Micrometeorological and leaf-level measurements of isoprene emissions from a southern African...
11
Micrometeorological and leaf-level measurements of isoprene emissions from a southern African savanna Peter Harley, 1 Luanne Otter, 2 Alex Guenther, 1 and James Greenberg 1 Received 30 May 2002; revised 24 July 2002; accepted 1 August 2002; published 12 February 2003. [1] In February 2001, as part of the Southern African Regional Science Initiative (SAFARI 2000), isoprene fluxes were measured for 8 days using the relaxed eddy accumulation technique from a 21-m tower in a Combretum-Acacia savanna in Kruger National Park, 13 km from Skukuza, RSA. Despite warm and sunny conditions, midday isoprene concentrations were low, averaging 0.39 nL/L. Fluxes of isoprene increased through the morning hours, with midday fluxes averaging 0.34 mg m 2 h 1 and a maximum measured flux of approximately 1.0 mg m 2 h 1 . Consistent with these low fluxes, leaf enclosure measurements of woody species within the tower footprint determined that only one isoprene-emitting species, Acacia nigrescens, was present in significant numbers, comprising less than 10% of the woody biomass. Combining enclosure data with species composition and leaf area index data from the site, we estimated that the isoprene emission capacity of the vegetation within the vicinity of the tower was very low, approximately 0.47 mg m 2 h 1 , and patchy. Under these circumstances, low and variable fluxes are expected. Additional leaf enclosure measurements, for a total of 121 species, were made at other locations, and approximately 35% of the species was found to emit significant amounts of isoprene. Important isoprene emitting plant families included Caesalpinaceae, Mimosaceae, Papilionaceae, Euphorbiaceae, Moraceae, and Myrtaceae. Twelve members of the important savanna genus Acacia were measured, of which five species, all belonging in Subgenus Aculeiferum, Section Aculeiferum, were found to emit significant amounts of isoprene. In contrast, the plant family, Combretaceae, dominant in many savanna ecosystems, was found to contain no species which emit isoprene. INDEX TERMS: 0315 Atmospheric Composition and Structure: Biosphere/atmosphere interactions; 0365 Atmospheric Composition and Structure: Troposphere—composition and chemistry; 1615 Global Change: Biogeochemical processes (4805) Citation: Harley, P., L. Otter, A. Guenther, and J. Greenberg, Micrometeorological and leaf-level measurements of isoprene emissions from a southern African savanna, J. Geophys. Res., 108(D13), 8468, doi:10.1029/2002JD002592, 2003. 1. Introduction [2] Emissions of reactive trace gases from the biosphere significantly influence the oxidative photochemistry of the lower troposphere [Fehsenfeld et al., 1992; Monson and Holland, 2001]. In particular, emissions of biogenic volatile organic compounds (BVOC) affect the tropospheric distri- bution of ozone, hydroxyl radicals, reactive nitrogen species and carbon monoxide. Improved quantification of the bio- spheric source strength of these compounds is crucial to understanding tropospheric chemistry at regional and global scales. The global model of Guenther et al. [1995] provided a useful framework for modeling BVOC emissions by combin- ing a vegetation classification scheme, aboveground biomass estimates, species level BVOC emission estimates, and algorithms describing physiological controls over emission. Similar efforts using higher resolution data and more detailed inventories have resulted in regional scale models for North America [Guenther et al., 2000] and Europe [Simpson et al., 1999], but efforts elsewhere have lagged behind. This and two companions papers [Greenberg et al., 2003; Otter et al., 2003] describing research on BVOC emmissions conducted as part of the Southern African Regional Science Initiative (SAFARI 2000) represent attempts to apply these methods to develop a regional scale BVOC emmision model for southern Africa. [3] The SAFARI 2000 experiment was an international science initiative to investigate interactions between the land surface and the atmosphere in southern Africa [Swap et al., 2002]. An important research goal was improved under- standing of the relationship between biogenic, pyrogenic and anthropogenic emissions/deposition and the biogeochemical systems of southern Africa. Approximately 35% of South Africa is covered by savanna, broadly defined as a tropical mixed tree-grass community [Scholes and Walker, 1993]. Savannas generally occupy the vast region separating the equatorial forest from midlatitude deserts, and represent a JOURNAL OF GEOPHYSICAL RESEARCH, VOL. 108, NO. D13, 8468, doi:10.1029/2002JD002592, 2003 1 Atmospheric Chemistry Division, National Center for Atmospheric Research, Boulder, Colorado, USA. 2 Climatology Research Group, University of the Witwatersrand, Braamfontein, Johannesburg, South Africa. Copyright 2003 by the American Geophysical Union. 0148-0227/03/2002JD002592$09.00 SAF 4 - 1
Transcript of Micrometeorological and leaf-level measurements of isoprene emissions from a southern African...

Micrometeorological and leaf-level measurements of isoprene
emissions from a southern African savanna
Peter Harley,1 Luanne Otter,2 Alex Guenther,1 and James Greenberg1
Received 30 May 2002; revised 24 July 2002; accepted 1 August 2002; published 12 February 2003.
[1] In February 2001, as part of the Southern African Regional Science Initiative(SAFARI 2000), isoprene fluxes were measured for 8 days using the relaxed eddyaccumulation technique from a 21-m tower in a Combretum-Acacia savanna in KrugerNational Park, 13 km from Skukuza, RSA. Despite warm and sunny conditions, middayisoprene concentrations were low, averaging 0.39 nL/L. Fluxes of isoprene increasedthrough the morning hours, with midday fluxes averaging 0.34 mg m�2 h�1 and amaximum measured flux of approximately 1.0 mg m�2 h�1. Consistent with these lowfluxes, leaf enclosure measurements of woody species within the tower footprintdetermined that only one isoprene-emitting species, Acacia nigrescens, was present insignificant numbers, comprising less than 10% of the woody biomass. Combiningenclosure data with species composition and leaf area index data from the site, weestimated that the isoprene emission capacity of the vegetation within the vicinity of thetower was very low, approximately 0.47 mg m�2 h�1, and patchy. Under thesecircumstances, low and variable fluxes are expected. Additional leaf enclosuremeasurements, for a total of 121 species, were made at other locations, and approximately35% of the species was found to emit significant amounts of isoprene. Important isopreneemitting plant families included Caesalpinaceae, Mimosaceae, Papilionaceae,Euphorbiaceae, Moraceae, and Myrtaceae. Twelve members of the important savannagenus Acacia were measured, of which five species, all belonging in SubgenusAculeiferum, Section Aculeiferum, were found to emit significant amounts of isoprene. Incontrast, the plant family, Combretaceae, dominant in many savanna ecosystems, wasfound to contain no species which emit isoprene. INDEX TERMS: 0315 Atmospheric
Composition and Structure: Biosphere/atmosphere interactions; 0365 Atmospheric Composition and Structure:
Troposphere—composition and chemistry; 1615 Global Change: Biogeochemical processes (4805)
Citation: Harley, P., L. Otter, A. Guenther, and J. Greenberg, Micrometeorological and leaf-level measurements of isoprene
emissions from a southern African savanna, J. Geophys. Res., 108(D13), 8468, doi:10.1029/2002JD002592, 2003.
1. Introduction
[2] Emissions of reactive trace gases from the biospheresignificantly influence the oxidative photochemistry of thelower troposphere [Fehsenfeld et al., 1992; Monson andHolland, 2001]. In particular, emissions of biogenic volatileorganic compounds (BVOC) affect the tropospheric distri-bution of ozone, hydroxyl radicals, reactive nitrogen speciesand carbon monoxide. Improved quantification of the bio-spheric source strength of these compounds is crucial tounderstanding tropospheric chemistry at regional and globalscales. The global model ofGuenther et al. [1995] provided auseful framework for modeling BVOC emissions by combin-ing a vegetation classification scheme, aboveground biomassestimates, species level BVOC emission estimates, and
algorithms describing physiological controls over emission.Similar efforts using higher resolution data and more detailedinventories have resulted in regional scale models for NorthAmerica [Guenther et al., 2000] and Europe [Simpson et al.,1999], but efforts elsewhere have lagged behind. This andtwo companions papers [Greenberg et al., 2003; Otter et al.,2003] describing research on BVOC emmissions conductedas part of the Southern African Regional Science Initiative(SAFARI 2000) represent attempts to apply these methods todevelop a regional scale BVOC emmisionmodel for southernAfrica.[3] The SAFARI 2000 experiment was an international
science initiative to investigate interactions between the landsurface and the atmosphere in southern Africa [Swap et al.,2002]. An important research goal was improved under-standing of the relationship between biogenic, pyrogenic andanthropogenic emissions/deposition and the biogeochemicalsystems of southern Africa. Approximately 35% of SouthAfrica is covered by savanna, broadly defined as a tropicalmixed tree-grass community [Scholes and Walker, 1993].Savannas generally occupy the vast region separating theequatorial forest from midlatitude deserts, and represent a
JOURNAL OF GEOPHYSICAL RESEARCH, VOL. 108, NO. D13, 8468, doi:10.1029/2002JD002592, 2003
1Atmospheric Chemistry Division, National Center for AtmosphericResearch, Boulder, Colorado, USA.
2Climatology Research Group, University of the Witwatersrand,Braamfontein, Johannesburg, South Africa.
Copyright 2003 by the American Geophysical Union.0148-0227/03/2002JD002592$09.00
SAF 4 - 1

major vegetation classification, comprising approx. 20% ofthe global land surface, and about 40% of the total landsurface in Africa. Savanna regions in Africa are underincreasing population pressure, and are undergoing rapidland use change. Improved understanding of the magnitudeand potential importance of emissions of BVOC in southernAfrica will require characterization of a number of differentsavanna ecosystems in terms of their species composition,biomass and BVOC emission characteristics. Data presentedhere represent an attempt to characterize BVOC emissionsfrom one widespread savanna type in southern Africa.[4] As part of SAFARI 2000, land-atmosphere fluxes of
CO2, water vapor and energy were continuously monitoredfrom flux towers in two distinct savanna vegetation types[Otter et al., 2002b], for which little information existsconcerning the potential emissions of BVOC. In the southernhemisphere summer of 2001, these two towers were thereforeselected as sites at which to measure emissions of BVOC andscreen local vegetation species for their potential to emitthese compounds. This manuscript treats isoprene emissionsfrom a previously unstudied but widespread savanna type inthe lowveld of South Africa, dominated by trees in the generaCombretum and Acacia. Fluxes of isoprene were measuredabove the savanna canopy using the Relaxed Eddy Accumu-lation (REA) technique. In addition, tree species in thefootprint of the measurement tower were screened for theirability to emit isoprene. This information, combined withsite-specific species composition and biomass data [Scholeset al., 2001] was used to make predictions of isopreneemissions from this landscape, which were then comparedwith tower flux measurements.We also took advantage of thewide variety of easily accessible plant specimens growing ina nearby nursery to screen an additional 95 species of SouthAfrican plants for the ability to emit isoprene, providingspecies level isoprene emission information which can beused to further initial estimates of isoprene emissions fromadditional ecosystems of southern Africa [Otter et al.,2002a]. A companion paper [Greenberg et al., 2003] inves-tigates the unusually high emissions of monoterpenes from amopane (Colophospermum mopane) woodland near Maun,Botswana.
2. Methods
2.1. Site Description
[5] The field flux study was carried out in February 2001 ata savanna flux measurement site in Kruger National Park,Republic of South Africa, described previously [Scholes etal., 2001]. The site, located 13 km WSW of Skukuza, is anintensive study site of the SAFARI 2000 campaign, andmeteorological parameters as well as exchanges of energy,CO2 and H2O, measured using eddy covariance, have beenmeasured continuously since April 2000. The 21-m walk-upflux tower (25�01.1840S; 31�29.8130E; 365 m above sealevel) is situated at the top of a gentle slope and straddlesthe ecotone between two distinct savanna types. The top ofthe slope is characterized by sandy soil and a broad-leavedsavanna dominated by members of the Combretaceae. ThisCombretum dominated savanna is replaced by a fine-leafedAcacia savanna on clayey soils as one moves downslope.This is a characteristic and repeated catenal pattern through-out the undulating topography of the region [Chappell,
1992], and savannas of these types cover a wide area of thebroad coastal plain, or ‘‘lowveld’’, at altitudes of about 300 mabove sea level. As discussed by Scholes et al. [2001], thevegetation, with about 32% tree plus shrub cover, may beclassified as awooded grassland or open savanna. About two-thirds of the site, occupying the ridge top, is broad-leavedwooded grassland, dominated byCombretum apiculatum andSclerocarya birrea, while the remaining third, occupying themidslope, is fine-leaved wooded grassland, dominated byAcacia nilotica, A. nigrescens, and S. birrea. Another 22woody species were encountered within the tower footprint,totaling only about one eighth of the woody biomass. Treedensity data, utilized below to estimate isoprene-emittingbiomass within the tower footprint, is also presented byScholes et al. [2001].[6] The climate is semiarid subtropical, annual rainfall at
Skukuza averaging 55 cm, with hot, wet summers andwarm, dry winters. On average, January and February arethe wettest months, each averaging about 9 cm, but January2001 was abnormally dry (2.8 cm), and the grass compo-nent of the system was almost entirely senescent at the timeof measurements. Long-term climate statistics may be foundin the work of Scholes et al. [2001].
2.2. Tower Flux Measurements
[7] The relaxed eddy accumulation (REA) techniqueestimates a flux by rapidly partitioning air parcels in upwardor downward moving eddies into separate reservoirs. Sam-ples are collected over a half-hour time period to allow for astatistically significant sampling of eddies of various size,and for collection of air samples large enough for accurateanalysis. In this study, air samples corresponding to updraftsand downdrafts were collected separately into 3-l Teflonbags, using a valve switching system similar to thatdescribed by Baker et al. [1999]. Improvements incorpo-rated into the present system include modified plumbing toallow sample reservoirs to be evacuated without removalfrom the system, and inclusion of two up and two downreservoirs. Thus, one pair of Teflon bags can be sampledand evacuated while the second pair is filling, allowingcontinuous sampling. A 3-dimensional sonic anemometer(ATI, Boulder, CO), positioned at the end of a 2 m boomnear the top of a walk-up tower approximately 21 m abovethe ground, measured vertical wind speed and direction at 9Hz. Air was drawn continuously (approx. 100 cm3 min�1)through an inlet located approx. 5 cm from the anemometerand fitted with an ozone trap consisting of filter paperimpregnated with potassium iodide. Vertical wind data weresent from the anemometer to a laptop computer, whichoperated fast-switching solenoid valves that directed air toeither the updraft or downdraft reservoir. A completetechnical description of the REA system, including LabViewprogramming used to control valves and collect data, isavailable from the corresponding author. If vertical windspeed was below a threshold value (±0.6 sw computed fromthe previous half hour period, where sw is the standarddeviation of the vertical wind speed), sample air was notcollected. Samples were collected over 30 minute periods,and calculated fluxes represent half-hour averages. Immedi-ately following collection, a sample of air from each reser-voir was collected onto 2-stage solid absorbent cartridges,consisting of 200 mg Tenax or 200 mg Carbotrap B,
SAF 4 - 2 HARLEY ET AL.: MEASUREMENTS OF ISOPRENE EMISSIONS

followed by 200 mg Carbosieve (all from Supelco Inc.,Bellefonte, PA), by pumping sample air for 5 min directlythrough the cartridge, using a controlled-flow pump (AirProSurveyor, AFC Intl., DeMotte, IN) located downstream fromthe cartridge. The flow rate of air through the cartridges wasnominally 300 cm3 min�1, but varied slightly since eachcartridge offered a different flow resistance. Actual flowswere measured using a portable primary flow calibrator(BIOS Dry-Cal DC-Lite, AFC Intl.), and the total volumecollected onto the cartridges varied from 1250 cm3 to 1680cm3. Cartridges were stored under refrigeration at approx-imately 0�C and subsequently analyzed in the laboratory atthe National Center for Atmospheric Research (Boulder,CO) using gas chromatography-mass spectroscopy (GC-MS; HP5890 with HP5972 detector, Hewlett-Packard) inselected ion mode. Details of cartridge construction, car-tridge storage tests, sample inlet system and GC-MS analysishave been described previously [Greenberg et al., 1999].The detection limit for the GC-MS analysis was approxi-mately 1 pptv for isoprene, and uncertainty in the analysis,estimated from propagation of errors, was approximately0.05 nL/L for a sample of 1 nL/L.[8] Fluxes were calculated according to the relationship,
F = b*sw*(Cu � Cd), where F is the flux of the trace gas ofinterest (mg m�2 h�1), b is a unitless coefficient estimated bysimilarity with virtual temperature as measured by the sonicanemometer [Businger and Oncley, 1990; Bowling et al.,1998], sw is the standard deviation of the vertical wind speed(m h�1) during the 30 min of sampling, and Cu and Cd
represent the concentrations of the VOC of interest (mg m�3),determined from samples collected in the up and down Teflonsample reservoirs. Reliable wind and cartridge concentrationdata were obtained from a total of 15 half-hour measurementperiods, from which isoprene fluxes were estimated.
2.3. Enclosure Sampling for Isoprene Emissions
[9] All woody species found at the Skukuza tower sitewere screened for the ability to produce and emit isoprene insignificant amounts. In addition, over 100 species of plantsgrowing either naturally or in pots at a tree nursery operatedby volunteers of Kruger National Park in Skukuza weresampled. Intact leaves were carefully inserted into thestandard 6-cm2 leaf cuvette of an LI-6400 Portable Photo-synthesis System (Li-Cor, Lincoln, NE) and physiologicalactivity verified by measuring positive rates of net photo-synthesis and transpiration. The LI-6400 red light LED lightsource was used to illuminate leaves (1000 mmol photonsm�2 s�1), and leaf temperature was controlled to as near30�C as possible, although with the high air temperaturesand high solar irradiances encountered, temperatures fre-quently exceeded 30�C. Using the sample pump of aVoyager Portable Gas Chromatograph (Photovac Int’l.,Inc., Deer Park, NY), air exiting the cuvette was pulledthrough Teflon tubing into the sample loop and analyzedusing the built-in photoionization detector. Chromatogramswere stored digitally and hand-integrated. The Voyager wascalibrated daily using a gas-phase isoprene standard (31.3nL/L isoprene in air) verified against a 201 nL/L neohexanestandard (Scott Specialty Gases, Plumsteadville, PA, USA).Measurement precision was assessed based on repeatedmeasurements of the standard (n = 11), in which the standarddeviation was 4% of the mean concentration. Repeated
samples drawn from the empty cuvette consistently evi-denced a small unidentified peak which would interfere withisoprene; this peak, if treated as isoprene, averaged 0.9 nL/L;this value was subtracted from isoprene concentrations forall leaf samples. Given this interference and a variablebaseline, we assign a lower detection limit of 1 nL/Lisoprene. Experimental leaves were harvested, oven-driedat 70�C and subsequently weighed. The dry mass of leaftissue inside the cuvette during each measurement wascalculated, and specific leaf mass (SLM, g m�2) determinedfor all leaves. Isoprene emission rates are expressed as mgCarbon g�1 dry mass h�1. For the flow rates used in thisexperiment (540 cm3 min�1) and a typical amount of leafbiomass (60 mg), the isoprene emission calculated at thedetection limit (1 nL/L isoprene) gives an emission rate of1.2 mg C g�1 h�1.[10] In a few cases, where leaf-level measurements were
ambiguous (i.e., a very small isoprene peak was evident),branches with several leaves were enclosed in a staticenclosure consisting of a 3-l Teflon bag. After approx. 10min in the sun, air from the bag was sampled for isopreneconcentration.
3. Results
3.1. Meteorology
[11] In general, weather during the period of tower fluxmeasurements was sunny, warm to hot, and dry.Mean diurnalfluctuations in air temperature and incoming shortwaveradiation (W m�2) for the 7 days of data collection aredepicted in Figure 1. Daytime temperature maximum aver-aged 28.5�C over the experimental period, but exceeded35�C on two days. Midday relative humidity values variedbetween 30 and 70%. Nighttime temperatures were mild,falling below 20�C on only one night. Solar irradiance wasvariable, but incoming shortwave radiation always exceeded475 W m�2 during midday and exceeded 1000 W m�2 onfour of the measurement days. Rain totaling 37 mm fellduring two nights.
3.2. Tower Flux Measurements
[12] A total of 15 up-down paired samples were consid-ered valid samples for isoprene flux estimation. All meas-ured isoprene concentrations, from both up and downreservoirs, and including data from periods when fluxeswere not calculated, are plotted in Figure 2a as a function oftime of day. Concentrations were generally low, the max-imum concentration measured being 0.86 nL/L. The midday(0900–1300 UT) mean concentration was 0.39 nL/L (s.e. =0.03; n = 52) and the mean difference in isoprene concen-tration between up and down bags was only 0.14 nL/L(s.e. = 0.04). Given an estimated uncertainty level associ-ated with the GC-MS analysis of 0.05 nL/L in eachreservoir, it is clear that that the REA technique is operatingnear the limits of its usefulness in this low isopreneenvironment. All isoprene flux estimates obtained fromthe REA technique are plotted as a function of time ofday in Figure 2c. Early morning fluxes were very low, andthough variable, fluxes generally increased until midday,reaching a maximum of 1.0 mg m�2 h�1. The averagemidday (0900–1300 UT) flux, based on 12 samples, was0.34 mg m�2 h�1 (s.e. = 0.11). The magnitude of the
HARLEY ET AL.: MEASUREMENTS OF ISOPRENE EMISSIONS SAF 4 - 3

isoprene fluxes did not appear to be correlated with winddirection (Figure 2d).
3.3. Screening for Isoprene Emission WithEnclosure Measurements
[13] Scholes et al. [2000] list 19 species (Table 1) thatdominate the woody biomass within a circle 800 m inradius, centered on the flux tower. Leaves from all of thesespecies were sampled in this study either at the tower site orelsewhere, and their measured emissions appear in Table 2.In addition to these 19 species, we measured leaves from anadditional 8 species of trees and shrubs (Table 1) that,although present at the site, constitute less than 1% of thebiomass. Of the 7 species which dominate the landscape,only Acacia nigrescens emits significant amounts of iso-prene. Although 5 of the remaining 20 species appear to beisoprene emitters, their contribution to the landscape scaleisoprene flux is expected to be very small, due to theirminor presence in the tower footprint.[14] In addition to those woody species growing at the
flux tower site, 95 additional species were screened, repre-
senting 41 plant families, growing either at the Skukuzaresearchers’ lodging compound or at the Skukuza treenursery (Table 2).[15] Given a detection limit of 1 nL/L isoprene and typical
leaf biomass and flow rate, the lowest isoprene emission ratewhich can be measured with confidence is 1.2 mg C g�1 h�1,and all measurements below that value are assigned to thecategory of nonisoprene emitters. Using this criterion, 52 ofthe 123 species measured may be classified as emitters, and18 of the 41 plant families contained at least one emittingspecies. If we adopt a slightly less conservative criterion of 3mg C g�1 h�1, only 43 species are classified as emitters, from15 different families. Since results for those 9 species withemission capacities between 1.2 and 3 mg C g�1 h�1 aresomewhat ambiguous, they will be examined on a case bycase basis below, and assigned to one category or the otherbased on additional information, where available. It is clearfrom Table 2 however, that several families of floweringplants commonly occurring in southern Africa contain asignificant percentage of isoprene emitting species, includingthe three legume families, Caesalpinaceae, Mimosaceae andPapilionaceae, as well as Burseraceae, Euphorbiaceae, Fla-courtiaceae, Moraceae and Myrtaceae.
4. Discussion
[16] Results from the tower REA flux measurements andthe screening of tree species at the tower site are consistent,both indicating that this savanna landscape represents arelatively minor source of isoprene to the atmosphere.
4.1. Measured and Estimated Isoprene Fluxes
[17] Given the inherent sources of error associated withthe REA technique [Bowling et al., 1998] and the smalldifferences in measured isoprene concentrations in upversus down reservoirs relative to the uncertainty of theanalytical technique, each individual REA flux should beregarded as highly uncertain. Taken as a whole, however,the data in Figure 2 indicate that the vegetation within theflux footprint is a small but significant source of isoprene.Given the lack of a significant nearby homogeneous sourceof isoprene, considerable variability in both isoprene con-centration and flux is not surprising. Given an extremelypatchy and heterogeneous source region (see below), theconcentration of isoprene in air masses reaching the REAinlet will vary continuously depending on wind speed anddirection, as will the measured flux.[18] Based on the measured emissions of species within
the footprint of the tower, and the published species compo-sition and biomass data of Scholes et al. [2001], we derived alandscape-scale isoprene emission capacity (mg C m�2
ground area h�1), as follows (Table 1). Scholes et al.[2001] estimated tree basal area surrounding the tower siteto a distance of 600 m (Table 1). Based on these data, andassuming that tree cover is proportional to tree basal area, thepercent cover of each species was calculated. This valuemultiplied by the woody plant leaf area index (LAI, m2 ofleaf area per m2 of ground area), averaged over the site,provides an estimate of the total leaf area of each species perunit ground area (not shown), which when multiplied by thespecific leaf mass of leaves of each species (SLM, g m�2)yields foliar density (g of leaf per m2 of ground). Foliar
Figure 1. Average weather conditions at the Skukuzatower site for the duration of the tower flux study. Points arehourly means of incoming short wave radiation (W m�2;top panel) and air temperature (�C; bottom panel) for periodbetween 1 February and 8 February 2001. Lines representone standard error.
SAF 4 - 4 HARLEY ET AL.: MEASUREMENTS OF ISOPRENE EMISSIONS

Figure 2. Summary of isoprene concentrations and fluxes measured at the Skukuza tower site between1 February and 8 February 2001. Top panels represent isoprene concentrations (nL/L) measured at 19 mas a function of time of day (A) and wind direction (B). Bottom panels depict measured isoprene fluxes(mg C m�2 h�1) as a function of time of day (C) and wind direction (D).
Table 1. Data Used to Estimate Area-Averaged Emission Rates for Isoprenea
Species
Basal Area LAI,m2 m�2
SLM,g m�2
(Leaf )
FoliarDensity, g m�2
(Ground)
Leaf-LevelEmission Capacity,
mg C g�1 h�1
Area-AveragedEmission Capacity,mg C m�2 h�1m2 ha�1 %
Combretum apiculatum 1.55 29.6 0.67 117 23.2 0.2 4.6Sclerocarya birrea 1.73 33.1 154 34.1 0.2 6.8Acacia nigrescens 0.69 13.2 82 7.2 50 360Acacia nilotica 0.22 4.2 145 4.1 0.2 0.8Ziziphus mucronata 0.31 5.9 86 3.4 0.2 0.7Grewia bicolor 0.14 2.7 104 1.9 0.2 0.4Lannea schweinfurthii 0.12 2.3 99 1.5 0.5 0.8Acacia tortilis 0.02 0.4 100 0.3 0.2 0.1Balanites maughamii 0.06 1.1 92 0.7 1.7 1.2Peltophorum africanum 0.02 0.4 100 0.3 0.2 0.1Spirostachys africana 0.08 1.5 101 1.0 68 68Dichrostachys cinerea 0.12 2.3 120 1.8 0.2 0.4Euclea natalensis 0.02 0.4 202 0.5 0.2 0.1Diospyros mespiliformis 0.02 0.4 82 0.2 0.2 0.1Grewia hexamita 0.02 0.4 106 0.3 0.2 0.1Schotia brachypetala 0.04 0.8 126 0.6 0.2 0.1Lonchocarpus capassa 0.06 1.1 148 1.1 24 26Terminalia sericea 0.01 0.2 159 0.2 0.3 0.1Carissa edulis 0 0.0 57 0.0 0.2 0.0
Species Below Not Listed in Scholes et al. [2001] but Measured at the Tower Site in This StudyRhus lancea 53Combretum imberbe 0.2Combretum hereroense 0.4Combretum zeyheri 0.2Bolusanthus speciosus 40Dalbergia melanoxylon 39Pterocarpus rotundifolius 57Grewia flavescens 0.2Total 5.23 471
Basal area data and site-specific leaf area index (LAI) are from Scholes et al. [2001]. Specific Leaf Mass (SLM) and isoprene emission capacities areestimated in this paper (species designated as ‘‘below detection limit’’ in Table 2 are assigned a value of 0.2 mg C g�1 h�1). Area-averaged emissioncapacity (by species) is determined as [% of total basal area/100] � [LAI] � [SLM] � [Emission Capacity].
aEmission rates for isoprene are expressed as mg C m�2 h�1.
HARLEY ET AL.: MEASUREMENTS OF ISOPRENE EMISSIONS SAF 4 - 5
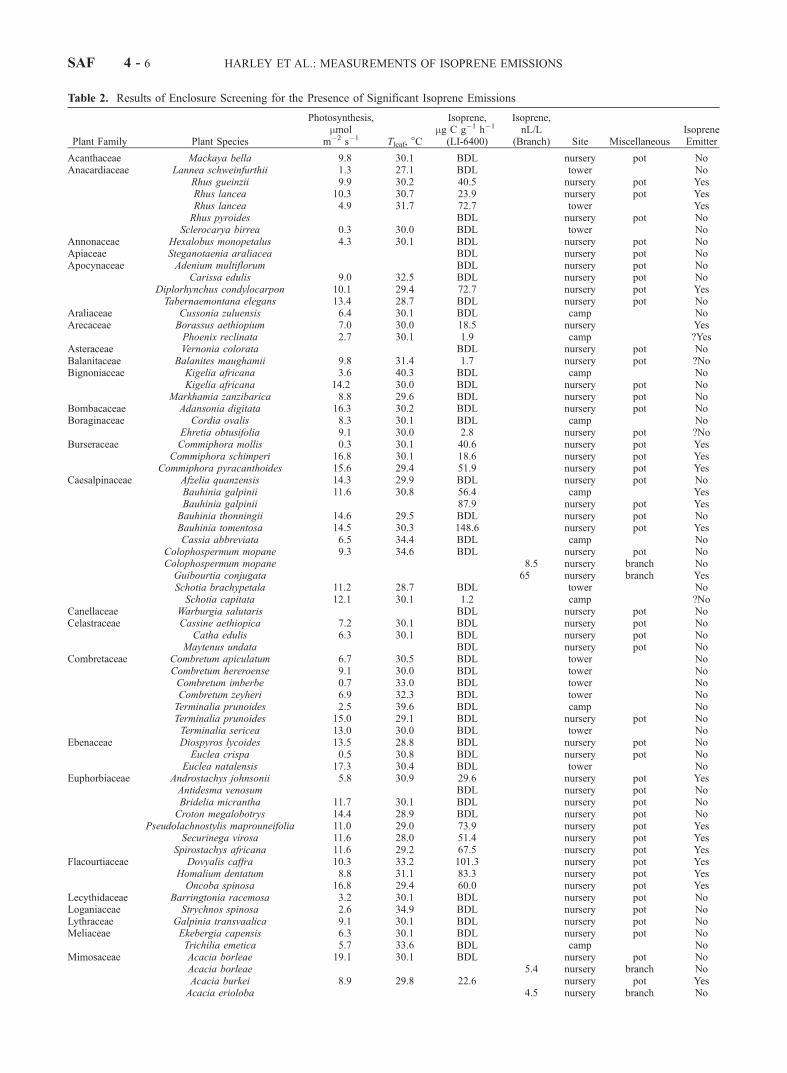
Table 2. Results of Enclosure Screening for the Presence of Significant Isoprene Emissions
Plant Family Plant Species
Photosynthesis,mmol
m�2 s�1 Tleaf, �C
Isoprene,mg C g�1 h�1
(LI-6400)
Isoprene,nL/L
(Branch) Site MiscellaneousIsopreneEmitter
Acanthaceae Mackaya bella 9.8 30.1 BDL nursery pot NoAnacardiaceae Lannea schweinfurthii 1.3 27.1 BDL tower No
Rhus gueinzii 9.9 30.2 40.5 nursery pot YesRhus lancea 10.3 30.7 23.9 nursery pot YesRhus lancea 4.9 31.7 72.7 tower YesRhus pyroides BDL nursery pot No
Sclerocarya birrea 0.3 30.0 BDL tower NoAnnonaceae Hexalobus monopetalus 4.3 30.1 BDL nursery pot NoApiaceae Steganotaenia araliacea BDL nursery pot NoApocynaceae Adenium multiflorum BDL nursery pot No
Carissa edulis 9.0 32.5 BDL nursery pot NoDiplorhynchus condylocarpon 10.1 29.4 72.7 nursery pot YesTabernaemontana elegans 13.4 28.7 BDL nursery pot No
Araliaceae Cussonia zuluensis 6.4 30.1 BDL camp NoArecaceae Borassus aethiopium 7.0 30.0 18.5 nursery Yes
Phoenix reclinata 2.7 30.1 1.9 camp ?YesAsteraceae Vernonia colorata BDL nursery pot NoBalanitaceae Balanites maughamii 9.8 31.4 1.7 nursery pot ?NoBignoniaceae Kigelia africana 3.6 40.3 BDL camp No
Kigelia africana 14.2 30.0 BDL nursery pot NoMarkhamia zanzibarica 8.8 29.6 BDL nursery pot No
Bombacaceae Adansonia digitata 16.3 30.2 BDL nursery pot NoBoraginaceae Cordia ovalis 8.3 30.1 BDL camp No
Ehretia obtusifolia 9.1 30.0 2.8 nursery pot ?NoBurseraceae Commiphora mollis 0.3 30.1 40.6 nursery pot Yes
Commiphora schimperi 16.8 30.1 18.6 nursery pot YesCommiphora pyracanthoides 15.6 29.4 51.9 nursery pot Yes
Caesalpinaceae Afzelia quanzensis 14.3 29.9 BDL nursery pot NoBauhinia galpinii 11.6 30.8 56.4 camp YesBauhinia galpinii 87.9 nursery pot YesBauhinia thonningii 14.6 29.5 BDL nursery pot NoBauhinia tomentosa 14.5 30.3 148.6 nursery pot YesCassia abbreviata 6.5 34.4 BDL camp No
Colophospermum mopane 9.3 34.6 BDL nursery pot NoColophospermum mopane 8.5 nursery branch NoGuibourtia conjugata 65 nursery branch YesSchotia brachypetala 11.2 28.7 BDL tower NoSchotia capitata 12.1 30.1 1.2 camp ?No
Canellaceae Warburgia salutaris BDL nursery pot NoCelastraceae Cassine aethiopica 7.2 30.1 BDL nursery pot No
Catha edulis 6.3 30.1 BDL nursery pot NoMaytenus undata BDL nursery pot No
Combretaceae Combretum apiculatum 6.7 30.5 BDL tower NoCombretum hereroense 9.1 30.0 BDL tower NoCombretum imberbe 0.7 33.0 BDL tower NoCombretum zeyheri 6.9 32.3 BDL tower NoTerminalia prunoides 2.5 39.6 BDL camp NoTerminalia prunoides 15.0 29.1 BDL nursery pot NoTerminalia sericea 13.0 30.0 BDL tower No
Ebenaceae Diospyros lycoides 13.5 28.8 BDL nursery pot NoEuclea crispa 0.5 30.8 BDL nursery pot No
Euclea natalensis 17.3 30.4 BDL tower NoEuphorbiaceae Androstachys johnsonii 5.8 30.9 29.6 nursery pot Yes
Antidesma venosum BDL nursery pot NoBridelia micrantha 11.7 30.1 BDL nursery pot NoCroton megalobotrys 14.4 28.9 BDL nursery pot No
Pseudolachnostylis maprouneifolia 11.0 29.0 73.9 nursery pot YesSecurinega virosa 11.6 28.0 51.4 nursery pot Yes
Spirostachys africana 11.6 29.2 67.5 nursery pot YesFlacourtiaceae Dovyalis caffra 10.3 33.2 101.3 nursery pot Yes
Homalium dentatum 8.8 31.1 83.3 nursery pot YesOncoba spinosa 16.8 29.4 60.0 nursery pot Yes
Lecythidaceae Barringtonia racemosa 3.2 30.1 BDL nursery pot NoLoganiaceae Strychnos spinosa 2.6 34.9 BDL nursery pot NoLythraceae Galpinia transvaalica 9.1 30.1 BDL nursery pot NoMeliaceae Ekebergia capensis 6.3 30.1 BDL nursery pot No
Trichilia emetica 5.7 33.6 BDL camp NoMimosaceae Acacia borleae 19.1 30.1 BDL nursery pot No
Acacia borleae 5.4 nursery branch NoAcacia burkei 8.9 29.8 22.6 nursery pot YesAcacia erioloba 4.5 nursery branch No
SAF 4 - 6 HARLEY ET AL.: MEASUREMENTS OF ISOPRENE EMISSIONS

Plant Family Plant Species
Photosynthesis,mmol
m�2 s�1 Tleaf, �C
Isoprene,mg C g�1 h�1
(LI-6400)
Isoprene,nL/L
(Branch) Site MiscellaneousIsopreneEmitter
Acacia galpinii 17.6 28.4 22.1 nursery pot YesAcacia galpinii 27.6 30.2 12.1 nursery pot Yes
Acacia nigrescens 13.7 30.1 4.0 nursery pot YesAcacia nigrescens 20.0 nursery pot YesAcacia nigrescens 260 nursery branch YesAcacia nilotica 11.5 30.1 BDL tower NoAcacia nilotica 2.9 36.4 BDL camp NoAcacia nilotica 5.4 nursery branch No
Acacia polyacantha 19.6 30.1 7.2 nursery pot YesAcacia polyacantha 20.0 30.2 8.0 nursery pot YesAcacia polyacantha >1500 nursery branch YesAcacia robusta 1.2 nursery pot ?NoAcacia robusta 1.8 nursery branch NoAcacia senegal 8.7 35.7 50.1 nursery pot YesAcacia sieberana 6.3 27.7 BDL nursery pot NoAcacia tortilis 12.8 28.8 BDL tower NoAcacia tortilis 4.6 nursery branch No
Acacia xanthoploea 18.8 30.2 BDL nursery pot NoAlbizia adianthifolia 8.5 33.1 4.9 nursery pot Yes
Albizia amara 6.8 31.3 BDL nursery pot NoAlbizia forbesii 12.5 nursery pot YesAlbizia harveyi 7.9 30.1 1.2 nursery pot ?NoAlbizia harveyi 5.9 nursery branch No
Albizia versicolor 18.9 28.9 105.0 nursery pot YesDichrostachys cinerea 8.3 30.2 BDL tower NoElephantorrhiza burkei 13.8 26.6 BDL nursery pot No
Faidherbia albida BDL nursery pot NoXylia torreana 8.0 32.8 BDL nursery pot No
Moraceae Ficus ingens 74.4 nursery pot YesFicus stuhlmannii 2.7 30.0 13.9 camp YesFicus stuhlmannii 0.4 37.3 31.9 nursery pot YesFicus sycamorus 9.3 30.1 23.0 camp Yes
Myrtaceae Heteropyxis natalensis BDL nursery pot NoSyzygium cordatum 8.7 28.4 7.8 nursery pot Yes
Syzygium sp. 10.5 30.0 16.4 nursery pot YesOchnaceae Ochna natalita 7.9 31.2 69.3 nursery pot YesPapilionaceae Baphia massaiensis 4.0 29.8 113.9 nursery pot Yes
Bolusanthus speciosus 8.3 27.9 30.6 tower YesBolusanthus speciosus 12.1 31.4 48.7 nursery pot Yes
Calpurnia aurea 4.9 29.9 2.8 nursery pot ?YesCordyla africana 3.6 30.6 86.4 nursery pot Yes
Dalbergia melanoxylon 12.2 27.8 38.0 tower YesDalbergia melanoxylon 5.4 28.8 40.1 nursery pot YesErythrina lysistemon 7.2 35.1 1.6 camp ?NoLonchocarpus capassa 17.2 30.0 22.6 tower YesLonchocarpus capassa 10.5 29.9 24.1 nursery pot Yes
Mundulea sericea 17.2 30.2 98.3 nursery pot YesMundulea sericea 6.5 36.5 179.8 nursery pot Yes
Ormocarpum trichocarpum 13.6 29.2 10.1 nursery pot YesOrmocarpum trichocarpum 834 nursery branch YesPeltophorum africanum BDL camp NoPterocarpus rotundifolius 14.1 30.8 56.7 tower Yes
Vigna sp. 0.3 33.3 BDL tower NoXanthocercis zambesiaca 14.8 30.1 57.6 nursery pot Yes
Poaceae Phragmites australis 8.2 28.9 34.3 nursery YesRhamnaceae Berchemia zeyheri 10.8 32.3 70.9 camp Yes
Ziziphus mucronata 5.2 34.9 BDL camp NoZiziphus rivularis 10.1 29.5 BDL nursery pot No
Rubiaceae Breonadia salicina 14.1 30.4 BDL nursery pot NoPachystigma macrocalyx 13.8 27.2 BDL nursery pot No
Salvadoraceae Salvadora angustifolia 2.5 30.2 5.5 nursery pot YesSalvadora persica 12.3 33.6 52.8 nursery pot Yes
Sapindaceae Pappea capensis 6.5 30.1 BDL nursery pot NoSapotaceae Manilkara mochisia BDL nursery pot NoSimaroubaceae Kirkia acuminata 3.6 30.0 BDL nursery pot NoSterculiaceae Dombeya rotundifolia 12.3 32.7 BDL camp No
Sterculia murex 8.9 28.8 BDL nursery cut NoTiliaceae Grewia bicolor 12.2 34.0 BDL camp No
Grewia flavescens 1.7 41.1 BDL tower NoGrewia flavescens 5.3 29.6 BDL nursery pot NoGrewia hexamita 6.7 34.0 BDL tower NoGrewia hexamita 2.3 39.9 BDL camp No
Table 2. (continued)
HARLEY ET AL.: MEASUREMENTS OF ISOPRENE EMISSIONS SAF 4 - 7

density multiplied by the species-specific emission capacityfor isoprene (mg C g�1 h�1) gives the area-averaged emissioncapacity for that species (mg C m�2 h�1). Summing thesevalues for all species provides the isoprene emissioncapacity averaged over the entire site (0.47 mg C m�2
h�1). Thus, the combination of low tree cover (approx.30% [Scholes et al., 2001]) and biomass and the smallpercentage of isoprene emitting species within the towerfootprint results in low emissions, as reflected in the towerflux measurements.[19] Guenther et al. [1996] estimated landscape average
emission capacities for a variety of savanna types in southernAfrica, and reported values ranging from 0.60 to 0.90 mg Cm�2 h�1 for isoprene. Our estimate therefore falls slightlybelow their low estimate. Their value for Combretum apicu-latum savanna was 0.97 mg C m�2 h�1, approximately twiceour estimate from a similar savanna in this study. Thisdiscrepancy results largely from two factors. Guenther et al.[1996] used an emission capacity for A. nigrescens of 110 mgC g�1 h�1, while we measured much lower rates, averagingonly 20 mg C g�1 h�1. For the purpose of estimating thelandscape average emission capacity of the tower site, weadopted an intermediate emission capacity for A. nigrescensof 50 mgC g�1 h�1. If the higher value of 110were used in ourarea-averaged emission capacity calculations, the estimatewould increase to 0.90 mg C m�2 h�1. Only additionalmeasurements can resolve this discrepancy in species emis-sion capacity, although ourmeasurements were carried out onleaves growing on low, shaded branches or on saplingsgrowing in the shade at the Skukuza nursery, and mighttherefore be expected to underestimate emission rates fromthe upper canopy of field-grown trees. A second reason whyour fluxes were lower than expected is the species composi-tion at the study site. Generally speaking, this savanna typeconsists of a repeating sequence of sandy, infertile upland sitesdominated by nonemittingmembers of the Combretaceae andsites lower on the slope on more fertile clayey soils, domi-nated by fine-leafed Acacia spp. Although on the regionalscale, this community is dominated by the isoprene-emittingA. nigrescens, the 300� 300m sample area around the tower,and the flux footprint in general, is dominated by the non-emitting A. nilotica [Scholes et al., 2001]. A. nigrescenscomprises only about 10% of the leaf biomass, confined tothe area southeast of, and a considerable distance from, theflux tower. Thus, the low isoprene fluxes measured in thisstudy may underestimate the fluxes expected from thewidespread Combretum-Acacia savanna of the ‘‘low-veld’’.In any case, isoprene emissions from this savanna type
would be expected to be generally low, but with significantpatchy source areas dominated by A. nigrescens.
4.2. Screening of Vegetation for Isoprene Emission
[20] Two published studies report results of previousattempts to screen savanna vegetation of southern Africafor BVOC emissions [Guenther et al., 1996; Otter et al.,2002a], and a third similar study was carried out in centralAfrica [Klinger et al., 1998]. The screening during thisstudy of over 120 species, many of which had not beenmeasured previously, for the presence of significant iso-prene emissions adds considerably to the emissions data-base for southern Africa.[21] The capacity for isoprene emission from leaves
of different species varies over several orders of mag-nitude [Harley et al., 2000]. All leaves produce theimmediate precursor of isoprene, dimethylallyl pyrophos-phate (DMAPP), in the light, and it is likely that most orpossibly all leaves can produce very small amounts ofisoprene (i.e., <1 mg C g�1 h�1), perhaps by a nonenzy-matic, acid catalyzed reaction [Deneris et al., 1985]. Asignificant fraction of tree species (and a few herbaceousspecies) are capable of producing and emitting much largeramounts of isoprene (up to at least 200 mg C g�1 h�1 underhigh light and optimal temperature) in a reaction catalyzedby the enzyme isoprene synthase [Silver and Fall, 1991].These enzyme-catalyzed rates of production vary widelyacross and within species, depending on, among otherthings, light and temperature during measurement, leafage, canopy position, and light and temperature conditionsexperienced by the leaves in the days prior to measurement[Geron et al., 2000; Harley et al., 2000; Petron et al., 2001;Sharkey et al., 1999]. In this screening study, each deter-mination is based on a single measurement (or few), andfrequently measurements were made on young plants withleaves growing in relatively low light environments at theSkukuza nursery. These measurements may be expected tounderestimate the true emission capacity for these species.We report results of all measurements in Table 2, but thesevalues were used only to identify isoprene emitting taxa,rather than to assign definitive isoprene emission capacitiesto each species.[22] Most of the measurements allow an unambiguous
determination of whether or not a given species is capable ofemitting significant amounts of isoprene, and all species forwhich we measured an emission rate greater than 3 mg C g�2
h�1 are designated as isoprene emitters in Table 2. Similarly,those with measured rates less than 1.2 mg C g�2 h�1
Table 2. (continued)
Plant Family Plant Species
Photosynthesis,mmol
m�2 s�1 Tleaf, �C
Isoprene,mg C g�1 h�1
(LI-6400)
Isoprene,nL/L
(Branch) Site MiscellaneousIsopreneEmitter
Ulmaceae Celtis africanus 14.4 30.1 1.2 nursery pot ?NoTrema orientalis 6.9 38.1 BDL camp No
Verbenaceae Vitex sp. �4.9 30.3 BDL tower NoVitaceae Cissus cornifolia 1.4 32.3 BDL tower No
Species are arranged alphabetically by plant family. Photosynthetically active radiation was 1000 mmol m�2 s�1 for LI-6400 measurements, and abovethat value for branch enclosures. Leaf temperature during measurement and rates of net photosynthesis measured simultaneously are given. Leaf levelmeasurements in which less than 1 nL/L isoprene was measured are designated as below detection limit (BDL). For those taxa with isoprene emission ratesless than 3 mg C g�1 h�1 (designated with a ‘‘?’’ in the final column), justification for inclusion in a given category is provided in the text.
SAF 4 - 8 HARLEY ET AL.: MEASUREMENTS OF ISOPRENE EMISSIONS

(designated as ‘‘below detection limit’’ [BDL] in Table 2) areclassified as nonemitters.[23] Nine measurements gave readings between 1.2 and
3 mg C g�2 h�1 and assigning these taxa to one or the othercategory is somewhat problematic. Because the initial meas-urements were very close to our detection limit, Acaciarobusta and Albizia harveyi were resampled using staticbranch enclosures; isoprene concentrations in the enclo-sures after 10 min in the sun were sufficiently low (1.8 and5.9nL/L, respectively) that theymaybothbesafely regardedasnonemitters. Celtis, Ehretia and Balanites may all be tenta-tively classified as nonemitters, based on the very low valuesreported here and their taxonomic position vis-a-vis knownisoprene emitting species. Several species of Celtis (Ulma-ceae) have beenmeasured previously (the reader is referred tothe isoprene emission database maintained at an NCAR website (http://www.acd.ucar.edu:8080/voc/vocIndex.jsp)for these supporting data and references), and none wasreported to emit isoprene; indeed, no members of theUlmaceae have been shown to emit. Ehretia (Boraginaceae)has not been measured previously, but no emitting membersof the Boraginaceae have been reported. Only one otherspecies of Balanites has been sampled, and isoprene emis-sion was not detected. Phoenix reticulata is a palm (Are-caceae), many but not all of which are isoprene emitters.Indeed, both emitting and nonemitting members of thegenus Phoenix have been reported, as has a report of lowemissions in P. reticulata. Although we suspect it is anisoprene emitter, this characterization remains unclear.Calpurnea and Erythrina (Papilionaceae) and Schotia (Cae-salpinaceae) are all members of the legume family, charac-terized by many isoprene emitting taxa. However, threespecies of Erythrina, including E. lysistemon, have beenpreviously found not to emit isoprene, as has a closelyrelated species of Schotia. Calpurnea, which has not beenmeasured previously, belongs to Papilionaceae, subfamilySophoreae, which is dominated by isoprene emitting spe-cies, and is likely to emit, but we cannot assign it to thatcategory with confidence.[24] A comparison of the results in Table 2 with published
isoprene emission studies [Guenther et al., 1996; Otter etal., 2002a; available at http://www.acd.ucar.edu:8080/voc/vocIndex.jsp] reveals that our findings are generally con-sistent with previous data. The importance of a number oftropical plant families for isoprene emission is confirmedhere, including Caesalpinaceae, Euphorbiaceae, Flacourtia-ceae, Mimosaceae, Myrtaceae and Papilionaceae. Similarly,the general absence of isoprene emitting species in suchimportant and widespread families as Bignoniaceae, Com-bretaceae, Ebenaceae, Meliaceae, Rubiaceae and Tiliaceaeis confirmed. The high rates of isoprene emission observedin Diplorhynchus was somewhat surprising (though con-firming a previous determination of Guenther et al. [1996])since the Apocynaceae contains very few emitting species.[25] It is often assumed that all members of a given genus
are either isoprene emitters or nonemitters. The presence ofseveral genera in this study with both emitting and non-emitting species is worth noting, therefore, complicating asit does attempts to assign emission rates to unmeasuredspecies based on rates measured on other members of thesame genus [Benjamin et al., 1996; Karlik and Winer,2001]. Both emitting and nonemitting members of Rhus
have been previously reported, and the same is true forAlbizia and Bauhinia (http://www.acd.ucar.edu:8080/voc/vocIndex.jsp). The report that Acacia nigrescens emittedisoprene [Guenther et al., 1996], in contrast to other speciesof the genus, was confirmed in this study, and four addi-tional emitting species of Acacia were discovered. A carefullook at the subgeneric classification of the very large genusAcacia (�1250 spp.) [Miller and Bayer, 2001; Robinsonand Harris, 2000] reveals that all these emitting species arerestricted to Subgenus Aculeiferum, Section Aculeiferum,a relatively small group of perhaps 100 spp., restricted toAfrica and Asia. Additional reports of isoprene emissionfrom A. mellifera in southern Africa [Guenther et al.,1996] and A. catechu (Asia), A. caffra (southern Africa)and A. modesta (India) (Rasmussen, personal communica-tion), all of which are also found in Subgenus Aculeiferum,Section Aculeiferum, lends support to the notion that iso-prene emission in the genus Acacia is restricted to thatsubgroup. Three additional Indian species, A. ferruginea,A. lenticularis and A. sinuate are also reported to emitisoprene (Rasmussen, personal communication) but we havebeen unable to determine the subgeneric classification ofthese species. The large subgenus Phyllodineae (>950 spp.),largely confined to Australia, although not well sampled, hasnot produced any isoprene emitting species. Although fewerthan 50 of the over 1250 species within the genus Acaciahave been sampled for VOC emissions, this apparent sharpdichotomy in the emissions characteristics of a single taxo-nomic subgroup is reminiscent (though opposite) of thesituation in the large genus Quercus (oaks), where all specieshave been found to emit isoprene except those in a relativelysmall Subgroup, Section Cerris, many of which emit largeamounts of monoterpenes in a light-dependent fashion[Loreto et al., 1998; Csiky and Seufert, 1999]. It is interest-ing to note in this context that two species of Acacia,A. tortilis [Guenther et al., 1996] and A. erioloba [Greenberget al., 2003] have also been reported to emit light-dependentmonoterpenes.
5. Summary and Conclusions
[26] Field campaigns during SAFARI 2000 have charac-terized biogenic VOC emissions from two distinct savannatypes, both of which are widespread in southern Africa.Combretum-Acacia savanna (sensu latu), investigated in thecurrent study, has generally low amounts of woody biomass,which is dominated by nonisoprene emitting tree species. Itis therefore expected to be a relatively small source ofbiogenic VOC. Although the REA tower flux estimatesreported here exhibit considerable scatter and are based onrelatively few sampling periods, the generally low fluxes ofisoprene measured from the Skukuza tower confirm thisprediction. However, within this broad savanna classifica-tion, there are areas with greater abundance of isoprene-emitting Acacia species (especially A. nigrescens) whichwill emit significant amounts of isoprene to the atmosphere.Thus, the lowveld is expected to be a patchy mosaic oflandscapes, some areas of very low isoprene emissions andothers of moderate to high emissions, depending on speciescomposition and biomass density, which are dependent inturn on soil properties [Chappell, 1992]. Mopane wood-lands, on the other hand, dominated by Colophospermum
HARLEY ET AL.: MEASUREMENTS OF ISOPRENE EMISSIONS SAF 4 - 9

mopane (Caesalpinaceae) have among the largest emissionsof monoterpenes (primarily a-pinene and d-limonene) ofany ecosystem yet investigated [Greenberg et al., 2003] andare widespread in southern Africa, with implications forregional tropospheric chemistry and aerosol formation andgrowth. A third major savanna type of south central Africa,the moist broad-leafed miombo woodlands, distinctly differ-ent from that discussed here, is dominated by members of theCaesalpinaceae, including Brachystegia (miombo), Julber-nardia and Isoberlinia, the latter two of which are known tobe isoprene emitters [Guenther et al., 2000; Klinger et al.,1998]. Miombo woodland is the dominant vegetation type ofthe Central African plateau, extending from Tanzania and theDemocratic Republic of Congo south through Zambia,Malawi and eastern Angola, to Zimbabwe and Mozambique.Based on species composition and biomass estimates andenclosure measurements on dominant vegetation [Otter etal., 2002a], miombo woodland is expected to represent amuch stronger isoprene source than Combretum-Acaciasavanna, though this has not yet been verified through fieldinvestigations of above canopy fluxes.[27] Emission potential of other types of savanna, and
other forested ecosystems of southern Africa, in whichBVOC emissions have not been directly measured, maybe inferred by combining estimates of species compositionand biomass with BVOC enclosure data. Since actualmeasurements of isoprene emission from many of thesespecies are lacking, estimates of emission capacity mustfrequently depend on the emission characteristics of taxo-nomically closely related species (see, e.g., Benjamin et al.[1996], who developed a similar strategy in California).Enclosure measurements reported here, in conjunction withother measurements found in the literature, confirm thatseveral plant families frequently represented in Africansavanna landscapes have a high proportion of isoprene-emitting genera and species. These include two families oflegumes, Caesalpinaceae and Papilionaceae, and Euphor-biaceae. Although the third legume family, Mimosaceae,generally contains fewer isoprene emitting taxa, the con-firmation of isoprene emission from several members of thegenus Acacia, widespread in savanna ecosystems, is impor-tant to understanding BVOC fluxes in southern Africa.Equally important is data indicating the general lack ofisoprene emissions from dominant savanna plant familiessuch as Combretaceae.[28] Attempts to integrate species composition and leaf
biomass data with species level estimates of BVOC emis-sion characteristics were initiated with the global model ofGuenther et al. [1995] and elaborated by Guenther et al.[1996]. Coupling a detailed and updated vegetation classi-fication scheme with ground and satellite-based estimates ofLAI and leaf biomass, and species-level BVOC emissiondata, Otter et al. [2003] have developed a highly resolvedbiogenic VOC emission model for southern Africa, the mostdetailed such scheme outside North America and Europe.Additional regional BVOC flux studies will be needed tovalidate predictions of such models, which will provideimportant VOC source information for use in regionaltropospheric chemistry and air quality models.
[29] Acknowledgments. This study was part of the SAFARI 2000Southern African Research Initiative. The authors wish to thank Bob and
Mary Scholes for inviting us to participate, as well as for logistic supportand species identification. Chris Geron (U.S. Environmental ProtectionAgency) provided the Voyager gas chromatograph. The authors wish tothank Ona Davies, Director of the Skukuza Nursery, and her staff foropening their facility to us and providing us with assistance and afternoontea. Andrew Woghiren provided valuable logistic support in the field. TheNational Center for Atmospheric Research is supported by the NationalScience Foundation, and Luanne Otter was supported by the Department ofArts, Culture, Science and Technology in South Africa.
ReferencesBaker, B., A. Guenther, J. Greenberg, A. Goldstein, and R. Fall, Canopyfluxes of 2-methyl-3-buten-2-ol over a ponderosa pine forest by relaxededdy accumulation: Field data and model comparison, J. Geophys. Res.,104, 26,107–26,114, 1999.
Benjamin, M. T., M. Sudol, L. Bloch, and A. M. Winer, Low-emittingurban forests: A taxonomic methodology for assigning isoprene andmonoterpene emission rates, Atmos. Environ., 30, 1437–1452, 1996.
Bowling, D. R., A. A. Turnipseed, A. C. Delany, D. D. Baldocchi, J. P.Greenberg, and R. K. Monson, The use of relaxed eddy accumulation tomeasure biosphere-atmosphere exchange of isoprene and other biologicaltrace gases, Oecologia, 116, 306–315, 1998.
Businger, J. A., and S. P. Oncley, Flux measurements with conditionalsampling, J. Atmos. Oceanic Technol., 7, 349–352, 1990.
Chappell, C., The ecology of sodic sites in the Eastern Transvaal Lowveld,M.S. thesis, Univ. of the Witwatersrand, Johannesburg, 1992.
Csiky, O., and G. Seufert, Terpenoid emissions of Mediterranean oaks andtheir relation to taxonomy, Ecol. Appl., 9, 1138–1146, 1999.
Deneris, E. S., R. A. Stein, and J. F. Mean, Acid-catalyzed formation ofisoprene from a mevalonate-derived product using a rat liver cytosolfraction, J. Biol. Chem., 260, 1382–1385, 1985.
Fehsenfeld, F., et al., Emissions of volatile organic compounds from vege-tation and the implications for atmospheric chemistry, Global Biogeo-chem. Cycles, 6, 389–430, 1992.
Geron, C., A. Guenther, T. Sharkey, and R. R. Arnts, Temporal variabilityin basal isoprene emission factor, Tree Physiol., 20, 799–805, 2000.
Geron, C., P. Harley, and A. Guenther, Isoprene emission capacity for UStree species, Atmos. Environ., 35, 3341–3352, 2001.
Greenberg, J. P., A. Guenther, P. R. Zimmerman, W. Baugh, C. Geron,K. Davis, D. Helmig, and L. F. Klinger, Tethered balloon measurements ofbiogenic VOCs in the atmospheric boundary layer, Atmos. Environ., 33,855–867, 1999.
Greenberg, J. P., A. Guenther, P. Harley, L. Otter, E. M. Veenendaal, C. N.Hewitt, A. E. James, and S. M. Owen, Eddy flux and leaf-level measure-ments of biogenic VOC emissions from mopane woodland of Botswana,J. Geophys. Res., 108, doi:10.1029/2002JD002317, in press, 2003.
Guenther, A., L. Otter, P. Zimmerman, J. Greenberg, R. Scholes, andM. Scholes, Biogenic hydrocarbon emissions from southern Africansavannas, J. Geophys. Res., 101, 25,859–25,865, 1996.
Guenther, A., C. Geron, T. Pierce, B. Lamb, P. Harley, and R. Fall, Naturalemissions of non-methane volatile organic compounds, carbon monoxide,and oxides of nitrogen from North America, Atmos. Environ., 34, 2205–2230, 2000.
Guenther, A. B., et al., A global model of natural volatile organic com-pound emissions, J. Geophys. Res., 100, 8873–8892, 1995.
Harley, P. C., R. K. Monson, and M. T. Lerdau, Ecological and evolutionaryaspects of isoprene emission from plants, Oecologia, 118, 109–123,2000.
Karlik, J., and A. M. Winer, Measured isoprene emission rates of plants inCalifornia landscapes: Comparison to estimates from taxonomic relation-ships, Atmos. Environ., 35, 1123–1131, 2001.
Klinger, L. F., J. Greenberg, A. Guenther, G. Tyndall, P. Zimmerman,M. M’Bangui, and J. M. Moutsambote, Patterns in volatile organic com-pound emissions along a savanna-rainforest gradient in central Africa,J. Geophys. Res., 103, 1443–1454, 1998.
Loreto, F., P. Ciccioli, E. Brancaleoni, R. Valentini, M. De Lillis, O. Csiky,and G. Seufert, A hypothesis on the evolution of isoprenoid emission byoaks based on the correlation between emission type and Quercus tax-onomy, Oecologia, 115, 302–305, 1998.
Miller, J. T., and R. J. Bayer, Molecular phylogenetics of Acacia (Faba-ceae: Mimosoideae) based on the chloroplast MATK coding sequenceand flanking TRNK intron spacer regions, Am. J. Bot., 88, 697–705,2001.
Monson, R. K., and E. A. Holland, Biospheric trace gas fluxes and theircontrol over tropospheric chemistry, Annu. Rev. Ecol. Syst., 32, 547–576,2001.
Otter, L., A. Guenther, and J. Greenberg, Seasonal and spatial variations inbiogenic hydrocarbon emissions from southern African savannas andwoodlands. Atmos. Environ., 36, 4265–4275, 2002a.
SAF 4 - 10 HARLEY ET AL.: MEASUREMENTS OF ISOPRENE EMISSIONS

Otter, L. B., et al., The Southern African Regional Science Initiative(SAFARI 2000): Wet season campaigns, S. Afr. J. Sci., 98, 131–137,2002b.
Otter, L., G. Fleming, C. Wiedinmyer, A. Guenther, J. Greenberg, andP. Harley, Spatial and temporal variations in biogenic VOC emissionsfor Africa south of the equator, J Geophys. Res., 108, doi:10.1029/2002JD002609, in press, 2003.
Petron, G., P. Harley, J. Greenberg, and A. Guenther, Seasonal temperaturevariations influence isoprene emission, Geophys. Res. Lett., 28, 1707–1710, 2001.
Robinson, J., and S. A. Harris, A plastid DNA phylogeny of the genusAcaciaMiller (Acacieae, Leguminoseae), Bot. J. Linn. Soc., 195–222, 2000.
Scholes, R. J., and B. H. Walker, An African Savanna: Synthesis of theNylsvley Study, Cambridge Univ. Press, New York, 1993.
Scholes, R. J., et al., The environment and vegetation of the flux measure-ment site near Skukuza, Kruger National Park, Koedoe, 44, 73–83, 2001.
Sharkey, T. D., E. L. Singsaas, M. T. Lerdau, and C. D. Geron, Weathereffects on isoprene emission capacity and applications in emissions algo-rithms, Ecol. Appl., 9, 1132–1137, 1999.
Silver, G. M., and R. Fall, Enzymatic synthesis of isoprene from dimethy-lallyl diphosphate in aspen leaf extracts, Plant Physiol., 97, 1588–1591,1991.
Silver, G. M., and R. Fall, Enzymatic synthesis of isoprene from dimethy-lallyl diphosphate in aspen leaf extracts, Plant Physiol., 97, 1588–1591,1991.
Simpson, D., et al., Inventorying emissions from nature in Europe, J. Geo-phys. Res., 104, 8113–8152, 1999.
Swap, R. J., et al., The Southern African Regional Science Initiative (SA-FARI 2000): Overview of the dry season field campaign, S. Afr. J. Sci.,98, 125–130, 2002.
�����������������������J. Greenberg, A. Guenther, and P. Harley, Atmospheric Chemistry
Division, National Center for Atmospheric Research, Boulder, CO 80307,USA. ([email protected])L. Otter, Climatology Research Group, University of the Witwatersrand,
Braamfontein, Johannesburg, South Africa.
HARLEY ET AL.: MEASUREMENTS OF ISOPRENE EMISSIONS SAF 4 - 11