Contrasting photosynthetic characteristics of forest vs. savanna species (far North Queensland,...
43
BGD 11, 8969–9011, 2014 Contrasting photosynthetic characteristics of forest vs. savanna species K. J. Bloomfield et al. Title Page Abstract Introduction Conclusions References Tables Figures Back Close Full Screen / Esc Printer-friendly Version Interactive Discussion Discussion Paper | Discussion Paper | Discussion Paper | Discussion Paper | Biogeosciences Discuss., 11, 8969–9011, 2014 www.biogeosciences-discuss.net/11/8969/2014/ doi:10.5194/bgd-11-8969-2014 © Author(s) 2014. CC Attribution 3.0 License. This discussion paper is/has been under review for the journal Biogeosciences (BG). Please refer to the corresponding final paper in BG if available. Contrasting photosynthetic characteristics of forest vs. savanna species (far North Queensland, Australia) K. J. Bloomfield 1,* , T. F. Domingues 2,** , G. Saiz 3,*** , M. I. Bird 4 , D. M. Crayn 5 , A. Ford 6 , D. J. Metcalfe 6 , G. D. Farquhar 1 , and J. Lloyd 7,8,* 1 Division of Plant Sciences, Research School of Biology, The Australian National University, Canberra, ACT 0200, Australia 2 Universidade de São Paulo, Faculdade de Filosofia Ciências e Letras de Ribeirão Preto, Brazil 3 Karlsruhe Institute of Technology, Institute of Meteorology and Climate Research, Garmisch-Partenkirchen, Germany 4 School of Earth and Environmental Sciences and Centre for Tropical Environmental and Sustainability Science, James Cook University, Cairns, Queensland, Australia 5 Australian Tropical Herbarium and Centre for Tropical Biodiversity and Climate Change, James Cook Universtiy, Cairns, Queensland, Australia 6 CSIRO Ecosystem Sciences Tropical Forest Research Centre, Atherton, Queensland, Australia 7 Department of Life Sciences, Imperial College London, Silwood Park Campus, SL5 7PY, UK 8969
-
Upload
independent -
Category
Documents
-
view
1 -
download
0
Transcript of Contrasting photosynthetic characteristics of forest vs. savanna species (far North Queensland,...
BGD11, 8969–9011, 2014
Contrastingphotosynthetic
characteristics offorest vs. savanna
species
K. J. Bloomfield et al.
Title Page
Abstract Introduction
Conclusions References
Tables Figures
J I
J I
Back Close
Full Screen / Esc
Printer-friendly Version
Interactive Discussion
Discussion
Paper
|D
iscussionP
aper|
Discussion
Paper
|D
iscussionP
aper|
Biogeosciences Discuss., 11, 8969–9011, 2014www.biogeosciences-discuss.net/11/8969/2014/doi:10.5194/bgd-11-8969-2014© Author(s) 2014. CC Attribution 3.0 License.
This discussion paper is/has been under review for the journal Biogeosciences (BG).Please refer to the corresponding final paper in BG if available.
Contrasting photosyntheticcharacteristics of forest vs. savannaspecies (far North Queensland, Australia)K. J. Bloomfield1,*, T. F. Domingues2,**, G. Saiz3,***, M. I. Bird4, D. M. Crayn5,A. Ford6, D. J. Metcalfe6, G. D. Farquhar1, and J. Lloyd7,8,*
1Division of Plant Sciences, Research School of Biology, The Australian National University,Canberra, ACT 0200, Australia2Universidade de São Paulo, Faculdade de Filosofia Ciências e Letras de Ribeirão Preto,Brazil3Karlsruhe Institute of Technology, Institute of Meteorology and Climate Research,Garmisch-Partenkirchen, Germany4School of Earth and Environmental Sciences and Centre for Tropical Environmental andSustainability Science, James Cook University, Cairns, Queensland, Australia5Australian Tropical Herbarium and Centre for Tropical Biodiversity and Climate Change,James Cook Universtiy, Cairns, Queensland, Australia6CSIRO Ecosystem Sciences Tropical Forest Research Centre, Atherton, Queensland,Australia7Department of Life Sciences, Imperial College London, Silwood Park Campus, SL5 7PY, UK
8969
BGD11, 8969–9011, 2014
Contrastingphotosynthetic
characteristics offorest vs. savanna
species
K. J. Bloomfield et al.
Title Page
Abstract Introduction
Conclusions References
Tables Figures
J I
J I
Back Close
Full Screen / Esc
Printer-friendly Version
Interactive Discussion
Discussion
Paper
|D
iscussionP
aper|
Discussion
Paper
|D
iscussionP
aper|
8School of Marine and Tropical Biology and Centre for Tropical Environmental andSustainability Science, James Cook University, Cairns, Queensland, Australia*previously at: School of Geography, University of Leeds, LS2 9JT, UK**previously at: School of Geosciences, University of Edinburgh, EH8 9XP, UK***previously at: School of Geography & Geosciences, University of Saint Andrews, KY16 9AL,UK
Received: 26 May 2014 – Accepted: 26 May 2014 – Published: 13 June 2014
Correspondence to: K. J. Bloomfield ([email protected])
Published by Copernicus Publications on behalf of the European Geosciences Union.
8970
BGD11, 8969–9011, 2014
Contrastingphotosynthetic
characteristics offorest vs. savanna
species
K. J. Bloomfield et al.
Title Page
Abstract Introduction
Conclusions References
Tables Figures
J I
J I
Back Close
Full Screen / Esc
Printer-friendly Version
Interactive Discussion
Discussion
Paper
|D
iscussionP
aper|
Discussion
Paper
|D
iscussionP
aper|
Abstract
Forest and savanna are the two dominant vegetation types of the tropical regions withvery few tree species common to both. Aside from precipitation patterns, boundariesbetween these two vegetation types are strongly determined by soil characteristics andnutrient availability. For tree species drawn from a range of forest and savanna sites in5
tropical far north Queensland, Australia, we compared leaf traits of photosynthetic ca-pacity, structure and nutrient concentrations. Area-based photosynthetic capacity washigher for the savanna species with a steeper slope to the photosynthesis↔Nitrogenrelationship compared with the forest group. Higher leaf mass per unit leaf area forthe savanna trees derived from denser rather than thicker leaves and did not appear10
to restrict rates of light-saturated photosynthesis when expressed on either an area-or mass-basis. Median ratios of foliar N to phosphorus were above 20 at all sites,but we found no evidence for a dominant P-limitation of photosynthesis for the forestgroup. A parsimonious mixed-effects model of area-based photosynthetic capacity re-tained vegetation type and both N and P as explanatory terms. Resulting model-fitted15
predictions suggested a good fit to the observed data (R2 = 0.82). The model’s ran-dom component found variation in area-based photosynthetic response to be muchgreater among species (71 % of response variance) than across sites (9 %). These re-sults suggest that in leaf area-based photosynthetic terms, savanna trees of far northQueensland, Australia are capable of out-performing forest species at their common20
boundaries1.
1 Introduction
Forests and savannas dominate the tropical vegetated regions of the Earth covering15–20 % of the Earth’s surface (Torello-Raventos et al., 2013). At a broad scale, ithas been long recognised that the distribution of these two biomes, each with its own25
1Adopted symbols and abbreviations are defined in Table 5.8971
BGD11, 8969–9011, 2014
Contrastingphotosynthetic
characteristics offorest vs. savanna
species
K. J. Bloomfield et al.
Title Page
Abstract Introduction
Conclusions References
Tables Figures
J I
J I
Back Close
Full Screen / Esc
Printer-friendly Version
Interactive Discussion
Discussion
Paper
|D
iscussionP
aper|
Discussion
Paper
|D
iscussionP
aper|
structural characteristics and species composition, is principally governed by precip-itation and its seasonality (Schmimper, 1903), but with soil chemical characteristicsalso important (Lloyd et al., 2008, 2009; Lehmann et al., 2011). Edaphic conditionsare especially influential in regions where the two biomes intersect – often referredto as “ecotones” or “Zones of (Ecological) Tension” (ZOT) – both forest and savanna5
existing as discrete “patches” under similar climatic conditions (Cochrane, 1989; Rat-ter, 1992; Thompson et al., 1992; Hoffmann et al., 2009; Lehmann et al., 2011; Saizet al., 2012; Veenendaal et al., 2014). The patchiness of the ZOT mosaic at small spa-tial scales has led some to argue that disturbances, principally fire, must interact withclimatic/edaphic boundaries in determining transition between the two alternative veg-10
etation types (e.g. Lehmann et al., 2011; Hoffmann et al., 2012). Whatever the drivers,feedbacks associated with changes to distributions of these biomes in response to an-thropogenic climate change have the potential to substantially modify the rate of futureglobal warming (e.g. Malhi et al., 2009).
The fundamental drivers of variation in photosynthetic carbon acquisition across and15
within these two biomes remain poorly understood. There is, however, accumulatingevidence that for tropical forest species phosphorus (P) availability may limit photosyn-thetic rates and productivity (Vitousek, 1984; Domingues et al., 2010; Mercado et al.,2011; Quesada et al., 2012). Whereas in savanna ecosystems nitrogen (N) may bemore important as a limiting nutrient (Lloyd et al., 2009). Soils in Australia are gener-20
ally highly weathered with the consequence that plant performance, even in the sub-tropical and temperate regions, is often considered more limited by the supply of Pthan of N (Beadle, 1962, 1966; Webb, 1968). Nevertheless, in far north Queensland(FNQ), where almost all the Australian tropical forest occurs, recent volcanic activity(0.01 to 4.5 Ma BP) has produced some very young soils. These basaltic soils cover25
about 60 % of FNQ’s land area (Whitehead et al., 2007) and display higher levels oforganic matter and total P when compared with other parent material groupings suchas granitic or metamorphic (Spain, 1990). Direct links from soil P status to measuresof forest productivity are not straightforward, however, and inter-specific variations in
8972
BGD11, 8969–9011, 2014
Contrastingphotosynthetic
characteristics offorest vs. savanna
species
K. J. Bloomfield et al.
Title Page
Abstract Introduction
Conclusions References
Tables Figures
J I
J I
Back Close
Full Screen / Esc
Printer-friendly Version
Interactive Discussion
Discussion
Paper
|D
iscussionP
aper|
Discussion
Paper
|D
iscussionP
aper|
P use efficiency are likely to have contributed to the varied composition of local plantcommunities (Gleason et al., 2009).
The forest and savanna vegetation types (V) have very few plant species in common(Torello-Raventos et al., 2013) and the edaphic determinants of the ZOT are of partic-ular interest in Australia (Beadle, 1962, 1966; Russell-Smith et al., 2004). The savan-5
nas of FNQ are distinctive globally being dominated by eucalypts (Myrtaceae). Here,species of the closely related genera Eucalyptus and Corymbia are characterised bysclerophyllous (hard) leaves with relatively low leaf [N], but a high oil content and cor-respondingly high heat of combustion (Beadle, 1966) – traits that contribute to a highlyflammable leaf litter. In contrast to the tree species of the moist forests, such ever-10
green savanna species are generally expected to be able to withstand periods of watershortage and high water vapour pressure deficit. Sclerophylly imparts both structuraland physiological leaf traits, but, to date, most research has focused on the struc-tural aspects: leaf thickness and density combining in the ratio leaf mass per unit area(Ma, g m−2). Sclerophyllous leaves are often amphistomatous (i.e. with stomata abun-15
dant on both the adaxial and abaxial leaf surfaces) displaying an isobilateral mesophylldistribution (Burrows, 2001) – characteristics thought to be associated with both highphotosynthetic potentials (Mott et al., 1982) and high insolation environments (Pyykko,1966; Parkhurst, 1978). Such eco-physiological associations are expected on theoreti-cal grounds, especially under conditions of low water availability (Buckley et al., 2002).20
Broad overlap in leaf traits has been reported for savanna and forest tree species,but, generally speaking, differences between the two vegetation types in leaf N and Pcontent, rates of photosynthesis, morphology and longevity might reasonably be ex-pected due to the drier conditions typical of savannas (Wright et al., 2001; Buckleyet al., 2002; Meir et al., 2007; Domingues et al., 2010). In addition, within individual25
tropical forest stands, leaves can vary markedly in their physiological and structuralproperties depending on canopy position and the availability of gaps (Popma et al.,1992; Lloyd et al., 2010). Indeed tropical forest tree species are often grouped ac-cording to their degree of shade tolerance and/or light requirement (e.g. Swaine and
8973
BGD11, 8969–9011, 2014
Contrastingphotosynthetic
characteristics offorest vs. savanna
species
K. J. Bloomfield et al.
Title Page
Abstract Introduction
Conclusions References
Tables Figures
J I
J I
Back Close
Full Screen / Esc
Printer-friendly Version
Interactive Discussion
Discussion
Paper
|D
iscussionP
aper|
Discussion
Paper
|D
iscussionP
aper|
Whitmore, 1988; but see Poorter, 1999). Shade tolerant species in the understory mayreceive less than 2 % of full light at the canopy crown (Chazdon, 1992) whilst pio-neer species typically require high light for germination and survival and depend onthe creation of forest gaps (Turner, 2001). As a result, species characteristic of differ-ing light niches have commonly been considered to display distinctive photosynthetic5
traits linked to nutrient investment, allocation and leaf architecture (Niinemets, 1997;Carswell et al., 2000; Wright et al., 2001). In the context of P availability, a study inthe forest of Guyana, on relatively infertile Ferralsols, found that pioneer tree speciesexhibited higher photosynthetic nitrogen and phosphorus use efficiencies than neigh-bouring climax species (defined here as those species whose seeds can germinate10
and establish in the shade) (Raaimakers et al., 1995).In this study we contrast leaf photosynthetic traits for tree species from forest and
savanna communities of northern Australia addressing the following questions:
1. Do tropical moist forest and savanna tree species differ in photosynthetic capacity(Amax) and nutrient use efficiency?15
2. If so, can such differences be linked to variation in leaf structural traits?
3. Does the slope or intercept of the Amax ↔ [N] or Amax ↔ [P] relationship differ be-tween species characteristic of the two vegetation types?
4. Do interspecific differences in leaf traits for forest trees correspond with their in-dependently ascertained light niche classification?20
2 Materials and method
2.1 Sites and species
A series of sites was selected in FNQ, Australia in an arc from the Atherton Tablelands,inland from Cairns, to Cape Tribulation, north of the Daintree River. The series, which
8974
BGD11, 8969–9011, 2014
Contrastingphotosynthetic
characteristics offorest vs. savanna
species
K. J. Bloomfield et al.
Title Page
Abstract Introduction
Conclusions References
Tables Figures
J I
J I
Back Close
Full Screen / Esc
Printer-friendly Version
Interactive Discussion
Discussion
Paper
|D
iscussionP
aper|
Discussion
Paper
|D
iscussionP
aper|
forms part of the Tropical Biomes in Transition (TROBIT) network, was designed toprovide a contrast of vegetation types, specifically forest (F) and savanna (S), andoccurring on diverse soils (Table 1). Further descriptions of all sites and the ratio-nale (both structural and floristic) for our distinction between F and S are availablein Torello-Raventos et al. (2013). Seven sites were visited in six weeks of fieldwork dur-5
ing April and May 2009 and measurements were performed on 125 trees representing30 species. A full list of species by site is presented at Table S1 (Supplement).
2.2 Gas exchange measurements
Leaf gas exchange measurements were performed using a portable photosynthesissystem (Li-Cor 6400, Li-Cor, Lincoln, NE, USA) on young, fully developed leaves. Dur-10
ing the measurements, chamber conditions were set with block temperature (mean27 ◦C) held slightly above ambient air temperature to avoid problems of condensa-tion; relative humidity remained close to ambient (mean=67 %). The rate of air flowto the sample cell was held constant at 500 µmol s−1, but exceptionally, and whenfaced with very low stomatal conductance, this was reduced (minimum 250 µmol s−1).15
Light (A↔Q) curves were generated for each tree species to determine the saturatinglight level for adoption in subsequent CO2 response curves (Aa ↔ Ci curves). Thosesaturating light levels ranged from 500 to 2000 µmol m−2 s−1. Measurements of light-saturated net CO2 assimilation per unit leaf area (Aa) were then obtained for a rangeof intercellular CO2 concentrations (Ci) by varying chamber CO2 concentration (Ca).20
The Aa ↔ Ci curves were fitted using the Farquhar et al. (1980) model as applied bySharkey et al. (2007) that allows determination of characterising photosynthetic param-eters including maximum carboxylation velocity (Vcmax,a) and maximum rate of electrontransport (Jmax,a); internal (sub-stomatal) conductance is assumed to be infinite. Thecurve fitting routine was executed in the R environment (R Development Core Team,25
2011) using code provided by Domingues et al. (2010). The Aa ↔ Ci curves also pro-vided area based values of light-saturated photosynthesis under ambient and elevatedatmospheric [CO2] (Asat,a and Amax,a respectively). For the purposes of modelling pho-
8975
BGD11, 8969–9011, 2014
Contrastingphotosynthetic
characteristics offorest vs. savanna
species
K. J. Bloomfield et al.
Title Page
Abstract Introduction
Conclusions References
Tables Figures
J I
J I
Back Close
Full Screen / Esc
Printer-friendly Version
Interactive Discussion
Discussion
Paper
|D
iscussionP
aper|
Discussion
Paper
|D
iscussionP
aper|
tosynthetic capacity we focus on variations in Amax – preferred over Asat in this contextas less susceptible to limitations of stomatal conductance (gs).
In the absence of cranes or suspended walkways, branches had to be cut fromtrees. Sun exposed branches for low trees were reached using hand-held secateursor forestry shears on telescopic poles; for taller trees branches were pulled down using5
a weighted line shot from a catapult. Trees of sub-canopy species were rarely foundgrowing in full sunlight and so these leaves, although sampled from upper branchesfree of self-shading, had developed in a relatively low-light environment. Once de-tached, the stem was re-cut under water in order to re-establish the xylem water col-umn (Domingues et al., 2010). Performing gas exchange measurements on excised10
branches can affect subsequent calculations where stomatal conductance is heavilydepressed (Santiago and Mulkey, 2003). The Aa ↔ Ci curves were reviewed for suchinstances and where necessary the data excluded from all further analysis (n = 11).A further check on data integrity proposed by Kattge et al. (2009) rejects those mea-surements where Asat/[N]m is <2 µmol CO2 g−1 N s−1: any such curves were likewise15
excluded (n = 2).
2.3 Leaf morphology and nutrient analysis
At the completion of gas exchange measurements, the leaf (gas leaf) was cut fromthe branch and leaf thickness (d ) taken by averaging repeated measurements (Mitu-toyo dial thickness gauge, n = 6) alternating back and forward across the mid-vein and20
proceeding down the lamina from tip to base. A series of discs (0.66 cm, diameter)was then punched from the leaf avoiding veins and necrosis or other damage. Thediscs with the remainder of the leaf (petiole and mid-vein discarded) were oven driedat 70 ◦C for a minimum of 48 h before their dried mass was recorded. The combinationfor the discs of known area and dried mass allowed the calculation of leaf mass per25
unit area (Ma, g m−2). Leaf density (ρ, g cm−3) was estimated using the equation:
ρ =Ma/d . (1)
8976
BGD11, 8969–9011, 2014
Contrastingphotosynthetic
characteristics offorest vs. savanna
species
K. J. Bloomfield et al.
Title Page
Abstract Introduction
Conclusions References
Tables Figures
J I
J I
Back Close
Full Screen / Esc
Printer-friendly Version
Interactive Discussion
Discussion
Paper
|D
iscussionP
aper|
Discussion
Paper
|D
iscussionP
aper|
In addition to the gas leaf, the opposing leaf was also cut from the branch, petioleand mid-vein discarded, and placed in a zip-lock plastic bag with moist cotton-wooluntil fresh mass could be measured that evening (or exceptionally the next day). Theleaf was then placed in an envelope, oven-dried as above and dried mass recorded.The ratio of the leaf’s dried to fresh mass is termed leaf dry matter content (ξ). All5
subsequent references to ξ relate to opposing and not gas leaves. Logistical constraintsimposed by repeated changes of base camp and lack of electricity supply meant thatdelays were experienced between harvesting the leaves and oven drying (maximumdelay 30 days).
Oven-dried material was used for determination of total leaf [N] and [P]: dried ground10
leaf material was acid-peroxide digested before colorimetric analysis using a seg-mented flow analyser (Skalar San+System, Breda, the Netherlands). The photosyn-thetic efficiency of nutrient use was estimated as the maximal rate of carbon gain perunit of leaf N and P (AN and AP respectively).
2.4 Statistical analyses15
All statistical analysis and modelling was conducted using the open-source statisticalenvironment R (R Development Core Team, 2011). As initial data exploration revealedwide variation in many trait values across the different sites, non-parametric Kruskal-Wallis tests were used to test for differences among the categorical factors of Site andV using the coin package (Hothorn et al., 2008). Where significant, differences among20
factor levels were assigned using Tukey’s HSD post-hoc tests (p < 0.05) applied to datarankings. After exclusion of poor Aa ↔ Ci curves (n = 13, described above) and repli-cates with other missing values (n = 3), the revised dataset of 109 leaf measurementscontained many more observations for F (n = 85) than S (n = 24) and so there is anelement of imbalance in the test specification where V is adopted as the fixed factor.25
Bivariate relationships were described using Standardised Major Axis (SMA) line fitsusing smart-3 (Warton et al., 2006).
8977
BGD11, 8969–9011, 2014
Contrastingphotosynthetic
characteristics offorest vs. savanna
species
K. J. Bloomfield et al.
Title Page
Abstract Introduction
Conclusions References
Tables Figures
J I
J I
Back Close
Full Screen / Esc
Printer-friendly Version
Interactive Discussion
Discussion
Paper
|D
iscussionP
aper|
Discussion
Paper
|D
iscussionP
aper|
2.4.1 Mixed effects linear model of photosynthetic capacity
The study involved replicated measurements of tree species within and across forestand savanna plots. Such a design introduced the strong likelihood that measurementswithin the same site would be influenced by spatial proximity. In specifying a model thatattempted to explain differences in photosynthetic capacity between V it was neces-5
sary to recognise this hierarchical structure in order to avoid systematic variation in theresiduals leading to potentially biased interpretation (Zuur et al., 2009). The sites andspecies selected, rather than considered of primary interest per se, were viewed as rep-resentative of a wider population and focus placed on their variance. The model’s ran-dom component therefore included the categorical variables of species nested within10
sites. Unfortunately, because not all tree species at all sites were measured with repli-cation (see instances of n = 1 at Supplement Table S1), convergence problems meantthat the random component of the model could not accommodate differing slopes aswell as intercepts for species within a site.
The final model (fitted using the nlme package in R) may be expressed as:15
Amax,a[i jk] = α+β1bjk +β2[N]a[i jk] +β3[P]a[i jk] +ak +aj |k +εi jk . (2)
Here response variable Amax,a[i jk] denotes the maximum rate of area-based photo-synthesis for observation i of species j at site k with b denoting a categorical variabletaking a base value of 0 for species in plots classified as “forest” (F) and a value of 1 for“savanna” (S). The term ak is a random intercept and allows for variation among sites.20
The term aj |k allows for interspecific variation at the same site. The term εi jk is theresidual (unexplained) error and represents the variation within-site, variation amongplants of the same species and measurement error. Each of the variation terms isassumed to be normally distributed with mean zero. With the independent covariatescentred (i.e., zeroed on the population mean), the fitted intercept term α thus repre-25
sents the predicted forest tree Amax,a at the (F+S) population mean [N]a and [P]a. Theterm β1b represents the difference in predicted Amax,a between the two V (in this case
8978
BGD11, 8969–9011, 2014
Contrastingphotosynthetic
characteristics offorest vs. savanna
species
K. J. Bloomfield et al.
Title Page
Abstract Introduction
Conclusions References
Tables Figures
J I
J I
Back Close
Full Screen / Esc
Printer-friendly Version
Interactive Discussion
Discussion
Paper
|D
iscussionP
aper|
Discussion
Paper
|D
iscussionP
aper|
Amax,a[S]−Amax,a[F]). The predicted S tree Amax,a at the population mean [N]a and [P]avalues is therefore α+β1.
2.5 Plant functional types
F species were assigned to one of four plant functional types (Φ) depending on theiradult stature and light requirements for recruitment (Veenendaal et al., 1996). Three5
of the authors (DMC, AF and DJM), each with an extensive knowledge of Australiantropical forest trees, made independent Φ assignments before combined results wereconsolidated and minor discrepancies resolved. The Φ descriptions are provided in Ta-ble S2 (Supplement) and the relevant species designations in Table S1 (Supplement).All of the tropical moist forest species in this study are obligate evergreen.10
3 Results
There was a ten-fold range across the dataset in photosynthetic capacity per unit leafarea (Amax,a) from 4.9 to 52.0 µmol m−2 s−1 (Fig. 1a). Mean values (treating each sam-pled tree as an independent variable) differed among sites (p < 0.0001) and were sig-nificantly higher in the S plots (Fig. 1b; p < 0.0001). When expressed per unit leaf15
dried mass, photosynthetic capacity (Amax,m) was also highly variable with significantplot-to-plot differences (Fig. 1c; p < 0.0001). Overall there was, however, no differencein mean Amax,m between F and S (Fig. 1d; p = 0.11). There were striking inter-site dif-ferences in leaf mass per unit area (Ma; Fig. 1e) even for adjacent sites associatedwith the same V (e.g. DCR-01 and DCR-02). Indeed, this trait was highly variable with20
a five-fold range from lowest to highest observations (Fig. 1e). Overall, Ma was higherfor S than for F (Fig. 1f; p < 0.0001). That contrast in Ma derived chiefly from variableleaf dry matter content ratios (ξ) rather than leaf thickness (d ). A three-fold variationin ξ was observed with pronounced differences among sites (Fig. 1g; p < 0.0001) and,like Ma, higher mean values for S than for F (Fig. 1h; p = 0.0035). By contrast, there25
8979

BGD11, 8969–9011, 2014
Contrastingphotosynthetic
characteristics offorest vs. savanna
species
K. J. Bloomfield et al.
Title Page
Abstract Introduction
Conclusions References
Tables Figures
J I
J I
Back Close
Full Screen / Esc
Printer-friendly Version
Interactive Discussion
Discussion
Paper
|D
iscussionP
aper|
Discussion
Paper
|D
iscussionP
aper|
was no difference between S and F for measures of d (Fig. 1j; p = 0.70) which was alsomuch less variable. Indeed, differences in d (Fig. 1i; p = 0.0005) were dominated byextremely high values for just one species, Wilkiea angustifolia, sampled in this studyat KBL-03 only.
Both area- and mass-based leaf nitrogen levels were highly variable and this was5
most pronounced within the F plots. On an area basis, differences among sites(Fig. 1 m; p < 0.0001) produced higher mean [N]a values for S than for F (Fig. 1n;p = 0.0002) with this inter-site N variability even more pronounced on a mass basis(Fig. 1o; p < 0.0001). Here mean [N]m at KBL-01 was more than double that at neigh-bouring KBL-02. Overall, mean [N]m was higher for F than for S (Fig. 1p; p < 0.0001).10
Broadly similar trends were observed for total leaf phosphorus with higher mean [P]afor S vs. F (Fig. 1r; p = 0.003), and with that ranking also reversed when expressed ona mass basis (Fig. 1t; p = 0.0004). Foliar ratios [N] : [P] ranged from 10.1 (Neisospermapoweri, KBL-01) to 39.1 (Symplocos hayesii, KBL-03), but on average did not differacross plots (Fig. 1k; p = 0.29) and with no systematic differences between F and S15
(Fig. 1l; p = 0.74).There was a strong positive linear relationship between [P]a and [N]a for both F
and S (Fig. 2a), but with a steeper slope observed for S. The shallower slope for Fdiffers (p = 0.031) from the mean relationship for tropical forests as suggested by Re-ich et al. (2009) as depicted by the dotted line passing through the origin in Fig. 2a20
(slope=103/18.8). When expressed on a mass basis, there was a single, commonP↔N relationship for both V (Fig. 2b). Leaf nutrient investment on an area basisshowed positive relationships with Ma for F only (Fig. 2c and d).
To test for differences in the photosynthesis-nutrient relationships between the twoV, a series of standardised major axis (SMA) analyses were undertaken with photosyn-25
thetic parameters (Amax, Vcmax and Jmax) as the response variable and leaf chemistry([N] and [P]) as the explanatory bivariate (Table 2) – with analyses undertaken on bothan area and a mass basis. For the combined dataset, linear relationships were strongfor both nutrients irrespective of whether variables were expressed on a mass- or area-
8980
BGD11, 8969–9011, 2014
Contrastingphotosynthetic
characteristics offorest vs. savanna
species
K. J. Bloomfield et al.
Title Page
Abstract Introduction
Conclusions References
Tables Figures
J I
J I
Back Close
Full Screen / Esc
Printer-friendly Version
Interactive Discussion
Discussion
Paper
|D
iscussionP
aper|
Discussion
Paper
|D
iscussionP
aper|
basis (r values ranging from 0.62 to 0.72, Table S3, Supplement). Nevertheless, testsfor a common slope for the two V were rejected for all three [N]a relationships (Supple-ment Table S3).
The Amax,a ↔ [N]a association as shown in Fig. 3a suggests two important differ-ences between the two V. First: across the (pooled) dataset the lowest 0.3 fraction5
[N]a are confined to F associated trees (as can also be inferred from Figs. 1 and 2).Second: for the lowest [N]a for S associated trees (ca. 1.6 g m−2) similar Amax,a are ob-served for both S and F, but as [N]a increases beyond that point Amax,a for S rises witha sensitivity nearly three times that observed for F. A similar pattern was observed forthe Amax,a ↔ [P]a association (Fig. 3b), although in this case the OLS regression for S10
trees was not statistically significant (p = 0.15) and thus a formal evaluation of slopeand intercept differences is not strictly applicable. There was no difference betweenthe two V in either the slope or the intercept of the Amax,a ↔Ma association (Supple-
ment Table S3) and a single line (r2 = 0.3) describes the common positive relationship(Fig. 3c).15
When the same Amax ↔ trait relationships were examined on a mass basis, verydifferent patterns appeared: for example, differences between F and S in the Amax,m ↔[N]m association were expressed as differences in intercept (Fig. 3d) rather than slope(cf. Fig. 3a). This was also the case for the Amax,m ↔ [P]m association. Furthermore(and in contrast to the area based Amax,a expression) both Amax,m ↔Ma associations20
were significant, but with different slopes for the two V (Fig. 3f).In attempting to model variation in Amax,a the starting, or maximal, fixed component
of our linear mixed effects model (Model 1, Table 3) included, along with a V depen-dent term, those continuous variables spanning leaf morphology and chemistry sug-gested by pair-wise correlation plots at Fig. S1 (Supplement). The optimal fixed term,25
on Akaike information and likelihood ratio criteria, was provided by Model 4: with veg-etation type a fitted categorical variable (through the β1b term) along with the continu-ous variables [N]a and [P]a. Model performance was not improved by adding interactionterms (see model variants 8 through 12, Table 3). Also of note is Model 6 which in drop-
8981
BGD11, 8969–9011, 2014
Contrastingphotosynthetic
characteristics offorest vs. savanna
species
K. J. Bloomfield et al.
Title Page
Abstract Introduction
Conclusions References
Tables Figures
J I
J I
Back Close
Full Screen / Esc
Printer-friendly Version
Interactive Discussion
Discussion
Paper
|D
iscussionP
aper|
Discussion
Paper
|D
iscussionP
aper|
ping the b term produces a significantly inferior model (p = 0.002). That is to say, wecould not account for the intrinsically higher area-based photosynthetic capacities ofS affiliated trees (Fig. 1a) through systematic F–S differences in any of our measuredfoliar traits. Comparisons against a model variant (Model 7, Table 3), excluding the bterm, but reinstating available traits relating to leaf chemistry and structure confirmed5
that b could not be substituted in this way.The full model, fixed and random terms combined, explained 82 % of variation in the
observed values of Amax,a and with all four forest Φ reasonably well predicted (Fig. 4a).A plot of model residuals against fitted values raised no concerns for the model as-sumptions (Fig. S2, Supplement). These model results also suggest, other things be-10
ing equal, that photosynthetic capacities are intrinsically higher for S than F species(Fig. 1b) – with estimated values at the dataset trait means of 29 and 18 µmol CO2
m−2 s−1 (Table 4). Despite the relatively low t value for the fitted [P]a term, the predic-tive power of the overall model was improved by retaining [P]a as a fixed term (comparemodels 4 and 5 in Table 3). The greater significance attached by the final model to the15
[N]a term is confirmed when the two slope coefficients are standardised to allow for the
difference in underlying units: β′
2[N]a = 0.294 and β′
3[P]a = 0.172 (interpreted as therelative effect on Amax,a of one standard deviation change in the independent variable).
The final model adopted here was also compared against a minimal, or null, modelthat contained only b as a fixed term, but which employed an identical random com-20
ponent of species nested within sites (Table 4). Comparing output from the final andnull models showed that including leaf nutrient status in the fixed component reducedresponse variance by more than half – and with the residual variance (real noise) de-creasing from 8.64 to 7.49 µmol CO2 m−2 s−1.
The model’s nested random component, which recognises the grouping of species25
within sites, allows the variance of the response (Amax,a) to be partitioned among theavailable terms. The fraction attributable to variance among plots (9 %) is dwarfed bythat among species (71 %). The residual term (20 % of response variance) reflects vari-ation within individual sites and species together with measurement error. Variation in
8982
BGD11, 8969–9011, 2014
Contrastingphotosynthetic
characteristics offorest vs. savanna
species
K. J. Bloomfield et al.
Title Page
Abstract Introduction
Conclusions References
Tables Figures
J I
J I
Back Close
Full Screen / Esc
Printer-friendly Version
Interactive Discussion
Discussion
Paper
|D
iscussionP
aper|
Discussion
Paper
|D
iscussionP
aper|
Amax,a around the population mean was therefore influenced much more by a tree’staxonomy than the plot in which it was growing. One factor that may help explain thisinter-specific variation is plant functional type (Φ, related to a tree’s growth strategy andlight requirements as described in Table S2). We next examined model output for anyΦ-related pattern in random intercepts for the different species. We found that tall pio-5
neers displayed higher intercepts than sub-canopy species (p = 0.0326) as is shown inFig. 4b. Thus, at any given [N]a and [P]a tall pioneers typically achieved a higher Amax,athan shade tolerant forest trees. Small pioneers and shade tolerant canopy specieswere intermediate between these two extremes and showed intercepts close to thepopulation mean.10
Broadly similar results were obtained when the mixed modelling approach was re-peated for mass-based leaf traits (Table S4, Supplement). The fixed component of thefinal parsimonious model again included b, [N]m and [P]m, but this time with a signifi-cant N : P interaction. The preferred random term was unchanged from that presentedabove. Including the mass-based leaf nutrient terms had a huge effect in reducing the15
response variance with inter-site variance effectively removed when compared againsta minimal model that contained only b. Inter-specific variance, as a proportion of the to-tal, was only 32 % (compared with 71 % for the area-based model above), but the samedistinction in random intercept was observed between tall pioneer and sub-canopyspecies (p = 0.0320).20
Elevated rates of photosynthesis per unit N yielded higher photosynthetic use effi-ciencies (AN) for S species (Fig. 5e). Of the F trees only the tall pioneers showed anequivalent AN to the S species and, as with the mixed effects model’s random interceptterms (Fig. 4b), there was a significant difference between tall pioneers and shade tol-erant species. On the other hand, although there was a clear distinction between F and25
S species in AP, no such distinction could be made among the four F types. This wasmostly due to greater within-Φ variability.
The higher Ma values for the S trees (Fig. 1d) suggested underlying differences inleaf structure between the two V and the range of Ma values for separate Φ classes
8983
BGD11, 8969–9011, 2014
Contrastingphotosynthetic
characteristics offorest vs. savanna
species
K. J. Bloomfield et al.
Title Page
Abstract Introduction
Conclusions References
Tables Figures
J I
J I
Back Close
Full Screen / Esc
Printer-friendly Version
Interactive Discussion
Discussion
Paper
|D
iscussionP
aper|
Discussion
Paper
|D
iscussionP
aper|
showed distributions centred at different points along the Ma axis (Fig. S3, Supple-ment). Whilst we found positive relationships for Ma with d and ρ, the slopes of thoserelationships were V-dependent (Fig. 6a and b) and the association was much strongerfor the S group. Over common ranges of Ma, the F trees displayed the thicker leaves(measured fresh) – a result heavily influenced by the upper canopy group. Indeed, Ma5
was seldom greater than 75 g m−2 for either the small pioneer or sub-canopy classes,but for any given Ma the ratio of leaf dry mass to water content (ϕ, as an index of scle-rophylly) was much higher for the small pioneers (Fig. 6c). The slope of the relationshipϕ↔Ma also differed among the Φ classes (p < 0.0001) – being shallowest for the Strees (an increased ratio of 0.005 per unit Ma) and steepest for the small pioneers (an10
increase of 0.019). Such structural differences among classes of V and Φ appearedunrelated, however, to our measure of photosynthetic N allocation: AN was indepen-dent of d (p = 0.46) and an overall correlation with Ma (p = 0.0009) disappeared uponcontrolling for V and Φ (Fig. 6d).
Tropical forests are noted for their species diversity, but in two cases it was possible to15
find multiple replicates of the same species across sites: Cardwellia sublimis (CTC-01,KCR-01) and Neolitsea dealbata (KBL-01, KBL-03, KCR-01) (Supplement Table S1).A similar cross-site comparison was also possible for the S species Lophostemonsuaveolens (DCR-01, KBL-02). In the case of N. dealbata, data for the three Queens-land F sites are here augmented by data from greenhouse experiments conducted20
under differing P fertiliser treatments (Control treatment: 1/3 Hoagland’s plant feed;Minus-P: phosphorus deficient (Bloomfield et al., 2014)).
For N. dealbata, P limitation created by the “Minus-P” treatment in the greenhouseplants (GH7) was evident in the lower [P]a result (Fig. 7d) and depressed photosyn-thetic capacity (Fig. 7a). For the F sites, Amax,a, [N]a and [P]a were all higher at KBL-0125
than at KCR-01 whilst Ma for the P-limited greenhouse trees was significantly higherthan for those at KCR-01. In the case of L. suaveolens, Amax,a was higher at KBL-
02 than at DCR-01 (mean values±1 SD of 45.5±0.9 and 28.1±5.1 µmol m−2 s−1 re-spectively) with a similar ranking of KBL-02>DCR-01 for levels of [P]a (82.8±4.1 and
8984

BGD11, 8969–9011, 2014
Contrastingphotosynthetic
characteristics offorest vs. savanna
species
K. J. Bloomfield et al.
Title Page
Abstract Introduction
Conclusions References
Tables Figures
J I
J I
Back Close
Full Screen / Esc
Printer-friendly Version
Interactive Discussion
Discussion
Paper
|D
iscussionP
aper|
Discussion
Paper
|D
iscussionP
aper|
57.8±12.9 mg m−2 respectively). On the other hand, differences were not significantfor Ma (134.1±7.9 and 135.3±30.5 g m−2) or [N]a (2.06±0.28 and 1.83±0.26 g m−2).For C. sublimis, no inter-site differences were found for Amax,a, Ma, or leaf nutrient lev-els.
4 Discussion5
The main aim of this study was to compare photosynthetic traits for the tree speciestypical of adjacent tropical moist forest and savanna plots – a dynamic boundary poten-tially sensitive to changes in global climate (Sitch et al., 2008; Booth et al., 2012; Glooret al., 2012; Huntingford et al., 2013). Our results include higher photosynthetic capac-ity and nutrient use efficiencies for the savanna species, but our prediction of a primary10
photosynthetic role for P rather than N across the forest sites was not supported. Ourpreferred area-based model retained only three fixed terms: vegetation type, leaf Nand P yet accounted for 82 % of variation in Amax,a. Model output revealed a strongerrelationship A↔N than A↔P and found variability among species much more pro-nounced than among sites. For F there was qualified support for the expectation that15
pioneer species would show higher photosynthetic traits of Amax,a and AN compared tolate successional shade tolerant species (Raaimakers et al., 1995).
Values reported here for key leaf traits such as Amax,a, Ma and levels of foliar N and Pfell within previously published ranges for F and S trees (e.g. Medina, 1984; Prior et al.,2005; Harrison et al., 2009; Cernusak et al., 2011). There were, however, significant dif-20
ferences among sites and between F and S in all these traits (Fig. 1). In particular, the Fsite south of Ravenshoe (KBL-01) stood out as high in leaf nutrients and photosyntheticcapacity when expressed on a mass basis. Due to lower Ma, however, that prominencewas all but removed when area-based traits were examined. Lower mass-based leafnutrient values for S species have traditionally been linked to their higher Ma associ-25
ated with contrasts in leaf longevity and economic strategy. In the Australian literature,these species are widely described as sclerophyllous, characterised by tough leaves
8985
BGD11, 8969–9011, 2014
Contrastingphotosynthetic
characteristics offorest vs. savanna
species
K. J. Bloomfield et al.
Title Page
Abstract Introduction
Conclusions References
Tables Figures
J I
J I
Back Close
Full Screen / Esc
Printer-friendly Version
Interactive Discussion
Discussion
Paper
|D
iscussionP
aper|
Discussion
Paper
|D
iscussionP
aper|
and adaptations to limit water loss. We argue, however, that on theoretical grounds it isarea- rather than mass-based concentrations of N (and presumably also P, where rel-evant for photosynthetic carbon gain) that should be modulated by differences in wateravailability. With declining precipitation therefore, an increase in area-based photosyn-thetically important nutrients (in our case S > F) seems to be the general case (Buckley5
et al., 2002; Cernusak et al., 2011; Domingues et al., 2014; Schrodt et al., 2014). It isnon-systematic variations in Ma with precipitation, in turn probably attributable to sea-sonal variation, that produce any apparent contradictions (Schrodt et al., 2014).
It has long been considered that vegetation differentiation in Australia is strongly in-fluenced by edaphic constraints and specifically P status (Webb, 1968; Russell-Smith10
et al., 2004). The widely observed positive correlation leaf [N]↔ [P] (e.g. Wright et al.,2001) is evident here as well (Fig. 2a), but the slope of the relationship differed be-tween F and S. Despite their situation in the Atherton basalt province (Whitehead et al.,2007), the mean foliar N : P ratios for all of the sites visited in this study were far abovethresholds believed to constitute P-deficiency (Townsend et al., 2007; Cernusak et al.,15
2010). This is particularly striking since the forests studied here, even after excludingthe sub-canopy trees, had median [N]a of only 1.63 g m−2. Such N levels are low com-pared to other tropical forests for which extensive data have recently become available– see Table 2 of Domingues et al. (2014). They are lower, for example, than Cameroon(2.12 g m−2) and lower even than for trees growing on soils of low nutrient availabil-20
ity in the Amazon Basin (1.90 g m−2). Foliar P levels, however, were lower still despiteconcentrations of soil extractable P (PTF) for our forest plots being relatively high (165–958 µg g−1, Table 1). For what have been classed “high nutrient” soils in the AmazonBasin, for example, Fyllas et al. (2009) reported median foliar P of 1.11 mg g−1 and0.11 g m−2 with equivalent soil PTF ranging from 52–422 µg g−1 (Quesada et al., 2010).25
In our study, however, upper canopy forest trees displayed median P values of only0.76 mg g−1 and 0.08 g m−2, much closer to Amazon forest trees growing on “low nu-trient status” soils for which soil PTF ranges from 14–87 µg g−1 (Quesada et al., 2010)with foliar P median values of 0.7 mg g−1 and 0.06 g m−2(Fyllas et al., 2009).
8986
BGD11, 8969–9011, 2014
Contrastingphotosynthetic
characteristics offorest vs. savanna
species
K. J. Bloomfield et al.
Title Page
Abstract Introduction
Conclusions References
Tables Figures
J I
J I
Back Close
Full Screen / Esc
Printer-friendly Version
Interactive Discussion
Discussion
Paper
|D
iscussionP
aper|
Discussion
Paper
|D
iscussionP
aper|
This apparent “inability” of Australian forest trees to utilise high soil P availabilitiescould perhaps be related to their unique evolutionary history. Essentially of Gondwananorigin (Crisp et al., 1999), today’s forests represent remnants of more temperate moistforests that covered much of the continent until the mid-Miocene (Adam, 1992). Pre-sumably arising from a flora already adapted to the characteristically P-limited soils of5
much of Australia (McKenzie et al., 2004) it may be that many of the species occurringwithin the Australian tropical forest region suffer from an “evolutionary hangover” lack-ing the ability to utilise high levels of soil P even where available. There is in addition,especially for the lowlands, a considerable Asia-derived element in the Australian trop-ical forest flora (Sniderman and Jordan, 2011; Crayn et al., 2014) and many soils of10
the Asian lowland tropical forest region are also of relatively low nutrient status (Acreset al., 1975; Tessins and Jusop, 1983; Ohta and Effendi, 1992; Banin et al., 2014). Bycomparison, despite the generally lower P status of the savanna soils (Table 1), thesavanna trees in our study had a slightly higher median [P]a than those of the forest(S = 0.08g m−2 and F = 0.06g m−2) and this was true also for [N]a (S = 2.09g m−2 and15
F = 1.62g m−2). This finding for the Australian species contrasts with previous work inWest Africa and Cameroon where area-based N and P concentrations were lower forsavanna than for forest species (Domingues et al., 2014; Schrodt et al., 2014).
Despite these differences in area-based nutrient concentrations, there are notableconsistencies between our results and the African studies mentioned above. First, al-20
beit with different model parameterisations, there is clear evidence of a role for both Nand P in the modulation of photosynthetic rates in the field. Second, other things beingequal, it seems that savanna trees have higher N use efficiency than their forest coun-terparts. This higher AN (Fig. 5) may reflect differences in leaf construction linked to thehigher light environment. Earlier studies have suggested that lower AN values for scle-25
rophytes may be caused by limitations to internal conductance caused by leaf structuralfactors linked to greater leaf longevity (e.g. Warren, 2008). Mesophyll conductance (gm)is, however, the complex and variable product of at least three phases acting in series(Flexas et al., 2008): conductance through intercellular air spaces (gias), through cell
8987
BGD11, 8969–9011, 2014
Contrastingphotosynthetic
characteristics offorest vs. savanna
species
K. J. Bloomfield et al.
Title Page
Abstract Introduction
Conclusions References
Tables Figures
J I
J I
Back Close
Full Screen / Esc
Printer-friendly Version
Interactive Discussion
Discussion
Paper
|D
iscussionP
aper|
Discussion
Paper
|D
iscussionP
aper|
walls (gw) and through the liquid and membrane phases inside cells (gliq). The mostimportant constraint on gm is thought to be gliq which is the phase least affected by leafstructure.
At the leaf level, AN is dependent upon a number of factors including N allocation,conductance and Rubisco kinetics and no single cause has been found to explain ob-5
served interspecific differences (Hikosaka, 2004; Hikosaka and Shigeno, 2009). Theidea that species with high Ma exhibit low AN due to greater structural investment (e.g.Takashima et al., 2004) has been countered by later studies that found no relation-ship between AN and the proportion of leaf N allocated to cell walls (Harrison et al.,2009; Hikosaka and Shigeno, 2009). Indeed, our general positive association between10
area-based photosynthetic capacity and Ma (also observed by Domingues et al., 2014)challenges the general notion that thick sclerophyllous leaves should be characterisedby low photosynthetic rates and/or low photosynthetic nutrient use efficiencies (Wrightet al., 2004; Westoby and Wright, 2006). Certainly, it has long been known that typi-cally sclerophyllous eucalypt species can have exceptionally high photosynthetic rates15
(Larcher, 1969) with Denton et al. (2007) also finding very high nutrient use efficienciesfor numerous xeromorphic Proteaceae species that exhibit some of the very highestMa worldwide.
Interestingly, our best-fit photosynthesis model was not improved by the inclusion ofmorphological traits such as Ma, leaf thickness or the ratio of leaf dry to fresh mass.20
Although Ma was much higher for the S plots, there was no difference in leaf thicknessbetween S and F sites (p = 0.95) suggesting that most of the difference in Ma betweenthe two vegetation types was attributable to a high leaf density for S. But, as notedabove, with no adverse effects on photosynthetic nutrient use efficiencies.
Our study included measurements of 30 tree species across seven sites; these sites25
and species were viewed as representative of wider populations and our treatment ofthose terms therefore focused on their influence on the variance of the photosyntheticresponse rather than mean values. The linear mixed effects model (Table 4), throughits random component of species nested within sites, showed that most of the variance
8988
BGD11, 8969–9011, 2014
Contrastingphotosynthetic
characteristics offorest vs. savanna
species
K. J. Bloomfield et al.
Title Page
Abstract Introduction
Conclusions References
Tables Figures
J I
J I
Back Close
Full Screen / Esc
Printer-friendly Version
Interactive Discussion
Discussion
Paper
|D
iscussionP
aper|
Discussion
Paper
|D
iscussionP
aper|
in the data occurred among species (71 %). Once levels of leaf N and P had beenincluded in the model, variation among sites represented less than 10 % of total vari-ation. This corresponds with the findings of other Australian studies where within-sitevariation has proved much larger than that among sites (e.g. Wright et al., 2004; As-ner et al., 2009). For this study, it could be argued that the climatic and topographical5
ranges spanned by the seven sites (Table 1) were rather modest – mean annual pre-cipitation, for example, is nowhere lower than 1300 mm and the range in mean annualtemperatures is only six ◦C.
Where possible in the F sites, tree species were selected in order to provide a con-trast of light environment as described in the assigned categories of plant functional10
type (Φ). Such categorisation is often problematic and especially in the setting ofboundaries from one group to another (e.g. Poorter, 1999). For Australian tropical moistforests, Webb developed a classification system of 20 structural vegetation types alongclimatic and edaphic gradients (1968). Faced with such complexity and subjectivity,many authors have instead argued for a spectrum of vegetation types or habits (e.g.15
Coste et al., 2005). The current study used Φ to attempt to explain residual patterns inthe data after controlling for V (Fig. 4b). As hypothesised, there was evidence that pio-neer trees of the F showed higher photosynthetic capacity and nutrient use efficiencythan those shade tolerant species which persist in the understory (Fig. 5e and f).
Two pioneer species, although with different adult statures, were found in sufficient20
numbers at more than one location to allow inter-site comparisons. C. sublimis (tall pio-neer) showed no differences between sites in photosynthetic capacity or leaf chemistry.The opposite was true for N. dealbata (short pioneer) which showed two- and three-fold variations in [N]a, [P]a and Amax,a (Fig. 7). That result, as well as underlining theimportance of environment and nutrient availability as key modulators of leaf traits for25
a given species (Fyllas et al., 2009), also demonstrates that such differences translateinto changes in photosynthetic carbon assimilation ability.
Overall, our results suggest a complex effect of P on photosynthetic capacity forthese Australian tree species. Foliar [P]a was only marginally significant in the preferred
8989

BGD11, 8969–9011, 2014
Contrastingphotosynthetic
characteristics offorest vs. savanna
species
K. J. Bloomfield et al.
Title Page
Abstract Introduction
Conclusions References
Tables Figures
J I
J I
Back Close
Full Screen / Esc
Printer-friendly Version
Interactive Discussion
Discussion
Paper
|D
iscussionP
aper|
Discussion
Paper
|D
iscussionP
aper|
linear mixed effects model (Table 4), but its inclusion improved the overall predictivepower. When examined on a mass basis, P did, however, appear more critical and withan N : P interaction term also included in the optimal model (Supplement Table S4).This mass- vs. area-based inconsistency in the apparent importance of P as a mod-ulator of photosynthetic rates was also noted by Domingues et al. (2014) who like-5
wise found their mass-based models to include an N : P interaction term not present inthe area-based version. The sudden appearance of apparently significant terms whentransforming area-based entities to a mass basis is, however, to be expected (Lloydet al., 2013).
5 Conclusions10
Comparing tree species of neighbouring forest and savanna sites in far north Queens-land, Australia we found higher photosynthetic capacity for savanna species linked togreater nitrogen use efficiency. Higher leaf mass per unit area for the savanna trees de-rived from greater leaf density rather than thickness, but did not inhibit photosyntheticcapacity or AN. Our mixed effects model accounted for 82 % of variation in observed15
photosynthetic response and confirmed the importance of the A↔N relationship. Themodel, whilst retaining leaf P as a key explanatory term, did not support the predic-tion of a dominant role for P rather than N in determining rates of photosynthesis forAustralian tropical forest species.
The Supplement related to this article is available online at20
doi:10.5194/bgd-11-8969-2014-supplement.
8990
BGD11, 8969–9011, 2014
Contrastingphotosynthetic
characteristics offorest vs. savanna
species
K. J. Bloomfield et al.
Title Page
Abstract Introduction
Conclusions References
Tables Figures
J I
J I
Back Close
Full Screen / Esc
Printer-friendly Version
Interactive Discussion
Discussion
Paper
|D
iscussionP
aper|
Discussion
Paper
|D
iscussionP
aper|
Acknowledgements. We would like to thank Jeanette Kemp (Australian Wildlife Conservancy)and Matt Bradford (CSIRO, Atherton) for all their help with logistics and in the field. Thanksalso to Prof. Owen Atkin (Australian National University, Canberra) for many fruitful discus-sions. This work was supported by the UK Natural Environment Research Council (ReferenceNE/F002165/1), a Royal Society of London UK-Australia Exchange Award to Jon Lloyd, and5
the Australian Research Council (Reference DP0986823).
References
Acres, B. D., Bower, R. P., Burrough, P. A., Folland, C. J., Kalsi, M. S., Thomas, P., andWright, P. S.: The Soils of Sabah, Ministry of Overseas Development, Surrey, England, 1975.
Adam, P.: Australian rainforests, Clarendon Press, Oxford, 1992.10
Asner, G. P., Martin, R. E., Ford, A. J., Metcalfe, D. J., and Liddell, M. J.: Leaf chemical andspectral diversity in Australian tropical forests, Ecol. Appl., 19, 236–253, 2009.
Banin, L., Lewis, S. L., Lopez-Gonzalez, G., Baker, T. R., Quesada, C. A., Chao, K.-J.,Burslem, D. F. R. P., Nilus, R., Abu Salim, K., Keeling, H. C., Tan, S., Davies, S. J., Mon-teagudo Mendoza, A., Vásquez, R., Lloyd, J., Neill, D. A., Pitman, N., and Phillips, O. L.:15
Tropical forest wood production: a cross-continental comparison, J. Ecol., doi:10.1111/1365-2745.12263, 2014.
Beadle, N. C. W.: Soil phosphate and delimitation of plant communities in Eastern Australia II,Ecology, 43, 281–288, 1962.
Beadle, N. C. W.: Soil phosphate and its role in molding segments of Australian flora and20
vegetation with special reference to xeromorphy and sclerophylly, Ecology, 47, 992–1007,1966.
Bloomfield, K. J., Farquhar, G. D., and Lloyd, J.: Photosynthesis–nitrogen relationships in trop-ical forest tree species as affected by soil phosphorus availability: a controlled environmentstudy, Funct. Plant Biol., doi:10.1071/FP13278, 2014.25
Booth, B. B. B., Jones, C. D., Collins, M., Totterdell, I. J., Cox, P. M., Sitch, S., Huntingford, C.,Betts, R. A., Harris, G. R., and Lloyd, J.: High sensitivity of future global warming to landcarbon cycle processes, Environ. Res. Lett., 7, 024002, doi:10.1088/1748-9326/7/2/024002,2012.
8991
BGD11, 8969–9011, 2014
Contrastingphotosynthetic
characteristics offorest vs. savanna
species
K. J. Bloomfield et al.
Title Page
Abstract Introduction
Conclusions References
Tables Figures
J I
J I
Back Close
Full Screen / Esc
Printer-friendly Version
Interactive Discussion
Discussion
Paper
|D
iscussionP
aper|
Discussion
Paper
|D
iscussionP
aper|
Buckley, T. N., Miller, J. M., and Farquhar, G. D.: The mathematics of linked optimisation forwater and nitrogen use in a canopy, Silva Fenn., 36, 639–669, 2002.
Burrows, G. E.: Comparative anatomy of the photosynthetic organs of 39 xeromorphic speciesfrom subhumid New South Wales, Australia, Int. J. Plant Sci., 162, 411–430, 2001.
Carswell, F. E., Meir, P., Wandelli, E. V., Bonates, L. C. M., Kruijt, B., Barbosa, E. M., No-5
bre, A. D., Grace, J., and Jarvis, P. G.: Photosynthetic capacity in a central Amazonian rainforest, Tree Physiol., 20, 179–186, 2000.
Cernusak, L. A., Winter, K., and Turner, B. L.: Leaf nitrogen to phosphorus ratios of tropicaltrees: experimental assessment of physiological and environmental controls, New Phytol.,185, 770–779, 2010.10
Cernusak, L. A., Hutley, L. B., Beringer, J., Holtum, J. A. M., and Turner, B. L.: Photosyntheticphysiology of eucalypts along a sub-continental rainfall gradient in northern Australia, Agr.Forest Meteorol., 151, 1462–1470, 2011.
Chazdon, R. L.: Photosynthetic plasticity of two rain forest shrubs across natural gap transects,Oecologia, 92, 586–595, 1992.15
Cochrane, T. T.: Chemical properties of native savanna and forest soils in central Brazil, SoilSci. Soc. Am. J., 53, 139–141, 1989.
Coste, S., Roggy, J. C., Imbert, P., Born, C., Bonal, D., and Dreyer, E.: Leaf photosynthetictraits of 14 tropical rain forest species in relation to leaf nitrogen concentration and shadetolerance, Tree Physiol., 25, 1127–1137, 2005.20
Crayn, D. M., Costion, C., and Harrington, M.: The Sahul-Sunda floristic exchange: datedmolecular phylogenies document post-Miocene intercontinental dispersal dynamics, J. Bio-geogr., in review, 2014.
Crisp, M. D., West, J. G., and Linder, H. P.: Biogeography of the terrestrial flora, in: Flora ofAustralia, edited by: Orchard, A. E. and Thompson, H. S., CSIRO, Melbourne, 1999.25
Denton, M. D., Veneklaas, E. J., Freimoser, F. M., and Lambers, H.: Banksia species (Pro-teaceae) from severely phosphorus-impoverished soils exhibit extreme efficiency in the useand re-mobilization of phosphorus, Plant Cell Environ., 30, 1557–1565, 2007.
Domingues, T. F., Meir, P., Feldpausch, T. R., Saiz, G., Veenendaal, E. M., Schrodt, F., Bird, M.,Djagbletey, G., Hien, F., Compaore, H., Diallo, A., Grace, J., and Lloyd, J.: Co-limitation of30
photosynthetic capacity by nitrogen and phosphorus in West Africa woodlands, Plant CellEnviron., 33, 959–980, 2010.
8992
BGD11, 8969–9011, 2014
Contrastingphotosynthetic
characteristics offorest vs. savanna
species
K. J. Bloomfield et al.
Title Page
Abstract Introduction
Conclusions References
Tables Figures
J I
J I
Back Close
Full Screen / Esc
Printer-friendly Version
Interactive Discussion
Discussion
Paper
|D
iscussionP
aper|
Discussion
Paper
|D
iscussionP
aper|
Domingues, T. F., Ishida, F. Y., Feldpausch, T. R., Grace, J., Meir, P., Saiz, G., Sene, O.,Schrodt, F., Sonké, B., Taedoumg, H., Veenendaal, E. M., Lewis, S., and Lloyd, J.: Biome-specific effects of nitrogen and phosphorus on the photosynthetic characteristics of trees ata forest-savanna boundary in Cameroon, Oecologia, submitted, 2014.
Farquhar, G. D., von Caemmerer, S., and Berry, J. A.: A biochemical model of photosynthetic5
CO2 assimilation in leaves of C3 species, Planta, 149, 78–90, 1980.Flexas, J., Ribas-Carbo, M., Diaz-Espejo, A., Galmes, J., and Medrano, H.: Mesophyll conduc-
tance to CO2: current knowledge and future prospects, Plant Cell Environ., 31, 602–621,2008.
Fyllas, N. M., Patiño, S., Baker, T. R., Bielefeld Nardoto, G., Martinelli, L. A., Quesada, C. A.,10
Paiva, R., Schwarz, M., Horna, V., Mercado, L. M., Santos, A., Arroyo, L., Jiménez, E. M.,Luizão, F. J., Neill, D. A., Silva, N., Prieto, A., Rudas, A., Silviera, M., Vieira, I. C. G., Lopez-Gonzalez, G., Malhi, Y., Phillips, O. L., and Lloyd, J.: Basin-wide variations in foliar prop-erties of Amazonian forest: phylogeny, soils and climate, Biogeosciences, 6, 2677–2708,doi:10.5194/bg-6-2677-2009, 2009.15
Gleason, S. M., Read, J., Ares, A., and Metcalfe, D. J.: Phosphorus economics of tropicalrainforest species and stands across soil contrasts in Queensland, Australia: understandingthe effects of soil specialization and trait plasticity, Funct. Ecol., 23, 1157–1166, 2009.
Gloor, M., Gatti, L., Brienen, R., Feldpausch, T. R., Phillips, O. L., Miller, J., Ometto, J. P.,Rocha, H., Baker, T., de Jong, B., Houghton, R. A., Malhi, Y., Aragão, L. E. O. C., Guyot, J.-L.,20
Zhao, K., Jackson, R., Peylin, P., Sitch, S., Poulter, B., Lomas, M., Zaehle, S., Huntingford, C.,Levy, P., and Lloyd, J.: The carbon balance of South America: a review of the status, decadaltrends and main determinants, Biogeosciences, 9, 5407–5430, doi:10.5194/bg-9-5407-2012,2012.
Harrison, M. T., Edwards, E. J., Farquhar, G. D., Nicotra, A. B., and Evans, J. R.: Nitrogen in cell25
walls of sclerophyllous leaves accounts for little of the variation in photosynthetic nitrogen-use efficiency, Plant Cell Environ., 32, 259–270, 2009.
Hikosaka, K.: Interspecific difference in the photosynthesis-nitrogen relationship: patterns,physiological causes, and ecological importance, J. Plant Res., 117, 481–494, 2004.
Hikosaka, K. and Shigeno, A.: The role of Rubisco and cell walls in the interspecific variation in30
photosynthetic capacity, Oecologia, 160, 443–451, 2009.
8993
BGD11, 8969–9011, 2014
Contrastingphotosynthetic
characteristics offorest vs. savanna
species
K. J. Bloomfield et al.
Title Page
Abstract Introduction
Conclusions References
Tables Figures
J I
J I
Back Close
Full Screen / Esc
Printer-friendly Version
Interactive Discussion
Discussion
Paper
|D
iscussionP
aper|
Discussion
Paper
|D
iscussionP
aper|
Hoffmann, W. A., Adasme, R., Haridasan, M., de Carvalho, M. T., Geiger, E. L., Pereira, M. A. B.,Gotsch, S. G., and Franco, A. C.: Tree topkill, not mortality, governs the dynamics of savanna-forest boundaries under frequent fire in central Brazil, Ecology, 90, 1326–1337, 2009.
Hoffmann, W. A., Geiger, E. L., Gotsch, S. G., Rossatto, D. R., Silva, L. C. R., Lau, O. L.,Haridasan, M., and Franco, A. C.: Ecological thresholds at the savanna-forest boundary:5
how plant traits, resources and fire govern the distribution of tropical biomes, Ecol. Lett., 15,759–768, 2012.
Hothorn, T., Hornik, K., van de Wiel, M. A. V., and Zeileis, A.: Implementing a class of permu-tation tests: the coin package, J. Stat. Softw., 28, 1–23, 2008.
Huntingford, C., Zelazowski, P., Galbraith, D., Mercado, L. M., Sitch, S., Fisher, R., Lomas, M.,10
Walker, A. P., Jones, C. D., Booth, B. B. B., Malhi, Y., Hemming, D., Kay, G., Good, P.,Lewis, S. L., Phillips, O. L., Atkin, O. K., Lloyd, J., Gloor, E., Zaragoza-Castells, J., Meir, P.,Betts, R., Harris, P. P., Nobre, C., Marengo, J., and Cox, P. M.: Simulated resilience of tropicalrainforests to CO2-induced climate change, Nat. Geosci., 6, 268–273, 2013.
Kattge, J., Knorr, W., Raddatz, T., and Wirth, C.: Quantifying photosynthetic capacity and its re-15
lationship to leaf nitrogen content for global-scale terrestrial biosphere models, Glob. ChangeBiol., 15, 976–991, 2009.
Larcher, W.: Effect of environmental and physiological variables on carbon dioxide gas ex-change of trees, Photosynthetica, 3, 167–198, 1969.
Lehmann, C. E. R., Archibald, S. A., Hoffmann, W. A., and Bond, W. J.: Deciphering the distri-20
bution of the savanna biome, New Phytol., 191, 197–209, 2011.Lloyd, J., Bird, M. I., Vellen, L., Miranda, A. C., Veenendaal, E. M., Djagbletey, G., Mi-
randa, H. S., Cook, G., and Farquhar, G. D.: Contributions of woody and herbaceous vege-tation to tropical savanna ecosystem productivity: a quasi-global estimate, Tree Physiol., 28,451–468, 2008.25
Lloyd, J., Goulden, M., Ometto, J. P., Fyllas, N. M., Quesada, C. A., and Patiño, S.: Ecophysiol-ogy of forest and savanna vegetation, in: Amazonia and Global Change, edited by: Keller, M.,Gash, J., and Silva Dias, P., American Geophysical Union, Washington, DC, 463–484, 2009.
Lloyd, J., Patiño, S., Paiva, R. Q., Nardoto, G. B., Quesada, C. A., Santos, A. J. B., Baker, T. R.,Brand, W. A., Hilke, I., Gielmann, H., Raessler, M., Luizão, F. J., Martinelli, L. A., and Mer-30
cado, L. M.: Optimisation of photosynthetic carbon gain and within-canopy gradients of asso-ciated foliar traits for Amazon forest trees, Biogeosciences, 7, 1833–1859, doi:10.5194/bg-7-1833-2010, 2010.
8994
BGD11, 8969–9011, 2014
Contrastingphotosynthetic
characteristics offorest vs. savanna
species
K. J. Bloomfield et al.
Title Page
Abstract Introduction
Conclusions References
Tables Figures
J I
J I
Back Close
Full Screen / Esc
Printer-friendly Version
Interactive Discussion
Discussion
Paper
|D
iscussionP
aper|
Discussion
Paper
|D
iscussionP
aper|
Lloyd, J., Bloomfield, K., Domingues, T. F., and Farquhar, G. D.: Photosynthetically relevantfoliar traits correlating better on a mass vs an area basis: of ecophysiological relevance orjust a case of mathematical imperatives and statistical quicksand?, New Phytol., 199, 311–321, 2013.
Malhi, Y., Aragao, L., Galbraith, D., Huntingford, C., Fisher, R., Zelazowski, P., Sitch, S., Mc-5
Sweeney, C., and Meir, P.: Exploring the likelihood and mechanism of a climate-change-induced dieback of the Amazon rainforest, P. Natl. Acad. Sci. USA, 106, 20610–20615, 2009.
McKenzie, N. J., Jacquier, D., Isbell, R. F., and Brown, K.: Australian Soils and Landscapes: anIllustrated Compendium, CSIRO Publishing, Collingwood, Victoria, 2004.
Medina, E.: Nutrient balance and physiological processes at the leaf level, in: Physiological10
Ecology of Plants of the Wet Tropics, edited by: Medina, E., Mooney, H. A., and Vázuez-Yánes, C., Dr W. Junk Publishers, The Hague, 1984.
Meir, P., Levy, P. E., Grace, J., and Jarvis, P. G.: Photosynthetic parameters from two contrastingwoody vegetation types in West Africa, Plant Ecol., 192, 277–287, 2007.
Mercado, L. M., Patiño, S., Domingues, T. F., Fyllas, N. M., Weedon, G. P., Sitch, S., Que-15
sada, C. A., Phillips, O. L., Aragao, L., Malhi, Y., Dolman, A. J., Restrepo-Coupe, N.,Saleska, S. R., Baker, T. R., Almeida, S., Higuchi, N., and Lloyd, J.: Variations in Amazon for-est productivity correlated with foliar nutrients and modelled rates of photosynthetic carbonsupply, Philos. T. R. Soc. B, 366, 3316–3329, 2011.
Mott, K. A., Gibson, A. C., and Oleary, J. W.: The adaptive significance of amphistomatic leaves,20
Plant Cell Environ., 5, 455–460, 1982.Niinemets, U.: Role of foliar nitrogen in light harvesting and shade tolerance of four temperate
deciduous woody species, Funct. Ecol., 11, 518–531, 1997.Ohta, S. and Effendi, S.: Ultisols of “lowland Dipterocarp forest” in East Kalimantan, Indonesia
II. Status of carbon, nitrogen and phosphorus, Soil Sci. Plant Nutr., 38, 207–216, 1992.25
Parkhurst, D. F.: The adaptive significance of stomatal occurrence on one or both surfaces ofleaves, J. Ecol., 66, 367–383, 1978.
Poorter, L.: Growth responses of 15 rain-forest tree species to a light gradient: the relativeimportance of morphological and physiological traits, Funct. Ecol., 13, 396–410, 1999.
Popma, J., Bongers, F., and Werger, M. J. A.: Gap-dependence and leaf characteristics of trees30
in a tropical lowland rain-forest in Mexico, Oikos, 63, 207–214, 1992.Prior, L. D., Bowman, D., and Eamus, D.: Intra-specific variation in leaf attributes of four savanna
tree species across a rainfall gradient in tropical Australia, Aust. J. Bot., 53, 323–335, 2005.
8995
BGD11, 8969–9011, 2014
Contrastingphotosynthetic
characteristics offorest vs. savanna
species
K. J. Bloomfield et al.
Title Page
Abstract Introduction
Conclusions References
Tables Figures
J I
J I
Back Close
Full Screen / Esc
Printer-friendly Version
Interactive Discussion
Discussion
Paper
|D
iscussionP
aper|
Discussion
Paper
|D
iscussionP
aper|
Pyykko, M.: The leaf anatomy of East Patagonian xerophytic plants, Ann. Bot. Fenn., 3, 453–622, 1966.
Quesada, C. A., Lloyd, J., Schwarz, M., Patiño, S., Baker, T. R., Czimczik, C., Fyllas, N. M.,Martinelli, L., Nardoto, G. B., Schmerler, J., Santos, A. J. B., Hodnett, M. G., Herrera, R.,Luizão, F. J., Arneth, A., Lloyd, G., Dezzeo, N., Hilke, I., Kuhlmann, I., Raessler, M.,5
Brand, W. A., Geilmann, H., Moraes Filho, J. O., Carvalho, F. P., Araujo Filho, R. N.,Chaves, J. E., Cruz Junior, O. F., Pimentel, T. P., and Paiva, R.: Variations in chemical andphysical properties of Amazon forest soils in relation to their genesis, Biogeosciences, 7,1515–1541, doi:10.5194/bg-7-1515-2010, 2010.
Quesada, C. A., Phillips, O. L., Schwarz, M., Czimczik, C. I., Baker, T. R., Patiño, S., Fyl-10
las, N. M., Hodnett, M. G., Herrera, R., Almeida, S., Alvarez Dávila, E., Arneth, A., Ar-royo, L., Chao, K. J., Dezzeo, N., Erwin, T., di Fiore, A., Higuchi, N., Honorio Coro-nado, E., Jimenez, E. M., Killeen, T., Lezama, A. T., Lloyd, G., López-González, G.,Luizão, F. J., Malhi, Y., Monteagudo, A., Neill, D. A., Núñez Vargas, P., Paiva, R., Pea-cock, J., Peñuela, M. C., Peña Cruz, A., Pitman, N., Priante Filho, N., Prieto, A., Ramírez, H.,15
Rudas, A., Salomão, R., Santos, A. J. B., Schmerler, J., Silva, N., Silveira, M., Vásquez, R.,Vieira, I., Terborgh, J., and Lloyd, J.: Basin-wide variations in Amazon forest structureand function are mediated by both soils and climate, Biogeosciences, 9, 2203–2246,doi:10.5194/bg-9-2203-2012, 2012.
R Development Core Team: R: A Language and Environment for Statistical Computing, R Foun-20
dation for Statistical Computing, Vienna, Austria, 2011.Raaimakers, D., Boot, R. G. A., Dijkstra, P., Pot, S., and Pons, T.: Photosynthetic rates in relation
to leaf phosphorus content in pioneer versus climax tropical rainforest trees, Oecologia, 102,120–125, 1995.
Ratter, J. A.: Transition between Cerrado and forest vegetation in Brazil, in: Nature and Dy-25
namics of Forest-Savanna Boundaries, edited by: Furley, P., Proctor, J., and Ratter, J. A.,Chapman and Hall, London, 1992.
Reich, P. B., Oleksyn, J., and Wright, I. J.: Leaf phosphorus influences the photosynthesis-nitrogen relation: a cross-biome analysis of 314 species, Oecologia, 160, 207–212, 2009.
Russell-Smith, J., Stanton, P. J., Whitehead, P. J., and Edwards, A.: Rain forest invasion of30
eucalypt-dominated woodland savanna, iron range, north-eastern Australia: I. Successionalprocesses, J. Biogeogr., 31, 1293–1303, 2004.
8996
BGD11, 8969–9011, 2014
Contrastingphotosynthetic
characteristics offorest vs. savanna
species
K. J. Bloomfield et al.
Title Page
Abstract Introduction
Conclusions References
Tables Figures
J I
J I
Back Close
Full Screen / Esc
Printer-friendly Version
Interactive Discussion
Discussion
Paper
|D
iscussionP
aper|
Discussion
Paper
|D
iscussionP
aper|
Saiz, G., Bird, M. I., Domingues, T., Schrodt, F., Schwarz, M., Feldpausch, T. R., Veenendaal, E.,Djagbletey, G., Hien, F., Compaore, H., Diallo, A., and Lloyd, J.: Variation in soil carbon stocksand their determinants across a precipitation gradient in West Africa, Glob. Change Biol., 18,1670–1683, 2012.
Santiago, L. S. and Mulkey, S. S.: A test of gas exchange measurements on excised canopy5
branches of ten tropical tree species, Photosynthetica, 41, 343–347, 2003.Schmimper, A. F. W.: Plant-Geography Upon a Physiological Basis, Clarendon Press, Oxford,
1903.Schrodt, F., Domingues, T. F., Feldpausch, T. R., Saiz, G., Quesada, C. A., Schwarz, M.,
Ishida, F. Y., Compaore, H., Diallo, A., Djagbletey, G., Hien, F., Hiernaux, P., Mougin, E.,10
Sonké, B., Zapfack, L., Bird, M., Lewis, S. L., Meir, P., Phillips, O. L., Grace, J., Veenen-daal, E. M., and Lloyd, J.: Foliar trait contrasts between African forest and savanna trees:genetic versus environmental effects, Funct. Plant Biol., submitted, 2014.
Sharkey, T. D., Bernacchi, C. J., Farquhar, G. D., and Singsaas, E. L.: Fitting photosyntheticcarbon dioxide response curves for C3 leaves, Plant Cell Environ., 30, 1035–1040, 2007.15
Sitch, S., Huntingford, C., Gedney, N., Levy, P. E., Lomas, M., Piao, S. L., Betts, R., Ciais, P.,Cox, P., Friedlingstein, P., Jones, C. D., Prentice, I. C., and Woodward, F. I.: Evaluation of theterrestrial carbon cycle, future plant geography and climate-carbon cycle feedbacks using fiveDynamic Global Vegetation Models (DGVMs), Glob. Change Biol., 14, 2015–2039, 2008.
Sniderman, J. M. K. and Jordan, G. J.: Extent and timing of floristic exchange between Aus-20
tralian and Asian rain forests, J. Biogeogr., 38, 1445–1455, 2011.Spain, A. V.: Influence of environmental conditions and some soil chemical properties on the
carbon and nitrogen contents of some tropical Australian rainforest soils, Aust. J. Soil Res.,28, 825–839, 1990.
Swaine, M. D. and Whitmore, T. C.: On the definition of ecological species groups in tropical25
rain forests, Vegetatio, 75, 81–86, 1988.Takashima, T., Hikosaka, K., and Hirose, T.: Photosynthesis or persistence: nitrogen allocation
in leaves of evergreen and deciduous Quercus species, Plant Cell Environ., 27, 1047–1054,2004.
Tessins, E. and Jusop, S.: Quantitative Relationships Between Mineralogy and Properties of30
Tropical Soils, Universiti Pertanian Malaysia, Serdang, Selangor, 1983.
8997
BGD11, 8969–9011, 2014
Contrastingphotosynthetic
characteristics offorest vs. savanna
species
K. J. Bloomfield et al.
Title Page
Abstract Introduction
Conclusions References
Tables Figures
J I
J I
Back Close
Full Screen / Esc
Printer-friendly Version
Interactive Discussion
Discussion
Paper
|D
iscussionP
aper|
Discussion
Paper
|D
iscussionP
aper|
Thompson, J., Viana, J., Proctor, J., and Ratter, J. A.: Contrasting forest-savanna boundarieson Maraca Island, Roraima, Brazil, in: Nature and Dynamics of Forest-Savanna Boundaries,edited by: Furley, P., Proctor, J. and Ratter, J. A., Chapman and Hall, London, 1992.
Torello-Raventos, M., Feldpausch, T. R., Veenendaal, E., Schrodt, F., Saiz, G., Domingues, T. F.,Djagbletey, G., Ford, A., Kemp, J., Marimon, B. S., Marimon, B. H., Lenza, E., Rat-5
ter, J. A., Maracahipes, L., Sasaki, D., Sonke, B., Zapfack, L., Taedoumg, H., Villarroel, D.,Schwarz, M., Quesada, C. A., Ishida, F. Y., Nardoto, G. B., Affum-Baffoe, K., Arroyo, L., Bow-man, D., Compaore, H., Davies, K., Diallo, A., Fyllas, N. M., Gilpin, M., Hien, F., Johnson, M.,Killeen, T. J., Metcalfe, D., Miranda, H. S., Steininger, M., Thomson, J., Sykora, K., Mou-gin, E., Hiernaux, P., Bird, M. I., Grace, J., Lewis, S. L., Phillips, O. L., and Lloyd, J.: On the10
delineation of tropical vegetation types with an emphasis on forest/savanna transitions, PlantEcol. Div., 6, 101–137, 2013.
Townsend, A. R., Cleveland, C. C., Asner, G. P., and Bustamante, M. M. C.: Controls over foliarN : P ratios in tropical rain forests, Ecology, 88, 107–118, 2007.
Turner, I. M.: The Ecology of Trees in the Tropical Rain Forest, Cambridge University Press,15
Cambridge, 2001.Veenendaal, E. M., Swaine, M. D., Lecha, R. T., Walsh, M. F., Abebrese, I. K., and
OwusuAfriyie, K.: Responses of West African forest tree seedlings to irradiance and soilfertility, Funct. Ecol., 10, 501–511, 1996.
Veenendaal, E. M., Torello-Raventos, M., Feldpausch, T. R., Domingues, T. F., Gerard, F.,20
Schrodt, F., Saiz, G., Quesada, C. A., Djagbletey, G., Ford, A., Kemp, J., Marimon, B. S.,Marimon-Junior, B. H., Lenza, E., Ratter, J. A., Maracahipes, L., Sasaki, D., Sonké, B.,Zapfack, L., Villarroel, D., Schwarz, M., Yoko Ishida, F., Gilpin, M., Nardoto, G. B., Affum-Baffoe, K., Arroyo, L., Bloomfield, K., Ceca, G., Compaore, H., Davies, K., Diallo, A., Fyl-las, N. M., Gignoux, J., Hien, F., Johnson, M., Mougin, E., Hiernaux, P., Killeen, T., Met-25
calfe, D., Miranda, H. S., Steininger, M., Sykora, K., Bird, M. I., Grace, J., Lewis, S.,Phillips, O. L., and Lloyd, J.: Structural, physiognomic and aboveground biomass variation insavanna-forest transition zones on three continents. How different are co-occurring savannaand forest formations?, Biogeosciences Discuss., 11, 4591–4636, doi:10.5194/bgd-11-4591-2014, 2014.30
Vitousek, P. M.: Litterfall, nutrient cycling and nutrient limitation in tropical forests, Ecology, 65,285–298, 1984.
8998
BGD11, 8969–9011, 2014
Contrastingphotosynthetic
characteristics offorest vs. savanna
species
K. J. Bloomfield et al.
Title Page
Abstract Introduction
Conclusions References
Tables Figures
J I
J I
Back Close
Full Screen / Esc
Printer-friendly Version
Interactive Discussion
Discussion
Paper
|D
iscussionP
aper|
Discussion
Paper
|D
iscussionP
aper|
Warren, C. R.: Stand aside stomata, another actor deserves centre stage: the forgotten role ofthe internal conductance to CO2 transfer, J. Exp. Bot., 59, 1475–1487, 2008.
Warton, D. I., Wright, I. J., Falster, D. S., and Westoby, M.: Bivariate line-fitting methods forallometry, Biol. Rev., 81, 259–291, 2006.
Webb, L. J.: Environmental relationships of the structural types of Australian rain forest vegeta-5
tion, Ecology, 49, 296–311, 1968.Westoby, M. and Wright, I. J.: Land-plant ecology on the basis of functional traits, Trends Ecol.
Evol., 21, 261–268, 2006.Whitehead, P. W., Stephenson, P. J., McDougall, I., Hopkins, M. S., Grahams, A. W., Coller-
son, K. D., and Johnson, D. P.: Temporal development of the Atherton Basalt Province, north10
Queensland, Aust. J. Earth Sci., 54, 691–709, 2007.Wright, I. J., Reich, P. B., and Westoby, M.: Strategy shifts in leaf physiology, structure and
nutrient content between species of high- and low-rainfall and high- and low-nutrient habitats,Funct. Ecol., 15, 423–434, 2001.
Wright, I. J., Reich, P. B., Westoby, M., Ackerly, D. D., Baruch, Z., Bongers, F., Cavender-15
Bares, J., Chapin, T., Cornelissen, J. H. C., Diemer, M., Flexas, J., Garnier, E., Groom, P. K.,Gulias, J., Hikosaka, K., Lamont, B. B., Lee, T., Lee, W., Lusk, C., Midgley, J. J., Navas, M. L.,Niinemets, U., Oleksyn, J., Osada, N., Poorter, H., Poot, P., Prior, L., Pyankov, V. I.,Roumet, C., Thomas, S. C., Tjoelker, M. G., Veneklaas, E. J., and Villar, R.: The worldwideleaf economics spectrum, Nature, 428, 821–827, 2004.20
Zuur, A. F., Ieno, E. N., Walker, N. J., Saveliev, A. A., and Smith, G. M.: Mixed Effects Modelsand Extensions in Ecology with R, Springer Science, New York, USA, 2009.
8999
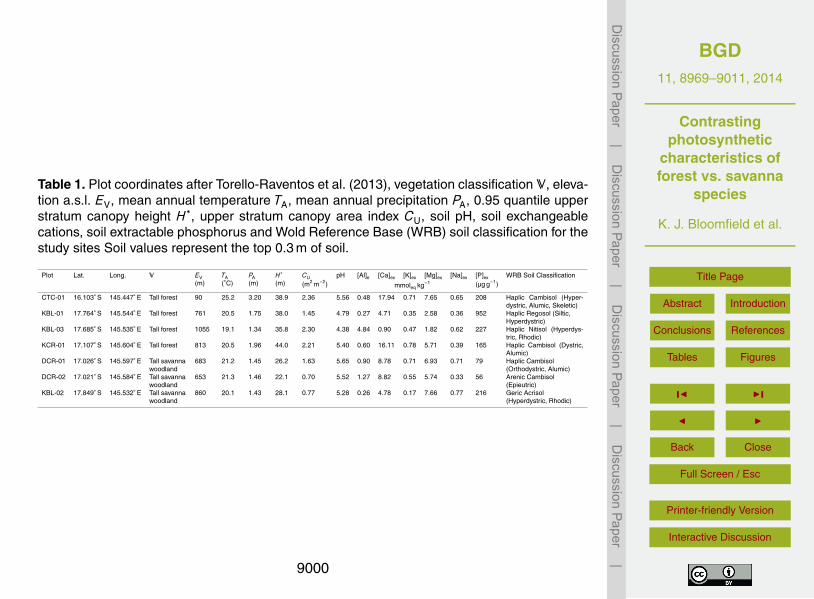
BGD11, 8969–9011, 2014
Contrastingphotosynthetic
characteristics offorest vs. savanna
species
K. J. Bloomfield et al.
Title Page
Abstract Introduction
Conclusions References
Tables Figures
J I
J I
Back Close
Full Screen / Esc
Printer-friendly Version
Interactive Discussion
Discussion
Paper
|D
iscussionP
aper|
Discussion
Paper
|D
iscussionP
aper|
Table 1. Plot coordinates after Torello-Raventos et al. (2013), vegetation classification V, eleva-tion a.s.l. EV, mean annual temperature TA, mean annual precipitation PA, 0.95 quantile upperstratum canopy height H∗, upper stratum canopy area index CU, soil pH, soil exchangeablecations, soil extractable phosphorus and Wold Reference Base (WRB) soil classification for thestudy sites Soil values represent the top 0.3 m of soil.
Plot Lat. Long. V EV(m)
TA(◦C)
PA(m)
H∗
(m)CU
(m2 m−2)pH [Al]e [Ca]ex [K]ex [Mg]ex [Na]ex [P]ex
(µg g−1)WRB Soil Classification
mmoleq kg−1
CTC-01 16.103◦ S 145.447◦ E Tall forest 90 25.2 3.20 38.9 2.36 5.56 0.48 17.94 0.71 7.65 0.65 208 Haplic Cambisol (Hyper-dystric, Alumic, Skeletic)
KBL-01 17.764◦ S 145.544◦ E Tall forest 761 20.5 1.75 38.0 1.45 4.79 0.27 4.71 0.35 2.58 0.36 952 Haplic Regosol (Siltic,Hyperdystric)
KBL-03 17.685◦ S 145.535◦ E Tall forest 1055 19.1 1.34 35.8 2.30 4.38 4.84 0.90 0.47 1.82 0.62 227 Haplic Nitisol (Hyperdys-tric, Rhodic)
KCR-01 17.107◦ S 145.604◦ E Tall forest 813 20.5 1.96 44.0 2.21 5.40 0.60 16.11 0.78 5.71 0.39 165 Haplic Cambisol (Dystric,Alumic)
DCR-01 17.026◦ S 145.597◦ E Tall savannawoodland
683 21.2 1.45 26.2 1.63 5.65 0.90 8.78 0.71 6.93 0.71 79 Haplic Cambisol(Orthodystric, Alumic)
DCR-02 17.021◦ S 145.584◦ E Tall savannawoodland
653 21.3 1.46 22.1 0.70 5.52 1.27 8.82 0.55 5.74 0.33 56 Arenic Cambisol(Epieutric)
KBL-02 17.849◦ S 145.532◦ E Tall savannawoodland
860 20.1 1.43 28.1 0.77 5.28 0.26 4.78 0.17 7.66 0.77 216 Geric Acrisol(Hyperdystric, Rhodic)
9000
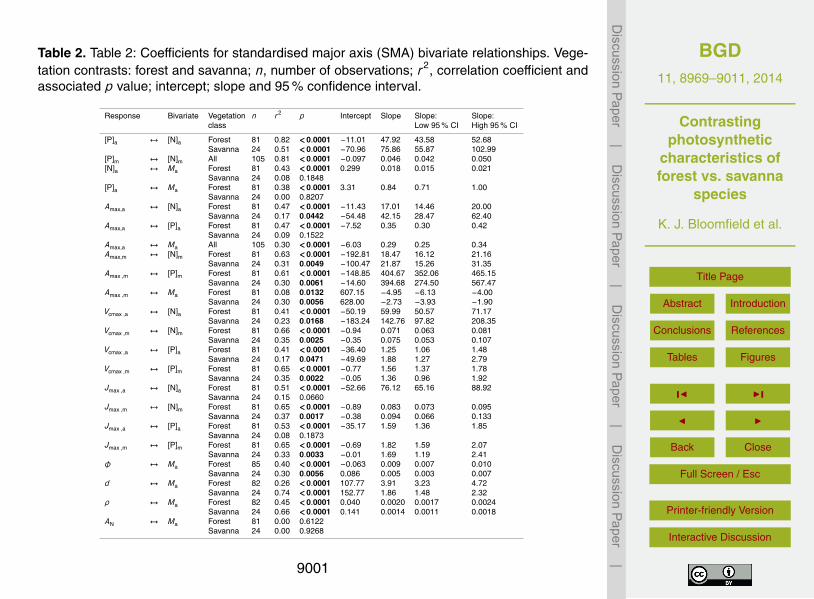
BGD11, 8969–9011, 2014
Contrastingphotosynthetic
characteristics offorest vs. savanna
species
K. J. Bloomfield et al.
Title Page
Abstract Introduction
Conclusions References
Tables Figures
J I
J I
Back Close
Full Screen / Esc
Printer-friendly Version
Interactive Discussion
Discussion
Paper
|D
iscussionP
aper|
Discussion
Paper
|D
iscussionP
aper|
Table 2. Table 2: Coefficients for standardised major axis (SMA) bivariate relationships. Vege-tation contrasts: forest and savanna; n, number of observations; r2, correlation coefficient andassociated p value; intercept; slope and 95 % confidence interval.
Response Bivariate Vegetationclass
n r2 p Intercept Slope Slope:Low 95 % CI
Slope:High 95 % CI
[P]a ↔ [N]a Forest 81 0.82 <0.0001 −11.01 47.92 43.58 52.68Savanna 24 0.51 <0.0001 −70.96 75.86 55.87 102.99
[P]m ↔ [N]m All 105 0.81 <0.0001 −0.097 0.046 0.042 0.050[N]a ↔ Ma Forest 81 0.43 <0.0001 0.299 0.018 0.015 0.021
Savanna 24 0.08 0.1848[P]a ↔ Ma Forest 81 0.38 <0.0001 3.31 0.84 0.71 1.00
Savanna 24 0.00 0.8207Amax,a ↔ [N]a Forest 81 0.47 <0.0001 −11.43 17.01 14.46 20.00
Savanna 24 0.17 0.0442 −54.48 42.15 28.47 62.40Amax,a ↔ [P]a Forest 81 0.47 <0.0001 −7.52 0.35 0.30 0.42
Savanna 24 0.09 0.1522Amax,a ↔ Ma All 105 0.30 <0.0001 −6.03 0.29 0.25 0.34Amax,m ↔ [N]m Forest 81 0.63 <0.0001 −192.81 18.47 16.12 21.16
Savanna 24 0.31 0.0049 −100.47 21.87 15.26 31.35Amax ,m ↔ [P]m Forest 81 0.61 <0.0001 −148.85 404.67 352.06 465.15
Savanna 24 0.30 0.0061 −14.60 394.68 274.50 567.47Amax ,m ↔ Ma Forest 81 0.08 0.0132 607.15 −4.95 −6.13 −4.00
Savanna 24 0.30 0.0056 628.00 −2.73 −3.93 −1.90Vcmax ,a ↔ [N]a Forest 81 0.41 <0.0001 −50.19 59.99 50.57 71.17
Savanna 24 0.23 0.0168 −183.24 142.76 97.82 208.35Vcmax ,m ↔ [N]m Forest 81 0.66 <0.0001 −0.94 0.071 0.063 0.081
Savanna 24 0.35 0.0025 −0.35 0.075 0.053 0.107Vcmax ,a ↔ [P]a Forest 81 0.41 <0.0001 −36.40 1.25 1.06 1.48
Savanna 24 0.17 0.0471 −49.69 1.88 1.27 2.79Vcmax ,m ↔ [P]m Forest 81 0.65 <0.0001 −0.77 1.56 1.37 1.78
Savanna 24 0.35 0.0022 −0.05 1.36 0.96 1.92Jmax ,a ↔ [N]a Forest 81 0.51 <0.0001 −52.66 76.12 65.16 88.92
Savanna 24 0.15 0.0660Jmax ,m ↔ [N]m Forest 81 0.65 <0.0001 −0.89 0.083 0.073 0.095
Savanna 24 0.37 0.0017 −0.38 0.094 0.066 0.133Jmax ,a ↔ [P]a Forest 81 0.53 <0.0001 −35.17 1.59 1.36 1.85
Savanna 24 0.08 0.1873Jmax ,m ↔ [P]m Forest 81 0.65 <0.0001 −0.69 1.82 1.59 2.07
Savanna 24 0.33 0.0033 −0.01 1.69 1.19 2.41φ ↔ Ma Forest 85 0.40 <0.0001 −0.063 0.009 0.007 0.010
Savanna 24 0.30 0.0056 0.086 0.005 0.003 0.007d ↔ Ma Forest 82 0.26 <0.0001 107.77 3.91 3.23 4.72
Savanna 24 0.74 <0.0001 152.77 1.86 1.48 2.32ρ ↔ Ma Forest 82 0.45 <0.0001 0.040 0.0020 0.0017 0.0024
Savanna 24 0.66 <0.0001 0.141 0.0014 0.0011 0.0018AN ↔ Ma Forest 81 0.00 0.6122
Savanna 24 0.00 0.9268
9001
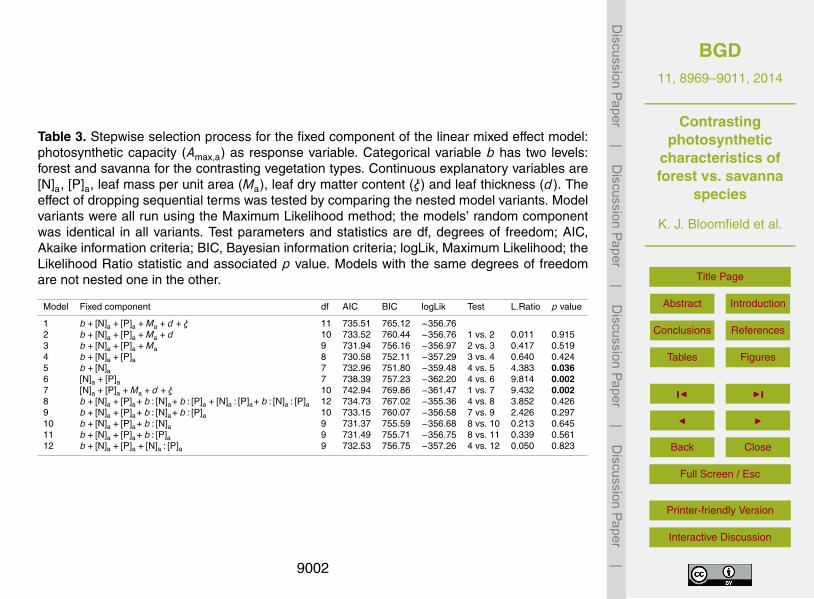
BGD11, 8969–9011, 2014
Contrastingphotosynthetic
characteristics offorest vs. savanna
species
K. J. Bloomfield et al.
Title Page
Abstract Introduction
Conclusions References
Tables Figures
J I
J I
Back Close
Full Screen / Esc
Printer-friendly Version
Interactive Discussion
Discussion
Paper
|D
iscussionP
aper|
Discussion
Paper
|D
iscussionP
aper|
Table 3. Stepwise selection process for the fixed component of the linear mixed effect model:photosynthetic capacity (Amax,a) as response variable. Categorical variable b has two levels:forest and savanna for the contrasting vegetation types. Continuous explanatory variables are[N]a, [P]a, leaf mass per unit area (Ma), leaf dry matter content (ξ) and leaf thickness (d ). Theeffect of dropping sequential terms was tested by comparing the nested model variants. Modelvariants were all run using the Maximum Likelihood method; the models’ random componentwas identical in all variants. Test parameters and statistics are df, degrees of freedom; AIC,Akaike information criteria; BIC, Bayesian information criteria; logLik, Maximum Likelihood; theLikelihood Ratio statistic and associated p value. Models with the same degrees of freedomare not nested one in the other.
Model Fixed component df AIC BIC logLik Test L.Ratio p value
1 b+ [N]a + [P]a +Ma +d + ξ 11 735.51 765.12 −356.762 b+ [N]a + [P]a +Ma +d 10 733.52 760.44 −356.76 1 vs. 2 0.011 0.9153 b+ [N]a + [P]a +Ma 9 731.94 756.16 −356.97 2 vs. 3 0.417 0.5194 b+ [N]a + [P]a 8 730.58 752.11 −357.29 3 vs. 4 0.640 0.4245 b+ [N]a 7 732.96 751.80 −359.48 4 vs. 5 4.383 0.0366 [N]a + [P]a 7 738.39 757.23 −362.20 4 vs. 6 9.814 0.0027 [N]a + [P]a +Ma +d + ξ 10 742.94 769.86 −361.47 1 vs. 7 9.432 0.0028 b+ [N]a + [P]a+b : [N]a+b : [P]a + [N]a : [P]a+b : [N]a : [P]a 12 734.73 767.02 −355.36 4 vs. 8 3.852 0.4269 b+ [N]a + [P]a+b : [N]a+b : [P]a 10 733.15 760.07 −356.58 7 vs. 9 2.426 0.29710 b+ [N]a + [P]a+b : [N]a 9 731.37 755.59 −356.68 8 vs. 10 0.213 0.64511 b+ [N]a + [P]a+b : [P]a 9 731.49 755.71 −356.75 8 vs. 11 0.339 0.56112 b+ [N]a + [P]a + [N]a : [P]a 9 732.53 756.75 −357.26 4 vs. 12 0.050 0.823
9002
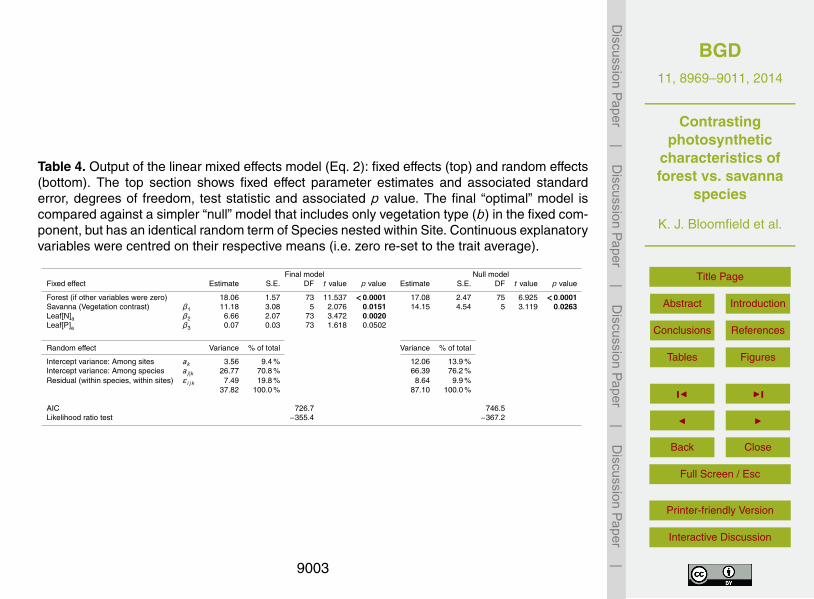
BGD11, 8969–9011, 2014
Contrastingphotosynthetic
characteristics offorest vs. savanna
species
K. J. Bloomfield et al.
Title Page
Abstract Introduction
Conclusions References
Tables Figures
J I
J I
Back Close
Full Screen / Esc
Printer-friendly Version
Interactive Discussion
Discussion
Paper
|D
iscussionP
aper|
Discussion
Paper
|D
iscussionP
aper|
Table 4. Output of the linear mixed effects model (Eq. 2): fixed effects (top) and random effects(bottom). The top section shows fixed effect parameter estimates and associated standarderror, degrees of freedom, test statistic and associated p value. The final “optimal” model iscompared against a simpler “null” model that includes only vegetation type (b) in the fixed com-ponent, but has an identical random term of Species nested within Site. Continuous explanatoryvariables were centred on their respective means (i.e. zero re-set to the trait average).
Final model Null modelFixed effect Estimate S.E. DF t value p value Estimate S.E. DF t value p value
Forest (if other variables were zero) 18.06 1.57 73 11.537 <0.0001 17.08 2.47 75 6.925 <0.0001Savanna (Vegetation contrast) β1 11.18 3.08 5 2.076 0.0151 14.15 4.54 5 3.119 0.0263Leaf[N]a β2 6.66 2.07 73 3.472 0.0020Leaf[P]a β3 0.07 0.03 73 1.618 0.0502
Random effect Variance % of total Variance % of total
Intercept variance: Among sites ak 3.56 9.4 % 12.06 13.9 %Intercept variance: Among species aj |k 26.77 70.8 % 66.39 76.2 %Residual (within species, within sites) εi jk 7.49 19.8 % 8.64 9.9 %
37.82 100.0 % 87.10 100.0 %
AIC 726.7 746.5Likelihood ratio test −355.4 −367.2
9003
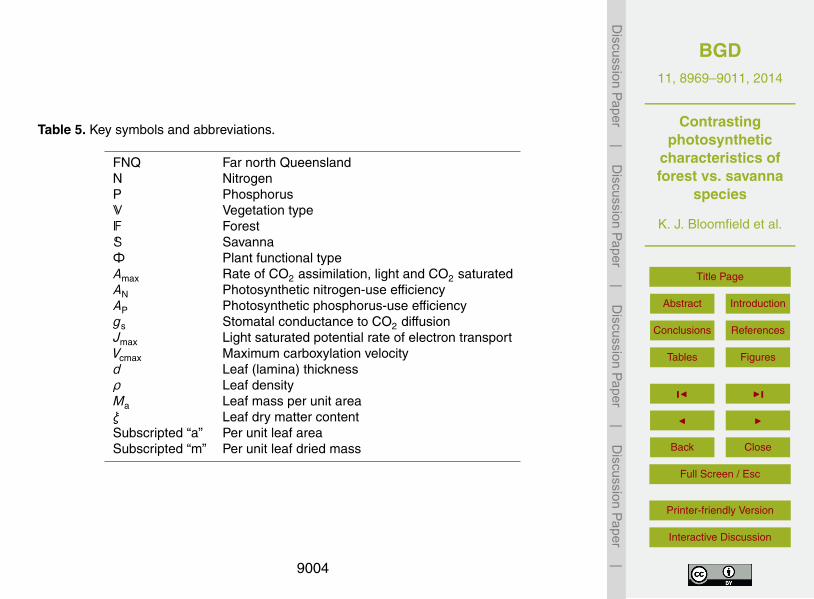
BGD11, 8969–9011, 2014
Contrastingphotosynthetic
characteristics offorest vs. savanna
species
K. J. Bloomfield et al.
Title Page
Abstract Introduction
Conclusions References
Tables Figures
J I
J I
Back Close
Full Screen / Esc
Printer-friendly Version
Interactive Discussion
Discussion
Paper
|D
iscussionP
aper|
Discussion
Paper
|D
iscussionP
aper|
Table 5. Key symbols and abbreviations.
FNQ Far north QueenslandN NitrogenP PhosphorusV Vegetation typeF ForestS SavannaΦ Plant functional typeAmax Rate of CO2 assimilation, light and CO2 saturatedAN Photosynthetic nitrogen-use efficiencyAP Photosynthetic phosphorus-use efficiencygs Stomatal conductance to CO2 diffusionJmax Light saturated potential rate of electron transportVcmax Maximum carboxylation velocityd Leaf (lamina) thicknessρ Leaf densityMa Leaf mass per unit areaξ Leaf dry matter contentSubscripted “a” Per unit leaf areaSubscripted “m” Per unit leaf dried mass
9004
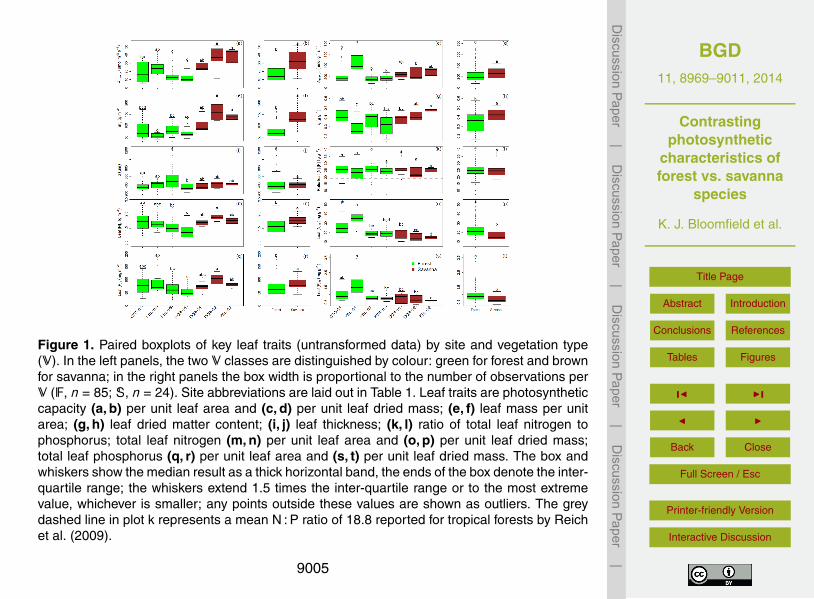
BGD11, 8969–9011, 2014
Contrastingphotosynthetic
characteristics offorest vs. savanna
species
K. J. Bloomfield et al.
Title Page
Abstract Introduction
Conclusions References
Tables Figures
J I
J I
Back Close
Full Screen / Esc
Printer-friendly Version
Interactive Discussion
Discussion
Paper
|D
iscussionP
aper|
Discussion
Paper
|D
iscussionP
aper|
Figure 1. Paired boxplots of key leaf traits (untransformed data) by site and vegetation type(V). In the left panels, the two V classes are distinguished by colour: green for forest and brownfor savanna; in the right panels the box width is proportional to the number of observations perV (F, n = 85; S, n = 24). Site abbreviations are laid out in Table 1. Leaf traits are photosyntheticcapacity (a, b) per unit leaf area and (c, d) per unit leaf dried mass; (e, f) leaf mass per unitarea; (g, h) leaf dried matter content; (i, j) leaf thickness; (k, l) ratio of total leaf nitrogen tophosphorus; total leaf nitrogen (m, n) per unit leaf area and (o, p) per unit leaf dried mass;total leaf phosphorus (q, r) per unit leaf area and (s, t) per unit leaf dried mass. The box andwhiskers show the median result as a thick horizontal band, the ends of the box denote the inter-quartile range; the whiskers extend 1.5 times the inter-quartile range or to the most extremevalue, whichever is smaller; any points outside these values are shown as outliers. The greydashed line in plot k represents a mean N : P ratio of 18.8 reported for tropical forests by Reichet al. (2009).
9005
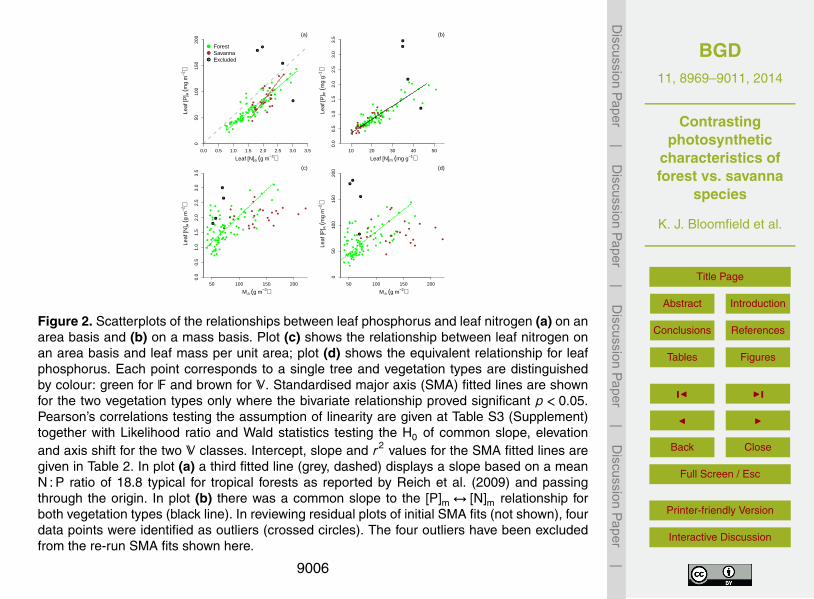
BGD11, 8969–9011, 2014
Contrastingphotosynthetic
characteristics offorest vs. savanna
species
K. J. Bloomfield et al.
Title Page
Abstract Introduction
Conclusions References
Tables Figures
J I
J I
Back Close
Full Screen / Esc
Printer-friendly Version
Interactive Discussion
Discussion
Paper
|D
iscussionP
aper|
Discussion
Paper
|D
iscussionP
aper|
●
●
●
●
0.0 0.5 1.0 1.5 2.0 2.5 3.0 3.5
050
100
150
200
Leaf [N]a (g m−2)
Leaf
[P] a
(mg
m−2
)
●●●
●
●
●
●
●
●
●
●
●
●
●
●
●●
●
●
●
●
●
●
●
●●
●
●
●●
●● ●●●
●●
●
●
●
●●
●
●
●
●
●
●
●
●
●
●
●
●●
●
●
●
●
●
●
●
●
●
●●●
●
●
●
●
●
●
●
●
●
● ●
●
●
●
●
●
●
●
● ●
●
●
●
●
●
●
●●
●
●
●
●
●
●
●
●
●
●
●
●
●
ForestSavannaExcluded
(a)
●
●
●
●
10 20 30 40 50
0.0
0.5
1.0
1.5
2.0
2.5
3.0
3.5
Leaf [N]m (mg g−1)
Leaf
[P] m
(mg
g−1)
●
●
●
●●
●
●
●
●
●
●
●●
●
●●●
●
●
●●
●
●●
● ●●
●●●
●●
●●
●
●
●
●
●
●
●
●
●●
●●●●
●
●
●
●●●
●●
●●● ●
●●
●●
●
●
●●●
●
●
●
●
●
●
●
●●
●
●
●
●● ●
●● ●●
●●
●
●
●
●●
●
●
●
●
●
●
● ●
●
●
(b)
●
●
●
●
50 100 150 200
0.0
0.5
1.0
1.5
2.0
2.5
3.0
3.5
Ma (g m−2)
Leaf
[N] a
(g m
−2)
●
●
●
●
●
●
●
●
●
●
●
●
●
●●
●●
●
●
●
●
●
●
●
●
●
●
●
●●
●
●● ●
●
●
●●
●●
●
●
●
●
●
●
●
●
●
●
●
●
●
●
● ●
●
●
●
●
●
●
●
●
●
●
●
● ●
●
●
●●
●
●
●
●
●
●
●
●
●
●
●
●
●
●
●
●
●
●●
●
●
●
●●
●
●
●
●
●
●
● ●
(c)
●
●
●
●
50 100 150 200
050
100
150
200
Ma (g m−2)
Leaf
[P] a
(mg
m−2
)
●●●
●
●
●
●
●
●
●
●
●
●
●
●
●●
●
●
●
●
●
●
●
●●
●
●
●●
●● ● ●●
●●
●
●
●
●●
●
●
●
●
●
●
●
●
●
●
●
●●
●
●
●
●
●
●
●
●
●
●●●
●
●
●
●
●
●
●
●
●
● ●
●
●
●
●
●
●
●
●●
●
●
●
●
●
●
●●
●
●
●
●
●
●
●
●
●
●
(d)
Figure 2. Scatterplots of the relationships between leaf phosphorus and leaf nitrogen (a) on anarea basis and (b) on a mass basis. Plot (c) shows the relationship between leaf nitrogen onan area basis and leaf mass per unit area; plot (d) shows the equivalent relationship for leafphosphorus. Each point corresponds to a single tree and vegetation types are distinguishedby colour: green for F and brown for V. Standardised major axis (SMA) fitted lines are shownfor the two vegetation types only where the bivariate relationship proved significant p < 0.05.Pearson’s correlations testing the assumption of linearity are given at Table S3 (Supplement)together with Likelihood ratio and Wald statistics testing the H0 of common slope, elevationand axis shift for the two V classes. Intercept, slope and r2 values for the SMA fitted lines aregiven in Table 2. In plot (a) a third fitted line (grey, dashed) displays a slope based on a meanN : P ratio of 18.8 typical for tropical forests as reported by Reich et al. (2009) and passingthrough the origin. In plot (b) there was a common slope to the [P]m ↔ [N]m relationship forboth vegetation types (black line). In reviewing residual plots of initial SMA fits (not shown), fourdata points were identified as outliers (crossed circles). The four outliers have been excludedfrom the re-run SMA fits shown here.
9006

BGD11, 8969–9011, 2014
Contrastingphotosynthetic
characteristics offorest vs. savanna
species
K. J. Bloomfield et al.
Title Page
Abstract Introduction
Conclusions References
Tables Figures
J I
J I
Back Close
Full Screen / Esc
Printer-friendly Version
Interactive Discussion
Discussion
Paper
|D
iscussionP
aper|
Discussion
Paper
|D
iscussionP
aper|
●
●
●
●●
●
●
●
●
●●
●
●●
●●●
●
●
●
● ●●
●
●
●
●
●
●
●
●
●●
●
●
●
●●
●●
●
● ●
●
●●●
●
●
●●
●
●
●
●
●
●
●●
●
●
●
●●
●
●● ●●
●
●
●● ●
●
●●
●●●
●
0.0 1.0 2.0 3.0
010
2030
4050
Leaf [N]a (g m−2)
Am
ax ,a
(µm
ol C
O2
m−2
s−1
)●
●
●
●
●
●
●
●
●
CTC−01DCR−01DCR−02KBL−01KBL−02KBL−03KCR−01Excluded
(a)
●
●
●
●●
●
●
●
●
●●
●
●●
●●●
●
●
●
● ●●
●
●
●
●
●
●
●
●
●●
●
●
●
●●
●●
●
● ●
●
●●●
●
●
●●
●
●
●
●
●
●
●●
●
●
●
●●
●
●●● ●
●
●
● ●●
●
●●●●
●
●
0 50 100 150 200
010
2030
4050
Leaf [P]a (mg m−2)
●
●
●
●
(b)
●
●
●
●●
●
●
●
●
●●
●
●●●
●●
●
●
●
● ●●
●
●
●
●
●
●
●
●
● ●
●
●
●
●●
●●●
● ●
●
●●●
●
●
●●
●
●
●
●
●
●
●●
●
●
●
●●
●
●●● ●
●
●
● ● ●
●
●●●●
●
●
50 100 150 200
010
2030
4050
●
●
●
●
(c)
●
●
●
●
●
●
●
●
●
●●
●
●●
●●●
● ●
●
●
●
●●
●
●
●
●
●
●
●
●●
●●
●● ●
●●
●●
●
●
●●
●●
●
●●
●
●
● ●
●
●
●●
●
●●
●●●
●
●
●
●
● ●●
● ●
●
●
●
●●
●
●
10 20 30 40 50
020
040
060
080
0
Leaf [N]m (mg g−1)
Am
ax ,m
(nm
ol C
O2
g−1 s
−1)
●
●
●●
(d)
●
●
●
●
●
●
●
●
●
●●
●
●●
●●●
● ●
●
●
●
●●
●
●
●
●
●
●
●
●●
●●
●● ●
●●
●●
●
●
●●
●●
●
●●
●
●
● ●
●
●
●●
●
●●
●●●
●
●
●
●
● ●●
●●
●
●
●
●●
●
●
0.0 1.0 2.0 3.0
020
040
060
080
0
Leaf [P]m (mg g−1)
●
●
●●
(e)
●
●
●
●
●
●
●
●
●
●●
●
●●●
●●
●●
●
●
●
●●
●
●
●
●
●
●
●
●●
●●
●●●
●●●
●
●
●
●●
●●
●
●●
●
●
●●
●
●
●●
●
●●
● ●●
●
●
●
●
●●●
● ●
●
●
●
●●
●
●
50 100 150 200
020
040
060
080
0
Ma (g m−2)
●
●
●●
(f)
Figure 3. Top panel (plots a–c), scatterplots of the area-based relationships between photo-synthetic capacity (Amax,a) and (a) leaf nitrogen; (b) leaf phosphorus; (c) leaf mass per unitarea (Ma). Bottom panel (plots d–f) the equivalent plots are expressed per unit leaf dried mass.Each point represents a single leaf; dots denote F sites and square symbols denote S sites;individual sites are distinguished by colour: CTC-01 black, DCR-01 red, DCR-02 green, KBL-01 royal blue, KBL-02 turquoise, KBL-03 pink, KCR-01 yellow. Standardised major axis (SMA)fitted lines are shown where significant: F (green), S (brown). Pearson’s correlations testing theassumption of linearity are given at Table S3 (Supplement) together with Likelihood ratio andWald statistics testing the H0 of common slope, elevation and axis shift for the two V classes.In plot (c) there was no difference in slope between the two V and so a common line is fitted(black). SMA intercept, slope and r2 values are given in Table 2.
9007

BGD11, 8969–9011, 2014
Contrastingphotosynthetic
characteristics offorest vs. savanna
species
K. J. Bloomfield et al.
Title Page
Abstract Introduction
Conclusions References
Tables Figures
J I
J I
Back Close
Full Screen / Esc
Printer-friendly Version
Interactive Discussion
Discussion
Paper
|D
iscussionP
aper|
Discussion
Paper
|D
iscussionP
aper|
●
●
●
●● ●
●
●
●
●
●
●
●
●
●
●
●
●
●
●●
●
●
●●
●
●
●
●●
●
●
●
●
●
●
●
●●
●
●
●
●
●
●
●
●
●
● ●
●
●
●
●
●
●
●
●
●
●●
●
●
●
●
●
●
●●
● ●
●
●●
●
●
●
●
●
●
●
●
●
●
●
●●
●
●
●
●
●●
●
●●
●
●
●
●●
●
●
●
●
●●
●
●
0 10 20 30 40 50
010
2030
4050
Model fitted values
Am
ax ,a
(µm
ol C
O2 m
−2 s
−1)
R2 = 0.82
●
●
●
●
●
SavannaSmall pioneerSub−canopyTall pioneerUpper canopy
(a)
−5
05
Forest species only
Mod
el r
ando
m in
terc
epts
(
diffe
renc
e fr
om p
opul
atio
n m
ean)
Small
pion
eer
Sub−c
anop
y
Tall p
ionee
r
Upper
cano
py
ab
b
a
ab
(b)
Figure 4. Output from linear mixed effects model (Eq. 2): (a) scatterplot of observed photo-synthetic capacity (Amax,a) against the model fitted values as an indication of goodness of fitand (b) boxplot of model random intercepts (Amax,a ↔ [N]a) by Φ for the F subset; boxes whichshare the same letter correspond to means that were not significantly different (Tukey’s HSDon ranked values). Boxplot construction is explained in Fig. 1.
9008
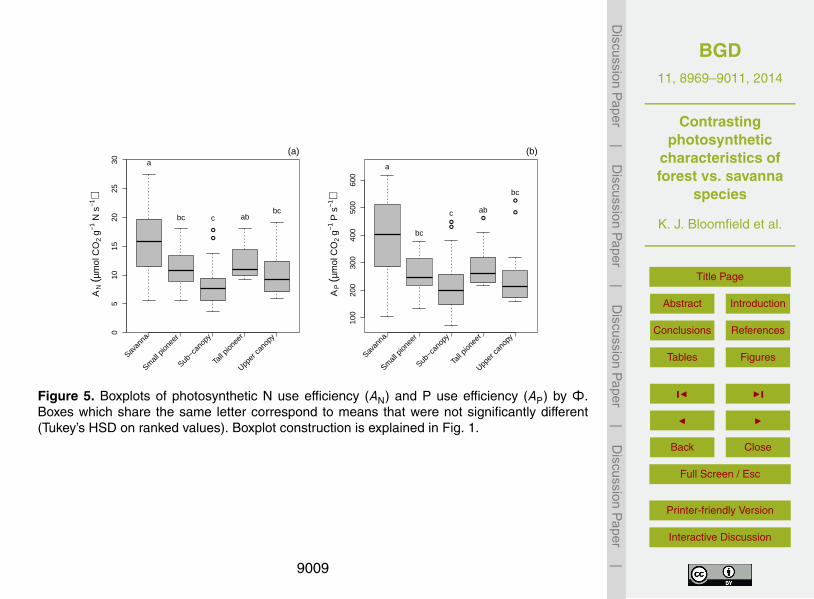
BGD11, 8969–9011, 2014
Contrastingphotosynthetic
characteristics offorest vs. savanna
species
K. J. Bloomfield et al.
Title Page
Abstract Introduction
Conclusions References
Tables Figures
J I
J I
Back Close
Full Screen / Esc
Printer-friendly Version
Interactive Discussion
Discussion
Paper
|D
iscussionP
aper|
Discussion
Paper
|D
iscussionP
aper|
●
●
05
1015
2025
30
AN
(µm
ol C
O2 g
−1 N
s−1
)
Savan
na
Small
pion
eer
Sub−c
anop
y
Tall p
ionee
r
Upper
cano
py
a
bc c abbc
(a)
●●
●
●
●
100
200
300
400
500
600
AP (µ
mol
CO
2 g−1
P s
−1)
Savan
na
Small
pion
eer
Sub−c
anop
y
Tall p
ionee
r
Upper
cano
py
a
bc
c ab
bc
(b)
Figure 5. Boxplots of photosynthetic N use efficiency (AN) and P use efficiency (AP) by Φ.Boxes which share the same letter correspond to means that were not significantly different(Tukey’s HSD on ranked values). Boxplot construction is explained in Fig. 1.
9009
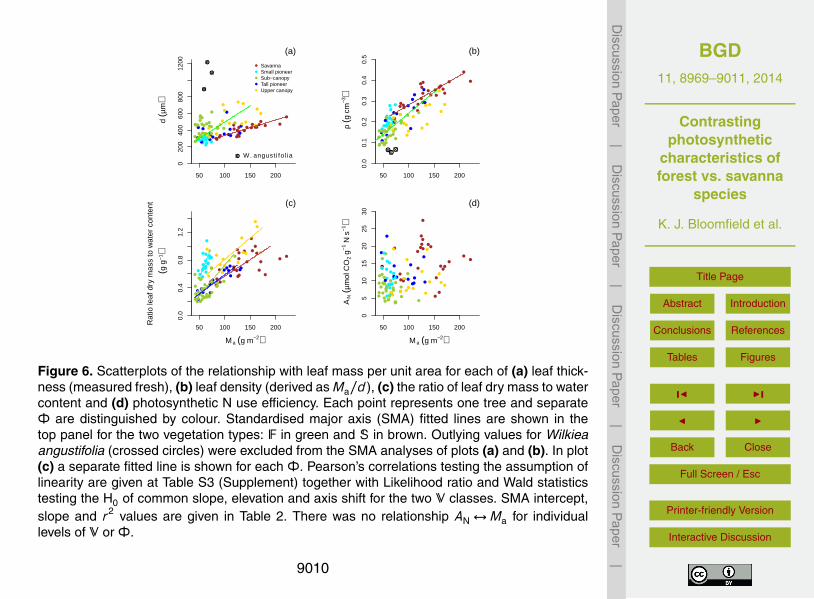
BGD11, 8969–9011, 2014
Contrastingphotosynthetic
characteristics offorest vs. savanna
species
K. J. Bloomfield et al.
Title Page
Abstract Introduction
Conclusions References
Tables Figures
J I
J I
Back Close
Full Screen / Esc
Printer-friendly Version
Interactive Discussion
Discussion
Paper
|D
iscussionP
aper|
Discussion
Paper
|D
iscussionP
aper|
●●
●●
●●
●
●●
●
●
●
●
●
●●●
●
●
●
●●
●●●
●●
●
●●● ●
●●●
●● ●
●
●●●●●
●
●
●
●●●
●●
●
●
●
●●●
●●
●
●●●●
●●
●●
●
●
●
●●
●●
●
●●
●
●
●
●
●
● ●
●
●
●
●
●●
● ●
●
●●
●
●
● ●●●●
●●
50 100 150 2000
200
400
600
800
1200
d (µ
m)
●
●
●
● W. angust i fol ia
●
●
●
●
●
SavannaSmall pioneerSub−canopyTall pioneerUpper canopy
(a)
●
●●
●●
●
●
●●
●
● ●
●
●
●●●
●
●
●●
●
●
●● ●
●
●
●
●
●
●●
●●
●
●
● ●
●
●●●
●
● ●●
●●
●
●
●
●
●
●
●
●●
●
● ●
●
●●
●
●
●
●●●
●
●
●
●
●
●●●●
● ●●
●
●
●
●
●●
●
●
● ●●
●
●
●
●● ●●
●
●●
●
●
●
50 100 150 200
0.0
0.1
0.2
0.3
0.4
0.5
ρ (g
cm
−3)
●●●
(b)
●●●
●
●
●
●
●
●
●
●
●
●
●●●● ●●
●●
●
●●
●●
●
●
●
●●
●
●
●●
●
●●
●●●
●
●●
●
●
●
●●
●●●
●●
●
●
●●
●● ●
●
●
●
●
●
●●●
●
●
●
●
●
●
●
●
●
●
●
●●
●
● ●
●
●
● ●●
●
●
●
●
●
●
●
●●
●
●
●
●
●
●●●
●
●
50 100 150 200
0.0
0.4
0.8
1.2
Ma (g m−2)
Rat
io le
af d
ry m
ass
to w
ater
con
tent
(g g
−1)
(c)
●
●
●
●
●
●
●
●●
●●
●
●
●
●
●
●
●
●
●●
●
●
●
●●●
● ●
●
●
●
●●●
●
●
●●
●
●●
●●
●●
●
●
●
●
●● ●
●
●
●●
●
●
●●
●
●●
●
●●
●
●
●
●
●
●
●●●
●
●
●
●
●
●
●
●
●
●●
●●●
● ●
●
●
●
● ●
●
●
● ●●
●
●
●
●
●●
●
50 100 150 200
05
1015
2025
30
Ma (g m−2)A
N (µ
mol
CO
2 g−1
N s
−1)
(d)
Figure 6. Scatterplots of the relationship with leaf mass per unit area for each of (a) leaf thick-ness (measured fresh), (b) leaf density (derived as Ma/d ), (c) the ratio of leaf dry mass to watercontent and (d) photosynthetic N use efficiency. Each point represents one tree and separateΦ are distinguished by colour. Standardised major axis (SMA) fitted lines are shown in thetop panel for the two vegetation types: F in green and S in brown. Outlying values for Wilkieaangustifolia (crossed circles) were excluded from the SMA analyses of plots (a) and (b). In plot(c) a separate fitted line is shown for each Φ. Pearson’s correlations testing the assumption oflinearity are given at Table S3 (Supplement) together with Likelihood ratio and Wald statisticstesting the H0 of common slope, elevation and axis shift for the two V classes. SMA intercept,slope and r2 values are given in Table 2. There was no relationship AN ↔Ma for individuallevels of V or Φ.
9010
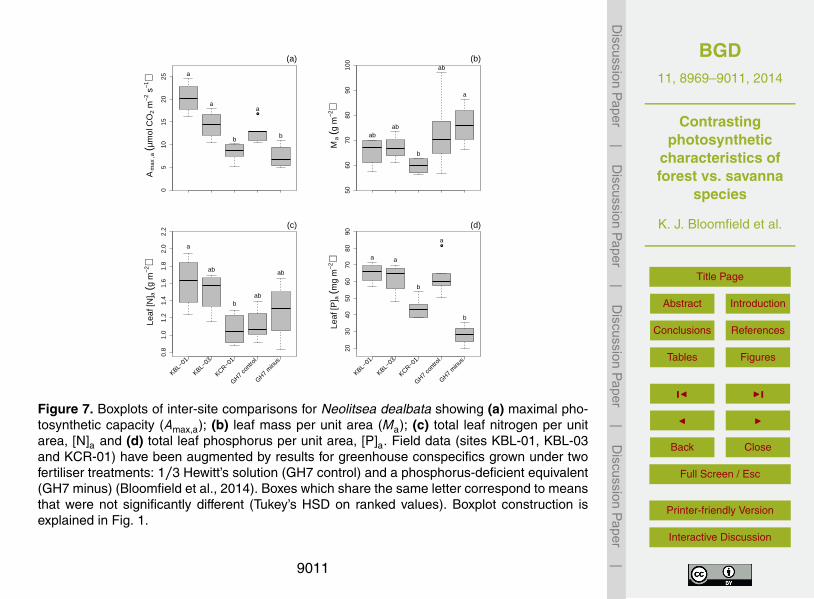
BGD11, 8969–9011, 2014
Contrastingphotosynthetic
characteristics offorest vs. savanna
species
K. J. Bloomfield et al.
Title Page
Abstract Introduction
Conclusions References
Tables Figures
J I
J I
Back Close
Full Screen / Esc
Printer-friendly Version
Interactive Discussion
Discussion
Paper
|D
iscussionP
aper|
Discussion
Paper
|D
iscussionP
aper|
●
05
1015
2025
Am
ax ,a
(µm
ol C
O2 m
−2 s
−1)
(a)
a
a
b
a
b
5060
7080
9010
0
Ma (
g m
−2)
(b)
abab
b
ab
a
0.8
1.0
1.2
1.4
1.6
1.8
2.0
2.2
Leaf
[N] a
(g m
−2)
KBL−01
KBL−03
KCR−01
GH7 co
ntro
l
GH7 m
inus
(c)
a
ab
bab
ab
●
2030
4050
6070
8090
Leaf
[P] a
(mg
m−2
)
KBL−01
KBL−03
KCR−01
GH7 co
ntro
l
GH7 m
inus
(d)
a a
b
a
b
Figure 7. Boxplots of inter-site comparisons for Neolitsea dealbata showing (a) maximal pho-tosynthetic capacity (Amax,a); (b) leaf mass per unit area (Ma); (c) total leaf nitrogen per unitarea, [N]a and (d) total leaf phosphorus per unit area, [P]a. Field data (sites KBL-01, KBL-03and KCR-01) have been augmented by results for greenhouse conspecifics grown under twofertiliser treatments: 1/3 Hewitt’s solution (GH7 control) and a phosphorus-deficient equivalent(GH7 minus) (Bloomfield et al., 2014). Boxes which share the same letter correspond to meansthat were not significantly different (Tukey’s HSD on ranked values). Boxplot construction isexplained in Fig. 1.
9011