Alexander polynomials: Essential variables and multiplicities
Upload
khangminh22Category
view
1download
0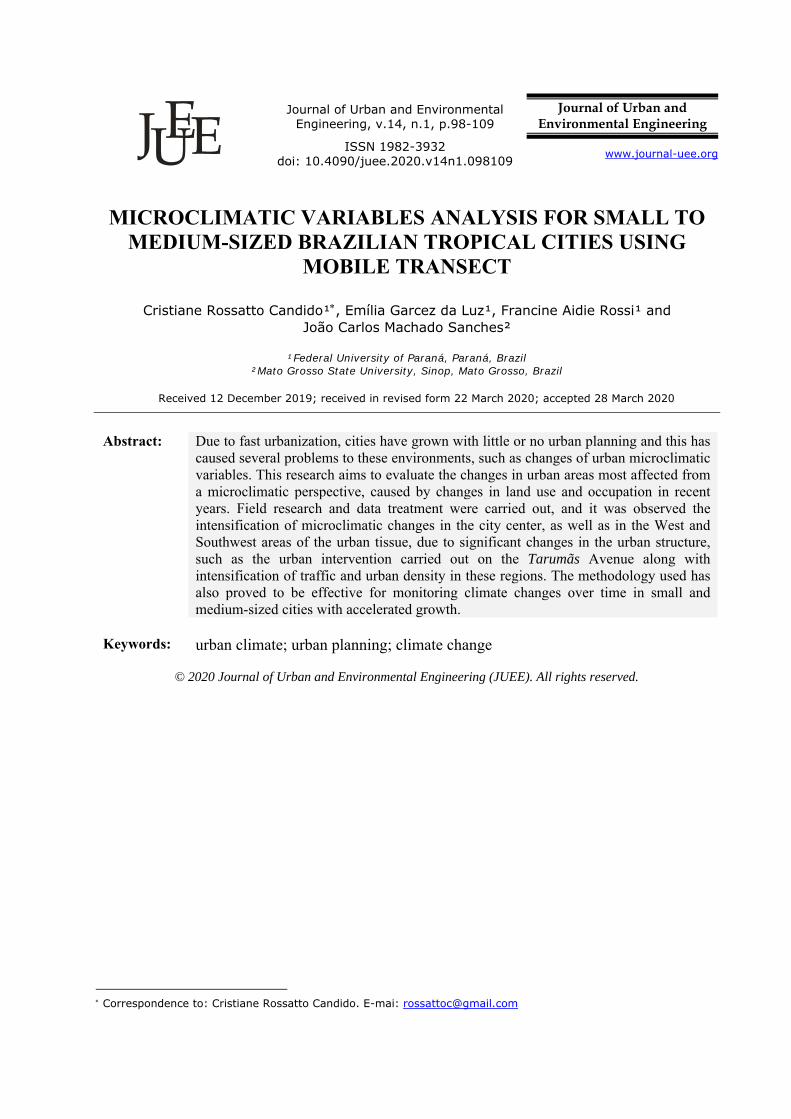
UEEJ
Journal of Urban and Environmental Engineering, v.14, n.1, p.98-109
Journal of Urban and Environmental Engineering
ISSN 1982-3932 doi: 10.4090/juee.2020.v14n1.098109 www.journal-uee.org
MICROCLIMATIC VARIABLES ANALYSIS FOR SMALL TO MEDIUM-SIZED BRAZILIAN TROPICAL CITIES USING
MOBILE TRANSECT
Cristiane Rossatto Candido¹, Emília Garcez da Luz¹, Francine Aidie Rossi¹ and João Carlos Machado Sanches²
¹Federal University of Paraná, Paraná, Brazil
²Mato Grosso State University, Sinop, Mato Grosso, Brazil
Received 12 December 2019; received in revised form 22 March 2020; accepted 28 March 2020
Abstract: Due to fast urbanization, cities have grown with little or no urban planning and this has
caused several problems to these environments, such as changes of urban microclimatic variables. This research aims to evaluate the changes in urban areas most affected from a microclimatic perspective, caused by changes in land use and occupation in recent years. Field research and data treatment were carried out, and it was observed the intensification of microclimatic changes in the city center, as well as in the West and Southwest areas of the urban tissue, due to significant changes in the urban structure, such as the urban intervention carried out on the Tarumãs Avenue along with intensification of traffic and urban density in these regions. The methodology used has also proved to be effective for monitoring climate changes over time in small and medium-sized cities with accelerated growth.
Keywords:
urban climate; urban planning; climate change
© 2020 Journal of Urban and Environmental Engineering (JUEE). All rights reserved.
Correspondence to: Cristiane Rossatto Candido. E-mai: [email protected]

Candido, da Luz, Rossi and Sanches
Journal of Urban and Environmental Engineering (JUEE), v.14, n.1, p.98-109, 2020
99
INTRODUCTION
Most of the humanity is now living in the cities. The evolution to this reality occurred with the urbanization process, on a world scale, after the Industrial Revolution, and in Brazil from the second half of 20th century onwards. This phenomenon, which occurred at an accelerated pace, brought some problems to the cities, such as microclimatic changes and increase of the heat waves (IPCC, 2014) as a response of the land use changes and directly influence the urban climate composition, which is a combination of geometry, terrain relief, types of surfaces, soil permeability index and vegetation index.
Studies related to the urban climate has shown that urban expansion without appropriate planning control creates environments that hamper the performance of urban functions along with thermal discomfort, less air quality, rainfall and other impacts (ALI et al., 2017; GOMES, GOMES e LAMBERTS, 2009; MONTEIRO, 1976; OLIVEIRA et al., 2009; SANCHES, 2015; SHI et al., 2018). Moreover, the existing activities in the cities demands a lot of energy, raw materials and water (ASSIS, 2005) which increase energy consumption and emission of pollutants gaseous (MARIĆ et al., 2016) hence change the energy balance of the city (CALLEJAS et al., 2016).
Sinop, a city located in the transition of the rainforest and Brazilian savanna, in the state of Mato Grosso, is in a similar context. Sanches (2015) verified some changes in urban climate, mainly in the central region of the city due to high-density and lack of permeable area. The city went through some changes in the urban structure until 2017, such as removal of tree vegetation from Tarumãs Avenue, one of the main avenues in the city, growth of neighborhoods on the west and east sides, addition of parking lots on both sides of the main avenue, Mognos Avenue, and some urban interventions in squares and public places.
Furthermore, the approval of the City Statute, created the possibility of developing urban studies considering environmental aspects for urban quality, such as urban climate, which would serve as a subsidy to elaborate the municipal Master Plan (ASSIS et al., 2007).
Studies addressing evolution of the urban heat island and the urban climate change caused by land use are important because of the accelerated growth of medium-sized cities in Brazil. Many cities that have considerably expanded have tropical climate, low latitudes and are located in areas with a developmental perspective (DUARTE et al., 2015; ROTH, 2007).
Few studies in Brazil have shown the relation between fast growth by land use modifications and changes in microclimatic variables. For instance, Souza et al. (2016) verified some changes in microclimatic parameters after interventions in a University campus in São Paulo. The study indicated that asphalt and lack of
tree vegetation even with presence of grass in periods with higher incidence of solar radiation increased the temperature, leading to an even more complex process in the city scale.
The present study aims to evaluate the microclimatic variables changes with mobile measurement in temporal aspect as a purpose to monitoring urban climate in small to medium-sized cities. Also, modifications in urban areas most affected from microclimatic view in Sinop, located in Midwest in Brazil, due to the changes in land use in recent years, were also evaluated by comparing observations made in 2017 and a study carried out in 2013 and 2014 by Sanches (2015).
Method
Object of study
Sinop is a city located in Mato Grosso State, in Midwest region in Brazil (11º 51' 51" S, 55º 30' 09" W). with an altitude of 384 meters and a predominantly flat relief. The city has an estimated population of 132,934 inhabitants, with a distribution of 28.69 habitants per square kilometer and HDI of 0.754 (UNDP, 2013, IBGE, 2016) and it is 500 kilometers away from the state capital Cuiabá.
Sinop belongs to the geomorphological unit of Parecis Plateau, in the Amazon Basin, having as its hydrographic network the Teles Pires River, which is a tributary of the Tapajós River (MORENO; HIGA, 2005). The city urban street design is predominantly orthogonal, with roads perpendicular and parallel to the highway BR- 163. There are three urban forest reserves: one to the South (CEPROTEC Reserve), one to the West (UNEMAT Reserve) and another to the North (Forest Park Reserve).
A study has shown that the predominant wind flow is north-northwest for the rainy season and east-southeast for the dry season (SANTOS; SANCHES, 2013). Other studies (SANCHES, 2015; SANCHES et al., 2017) show that the hottest and driest regions in the city are concentrated along the highway BR-163 and in the central and western parts of the city.
Low index of urban vegetation, intense traffic of vehicles, low permeable areas and high constructive density are common features to these regions. Identifying these sources of heat and poor ventilation is important in planning actions that mitigate or eliminate the effects of discomfort in the affected regions of urban centers (BONAFONI et al., 2017, DRACH et al., 2016). This study is a continuation of a method established in a previous work (SANCHES, 2015).
Equipment
A fixed station installed in the campus of State University of Mato Grosso (UNEMAT), located in the central area of the city, was used to compare measured data with data collected in mobile measurements. The
Candido, da Luz, Rossi and Sanches
Journal of Urban and Environmental Engineering (JUEE), v.14, n.1, p.98-109, 2020
100
fixed station site was also chosen to develop the research methodology in the study in which this research is based (Sanches, 2015).
The fixed weather station (model Davis Instruments' Vantage Pro2.) has a set of sensors, to collect rain, wind, temperature and humidity data in a rugged sensor suite with optional solar radiation, central solar collection and data transmission, which were purchased separately. To reduce impact on readings, the temperature and humidity sensors were built within a shield to protect them from radiation.
As the other main unit of this station, the console records the measured data, with a wireless communication system between sensors and a maximum range of 300 meters (Davis Instruments, 2012a). Measurements by mobile transect can be done with sensors at different heights, usually between 0.75 and 2 meters (Achberger & Ba, 1999; Assis et al., 2007; Heusinkveld et al., 2014; Häb et al., 2015; Liu et al., 2016). The studies have shown that 2 meters height is the most usual.
A car of 1.5 m height was used with the temperature and humidity sensor coupled in a support, resulting in 2.2 meters height for measurement. This research was based on air temperature and humidity only so the respective sensor was coupled to the mast on the vehicle. The sensor used, the ITWH-1080 model from Instrutemp, has a precision of ± 1º C for temperature and ± 5% for humidity, with range of -40º C to 65º C and 10% to 99% respectively (INSTRUTEMP, 2010). The transmission field can reach a maximum of 100 meters distance. The station also has a console which is kept inside of the vehicle. Measured data is recorded manually in a worksheet.
Mobile measurement protocols
Fig. 1 shows the route defined to monitor the urban climate of Sinop (Sanches, 2015) were the fixed station is pointed as well. The points were evenly distributed with a mean radius of 500 meters around each point to distinguish specific features of different regions, the influence of forest reserves and high constructive density in the urban perimeter of Sinop.
These are general characteristics that the measurement points should show in the perimeter studied, as well as topographic characteristics (ASSIS et al., 2007).
Measurements were taken for rainy dry seasons and three characteristic days were chosen for each, as it has been shown to be sufficient to evaluate microclimate variables in the city (Sanches, 2015). Therefore, data were collected on February 22, 23 and 24 in the rainy season of 2017. However, since there can be no precipitation during data collection, the measurement for the morning period on February 22 was only possible to be carried out on March 2. For the dry season data were collected on August 08, 09 and 10.
Fig. 1 Path and points of the route performed by the mobile transect.
Measurement intervals of mobile transect are defined
by specific characteristics of the site studied (Heusinkveld et al., 2014), and must be performed during a period of time that is characteristic of a certain period of the day, without great variations at the same point by time w. For Sinop, measurements can be performed under these conditions within one hour (SANCHES, 2015).
Measurement schedule was based on recommendations of the World Meteorological Organization (WMO), which indicates the timetables of 08:00 a.m., 2:00 p.m. and 8:00 p.m. as indicators of critical periods of the weather through the day (MACIEL, 2011).To perform measurements with mobile transects, the station consoles (fixed and mobile) must be synchronized to the same time and programmed to store data from minute to minute. After that, the measurement can be started with the equipment coupled to the car at a speed of 40 kilometers per hour, remaining at each measurement point for at least two minutes to collect data and to check wireless data reception signal on the console mobile station (Sanches et al., 2017; Sanches, 2015). Temperature and humidity data were recorded at the exact minute of the measurement so that subsequent data correction is valid.
Data processing
Maps of air temperature and relative humidity were generated from the data collected by using the kriging method with the open source software SAGA GIS, developed by the department of physical geography at

Candido, da Luz, Rossi and Sanches
Journal of Urban and Environmental Engineering (JUEE), v.14, n.1, p.98-109, 2020
101
Fig. 2 Variation of (a) air temperature; and (b) relative humidity in the points of mobile transect in the morning period of rainy season. the University of Göttingen, Germany, for spatial data editing. Final adjustments were made in the test version of software Corel Draw. Electronic sheets were used to correct data and to generate graphs with the previous situation of air temperature and humidity of the periods studied. For the correction of the mobile measurement data, the minute in which the data of a moving point has been registered is checked and corrected with the values recorded in the fixed station. The difference in air temperature value or relative humidity recorded at the fixed station in the first minute of measurement with the other minutes is calculated to obtain the variation of values in the fixed point. Subsequently, the variation found of the other values measured in the field is added or subtracted. Thus, the representative values of temperature and humidity are obtained for the 16 measurement points along the urban perimeter, for the first minute of data recording, in the case of the study applied here, at 08:00 h, 14: 00 and 20:00 h (Sanches, 2015, Sanches et al., 2017).
Geostatistical method kriging was applied in this research. Normal kriging is the most common and the most suitable method, and consists in a non-stationary estimation model that evidences reading and global interpretation of the phenomena, expresses evident trends by the data sequence and also allows multiple interpretations for the same data series. Use of geographic information systems and statistical tools, together, can optimize more reliable interpolation methods. (Castro & Lopes, 2013). Trindade & Sanches (2016) applied ordinary kriging method to interpolate wind speed and wind direction data interpolation at points where no samples were collected, to generate wind flow maps in Sinop, Brazil from images of remote sensing provided by INPE, in Landsat and SRTM along with images obtained from Google Earth.
In this research, the preparation of the general maps of the stations starts from the data analysis of each measurement day for each period. Then, the maps of the means of the variables are generated for each period of measurement in the rainy and dry seasons. Later, a map of climate change was generated by layering maps of the averages of relative air humidity and air temperature. The classification of the climatic changes
of the studied regions was based on the overlapping of layers, in which the region with the greatest climate change corresponds to the one with four layers overlapping, a significant climatic change to that with three layers overlap, and some climatic change to that with overlap of two or one layer.
Results
Mobile transect in rainy season
Morning period
The morning period showed a difference of average temperature of 2.6 °C between points 1, with an average of 25.8 °C, and 16, with a mean of 23.2 °C, as shown in Fig. 2a. For the same period, Sanches (2015) verified a difference of average temperature between extreme points of 0.3 ºC.
Relative humidity in measured days had a variation of 10.3% between highest and lowest mean values. As seen in Fig. 2b, point 1 had the lowest value of air relative humidity, 80%, while in points 11, 12 and 13 the air relative humidity was 90.3%. The previous study (Sanches, 2015) showed an average difference of 3%.
Figures 3ab shows how air temperature and relative humidity behaved during the morning period measured in rainy season. Most significant climate changes (increase of temperature and decrease of relative humidity) can be seen in the central and westregions of the city, with little or no vegetation cover and high constructive density. The west side is a predominantly residential area, and in the central area is predominantly commerce with intense traffic of vehicles in commercial hours.
The most affected mesh of the city agrees with respect to the two evaluated variables, the points with higher temperatures are also those with smaller humidity values. The influence of wind for this period was insignificant, with an average speed of 0.33 m/s and predominant direction east.
Afternoon period
For the afternoon period in the rainy season, the difference between the average air temperature of

Candido, da Luz, Rossi and Sanches
Journal of Urban and Environmental Engineering (JUEE), v.14, n.1, p.98-109, 2020
102
Fig. 4 Variation of average (a) air temperature; and (b) relative humidity in the points of mobile transect in the night period of rainy season.
Fig. 3 Distribution maps of (a) air temperature; and (b) relative
humidity in the morning period.
extreme points, 10 and points 2 and 3, with averages of 34.5 °C and 32.9 °C respectively, was 1.6 °C (Figure 4(a)). In the previous study (Sanches, 2015), in which the highest point was point 1 and the lowest point, point 15.
This fact can be explained due to the dynamics of the winds in the period of measurement of the rainy season, whose average speed was 0.81 m/s with east orientation. The wind from this orientation is laden with a mass of warm air, since the eastern portion of the city contains no forest reserves and has vast unused open areas. In addition, the region harbors the industrial sector of the city, and, in places close to the urban area, crops of agricultural production. For average air relative humidity, the difference between highest and lowest values was 4.9%, between points 1 and 3, with 46.0% and 50.9% respectively. Points 15 and 16 also marked high average humidity, with 50.3% and 50.6%, respectively, it can be seen in Figure 4(b). In the previous study (Sanches, 2015), relative humidity between extreme points was 15%, while for this research de difference found was 10%.
The maps of Figure 5 show, respectively, the conditions of air temperature (Figure 5a) and air relative humidity (Figure 5b) along Sinop. Both show points 1, 9 and 10 as points considerably hotter and with low humidity in the microclimatic scope, similar to what was demonstrated by Sanches (2015). On the other hand, point 2, in the western part of the city, was in a better condition in the case studied in 2015, and in this research was hotter and with significant decreased humidity. It is justified by the withdrawal of some trees present in the Tarumãs Avenue.
The natural reserves of Forest Park and UNEMAT campus work as air purifiers for the east wind flow.
Night period
The night period shows the real climatic conditions and inadequate formations of the climate as well (Liu et al., 2016; Sanches, 2015). In the rainy season, the difference of average air temperature was 0.8ºC, between points 1, with 26.1 ºC, and point 13, with 25.3 °C, against 1.8 °C in the previous study (SANCHES,

Candido, da Luz, Rossi and Sanches
Journal of Urban and Environmental Engineering (JUEE), v.14, n.1, p.98-109, 2020
103
Fig. 5 Distribution maps of (a) air temperature; and (b) relative humidity in the evening period.
Fig. 6 Variation of average (a) air temperature; and (b) relative humidity in the points of mobile transect in the night period of rainy season. 2015). That means that between the two studies there was no significant change on average amplitude. Figure 6(a) shows the graph for air temperature in the night period and the averages.
The difference of average relative air humidity was 6.4% between points 1 and 13, 78.3%, and 84.8% respectively, which shows the influence of Forest Park Reserve on increasing of air humidity and as cooling effect. Sanches (2015) found a similar difference on average relative air humidity of 7%.
In one of the measured days, the difference reached 9.1% between points 1 and 13, respectively. Figure 6(b) shows the variation of relative humidity in the night period for rainy season.
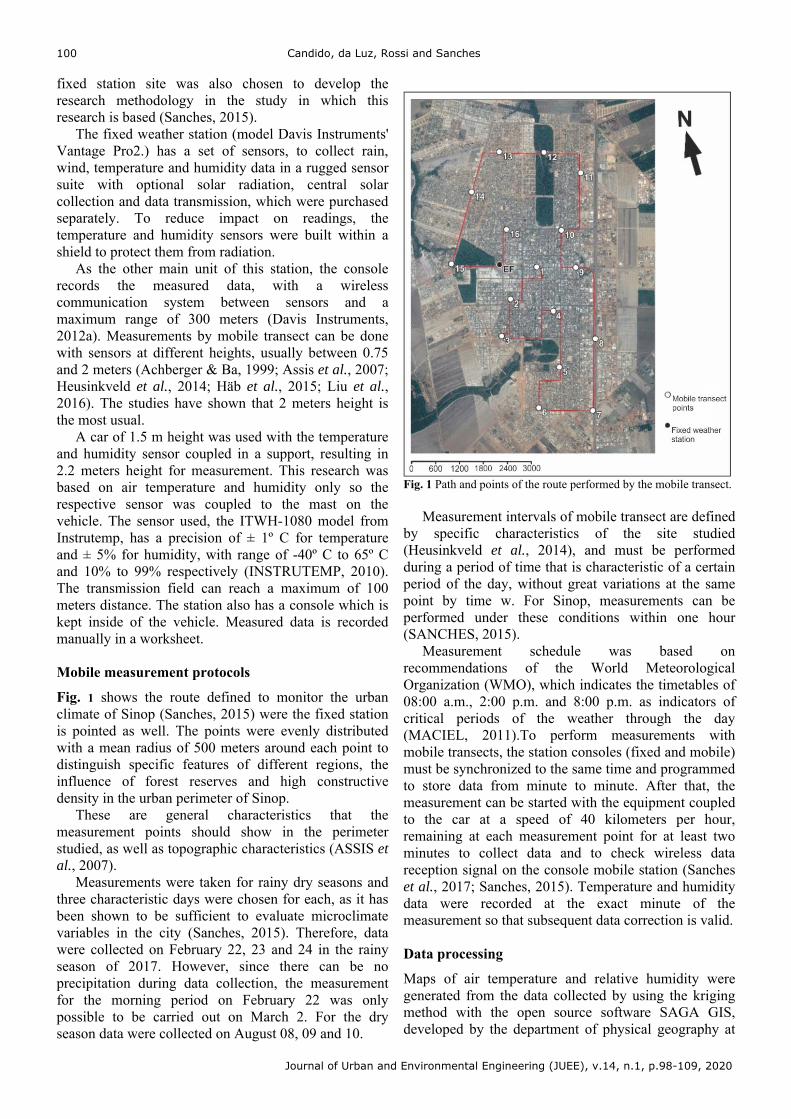
The distribution maps of air temperature (Figure 7a) and relative air (Figure 7b) humidity, show that the central area (points 1, 2, 3, 9 and 10) and the western region as the most affected microclimate in this period.
This happens due to the fact that these regions are of the ones with higher density and less permeability,
retaining, for example, solar radiation and, as a consequence, liberating long waves of heat, which takes longer to cool in the night. The cooler and more humid regions are mainly located between the reserves of Forest Park and UNEMAT Campus, which highlights the importance of vegetation in the microclimate behavior of cities. The predominant wind flow is on east-northeast direction, with an average speed of 0.20 m/s. Mobile transect in dry season
Morning period
During the dry season, the morning period showed the highest air temperature values at point 1, in the central region of the city, because of an area with few vegetation, high constructive density, few soil permeability and intense traffic of vehicles. The coldest point varied in the days of collecting data, and the average was point 10 as the coldest, which is under
Candido, da Luz, Rossi and Sanches
Journal of Urban and Environmental Engineering (JUEE), v.14, n.1, p.98-109, 2020
104
Fig. 7 Distribution maps of (a) air temperature; and (b) relative humidity in the night period.
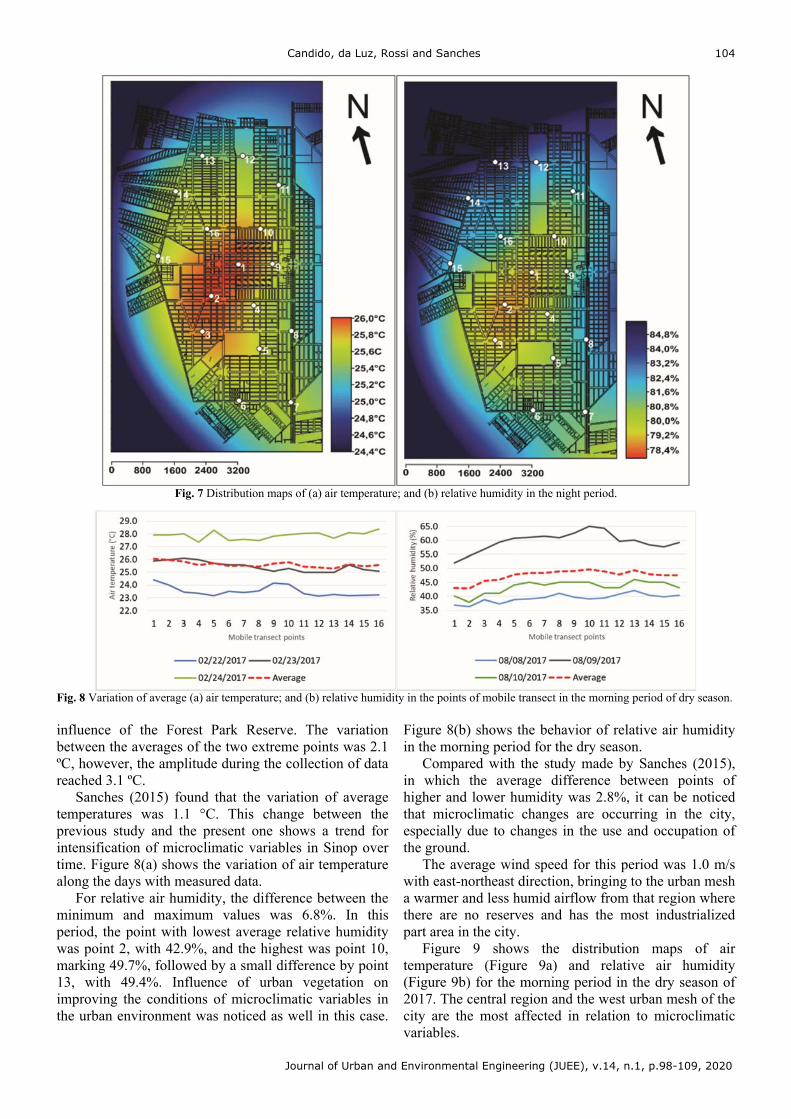
Fig. 8 Variation of average (a) air temperature; and (b) relative humidity in the points of mobile transect in the morning period of dry season. influence of the Forest Park Reserve. The variation between the averages of the two extreme points was 2.1 ºC, however, the amplitude during the collection of data reached 3.1 ºC.
Sanches (2015) found that the variation of average temperatures was 1.1 °C. This change between the previous study and the present one shows a trend for intensification of microclimatic variables in Sinop over time. Figure 8(a) shows the variation of air temperature along the days with measured data.
For relative air humidity, the difference between the minimum and maximum values was 6.8%. In this period, the point with lowest average relative humidity was point 2, with 42.9%, and the highest was point 10, marking 49.7%, followed by a small difference by point 13, with 49.4%. Influence of urban vegetation on improving the conditions of microclimatic variables in the urban environment was noticed as well in this case.
Figure 8(b) shows the behavior of relative air humidity in the morning period for the dry season.
Compared with the study made by Sanches (2015), in which the average difference between points of higher and lower humidity was 2.8%, it can be noticed that microclimatic changes are occurring in the city, especially due to changes in the use and occupation of the ground.
The average wind speed for this period was 1.0 m/s with east-northeast direction, bringing to the urban mesh a warmer and less humid airflow from that region where there are no reserves and has the most industrialized part area in the city.
Figure 9 shows the distribution maps of air temperature (Figure 9a) and relative air humidity (Figure 9b) for the morning period in the dry season of 2017. The central region and the west urban mesh of the city are the most affected in relation to microclimatic variables.

Candido, da Luz, Rossi and Sanches
Journal of Urban and Environmental Engineering (JUEE), v.14, n.1, p.98-109, 2020
105
Fig. 9 Distribution maps of (a) Air temperature; and (b) relative humidity in the morning period
Fig. 10 Variation of (a) air temperature; And (b) relative humidity in the points of mobile transect in the evening period of dry season.
Afternoon period
The afternoon period of the dry season showed a higher average temperature at point 1, marking 37.4 °C, and the lowest temperature point in this period was in point 4, with 36.2 °C, with a amplitude of 1.2 °C between them. The variation between the points in this period was small, and due to the fact that the last day of measurement of the dry season showed a different trend than expected, there was a variation on averages values, as it is shown on Figure 10(a). In comparison to the previous study (Sanches, 2015), which showed an amplitude of 1.2 °C, the points of higher and lower temperatures was 7 and 13 successively.
For the afternoon period in dry season, the CEPROTEC Reserve influenced the air temperature, and, as a result, a region on the southwest of the city was the milder in terms of temperature. However, averages had little variation, thus showing little change in the microclimate for that period. Relative humidity showed lower average relative humidity between points
8 and 9, with both marking 19.5%, and higher average values at the points under influence of CEPROTEC Reserve, as seen on points 4 and 5, and reserves of Unemat Campus and Forest Park, as seen on points 13, 14, 15 and 16. Average variations were small, marking 3.4% between extreme values.
The mean difference found by Sanches (2015) was slightly higher than in this research, 4.7%, between points 9 and 13, respectively, the lowest and highest average relative humidity for the period. Figure 10(b) shows how relative air humidity behaved on the days measured for the afternoon period of dry season.
The maps of Figure 11(a and b) show that the region along road BR-163 and the central area of the city are hotter and drier than other parts of the city. It can be noticed that urban vegetation influences microclimate, as the lower values of air temperature and higher values of relative humidity were verified on surroundings of the existing reserves in Sinop. Average wind speed was 0.40 m/s with East orientation for this period.

Candido, da Luz, Rossi and Sanches
Journal of Urban and Environmental Engineering (JUEE), v.14, n.1, p.98-109, 2020
106
Fig. 11 Distribution maps of (a) air temperature; and (b) relative humidity in the evening period.
Fig. 12 Variation of (a) air temperature; And (b) relative humidity in the points of mobile transect in the night period of the dry season.
Night Period
For the night period of dry season, point 2 showed the highest average air temperature, with 30.1°C, and point 13 the lowest average, with 27.8°C. The difference between these two points was 2.1 °C, in contrast to the amplitude of 1 °C found by Sanches (2015). In addition, higher and lower temperatures were found in different points, 6 and 7 for higher temperature and point 14 for lower temperature. However, in both studies the central area appeared to be the warmest, as well as the area along the BR-163, and that the areas favored by the presence of vegetation are cooler. Graph of Figure 12(a) shows how air temperature performed in dry season in Sinop at night.
For relative humidity, the average difference was 13.1%. Points 1 and 2 marked 35.3%, with the lowest average value recorded, and point 13 had the highest value, with 48.3%. Compared to the average variation
found by Sanches (2015), of 5.3%, between points 7 and 15, lowest and highest average relative humidity respectively, the variation increased significantly between the points. Again, places with higher relative humidity are under the influence of reserves of the Forest Park and UNEMAT. Figure 12(b) shows the performance of relative humidity for dry season in the night period.
Winds in the night period of dry season showed an average speed of 0.32 m/s, with predominant direction to Eastern side. Figure 13 shows the central area of the city along with the western portion and the perimeter along the BR-163 as being more impaired compared to microclimatic variables due to lack of vegetation, higher traffic of vehicles and by the greater constructive density.

Candido, da Luz, Rossi and Sanches
Journal of Urban and Environmental Engineering (JUEE), v.14, n.1, p.98-109, 2020
107
Fig. 13 Distribution map of (a) air temperature; and (b) relative humidity in the night period.
Fig. 14 (a) Map of microclimate change in the two periods studied, data from 2013/2014 (Sanches, 2015). (b) Map of microclimate change in
the two periods studied, data for 2017.
DISCUSSION
A map with the most significant microclimate changes was generated, divided by the main areas, to compare the most affected regions of the city between the first study made in 2013 and 2014 with new data from 2017.
Figure 14(a) shows the results from Sanches (2015 compared to microclimate changes evaluated in 2017, as shown in Figure 14(b), in the city of Sinop.
In this context, changes occurred between the two studies are significant and are consistent with changes in land use and occupation. The presence of a dry and hot
region in the central, southwestern and western portions of the city is noticeable, both in the rainy and in the dry seasons. The results differ from the ones obtained by Sanches (2015), which showed that the urban network was predominantly affected during the rainy season.
In 2015, there was a big change in the conformation of Tarumãs Avenue, which previously had a large amount of arboreal vegetation, along its extension, now displays little undergrowth vegetation after urban interventions. A parking system was added on the edges of the avenue, leading to an increase on traffic of

Candido, da Luz, Rossi and Sanches
Journal of Urban and Environmental Engineering (JUEE), v.14, n.1, p.98-109, 2020
108
vehicles and on the number of commercial establishments. Another aggravating factor is that the permeability index has decreased in the avenue by the replacement of the open channel of water flow for the paved parking.
However, milder situations around points 8 and 9 were noticed due to landscape interventions at the Gigante do Norte Stadium (Point 8) and at Bíblia Square (Point 9). There was a concern with the insertion of urban vegetation, not only arboreal, but also on the ground, with grass planting. It was implanted a source of water in Bíblia Square, which influences the cooling and humidification of that area. In the central region of the city, along with Mognos Avenue, there was a decrease in the vehicular flow due to implantation of parking on both sides of the road, making it slower and with only one track, which is avoided by users.
Microclimate changes were more significant in the dry period, reaching an average of 2.3 °C between sites under the influence of the forest reserves and areas with low soil permeability and high constructive density. In the rainy season the difference was 0.8 ºC. Relative humidity had a similar behavior to air temperature in the rainy season, marking an average difference between the extreme values of 6.4%, while in the dry season it reached 13.1%.
Data have shown the influence of vegetation for cooling and the increase of humidity mainly during the dry season, in which the relative humidity can reach values close to 35% in areas with little or no vegetation.
CONCLUSION
The research showed to be effective in monitoring the microclimatic variables of temperature and relative humidity in Sinop, Brazil. Urban climate in regions that was most affected were the ones with changes in the use and occupation of the ground and with differences in the dynamics of the city.
In recent years, changes in landscaping in some areas of the city, reduction of vehicle traffic and maintenance of large vegetated areas have contributed significantly to the mitigation of undesirable climate change effects. On the other hand, the suppression of tree vegetation in the roads, excessive waterproofing of the ground and the increase of vehicular traffic contributed decisively to the formation of climatically compromised areas in Sinop, Brazil.
More specific studies are needed to better understand the behavior of wind flow and the influence of urban geometry on formation of areas compromised in the context of urban microclimates. REFERENCES
Achberger, C.; BA, L. Correction of surface air temperature measurements from a mobile platform. v. 99, p. 227–238, 1999.
Akbari, H.; Kolokotsa, D. Three decades of urban heat islands and mitigation technologies. Energy & Buildings, v. 133, p. 834–842, 2016.
Ali, J. M.; Marsh, S. H.; Smith, M. J. A comparison between London and Baghdad surface urban heat islands and possible engineering mitigation solutions. Sustainable Cities and Society, v. 29, p. 159–168, 2017.
Assis, E. S.; Ramos, J. G. L.; Souza, R. V. G.; Cornacchia, G. M. M. Aplicação de dados do clima urbano no desenvolvimento de planos diretores de cidades mineiras. In: Encac/Elacac. p. 152–161, 2007.
ASSIS, E. S.; RAMOS, J. G. L.; SOUZA, R. V. G.; CORNACCHIA, G. M. M. Aplicação de dados do clima urbano no desenvolvimento de planos diretores de cidades mineiras. In: Encac/Elacac. p. 152–161, 2007.
Bonafoni, S.; Baldinelli, G.; VERDUCCI, P. Sustainable strategies for smart cities : Analysis of the town development effect on surface urban heat island through remote sensing methodologies. Sustainable Cities and Society, v. 29, p. 211–218, 2017.
Callejas, I. J. A; Nogueira, M. C. J A; Biudes, M. S; Durante, L. C. Variação sazonal do balanço de energia em cidade. Mercator, v. 15, p. 85–106, 2016.
Castro, E.; Lopes, A. O Conforto Térmico Urbano e a sua Perceção na Cidade da Guarda: contributos para o estudo dos riscos climáticos. In: Anthropic and mixed natural risks: Tribute to Professor Fernando Rebelo. Coimbra, Portugal. Grography department, College of Letters, 2013.
DAVIS INSTRUMENTS. Vantage Pro2 Console Manual. Davis Instruments Corp., 2012a. Available on:// Http://www.davisnet.com/product_documents/weather/manuals/07395-234_IM_06312.pdf//. Acessed: May 08, 2017.
Drach, P. R. C.; Barbosa, G. S.; Corbella, O. D.; Silva, M. A. P. Dinâmica da temperatura intra-urbana : ilha do fundão, Rio de Janeiro, Brasil dynamics of intra- urban temperature : fundão island, Rio de Janeiro , Brazil. Energías Renovables y Medio Ambiente, v. 37, p. 1–9, 2016.
Duarte, D. H. S.; Shinzato, P.; Gusson, C. S.; Alves, C. A. The impact of vegetation on urban microclimate to counterbalance built density in a subtropical changing climate. Urban Climate, v. 14, p. 224–239, 2015.
Gomes, P.; Gomes, P. S.; Lamberts, R. O estudo do clima urbano e legislação urbanística: considerações a partir do caso Montes Claros – MG. Ambiente Construído, v. 9, n. 1, p. 73–91, 2009.
Häb, K.; Ruddell, B. L.; Middel, A. Sensor lag correction for mobile urban microclimate measurements. Urban Climate, v. 14, p. 622–635, 2015.
Heusinkveld, G. J.; Steeneveld, G. J.; Van Hove, L. W. A.; Jacobs, C. M. J.; Holtslag, A. A. M. Spatial variability of the Rotterdam urban heat island as influenced by urban land use. Journal of Geophysical Research: Atmospheres, p. 677–692, 2014.
IPCC, 2014. Climate Change 2014–Impacts, Adaptation and Vulnerability: Regional Aspects. Cambridge University Press, Cambridge, United Kingdom and New York, NY, USA.
IBGE. Brazilian Institute of Geography and Statistics (2016). Avaliable on: // http://cidades.ibge.gov.br/xtras/perfil.php?codmun=510790// Acessed: May 01, 2017.
INSTRUTEMP. Manual de Instruções: Estação meteorológica com display touch screen ITWH-1080, 2010. Avaliable on: //http://instrutemp.provisorio.ws/2010_09/ITWH-1080.pdf// Acessed: March 02, 2017.
Liu, L.; Liu, J.; Lin, Y. Spatial-Temporal Analysis of the Urban Heat Island of a Subtropical City by Using Mobile Measurement. Procedia Engineering, v. 169, p. 55–63, 2016.
Maciel, C. R. Análise da relação entre características do ambiente urbano e comportamento de variáveis microclimáticas: estudo de caso em Cuiabá-MT. 141f. Thesis (Master in Environmental Physics), Physics Institute, Federal University of Mato Grosso, Cuiabá, 2011.

Candido, da Luz, Rossi and Sanches
Journal of Urban and Environmental Engineering (JUEE), v.14, n.1, p.98-109, 2020
109
Maitelli, G. T. Interações atmosfera-superfície. In: MORENO, G; HIGA, T. C. S. (Org.). Geografia de Mato Grosso: Território, sociedade, ambiente. Cuiabá: Entrelinhas, 2005. cap. 13, p. 238-249.
Marić, I.; Pucar, M.; Kovačević, B. Reducing the impact of climate change by applying information technologies and measures for improving energy efficiency in urban planning. Energy and Buildings, v. 115, p. 102–111, 2016.
Monteiro, C. A. F. (1976) Teoria e clima urbano. Thesis (Livre Docência in Geography), Philosophy College, Letters and Human Science, São Paulo University, São Paulo.
Oliveira, A. S.; Santos, F. M. M.; Nogueira, M. C. J. A.; Durante, L. C.; Nince, P. C. C. Análise da variação de temperatura e umidade em função das características de ocupação do solo em Cuiabá-MT. Engenhaira Ambiental - Espírito Santo do Pinhal, v. 6, n. 1, p. 240–251, 2009.
Roth, M. Review of urban climate research in (sub) tropical regions. International Journal of Climatology, v. 27, p. 1859–1873, 2007.
Sanches, J. C. M. Uma metodologia para a inserção do clima como critério para o planejamento urbano: análise da cidade de Sinop-
MT. 2015. Thesis (Phd in urban planning) – Federal University of Rio de Janeiro, Rio de Janeiro.
Sanches, J. C. M.; Candido, C. R.; Ohira, S. Clima urbano como critério de planejamento de assentamentos de habitações de interese social : o caso de Sinop-MT, na Amazônia Legal brasileira. 4º CIHEL – Congresso Internacional da Habitação no Espaço Lusófono, 2017.
Shi, Y.; Lau, K. K-L.; Ren, C.; NG, E. Evaluating the local climate zone classification in high-density heterogeneous urban environment using mobile measurement. Urban Climate, v. 25, p. 167-186, 2018.
Souza, N. S.; Gaio, D. C.; Santos, F. M. M.; Nogueira, J. S.; Nogueira, M. C. J. A. Análise do comportamento do campo térmico da avenida principal do campus da UFMT após intervenções urbanas. InterEspaço, v. 2, n.7, p. 129-143, 2016.
UNDP. Human Development Report 2013. Available on:// http://www.pnud.org.br/arquivos/rdh-2013-resumo.pdf//. Acessed: May 10, 2017.
Copyright © 2022 FDOKUMEN