Microclimatic analysis of historic buildings: a new methodology for temperate climates

lable at ScienceDirect
Building and Environment 45 (2010) 94–106
Contents lists avai
Building and Environment
journal homepage: www.elsevier .com/locate /bui ldenv
Energy and microclimatic performance of restored hypogeous buildingsin south Italy: The ‘‘Sassi’’ district of Matera
Nicola Cardinale a,*, Gianluca Rospi b, Alessandro Stazi b
a Department of Engineering and Environmental Physics, University of Basilicata, Via Lazazzera, 75100 Matera, Italyb Department of Architecture, Constructions and Structures, Polytechnic University of Marche, Via Brecce Bianche, 60131 Ancona, Italy
a r t i c l e i n f o
Article history:Received 10 February 2009Received in revised form30 April 2009Accepted 16 May 2009
Keywords:HypogeaMediterranean architectureRestorationComfort indicesDynamic energy simulation
* Corresponding author. Tel.: þ39 08351971460.E-mail address: [email protected] (N. Card
0360-1323/$ – see front matter � 2009 Elsevier Ltd.doi:10.1016/j.buildenv.2009.05.017
a b s t r a c t
The site of the ‘‘Sassi of Matera’’ classified by the United Nations Educational, Scientific and CulturalOrganization (UNESCO) as World Heritage in 1993, is an exceptional example of traditional bioclimaticMediterranean architecture. Within this immense artistic heritage, we find hypogea habitations, stonebuildings, and mixed habitation – half-hypogeum and half-built. In this study, we analyze the energy andmicroclimatic performance of hypogeous structures in three states: not-restored, immediately afterrestoration, and a few years after restoration (in normal use). We monitored a surface hypogeum anda deep hypogeum. We performed a dynamic parametric simulation using the software EnergyPlus toquantify the energetic balance of the hypogeous structures during one calendar year. The energeticvaluation of the surface hypogea shows that these environments, once restored and in a condition ofnormal use, give indoor comfort within the limits of comfort thermo-hygrometrics established by thecomfort indices of predicted mean vote (PMV) and predicted percentage of dissatisfied (PPD). The hugethermal mass of the walls ensures that the microclimate indoor conditions are regular throughout theseasons, without differences in the daily thermal oscillation. Deep hypogea without an air change systemcannot reach thermal-hygrometric comfort values. We determined that these structures have a nullthermal balance during mid-season, while in the summer the floor loses heat, thereby cooling theenvironment. The opposite occurs in winter. We can conclude that these buildings were designed asbioclimatic. In fact they can be used, after restoration, with limited use of technology systems.
� 2009 Elsevier Ltd. All rights reserved.
1. Introduction
The stone used in architecture has produced numerous complexand highly heterogeneous applications: from buildings dug intorock to built-up structures.
In the Mediterranean area stone architecture and, in particular insouthern Italy, the built-up structures were conceived as a naturalcontinuation of the dug structures, reaching their own formal andtypological autonomy, thereby realizing the basic constructive cellcalled ‘‘lamia’’ or ‘‘lamione’’. This process has overseen the birth anddevelopment of ancient districts called ‘‘Sassi of Matera’’. In these,the relationship between dug and built structures reached itshighest expression and morphological formalization [1].
For several years, studies involving the analysis of the indoormicroclimate of these complex structures were conducted. Inparticular, in Ref. [2], experimental measurements were carried outon the properties of materials (thermal conductivity and humidity
inale).
All rights reserved.
of the walls) in an unrestored hypogeum. In Ref. [3], the authorsanalyzed microclimatic parameters in the crypt of a rock church inorder to recover and conserve mural paintings. In Ref. [4], attentionwas focused on the behaviour of masonry in calcareous tufa asnatural microclimate thermo-regulators. In Refs. [5,6], some initialassessments were carried out on the behaviour of heat-humidityhypogeum of the ‘‘Sassi’’ of Matera in not-restored and restoredconfigurations. Moreover, the results of energy analyses withsimplified methods (method 5000 and others) are given in Refs.[7,8] for bioclimatic buildings in Mediterranean lands.
In this paper, we describe the results of the prosecution of theprevious studies and quantify, by using a dynamic analysis method[9], the energy behaviour of hypogeum structures not-restored,immediately after restoration, and a few years after restoration(called ‘‘in normal use’’).
2. The hypogeum structure of the ‘‘Sassi of Matera’’
The site of the ‘‘Sassi of Matera’’ (Fig. 1), classified by the UnitedNations Educational, Scientific and Cultural Organization (UNESCO)as World Heritage in 1993, is an exceptional example of traditional

Fig. 1. Site of ‘‘Sassi di Matera’’.
N. Cardinale et al. / Building and Environment 45 (2010) 94–106 95
Mediterranean architecture, with its various building forms andmany bioclimatic systems.
This site is located in Basilicata in southern Italy and is charac-terized as having a Mediterranean climate, with hot dry summersand temperate and humid winters.
The average seasonal temperature is 4 �C in winter and 32 �C insummer, which often has high values close to 40 �C. Moreoverwinter is mild with rare frosts. Rains are mostly concentrated inautumn and winter.
The coordinates of the site are 40� 390 5000 N, 16� 360 3700 E, andthe altitude is 401 m above sea level.
Within this immense artistic heritage, we find hypogeoushabitations, stone buildings, and mixed habitation, half-hypogeumand half-built. The variety of technological solutions and biocli-matic characteristics makes this ecosystem unique in Europe andvery rare in the world.
The hypogeum structure, dug inside sandstone banks up toa depth ranging from 6 to 15 m, is arranged in a horseshoe arounda central atrium, called the ‘‘neighbourhood’’ (Fig. 2). They are oftenexposed to the south. Central caves, like the fingers of the hand, arelonger because they receive more solar radiation and extendfurther into the rock. In summer, when the sun is higher, theinternal areas remain cooler [1].
The floors of the rooms are placed on a ‘‘vespai’’ (loose stonefoundation) made with the waste of the stonework (tufa). In thisway there exists an air space that insulates the floor from themoisture of the soil [10].
The formation of hypogeous buildings was spontaneous andnatural, creating a complex set of terraced rooms where often theroof of a hypogeum is the access street of the upper hypogeum.
A complex system of canals collects water from the street andfrom the roofs and directs it into small tanks placed under thehouse, or in larger tanks in the heart of the ‘‘neighbourhood’’, to beused during droughts.
3. Analysis methodology
Our experimental approach to the energy analysis of hypogeousstructures can be summarized as follows:
(1) monitoring of thermo-hygrometer parameters [11];(2) calculation of indoor comfort [12,13]; and(3) parametric dynamic simulation using EnergyPlus software [9].
Experiments were performed on different structures which arepart of a single complex, partly restored and redeveloped (Hotel S.Angelo), located in the centre of the ‘‘Sasso Caveoso’’ (Fig. 3). Wemonitored a surface hypogeum (civic 45) and a deep hypogeum(civic 47). The choice of typologies was dictated by the need tocompare environments before restoration, immediately afterrestoration, and a few years after restoration (in normal use).
The monitored surface hypogeous house has a depth of pene-tration in a tufaceous bank of about 8.00 m and an average width ofabout 4.00 m. It consists of a single space used as a room of a hotel,plus a small bathroom of about 5.00 m2. This typology is the mostdeveloped within the site and is characterized by having only oneside of the room in direct contact with the outside. On the outerwall we find the front door and small windows of various sizesaccording to the form and size of the space, usually located on thetop of the front door, commonly called sopraluce. The deep hypo-geous building differs from the surface hypogeum only in the depthof penetration in the tufa bank. These structures were dug into thebank for distances of more than 15 m, and are often composed ofthe aggregation of one or more rooms. The deep side of thehypogeum was used as a tank for water recovery or as cellar to storefood. The monitored deep hypogeum has a depth of penetration ofabout 20.00 m and an average width of about 6.00 m. It is madefrom the aggregation of three rooms of different sizes, and is usedas an art gallery. This type, like the surface hypogea, is characterizedas having only one side of the room in direct contact with theoutside, where we find the front door and the sopraluce. Even ifthese structures are typologically different, they have similararchitectural features and forms (for example, all three are orientedin the same way and use tufa as the fundamental building material).
The first phase of our study, environmental monitoring, wascarried out through various measurement campaigns conductedcontinuously over a period of eight days. We measured indoor andoutdoor parameters (dry-bulb and wet-bulb temperatures, dew-point temperature, relative humidity, mean radiant temperature,and air velocity) and environmental parameters (temperature andrelative humidity of the air, and global solar radiation on thehorizontal plane) [11]. At this stage, we monitored unrestoredhypogea (structures in a state of total neglect for several years),restored structures (structures that have been recovered but werenot inhabited), and structures in normal use (restored residentialstructures inhabited for several years).
The second phase, evaluation of indoor comfort, was performedby calculating the comfort indices described in Refs. [12,13]. Thesecan be calculated using a mathematical function of the energybalance of the human body. The input variables are both objectiveparameters (temperature, humidity, and air velocity in the rooms)and personal parameters (physical activity performed and clothes

Fig. 2. Structure of the site ‘‘Sassi of Matera’’.
N. Cardinale et al. / Building and Environment 45 (2010) 94–10696
worn). Using the energy balance equation, we can assess whetherthe individual in a confined space would be comfortable withrespect to temperature. This is accomplished with the calculation ofappropriate indices, called comfort indices, which are functions ofthe following independent variables: temperature, humidity, airvelocity, metabolism, and thermal resistance of clothing.
The indices of comfort calculated are the predicted mean vote(PMV) and predicted percentage of dissatisfied (PPD) [12,13].
In our third and last phase, dynamic simulation, we madea series of parametric analyses on the structures of hypogea ‘‘Sassiof Matera’’. The tests were performed using the dynamic simulationsoftware EnergyPlus [9]. Our goal was to validate the software onhypogea, and quantify and analyze the hypogeum plant in variousconfigurations over a period of one year. The software validationwas made by comparing the results of monitoring campaigns withthe values obtained from dynamic simulations. To compare theresults, a time was chosen for which the thermo-physical param-eters of the environment (temperature, relative humidity, and solarradiation) input into the software had a trend similar to thatmeasured in situ at the outside climatic station. In this way,a comparison was made with almost identical boundary conditions,reducing any possible errors in estimation and evaluation. Thisallowed us to set all the input parameters of the software (rooms,
Fig. 3. Maps of mo
materials, and systems) to achieve output parameters similar toreal measured conditions. Once set, different parametric analyses(with open windows, closed windows, heating on or off, and so on)were conducted.
Through a dynamic analysis for a one-year period, we simulatedthese parameters: the internal temperatures (dry-bulb and wet-bulb temperatures, dew-point temperature, and mean radianttemperature) against the outdoor air temperature, the trend of thePMV and PPD comfort indices, and the room heat balance betweeninputs and losses.
4. Microclimate of the hypogeous rooms of the‘‘Sassi of Matera’’
Monitoring was performed from April, 2007 through August,2007. It was divided into two distinct periods: the first runningfrom 15/April/2007 to 01/June/2007, representative of the inter-mediate season, and the second running from 15/June/2007 to 05/August/2007, characteristic of the summer season. The choice ofthese periods was influenced by the goal of understanding thebehaviour of these structures in relation to high summer temper-atures (15/June/2007 to 05/August/2007) and to high dailytemperature ranges (15/April/2007 to 01/June/2007). These periods
nitored rooms.

N. Cardinale et al. / Building and Environment 45 (2010) 94–106 97
are characterized by a progressive increase in average dailytemperatures, which is useful for understanding how the structureschange their ecosystem during the transition from winter tosummer.
In the Mediterranean area, we consume more energy duringsummer than during the winter season; therefore, energy recoveryof buildings is mainly directed to improve the rooms passivecooling. In addition, the increasing concentration of CO2 contrib-uted to the greenhouse effect in the last years, causing a rising ofthe environmental temperature. In this way summer thermal loadsalways become more important in the yearly thermal balance ofbuildings.
The first evaluation was conducted to compare the evolution oftemperature, relative humidity, and indoor air speed with standardparameters required by the current legislation [11], which includesthe following performance indicators:
– room air temperature between 18 �C and 26 �C;– relative humidity between 40% and 60%;– absolute speed of the room air between 0 m/s and 0.5 m/s;– minimum air change rate for air leakage: 0.5 (1/h).
The parameters were also compared with the fluctuation of theexternal microclimate to understand the response of the structuresto changes in weather. This comparison was done on the previouslydescribed building typologies (surface hypogeum and deep hypo-geum) in three different conditions of use: not-restored, restored,and normal use.
4.1. Surface and deep hypogea in not-restored configuration
Measurements were made on these rooms in April and July of2007, and were integrated with data from old monitoringcampaigns during 2002–2003 [2,3]. The most important result wasa steady trend of indoor microclimate conditions during thecampaign of measurements. In particular, the internal tempera-tures had a steady trend throughout the monitoring period, withvalues of 12–14 �C for surface hypogea and 10–12 �C for deephypogea in mid-season, and 14–16 �C for surface hypogea and12–14 �C for deep hypogea in the summer. The result showedindoor temperatures considerably lower than the average dailyoutdoor temperatures. Even the vapour pressure showed a steadytrend, with very high values throughout the monitoring period:pv¼ 12,740 hPa (mean of the vapour pressure calculated at 12 �Cand 14 �C) in mid-season and pv¼ 14,502 hPa (mean of the vapourpressure calculated at 14 �C and 16 �C) in summer for surfacehypogea; as in deep hypogea pv¼ 12,482 hPa (mean of the vapourpressure calculated at 10 �C and 12 �C) in mid-season andpv¼ 14,238 hPa (mean of the vapour pressure calculated at 12 �Cand 14 �C) in summer. As seen from the charts, these rooms havehigh water vapour content, facilitated by a total absence of internalair motion. This is one of the main causes of the formation ofmildew and bacterium on the surfaces of the building, aided byconstant water absorption due to the high humidity in the airimmediately in contact with the wall.
Indeed, these areas in the past were tanks of recovered rain-water and were often made with waterproof material called‘‘cocciopesto’’ (waterproof plastering made with small pieces ofcrock mixed with lime), which encouraged condensation.
4.2. Surface and deep hypogea in restored configuration
The monitoring carried out on these buildings was continuousfor a period of ten days per season (April–May, 2007 and July–August, 2007). They were the first measurements ever done on this
type of architecture. The results obtained by the measurementcampaign are summarized as follows.
– Constant trend of room temperature, often coinciding with theminimal external temperature recorded in the period ofmonitoring (15–16 �C period from April to June, and 18 �Cperiod from June to August).
– Values of vapour pressure: pv¼ 11,802 hPa–pv¼ 11,922 hPa forsurface hypogea and pv¼ 13,625 hPa–pv¼ 14,526 hPa for deephypogea.
– Minimum values of air velocity when the difference betweenindoor and outdoor temperatures is above 10 �C for the surfacehypogeum structure, and total lack of air motion in the deepestpart of the room for deep hypogeum.
These values are described in the charts in Fig. 4.The first interesting result obtained from this analysis was to
find in the surface hypogeum a significant decrease of indoorrelative humidity after recovery interventions. In the restoredconfiguration values of indoor temperatures are greater reducingthe indoor relative humidity from 95% to 65%.
In contrast, in the deep hypogeum, even after the restoration,the vapour pressure maintained at high levels establishes a relativehumidity with values of about 80%. This is caused by still air insidethe hypogeum. The dense and saturated still air contributes toincreased water vapour content inside. This phenomenon tends todecrease near the entrance of the sopraluce which when openedencourages a constant minimal air supply zone next to theentrance. In measurements made near the entrance, values ofrelative humidity of about 70% were detected, ten points less thanthe deepest zone of the hypogeum. These values, even if lowcompared to the deepest areas, are high compared to normalcomfort conditions.
We are able to say with certainty that the largest share ofmoisture on the wall surfaces is caused by the continued strongabsorption of relative humidity contained in the air in contact withthe walls, and only in small part by the migration water present inthe rock. It follows that in such rooms the moisture due to thecapillary rise of water in the rock walls is almost absent. The mainintervention for restoration of these buildings must be that ofindoor microclimate control.
Another interesting result was to find a steady trend of indoortemperatures with very low values with respect to the externaltemperatures, creating a thermal gradient between the inside andoutside that exceeded 10 �C for a few hours during the summerseason.
The latest results obtained from these tests were the assessmentof the sopraluce on internal microclimate conditions. In fact, ithelped to lower the relative humidity in the entrance through thecreation of a constant air supply during the day (about 0.5 1/h).
4.3. Surface and deep hypogea in normal use condition
Even for this configuration, monitoring campaigns have beenconducted continuously for a period of ten days per season (April–May, 2007 and July–August, 2007) and were the first measure-ments ever done on this type of architecture. The measurementsperformed on structures in this configuration complete theresearch started in 2005 and helped us to make a series ofconsiderations about the restoration and final microclimaticbehaviour of these structures. Moreover, it was possible to verifycompliance with minimum standards of comfort described bycurrent standards [11]. We conclude that these structures maintaintheir internal conditions at a relatively good level of comfort. Themain results can be summarized as follows.

Fig. 4. Physical parameters values in surface hypogeum and deep hypogeum.
N. Cardinale et al. / Building and Environment 45 (2010) 94–10698
(1) The temperatures of indoor rooms (see Fig. 5) remainedconstant during the measurements, reaching values of 18 �C inApril and May and 21 �C in July and August for surface hypogea.Regarding the deep hypogea, the values measured were lessthan 1 �C compared to surface hypogea (17 �C in April–May and20 �C in July–August). These results were achieved against dailyhigh temperature ranges that on certain days exceeded 20 �C,with summer maximum temperatures exceeding 38 �C.
We can state that the indoor air temperature of these structuresfully complies with the minimum temperature for comfort inconfined rooms. Another interesting result concerns the largethermal gradient created between internal and external spaces.The low indoor temperatures (20–21 �C) with respect to highsummer air temperatures (40 �C) suggest that these structuresneed to be heated slightly to avoid a large thermal indoor/outdoorgradient.
(2) The vapour pressure values (calculated as a function of thetemperature difference) are: pv¼ 13,394 hPa at 18 �C withrelative humidity 65% and pv¼ 14,894 hPa at 21 �C with
relative humidity 60%. It was found that the tendency of surfacehypogea indoor relative humidity is to be constant, with valuesaround 60–65% (comfort limit).
In deep hypogeum the vapour pressure values (calculated asa function of the temperature difference) are: pv¼ 15,478 hPa at17 �C with relative humidity 80% and pv¼ 18,672 hPa at 20 �C withrelative humidity 80%.
This is caused by poor ventilation of these rooms, a result of thegeometric shape of the structures. They have only one side whereopenings are arranged: the front door and the sopraluce. Thiscauses stagnation of air and humidity. There are two differentmethodologies to resolve this problem.
4.3.1. Natural methodA natural method is to open, if possible, the sopraluce during the
day in winter and mid-season, and always in summer (Fig. 6). Thisoperation encourages natural ventilation, allowing an effectiveindoor air change rate of 0.5–1 1/h. This element acts as a sponta-neous expulsion duct for indoor air and contributes to increase theindoor temperature and lower the relative humidity of surface

Fig. 5. Temperature values in hypogea in the intermediate and summer season.
N. Cardinale et al. / Building and Environment 45 (2010) 94–106 99
hypogeous structures, bringing the temperature value from 18 �C to21 �C with relative humidity 55%. In deep hypogeous structures, thesopraluce contributes only to increasing the indoor temperatureand to lowering the relative humidity of the zone next to theentrance, bringing the temperature value from 17 �C to 20 �C withrelative humidity 70% – still far from comfort conditions. Finally,the opening of the sopraluce in the hypogeum can slightly raise thetemperature in the summer to values of 23–24 �C, thereby reducingthe high indoor/outdoor thermal gradient.
4.3.2. Artificial methodAn artificial method is to activate an indoor mechanical air
change (Fig. 7). Considering that the assessments were madeduring mid-season and summer, we considered it appropriate toswitch off the air conditioning system during the measurements, asthe indoor temperature fell within the comfort limits. Therefore,attention has been focused on the room air recirculation system,called UTA.
The UTA is a simple machine that pulls in outdoor air, filters it,and pushes it into rooms. Specifically, the machine pulls air from an
adjacent hypogeum room that has the sopraluce always openduring the day. In this way, the air is naturally precooled from thegreat thermal mass of the hypogeum, and the precooling iscompleted in underground ducts through which the air travelsbefore returning back into the room. The air thereby loses much ofits heat, so it returns to a temperature of 26–27 �C.
The benefits obtained with the artificial method were an indoortemperature increase of the same temperature grade (�C) anda lower relative humidity. In fact, the measurements made in thehypogeum with the air recirculation plant on and working with anair change rate of 1 1/h produced a slight increase in the indoortemperature of 2–3 �C, and a constant decrease in relative humidityof up to 50%. It reached values of 22–26 �C, further reducing thethermal gradient during hot summer hours.
As for the deep hypogeum, as we have seen, with the air changesystem shut down, microclimatic conditions do not reach thecurrent standard of comfort. Indeed, we found high concentrationsof water vapour content and very large temperature rangesbetween the inside and outside (above 10 �C) that can causeillnesses and physical disturbance.

Fig. 6. Relative humidity value in hypogea with natural air change on and off.
N. Cardinale et al. / Building and Environment 45 (2010) 94–106100
In contrast, the deep hypogea with air change rate systemsturned on are within the limits of comfort required by the currentlegislation. Indeed, by setting the air recirculation at a value of 1.5 1/h,the vapour pressure values dropped by about 15%, reaching a valueof pv¼ 18,672 hPa at 20 �C with relative humidity 65%, which is stillslightly high. With a value of 3 1/h, the indoor air temperaturereaches constant values of 20 �C during the period from April toJune, and 22 �C during the period from June to August, therebyreducing the thermal difference between external and internalspaces.
In this way the temperature increase reduces the relativehumidity around 55% returning fully to the limits of hygrometriccomfort.
5. The comfort of the surface hypogeum and deep hypogeum
The valuation of indoor comfort was implemented by calcu-lating the indices of comfort only in the restored and normal use
Fig. 7. Relative humidity value in hypogea with
configurations, leaving out the comfort index calculation in theother two configurations (not-restored and restored). In fact, theresults of the microclimatic measurements showed that the not-restored and restored configurations were already out of the limitsof comfort, for which a comfort index calculation would returnindices outside the comfort range for thermo-hygrometer wellness[12,13].
The calculation of comfort indices on the hypogeum structuresreturned the following results.
– In the mid-season (spring and autumn), considering a clothingresistance at 0.8 clo (resistance of average clothing for theseason considered) and a metabolic activity at 1.2 met (restactivity) [14], an individual who is in these rooms is underthermal-hygrometric comfort conditions.
– In summer, but considering a clothing resistance at 0.6 clo(resistance of average clothing for the season considered) anda metabolic activity at 1.2 met (rest activity) [14], an individual
air mechanical change system on and off.

Fig. 8. Comfort index: sopraluce close (left) and open (right).
N. Cardinale et al. / Building and Environment 45 (2010) 94–106 101
who is in these rooms is under thermal-hygrometric comfortconditions.
– These values were deduced considering an air change of 0.5 1/hobtained in a natural way by opening the sopraluce andwithout a fan system. In contrast, not considering the airchange, these rooms are in thermal comfort but they are not inhygrometric comfort, as the indoor relative humidity reachedvalues above 60% for a few hours of the day.
The graphs in Fig. 8 refer to two different situations: thesopraluce closed and open.
The deep hypogea comfort index calculation allows thefollowing considerations. These structures with the air changesystem off cannot reach the level of thermo-hygrometric comfort.In fact, taking a clothing resistance at 0.8 clo for the mid-season,a clothing resistance at 0.6 clo for the summer season, anda metabolic activity at 1.2 met (rest activity), an individual who isfound in these rooms has a cold feeling. However, rooms with theair change system reached the thermo-hygrometric comfort level.
Fig. 9 refers to two different situations: air change system on,and air change system off.
An interesting result reached from the comfort index calculationwas to verify that the surface and deep hypogea without air change,natural and/or mechanical, do not fall within the limits of thermo-hygrometric comfort established by the indices. In fact, especiallyfor deep hypogea, the results of the calculations of comfort indicesfor the mid-season and summer season were negative since anindividual in these rooms would have a cold feeling.
Another interesting result was to understand what uses aremost appropriate for these buildings after restoration. Indeed, itappeared that surface hypogea are best suited for hotels, schools,and offices; i.e., activities for which the basal metabolic rate hasvalues between 0, 8-1, and 2 met. Deep hypogea are best suited foractivities in which the basal metabolic rate has values above1.6 met. This corresponds to light activity, for example craft shopsor museums. On the other hand, in these buildings it is possible todo activities involving a lower basal metabolic rate by simplyincreasing the cloth resistance (1, 2-1, 4 clo). These considerations

Fig. 9. Comfort index: system off (left) and system on (right).
N. Cardinale et al. / Building and Environment 45 (2010) 94–106102
are essential in recovery operations to prevent subsequent effectsof structural deterioration due to inappropriate uses, and thermaldiscomfort for future users.
6. Dynamic energy analysis
The validation of the software on such hypogeous structureswas realized, considering a time lapse in which the evolution ofexternal thermo-hygrometer parameters was similar to thosemonitored in Ref. [9]. The verification was done during mid-seasonbecause the hypogeous structures are subject to great variations inboundary values day after day. Moreover, in this period, we havea strong daily range of microclimatic parameters.
When modelling the structure, the software needs input param-eters including the dimensions of the rooms and the thermo-physicalproperties of the tufa that make up the casing. The values wereobtained by laboratory tests [4] and are at a mean temperature of25.4 �C: conductivity¼ 0.633 W/mK, diffusivity¼ 0.437�10�6 m2/sand density� thermal capacity¼ 1.448� 106 J/m3K.
After specifying the values, the next step was to compare theresults of internal temperature trends obtained by dynamic simu-lation with those obtained from experimental measurements.
As shown in Figs. 10 and 11, the evolution of the internaltemperature is constant in both charts (graphs were obtained by insitu measurements and calculated using the dynamic simulations).The only difference is that the result of the dynamic simulation isone degree lower than the value monitored. This difference may beconsidered acceptable, given the difficulties in modelling the greatirregularity of geometric construction due to the walls and ceilingcarved in the rock bench in a nonuniform way. They have botha constant temperature trend, and the internal temperature of17 �C, obtained from simulation, is in agreement with thetemperature of 18 �C obtained during environmental monitoringon April 14–22, 2007.
After the validation and development of the software model, thenext step was to analyze the behaviour of the structure during theperiod of a calendar year. In this way, it was possible to see how thisstructure behaved under different weather conditions throughout

Fig. 10. EnergyPlus result.
N. Cardinale et al. / Building and Environment 45 (2010) 94–106 103
the season. The charts in Figs. 12–15 describe the time series ofdifferent comfort parameters (temperature, relative humidity, andcomfort indices).
This analysis showed that these rooms have a constant seasonalinternal temperature. This allows us to say that these buildings donot suffer from the daily temperature changes. Moreover, theinternal temperatures in winter have a constant value of 10–12 �Cthat corresponds to the maximum outside average temperature ofthe period. During mid-season, the value of the indoor temperaturereaches 17 �C, coinciding with the average outside temperature.
Fig. 11. Result of the m
During summer, however, the internal temperature reached highervalues of about 3 �C compared to the monitored temperatures.
From the analysis carried out in situ and from different para-metric analyses (with different structural and plant configurations),we can say that the deviation of the simulated case from the realcase was caused by difficulties in modelling the evolution of heatflows within the rooms. In these structures, during the hottesthours of the summer days, we noticed natural ventilation throughthe sopraluce opening. In any case, given the difficulties ofmodelling the structural hypogeum (constructive irregularities)
onitoring in situ.
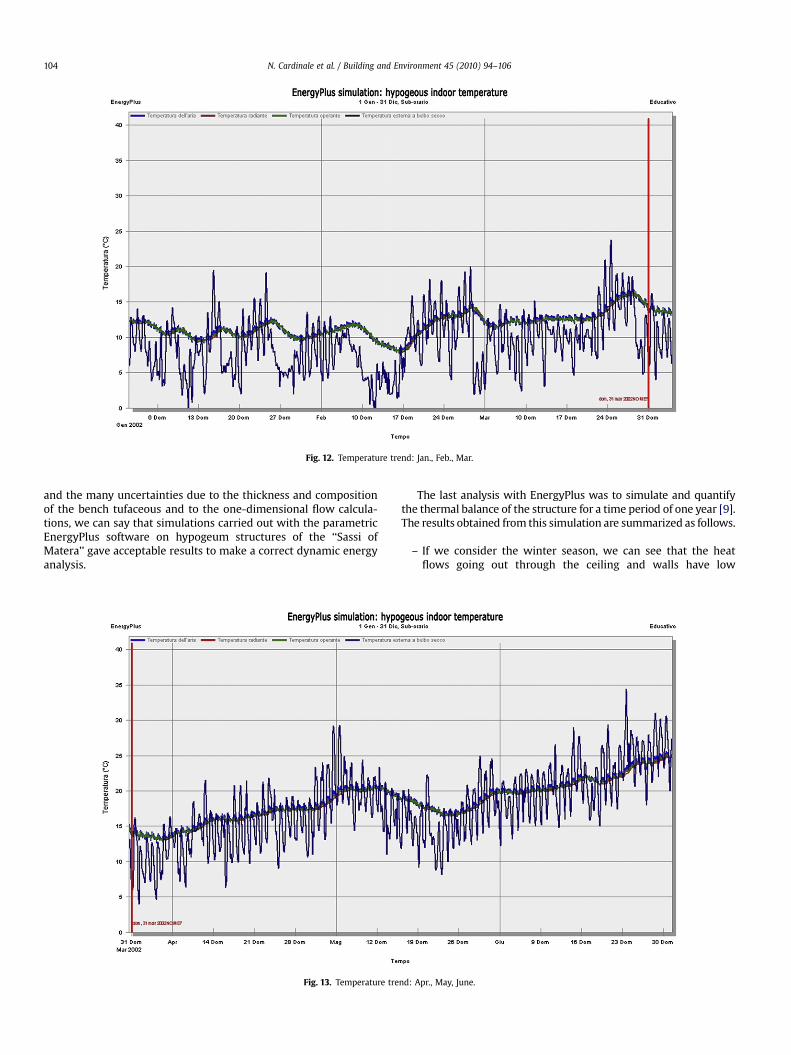
Fig. 12. Temperature trend: Jan., Feb., Mar.
N. Cardinale et al. / Building and Environment 45 (2010) 94–106104
and the many uncertainties due to the thickness and compositionof the bench tufaceous and to the one-dimensional flow calcula-tions, we can say that simulations carried out with the parametricEnergyPlus software on hypogeum structures of the ‘‘Sassi ofMatera’’ gave acceptable results to make a correct dynamic energyanalysis.
Fig. 13. Temperature tre
The last analysis with EnergyPlus was to simulate and quantifythe thermal balance of the structure for a time period of one year [9].The results obtained from this simulation are summarized as follows.
– If we consider the winter season, we can see that the heatflows going out through the ceiling and walls have low
nd: Apr., May, June.

Fig. 14. Temperature trend: July, Aug., Sep.
N. Cardinale et al. / Building and Environment 45 (2010) 94–106 105
values, e.g. �0.2 kW. This small amount of heat is balanced bythe flow into the room through the floor (about 0.2 kW).Adding to this the small heat gain obtained through thesopraluce, we obtain a zero thermal balance, confirming thatthis structure has a neutral behaviour against the outsideenvironment.
Fig. 15. Temperature tre
– In mid-season, we note the inversion of heat flow following thetransition from winter to summer. In fact, as shown in thecharts, when we approach the hot season, the heat flowthrough the walls and the roof tends to vanish while the heatflow through the floor first vanishes in April and then reverses,reaching values of �0.3 kW (May) and �0.6 kW (June).
nd: Oct., Nov., Dec.

N. Cardinale et al. / Building and Environment 45 (2010) 94–106106
– In summer, there is an inversion of heat flow passing throughthe walls and entering the room with values of 0.2 kW, whilethe thermal flux through the floor is outgoing with a medianvalue of �0.7 kW.
The monitoring campaign has confirmed all results obtainedthrough the dynamic analysis conducted using EnergyPlus. More-over, with the dynamic analysis the global energy behaviour ofhypogea is quantified. By quantifying the total energy balance ofthe hypogeous structures, it is possible to state the following.
– During the winter season, the heat flow loss from the walls wasbalanced by the positive energy gain through the floor, whichstabilized the evolution of temperature that remains constantat about 12–13 �C.
– During mid-season, the heat fluxes exchanged are essentiallynull, resulting in a constant evolution of temperature withvalues of 15–16 �C.
– In summer, the heat flow dispersed from the floor impliesa negative thermal balance that cancels the incoming heat flowfor transmission and ventilation, helping to reduce highsummer temperatures.
7. Conclusion
The comparisons done in situ among the different configura-tions of the hypogeum, the valuation of comfort, and the dynamicparametric analyses let us state that these buildings were devel-oped as real bioclimatic architecture with limited use of technologysystems. In fact, in their simple construction, they are able tomaximize solar gain in the cold season and minimize it in the hotseason by using the huge thermal mass as a cooler in summer andas a heater in winter. We can use natural ventilation for the regu-lation of relative humidity in both the seasons. Thus, the ‘‘Sassi ofMatera’’ is a model of bioclimatic architecture in which the naturalrock used ‘‘with wisdom’’ plays a fundamental role of environ-mental regulation.
The energetic valuation of surface hypogeous architectureshows that these environments once gave indoor comfort withinthe limits of thermo-hygrometric comfort established by theindices. We conclude that the most important thing to do is toregulate indoor microclimate, before eliminating the humidityfrom the walls. The same environments used under normalconditions reach indoor comfort within the limits established bythe indices.
The huge thermal mass of the walls ensures that the microcli-mate indoor conditions are regular throughout the seasons,without differences in the daily thermal oscillation. During thesummer season the indoor temperature is in the range of 18–21 �C(specially in deep hypogea). Then these buildings often need to beheated during the summer season to shorten the huge indoor/outdoor thermal gradient.
Deep hypogeous architectures without an air change systemcannot reach thermal-hygrometric comfort values. This system isuseful in increasing the indoor temperature and reducing theindoor–outdoor thermal gradient. A dynamic analysis permitted usto quantify the energy balance of the hypogeous structures duringa period of one calendar year. In this way, we can state that thesestructures have a null thermal balance during mid-season, while insummer the floor loses heat and cools the room with the oppositeoccurring in winter.
References
[1] Laureano P. Giardini di pietra, i Sassi di Matera e la civilta mediterranea.Torino: Bollati Boringhieri; 1993.
[2] Cardinale N, Guida A, Ruggiero F. Thermo-hygrometric evaluations in therecovery of rocky buildings of the ‘‘Sassi of Matera’’ (Italy). Journal of ThermalEnvelope and Building Science 2001;24:301–15.
[3] Cardinale N, Ruggiero F. A case study on the environmental measures tech-niques for the conservation in the vernacular settlements in southern Italy.Building and Environment 2002;37:405–14.
[4] Guida A, Rospi G, Pagliuca A. The bearing walls like a ‘‘natural thermalgovernor’’: the case of ‘‘Sassi di Matera’’. In: Proceedings of eighth interna-tional seminar on structural masonry, Istanbul, November 05–07, 2008.
[5] Rospi G. Architectural recovery and energetic design of traditional Mediter-ranean architecture. In: Proceedings of the International Conference ARTEC,Ancona, November 21, 2007.
[6] Guida A, Rospi G, Pagliuca A. Underground spaces and indoor comfort: thecase of ‘‘Sassi di Matera’’. In: Proceedings of first international conference onunderground spaces, New Forest, UK, September 8–10, 2008.
[7] Colombo R, Landabaso A, Sevilla A. Passive solar architecture for Mediterra-nean area. Brussels: Institute for System Engineering and Informatics, JointResearch Centre, Comm. of the European Communities; 1994.
[8] Cardinale N, Ruggiero F. Energetic aspects of bioclimatic buildings in theMediterranean area: a comparison between two different computationmethods. Energy and Buildings 2000;31:55–63.
[9] EnergyPlus – energy simulation software, version 3.0.0. Build 028, November2008, <http://apps1.eere.energy.gov/buildings/energyplus/>
[10] Restucci A. Matera. I Sassi. Manuale del Recupero. Mondatori Electa; 1998.ISBN 8843566040.
[11] Regulations UNI EN ISO 7726. Ergonomics of the thermal environment –instruments for measuring physical quantities; 2002.
[12] ASHRAE 55-92. PMV and PPD method.[13] Regulations UNI EN27730 (new version of regulation UNI EN ISO 7730:1997).
Moderate thermal environment: PMV and PPD calculation and valuation ofthermal comfort.
[14] UNI EN ISO 9920 2004.
Copyright © 2022 FDOKUMEN