Online Supplementary Materials for: Evolutionary novelty in a rat with no molars
Upload
independentCategory
view
0download
0
7. Micro-computed tomography of primate molars:Methodological aspects of three-dimensional data collection
A.J. OLEJNICZAKHuman Evolution Department,Max Planck Institute for EvolutionaryAnthropology, Deutscher platz 6, D-04103Leipzig, [email protected]
F.E. GRINEDepartments of Anthropology and Anatomical SciencesStony Brook UniversityStony Brook, NY 11794-4364, [email protected]
L.B. MARTINDepartments of Anthropology and Anatomical SciencesStony Brook UniversityStony Brook, NY 11794, [email protected]
Keywords: mCT; measurement accuracy; three-dimensional measurements; pixels; voxels; molars; 3-Drendering; molar enamel volume; slice thickness; image resolution
Abstract
Phylogenetic, paleodietary, and developmental studies of hominoid primates frequently make use of thepost-canine dentition, in particular molar teeth. To study the thickness and shape of molar enamel and dentine,internal dental structures must be revealed (e.g., the location of dentine horn apices), typically necessitatingthe production of physical sections through teeth. The partially destructive nature of such studies limits samplesizes and access to valuable fossil specimens, which has led scholars to apply several methods of radiographicvisualization to the study of teeth. Radiographic methods aimed at visualizing internal dental structures includelateral flat-plane X-rays, ultrasound, terra-hertz imaging, and computed tomography. Each of these techniqueshas resolution limitations rendering them inadequate for accurately reconstructing both the enamel-dentinejunction and the outer enamel surface; the majority of studies are thus performed using physical sections ofteeth. A comparatively new imaging technique, micro-computed tomography (mCT), accurately portrays theenamel-dentine junction of primate molars, and provides accurate measurements of enamel cap thickness andmorphology. The research presented here describes methodological parameters pertinent to mCT studies of molars(slice thickness and pixel resolution), and the observable impact on measurement accuracy when these parameters
103
S.E. Bailey and J.-J. Hublin (Eds.), Dental Perspectives on Human Evolution, 103–115.© 2007 Springer.

104 Olejniczak, Grine & Martin
are altered. Measurements taken on a small, taxonomically diverse sample of primate molars indicate that slicethickness should be conservatively set at approximately 3.45 % of specimen length, and image resolution shouldbe maximized (ideally, greater than or equal to 2048 × 2048 pixels per image) in order to ensure measurementaccuracy. After discussing this base-line protocol for future mCT studies of the primate dentition, illustrativeapplications of this imaging technology are presented.
Introduction
Background
Internal dental structures viewed by radio-graphic means have been employed intaxonomic, phylogenetic, and functionalstudies of primate and human evolution fornearly 100 years (Miller, 1915). The scientificvalue of studies of internal dental morphologyis evident from even a cursory review ofthe scientific literature pertaining to humanevolution, and is only briefly recounted here.The thickness of molar enamel, for instance,is one of the most widely-cited morpho-logical characters relevant to hominoid andhominin evolution (e.g., Gantt, 1977; Martin1985; Grine and Martin, 1988; Andrewsand Martin, 1991; Andrews, 1992; Whiteet al., 1994; Senut et al., 2001; Brunetet al., 2002; Martin et al., 2003; Grine, 2004;Smith et al., 2005). Measurement of enamelthickness necessitates clearly portraying theenamel-dentine junction, so that internal struc-tures of the tooth are revealed. It hasfurther been demonstrated that controlledplanes of section are necessary to accuratelydescribe the thickness of enamel, especiallyin inter-species comparisons (Martin, 1983).In order to achieve uniform planes of sectionfrom which to record enamel thicknessmeasurements, physical sections through teethare often produced, which partially destroythe tooth.
Another fruitful line of investigation, thequantification of enamel-dentine junction(EDJ) morphology, also involves destroyingdental material in order to view and measureinternal surfaces. Korenhof (1960, 1961, 1978,1982), Corruccini (1987), and Olejniczaket al. (2004) each employed destructive or
semi-destructive techniques in order to studythe morphology of the coronal dentinesurface. Although EDJ morphology is wellsuited to studying taxonomic affiliation andmechanisms of dental development, partialdestruction of dental tissues is necessary inorder to view this surface. Sample sizes inthese studies have been limited, despite thepromising results produced thus far.
Techniques that involve full or partialdestruction of a tooth in order to accuratelyvisualize the EDJ and measure the thicknessof enamel limit access to museum samples,and preclude the study of important fossilspecimens. In order to acquire largesamples of teeth (including fossil material),several non-destructive techniques have beenemployed, including ultrasound imaging(Yang, 1991) and tera-hertz pulse imaging(Crawley et al., 2003). Despite a long historyof innovation, few radiographic methodshave proven to accurately measure internaldental structures, and some methods aresubject to high degrees of measurementerror (e.g., lateral flat-plane X-rays (Grineet al., 2001) and medical CT (Grine, 1991;Spoor et al., 1993).
A relatively new radiographic technique,micro-computed tomography (mCT), hasrecently been applied to the study of theprimate dentition (e.g., Chaimanee et al.,2003; Kono, 2004; Olejniczak and Grine,2005, 2006). We have reported elsewherethat the measurement accuracy of mCT cross-sections is within 3% of equivalent measure-ments taken on physically prepared toothsections, when linear and area measure-ments are considered (Olejniczak and Grine,2006). Thus, mCT is capable of providingnon-destructive high-resolution measurablyaccurate visualizations of primate teeth

mCT of Primate Molars 105
(Figures 1 and 2). It is also capable ofseparating dental tissues (i.e., enamel, dentine,pulp) for analysis (Figure 3). Moreover,mCT facilitates the visualization of some
Figure 1. Three-dimensional volume rendering ofthe second molar of a tufted capuchin (Cebusapella) produced via mCT scanning. These
models are reconstructed from scans that were6 �m in thickness containing pixels that were
6 × 6 �m in dimension. The images at right showa cross-section through the tooth, both with the
dentine (lower right) and with the dentinecomponent removed via segmentation
(upper right).
Figure 2. Surface model of a siamang(Symphalangus syndactylus) lower second molarin standard anatomical views. This surface model
was created by threshold segmentation of animage stack containing cubic voxels of 10.5 �m
per side.
Figure 3. Surface models of the different dentaltissues that are perceptible and segmentable via
mCT scanning (enamel, dentine, and pulp),demonstrating the ability of this visualizationtechnique to non-destructively expose areas ofdental morphology that are inaccessible using
standard odontometric methods. This is the sametooth as in Figure 2.
fossil teeth, making them available fornon-destructive analysis (Figures 4 and 5).However, diagenetic re-mineralization ofenamel and dentine must be consideredwhen scanning fossil specimens, as densitydifferences between the two tissues may bereduced through the absorption of mineralsin the process of fossilization, rendering theenamel cap indistinguishable from the under-lying dentine. (Olejniczak and Grine, 2006).
In a previous analysis (Olejniczak andGrine, 2006), we compared measurementsfrom cross-sectional planes of physically
Figure 4. High-resolution surface models of theShanidar 3 Neanderthal upper third molar invarious views, demonstrating the potential
application of mCT scanning to Pleistocene fossilspecimens.
106 Olejniczak, Grine & Martin
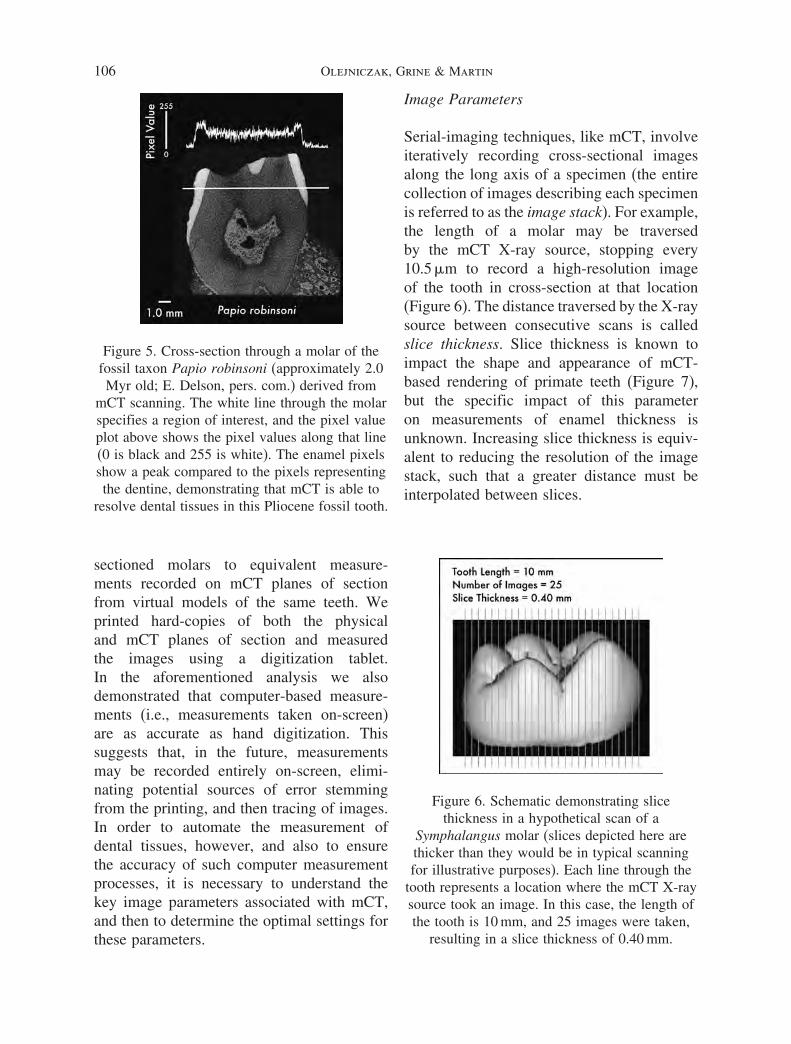
Figure 5. Cross-section through a molar of thefossil taxon Papio robinsoni (approximately 2.0Myr old; E. Delson, pers. com.) derived from
mCT scanning. The white line through the molarspecifies a region of interest, and the pixel valueplot above shows the pixel values along that line(0 is black and 255 is white). The enamel pixelsshow a peak compared to the pixels representingthe dentine, demonstrating that mCT is able to
resolve dental tissues in this Pliocene fossil tooth.
sectioned molars to equivalent measure-ments recorded on mCT planes of sectionfrom virtual models of the same teeth. Weprinted hard-copies of both the physicaland mCT planes of section and measuredthe images using a digitization tablet.In the aforementioned analysis we alsodemonstrated that computer-based measure-ments (i.e., measurements taken on-screen)are as accurate as hand digitization. Thissuggests that, in the future, measurementsmay be recorded entirely on-screen, elimi-nating potential sources of error stemmingfrom the printing, and then tracing of images.In order to automate the measurement ofdental tissues, however, and also to ensurethe accuracy of such computer measurementprocesses, it is necessary to understand thekey image parameters associated with mCT,and then to determine the optimal settings forthese parameters.
Image Parameters
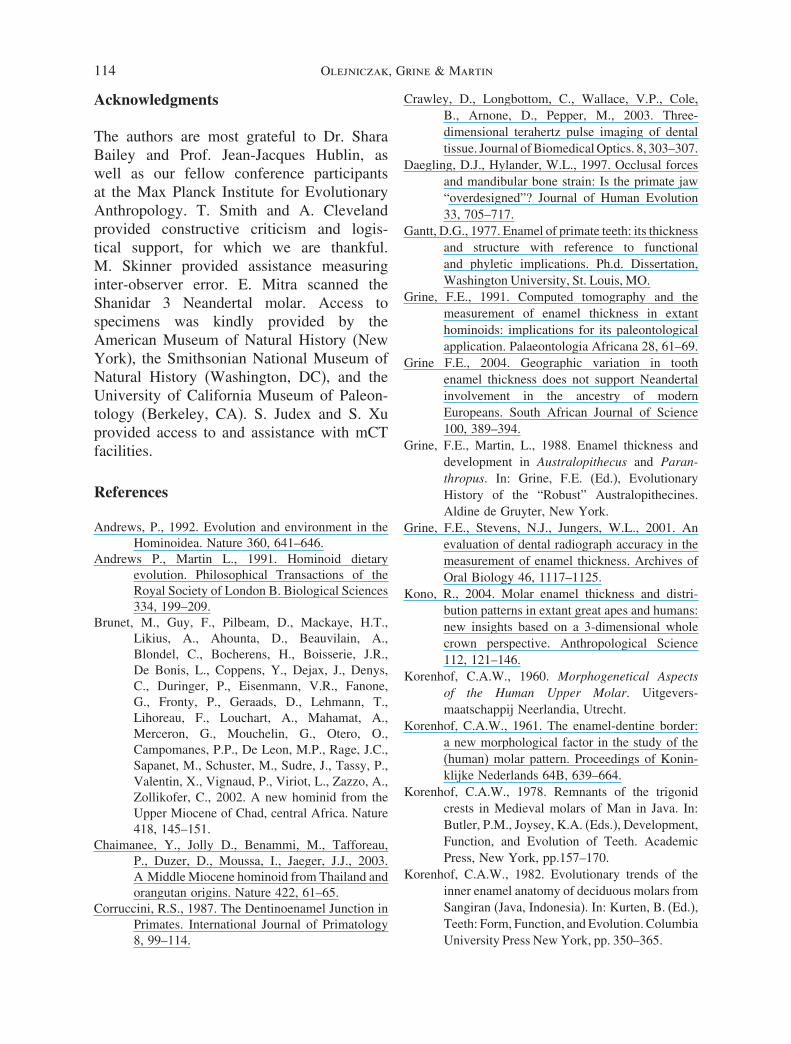
Serial-imaging techniques, like mCT, involveiteratively recording cross-sectional imagesalong the long axis of a specimen (the entirecollection of images describing each specimenis referred to as the image stack). For example,the length of a molar may be traversedby the mCT X-ray source, stopping every10.5 �m to record a high-resolution imageof the tooth in cross-section at that location(Figure 6). The distance traversed by the X-raysource between consecutive scans is calledslice thickness. Slice thickness is known toimpact the shape and appearance of mCT-based rendering of primate teeth (Figure 7),but the specific impact of this parameteron measurements of enamel thickness isunknown. Increasing slice thickness is equiv-alent to reducing the resolution of the imagestack, such that a greater distance must beinterpolated between slices.
Figure 6. Schematic demonstrating slicethickness in a hypothetical scan of a
Symphalangus molar (slices depicted here arethicker than they would be in typical scanningfor illustrative purposes). Each line through the
tooth represents a location where the mCT X-raysource took an image. In this case, the length ofthe tooth is 10 mm, and 25 images were taken,
resulting in a slice thickness of 0.40 mm.

mCT of Primate Molars 107
Figure 7. Surface models of an Ateles paniscusmolar generated from image stacks with varyingslice thicknesses. The tooth was worn and brokenprior to scanning (note the pools of dentine at thecusp tips and post mortem cracks). Not only theimage quality, but also the shape of the tooth is
changed when models are based on thicker slices,which require software to interpolate increasingamounts of missing (unscanned) morphology.
The resultant image produced at each slicelocation is comprised of some number ofsquare pixels of known dimension (e.g., eachpixel may be 10.5 × 10.5 �m). The numberof pixels within an image is known asimage resolution, and also serves to calibratemeasurements taken on that image becausethe size of the pixels is known (Figure 8).For example, each of the serial images maybe 15 × 15 pixels, so given a pixel dimensionof 6 × 6 �m, the image is known to be90 × 90 �m (Figure 8).
Slice thickness also acts as a depthparameter for the serial images. For instance,if slice thickness is 6 �m, and each pixel is6 × 6 �m, then each pixel may be considereda cube (called a voxel, derived from the termvolumetric pixel) that is 6 × 6 × 6 �m. In thisway, each cross-sectional image is actually acubic rectangle (Figure 8).
Slice thickness and image resolution have asubstantial impact on one’s ability to manip-ulate and measure image stacks in three dimen-sions because of computational limitations. For
instance, the image stack of a single Sympha-langus syndactylus molar scanned for this studyis approximately 3.6 GB in size, and requires85.3 GB of random access memory (RAM) inorder to manipulate it in three dimensions at animage resolution of 2048 × 2048 pixels. If onereduces the resolution of each image in the stackby 75 % to 512 × 512 pixels, the required RAMis reduced to 5 GB, enabling standard desktopcomputers tomanipulateandmeasure the imagestack with only minor modification to memoryhandling settings (Figure 9). An alternative toreducing image resolution is to record fewerimages during the scanning process, which isequivalent to increasing the slice thickness.Thus, a compromise between image quality(minimizing slice thickness and maximizingimage resolution) and computational ability(increasing slice thickness and reducing imageresolution) is sought in order to ensure that mCTscanning is not only accurate, but also viable forresearchers without access to costly computa-tional facilities.
One final consideration regarding the use ofradiographic images such as those producedvia mCT is the pixel value. Each pixel inevery image (assuming hereafter that imagesare 8-bit) has an associated value, rangingfrom 0 to 255. A pixel value of 0 indicatesthat the pixel is black; a pixel value of 255indicates that the pixel is white. Pixel valuesbetween 1 and 254 indicate that the pixel issome shade of grey, with the low end of therange indicating darker values of grey and thehigher end of the range indicating brightershades (see also Figure 5). Pixel value is afunction of density as perceived by the X-rayreceptor apparatus of the mCT machine, suchthat the hydroxyapatite crystals comprising theenamel cap (which appears nearly white inmCT images) are denser than the underlyingdentine (which appears grey in mCT images).Pixel values are useful not only in visuallyinterpreting the image stacks produced bymCT scanning, but also in the computer-based identification of tissues (i.e., image

108 Olejniczak, Grine & Martin
Figure 8. Schematic describing the different levels of data used in analysis of mCT image stacks. Theoriginal image stack contains the serial cross-sectional images. Each single image from within that
stack is of known dimension, because the number of pixels and the size of each pixel are known. Theslice thickness is used to turn each image into a cubic rectangle comprised of voxels, or
three-dimensional pixels, the smallest volumetric units in the mCT image stack. The entire volume isvisualized by giving each image from the original stack a thickness, and then viewing the resultant
voxels in three-dimensions.
segmentation), where software may be usedto automatically associate all of the nearlywhite pixels (e.g., pixels with values greaterthan 215) with one another, thus identifyingthe enamel cap. Because each pixel corre-sponds to a three-dimensional voxel of knownvolume (when slice thickness is considered),pixel value segmentation is a crucial step incalculating tissue volumes.
Since most mCT machines allow forcustomization of slice thickness and imageresolution settings, and because thesesettings could potentially alter computer-based measurements of dental tissuesregardless of segmentation techniques, thefocus of the research presented here is onthe ideal settings of these two parametersto ensure measurement accuracy. The exper-
iments described here therefore address thefollowing question: in order to accuratelymeasure dental tissues based on pixel valuesin images produced by mCT scanning, whatare the ideal values for slice thickness andimage resolution?
Materials and Methods
Study Sample
The sample studied here contains molarsfrom a taxonomically broad range of primates(Table 1). The sample comprises taxa thatare known from previous two-dimensionalanalyses to exhibit a range of enamel thick-nesses and enamel cap shapes (Martin,1985; Shellis et al., 1998; Ulhaas et al.,

mCT of Primate Molars 109
Figure 9. Plot depicting the physical memoryrequired to store an image stack versus the
resolution of the images in that stack, based on aSymphalangus syndactylus molar (the pattern
depicted here is similar for any image stack, onlythe absolute values change). In the case ofimages stored at 2048 × 2048 pixels, which
occupy 3.31 GB of hard drive space,approximately 86 GB of RAM are required to
manipulate and measure the image stack in threedimensions. When the images are reduced in
resolution to 512 × 512 pixels, the required RAMis reduced to approximately 5 GB. Due to the
hardware limitations of modern desktopcomputers, smaller images are preferred becauseof one’s ability to manipulate them with standardcomputational facilities. The research presentedhere suggests that reducing the size of the imagestack (either by recording fewer images throughor by reducing the resolution of those images)
may have a substantial impact on measurementsand should be avoided to ensure measurement
accuracy.
1999; Schwartz, 2000; Martin et al., 2003;Olejniczak et al., 2004).
Each molar was scanned using aScanco mCT 20 machine (Scanco Medical,Switzerland). The thinnest possible sliceswere taken, and images with the highestpossible resolution were acquired for eachspecimen. These parameters are partially
dependent upon the size of the individualspecimen; hence the diameter of the mCTtube that will accommodate this size; slicethickness and image resolution for eachspecimen are reported in Table 1. Scanningresulted in an image stack for each specimencomprised of serial LZW compressed TIFFimages, which were uncompressed prior toanalysis using GraphicConvertor software(Lemke Software GmbH), and convertedusing NIH ImageJ software to unsignedcharacter raw image format for volumetricanalysis using Slicer3-D software.
Slice ThicknessIn order to assess the impact of different slicethicknesses on computer-based measurementsof mCT scans, the volume of the enamelcap in each specimen was measured at15 different slice thicknesses. The rangeof slice thicknesses corresponded to thelowest possible thickness based on the mCTmachine’s capability on the low end, upto 1.00 mm on the high end. For example,a molar scanned at a slice thickness of0.01 mm had volume measurements takenat the following 15 slice thicknesses forcomparison: 0.01 mm, 0.02 mm, 0.03 mm,0.04 mm, 0.05 mm, 0.06 mm, 0.07 mm,0.08 mm, 0.09 mm, 0.10 mm, 0.20 mm,0.30 mm, 0.40 mm, 0.50 mm, and 1.00 mm.Volume measurements were performed usingSlicer3-D software, ensuring that identicalpixel threshold values were assigned to theimage stack during each measurement ofthe enamel cap volume. The volume of theenamel cap was calculated for each toothat each slice thickness, and the length ofthe specimen was also noted in order tocreate the index [slice thickness/specimenlength]. Using this percentage, slice thicknessmay be viewed as a function of tooth size,allowing a researcher to choose the thickestpossible slices that still yield an accurate(within 1%) measurement of volumes, giventhe size of the tooth as the only parameterknown a priori. Because scanning is both

110 Olejniczak, Grine & Martin
Table 1. Study sample composition and scanning parameters
Taxon Tooth Voxel Cubic Dimension (mm) Image Resolution (pixels) Number of Images
Ateles geoffroyi M1 0.011 2048 × 2048 756Ateles paniscus M1 0.006 2048 × 2048 1097Cebus apella M2 0.006 2048 × 2048 663Homo sapiens M3 0.010 2048 × 2048 1314Homo sapiens dm1 0.008 2048 × 2048 839Homo sapiens M3 0.008 2048 × 2048 1589Papio ursinus M2 0.010 2048 × 2048 1449Symphalangus syndactylus M2 0.010 2048 × 2048 847Symphalangus syndactylus M2 0.010 2048 × 2048 834Symphalangus syndactylus M1 0.010 2048 × 2048 807
time-consuming and expensive, selectingthe maximum slice thickness that providesaccurate measurements is important, and aneffective way to reduce resultant file sizeas well as the cost and time devoted toscanning.
Image ResolutionA single cross-sectional image from withineach specimen’s image stack was examinedat the highest resolution (2048 × 2048 pixels).We deliberately chose images from the centerof each image stack so that both enamel anddentine were visible. NIH ImageJ softwarewas employed to threshold the image, sothat only enamel pixels were visible. Thearea of enamel was calculated by countingthe number of pixels describing the enamel(the number of thresholded pixels) andmultiplying this number by the area of asingle pixel. This process was repeated oneach image five more times, after halvingthe resolution each time. Thus the areaof enamel was recorded for each toothcross-section at the following pixel resolu-tions: 2048 × 2048, 1024 × 1024, 512 × 512,256 × 256, 128 × 128, and 64 × 64 pixels.Identical thresholding was used for all sixmeasurements of each tooth image. Finally,the 2048 × 2048 pixel image was printed andthe hard-copy output was measured using adigitizing tablet interfaced with SigmaScanPro software (v5.0, SPSS, Inc.).
Results
Slice Thickness
Table 2 shows the slice thickness at whichvolume measurements were 1 % differentthan those recorded from the thinnest slicespossible. Table 2 also presents a percentagecalculation of slice thickness versus thespecimen length (mesio-distal length). Resultsof the slice thickness experiment suggest thatvolume is a rather robust measurement, suchthat a slice thickness of 8 % of the lengthof the specimen, on average, results in scansthat are accurate to within 1 % of the bestpossible (thinnest) scans for that specimen(Table 2). Moreover, there is no trend forthinly enameled species (e.g., Ateles paniscus)to require more scans than more thicklyenameled species (e.g.,Cebus apella) in orderto achieve measurement accuracy. Nor is therea relationship between specimen length andrequired slice thickness.
Image Resolution
Results of the image resolution exper-iment indicate that area measurements takenon images to which identical thresholdingalgorithms had been applied tend to becomeless similar to the actual area value (asmeasured by digitization) as resolution isdecreased. Table 3 depicts the value of

mCT of Primate Molars 111
Table 2. Slice thickness at which volume measurement is 1 % different than ideal
Taxon ToothThickness at 1 %Different (mm)
SliceThickness / Specimen
Length
Ateles geoffroyi M1 0.42 9�83 %Ateles paniscus M1 0.30 4�55 %Cebus apella M2 0.60 15�08 %Homo sapiens M3 0.80 7�60 %Homo sapiens dm1 0.80 11�76 %Homo sapiens M3 1.00 6�29 %Papio ursinus M2 0.50 3�45 %Symphalangus syndactylus M2 0.50 5�90 %Symphalangus syndactylus M2 1.00 11�90 %Symphalangus syndactylus M1 0.60 7�43 %Mean 8�38 %
Table 3. Enamel area from digitization (mm2) and thresholding (% different than digitization) at different pixel counts
Taxon ToothDigitized
Area (mm2) 2048 × 2048 1024 × 1024 512 × 512 256 × 256 128 × 128 64 × 64
Ateles geoffroyi M1 1�56 0.64 % 4.49 % 8.33 % 9.62 % 25.00 % 44.23 %Ateles paniscus M1 2�14 0.00 % 1.40 % 2.34 % 4.67 % 10.28 % 22.43 %Cebus apella M2 3�54 0.28 % 0.85 % 0.56 % 0.85 % 2.54 % 7.34 %Homo sapiens M3 17�68 0.79 % 1.81 % 1.92 % 5.77 % 4.07 % 1.41 %Homo sapiens dm1 8�42 1.07 % 1.19 % 0.48 % 0.24 % 2.85 % 12.00 %Homo sapiens M3 40�52 0.79 % 1.16 % 1.23 % 9.45 % 12.22 % 8.66 %Papio ursinus M2 21�90 1.92 % 4.20 % 4.93 % 4.89 % 6.62 % 10.68 %Symphalangus syndactylus M2 9�12 0.22 % 4.50 % 7.13 % 6.69 % 5.92 % 6.80 %Symphalangus syndactylus M2 9�11 0.66 % 0.11 % 0.33 % 1.43 % 3.84 % 5.60 %Symphalangus syndactylus M1 11�00 1.00 % 0.27 % 0.64 % 2.09 % 4.55 % 7.82 %Mean 0.74 % 2.00 % 2.79 % 4.57 % 7.79 % 12.70 %
enamel area obtained by digitization for eachtooth section, and the percent difference ofcomputer-based measurements of the samesection at different resolutions. There is awide range of percent differences from thedigitized area value, but the general trendis towards decreased measurement accuracy(i.e., increased percent differences from thevalue obtained via digitization) with reducedpixel counts. The average percent differenceof all the specimens at a given resolution isapproximately 1.5 times the percent differenceat the previous (better) resolution: from2.00 % at 1024 × 1024 pixels, to 2.79 % at512 × 512 pixels, to 4.57 % at 256 × 256pixels, and so on. The digitized values were
almost always closest to the values obtainedvia thresholded pixel counts at 2048 × 2048pixels, suggesting that 2048 pixels perside is adequate for accurate measure-ments compared to a hand-digitizationstandard (less than 1.00 % measurementdifference).
Discussion
Parameter Calibration
Results of the experiments conducted heresuggest that while image resolution shouldbe maximized in order to achieve automatedimage measurement accuracy (e.g., counting

112 Olejniczak, Grine & Martin
pixels or voxels after thresholding to measureareas and volumes, respectively), slicethickness may be sacrificed while maintainingaccurate measurements in some cases. That is,enamel volume may be calculated accuratelyin permanent human molars with slices thatare between 0.80 and 1.00 mm thick, eventhough it is possible to achieve slice thick-nesses of 0.008 mm for these specimens.However, because of its three-dimensionalnature, volume is less influenced by shapeirregularities caused by interpolation ofthicker slices than two-dimensional measure-ments such as areas or distances. In a previousanalysis, we found that slice thickness rangingfrom 0.006 mm to 0.010 mm facilitate accuratemeasurements of distances within mCT imagestacks of teeth (Olejniczak and Grine, 2006),suggesting that volumes and distances neces-sitate different slice thicknesses in orderto ensure measurement accuracy. The slicethicknesses reported here (Table 2) thusrepresent only the maximum thicknessesthat will enable the accurate measurementof enamel volumes; thinner slices arerequired for the accurate measurement ofdistances.
Example Applications of mCT
Having elsewhere demonstrated themeasurement accuracy of mCT visualizationand its ability to visualize fossil specimens(Olejniczak and Grine, 2005, 2006), andhaving considered here the ideal imageresolution and slice thickness parameters, wepresent some illustrative applications of thistechnology.
Martin (1983) suggested that the scaledvolume of enamel on a tooth crown wasthe ideal measurement of overall enamelthickness, and noted that two-dimensionalmeasurements from physical sections wereproxies for overall crown volumes. Whethermeasurements recorded on the widely usedmesial cusp ideal plane of section are
reliable proxies for overall crown volumemay be explored with mCT analysis, giventhis technology’s unique ability to produceaccurate, user-defined planes of section(see also Shimizu, 2002; Suwa and Kono,2005). The relative impact of slight devia-tions from the ideal plane of section mayalso be addressed using mCT models (e.g.,Olejniczak, 2005), and standard referenceplanes may be established in order tolimit inter-observer error in planar studies.Furthermore, the volumes of dental tissuesthemselves may be analyzed, permitting awhole-tooth perspective on enamel thickness(e.g., Kono, 2004).
Another study facilitated by mCTtechnology is the examination of bothmandibular architecture (e.g., Daegling andHylander, 1997) and molar tissue patterning(e.g., enamel thickness distribution, Schwartz,2000) within the same specimen (Figure 10).Currently, data sets produced for analyses ofmandibular morphology, and those producedby other researchers to examine molar enamelthickness must be integrated in order to
Figure 10. Section through a volume model of aSymphalangus syndactylus mandible produced bymCT scanning. The ability of mCT to visualizeaccurately the internal morphology of both tooth
and jaw facilitates simultaneous study ofmandibular and molar architecture.

mCT of Primate Molars 113
Figure 11. Occlusal views of surface models ofthe outer enamel surface and the enamel-dentinejunction in a Symphalangus syndactylus lower
second molar.
examine the internal morphology of both toothand jaw within a species. mCT visualizationthus affords the potential refinement offunctional models of mastication by allowingthe ideal plane of section through a molar toalso expose the morphology of the mandiblein the same plane, and in the same individual.
Finally, mCT imaging allows differentdental tissues to be separated via imagesegmentation, so previously inaccessible areasof morphology may be measured. Themorphology of the EDJ across the entiremolar crown, for instance, has been impli-cated as an important character in studiesof taxonomic affinity and dental devel-opment, although only partially destructivemeans (Korenhof, 1961; Corruccini 1987;Olejniczak et al., 2004) or enamel attritionpatterns (Simons, 1976) have been used toaccess and interpret this morphology (but seeSkinner and Kapadia, 2005). Measurement-accurate images of the outer enamel surfaceand the EDJ may be compared usingmCT imaging, facilitating further analysis ofthis potentially important suite of characters(Figure 11).
Conclusions
1. Slice thickness in mCT studies ofprimate molars aimed at measuringvolumes may conservatively be set at
3.45 % of the length of the specimen (themost conservative thickness reportedin Table 2), although thinner slices(approximately 10 times thinner) arerequired for area, linear, and coordinatemeasurements. Slice thickness andimage resolution are also functions ofthe size of each tooth to be scanned,such that larger teeth require fewerlower resolution scans than do smallerteeth.
2. Image resolution in mCT studies ofprimate molars should be maximized inorder to ensure measurement accuracy,ideally at 2048 × 2048 pixels orgreater if computer-based measurementtechniques are to be performed.
3. Inaccessible areas of anatomy, suchas pulp cavities, radicular canals, andthe morphology of the enamel-dentinejunction, may be accurately visualizedusing mCT methods, facilitating non-destructive and high-resolution studiesof internal tooth morphology.
4. Non-destructive paleoanthropologicalinvestigations of hominid molars maybe performed at high levels of accuracyusing mCT, although some drawbacksexist to using this method. First, thereis a negative relationship betweenspecimen size and scanning resolution,such that isolated teeth are more easilyscanned at high resolutions than arecrania or mandibles. Second, mCT(and the associated analysis software)is costly and time-consuming, so theminimum resolution and number ofscans necessary for accurate measure-ments should be taken. Nonetheless,the ability of mCT to non-destructivelyproduce measurable models of fossilspecimens promises to increase samplesizes and open new research questionsabout internal dental morphology,improving our understanding of hominiddental evolution.
114 Olejniczak, Grine & Martin
Acknowledgments
The authors are most grateful to Dr. SharaBailey and Prof. Jean-Jacques Hublin, aswell as our fellow conference participantsat the Max Planck Institute for EvolutionaryAnthropology. T. Smith and A. Clevelandprovided constructive criticism and logis-tical support, for which we are thankful.M. Skinner provided assistance measuringinter-observer error. E. Mitra scanned theShanidar 3 Neandertal molar. Access tospecimens was kindly provided by theAmerican Museum of Natural History (NewYork), the Smithsonian National Museum ofNatural History (Washington, DC), and theUniversity of California Museum of Paleon-tology (Berkeley, CA). S. Judex and S. Xuprovided access to and assistance with mCTfacilities.
References
Andrews, P., 1992. Evolution and environment in theHominoidea. Nature 360, 641–646.
Andrews P., Martin L., 1991. Hominoid dietaryevolution. Philosophical Transactions of theRoyal Society of London B. Biological Sciences334, 199–209.
Brunet, M., Guy, F., Pilbeam, D., Mackaye, H.T.,Likius, A., Ahounta, D., Beauvilain, A.,Blondel, C., Bocherens, H., Boisserie, J.R.,De Bonis, L., Coppens, Y., Dejax, J., Denys,C., Duringer, P., Eisenmann, V.R., Fanone,G., Fronty, P., Geraads, D., Lehmann, T.,Lihoreau, F., Louchart, A., Mahamat, A.,Merceron, G., Mouchelin, G., Otero, O.,Campomanes, P.P., De Leon, M.P., Rage, J.C.,Sapanet, M., Schuster, M., Sudre, J., Tassy, P.,Valentin, X., Vignaud, P., Viriot, L., Zazzo, A.,Zollikofer, C., 2002. A new hominid from theUpper Miocene of Chad, central Africa. Nature418, 145–151.
Chaimanee, Y., Jolly D., Benammi, M., Tafforeau,P., Duzer, D., Moussa, I., Jaeger, J.J., 2003.A Middle Miocene hominoid from Thailand andorangutan origins. Nature 422, 61–65.
Corruccini, R.S., 1987. The Dentinoenamel Junction inPrimates. International Journal of Primatology8, 99–114.
Crawley, D., Longbottom, C., Wallace, V.P., Cole,B., Arnone, D., Pepper, M., 2003. Three-dimensional terahertz pulse imaging of dentaltissue. Journal of Biomedical Optics. 8, 303–307.
Daegling, D.J., Hylander, W.L., 1997. Occlusal forcesand mandibular bone strain: Is the primate jaw“overdesigned”? Journal of Human Evolution33, 705–717.
Gantt, D.G., 1977. Enamel of primate teeth: its thicknessand structure with reference to functionaland phyletic implications. Ph.d. Dissertation,Washington University, St. Louis, MO.
Grine, F.E., 1991. Computed tomography and themeasurement of enamel thickness in extanthominoids: implications for its paleontologicalapplication. Palaeontologia Africana 28, 61–69.
Grine F.E., 2004. Geographic variation in toothenamel thickness does not support Neandertalinvolvement in the ancestry of modernEuropeans. South African Journal of Science100, 389–394.
Grine, F.E., Martin, L., 1988. Enamel thickness anddevelopment in Australopithecus and Paran-thropus. In: Grine, F.E. (Ed.), EvolutionaryHistory of the “Robust” Australopithecines.Aldine de Gruyter, New York.
Grine, F.E., Stevens, N.J., Jungers, W.L., 2001. Anevaluation of dental radiograph accuracy in themeasurement of enamel thickness. Archives ofOral Biology 46, 1117–1125.
Kono, R., 2004. Molar enamel thickness and distri-bution patterns in extant great apes and humans:new insights based on a 3-dimensional wholecrown perspective. Anthropological Science112, 121–146.
Korenhof, C.A.W., 1960. Morphogenetical Aspectsof the Human Upper Molar. Uitgevers-maatschappij Neerlandia, Utrecht.
Korenhof, C.A.W., 1961. The enamel-dentine border:a new morphological factor in the study of the(human) molar pattern. Proceedings of Konin-klijke Nederlands 64B, 639–664.
Korenhof, C.A.W., 1978. Remnants of the trigonidcrests in Medieval molars of Man in Java. In:Butler, P.M., Joysey, K.A. (Eds.), Development,Function, and Evolution of Teeth. AcademicPress, New York, pp.157–170.
Korenhof, C.A.W., 1982. Evolutionary trends of theinner enamel anatomy of deciduous molars fromSangiran (Java, Indonesia). In: Kurten, B. (Ed.),Teeth: Form, Function, and Evolution. ColumbiaUniversity Press New York, pp. 350–365.

mCT of Primate Molars 115
Martin, L.B., 1983. Relationships of the later MioceneHominoidea. Ph.D. Dissertation, UniversityCollege London, England.
Martin, L.B., 1985. Significance of enamel thicknessin hominoid evolution. Nature 314, 260–263.
Martin, L.B., Olejniczak, A.J., Maas, M.C., 2003.Enamel thickness and microstructure in pitheciinprimates, with comments on dietary adaptationsof the middle Miocene hominoid Kenyapithecus.Journal of Human Evolution 45, 351–367.
Miller, G.S., 1915. The jaw of Piltdown Man. Smith-sonian Miscellaneous Collections 65, 1–31.
Olejniczak, A.J., 2005. Mesiodistal and angular obliquityin studies of dental sections. American Journal ofPhysical Anthropology supplement, 126, 160.
Olejniczak, A.J., Grine, F.E., 2006. Assessment ofthe accuracy of dental enamel thickness usinghigh-resolution micro-focal X-ray computedtomography. Anatomical Record Part A 288A,263–275.
Olejniczak, A.J., Grine, F.E., 2005. High-resolutionmeasurement of Neandertal tooth enamelthickness by micro-focal computed tomography(mCT). South African Journal of Science 101,219–220.
Olejniczak, A.J., Martin, L.B., Ulhaas, L., 2004.Quantification of dentine shape in anthropoidprimates. Annals of Anatomy 186, 479–485.
Schwartz, G.T., 2000. Taxonomic and functionalaspects of the patterning of enamel thicknessdistribution in extant large-bodied hominoids.American Journal of Physical Anthropology111, 221–244.
Senut, B., Pickford, M., Gommery, D., Mein, P.,Cheboi, K., Coppens, Y., 2001. First hominidfrom the Miocene (Lukeino Formation, Kenya).Comptes Rendus de L’Academie Des SciencesSerie II Fascicule A- Sciences De La Terre EtDes Planetes 332, 137–144.
Shellis, R.P., Beynon, A.D., Reid, D.J., Hiiemae, K.M.,1998. Variations in molar enamel thicknessamong primates. Journal of Human Evolution35, 507–522.
Shimizu, D., 2002. Functional implications of enamelthickness in the lower molars of red colobus(Procolobus badius) and Japanese macaque(Macaca fuscata). Journal of Human Evolution43, 605–620.
Simons, E.L., 1976. The nature of the transitionin the dental mechanism from pongids tohominids. Journal of Human Evolution 5,511–528.
Skinner, M.M., Kapadia, R., 2005. An evaluation ofmicroCT for assessing in 3-D the concordanceof dental trait expression between the dentin-enamel junction and the outer enamel surfaceof modern human molars. American Journalof Physical Anthropology Supplement, 126,191–192.
Smith, T.M., Olejniczak, A.J., Martin, L.B., Reid,D.J., 2005. Variation in hominoid molar enamelthickness. Journal of Human Evolution 48,575–592.
Spoor, C.F., Zonneveld, F.W., Macho, G.A., 1993.Linear measurements of cortical bone and dentalenamel by computed-tomography – applicationsand problems. American Journal of PhysicalAnthropology 91, 469–484.
Suwa, G., Kono, R., 2005. A micro-CT based studyof linear enamel thickness in the mesial cuspsection of human molars: reevaluation ofmethodology and assessment of within-tooth,serial, and individual variation. AnthropologicalScience 113, 273–289.
Ulhaas, L., Henke, W., Rothe, H., 1999. Variationin molar enamel thickness in genera Cerco-pithecus and Colobus. Anthropologie 37,265–271.
White, T.D., Suwa, G., Asfaw, B., 1994. Australo-pithecus ramidus, a new species of earlyhominid from Aramis, Ethiopia. Nature371,306–312.
Yang, Z., 1991. Ultrasound surface imagingand the measurement of tooth enamelthickness. Ph.D. Dissertation, University ofManchester, UK.
Copyright © 2022 FDOKUMEN