M&G plc Business Overview
34
M&G plc Business Overview
-
Upload
khangminh22 -
Category
Documents
-
view
1 -
download
0
Transcript of M&G plc Business Overview

M&G plc Business Overview

an Asset Manager and Asset Owner…… focused on delivering great customer outcomes
through active, high-value added solutions
£367bn(FY 2020)
more than 800institutional clients
c. 5.3 millionretail customers
Our History Customers Geographies AUMA1
…serving 28markets
25 locations…
Who we areA unique business mix
2017
1931
1848
2019
1. Asset Under Management and Administration 2

3
Our investment caseDifferentiated proposition and capabilities to deliver attractive returns
Customerproposition
Investment capabilities
Financialreturns
• Diversified and resilient sources of earnings
• Strong, long-term, capital and cash generation
• Stable or increasing dividend policy
• Capital-efficient growth opportunities
Note: All figures refer to position as of FY 2020
• Leading investment house with expertise in high-value added solutions with resilient margins
• World class Private Asset franchise with £67bn AUMA and an attractive fee model
• Unique PruFund offering thanks to UK’s largest With-Profits Fund (£143bn AUMA)
• Integrated retail offering in the UK including advice, platform, and investment solutions
• One of the UK and Europe’s strongest brands for institutional asset mgmt.
• Expanding international network of 23 distribution offices serving 28 markets
4
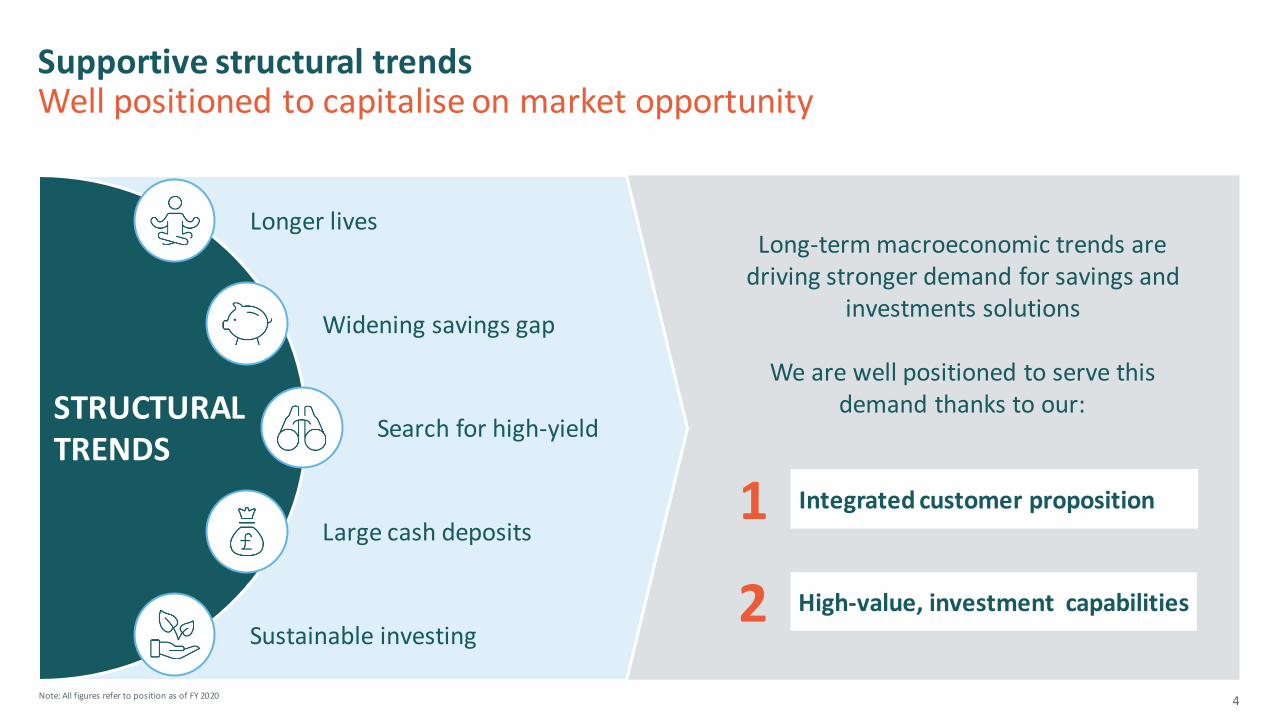
Supportive structural trendsWell positioned to capitalise on market opportunity
Note: All figures refer to position as of FY 2020
Long-term macroeconomic trends are driving stronger demand for savings and
investments solutions
We are well positioned to serve this demand thanks to our:STRUCTURAL
TRENDS
Widening savings gap
Longer lives
Sustainable investing
Search for high-yield
Large cash deposits
High-value, investment capabilities
Integrated customer proposition
2
1

With-Profits Fund (£143bn)
Managed for profitable growth
Sustainable value creation
Includes all open products
Savings & Asset Management
£232bn
Managed for capital and efficiency
Sticky assets, earnings and cashflows
Closed to new customers
Heritage
£134bn
Unique proposition expanding beyond PruFund
End-to-end offering in wealth management
Integrated distribution platform (i.e. Ascentric)
Integral component of the With-Profit Fund
Stable earnings contribution for 10+ years1
Provides scale to internal asset mgmt. franchise
Retail Savings(incl. PruFund)
£82bn
TraditionalWith-Profits
£84bn
Leading solutions and private assets offering
Diversified capabilities built over 20+ years
Attractive and resilient management fees
Stable earnings and capital generation
Upside opportunity from management actions
InstitutionalAsset Management
£86bn
Shareholder Annuities
£35bn
Comprehensive offering in active asset mgmt.
Established track record of product innovation
Playing at scale across Europe
Corporate pensions, closed to new schemes
Other unit-linked products
Retail Asset Management
£64bn
Other Heritage
£14bn
What powers M&G plcOur business segments
51. Assuming normal financial market development and policyholder behaviourNote: All AuMA figures refer to position as of FY 2020

£367.2bn AUMA
25 locations
28 markets
Americas£0.9bn
Distribution, operations and investment centres
Retail Asset Management
Institutional Asset Management
HeritageRetail Savings
Europe£44.6bn
Asia-Pac£9.6bn
Middle East& Africa1
£5.2bn
UK£306.9bn134
82
61
7.3
2.3
16
28
0.2
0.7
28
2 Corporate Assets
6
Our international footprint
1. Assets from Prudential Investment Managers South Africa recorded on a proportional basis in line with M&G’s 49.99% associate shareholdingNote: All AUMA figures refer to position as of FY 2020, based on the country of the underlying client

1. Total change in Solvency II surplus before capital movements and dividends 7
Business target
3-year cumulativecapital generation1
£2.2bnAfter debt and head office costs, market movements
and tax
2020-22mid-point
target
Dividend policy
Expectations forordinary dividends:
Stable or increasingTo develop broadly in l ine with capital generation over the longer term
1)
Two payments per yearinterim dividend being 1/3 of the previous full year
2)
2020 full year ordinary
dividend of £465m3)
Business target and dividend policyOur financial management framework
Leverage ratio
• FY20 position at 30%
• Underpinned by strong Heritage cashflows
• Aim to reduce gradually over time
Solvency ratio
• FY20 Shareholder Solvency ratio at 182%
• Comfortable level given the nature of the business we are writing
HoldCo Liquidity
Ensure sufficient liquid resources to cover expected cash outflows for at least 1 year,
including dividend
Assessing our position relative to:
Financial Management

8
Key messages
Differentiated and high-value added savings and investments solutions2
1 Unique and compelling business mix being both an Asset Manager and an Asset Owner
Attractive total return profile with capital discipline and profitable growth4
Well positioned to capture opportunities from demographic shifts and the search for yield3

The benefit of being both an Asset Manager and Asset Owner

With
-Pro
fits Fun
d
(£1
43
bn
)
64
86
82
84
35
142
Retail Asset Management
Institutional Asset Management
Retail Savings (incl. PruFund)
Traditional With-Profits
Shareholder AnnuitiesOther Heritage
10
Corporate Assets1
Our assets baseIntroducing the Asset Owner and the Asset Manager
1. Includes £0.8bn Other Savings and Asset Management AUMA; 2. Includes PAC and Ascentric customers, Corporate Assets and Other Assets Under Administration; 3. Prudential Assurance Company
Group View: £367bn AUMA
150
217Assets administered on behalf of Group customers2
3rd Party AssetsManaged by M&G
£217bn
Asset Owner view
150
134
83
£284bn
3rd Party AssetsManaged by M&G
PAC3 Assets managed by M&G
Other Group Assets
Asset Manager view
Sav
ing
s &
Ass
et M
anag
em
ent
Her
itag
e

Being both Asset Owner and Asset ManagerWhy the total is greater than the sum of the parts
1. Prudential Assurance CompanyNote: All AUMA figures refer to position as of FY 2020
What the Asset Owner bringsto the Asset Manager
Asset Owner andAsset Manager in action
• Provides scale to asset management operations
• Helps understand the needs of institutional clients
• Drives investment innovation and seeds new proposition
• Enhances diversity and resilience of earnings
• Enables to realise efficiencyand costs synergies
• Adds savings solutions (e.g. PruFund) to the broader investment proposition
Asset OwnerThe fiduciary manager for PAC1 clients,
with £217bn of assets under administration
Asset ManagerAn investment manager specialised in active high-value add solutions with £284bn assets under management
£134bn from the Asset Owner managed by the Asset Manager
11

How the Asset Owner Asset Manager relationship drives innovationThis symbiotic relationship benefits both internal and external clients
1. These are: European Private Placements, Leveraged Loans, UK long Lease Property, UK Direct Lending, Private ABS and Specialty Finance
By deploying seed capital, we can move quickly and
reap benefits for both policyholders and
shareholders
We have been one of the first non-bank investors in Europe in
several asset classes1
First mover
Our unique partnership model enables us to
launch innovative ideas and generate superior customer outcomes
This collaboration has strengthened with the creation of
a single Investment function
Seeding
Working closely with the Life fund, we gain a deep
understanding of the needs of large and
complex insurance funds
This allows us to develop bespoke and effective solutions to match
customers’ requirements
Idea generation
As we build expertise, sourcing capabilities, and
track record, we open these products to external
institutional clients
What starts as the answer to customer needs becomes a
competitive advantage
Externalisation
12

13
0.0
1.0
2.0
3.0
4.0
5.0
6.0
7.0
8.0
9.0
1999 2000 2001 2002 2003 2004 2005 2006 2007 2008 2009 2010 2011 2012 2013 2014 2015 2016 2017 2018 2019 2020
Internal Pru UK&E assets 3rd party Institutional assets
1. Includes all holdings in the portfolio; i.e. cash, Floating Rate Notes and Fx considerations
• One of the first non-bank investors in the asset class
• Development of capability and track record attracted third-party money
• Now a leader in the field, serving 200+ clients, with c. £8bn AuM1
Leveraged loans AuM in £bn
First pension fund client investment
Launch of pooled fund
One of the first non-bank investors in European leveraged loans
Asset Owner Asset Manager innovation in practicePrivate Assets as a key area of focus, the leveraged loans example

Our strategy

15
Our strategy pillars and how they support our ambitionPositioning M&G for long-term, sustainable growth
One M&GSupport the culture of One M&G: One team, aligned around one purpose, one vision and one mission; putting sustainability at the heart of everything we do
ProtectHeritage
Focus on retention, efficiency and control environment
BuildInternational
Deliver focused expansion in Asia, the Americas and Africa
Revitalise UK Re-establish market share in our largest business
ExpandInstitutional
Broaden capabilities offered in the UK and internationally
GrowEurope
Build on the success of our existing partnership approach
ProtectHeritage
RevitaliseUK
ExpandInstitutional
Build International
GrowEurope
One M&G

One M&G: Sustainability at the heart of everything we doA comprehensive approach covering all aspects of our business
161. In this context, “leadership” refers to members of the Executive Committee and their direct reports; 2. Includes Greenhouse Gas Protocol Scope 1 and 2 emissions and a minimum of 66% of upstream Scope 3 emissions (categories 1 to 8); 3. The smoothing element, similar return and similar volatility
`
Corporate Asset Manager
Asset Owner
Lead by example, delivering on ourpurpose to make the world a little better
Help customers manage and grow their savings, investing with a clear ambition
to make the world a little better
Deliver superior outcomes and positive societal impact through asset allocation
• Diversity and inclusion: 40% female and 20% ethnicity leadership1 by 2025 or sooner
• Climate change: Net zero corporate carbon emissions by 2030 or sooner2
• ESG policies: Embedding sustainability in executive objectives and remuneration
• Catalyst: A £5bn mandate from our With-Profits Fund aimed at delivering positive societal impact through innovation
• PruFund Planet: A range of funds being developed to deliver positive impact while retaining the same features of PruFund3
• Climate change: We are a founding member of the Net Zero Asset Manager initiative, committing to reach net zero across all AUMA by 2050 or sooner, working with clients to set interim targets for 2030
• Research and Engagement: Created a new ‘Stewardship & Sustainability’ team pooling existing expertise and hiring new talent
• Investment process: Put ESG requirements at the centre of all our investment decisions
• New funds: Recent launches include Global Climate Solutions, Sustainable Multi-Asset, Sustainable Allocation, Impact financing, ESG High-Yield and ESG EM Bond funds
• Continuous innovation: Pipeline includes thematic funds focused on Better Health, Diversity, and impact alternatives
One M&G
One M&G

Launch of M&G Wealth positions us for sustainable growthIntegrating retail asset management in the broader retail proposition
17
UK market dynamics
In the high value-add segment, customers look for support
and expertise, not just funds
M&G Wealth: An integrated offering along the value chain
Advisers seek help in serving customers, and outsource
portfolio construction
More consistent experience
Highervalue-add services
Better customer outcomes
Greater resilience
of margins
Longer business
persistency
An integrated and frictionless proposition is vital to attract advisers and serve customers
Advice Platform Investment solutions
• Added Ascentric’s partners to our already strong network of IFAs
• Launched a new self-employed model to grow our restricted adviser base (already over 220 agents)
• Gained new ISA and GIA capabilities through the acquisition of Ascentric
• We now provide the full range of digital wrappers
• Reshaping fund range with sustainability at its centre
• Combining asset mgmt., Strategic Asset Allocation and unique smoothing capabilities – Plan to add model portfolios
What it means for customers and our business:
Passives take the lion’s share of flows in the low value-add
end of the market
Revitalise UK

18
A successful, growing franchiseStrong performance, steady flows, resilient margins, growing AUMA
Why we are successful
We drive innovation through our Asset Owner / Asset Manager
combination
build long-term relationships with a core set of clients, turning
them into partners over time
add value by solving problemsand co-developing solutions that deliver client specific outcomes
progressively shift relationships to higher value solutions, such as
those including private assets
Flows, margins and asset baseSegregated and pooled mandates performance as % of revenues1
Performance
5-year 3-year
H1 20FY 19 FY 20H1 20FY 19 FY 20
Behind objectives
Outperforming objectives
2015 2016 2017 2018 2019 2020
Steadypositive flowsNet flows in £bn
1.2
6.64.1
(0.1)
5.1
(6.5)2
3.0 4.05.5 4.5 3.8
HealthypipelineCapital queue in £bn
ResilientmarginsAvg. fee margin in bps
86
71 777464
55 PublicAssets
PrivateAssets
Growingasset baseExternal AUMA in £bn
29 31 3034 35 37
1. Source : M&G plc – Excludes Retail, Real Estate and Institutional Buy & Hold mandates, CDO’s, Passive mandates and Restructuring. Term funds that exist for a given period and are recently incepted are excluded. Data is to Dec-20 or latest available. AUMA is net of cross holding, in GBP, performance on total return basis and all products are compared to benchmarks
as prescribed in prospectus or client IMA. Funds with track record less than specified periods are excluded, as are closed fu nds. At FY 2020, AUMA measured account for 67% of total. Data is correct at time of publication and subject to change; 2. Outfl ow of one particular £6.5bn low margin Institutional mandate as referred to in Prudential plc’s Full Year 2018 results
Expand institutional

19
Areas of strength Accelerating growth
Convert strong Solutions pipeline in new mandates and onboard clients
• Develop customised solutions in partnership with key wholesalers, leveraging the same approach we successfully use with institutional clients
• Client inspired innovation to deliver strategies that meet customer needs
Breadth of investment and asset allocation capabilities, and strength of wholesaler relationships
2
Complete launch of PruFund across different European markets
• Structure PruFund proposition to enable distribution to European wholesale clients across multiple countries
• Establish scalable operations to support large scale distribution
Unique With-Profits offering in strong demand from European partners
1
Further internationalise reach of institutional relationships
• Growth area in Europe (and Asia) where retail asset mgmt. is more challenged
• Develop insurance solutions for Insurers’ balance sheet assets
Depth of expertise and track record in serving institutional clients
3
Three priorities to capitalise on existing strengthsLeveraging established relationships and investment proposition
Grow Europe
Current focus
20
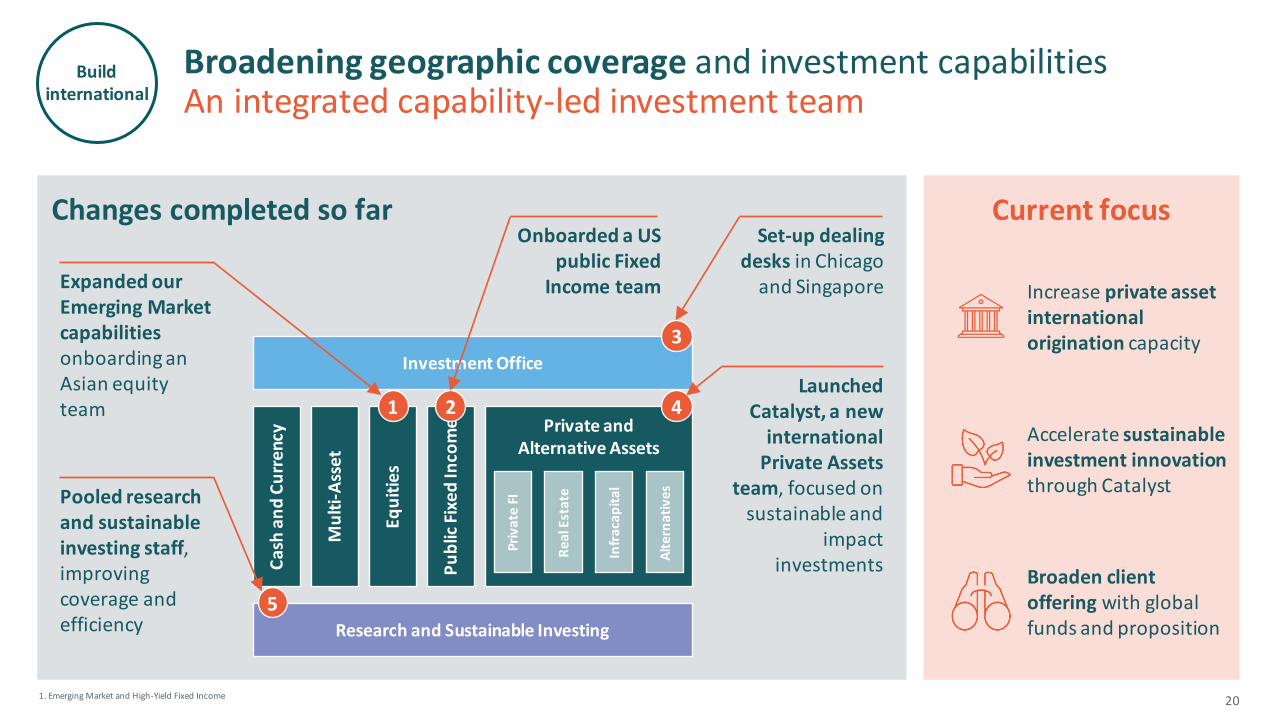
Onboarded a US public Fixed
Income team
Launched Catalyst, a new
international Private Assets
team, focused on sustainable and
impact investments
Expanded our Emerging Market capabilities onboarding an Asian equity team
Pooled research and sustainable investing staff, improving coverage and efficiency
Changes completed so far
Streamline fund offering with focus on Sustainable Investing
Current focus
Accelerate sustainableinvestment innovationthrough Catalyst
1. Emerging Market and High-Yield Fixed Income
Broadening geographic coverage and investment capabilitiesAn integrated capability-led investment team
Set-up dealing desks in Chicago
and Singapore
Private andAlternative Assets
Equ
itie
s
Priv
ate
FI
Rea
l Est
ate
Alt
ern
ativ
es
Infr
aca
pit
al
Cas
h a
nd
Cu
rren
cy
Pu
blic
Fix
ed
Inco
me
Mu
lti-
Ass
et
Research and Sustainable Investing
Investment Office
1 2 4
5
3
Broaden client offering with global funds and proposition
Increase private asset international origination capacity
Build international

In-force business underpins the long-term sustainability of dividendAnnuities and With-Profits cumulative UCG1 is £10bn2, net of tax
21
0.0
0.4
0.8
1.2
1.6
2.0
2.4
2021-2025 2026-2030 2031-2035 2036-2040 2041-2045 2045+
The £10bn does not include:
(+) Management actions, e.g. longevity releases, new hedges
(+) Institutional and Retail Asset Management earnings
(+) New Retail Savings business
(including new PruFund sales)
(+) Solvency II retained surplus from operating entities
(-) Net Debt and Head Office costs
£10bn Underlying Capital Generation for the period2
UCG1 for in-force Shareholder Annuities and With-Profits business (incl. PruFund)
1. Underlying Capital Generation, net of tax and run-off of hedge programmes2. Cumulative undiscounted total based on in-force business and reflecting economic conditions as of 31 December 2020
£bn
Protect Heritage

Financial Review

23
AUMA
£367bn
AdjustedOperating Profit
£788m
Shareholder SII coverage ratio
182%
Total CapitalGeneration
£995m
Note: £367bn AUMA includes £6.5bn of Assets under Advice 1. Ex dividend date for 2020 final ordinary dividend 18th March, payment date 28th April
We are committed to:
Our dividend policyconfirming our 2020final DPS of 12.23p1
£145m annual run-rate shareholder cost
savings by 2022
Our 2020-2022 target
£2.2bn Total Capital Generation
Strong and resilient performance in a challenging marketDelivering attractive returns as an independent business

1. Includes £11 billion of AUMA that for accounting purposes are no longer classified as Held for Sale2. Includes £0.8bn Other Savings and Asset Management AUMA
(0.1)
5.16.2
0.4
(7.4)
(12.1)
FY 2019 FY 2020
Retail Savings
Retail Asset Mgmt.
Institutional Asset Mgmt.
2 2
85 84
36 35
14 14
6382
7564
7786
AUMA at FY2019
Net flows -S&AM
Net flows -Heritage
Ascentric Market &other
movements
AUMA at FY2020
352367
(7) (7)
Traditional WP
S/H Annuities1
Other Heritage
Retail Savings
Retail Asset Mgmt.
Institutional Asset Mgmt.
o/w PruFund: £54bn
o/w PruFund:
£56bn
Savings & Asset Management net client flows (£bn)Movement in AUMA (£bn)
(1.3) (6.6)13
24
Corporate Assets2
AUMA and net client flows
16

25
Adjusted Operating Profit by source
1. Includes an amount of PruFund predecessor unitised With-Profits contracts2. Includes ‘Head Office Expenses’ and ‘Investment and other income on Hold Co assets’ – these were £(101)m and £25m respectively for FY 2020
(£m) FY 2019 FY 2020
Savi
ngs
& A
sse
t M
anag
emen
t
Asset Management 381 316
With-Profits (PruFund1) 55 44
Other 38 (28)
Total S&AM 474 332
He
rita
ge
With-Profits 187 207
Shareholder Annuities & Other 565 492
Total Heritage 752 699
Co
rpo
rate
C
en
tre
Debt Interest (29) (167)
Head Office2 (48) (76)
Corporate Centre (77) (243)
Adjusted Operating Profit 1,149 788
• Shareholders Annuities and Other AOP lower than 2019 mainly because of positive one-offs in 2019, i.e. £29m from changes to staff pension scheme and £17m higher mismatching profits
• Asset Management AOP affected by retail outflows and lower retail revenue margins
• Lower Other AOP due to deterioration in investment income and a small trading loss from Ascentric incurred in the second half
• FY 2020 Corporate Centre AOP reflects full year impact of Head Office and debt interest costs

1. Includes the effect of the Ascentric acquisition and the impact of the Group's share-based payment awards over and above the expense incurred2. Shareholder solvency II ratio
(0.1) (0.1) (0.1)(0.7)
4.5
1.3
4.8
£bnFY 2019
Operating Capital Generation
Market movements
Other movements
TaxDividends &
capital movements1
FY 2020
Own Funds 10.3 0.9 0.3 (0.1) (0.2) (0.6) 10.6
SCR 5.8 0.4 (0.4) - (0.0) 0.0 5.8
Surplus 4.5 1.3 (0.1) (0.1) (0.1) (0.7) 4.8
SII ratio2 176% 182%
Total Capital Generation£1.0bn
26
Solvency II surplus(£bn)
Total Capital Generation

FY 2020(£bn)
Present Value of future Shareholder Transfer (PVST)
from With-Profits Fund Capital requirement on PVST3
Shareholder Annuities & Other
2.7
8.0
1.3
4.0
0.5
Own Funds SCR
5.8
10.6
Sectoral
182% Solvency ratio£4.8bn surplus Own Funds
£3.2bn debt at nominal value
30% Solvency II Leverage ratio1
Other Own Funds, including:
£1.4bn TMTP2
£(2.1)bn risk margin
271. Calculated as nominal value of debt as % of total Group Shareholder Own Funds2. Transitional Measures on Technical Provisions; 3. Net of hedging
Shareholder Solvency II coverage ratio

28
Main drivers of earnings and capital generation by segment
Savings & Asset Management
Heritage
Corporate Centre
Segments Sources of earnings
1. Present Value of future Shareholder Transfer; unwind of PVST based on real world returns;2. Net of the run-off of the hedging programmes on Shareholder Transfers, which negatively affects capital generation; 3. Transitional Measures on Technical Provisions
Key driversAdjusted Operating Profit
Key driversUnderlying Capital Generation
Asset Management(Institutional, Retail, Internal)
Fees minus expensesFees minus expenses, and
changes in capital requirement
With-Profits(PruFund)
Shareholder transfers, net of hedgingUnwind of PVST1, new business strain,
release from in-force policies2
OtherResult of other businesses,
e.g. Ascentric, and investment incomeResult of other businesses,
e.g. Ascentric, and investment income
With-Profits(Traditional)
Shareholder transfers, net of hedgingUnwind of PVST1,
release from in-force policies2
Shareholder Annuities & Other
Returns on excess assets, margin release, and longevity experience
Returns on excess assets, margin release net of TMTP3, and release from run-off
Debt InterestInterest on subordinated debt net of fair
value premium amortisationInterest on subordinated debt
Head OfficeHead Office expenses and
investment income on HoldCo assetsHead Office expenses

Appendix

For Shareholders
Strategically
• Unique proposition
• Element of differentiated growth
• Anchor for our broader offering
Financially
• Stable source of earnings
• Capital-efficient proposition
• Store of value with back-end loaded profit signature
For customers
A savings product similar to traditional mutual funds…
• Multi-asset
• Daily unit price
• With a clear annual charge
… but with characteristics that make it stand out from the crowd
• Low volatility
• Smoothed returns
• Strong performance track record
For the With-Profits Fund
A proposition priced to recover the costs the With-Profits Fund expects to incur:
• Distribution and Admin expenses
• Investment management
• Smoothing and holding account
• Shareholder Transfer
Deviations from expectations are absorbed by the With-Profits estate
30
Uniqueness of PruFund offeringWhat is PruFund

Asset allocation as of December 2020
0%
10%
20%
30%
40%
50%
60%
70%
80%
90%
100%
2010 2011 2012 2013 2014 2015 2016 2017 2018 2019 2020
Europe
North America
Japan
UK
China
GEM
MEA
Asia ex. Japan
Europe
North America
Asia
UK
Hedge Fund
Infrastructure
Private Equity
US
Asia
UK and Europe
Alternative Credit2
Africa
Cash
TAA1
Equities Real Estate Alternatives Fixed Income
31
With-Profits FundStrategic Asset Allocation
1. Tactical Asset Allocation mandate; 2. Includes: Emerging Market, Convertibles, Bridge Loans, Private High-YieldSource: Allocation as of 31st of December2020 for OBMG, the largest of the funds within the With-Profits sub fund
Asset allocation evolution between 2010 and FY 2020
LEG
END

1. Data shows OBMG returns; OBMG is the largest of the funds within the With-Profits sub fund, backing PruFund Growth Fund – Past performance is not a guide to future performance. The value of an investment can go down as well as up and so customers may not get back the amount they put in
-5%
0%
5%
10%
15%
20%
25%
1950 1960 1970 1980 1990 2000 2010 2020
32
With-Profits FundHistorical returns
2006 2008 2010 2012 2014 2016 2018 2020
Cash SONIA Cumulative Rate
UK RPI Cumulative Rate
PruFund Growth Fund
ABI Mixed Investment 20-60% shares
96%
61%
47%
19%
PruFund Growth returns after charges(% returns above capital invested)1
Annualised 5-year rolling returns1 PruFund Growth returns vs. peers

33
Investor Relations contacts
+44 (0)20 8162 7307+44 (0)752 559 7694
Luca Gagliardi
Director of Investor Relations
+44 (0)20 8162 6624+44 (0)781 174 4668
Nicola Caverzan
Head of Credit and Rating Agency Relations
+44 (0)20 8162 6122+44 (0)781 020 3731
Maria Baines
Investor Relations Event Manager

Disclaimer
This presentation is made by M&G plc (“M&G”). For the purposes of this notice, ‘presentation’ shall mean and include the document that follows and any oral presentation, any question-and-answer session and anyother written or oral material delivered or distributed by M&G inconnection with it.
This presentation may contain certain ‘forward-looking statements’ with respect to M&G and its affiliates (the “M&G Group”), its plans, its current goals and expectations relating to future financial condition,performance, results, operating environment, strategy and objectives. Statements that are not historical facts, including statements about M&G’s beliefs and expectations and including, without limitation, statementscontaining the words ‘may’, ‘will’, ‘should’, ‘continue’, ‘aims’, ‘estimates’, ‘projects’, ‘believes’, ‘intends’, ‘expects’, ‘plans’, ‘seeks’, ‘outlook’ and ‘anticipates’, and words of similar meaning, are forward-lookingstatements. These statements are based on plans, estimates and projections as at the time they are made, and therefore persons reading this announcement are cautioned against placing undue reliance on forward-looking statements.
By their nature, forward-looking statements involve inherent assumptions, risk and uncertainty, as they generally relate to future events and circumstances that may be beyond the M&G Group’s control. A number ofimportant factors could cause M&G’s actual future financial condition or performance or other indicated results to differ materially from those indicated in any forward-looking statement. Such factors include, but arenot limited to, UK domestic and global economic and business conditions (including the political, legal and economic effects of the UK’s decision to leave the European Union); market-related conditions and risk,including fluctuations in interest rates and exchange rates, the potential for a sustained low-interest rate environment, corporate liquidity risk and the future trading value of the shares of M&G; investment portfolio-related risks, such as the performance of financial markets generally; the policies and actions of regulatory authorities, including, for example, new government initiatives; the impact of competition, economicuncertainty, inflation and deflation; the effect on M&G’s business and results from, in particular, mortality and morbidity trends, longevity assumptions, lapse rates and policy renewal rates; the timing, impact andother uncertainties of future acquisitions or combinations within relevant industries; the impact of internal projects and other strategic actions, such as transformation programmes, failing to meet their objectives; theimpact of operational risks, including risk associated with third party arrangements, reliance on third party distribution channels and disruption to the availability, confidentiality or integrity of M&G’s IT systems (orthose of its suppliers); the impact of changes in capital, solvency standards, accounting standards or relevant regulatory frameworks, and tax and other legislation and regulations in the jurisdictions in which the M&GGroup operates; and the impact of legal and regulatory actions, investigations and disputes. These and other important factors may, for example, result in changes to assumptions used for determining results ofoperations orre-estimations of reserves for future policy benefits.
Any forward-looking statements contained in this document speak only as of the date on which they are made. M&G expressly disclaims any obligation to update any of the forward-looking statements contained inthis document or any other forward-looking statements it may make, whether as a result of future events, new information or otherwise except as required pursuant to the UK Prospectus Rules, the UK Listing Rules,the UK Disclosure and Transparency Rules, or other applicable laws and regulations. Nothing in this announcement shall be construed as a profit forecast, or an offer to sell or the solicitation of an offer to buy anysecurities.
This presentation has been prepared for, and only for, the members of M&G and no other persons. M&G, its directors, employees, agents or advisers do not accept or assume responsibility to any other person towhom this document is shown or into whose hands it may come, and any such responsibilityor liabilityis expressly disclaimed.
M&G plc, incorporated and registered in England and Wales. Registered office: 10 Fenchurch Avenue, London EC3M 5AG. Registered number 11444019. M&G plc is a holding company, some of whose subsidiaries areauthorised and regulated, as applicable, by the Prudential Regulation Authority and the Financial Conduct Authority.
M&G plc is a company incorporated and with its principal place of business in England, and its affiliated companies constitute a leading savings and investments business. M&G plc is the direct parent company of ThePrudential Assurance Company Limited. The Prudential Assurance Company Limited is not affiliated in any manner with Prudential Financial, Inc, a company whose principal place of business is in the United States ofAmerica or Prudential plc, an international groupincorporated inthe United Kingdom.
34
M&G plc
Notes: All figures relate to continuing operations unless otherwise stated. Where relevant, comparative figures have been restated to include the results of entities acquired prior to the demerger as if those entities had always been combined, in l ine with merger accounting principles. Throughout this presentation, totals in tables and charts may not sum as a result of rounding.