
Molecular modeling and dynamics studies of Shikimate Kinase from Bacillus anthracis
Upload
independentCategory
view
2download
0
MFA for Overdetermined Systems Reviewed and Compared with RNAExpression Data to Elucidate the Difference in Shikimate Yield between Carbon-and Phosphate-Limited Continuous Cultures ofE. coli W3110.shik1
Gaspard Lequeux,*,† Louise Johansson,‡ Jo Maertens,† Peter A. Vanrolleghem,† and Gunnar Liden‡
BIOMATH, Department of Applied Mathematics, Biometrics and Process Control, Ghent University, Coupure Links 653,B-9000 Gent, Belgium, and Department of Chemical Engineering, Lund University, P.O. Box 124, SE-22100 Lund, Sweden
The present contribution focuses on the mathematical techniques used to solve steady statemetabolic models for the case of an overdetermined system. Even when parts of the system areunderdetermined it is possible to solve the model partially and obtain statistically meaningfulresults. This is illustrated with data gathered from a set ofE. coli W3110.shik1 phosphate- orcarbon-limited continuous cultures. It is shown that the low yield in shikimate for C-limitedcultures is not due to a lower flux going to the shikimate pathway but is caused by a highsecretion of byproducts. Carbon-limited cultures could be better for shikimate production thancarbon-abundant cultures provided the byproduct secretion is reduced. Finally, flux calculationsare compared with RNA expression data.
1. Introduction
Shikimic acid is an interesting starting material for theproduction of many chemical compounds, with as majorexample Tamiflu, used for treatment of influenza (1). As theextraction of shikimate from the plantIllicium is expensive,production strategies via fermentation are developed. One ofthe strains that has been genetically modified to produce moreshikimate isE. coli W3110.shik1 (2). Shikimate production,however, is very low under carbon-limiting conditions.
Metabolic flux analysis can be used to obtain more knowledgeabout the flux distribution of intracellular reactions. MFA isfrequently applied on underdetermined systems when thesolution of the model can only be calculated under certainassumptions, e.g., maximal biomass production (3). However,metabolic models can also be used when the system is over-determined, i.e., when there are more measurements availablethan degrees of freedom (4). The statistical methods discussedin this paper were initially developed for black box models (5,6) but can easily be applied on metabolic models (7).
In the first part of this contribution, those methods arereviewed. It will be clarified that one can still calculate somefluxes and perform statistical tests to check whether themeasurement data are consistent even if parts of the model areunderdetermined (7). The methods explained here are moregeneral than what can be found in refs 8 and 9.
In a second part, those methodologies are applied to a set ofexperiments aiming at finding differences in flux distributionbetween carbon-limited and carbon-abundant (phosphate-limited) cultures of theE. coli strain W3110.shik1 (2). Thisstrain was genetically modified to produce more shikimate (anintermediate of the aromatic amino acid pathway). Undercarbon-limited conditions, more byproducts can be found, suchas dehydro shikimate and dehydro quinate, and a lot less
shikimate is produced (2, 10) than under carbon-abundance. Itis shown that this lower shikimate yield under carbon-limitedconditions is not due to a lower flux going to the aromaticpathway. On the contrary there is an even higher flux going toit.
The last part of this work compares flux balancing with RNAexpression level measurements. Although it is sometimesattempted to solve the problem of parallel pathways with theaid of RNA expression levels (11), this is not done here becauseit is not expected to be possible (12). However, for some fluxesthe variations over different culture conditions correlates withthe RNA expression levels of the corresponding genes.
2. Materials and Methods
2.1. Experimental Setup.In the performed experiments theE. coli W3110 strain was used. This strain was modified toW3110.shik1, as described in ref 2.
Six phosphate-limited and four carbon-limited continuouscultures with W3110.shik1 were run at dilution rates varyingfrom 0.05 to 0.3 h-1.
A second set of experiments consisted of phosphate- andcarbon-limited chemostats of the wild-type W3110 and theshikimate-producing strain W3110.shik1 at a dilution rate of0.2 h-1. Each combination was done in duplicate. Besides inputand output fluxes, RNA expression levels were determined too.
2.1.1. Inoculum Preparation.The medium used for inoculumpreparation (100 mL) was the same for carbon-limited andphosphate-limited experiments. For W3110 (the wild-typestrain), the medium contained, per liter: 20 g of glucose (VWRInternational, Stockholm, Sweden), 7.5 g of K2HPO4, 0.3 g ofNH4Fe(III)-citrate, 2.1 g of citric acid monohydrate, 0.1 mLMgSO4‚7 H2O (1 M), 0.0037 g of (NH4)6(Mo7O24)‚4 H2O,0.0029 g of ZnSO4‚7 H2O, 0.0247 g of H3BO3, 0.0025 g ofCuSO4‚5 H2O, 0.0158 g of MnCl2‚4 H2O, 0.055 mg of thiamine(Sigma-Aldrich, Steinheim, Germany), and 1.2 mL of H2SO4
(96%) (VWR International). For W3110.shik1 the mediumadditionally contained 0.010 g ofp-hydroxybenzoic acid, 0.010
* To whom correspondence should be addressed. [email protected].
† Ghent University.‡ Lund University.
1056 Biotechnol. Prog. 2006, 22, 1056−1070
10.1021/bp060014u CCC: $33.50 © 2006 American Chemical Society and American Institute of Chemical EngineersPublished on Web 06/16/2006
g of potassiump-amino benzoate, 0.010 g of 2,3-dihydroxy-benzoic acid (vitamins), and 0.015 g of tetracycline hydrochlo-ride (antibiotic) (Sigma-Aldrich). Inoculum cultures were grownin 250 mL baffled E-flasks at 37°C at a shaker speed of 200rpm up to an OD-value of 1.5-2.5, to ensure exponentiallygrowth. The fermenter was inoculated with 40 mL of theinoculum culture (W3110.shik1) or 20 mL (W3110).
2.1.2.Culture Media. The glucose and mineral solutions weresterilized separately at 121°C for 20 min and thereafter mixed.Antibiotic solution, vitamins and trace metals, and MgSO4
solution were added by sterile filtration through a 0.2 mmMinisart cellulose acetate filter (Sartorius AG, Goettingen,Germany). All solutions were prepared using deionized water;1.5 L of medium was prepared for the batch cultivation. Theworking volume of the chemostat was around 1.3 L, and pHwas adjusted to 7.0 by addition of NH4OH (25%) before andafter sterilization.
2.1.3.Carbon-Limited CultiWations. The composition of theC-limitation medium for the batch phase and the chemostatphase of the W3110 was the same as for the preculture medium,except for some minor changes. The medium contained 0.13g/L antifoam 286 (Sigma-Aldrich). In addition, the glucoseconcentration was 10 and 25 g/L in batch and chemostat phase,respectively. The composition of the medium for growth ofW3110.shik1 was the same as that for W3110 except that italso contained 0.015 g/L tetracycline hydrochloride.
2.1.4.Phosphate-Limited CultiWations. The composition ofthe P-limited medium in batch phase was, per liter: 20 g ofglucose, 92 mL of H3PO4 (85%), 5.39 g of NH4SO4, 3.32 g ofNaOH, 1.66 g of KOH (Sigma-Aldrich), 0.52 g of MgSO4‚7H2O, 0.133 g of antifoam 286, 3.73 mL of H2SO4 (96%); tracemetals (1): 0.093 g of FeSO4‚7 H2O, and 0.079 g of citric acidmonohydrate; trace metal (2): 0.0073 g of CoCl2‚6 H2O,0.00207 g of MnCl2‚4 H2O, and 0.00103 g of ZnCl (Sigma-Aldrich). The medium of W3110.shik1 also contained 0.015g/L tetracycline hydrochloride. In chemostat operation, thephosphate solution and the solution of the remaining mediumcomponents were fed separately to the fermenter. The phosphatefeed contained 0.9 mL/L H3PO4 (85%), whereas the second feedsolution contained all other components. Since the phosphatesolution contributed extra volume and thereby diluted the secondfeed solution the latter was up concentrated 1.3 times, e.g., theglucose concentration was 32 g/L, giving a concentration of 25g/L in the reactor.
2.1.5.Fermentation Methods.All fermentations were carriedout in a Biostat CT culture vessel (Sartorius BBI SystemsGmbH, Melsungen, Germany) with a maximum workingvolume of 3.5 L. Temperature (37°C), pH (7.0), stirring rate(750 rpm), and airflow rate (0.75 slpm) were controlled by theprogram MFCS/win shell 2.0 (Sartorius BBI) via the controlunit DCU Biostat C (Sartorius BBI). p O2 was measured withan InPro 6000 (Mettler Toledo Gmbh, Giessen, Germany). ThepH was measured with a pH-meter of type 405-DPAS-SC-K8S/120 (Mettler Toledo). For maintaining the pH at 7.0, H2SO4 (2M) and NH4OH (25%) were used in the C-limited case andH2SO4 (1 M) and NH4OH (12.5%) in the P-limited case. O2
and CO2 contents in the off gas were measured by an Innova1311 (INNOVA Air Tech Instruments, Ballerup, Denmark).Two balances and pumps were also coupled to the equipment,allowing precise measurement of the feed rate during chemostatoperation. Data from all equipment except for one of the pumpswere routinely logged by the data acquisition software.
In the C-limited case, chemostat operation was started whenthe glucose was finished (indicated by a rapid reduction of the
CO2 in the off-gas). In the P-limited case, the chemostat wasstarted when the phosphate was consumed (also seen as a smallpeak in the p O2). Establishment of steady state was confirmedfrom measurement of the off-gas composition. At least fiveretention times were allowed to pass before each steady-state.Sampling of OD and for metabolite analyses was carried out atfermentation start, end of batch, and at steady state duringchemostat operation. Samples for dry weight were taken at theend of the batch cultivation and at steady state during chemostatcultivation.
2.2. Analytical Methods.The analytical methods for deter-mining the amount of metabolites and cell dry weights aredescribed in ref 2; 3.5% of the dry weight was considered asash (13).
For the elemental composition of biomass, 50 mL offermentation broth was taken and centrifuged for 20 min at 2000g and 4°C. The pellet was washed once with 40 mL of icecold 0.9% NaCl and again centrifuged and decanted. The pelletswere then frozen in liquid nitrogen, vacuum-dried, and analyzedwith a CHNS-O analyzer (model EA1108, Carlo Erba Instru-ments, Italy) (4).
Sampling for transcriptome analysis was performed at steadystate. To minimize mRNA degradation, 50 mL falcon tubescontaining about 25 mL of ice were filled up as fast as possiblewith fermentation broth. The tubes were centrifuged for 1 minat 2000g, and the pellet was frozen in liquid nitrogen. In thephosphate-limited experiments, the mRNA sampling methodwas further improved by adding 1.25 mL of “stop-solution”,containing about 95% ethanol and 5% phenol, to the tubes priorto sampling.
Total RNA was extracted by using the Fastprep systemincluding the FastRNAPro Blue kit (Qbiogene, Montre´al,Canada). DNA present was degraded by addition of DNAse(VWR International) to a concentration of 0.2 UµL-1 . Thesamples were then held at 37°C for 20 min. The reaction wasinterrupted by addition of 0.5 M EDTA (Sigma-Aldrich) to afinal concentration of 10 mM. The RNA was further cleanedby using a RNeasy microelute Cleanup kit (Qiagen, Venlo, TheNetherlands). The quality of RNA was controlled by runningthe samples on a 1% TBE gel. The RNA samples were thensent to SWEGENE Microarray Resource Centre (Lund, Sweden)where the quality of RNA was further controlled by usingNanodrop ND1000 (Nanodrop Technologies, Wilmington,USA), which gives very accurate concentration and 260/280ratio figures. In addition quality testing of the RNA was carriedout using the Agilent Bioanalyzer 2100 (Agilent Technologies,Palo Alto, USA). cDNA synthesis, cDNA fragmentation, andpreparation of the hybridization mixture was carried outaccording to the recommendations of the manufacturer of themicroarrays (Affymetrix, Santa Clara, USA). Hybridization,washing, staining, and scanning of the microarrays (AffymetrixE. coli antisense genome arrays AS v2) were performed by usingGeneChip Hybridization Oven 640, GeneChip Fluidic Station450, and GeneChip Scanner 2500 (all from Affymetrix). Dataacquisition and gene expression data analysis was carried outusing MAS 5.0 (Affymetrix). A chip to chip normalization wasperformed in this program by scaling to a median intensity of100. For statistical analysis the Bayesian test was carried outusing a web-interface version of Cyber-T found at http://visitor.ics.uci.edu/genex/cybert/ (14). All presented microarraydata were significant at a 95% level. The mRNA data arediscussed in more detail in ref 15.
2.3. Theoretical Framework. A metabolic network modelis basically a system of linear equations. There are two methods
Biotechnol. Prog., 2006, Vol. 22, No. 4 1057
to solve such a system. The first one works directly withnullspace calculations (16). It is an elegant method but has amajor drawback: it is not possible to use internal fluxmeasurements to reduce the number of degrees of freedom inthe system. Only exchange rates can be used. The secondmethod (well described in ref 17) is more general and is theone that is used in this work. Both methods make use of thepseudo inverse of a matrix and its nullspace. The methods willbe reviewed briefly.
2.3.1.Pseudo InWerse of a Matrix. The solution of a linearsystem
can be found by calculating the inverse of matrixA:
This can only be done ifA is invertible, which means thatthe system of equations should be neither overdetermined norunderdetermined. In MFA those conditions are rarely fulfilled.
In the case of an overdetermined system a “least-squares”solution can be calculated by use of the (left) pseudo inverse:
The left pseudo inverse can thus be defined as (ATA)-1AT
and to be calculable,ATA must be nonsingular. This meansthat the number of rows ofA should be less or equal to thenumber of columns. Furthermore, those rows should be linearlyindependent.
A more general method, which can be applied to every matrix,to calculate the pseudo inverse is based on Singular ValueDecomposition (18) (a good explanation of SVD, the pseudoinverse, and its application in MFA can be found in ref 19).Given the matrixA with dimensions⟨m × n⟩, there existorthonormal matrixes:
so that
whereS is an⟨m × n⟩ dimensional nonsquare diagonal matrix.The elements on the diagonal are the singular values ofA. Thenumber of singular values that are not zero is equal to the rankof A. WhenA has full rank andm ) n, the inverse ofA is (theinverse of an orthonormal matrix is equal to its transposed)
The inverse of a diagonal matrix is calculated by invertingthe elements on the diagonal one by one. IfA is not fully rankedor A is not square, a partial inverse can be calculated byinverting only singular values inS that are not zero. This waythe pseudo inverse of every matrix can be calculated:
This makes it possible to calculate a solution not only whenthe system is fully or overdetermined but also when parts ofthe system are underdetermined. The next section explains howone can make a distinction, by use of the nullspace, betweenthose underdetermined parts (whose obtained solution is obvi-ously not unique) and the determined ones.
2.3.2 Nullspace. If the system as given in eq 1 is under-determined, the solution given with the pseudo inverse
is only one of the infinity of possible solutions. To determinewhich elements ofx have a single solution and to determine arelationship between the infinity of solutions for the otherelements ofx, the nullspace can be calculated.
The nullspace is defined as the set of linear independentvectors,xn, that fulfill the equation
The number of independent nullspace vectors is equal to thenumber of columns inA minus the rank ofA. From thedefinition it is clear that each nullspace vector can be added anarbitrary number of times to the base solution given in eq 8.Thus the complete solution is
wheref is a vector with as many elements as there are vectors(columns) in the nullspace ofA. For all possible values off thesolution remains valid.
Parallel pathways in the metabolic model typically yieldnullspace vectors if there are no fluxes measured from one ofthose pathways. Elements (rows) ofx that have only zeros inthe nullspace ofA are fully determined. Thus, a system ofequations can have some unknowns for which a unique solutioncan be found and some for which this is not possible.
2.3.3.Construction of the Metabolic Model. When gatheringthe reactions for the metabolic model, inevitably some errorsget in. Errors in stoichiometry were caught with the elementalconsistency test. Superfluous reactions were detected with thedead end test and removed. Both tests are described elsewhere(20).
Although the technique for solving the metabolic modelexplained further can cope with parallel pathways, we chose toremove them, to be able to fully solve the model and have allfluxes known. During the construction of the model, parallelpathways were detected with the method described in ref 20and removed.
2.3.4.Solution of the Metabolic Model. The matrix repre-sentation of a biochemical reaction network can be written as
werec is a vector containing the concentration of the differentmetabolites inside the cell, matrixW is the extended stoichio-metric matrix, and vectora is the vector with all the reactionrates. If steady state is assumed, the concentration of themetabolites inside the cell does not change and eq 11 can besimplified to
W is called the extended stoichiometric matrix because itcontains more than pure enzymatic conversions. The exchangeof metabolites with the environment is added as reactions takingfrom, or removing matter to a buffer (21). Thus input and output
Ax ) b (1)
x ) A-1b (2)
x ) (ATA)-1AT b (3)
U⟨m×m⟩ andV⟨n×n⟩ (4)
A ) USVT (5)
A-1 ) VS-1UT (6)
A# ) VS#UT (7)
x ) A#b (8)
Axn ) 0 (9)
x ) A#b + nullspace(A)f (10)
dcdt
) Wa(c) (11)
Wa ) 0 (12)
1058 Biotechnol. Prog., 2006, Vol. 22, No. 4
from the system is modeled as (e.g. glucose):
The corresponding rate in the flux vectora is the input rate forglucose.
In MFA the following representation is frequently used for ametabolic model (8, 9):
wherer is the net accumulation rate vector,W is the reactionrate vector, sensu stricto, andS is the stoichiometric matrix withthe different reactions in the rows and the metabolites in thecolumns. This equation can be rewritten as (I representing theidentity matrix augmented with some rows containing zeros,corresponding to the metabolites that have a zero exchange ratein eq 14):
which matches eq 12.Equation 12 is split up in two parts: one for the rates that
are measured and thus known (subscript m) and one for therates to be calculated (subscript c):
This equation can be solved forac:
2.3.5.Redundant Measurements. The solution obtained ineq 17 can be substituted into eq 16:
As a matrix multiplied with its nullspace is equal to zero, thisequation can be rewritten as
When the system is overdetermined, i.e., when there are moremeasurements than degrees of freedom (and assuming themeasurements do not agree perfectly), the terms befoream ineq 19 form a nonzero matrix. All independent rows of thatmatrix can be combined in the redundancy matrixR (6, 22):
It should be noted that it is not because there is redundancyin the measurements that the nullspace of the extended sto-ichiometric matrix should be void. It is perfectly possible (andusual) to have parts of the system of equations that areoverdetermined and parts that are underdetermined.
2.3.6.Making Use of Redundant Measurements. Redundantmeasurements can be used to enhance the confidence in themeasurements. This is explained in ref 5 for black box models,but the method also applies to stoichiometric models (7). Thereal value of a measurementam is equal to the measured valueam minus some random noiseδ:
Equation 20 gives the general formula; applied in a statisticalcontext, distinction should be made between a real value of a
variable (that can never be known), the measurement of thatvariable (indicated with a tilde), and the estimate of that variable(indicated with a hat). Combining eqs 21 and 20 yields
E being the vector of residuals. It was proven that to minimizethe error δ on the measurements, the following objectivefunction J has to be minimized (23):
Pε is the variance covariance matrix of the vector of residuals,and it can be proven that
The variance covariance matrix ofδ (Pδ) is equal to thevariance covariance matrix of the measurementsPam.
The solution of the minimization problem of eq 23 gives anestimate forδ:
which in turn gives an estimate for the measurements (I is theidentity matrix):
That these estimated values are better than the measured onesis obvious from the variance covariance matrix of the estimatedvalues:
since the second term ofPam is always positive. Making anestimate of the measured fluxes thus reduces their uncertainty.
The estimated measurements should be used to calculate theunknown fluxes. Equation 17 becomes
and the variance covariance matrix of the unknown fluxesbecomes (19)
Only the rows and columns ofPac corresponding to elementsof ac that have no freedom left in the nullspace ofWc (i.e., forwhich the corresponding rows in the nullspace ofWc containonly zeros) are relevant.
2.3.7.Statistical Test of the Quality of the Measurements.In the previous section it was explained how to increase thereliability of the measured fluxes. It is also possible to checkwhether the measurements are consistent. If so the residualvectorε should be equal to zero. To investigate whether this isthe case, the following test statistich is used (24):
The H0 hypothesis of this statistic is that measurements areconsistent and thath is equal to zero.
This test statistic is equal to the objective functionJ from eq23 (5), and thus ifPδ
-1 is a diagonal matrix,h can be rewrittenas
f GLC (13)
[r0]) SW (14)
[S - I ] [Wr ]) 0 (15)
Wcac + Wmam ) 0 (16)
ac ) -Wc#Wmam + nullspace(Wc)f (17)
Wmam - Wc(Wc#Wmam + nullspace(Wc)f) ) 0 (18)
(Wm - WcWc#Wm)am ) 0 (19)
Ram ) 0 (20)
am ) am - δ (21)
R am ) R(am + δ) ) Rδ ) E (22)
J ) δTPε-1δ (23)
Pε ) RPδRT (24)
δ ) Pδ RT Pε-1 E (25)
am ) (I - PamRT(RPam
RT)-1R)am (26)
Pam) (I - Pam
RT(RPamRT)-1R)Pam
(27)
ac ) -Wc#Wm am + nullspace(Wc)f (28)
Pac) Wc
#WmPamWm
TWc#T (29)
h ) ETPε-1E (30)
Biotechnol. Prog., 2006, Vol. 22, No. 4 1059
with n being the number of elements in the vectoram, i.e., thenumber of measured fluxes. As the errorδ on the measurementis assumed to be normally distributed, the terms of the sum inthe equation above are normally distributed with variance equalto one and thus the test statistich follows, by definition, aø2
distribution.It can be proven that the number of degrees of freedom of
that ø2 distribution is equal ton minus the rank ofR.2.3.8.Vector Comparison Test. If the quality of the measure-
ments test rejects theH0 hypothesis that the errors are equal tozero, one can detect which measurement(s) is erroneous. Asimple approach would be to try to remove measurements oneby one and check if the statistical test passes (the serialelimination method of ref 5), but this is not statistically goodpractice as there are some issues with independency of the tests(6). A better approach is to use the vector comparison test (6).
Equation 20 can be written more explicitly as
with Ri representing the different columns ofR and ami thedifferent measured fluxes. If one of the measurements is reallywrong by an amountτ, the expected value (E) ofE is
The same reasoning can be applied when more measuredfluxes are wrong: the residual vectorE will then be a linearcombination of those erroneous measurements. For each com-bination of subvectorsRs of the redundancy matrixR, astatistical test is run withH0 hypothesis that the residual vectorE is a linear combination ofRs. The statistic used for this test
follows a ø2 distribution with rank(R) - rank(Rs) degrees offreedom (6). Running the test for each possible combination ofvectors ofR is time-consuming, but it makes no sense to takecombinations with more than rank(R) - 1 vectors, as the degreeof freedom of the corresponding statistic is then zero or less.This is also intuitive: a vector ofn elements is a linearcombination of every independent set ofn vectors of lengthn.As such, the problem of too many combinations becomes worsethe more fluxes measured, a luxury problem.
2.4. Implementation.Solving of and performing the statisti-cal tests on metabolic models was implemented in SciLab(www.scilab.org). Figure generating was done using a combina-tion of R (www.r-project.org), xfig (www.xfig.org) and Latex(www.latex-project.org).
All fluxes were expressed in mol L-1 h-1, and modelcalculations were performed with those units. In the figures,all fluxes are divided by the biomass flux and are thus expressedas fractions of that flux.
3. Metabolic Model
3.1. Biomass Composition.To investigate whether biomasscomposition varied for different dilution rates, the elemental
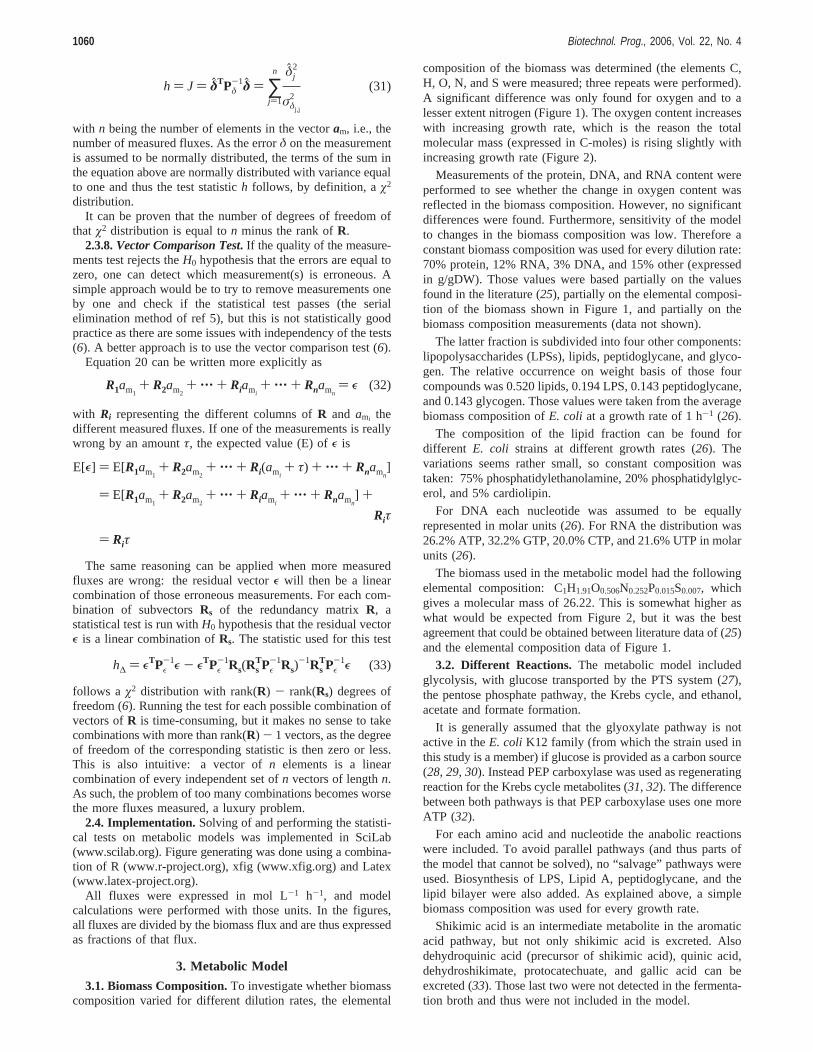
composition of the biomass was determined (the elements C,H, O, N, and S were measured; three repeats were performed).A significant difference was only found for oxygen and to alesser extent nitrogen (Figure 1). The oxygen content increaseswith increasing growth rate, which is the reason the totalmolecular mass (expressed in C-moles) is rising slightly withincreasing growth rate (Figure 2).
Measurements of the protein, DNA, and RNA content wereperformed to see whether the change in oxygen content wasreflected in the biomass composition. However, no significantdifferences were found. Furthermore, sensitivity of the modelto changes in the biomass composition was low. Therefore aconstant biomass composition was used for every dilution rate:70% protein, 12% RNA, 3% DNA, and 15% other (expressedin g/gDW). Those values were based partially on the valuesfound in the literature (25), partially on the elemental composi-tion of the biomass shown in Figure 1, and partially on thebiomass composition measurements (data not shown).
The latter fraction is subdivided into four other components:lipopolysaccharides (LPSs), lipids, peptidoglycane, and glyco-gen. The relative occurrence on weight basis of those fourcompounds was 0.520 lipids, 0.194 LPS, 0.143 peptidoglycane,and 0.143 glycogen. Those values were taken from the averagebiomass composition ofE. coli at a growth rate of 1 h-1 (26).
The composition of the lipid fraction can be found fordifferent E. coli strains at different growth rates (26). Thevariations seems rather small, so constant composition wastaken: 75% phosphatidylethanolamine, 20% phosphatidylglyc-erol, and 5% cardiolipin.
For DNA each nucleotide was assumed to be equallyrepresented in molar units (26). For RNA the distribution was26.2% ATP, 32.2% GTP, 20.0% CTP, and 21.6% UTP in molarunits (26).
The biomass used in the metabolic model had the followingelemental composition: C1H1.91O0.506N0.252P0.015S0.007, whichgives a molecular mass of 26.22. This is somewhat higher aswhat would be expected from Figure 2, but it was the bestagreement that could be obtained between literature data of (25)and the elemental composition data of Figure 1.
3.2. Different Reactions.The metabolic model includedglycolysis, with glucose transported by the PTS system (27),the pentose phosphate pathway, the Krebs cycle, and ethanol,acetate and formate formation.
It is generally assumed that the glyoxylate pathway is notactive in theE. coli K12 family (from which the strain used inthis study is a member) if glucose is provided as a carbon source(28, 29, 30). Instead PEP carboxylase was used as regeneratingreaction for the Krebs cycle metabolites (31, 32). The differencebetween both pathways is that PEP carboxylase uses one moreATP (32).
For each amino acid and nucleotide the anabolic reactionswere included. To avoid parallel pathways (and thus parts ofthe model that cannot be solved), no “salvage” pathways wereused. Biosynthesis of LPS, Lipid A, peptidoglycane, and thelipid bilayer were also added. As explained above, a simplebiomass composition was used for every growth rate.
Shikimic acid is an intermediate metabolite in the aromaticacid pathway, but not only shikimic acid is excreted. Alsodehydroquinic acid (precursor of shikimic acid), quinic acid,dehydroshikimate, protocatechuate, and gallic acid can beexcreted (33). Those last two were not detected in the fermenta-tion broth and thus were not included in the model.
h ) J ) δTPδ-1δ ) ∑
j)1
n δj2
σδj,j
2(31)
R1am1+ R2am2
+ ‚‚‚ + Riami+ ‚‚‚ + Rnamn
) E (32)
E[E] ) E[R1am1+ R2am2
+ ‚‚‚ + Ri(ami+ τ) + ‚‚‚ + Rnamn
]
) E[R1am1+ R2am2
+ ‚‚‚ + Riami+ ‚‚‚ + Rnamn
] +Riτ
) Riτ
h∆ ) ETPε-1E - ETPε
-1Rs(RsTPε
-1Rs)-1Rs
TPε-1E (33)
1060 Biotechnol. Prog., 2006, Vol. 22, No. 4
Sources for the reactions were mainly the ecocyc database(http://www.ecocyc.org/) (34), the database provided by theUniversity of California (http://systemsbiology.ucsd.edu/organ-isms/ecoli.html) (35), and the KEGG database (http://www.genome.ad.jp/kegg/) (36). The P/O ratio was set to 1.33(37).
The thus constructed model contained 137 reactions and 151metabolites of which 16 were exchangeable: Dhq, H2SO4, Ac,
Cit, Shi, H2O, O2, PiOH, GLC, CO2, Eth, Qa, Biom, Dhs, NH3,and FA. All parallel pathways were removed. There were nodead-end reactions, and the elemental consistency test waspassed (20).
There are 143 independent equations in the model and 137+ 16 unknowns. Thus, at least 10 measurements must beperformed. Twelve exchange fluxes were measured: O2, GLC,
Figure 1. Elemental composition of biomass (expressed in C-moles) at different dilution rates. H (upper left), O (upper right), N (lower left) andS (lower right): (2) C-limited cultures, (0) P-limited cultures. Error bars are for the standard deviation.
Figure 2. Molar mass of the biomass (in C-moles) as function of thedilution rate. Notation as in Figure 1.
Figure 3. Moles of carbon going in the reactor versus moles of carbonleaving the reactor. Open symbols are for influxes, and closed symbolsare for the carbon leaving the reactor: (4, 2) C-limited cultures, (O,b) P-limited cultures. Error bars represent the standard deviation.
Biotechnol. Prog., 2006, Vol. 22, No. 4 1061
CO2, Cit, FA, Shi, Dhs, Dhq, Qa, Ac, Eth, and Biom. Theconsistency of the measurements could thus be assessed, and if
the consistency test failed, the vector comparison test could beused to search for the dissonant measurement.
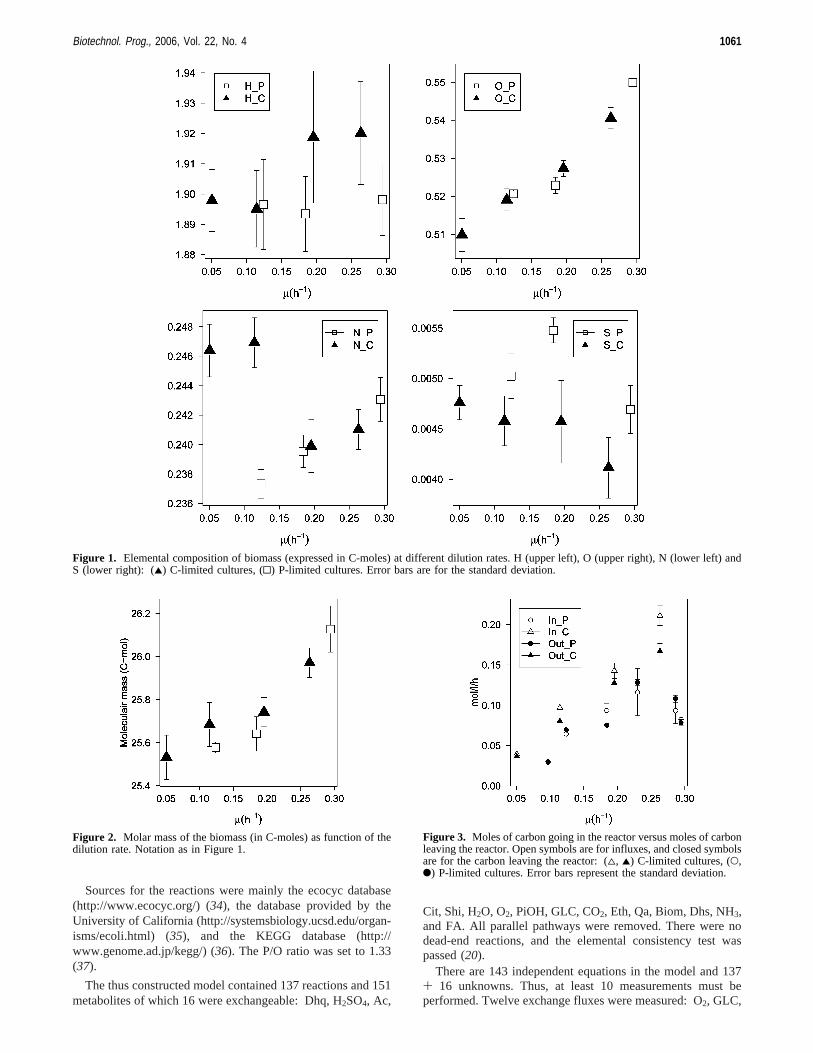
Figure 4. Relative fluxes (each flux is normalized against the biomass flux) in the glycolysis and pentose phosphate pathway for diffrerent growthrates: (0) phosphate-limited cultures, (2) carbon-limited cultures. Metabolites are typeset in roman font, and names of reactions are in italic. Theerror bars represent the standard deviation.
Figure 5. (Left) Moles of ATP hydrolyzed per mole of biomass formed. (Right) Moles of ATP per mole of biomass per hour that is hydrolyzed.From this data, the maintenance coefficients are calculated, assuming a constant P/O ratio of 1.l33. Notation as in Figure 4.
1062 Biotechnol. Prog., 2006, Vol. 22, No. 4
4. Results and Discussion
4.1. Carbon Balance. Only one statistically significantdifference could be detected between the carbon in- and outflux(Figure 3): the carbon balance of the carbon-limited culturewith a dilution rate of 0.12 h-1 is clearly not closed. It is alsofor this experiment that the model did not fit and no plausiblewrong measurement could be detected with the vector com-parison test. However, this experiment was kept in the data setsince the absolute error is small even though the coincidentalsmall variance on the measurements makes this error significant.Furthermore, the calculated fluxes were in accordance with thoseat other dilution rates.
4.2. Flux Analysis. Ten chemostat experiments were per-formed in which 12 exchange rates were measured. As explainedabove two measurements were redundant. The statistical testto evaluate whether the measurements agree could be run, andeven when the measurements did not agree, the vector com-parison test could point to the wrong measurement.
In four out of 10 experiments, the measurements were notconsistent. Running the vector comparison test revealed in onecase that the consumed amount of oxygen was too high and ina second case the amount of measured carbon dioxide. Remov-ing those measurements in the respective data sets made theremaining data consistent.
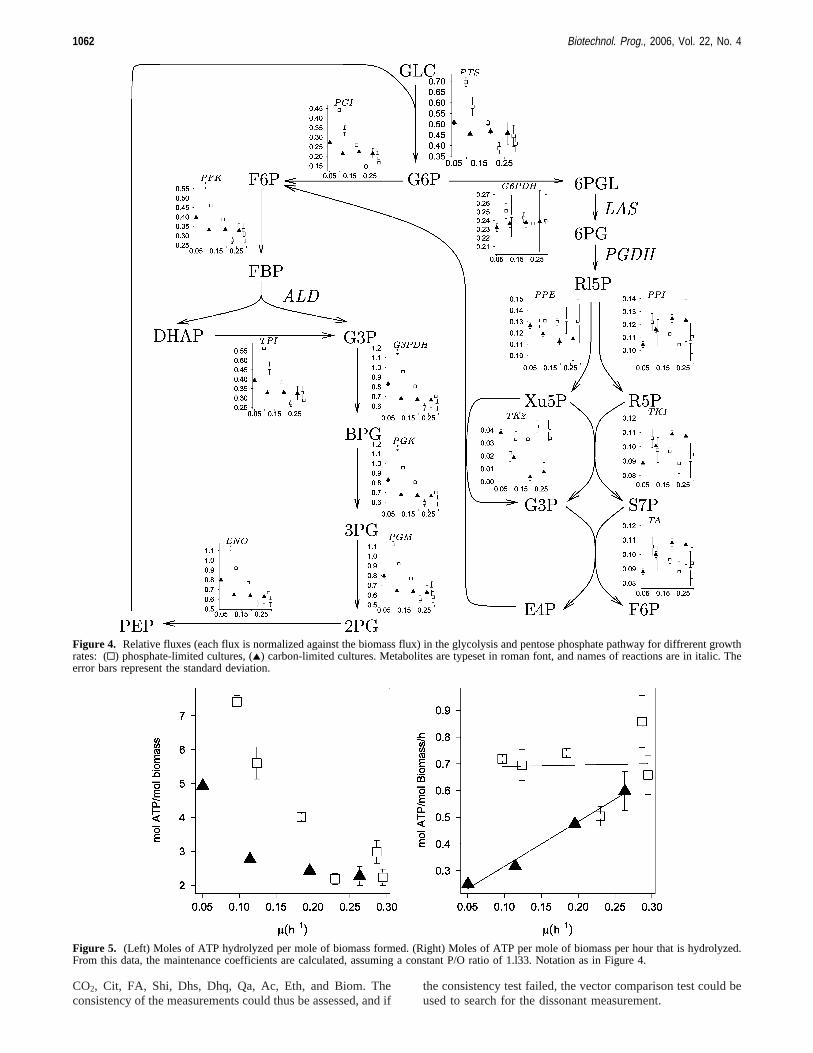
Figure 6. (Left) Moles of oxygen consumed and (right) moles of carbon dioxide produced per mole of biomass formed. Notation as in Figure 4.
Figure 7. Fluxes in the Krebs cycle and the fermentative pathways. Notation as in Figure 4.
Biotechnol. Prog., 2006, Vol. 22, No. 4 1063
In a third experiment, the ethanol measurement was detectedas inconsistent, but removing this one made the model predicta high ethanol flux, which was never detected in reality for anyof the dilution rates. However, in this dataset the oxygenmeasurement was identified as the second possible cause forthe nonfit of the model. Removing the oxygen measurementand keeping the ethanol measurement yielded a consistentdataset and realistic model predictions.
The fourth case (the carbon-limited case with growth ratearound 0.12 h-1, for which the carbon balance did not close)had only the ethanol measurement as potentially erroneous.Removing that measurement made the model predict an ethanolflux that was significantly not zero. Therefore, in the simulationsshown, the ethanol measurement was not removed. The datafrom this experiment were not discarded as they appear to agreewith the cultures run at other dilution rates.
Figure 4 shows the relative fluxes (in Figures 4, 7, and 8each molar flux is divided by the biomass flux) for the glycolysisand the pentose phosphate pathway. It can be seen that for thecarbon-limited cultures, each 1 mol of glucose gives 2 mol ofbiomass (the graph for the PTS reaction shows that the relativeflux-relative, as each molar flux is divided by the biomassflux-of glucose going into the cell is 0.5, thus to produce 1mol of biomass, 0.5 mol of glucose is consumed), or put anotherway, three of the six carbons of glucose are used for biomassconstruction. The same graph also shows that under P-limitedconditions, at low dilution rates, the biomass yield is lower,but strangely, at a dilution rate of 0.25 h-1 it tends to becomebetter than under carbon limitation (less glucose is consumedper mole of biomass produced than under carbon limitation).Looking at the ATP hydrolysis (Figure 5) and the respiration(Figure 6) there is no difference between the carbon-limited andphosphate-limited cultures at higher dilution rates. Thus, the
better biomass yield of P-limited cultures at high dilution ratesis not due to less CO2 production or less ATP hydrolysis. Thereason for it should be found in the aromatic pathway.
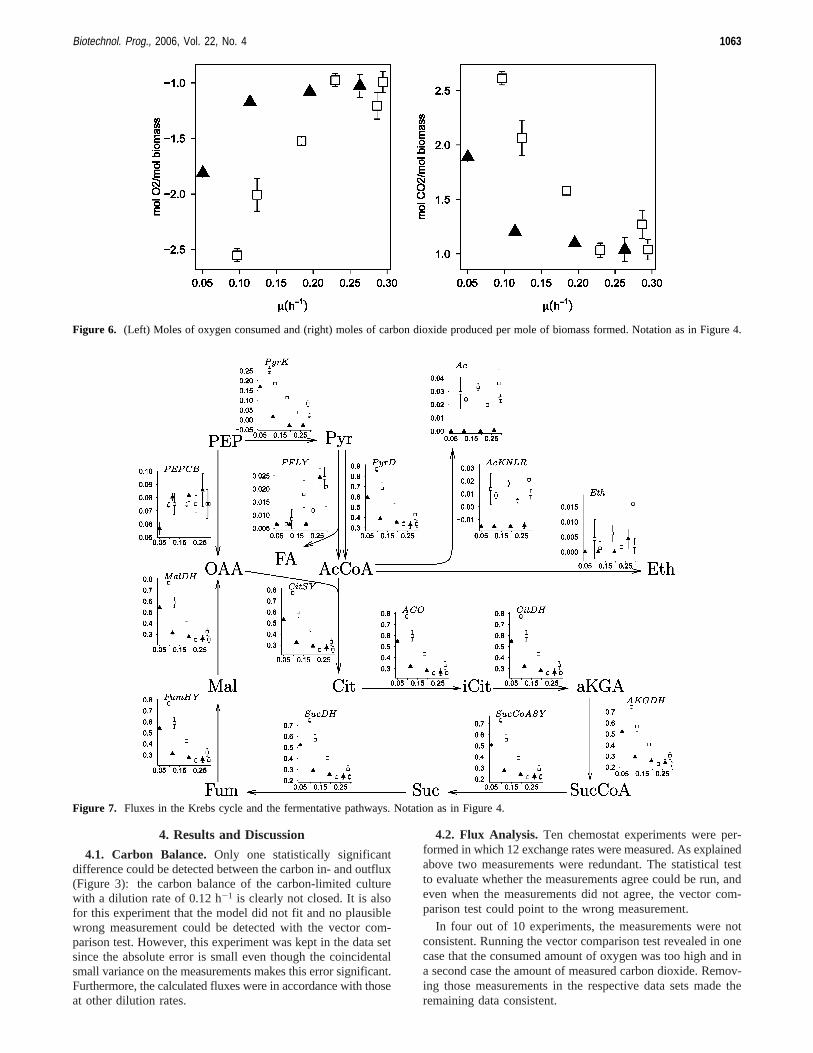
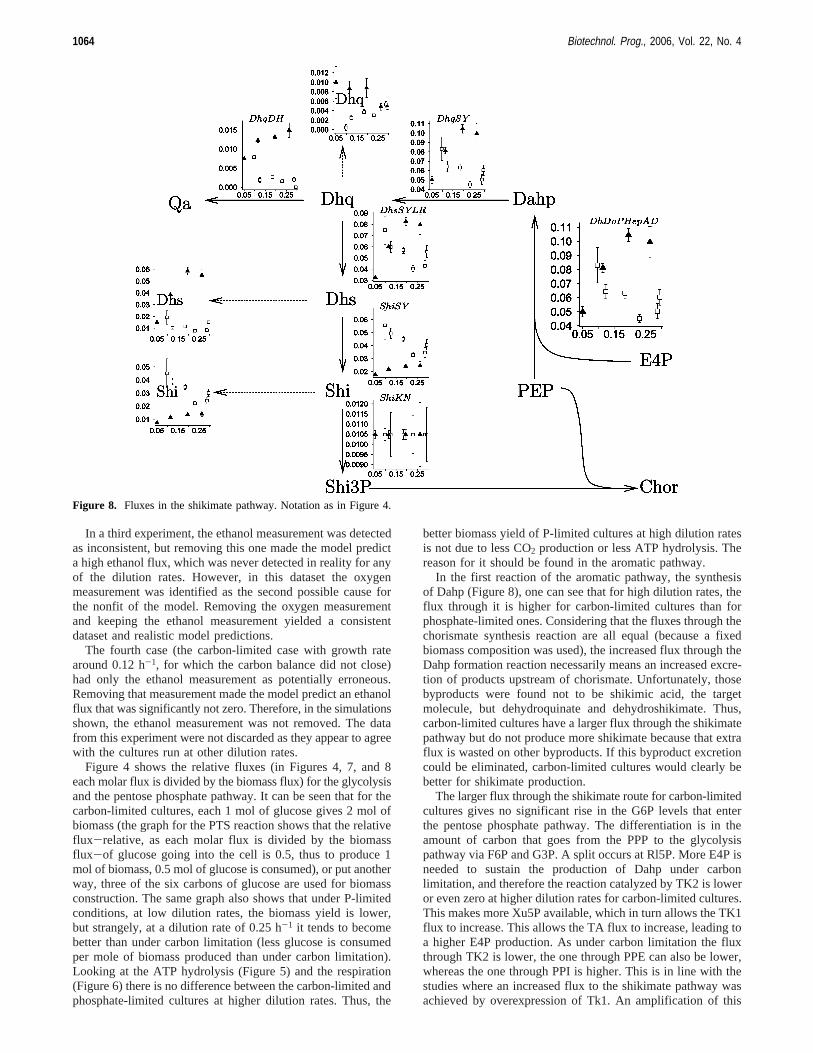
In the first reaction of the aromatic pathway, the synthesisof Dahp (Figure 8), one can see that for high dilution rates, theflux through it is higher for carbon-limited cultures than forphosphate-limited ones. Considering that the fluxes through thechorismate synthesis reaction are all equal (because a fixedbiomass composition was used), the increased flux through theDahp formation reaction necessarily means an increased excre-tion of products upstream of chorismate. Unfortunately, thosebyproducts were found not to be shikimic acid, the targetmolecule, but dehydroquinate and dehydroshikimate. Thus,carbon-limited cultures have a larger flux through the shikimatepathway but do not produce more shikimate because that extraflux is wasted on other byproducts. If this byproduct excretioncould be eliminated, carbon-limited cultures would clearly bebetter for shikimate production.
The larger flux through the shikimate route for carbon-limitedcultures gives no significant rise in the G6P levels that enterthe pentose phosphate pathway. The differentiation is in theamount of carbon that goes from the PPP to the glycolysispathway via F6P and G3P. A split occurs at Rl5P. More E4P isneeded to sustain the production of Dahp under carbonlimitation, and therefore the reaction catalyzed by TK2 is loweror even zero at higher dilution rates for carbon-limited cultures.This makes more Xu5P available, which in turn allows the TK1flux to increase. This allows the TA flux to increase, leading toa higher E4P production. As under carbon limitation the fluxthrough TK2 is lower, the one through PPE can also be lower,whereas the one through PPI is higher. This is in line with thestudies where an increased flux to the shikimate pathway wasachieved by overexpression of Tk1. An amplification of this
Figure 8. Fluxes in the shikimate pathway. Notation as in Figure 4.
1064 Biotechnol. Prog., 2006, Vol. 22, No. 4
enzyme in combination with an overexpressed DAHP-synthasehas shown to double the flow into the pathway in comparisonto the case where only DAHP-synthase was overexpressed (38).
The fluxes through glycolysis (Figure 4) follow the samepattern as those from ATP hydrolysis (Figure 5) and respiration(Figure 6). This pathway is mainly used to fuel the citric acidcycle (Figure 7) for generating ATP and biomass precursors.Interesting to note is the negative flux in carbon-limited culturesgoing through AcKNLR (Figure 7). Actually, no acetate wassupplied to the medium. The acetate consumed is provided bythe cysteine, ornithine, and lipid A synthesis reactions. Acetateconsumption in the presence of glucose, although uncommon,was reported in the literature (39).
The flux through PEP carboxylase (Figure 7) is completelydependent on the biomass formation reaction (as is the one
through the chorismate synthesis reaction, Figure 8). This canbe seen nicely as the constant flux for every phosphate-limitedculture. For the carbon-limited cultures, this is not true, as therewas some citric acid consumed in the experiment with the lowestgrowth rate, whereas it was produced in the other ones. Theamounts of citric acid consumed or produced were howeververy low: there is no significant difference between the carbon-limited and phosphate-limited cultures in the flux through PEPcarboxylase.
The calculated ATP hydrolysis flux allows to investigate themaintenance requirement for different growth rates and limitingconditions (Figure 5). Phosphate-limited cultures have a highernon-growth-associated maintenance compared to that of carbon-limited ones as under carbon abundance there is no need for aneffective carbon utilization. The non-growth-associated main-
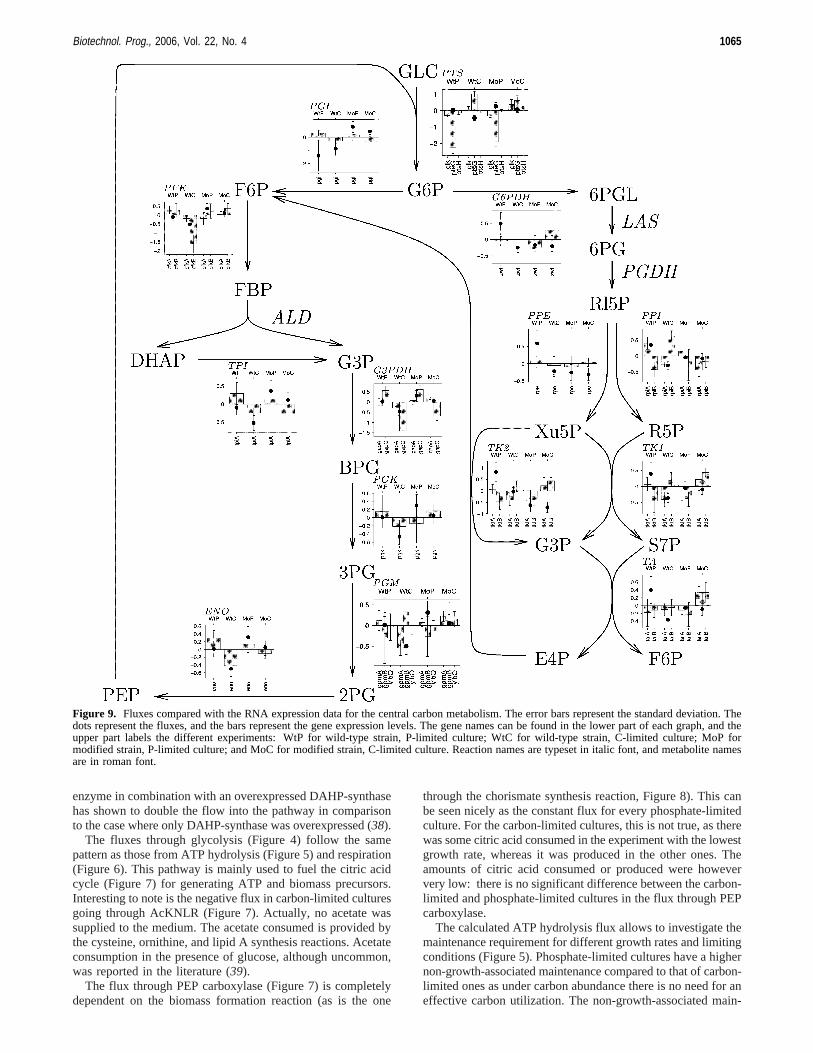
Figure 9. Fluxes compared with the RNA expression data for the central carbon metabolism. The error bars represent the standard deviation. Thedots represent the fluxes, and the bars represent the gene expression levels. The gene names can be found in the lower part of each graph, and theupper part labels the different experiments: WtP for wild-type strain, P-limited culture; WtC for wild-type strain, C-limited culture; MoP formodified strain, P-limited culture; and MoC for modified strain, C-limited culture. Reaction names are typeset in italic font, and metabolite namesare in roman font.
Biotechnol. Prog., 2006, Vol. 22, No. 4 1065
tenance for phosphate-limited cultures is 0.68 mol ATP per moleof biomass per hour. For carbon-limited cultures it is 0.15 mol/molBM/h. This conforms with the values reported in theliterature: 0.20 mol/molBM/h (39), 0.073 mol/molBM/h (40),and 0.12 mol/molBM/h (41).
The growth-associated maintenance for phosphate-limitedcultures is very low: 0.053 mol per mole of biomass. Forcarbon-limitation this is 1.68 mol/molBM/h. In literature bothlow values, 0.34 mol/molBM (39), and high values, 2.6 mol/molBM (41) can be found.
Apparently under carbon-abundant conditions, the cells, evenat the lowest growth rate, produce as much ATP as possibleand this production does not significantly increase (cannotincrease?) with higher growth rates. Carbon-limited cultureswant to optimize the utilization of the available glucose andtry to minimize the maintenance cost, resulting in an high growthdependent maintenance. However, the total maintenance isalways lower than in carbon-abundant cultures (in the right partof Figure 5, the curve of the P-limited cultures, squares, liesabove the curve of the C-limited ones, triangles). At a growthrate of 0.3 h-1 both curves meet each other. This is also thepoint at which the cells start to wash out. This suggests that themaintenance level of the phosphate-limited cultures is reallythe maximum that the cell can sustain.
4.3. RNA Expression Compared with Metabolic Fluxes.To investigate whether there exists a correlation between RNAexpression levels and metabolic fluxes, four different kinds ofcultures were performed in which flux data and RNA expressionlevels were determined. Two different experiments were donewith the wild-type strain (no genetic modifications for increasedflux through the aromatic pathway), one carbon-limited and onephosphate-limited, and two experiments were done with themodified strain, also one carbon-limited and one phosphate-limited. Each experiment was performed twice. The continuouscultures were all run at a dilution rate of 0.2 h-1.
In general RNA expression levels are compared by takingthe log2 of the fraction of expression levels under modifiedconditions against expression levels in a reference state. Thereference state in this case would be the wild-type fermentationunder carbon- or phosphate-limited conditions. As the RNAexpression levels have to be compared with the fluxes, the samemathematical treatment should be applied to the flux values(relative molar fluxes were used; each flux expressed in molL-1 h-1 was divided by the biomass flux). However, for thewild type, some fluxes in the shikimate-producing pathway arezero (more precisely, there is no quinic acid production). Forthe modified strain, some other fluxes are zero (no formic acidformation). Thus, for those fluxes, no good reference state exists.
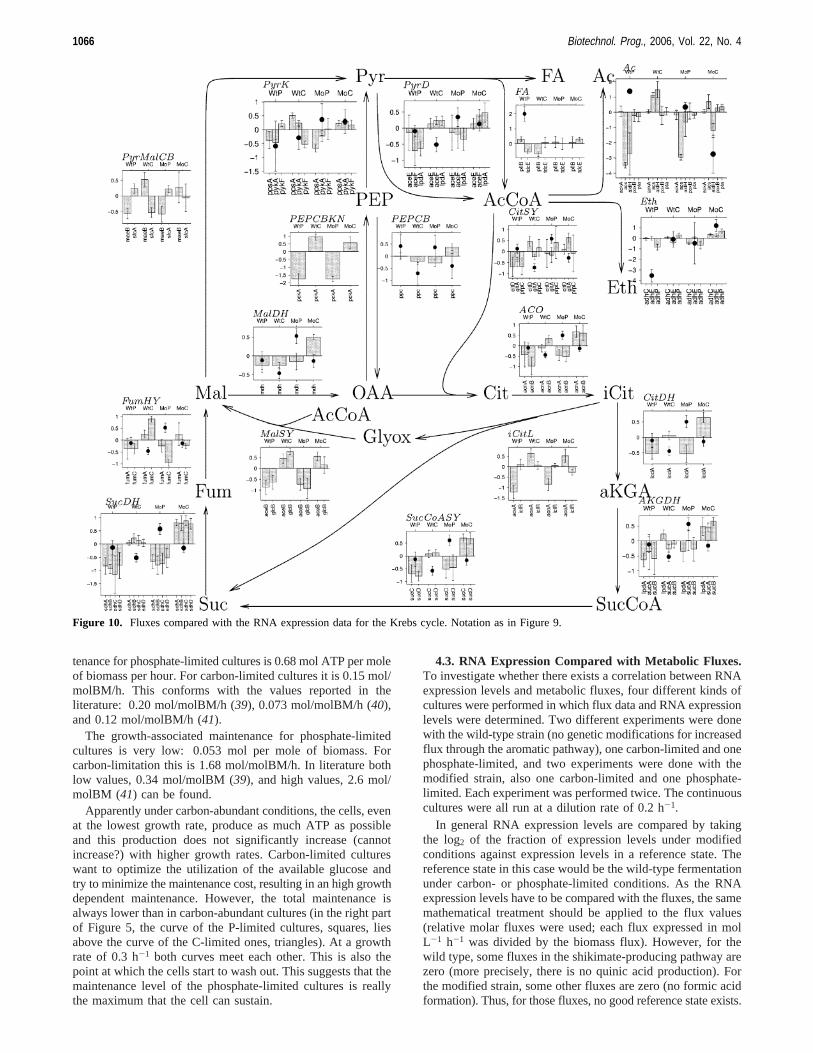
Figure 10. Fluxes compared with the RNA expression data for the Krebs cycle. Notation as in Figure 9.
1066 Biotechnol. Prog., 2006, Vol. 22, No. 4
Therefore, the mean of the four values was used as referencestate, each value was divided by it, and the log2 was taken.This was done for both the RNA expression levels and the fluxesthat were not zero (Figures 9-11).
The flux through a reaction is not always controlled by theenzyme level, as metabolic control analysis shows, but can alsobe limited by the availability of reactants. It is not expectedthat there is a direct correlation between RNA expression levelsand enzyme levels, even less between RNA expression levelsand metabolic fluxes. Only when RNA expression is absent canone say for sure that the corresponding flux is zero, and theabsence of expression of a gene can only be disproven, notproven (12). However, in some cases there can be qualitativecorrelations between RNA expression levels and metabolicfluxes (42). For some (key) reactions an increase in fluxcorrelates with an increase or decrease in RNA expression levels(Figures 9-11). Some correlations were detected in the glyco-lysis and the aromatic pathway, whereas in the PPP and thecitric acid cycle the reactions seem to be driven by supply anddemand and not by RNA expression of their genes.
In the following paragraphs examples are given of these threecases: positive correlation, negative correlation and no correla-tion.
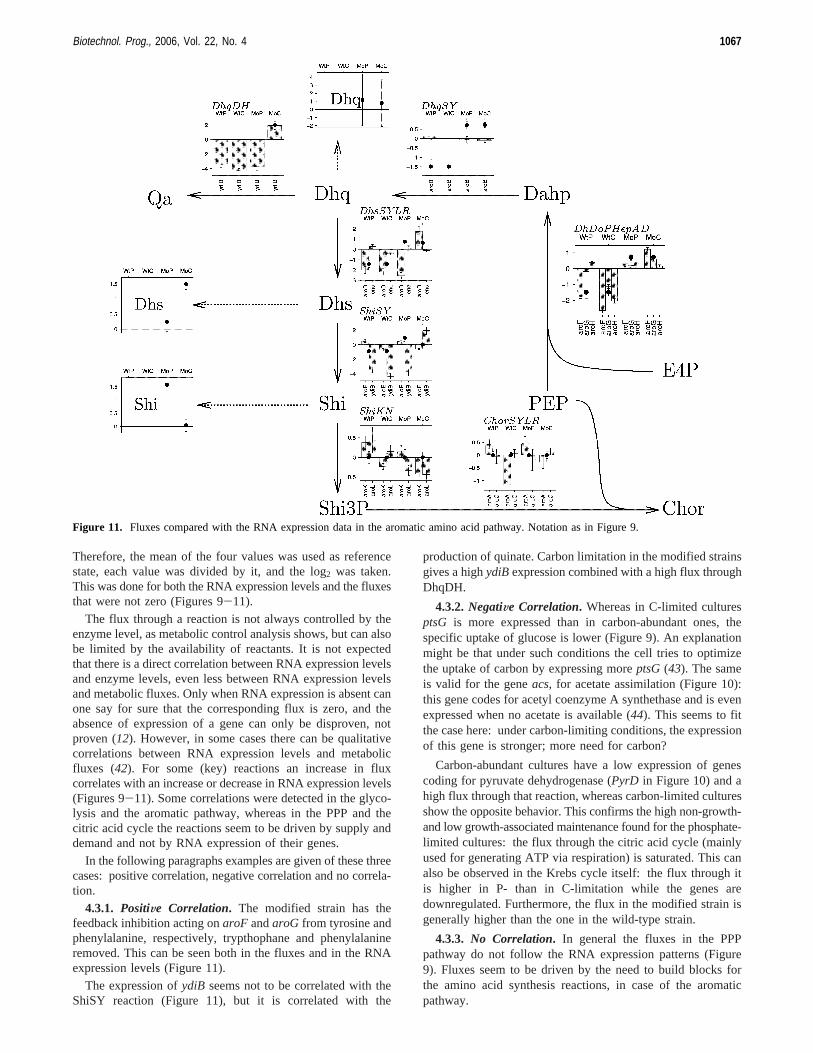
4.3.1. PositiWe Correlation. The modified strain has thefeedback inhibition acting onaroF andaroG from tyrosine andphenylalanine, respectively, trypthophane and phenylalanineremoved. This can be seen both in the fluxes and in the RNAexpression levels (Figure 11).
The expression ofydiB seems not to be correlated with theShiSY reaction (Figure 11), but it is correlated with the
production of quinate. Carbon limitation in the modified strainsgives a highydiBexpression combined with a high flux throughDhqDH.
4.3.2.NegatiWe Correlation. Whereas in C-limited culturesptsG is more expressed than in carbon-abundant ones, thespecific uptake of glucose is lower (Figure 9). An explanationmight be that under such conditions the cell tries to optimizethe uptake of carbon by expressing moreptsG(43). The sameis valid for the geneacs, for acetate assimilation (Figure 10):this gene codes for acetyl coenzyme A synthethase and is evenexpressed when no acetate is available (44). This seems to fitthe case here: under carbon-limiting conditions, the expressionof this gene is stronger; more need for carbon?
Carbon-abundant cultures have a low expression of genescoding for pyruvate dehydrogenase (PyrD in Figure 10) and ahigh flux through that reaction, whereas carbon-limited culturesshow the opposite behavior. This confirms the high non-growth-and low growth-associated maintenance found for the phosphate-limited cultures: the flux through the citric acid cycle (mainlyused for generating ATP via respiration) is saturated. This canalso be observed in the Krebs cycle itself: the flux through itis higher in P- than in C-limitation while the genes aredownregulated. Furthermore, the flux in the modified strain isgenerally higher than the one in the wild-type strain.
4.3.3. No Correlation. In general the fluxes in the PPPpathway do not follow the RNA expression patterns (Figure9). Fluxes seem to be driven by the need to build blocks forthe amino acid synthesis reactions, in case of the aromaticpathway.
Figure 11. Fluxes compared with the RNA expression data in the aromatic amino acid pathway. Notation as in Figure 9.
Biotechnol. Prog., 2006, Vol. 22, No. 4 1067
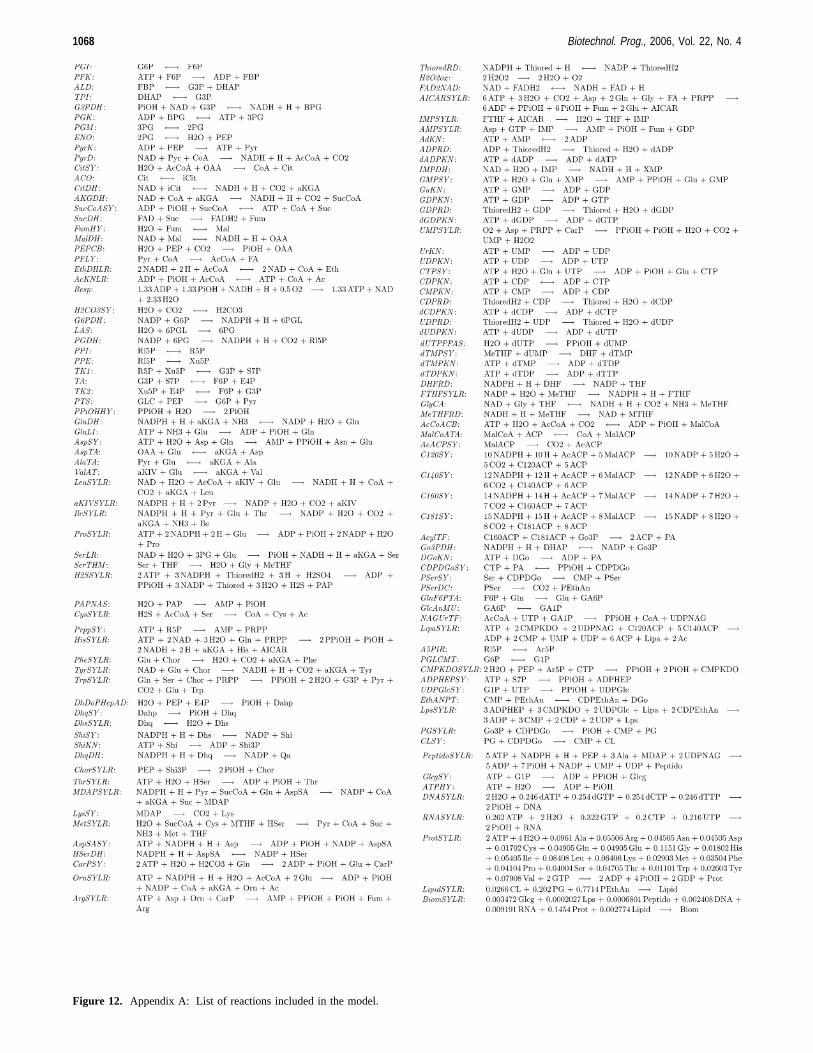
Figure 12. Appendix A: List of reactions included in the model.
1068 Biotechnol. Prog., 2006, Vol. 22, No. 4
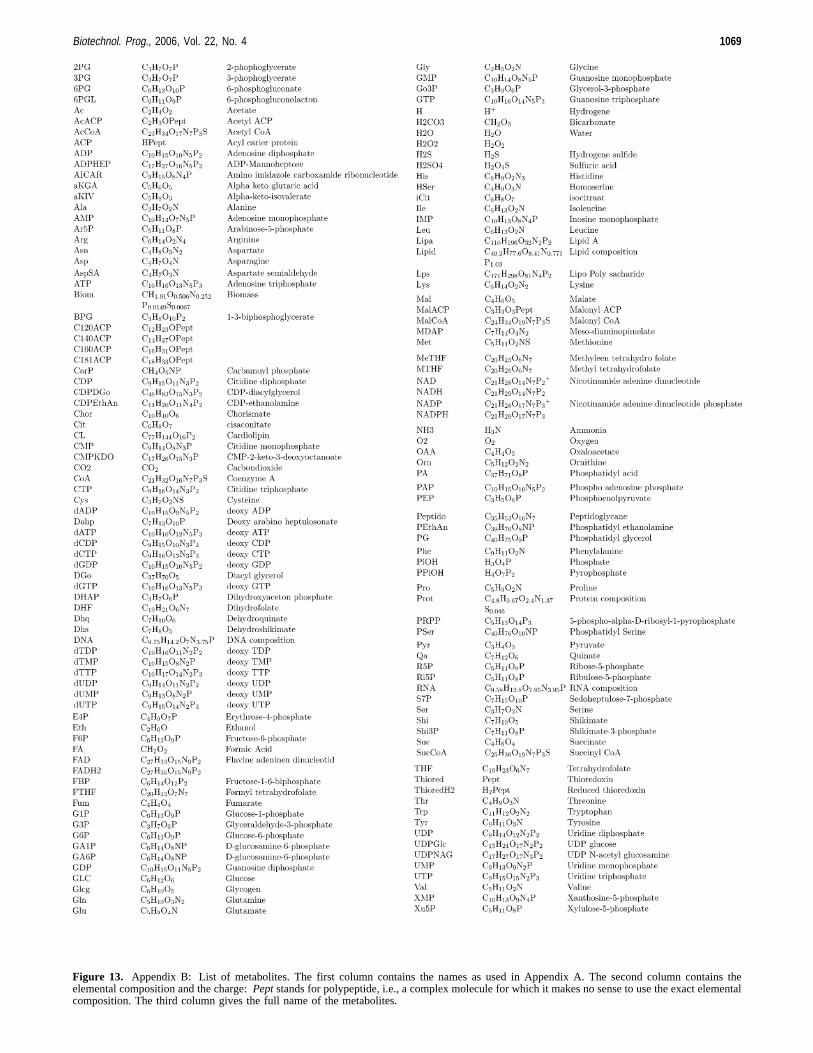
Figure 13. Appendix B: List of metabolites. The first column contains the names as used in Appendix A. The second column contains theelemental composition and the charge:Peptstands for polypeptide, i.e., a complex molecule for which it makes no sense to use the exact elementalcomposition. The third column gives the full name of the metabolites.
Biotechnol. Prog., 2006, Vol. 22, No. 4 1069
5. Conclusions
With the aid of MFA (of which an overview was given,including the error propagation of the measured fluxes to thecalculated ones and how to use redundant measurements to testfor consistency of the data), it was shown that in theE. coliW3110.shik1 strain, the difference in shikimic acid yieldbetween carbon-rich and carbon-limited cultures is not due toa lower flux in the aromatic amino acid pathway but to a largerexcretion of dehydroshikimic acid and dehydroquinic acid. Theflux entering the shikimate pathway was even higher in carbon-limited cultures, and this was due to or caused by less carbongoing from the pentose phosphate pathway to the glycolysis.
Flux data were compared with RNA expression data. Mostof the fluxes were not driven by the amount of expression ofthe corresponding gene. However, some fluxes were correlated,especially those from the altered genes:aroF and aroGfeedback inhibition, giving a higher flux through the aromaticpathway, andydiB overexpression, causing a high quinateproduction. Finally, a number of important fluxes are negativelycorrelated with the RNA expression level: this to maximizethe flux through that reaction, for example,ptsGunder carbon-limitation.
Acknowledgment
We thank Dr. Walter van Gulik of the Technical UniversityDelft (TUDelft) for taking care of the elemental analysis of thebiomass. This project was funded by the FWO-Vlaanderen(Fund for Scientific Research, Flanders, Belgium) grant G.0184.04and by a Marie-Curie scholarship (training site: QLK-3-CT-2001-60077) from the EU fifth framework program. Jo Maertensis a research assistant of the FWO-Vlaanderen.
References and Notes(1) De Clercq, E.Nat. ReV./Drug DiscoVery 2002, 1, 13-25.(2) Johansson, L.; Lindskog, A.; Silfversparre, G.; Cimander, C.;
Nielsen, K. F.; Lide´n, G. Biotechnol. Bioeng.2005, 92, 541-552.(3) Savinell, J.; Palsson, B.J. Theor. Biol.1992, 154, 421-454.(4) van Gulik, W. M.; de Laat, W. T. A. M.; Vinke, J. L.; Heijnen, J.
J. Biotechnol. Bioeng.2000, 68, 602-618.(5) Wang, N.; Stephanopoulos, G.Biotechnol. Bioeng.1983, 25, 2177-
2208.(6) van der Heijden, R.; Romein, B.; Heijnen, J.; Hellinga, C.; Luyben,
K. Biotechnol. Bioeng.1994, 43, 11-20.(7) Romein, B. Mathematical Modelling of Mammalian Cells in
Suspension Culture. Ph.D. Thesis, Technische Universiteit Delft, TheNetherlands, 2001.
(8) Stephanopoulos, G.; Aristidou, A.; Nielsen, J.Metabolic Engineer-ing. Principles and Methodologies; Academic Press: New York,1998.
(9) Nielsen, J.; Villadsen, J.; Lide´n, G. Bioreaction EngineeringPrinciples, 2nd ed.; Kluwer Academic/Plenum Publishers: NewYork, 2003.
(10) Knop, D. R.; Draths, K. M.; Chandran, S. S.; Barker, J. L.; vonDaeniken, R.; Weber, W.; Frost, J. W.J. Am. Chem. Soc.2001,123, 10173-10182.
(11) Huang, G. S.; Hong, M.-Y.; Liu, Y.-C.Life Sci.2003, 72, 2525-2531.
(12) A° kesson, M.; Fo¨rster, J.; Nielsen, J.Metab. Eng.2004, 6, 285-293.
(13) Battley, E. H.Appl. EnViron. Microbiol. 1995, 61, 1655-1657.(14) Long, A.; Mangalam, H.; Chan, B.; Tolleri, L.; Hatfield, G.; Baldi,
P. J. Biol. Chem.2001, 276, 19937-19944.(15) Johansson, L.; Lide´n, G. J. Biotechnol.2006, in press.(16) van der Heijden, R.; Heijnen, J. Unpublished work, 1995.(17) Noorman, H.; Luyben, K.; Heijnen, J.Biotechnol. Bioeng.1996,
49, 364-376.(18) Golub, G.; Loan, C. V.Matrix Computations, 3rd ed.; Johns
Hopkins University Press: Baltimore and London, 1996.(19) van der Heijden, R. State Estimation and Error Diagnosis for
Biotechnological Processes. Ph.D. Thesis, Technische UniversiteitDelft, Nederland, 1991.
(20) Lequeux, G.; Van der Heijden, R.; Van Den Broeck, S.;Vanrolleghem, P. InProceedings of the 9th IFAC Conference onComputer Applications in Biotechnology CAB9, Nancy, France,2004.
(21) Schilling, C.; Schuster, S.; Palsson, B.; Heinrich, R.Biotechnol.Prog. 1999, 15, 296-303.
(22) van der Heijden, R.; Heijnen, J.; Hellinga, C.; Romein, B.; Luyben,K. Biotechnol. Bioeng.1994, 43, 3-10.
(23) Madron, F.; Veverka, V.; Vanecek, V.AIChE J.1977, 23, 482-486.
(24) Reilly, P.; Carpani, R. In13th Chemical Engineering Conference;Montreal, Canada, 1963.
(25) Carlson, R.; Srienc, F.Biotechnol. Bioeng.2004, 85, 1-19.(26) Pramanik, J.; Keasling, J.Biotechnol. Bioeng.1997, 56, 398-
421.(27) Chen, R.; Yap, W. M. G. J.; Postma, P. W.; Bailey, J. E.
Biotechnol. Bioeng.1997, 56, 583-590.(28) Noronha, S. B.; Yeh, H. J. C.; Spande, T. F.; Shiloach, J.
Biotechnol. Bioeng.2000, 68, 316-327.(29) Phue, J.-N.; Shiloach, J.J. Biotechnol.2004, 109, 21-30.(30) Cozzone, A. J.Ann. ReV. Microbiol. 1998, 52, 127-164.(31) Sauer, U.; Lasko, D. R.; Fiaux, J.; Hochuli, M.; Glaser, R.;
Szyperski, T.; Wu¨thrich, K.; Bailey, J. E.J. Biotechnol.1999, 181,6679-6688.
(32) Wick, L. M.; Quadroni, M.; Egli, T.EnViron. Microbiol. 2001,3, 588-599.
(33) Draths, K.; Frost, J.J. Am. Chem. Soc.1991, 113, 9361-9363.(34) Keseler, I. M.; Collado-Vides, J.; Gama-Castro, S.; Ingraham, J.;
Paley, S.; Paulsen, I. T.; Peralta-Gil, M.; Karp, P. D.Nucleic AcidsRes.2005, 33, D334-D337.
(35) Reed, J. L.; Vo, T. D.; Schilling, C. H.; Palsson, B.Genome Biol.2003, 4, R54.
(36) Kanehisa, M.; Goto, S.Nucleic Acids Res.2000, 28, 27-30.(37) Varma, A.; Palsson, B.J. Theor. Biol.1993, 165, 477-502.(38) Draths, K. M.; Pompliano, D. L.; Conley, D. L.; Frost, J. W.;
Berry, A.; Disbrow, G. L.; Staversky, R. J.; Lievense, J. C.J. Am.Chem. Soc.1992, 114, 3956-3962.
(39) Varma, A.; Palsson, B.Bio/Technology1994, 12, 994-998.(40) Kayser, A.; Weber, J.; Hecht, V.; Rinas, U.Microbiology 2005,
151, 693-706.(41) Carlson, R.; Srienc, F.Biotechnol. Bioeng.2004, 86, 149-162.(42) Oh, M.-K.; Liao, J. C.Biotechnol. Prog.2000, 16, 278-286.(43) Hua, Q.; Yang, C.; Oshima, T.; Mori, H.; Shimizu, K.Appl.
EnViron. Microbiol. 2004, 70, 2354-2366.(44) Shin, S.; Song, S. G.; Lee, D. S.; Pan, J. G.; Park, C.FEMS
Microbiol. Lett. 1997, 146, 103-108.
Accepted for publication May 2, 2006.
BP060014U
1070 Biotechnol. Prog., 2006, Vol. 22, No. 4
Copyright © 2022 FDOKUMEN