Diversity and structure of soil microbiota of the Jinsha earthen ...
Upload
unitedstatesgeologicalsurveyCategory
view
4download
0
Methods for predicting peak discharge of floods causedby failure of natural and constructed earthen dams
Joseph S. WalderCascades Volcano Observatory, U.S. Geological Survey, Vancouver, Washington
Jim E. O’ConnorU.S. Geological Survey, Portland, Oregon
Abstract. Floods from failures of natural and constructed dams constitute a widespreadhazard to people and property. Expeditious means of assessing flood hazards arenecessary, particularly in the case of natural dams, which may form suddenly andunexpectedly. We revise statistical relations (derived from data for past constructed andnatural dam failures) between peak discharge (Qp) and water volume released (V0) ordrop in lake level (d) but assert that such relations, even when cast into a dimensionlessform, are of limited utility because they fail to portray the effect of breach-formation rate.We then analyze a simple, physically based model of dam-breach formation to show thatthe hydrograph at the breach depends primarily on a dimensionless parameter h 5 kV0/g1/ 2d7/ 2, where k is the mean erosion rate of the breach and g is acceleration due togravity. The functional relationship between Qp and h takes asymptotically distinct formsdepending on whether h ,, 1 (relatively slow breach formation or small lake volume) orh .. 1 (relatively fast breach formation or large lake volume). Theoretical predictionsagree well with data from dam failures for which k, and thus h, can be estimated. Thetheory thus provides a rapid means of predicting the plausible range of values of peakdischarge at the breach in an earthen dam as long as the impounded water volume andthe water depth at the dam face can be estimated.
1. Introduction
Floods from failures of natural and constructed dams con-stitute a widespread hazard to people and property not onlybecause of their magnitude (many of the largest terrestrialfloods have resulted from dam failures) but also because theyusually occur suddenly and unpredictably. Natural dams mayalso form suddenly and unexpectedly, thereby posing hazardsthat must be rapidly assessed. In this paper we assess methodsfor estimating the flood hydrograph at the dam, as this hydro-graph serves as an upstream boundary condition for subse-quent flood routing. We restrict our attention to earthen damsand to conditions at the dam breach and do not consider thecomplicated matter of downstream flood routing.
Two methods have been used previously to predict probablepeak discharge from potential dam failures. One method relieson regression equations that relate observed peak discharge tosome measure of the impounded water volume: depth, volume,or some combination thereof [e.g., Evans, 1986; Costa, 1988].The other method employs computer implementation of aphysically based model of breach formation and lake drainage(see, e.g., summaries by Fread [1989] and Singh [1996]). Re-gression relations are expedient but generally provide no bet-ter than order-of-magnitude predictions of probable peak dis-charge. Existing computational models generally account forhydraulic constraints not reflected by regression relations butmay be cumbersome to use and commonly require informationregarding dam structure and material properties, information
that may be poorly known, especially for natural dams. We willshow that the essential kinematics of breach formation andhydraulics of flow through a breach can be summarized in aphysical model that leads to a computationally simple, essen-tially graphical method of predicting peak discharge frombreaching of an earthen dam. Our method “predicts” peakdischarges that agree well with observational data from pastdam failures and involves no arbitrarily adjustable parameters.
The remainder of this paper is organized as follows: We firstdiscuss briefly the diverse characteristics of earthen dams. Wethen present and critically assess regression equations relatingpeak discharge (Qp) to measured quantities: namely, watervolume released (V0), lake water-level drop during the flood(d), and the product dV0 (proportional to the so-called po-tential energy of the lake [e.g., Costa, 1988]). We conclude thatsuch regression relations have limited predictive value becausefactors other than V0 and d commonly exert substantial controlon peak discharge at the breach. Assuming that the mechanicsand hydraulics of dam breaching are fundamentally the samefor all earthen-dam-failure events, we then show that an ap-propriately defined dimensionless measure of peak discharge,namely, Q*p 5 Qp/g1/ 2d5/ 2, where g is the acceleration due togravity, should depend on dimensionless lake volume (V*0 5V0/d3) and dimensionless measures of breach erosion rate,breach shape, and lake shape. By analyzing a simple physicallybased model of breach erosion and lake drainage, we predictthe functional dependence of Q*p on V*0 and the other dimen-sionless parameters. The predictions agree well with data fromthose dam failures for which the breach-erosion rate can ac-tually be estimated and lead to a computationally simplemethod of predicting probable peak discharge.
This paper is not subject to U.S. copyright. Published in 1997 by theAmerican Geophysical Union.
Paper number 97WR01616.
WATER RESOURCES RESEARCH, VOL. 33, NO. 10, PAGES 2337–2348, OCTOBER 1997
2337
2. Natural and Constructed DamsMany natural processes can lead to impounded water bod-
ies. Natural dams most commonly result from blockage ofdrainage paths by landslides, debris flows, glaciers, and glacialmoraines [Costa and Schuster, 1988; Umbal and Rodolfo, 1996]but also result from formation of closed depressions such ascalderas [e.g., Waythomas et al., 1996] or tectonic basins [e.g.,Gilbert, 1890]. Data on historical floods from glacier-dammedlakes were recently reviewed by Walder and Costa [1996]; be-cause few glacier-dammed lakes drain through a subaerialbreach, glacier dams will not be considered further here.
Landslide dams are diverse in their formation, geometry,internal characteristics, and longevity but generally result fromsome sort of mass movement into a valley bottom [Costa andSchuster, 1988, 1991]. Many moraine-dammed lakes haveformed during the last 100 years owing to sustained, rapidretreat of glaciers from Neoglacial-age moraines [Lliboutry etal., 1977; Blown and Church, 1985; Evans and Clague, 1993].Many of these moraine dams have failed, resulting in largefloods and debris flows.
Filling of closed basins, such as craters or tectonic depres-sions, can also lead to large floods. Examples include the lateHolocene breaching of Aniakchak caldera, Alaska [Waythomaset al., 1996], and the Pleistocene Bonneville flood caused bypartial breaching of the drainage divide between the Bonne-ville basin and the Snake River drainage of the northwesternUnited States [Gilbert, 1890; Malde, 1968; O’Connor, 1993].See Costa and Schuster [1988] and Clague and Evans [1994] formore detailed discussion of natural dams.
Constructed dams include fill dams (“earth” and/or rock)and concrete dams. Most constructed dams are earthen orrock-fill, including 93% of the 68,000 dams either more than7.6 m high or impounding more than 61,650 m3 that wereinspected during the U.S. National Dam Inspection Program[Costa, 1988]. The International Commission on Large Dams[1973] compiled information regarding failures of dams more
than 15 m high that were constructed in western Europe andthe United States between 1900 and 1973. Of the fill dams inthis category, 1.2% subsequently failed, primarily by piping andseepage, overtopping, or foundation defects. For further infor-mation regarding failures of constructed dams, see Costa[1988] and Singh [1996].
3. Uses and Limitations of Regression Relationsand Envelope Curves
A simple approach to estimating probable peak dischargeQp at a dam breach is to develop regression relations betweenobserved values of Qp and measures of lake characteristics,typically d, the total drop in lake level during the flood, andV0, the volume of water released as the water level falls by theamount d [e.g., Kirkpatrick, 1977; Hagen, 1982; Committee onthe Safety of Existing Dams, 1983; MacDonald and Langridge-Monopolis, 1984; Evans, 1986; Costa, 1988; Costa and Schuster,1988; Clague and Evans, 1994]. We have revised these regres-sion relations using data compiled in the electronic supplementto this paper.1 Table 1 summarizes computed coefficient valuesfor regressions relating Qp to V0, d, and dV0. (Note from thetabulated p values that the statistical significance of some ofthe regressions coefficients is rather low.) We agree with pre-vious investigators [e.g., Hagen, 1982] that neither V0, d, nordV0 has any particular advantage as a predictor of Qp.
So-called envelope curves, which are graphical upperbounds on Qp on graphs depicting Qp as a function of variouslake characteristics, have been proposed as a means of makingrapid, “conservative” assessments of potential peak discharge[e.g., Costa, 1988]. Envelope curves have no physical signifi-
1Supporting material is available on two diskettes or via AnonymousFTP from kosmos.agu.org, directory APEND (Username 5 anonymous,Password 5 guest). Diskettes may be ordered from American Geo-physical Union, 2000 Florida Avenue, N.W., Washington, DC 20009 orby phone at 800-966-2481; $30.00. Payment must accompany order.
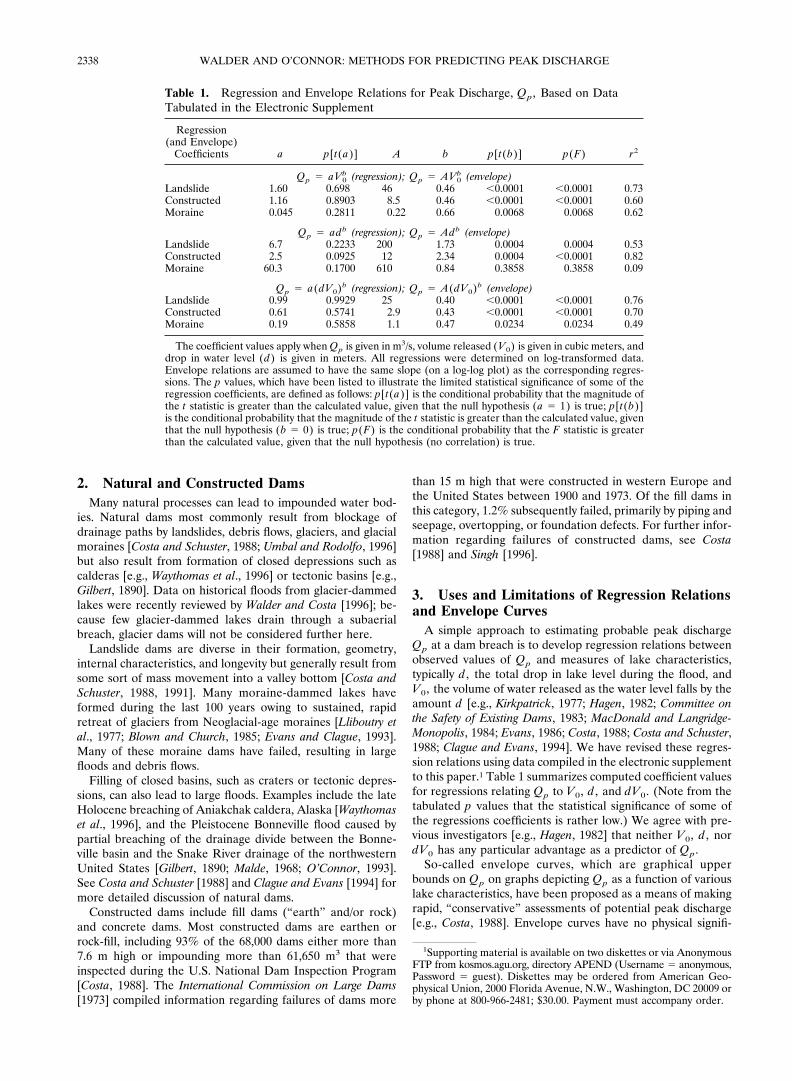
Table 1. Regression and Envelope Relations for Peak Discharge, Qp, Based on DataTabulated in the Electronic Supplement
Regression(and Envelope)
Coefficients a p[t(a)] A b p[t(b)] p(F) r2
Qp 5 aV0b (regression); Qp 5 AV0
b (envelope)Landslide 1.60 0.698 46 0.46 ,0.0001 ,0.0001 0.73Constructed 1.16 0.8903 8.5 0.46 ,0.0001 ,0.0001 0.60Moraine 0.045 0.2811 0.22 0.66 0.0068 0.0068 0.62
Qp 5 adb (regression); Qp 5 Adb (envelope)Landslide 6.7 0.2233 200 1.73 0.0004 0.0004 0.53Constructed 2.5 0.0925 12 2.34 0.0004 ,0.0001 0.82Moraine 60.3 0.1700 610 0.84 0.3858 0.3858 0.09
Qp 5 a(dV0)b (regression); Qp 5 A(dV0)b (envelope)Landslide 0.99 0.9929 25 0.40 ,0.0001 ,0.0001 0.76Constructed 0.61 0.5741 2.9 0.43 ,0.0001 ,0.0001 0.70Moraine 0.19 0.5858 1.1 0.47 0.0234 0.0234 0.49
The coefficient values apply when Qp is given in m3/s, volume released (V0) is given in cubic meters, anddrop in water level (d) is given in meters. All regressions were determined on log-transformed data.Envelope relations are assumed to have the same slope (on a log-log plot) as the corresponding regres-sions. The p values, which have been listed to illustrate the limited statistical significance of some of theregression coefficients, are defined as follows: p[t(a)] is the conditional probability that the magnitude ofthe t statistic is greater than the calculated value, given that the null hypothesis (a 5 1) is true; p[t(b)]is the conditional probability that the magnitude of the t statistic is greater than the calculated value, giventhat the null hypothesis (b 5 0) is true; p(F) is the conditional probability that the F statistic is greaterthan the calculated value, given that the null hypothesis (no correlation) is true.
WALDER AND O’CONNOR: METHODS FOR PREDICTING PEAK DISCHARGE2338

cance other than depicting approximately the limits of pastobservations. We have proposed envelope-curve relations(Table 1) by choosing “curves” that bound the data and havethe same slope (on a log-log graph) as the corresponding linearregressions.
Equations such as those in Table 1 may provide a rapidmethod of estimating peak discharges from dam failures butmust be used judiciously. The regressions are based on datacollected by a variety of methods [cf. Costa, 1988, Table 3],with discharge usually estimated some distance downstream ofthe dam and with no corrections for translation and attenua-tion of the flood wave. In most situations, therefore, estimatedpeak discharge is less than the value at the breach, although incases where water flows transform to debris flows, peak dis-charge may increase downstream by an order of magnitude[O’Connor et al., 1993]. The greatest drawback to these regres-sion and envelope relations, however, is that neither V0 nor dnor some simple combination of these variables exerts primarycontrol on peak discharge in all cases. The factors besides V0
and d that commonly exert substantial control on peak dis-charge at the breach are breach-erosion rate and to a lesserdegree the shapes of the breach and the lake basin.
4. Dimensionless Relation Between PeakDischarge and Lake Volume
If the fundamental physical mechanisms involved in dambreaching and lake drainage were the same for all dam-failureevents, then we would expect that relations of the sort given inTable 1 should actually be presented in terms of appropriatedimensionless variables. We can begin to identify these vari-ables by taking hydraulic constraints into account. A breach inan earthen dam generally has a complicated, time-dependentgeometry, and fully characterizing the flow through such abreach is presently intractable. Fortunately, we may restrictour attention to the flow near the upstream end of the breach,or what we shall call the breach inlet. For the usual situation inwhich there is no backwater effect at the downstream damface, the flow will become critical (Froude number 5 1) nearthe inlet, which acts hydraulically as a broad-crested weir.Under these conditions, the discharge Qo through the breachis given by [cf. Henderson, 1966]
Qo 5 g1/ 2h5/ 2f~shape! (1)
where g is acceleration due to gravity; h(t) is the lake level farfrom the breach inlet (i.e., beyond the influence of drawdownassociated with the exiting flow), measured relative to thethalweg of the breach inlet (Figure 1); and the dimensionlessfunction f depends on the shape of the breach and thus gen-erally varies with time t. Equation (1) is strictly valid only if thebreach is long enough (compared to h) in the flow direction forthere to be a well-defined region of critical flow but not so longthat flow resistance through the breach is substantial [cf. Hen-derson, 1966]. This condition is probably satisfied for breachesin constructed dams, but for landslide dams, which tend to bequite broad [Costa and Schuster, 1988], (1) probably over-estimates Qo. For the simple case of a triangular breach,f(shape) 5 c1 cot u, where c1 is an O(1) factor and u is thebreach side slope. More generally, f depends on an appropriatemeasure of the width/depth ratio of the breach, but as long asthis ratio is not extremely large, and for actual dam breaches itis nearly always ,5 [Singh et al., 1988], f will be O(1). Con-
sequently, by scaling the peak discharge by g1/ 2d5/ 2, we reachthe hydraulically significant conclusion that dimensionlesspeak discharge Q*p 5 Qp/g1/ 2d5/ 2 should be at most O(1).This conclusion is substantiated by plotting Q*p as a function ofV*0 5 V0/d3, the simplest plausible dimensionless measure ofthe released water volume [cf. Froehlich, 1987], for a largenumber of dam-break floods (Figure 2). Maximum values ofQ*p increase with increasing V*0 for V*0 , ;1000, but for largervalues of V*0, Q*p is less than 5 for all types of dam failures.
The physical meaning of Figure 2 is as follows. For lakeswith sufficiently large V*0, that is, lakes that have relativelylarge volumes for a given depth, breach formation can beconsidered to occur almost instantaneously: the breach formscompletely before significant drawdown occurs, and the peakdischarge approaches the physical limit represented by criticalflow through a fully formed breach with a water depth d. Incontrast, for lakes with relatively small V*0, significant draw-down of the lake surface occurs as the breach develops, andbreach-erosion rate must be a significant factor affecting peakflow at the breach. Figure 2 suggests that erosion rate affectspeak discharge significantly for V*0 , about 104.
5. Dam-Breach FormationFigure 2 portrays qualitatively interactions between lake
hypsometry, breach shape, and breach-erosion rate within thecontext of basic hydraulic principles governing dischargethrough the breach. To further understand these interactionsand to improve predictions of peak discharge (especially forrelatively small values of V*0), we next analyze a simple, phys-ically based model of dam breaching and lake drainage and inso doing elucidate the functional dependence of the hydro-graph, and in particular Q*p, on appropriate dimensionlessmeasures of lake volume, breach-formation rate, and lake andbreach shape. It turns out that Q*p depends primarily on theproduct of V*0 and a dimensionless measure of breach-erosionrate. Although we restrict our attention to the breach-formation process and thus the hydrograph at the breach, we
Figure 1. Idealized dam and lake geometries with the perti-nent length scales in the analysis defined. The total drop in lakelevel is the difference between the initial value of w and thefinal value of b .
2339WALDER AND O’CONNOR: METHODS FOR PREDICTING PEAK DISCHARGE

note that the outflow hydrograph provides a boundary condi-tion for downstream flood routing.
5.1. Mathematical Model
Earthen-dam failures generally result from either overtop-ping or piping. In the case of overtopping, water spilling overthe dam crest erodes a channel along the downstream face ofthe dam. The dam crest is eroded and breached by the escapingwater, and the head of the breach channel retreats upstream.The breach channel enlarges owing to both fluvial erosion andmass failures [Ralston, 1987]. Piping (seepage) failure can oc-cur with lake level short of overtopping the dam. Water per-colating through the dam at sufficiently great hydraulic gradi-ent carries away sediment, creating “pipes” that first appear atthe downstream face of the dam. As pipes enlarge and erodeheadward, water spilling from the pipes flows down the down-stream face of the dam and erodes a channel. Eventually thedam crest above the pipe collapses and is carried away by theflow, leaving a breach [MacDonald and Langridge-Monopolis,1984]. Piping may occur in conjunction with overtopping.
Discharge through the breach is controlled by the critical-flow condition given in (1). Variation of lake volume withdischarge through the breach is simply
dVdt 5 Qi 2 Qo (2)
where Qi is the rate of input to the lake. We choose theelevation datum as the base of the dam (Figure 1). The crest ofthe dam is then at an elevation Dc, the lake-surface elevationfar from the breach inlet is w(t), the elevation of the breachthalweg in the critical-flow reach is b(t), and the lake levelh(t) relative to the breach thalweg is given by
h~t! 5 w~t! 2 b~t! (3)
Thus dh/dt . 0 when the breach thalweg is lowered fasterthan the lake level. We will denote the initial elevation of the
lake surface as wi and the final elevation of the breach thalwegas bf. The net drop in water level, d, is related to wi and bf by
d 5 wi 2 bf bf $ 0 (4a)
d 5 wi bf , 0 (4b)
where bf , 0 means that the breach is eroded to below thebase of the dam, a rare occurrence.
To solve for the outflow hydrograph, (1), (2), and (3) mustbe supplemented by a hypsometric function relating lake vol-ume to water depth and by mathematical expressions describ-ing evolution of breach size and shape. It is convenient toassume that the lake volume varies with water level as
V~t!V0
5 Fw~t!wi
G m
(5)
A hypsometric function of this sort has been used by Clarke[1982] and Walder and Costa [1996] in analyses of floods fromglacier-dammed lakes. For lakes of interest in the presentanalysis, we expect 1 , m , 3 (Figure 3).
To complete the mathematical model, we need to describehow the breach widens and changes shape over time. Variousmathematical descriptions of breach evolution have been pro-posed, as summarized in Appendix A. Unfortunately, the me-chanics of breach formation are still not well understood, andfew dam failures have been observed in any detail. Breachformation probably involves a variety of processes, includingsediment entrainment from the breach floor, mass movementsfrom the breach sides into the exiting flow, knickpoint retreat,and mass movements on the downstream dam face. Not sur-prisingly, there are few data available on breach dimensions asa function of time. With rare exceptions, available data for anygiven dam-breach event comprise at best only the flood hydro-graph, the breach-formation time, and the final breach dimen-sions. Such data do not provide enough constraints to fix thevalues of the various parameters that enter into proposed
Figure 2. Dimensionless peak discharge (Q*p) versus dimensionless volume drained (V*0) for floods fromearthen-dam failures. The database for this graph is presented in the electronic supplement to this paper.Dimensionless variables are defined as Q*p 5 Qp/g1/ 2d5/ 2 and V*0 5 V0/d3, where Qp, V0, and d aredimensional peak discharge, volume drained, and water-level drop, respectively, and g is acceleration due togravity.
WALDER AND O’CONNOR: METHODS FOR PREDICTING PEAK DISCHARGE2340

breach-erosion “laws” (see Appendix A for examples), andthus an unlimited number of models of the breach-formationprocess can be made to “reproduce” measured hydrographs ifvalues of the pertinent constitutive parameters, or even thefunctional forms of the erosion “laws” themselves, are itera-tively adjusted. We propose instead that breach-evolutionequations be formulated in such a way that all relevant param-eters can be estimated from available data with no iterative“fitting” procedures. This requirement leads to an overall pa-rameterization of breach evolution that is identical to that usedby Fread [1977, 1980] in his DAMBRK model. Breach deep-ening is parameterized simply by a constant rate of downcut-ting, k, for a time period tf :
dbdt 5 2k ~t , t f! (6a)
dbdt 5 0 ~t $ t f! (6b)
Thus k 5 (wi 2 bf)/tf, a definition that encompasses bothovertopping failures (in which case) and piping failures (aslong as drawdown during the period from the beginning ofpiping until breach formation is negligible). Values of k can beestimated from published data for a limited number of con-structed dams and for several landslide dams (Table 2); in mostcases 10 m/h , k , 100 m/h, although more generally 1 m/h ,k , 103 m/h.
An obvious limitation to the parametric approach embodiedby (6) is that bf, the final elevation of the breach thalweg, mustbe prescribed, whereas a completely mechanistic model ofbreach evolution would yield bf as part of the solution. Whatmakes the parametric approach feasible is the fact thatbreaches are rarely eroded below the base of the dam (bf 50), so a lower limit on bf can be confidently predicted. In somecases, especially for landslide dams, the dam is only partlybreached. Data summarized in the electronic supplement tothis paper show that breaches are typically eroded to a depth of50% to 100% of the total dam height.
We further assume that the cross-sectional shape of thebreach in the critical-flow reach is at all times trapezoidal(Figure 1) and that the breach shape is invariant. Dam-breachcross sections observed after the fact are commonly trapezoi-dal [MacDonald and Langridge-Monopolis, 1984], and sincethere is a lack of data about breach shape while floods are inprogress, there is little basis for critically assessing more com-plicated breach geometries. Moreover, plausible alternativescenarios for breach-shape development (Appendix B) do notyield peak-discharge predictions significantly different fromthose for the simple analysis here. Accordingly, we assume thatthe slope u of the breach sides is constant and that the ratio ofbreach bottom width (B) to depth (Dc 2 b(t)) has the con-stant value r:
B 5 r@Dc 2 b~t!# ~t , t f! (7a)
B 5 r~Dc 2 bf! ~t $ t f! (7b)
Breach shapes measured at the end of dam-failure events show1 # r # 5 typically [Singh et al., 1988]. For the assumedtrapezoidal breach shape, the function f in the critical-flowrelation (1) becomes [cf. Singh et al., 1988]
f 5 c1 cot u 1 c2SBhD (8)
where c1 5 (1/ 2)1/ 2)(4/5)5/ 2cv cs and c2 5 (2/3)3/ 2cv cs.The coefficients cv and cs [e.g., Fread, 1977, 1980] are O(1)hydraulic correction factors. As our goal here is insight into theprimary controls on the breach hydrograph, not computationalhydrograph “fitting,” we will set cv 5 cs 5 1. This choicecorresponds to neglecting energy loss as the floodwater ap-proaches the breach inlet and assuming that there are notail-water effects at the outlet.
Equations (1)–(8) constitute the entire physical model ofbreaching and drainage. Using the initial condition
b~t 5 0! 5 Dc 2 wi (9)
to integrate (6), the model can be reduced to a single ordinarydifferential equation for h:
dhdt 5 k 2 S wi
m
mV0D @c1r~Dc 2 wi 1 kt! 1 c2h cot u#g1/ 2h3/ 2 2 Qi
~h 1 wi 2 kt!m21
~t , t f! (10a)
Figure 3. Idealized lake shapes, illustrating likely range ofshape factor m.
2341WALDER AND O’CONNOR: METHODS FOR PREDICTING PEAK DISCHARGE

dhdt 5 2S wi
m
mV0D @c1r~Dc 2 bf! 1 c2h cot u# g1/ 2h3/ 2 2 Qi
hm21
~t $ t f! (10b)
Equation (10) can be solved numerically, and (1) and (7) canthen be used to calculate Qo:
Qo 5 @c1r~Dc 2 wi 1 kt! 1 c2h cot u# g1/ 2h3/ 2 ~t , t f! (11a)
Qo 5 @c1r~Dc 2 bf! 1 c2h cot u# g1/ 2h3/ 2 ~t $ t f! (11b)
5.2. Analysis
5.2.1. Dimensionless formulation. Equations (1)–(8)lead one to expect that the breach hydrograph should dependon t and on the parameters Qi, V0, Dc, bf, wi, d, g , k, m, r,and u. Noting that the dimensional parameters and variablesinvolve only the dimensions of length and time, dimensionalanalysis and application of the Buckingham pi theorem[Malvern, 1969] leads to the result
Q*p 5 F~Q*i, V*0, k*, z , f , j , r, u , m! (12)
where Q*p and V*0 are as defined above; Q*i 5 Qi/g1/ 2d5/ 2 is
the dimensionless recharge rate; j 5 d/wi is the drop in lakelevel as a fraction of initial water level above the dam base; z 5wi/Dc is the initial water level as a fraction of dam height; f 5bf/Dc is the final elevation of the breach thalweg as a fractionof dam height; k* 5 k/g1/ 2d1/ 2 is dimensionless erosion rate;and F is a function to be determined. If peak discharge de-pends on erosion rate, the correct dimensionless measure ofthis dependence is k*. The analysis that follows predicts justhow Q*p should depend on k*.
We recast (10) and (11) into dimensionless form with thescalings
h 5 dh* (13a)
t 5 ~d/k!t* (13b)
Qo 5 g1/ 2d5/ 2Q*o (13c)
Qi 5 g1/ 2d5/ 2Q*i (13d)
and find the dimensionless equations
dh*dt* 5 1 2 S 1
mhjmDFc1rS 1jz
21j
1 t*D 1 c2h* cot uGh*3/ 2 2 Q*i
S1j
1 h* 2 t*Dm21
t* ,1j S 1 2
f
z D (14a)
dh*dt* 5 2S 1
mhjmD S c1r~1 2 f!
zj1 c2h* cot u D h*3/ 2 2 Q*i
S f
zj1 h*D m21
t* $1j S 1 2
f
z D (14b)
and
Q*o 5 F c1rS 1jz
21j
1 t*D 1 c2h* cot uG h*3/ 2 (15a)
t* ,1j
2f
z
Q*o 5 F c1rS 1 2 f
jz D 1 c2h* cot uG h*3/ 2 (15b)
t* $1j
2f
z
where h 5 kV0/g1/ 2d7/ 2 5 k*V*0. The dimensionless hydro-graph thus depends on t* and the parameters Q*i, h , j , z , f ,m, r, and cot u. The approximation Q*i ,, 1 is violated onlyat the onset of the flood (t* ,, 1) and again near the end ofthe flood (t* .. 1), except for rare cases in which small damsfail during extreme storms and the storm runoff dominates the
Table 2. Parameter Values for Dam Failures for Which Breach Erosion Rate Can BeReasonably Estimated
Dam/Lake V0, 106 m3 d, m Qp, m3/s tb, hours k, m/h h Q*p
Apishapa 22.8 28.0 6860 0.75 37 0.64 0.53Baldwin Hills 0.91 12.2 991 0.33 37 0.47 0.61Birehi Ganga, India* 460 97.5 56,650 1.0 91 0.43 0.19Buffalo Creek 0.50 14.4 1400 ca. 0.1 ca. 150 ca. 0.58 0.57Castlewood 6.17 21.3 3570 0.5 43 0.53 0.55French Landing 3.87 8.53 925 0.58 15 2.84 1.40Hatchtown 16.8 15.8 7000 1.0 17 1.52 2.25Hell Hole 30.6 35.1 7350 0.75 47 0.50 0.32Isfayramsay, Former
Soviet Union*6.5 90 4960 ,1.0 .90 .0.0075 0.21
La Josefina, Ecuador* 170 40 5000 8.0 5 0.19 0.16Little Deer Creek 1.23 16.8 1330 0.33 69 0.28 0.37North Fork Toutle River* 0.3 9 450 0.67 13.4 0.17 0.59Rıo Mantaro, Peru* 500 107 10,000 4.0 27 0.095 0.027Oros, Brazil 650 35.4 13,600 8.5 4.2 0.92 0.58Rıo Pisque, Ecuador* 2.5 30 480 3.5 8.6 0.013 0.031Schaeffer 4.4 30.5 4900 0.5 61 0.15 0.29Teton 310 67 65,200 1.25 54 0.60 0.57Tunawaea, New Zealand* 0.63 20 250 1.0 20 0.031 0.045
V0, volume of water released; d, drop in water level; Qp, peak discharge; tb, the breach-formation time;k, the mean erosion rate of the breach; h and Q*p, dimensionless variables defined in the text.
*Landslide dam.
WALDER AND O’CONNOR: METHODS FOR PREDICTING PEAK DISCHARGE2342

entire hydrograph [e.g., Anonymous, 1916; Hoxit et al., 1982, p.43]. We shall ignore such cases and set Q*i 5 0. The “shape”parameters all vary within fairly narrow limits: approximatebounds are 1 # r # 5 [Singh et al., 1988], 358 # u # 658[MacDonald and Langridge-Monopolis, 1984] and 1 # m # 3(cf. Figure 3). For constructed dams, at least, the “depth”parameters j, z, and f are also fairly narrowly constrained (perdata summarized in the electronic supplement): 0.46 # j # 1,0.53 # z # 1 (or sometimes slightly .1), and 20.32 # f # 0.44(f , 0 means the breach eroded below the base of the dam.)In contrast, the parameter h, which is the product of thedimensionless erosion rate k* and the dimensionless lake vol-ume V*0, ranges over several orders of magnitude. We dem-onstrate below that Q*p is primarily a function of h.
5.2.2. Numerical results and comparison to data. Com-putational exploration of the complete parameter space wouldbe exceptionally time consuming. Fortunately, it is sufficient toconsider some special cases:
5.2.2.1. Overtopping failures. In this case the fall in wa-ter level equals the dam height (z 5 1), and as long as thebreach does not erode below the base of the dam, the breachdepth also equals the dam height (thus j 1 f 5 1). Equations(14) and (15) then reduce to
dh*dt* 5 1 2 S 1
mhjmD ~c1rt* 1 c2h* cot u !h*3/ 2
S 1j
1 h* 2 t*D m21 (16a)
t* , 1
dh*dt* 5 2S 1
mhjmD ~c1r 1 c2h* cot u !h*3/ 2
S 1j
2 1 1 h*D m21 (16b)
t* $ 1
Q*o 5 ~c1rt* 1 c2h* cot u !h*3/ 2 t* , 1 (16c)
Q*o 5 ~c1r 1 c2h* cot u !h*3/ 2 t* $ 1 (16d)
The special case with j 5 1 (breach erodes to base of dam)suffices to examine the relative importance of the parametersh , r, m, and u. (This is the case considered by Walder et al.[1997].) Figure 4 shows results of calculations using (15) forthis special case. The effect of breach shape on dimensionlesspeak discharge Q*p was explored by separately varying theparameters r and u. The value of r has little effect on predictedQ*p for h # 0.2 but a noticeable effect for h $ 1 (Figure 4a).Breach-side slope has an almost negligible effect on Q*p (Fig-
Figure 4. (opposite) Dimensionless peak discharge (Q*p)versus the dimensionless parameter h. The curves are calcu-lated from the theoretical model for the case in which the damfails by overtopping when the water level equals the height ofthe dam, and the breach then cuts to the base of the dam (j 5z 5 1). Data for actual dam failures are from Table 2. (a)Breach shape factor r is parameter. Breach side slope u istaken as 358 and lake shape factor m equals 2. (b) Breach sideslope u is parameter. Breach shape factor r is taken as 2.5 andlake shape factor m equals 2. (c) Lake shape factor m isparameter. Breach shape factor r is taken as 2.5 and breachside slope u equals 358. (d) The shape parameters are m 5 2,r 5 2.5, and u 5 358. The dam fails by overtopping when thewater level equals the height of the dam (z 5 1), and thebreach then cuts down by a fraction j of the dam height.
2343WALDER AND O’CONNOR: METHODS FOR PREDICTING PEAK DISCHARGE

ure 4b). The effect of lake shape factor m on Q*p (Figure 4c)is noticeable but still small for h # 1. The value of Q*p isprimarily a function of h for h # 1. Results of calculations forthe more general case 0 , j , 1 are shown in Figure 4d forplausible values of m, r, and u. We see that the value of j hasa negligible effect on Q*p for all values of h.
5.2.2.2. Piping failures. We shall restrict our attention tothe special case in which the breach erodes exactly to the dambase, thus j 5 1, f 5 0, and (14) and (15) reduce to
dh*dt* 5 1 2 S 1
mhDF c1rS 1
z2 1 1 t*D 1 c2h* cot uG h*3/ 2
~1 1 h* 2 t*!m21
(17a)
t* , 1
dh*dt* 5 2S 1
mhD S c1rz
1 c2h* cot u D h*5/ 22m (17b)
t* $ 1
Q*o 5 F c1rS 1z
2 1 1 t*D 1 c2h* cot uG h*3/ 2 (17c)
t* , 1
Q*o 5 S c1rz
1 c2h* cot u D h*3/ 2 t* $ 1 (17d)
Solutions of (17) should be adequate to assess the effect of theparameter z (ratio of initial lake level to dam height) on theflood hydrograph. Results of calculations using (17) and plau-sible values of m, r, and u are shown in Figure 5. For h , ;1,Q*p is practically independent of z. For h . ;1, Q*p increasesas z decreases, reflecting the fact that for the assumed trape-zoidal breach shape, the initial breach width is zero for anovertopping failure and increases monotonically as z de-creases.
The near constancy of Q*p for h . 1 (with the other dimen-sionless parameters prescribed), regardless of failure style, is
noteworthy and readily explained. Large values of h corre-spond (for any given lake) to large values of erosion rate k. Insuch cases the breach develops fully before significant draw-down of the lake occurs; thus the peak discharge is nearly thesame as if the breach formed instantaneously and dependsprimarily on initial lake depth and final breach geometry. Incontrast, the strong dependence of Q*p on h for h , 1 followsfrom the fact that substantial drawdown occurs during breachformation and thus the discharge through the breach dependson erosion rate and lake hypsometry.
Data for dam failures are plotted in Figures 4 and 5 forcomparison with theoretical predictions. Values of Q*p and hwere derived from published data as shown in Table 2. Esti-mated erosion rates and thus the values of h generally havelarge probable errors. The predictions generally compare fa-vorably with data, particularly for constructed dams.
We conclude that Q*p depends primarily on h, for h , ;1,regardless of failure mode. This has significant implications forpurposes of predicting flood hazards from failure of earthendams, as discussed below.
5.2.3. Asymptotic relations for peak discharge. The pre-dicted functional relation between Q*p and h takes asymptot-ically different forms depending upon whether h ,, 1 orh .. 1 (cf. Figures 4 and 5). For h ,, 1
Q*p 5 ahb (18)
where a depends weakly on r and m but is practically inde-pendent of u and z and b varies slightly with m only. For h .. 1
Q*p < g (19)
where g ; O(1) depends weakly on u and z but somewhatmore significantly on r.
We now choose the particular case m 5 2, r 5 2.5, u 5358 as a benchmark for hazards-assessment purposes. Thevalue m 5 2 is probably in the midrange of m values for lakesimpounded by dams; r 5 2.5 is approximately the mean valuefor breached constructed dams [Singh et al., 1988]; and u ' 358is typical for natural dams [e.g., Waythomas et al., 1996] ifperhaps a bit low for some constructed dams. We then findnumerically a 5 1.51 and b 5 0.94, with (18) in fact a verygood approximation for h , ;0.6. For h .. 1 we find g '1.94z20.75. In dimensional form these “benchmark” predictiverelations are
Qp 5 1.51~ g1/ 2d5/ 2!0.06S kV0
d D 0.94 S k~ gd!1/ 2D SV0
d3D , ;0.6
(20a)
Qp 5 1.94g1/ 2d5/ 2SDc
d D 3/4 S k~ gd!1/ 2D SV0
d3D..1 (20b)
4.2.4. Time to peak flow. We denote the elapsed timefrom the start of breach formation until the moment of peakdischarge by tp and in line with the scaling used above definethe dimensionless time to peak flow by
tp 5 ~d/k!t*p (21)
Calculations show that as with the results for Q*p, there are twoasymptotically distinct cases:
t*p 5 a9hb9 h,,1 (22a)
t*p 5 1 h..1 (22b)
Figure 5. Dimensionless peak discharge (Q*p) versus the di-mensionless parameter h. The curves are calculated from thetheoretical model for the case in which the dam fails by pipingwhen the water level equals a fraction z of the dam height, andthe breach then cuts down to the base of the dam. Values forthe shape parameters are m 5 2, r 5 2.5, and u 5 358. Datafor actual dam failures are from Table 2.
WALDER AND O’CONNOR: METHODS FOR PREDICTING PEAK DISCHARGE2344

where a9 and b9 generally depend weakly on m, r, u , and z.For our “benchmark” configuration (m 5 2, r 5 2.5, u 5358), a9 varies from 1.05 (for z 5 0.5) to 1.24 (for z 5 1) andb9 varies from 0.33 (for z 5 1) to 0.41 (for z 5 0.5). (A figurein the electronic supplement shows more fully the variation oft*p with h for this particular case.) The result for the overtop-ping scenario (z 5 1) becomes in dimensional form
tp < 1.24S V0
k2~ gd!1/ 2D 1/3 S k~ gd!1/ 2D SV0
d3D,,1 (23a)
tp 5dk S k
~ gd!1/ 2D SV0
d3D..1 (23b)
For rapidly formed breaches (h .. 1), tp corresponds to thetime at which the breach has eroded to the base of the dam,whereas for slowly formed breaches (h ,, 1), peak flows occurbefore the breach has fully formed.
6. A Method for Rapidly Predicting anApproximate Hydrograph at the Breach
Our analysis allows for rapid prediction of plausible valuesof peak discharge with information that is commonly readilyavailable. Parameters that must be prescribed are drop in wa-ter level (d), water volume released (V0), and erosion rate(k). Data show that d is typically 50–100% of the dam height,Dc. Information about the structure and shape of the dam mayhelp constrain estimates of the probable value of d. The pa-rameter V0 follows directly from the estimated value of d andthe hypsometric function (lake surface area as a function ofdepth), which can be derived from topographic or bathymetricmaps. Data in Table 2 indicate that 10 m/h , k , 100 m/h istypical. The worst-case scenario for hazards assessment wouldgenerally involve a breach that erodes rapidly to the base of thedam. We suggest the following method for predicting peakdischarge (and time to peak flow) at the breach:
1. Values of h should be calculated for plausible values ofd , V0, and k. Determination of what constitutes “plausible”can be guided by the data we have tabulated and the discussionin the previous paragraph but ideally should be tempered byinformation about the actual dam and considerations of down-stream risks.
2. For values of h outside the range of about 0.6 to 5, theasymptotic relations (21a) and (21b) may be used as approxi-mate predictors of peak discharge. More generally, and par-ticularly for h in the range of about 0.6 to 5, one may read offvalues of Q*p from an appropriate curve in Figures 4 or 5.Given the weak dependence of Q*p on all variables except h,we suggest simply using the curve in Figure 4a for r 5 2.5.Corresponding values of dimensionless discharge Qp may thenbe determined from the definition Qp 5 g1/ 2d5/ 2Q*p using anyconsistent set of units.
3. The time to peak flow tp can be calculated using theasymptotic relations (22a) and (22b). An approximate breachhydrograph, assumed to be triangular, may then be constructedwith a peak value Qp at time tp and a termination at an elapsedtime of 2V0/Qp.
This method will produce good estimates of likely Qp and tp,but the assumed triangular hydrograph may be rather inaccu-rate, especially for large values of h. In any particular case, ifan investigator can also estimate p and has a compelling reasonto choose particular values of u and r, he may wish to solve (10)
and (11) numerically to compute dimensional hydrographs,although in this circumstance it may be more expedient to usea published version of Fread’s [1977, 1980] DAMBRK com-puter program.
7. ConclusionsEmpirical, dimensional relations between peak discharge of
dam-break floods and parameters related to the size of theimpounded lake have limited value for predictive purposesbecause they fail to reflect important hydraulic principles andconstraints that operate at the breach. In contrast, relationsbetween appropriately defined dimensionless measures ofpeak discharge and lake volume point to both the limitingcondition imposed on peak discharge by the occurrence ofcritical flow at the breach and the importance of breach-erosion rate, especially for lakes with relatively low impoundedvolumes relative to dam height. Analysis of a physically basedmodel of breach formation and lake drainage demonstratesthat the dimensionless peak discharge is a function primarily ofa variable h, which may be interpreted as the product of di-mensionless lake volume and dimensionless erosion rate. Com-pared to the parameter h, appropriate dimensionless measuresof lake shape and breach shape, as well as details of the breach-formation process, generally have minor influence on the floodhydrograph at the breach. The dominant role of h in deter-mining peak discharge leads to a simple, rapid, and essentiallyalgebraic or graphical method of estimating the probable peakdischarge at the breach.
Appendix A: Erosion “Laws” Used to ModelDam-Breach Formation
Observations of actual earthen-dam failures [e.g., Ralston,1987] and laboratory experiments [e.g., Simmler and Samet,1982; AlQaser and Ruff, 1993] show that the process of breachformation involves both tractive erosion of sediment, particu-larly in the early stages of breach formation as water flows overthe downstream face of the dam, and collapse of large massesof sediment, which are subsequently entrained and removed bythe flowing water. In recent models of breach formation [e.g.,Fread, 1985, 1989; Singh et al., 1988] the two erosional pro-cesses are assumed to operate more or less sequentially: aftera sediment wedge collapses into the breach the flood watersremove that sediment at a rate determined by the flow char-acteristics; once the collapsed sediments have been removed,the flood waters erode the breach floor at a rate controlled bythe flood’s bed load–transport capacity. (Previous investigatorsseem to have implicitly assumed that suspended-sedimenttransport is negligible.)
Model “rules” for determining when mass failures frombreach walls will occur involve standard limit-equilibrium con-cepts: the breach floor erodes downward uniformly until grav-itational forces acting on a “wedge” of sediment exceed resist-ing forces, which are related to both intrinsic strengthproperties of the dam and seepage forces exerted by porewater percolating through the dam [e.g., Fread, 1985, pp. 288–291; Singh et al., 1988, pp. 170–171]. Intrinsic strength prop-erties of the dam sediments probably do not vary greatly.Seepage forces can be reasonably estimated if the hydrologiccharacteristics of the dam are accurately known. Previous in-vestigators seem to have calculated seepage forces by assuming
2345WALDER AND O’CONNOR: METHODS FOR PREDICTING PEAK DISCHARGE

simple distributions of pore pressure [e.g., Singh et al., 1988, p.171].
If, as assumed by previous investigators, all sediments areremoved as bed load, one needs to relate the bed load flux tothe discharge through the breach. The volumetric bed load fluxper unit width may generally be written as [cf. Parker et al.,1982]
qb 5 F gS r s
rw2 1D Ds
3G 1/ 2
G~t*! (A1)
where rs is the density of sediment, rw is the density of water,g is acceleration due to gravity, and Ds is a “characteristic”grain size of the sediment; G(t*) is an empirically determinedfunction, where t* 5 t /g(rs 2 rw) Ds is the dimensionlessShields’ stress, t being the shear stress applied by the flowingwater on the breach floor. The applicability of empirical bedload-transport equations to the breach-formation process isproblematic for two reasons: first, bed load–transport equa-tions apply for steady flow; second, experimental data to elu-cidate the functional form of G(t*) are limited to t* , ;2,whereas much larger values of t* commonly occur during dam-break floods. To deal with the second of these issues, Singh etal. [1988] wrote G(t*) in the form
G~t*! 5 dt*« (A2)
and varied the values of d and « so as to “fit” predicted hydro-graphs to measured ones. Different values of d and « wereinferred for different dam failures. This sort of “calibration”procedure is problematic because it is neither unique nor (withexisting sediment-transport data) testable. We instead ac-knowledge the limitations of empiricisms such as (A1) andrecognize that “even if [material] properties can be measuredthere is a range for their probable value and within this rangeoutflow hydrographs of varying magnitude and shape will beproduced by [a physical] model” [Fread, 1985, p. 282].
Appendix B: Dependence of Flood Hydrograph onBreach-Opening Process
We assume in the model of the main text that the breach hasa trapezoidal shape at all times and that it erodes at a constantrate until it reaches the base of the dam. As a simple alterna-tive, we might suppose that an actual breach is triangular inshape until it erodes to the base of the dam and then widensinto a trapezoid. We show here that for a specified breach-formation time, the details of how the breach forms may havea noticeable but still relatively minor influence on peak dis-charge.
Denote the time to form a complete breach as tf. We nowposit a failure by overtopping such that the breach first erodesto the base of the dam at a constant rate for a time ftf (0 # f #1), maintaining all the while a triangular shape, and thenwidens at a constant rate for a time (1 2 f )tf until the breachis a trapezoid with B/Dc 5 r (all symbols being the same as inthe main text). Equations (6) and (8) of the main text are thenreplaced by
b 5 DcF 1 2 S tft fD G t , ft f (B1a)
b 5 0 t $ ft f (B1b)
and
B 5 0 t , ft f (B2a)
B 5 S rDc
1 2 fD S tt f
2 f D ft f # t , t f (B2b)
b 5 rDc t $ t f (B2c)
Using the same scalings as in the main text, we find thefollowing dimensionless equations to replace (14) and (15):
dh*dt* 5
1f 2 S 1
mhD c2h*5/ 2 cot u
S h* 1 1 2t*f D
m21 t* , f (B3a)
dh*dt* 5 2S 1
mhD F c1rS t* 2 f1 2 f D 1 c2h* cot uG h*5/ 22m (B3b)
f # t* , 1
dh*dt* 5 2S 1
mhD ~c1r 1 c2h* cot u !h*5/ 22m (B3c)
~t* $ 1!
and
Q* 5 c2h*5/ 2 cot u ~t* , f ! (B4a)
Q* 5 F c1rS t* 2 f1 2 f D 1 c2h* cot uG h*3/ 2 (B4b)
~ f # t* , 1!
Q* 5 ~c1r 1 c2h* cot u !h*3/ 2 ~t* $ 1! (B4c)
The erosion rate k entering into the parameter h should herebe interpreted as the nominal erosion rate knom 5 d/tf 5 Dc/tf.
Figure B1 illustrates the effect of varying the value of f on
Figure B1. Calculated dimensionless peak discharge Q*p ver-sus the dimensionless parameter h for various breach-openingscenarios. The dam is assumed to fail by overtopping when thewater level reaches the dam crest (z 5 1) and the breach thenopens to the base of the dam (j 5 1). The breach cross sectionis assumed to be triangular for a fraction f of the total breach-formation time; the breach then widens into a trapezoid duringthe remaining fraction 1 2 f of the breach-formation time.Other parameter values assumed are m 5 2, r 5 2.5, andu 5 358. The comparison curve labelled “trapezoid” is for thecase in which the breach is trapezoidal (with r 5 2.5) through-out the period of breach formation (cf. Figure 4a).
WALDER AND O’CONNOR: METHODS FOR PREDICTING PEAK DISCHARGE2346

Q*p for the case m 5 2, r 5 2.5, u 5 358. Differencesbetween predicted values of Q*p for the case f 5 0.75 andvalues for the scenario examined in the main text (the curvelabelled “trapezoid”) are very small. As f decreases, however,predicted values of Q*p may be noticeably different from the“trapezoid” values, particularly for h , ;0.2. On the basis ofthese results, details of the breach-formation process shouldhave a rather minor influence on peak discharge from breach-ing of constructed earthen dams, assuming that the constructedearthen dams for which we have been able to estimate valuesof h (Table 2) constitute a representative sample. For naturaldams, for which values of h are generally smaller than those forconstructed dams (Table 2), details of the breach-formationprocess may be rather significant.
Although the computations presented in this appendixhardly constitute a comprehensive exploration of how detailsof the breach-formation process affect Qp, the results do in-dicate that such details have a relatively minor effect and thatthe simple model of the main text captures the physics essentialfor estimating Qp.
Notationb height of breach floor relative to base of dam.
bf value of b at end of flood.B width of breach at its base.
c1, c2 O(1) numerical constants related to breach shape.d drop in lake level during flood.
Dc height of dam crest relative to dam base.Ds “characteristic” grain size in bed load–transport
relation.f fraction of total breach-formation time for breach
to cut down before widening.f dimensionless function related to breach shape.g acceleration due to gravity.
G(t*) empirical, dimensionless function in bedload–transport equation.
h lake level relative to breach floor.h* h/d, dimensionless measure of lake level.
k erosion rate of breach.k* k/( gd)1/ 2, dimensionless measure of breach
erosion rate.m exponent related to lake shape.qb volumetric bedload flux per unit width of breach.Qi recharge to lake.Q*i Qi/g
1/ 2d5/ 2, dimensionless recharge to lake.Qo discharge from lake.Q*o Qo/g1/ 2d5/ 2, dimensionless discharge from lake.Qp peak discharge from lake.Q*p Qp/g1/ 2d5/ 2, dimensionless peak discharge.
r bottom width of breach divided by breach depth,assumed constant.
t time.t* kt/d, dimensionless measure of time.tf time for breach to form.tp time from start of flood until peak discharge.t*f ktf/d, dimensionless measure of time to peak
discharge.V volume of water in lake as function of time.
V0 total volume of water drained from lake.V*0 V0/d3, dimensionless measure of total volume
drained from lake.
w lake level as function of time, relative to base ofdam.
wi initial lake level, relative to base of dam.a , b , g dimensionless constants in asymptotic relations
between Q*p and h.a9, b9 dimensionless constants in asymptotic relation
between t*p and h.d , « empirical constants related to bed load transport.
z wi/Dc, initial water level as fraction of damheight.
h kV0/g1/ 2d7/ 2, dimensionless parameter thatprimarily controls Q*p.
u slope of breach sides.j d/wi, drop in lake level as fraction of initial lake
level.rs density of bed load.rw density of water.
t average shear stress applied by flowing water tofloor of breach.
t* t /g(rs 2 rw) Ds, dimensionless measure of t,that is, Shields stress.
f bf/Dc, final height of breach floor as fraction ofdam height.
Acknowledgments. J. E. Costa commented helpfully on variousaspects of this work and provided access to his extensive collection ofpapers about dam-failure floods. R. M. Iverson and J. J. Major care-fully reviewed an earlier version of this paper.
ReferencesAlQaser, G., and J. F. Ruff, Progressive failure of an overtopped
embankment, in Hydraulic Engineering ’93 (Proc., 1993 Conf.), vol. 2,edited by H. W. Shen, S. T. Su, and F. Wen, pp. 1957–1962, Am. Soc.of Civ. Eng., New York, 1993.
Anonymous, Overtopped dam fails, Eng. News, 76, 232–233, 1916.Blown, I., and M. Church, Catastrophic lake drainage within the Ho-
mathko River basin, British Columbia, Can. Geotech. J., 22, 551–563,1985.
Clague, J. J., and S. G. Evans, Formation and failure of natural damsin the Canadian Cordillera, Geol. Surv. Can. Bull. 464, 35 pp., 1994.
Clarke, G. K. C., Glacier outburst floods from “Hazard Lake,” YukonTerritory, and the problem of flood magnitude prediction, J. Gla-ciol., 28, 3–21, 1982.
Committee on the Safety of Existing Dams, Safety of Existing Dams:Evaluation and Improvement, pp. 73–78, Natl. Acad. Press, Wash-ington, D. C., 1983.
Costa, J. E., Floods from dam failures, in Flood Geomorphology, editedby V. R. Baker, R. C. Kochel, and P. C. Patton, pp. 439–463, JohnWiley, New York, 1988.
Costa, J. E., and R. L. Schuster, The formation and failure of naturaldams, Geol. Soc. Am. Bull., 100, 1054–1068, 1988.
Costa, J. E., and R. L. Schuster, Documented historical landslide damsfrom around the world, U.S. Geol. Surv. Open File Rep. 91-239, 486pp., 1991.
Evans, S. G., The maximum discharge of outburst floods caused by thebreaching of man-made and natural dams, Can. Geotech. J., 23,385–387, 1986.
Evans, S. G., and J. J. Clague, Glacier-related hazards and climaticchange, in Conference on the World at Risk: Natural Hazards andClimate Change, edited by R. Bras, pp. 48–60, Am. Inst. of Phys.,New York, 1993.
Fread, D. L., The development and testing of a dam-break floodforecasting model, in Proceedings of Dam-break Flood Routing ModelWorkshop Held in Bethesda, Maryland on October 18–20, 1977, pp.164–197, Water Resour. Counc., Washington, D. C., 1977.
Fread, D. L., Capabilities of NWS model to forecast flash floodscaused by dam failures, in Second Conference on Flash Floods, pp.171–178, Am. Meteorol. Soc., Boston, Mass., 1980.
Fread, D. L., Dam breach erosion modeling, in Delineation of Land-
2347WALDER AND O’CONNOR: METHODS FOR PREDICTING PEAK DISCHARGE

slide, Flash Flood, and Debris Flow Hazards in Utah, edited by D. S.Bowles, pp. 281–310, Utah State Univ., Logan, 1985.
Fread, D. L., National Weather Service models to forecast dam-breachfloods, in Hydrology of Disasters, edited by O. Starosolszky and O. M.Melder, pp. 192–211, James and James, London, 1989.
Froehlich, D. C., Embankment-dam breach parameters, in Proceedingsof 1987 National Conference on Hydraulic Engineering, edited byR. M. Ragan, pp. 570–575, Am. Soc. of Civ. Eng., New York, 1987.
Gilbert, G. K., Lake Bonneville, U.S. Geol. Surv. Monogr. 1, 438 pp.,1890.
Hagen, V. K., Re-evaluation of design floods and dam safety, in Trans-actions of 14th International Congress on Large Dams, vol. 1, pp.475–491, Int. Comm. on Large Dams, Paris, 1982.
Henderson, F. M., Open Channel Flow, pp. 211–212, MacMillan, NewYork, 1966.
Hoxit, L. R., R. A. Maddox, C. F. Chappell, and S. A. Brua, Johns-town-western Pennsylvania storm and floods of July 19–20, 1977,U.S. Geol. Surv. Prof. Pap. 1211, 68 pp., 1982.
International Commission on Large Dams, Lessons from Dam Inci-dents, Boston, Mass., 1973.
Kirkpatrick, G. W., Evaluation guidelines for spillway adequacy, in TheEvaluation of Dam Safety, pp. 395–414, Am. Soc. of Civ. Eng., NewYork, 1977.
Lliboutry, L., B. M. Arnao, A. Pautre, and B. Schneider, Glaciologicalproblems set by the control of dangerous lakes in Cordillera Blanca,Peru, I, Historical failures of morainic lakes, their causes and pre-vention, J. Glaciol., 18, 239–254, 1977.
MacDonald, T. C., and J. Langridge-Monopolis, Breaching character-istics of dam failures, J. Hydraul. Eng., 110, 567–586, 1984.
Malde, H. E., The catastrophic late Pleistocene Bonneville Flood inthe Snake River Plain, Idaho, U.S. Geol. Surv. Prof. Pap. 596, 52 pp.,1968.
Malvern, L. E., Introduction to the Mechanics of a Continuous Medium,pp. 469–474, Prentice-Hall, Englewood Cliffs, N. J., 1969.
O’Connor, J. E., Hydrology, hydraulics, and geomorphology of theBonneville Flood, Geol. Soc. Am. Spec. Pap. 274, 83 pp., 1993.
O’Connor, J. E., J. H. Hardison, and J. E. Costa, Debris flows fromrecently deglaciated areas on central Oregon Cascade Range volca-noes, Eos Trans. AGU, 74, Fall Meet. Suppl., 314, 1993.
Parker, G., P. C. Klingeman, and D. G. McLean, Bedload and sizedistribution in paved gravel-bed streams, J. Hydraul. Div. Am. Soc.Civ. Eng., 108, 544–571, 1982.
Ralston, D. C., Mechanics of embankment erosion during overflow, inProceedings, 1987 National Conference on Hydraulic Engineering, ed-ited by R. M. Ragan, pp. 733–744, Am. Soc. of Civ. Eng., New York,1987.
Simmler, H., and L. Samet, Dam failure from overtopping studied in ahydraulic model, in Transactions of 14th International Congress onLarge Dams, vol. 1, pp. 427–445, Int. Comm. on Large Dams, Paris,1982.
Singh, V. P., Dam Breach Modeling Technology, pp. 27–40, 62–100,Kluwer Acad., Norwell, Mass., 1996.
Singh, V. P., P. D. Scarlatos, J. G. Collins, and M. R. Jourdan, Breacherosion of earthfill dams (BEED) model, Nat. Hazards, 1, 161–180,1988.
Umbal, J. V., and K. S. Rodolfo, The 1991 lahars of southwesternMount Pinatubo, Philippines, and evolution of the lahar-dammedMapanuepe Lake, in Fire and Mud: Eruptions and Lahars of MountPinatubo, Philippines, edited by C. G. Newhall and R. S. Punong-bayan, pp. 951–970, Univ. of Wash. Press, Seattle, 1996.
Walder, J. S., and J. E. Costa, Outburst floods from glacier-dammedlakes: The effect of mode of lake drainage on flood magnitude,Earth Surf. Processes Landforms, 21, 701–723, 1996.
Walder, J. S., J. E. O’Connor, and J. E. Costa, A physically basedmethod for predicting peak discharge of floods caused by failure ofnatural and constructed earthen dams, in Destructive Water: Water-Caused Natural Disasters—Their Abatement and Control (Proceedingsof the Conference Held at Anaheim, California, June 1996), IAHSPubl. 239, Int. Assoc. of Hydrol. Sci., Wallingford, England, in press,1997.
Waythomas, C. F., J. S. Walder, R. G. McGimsey, and C. A. Neal, Acatastrophic flood caused by drainage of a caldera lake at AniakchakVolcano, Alaska, and implications for volcanic-hazards assessment,Geol. Soc. Am. Bull., 108, 861–871, 1996.
J. E. O’Connor, U.S. Geological Survey, 10615 SE Cherry BlossomDr., Portland, OR 97216.
J. S. Walder, Cascades Volcano Observatory, U.S. Geological Sur-vey, 5400 MacArthur Blvd., Vancouver, WA 98661. (e-mail:[email protected])
(Received February 10, 1997; revised May 16, 1997;accepted June 3, 1997.)
WALDER AND O’CONNOR: METHODS FOR PREDICTING PEAK DISCHARGE2348
Copyright © 2022 FDOKUMEN