Bayesian Fusion for Indoor Positioning Using Bluetooth Fingerprints
Upload
independentCategory
view
2download
0
Methods for Computer-aided Chemical Biology.Part 1: Design of a Benchmark System for theEvaluation of Compound Selectivity
Dagmar Stumpfe‡, Hany E. A. Ahmed‡,Ingo Vogt and Jurgen Bajorath*
Department of Life Science Informatics, B-IT, Rheinische Friedrich-Wilhelms-Universit�t Bonn, Dahlmannstr. 2, D-53113 Bonn, Germany*Corresponding author: J�rgen Bajorath, [email protected]�These authors contributed equally to this work and share firstauthorship.
Computational drug design and discovery methodshave traditionally put much emphasis on the iden-tification of novel active compounds and the opti-mization of their potency. For chemical geneticsand genomics applications, an important task isthe identification of small molecules that are selec-tive against target families, subfamilies, or individ-ual targets and can be used as molecular probesfor specific functions. In order to develop or tunecomputational methods for such applications,there is a need for molecular benchmark systemsthat focus on compound selectivity, rather thanbiological activity (in qualitative terms) or potency.We have constructed a selectivity-oriented testsystem that consists of 26 compound selectivitysets against 13 individual targets belonging tothree distinct families and contains a total of 558selective compounds. The targets were chosenbecause of pharmaceutical relevance and the avail-ability of suitable ligands, privileged structuralmotifs and ⁄ or target structure information. Com-pound selectivity sets were characterized by struc-tural diversity, chemical scaffold and selectivityrange analysis. The test system is made freelyavailable and should be useful for the developmentof computational approaches in chemical biology.
Key words: chemical biology, chemical genetics, chemoinformatics,compound selectivity, computational methods, drug targets, molecularprobes, target families
Received 22 June 2007, revised 16 July 2007 and accepted for publica-tion 18 July 2007
The identification and optimization of novel active compounds haslong been the major focal point in computer-aided drug design andalso plays an important role in chemoinformatics research, for exam-ple, in the development of methods for compound database mining
(1). In general terms, chemical biology focuses on the use of smallmolecules to study and elucidate biological functions (2). In this con-text, chemical genetics (3,4) and genomics (4,5) approaches havebecome popular in recent years. Chemical genetics aims to generatesmall molecule-specific cellular phenotypes and identify responsibletargets (forward approach) or, alternatively, use small molecules tospecifically inhibit or activate selected targets and study the func-tional consequences (reverse approach). Chemical genomics is oftenunderstood as the systematic exploration of genomic targets usingsmall molecular probes or the generation of drug leads against allavailable therapeutic targets. Therefore, for chemical genetics orgenomics applications, it is usually very important to identify ordesign small molecules that can be used as selective probes for pro-tein families and ⁄ or individual family members in order to evaluatetheir functions. Such applications might not primarily aim at thedevelopment of drug candidates but rather attempt to generate anduse small molecules as tools for functional analysis. This changesthe perspective and requirements because compound selectivitybecomes a major issue, more so than potency or pharmacologicalproperties. Thus far, few if any computational methods have beenintroduced to directly support applications in chemical biology. Manyof these applications depend on the study of compound selectivity.However, dedicated molecular databases or test systems that aresuitable to address selectivity issues on a larger scale are currentlydifficult to access. In fact, we have not been able to obtain bench-mark data sets for selectivity studies from public domain sources.Therefore, we have designed a benchmark data set consisting of avariety of compound subsets that makes it possible to evaluate dif-ferences in ligand selectivity between individual members of differ-ent target families including biogenic amine G protein-coupledreceptors (GPCRs) that are among the most frequently occurring drugtargets (6,7), cathepsin (Cat) thiol proteases (8) and chymotrypsin-likeserine proteases (9). For the chosen thiol proteases, we were able tocomplement compound selectivity sets assembled from the literaturewith data from high-throughput screening (HTS) assays, which furtherexpanded the structural variety of compounds having different selec-tivity. In this study, we report the design of this selectivity benchmarksystem and a detailed analysis of the compounds it contains. Eachcompound subset was characterized by molecular similarity, chemicalscaffold and selectivity range analysis. Our compound collectionmakes it readily possible to evaluate computational methodologiesfor their ability to distinguish between ligands having different selec-tivity within a group of closely related targets. In an accompanyingarticle, we present an analysis of similarity search calculations usingdifferent 2D fingerprint methods that we carried out on these
182
Chem Biol Drug Des 2007; 70: 182–194
Research Article
ª 2007 The AuthorsJournal compilation ª 2007 Blackwell Munksgaard
doi: 10.1111/j.1747-0285.2007.00554.x
compound sets. The compound selectivity benchmark system will bemade freely available to support the development and ⁄ or evaluationof other compound selectivity-oriented methodologies.
Methods and Materials
Initially, we surveyed a number of different target families withinthe GPCR, thiol protease and serine protease superfamilies for theavailability of significant numbers of compounds with experimentallyconfirmed differential selectivity against individual targets. This sur-
vey largely determined which target families and subfamilies weultimately focused on. The chosen targets included six biogenicamine GPCRs, four papain-like thiol proteases and three chymotryp-sin-like serine proteases. For the assembly of our selectivity sets,compounds were taken from the Molecular Drug Data Report(MDDR)a, the BindingDB database (10,11) and original literature orpatent sources. For every compound, original references were con-sulted to confirm that it was assayed against different members ofour target panels and only competitive and reversible antagonistsor partial agonists (GPCRs) and inhibitors (proteases) were takeninto consideration. For GPCRs, the biologically active compoundsand drug candidates reported in the literature that met our selecti-vity criteria were antagonists or partial agonists, which rationalizestheir selection. Thus, the selectivity sets were hand-selected andassembled on a compound-by-compound basis, which is time-con-suming but ensures high quality of the data. For selected com-pounds exact sourcing information including original references isprovided in Supplementary Tables S1–S4. For GPCR and cathepsincompound sets taken from database or literature sources, a com-pound was considered selective for a given target if its Ki or IC50
value was at least 50-fold lower than for targets within the samesubfamily. This threshold value was applied to ensure that eachselectivity set contained at least about 10 compounds. Cathepsin
Table 1: Targets for compound selectivity sets
Superfamily Family Subfamily Targets
Rhodopsin-likeGPCRs
Biogenic aminereceptors
AdrenergicDopamineSerotonin
Alpha1D1, D2, D3, D45HT1a
Papain-like thiolproteases
C1 Papain Cat B-likeCat L-like
Cat BCat L, S, K
Chymotrypsin-likeserine proteases
S1 Chymotrypsin Trypsin-like Thrombin, Trypsin,Factor Xa
A
B
C
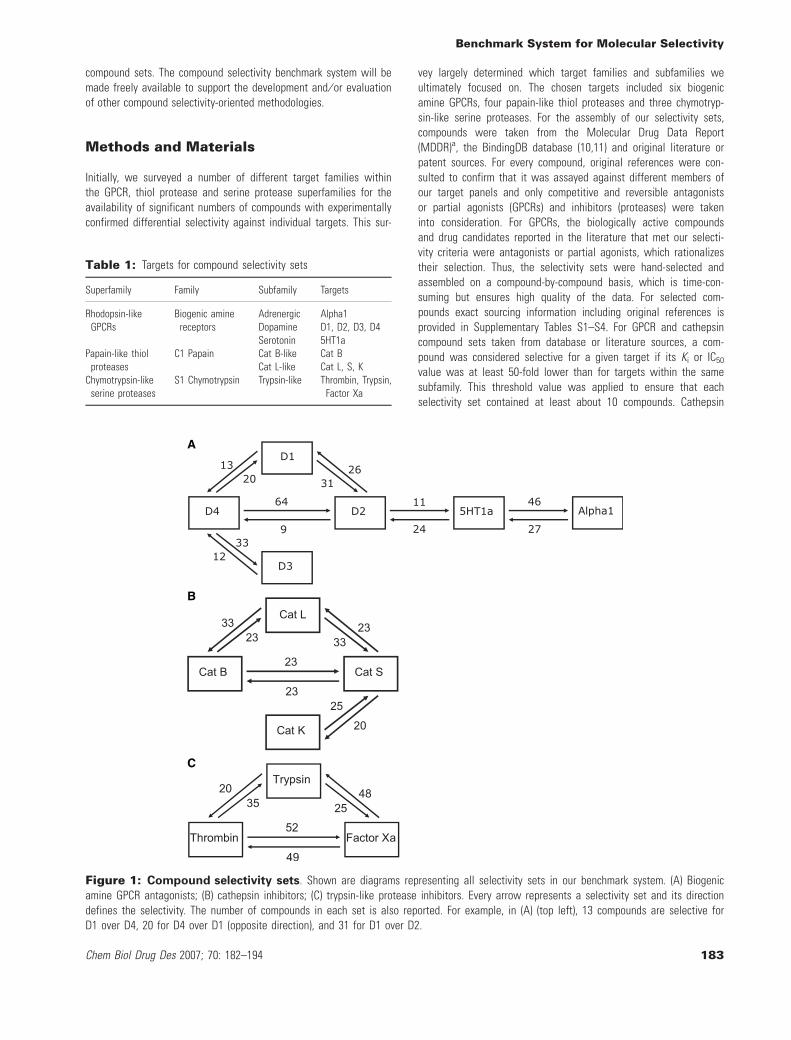
Figure 1: Compound selectivity sets. Shown are diagrams representing all selectivity sets in our benchmark system. (A) Biogenicamine GPCR antagonists; (B) cathepsin inhibitors; (C) trypsin-like protease inhibitors. Every arrow represents a selectivity set and its directiondefines the selectivity. The number of compounds in each set is also reported. For example, in (A) (top left), 13 compounds are selective forD1 over D4, 20 for D4 over D1 (opposite direction), and 31 for D1 over D2.
Benchmark System for Molecular Selectivity
Chem Biol Drug Des 2007; 70: 182–194 183

inhibitors taken from HTS data sets had to display exclusive bindingto one of the three cathepsins at concentrations of up to50 lmol ⁄ L. Cathepsin HTS data set were obtained by merging theresults of three screens for inhibitors of cathepsins B, L and S,
respectively, using largely overlapping compound source databases.These assays were carried out at the Penn Center for MolecularDiscovery (PCMD) at the University of Pennsylvaniab and are pub-licly available through PubChemc. The intersection of these threedifferent assays consists of 55,134 compounds including 79 hitswith confirmed IC50 against only one of the targets. For the serineprotease data sets, it was possible to select sufficiently large num-bers of compounds that had at least 100-fold lower Ki or IC50 val-ues against an individual target than the other targets of the samesubfamily. The intra-set structural diversity distribution was evalu-ated by systematic pair-wise calculation of the Tanimoto coefficient(Tc) (12) using the MACCS structural key fingerprintd and Tc matri-
Table 2: Selectivity set summary
Targets Selectivity sets Total number of compounds
Biogenic amine GPCRs 12 248Papain-like family 8 124Chymotrypsin-like family 6 186
A
Figure 2: MACCS Tc
matrices for selective set
comparison. Similarity valuesare reported for systematicintra-set and inter-set pair-wisecompound comparisons. MACCS Tcvalues are colour-coded accordingto the following scheme: lightgreen 0–0.2, dark green 0.2–0.4,grey 0.4–0.6, dark red 0.6–0.8,light red 0.8–1. Color bars markthe matrix positions of compoundsin a particular selectivity set.(A) GPCR ligands. (B) Proteaseinhibitors. B, K, L, and S refer tothe different cathepsins. Compoundsets with ''bidirectional'' selectivityare compared. For example, the D1versus D2 matrix (top left in A)compares D1 compounds selectiveover D2 and vice versa.
Stumpfe et al.
184 Chem Biol Drug Des 2007; 70: 182–194

ces were generated using Matrix2png (13). MACCS structural keyswere selected to access compound diversity because these descrip-tors are molecular fragments and thus emphasize structural resem-blance and, in addition, because they are publicly available (incontrast to various other fingerprints). LogP (o ⁄ w) values were cal-culated using the Molecular Operating Environmente. In order toanalyse core structure distributions within selectivity sets, differenttypes of scaffolds were calculated reminiscent of the Meqiapproach (14). Compounds were reduced to chemical scaffolds bydeleting all non-ring substituents except linkers between ring sys-tems. Chemical scaffolds were further reduced to carbon skeletonsby substituting all heteroatoms with carbon atoms and converting
all bond orders to single bonds. Upon publication, our benchmarksystem will be freely available through the following link: http://www.b-it-center.de/Wob/en/view/class211_id675.html.
Results and Discussion
Target selectionWe assembled compound sets selective against 13 targets belong-ing to three subfamilies of biogenic amine GPCRs (the alpha1adrenergic receptor, 5HT1a serotonin receptor and dopaminereceptor subtypes D1–D4), two subfamilies of papain-like thiol
B
Figure 2: Continued.
Benchmark System for Molecular Selectivity
Chem Biol Drug Des 2007; 70: 182–194 185

proteases (cathepsin B versus L, S and K) and trypsin-like subfam-ily of the serine proteases (thrombin, trypsin, factor Xa). Theselected targets and their superfamily, family and subfamily rela-tionships (15–19) are summarized in Table 1. We attempted toassemble compound sets displaying different scaffold-selectivityrelationships: similar scaffolds having different selectivity anddiverse scaffolds with similar selectivity. The GPCR ligands studiedhere generally share a canonical molecular organization wherearylpiperazine or piperidine moieties are connected through alkylor alkenyl spacers to heteroaromatic systems, as illustrated inSupplementary Figure S1. Variations in these structural motifs areresponsible for differences in ligand selectivity. For computationalapproaches, distinguishing between compounds having limitedstructural diversity, but significant differences in selectivity isthought to be a challenging task. This was another motivation forthe selection of biogenic amine GPCR ligands. In contrast to GPCRligands, for the proteases studied here, a wealth of X-ray struc-tural information is available (20,21) including complexes withselective ligands. Supplementary Figure S2 shows examples forthe trypsin-like proteases. Thus, corresponding selectivity sets canalso be evaluated in light of structural data taking known bind-ing modes into account, which makes it possible to apply struc-ture-based methods for selectivity analysis. This was anotherreason for focusing on protease targets. Thus, selectivity setswere designed to include rather different types of compoundsdirected against targets, for which much relevant information wasavailable, either at the ligand (GPCRs) or target structure level(proteases).
Selectivity setsAll selectivity sets currently included in our benchmark system andtheir composition are schematically presented in Figure 1. The num-ber of compounds per set ranges from 9 to 64, with the majority ofsets containing between 20 and 30 compounds. These compoundnumbers were largely determined by our stringent selection andquality control criteria, as described above. This also explains whyit was not possible to generate selectivity sets for all chosen tar-gets, for example, D2 and D3 (Figure 1A). Furthermore, it is impor-tant to note that the numbers of selective compounds per targetgenerally differ for target pairs, dependent on the ''directionality'',as also illustrated in Figure 1. An extreme example is provided byD4 and D2 (Figure 1A). For D4, 64 compounds were found to beselective over D2. By contrast, only nine compounds could be con-firmed to be selective for D2 over D4. Similarly, 48 inhibitors wereselective for factor Xa over trypsin, but only 25 for trypsin over fac-tor Xa. Confirming compound selectivity for target pairs essentiallyrequired the assembly of selectivity sets on a compound-by-com-pound basis, typically considering multiple sources in parallel.Table 2 summarizes the composition of our benchmark system.Twenty-six selectivity sets against 13 targets were generated con-taining a total of 558 selective compounds. Thus, the selectivitysets provide a benchmark system of considerable size.
Compound diversityThe intra- and inter-set structural diversity of selective compoundswas evaluated using systematic MACCS key fingerprint calculations.Figure 2 reveals that the compound diversity distribution withinselectivity sets substantially differs and, moreover, that selectivitysets belonging to the same target subfamily are related to eachother by significantly different degrees of diversity. As expected,GPCR ligands (Figure 2A) were generally more similar to each otherthan protease inhibitors (Figure 2B). However, although GPCR setsare in general -but not always- structurally homogeneous, compari-son of selectivity sets for target pairs produce rather different diver-sity patterns (Figure 2A) and equivalent observations can be madefor the protease inhibitor sets that are characterized by higherintra-set diversity (Figure 2B). However, there are exceptions; forexample, HTS hits selective for cathepsin S and both thrombin andtrypsin inhibitors selective over factor Xa have significant intra-setsimilarity. By contrast, thrombin inhibitors selective over trypsin arestructurally heterogeneous. The significantly different diversity pat-terns for selectivity sets and their comparison in Figure 2 demon-strate that there is no obvious correlation between structuralsimilarity or diversity and compound selectivity. Structurally similarcompounds, but also structurally diverse compounds are found tobe target-selective and compounds having opposite selectivity areoften related by different degrees of structural diversity. Theseobservations suggest that there are no simple structural rules thatgovern selectivity differences within our benchmark system and thatdifferent types of structure–selectivity relationships are covered.These are important aspects because we wish to rule out thatselectivity differences can simply be captured by comparison of glo-bal molecular similarity. Our findings also suggest that distinguish-ing between these sets of compounds having different selectivitypresents a non-trivial problem for molecular similarity analysis andother computational methods. Supplementary Figure S3 shows that
Table 3a: Selective compounds and carbon scaffolds for dopa-mine receptor D1
Selectivity Representative carbon scaffolds Representative compounds
D2 ⁄ D1‡50 Br
NHO
>10 000 ClN
HO
D4 ⁄ D1‡50 HO
N
HO
>1000 Cl
NSO
HN
In a–k, compounds and corresponding carbon scaffolds are shown that arerepresentative of low (minimally required) and high selectivity levels. Forexample, ''D2 ⁄ D1'' means that compounds are selective for D1 over D2. Thisnomenclature is consistently used throughout the tables.
Stumpfe et al.
186 Chem Biol Drug Des 2007; 70: 182–194
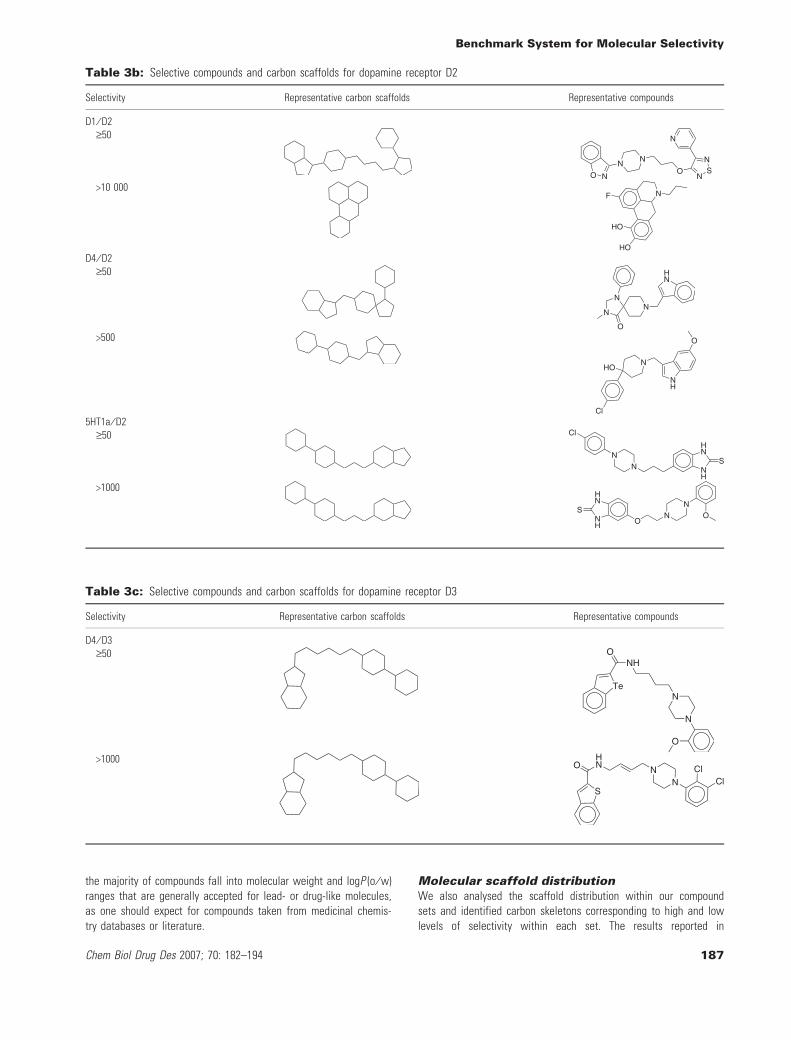
the majority of compounds fall into molecular weight and logP (o ⁄ w)ranges that are generally accepted for lead- or drug-like molecules,as one should expect for compounds taken from medicinal chemis-try databases or literature.
Molecular scaffold distributionWe also analysed the scaffold distribution within our compoundsets and identified carbon skeletons corresponding to high and lowlevels of selectivity within each set. The results reported in
Table 3c: Selective compounds and carbon scaffolds for dopamine receptor D3
Selectivity Representative carbon scaffolds Representative compounds
D4 ⁄ D3‡50
Te
ONH
N
N
O
>1000
ClNN
HNO
S
Cl
Table 3b: Selective compounds and carbon scaffolds for dopamine receptor D2
Selectivity Representative carbon scaffolds Representative compounds
D1 ⁄ D2‡50
SN
O
NN
NO
N
N
>10 000F N
HO
HO
D4 ⁄ D2‡50
O
N
NN
HN
>500
Cl
HON
NH
O
5HT1a ⁄ D2‡50 Cl
NN
HN
SNH
>1000
S
HN
ON
NON
H
Benchmark System for Molecular Selectivity
Chem Biol Drug Des 2007; 70: 182–194 187
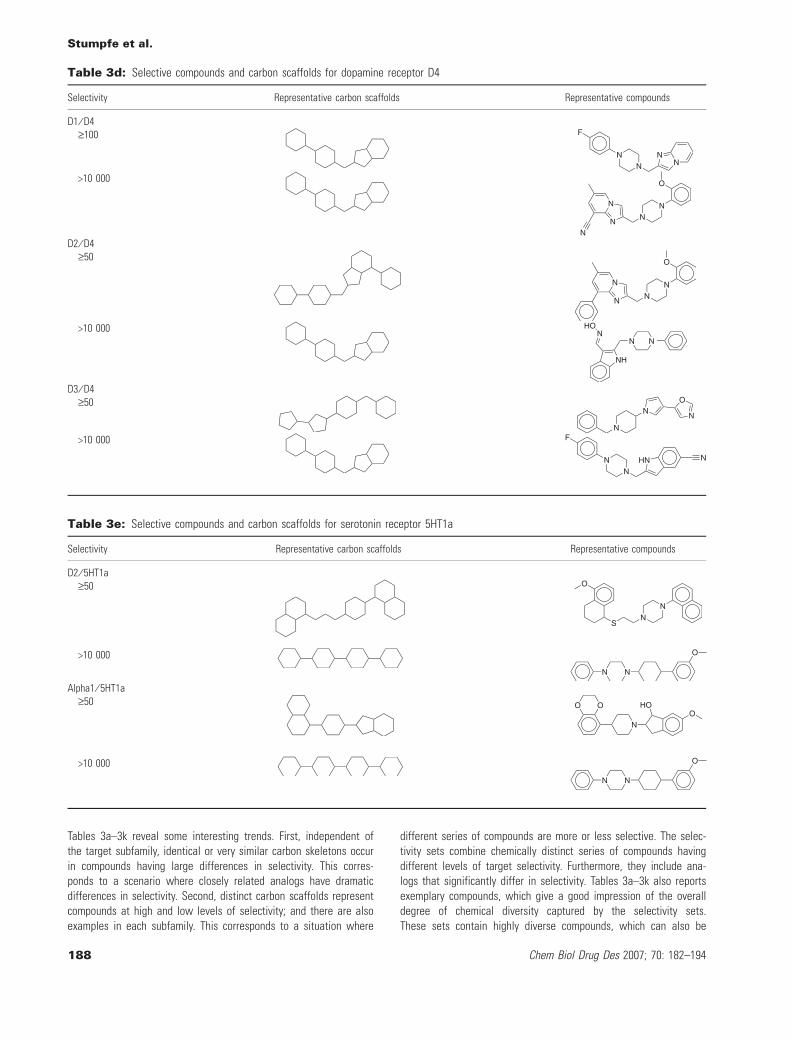
Tables 3a–3k reveal some interesting trends. First, independent ofthe target subfamily, identical or very similar carbon skeletons occurin compounds having large differences in selectivity. This corres-ponds to a scenario where closely related analogs have dramaticdifferences in selectivity. Second, distinct carbon scaffolds representcompounds at high and low levels of selectivity; and there are alsoexamples in each subfamily. This corresponds to a situation where
different series of compounds are more or less selective. The selec-tivity sets combine chemically distinct series of compounds havingdifferent levels of target selectivity. Furthermore, they include ana-logs that significantly differ in selectivity. Tables 3a–3k also reportsexemplary compounds, which give a good impression of the overalldegree of chemical diversity captured by the selectivity sets.These sets contain highly diverse compounds, which can also be
Table 3d: Selective compounds and carbon scaffolds for dopamine receptor D4
Selectivity Representative carbon scaffolds Representative compounds
D1 ⁄ D4‡100 F
NN
NN
>10 000 O
NN
N
N
N
D2 ⁄ D4‡50 O
NN
N
N
>10 000 HON
NH
N N
D3 ⁄ D4‡50 O
NN
N
>10 000 F
NN
HN N
Table 3e: Selective compounds and carbon scaffolds for serotonin receptor 5HT1a
Selectivity Representative carbon scaffolds Representative compounds
D2 ⁄ 5HT1a‡50
SN
N
O
>10 000 O
NN
Alpha1 ⁄ 5HT1a‡50 HO
ON
O O
>10 000 O
NN
Stumpfe et al.
188 Chem Biol Drug Des 2007; 70: 182–194
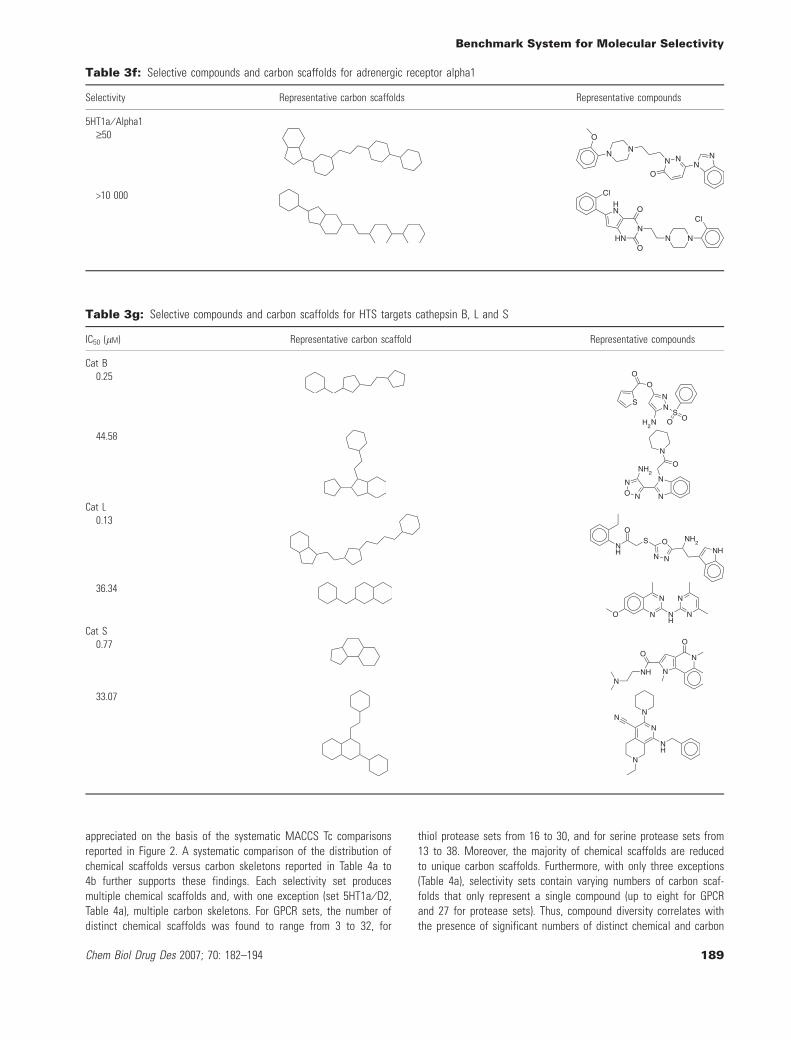
appreciated on the basis of the systematic MACCS Tc comparisonsreported in Figure 2. A systematic comparison of the distribution ofchemical scaffolds versus carbon skeletons reported in Table 4a to4b further supports these findings. Each selectivity set producesmultiple chemical scaffolds and, with one exception (set 5HT1a ⁄ D2,Table 4a), multiple carbon skeletons. For GPCR sets, the number ofdistinct chemical scaffolds was found to range from 3 to 32, for
thiol protease sets from 16 to 30, and for serine protease sets from13 to 38. Moreover, the majority of chemical scaffolds are reducedto unique carbon scaffolds. Furthermore, with only three exceptions(Table 4a), selectivity sets contain varying numbers of carbon scaf-folds that only represent a single compound (up to eight for GPCRand 27 for protease sets). Thus, compound diversity correlates withthe presence of significant numbers of distinct chemical and carbon
Table 3f: Selective compounds and carbon scaffolds for adrenergic receptor alpha1
Selectivity Representative carbon scaffolds Representative compounds
5HT1a ⁄ Alpha1‡50
O
N NN
NN
N
O
>10 000
Cl
NNN
OHN
HN O
Cl
Table 3g: Selective compounds and carbon scaffolds for HTS targets cathepsin B, L and S
IC50 (lM) Representative carbon scaffold Representative compounds
Cat B0.25
S
O
O
NN
N O OS
H2
44.58
O
N
N
NNON
NH2
Cat L0.13
NH2S
O
NH
O
NNNH
36.34
O
N
NNH
N
N
Cat S0.77 O
N
N
O
NHN
33.07
NN
NH
N
N
Benchmark System for Molecular Selectivity
Chem Biol Drug Des 2007; 70: 182–194 189
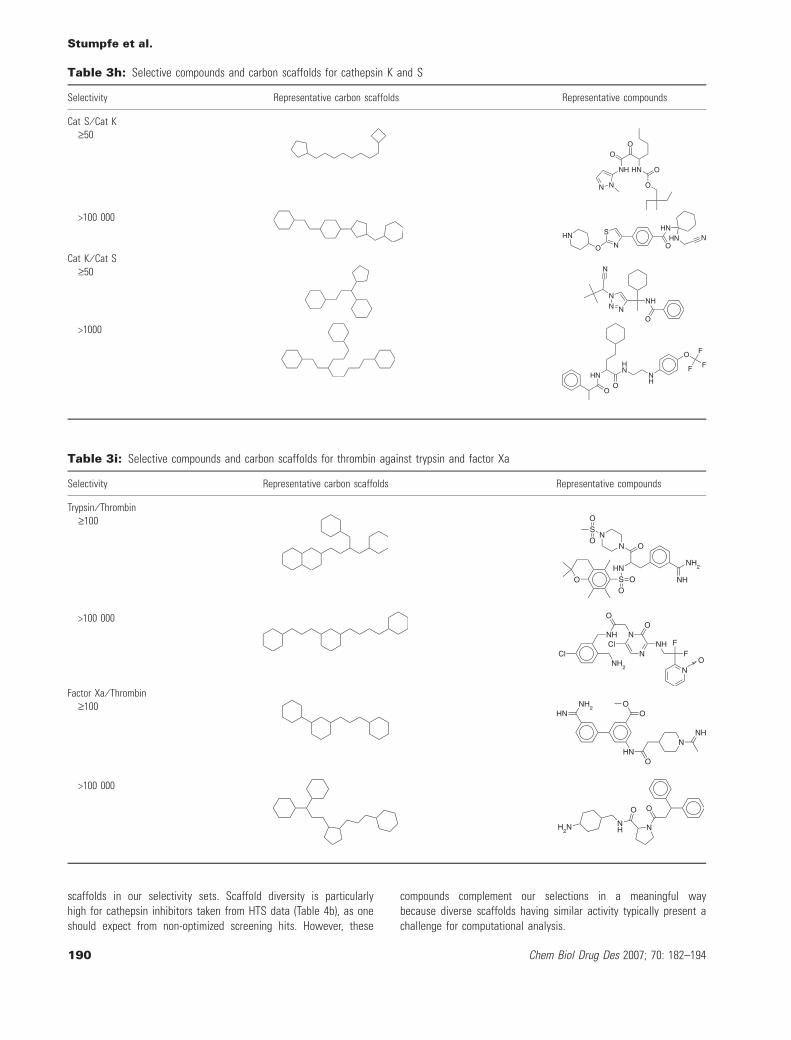
scaffolds in our selectivity sets. Scaffold diversity is particularlyhigh for cathepsin inhibitors taken from HTS data (Table 4b), as oneshould expect from non-optimized screening hits. However, these
compounds complement our selections in a meaningful waybecause diverse scaffolds having similar activity typically present achallenge for computational analysis.
Table 3h: Selective compounds and carbon scaffolds for cathepsin K and S
Selectivity Representative carbon scaffolds Representative compounds
Cat S ⁄ Cat K‡50
O
O
HN
OO
NH
NN
>100 000S
NO
HNO
HNHN N
Cat K ⁄ Cat S‡50
O
NHNN
N
N
>1000
F
F
FO
NH
HN
OHN
O
Table 3i: Selective compounds and carbon scaffolds for thrombin against trypsin and factor Xa
Selectivity Representative carbon scaffolds Representative compounds
Trypsin ⁄ Thrombin‡100
SO
ON
N
HNSO
O O
O
NH2
NH
>100 000
NH2
ClN
O
NH
Cl
O
NNH
FF
NO
Factor Xa ⁄ Thrombin‡100 NH
2
OHN
OO
HN
NNH
>100 000
H2N
O
N
O
NH
Stumpfe et al.
190 Chem Biol Drug Des 2007; 70: 182–194
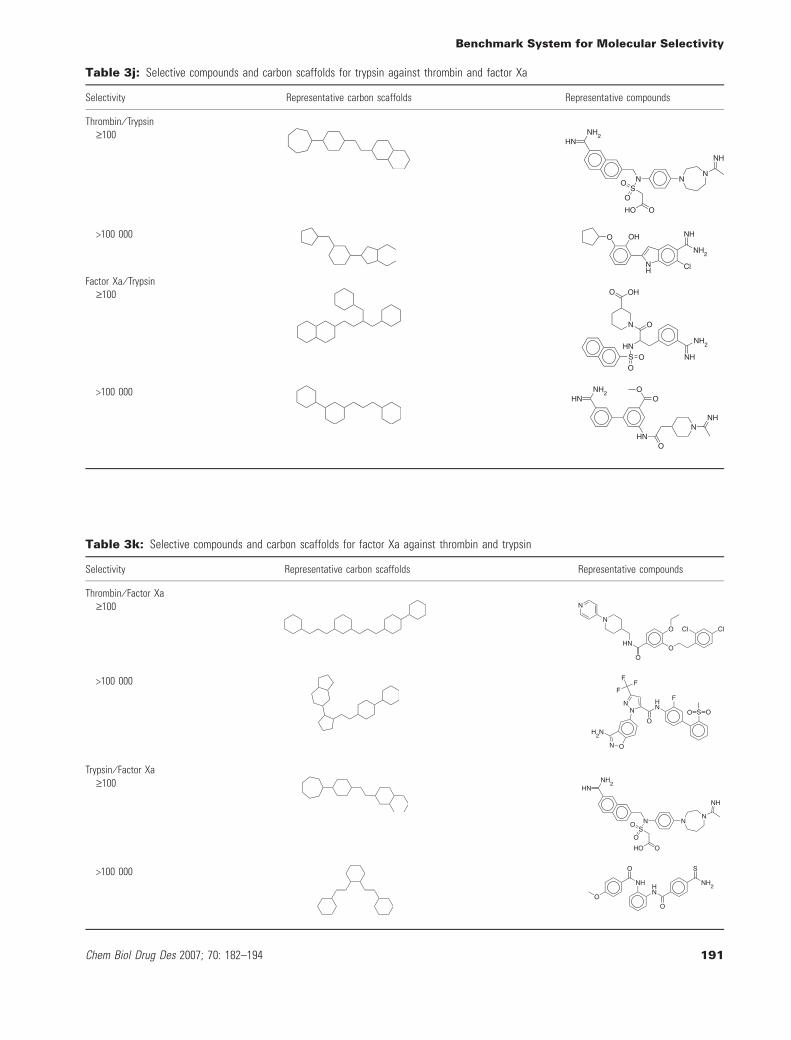
Table 3j: Selective compounds and carbon scaffolds for trypsin against thrombin and factor Xa
Selectivity Representative carbon scaffolds Representative compounds
Thrombin ⁄ Trypsin‡100
SO
O
N
HNNH
2
NN
NH
OHO
>100 000NH
2
O OH
ClNH
NH
Factor Xa ⁄ Trypsin‡100
NH2
O OH
OO
HNNH
ON
S
>100 000 NH2
OHN
OO
HN
NNH
Table 3k: Selective compounds and carbon scaffolds for factor Xa against thrombin and trypsin
Selectivity Representative carbon scaffolds Representative compounds
Thrombin ⁄ Factor Xa‡100
Cl
O
O
O
HN
N
N
Cl
>100 000
O O
HN
O
NN
FF
F
ON
F
S
H2N
Trypsin ⁄ Factor Xa‡100
SO
O
N
HN
NN
NH
OHO
NH2
>100 000 S
NH2
O
HN
NH
O
O
Benchmark System for Molecular Selectivity
Chem Biol Drug Des 2007; 70: 182–194 191

Selectivity rangesAs already indicated in Table 4a to 4c, the selectivity sets com-bine compounds at varying selectivity levels and the selectivityrange for each set is reported in Table 5a to 5c. For the GPCRand cathepsin targets, we set a threshold value of at least a 50-fold difference in compound potency between two targets as acriterion for compound selectivity. This was performed in order toensure that selectivity sets would contain at least about 10 com-pounds (although, in the most cases, we were able to collect lar-
ger numbers of molecules). However, as can be seen in Table 5aand 5b, selectivity ranges within these sets typically coverapproximately three orders of magnitude. For the serine proteasesets, it was possible to apply a more stringent 100-fold differ-ence in relative potency as a selectivity criterion. Nevertheless,as can be seen in Table 5c, selectivity ranges within these setsalso cover three to four orders of magnitude. Thus, similar to thediversity of structure–selectivity relationships represented by thesecompound sets, their intra-set selectivity distributions are hetero-geneous. This also provides an opportunity to benchmark compu-tational models that aim at describing selectivity differences inquantitative terms.
Table 5a: Selectivity and potency ranges inside the GPCR com-pound sets
Sets Selectivity range (ratio) Potency range (Ki or IC50) [nM]
D2 ⁄ D1 59–10 084 0.08–14D1 ⁄ D2 67–18 310 0.053–1430D4 ⁄ D1 65–4761 0.068–14D1 ⁄ D4 190–30 769 0.25–44D4 ⁄ D2 50–834 2.5–23.9D2 ⁄ D4 59–17 600 0.5–36D4 ⁄ D3 51–1609 0.23–43D3 ⁄ D4 52–15 000 0.25–1305HT1a ⁄ D2 50–1621 0.19–20D2 ⁄ 5HT1a 58–10 000 0.02–10.25HT1a ⁄ Alpha1 59–20 000 0.29–110.7Alpha1 ⁄ 5HT1a 55–10 000 0.02–7.1
Table 4a: Distribution of chemical and carbon scaffolds insidethe GPCR compound sets
SetsSelectiveligands
Chemicalscaffolds
Carbonscaffolds
Uniquecarbon scaffold
D2 ⁄ D1 31 17 17 6D1 ⁄ D2 26 14 11 2D4 ⁄ D1 13 5 5 1D1 ⁄ D4 20 9 5 0D4 ⁄ D2 9 3 3 0D2 ⁄ D4 64 21 12 4D4 ⁄ D3 12 11 6 3D3 ⁄ D4 33 21 16 55HT1a ⁄ D2 11 3 1 0D2 ⁄ 5HT1a 24 21 11 15HT1a ⁄ Alpha1 27 18 14 8Alpha1 ⁄ 5HT1a 46 32 19 7
''Unique carbon scaffold'' gives the number of carbon scaffolds that onlyrepresent a single compound.
Table 4b: Distribution of chemical and carbon scaffolds insidethe cathepsin compound sets
SetsSelectiveligands
Chemicalscaffolds
Carbonscaffolds
Uniquecarbon scaffold
Cat L ⁄ Cat B 23 16 15 12Cat B ⁄ Cat L 33 30 28 25Cat S ⁄ Cat B 23 16 15 12Cat B ⁄ Cat S 23 18 18 15Cat S ⁄ Cat L 33 30 28 25Cat L ⁄ Cat S 23 18 18 15Cat S ⁄ Cat K 25 22 14 8Cat K ⁄ Cat S 20 19 17 14
Table 4c: Distribution of chemical and carbon scaffolds insidethe serine protease compound sets
SetsSelectiveligands
Chemicalscaffolds
Carbonscaffolds
Unique carbonscaffold
Factor Xa ⁄ Thrombin 52 33 26 21Thrombin ⁄ Factor Xa 49 27 22 18Factor Xa ⁄ Trypsin 25 18 14 10Trypsin ⁄ Factor Xa 48 38 29 17Thrombin ⁄ Trypsin 20 13 10 7Trypsin ⁄ Thrombin 35 35 30 27
Table 5b: Selectivity and potency ranges inside the cathepsincompound sets
Selectivity range (ratio) Potency range (Ki or IC50) [nM]
Cat L ⁄ Cat B specific HTS set 250–44 580Cat B ⁄ Cat L specific HTS set 130–36 340Cat S ⁄ Cat B specific HTS set 250–44 580Cat B ⁄ Cat S specific HTS set 770–33 070Cat S ⁄ Cat L specific HTS set 130–36 340Cat L ⁄ Cat S specific HTS set 770–33 070Cat S ⁄ Cat K 65–119 298-fold 0.0048–410Cat K ⁄ Cat S 50–1000-fold 15–3100
Table 5c: Selectivity and potency ranges inside the serine pro-tease compound sets
Selectivity range(ratio)
Potency range(Ki or IC50) [nM]
Factor Xa ⁄ Thrombin 100–490 000-fold 0.66–1000Thrombin ⁄ Factor Xa 104–2000 000-fold 0.1–87Factor Xa ⁄ Trypsin 100–100 000-fold 0.64–779Trypsin ⁄ FactorXa 100–400 000-fold 0.01–60Thrombin ⁄ Trypsin 100–11 428-fold 1–900Trypsin ⁄ Thrombin 103–122 059-fold 0.0025–1600
Stumpfe et al.
192 Chem Biol Drug Des 2007; 70: 182–194
Conclusions and Future Directions
In the context of chemical biology, a major challenge for and goalof computational approaches will be to successfully mine databasesfor molecules that can distinguish between different targets withina protein family or subfamily. The compound benchmark systemreported herein was designed to permit the evaluation or develop-ment of computational methods for applications in chemical biologythat depend on the use of target-selective compounds. Great carewas taken to assemble high-quality compound sets with well-defined selectivity. We have analysed the selectivity sets in detailand confirmed that they contain diverse chemotypes and com-pounds, represent different degrees of diversity between sets fortarget pairs, and capture different types of structure–selectivityrelationships. Thus, on the basis of our analysis, the compound col-lection is thought to provide an attractive and challenging test sys-tem for the computational investigation of compound selectivity.Currently, the selectivity sets contain 558 selective molecules. Forthe evaluation of computational methods, this is a sufficiently largenumber of compounds. Different methodologies require differenttypes of molecular and feature representations, for which theassembly of chemically different compounds and diverse structure–selectivity relationships provides a meaningful basis. Alternativemethods are expected to respond differently to specific molecularfeatures encoded by diverse selectivity sets within our benchmarksystem. The system will be continuously updated and selectivitysets for new targets and target families will be added. The com-pound system will be made freely available and it is hoped that itwill be also useful to others and aid in the further development ofselectivity-oriented computational methods. In the accompanyingpaper, we present a first analysis of the potential of 2D similaritysearch methods to identify compounds having different selectivitywithin target subfamilies and distinguish them from decoys.
Acknowledgment
This work was supported by a DFG Special Research Center grant(SFB 704), a fellowship of the Egyptian government (H.E.A.A.), andthe B-IT foundation.
References
1. Eckert H., Bajorath J. (2007) Molecular similarity analysis in vir-tual screening. Drug Discov Today;12:225–233.
2. Stockwell B.R. (2004) Exploring biology with small organic mole-cules. Nature;432:846–854.
3. Alaimo P.J., Shogren-Knaak M.A., Shokat K.M. (2001) Chemicalgenetic approaches for the elucidation of signaling pathways.Curr Opin Chem Biol;5:360–367.
4. Spring D.R. (2005) Chemical genetics to chemical genomics:small molecules offer big insights. Chem Soc Rev;34:472–482.
5. Bredel M., Jacoby E. (2004) Chemogenomics: an emerging strat-egy for rapid target and drug discovery. Nature Rev Genet;5:262–275.
6. Tyndall J.D., Sandilya R. (2005) GPCR agonists and antagonistsin the clinic. Med Chem;1:405–421.
7. Overington J.P., Al-Lazikani B., Hopkins A.L. (2006) How manydrugs are there? Nature Rev Drug Discov;5:993–996.
8. McGrath M.E. (1999) The lysosomal cysteine proteases. AnnuRev Biophys Biomol Struct;28:181–204.
9. Rawlings N.D., Barrett A.J. (1993) Evolutionary families of pep-tidases. Biochem J;290:205–218.
10. Chen X., Lin Y., Liu M., Gilson M.K. (2002) The Binding Data-base: data management and interface design. Bioinformat-ics;18:130–139.
11. Liu T., Lin Y., Wen X., Jorrisen R.N., Gilson M.K. (2007) Binding-DB: a web-accessible database of experimentally determinedprotein-ligand binding affinities. Nucleic Acids Res;35:D198–D201.
12. Willett P. (2005) Searching techniques for databases of two-and three-dimensional structures. J Med Chem;48:4183–4199.
13. Pavlidis P., Nobel W.S. (2003) Matrix2png: a utility for visualizingmatrix data. Bioinformatics;19:295–296.
14. Xu Y.J., Johnson M. (2002) Using molecular equivalence num-bers to visually explore structural features that distinguishchemical libraries. J Chem Inf Comput Sci;42:912–926.
15. Jacoby E., Bouhelal R., Gerspacher M., Seuwen K. (2006) The 7TM G-protein-coupled receptor target family. ChemMedChem;1:761–782.
16. Guay J., Falgueyret J.P., Ducret A., Percival M.D., Mancini J.A.(2000) Potency and selectivity of inhibition of cathepsin K, L andS by their respective propeptides. Eur J Biochem;267:6311–6318.
17. Nagler D.K., Menard R. (2003) Family C1 cysteine prote-ases: biological diversity or redundancy? Biol Chem;384:837–843.
18. Screen S.E., St. Leger R.J. (2000) Cloning, expression, and sub-strate specificity of a fungal chymotrypsin. Evidence for lateralgene transfer from an actinomycete bacterium. J Biol Chem;275:6689–6694.
19. Volanakis J.E., Narayana S.V. (1996) Complement factor D, anovel serine protease. Protein Sci;5:553–564.
20. Czapinska H., Otlewski J. (1999) Structural and energetic deter-minants of the S1-site specificity in serine proteases. Eur J Bio-chem;260:571–595.
21. Turk D., Guncar G. (2003) Lysosomal cysteine proteases (cathep-sins): promising drug targets. Acta Cryst D;59:203–213.
Notes
aMolecular Drug Data Report (MDDR). San Leandro, CA, USA: Else-vier MDL; http://www.mdl.com
bThe Penn Center for Molecular Discovery (PCMD). http://www.seas.upenn.edu/~pcmd/
cPubChemhttp://pubchem.ncbi.nlm.nih.gov
dMACCS structural keys, San Leandro, CA, USA: Elsevier MDL;http://www.mdl.com.
Benchmark System for Molecular Selectivity
Chem Biol Drug Des 2007; 70: 182–194 193
eMolecular Operating Environment, Chemical Computing Group, Que-bec, Canada: Montreal; http://www.chemcomp.com.
Supplementary Material
The following supplementary material is available for this article:
Figure S1. Canonical structure of biogenic amine GPCR ligands.The general molecular organization of these GPCR ligands and themost frequently observed variations in their substructures areshown.
Figure S2. X-ray structures of trypsin-like proteases in complexwith selective inhibitors. Shown are examples of protease com-plexes with inhibitors that are included in our selectivity sets. ThePDB id numbers of the X-ray structures are reported. The bindingconformations of these inhibitors are also shown on a larger scaletogether with 2D drawings.
Figure S3. Log P (o ⁄ w) and molecular weight distribution ofselective compounds. a. D1, D2, D3, and D4; b. 5HT1a, alpha1, and
D2; c. cathepsin B, L, and S (HTS hits); d. cathepsin K and S; ande. thrombin, trypsin, and factor Xa.
Table S1. Detailed description of GPCR compound sets.
Table S2. Detailed description of thiol protease compound sets(HTS data).
Table S3. Detailed description of thiol protease compound sets.
Table S4. Detailed description of serine protease compound sets.
Appendix S1. Supplementary References.
This material is available as part of the online article from: http://www.blackwell-synergy.com/doi/abs/10.1111/j.1747-0285.2007.00554.x(This link will take you to the article abstract).
Please note: Blackwell Publishing are not responsible for the con-tent or functionality of any supplementary materials supplied by theauthors. Any queries (other than missing material) should be direc-ted to the corresponding author for the article.
Stumpfe et al.
194 Chem Biol Drug Des 2007; 70: 182–194
Copyright © 2022 FDOKUMEN