Method development for extraction and purification of dermal RNA from FVB/N mice treated with...
11
1 Bioresource Research esis 1 (2010) 1-20 Bioresource Research esis department homepage: http://agsci.oregonstate.edu/brr Method development for extraction and purification of dermal RNA from FVB/N mice treated with environmental PAH mixtures Andrew Larkin a,b , Lisbeth K. Siddens b , Sharon K. Krueger c , David E. Williams b , William M. Baird b,* a Department of Bioresource Research, Oregon State University, Corvallis, Oregon, 97331 b Department of Environmental and Molecular Toxicology, Oregon State University, Corvallis, Oregon, 97331 c Linus Pauling Institute, Oregon State University, Corvallis, Oregon, 97331 THESIS INFO ABSTRACT esis history: Received Revised Accepted Keywords: Carcinogenesis Carcinoma Dermis Gene Expression Polyclic Aromatic Hydrocarbons Skin Introduction Polycyclic aromatic hydrocarbons (PAHs) are a class of environmentally persistent carcinogenic compounds present in the environment as complex mixtures. PAHs are formed either as incomplete combustion byproducts, in which carbon matter is only partially incinerated and the remaining carbon and hydrogen form fused aromatic rings, or during long term geological processes such as the formation of fossil fuels. Although PAHs are produced in part from natural sources, such as forest fires, anthropological processes, such as petroleum combustion, coal and biofuel burning, and oil spills, have led to dramatic increases in environmental PAH levels above naturally occurring concentrations (Zhang and Tao, 2009). PAHs are oſten divided into two different classifications based on their molecular weight: low molecular weight PAHs with two or three aromatic rings, such as naphthalene, and high * Corresponding author. Oregon State University, Corvallis, 97331. E-mail address: [email protected] molecular weight PAHs consisting of 4 or more aromatic rings, such as benzo[a]pyrene (B[a]P) ((Maliszewska-Kordybach, 1999). Figure 1 shows the names and structures of 16 PAHs the EPA has identified as high priority pollutants, and Tables 1 and 2 list the most common PAHs found, cigarette smoke residue (Rodgman et al., 2000) and crude oil (Benner Jr et al., 1990), respectively. Several high priority PAH pollutants are found in both crude oil and cigarette smoke residue. In addition to parent PAHs, nitro- and oxy-PAHs have recently gained attention as potent carcinogens of concern due to their differences in environmental distribution and persistence, including greater potential for spreading in ground and surface water from sites of PAH contamination (Lundstedt et al., 2007). Current methods for risk assessment of PAH mixtures are based on toxic equivalent factors (TEFs, also referred to as relative potency factors) in which the toxicities of PAHs are expressed in terms of the most well studied PAH, B[a]P, or B[a] P equivalents (Bapeqs) (Versar, 2002). Bapeqs of all individual PAHs in a complex mixture can then be summed to determine the toxic equivalent (TEQ) of an entire mixture. Using TEQs allows risk assessment and regulatory agencies to quantitatively Epidermal RNA samples from FVB/N mice treated with PAH standards and environmental PAH mixtures were harvested and purified using Trizol extraction and RNeasy mini prep kit purification. Epidermal RNA integrity was low (RIN mean 3.5), indicating significant RNA degradation and the need to modify handling, collection, and processing of skin to limit degradation. Potential sources of RNA degrdation include RNase activity, both endogenous and exogenous, thermal degradation during heat- induced epidermal-dermal seperation, and contamination of stock solutions. Testing of the modified method produced dermal RNA samples with acceptable RIN integrity levels (RIN mean 7.6). Variations of the modified method were performed and compared to one another for method optimization.
-
Upload
independent -
Category
Documents
-
view
1 -
download
0
Transcript of Method development for extraction and purification of dermal RNA from FVB/N mice treated with...

1Bioresource Research Thesis 1 (2010) 1-20
Bioresource Research Thesisdepartment homepage: http://agsci.oregonstate.edu/brr
Method development for extraction and purification of dermal RNA from FVB/N mice treated with environmental PAH mixtures
Andrew Larkina,b, Lisbeth K. Siddensb, Sharon K. Kruegerc, David E. Williamsb, William M. Bairdb,*
a Department of Bioresource Research, Oregon State University, Corvallis, Oregon, 97331b Department of Environmental and Molecular Toxicology, Oregon State University, Corvallis, Oregon, 97331c Linus Pauling Institute, Oregon State University, Corvallis, Oregon, 97331
THESIS INFO ABSTRACT
Thesis history:ReceivedRevisedAccepted
Keywords:CarcinogenesisCarcinomaDermisGene ExpressionPolyclic Aromatic HydrocarbonsSkin
Introduction
Polycyclic aromatic hydrocarbons (PAHs) are a class of environmentally persistent carcinogenic compounds present in the environment as complex mixtures. PAHs are formed either as incomplete combustion byproducts, in which carbon matter is only partially incinerated and the remaining carbon and hydrogen form fused aromatic rings, or during long term geological processes such as the formation of fossil fuels. Although PAHs are produced in part from natural sources, such as forest fires, anthropological processes, such as petroleum combustion, coal and biofuel burning, and oil spills, have led to dramatic increases in environmental PAH levels above naturally occurring concentrations (Zhang and Tao, 2009). PAHs are often divided into two different classifications based on their molecular weight: low molecular weight PAHs with two or three aromatic rings, such as naphthalene, and high
* Corresponding author. Oregon State University, Corvallis, 97331. E-mail address: [email protected]
molecular weight PAHs consisting of 4 or more aromatic rings, such as benzo[a]pyrene (B[a]P) ((Maliszewska-Kordybach, 1999). Figure 1 shows the names and structures of 16 PAHs the EPA has identified as high priority pollutants, and Tables 1 and 2 list the most common PAHs found, cigarette smoke residue (Rodgman et al., 2000) and crude oil (Benner Jr et al., 1990), respectively. Several high priority PAH pollutants are found in both crude oil and cigarette smoke residue. In addition to parent PAHs, nitro- and oxy-PAHs have recently gained attention as potent carcinogens of concern due to their differences in environmental distribution and persistence, including greater potential for spreading in ground and surface water from sites of PAH contamination (Lundstedt et al., 2007). Current methods for risk assessment of PAH mixtures are based on toxic equivalent factors (TEFs, also referred to as relative potency factors) in which the toxicities of PAHs are expressed in terms of the most well studied PAH, B[a]P, or B[a]P equivalents (Bapeqs) (Versar, 2002). Bapeqs of all individual PAHs in a complex mixture can then be summed to determine the toxic equivalent (TEQ) of an entire mixture. Using TEQs allows risk assessment and regulatory agencies to quantitatively
Epidermal RNA samples from FVB/N mice treated with PAH standards and environmental PAH mixtures were harvested and purified using Trizol extraction and RNeasy mini prep kit purification. Epidermal RNA integrity was low (RIN mean 3.5), indicating significant RNA degradation and the need to modify handling, collection, and processing of skin to limit degradation. Potential sources of RNA degrdation include RNase activity, both endogenous and exogenous, thermal degradation during heat-induced epidermal-dermal seperation, and contamination of stock solutions. Testing of the modified method produced dermal RNA samples with acceptable RIN integrity levels (RIN mean 7.6). Variations of the modified method were performed and compared to one another for method optimization.

2 A. Larkin et al. / Bioresource Research Thesis 1 (2010) 1-20
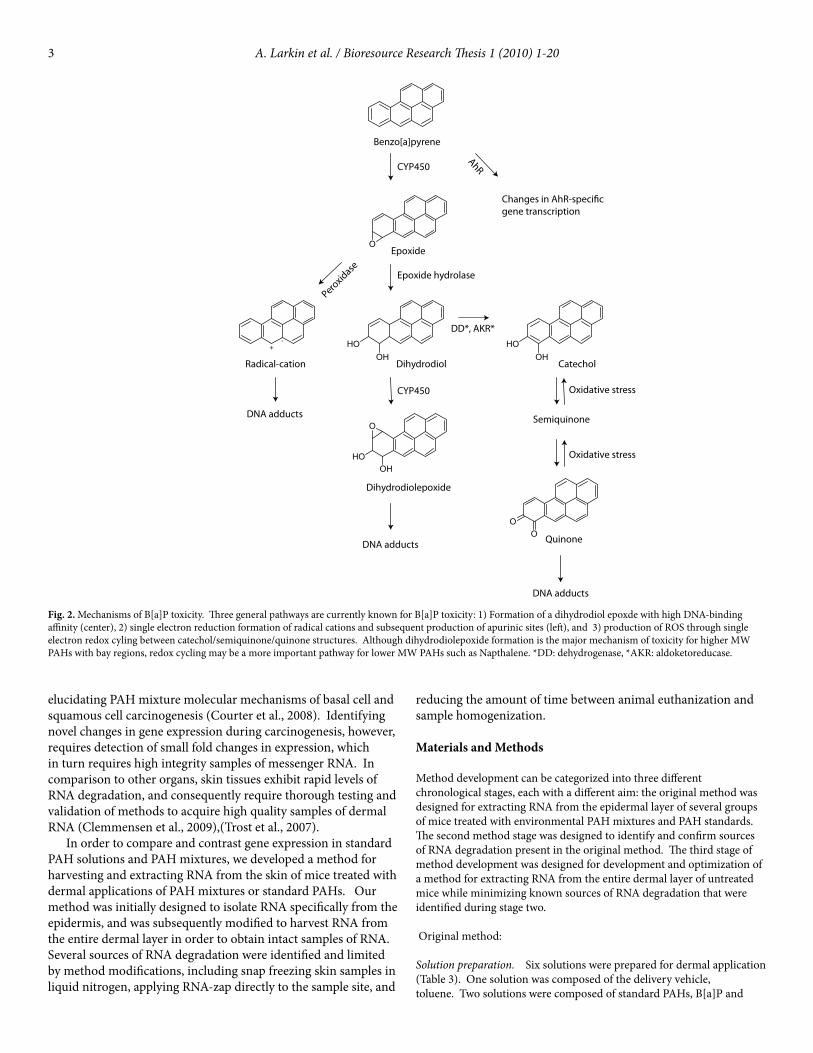
evaluate, compare, and regulate PAH mixtures. TEQs do not, however, take into consideration interactions between various compounds in PAH mixtures or differences in the relative significance of each mechanism of toxicity. In 2002, the EPA identified the need for further analysis and initiated an integrated risk information system (IRIS) assessment of “PAHs as they occur together in common mixtures” (Mills, 2003). As of June 2010, results or an update of the status of this assessment is not available at the EPA website. In order to better understand PAH mixture toxicities, and to accurately extrapolate toxicity studies to human health risk assessment, further studies of PAH mixtures and comparisons of PAH mixtures and standard solutions need to be performed. Although PAH mixture toxicities have not been well studied, a number of individual PAHs have been studied in detail, particularly B[a]P, which is the current model for molecular PAH toxicity. There are three major molecular pathways of B[a]P toxicity: 1) formation of DNA adducts, 2) changes in gene expression through the aryl hydrocarbon receptor (AhR), and 3) formation of reactive oxygen species (ROS) (Figure 2). B[a]P requires metabolic activation in order to form DNA-adducts. Although several metabolic pathways can potentially produce DNA adducts, the majority are formed through metabolic activation to a highly reactive dihydrodiol epoxide (Figure 2). Dihydrodiol epoxide formation begins with cytochrome P450 (CYP450) epoxygenation, mostly through CYP isoforms CYP1A1 and CYP1B1, followed by hydrolysis by epoxide hydrolase (EH) to form a dihydrodiol. The dihydrodiol is subsequently oxidized by CYP450, again mostly through CYP1A1 and CYP1B1 isoforms, producing a dihydrodiolepoxide. Epoxide stereoisomer formation and epoxide hydrolysis to a trans diol conformation can produce four different dihydrodiolepoxide stereoisomers with different DNA binding properties. Studies have found that the (+)-anti-B[a]P-7R,8S-diol-9-S,10R-epoxide is the most mutagenic and tumorigenic (Baird et al., 2005).
Napthalene Acenaphthylene Acenaphthene Fluorene
Phenanthrene Anthracene Fluoranthene Pyrene
Benzo(a)anthracene Crysene
Benzo(a)pyrene Dibenzo(a,h)anthracene Indeno(1,2,3-cd)pyrene Benzo(ghi)perylene
One electron oxidation of B[a]P can also lead to DNA adducts through the formation of radical cation intermediates. These DNA adducts, however, are often unstable and quickly produce apurnic sites. Planar PAHs such as B[a]P can alter cellular function without metabolic activation through binding and activation of the AhR. Once bound, the AhR-PAH ligand tranlocates to the nucleus and binds to AhR-specific elements in promoter regions to upregulate gene expression of AhR target genes. One of the genes activated is CYP1A1: upregulating CYP1A1 levels increases metabolic activation of B[a]P, further increasing B[a]P toxicity (Baird et al., 2005). Lastly, PAHs may be reduced by aldoketoreductases and dehydrogenases to catechols, which can then undergo single electron redox cycling, producing ROS that might oxidize DNA, creating 8-oxo-dG sites, or oxidize sulfhydryl-containing proteins (Warshawsky and Landolph, 2006). The fully oxidized quinine product in the redox cycling pathway is also capable of binding to DNA. Previous studies support using gene expression as a means of
Fig. 1. The 16 parent PAHs identified by the EPA as priority pollutants. 16 additional PAH compounds have also been identified by the EPA as priority pollutants.
PAH components concentration (μg/920mg RES)Napthalene 1300Fluorene 860Phenanthrene 780Pyrene 350Chrysene 80Benzo[a]pyrene 50Total 3420
PAH components concentration (μg/g crude oil)Acenaphthylene 47Acenaphthene 1Fluorene 135Phenathrene 1220Anthracene 275Fluoranthene 730Pyrene 790Benzo[a]anthracene 230Chrysene 220Benzofluoranthenes 415Benzo[a]pyrene 205Benzo[e]pyrene 275Perylene 46Indeno[1,2,3-cd]pryene 535Benzo[ghi]perylene 180Total 4929
Table 2PAH levels in Alberta sweet crude oil samples collected at 25°Ca
Table 1PAH levels in 700°C pyrolysates from tabacco residue (RES) after extractiona
aAdapted from Rodgman et al., 2000. Table 1 lists PAH components of interest and is not all inclusive
aAdapted from Maliszewska-Kordybach, 1999. Table 2 lists PAH components of interest and is not all inclusive
3 A. Larkin et al. / Bioresource Research Thesis 1 (2010) 1-20
O
OHOH
O
OO
OHOH
OHOH
CYP450
Benzo[a]pyrene
Peroxidase
Radical-cation Dihydrodiol
Epoxide hydrolase
Epoxide
Dihydrodiolepoxide
Catechol
Semiquinone
Quinone
Oxidative stress
Oxidative stress
DNA adducts
DNA adducts
DNA adducts
DD*, AKR*
+.
CYP450
AhR
Fig. 2. Mechanisms of B[a]P toxicity. Three general pathways are currently known for B[a]P toxicity: 1) Formation of a dihydrodiol epoxde with high DNA-binding affinity (center), 2) single electron reduction formation of radical cations and subsequent production of apurinic sites (left), and 3) production of ROS through single electron redox cyling between catechol/semiquinone/quinone structures. Although dihydrodiolepoxide formation is the major mechanism of toxicity for higher MW PAHs with bay regions, redox cycling may be a more important pathway for lower MW PAHs such as Napthalene. *DD: dehydrogenase, *AKR: aldoketoreducase.
elucidating PAH mixture molecular mechanisms of basal cell and squamous cell carcinogenesis (Courter et al., 2008). Identifying novel changes in gene expression during carcinogenesis, however, requires detection of small fold changes in expression, which in turn requires high integrity samples of messenger RNA. In comparison to other organs, skin tissues exhibit rapid levels of RNA degradation, and consequently require thorough testing and validation of methods to acquire high quality samples of dermal RNA (Clemmensen et al., 2009),(Trost et al., 2007). In order to compare and contrast gene expression in standard PAH solutions and PAH mixtures, we developed a method for harvesting and extracting RNA from the skin of mice treated with dermal applications of PAH mixtures or standard PAHs. Our method was initially designed to isolate RNA specifically from the epidermis, and was subsequently modified to harvest RNA from the entire dermal layer in order to obtain intact samples of RNA. Several sources of RNA degradation were identified and limited by method modifications, including snap freezing skin samples in liquid nitrogen, applying RNA-zap directly to the sample site, and
reducing the amount of time between animal euthanization and sample homogenization.
Materials and Methods
Method development can be categorized into three different chronological stages, each with a different aim: the original method was designed for extracting RNA from the epidermal layer of several groups of mice treated with environmental PAH mixtures and PAH standards. The second method stage was designed to identify and confirm sources of RNA degradation present in the original method. The third stage of method development was designed for development and optimization of a method for extracting RNA from the entire dermal layer of untreated mice while minimizing known sources of RNA degradation that were identified during stage two. Original method:
Solution preparation. Six solutions were prepared for dermal application (Table 3). One solution was composed of the delivery vehicle, toluene. Two solutions were composed of standard PAHs, B[a]P and
4 A. Larkin et al. / Bioresource Research Thesis 1 (2010) 1-20
dibenzo(def,p)chrysene (DBC), dissolved in vehicle. Three solutions were composed of NIST PAH standards extracted and dissolved in vehicle. Animal preparation. The FVB/N strain of mouse was selected for use because of their constrained inbred genetic diversity, as well as their heightened sensitivity to carcinoma genesis. Femalie FVB/N mice between seven to eight weeks of age were shaved from the dorsal side of the front shoulders to the dorsal base of the tail 48 h before treatment. In order to determine which mice were in the resting hair phase of development, mice were for observed for hair growth in the shaved area approximately 12 h before and immediately prior to treatment.
Animal treatment. Mice determined to be in the resting hair phase were randomly separated into six different treatment groups, with five mice in each group. Each mouse was treated with a single 200 μL dose of the corresponding prepared solution distributed as evenly as possible across the entire shaved surface. Treated mice were then euthanized approximately 12 h after treatment in accordance with IACUC guidelines and policy.
Epidermal cell harvest. Immediately after euthanization, the site of application was cleaned using ethanol and sterile gauze pads. NAIR was then applied to the application site and left for six to seven min in order to remove any remaining hair follicles. After removal of the NAIR and rinsing of the application site using sterilized water and gauze pads, the shaved area was excised using sterilized scissors and forceps and placed into a 58°C sterilized water heat bath for 30 sec in order to thermally induce the separation of the epidermal and dermal layers. After epidermal separation, skin samples were placed into an ice bath to limit endogenous RNase activity. Samples were then placed onto a cooled sterile petri dish, and the epidermal cells were scraped off and removed from the rest of the skin using sterile razor blades. Epidermal cells from each harvested skin sample were then placed into a uniquely labeled 2 mL tube containing the RNase-inactivating solution Trizol and were stored at -80°C.
Trizol extraction. Samples containing epidermal cells in Trizol were thawed to room temperature and disrupted using a minipolytron tissue tearer for 15-30 sec. After disruption, samples were left at room temperature (RT) for 3 min to allow for diffusion and separation of RNA-protein complexes. 200 uL chloroform was added to each sample, followed by vigorous shaking and incubation at room temperature for 3 min. Samples were subsequently centrifuged at 12,000 x g for 15 sec at 10°C. The aqueous upper phase containing RNA was removed and transferred to a new labeled microcentrifuge tube. 0.5 mL isopropyl alcohol was added to each tube containing the RNA solution, and was left at RT for 10 min. Samples were then centrifuged at 12,000 x g for 10 min at 10°C. At the end of centrifugation, a white or light yellow RNA pellet was observed at the bottom of the tubes. The supernatant was removed,
leavening the RNA pellet, which was rinsed twice with 1 mL 70% ethanol. Samples were centrifuged at 15,000 x g for 10 min at 10°C, resulting in a white or light yellow RNA pellet. The supernatant was again removed, and the RNA pellets were allowed to air dry for 5-10 min or until the pellet appeared dry. Pellets were resolubilized in 20-100 μL of RNase free water and were stored at -80°C.
RNA purification. RNA samples were further purified using RNeasy mini prep kit. RNA samples consisting of RNA dissolved in RNAse-free water were pipetted into a clean 1.5 mL microcentrifuge tube. 50μL RNA-free water was added and mixed with each sample, followed by 350 μL RLT buffer. 250 μL of ethanol was then added to and mixed with each sample: 70% ethanol was added to B[a]P samples, whereas 100% ethanol was added to the Ctrl, DBC, Mix1, Mix2, and Mix3 samples. Samples were then transferred onto RNeasy filter columns placed in a collection tube, and were centrifuged for 1 min at 13,300 rpm. The filter column was then transferred to a new collection tube and the waste was discarded. 500 μL RPE buffer was added to the filter columns, and was mixed and rolled around the column interior in order to ensure perfusion throughout the entire column matrix. Columns were then centrifuged for 5 min at 13,300 rpm, and the residual buffer was subsequently discarded. The RPE buffer wash was repeated two for a total of two RPE buffer washes under identical conditions. In order to remove any residual buffer, samples were transferred to a new collection tube and centrifuged at 13,300 rpm for 2 min. Samples were then transferred to a new collection tube. 50 μL RNase-free water was then added to the filter columns, and was incubated at RT for 10 min in order to allow for maximum RNA elution. Samples were centrifuged at 13,300 rpm for 2 min. RNA samples were collected and stored at -80°C.
Nanodrop spectrophotometry. RNA purity and concentration levels were determined using nanodrop spectrophotometry. Samples were analyzed after Trizol and extraction and RNasey cleanup. Samples with a 260/280 absorption ratio at or above 1.9 with concentrations at or above 100 ng/μL were used for further analysis. B[a]P samples with concentrations below 100 ng/μL were concentrated by spinning in a speedvac set to low temperatures for 18 min, followed by additional nanodrop spectrophotometry analysis.
Bioanalyzer analysis. Aliquots from 27 samples were diluted to concentrations between 100-300 ng/μL and were submitted to the OSU Center for Genome Research and Biocomputing (CGRB) for agilent bioanalyzer analysis in order to determine RNA integrity.
Second stage:
Potential sources of RNA degradation were identified and assessed for relevance in collaboration with associates at Pacific Northwest National Laboratories (PNNL) and OSU Department of Pharmacy.
Third stage:
A new method for extracting RNA from the entire dermal layer of mouse skin was designed and performed on four different groups of mice with a different variation of the method performed on each group (Table 4).
Animal preparation. Groups 3 and 4 were shaved as described in method 1. Groups 1 and 2 were not shaved prior to dermal cell harvest.
Animal treatment. All five groups were not treated prior to dermal cell harvest. Mice were euthanized in accordance with IACUC guidelines and policy.
Dermal cell harvest. Immediately after euthanization, the area of skin
Treatment componentsControl 200 μL tolueneB[a]P 200 μL toluene 400 nm B[a]P DBC 200 μL toluene 4 nm DBC Mix1 200 μL toluene 1 mg DPEMix2 200 μL toluene 1 mg DPE 1 mg CTEMix3 200 μL toluene 1 mg DPE 1 mg CTE 2 mg CSC
Table 3Composition of method 1 treatment solutions
DPE: diesel particulate extract, CTE: coal tar extract, CSC: cigarette smoke condensate.

5 A. Larkin et al. / Bioresource Research Thesis 1 (2010) 1-20
corresponding to the sites of application in method 1 was cleaned using either ethanol for groups 1, 2, and 3 or RNA-Zap for group 4. Skin from the cleaned area was excised using sterilized scissors and forceps. Samples from groups 1 and 2 were placed in empty 15 mL centrifuge tubes, while samples from groups 3 and 4 were placed in 15 mL tubes containing 10mL Trizol. Samples from all five groups were then snap frozen in liquid nitrogen and stored at -80°C.
Trizol extraction. Prior to Trizol extraction, samples from Group 1 were thawed for 15-20 min on ice, and then transferred into a 15 mL centrifuge tube containing 10 mL Trizol. Samples from group 2 were immediately submersed in 10 mL Trizol, and allowed to thaw while in solution. Samples from groups 3 and 4 were already submersed in Trizol and were thawed in solution at RT. All of the samples were then disrupted using a polytron tissue tearer for 15-30 sec, and left at room temperature (RT) for 3 minutes to allow for diffusion and separation of RNA-protein complexes. Two 1 mL aliquots were taken from each sample and placed into clean, labeled 2 mL centrifuge tubes. 200 uL chloroform was added to each aliquot, followed by vigorous shaking and incubation at RT for 3 min. Samples were subsequently centrifuged at 12,000 x g for 15 sec at 10°C. The aqueous upper phase containing RNA was removed and transferred to a new labeled microcentrifuge tube. 0.5 mL isopropyl alcohol was added to each tube containing the RNA solution, and was left at RT for 10 min. Aliquots were then centrifuged at 12,000 x g for 10 min at 10°C. At the end of centrifugation, a white or light yellow RNA pellet was observed. The supernatant was removed, leavening the RNA pellet, which was rinsed twice with 1 mL 70% ethanol. Aliquots were centrifuged at 15,000 x g for 10 minat 10°C, resulting in a white or light yellow RNA pellet. The supernatant was again removed, and the RNA pellets were allowed to air dry for 5-10 min, or until the pellet appeared dry. Pellets were resolubilized in 20-100 μL of RNase free water and were stored at -80°C.
Nanodrop spectrophotometry. Spectrophotometric analysis was performed on all aliquots according to the method and quality control measures described in method 1.
Bioanalyzer analysis. Bioanalyzer analysis was performed on all aliquots, with the exception of aliquot 1 from sample 1 of group 4, according to the method and quality control measures described in method 1.
Results
Epidermal RNA samples.
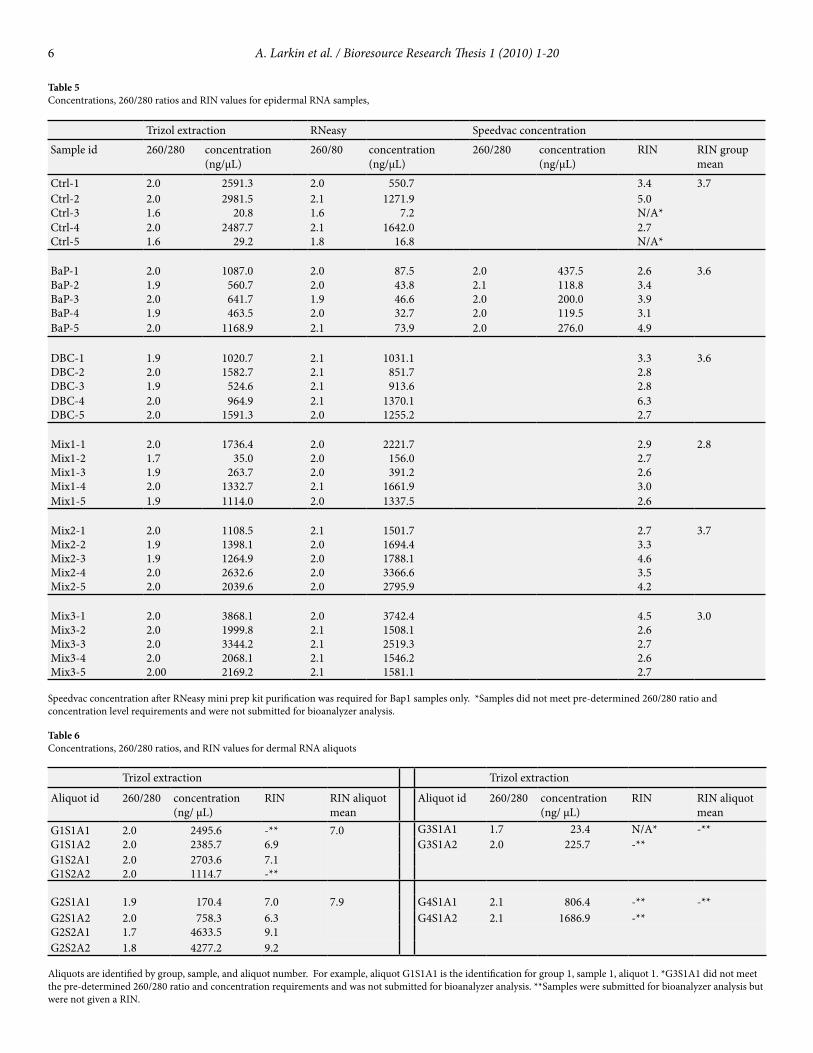
The concentrations and 260/280 ratios of each epidermal RNA sample after Trizol extraction and RNeasy mini prep kit purification are listed in Table 5. Samples Crtl-3 and Ctrl-5 exhibited 260/280 ratios below 1.9 and concentrations below 100 ng/μL and were not used for subsequent analysis. BaP sample concentrations were below 100 ng/μL after RNeasy purification, but were above 100ng/μL after concentration. 28 out of 30 epidermal RNA samples were submitted for bioanalyzer analysis. Sample RINs and RIN means for each treatment group are listed in Table 5. RIN values ranged from 3.4 to 6.3 on a scale of 1 to 10, with 10 corresponding to to intact RNA. Treatment group RIN means ranged from 2.8 to 3.7. Representative bioanalyzer chromatograms and electrophoresis runs are shown in Figure 5 (bioanalyzer results for all epidermal RNA samples are available in Supp Appendix 1).
Dermal RNA samples.
The concentrations and 260/280 ratios of each dermal RNA aliquot after Trizol extraction are listed in Table 6. Aliquots from sample 2 of group 2 exhibited 260/280 ratios below 1.9, but were included for the limited purposes of RIN analysis. Aliquot 1 from sample 1 of group 3 exhibited a 260/280 ratio below 1.9 and concentration below 100ng/μL, and was not used for subsequent analysis. Eleven out of 12 dermal RNA aliquots were submitted for analysis. Sample RINs and group RIN means are listed in Table 6. Six aliquots were assigned RINs, which ranged from 6.3 to 9.2 All aliquots from groups three and four and aliquot 1 of sample 1 from group 1 were not assigned RINs. Group 1 exhibited an aliquot mean of 7.0, and group 2 exhibited a sample mean of 7.9. Performing a Spearman’s Rho test to compare RIN values between aliquots was not possible due to the small number of aliquots assigned RIN values. Results of the bioanalyzer chromatogram and electrophoresis for one sample from each group are shown in Figure 6 (bioanalyzer results for all dermal RNA samples are shown in Supp Aendix 2).
Discussion
Assigning RIN values to RNA samples is based on performing capillary electrophoresis and analyzing the corresponding electropherogram for signs of degradation, including skewness towards smaller nucleotide sizes, large baseline noise, and small 16s and 18s rRNA percent areas (Fleige and Pfaffl, 2006) Although RIN values are widely accepted as an accurate measurement of RNA integrity, it is still uncertain which RIN levels are sensitive enough to detect small transcriptome changes. In a study comparing RT-qPCR expression patterns of RNA samples with varying RIN values, Mueller et al. concluded that there is no significant improvement in gene expression analysis with an increase in RIN values greater 5 (Mueller et al., 2004). RIN values of 7 or greater, however, are more widely accepted in the scientific community for gene expression studies requiring sensitive detection. RIN values between 6 and 7 are also widely accepted if the corresponding analyses are confirmed by follow up RT-qPCR (Mueller et al., 2004).
Group animal preperation
cleaning solution
snap freezing conditions
thaw conditions
1 none ethanol no solution 15-20 min no solution
2 none ethanol no solution Trizol3 shaved ethanol Trizol Trizol4 shaved RNA-zap Trizol Trizol
Table 4Method variations in the whole dermal RNA extraction procedure in groups 1-4.
Method variations included differences between groups in animal preperation, the solution used to clean the area of interest prior to excision, the conditions in which samples were snap frozen in liquid nitrogen, and the conditions in which samples were thawed prior to Trizol© extraction.
6 A. Larkin et al. / Bioresource Research Thesis 1 (2010) 1-20
Trizol extraction RNeasy Speedvac concentrationSample id 260/280 concentration
(ng/μL)260/80 concentration
(ng/μL)260/280 concentration
(ng/μL)RIN RIN group
meanCtrl-1 2.0 2591.3 2.0 550.7 3.4 3.7Ctrl-2 2.0 2981.5 2.1 1271.9 5.0Ctrl-3 1.6 20.8 1.6 7.2 N/A*Ctrl-4 2.0 2487.7 2.1 1642.0 2.7Ctrl-5 1.6 29.2 1.8 16.8 N/A*
BaP-1 2.0 1087.0 2.0 87.5 2.0 437.5 2.6 3.6BaP-2 1.9 560.7 2.0 43.8 2.1 118.8 3.4BaP-3 2.0 641.7 1.9 46.6 2.0 200.0 3.9BaP-4 1.9 463.5 2.0 32.7 2.0 119.5 3.1BaP-5 2.0 1168.9 2.1 73.9 2.0 276.0 4.9
DBC-1 1.9 1020.7 2.1 1031.1 3.3 3.6DBC-2 2.0 1582.7 2.1 851.7 2.8DBC-3 1.9 524.6 2.1 913.6 2.8DBC-4 2.0 964.9 2.1 1370.1 6.3DBC-5 2.0 1591.3 2.0 1255.2 2.7
Mix1-1 2.0 1736.4 2.0 2221.7 2.9 2.8Mix1-2 1.7 35.0 2.0 156.0 2.7Mix1-3 1.9 263.7 2.0 391.2 2.6Mix1-4 2.0 1332.7 2.1 1661.9 3.0Mix1-5 1.9 1114.0 2.0 1337.5 2.6
Mix2-1 2.0 1108.5 2.1 1501.7 2.7 3.7Mix2-2 1.9 1398.1 2.0 1694.4 3.3Mix2-3 1.9 1264.9 2.0 1788.1 4.6Mix2-4 2.0 2632.6 2.0 3366.6 3.5Mix2-5 2.0 2039.6 2.0 2795.9 4.2
Mix3-1 2.0 3868.1 2.0 3742.4 4.5 3.0Mix3-2 2.0 1999.8 2.1 1508.1 2.6Mix3-3 2.0 3344.2 2.1 2519.3 2.7Mix3-4 2.0 2068.1 2.1 1546.2 2.6Mix3-5 2.00 2169.2 2.1 1581.1 2.7
Table 5Concentrations, 260/280 ratios and RIN values for epidermal RNA samples,
Speedvac concentration after RNeasy mini prep kit purification was required for Bap1 samples only. *Samples did not meet pre-determined 260/280 ratio and concentration level requirements and were not submitted for bioanalyzer analysis.
Table 6Concentrations, 260/280 ratios, and RIN values for dermal RNA aliquots
Trizol extraction Trizol extraction
Aliquot id 260/280 concentration (ng/ μL)
RIN RIN aliquot mean
Aliquot id 260/280 concentration (ng/ μL)
RIN RIN aliquot mean
G1S1A1 2.0 2495.6 -** 7.0 G3S1A1 1.7 23.4 N/A* -**G1S1A2 2.0 2385.7 6.9 G3S1A2 2.0 225.7 -**G1S2A1 2.0 2703.6 7.1G1S2A2 2.0 1114.7 -**
G2S1A1 1.9 170.4 7.0 7.9 G4S1A1 2.1 806.4 -** -**G2S1A2 2.0 758.3 6.3 G4S1A2 2.1 1686.9 -**G2S2A1 1.7 4633.5 9.1G2S2A2 1.8 4277.2 9.2
Aliquots are identified by group, sample, and aliquot number. For example, aliquot G1S1A1 is the identification for group 1, sample 1, aliquot 1. *G3S1A1 did not meet the pre-determined 260/280 ratio and concentration requirements and was not submitted for bioanalyzer analysis. **Samples were submitted for bioanalyzer analysis but were not given a RIN.

7 A. Larkin et al. / Bioresource Research Thesis 1 (2010) 1-20
Mix 3-2
Ctrl-4
DBC-1
Ladder
Fig. 3.Sample electropherograms of epidermal RNA samples
G2S1A1
G1S1A2
G3S1A2
G4S1A2
Fig. 4. Sample electropherograms of dermal RNA samples
8 A. Larkin et al. / Bioresource Research Thesis 1 (2010) 1-20
Epidermal RNA samples.
Only two out of 28 epidermal RNA samples submitted for bioanalyzer analysis were assigned RINs greater than or equal to 5 (5.0 for Ctrl-2 and 6.3 for DBC-4), suggesting significant RNA degradation among all treatment groups. Electropherograms of all samples show skeweness towards the smaller nucleotide range, large baseline noise, and small 16s and 18s rRNA peaks, all indicative of degraded RNA. Rank sum tests suggest no statistical difference in RINs between treatment groups (p=0.05, Appendix 1), further suggesting a common source of RNA degradation in all treatment groups. All of the epidermal samples were categorized as unaccetpable for microarray and focused PCR-array analysis. Potential sources of RNA degradation were identified with the help of colleagues at Pacific Northwest National Laboratories and Dr. Arup Indra from the Department of Pharmacy at Oregon State University. Potential degradation sources include RNase activity during epidermal harvest, thermal degradation during heat treatment, chemical degradation during NAIR application, and potential contamination during Trizol extraction and RNeasy purification. The following revisions were applied to the original method in order to limit potential RNA degradation: 1) NAIR application and heat bath epidermal-dermal separation were removed, and 2) Immediately after dermal harvest, samples were frozen in liquid nitrogen. The result of these modifications is the method described in the “third stage” subsection of the materials and methods section.
Dermal RNA aliquots.
Of the 6 dermal RNA aliquots assigned RINs, all 6 values were above 5.0, with 4 out 6 exhibiting values above 7.0. The low proprortion of dermal aliquots assigned RIN values prevented perofmring a Spearman’s Rho test between aliquots or a rank-sum test between groups, significantly limiting statistical quantitative analysis. A limited qualitative comparison based on the electropherograms, however, can still be performed, as long as the limitations and subjectivity of the analysis are addressed. All dermal RNA electropherograms exhibit limited skewness towards the smaller nucleotide range and little baseline variance. 16s and 18s rRNA peaks in group 1 electropherograms have smaller peak height relative to groups 2, 3, and 4, but have larger bases and therefore might have similar % areas. The most visibly discernable difference between groups can be observed in the electrophoresis staining (shown to the right of each electropherogram in Figure 6). Stains with well-defined bands indicate intact 16s and 18s rRNA, whereas stains with smeared, less defined bands are indicative of 16s and 18s rRNAs small nucleotide degradations. Group 1 bands show moderate smearing and group 2 bands show little or no smearing in comparison to groups 3 and 4. As mentioned previously, group 1 samples were thawed on ice for 15-20 minutes before being placed into the RNase-inactivating solution Trizol, providing more time for endogenous RNase activity relative to groups 2, 3, and 4. Groups 3 and 4 were snap frozen in Trizol solution, whereas group 2 samples were placed in Trizol after snap freezing, immediately after samples were removed from -80°C storage
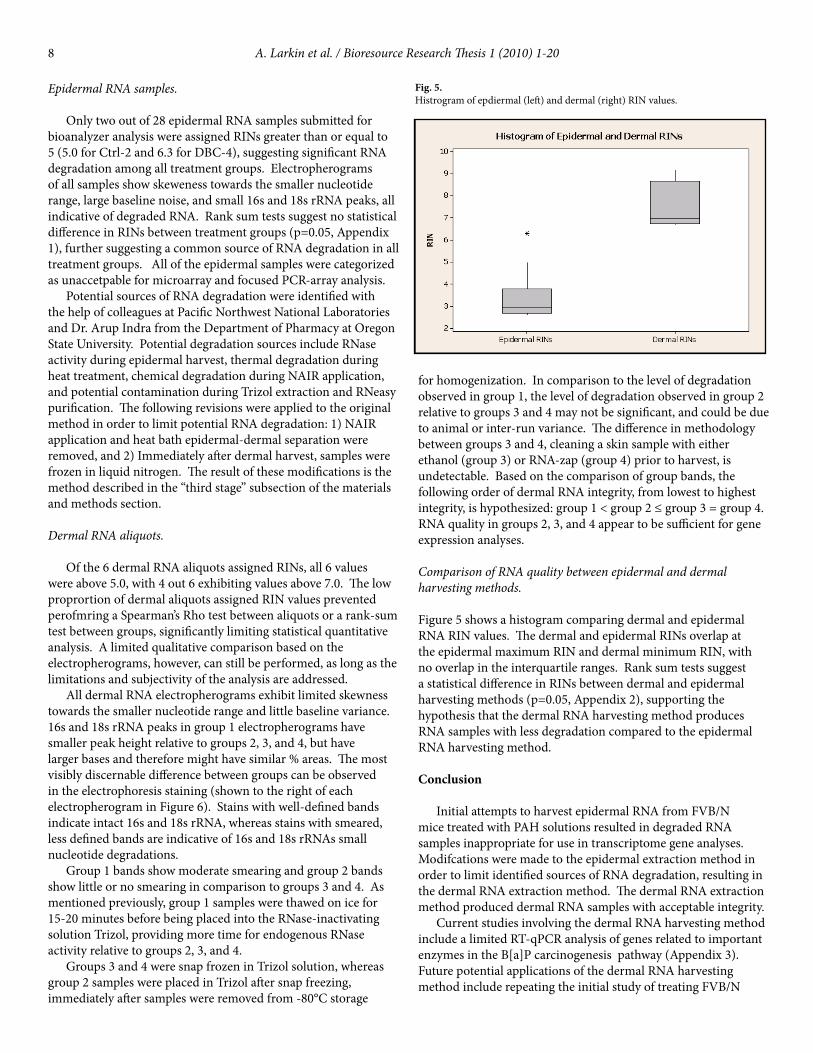
Fig. 5.Histrogram of epdiermal (left) and dermal (right) RIN values.
for homogenization. In comparison to the level of degradation observed in group 1, the level of degradation observed in group 2 relative to groups 3 and 4 may not be significant, and could be due to animal or inter-run variance. The difference in methodology between groups 3 and 4, cleaning a skin sample with either ethanol (group 3) or RNA-zap (group 4) prior to harvest, is undetectable. Based on the comparison of group bands, the following order of dermal RNA integrity, from lowest to highest integrity, is hypothesized: group 1 < group 2 ≤ group 3 = group 4. RNA quality in groups 2, 3, and 4 appear to be sufficient for gene expression analyses.
Comparison of RNA quality between epidermal and dermal harvesting methods.
Figure 5 shows a histogram comparing dermal and epidermal RNA RIN values. The dermal and epidermal RINs overlap at the epidermal maximum RIN and dermal minimum RIN, with no overlap in the interquartile ranges. Rank sum tests suggest a statistical difference in RINs between dermal and epidermal harvesting methods (p=0.05, Appendix 2), supporting the hypothesis that the dermal RNA harvesting method produces RNA samples with less degradation compared to the epidermal RNA harvesting method.
Conclusion Initial attempts to harvest epidermal RNA from FVB/N mice treated with PAH solutions resulted in degraded RNA samples inappropriate for use in transcriptome gene analyses. Modifcations were made to the epidermal extraction method in order to limit identified sources of RNA degradation, resulting in the dermal RNA extraction method. The dermal RNA extraction method produced dermal RNA samples with acceptable integrity. Current studies involving the dermal RNA harvesting method include a limited RT-qPCR analysis of genes related to important enzymes in the B[a]P carcinogenesis pathway (Appendix 3). Future potential applications of the dermal RNA harvesting method include repeating the initial study of treating FVB/N

9 A. Larkin et al. / Bioresource Research Thesis 1 (2010) 1-20
mice with PAH mixtures using the dermal RNA harvesting method. Finally, dermal-epidermal separation using ammonium thiocyanate has been successfully used to acquire high quality RNA samples in human skin (Clemmensen et al., 2009, Trost et al., 2007). Performing ammonium thiocyanate induced dermal-epidermal separation in conjunction with the techniques designed to limit endogenous RNase activity in the dermal RNA extraction method could produce murine epidermal RNA samples with acceptable integrity.
Acknowledgements
This work was supported by the Superfund Research Program (NIEHS P42ES016465, NIEHS P42ES016405-S1).
References
Baird, W., Hooven, L., and Mahadevan, B. (2005). Carcinogenic polycyclic aromatic hydrocarbon-DNA adducts and mechanism of action. Environmental and molecular mutagenesis 45, 106-114.Benner Jr, B., Bryner, N., Wise, S., Mulholland, G., Lao, R., and Fingas, M. (1990). Polycyclic aromatic hydrocarbon emissions from the combustion of crude oil on water. Environmental science & technology 24, 1418-1427.Clemmensen, A., Thomassen, M., Clemmensen, O., Tan, Q., Kruse, T. A., Petersen, T. K., Andersen, F., and Andersen, K. E. (2009). Extraction of high-quality epidermal RNA after ammonium thiocyanate-induced dermo-epidermal separation of 4 mm human skin biopsies. Exp Dermatol 18, 979-984.Courter, L., Luch, A., Musafia-Jeknic, T., Arlt, V., Fischer, K., Bildfell, R., Pereira, C., Phillips, D., Poirier, M., and Baird, W. (2008). The influence of diesel exhaust on polycyclic aromatic hydrocarbon-induced DNA damage, gene expression, and tumor initiation in Sencar mice in vivo. Cancer letters 265, 135-147.Fleige, S., and Pfaffl, M. W. (2006). RNA integrity and the effect on the real-time qRT-PCR performance. Mol Aspects Med 27, 126-139.Lundstedt, S., White, P. A., Lemieux, C. L., Lynes, K. D., Lambert, I. B., Oberg, L., Haglund, P., and Tysklind, M. (2007). Sources, fate, and toxic hazards of oxygenated polycyclic aromatic hydrocarbons (PAHs) at PAH-contaminated sites. Ambio 36, 475-485.Maliszewska-Kordybach, B. (1999). Sources, concentrations, fate and effects of polycyclic aromatic hydrocarbons (PAHs) in the environment. Part A: PAHs in air. Polish Journal of Environmental Studies 8, 131-136.Mills, A., and Rieth, S. (2003). Needs Assessment for U.S. EPA’s Integrated Risk Information System. (N. C. f. E. Assessment, Ed.), Washington, DC.Mueller, O., Lightfoot, S., and Schroeder, A. (2004). RNA integrity number (RIN)–Standardization of RNA Quality Control. Agilent Application Note, Publication, 1–8.Rodgman, A., Smith, C. J., and Perfetti, T. A. (2000). The composition of cigarette smoke: a retrospective, with emphasis on polycyclic components. Hum Exp Toxicol 19, 573-595.Trost, A., Bauer, J. W., Lanschutzer, C., Laimer, M., Emberger,
M., Hintner, H., and Onder, K. (2007). Rapid, high-quality and epidermal-specific isolation of RNA from human skin. Exp Dermatol 16, 185-190.Versar, I. a. B. S. A. (2002). Peer Consultation Workshop on Approaches to Polycyclic Aromatic Hydrocarbon (PAH) Health Assessment. In Peer Consultation Workshop on Approaches to Polycyclic Aromatic Hydrocarbon (PAH) Health Assessment. (E. P. Agency, Ed.), Arlington, Virginia.Warshawsky, D., and Landolph, J. (2006). Molecular carcinogenesis and the molecular biology of human cancer. CRC Press.Zhang, Y., and Tao, S. (2009). Global atmospheric emission inventory of polycyclic aromatic hydrocarbons (PAHs) for 2004. Atmospheric Environment 43, 812-819.

A. Larkin et al. / Bioresource Research Thesis 1 (2010) 1-20A1,A2
The normal probability plots of epidermal RNA RIN values for each treatment group (shown above) have large variances that do not allow for a paramatric analysis based on normal approximation. A non parametric rank-sum statistical analysis was performed for each treatment group, testing for statistical significance between each treatment group and the remaining epidermal RNA sample (null hypothesis: RINgroup = RIN(epidermal RNA sample - group)). There was no evidence for any of the 6 treatment groups to suggest that the RIN values differ from those of the epdiermal RNA sample, on average (p=0.05). Statistical analysis was performed using Minitab computer software.
Appenxdix 1.Statistical analysis of epdiermal RNA RIN values.
Appendix 2.Statistical analysis comparing epidermal and dermal RNA RIN values.
The normal probability plots of epidermal and dermal RNA RIN values (shown above) have large variances that do not allow for a paramatric analysis based on normal approximation. A non parametric rank-sum statistical analysis was performed for each treatment group, testing for statistical significance between each treatment group and the remaining epidermal RNA sample (null hypothesis: RINepdiermal = RINdermal). There is moderate evidence to suggest that epidermal and dermal RNA RIN values are significnatly different, on average (p=0.05). Statistical analysis was performed using Minitab computer software.

A. Larkin et al. / Bioresource Research Thesis 1 (2010) 1-20 A3
Appendix 3Progress report on current RT-qPCR analysis.
Ladder (50bp)
CYP1B1 (59.9˚C)AhR (62.4˚C)AhR (59.9˚C)
AhR (58.1˚C)AhR (56.8˚C)AhR (56.0˚C)
RT-qPCR conditions are currently being optimized for analyzing the epression of genes involved in B[a]P toxicity and for the housekeeping genes GADPH and β-actin. Above: q-PCR products from a temperature gradient analysis were run onTBE gels and stained with ethidium bromide for imaging. Several temperatures used for AhR and β-actin replication in the gradient run produced relatively pure products, indicative of conditions sensitive and selective enough for RT-qPCR analysis. Further experimentation with varying temperatures and Mg2+ concentrations will be required to optimize GADPH, CYP1A1, and CYP1B1 conditions. Sucessfull optimization and subsequent RT-qPCR validation will be useful for future gene specific expression analysis, as well as for confirmation of results from transcriptome or PCR-array studies.
Ladder 50kb