Synthesis of platinum and platinum–ruthenium-modified diamond nanoparticles
Upload
solapuruniversityCategory
view
1download
0
Inorganica Chimica Acta 374 (2011) 69–78
Contents lists available at ScienceDirect
Inorganica Chimica Acta
journal homepage: www.elsevier .com/locate / ica
Methimazole complexes of platinum(II): Synthesis, characterizationand redox behavior
Liladhar B. Kumbhare a, Umang Singh b, Beena G. Singh b, Amey Wadawale a, G. Kedarnath a, Sanjio S. Zade c,K. Indira Priyadarsini b, Vimal K. Jain a,⇑a Chemistry Division, Bhabha Atomic Research Centre, Mumbai 400085, Indiab Radiation and Photochemistry Division, Bhabha Atomic Research Centre, Mumbai 400085, Indiac Department of Chemical Sciences, Indian Institute of Science Education and Research, Kolkata, PO: BCKV Campus Main Office, Mohanpur 741252, Nadia, West Bengal, India
a r t i c l e i n f o
Article history:Available online 13 January 2011
Dedicated to Prof. Wolfgang Kaim on his60th Birthday
Keywords:PlatinumMethimazoleNMRX-ray structurePulse radiolysisRedox behavior
0020-1693/$ - see front matter � 2011 Elsevier B.V. Adoi:10.1016/j.ica.2011.01.016
⇑ Corresponding author. Tel.: +91 22 2559 5095; faE-mail addresses: [email protected], jain
a b s t r a c t
A variety of platinum(II) complexes of methimazole (2-mercapto-1-methylimidazole; HImS = neutralform and ImS = thiolate form), coordinated in both thione and thiolate forms, have been isolated by react-ing methimazole with [PtCl(terpy)]Cl (terpy = 2,20:60,20 0 terpyridine), [PtCl2(bipy)] (bipy = bipyridine),[PtCl2(o-phen)] (o-phen = o-phenanthroline), [PtCl2(CH3CN)2] and [PtCl2(COD)] (COD = 1,5-cyclooctadi-ene). These complexes were characterized by electronic absorption, IR and NMR (1H, 13C, 195Pt) spectros-copies. Molecular structure of [Pt(bipy)(HImS)2]Cl2�3H2O (3a�3H2O) has been established by single crystalX-ray crystallography. Platinum thiolate complex, [Pt(ImS)2(HImS)2] (5), could be obtained by treatmentof [Pt(HImS)4]Cl2 with sodium methoxide in methanol. The solution of 5 in organic solvents yielded bi-and tri-nuclear platinum complexes. The effect of diimine ligands on oxidation of methimazole moiety inthe complexes has been studied by electrochemical oxidation and pulse radiolytic oxidation employingspecific one-electron oxidant, N�3 radical.
� 2011 Elsevier B.V. All rights reserved.
1. Introduction
The chemistry of S, N-containing heterocyclic ligands (e.g., 2-mercaptopyridine) with platinum group metals has been of consid-erable interest both from structural point of view [1–3] and also fortheir anti-tumor activity [4,5]. The high propensity of platinum tobind sulfur and isolation of thiolate complexes (e.g., [Pt(methio-nine)2] [6]) from the urine of cisplatin treated patients have beena driving force to explore platinum complexes with sulfur ligandsso as to overcome the side effects of cisplatin and have improvedtoxicity and/or their applicability to a wide range of tumors [7].Platinum complexes when administered in living systems undergoa variety of reactions such as aquation, ligand substitution, redoxreactions before they bind the target molecule in the biological sys-tem [8,9]. Over a decade, there has been a considerable interest inthe development of redox active metal complexes that show DNAbinding properties and such complexes can be used as anti-tumoragents [10,11].
Methimazole (2-mercapto-1-methylimidazole) exists in thioland thione tautomeric forms and bind to metal ions in several dif-ferent ways. Although some work on complexes of methimazoleand related ligands with platinum has been reported [12–15], the
ll rights reserved.
x: +91 22 2550 [email protected] (V.K. Jain).
present study has been undertaken to investigate different modesof binding of methimazole to platinum centre leading to the forma-tion of various species. The results of this work are reported herein.
2. Experimental
2.1. Materials and methods
Microanalyses were carried out on a Carlo Erba EA-1110 CHN-Sinstrument. UV–Vis absorption spectra were recorded on a Chemi-to Spectrascan UV 2600 spectrophotometer. 1H, 13C{1H} and195Pt{1H} NMR spectra were recorded in deuterated solvents on aBruker Avance-II 300 MHz NMR spectrometer operating at 300,75.47 and 64.52 MHz, respectively and chemical shifts are relativeto TMS for 1H and 13C and external Na2PtCl6 in D2O for 195Pt{1H}.Mass spectra were recorded on a Waters Q-Tof micro (YA-105)Time of Flight mass spectrometer. Cyclic voltammetry was per-formed on an Autolab PGSTAT 302N instrument. The voltammo-grams were recorded using a three electrode configuration with aplatinum pseudo reference electrode (square foil 8 � 8 mm; elec-trode potential: 0.12 V versus Ag/AgCl (saturated)), platinum wirecoated with platinum black as a counter electrode and polishedglassy carbon electrode (diameter = 5 mm) as a working electrode.Solutions of 2, 3a and 3b were prepared in acetonitrile containing0.1 M of tetrabutylammonium hexafluorophosphate (TBAP). Con-

70 L.B. Kumbhare et al. / Inorganica Chimica Acta 374 (2011) 69–78
centrations of the samples were maintained in the range 0.25–1.0 mM.
Methimazole (2-mecapto-1-methylimidazole; designated asHImS for neutral form and ImS for thiolate form) was preparedaccording to literature method [16] (UV–Vis (CH2Cl2, kmax, nm):269. 1H NMR (CDCl3, d): 3.60 (s, 3H, NMe); 6.68 (t, 2 Hz, 1H, H5);6.72 (t, 2 Hz, 1H, H4); 12.06 (br, 1H, NH). 13C{1H} NMR (CDCl3,d): 34.3 (s, NMe); 114.2 (C5), 119.1 (C4), 160.1 (C@S)).
2.2. Preparation of complexes
2.2.1. [PtCl2(HImS)2] (1)The title complex has been prepared by a different route from
the one reported in the literature [13]. To an acetonitrile solution(10 ml) of [PtCl2(CH3CN)2] (250 mg, 0.72 mmol), methimazole(165 mg, 1.44 mmol) was added and stirred for 2 h. A yellow pre-cipitate formed was filtered, washed with cold water and dried un-der vacuum (yield 211 mg, 59%). Anal. Calc. for C8H12Cl2N4PtS2
(494.3): C, 19.4; H, 2.4; N, 11.3. Found: C, 19.6; H, 2.4; N, 11.7%.IR (Nujol, cm�1): 1304 (C@S), 327, 324 (Pt–Cl). UV–Vis (DMSO,kmax, nm): 312, 359. 1H NMR (DMSO-d6, d): 3.72 (NMe, cis isomer),3.65 (NMe, trans isomer); 7.38–7.42 (m); 7.50–7.55 (m) [@CH (cis–trans isomer)]; 13.81 (NH). 13C NMR (DMSO-d6, d): 35.3 (s, NMe);118.4 (C5), 123.7 (C4).
2.2.2. [Pt(HImS)4]Cl2�2H2O (2�2H2O)The title complex was prepared by a method different from that
reported earlier [12]. To a dichloromethane solution (20 mL) of[PtCl2(COD)] (280 mg, 0.75 mmol), a solution (20 mL) of methima-zole (342 mg, 3.0 mmol) was added under an argon atmosphere.The reaction mixture was stirred in dark for 2 h whereupon a yel-low precipitate formed. The precipitate was filtered, washed withdichloromethane and dried in vacuum. The complex was recrystal-lized from ethanol–hexane mixture; yield 455 mg (80%); m.p. 260–262 �C. Anal. Calc. for C16H24Cl2N8PtS4�2H2O (758.69): C, 25.3; H,3.7; N 14.8. Found: C, 25.5; H, 3.4; N, 14.8%. IR (Nujol, cm�1):3428 (NH), 1283 (C@S). UV–Vis (MeOH, kmax, nm, e, M�1 cm�1):271 (4.1 � 104), 224 (3.0 � 104). 1H NMR (D2O, d): 3.45 (s, 12H,NMe); 6.96, 7.03 (d each, @CH) ppm (NH not observed due to ex-change with D2O). 13C{1H} NMR (CD3OD, d): 34.0 (NMe), 116.9(C5), 122.4 (C4) ppm.
2.2.3. [Pt(bipy)(HImS)2]Cl2�3H2O (3a�3H2O)A dichloromethane solution (20 mL) of methimazole (156 mg,
1.37 mmol) was added to a suspension of [PtCl2(bipy)] (288 mg,0.68 mmol) in the same solvent with continuous stirring for 3 h.A yellow precipitate formed during the reaction was filtered,washed with dichloromethane and recrystallized from methanol–hexane under cold condition; yield 346 mg (78%); m.p. 106 �C.Anal. Calc. for C18H20Cl2N6PtS2�3H2O (704.55): C, 30.7; H, 3.7; N,11.9. Found: C, 30.4; H, 3.7; N, 11.8%. IR (Nujol, cm�1): 3348 (br,NH), 1275 (C@S). UV–Vis (MeOH, kmax, nm, e, M�1 cm�1): 251(2.7 � 104), 306 (sh, 1.2 � 104), 320 (sh, 1 � 104). 1H NMR (CD3OD,d): 3.75 (s, 6H, NMe); 7.26, 7.45 (s, 4H, @CH of HImS]; 7.90 (t, 2H),8.49 (t, 7.6 Hz, 2H), 8.70 (d, 8.0 Hz, 2H), 9.50 (q, 2H, [bipy] ppm.13C{1H} NMR (CD3OD, d): 34.1 (NMe), 117.4, 123.2 [C5 and C4 ofHImS]; 124.3, 128.1, 141.7, 148.3, 157.0 [bipy] ppm.
2.2.4. [Pt(o-phen)(HImS)2]Cl2�2H2O (3b�2H2O)This was prepared in a similar manner as 3a from methimazole
(130 mg, 1.14 mmol) and [PtCl2(o-phen)] (263 mg, 0.59 mmol) indichloromethane; yield 324 mg (80%); m.p. 220–222 �C. Anal. Calc.for C20H20Cl2N6PtS2�2H2O (710.56): C, 33.8; H, 3.4; N, 11.8. Found:C, 33.1; H, 3.4; N, 11.4%. IR (Nujol, cm�1): 3339 (br, NH), 1291(C@S). UV–Vis (MeOH, kmax, nm, e, M�1 cm�1): 219 (3.3 � 104),269 (2.8 � 104), 391 (3 � 103). 1H NMR (CD3OD, d): 3.79 (s, 6H,
NMe); 7.26 (each s, 4H, @CH) [ImS]; 8.21 (d, d, 2H), 8.36 (s, 2H),9.10 (d, J = 10.2 Hz, 2H), 9.76 (d, d, 2H) [o-phen] ppm. 13C{1H}NMR (CD3OD, d): 34.2 (NMe), 117.5, 123.4 [C5 and C4 of HImS];126.3, 128.3, 131.4, 140.6, 148.8 [o-phen] ppm.
2.2.5. [Pt(terpy)(HImS)]Cl2�2H2O (4�2H2O)To a methanolic solution (20 mL) of [PtCl(terpy)]Cl�2H2O
(115 mg, 0.21 mmol), a dichloromethane solution (10 mL) of meth-imazole (26 mg, 0.23 mmol) was added and the solution was stir-red for 3 h. The solvents were removed under vacuum and thecontents were washed with ether. The residue was recrystallizedfrom methanol–acetonitrile whereupon needle shaped crystals ofthe title complex were obtained; yield 89 mg (66%). Anal. Calc.for C19H17Cl2N5PtS�2H2O (649.45): C, 35.1; H, 3.2; N, 10.8. Found:C, 34.6; H, 3.1; N, 10.5%. 1H NMR (D2O, d): 3.57 (s, 3H, NMe);6.78 (d, 1H), 7.06 (d, 1H) (CH@CH); 7.50 (t, 2H); 8.00–8.23 (m,6H); 8.33 (t, 1H); 8.46 (d, 1H) [terpy]. 13C{1H} NMR (D2O, d): 34.7(NMe); 117.1, 123 (CH); 124.4, 126.2, 129.8, 143.3, 144.0, 152.2,153.7, 157.9 (terpy).
2.2.6. [Pt(ImS)2(HImS)2] (5)A methanolic solution (6 mL) of sodium methoxide (0.057 M)
was added to a solution of 2 (293 mg, 0.39 mmol) in methanol withstirring which continued for 2 h. The precipitated yellow productwas filtered, washed with water and methanol and dried undervacuum to yield 5 (140 mg; 57%); m.p. 118 �C. Anal. Calc. forC16H22N8PtS4 (649.74): C, 29.5; H, 3.4; N, 17.2; S, 19.7. Found: C,29.0; H, 3.1; N, 16.7; S, 19.4%. IR (Nujol, cm�1): 3366 (br, NH),1279 (C@S). UV–Vis (CH2Cl2, kmax, nm): 376 (sh). 1H NMR (CDCl3,d): 3.57 (s, NMe); 6.72, 6.82 (each d, 1.5 Hz, @CH). 13C{1H} NMR(CDCl3, d): 34.4 (NMe), 119.8 (C5), 120.8 (C4). TOF MS ES+ Mass(m/e): 649 [M+]; 536 [Pt(ImS)2(HImS)]; 421 [Pt(ImS)2]; 115 (HImS).
A suspension of 5 in dichloromethane was allowed to standovernight to yield a wine-red solution which was filtered throughcelite and the filtrate was dried to yield flaky purple compound. 1HNMR (CDCl3, d): 3.35, 3.80 (NMe); 6.64, 7.01, 7.12, 7.72 (each d, CHof methimazole rings). 13C NMR (CDCl3, d): 33.84, 35.39 (NMe);120.1, 124.7, 121.6, 128.6 (bridged imidazole CH). TOF MS ES+Mass(m/e): 957 [Pt2(ImS)4(HImS)], 843 ([Pt2(ImS)4]), 536 ([Pt(Im-S)2(HImS)]), 227 (PtS), 114 (HImS) (Supplementary Fig. S-1).
In order to identify the formation of intermediate products as afunction of time, the reaction of 2 with sodium methoxide wasmonitored by time dependent UV–Vis spectroscopy and massspectrometry without isolating 5. UV–Vis spectra of the reactionmixture were recorded at different time intervals and kmax valuesare given as follows: UV–Vis (MeOH, nm): 324, 379 (orange solu-tion) (after 2 h); 405, 534 (red solution) (after 5 h); 420, 542 (pur-ple solution) (after 1 day). Mass spectra of the reaction mixturewere also recorded at different time intervals. The spectra showedfollowing peaks: TOF MS ES+ Mass (m/e): 1150 [Pt3(ImS)5], 843[Pt2(ImS)4], 729 [Pt2(ImS)3] 649 [Pt(ImS)2(HImS)2], 421 [Pt(ImS)2],(after completion of reaction) (supplementary Fig. S-2); after 1 daysame peaks were observed with increase in intensity for[Pt2(ImS)4]; 1375 [Pt4(ImS)4Cl4)], 954 [Pt3(ImS)2Cl4] in addition toabove mass peaks (after 4 days).
2.3. X-ray crystallography
Intensity data for [Pt(bipy)(HImS)2]Cl2�3H2O (3a�3H2O) weremeasured on a Rigaku AFC 7S diffractometer fitted with Mo Karadiation so that hmax = 27.5�. Data collection and refinement de-tails are given in Table 1. The structure was solved by direct meth-ods and refinement was done on F2 [17] using data that had beencorrected for Lorentz and polarization effects with an empiricalprocedure [18]. The non-hydrogen atoms were refined anisotropi-cally. Hydrogen atoms were fitted in their calculated positions and
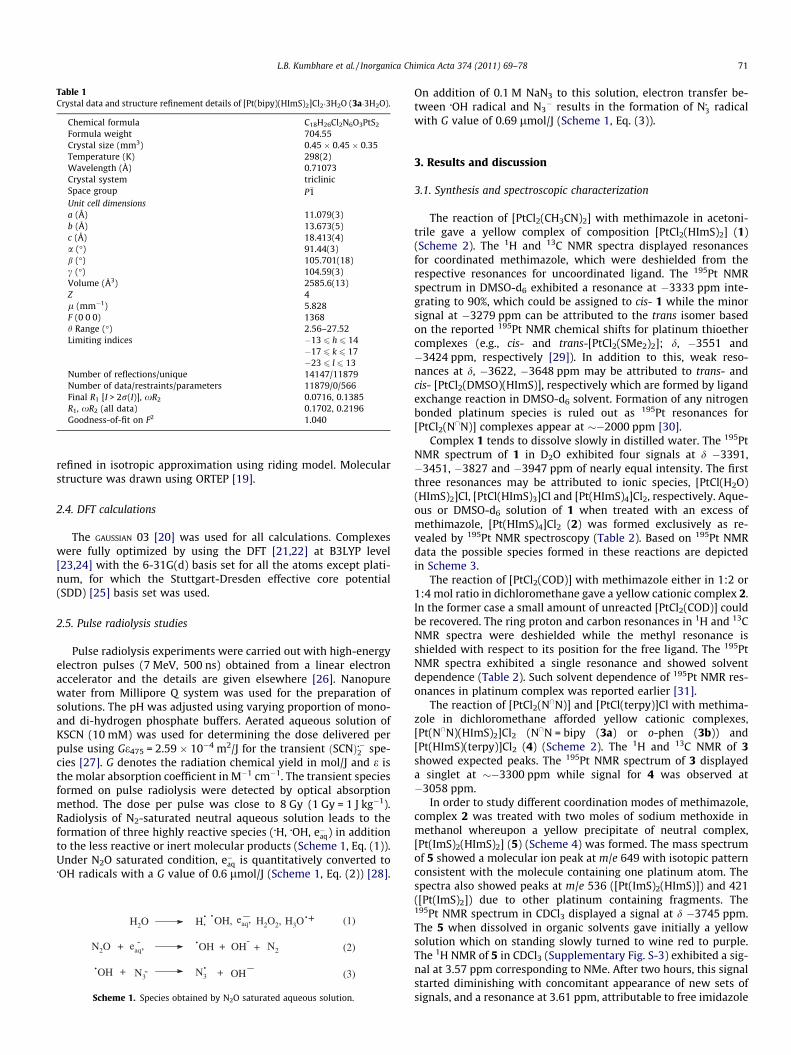
Table 1Crystal data and structure refinement details of [Pt(bipy)(HImS)2]Cl2�3H2O (3a�3H2O).
Chemical formula C18H26Cl2N6O3PtS2
Formula weight 704.55Crystal size (mm3) 0.45 � 0.45 � 0.35Temperature (K) 298(2)Wavelength (Å) 0.71073Crystal system triclinicSpace group P�1Unit cell dimensionsa (Å) 11.079(3)b (Å) 13.673(5)c (Å) 18.413(4)a (�) 91.44(3)b (�) 105.701(18)c (�) 104.59(3)Volume (Å3) 2585.6(13)Z 4l (mm�1) 5.828F (0 0 0) 1368h Range (�) 2.56–27.52Limiting indices �13 6 h 6 14
�17 6 k 6 17�23 6 l 6 13
Number of reflections/unique 14147/11879Number of data/restraints/parameters 11879/0/566Final R1 [I > 2r(I)], xR2 0.0716, 0.1385R1, xR2 (all data) 0.1702, 0.2196Goodness-of-fit on F2 1.040
L.B. Kumbhare et al. / Inorganica Chimica Acta 374 (2011) 69–78 71
refined in isotropic approximation using riding model. Molecularstructure was drawn using ORTEP [19].
2.4. DFT calculations
The GAUSSIAN 03 [20] was used for all calculations. Complexeswere fully optimized by using the DFT [21,22] at B3LYP level[23,24] with the 6-31G(d) basis set for all the atoms except plati-num, for which the Stuttgart-Dresden effective core potential(SDD) [25] basis set was used.
2.5. Pulse radiolysis studies
Pulse radiolysis experiments were carried out with high-energyelectron pulses (7 MeV, 500 ns) obtained from a linear electronaccelerator and the details are given elsewhere [26]. Nanopurewater from Millipore Q system was used for the preparation ofsolutions. The pH was adjusted using varying proportion of mono-and di-hydrogen phosphate buffers. Aerated aqueous solution ofKSCN (10 mM) was used for determining the dose delivered perpulse using Ge475 = 2.59 � 10�4 m2/J for the transient ðSCNÞ��2 spe-cies [27]. G denotes the radiation chemical yield in mol/J and e isthe molar absorption coefficient in M�1 cm�1. The transient speciesformed on pulse radiolysis were detected by optical absorptionmethod. The dose per pulse was close to 8 Gy (1 Gy = 1 J kg�1).Radiolysis of N2-saturated neutral aqueous solution leads to theformation of three highly reactive species (�H, �OH, e�aq) in additionto the less reactive or inert molecular products (Scheme 1, Eq. (1)).Under N2O saturated condition, e�aq is quantitatively converted to�OH radicals with a G value of 0.6 lmol/J (Scheme 1, Eq. (2)) [28].
eaq,-N2O +
+ N3OH -
H, OH, H2O2,.. .
H3O+eaq,
+.
N3 OH
OH-
OH N2++.
(1)
(2)
(3)
H2O
.
Scheme 1. Species obtained by N2O saturated aqueous solution.
On addition of 0.1 M NaN3 to this solution, electron transfer be-tween �OH radical and N3
� results in the formation of N�3 radicalwith G value of 0.69 lmol/J (Scheme 1, Eq. (3)).
3. Results and discussion
3.1. Synthesis and spectroscopic characterization
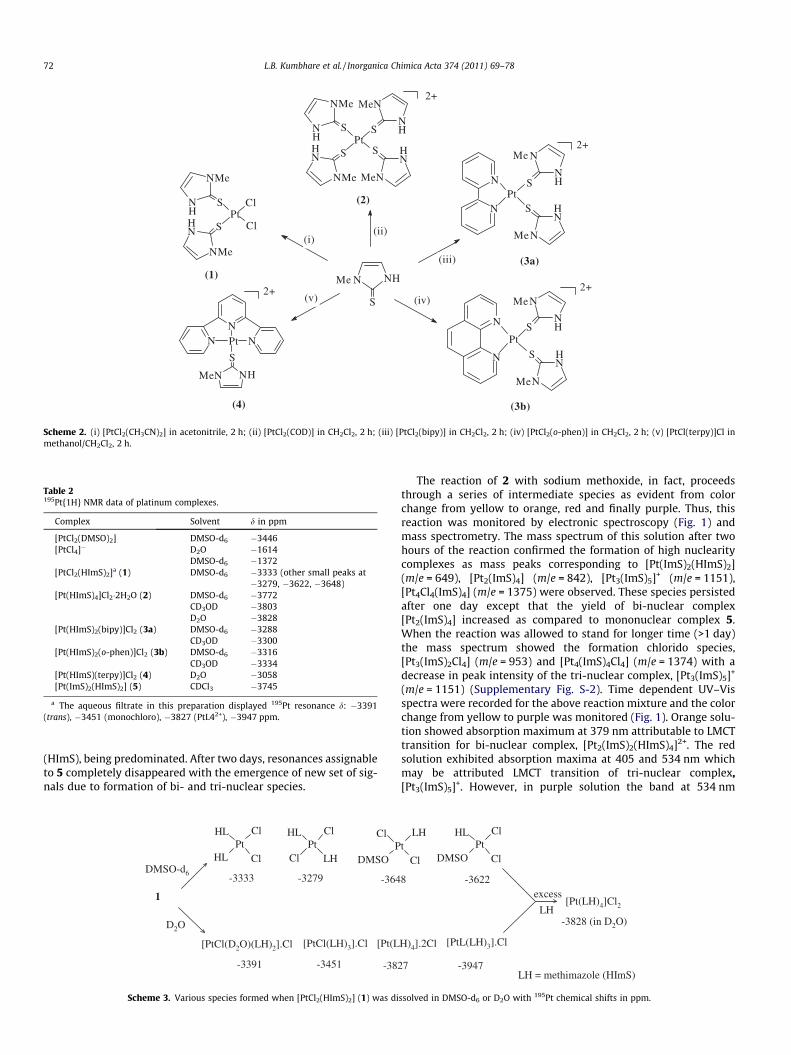
The reaction of [PtCl2(CH3CN)2] with methimazole in acetoni-trile gave a yellow complex of composition [PtCl2(HImS)2] (1)(Scheme 2). The 1H and 13C NMR spectra displayed resonancesfor coordinated methimazole, which were deshielded from therespective resonances for uncoordinated ligand. The 195Pt NMRspectrum in DMSO-d6 exhibited a resonance at �3333 ppm inte-grating to 90%, which could be assigned to cis- 1 while the minorsignal at �3279 ppm can be attributed to the trans isomer basedon the reported 195Pt NMR chemical shifts for platinum thioethercomplexes (e.g., cis- and trans-[PtCl2(SMe2)2]; d, �3551 and�3424 ppm, respectively [29]). In addition to this, weak reso-nances at d, �3622, �3648 ppm may be attributed to trans- andcis- [PtCl2(DMSO)(HImS)], respectively which are formed by ligandexchange reaction in DMSO-d6 solvent. Formation of any nitrogenbonded platinum species is ruled out as 195Pt resonances for[PtCl2(N\N)] complexes appear at ��2000 ppm [30].
Complex 1 tends to dissolve slowly in distilled water. The 195PtNMR spectrum of 1 in D2O exhibited four signals at d �3391,�3451, �3827 and �3947 ppm of nearly equal intensity. The firstthree resonances may be attributed to ionic species, [PtCl(H2O)(HImS)2]Cl, [PtCl(HImS)3]Cl and [Pt(HImS)4]Cl2, respectively. Aque-ous or DMSO-d6 solution of 1 when treated with an excess ofmethimazole, [Pt(HImS)4]Cl2 (2) was formed exclusively as re-vealed by 195Pt NMR spectroscopy (Table 2). Based on 195Pt NMRdata the possible species formed in these reactions are depictedin Scheme 3.
The reaction of [PtCl2(COD)] with methimazole either in 1:2 or1:4 mol ratio in dichloromethane gave a yellow cationic complex 2.In the former case a small amount of unreacted [PtCl2(COD)] couldbe recovered. The ring proton and carbon resonances in 1H and 13CNMR spectra were deshielded while the methyl resonance isshielded with respect to its position for the free ligand. The 195PtNMR spectra exhibited a single resonance and showed solventdependence (Table 2). Such solvent dependence of 195Pt NMR res-onances in platinum complex was reported earlier [31].
The reaction of [PtCl2(N\N)] and [PtCl(terpy)]Cl with methima-zole in dichloromethane afforded yellow cationic complexes,[Pt(N\N)(HImS)2]Cl2 (N\N = bipy (3a) or o-phen (3b)) and[Pt(HImS)(terpy)]Cl2 (4) (Scheme 2). The 1H and 13C NMR of 3showed expected peaks. The 195Pt NMR spectrum of 3 displayeda singlet at ��3300 ppm while signal for 4 was observed at�3058 ppm.
In order to study different coordination modes of methimazole,complex 2 was treated with two moles of sodium methoxide inmethanol whereupon a yellow precipitate of neutral complex,[Pt(ImS)2(HImS)2] (5) (Scheme 4) was formed. The mass spectrumof 5 showed a molecular ion peak at m/e 649 with isotopic patternconsistent with the molecule containing one platinum atom. Thespectra also showed peaks at m/e 536 ([Pt(ImS)2(HImS)]) and 421([Pt(ImS)2]) due to other platinum containing fragments. The195Pt NMR spectrum in CDCl3 displayed a signal at d �3745 ppm.The 5 when dissolved in organic solvents gave initially a yellowsolution which on standing slowly turned to wine red to purple.The 1H NMR of 5 in CDCl3 (Supplementary Fig. S-3) exhibited a sig-nal at 3.57 ppm corresponding to NMe. After two hours, this signalstarted diminishing with concomitant appearance of new sets ofsignals, and a resonance at 3.61 ppm, attributable to free imidazole
MeN
NHS
NH
MeN
SPt
NH
NMe
S
NH
NMe
S
Cl
ClPt
NH
NMe
S
NH
NMe
S
NHN
S
NN NPt
N N
S
N
N
N
NHS
NH
N
SPt
N
N
Pt
N
NHS
NH
N
S
(i)(ii)
(iii)
(iv)(v)
(2)
2+
(1)
(4)
Me
HMe
(3a)
2+Me
Me
(3b)
2+2+Me
Me
Scheme 2. (i) [PtCl2(CH3CN)2] in acetonitrile, 2 h; (ii) [PtCl2(COD)] in CH2Cl2, 2 h; (iii) [PtCl2(bipy)] in CH2Cl2, 2 h; (iv) [PtCl2(o-phen)] in CH2Cl2, 2 h; (v) [PtCl(terpy)]Cl inmethanol/CH2Cl2, 2 h.
Table 2195Pt{1H} NMR data of platinum complexes.
Complex Solvent d in ppm
[PtCl2(DMSO)2] DMSO-d6 �3446[PtCl4]� D2O �1614
DMSO-d6 �1372[PtCl2(HImS)2]a (1) DMSO-d6 �3333 (other small peaks at
�3279, �3622, �3648)[Pt(HImS)4]Cl2�2H2O (2) DMSO-d6 �3772
CD3OD �3803D2O �3828
[Pt(HImS)2(bipy)]Cl2 (3a) DMSO-d6 �3288CD3OD �3300
[Pt(HImS)2(o-phen)]Cl2 (3b) DMSO-d6 �3316CD3OD �3334
[Pt(HImS)(terpy)]Cl2 (4) D2O �3058[Pt(ImS)2(HImS)2] (5) CDCl3 �3745
a The aqueous filtrate in this preparation displayed 195Pt resonance d: �3391(trans), �3451 (monochloro), �3827 (PtL42+), �3947 ppm.
72 L.B. Kumbhare et al. / Inorganica Chimica Acta 374 (2011) 69–78
(HImS), being predominated. After two days, resonances assignableto 5 completely disappeared with the emergence of new set of sig-nals due to formation of bi- and tri-nuclear species.
HLPt
Cl
ClHL
HLPt
Cl
LHCl
ClP
DMSO
-3333 -3279 -364
[PtCl(D2O)(LH)2].Cl [PtCl(LH)3].Cl [Pt(L
-3391 -3451 -382
1
D2O
DMSO-d6
Scheme 3. Various species formed when [PtCl2(HImS)2] (1) was di
The reaction of 2 with sodium methoxide, in fact, proceedsthrough a series of intermediate species as evident from colorchange from yellow to orange, red and finally purple. Thus, thisreaction was monitored by electronic spectroscopy (Fig. 1) andmass spectrometry. The mass spectrum of this solution after twohours of the reaction confirmed the formation of high nuclearitycomplexes as mass peaks corresponding to [Pt(ImS)2(HImS)2](m/e = 649), [Pt2(ImS)4] (m/e = 842), [Pt3(ImS)5]+ (m/e = 1151),[Pt4Cl4(ImS)4] (m/e = 1375) were observed. These species persistedafter one day except that the yield of bi-nuclear complex[Pt2(ImS)4] increased as compared to mononuclear complex 5.When the reaction was allowed to stand for longer time (>1 day)the mass spectrum showed the formation chlorido species,[Pt3(ImS)2Cl4] (m/e = 953) and [Pt4(ImS)4Cl4] (m/e = 1374) with adecrease in peak intensity of the tri-nuclear complex, [Pt3(ImS)5]+
(m/e = 1151) (Supplementary Fig. S-2). Time dependent UV–Visspectra were recorded for the above reaction mixture and the colorchange from yellow to purple was monitored (Fig. 1). Orange solu-tion showed absorption maximum at 379 nm attributable to LMCTtransition for bi-nuclear complex, [Pt2(ImS)2(HImS)4]2+. The redsolution exhibited absorption maxima at 405 and 534 nm whichmay be attributed LMCT transition of tri-nuclear complex,[Pt3(ImS)5]+. However, in purple solution the band at 534 nm
HLPt
Cl
ClDMSOt
LH
Cl
8 -3622
H)4].2Cl [PtL(LH)3].Cl
7 -3947LH = methimazole (HImS)
excess
LH[Pt(LH)4]Cl2
-3828 (in D2O)
ssolved in DMSO-d6 or D2O with 195Pt chemical shifts in ppm.
NaOMe/MeOH[Pt(HImS)4]
2+ [Pt(ImS)2(HImS)2] [Pt2(ImS)2(HImS)4]2+
[Pt2(ImS)4(HImS)2][Pt2(ImS)4][Pt3(ImS)5]+
Solvent
(2) (5)
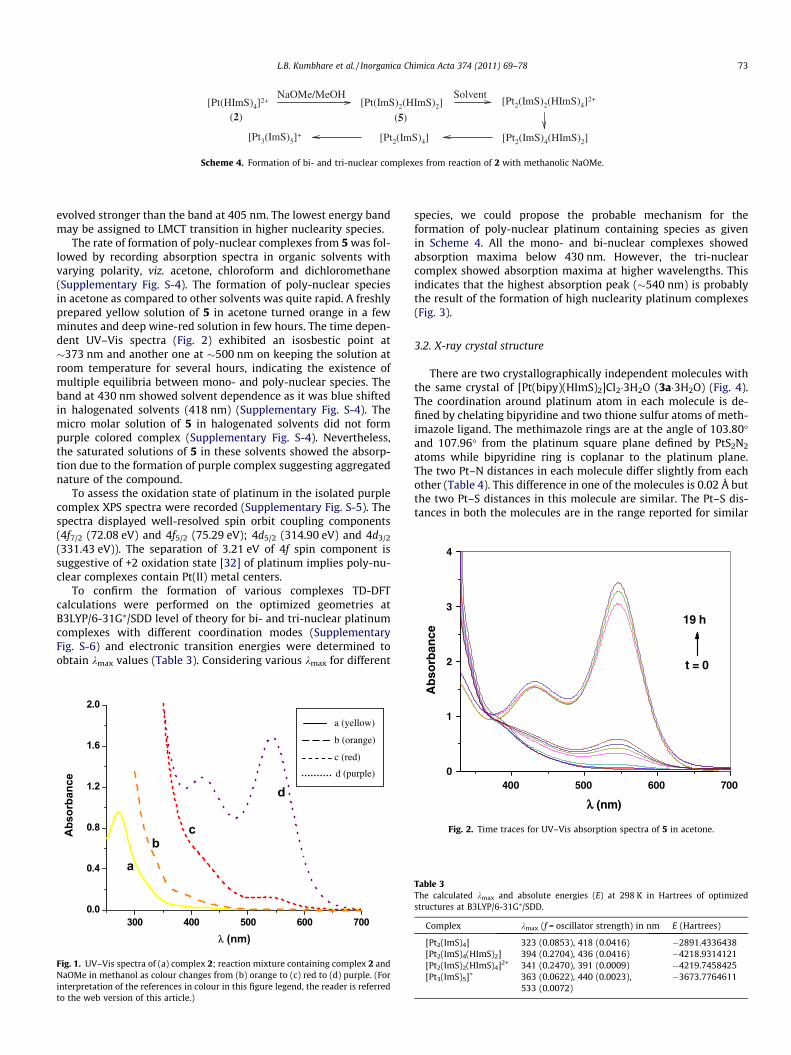
Scheme 4. Formation of bi- and tri-nuclear complexes from reaction of 2 with methanolic NaOMe.
2
3
4
rban
ce
t = 0
19 h
L.B. Kumbhare et al. / Inorganica Chimica Acta 374 (2011) 69–78 73
evolved stronger than the band at 405 nm. The lowest energy bandmay be assigned to LMCT transition in higher nuclearity species.
The rate of formation of poly-nuclear complexes from 5 was fol-lowed by recording absorption spectra in organic solvents withvarying polarity, viz. acetone, chloroform and dichloromethane(Supplementary Fig. S-4). The formation of poly-nuclear speciesin acetone as compared to other solvents was quite rapid. A freshlyprepared yellow solution of 5 in acetone turned orange in a fewminutes and deep wine-red solution in few hours. The time depen-dent UV–Vis spectra (Fig. 2) exhibited an isosbestic point at�373 nm and another one at �500 nm on keeping the solution atroom temperature for several hours, indicating the existence ofmultiple equilibria between mono- and poly-nuclear species. Theband at 430 nm showed solvent dependence as it was blue shiftedin halogenated solvents (418 nm) (Supplementary Fig. S-4). Themicro molar solution of 5 in halogenated solvents did not formpurple colored complex (Supplementary Fig. S-4). Nevertheless,the saturated solutions of 5 in these solvents showed the absorp-tion due to the formation of purple complex suggesting aggregatednature of the compound.
To assess the oxidation state of platinum in the isolated purplecomplex XPS spectra were recorded (Supplementary Fig. S-5). Thespectra displayed well-resolved spin orbit coupling components(4f7/2 (72.08 eV) and 4f5/2 (75.29 eV); 4d5/2 (314.90 eV) and 4d3/2
(331.43 eV)). The separation of 3.21 eV of 4f spin component issuggestive of +2 oxidation state [32] of platinum implies poly-nu-clear complexes contain Pt(II) metal centers.
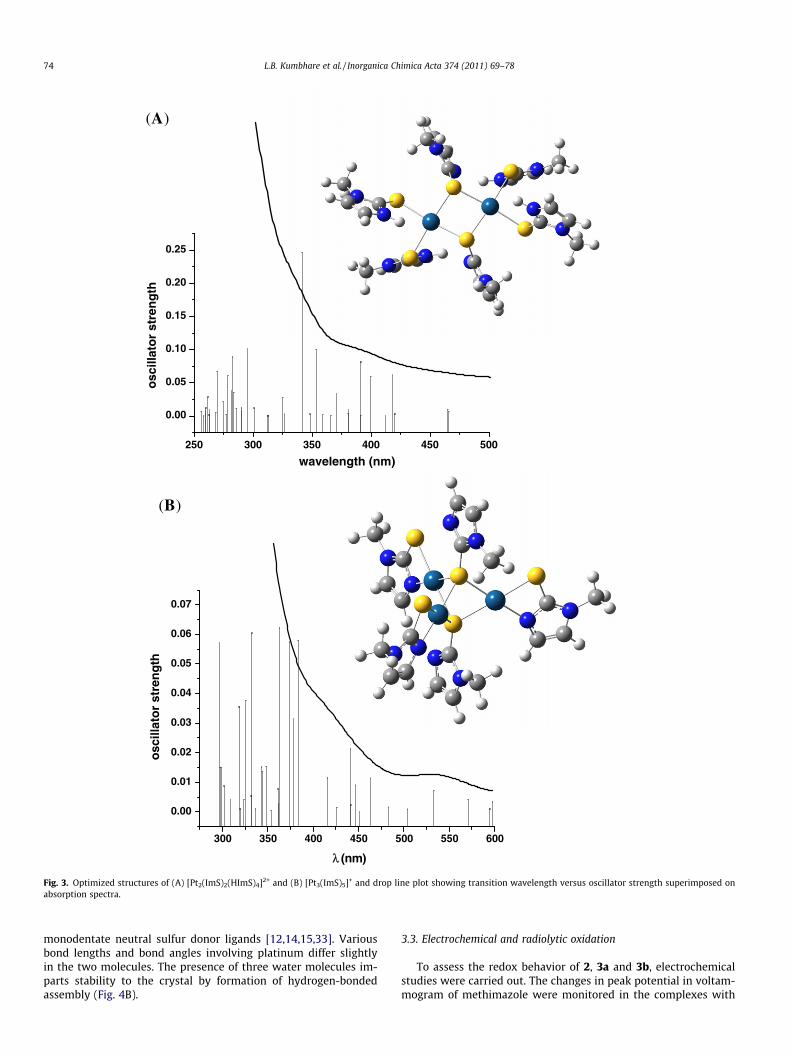
To confirm the formation of various complexes TD-DFTcalculations were performed on the optimized geometries atB3LYP/6-31G⁄/SDD level of theory for bi- and tri-nuclear platinumcomplexes with different coordination modes (SupplementaryFig. S-6) and electronic transition energies were determined toobtain kmax values (Table 3). Considering various kmax for different
300 400 500 600 7000.0
0.4
0.8
1.2
1.6
2.0
Abs
orba
nce
λ (nm)
ab
c
d
a (yellow)
b (orange)
c (red)
d (purple)
Fig. 1. UV–Vis spectra of (a) complex 2; reaction mixture containing complex 2 andNaOMe in methanol as colour changes from (b) orange to (c) red to (d) purple. (Forinterpretation of the references in colour in this figure legend, the reader is referredto the web version of this article.)
species, we could propose the probable mechanism for theformation of poly-nuclear platinum containing species as givenin Scheme 4. All the mono- and bi-nuclear complexes showedabsorption maxima below 430 nm. However, the tri-nuclearcomplex showed absorption maxima at higher wavelengths. Thisindicates that the highest absorption peak (�540 nm) is probablythe result of the formation of high nuclearity platinum complexes(Fig. 3).
3.2. X-ray crystal structure
There are two crystallographically independent molecules withthe same crystal of [Pt(bipy)(HImS)2]Cl2�3H2O (3a�3H2O) (Fig. 4).The coordination around platinum atom in each molecule is de-fined by chelating bipyridine and two thione sulfur atoms of meth-imazole ligand. The methimazole rings are at the angle of 103.80�and 107.96� from the platinum square plane defined by PtS2N2
atoms while bipyridine ring is coplanar to the platinum plane.The two Pt–N distances in each molecule differ slightly from eachother (Table 4). This difference in one of the molecules is 0.02 Å butthe two Pt–S distances in this molecule are similar. The Pt–S dis-tances in both the molecules are in the range reported for similar
400 500 600 7000
1
Ab
so
λλ (nm)
Fig. 2. Time traces for UV–Vis absorption spectra of 5 in acetone.
Table 3The calculated kmax and absolute energies (E) at 298 K in Hartrees of optimizedstructures at B3LYP/6-31G⁄/SDD.
Complex kmax (f = oscillator strength) in nm E (Hartrees)
[Pt2(ImS)4] 323 (0.0853), 418 (0.0416) �2891.4336438[Pt2(ImS)4(HImS)2] 394 (0.2704), 436 (0.0416) �4218.9314121[Pt2(ImS)2(HImS)4]2+ 341 (0.2470), 391 (0.0009) �4219.7458425[Pt3(ImS)5]+ 363 (0.0622), 440 (0.0023),
533 (0.0072)�3673.7764611
250 300 350 400 450 500
0.00
0.05
0.10
0.15
0.20
0.25
osc
illat
or
stre
ng
th
wavelength (nm)
300 350 400 450 500 550 600
0.00
0.01
0.02
0.03
0.04
0.05
0.06
0.07
osc
illat
or
stre
ng
th
λ (nm)
(A)
(B)
Fig. 3. Optimized structures of (A) [Pt2(ImS)2(HImS)4]2+ and (B) [Pt3(ImS)5]+ and drop line plot showing transition wavelength versus oscillator strength superimposed onabsorption spectra.
74 L.B. Kumbhare et al. / Inorganica Chimica Acta 374 (2011) 69–78
monodentate neutral sulfur donor ligands [12,14,15,33]. Variousbond lengths and bond angles involving platinum differ slightlyin the two molecules. The presence of three water molecules im-parts stability to the crystal by formation of hydrogen-bondedassembly (Fig. 4B).
3.3. Electrochemical and radiolytic oxidation
To assess the redox behavior of 2, 3a and 3b, electrochemicalstudies were carried out. The changes in peak potential in voltam-mogram of methimazole were monitored in the complexes with
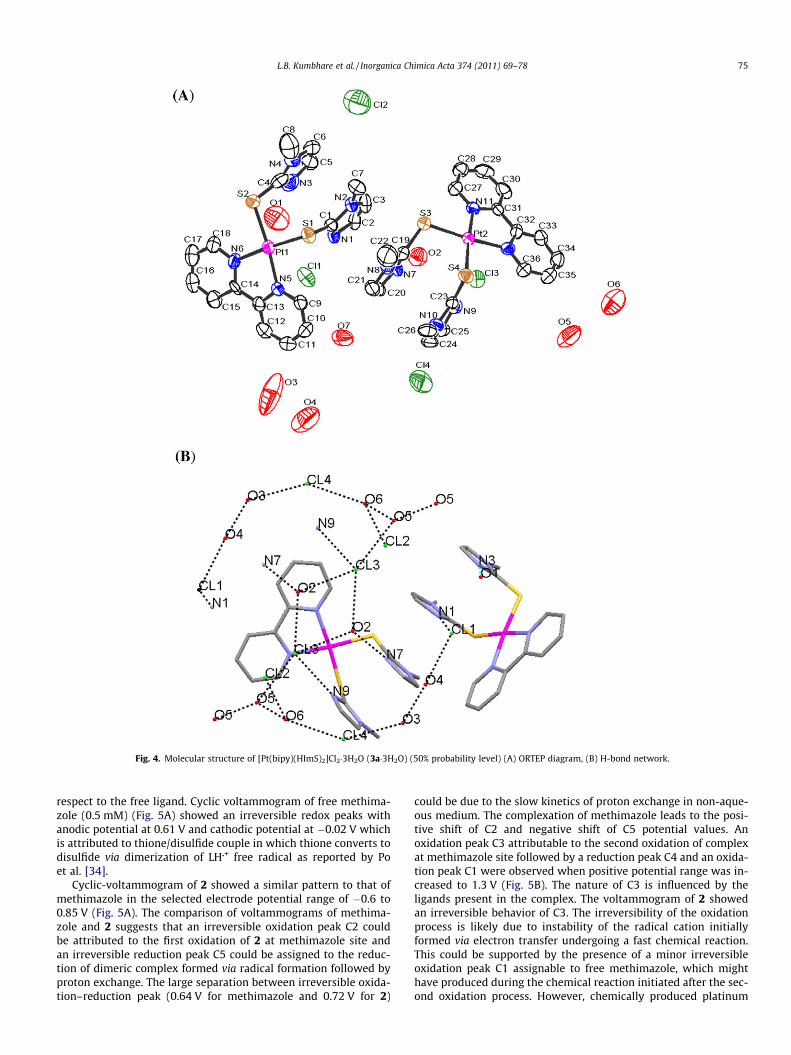
Fig. 4. Molecular structure of [Pt(bipy)(HImS)2]Cl2�3H2O (3a�3H2O) (50% probability level) (A) ORTEP diagram, (B) H-bond network.
L.B. Kumbhare et al. / Inorganica Chimica Acta 374 (2011) 69–78 75
respect to the free ligand. Cyclic voltammogram of free methima-zole (0.5 mM) (Fig. 5A) showed an irreversible redox peaks withanodic potential at 0.61 V and cathodic potential at �0.02 V whichis attributed to thione/disulfide couple in which thione converts todisulfide via dimerization of LH�+ free radical as reported by Poet al. [34].
Cyclic-voltammogram of 2 showed a similar pattern to that ofmethimazole in the selected electrode potential range of �0.6 to0.85 V (Fig. 5A). The comparison of voltammograms of methima-zole and 2 suggests that an irreversible oxidation peak C2 couldbe attributed to the first oxidation of 2 at methimazole site andan irreversible reduction peak C5 could be assigned to the reduc-tion of dimeric complex formed via radical formation followed byproton exchange. The large separation between irreversible oxida-tion–reduction peak (0.64 V for methimazole and 0.72 V for 2)
could be due to the slow kinetics of proton exchange in non-aque-ous medium. The complexation of methimazole leads to the posi-tive shift of C2 and negative shift of C5 potential values. Anoxidation peak C3 attributable to the second oxidation of complexat methimazole site followed by a reduction peak C4 and an oxida-tion peak C1 were observed when positive potential range was in-creased to 1.3 V (Fig. 5B). The nature of C3 is influenced by theligands present in the complex. The voltammogram of 2 showedan irreversible behavior of C3. The irreversibility of the oxidationprocess is likely due to instability of the radical cation initiallyformed via electron transfer undergoing a fast chemical reaction.This could be supported by the presence of a minor irreversibleoxidation peak C1 assignable to free methimazole, which mighthave produced during the chemical reaction initiated after the sec-ond oxidation process. However, chemically produced platinum
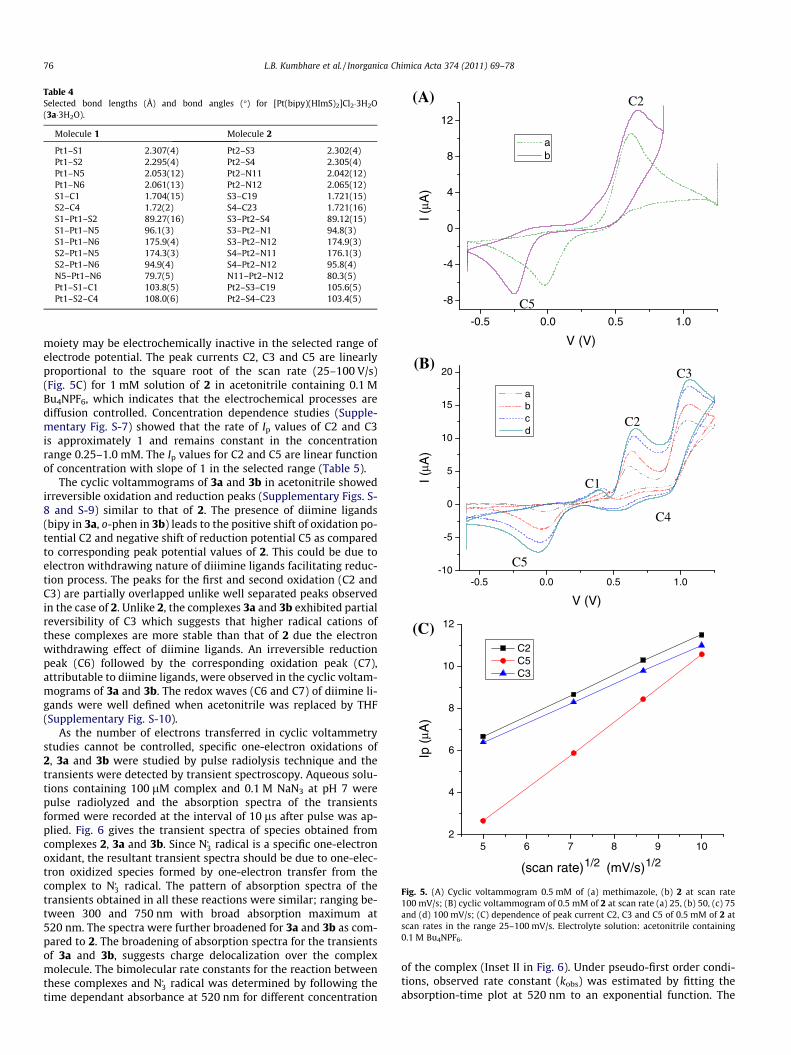
Table 4Selected bond lengths (Å) and bond angles (�) for [Pt(bipy)(HImS)2]Cl2�3H2O(3a�3H2O).
Molecule 1 Molecule 2
Pt1–S1 2.307(4) Pt2–S3 2.302(4)Pt1–S2 2.295(4) Pt2–S4 2.305(4)Pt1–N5 2.053(12) Pt2–N11 2.042(12)Pt1–N6 2.061(13) Pt2–N12 2.065(12)S1–C1 1.704(15) S3–C19 1.721(15)S2–C4 1.72(2) S4–C23 1.721(16)S1–Pt1–S2 89.27(16) S3–Pt2–S4 89.12(15)S1–Pt1–N5 96.1(3) S3–Pt2–N1 94.8(3)S1–Pt1–N6 175.9(4) S3–Pt2–N12 174.9(3)S2–Pt1–N5 174.3(3) S4–Pt2–N11 176.1(3)S2–Pt1–N6 94.9(4) S4–Pt2–N12 95.8(4)N5–Pt1–N6 79.7(5) N11–Pt2–N12 80.3(5)Pt1–S1–C1 103.8(5) Pt2–S3–C19 105.6(5)Pt1–S2–C4 108.0(6) Pt2–S4–C23 103.4(5)
-0.5 0.0 0.5 1.0
-8
-4
0
4
8
12
I (μ A
)
V (V)
a b
-0.5 0.0 0.5 1.0-10
-5
0
5
10
15
20
I (μ A
)
V (V)
a b c d
5 6 7 8 9 102
4
6
8
10
12
Ip (
μ A)
(scan rate)1/2 (mV/s)1/2
C2 C5 C3
(A)
(B)
(C)
C2
C1
C3
C5
C2
C4
C5
Fig. 5. (A) Cyclic voltammogram 0.5 mM of (a) methimazole, (b) 2 at scan rate100 mV/s; (B) cyclic voltammogram of 0.5 mM of 2 at scan rate (a) 25, (b) 50, (c) 75and (d) 100 mV/s; (C) dependence of peak current C2, C3 and C5 of 0.5 mM of 2 atscan rates in the range 25–100 mV/s. Electrolyte solution: acetonitrile containing0.1 M Bu4NPF6.
76 L.B. Kumbhare et al. / Inorganica Chimica Acta 374 (2011) 69–78
moiety may be electrochemically inactive in the selected range ofelectrode potential. The peak currents C2, C3 and C5 are linearlyproportional to the square root of the scan rate (25–100 V/s)(Fig. 5C) for 1 mM solution of 2 in acetonitrile containing 0.1 MBu4NPF6, which indicates that the electrochemical processes arediffusion controlled. Concentration dependence studies (Supple-mentary Fig. S-7) showed that the rate of Ip values of C2 and C3is approximately 1 and remains constant in the concentrationrange 0.25–1.0 mM. The Ip values for C2 and C5 are linear functionof concentration with slope of 1 in the selected range (Table 5).
The cyclic voltammograms of 3a and 3b in acetonitrile showedirreversible oxidation and reduction peaks (Supplementary Figs. S-8 and S-9) similar to that of 2. The presence of diimine ligands(bipy in 3a, o-phen in 3b) leads to the positive shift of oxidation po-tential C2 and negative shift of reduction potential C5 as comparedto corresponding peak potential values of 2. This could be due toelectron withdrawing nature of diiimine ligands facilitating reduc-tion process. The peaks for the first and second oxidation (C2 andC3) are partially overlapped unlike well separated peaks observedin the case of 2. Unlike 2, the complexes 3a and 3b exhibited partialreversibility of C3 which suggests that higher radical cations ofthese complexes are more stable than that of 2 due the electronwithdrawing effect of diimine ligands. An irreversible reductionpeak (C6) followed by the corresponding oxidation peak (C7),attributable to diimine ligands, were observed in the cyclic voltam-mograms of 3a and 3b. The redox waves (C6 and C7) of diimine li-gands were well defined when acetonitrile was replaced by THF(Supplementary Fig. S-10).
As the number of electrons transferred in cyclic voltammetrystudies cannot be controlled, specific one-electron oxidations of2, 3a and 3b were studied by pulse radiolysis technique and thetransients were detected by transient spectroscopy. Aqueous solu-tions containing 100 lM complex and 0.1 M NaN3 at pH 7 werepulse radiolyzed and the absorption spectra of the transientsformed were recorded at the interval of 10 ls after pulse was ap-plied. Fig. 6 gives the transient spectra of species obtained fromcomplexes 2, 3a and 3b. Since N�3 radical is a specific one-electronoxidant, the resultant transient spectra should be due to one-elec-tron oxidized species formed by one-electron transfer from thecomplex to N�3 radical. The pattern of absorption spectra of thetransients obtained in all these reactions were similar; ranging be-tween 300 and 750 nm with broad absorption maximum at520 nm. The spectra were further broadened for 3a and 3b as com-pared to 2. The broadening of absorption spectra for the transientsof 3a and 3b, suggests charge delocalization over the complexmolecule. The bimolecular rate constants for the reaction betweenthese complexes and N�3 radical was determined by following thetime dependant absorbance at 520 nm for different concentration
of the complex (Inset II in Fig. 6). Under pseudo-first order condi-tions, observed rate constant (kobs) was estimated by fitting theabsorption-time plot at 520 nm to an exponential function. The
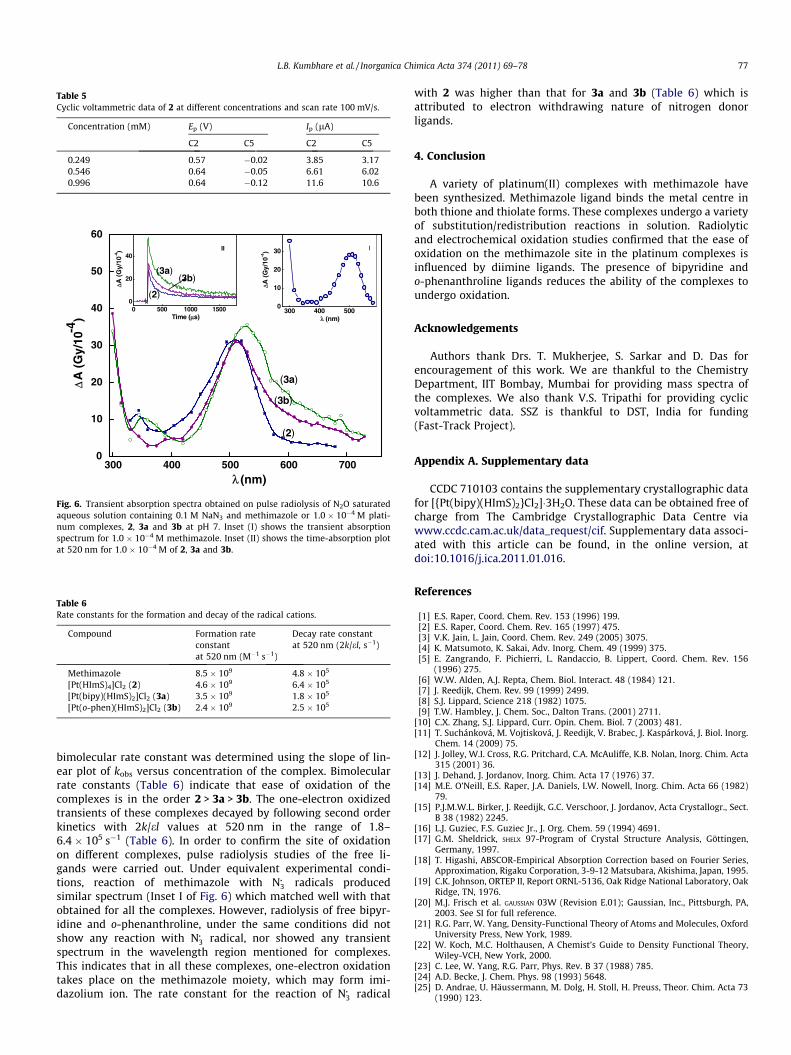
Table 5Cyclic voltammetric data of 2 at different concentrations and scan rate 100 mV/s.
Concentration (mM) Ep (V) Ip (lA)
C2 C5 C2 C5
0.249 0.57 �0.02 3.85 3.170.546 0.64 �0.05 6.61 6.020.996 0.64 �0.12 11.6 10.6
300 400 500 600 7000
10
20
30
40
50
60
300 400 5000
10
20
30
0 500 1000 15000
20
40
(3b)(3a)
(2)
(3b)
(2)
(3a)ΔA
(G
y/10
-4)
λ (nm)
λ (nm)
ΔA (
Gy/
10-4) I
Time (μs)
Δ A (
Gy/
10-4) II
Fig. 6. Transient absorption spectra obtained on pulse radiolysis of N2O saturatedaqueous solution containing 0.1 M NaN3 and methimazole or 1.0 � 10�4 M plati-num complexes, 2, 3a and 3b at pH 7. Inset (I) shows the transient absorptionspectrum for 1.0 � 10�4 M methimazole. Inset (II) shows the time-absorption plotat 520 nm for 1.0 � 10�4 M of 2, 3a and 3b.
Table 6Rate constants for the formation and decay of the radical cations.
Compound Formation rateconstantat 520 nm (M�1 s�1)
Decay rate constantat 520 nm (2k/el, s�1)
Methimazole 8.5 � 109 4.8 � 105
[Pt(HImS)4]Cl2 (2) 4.6 � 109 6.4 � 105
[Pt(bipy)(HImS)2]Cl2 (3a) 3.5 � 109 1.8 � 105
[Pt(o-phen)(HImS)2]Cl2 (3b) 2.4 � 109 2.5 � 105
L.B. Kumbhare et al. / Inorganica Chimica Acta 374 (2011) 69–78 77
bimolecular rate constant was determined using the slope of lin-ear plot of kobs versus concentration of the complex. Bimolecularrate constants (Table 6) indicate that ease of oxidation of thecomplexes is in the order 2 > 3a > 3b. The one-electron oxidizedtransients of these complexes decayed by following second orderkinetics with 2k/el values at 520 nm in the range of 1.8–6.4 � 105 s�1 (Table 6). In order to confirm the site of oxidationon different complexes, pulse radiolysis studies of the free li-gands were carried out. Under equivalent experimental condi-tions, reaction of methimazole with N�3 radicals producedsimilar spectrum (Inset I of Fig. 6) which matched well with thatobtained for all the complexes. However, radiolysis of free bipyr-idine and o-phenanthroline, under the same conditions did notshow any reaction with N�3 radical, nor showed any transientspectrum in the wavelength region mentioned for complexes.This indicates that in all these complexes, one-electron oxidationtakes place on the methimazole moiety, which may form imi-dazolium ion. The rate constant for the reaction of N�3 radical
with 2 was higher than that for 3a and 3b (Table 6) which isattributed to electron withdrawing nature of nitrogen donorligands.
4. Conclusion
A variety of platinum(II) complexes with methimazole havebeen synthesized. Methimazole ligand binds the metal centre inboth thione and thiolate forms. These complexes undergo a varietyof substitution/redistribution reactions in solution. Radiolyticand electrochemical oxidation studies confirmed that the ease ofoxidation on the methimazole site in the platinum complexes isinfluenced by diimine ligands. The presence of bipyridine ando-phenanthroline ligands reduces the ability of the complexes toundergo oxidation.
Acknowledgements
Authors thank Drs. T. Mukherjee, S. Sarkar and D. Das forencouragement of this work. We are thankful to the ChemistryDepartment, IIT Bombay, Mumbai for providing mass spectra ofthe complexes. We also thank V.S. Tripathi for providing cyclicvoltammetric data. SSZ is thankful to DST, India for funding(Fast-Track Project).
Appendix A. Supplementary data
CCDC 710103 contains the supplementary crystallographic datafor [{Pt(bipy)(HImS)2}Cl2]�3H2O. These data can be obtained free ofcharge from The Cambridge Crystallographic Data Centre viawww.ccdc.cam.ac.uk/data_request/cif. Supplementary data associ-ated with this article can be found, in the online version, atdoi:10.1016/j.ica.2011.01.016.
References
[1] E.S. Raper, Coord. Chem. Rev. 153 (1996) 199.[2] E.S. Raper, Coord. Chem. Rev. 165 (1997) 475.[3] V.K. Jain, L. Jain, Coord. Chem. Rev. 249 (2005) 3075.[4] K. Matsumoto, K. Sakai, Adv. Inorg. Chem. 49 (1999) 375.[5] E. Zangrando, F. Pichierri, L. Randaccio, B. Lippert, Coord. Chem. Rev. 156
(1996) 275.[6] W.W. Alden, A.J. Repta, Chem. Biol. Interact. 48 (1984) 121.[7] J. Reedijk, Chem. Rev. 99 (1999) 2499.[8] S.J. Lippard, Science 218 (1982) 1075.[9] T.W. Hambley, J. Chem. Soc., Dalton Trans. (2001) 2711.
[10] C.X. Zhang, S.J. Lippard, Curr. Opin. Chem. Biol. 7 (2003) 481.[11] T. Suchánková, M. Vojtisková, J. Reedijk, V. Brabec, J. Kaspárková, J. Biol. Inorg.
Chem. 14 (2009) 75.[12] J. Jolley, W.I. Cross, R.G. Pritchard, C.A. McAuliffe, K.B. Nolan, Inorg. Chim. Acta
315 (2001) 36.[13] J. Dehand, J. Jordanov, Inorg. Chim. Acta 17 (1976) 37.[14] M.E. O’Neill, E.S. Raper, J.A. Daniels, I.W. Nowell, Inorg. Chim. Acta 66 (1982)
79.[15] P.J.M.W.L. Birker, J. Reedijk, G.C. Verschoor, J. Jordanov, Acta Crystallogr., Sect.
B 38 (1982) 2245.[16] L.J. Guziec, F.S. Guziec Jr., J. Org. Chem. 59 (1994) 4691.[17] G.M. Sheldrick, SHELX 97-Program of Crystal Structure Analysis, Göttingen,
Germany, 1997.[18] T. Higashi, ABSCOR-Empirical Absorption Correction based on Fourier Series,
Approximation, Rigaku Corporation, 3-9-12 Matsubara, Akishima, Japan, 1995.[19] C.K. Johnson, ORTEP II, Report ORNL-5136, Oak Ridge National Laboratory, Oak
Ridge, TN, 1976.[20] M.J. Frisch et al. GAUSSIAN 03W (Revision E.01); Gaussian, Inc., Pittsburgh, PA,
2003. See SI for full reference.[21] R.G. Parr, W. Yang, Density-Functional Theory of Atoms and Molecules, Oxford
University Press, New York, 1989.[22] W. Koch, M.C. Holthausen, A Chemist’s Guide to Density Functional Theory,
Wiley-VCH, New York, 2000.[23] C. Lee, W. Yang, R.G. Parr, Phys. Rev. B 37 (1988) 785.[24] A.D. Becke, J. Chem. Phys. 98 (1993) 5648.[25] D. Andrae, U. Häussermann, M. Dolg, H. Stoll, H. Preuss, Theor. Chim. Acta 73
(1990) 123.

78 L.B. Kumbhare et al. / Inorganica Chimica Acta 374 (2011) 69–78
[26] S.N. Guha, P.N. Moorthy, K. Kishore, D.B. Naik, K.N. Rao, Proc. Indian Acad. Sci.Chem. Sci. 99 (1987) 261.
[27] G.V. Buxton, C.R. Stuart, J. Chem. Soc., Faraday Trans. 91 (1995) 279.[28] G.V. Buxton, Q.G. Mulazzani, in: V. Balzani (Ed.), Radiation-Chemical
Techniques, Electron Transfer in Chemistry, vol. 1, Wiley-VCH, Weinheim,2001, p. 503.
[29] P.L. Goggin, R.J. Goodfellow, S.R. Haddock, B.F. Taylor, I.R.H. Marshall, J. Chem.Soc., Dalton Trans. (1976) 459.
[30] E. Gabano, E. Marengo, M. Bobba, E. Robotti, C. Cassino, M. Botta, D. Osella,Coord. Chem. Rev. 250 (2006) 2158.
[31] P.S. Pregosin, Coord. Chem. Rev. 44 (1982) 247.[32] J.F. Moulder, W.F. Stickle, P.E. Sobol, K.D. Bomben, in: J. Chastain, R.C. King Jr.
(Eds.), Handbook of X-Ray Photoelectron Spectroscopy, Perkin Elmer, EdenPrairie, MN, 1992.
[33] J. Calvo, J.S. Casas, E. Garciá-Martinez, Y. Parajó, A. Sánchez-González, J. Sordo,Z. Anorg. Allg. Chem. 630 (2004) 215.
[34] H.N. Po, Z. Shariff, J.A. Masse, F. Freeman, M.C. Keindle-Yu, Phosphorus, Sulfur,Silicon 63 (1991) 1.
Copyright © 2022 FDOKUMEN