Metabolic capacities of microorganisms from a long-term bare fallow
7
Applied Soil Ecology 51 (2011) 87–93 Contents lists available at ScienceDirect Applied Soil Ecology journa l h o me page: www.elsevier.com/locate/apsoil Metabolic capacities of microorganisms from a long-term bare fallow Bertrand Guenet a,1 , Sabrina Juarez b , Gérard Bardoux c , Valérie Pouteau d , Nathalie Cheviron e , Christelle Marrauld e , Luc Abbadie a , Claire Chenu f,∗ a UPMC, UMR 7618 Bioemco, 46, rue d’Ulm, F-75230 Paris Cedex 05, France b UPMC, UMR 7618 Bioemco, Bâtiment EGER, 78850 Thiverval Grignon, France c CNRS, UMR 7618 Bioemco, Bâtiment EGER, 78850 Thiverval Grignon, France d INRA, UMR 1122 Bioemco, Bâtiment EGER, 78850 Thiverval Grignon, France e INRA, PESSAC, Batiment 6, RD 10 78026 Versailles Cedex, France f Agroparistech, UMR 7618 Bioemco, Bâtiment EGER, 78850 Thiverval Grignon, France a r t i c l e i n f o Article history: Received 3 July 2010 Received in revised form 9 May 2011 Accepted 9 July 2011 Keywords: Fresh organic matter 13 C-straw 13 C-cellulose Mineralization Bare fallow soil Arable soil Biolog® ECOPlates a b s t r a c t Soil degradation due to erosion or to soil organic matter (SOM) depletion is known to reduce the ecosys- tems services performed by soils. Amendments of organic matter are often proposed to restore the soil quality as they may increase water holding capacity, microbial activity and decrease erosion. In this work, we tested the ability of microbial communities from a soil very depleted in organic matter to mineralize fresh organic matter. We used a soil deprived of organic matter inputs since 1929 as a model of degraded soil. We amended it with 13 C-cellulose or 13 C-straw at two different levels (0.5 g C kg −1 of soil vs. 5 g C kg −1 ). The same treatments were performed on an arable soil as control. The soils were incubated at 20 ◦ C during 209 days and the amount of CO 2 released and 13 C–CO 2 were monitored during incubation. We measured the microbial biomass by fumigation extraction and determined the metabolic profiles of microorganisms by using Biolog ® ECOPlates. The straw and cellulose were mineralized without lag-time in both soils. It suggested that the bare fallow soil had kept its metabolic capacities to degrade straw and cellulose, but at a lower rate when compared to the arable control soil. The Shannon index (H) calculated from Biolog® ECOPlates was very high in the two types of soils, which suggest that the two microbial communities were ubiquist. Moreover, the bare fallow microbial community was efficient to mineralize the amino acids and the mannitol in the Biolog® ECOPlates. Consequently, we assumed that the bare fallow soil microbial community had kept its metabolic capacities because of the microbial turnover. The dead microbial biomass might be an important substrate for the microbial community explaining why it may easily mineralize labile organic matter such as straw or cellulose. © 2011 Elsevier B.V. All rights reserved. 1. Introduction Soil degradation is a widespread phenomenon, particularly in the context of agricultural production because of, e.g., lack of plant residue input, erosion and fire-based techniques (Lal, 2000; Styger et al., 2007). One of the first recommended actions to restore a degraded soil is the amendment with fresh organic matter (FOM) or compost (Ros et al., 2003a,b; Bastida et al., 2009). FOM amend- ment increases soil aggregate stability (e.g., Ros et al., 2003a) and water-holding capacity (Barzegar et al., 2002; Bastida et al., 2009), reduces erosion (Roman et al., 2003) and increases microbial activ- ity (Ros et al., 2003b; Bastida et al., 2007). However, the capacity ∗ Corresponding author. Tel.: +33 1 30 81 52 16. E-mail address: [email protected] (C. Chenu). 1 Present address: CNRS, UMR 8212 Laboratoire des Sciences du Climat et de l’Environnement, L’Orme des Merisiers-bat. 712, 91190 Gif-sur-Yvette, France. of autochthonous microbial communities of a degraded or very degraded soil to mineralize and stabilize fresh organic matter is a key point for soil restoration (Pascual et al., 2000; Saison et al., 2006). To improve the management of FOM amendments a bet- ter understanding of the C-cycling in soils, in particular of the role of soil microorganisms in FOM incorporation to SOM, is needed. Thanks to isotopic techniques and in particular to the use of 13 C or 14 C-labelled FOM, important advances in the understanding of C dynamics in soil have been made (e.g., Gaillard et al., 2003). For instance, using DNA stable isotopes probing, it is now possi- ble to detect what kind of microbial taxa mineralize FOM or SOM (Bernard et al., 2007). Furthermore, the monitoring of SOM and FOM decomposition when both substrates are present together is made possible thanks to isotopes (Guenet et al., 2010). Our aim in this paper was to test if a soil strongly depleted in SOM kept its FOM metabolic capacities, even if the SOM was quite exclusively made of stabilized OM. The bare fallow experi- ment maintained at INRA Versailles since 1929 presented a unique 0929-1393/$ – see front matter © 2011 Elsevier B.V. All rights reserved. doi:10.1016/j.apsoil.2011.07.006
-
Upload
independent -
Category
Documents
-
view
2 -
download
0
Transcript of Metabolic capacities of microorganisms from a long-term bare fallow
M
BCa
b
c
d
e
f
a
ARRA
KF1
1
MBAB
1
tredomwri
l
0d
Applied Soil Ecology 51 (2011) 87– 93
Contents lists available at ScienceDirect
Applied Soil Ecology
journa l h o me page: www.elsev ier .com/ locate /apsoi l
etabolic capacities of microorganisms from a long-term bare fallow
ertrand Gueneta,1, Sabrina Juarezb, Gérard Bardouxc, Valérie Pouteaud, Nathalie Chevirone,hristelle Marraulde, Luc Abbadiea, Claire Chenuf,∗
UPMC, UMR 7618 Bioemco, 46, rue d’Ulm, F-75230 Paris Cedex 05, FranceUPMC, UMR 7618 Bioemco, Bâtiment EGER, 78850 Thiverval Grignon, FranceCNRS, UMR 7618 Bioemco, Bâtiment EGER, 78850 Thiverval Grignon, FranceINRA, UMR 1122 Bioemco, Bâtiment EGER, 78850 Thiverval Grignon, FranceINRA, PESSAC, Batiment 6, RD 10 78026 Versailles Cedex, FranceAgroparistech, UMR 7618 Bioemco, Bâtiment EGER, 78850 Thiverval Grignon, France
r t i c l e i n f o
rticle history:eceived 3 July 2010eceived in revised form 9 May 2011ccepted 9 July 2011
eywords:resh organic matter3C-straw3C-celluloseineralization
are fallow soilrable soiliolog® ECOPlates
a b s t r a c t
Soil degradation due to erosion or to soil organic matter (SOM) depletion is known to reduce the ecosys-tems services performed by soils. Amendments of organic matter are often proposed to restore the soilquality as they may increase water holding capacity, microbial activity and decrease erosion. In this work,we tested the ability of microbial communities from a soil very depleted in organic matter to mineralizefresh organic matter. We used a soil deprived of organic matter inputs since 1929 as a model of degradedsoil. We amended it with 13C-cellulose or 13C-straw at two different levels (0.5 g C kg−1 of soil vs. 5 gC kg−1). The same treatments were performed on an arable soil as control. The soils were incubated at20 ◦C during 209 days and the amount of CO2 released and �13C–CO2 were monitored during incubation.We measured the microbial biomass by fumigation extraction and determined the metabolic profiles ofmicroorganisms by using Biolog® ECOPlates. The straw and cellulose were mineralized without lag-timein both soils. It suggested that the bare fallow soil had kept its metabolic capacities to degrade straw andcellulose, but at a lower rate when compared to the arable control soil. The Shannon index (H) calculated
from Biolog® ECOPlates was very high in the two types of soils, which suggest that the two microbialcommunities were ubiquist. Moreover, the bare fallow microbial community was efficient to mineralizethe amino acids and the mannitol in the Biolog® ECOPlates. Consequently, we assumed that the barefallow soil microbial community had kept its metabolic capacities because of the microbial turnover. Thedead microbial biomass might be an important substrate for the microbial community explaining why itmay easily mineralize labile organic matter such as straw or cellulose.. Introduction
Soil degradation is a widespread phenomenon, particularly inhe context of agricultural production because of, e.g., lack of plantesidue input, erosion and fire-based techniques (Lal, 2000; Stygert al., 2007). One of the first recommended actions to restore aegraded soil is the amendment with fresh organic matter (FOM)r compost (Ros et al., 2003a,b; Bastida et al., 2009). FOM amend-ent increases soil aggregate stability (e.g., Ros et al., 2003a) and
ater-holding capacity (Barzegar et al., 2002; Bastida et al., 2009),educes erosion (Roman et al., 2003) and increases microbial activ-ty (Ros et al., 2003b; Bastida et al., 2007). However, the capacity
∗ Corresponding author. Tel.: +33 1 30 81 52 16.E-mail address: [email protected] (C. Chenu).
1 Present address: CNRS, UMR 8212 Laboratoire des Sciences du Climat et de’Environnement, L’Orme des Merisiers-bat. 712, 91190 Gif-sur-Yvette, France.
929-1393/$ – see front matter © 2011 Elsevier B.V. All rights reserved.oi:10.1016/j.apsoil.2011.07.006
© 2011 Elsevier B.V. All rights reserved.
of autochthonous microbial communities of a degraded or verydegraded soil to mineralize and stabilize fresh organic matter isa key point for soil restoration (Pascual et al., 2000; Saison et al.,2006). To improve the management of FOM amendments a bet-ter understanding of the C-cycling in soils, in particular of the roleof soil microorganisms in FOM incorporation to SOM, is needed.Thanks to isotopic techniques and in particular to the use of 13Cor 14C-labelled FOM, important advances in the understanding ofC dynamics in soil have been made (e.g., Gaillard et al., 2003).For instance, using DNA stable isotopes probing, it is now possi-ble to detect what kind of microbial taxa mineralize FOM or SOM(Bernard et al., 2007). Furthermore, the monitoring of SOM andFOM decomposition when both substrates are present together ismade possible thanks to isotopes (Guenet et al., 2010).
Our aim in this paper was to test if a soil strongly depletedin SOM kept its FOM metabolic capacities, even if the SOM wasquite exclusively made of stabilized OM. The bare fallow experi-ment maintained at INRA Versailles since 1929 presented a unique

8 d Soil
oIlSbtlmtmscwf
2
2
teelapus2wt9its(am
tcscsd(auttca
2
ubavaeFw
8 B. Guenet et al. / Applie
pportunity to test this, since the soil received no FOM for 80 years.ndeed, Barré et al. (2010) showed that in this bare fallow soil, ateast 73% of total soil organic carbon corresponded to the stableOM pool, with residence times of several centuries, as definedy Parton et al. (1987) in the CENTURY model. Thus, we broughtwo types of 13C-labelled FOM (wheat straw and cellulose) at twoevels (0.5 g C kg−1 and 5 g C kg−1) to samples from this soil, and
onitored the FOM and SOM mineralization. We also measuredhe microbial biomass and the metabolic capabilities of the soil
icroorganisms using the Biolog® ECOPlates. We performed theame experiment on the same soil but continuously cropped as aontrol. We used these soils to compare how FOM was mineralizedhen incorporated to a bare fallow soil without FOM amendment
or 80 years and versus a soil with regular FOM inputs history.
. Materials and methods
.1. Soils
The soils are Eutric Cambisol (FAO). We used two long-termrials located nearby at INRA Versailles (France) on the same par-nt material. The first one is a bare fallow soil from the “42 plotsxperiment” thereafter called bare fallow. The control plots of thisong-term experiment were maintained bare and did not receiveny addition of organic matter, nor any fertilisers, since 1929. Thelots were initially weeded manually and since 1967, herbicides aresed to prevent weeds growth. Thus, the SOM of this soil was con-idered as a good surrogate for stable SOM (Balabane and Plante,004; Barré et al., 2010). Soil pH was 4.4 (distilled water: soil = 1),ith a C content of 5.6 ± 0.33 mg C g−1 dried soil and a total-N con-
ent of 0.6 ± 0.05 mg g−1 dried soil. The C:N ratio mean value was.4. The second soil is an agricultural soil from the “Closeaux” exper-
mental site, thereafter called arable soil. In this paper, we usedhree plots which have always been under a C3 plants rotation, andince 1993 under a wheat monoculture. The soil had a pH of 6.8distilled water: soil = 1), a C content of 14.5 ± 0.5 mg g−1 dried soilnd a total-N content of 1.2 ± 0. mg g−1 dried soil. The C:N ratioean value was 11.9.Soils were sampled in the 0–20 cm horizon in April 2008, in
hree replicate bare fallow plots (plot nos. 22, 30, 34) and threeropped soil plots (plot nos. 5, 7, 15). In each plot, we sampledoil in three spots with a cylindrical auger and then pooled theores to obtain approximately 1 kg of moist soil. For the arableoil, we sampled between the wheat rows. Samples were imme-iately stored at 4 ◦C before use. Then, samples were sieved moist<2 mm), homogenised and pre-incubated during one week atmbient temperature before experiments. Field replicates weresed as incubation replicates, then resulting in triplicate incuba-ions per soil. Unfortunately, a C4 (maize) contamination in one ofhe arable plot samples forced us to discard the results from theorresponding incubations and then to use only two replicates forll the treatments using the arable soil.
.2. ı13C-fresh organic matter
Two types of FOM were used in this experiment. First wesed a wheat straw (INRA Laon, France) previously describedy Gaillard et al. (2003). The C concentration was 440.3 mg g−1
nd the N concentration was 4.52 mg g−1 leading to C:N ratioalue of 98. The 13�C-straw value was 1854.7‰ (i.e. isotopic
bundance A = 0.03208). The second FOM type was 13C-cellulosextracted from uniformly 13C-labelled wheat straw (INRA Laon,rance) according to Wise (1944). The final C concentrationas 400.8 mg g−1 and the 13�C-cellulose = 1850.6‰ (i.e. isotopicEcology 51 (2011) 87– 93
abundance A = 0.03203). Both substrates were available as groundpowders.
2.3. Experimental unit
Experimental units consisted of 20 g of soil remoistened to a finalmatric potential of −0.032 MPa (pF = 2.5) with deionised water,and placed into a 120 ml flask subsequently sealed with a septum.Experimental units were separated into five batches for each soil.In the first batch, 0.5 g 13C-cellulose kg−1 of dried soil was added(thereafter called 0.05% cellulose treatment). In the second batch5 g 13C-cellulose kg−1 of soil was added (thereafter called 0.5% cel-lulose treatment). In the third batch, 0.5 g 13C-straw kg−1 of driedsoil were amended (thereafter called 0.05% straw treatment). Inthe fourth batch 5 g 13C-straw kg−1 of dried soil were amended(thereafter called 0.5% straw treatment). The fifth batch consistedof a control without amendment. For each amendment, FOM weregently mixed and homogenized. Moisture was controlled by peri-odically weighing the flasks and comparing with the weight at thebeginning of the experiment. Moisture was kept constant duringthe experiment for all batches by adding deionised water whenneeded. Flasks were incubated during 209 days at 20 ◦C. Each incu-bation replicate corresponded to a field replicate (3× for the barefallow and 2× for the arable soil as explained previously).
2.4. Measurements of CO2 concentration and ı13C
The organic matter mineralization was monitored by measuringthe CO2 and the �13C–CO2 in flasks’ headspace at days 1, 3, 6, 14,21, 30, 37, 48, 64, 84, 155 and 209. The CO2 concentration (ppm)was determined with a MICROGC (Agilent, Santa Clara, USA) andcarbon isotope ratios were measured by using an automatic unitthat combined a Gas Chromatograph 5890 GC (Hewlett-Packard,Palo Alto, CA, USA) coupled to an isotope ratio mass spectrom-eter (Isochrom III, Micromass-GVI Optima) equipped with a 3-mfull column filled with a Prorapak QS stationary phase (80–100mesh). After each CO2 measurement, all flasks were flushed withreconstituted, moistened and CO2 free-air. At the beginning of theexperiment, the flask’s atmosphere was without CO2.
2.5. Quantification of FOM mineralization
FOM mineralization was calculated by comparing the amountof 13CO2 in samples with FOM to the amount of 13CO2 in controltreatments. FOM mineralization was calculated according to thefollowing equation:
FOM mineralization = (1 − ˛) × Qsample
where Q is the amount of CO2 in the flask’s atmosphere in mgCO2–C kg−1 dried soil, and
= AFOM − Asample
AFOM − Acontrol
where AFOM, Asample and Acontrol represent the isotopic abundanceof FOM, of CO2 in the atmosphere of sample and of CO2 in theatmosphere of the control experiment, respectively.
2.6. Microbial biomass and metabolic profiles
Microbial biomass was determined after sampling the soilsby fumigation-extraction (Vance et al., 1987). For each field
replicate, 2 g of preincubated soil was shaken for 1 h with 4 mlof 30 mM K2SO4 (non-fumigated sample) while another 2 g wasexposed to ethanol-free chloroform for one night (16 h) before itwas shaken with K2SO4. Then, the K2SO4 extracts were lyophilized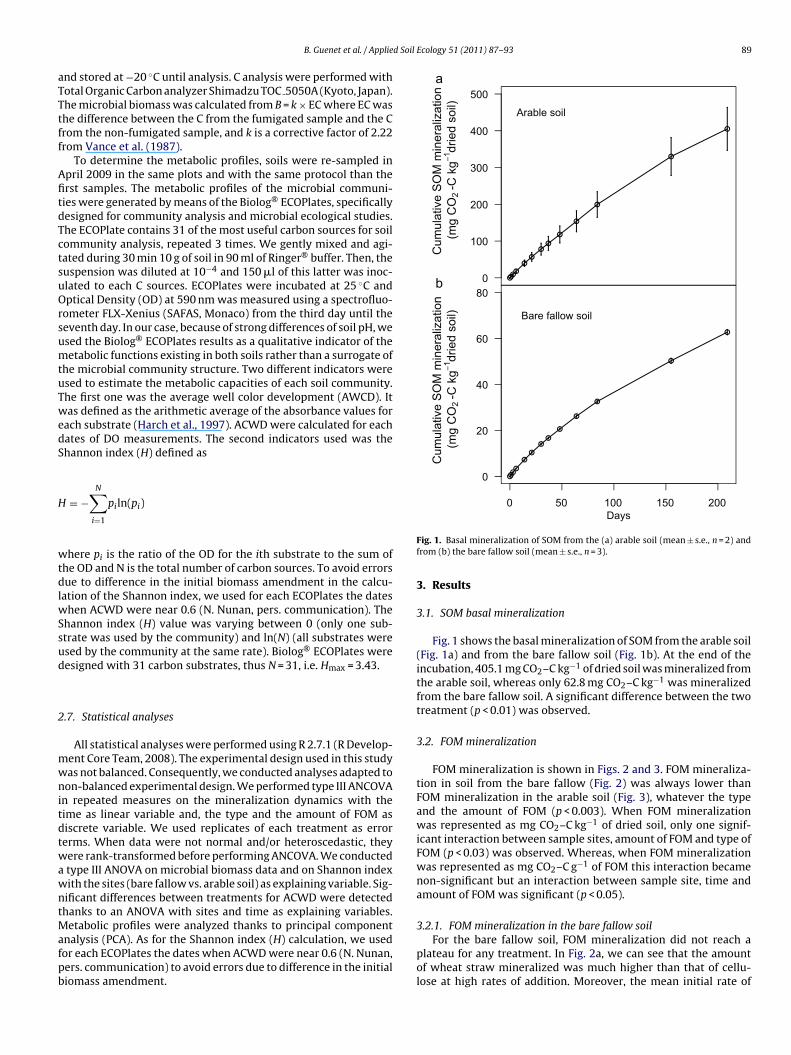
d Soil Ecology 51 (2011) 87– 93 89
aTTtff
AfitdTctsuOrsumtuTwedS
H
wtdlwSsud
2
mwnitdtwawntMafpb
0
100
200
300
400
500
Cum
ulat
ive
SO
M m
iner
aliz
atio
n(m
g C
O2
-C k
g1 d
ried
soil)
a
Arable soil
0 50 100 150 200
0
20
40
60
80
Cum
ulat
ive
SO
M m
iner
aliz
atio
n(m
g C
O2
-C k
g1 d
ried
soil)
Days
b
Bare fallow soil
B. Guenet et al. / Applie
nd stored at −20 ◦C until analysis. C analysis were performed withotal Organic Carbon analyzer Shimadzu TOC 5050A (Kyoto, Japan).he microbial biomass was calculated from B = k × EC where EC washe difference between the C from the fumigated sample and the Crom the non-fumigated sample, and k is a corrective factor of 2.22rom Vance et al. (1987).
To determine the metabolic profiles, soils were re-sampled inpril 2009 in the same plots and with the same protocol than therst samples. The metabolic profiles of the microbial communi-ies were generated by means of the Biolog® ECOPlates, specificallyesigned for community analysis and microbial ecological studies.he ECOPlate contains 31 of the most useful carbon sources for soilommunity analysis, repeated 3 times. We gently mixed and agi-ated during 30 min 10 g of soil in 90 ml of Ringer® buffer. Then, theuspension was diluted at 10−4 and 150 �l of this latter was inoc-lated to each C sources. ECOPlates were incubated at 25 ◦C andptical Density (OD) at 590 nm was measured using a spectrofluo-
ometer FLX-Xenius (SAFAS, Monaco) from the third day until theeventh day. In our case, because of strong differences of soil pH, wesed the Biolog® ECOPlates results as a qualitative indicator of theetabolic functions existing in both soils rather than a surrogate of
he microbial community structure. Two different indicators weresed to estimate the metabolic capacities of each soil community.he first one was the average well color development (AWCD). Itas defined as the arithmetic average of the absorbance values for
ach substrate (Harch et al., 1997). ACWD were calculated for eachates of DO measurements. The second indicators used was thehannon index (H) defined as
= −N∑
i=1
piln(pi)
here pi is the ratio of the OD for the ith substrate to the sum ofhe OD and N is the total number of carbon sources. To avoid errorsue to difference in the initial biomass amendment in the calcu-
ation of the Shannon index, we used for each ECOPlates the dateshen ACWD were near 0.6 (N. Nunan, pers. communication). The
hannon index (H) value was varying between 0 (only one sub-trate was used by the community) and ln(N) (all substrates weresed by the community at the same rate). Biolog® ECOPlates wereesigned with 31 carbon substrates, thus N = 31, i.e. Hmax = 3.43.
.7. Statistical analyses
All statistical analyses were performed using R 2.7.1 (R Develop-ent Core Team, 2008). The experimental design used in this studyas not balanced. Consequently, we conducted analyses adapted toon-balanced experimental design. We performed type III ANCOVA
n repeated measures on the mineralization dynamics with theime as linear variable and, the type and the amount of FOM asiscrete variable. We used replicates of each treatment as errorerms. When data were not normal and/or heteroscedastic, theyere rank-transformed before performing ANCOVA. We conducted
type III ANOVA on microbial biomass data and on Shannon indexith the sites (bare fallow vs. arable soil) as explaining variable. Sig-ificant differences between treatments for ACWD were detectedhanks to an ANOVA with sites and time as explaining variables.
etabolic profiles were analyzed thanks to principal component
nalysis (PCA). As for the Shannon index (H) calculation, we usedor each ECOPlates the dates when ACWD were near 0.6 (N. Nunan,ers. communication) to avoid errors due to difference in the initialiomass amendment.Fig. 1. Basal mineralization of SOM from the (a) arable soil (mean ± s.e., n = 2) andfrom (b) the bare fallow soil (mean ± s.e., n = 3).
3. Results
3.1. SOM basal mineralization
Fig. 1 shows the basal mineralization of SOM from the arable soil(Fig. 1a) and from the bare fallow soil (Fig. 1b). At the end of theincubation, 405.1 mg CO2–C kg−1 of dried soil was mineralized fromthe arable soil, whereas only 62.8 mg CO2–C kg−1 was mineralizedfrom the bare fallow soil. A significant difference between the twotreatment (p < 0.01) was observed.
3.2. FOM mineralization
FOM mineralization is shown in Figs. 2 and 3. FOM mineraliza-tion in soil from the bare fallow (Fig. 2) was always lower thanFOM mineralization in the arable soil (Fig. 3), whatever the typeand the amount of FOM (p < 0.003). When FOM mineralizationwas represented as mg CO2–C kg−1 of dried soil, only one signif-icant interaction between sample sites, amount of FOM and type ofFOM (p < 0.03) was observed. Whereas, when FOM mineralizationwas represented as mg CO2–C g−1 of FOM this interaction becamenon-significant but an interaction between sample site, time andamount of FOM was significant (p < 0.05).
3.2.1. FOM mineralization in the bare fallow soil
For the bare fallow soil, FOM mineralization did not reach aplateau for any treatment. In Fig. 2a, we can see that the amountof wheat straw mineralized was much higher than that of cellu-lose at high rates of addition. Moreover, the mean initial rate of

90 B. Guenet et al. / Applied Soil Ecology 51 (2011) 87– 93
0
500
1000
1500
2000
Cum
ulat
ive
FOM
min
eral
izat
ion
(mg
CO
2-C
kg
1 drie
d so
il)
(a)
0.5% straw 0.05% straw 0.5% cellulose 0.05% cellulose
0 50 100 150 200
0
200
400
600
800
Cum
ulat
ive
FOM
min
eral
izat
ion
(mg
CO
2-C
g1 C
-FO
M)
Days
(b)
a
b
Fig. 2. Mineralization of FOM for the bare fallow soil (mean ± s.e., n = 3). Values areexpressed in mg of CO –C kg−1 of dried soil (a) and in mg of CO –C g−1 FOM (b). �,©c
malctbroo
3
motmdseo
0
500
1000
1500
2000
Cum
ulat
ive
FOM
min
eral
izat
ion
(mg
CO
2-C
kg
1 drie
d so
il)
a
0.5% straw 0.05% straw 0.5% cellulose 0.05% cellulose
0 50 100 150 200
0
200
400
600
800
Cum
ulat
ive
FOM
min
eral
izat
ion
(mg
CO
2-C
g1 C
-FO
M)
Days
b
Fig. 3. Mineralization of FOM for the arable soil (mean ± s.e., n = 2). Values are−1 −1
TSS
2 2
, �, � represent the treatments 0.5% straw, 0.05% straw, 0.5% cellulose and 0.05%ellulose respectively.
ineralization at the two levels of amendment was 2.0 ± 0.2 mgnd 0.9 ± 0.3 CO2–C kg−1 of dried soil days−1 for straw and cellu-ose respectively. In addition for the first 84 days, the treatment 0.5%ellulose induced the mineralization of the same amount of CO2 ashe treatments 0.05% cellulose and 0.05% straw. Fig. 2b showed thatetween days 84 and 155, both wheat straw and cellulose at 0.05%ates of addition were very little mineralized. Finally, despite a lackf OM input for 80 years, no lag-time for FOM mineralization wasbserved.
.2.2. FOM mineralization in the arable soilFor the soil sampled at the Closeaux site (arable soil), FOM
ineralization reached a plateau at day 84 for the low amountf FOM (0.05%). The mean initial rate of mineralization for thewo levels of amendment was 3.2 ± 0.9 (0.05%) and 7.0 ± 0.5 (0.5%)
g CO2–C kg−1 of dried soil days−1 for cellulose and straw. The
ynamics were quite similar for the two types of FOM, however,lightly more cellulose than wheat straw was mineralised at thend (+31.4%). At the low level of amendment (0.05%) and at the endf the incubation, 69.5% of the added of cellulose was mineralised,able 1oil horizon characteristics (mean, n = 3 for bare fallow soil and mean, n = 2 for arable sampling was performed in the 0–20 cm horizon.
Experimental site C content (mg kg−1) N content (mg kg−1) C:N ratio
Bare fallow soil 5.60 (0.33)a 0.60 (0.05) 9.4 (0.63)
Arable soil 14.5 (0.5) 1.20 (0.01) 11.9 (0.6)
a Numbers in parentheses are standard errors.
expressed in mg of CO2–C kg of dried soil (a) and in mg of CO2–C g FOM (b).�, ©, �, � represent the treatments 0.5% straw, 0.05% straw, 0.5% cellulose and0.05% cellulose respectively.
and 52.9% of the added wheat straw (Fig. 3b). At the high rate ofFOM addition (0.5%), no difference between cellulose and wheatstraw was observed and mineralization was much less than at thelow level of addition in proportion of the added C (Fig. 3b).
3.3. Microbial biomass and metabolic profiles
As reported in Table 1, the biomass in the arable soil was largelyand significantly higher than in the bare fallow soil (39.9 ± 5.1 mgC g−1 vs. 153.2 ± 1.5 mg C g−1 soil for the bare fallow and arablesoils respectively, p < 0.0001). We also observed differences in themetabolic patterns between the two sites (Fig. 4). The varianceobserved between the two sites was partially explained by thedifferent conditions in the two sites. Indeed, the arable soil fieldreplicates are distributed within the negative values of the secondaxis, whereas the bare fallow soil field replicates are distributed on
the positive values of the second axis. Furthermore, the distributionof the three field replicates of the arable soil within the PCA plot wasmore homogenous than for the bare fallow soil indicating a moresimilar metabolic pattern between the replicates for the arable soiloil) and Shannon index (H) calculated thanks to Biolog® ECOPlates (mean, n = 3).
13∂C pH Microbial biomass (mg C kg−1) H
−24.7 (0.1) 4.4 39.9 (5.1) 3.07 (0.08)−25.9 (0.0) 6.8 153.2 (1.5) 3.26 (0.04)

B. Guenet et al. / Applied Soil
Bare Fallow soil rep#1
Bare Fallow soil rep#2
Bare Fallow soil rep#3
Arable soil rep#3 Arable soil rep#1
Arable soil rep#2
-0,06
-0,04
-0,02
0
0,02
0,04
0,06
0,08
0,1
-0,09 -0,07 -0,05 -0,03 -0,01 0,01 0,03
Seco
nd c
ompo
nent
(28%
)
First component (32%)
Fig. 4. Principal component analysis of carbon substrate utilization patternsos
capb
nblCsitwwwimbb(istt
FEt
btained with Biolog® ECOPlates for the bare fallow and the arable soils. All carbonubstrates of the Biolog® ECOPlates were considered for this PCA.
ompared to the bare fallow soil. ACWD value was higher for therable soil at each dates compared to the bare fallow soil (Fig. 5
< 0.004) indicating that the metabolic activity of the arable soilacterial community was higher.
Surprisingly, no difference between the two soils of the Shan-on index has been observed. The Shannon index (H) value rangedetween 0 (only one substrate was used by the community) and
n(N) (all substrates were used by the community at the same rate).onsequently, the highest is the Shannon index the more sub-trates are mineralized by the microbial community. In our case,ts value was high (92% of the maximum value) suggesting that thewo bacterial communities were relatively ubiquists. This resultas expected for the arable soil but not for the bare fallow soil,hich had not received any organic matter since 1929. Moreover,e divided the Biolog® ECOPlates substrates in quartiles depend-
ng on their mineralization rates and we observed that among theost degraded substrates (belonging to the fourth quartile) by the
are fallow soil microbial community, four are also highly degradedy the arable soil microbial community. These are amino acidsasparagine and arginine), mannitol and galacturonic acid, whichs a pectin or a microbial polysaccharide monomer. Moreover, thetandard deviation calculated for the Shannon index indicated that
he bare fallow soil metabolic profile was largely more variable thanhe arable soil as suggested by PCA.4.0 4.5 5.0 5.5 6.0 6.5 7.00.0
0.5
1.0
1.5
AC
WD
Days
Arable Bare fallow
ig. 5. Evolution of the Average Color Well Development (ACWD) during the Biolog®
COPlates incubations. ©, � represent the arable soil and the bare fallow soil respec-ively.
Ecology 51 (2011) 87– 93 91
4. Discussion
The basal mineralization of the arable soil was higher than in thebare fallow soil (Fig. 1), which was due to the higher concentrationof C in the arable soil (Table 1). In addition, when SOM mineral-ization is expressed in mg CO2–C g−1 dried soil-C, the arable soilstill had a higher basal mineralization than the bare fallow soil(27.9 mg CO2–C g−1 dried soil-C vs. 11.2 mg CO2–C g−1 dried soil-C,respectively). Two hypothesis can be proposed (i) soil conditions,in particular acid pH (Table 1) that is less favourable to microbialdecomposers in the bare fallow soil and (ii) SOM of the bare fallowsoil that was very likely more stabilized than SOM from the arablesoil. Indeed, during the 80 years of treatment in the bare fallow soil,the more labile SOM has been certainly mineralized as suggestedby Rühlmann (1999) leading to a relative increase of the stabilizedC. Moreover, Barré et al. (2010) showed that the total SOM of longterm bare fallow soils (with >50 years of bare fallow) are good sur-rogates for quantifying the size of the stable, or passive pool of SOMdefined by Parton et al. (1987) in the CENTURY model. It was thecase of the long term bare fallow of the 42 plots experiments alsoused in this study.
Basal mineralization occurred without any lag time in bothsoils. It may be explained by two alternative hypothesis (i) theautochthonous microbial community has developed the enzymaticmachinery able to degrade highly stabilized OM or (ii) a smalllabile pool of OM still exists in this soil. Such a labile pool couldbe explained both by the turnover of the microbial biomass and byoccasional weeds.
The arable soil mineralized more FOM than the bare fallow soil(Figs. 2 and 3). This result was expected because FOM regularlyenters the arable soil as dead roots, litter, root exudates, etc. Fur-thermore, the microbial biomass (Table 1) and ACWD calculatedfrom the ECOPlates measurements (Fig. 5) were significantly higherin the arable soil, indicating higher metabolic activities.
At low rates of addition FOM mineralization reached a plateau,with values typical for wheat and cellulose mineralization in soilunder similar conditions (e.g., Angers and Recous, 1997; Guenetet al., 2010). However, for the high amount of FOM, no plateauwas observed, and at the end of the experiment only a third ofthe amount of FOM was mineralized. It indicates a limitation ofFOM biodegradation due to (i) a limiting element such as N (Hobbie,2005; Fog, 1988) or to (ii) a slow growth rate of the microorganismsable to degrade FOM. Because the experiment was not designed toelucidate this point, it is difficult to favour one hypothesis overanother. However, to degrade 5 g C kg−1 of soil, microorganismsneed to immobilize between 0.45 and 1.13 g Nmineral kg−1 of soil(Recous et al., 1995). In other words, the mineralization of 405 mgof C kg−1 of dried soil would require between 0.037 and 0.093 gof mineral N kg−1 of soil, which is relatively important. Conse-quently, an N limitation could likely explain why the high amountof FOM was not completely mineralized in 209 days. Moreover,we observed in the bare fallow that at high rates of additionmore straw was mineralized than cellulose. Cellulose is a N-freecompounds and more N is needed to mineralize cellulose thanstraw. This also suggests that the FOM mineralization was N lim-ited for the high amount of FOM. However, the SOM decomposersmay provided N from SOM to FOM decomposers, and acted indi-rectly on FOM decomposition (Moorhead and Sinsabaugh, 2006;Craine et al., 2007). Indeed, during the first 84 days the highamount of cellulose was mineralized at the same rate than the lowamount, suggesting a common limitation of FOM mineralization.The N availability for FOM decomposers may limit cellulose decom-
position, but the activity of SOM decomposers, mineralizing soil N,may provide the necessary N, explaining why after 84 days the highamount of cellulose was mineralized at an higher rate than the lowamount.
9 d Soil
ahmamtayretcdboFwo
f
(
(
t
2 B. Guenet et al. / Applie
In our study, the bare fallow soil microbial community wasble to mineralize straw and cellulose and at surprising relativelyigh rates. Indeed, in spite of strong differences in soil manage-ent between the two sites and in particular the absence of FOM
mendments for almost 80 years, we observed a decrease in FOMineralization of only 54% on average in the bare fallow soil at
he end of the incubation compared to the arable soil. Despite thebsence of FOM amendment in the bare fallow soil for almost 80ears, the soil seems to have kept its capacities to degrade plantesidues as suggested by the absence of lag phase on FOM min-ralization. Moreover the value of the Shannon index H, which ishe same between the two soils suggests that the both microbialommunities have the same metabolic capacities. The absence ofifference in the Shannon index calculated with Biolog GN platesetween an arable soil and a bare fallow soil has been previouslybserved by Hirsch et al. (2009). It also agrees with the study ofauci and Dick (1994) showing that even soil managed long timeith minimal C inputs had a high potential to respond to new
rganic inputs.Several assumptions may explain such strong capacities of bare
allow soil to degrade FOM:
(i) Microorganisms able to FOM mineralization in our case weresupplied with FOM, which is not supposed to be favourableto autochthonous microorganisms. However, using moleculartools Saison et al. (2006) and Innerebner et al. (2006) haveshowed that an autochthonous community out competes theexogenous community. Moreover in our case, we believe thatthis assumption was the less probable because the process ofextraction of cellulose largely sterilized this type of FOM (acidextraction and freeze-drying) and cellulose was strongly min-eralized. In addition, the Shannon index calculated from theECOPlates results indicated that the autochthonous commu-nity of the bare fallow soil was as ubiquist as the communityof the arable soil.
(ii) Autotrophic microorganisms (algae and cyanobacteria) and thefew weeds that escaped to the cleaning of soil in the bare fallowsite produced enough FOM to keep the FOM metabolic capac-ities of the soils. This hypothesis may not be totally excludedbecause in the four most degraded substrates, a pectin (galac-turonic acid) largely produced by plants was present.
iii) The metabolites of the slow degradation of stable SOM of thebare fallow soil are themselves labile and maintain a microbialcommunity able to use FOM as well as SOM. This hypothe-sis appears reasonable as the breakdown of stable SOM mayproduce small molecules.
iv) A microbial community able to use FOM as substrate hasbeen maintained thanks to the microbial turnover. We favourthis assumption because in the most degraded substrates inthe ECOPlates, there were three substrates that are impor-tant part of microbial biomass: amino acids (asparagine andarginine) and one of the most important fungal compounds(mannitol) (Glaser et al., 2004; Solomon et al., 2007). It sug-gests that the bare fallow soil microbial community easily usedmicrobial products (at least, asparagine, arginine and manni-tol) as substrates. Consequently, in spite of the absence of FOMamendment since 1929 the soil from the bare fallow could havemaintained its metabolic capacities to degrade FOM probablythanks to a microbial community growing on dead micro-bial biomass and occasional weeds. This is in accordance withHirsch et al. (2009) who observed that microbial communityof a bare fallow soil for 50 years was as diverse as that of an
arable soil.Because FOM amendment is one of the most important meano restore highly degraded soils (Ros et al., 2003a,b; Bastida et al.,
Ecology 51 (2011) 87– 93
2009), the conservation of metabolic capacities of FOM degradationis an important requirement in the process of restoration. Shouldwe use only the intrinsic metabolic capacities of a degraded soilto restore it, or should we inoculate microorganisms to optimizethe restoration process? Our results suggest that a highly degradedsoil still keeps its metabolic capacities to degrade FOM even after 80years without OM inputs. We suggest that these metabolic capaci-ties are mainly maintained thanks to the production of a marginallabile pool due to microbial turnover, resulting in a more or lesspermanent flow of FOM, even at a low rate.
Acknowledgements
The authors thank the INRA (Unité de Science du Sol and thenPessac) for maintaining the historical experiment of the 42 plots.This work was financed by an EC2CO INSU program. BertrandGuenet was supported by R2DS network.
References
Angers, D., Recous, S., 1997. Decomposition of wheat straw and rye in soil as affectedby particle size. Plant Soil 189, 197–203.
Balabane, M., Plante, A.F., 2004. Aggregation and carbon storage in silty soil usingphysical fractionation techniques. Eur. J. Soil Sci. 55, 415–427.
Barré, P., Eglin, T., Christensen, B.T., Ciais, P., Houot, S., Kätterer, T., van Oort, F.,Peylin, P., Poulton, P.R., Romanenkov, V., Chenu, C., 2010. Long-term bare fallowexperiments offer new opportunities for the quantification and the study ofstable carbon in soil. Biogeosciences 7, 4887–4917.
Barzegar, A.R., Yousefi, A., Daryashenas, A., 2002. The effect of addition of differentamounts and types of organic materials on soil physical properties and yield ofwheat. Plant Soil 247, 295–301.
Bastida, F., Moreno, J.L., Hernandez, T., Garcia, C., 2007. The long-term effects of themanagement of a forest soil on its carbon content microbial biomass and activityunder a semi-arid climate. Appl. Soil Ecol. 37, 53–62.
Bastida, F., Perez-de-Mora, A., Babic, K., Hai, K., Hai, B., Hernandez, T., Garcia, C.,Schloter, M., 2009. Role of amendments on N cycling in Mediterranean aban-doned semiarid soils. Appl. Soil Ecol. 41, 195–205.
Bernard, L., Mougel, C., Maron, P.A., Nowak, V., Lévêque, J., Henault, C., Haichar, F.E.Z.,Berge, O., Marol, C., Balesdent, J., Gibiat, F., Lemanceau, P., Ranjard, L., 2007.Dynamics and identification of soil microbial populations actively assimilat-ing carbon from 13C-labelled wheat residue as estimated by DNA- and RNA-SIPtechniques. Environ. Microbiol. 9, 752–764.
Craine, J.M., Morrow, C., Fierer, N., 2007. Microbial nitrogen limitation increasesdecomposition. Ecology 88, 2105–2113.
Fauci, M.F., Dick, R.P., 1994. Soil microbial dynamics: short and long term effects ofinorganic and organic nitrogen. Soil Sci. Soc. Am. J. 58, 801–806.
Fog, K., 1988. The effect of added nitrogen on the rate of decomposition of organicmatter. Biol. Rev. 63, 433–462.
Gaillard, V., Chenu, C., Recous, S., 2003. Carbon mineralisation in soil adjacent toplant residues of contrasting biochemical quality. Soil Biol. Biochem. 35, 93–99.
Glaser, B., Turrión, M.B., Alef, K., 2004. Amino sugars and muramic acid–biomarkersfor soil microbial community structure analysis. Soil Biol. Biochem. 36, 399–407.
Guenet, B., Neill, C., Bardoux, G., Abbadie, L., 2010. Is there a linear relationshipbetween priming effect intensity and the amount of organic matter input? Appl.Soil Ecol., doi:10.1016/j.apsoil.2010.09.006.
Harch, B.D., Correll, R.L., Meech, W., Kirkby, C.A., Pankhurst, C.E., 1997. Using theGini coefficient with BIOLOG substrate utilisation data to provide an alternativequantitative measure for comparing bacterial soil communities. J. Microbiol.Methods 30, 91–101.
Hirsch, P.R., Gilliam, L.M., Sohi, S.P., Williams, J.K., Clark, I.M., Murray, P.J., 2009.Starving the soil of plant input for 50 years reduces abundance but not diversityof soil bacterial communities. Soil Biol. Biochem. 41, 2021–2024.
Hobbie, S.E., 2005. Contrasting effects of substrate and fertilizer nitrogen on the earlystages of litter decomposition. Ecosystems 8, 644–656.
Innerebner, G., Knapp, B., Vasara, T., Romantschuk, M., Insam, H., 2006. Traceabilityof ammonia-oxidizing bacteria in compost-treated soils. Soil Biol. Biochem. 38,1092–1100.
Lal, R., 2000. Soil management in the developing countries. Soil Sci. 165, 57–72.Moorhead, D.L., Sinsabaugh, R.L., 2006. A theoretical model of litter decay and micro-
bial interaction. Ecol. Monogr. 76, 151–174.Parton, W.J., Schimel, D.S., Cole, C.V., Ojima, D.S., 1987. Analysis of actors control-
ling soil organic matter levels in Great Plains grasslands. Soil Sci. Soc. Am. J. 51,1173–1179.
Pascual, J.A., Garcia, C., Hernandez, T., Moreno, J.L., Ros, M., 2000. Soil microbial activ-ity as a biomarker of degradation and remediation processes. Soil Biol. Biochem.32, 1877–1883.
Recous, S., Robin, D., Darwis, D., Mary, B., 1995. Soil inorganic N availability: effecton maize residue composition. Soil Biol. Biochem. 27, 1529–1538.

d Soil
R
R
R
R
S
degradation in the rainforest region of Madagascar. Agric. Ecosyst. Environ. 119,
B. Guenet et al. / Applie
oman, R., Fortun, C., Garcia Lopez de Sa, M.E., Almendros, G., 2003. Successful soilremediation and reforestoration of a calcic regosol amended with compostedurban waste. Arid Land Res. Manage. 17, 297–311.
os, M., Hernandez, M.T., Garcia, C., 2003a. Bioremediation of soil degraded bysewage sludge: effects on soil properties and erosion losses. Environ. Manage.31, 741–747.
os, M., Hernandez, M.T., Garcia, C., 2003b. Soil microbial activity after restoration
of a semi arid soil by organic amendment. Soil Biol. Biochem. 35, 463–469.ühlmann, J., 1999. A new approach to estimating the pool of stable organic matterin soil using data from long-term field experiments. Plant Soil 213, 149–160.
aison, C., Degrange, V., Oliver, R., Millard, P., Commeaux, C., Montange, D., Le Roux,X., 2006. Alteration and resilience of the soil microbial community following
Ecology 51 (2011) 87– 93 93
compost amendment: effects of compost level and compost-borne microbialcommunity. Environ. Microbiol. 8, 247–257.
Solomon, P.S., Waters, O.D.C., Oliver, R.P., 2007. Decoding the mannitol enigma infilamentous fungi. Trends Microbiol. 15, 257–262.
Styger, E., Rakotondramasy, H.M., Pfeffer, M.J., Fernandes, E.C.M., Bates, D.M., 2007.Influence of slash-and-burn farming practices on fallow succession and land
257–269.Vance, E.D., Brookes, P.C., Jenkinson, D.S., 1987. An extraction method for measuring
soil microbial biomass C. Soil Biol. Biochem. 19, 703–707.Wise, L.E., 1944. Wood Chemistry. Reinhold, Washington.