Scoping study on Institutional Arrangements & Capacities ...
Upload
khangminh22Category
view
1download
0
5761P25/FICHT-9661890-v2
Final Report October 2012
Study on Incentives to Build Power Generation Capacities Outside the EU for Electricity Supply of the EU
FINAL REPORT


5761P25/FICHT-9661890-v2 I
Table of Contents
1. Executive Summary 1-1
1.1 Background and Objective 1-1
1.2 Demand for New Power Generation Capacities up to 2020 1-1
1.3 Applied Methodology 1-2
1.4 Overview of Results of Fossil-Fired Power Plant Options 1-4
1.5 Outcome of the Investigations of Renewable Energy and CDM Projects 1-7
1.6 Double Counting and Carbon Leakage Effect from Electricity Imports
into the EU 1-8
2. Introduction 2-1
2.1 Structure of the Study 2-2
2.2 Analysed Countries 2-3
3. New Power Plant Capacity Needs 3-1
3.1 Data Sources 3-2
3.2 Electricity Demand Assessment 3-6
3.2.1 North East European countries 3-8
3.2.2 South East European countries 3-9
3.2.3 Mediterranean countries 3-11
3.2.4 Summary: Electricity demand assessment 3-11
3.3 Electricity Supply Assessment 3-13
3.3.1 Structure of existing power plants 3-13
3.3.2 Development of power plant capacities 3-31
3.3.3 Development of electricity generation 3-43
3.4 Need for Investments in New Power Capacities 3-59
3.4.1 Need for new power plant capacities derived from [EU Trends]
and [EURPROG] 3-60
3.4.2 Scenario for new power plant capacity requirements 3-62
3.5 Conclusions on Power Plant Capacity Needs 3-67
4. The Decision Making Model 4-1
4.1 Characteristics of Electricity Markets and Electricity Price Settings 4-1
4.2 Investment Decision Factors 4-6
4.2.1 Economic decision factors for investment 4-6
4.2.2 Non-tangible decision factors 4-13

5761P25/FICHT-9661890-v2 II
4.2.3 Appraisal of capital investment under uncertainty 4-15
4.2.4 Usual level of return on investment - weighted average costs of
capital 4-16
4.2.5 Hedging strategies for new power generation plants 4-17
4.2.6 Technical preconditions and risks 4-18
4.2.7 Regulatory environment in EU member states 4-28
4.2.8 Regulatory environment in non-EU countries 4-38
4.3 The Decision Making Model 4-50
4.3.1 General assumptions 4-50
4.3.2 Levelized electricity costs 4-52
4.3.3 The structure of the decision making model 4-53
4.3.4 Decision tree for non-monetary tangible factors and risks 4-56
4.4 Conclusions 4-59
5. Analysis of Investment Decisions in EU Countries 5-1
5.1 Scenarios 5-1
5.1.1 CO2 prices 5-3
5.1.2 Fossil fuel prices 5-4
5.1.3 Levelized scenario prices 5-8
5.2 Change from 2nd to 3rd Emission Trading Period 5-9
5.2.1 Free allocations of certificates in the second ETS period 5-9
5.2.2 Microeconomic effects from change to full auctioning 5-11
5.3 Levelized Costs of Electricity with Full Auctioning 5-15
5.4 Conclusions 5-25
6. Non-EU Power Plant Investment Options in Competition to the EU 6-1
6.1 Application of the Decision Tree 6-1
6.1.1 Transmission options for electricity import into the EU 6-1
6.1.2 Fuel Availability for New Power Plants 6-12
6.1.3 Political and regulatory constraints in non-EU countries 6-13
6.2 Identification and Quantification of Country-Specific Conditions 6-14
6.2.1 Consideration of country risks 6-14
6.2.2 Influence of transmission costs on the viability of the investment 6-17
6.3 Prospects for Investments outside the EU 6-19
6.3.1 Competitive advantage provided by avoided carbon cost 6-19
6.3.2 Competitive advantage provided by marginal cost 6-21

5761P25/FICHT-9661890-v2 III
6.4 Presentation and discussion of the country specific results 6-22
6.4.1 Underlying country-specific assumptions 6-26
6.4.2 Scenario comparison 6-28
6.4.3 List of most promising investment prospects 6-33
7. Renewable Energy and CDM Projects 7-1
7.1 Differences between Fossil and Renewable Energy Projects 7-1
7.2 Increased CO2 emissions from CDM projects? 7-3
7.2.1 CDM regulations 7-3
7.2.2 Qualification of REN projects for CDM 7-6
7.2.3 Double counting effect from CDM projects 7-8
7.2.4 Electricity import into the EU and its impact on overall CO2
emissions 7-9
8. List and Scale of Known Investments 8-1
8.1 Coal-fired Power Plant in Albania to Supply Italy with Electricity 8-1
8.2 Hard Coal PP in Belarus for Exporting Electricity to Poland 8-2
8.3 Italian Tunisian Power Plant Project ELMED 8-3
8.4 Conclusions 8-4
9. References 9-1
10. Glossary 10-1
11. Annex 11-1
11.1 Annex I: Levelized CO2 Prices 11-1
11.2 Annex II: Levelized Fuel Prices 11-2
11.3 Annex III: Levelized CO2 Costs of Electricity 11-3
11.4 Annex IV: Levelized Fuel Costs of Electricity 11-4
11.5 Annex V: Results for the power plant investment competition between
EU and non-EU countries 11-5
5761P25/FICHT-9661890-v2 IV
List of Figures Figure 1: Overview of EU country clustering and potential electricity import
options from non-EU countries 2-5 Figure 2: Electricity demand in 2010 according to different data sources 3-7 Figure 3: Development of electricity demand in North East European countries 3-8 Figure 4: Development of electricity demand in South East European countries 3-10
Figure 5: Development of electricity demand in Mediterranean countries 3-11 Figure 6: Development of electricity demand in total for the selected EU countries 3-12 Figure 7: Age structure of existing power plants in Estonia 3-14 Figure 8: Age structure of existing power plants in Finland 3-15 Figure 9: Age structure of existing power plants in Latvia 3-15
Figure 10: Age structure of existing power plants in Lithuania 3-16 Figure 11: Age structure of existing power plants in Poland 3-16
Figure 12: Age structure of existing power plants in the Slovak Republic 3-17
Figure 13: Capacity retirements in North East European countries 3-18 Figure 14: Capacity retirements in North East European countries 3-20 Figure 15: Age structure of existing power plants in Bulgaria 3-21 Figure 16: Age structure of existing power plants in Greece 3-21
Figure 17: Age structure of existing power plants in Hungary 3-22 Figure 18: Age structure of existing power plants in Romania 3-22
Figure 19: Age structure of existing power plants in Slovenia 3-23 Figure 20: Capacity retirements in South East European countries 3-24 Figure 21: Capacity retirements in South East European countries 3-25
Figure 22: Age structure of existing power plants in Italy 3-26 Figure 23: Age structure of existing power plants in Spain 3-26
Figure 24: Capacity retirements in Mediterranean countries 3-27
Figure 25: Capacity retirements in Mediterranean countries 3-28
Figure 26: Capacity retirements in all selected EU countries 3-29 Figure 27: Capacity development in Estonia 3-31 Figure 28: Capacity development in Finland 3-32
Figure 29: Capacity development in Latvia 3-32 Figure 30: Capacity development in Lithuania 3-32
Figure 31: Capacity development in Poland 3-33 Figure 32: Capacity development in the Slovak Republic 3-33 Figure 33: Capacity development by fuel type in North East European countries 3-34
Figure 34: Capacity development in Bulgaria 3-35 Figure 35: Capacity development in Greece 3-35 Figure 36: Capacity development in Hungary 3-36 Figure 37: Capacity development in Romania 3-36 Figure 38: Capacity development in Slovenia 3-36
Figure 39: Capacity by fuel type in South East European countries 3-38 Figure 40: Capacity development in Italy 3-39
Figure 41: Capacity development in Spain 3-39 Figure 42: Capacity by fuel type in Mediterranean countries 3-40
Figure 43: Capacity by fuel type in all selected European countries 3-41 Figure 44: Electricity generation development in Estonia 3-43 Figure 45: Electricity generation development in Finland 3-44 Figure 46: Electricity generation development in Latvia 3-44 Figure 47: Electricity generation development in Lithuania 3-44

5761P25/FICHT-9661890-v2 V
Figure 48: Electricity generation development in Poland 3-45
Figure 49: Electricity generation development in the Slovak Republic 3-45 Figure 50: Electricity generation 2010 in North East European countries 3-47 Figure 51: Electricity generation development in North East European countries 3-48 Figure 52: Electricity generation development in Bulgaria 3-49 Figure 53: Electricity generation development in Greece 3-49
Figure 54: Electricity generation development in Hungary 3-50 Figure 55: Electricity generation development in Romania 3-50 Figure 56: Electricity generation development in Slovenia 3-50 Figure 57: Electricity generation 2010 in South East European countries 3-52 Figure 58: Electricity generation development in South East European countries 3-54
Figure 59: Electricity generation development in Italy 3-54 Figure 60: Electricity generation development in Spain 3-55 Figure 61: Electricity generation in 2010 in Mediterranean countries 3-55
Figure 62: Electricity generation development in Mediterranean countries 3-56 Figure 63: Electricity generation development in all selected EU countries 3-58 Figure 64: Need for new power plant capacities by country: [EU Trends] Scenario 3-60 Figure 65: Need for new power plant capacities by country: [EURPROG] Scenario 3-60
Figure 66: New power plant capacities up to 2020 in North East European countries 3-64 Figure 67: New power plant capacities up to 2020 in South East European countries 3-64
Figure 68 : New power plant capacities up to 2020 in Mediterranean countries 3-65 Figure 69: New power plant capacities up to 2020 by country cluster 3-66 Figure 70: Market clearing at power exchange auction (from [UPC]) 4-4
Figure 71: Merit order curves for Spain from 2003 to 2005 (from [LE]) 4-4 Figure 72: Indexed fossil fuel prices 4-6
Figure 73: Freight rates for coal 4-7 Figure 74: Example of portfolio management 4-11 Figure 75: Simplified heat flow diagram of a steam power plant 4-19
Figure 76: Simplified heat flow diagram of a CCGT power plant 4-20 Figure 77: Overview of ENTSO-E RG CE (Former UCTE) and IPS/UPS
synchronous zones 4-24
Figure 78: IPS/UPS system synchronous zone 4-26 Figure 79: Map of the Contractual Parties of the EEC 4-39 Figure 80: Structure of the decision making model 4-54 Figure 81: CO2 prices in the three scenarios (for derivation cf. description above) 5-3 Figure 82: Natural gas price development for the three scenarios 5-5
Figure 83: Coal price development for the three scenarios 5-5 Figure 84: Fuel prices for power plants in 2010 in €(2010) / MWht, NCV 5-7 Figure 85: Cost breakdown of electricity generation costs for lignite power plant
in Hungary (Scenario C) 5-17 Figure 86: Cost breakdown of electricity generation costs for hard coal power plant
in Hungary (Scenario C) 5-17 Figure 87: Cost breakdown of electricity generation costs for CCGT (base load)
in Hungary (Scenario C) 5-18 Figure 88: Composition of levelized electricity costs in Scenario A 5-22 Figure 89: Composition of levelized electricity costs in Scenario B 5-23 Figure 90: Composition of levelized electricity costs in Scenario C 5-24 Figure 91: Benefit of avoided CO2 cost minus transmission cost 6-18 Figure 92: Rate of return on equity vs. discount rate 6-21 Figure 93: Relative competitiveness of most relevant investment options 6-37

5761P25/FICHT-9661890-v2 I
List of Tables Table 1: EU countries and their potentially electricity supplying non-EU neighbours ... 2-5 Table 2: Characterisation of data sources used for this report ......................................... 3-5 Table 3: Development of electricity demand in North East European countries ............. 3-9 Table 4: Development of electricity demand in South East European countries ........... 3-10 Table 5: Development of electricity demand in Mediterranean countries ..................... 3-11
Table 6: Development of electricity demand in total for the selected EU countries ..... 3-12 Table 7: Technical lifetimes of power plants by fuel type ............................................. 3-13 Table 8: Capacity retirements in North East European countries .................................. 3-19 Table 9: Capacity retirements by fuel type in North East European countries .............. 3-19 Table 10: Capacity retirements in South East European countries .................................. 3-24
Table 11: Capacity retirements by fuel type in South East European countries .............. 3-25 Table 12: Capacity retirements in Mediterranean countries ............................................ 3-27
Table 13: Capacity retirements by fuel type in Mediterranean countries ........................ 3-28
Table 14: Capacity retirements in all selected EU countries ........................................... 3-29 Table 15: Capacity retirements by fuel type for all selected EU countries ...................... 3-30 Table 16: Capacity retirements by fuel type for all selected EU countries ...................... 3-30 Table 17: Capacity development in North East European countries ............................... 3-34
Table 18: Capacity development by fuel type in North East European countries ........... 3-35 Table 19: Capacity development in South East European countries ............................... 3-37
Table 20: Capacity development by fuel type in South East European countries ........... 3-38 Table 21: Capacity development in Mediterranean countries .......................................... 3-40 Table 22: Capacity development by fuel type in Mediterranean countries ..................... 3-41
Table 23: Capacity development in all selected European countries ............................... 3-42 Table 24: Capacity development by fuel type in all selected European countries ........... 3-42
Table 25: Electricity generation development in North East European countries ........... 3-47
Table 26: Electricity generation development by fuel type in North East European
countries ........................................................................................................... 3-48 Table 27: Electricity generation development in South East European countries ........... 3-53 Table 28: Electricity generation development by fuel type in South East European
countries ........................................................................................................... 3-53 Table 29: Electricity generation development in Mediterranean countries ..................... 3-56
Table 30: Electricity generation development by fuel type in Mediterranean countries . 3-56 Table 31: Electricity generation development in all selected EU countries .................... 3-57 Table 32: Electricity generation development by fuel type in all selected EU
countries ........................................................................................................... 3-57 Table 33: Need for new power plant capacities for the [EU Trends] Scenario ............... 3-62 Table 34: Need for new power plant capacities for the [EURPROG] Scenario .............. 3-62 Table 35: Electricity demand and new capacities up to 2020 by country cluster
shares, as derived from [EU Trends]. .............................................................. 3-66
Table 36: Example of typical weighted average cost of capital (WACC) of power
plant projects .................................................................................................... 4-17
Table 37: Typical technical parameters of steam power plants ....................................... 4-19 Table 38: Main technical parameters of CCGT power plants .......................................... 4-21
Table 39: Usually applied technology for interconnection of power systems ................. 4-23 Table 40: Emission limits for new power plants under the LCP Directive [RENA] ....... 4-29 Table 41: ELVs for new power plants from 2013 on, as required by the IE Directive ... 4-31 Table 42: World Bank emission limit standards for power plant investments ................ 4-50 Table 43: Characterisation of power plants analysed for this study ................................ 4-53

5761P25/FICHT-9661890-v2 II
Table 44: Assumed economical parameters by power plant type, ................................... 4-54
Table 45: Country-specific model inputs ......................................................................... 4-55 Table 46: Weighted average cost of capital (WACC) for all analysed countries ............ 4-56 Table 47: The scenarios used in this report and their EU Scenario counterparts ............. 5-2 Table 48: CO2 prices in the three scenarios (for derivation cf. description above) ........... 5-4 Table 49: Total GHG reduction in the EU in the three scenarios (for derivation cf.
description above) .............................................................................................. 5-4 Table 50: Fuel prices for power plants in 2010 in €(2010) / MWht, NCV ........................... 5-8 Table 51: Free allocations of certificates in the 2nd ETS period by country and
power plant (derived from [ISI]) ...................................................................... 5-10 Table 52: Certificate deficit after allocation (in%age of emissions) ................................ 5-10
Table 53: Levelized CO2 costs of electricity in the second ETS period (Scenario A) ..... 5-12 Table 54: Levelized CO2 costs of electricity in the second ETS period (Scenario B) ..... 5-12 Table 55: Levelized CO2 costs of electricity in the second ETS period (Scenario C) ..... 5-12
Table 56: CO2 costs on electricity: difference of 3rd compared to 2nd
ETS period
(Scenario A) ..................................................................................................... 5-13 Table 57: CO2 costs on electricity: difference of 3rd compared to 2
nd ETS period
(Scenario B) ..................................................................................................... 5-13
Table 58: CO2 costs on electricity: difference of 3rd compared to 2nd
ETS period
(Scenario C) ..................................................................................................... 5-13
Table 59: Electricity cost increase due to change from 2nd
to 3rd
ETS period
(Scenario A) ..................................................................................................... 5-14 Table 60: Electricity cost increase due to change from 2
nd to 3
rd ETS period
(Scenario B) ..................................................................................................... 5-14 Table 61: Electricity cost increase due to change from 2nd to 3rd ETS period
(Scenario C) ..................................................................................................... 5-14 Table 62: Levelized composite costs of electricity (Scenario A) .................................... 5-15 Table 63: Levelized composite costs of electricity (Scenario B) ..................................... 5-16
Table 64: Levelized composite costs of electricity (Scenario C) ..................................... 5-16 Table 65: Calculation of levelized costs in the model: The example of Hungary for
Scenario C ........................................................................................................ 5-19
Table 66: Marginal costs as%age of composite costs (Scenario A) ................................ 5-20 Table 67: Marginal costs as%age of composite costs (Scenario B) ................................. 5-20 Table 68: Marginal costs as%age of composite costs (Scenario C) ................................. 5-21 Table 69: Existing transmission lines between analysed EU and non-EU countries ......... 6-3 Table 70: Existing connections between Turkey and the EU ............................................ 6-5
Table 71: Potential transmission projects .......................................................................... 6-7 Table 72: Relevant transmission projects and their estimated CAPEX ............................. 6-9 Table 73: Transmission options for electricity import into the EU from new fossil
fired power plants outside the EU .................................................................... 6-10 Table 74: Non-EU countries with transmission options for electricity import into EU .. 6-11
Table 75: Transmission options for electricity import into the EU from new fossil
fuel power plants outside the EU and the associated fuel availability ............. 6-13
Table 76: Rating classes ................................................................................................... 6-15 Table 77: Country risk premiums by rating class ............................................................ 6-16 Table 78: Power transmission cost vs. avoided CO2 cost ................................................ 6-18 Table 79: Influence of CO2 cost on levelized electricity cost, Scenario A ...................... 6-20 Table 80: Influence of CO2 cost on levelized electricity cost, Scenario B ...................... 6-20 Table 81: Influence of CO2 cost on levelized electricity cost, Scenario C ...................... 6-20 Table 82: Share of marginal costs in total electricity generation cost, Scenario A ......... 6-21

5761P25/FICHT-9661890-v2 III
Table 83: Share of marginal costs in total electricity generation cost, Scenario b .......... 6-22
Table 84: Share of marginal costs in total electricity generation cost, Scenario C .......... 6-22 Table 85: Main results from the decision making model for competing power plant
investments between Italy and Tunisia ............................................................ 6-25 Table 86: Transmission options with associated specific transmission CAPEX and
fuel prices in non-EU countries in 2010 .......................................................... 6-27
Table 87: Country-specific model inputs for non-EU countries ...................................... 6-28 Table 88: Competing base load power plants, Scenario A .............................................. 6-29 Table 89: Competing intermediate load power plants, Scenario A ................................. 6-29 Table 90: Competing of peak load power plants, Scenario A .......................................... 6-29 Table 91: Competing of base load power plants, Scenario B .......................................... 6-30
Table 92: Competing of intermediate load power plants, Scenario B ............................. 6-30 Table 93: Competing of peak load power plants, Scenario B .......................................... 6-30 Table 94: Competing of base load power plants, Scenario C .......................................... 6-31
Table 95: Competing of intermediate load power plants, Scenario C ............................. 6-31 Table 96: Competing of peak load power plants, Scenario C .......................................... 6-31 Table 97: Base Load: List of investment options and their break even WACCs ............ 6-34 Table 98: Intermediate Load: List of investment options and their break even
WACCs ............................................................................................................ 6-35 Table 99: Peak Load: List of investment options and their breakeven WACCs ............. 6-36
Table 100: Cost implications renewable power and combinations of renewable and
fossil power ........................................................................................................ 7-2 Table 101: Number of projects and certified emission reductions of renewable energy
power plants registered or in process between 1 January 2011 and 31
August 2012 ....................................................................................................... 7-5
Table 102: Ongoing, planned and potential investments in new power plants for
electricity import into the EU ............................................................................ 8-1

5761P25/FICHT-9661890-v2 1-1
1. Executive Summary
1.1 Background and Objective
This report analyses the prospects for investments in power plants outside
the EU dedicated to supplying the electricity they generate to the EU. Under
the 3rd
Emissions Trading Scheme (ETS), all CO2 emission rights for new
power plants installed within the EU will have to be auctioned. In contrast,
for power plants outside the EU there are no costs for these rights. This
provides a competitive advantage and opportunities for higher returns for
power plant projects in countries bordering the EU.
The general objective of this study is therefore to analyse the impact of full
auctioning on the investment decisions of power generators facing the
option to invest inside or outside the EU. It will also clarify possible
incentives to invest in projects under the UN CDM scheme outside of the
EU to supply electricity generated from renewable energy sources into the
EU. The question is whether electricity imported into the EU from fossil as
well as renewable energy resources may cause globally increased CO2
emissions. Unless stated otherwise, all of the following investigations apply
only for new power plants to be built within the time frame of the 3rd ETS,
i.e. up to 2020.
The analysis is prepared specifically for those EU member states that either
already have electricity interexchange or at least have future electricity
interexchange options directly across borders or overseas to non-EU
countries (see table below).
EU countries and their potentially electricity supplying non-EU neighbours
1.2 Demand for New Power Generation Capacities up to 2020
The need for new power plant investments up to 2020 in the selected EU
countries is determined from the gap between the projected power plant
capacities in 2020 less the already existing capacities that are no yet retired
EU countries
with potential import from the following… ...non-EU countries
Bulgaria Turkey, Ukraine, Former Yugoslav Republic of Macedonia, Serbia
Estonia Russian Federation
Finland Russian Federation
Greece Libya, Egypt, Turkey, Albania, Former Yugoslav Republic of Macedonia
Hungary Ukraine, Croatia, Serbia
Italy Tunisia, Libya, Croatia, Montenegro, Albania, Bosnia-Herzegowina
Latvia Belarus, Russian Federation
Lithuania Belarus, Russian Federation
Poland Ukraine, Belarus, Russian Federation
Romania Moldova, Ukraine, Serbia, Turkey
Slovak Republic Ukraine
Slovenia Croatia
Spain Morocco, Algeria, Tunisia

5761P25/FICHT-9661890-v2 1-2
in 2020. The highest retirement rates are for coal power capacities of which
41% are due for decommissioning by 2020. Based on [EU Trends]1 it is
anticipated that new power plant needs up to 2020 total over 150 GW, with
almost 100 GW of this to be met by new renewable energy power plants.
New coal power plant investments (26 GW) focus on North East European
countries, wind power plants (50 GW) on Mediterranean countries and
natural gas-fired power plants (12 GW) on South East European countries.
Italy, Greece and Finland are the only net electricity importing countries
that are going to keep their importing status, at least until 2020. As such,
they are preferred candidates for electricity imports from outside the EU.
But as the analysis shows, in general all countries have considerable
potential for new power plant capacity investments up to 2020.
1.3 Applied Methodology
Five fossil fuel-fired power plant options are investigated pair-wise inside
and outside of EU countries, namely: a lignite power plant (base load), a
hard coal power plant (base load), two CCGTs (one for base load and one
for intermediate load) and a gas turbine (peak load).
To assess the economic viability of these options, an integrated user-friendly
model under MS Excel has been developed for this study. It calculates the
levelized electricity generation cost (LEC), including all cost categories that
an investor has to consider in his investment decision. The LEC is
calculated by summing the present value of all cost components divided by
the present value of generated electricity. All cost series are calculated in
real terms and discounted at a rate based on the weighted average cost of
capital (WACC).
The WACC is based on 30% equity and 70% borrowed capital with typical
rates for returns on equity and interest rate for bank loans. The decisive
factor for the investor is a high rate of return on equity (ROE) .This
comprises the following rates with typical values for projects in the power
supply sector:
a risk-free return rate which is identical to the bank interest rate
a venture premium which is typical for power plant investments in EU
countries
a further risk premium which is dependent on the specific investment risk
situation of the non-EU country in question.
The WACC includes also the corporate tax that is levied on the equity part
of the invested capital.
Economic and non-economic investment decision factors are analysed from
the investor’s viewpoint and are integrated into the model. The option that
has the lowest electricity generation costs of a pair, with one located in an
1 Square brackets indicate the source reference. All references are listed in section 9.

5761P25/FICHT-9661890-v2 1-3
EU country and the other in a neighbouring non-EU country, is the preferred
investment from the viewpoint of the investor.
Economic investment factors comprise mainly fuel costs and costs for
acquisition of CO2 emission allowances (“CO2 costs”), both of which are
derived from EU documents for the following three scenarios:
Scenario A: reference scenario reflecting a business as usual
development with all EU policies up to March 2010 included, i.e. also
legislation on ETS, non-ETS and renewables
Scenario B: decarbonisation scenario with -80% CO2 in 2050 compared
to 1990 in the framework of fragmented international climate action
Scenario C: decarbonisation scenario -80% CO2 in 2050 compared to
1990 in the framework of global climate action
CO2 prices in the three scenarios
Uncertainty regarding the future range of price developments is investigated
with this scenario analysis. Whereas CO2 costs tend to increase from
Scenario A to Scenario C, fuel prices tend to decrease from A to C. This is
consistent with lower global fossil fuel demand and thus lower fuel prices
with greater efforts for CO2 avoidance. Levelized fuel and CO2 costs
(levelized over the power plant lifetime) in real terms for a typical EU
country are depicted in the table below.

5761P25/FICHT-9661890-v2 1-4
Levelized fuel and CO2 costs for a typical EU country (in real terms)
It is to be noted that there are significant differences with regard to fuel
prices, corporate taxes and other financial conditions between the
considered countries in the EU and those outside that may have some
influence on the LEC. This is likewise addressed in the study.
1.4 Overview of Results of Fossil-Fired Power Plant Options
Under the assumption that the allocation rules of the 2nd
ETS period would
be applied over the whole lifetime of the power plants, investment
conditions in the ongoing 2nd
ETS period regarding emissions trading vary
greatly depending on power plant type but also on EU country. In some
countries a deficit of more than 50% of the required certificates remains
after allocation, especially for coal power plants in Slovenia, Lithuania and
Finland. On the other hand, gas turbines (GT) were effectively over-
allocated with emission rights in Lithuania, Italy and Finland.
In the 3rd
ETS period, full auctioning is the general principle applied for
new power plants. The change from the 2nd
to the 3rd
ETS phase negatively
affects combined cycle gas turbine (CCGT) plants the least. Because these,
unlike simple cycle GTs, are not losing allocation privileges, but also,
unlike coal power plants, they are not hit by high specific CO2 emissions.
Particularly if CCGTs are operated in base load, the change to the 3rd
ETS
period means that, on average over all investigated countries, only between
about 7 and 11 €/MWhe is added to their costs, depending on the scenario.
But in the extreme case, the additional costs due to the change to full
auctioning can be up to 72 €/MWhe, as is the case for gas turbines in
Lithuania under Scenario C. This gives an indication of the windfall profits
that the 2nd
ETS period released through national allocation plans.
Despite the full auctioning principle, lignite-fired power plants that emit the
most CO2 are still the most competitive base-load power plant option in the
3rd
ETS, at least in Scenario A and, for some countries, also in Scenario B
and even in C. However, in the global action decarbonisation Scenario C,
the highest CO2 prices combined with the lowest fuel prices shift the
Lignite Hard Coal CCGT CCGT GT
USC-PC USC-PC intermediate
base load base load base load load peak load
lifetime [a] 35 35 25 25 25
€ / MWht 7.19 15.32 37.20 37.78 41.54
€ / t CO2 27.47 27.47 23.61 23.61 23.61
€ / MWht 6.84 14.56 35.75 36.33 40.09
€ / t CO2 38.56 38.56 32.15 32.15 32.15
€ / MWht 5.97 12.71 33.41 33.99 37.74
€ / t CO2 44.10 44.10 35.56 35.56 35.56
discount rate real 5%
scenario A
scenario B
scenario C

5761P25/FICHT-9661890-v2 1-5
competitive advantage for base-load power plants generally towards natural
gas-fired CCGT plants.
Pair-wise comparison of investment opportunities in countries bordering the
EU is done on the basis of the levelized electricity cost, including costs for
generation and for transmission of the electricity from the power plant
outside the EU to the respective feed-in point of the high voltage grid in the
EU. In a first stage, there is some initial screening: some power plant
options of country pairs for which the power plant investment, the fuel
supply for the power plant or the electricity transmission to the EU proved
to be unfeasible have been excluded from further investigations.
Generally, among the remaining investment options, base load power plants
provide the most attractive investment options, for two reasons:
1. Levelized transmission costs are lowest for the highest annual full-
load hours.
2. Base load is the segment that is most attractive for the CO2 intensive
coal power plants and thus non-EU investments in coal power plants
can take particular advantage of avoided carbon costs.
The results of the investigation for base load investments are shown for the
reference Scenario A in the table below. The LECs are calculated with
discount rates, excluding risk premiums that are usually around the same for
the two adjacent countries. It is to be noted in this context that the return on
equity only is about double the WACC in real terms. The tables show the
levelized electricity cost (LEC) as a total as well as the included CO2 cost
(LCO2) and the levelized transmission cost (LTC) per MWh of generated
electricity. The tables also show the maximum discount rate based on the
WACC that can be achieved up to the point of LEC equality between the
power plants inside and outside the EU, i.e. up to the breakeven point.
Overview of results for Scenario A for base load electricity
The outcome of the investigations can be summarized as follows: Coal-fired
base-load power plants outside the EU possess a significant competitive
advantage due to the avoided CO2 costs. The achievable maximum rates of
Scenario A
Base Load
linkage: EU non-EU break even
existing / country power LEC LCO2 country power LEC LTC power WACC
new plant [€/MWhe] [€/MWhe] plant [€/MWhe] [€/MWhe] plant real [%]
existing BG Lignite 71.0 26.2 TR Lignite 47.4 0.4 Lignite 13.2%
existing GR Lignite 73.0 25.7 TR Lignite 47.1 0.5 Lignite 13.8%
existing HU n.a. n.a. n.a. RS n.a. n.a. n.a. n.a. n.a.
new IT Hard Coal 82.1 20.2 TN Hard Coal 69.3 9.4 CCGT 12.0%
new IT Hard Coal 82.1 20.2 ME Hard Coal 66.8 8.6 Hard Coal 9.1%
new IT Hard Coal 82.1 20.2 DZ Hard Coal 67.7 8.4 CCGT 12.8%
new IT Hard Coal 82.1 20.2 AL Hard Coal 66.6 8.3 Hard Coal 9.5%
new RO Lignite 71.4 25.9 TR Hard Coal 69.9 9.5 Hard Coal 5.5%
new RO Lignite 71.4 25.9 RS Lignite 45.7 0.5 Lignite 13.5%

5761P25/FICHT-9661890-v2 1-6
return (break-even WACCs, in real terms!) are quite high. It is to be noted,
however, that the investor can only partially exploit these higher rates in
order to achieve a competitive advantage over power plants within the EU.
Even so, the residual rate of return will still remain quite attractive
compared to what would be achievable for power plant projects within the
EU. LTCs for new connections that require converter stations and
transmission lines are quite high, but nevertheless the advantage from
avoided CO2 cost is still attractive, at least for base load. LTCs for existing
connections are almost negligible compared to the generation cost, which is
why such options have a strategic advantage and can even compete in peak
load regimes with the EU power plant alternative.
Intermediate or peak load power plants outside the EU are less, respectively
hardly attractive for investors. The reason is that levelized transmission
costs for intermediate and peak load regimes are higher due to the low
capacity factors. And also the CO2 emission costs that can be avoided with a
natural gas power plant by settling it outside the EU are lower compared to
coal power plants. Such options become relevant only if natural gas prices
are moderate (as in Maghreb countries) or if synchronized connections to
the ENTSO-E grid are available and power transmission capacities not yet
fully exploited (see Serbia and Turkey).
Scenarios B and C with higher CO2 costs provide in general higher returns,
especially for base load power plants. Over all three scenarios, six country
pairs can be highlighted as the most competitive of the non-EU versus the
EU power plant investment options:
Relative competitiveness of the most relevant investment options
Turkey-Greece
Algeria-Italy
Tunisia-Italy
Serbia-Romania
Turkey-Bulgaria
Serbia-Hungary
base load
intermediate load
peak load

5761P25/FICHT-9661890-v2 1-7
Turkey, Algeria, Tunisia and Serbia are the most promising non-EU
countries for new power plant investments that could profitably export
electricity, preferably base load power, to EU countries. Greece and Italy
and, of minor importance, also Bulgaria, Romania and Hungary may import
such electricity.
1.5 Outcome of the Investigations of Renewable Energy and CDM Projects
There are significant differences between electricity from fossil-fired power
plants and electricity from renewable energy sources. For renewable energy
projects, the characteristic of the location is the most decisive factor for site
selection. Renewable energy projects are viable at locations offering
favourable natural resources like solar radiation and wind. Usually they are
only economically viable if feed-in tariffs are sufficiently high or with other
substantial promotion, which is typically the case in EU countries but less so
outside the EU. A further important aspect is that renewable energy does not
generate CO2 emissions and no CO2 costs, irrespective of whether they are
installed outside or inside the EU. Under this aspect, there is no incentive
for investing outside the EU for importing electricity into the EU.
Additionally, transmission costs become higher with lower capacity factors
as is typically the case for renewable electricity generation.
In general, we can conclude that importing electricity generated by
renewable energy power plants in adjacent countries into the EU is currently
not an attractive option for investors. It may become attractive, though, for
large-scale solar energy projects that can exploit economies of scale for both
power generation and power transmission. In this context, the planned
DESERTEC project may be noted as a viable option for the medium term.
For the third trading period, the ETS Directive restricts the use of certified
emission reductions (CERs) from new renewable CDM projects that are
registered post-2012. However, this holds only as long as no satisfactory
international agreement on climate change is approved by the Community
or no bilateral agreement with a country is signed.
The CDM methodology of UNFCCC generally prohibits the approval of
CERs for renewable energy (REN) imports into the EU. This applies,
though, only in such cases where the REN power plant is directly and
exclusively connected to a direct power line into the European electricity
network or when the power purchase agreement of the power plant is
directly contracted with a purchaser in the European electricity system. For
other cases, i.e. with external intermediate electricity trading, indirect
granting of CERs for renewable electricity import into the EU is possible in
principle.

5761P25/FICHT-9661890-v2 1-8
1.6 Double Counting and Carbon Leakage Effect from Electricity Imports into the EU
Electricity generated by an REN CDM project that is to be supplied to the
EU increases overall global CO2 emissions. The reason is that CERs issued
for such projects could be used by installations included in the EU ETS.
Thus, within the EU, these CERs would allow for higher overall CO2
emissions on top of the ETS cap, justified as compliance with the emission
reductions achieved outside the EU. But because of import of this electricity
into the EU, the associated emission reductions are not actually achieved
outside the EU. Under the line, emission reductions are double-counted.
When added up over EU and non-EU countries, global CO2 emissions are
increased and the environmental and economic integrity of the EU ETS is
undermined.
A similar case of increased overall CO2 emissions arises if, instead of an
REN plant, a fossil fuel-fired power plant in the non-EU country transfers
its generated electricity into the EU. The imported electricity does not
reduce the overall emissions inside the EU as fixed by the overall ETS cap.
However, in the non-EU country CO2 emissions are increased without
having any further impact on the remaining electricity supply and the
remaining CO2 emissions in this country. This effect from fossil fuel-fired
electricity import is known as carbon leakage.
Each electricity import into the EU – also from existing power plants –
cannot contribute to less CO2 emissions within the EU due to the fixed ETS
cap, but could be used instead in the non-EU country to avoid other CO2
emissions from power generation. And inversely, each electricity export out
of the EU avoids power generation and usually also associated CO2
emissions outside of the EU without any impact on the EU’s own CO2
balance.

5761P25/FICHT-9661890-v2 2-1
2. Introduction
The revised EU Emission Trading Scheme (ETS) Directive stipulates that
power producers will have to buy allowances necessary to comply with the
ETS as from 2013. Contrary to the situation prevailing in the first and
second period of the ETS, the cost of emitting carbon will then turn into real
production costs for electricity producers.
While power producers in the EU will act on a level playing field, this is not
likely to be the case for power producers outside the EU not facing carbon
constraints which translate into economic and business related
considerations. As a consequence, incentives arise in countries adjacent to
the EU to invest in new power generation capacities designated to generate
electricity for export to EU member states, provided technical and
regulatory requirements allow. Such electricity could, in theory, not only
provide competitive advantages to their producers/suppliers arising from the
absence of comparable carbon constraints, but may be perceived as carbon
leakage from the production of electricity generation possibly impacting on
the stringency of the EU wide cap and undermining the objectives of the
revised EU ETS Directive.
EU member states are exposed to a different degree and in a different
manner depending on their geographical situation and their non-EU
neighbours to potential electricity imports from non-EU countries. The
electricity grid of some EU member states is very well interconnected with
non-EU countries, while interconnection of these member states with other
EU member states remains, for the time being, less developed. Others may
consider building new cross border electricity transmission lines, in order to
benefit from electricity imports generated outside the EU.
Another subject investigated in this study concerns investments in electricity
generation from renewable energy outside the EU, if
the electricity generated is to be supplied to the EU and
the country, where the investment is undertaken, is entitled to issue
Certified Emission Reduction units (CER) under the UN Clean
Development Mechanism (CDM), set up in order to stimulate, among
other things, emission reductions in countries not subject to mitigation
efforts under the Kyoto Protocol.
In such a case, the following effects could accrue to the EU ETS:
a) to the extent this electricity is supplied to the EU, the demand for
allowances is expected to decrease resulting in a lower allowance price.
Of course, the overall quantity of allowances in the EU ETS remains
unaffected.
b) CERs issued from such projects could be used by installations included
in the EU ETS for compliance. In such a case and due to the fact
described under a), emissions on top of the EU ETS cap will be offset.
As a consequence, globally more CO2 would be emitted than without the

5761P25/FICHT-9661890-v2 2-2
CDM project. From the investor's point of view, these projects may turn
out to be attractive, since additional income from the issuance and sales
of CERs could be released.
In the light of these potential consequences of the European emission
trading scheme leading to double counting or carbon leakage effects,
this study analyses the impact of full auctioning on the investment
decision of power generators facing the option to invest inside or
outside the EU with a view to supplying electricity for consumption in
the EU.
This analysis addresses in particular uncertainties in investment decision
making. Uncertainty concerns the development of power prices, carbon
prices, fuel costs and other investment decision factors. Also the regulatory
framework and the investment conditions in the various countries adjacent
to the EU are taken into account, as well as diverse electricity generation
technologies, such as those based on fossil fuels, but also those based on
renewable energy, like wind and solar.
The study provides an assessment of the economic and microeconomic
effects of full auctioning on investment decisions of power generators that
have the choice to build capacities for the supply of electricity to the EU
inside or outside the EU. Based on these findings, a list of countries with the
most attractive investment options is compiled.
The study also clarifies the incentives to invest in projects under the UN
CDM rules outside the EU, which supply electricity generated from
renewable energy sources to the EU and which would lead to double
counting of emission reductions.
2.1 Structure of the Study
In preparation for the study, EU member states are identified that have high
potential and a substantial need to invest in new power plant capacities.
These countries may attract not only power plant investments within the
country, but instead also investments in adjacent non-EU countries with the
option to import electricity into the EU country under consideration.
Thus, in Chapter 3 the need for new power plant capacities in EU member
states is determined by investigating the expected evolution of electricity
demand and supply. This is done for those particular EU countries that
either already have electricity interexchange or at least have future
electricity interexchange options across direct borders or overseas to non-
EU countries.
As a next step, the investment decision process for new electricity
generation capacity investment options is investigated. Based on the key
factors for taking investment decisions, a decision-making model is set up
and presented in Chapter 4. The model calculates the levelized costs of

5761P25/FICHT-9661890-v2 2-3
electricity in EU member states. The model is then used in Chapter 5 for
analysing investment conditions in EU member states, focusing in particular
on the impact of the change from the second to the third emission trading
scheme.
In Chapter 6, the prospects for investments in non-EU countries are
investigated in comparison with associated EU countries to which the
generated electricity shall be supplied. Relevant EU/non-EU country pairs
and their power plant investment options are identified and compared pair-
by-pair. The most promising investment prospects are ranked.
Then in Chapter 7 renewable power plants and the effect of double counting
from CDM projects are investigated. Finally, Chapter 8 introduces current,
planned and potential investments in new electricity generation capacity in
the considered non-EU countries with the aim of supplying electricity to the
EU. The Executive Summary is found in Chapter 1.
2.2 Analysed Countries
Analysis of power plant investment decisions is undertaken for the
following EU member states:
Bulgaria
Estonia
Finland
Greece
Hungary
Italy
Latvia
Lithuania
Poland
Romania
Slovak Republic
Slovenia
Spain
Common to these 13 countries is their possibility for electricity
interexchange or at least future electricity interexchange options across
direct borders or overseas to non-EU countries. Countries participating in
the European Economic Area (EEA) are not considered non-EU countries
for the purpose of this study.
In order to obtain a clear overview of the findings for individual countries,
they are classified into three clusters:

5761P25/FICHT-9661890-v2 2-4
1. North East European countries
This cluster includes six countries that have direct borders to Russia or to
other former Soviet Union states (Belarus, Ukraine) in common. These
countries are
Estonia
Finland
Latvia
Lithuania
Poland
Slovak Republic
2. South East European countries
The common characteristic of these five countries is that they have direct
borders to one or more EU enlargement country in the Western Balkan
region. Falling within this category are:
Bulgaria
Greece
Hungary
Romania
Slovenia
3. Mediterranean countries
The remaining two countries belong to this cluster. They have a
Mediterranean coast and in general have direct electricity interexchange
options only via connections overseas, either to African or to Western
Balkan countries. These countries are:
Italy
Spain
The classification of the EU countries and their general options for
electricity import from outside the EU are illustrated in Figure 1. Pairings of
EU countries and their neighbouring non-EU countries are considered. For
each country pair, the non-EU country could potentially host power plants
that are constructed with the purpose of supplying electricity to the
belonging EU country. The investigated country pairs are listed in Table 1
and are also indicated by red lines in Figure 1.

5761P25/FICHT-9661890-v2 2-5
Figure 1: Overview of EU country clustering and potential electricity import
options from non-EU countries
Table 1: EU countries and their potentially electricity supplying non-EU
neighbours
Non-EU countries
North East European countries
South East European countries
Mediterranean countries
Potential electricity import optionsPotential electricity import options
EU countries
with potential import from the following… ...non-EU countries
Bulgaria Turkey, Ukraine, Former Yugoslav Republic of Macedonia, Serbia
Estonia Russian Federation
Finland Russian Federation
Greece Libya, Egypt, Turkey, Albania, Former Yugoslav Republic of Macedonia
Hungary Ukraine, Croatia, Serbia
Italy Tunisia, Libya, Croatia, Montenegro, Albania, Bosnia-Herzegowina
Latvia Belarus, Russian Federation
Lithuania Belarus, Russian Federation
Poland Ukraine, Belarus, Russian Federation
Romania Moldova, Ukraine, Serbia, Turkey
Slovak Republic Ukraine
Slovenia Croatia
Spain Morocco, Algeria, Tunisia

5761P25/FICHT-9661890-v2 3-1
3. New Power Plant Capacity Needs
As a preparatory task for the study, the need for new power plant capacities
in EU member states is determined by investigating the expected evolution
of electricity demand and supply. This is done for those specific EU
countries that either already have electricity interexchange or at least have
future electricity interexchange options across direct borders or overseas to
non-EU countries.
Electricity demand and supply in these EU countries is analysed under the
following aspects:
Electricity demand assessment:
How will electricity demand in each of the selected countries evolve up
to 2020?
Structure of existing power plants:
What power plant capacities are installed? And what is the age of the
installed power plants? What will be the resulting power plant retirement
plan up to 2020? An analysis of these questions is undertaken for each of
the selected countries per power plant technology classified by fuel types.
Development of power plant capacities:
How could future power plant capacity evolve? This analysis concerns
the development of total capacities by fuel type for each selected country
and will include expectations on future replacement of retiring capacities
as well as expectations on capacity net additions2.
Development of electricity generation:
How much electricity generation can be expected from the power plants
in the selected countries? A comparison with electricity demand for each
country in 2020 will show whether the country will have to rely on
electricity imports or on further power plant investments to fill the gap to
demand or whether the country will not face an electricity deficit.
Needs for investments in power capacities:
What gross additions for power generation capacities are needed to
obtain the expected power plant capacities in each selected country?
With analysis of all these aspects, those countries are identified that have
high potential and the substantial need to invest in new power plant
capacities. These countries may attract not only power plant investments
within the country, but instead investments in adjacent non-EU countries
with the option to import electricity into the EU-country under
consideration.
2 ‘Capacity net additions’ should not be confused with ‘net electrical capacity’. The latter
term is defined for each power plant as its gross electrical capacity less the electrical power
required for the operation of the power plant itself. ‘Net additions’ of capacities, though,
refer to gross additions of new power plant capacities less decommissioned power plant
capacities. ‘Capacity net additions’ are therefore identical to the effective overall capacity
increase or decrease.

5761P25/FICHT-9661890-v2 3-2
3.1 Data Sources
For the demand and supply analysis of the selected EU countries, the
following data sources are used:
WEPP
The UDI World Electric Power Plants Data Base [WEPP] is a
comprehensive, global inventory of electric power generating units. It states
ownership, location, and engineering design data for power plants of all
sizes and technologies operated by regulated utilities, private power
companies, and industrial or commercial autoproducers in every country in
the world. [WEPP] is maintained and re-issued quarterly in its entirety
(including regional subsets) by the UDI Products Group of Platts, the energy
information division of The McGraw-Hill Companies, Inc. The June 2011
edition contains, for EU countries, 41,980 and for European non-EU
countries 6,293 power plant records.
EU Energy Trends
The ‘European Energy and Transport - Trends to 2030’ publication
[EU Trends] was issued by the European Commission in 2003 with updates
in 2005, 2007 and 2009. A consortium led by the National Technical
University of Athens derived scenarios from a set of E3 models (energy,
economy and environmental models) structured around the PRIMES energy
system model. These scenarios consider current trends for population and
economic development, including the recent economic downturn as well as
the highly volatile energy import price environment of recent years.
Economic decisions are driven by market forces and technology progress in
the framework of concrete national and EU policies and measures
implemented up to April 2009. This includes the European Emissions
Trading Scheme (ETS) and several energy efficiency measures. In this way,
energy scenarios for all EU countries and some adjacent countries are
calculated for the time period up to 2030.
The latest scenario described in the 2009 update of [EU Trends] is the so-
called ‘Reference Scenario’. It includes policies adopted between April
2009 and December 2009 and assumes that national targets under the
Renewables Directive [2009/28/EC] and the GHG Effort sharing decision
[2009/406/EC] will have been achieved in 2020. As such, the Reference
Scenario includes the mandatory national emission and energy targets set
for 2020 and can thus serve as a benchmark for policy scenarios with long
term targets. The Reference Scenario is therefore also used within the study
at hand. Figures for electricity consumption, generation and capacities up to
2030 are compiled for each country.
Eurprog
The ‘Power Statistics 2010’ (formerly called ‘EURPROG’) [EURPROG] is
the 38th edition of the statistical yearbook published by EURELECTRIC. It
contains referenced data from EURELECTRIC members from all 27 EU
member states for the years 1980, 1990, 2000, 2007, 2008, as well as
forecasts for 2010, 2020 and 2030. It includes information on the structure

5761P25/FICHT-9661890-v2 3-3
of the electricity industries, trends in general economic indicators, peak
demand and load management, medium and long-term generating prospects,
sectoral electricity consumption, electricity balances and fuel consumption
and emissions of the electricity sector.
The data provided in Power Statistics 2010 are based on estimates provided
by EURELECTRIC’s Network of Experts on Statistics & Prospects. The
latest issue of Power Statistics 2010 primarily contains data from 2008,
although preliminary information on 2009 is partly integrated into the
report. For this study also older issues of 2008 and 2009 are used and
compared with the latest issue. Figures for electricity demand, generation
and capacities for all selected countries for 2010 and 2020 are used for the
purpose of this study.
Eurostat
Eurostat is the statistical office of the European Union. The ‘Electricity
production and supply statistics report’ [Eurostat] was published in June
2011 and shows provisional 2010 data for electricity demand and generation
in 2010 for each EU country. Electricity generation data are not classified
by different fossil fuel types but contain an item ‘conventional thermal’
covering electricity generated from natural gas, coal and lignite.
Economist Intelligence Unit
The Economist Intelligence Unit is the in-house research unit of the
magazine ‘The Economist’. For many countries of the world, it publishes an
energy report that contains inter alia information on and scenarios for
electricity capacities and demand in those countries. For this study, reports
for different EU countries published between September 2010 and June
2011 are used [EIU], which provide estimates for the years 2009 and 2010
as well as forecasts for 2011 to 2015 and 2020. However, no reports for the
Baltic countries (Estonia, Latvia, Lithuania) and for Slovenia were
available. For the report at hand, [EIU] was used to countercheck and
compare with figures from other data sources, but none of its actual
information was used further in this report.
CIA
The ‘World Factbook’ [CIA] by the Central Intelligence Agency (CIA) of
the USA offers statistics for electricity demand and generation for 2000 to
2008 and estimates of these for 2009 and 2010. It is updated weekly. Annual
electricity generation is classified by country, but is not further broken down
by energy source and fuel type. For the report at hand, [CIA] was used to
countercheck and compare with figures from other data sources, but none of
its actual information was used further in this report.
ENTSO-E
The European Network of Transmission System Operators for Electricity
(ENTSO-E) is an association of 41 European transmission system operators
(TSOs) from 34 countries. In its ‘Statistical Database’ [ENTSO-E]
ENTSO-E provides statistical values for monthly electricity demand,
generation and installed capacities from 2010 on backwards. These data are

5761P25/FICHT-9661890-v2 3-4
used to crosscheck values of other data sources for 2010. The statistical
database is available online and was downloaded on 24 November 2011, but
no schedule of latest updates is announced.
Data source comparison
In general, the data sources that were consulted can be characterized and
compared under different aspects. The sources may contain information on
electricity demand, electricity generation and/or power capacities (cf. Table
2). Only some of them provide also data for the year 2020, which depends
on the nature of the data sources. Statistical data sources like [Eurostat] and
[CIA] do not provide predictive figures for 2020. Other sources like
[EU Trends] and [EURPROG] focus on scenarios. Their figures for 2010
are scenario-based and do not claim a strict statistical status for 2010. Other
sources like [EIU] offer estimated figures and may be regarded as having an
informational value located between statistics and scenarios.
Also the level of detail varies between the data sources, particularly with
regard to breakdowns into different electricity generating technologies and
the type of energy sources used. Some sources like [WEPP] provide full
details of the fuel types used or at least distinguish between hard coal and
lignite, such as [EURPROG]. Others like [EU Trends] only list all ‘coal’ in
total or do not distinguish natural gas and coal fuels like [Eurostat], [EIU],
[CIA] and [ENTSO-E] do.

5761P25/FICHT-9661890-v2 3-5
Table 2: Characterisation of data sources used for this report
2010 2020
Data Source Available Details of Informational value of data Demand Production Capacity Demand Production Capacity
Power Supply [GWh] [GWh] [MW] [GWh] [GWh] [MW]
[EU Trends] "Coal" in total Prediction (based from 2009) x x x x x x
[EURPROG] "Lignite", "Coal" Prediction (based from 2009) x x x x x x
[Eurostat] "Conventional thermal" Provisional (based from 2010) x x - - - -
[EIU] "Combustible fuels" Estimation (based from 2010) x - x x - x
[CIA] "Electricity in total" Only for past years x x - - - -
[WEPP] fully detailed Statistical value - - x - - -
[ENTSO-E] "Electricity in total" Statistical value x x x - - -

5761P25/FICHT-9661890-v2 3-6
3.2 Electricity Demand Assessment
In order to analyse the electricity demand development for the selected EU
countries, mainly four data sources were evaluated that provide electricity
demand figures on a national level. These are (cf. Table 2):
[EU Trends]
[EURPROG]
[Eurostat]
[ENTSO-E]
Figures for 2010 in the 2010 issue of [EURPROG] are generated from a
scenario that was set up for the status of data up to 2009. These can be
compared with national electricity demand figures as given by [EU Trends].
Both sources also provide an outlook up to 2020 and beyond. For cross-
checking the figures of both data sources, two further statistical data sources
are used in order to compare demand values for 2010. This is firstly
[Eurostat], for which data for 2010 are regarded as statistical values with a
provisional status and, secondly, [ENTSO-E] that provides electricity
demand statistics for 2010.
From the comparison with the two statistical sources, no preference for one
of the two scenario sources [EU Trends] and [EURPROG] can be found.
Whilst [EU Trends] seems to agree with the statistics in 2010 better for
Bulgaria and Poland, [EURPROG] seems to perform better for Estonia,
Greece, Slovak Republic and Slovenia (see Figure 2). For the other
countries, deviations of the 2010 values compared to the statistical sources
are either not significant or do not indicate a preference for one or the other
scenario. Or the statistical sources are even contradictory, as is particularly
the case for Lithuania and Spain.

5761P25/FICHT-9661890-v2 3-7
Figure 2: Electricity demand in 2010 according to different data sources

5761P25/FICHT-9661890-v2 3-8
For 2020, only [EU Trends] and [EURPROG] offer demand figures for all
selected EU countries. Since no preference in favour of one of the two
sources could be identified from the comparison of 2010 values with
statistical values, both sources are thus used in the following to analyse the
evolution of future demand in these EU countries.
3.2.1 North East European countries
Figure 3: Development of electricity demand in North East European countries
Figure 3 shows the electricity demand in the North East European countries
for the years 2010, 2020 and 2030. Demand figures as published by
[EURPROG] in the years 2008, 2009 and 2010 are shown in blue, whereas
figures from [EU Trends] are in red. Upon comparing the different
[EURPROG] publications, it can be seen that a considerable reduction of
electricity demand – not only in 2010 but also in 2020 – as a consequence of
0
2
4
6
8
10
12
14
2005 2010 2015 2020 2025 2030 2035
[TW
h]
Estonia
[EURPROG] (2008)
[EURPROG] (2009)
[EURPROG] (2010)
[EU Trends]
0
20
40
60
80
100
120
140
2005 2010 2015 2020 2025 2030 2035[T
Wh
]
Finland
[EURPROG] (2009)
[EURPROG] (2008)
[EURPROG] (2010)
[EU Trends]
0
2
4
6
8
10
12
14
16
2005 2010 2015 2020 2025 2030 2035
[TW
h]
Latvia
[EURPROG] (2008)
[EURPROG] (2009)
[EURPROG] (2010)
[EU Trends]
0
2
4
6
8
10
12
14
16
18
20
2005 2010 2015 2020 2025 2030 2035
[TW
h]
Lithuania
[EURPROG] (2008)
[EURPROG] (2009)
[EURPROG] (2010)
[EU Trends]
0
50
100
150
200
250
2005 2010 2015 2020 2025 2030 2035
[TW
h]
Poland
[EURPROG] (2008)
[EURPROG] (2009)
[EURPROG] (2010)
[EU Trends]
0
5
10
15
20
25
30
35
40
45
2005 2010 2015 2020 2025 2030 2035
[TW
h]
Slovak Republic
[EURPROG] (2008)
[EURPROG] (2009)
[EURPROG] (2010)
[EU Trends]
5761P25/FICHT-9661890-v2 3-9
the global financial crisis and economic downturn is already included in the
latest [EURPROG] issue of 2010. This is more or less also confirmed by
[EU Trends]. However for Poland and the Slovak Republic, [EU Trends]
seems more to follow the older demand paths from older [EURPROG]
issues, which do not include the full impact of the global economic crisis.
The strong increase in [EURPROG 2010] foreseen for Poland after 2020
may result from an inconsistency within the [EURPROG 2010]: Whereas
forecasts up to 2020 are taken from the PSE Operator S.A. ‘Development
Program for Domestic Transmission System - Expected Scenario’,
projections for 2030 are estimates ‘mostly based on assumed trends’
presented in this scenario.
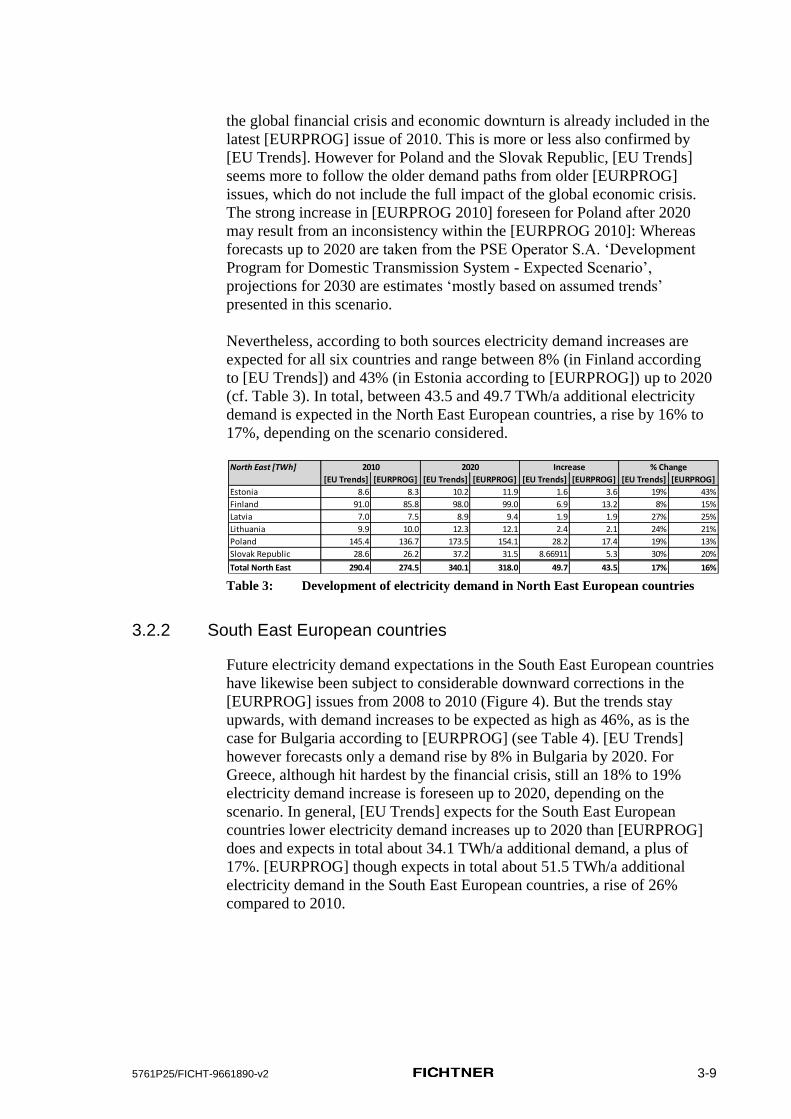
Nevertheless, according to both sources electricity demand increases are
expected for all six countries and range between 8% (in Finland according
to [EU Trends]) and 43% (in Estonia according to [EURPROG]) up to 2020
(cf. Table 3). In total, between 43.5 and 49.7 TWh/a additional electricity
demand is expected in the North East European countries, a rise by 16% to
17%, depending on the scenario considered.
Table 3: Development of electricity demand in North East European countries
3.2.2 South East European countries
Future electricity demand expectations in the South East European countries
have likewise been subject to considerable downward corrections in the
[EURPROG] issues from 2008 to 2010 (Figure 4). But the trends stay
upwards, with demand increases to be expected as high as 46%, as is the
case for Bulgaria according to [EURPROG] (see Table 4). [EU Trends]
however forecasts only a demand rise by 8% in Bulgaria by 2020. For
Greece, although hit hardest by the financial crisis, still an 18% to 19%
electricity demand increase is foreseen up to 2020, depending on the
scenario. In general, [EU Trends] expects for the South East European
countries lower electricity demand increases up to 2020 than [EURPROG]
does and expects in total about 34.1 TWh/a additional demand, a plus of
17%. [EURPROG] though expects in total about 51.5 TWh/a additional
electricity demand in the South East European countries, a rise of 26%
compared to 2010.
North East [TWh]
[EU Trends] [EURPROG] [EU Trends] [EURPROG] [EU Trends] [EURPROG] [EU Trends] [EURPROG]
Estonia 8.6 8.3 10.2 11.9 1.6 3.6 19% 43%
Finland 91.0 85.8 98.0 99.0 6.9 13.2 8% 15%
Latvia 7.0 7.5 8.9 9.4 1.9 1.9 27% 25%
Lithuania 9.9 10.0 12.3 12.1 2.4 2.1 24% 21%
Poland 145.4 136.7 173.5 154.1 28.2 17.4 19% 13%
Slovak Republic 28.6 26.2 37.2 31.5 8.66911 5.3 30% 20%
Total North East 290.4 274.5 340.1 318.0 49.7 43.5 17% 16%
2010 2020 Increase % Change

5761P25/FICHT-9661890-v2 3-10
Figure 4: Development of electricity demand in South East European countries
Table 4: Development of electricity demand in South East European countries
0
10
20
30
40
50
60
70
80
2005 2010 2015 2020 2025 2030 2035
[TW
h]
Bulgaria
[EURPROG] (2008)
[EURPROG] (2009)
[EURPROG] (2010)
[EU Trends]
0
10
20
30
40
50
60
70
80
90
2005 2010 2015 2020 2025 2030 2035
[TW
h]
Greece
[EURPROG] (2008)
[EURPROG] (2009)
[EURPROG] (2010)
[EU Trends]
0
10
20
30
40
50
60
70
2005 2010 2015 2020 2025 2030 2035
[TW
h]
Hungary
[EURPROG] (2008)
[EURPROG] (2009)
[EURPROG] (2010)
[EU Trends]
0
20
40
60
80
100
120
2005 2010 2015 2020 2025 2030 2035
[TW
h]
Romania
[EURPROG] (2008)
[EURPROG] (2009)
[EURPROG] (2010)
[EU Trends]
0
2
4
6
8
10
12
14
16
18
20
2005 2010 2015 2020 2025 2030 2035
[TW
h]
Slovenia
[EURPROG] (2008)
[EURPROG] (2009)
[EURPROG] (2010)
[EU Trends]
South East [TWh]
[EU Trends] [EURPROG] [EU Trends] [EURPROG] [EU Trends] [EURPROG] [EU Trends] [EURPROG]
Bulgaria 34.5 36.2 37.1 52.7 2.7 16.5 8% 46%
Greece 64.1 60.9 76.1 71.7 12.0 10.8 19% 18%
Hungary 39.1 39.9 44.6 48.0 5.5 8.1 14% 20%
Romania 50.7 50.6 62.1 64.2 11.4 13.6 23% 27%
Slovenia 15.4 12.4 17.9 14.9 2.55733 2.5 17% 20%
Total South East 203.8 200.0 237.9 251.5 34.1 51.5 17% 26%
2010 2020 Increase % Change

5761P25/FICHT-9661890-v2 3-11
3.2.3 Mediterranean countries
The two Mediterranean countries considered, Italy and Spain, are also those
with the highest electricity demand. Their demand figures are each on their
own higher than those of either the North East European countries cluster or
the South East European countries cluster altogether. Downward corrections
of demand figures were made with the latest [EURPROG] issue in 2010,
particularly for Spain (see Figure 5). [EU Trends] confirms the expected
trend for Spain, at least until 2020, but believes in a much lower electricity
demand increase in Italy, particularly beyond 2020. So again, as for the
South East European country cluster, also for the Mediterranean countries
[EU Trends] expects considerably lower electricity demand increases by
2020 than [EURPROG] does and expects in total about 111.6 TWh/a
additional demand, a plus of 18% (Table 5). [EURPROG] though expects in
total about 156.1 TWh/a additional electricity demand in the Mediterranean
countries, a rise of 26% compared to 2010.
Figure 5: Development of electricity demand in Mediterranean countries
Table 5: Development of electricity demand in Mediterranean countries
3.2.4 Summary: Electricity demand assessment
Although revised downward with the latest issues of [EURPROG], a
considerable electricity demand increase of in total 23% (356 TWh/a) from
2010 to 2020 is still expected over all selected EU countries by
[EURPROG], with outstanding demand growth particularly in Bulgaria
(+46%) and Estonia (+43%). However, [EU Trends] does not confirm
growth expectations for these two countries and foresees, particularly for
Bulgaria, the lowest growth rate of only 8% by 2020. Also for Finland and
Hungary, [EU Trends] expects similar low growth rates whereas
[EURPROG] anticipates lowest demand dynamics not only for Finland
(15%) but also for Poland (13%), and Greece (18%). In general,
[EURPROG] foresees higher electricity demand increases and expects them
0
100
200
300
400
500
600
2005 2010 2015 2020 2025 2030 2035
[TW
h]
Italy
[EURPROG] (2008)
[EURPROG] (2009)
[EURPROG] (2010)
[EU Trends]
0
50
100
150
200
250
300
350
400
450
500
2005 2010 2015 2020 2025 2030 2035
[TW
h]
Spain
[EURPROG] (2008)
[EURPROG] (2009)
[EURPROG] (2010)
[EU Trends]
Mediterranean [TWh]
[EU Trends] [EURPROG] [EU Trends] [EURPROG] [EU Trends] [EURPROG] [EU Trends] [EURPROG]
Italy 333.3 330.5 386.0 420.4 52.6 89.9 16% 27%
Spain 285.1 273.6 344.0 339.8 58.9386 66.2 21% 24%
Total Mediterranean 618.4 604.1 730.0 760.2 111.6 156.1 18% 26%
2010 2020 Increase % Change

5761P25/FICHT-9661890-v2 3-12
to be more focussed to the southern countries, whereas [EU Trends] hardly
identifies regional differences in the average growth rates of the country
clusters (see Figure 6, Figure 1 and Table 6). [EU Trends] ends up with a
demand increase of only 18% or 273 TWh/a for all selected EU countries
altogether.
The quite different results from country to country, but also in sum,
obtained from the two data sources, [EU Trends] and [EURPROG], cannot
be explained. The reason is that neither the scenario methods nor the basis
of expert judgement affecting the results of the two studies are transparent
enough. This holds particularly for [EURPROG], for which the scenario
may be obtained with different approaches and assumptions from the
EURELECTRIC members in the various countries. [EU Trends] refers to a
scenario framework that explicitly includes the latest climate policy
measures on EU level but also the mandatory national greenhouse gas
emission and energy targets set for 2020. So, to include the impact of these
policies on the anticipated power plant investment behaviour in the
proximity of the EU boundaries, the [EU Trends] scenario is taken as a
reference for this study.
Figure 6: Development of electricity demand in total for the selected EU countries
Table 6: Development of electricity demand in total for the selected EU countries
0
100
200
300
400
500
600
700
800
2005 2010 2015 2020 2025
[TW
h]
North East [EURPROG]
South East [EURPROG]
Mediterranean [EURPROG]
North East [EU Trends]
South East [EU Trends]
Mediterranean [EU Trends]
Demand [TWh]
[EU Trends] [EURPROG] [EU Trends] [EURPROG] [EU Trends] [EURPROG] [EU Trends] [EURPROG]
North East 290.4 274.5 340.1 318.0 49.7 43.5 17% 16%
South East 203.8 200.0 237.9 251.5 34.1 51.5 17% 26%
Mediterranean 618.4 604.1 730.0 760.2 111.6 156.1 18% 26%
Total 1112.6 1078.6 1308.0 1329.7 272.8 355.7 18% 23%
2010 2020 Increase % Change

5761P25/FICHT-9661890-v2 3-13
3.3 Electricity Supply Assessment
The electricity supply assessment for the selected EU countries follows
three steps. Firstly, the structure of the existing power plants by fuel type
and by age is investigated, from which a retirement plan is derived.
Secondly, the expected future development of power plant capacities is
outlined. And thirdly, the expected future development of electricity
generation is shown and compared with future demand expectations.
3.3.1 Structure of existing power plants
For analysis of the structure of existing power plants, the [WEPP] database
is used, which is the most detailed and probably also most closely
administered of the available databases. With the issue date of June 2011,
[WEPP] belongs also to the most recently updated available data sources. It
records for each power plant, inter alia, its gross capacity, its year of
commissioning (‘year-on-line’), place and country of location, the utility
type by technology and the type of main fuel as well as of alternative fuels.
Particularly due to the information on the age of the regarded power plants,
the [WEPP] database is the only one among the available data sources that
allows constructing a detailed retirement plan for the power plants by fuel
type and by country. [WEPP] only lists gross electrical capacities in contrast
to all other sources used in this study, which list net electrical capacities.
The retirement plan is obtained from the age structure of the power plant
fleet by assuming standard technical lifetimes for each type of power plant
characterised by its fuel type. The assumed standard technical lifetimes by
fuel type are depicted in Table 7. For nuclear power plants, the lifetime was
individually determined for each power plant, if specific information on
planning for retirement was available. For others, no retirement up to 2020
was considered.
Table 7: Technical lifetimes of power
plants by fuel type
Fuel type years
Nuclear Energy individually
Coal & Lignite 45
Petroleum products 30
Gas 40
Biomass & waste 30
Hydro 60
Wind 20
PV 20
Other renewables 30

5761P25/FICHT-9661890-v2 3-14
3.3.1.1 North East European countries
The following six figures (Figure 7 to Figure 12) show the existing power
plant capacities in the six North East European countries. They are
classified by fuel type and by age, stated in 10-year steps. As can be seen,
the predominant age of the power plants for most countries is in the range of
31 to 50 years. Only a few of the plants are older than 50 years, which is
more than their technical lifetime and which may have been made possible
in the past by technical retrofit measures.
Only for the Slovak Republic is it clear that large parts of the power plant
fleet are younger than 31 years, particularly nuclear and hydro power plants.
In Estonia there is the special situation that the majority of the power plant
capacities are fired with oil-shale.
Figure 7: Age structure of existing power plants in Estonia
0.0
0.2
0.4
0.6
0.8
1.0
1.2
1.4
1.6
0-10 11-20 21-30 31-40 41-50 51-60 >60
[GW
]
Age
Estonia
Others
Solar
Wind
Hydropower
Biomass & Waste
Gas
Oil
Oil Shale
Coal & Lignite
Nuclear

5761P25/FICHT-9661890-v2 3-15
Figure 8: Age structure of existing power plants in Finland
Figure 9: Age structure of existing power plants in Latvia
0.0
0.5
1.0
1.5
2.0
2.5
3.0
0-10 11-20 21-30 31-40 41-50 51-60 >60
[GW
]
Age
Finland
Others
PV
Wind
Hydropower
Biomass & Waste
Gas
Oil
Coal & Lignite
Nuclear
0.0
0.1
0.2
0.3
0.4
0.5
0.6
0.7
0.8
0.9
0-10 11-20 21-30 31-40 41-50 51-60 >60
[GW
]
Age
Latvia
Others
PV
Wind
Hydropower
Biomass & Waste
Gas
Oil
Coal & Lignite
Nuclear

5761P25/FICHT-9661890-v2 3-16
Figure 10: Age structure of existing power plants in Lithuania
Figure 11: Age structure of existing power plants in Poland
0.0
0.2
0.4
0.6
0.8
1.0
1.2
1.4
0-10 11-20 21-30 31-40 41-50 51-60 >60
[GW
]
Age
Lithuania
Others
PV
Wind
Hydropower
Biomass & Waste
Gas
Oil
Coal & Lignite
Nuclear
0
2
4
6
8
10
12
14
0-10 11-20 21-30 31-40 41-50 51-60 >60
[GW
]
Age
Poland
Others
PV
Wind
Hydropower
Biomass & Waste
Gas
Oil
Coal & Lignite
Nuclear

5761P25/FICHT-9661890-v2 3-17
Figure 12: Age structure of existing power plants in the Slovak Republic
The retirement plans for the six North East European countries resulting
from the age structure of their power plant fleets are depicted in Figure 13.
0.0
0.2
0.4
0.6
0.8
1.0
1.2
0-10 11-20 21-30 31-40 41-50 51-60 >60
[GW
]
Age
Slovak Republic
Others
PV
Wind
Hydropower
Biomass & Waste
Gas
Oil
Coal & Lignite
Nuclear

5761P25/FICHT-9661890-v2 3-18
Figure 13: Capacity retirements in North East European countries
It becomes clear that the power plant fleets in Poland and Estonia are
dominated by coal power plants and oil shale-fired power plants,
respectively, whereas for Latvia and also for Lithuania and the Slovak
Republic both, hydro and gas power plants play a major role. Finland in
contrast has the most balanced mix of power plant types, with a
considerable fraction being fuelled with biomass. Nuclear power is installed
in Finland and Slovak Republic.
The largest relative power plant retirements up to 2020 are expected
particularly for Lithuania and Estonia in accordance with the relatively high
age of their power plants. Almost two-third of their electrical capacities may
be retired by 2020 (cf. Table 8). But also the Slovak Republic, Poland and
Finland face substantial power plant retirements by 2020 to a share of 30%
and more. These three non-Baltic countries are at the same time the ones
which have the highest power plant capacities installed. Thus the
retirements in these countries dominate in absolute values for this cluster of
North East European countries, with up to more than 13 GW being expected
to retire just in Poland alone by 2020.
0
1
2
3
4
2010 2020 2030
[GW
]
Estonia Others
Solar
Wind
Hydropower
Biomass & Waste
Gas
Oil
Oil Shale
Coal & Lignite
Nuclear0
2
4
6
8
10
12
14
16
18
2010 2020 2030
[GW
]
Finland Others
PV
Wind
Hydropower
Biomass & Waste
Gas
Oil
Coal & Lignite
Nuclear
0
1
2
3
2010 2020 2030
[GW
]
Latvia Others
PV
Wind
Hydropower
Biomass & Waste
Gas
Oil
Coal & Lignite
Nuclear0
1
2
3
4
2010 2020 2030[G
W]
Lithuania Others
PV
Wind
Hydropower
Biomass & Waste
Gas
Oil
Coal & Lignite
Nuclear
0
5
10
15
20
25
30
35
40
2010 2020 2030
[GW
]
Poland Others
PV
Wind
Hydropower
Biomass & Waste
Gas
Oil
Coal & Lignite
Nuclear0
1
2
3
4
5
6
7
8
9
2010 2020 2030
[GW
]
Slovak Republic Others
PV
Wind
Hydropower
Biomass & Waste
Gas
Oil
Coal & Lignite
Nuclear

5761P25/FICHT-9661890-v2 3-19
Table 8: Capacity retirements in North East European countries
Accordingly, the high share of coal power plants installed in Poland
dominates the overall power plant retirements by fuel type (see Table 9 and
Figure 14). About 14.7 GW of coal and lignite power plants are expected to
retire by 2020, which is about 42% of installed coal power plant capacities.
A higher share of decommissioning of 87% by 2020 is only planned for oil
shale and oil-fired power plants, particularly in Estonia, Finland and
Lithuania.
Table 9: Capacity retirements by fuel type in North East European countries
retirement installed retirement retirement
2010 2010 - 2020 2010 - 2020
[MW] [MW] %
Estonia 2,864 1,863 65%
Finland 16,881 5,066 30%
Latvia 2,258 83 4%
Lithuania 3,677 2,200 60%
Poland 33,929 13,159 39%
Slovak Republic 7,685 3,369 44%
Total 67,294 25,740 38%
North East installed retirement retirement
Europe 2010 2010 - 2020 2010 - 2020
[MW] [MW] %
Nuclear 4,690 1,010 22%
Coal & Lignite 34,761 14,658 42%
Oil Shale 2,478 1,770 71%
Oil 2,304 2,013 87%
Gas 7,935 2,898 37%
Biomass & Waste 2,888 1,059 37%
Hydropower 10,001 2,022 20%
Wind 1,916 301 16%
Solar 285 0 0%
Others 36 9 25%
Total 67,294 25,740 38%

5761P25/FICHT-9661890-v2 3-20
Figure 14: Capacity retirements in North East European countries
3.3.1.2 South East European countries
The following five figures (Figure 15 to Figure 19) show the existing power
plant capacities in the five South East European countries. They are
classified by fuel type and by age, stated in 10-year steps.
Bulgaria but also Romania and Slovenia are found among the South East
European countries with the oldest power plant fleets. Greece and Hungary
have relatively high shares of younger power plants, i.e. with an age of
20 years or less, which are mainly natural gas fired. The natural gas power
plants in the South East European countries belong in general to the latest
power plant technology installed. Installed nuclear power plants are mainly
in an age range of between 11 and 30 years.
0
10
20
30
40
50
60
70
80
2010 2020 2030
[GW
]
North East Others
Solar
Wind
Hydropower
Biomass & Waste
Gas
Oil
Oil Shale
Coal & Lignite
Nuclear

5761P25/FICHT-9661890-v2 3-21
Figure 15: Age structure of existing power plants in Bulgaria
Figure 16: Age structure of existing power plants in Greece
0.0
0.5
1.0
1.5
2.0
2.5
0-10 11-20 21-30 31-40 41-50 51-60 >60
[GW
]
Age
Bulgaria
Others
PV
Wind
Hydropower
Biomass & Waste
Gas
Oil
Coal & Lignite
Nuclear
0.0
0.5
1.0
1.5
2.0
2.5
3.0
3.5
0-10 11-20 21-30 31-40 41-50 51-60 >60
[GW
]
Age
Greece
Others
PV
Wind
Hydropower
Biomass & Waste
Gas
Oil
Coal & Lignite
Nuclear

5761P25/FICHT-9661890-v2 3-22
Figure 17: Age structure of existing power plants in Hungary
Figure 18: Age structure of existing power plants in Romania
0.0
0.5
1.0
1.5
2.0
2.5
0-10 11-20 21-30 31-40 41-50 51-60 >60
[GW
]
Age
Hungary
Others
PV
Wind
Hydropower
Biomass & Waste
Gas
Oil
Coal & Lignite
Nuclear
0.0
0.5
1.0
1.5
2.0
2.5
3.0
3.5
0-10 11-20 21-30 31-40 41-50 51-60 >60
[GW
]
Age
Romania
Others
PV
Wind
Hydropower
Biomass & Waste
Gas
Oil
Coal & Lignite
Nuclear

5761P25/FICHT-9661890-v2 3-23
Figure 19: Age structure of existing power plants in Slovenia
The retirement plans for the five South East European countries resulting
from the age structure of their power plant fleets are depicted in Figure 20.
0
0.1
0.2
0.3
0.4
0.5
0.6
0.7
0.8
0-10 11-20 21-30 31-40 41-50 51-60 >60
[GW
]
Age
Slovenia
Others
PV
Wind
Hydropower
Biomass & Waste
Gas
Oil
Coal & Lignite
Nuclear

5761P25/FICHT-9661890-v2 3-24
Figure 20: Capacity retirements in South East European countries
Except for Greece, all other South East European countries are subject to
about 35% to 37% of retirements of their installed power plant capacities in
the period from 2010 to 2020. Greece benefits from its younger power
plants with a higher share of long-lived (cf. Table 7) coal power plants.
Hungary, in contrast, also with a relatively young power plant fleet, has
much higher capacity shares of more short-lived natural gas power plants.
Of the countries considered, Romania has the highest installed capacity
(22.1 GW) followed by Greece (15.1 GW) and Bulgaria (12.2 GW).
Table 10: Capacity retirements in South East European countries
0
2
4
6
8
10
12
14
2010 2020 2030
[GW
]
Bulgaria Others
PV
Wind
Hydropower
Biomass & Waste
Gas
Oil
Coal & Lignite
Nuclear0
2
4
6
8
10
12
14
16
2010 2020 2030
[GW
]
Greece Others
PV
Wind
Hydropower
Biomass & Waste
Gas
Oil
Coal & Lignite
Nuclear
0
1
2
3
4
5
6
7
8
9
10
2010 2020 2030
[GW
]
Hungary Others
PV
Wind
Hydropower
Biomass & Waste
Gas
Oil
Coal & Lignite
Nuclear0
5
10
15
20
25
2010 2020 2030
[GW
]
Romania Others
PV
Wind
Hydropower
Biomass & Waste
Gas
Oil
Coal & Lignite
Nuclear
0
1
2
3
4
2010 2020 2030
[GW
]
Slovenia Others
PV
Wind
Hydropower
Biomass & Waste
Gas
Oil
Coal & Lignite
Nuclear
South East installed retirement retirement
Europe 2010 2010 - 2020 2010 - 2020
[MW] [MW] %
Bulgaria 12,216 4,225 35%
Greece 15,197 2,883 19%
Hungary 9,356 3,371 36%
Romania 22,091 8,140 37%
Slovenia 3,468 1,300 37%
Total 62,328 19,918 32%

5761P25/FICHT-9661890-v2 3-25
Hydropower plays a major role in all these countries except for Hungary,
which is dominated by natural gas power plants. No retirements up to 2020
are expected for nuclear power plants (cf. Table 11), which are installed in
all of these countries except Greece. Fossil fuel fired plants are most
affected by retirements (cf. Table 11). About two-thirds of oil-fired power
plant capacities (2.9 GW) and a little more than 40% of coal power plant
capacities (9.2 GW) as well as of natural gas power plant capacities
(5.9 GW) are expected to retire by 2020.
Table 11: Capacity retirements by fuel type in South East European countries
Figure 21: Capacity retirements in South East European countries
3.3.1.3 Mediterranean countries
The following two figures (Figure 22 and Figure 23) show the existing
power plant capacities in the two Mediterranean countries, Italy and Spain.
They are classified by fuel type and by age, stated in 10-year steps.
South East installed retirement retirement
Europe 2010 2010 - 2020 2010 - 2020
[MW] [MW] %
Nuclear 6,167 0 0%
Coal & Lignite 21,248 9,248 44%
Oil 4,266 2,853 67%
Gas 14,322 5,901 41%
Biomass & Waste 307 151 49%
Hydropower 13,832 1,320 10%
Wind 1,687 320 19%
Solar 277 0 0%
Others 222 125 56%
Total 62,328 19,918 32%
0
10
20
30
40
50
60
70
2010 2020 2030
[GW
]
South East Others
PV
Wind
Hydropower
Biomass & Waste
Gas
Oil
Coal & Lignite
Nuclear

5761P25/FICHT-9661890-v2 3-26
Compared to the previously investigated EU countries, both Italy and Spain
are equipped with a relatively young power plant fleet. In both countries
recently, i.e. during the last ten years, massive investments have been made
in new natural gas-fired power plants. Almost no new coal power plants
have been brought on line in Spain for at least twenty years and also no new
nuclear power plants. In Italy there are no nuclear power plants.
Figure 22: Age structure of existing power plants in Italy
Figure 23: Age structure of existing power plants in Spain
0
5
10
15
20
25
30
35
40
0-10 11-20 21-30 31-40 41-50 51-60 >60
[GW
]
Age
Italy
Others
Geothermal
PV
Wind
Hydropower
Biomass & Waste
Gas
Oil
Coal & Lignite
Nuclear
0
5
10
15
20
25
30
0-10 11-20 21-30 31-40 41-50 51-60 >60
[GW
]
Age
Spain
Others
PV
Wind
Hydropower
Biomass & Waste
Gas
Oil
Coal & Lignite
Nuclear

5761P25/FICHT-9661890-v2 3-27
0
20
40
60
80
100
120
2010 2020 2030
[GW
]
Spain Others
PV
Wind
Hydropower
Biomass & Waste
Gas
Oil
Coal & Lignite
Nuclear0
20
40
60
80
100
120
2010 2020 2030
[GW
]
Italy Others
Geothermal
PV
Wind
Hydropower
Biomass & Waste
Gas
Oil
Coal & Lignite
Nuclear
The retirement plans for the two Mediterranean countries resulting from the
age structure of their power plant fleets are depicted in Figure 24.
Figure 24: Capacity retirements in Mediterranean countries
Both countries have about the same total installed capacities of 98 GW
(Table 12) and also their expected total capacity retirement by 2020 is
almost the same at about 24 and 25 GW. The main difference between both
countries is the role that natural gas power plants and wind power plants
play in their power plant fleets. For Italy, natural gas power plants dominate,
whereas for Spain a broader technology mix is installed with a considerable
share of already installed wind power. Coal power plant capacities play a
minor role in both countries and about one-third of capacities is forecast to
retire in both countries together by 2020 (cf. Table 13).
Table 12: Capacity retirements in Mediterranean countries
It is interesting to note that oil-fired power plants are being retired at a high
rate in both countries up to 2020, amounting to 92% of capacities installed
in Italy and 51% of capacities installed in Spain. Since installed oil-fired
power plant capacities are also at a rather high level, particularly in Italy,
this power plant technology is also the one where most retirement in
absolute figures is expected by 2020 for the Mediterranean countries,
namely about 12.4 GW (cf. Table 13). Compared to renewable capacities
for wind power and hydropower, which due to their short lifetimes also face
high retirements of 10.2 GW (wind) and 11.1 GW (hydropower), expected
retirements of conventional power plant capacities (other than of oil-fired
power plants) is comparably lower in absolute figures: 7.2 GW of coal-fired
power plants, 3.7 GW of natural gas fired power plants and 3.5 GW of
nuclear power plants. In total 48.6 GW or 25% of capacity retirement is
expected for the Mediterranean countries, as illustrated in Figure 25.
retirement installed retirement retirement
2010 2010 - 2020 2010 - 2020
MW [MW] %
Italy 98,587 24,757 25%
Spain 98,099 23,834 24%
Total 196,686 48,591 25%

5761P25/FICHT-9661890-v2 3-28
Table 13: Capacity retirements by fuel type in Mediterranean countries
Figure 25: Capacity retirements in Mediterranean countries
Mediterranean installed retirement retirement
Europe 2010 2010 - 2020 2010 - 2020
[MW] [MW] %
Nuclear 6,664 3,513 53%
Coal & Lignite 21,842 7,195 33%
Oil 16,128 12,389 77%
Gas 79,669 3,715 5%
Biomass & Waste 1,651 165 10%
Hydropower 35,714 11,082 31%
Wind 26,956 10,271 38%
Solar 7,287 0 0%
Geothermal 724 216 30%
Others 51 45 88%
Total 196,686 48,591 25%
0
50
100
150
200
250
2010 2020 2030
[GW
]
Mediterranean Others
Geothermal
PV
Wind
Hydropower
Biomass & Waste
Gas
Oil
Coal & Lignite
Nuclear

5761P25/FICHT-9661890-v2 3-29
3.3.1.4 Summary: Structure of existing power plants
Figure 26: Capacity retirements in all selected EU countries
Figure 26 shows the expected retirement for all selected EU countries from
2010 up to 2020 and beyond. As can be seen from Table 14, the countries
classified as North East European countries are exposed to the highest
relative capacity retirement from 2010 to 2020, but in absolute terms
capacity retirement in the only two Mediterranean countries, Italy and
Spain, dominates with about 48.6 GW.
Table 14: Capacity retirements in all selected EU countries
However, as shown in Table 15, despite the highest total capacity retirement
in the Mediterranean countries, expected retirements for coal-fired power
plant capacities are higher for the South East European and particularly for
the North East European countries. Almost the same holds for natural gas
power plants. The Mediterranean countries dominate retirements
particularly for oil-fired power plant capacities and for hydropower and
wind power capacities. In total, 94.2 GW of power plant capacity is
expected to be retired by 2020 in all selected EU countries.
0
50
100
150
200
250
300
350
2010 2020 2030
[GW
]
Total selected EU countriesOthers
Solar
Wind
Hydropower
Biomass & Waste
Gas
Oil
Oil Shale
Coal & Lignite
Nuclear
Capacities installed retirement retirement
2010 2010 - 2020 2010 - 2020
MW [MW] %
North East 67,294 25,740 38%
South East 62,328 19,918 32%
Mediterranean 196,686 48,591 25%
Total 326,308 94,249 29%

5761P25/FICHT-9661890-v2 3-30
Table 15: Capacity retirements by fuel type for all selected EU countries
With regard to the installed capacities (see Table 16) it can be stated that, of
the conventional power plants, particularly the capacities of oil-fired power
plants (-76%), oil shale-fired power plants (-71%) and coal-fired power
plants (-40%) will decrease by retirements. Natural gas power plant
capacities however are only being retired by 12%. Also renewable power
plant technologies face considerable ‘retirement rates’ of between 24% for
hydropower and 36% for wind power, either due to old capacities
(hydropower) or due to relatively short technical lifetimes (wind, biomass).
Retirement of PV power plants is assumed to play no major role up to 2020
due to their shorter service life.
Table 16: Capacity retirements by fuel type for all selected EU countries
Retirements North East South East Mediterranean Total
2010 - 2020 European European European
[MW] [MW] [MW] [MW]
Nuclear 1,010 0 3,513 4,523
Coal & Lignite 14,658 9,248 7,195 31,101
Oil Shale 1,770 0 0 1,770
Oil 2,013 2,853 12,389 17,255
Gas 2,898 5,901 3,715 12,514
Biomass & Waste 1,059 151 165 1,375
Hydropower 2,022 1,320 11,082 14,424
Wind 301 320 10,271 10,892
Solar 0 0 0 0
Others 9 125 261 395
Total 25,740 19,918 48,591 94,249
Capacities installed retirement retirement
by fuel 2010 2010 - 2020 2010 - 2020
[MW] [MW] %
Nuclear 17,521 4,523 26%
Coal & Lignite 77,851 31,101 40%
Oil Shale 2,478 1,770 71%
Oil 22,698 17,255 76%
Gas 101,926 12,514 12%
Biomass & Waste 4,846 1,375 28%
Hydropower 59,547 14,424 24%
Wind 30,559 10,892 36%
Solar 7,849 0 0%
Others 1,033 395 38%
Total 326,308 94,249 29%

5761P25/FICHT-9661890-v2 3-31
3.3.2 Development of power plant capacities
The future development of power plant capacities comprises the
replacement of retiring capacities but also further capacity net additions3.
Two of the analysed data sources (cf. section 3.1) contain scenarios for
future development of power plant capacities up to 2020 in the selected EU
countries: [EU Trends] and [EURPROG], with [EU Trends] also providing
figures for 2015. Both sources are presented and investigated in the
following.
3.3.2.1 North East European countries
The following figures (Figure 27 to Figure 32) show the future development
of power plant capacities up to 2020 in the North East European countries as
outlined by [EU Trends] and by [EURPROG].
Figure 27: Capacity development in Estonia
3 ‘Capacity net additions’ should not be confused with ‘net electrical capacity’. The latter
term is defined for each power plant as its gross electrical capacity less the electrical power
required for the operation of the power plant itself. ‘Net additions’ of capacities however
refer to gross additions of new power plant capacities less decommissioned power plant
capacities. ‘Capacity net additions’ are therefore identical to the effective overall capacity
increase or decrease.
0.0
0.5
1.0
1.5
2.0
2.5
3.0
3.5
2010 2015 2020
[GW
]
Estonia [EU Trends]
Other renewables
Solar
Wind
Hydro
Biomass & Waste
Natural gas
Petroleum products
Oil Shale
Coal & Lignite
Nuclear Energy
0.0
0.5
1.0
1.5
2.0
2.5
3.0
3.5
2010 2020
[GW
]
Estonia [EURPROG]
Other renewables
Solar
Wind
Hydro
Biomass & Waste
Natural gas
Petroleum products
Oil Shale
Coal & Lignite
Nuclear Energy

5761P25/FICHT-9661890-v2 3-32
Figure 28: Capacity development in Finland
Figure 29: Capacity development in Latvia
Figure 30: Capacity development in Lithuania
0
5
10
15
20
25
2010 2015 2020
[GW
]
Finland [EU Trends]
Other renewables
Solar
Wind
Hydro
Biomass & Waste
Natural gas
Petroleum products
Coal & Lignite
Nuclear Energy0
5
10
15
20
25
2010 2020
[GW
]
Finland [EURPROG]
Other renewables
Solar
Wind
Hydro
Biomass & Waste
Natural gas
Petroleum products
Coal & Lignite
Nuclear Energy
0.0
0.5
1.0
1.5
2.0
2.5
3.0
3.5
4.0
2010 2015 2020
[GW
]
Latvia [EU Trends]
Other renewables
Solar
Wind
Hydro
Biomass & Waste
Natural gas
Petroleum products
Coal & Lignite
Nuclear Energy0.0
0.5
1.0
1.5
2.0
2.5
3.0
3.5
4.0
2010 2020
[GW
]
Latvia [EURPROG]
Other renewables
Solar
Wind
Hydro
Biomass & Waste
Natural gas
Petroleum products
Coal & Lignite
Nuclear Energy
0
1
2
3
4
5
2010 2015 2020
[GW
]
Lithuania [EU Trends]
Other renewables
Solar
Wind
Hydro
Biomass & Waste
Natural gas
Petroleum products
Coal & Lignite
Nuclear Energy0
1
2
3
4
5
2010 2020
[GW
]
Lithuania [EURPROG]
Other renewables
Solar
Wind
Hydro
Biomass & Waste
Natural gas
Petroleum products
Coal & Lignite
Nuclear Energy

5761P25/FICHT-9661890-v2 3-33
Figure 31: Capacity development in Poland
Figure 32: Capacity development in the Slovak Republic
As can be seen from Figure 27 to Figure 32, in general both publications,
[EU Trends] and [EURPROG], do not differ too much regarding the
expectations for electricity capacity developments, at least for most
countries. This holds, of course, more particularly for the starting year 2010,
where no large deviations are observed (cf. Table 17).
Differences between the two sources are particularly noted for the country
with the highest power plant capacity of the North East European countries,
Poland (cf. Figure 31). Whereas [EURPROG] assumes an increase by 47%
from 33.9 GW to 49.7 GW by 2020 for Poland, with 5.9 GW assigned to
coal-fired power plants alone, [EU Trends] assumes an increase by only 9%,
from 32.5 GW to 35.3 GW (cf. Table 17). For coal power plants,
[EU Trends] even expects a capacity drop of about 2.4 GW for Poland by
2020. This may result from the policy assumptions of [EU Trends] which
include the constraints from the emission trading scheme and the national
emission targets for each EU country. But also the development of wind
power and natural gas power plants is seen more optimistically by
[EURPROG]. On the other hand [EU Trends] foresees substantial market
entries for biomass & waste and nuclear energy power plants in Poland.
0
10
20
30
40
50
60
2010 2015 2020
[GW
]
Poland [EU Trends]
Other renewables
Solar
Wind
Hydro
Biomass & Waste
Natural gas
Petroleum products
Coal & Lignite
Nuclear Energy0
10
20
30
40
50
60
2010 2020
[GW
]
Poland [EURPROG]
Other renewables
Solar
Wind
Hydro
Biomass & Waste
Natural gas
Petroleum products
Coal & Lignite
Nuclear Energy
0
1
2
3
4
5
6
7
8
9
2010 2015 2020
[GW
]
Slovak Republic [EU Trends]
Other renewables
Solar
Wind
Hydro
Biomass & Waste
Natural gas
Petroleum products
Coal & Lignite
Nuclear Energy0
1
2
3
4
5
6
7
8
9
2010 2020
[GW
]
Slovak Republic [EURPROG]
Other renewables
Solar
Wind
Hydro
Biomass & Waste
Natural gas
Petroleum products
Coal & Lignite
Nuclear Energy

5761P25/FICHT-9661890-v2 3-34
Table 17: Capacity development in North East European countries
Since Poland has by far the largest power plant capacities of the North East
European countries, the differences between [EU Trends] and [EURPROG]
regarding capacity net additions in Poland are also reflected when totalling
all North East European countries. The capacity development according to
both data sources for North East European countries is shown in Figure 33.
Differing expectations with regard to 2020 concern particularly coal-fired
power plants, natural gas-fired power plants and wind power plants, for all
of which [EURPROG] is much more optimistic regarding capacity net
additions than [EU Trends]. For coal-fired power plant capacities, [EU
Trends] even expects a capacity drop by about 3.1 GW (see Table 18),
whereas [EURPROG] in contrast expects about 5.5 GW of net additions. On
the other hand, [EU Trends] is more optimistic about power plant capacities
fired with biomass and waste, and anticipates 5.3 GW capacity net additions
by 2020 for these power plant types, whereas [EURPROG] only expects 0.5
GW net additions. Nevertheless, in total a gap of about 14 GW capacity net
additions remains between the two scenarios, [EU Trends] and
[EURPROG], when these are compared.
Figure 33: Capacity development by fuel type in North East European countries
Capacities
by country [EU Trends] [EURPROG] [EU Trends] [EURPROG] [EU Trends] [EURPROG]
[MW] [MW] [MW] [MW] [%] [%]
Estonia 2,423 2,429 834 675 34% 28%
Finland 17,582 17,137 4,157 3,742 24% 22%
Latvia 2,359 2,530 732 1,075 31% 42%
Lithuania 2,756 2,525 1,520 2,448 55% 97%
Poland 32,481 33,850 2,769 15,802 9% 47%
Slovak Republic 6,628 6,328 1,708 1,988 26% 31%
Total 64,229 64,799 11,720 25,730 18% 40%
installed 2010 net additions until 2020 net additions until 2020
0
10
20
30
40
50
60
70
80
90
100
2010 2010 2020 2020
[EU Trends] [EURPROG] [EU Trends] [EURPROG]
[GW
]
North East European countries
Other renewables
Solar
Wind
Hydro
Biomass & Waste
Natural gas
Petroleum products
Oil Shale
Coal & Lignite
Nuclear Energy

5761P25/FICHT-9661890-v2 3-35
Table 18: Capacity development by fuel type in North East European countries
3.3.2.2 South East European countries
The following figures (Figure 34 to Figure 38) show the future development
of power plant capacities up to 2020 in the South East European countries as
outlined by [EU Trends] and by [EURPROG].
Figure 34: Capacity development in Bulgaria
Figure 35: Capacity development in Greece
Capacities
by fuel [EU Trends] [EURPROG] [EU Trends] [EURPROG] [EU Trends] [EURPROG]
[MW] [MW] [MW] [MW] [%] [%]
Nuclear Energy 4,550 4,510 4,738 5,853 104% 130%
Coal & Lignite 35,991 36,589 -2,918 5,466 -8% 15%
Oil Shale 2,056 2,056 -138 46 -7% 2%
Petroleum products 1,889 676 -665 -99 -35% -15%
Natural gas 8,511 8,763 525 4,621 6% 53%
Biomass & Waste 2,465 2,565 5,280 485 214% 19%
Hydro 7,341 7,034 492 307 7% 4%
Wind 1,407 2,592 4,217 8,933 300% 345%
Solar 19 5 166 117 874% 2340%
Other renewables 0 9 23 1 n.a. 11%
Total 64,229 64,799 11,720 25,730 18% 40%
installed 2010 net additions until 2020 net additions until 2020
0
2
4
6
8
10
12
14
2010 2015 2020
[GW
]
Bulgaria [EU Trends]
Other renewables
Solar
Wind
Hydro
Biomass & Waste
Natural gas
Petroleum products
Coal & Lignite
Nuclear Energy0
2
4
6
8
10
12
14
2010 2020
[GW
]
Bulgaria [EURPROG]
Other renewables
Solar
Wind
Hydro
Biomass & Waste
Natural gas
Petroleum products
Coal & Lignite
Nuclear Energy
0
5
10
15
20
25
2010 2015 2020
[GW
]
Greece [EU Trends]
Other renewables
Solar
Wind
Hydro
Biomass & Waste
Natural gas
Petroleum products
Coal & Lignite
Nuclear Energy0
5
10
15
20
25
2010 2020
[GW
]
Greece [EURPROG]
Other renewables
Solar
Wind
Hydro
Biomass & Waste
Natural gas
Petroleum products
Coal & Lignite
Nuclear Energy

5761P25/FICHT-9661890-v2 3-36
Figure 36: Capacity development in Hungary
Figure 37: Capacity development in Romania
Figure 38: Capacity development in Slovenia
With regard to the two sources for capacity development, [EU Trends] and
[EURPROG], the discrepancies for South East European countries are in
general more apparent than for North East European countries.
0
2
4
6
8
10
12
2010 2015 2020
[GW
]
Hungary [EU Trends]
Other renewables
Solar
Wind
Hydro
Biomass & Waste
Natural gas
Petroleum products
Coal & Lignite
Nuclear Energy0
2
4
6
8
10
12
2010 2020
[GW
]
Hungary [EURPROG]
Other renewables
Solar
Wind
Hydro
Biomass & Waste
Natural gas
Petroleum products
Coal & Lignite
Nuclear Energy
0
5
10
15
20
25
2010 2015 2020
[GW
]
Romania [EU Trends]
Other renewables
Solar
Wind
Hydro
Biomass & Waste
Natural gas
Petroleum products
Coal & Lignite
Nuclear Energy0
5
10
15
20
25
2010 2020
[GW
]
Romania [EURPROG]
Other renewables
Solar
Wind
Hydro
Biomass & Waste
Natural gas
Petroleum products
Coal & Lignite
Nuclear Energy
0
1
2
3
4
5
2010 2015 2020
[GW
]
Slovenia [EU Trends]
Other renewables
Solar
Wind
Hydro
Biomass & Waste
Natural gas
Petroleum products
Coal & Lignite
Nuclear Energy0
1
2
3
4
5
2010 2020
[GW
]
Slovenia [EURPROG]
Other renewables
Solar
Wind
Hydro
Biomass & Waste
Natural gas
Petroleum products
Coal & Lignite
Nuclear Energy
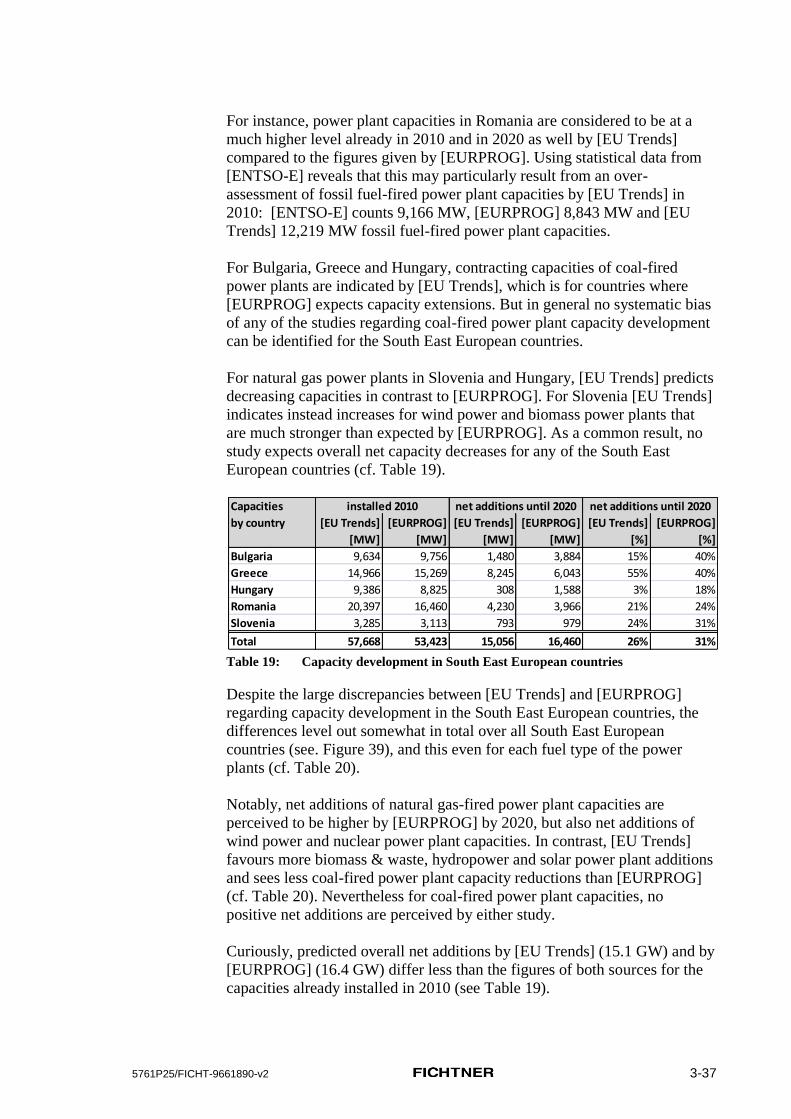
5761P25/FICHT-9661890-v2 3-37
For instance, power plant capacities in Romania are considered to be at a
much higher level already in 2010 and in 2020 as well by [EU Trends]
compared to the figures given by [EURPROG]. Using statistical data from
[ENTSO-E] reveals that this may particularly result from an over-
assessment of fossil fuel-fired power plant capacities by [EU Trends] in
2010: [ENTSO-E] counts 9,166 MW, [EURPROG] 8,843 MW and [EU
Trends] 12,219 MW fossil fuel-fired power plant capacities.
For Bulgaria, Greece and Hungary, contracting capacities of coal-fired
power plants are indicated by [EU Trends], which is for countries where
[EURPROG] expects capacity extensions. But in general no systematic bias
of any of the studies regarding coal-fired power plant capacity development
can be identified for the South East European countries.
For natural gas power plants in Slovenia and Hungary, [EU Trends] predicts
decreasing capacities in contrast to [EURPROG]. For Slovenia [EU Trends]
indicates instead increases for wind power and biomass power plants that
are much stronger than expected by [EURPROG]. As a common result, no
study expects overall net capacity decreases for any of the South East
European countries (cf. Table 19).
Table 19: Capacity development in South East European countries
Despite the large discrepancies between [EU Trends] and [EURPROG]
regarding capacity development in the South East European countries, the
differences level out somewhat in total over all South East European
countries (see. Figure 39), and this even for each fuel type of the power
plants (cf. Table 20).
Notably, net additions of natural gas-fired power plant capacities are
perceived to be higher by [EURPROG] by 2020, but also net additions of
wind power and nuclear power plant capacities. In contrast, [EU Trends]
favours more biomass & waste, hydropower and solar power plant additions
and sees less coal-fired power plant capacity reductions than [EURPROG]
(cf. Table 20). Nevertheless for coal-fired power plant capacities, no
positive net additions are perceived by either study.
Curiously, predicted overall net additions by [EU Trends] (15.1 GW) and by
[EURPROG] (16.4 GW) differ less than the figures of both sources for the
capacities already installed in 2010 (see Table 19).
Capacities
by country [EU Trends] [EURPROG] [EU Trends] [EURPROG] [EU Trends] [EURPROG]
[MW] [MW] [MW] [MW] [%] [%]
Bulgaria 9,634 9,756 1,480 3,884 15% 40%
Greece 14,966 15,269 8,245 6,043 55% 40%
Hungary 9,386 8,825 308 1,588 3% 18%
Romania 20,397 16,460 4,230 3,966 21% 24%
Slovenia 3,285 3,113 793 979 24% 31%
Total 57,668 53,423 15,056 16,460 26% 31%
installed 2010 net additions until 2020 net additions until 2020

5761P25/FICHT-9661890-v2 3-38
Figure 39: Capacity by fuel type in South East European countries
Table 20: Capacity development by fuel type in South East European countries
0
10
20
30
40
50
60
70
80
2010 2010 2020 2020
[EU Trends] [EURPROG] [EU Trends] [EURPROG]
[GW
]
South East European countries
Other renewables
Solar
Wind
Hydro
Biomass & Waste
Natural gas
Petroleum products
Coal & Lignite
Nuclear Energy
Capacities
by fuel [EU Trends] [EURPROG] [EU Trends] [EURPROG] [EU Trends] [EURPROG]
[MW] [MW] [MW] [MW] [%] [%]
Nuclear Energy 5,802 5,776 2,057 3,230 35% 56%
Coal & Lignite 18,023 16,740 -185 -1,353 -1% -8%
Petroleum products 4,775 3,744 -1,422 -1,693 -30% -45%
Natural gas 14,077 12,390 1,511 5,486 11% 44%
Biomass & Waste 800 828 1,685 268 211% 32%
Hydro 11,889 11,034 2,322 1,272 20% 12%
Wind 2,211 2,839 7,143 8,263 323% 291%
Solar 91 72 1,875 967 2060% 1343%
Other renewables 0 0 70 20 n.a. n.a.
Total 57,668 53,423 15,056 16,460 26% 31%
net additions until 2020installed 2010 net additions until 2020

5761P25/FICHT-9661890-v2 3-39
3.3.2.3 Mediterranean countries
Figure 40 and Figure 41 show the future development of power plant
capacities up to 2020 in the Mediterranean countries as outlined by
[EU Trends] and by [EURPROG].
Figure 40: Capacity development in Italy
Figure 41: Capacity development in Spain
Installed capacities in the two countries classified as Mediterranean
countries are the highest among all the selected EU countries. Both data
sources hardly differ regarding the figures for installed capacities in 2010.
However, for 2020 [EU Trends] expects about 12 GW more electrical
capacities to be installed in Italy than [EURPROG] does, which is almost
12% higher (cf. Table 21). About 10 GW of this difference can be assigned
to higher wind power additions and about 2 GW to higher biomass & waste
power capacities. Characteristic for Italy is that the still existing
considerable oil-fired power plant capacity is forecast by both scenarios to
decrease by 2020 to almost one-third of its 2010 value. Coal and natural gas
power plant capacities in Italy almost stagnate in both scenarios but
approx. 1.6 GW nuclear power plant capacities are entering the Italian
electricity market.
0
20
40
60
80
100
120
2010 2015 2020
[GW
]
Italy [EU Trends]
Other renewables
Solar
Wind
Hydro
Biomass & Waste
Natural gas
Petroleum products
Coal & Lignite
Nuclear Energy0
20
40
60
80
100
120
2010 2020[G
W]
Italy [EURPROG]
Other renewables
Solar
Wind
Hydro
Biomass & Waste
Natural gas
Petroleum products
Coal & Lignite
Nuclear Energy
0
20
40
60
80
100
120
2010 2015 2020
[GW
]
Spain [EU Trends]
Other renewables
Solar
Wind
Hydro
Biomass & Waste
Natural gas
Petroleum products
Coal & Lignite
Nuclear Energy0
20
40
60
80
100
120
2010 2020
[GW
]
Spain [EURPROG]
Other renewables
Solar
Wind
Hydro
Biomass & Waste
Natural gas
Petroleum products
Coal & Lignite
Nuclear Energy

5761P25/FICHT-9661890-v2 3-40
For Spain, higher capacities of natural gas power plants are indicated in
[EU Trends] compared to [EURPROG] at the expense of capacities of
power plants based on combustion of petroleum products, which are lower
in [EU Trends] than listed in [EURPROG]. This may at least partly result
from a different assignment of power plants to their primarily used fuel.
Apart from this, particularly Spanish wind power and biomass & waste
power plant capacities in 2010 are perceived to be higher and solar power
capacities lower in [EU Trends] compared to [EURPROG].
Table 21: Capacity development in Mediterranean countries
Looking at both Mediterranean countries together (see Figure 42), it can be
seen that [EU Trends] is generally much more optimistic regarding the
future additions of renewable power plant capacities by 2020, particularly of
biomass & waste, wind power and solar power plant capacities. Only for
natural gas power plants, does [EU Trends] see in contrast to [EURPROG]
no net positive capacity additions (cf. Table 22). And like for South East
European countries, for Mediterranean countries, too, neither study indicates
net positive additions for coal-fired power plants.
Figure 42: Capacity by fuel type in Mediterranean countries
Capacities
by country [EU Trends] [EURPROG] [EU Trends] [EURPROG] [EU Trends] [EURPROG]
[MW] [MW] [MW] [MW] [%] [%]
Italy 96,802 96,738 17,372 5,430 18% 6%
Spain 97,750 95,250 17,993 18,595 18% 20%
Total 194,552 191,988 35,365 24,025 18% 13%
installed 2010 net additions until 2020 net additions until 2020
0
50
100
150
200
250
2010 2010 2020 2020
[EU Trends] [EURPROG] [EU Trends] [EURPROG]
[GW
]
Mediterranean countries
Other renewables
Solar
Wind
Hydro
Biomass & Waste
Natural gas
Petroleum products
Coal & Lignite
Nuclear Energy

5761P25/FICHT-9661890-v2 3-41
Table 22: Capacity development by fuel type in Mediterranean countries
3.3.2.4 Summary: Development of power plant capacities
Figure 43 shows the future development of power plant capacities summed
for all selected EU countries up to 2020, as outlined by [EU Trends] and
[EURPROG]. Despite having seen - by source - quite different results for
the country clusters considered, in total the differences level out, at least for
total capacity net additions. For individual countries, main outstanding
differences between the two data sources are identified for Poland and Italy.
Figure 43: Capacity by fuel type in all selected European countries
For all countries in any scenario, positive capacity net additions are
foreseen. The highest capacity growth is expected in the North East and
South East European countries, but the highest capacity net additions in
absolute terms can be expected for the two Mediterranean countries in a
range from about 24 to 35 GW (see Table 23). In total, between 62.1 GW
Capacities
by fuel [EU Trends] [EURPROG] [EU Trends] [EURPROG] [EU Trends] [EURPROG]
[MW] [MW] [MW] [MW] [%] [%]
Nuclear Energy 7,434 7,419 1,131 1,579 15% 21%
Coal & Lignite 21,238 20,925 -460 -2,013 -2% -10%
Petroleum products 16,155 18,878 -7,774 -9,234 -48% -49%
Natural gas 82,276 79,155 -2,655 1,142 -3% 1%
Biomass & Waste 4,369 3,478 6,013 2,445 138% 70%
Hydro 30,914 31,122 817 410 3% 1%
Wind 26,181 23,755 27,480 22,799 105% 96%
Solar 5,250 6,585 10,519 6,897 200% 105%
Other renewables 735 671 294 0 40% 0%
Total 194,552 191,988 35,365 24,025 18% 13%
net additions until 2020installed 2010 net additions until 2020
0
50
100
150
200
250
300
350
400
2010 2010 2020 2020
[EU Trends] [EURPROG] [EU Trends] [EURPROG]
[GW
]
Other renewables
Solar
Wind
Hydro
Biomass & Waste
Natural gas
Petroleum products
Oil Shale
Coal & Lignite
Nuclear Energy

5761P25/FICHT-9661890-v2 3-42
and 66.2 GW of capacity net additions are expected, a relative increase of
around 20% to 21%.
Table 23: Capacity development in all selected European countries
More than half of these net additions consist of additional wind power
plants (cf. Table 24), and also the other renewable technologies are among
the power plant types with the highest growth rates. However, the
assumptions in the two data sources regarding the composition of the total
power plant capacities in 2020 differ quite a lot (cf. Table 24). [EU Trends]
expects much more renewable shares, particularly from biomass & waste
power plants and from solar power plants. On the other hand [EURPROG]
generally expects more conventional power plant additions, particularly
more natural gas power plants (+11.2 GW). Higher expectations by
[EURPROG] regarding coal power plants result mainly from the high value
of about 5.9 GW coal power plant capacity net additions in Poland. But
except for this, the trend for installed coal power plant capacities is
generally seen by both scenarios to slightly decrease by 2020. The only
power plant type with strongly shrinking capacities is the one fuelled by
petroleum products.
Table 24: Capacity development by fuel type in all selected European countries
The quite different results from country to country but also in total, as
obtained from both data sources, [EU Trends] and [EURPROG], cannot be
explained. The reason is that neither the scenario methods nor the basis of
expert judgement impacting the results of the two studies are sufficiently
transparent. This holds particularly for [EURPROG], for which the scenario
may be obtained with different approaches and assumptions from the
EURELECTRIC members in the various countries. [EU Trends] refers to a
scenario framework that explicitly includes the latest climate policy
measures on EU level but also the mandatory national greenhouse gas
Capacities
[EU Trends] [EURPROG] [EU Trends] [EURPROG] [EU Trends] [EURPROG]
[MW] [MW] [MW] [MW] [%] [%]
North East 64,229 64,799 11,720 25,730 18% 40%
South East 57,668 53,423 15,056 16,460 26% 31%
Mediterranean 194,552 191,988 35,365 24,025 18% 13%
Total 316,449 310,210 62,141 66,215 20% 21%
installed 2010 net additions until 2020 net additions until 2020
Capacities
by fuel [EU Trends] [EURPROG] [EU Trends] [EURPROG] [EU Trends] [EURPROG]
[MW] [MW] [MW] [MW] [%] [%]
Nuclear Energy 17,786 17,705 7,926 10,662 45% 60%
Coal & Lignite 75,252 74,254 -3,563 2,100 -5% 3%
Oil Shale 2,056 2,056 -138 46 -7% 2%
Petroleum products 22,819 23,298 -9,861 -11,026 -43% -47%
Natural gas 104,864 100,308 -619 11,249 -1% 11%
Biomass & Waste 7,634 6,871 12,978 3,198 170% 47%
Hydro 50,144 49,190 3,631 1,989 7% 4%
Wind 29,799 29,186 38,840 39,995 130% 137%
Solar 5,360 6,662 12,560 7,981 234% 120%
Other renewables 735 680 387 21 53% 3%
Total 316,449 310,210 62,141 66,215 20% 21%
installed 2010 net additions until 2020 net additions until 2020
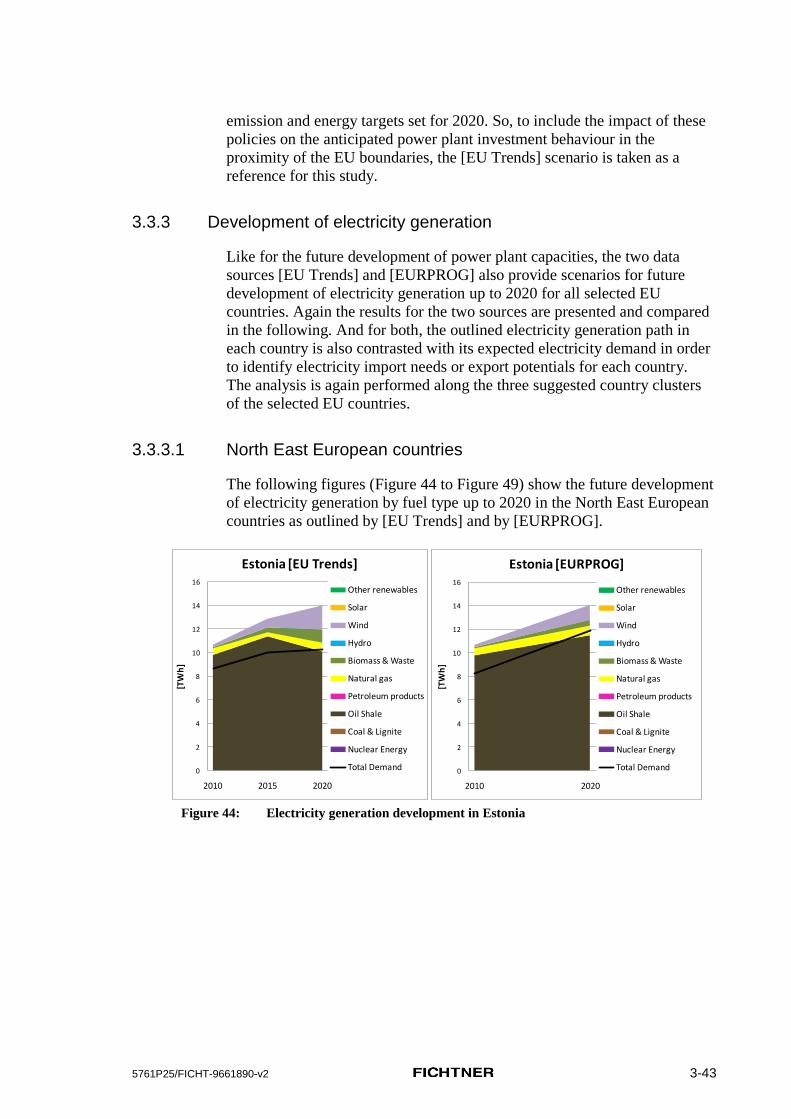
5761P25/FICHT-9661890-v2 3-43
emission and energy targets set for 2020. So, to include the impact of these
policies on the anticipated power plant investment behaviour in the
proximity of the EU boundaries, the [EU Trends] scenario is taken as a
reference for this study.
3.3.3 Development of electricity generation
Like for the future development of power plant capacities, the two data
sources [EU Trends] and [EURPROG] also provide scenarios for future
development of electricity generation up to 2020 for all selected EU
countries. Again the results for the two sources are presented and compared
in the following. And for both, the outlined electricity generation path in
each country is also contrasted with its expected electricity demand in order
to identify electricity import needs or export potentials for each country.
The analysis is again performed along the three suggested country clusters
of the selected EU countries.
3.3.3.1 North East European countries
The following figures (Figure 44 to Figure 49) show the future development
of electricity generation by fuel type up to 2020 in the North East European
countries as outlined by [EU Trends] and by [EURPROG].
Figure 44: Electricity generation development in Estonia
0
2
4
6
8
10
12
14
16
2010 2015 2020
[TW
h]
Estonia [EU Trends]
Other renewables
Solar
Wind
Hydro
Biomass & Waste
Natural gas
Petroleum products
Oil Shale
Coal & Lignite
Nuclear Energy
Total Demand 0
2
4
6
8
10
12
14
16
2010 2020
[TW
h]
Estonia [EURPROG]
Other renewables
Solar
Wind
Hydro
Biomass & Waste
Natural gas
Petroleum products
Oil Shale
Coal & Lignite
Nuclear Energy
Total Demand

5761P25/FICHT-9661890-v2 3-44
Figure 45: Electricity generation development in Finland
Figure 46: Electricity generation development in Latvia
Figure 47: Electricity generation development in Lithuania
0
20
40
60
80
100
120
2010 2015 2020
[TW
h]
Finland [EU Trends]
Other renewables
Solar
Wind
Hydro
Biomass & Waste
Natural gas
Petroleum products
Coal & Lignite
Nuclear Energy
Total Demand0
20
40
60
80
100
120
2010 2020
[TW
h]
Finland [EURPROG]
Other renewables
Solar
Wind
Hydro
Biomass & Waste
Natural gas
Petroleum products
Coal & Lignite
Nuclear Energy
Total Demand
0
1
2
3
4
5
6
7
8
9
10
2010 2015 2020
[TW
h]
Latvia [EU Trends]
Other renewables
Solar
Wind
Hydro
Biomass & Waste
Natural gas
Petroleum products
Coal & Lignite
Nuclear Energy
Total Demand0
1
2
3
4
5
6
7
8
9
10
2010 2020
[TW
h]
Latvia [EURPROG]
Other renewables
Solar
Wind
Hydro
Biomass & Waste
Natural gas
Petroleum products
Coal & Lignite
Nuclear Energy
Total Demand
0
5
10
15
20
25
2010 2015 2020
[TW
h]
Lithuania [EU Trends]
Other renewables
Solar
Wind
Hydro
Biomass & Waste
Natural gas
Petroleum products
Coal & Lignite
Nuclear Energy
Total Demand0
5
10
15
20
25
2010 2020
[TW
h]
Lithuania [EURPROG]
Other renewables
Solar
Wind
Hydro
Biomass & Waste
Natural gas
Petroleum products
Coal & Lignite
Nuclear Energy
Total Demand

5761P25/FICHT-9661890-v2 3-45
Figure 48: Electricity generation development in Poland
Figure 49: Electricity generation development in the Slovak Republic
The figures demonstrate that, among all countries considered, more or less
substantial differences between the figures as given by the two data sources
can be found. Even for countries where total electricity generation figures
almost coincide, the composition of electricity generation by fuel type can
be quite different. The greatest deviations between the two scenarios,
[EU Trends] and [EURPROG], are found for Lithuania and for Poland.
For Poland’s development of electricity generation from coal, [EU Trends]
forecasts increases and [EURPROG] decreases. This is unexpected, since it
is just the reverse of the development of coal-fired power plant capacities
that is expected in the two studies. [EU Trends] predicts a slightly decrease
of Polish coal-fired power plant capacities up to 2020 and [EURPROG]
foresees a strong increase (cf. Figure 31, section 3.3.2.1).
And for Poland even the electricity generation values for 2010 already differ
by more than 10% between the two data sources. The same is observed for
Lithuania and the Slovak Republic. So in Figure 50, the 2010 electricity
generation figures of all North East European countries are compared with
those of [Eurostat] to show up the different assumptions for electricity
0
20
40
60
80
100
120
140
160
180
200
2010 2015 2020
[TW
h]
Poland [EU Trends]
Other renewables
Solar
Wind
Hydro
Biomass & Waste
Natural gas
Petroleum products
Coal & Lignite
Nuclear Energy
Total Demand0
20
40
60
80
100
120
140
160
180
200
2010 2020
[TW
h]
Poland [EURPROG]
Other renewables
Solar
Wind
Hydro
Biomass & Waste
Natural gas
Petroleum products
Coal & Lignite
Nuclear Energy
Total Demand
0
5
10
15
20
25
30
35
40
45
2010 2015 2020
[TW
h]
Slovak Republic [EU Trends]
Other renewables
Solar
Wind
Hydro
Biomass & Waste
Natural gas
Petroleum products
Coal & Lignite
Nuclear Energy
Total Demand0
5
10
15
20
25
30
35
40
45
2010 2020
[TW
h]
Slovak Republic [EURPROG]
Other renewables
Solar
Wind
Hydro
Biomass & Waste
Natural gas
Petroleum products
Coal & Lignite
Nuclear Energy
Total Demand

5761P25/FICHT-9661890-v2 3-46
amounts in 2010 by fuel type. Since [Eurostat] subsumes all electricity
generated from ‘combustible fuels’ within a single classification, this is
illustrated in Figure 50 by striped blocks within the bar charts for [Eurostat].
It turns out that the 2010 generation values for Latvia and Lithuania are
better met by [EU Trends] whereas the 2010 values for Poland and Slovak
Republic are better matched by [EURPROG]. The same result is also
confirmed when total generated electricity values for 2010 by [EU Trends]
and [EURPROG] are compared with statistical values for electricity
generation published by [ENTSO-E].
As a result, we can assume that Poland and the Slovak Republic are
probably not that important as electricity net exporting countries in 2010 as
indicated by [EU Trends] but Lithuania is indeed a large electricity importer
in 2010, as indicated by [EU Trends].
With regard to 2020, for some countries differences may arise because
[EURPROG] seems to expect earlier commissioning of planned new nuclear
power plants than [EU Trends] does.
From the presented development of electricity demand figures, it can be
seen that, for all countries, the total electricity generation increase up to
2020 is stronger than the electricity demand increase (cf. Figure 44 to Figure
49). As a result, Lithuania, Slovak Republic and - according to [EURPROG]
- also Finland are going to become net electricity exporting countries by
2020, Estonia already is, and Latvia is well on the way to becoming one
later.

5761P25/FICHT-9661890-v2 3-47
Figure 50: Electricity generation 2010 in North East European countries
In both scenarios, Lithuania is forecast to more than double its electricity
generation from 2010 to 2020 (cf. Table 25). The largest absolute electricity
generation increments are found either for Finland or for Poland, depending
on the scenario referred to. In total, between 61.5 GW (+21%) and 77.4 GW
(+29%) more electricity generation is expected in the North East European
countries.
Table 25: Electricity generation development in North East European countries
0
2
4
6
8
10
12
14
[Eurostat] [EU Trends] [EURPROG]
[TW
h]
Estonia
Other renewables
Solar
Wind
Hydro
Biomass & Waste
Natural gas
Petroleum products
Oil Shale
Coal & Lignite
Nuclear Energy
0
10
20
30
40
50
60
70
80
90
[Eurostat] [EU Trends] [EURPROG]
[TW
h]
Finland
Other renewables
Solar
Wind
Hydro
Biomass & Waste
Natural gas
Petroleum products
Coal & Lignite
Nuclear Energy
0
1
2
3
4
5
6
7
[Eurostat] [EU Trends] [EURPROG]
[TW
h]
Latvia
Other renewables
Solar
Wind
Hydro
Biomass & Waste
Natural gas
Petroleum products
Coal & Lignite
Nuclear Energy
0
2
4
6
8
10
12
[Eurostat] [EU Trends] [EURPROG]
[TW
h]
Lithuania
Other renewables
Solar
Wind
Hydro
Biomass & Waste
Natural gas
Petroleum products
Coal & Lignite
Nuclear Energy
0
20
40
60
80
100
120
140
160
180
[Eurostat] [EU Trends] [EURPROG]
[TW
h]
Poland
Other renewables
Solar
Wind
Hydro
Biomass & Waste
Natural gas
Petroleum products
Coal & Lignite
Nuclear Energy
0
5
10
15
20
25
30
35
[Eurostat] [EU Trends] [EURPROG]
[TW
h]
Slovak Republic
Other renewables
Solar
Wind
Hydro
Biomass & Waste
Natural gas
Petroleum products
Coal & Lignite
Nuclear Energy
Generation
by country [EU Trends] [EURPROG] [EU Trends] [EURPROG] [EU Trends] [EURPROG]
[GWh] [GWh] [GWh] [GWh] [%] [%]
Estonia 10,697 10,700 3,298 3,400 31% 32%
Finland 79,216 74,500 11,827 27,400 15% 37%
Latvia 5,820 5,300 3,066 3,700 53% 70%
Lithuania 6,416 10,700 7,266 14,100 113% 132%
Poland 162,542 136,100 26,606 17,400 16% 13%
Slovak Republic 31,941 25,200 9,395 11,400 29% 45%
Total 296,632 262,500 61,458 77,400 21% 29%
2010 net additions until 2020 net additions until 2020

5761P25/FICHT-9661890-v2 3-48
By fuel type, largest electricity increases in the North East European
countries will come from nuclear energy and, depending on which scenario
to believe, either from biomass & waste power plants [EU Trends] or from
wind power and natural gas [EURPROG] (see Table 26). For natural gas,
though, [EU Trends] indicates decreasing electricity generation, and for
coal-based electricity both studies expect declines, [EURPROG] even by
20.8 TWh (-14%).
Thanks to its higher generation growth rates compared to demand growth
rates, the whole region of the North East European countries is on its way to
becoming a net electricity exporter by 2020, according to [EURPROG] (see
Figure 51). According to [EU Trends] it already is an electricity exporting
region and will increase its electricity exports up to 2020.
Table 26: Electricity generation development by fuel type in North East European
countries
Figure 51: Electricity generation development in North East European countries
Generation
by fuel [EU Trends] [EURPROG] [EU Trends] [EURPROG] [EU Trends] [EURPROG]
[GWh] [GWh] [GWh] [GWh] [%] [%]
Nuclear Energy 37,244 35,500 38,418 46,600 103% 131%
Coal & Lignite 169,464 146,300 -338 -20,800 0% -14%
Oil Shale 9,824 9,800 290 1,700 3% 17%
Petroleum products 2,982 1,400 -1,621 100 -54% 7%
Natural gas 32,198 32,300 -5,147 24,200 -16% 75%
Biomass & Waste 19,292 11,800 20,304 4,400 105% 37%
Hydro 23,471 22,000 1,010 1,800 4% 8%
Wind 2,141 3,400 8,179 19,200 382% 565%
Solar 16 0 166 100 1038% n.a.
Other renewables 0 0 197 100 n.a. n.a.
Total 296,632 262,500 61,458 77,400 21% 29%
2010 net additions until 2020 net additions until 2020
0
50
100
150
200
250
300
350
400
2010 2020
[TW
h]
[EU Trends]
Other renewables
Solar
Wind
Hydro
Biomass & Waste
Natural gas
Petroleum products
Oil Shale
Coal & Lignite
Nuclear Energy
Demand0
50
100
150
200
250
300
350
400
2010 2020
[TW
h]
[EURPROG]
Other renewables
Solar
Wind
Hydro
Biomass & Waste
Natural gas
Petroleum products
Oil Shale
Coal & Lignite
Nuclear Energy
Demand

5761P25/FICHT-9661890-v2 3-49
3.3.3.2 South East European countries
The following figures (Figure 52 to Figure 56) show the future development
of electricity generation by fuel type up to 2020 in the South East European
countries as outlined by [EU Trends] and by [EURPROG].
Figure 52: Electricity generation development in Bulgaria
Figure 53: Electricity generation development in Greece
0
10
20
30
40
50
60
70
2010 2015 2020
[TW
h]
Bulgaria [EU Trends]
Other renewables
Solar
Wind
Hydro
Biomass & Waste
Natural gas
Petroleum products
Coal & Lignite
Nuclear Energy
Total Demand0
10
20
30
40
50
60
70
2010 2020
[TW
h]
Bulgaria [EURPROG]
Other renewables
Solar
Wind
Hydro
Biomass & Waste
Natural gas
Petroleum products
Coal & Lignite
Nuclear Energy
Total Demand
0
10
20
30
40
50
60
70
80
2010 2015 2020
[TW
h]
Greece [EU Trends]
Other renewables
Solar
Wind
Hydro
Biomass & Waste
Natural gas
Petroleum products
Coal & Lignite
Nuclear Energy
Total Demand0
10
20
30
40
50
60
70
80
2010 2020
[TW
h]
Greece [EURPROG]
Other renewables
Solar
Wind
Hydro
Biomass & Waste
Natural gas
Petroleum products
Coal & Lignite
Nuclear Energy
Total Demand
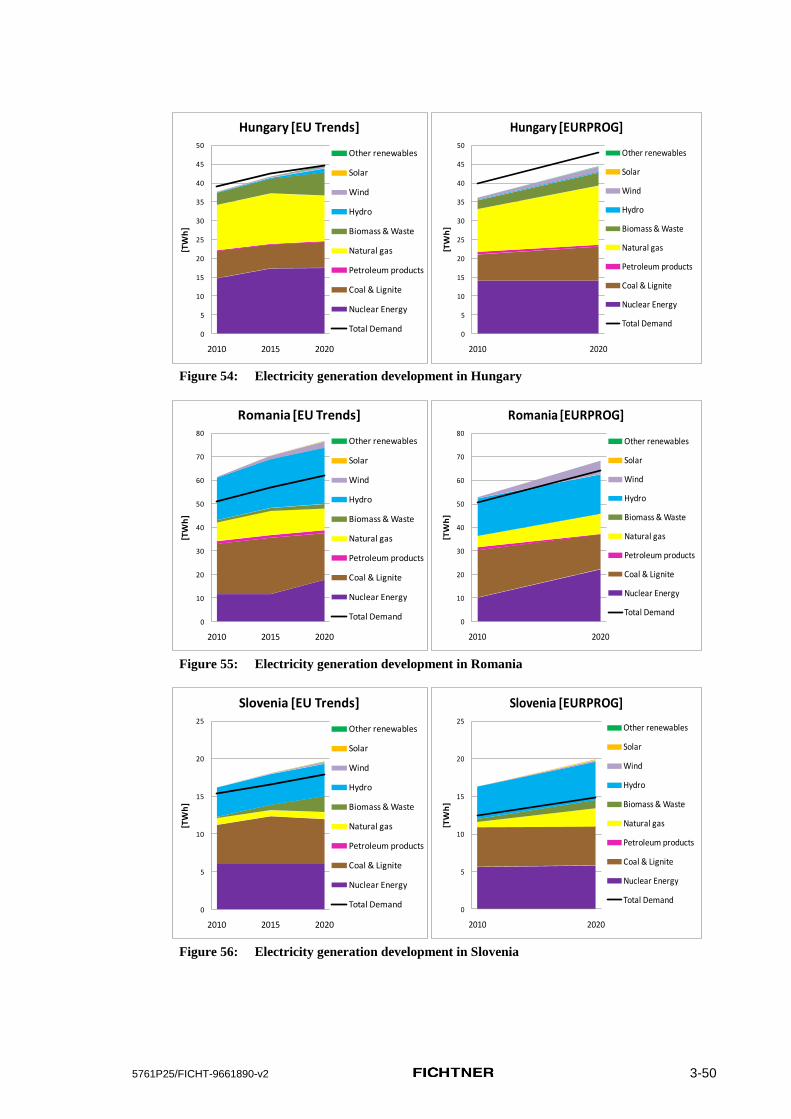
5761P25/FICHT-9661890-v2 3-50
Figure 54: Electricity generation development in Hungary
Figure 55: Electricity generation development in Romania
Figure 56: Electricity generation development in Slovenia
0
5
10
15
20
25
30
35
40
45
50
2010 2015 2020
[TW
h]
Hungary [EU Trends]
Other renewables
Solar
Wind
Hydro
Biomass & Waste
Natural gas
Petroleum products
Coal & Lignite
Nuclear Energy
Total Demand0
5
10
15
20
25
30
35
40
45
50
2010 2020
[TW
h]
Hungary [EURPROG]
Other renewables
Solar
Wind
Hydro
Biomass & Waste
Natural gas
Petroleum products
Coal & Lignite
Nuclear Energy
Total Demand
0
10
20
30
40
50
60
70
80
2010 2015 2020
[TW
h]
Romania [EU Trends]
Other renewables
Solar
Wind
Hydro
Biomass & Waste
Natural gas
Petroleum products
Coal & Lignite
Nuclear Energy
Total Demand0
10
20
30
40
50
60
70
80
2010 2020
[TW
h]
Romania [EURPROG]
Other renewables
Solar
Wind
Hydro
Biomass & Waste
Natural gas
Petroleum products
Coal & Lignite
Nuclear Energy
Total Demand
0
5
10
15
20
25
2010 2015 2020
[TW
h]
Slovenia [EU Trends]
Other renewables
Solar
Wind
Hydro
Biomass & Waste
Natural gas
Petroleum products
Coal & Lignite
Nuclear Energy
Total Demand0
5
10
15
20
25
2010 2020
[TW
h]
Slovenia [EURPROG]
Other renewables
Solar
Wind
Hydro
Biomass & Waste
Natural gas
Petroleum products
Coal & Lignite
Nuclear Energy
Total Demand

5761P25/FICHT-9661890-v2 3-51
Also for the analysed South East European countries more or less
substantial differences between the figures as given by the two data sources
can be found. In particular, also the development of the composition of
electricity generation by fuel type can differ quite a lot.
Except for Slovenia, the electricity generation values for 2010 already differ
significantly, as shown in Figure 57, where the 2010 electricity generation
figures of all South East European countries are compared with the ones by
[Eurostat], to see the differing assumptions for electricity amounts in 2010
by fuel type. Again, [Eurostat]’s subsumed ‘combustible fuels’ category is
illustrated in Figure 57 with striped blocks within the bar charts for
[Eurostat].
It turns out that the 2010 generation values for Bulgaria are slightly better
met by [EU Trends] whereas the 2010 values for Greece, Hungary and
Romania are better matched by [EURPROG]. The same result is also
confirmed when total generated electricity values for 2010 by [EU Trends]
and [EURPROG] are compared with statistical values for electricity
generation published by [ENTSO-E].
As a result we can assume that net electricity imports in 2010 have probably
been higher in Hungary as indicated by [EU Trends] and, particularly in
Romania, net electricity exports have been considerably lower than
indicated by [EU Trends].
From the presented development of electricity demand figures in
[EURPROG], it can be seen that electricity generation more or less keeps
pace with electricity demand development for all countries (cf. Figure 52 to
Figure 56). All countries are forecast to keep their status up to 2020 as either
net electricity exporters (Bulgaria, Romania, Slovenia) or net electricity
importers (Greece, Hungary).

5761P25/FICHT-9661890-v2 3-52
Figure 57: Electricity generation 2010 in South East European countries
In both scenarios, all countries can expect to increase their electricity
generation by about 20% to 30%, except for Bulgaria which is forecast by
[EURPROG] to increase generation even by 49% (cf. Table 27). The largest
electricity producers at present are Greece and Romania, and the smallest is
Slovenia. In total, between 46.6 TWh (+22%) and 60.5 TWh (+29%) more
electricity generation is expected in the South East European countries.
0
5
10
15
20
25
30
35
40
45
50
[Eurostat] [EU Trends] [EURPROG]
[TW
h]
Bulgaria
Other renewables
Solar
Wind
Hydro
Biomass & Waste
Natural gas
Petroleum products
Coal & Lignite
Nuclear Energy
0
10
20
30
40
50
60
70
[Eurostat] [EU Trends] [EURPROG]
[TW
h]
Greece
Other renewables
Solar
Wind
Hydro
Biomass & Waste
Natural gas
Petroleum products
Coal & Lignite
Nuclear Energy
0
5
10
15
20
25
30
35
40
[Eurostat] [EU Trends] [EURPROG]
[TW
h]
Hungary
Other renewables
Solar
Wind
Hydro
Biomass & Waste
Natural gas
Petroleum products
Coal & Lignite
Nuclear Energy
0
10
20
30
40
50
60
70
[Eurostat] [EU Trends] [EURPROG]
[TW
h]
Romania
Other renewables
Solar
Wind
Hydro
Biomass & Waste
Natural gas
Petroleum products
Coal & Lignite
Nuclear Energy
0
2
4
6
8
10
12
14
16
18
[Eurostat] [EU Trends] [EURPROG]
[TW
h]
Slovenia
Other renewables
Solar
Wind
Hydro
Biomass & Waste
Natural gas
Petroleum products
Coal & Lignite
Nuclear Energy

5761P25/FICHT-9661890-v2 3-53
Table 27: Electricity generation development in South East European countries
By fuel type, the largest electricity generation increases in the South East
European countries will again come from nuclear energy (see Table 28),
as is also the case for North East European countries (cf. above). There are
enormous differences between the two scenarios regarding assumptions for
future electricity additions from natural gas power plants. Like for the North
East European countries, [EURPROG] is again much more optimistic for
future additional electricity generation from natural gas (+22.8 TWh) up to
2020 in the South East European countries. [EU Trends] only expects
+4 TWh more electricity from natural gas in 2020. Both studies expect
declines in coal-based electricity of between 5.4 and 5.6 TWh by 2020.
In total, the South East European countries are now and will be in the future
generating more electricity than demanded according to both scenarios and
they are expected to increase their net electricity exports (see Figure 58).
Table 28: Electricity generation development by fuel type in South East European
countries
Generation
by country [EU Trends] [EURPROG] [EU Trends] [EURPROG] [EU Trends] [EURPROG]
[GWh] [GWh] [GWh] [GWh] [%] [%]
Bulgaria 39,688 44,100 8,839 21,800 22% 49%
Greece 61,331 57,300 12,046 11,300 20% 20%
Hungary 37,696 36,100 7,000 8,400 19% 23%
Romania 61,460 52,900 15,301 15,400 25% 29%
Slovenia 16,192 16,300 3,452 3,600 21% 22%
Total 216,367 206,700 46,638 60,500 22% 29%
2010 net additions until 2020 net additions until 2020
Generation
by fuel [EU Trends] [EURPROG] [EU Trends] [EURPROG] [EU Trends] [EURPROG]
[GWh] [GWh] [GWh] [GWh] [%] [%]
Nuclear Energy 47,008 43,600 16,493 26,900 35% 62%
Coal & Lignite 84,727 84,100 -5,370 -5,600 -6% -7%
Petroleum products 9,649 9,100 -3,126 -5,400 -32% -59%
Natural gas 35,908 33,100 3,957 22,800 11% 69%
Biomass & Waste 4,718 3,100 9,216 2,100 195% 68%
Hydro 30,141 27,600 7,630 1,700 25% 6%
Wind 4,108 6,000 14,307 16,900 348% 282%
Solar 108 100 2,948 1,000 2730% 1000%
Other renewables 0 0 583 100 n.a. n.a.
Total 216,367 206,700 46,638 60,500 22% 29%
2010 net additions until 2020 net additions until 2020

5761P25/FICHT-9661890-v2 3-54
Figure 58: Electricity generation development in South East European countries
3.3.3.3 Mediterranean countries
Figure 59 and Figure 60 show the future development of electricity
generation by fuel type up to 2020 in Italy and Spain as outlined by
[EU Trends] and by [EURPROG].
Figure 59: Electricity generation development in Italy
For Italy, total electricity generation figures by the two data sources almost
agree, although the composition of electricity generation by fuel type
develops differently up to 2020. And particularly the electricity demand
increase up to 2020 is seen to be much lower by [EU Trends] than by
[EURPORG].
0
50
100
150
200
250
300
2010 2020
[TW
h]
[EU Trends]
Other renewables
Solar
Wind
Hydro
Biomass & Waste
Natural gas
Petroleum productsCoal & Lignite
Nuclear Energy
0
50
100
150
200
250
300
2010 2020
[TW
h]
[EURPROG]
Other renewables
Solar
Wind
Hydro
Biomass & Waste
Natural gas
Petroleum products
Coal & Lignite
Nuclear Energy
Demand
0
50
100
150
200
250
300
350
400
450
500
2010 2015 2020
[TW
h]
Italy [EU Trends]
Other renewables
Solar
Wind
Hydro
Biomass & Waste
Natural gas
Petroleum products
Coal & Lignite
Nuclear Energy
Total Demand0
50
100
150
200
250
300
350
400
450
500
2010 2020
[TW
h]
Italy [EURPROG]
Other renewables
Solar
Wind
Hydro
Biomass & Waste
Natural gas
Petroleum products
Coal & Lignite
Nuclear Energy
Total Demand

5761P25/FICHT-9661890-v2 3-55
Figure 60: Electricity generation development in Spain
For Spain, too, discrepancies between the future development of electricity
generation and its make-up by fuel type are apparent. Even the electricity
generation values for 2010 already differ significantly for Spain, as shown
by the comparison in Figure 61 with the figures from [Eurostat]. Again,
[Eurostat]’s subsumed ‘combustible fuels’ category is illustrated in Figure
61 with striped blocks in the bar charts for [Eurostat].
It turns out that the 2010 generation value for Spain is better matched by
[EURPROG] than by [EU Trends]. This is confirmed when the total
electricity generated in 2010 in Spain is compared with the relevant
statistical value published by [ENTSO-E].
From the presented development of electricity demand figures, it can be
seen that electricity generation roughly keeps pace with electricity demand
development for both countries (cf. Figure 59 and Figure 60). That’s why
Italy is forecast to remain a net electricity importer up to 2020 and Spain
will continue to almost balance its own electricity demand with its own
electricity generation.
Figure 61: Electricity generation in 2010 in Mediterranean countries
[EU Trends] sees for both countries an electricity generation increase of
about 20% and [EURPROG] one of about 23%-24% (cf. Table 29). In total,
0
50
100
150
200
250
300
350
400
2010 2015 2020
[TW
h]
Spain [EU Trends]
Other renewables
Solar
Wind
Hydro
Biomass & Waste
Natural gas
Petroleum products
Coal & Lignite
Nuclear Energy
Total Demand0
50
100
150
200
250
300
350
400
2010 2020
[TW
h]
Spain [EURPROG]
Other renewables
Solar
Wind
Hydro
Biomass & Waste
Natural gas
Petroleum products
Coal & Lignite
Nuclear Energy
Total Demand
0
50
100
150
200
250
300
350
[Eurostat] [EU Trends] [EURPROG]
[TW
h]
Italy
Other renewables
Solar
Wind
Hydro
Biomass & Waste
Natural gas
Petroleum products
Coal & Lignite
Nuclear Energy
0
50
100
150
200
250
300
350
[Eurostat] [EU Trends] [EURPROG]
[TW
h]
Spain
Other renewables
Solar
Wind
Hydro
Biomass & Waste
Natural gas
Petroleum products
Coal & Lignite
Nuclear Energy
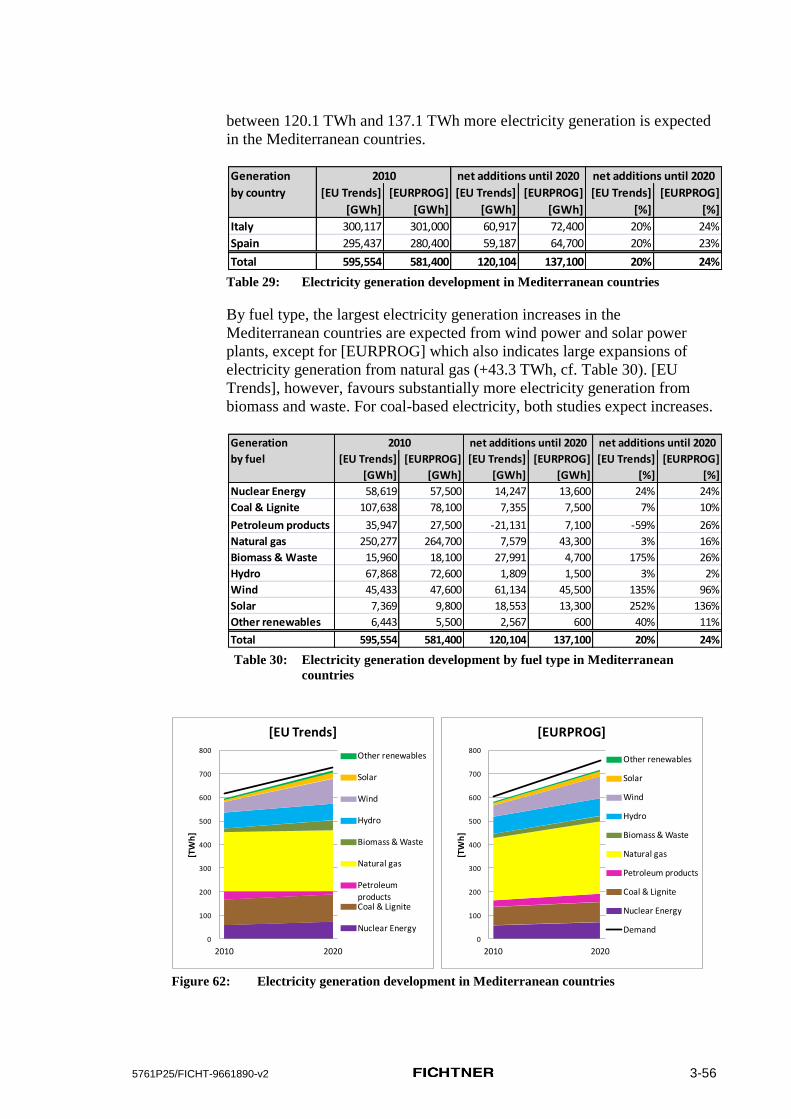
5761P25/FICHT-9661890-v2 3-56
between 120.1 TWh and 137.1 TWh more electricity generation is expected
in the Mediterranean countries.
Table 29: Electricity generation development in Mediterranean countries
By fuel type, the largest electricity generation increases in the
Mediterranean countries are expected from wind power and solar power
plants, except for [EURPROG] which also indicates large expansions of
electricity generation from natural gas (+43.3 TWh, cf. Table 30). [EU
Trends], however, favours substantially more electricity generation from
biomass and waste. For coal-based electricity, both studies expect increases.
Table 30: Electricity generation development by fuel type in Mediterranean
countries
Figure 62: Electricity generation development in Mediterranean countries
Generation
by country [EU Trends] [EURPROG] [EU Trends] [EURPROG] [EU Trends] [EURPROG]
[GWh] [GWh] [GWh] [GWh] [%] [%]
Italy 300,117 301,000 60,917 72,400 20% 24%
Spain 295,437 280,400 59,187 64,700 20% 23%
Total 595,554 581,400 120,104 137,100 20% 24%
2010 net additions until 2020 net additions until 2020
Generation
by fuel [EU Trends] [EURPROG] [EU Trends] [EURPROG] [EU Trends] [EURPROG]
[GWh] [GWh] [GWh] [GWh] [%] [%]
Nuclear Energy 58,619 57,500 14,247 13,600 24% 24%
Coal & Lignite 107,638 78,100 7,355 7,500 7% 10%
Petroleum products 35,947 27,500 -21,131 7,100 -59% 26%
Natural gas 250,277 264,700 7,579 43,300 3% 16%
Biomass & Waste 15,960 18,100 27,991 4,700 175% 26%
Hydro 67,868 72,600 1,809 1,500 3% 2%
Wind 45,433 47,600 61,134 45,500 135% 96%
Solar 7,369 9,800 18,553 13,300 252% 136%
Other renewables 6,443 5,500 2,567 600 40% 11%
Total 595,554 581,400 120,104 137,100 20% 24%
2010 net additions until 2020 net additions until 2020
0
100
200
300
400
500
600
700
800
2010 2020
[TW
h]
[EU Trends]
Other renewables
Solar
Wind
Hydro
Biomass & Waste
Natural gas
Petroleum productsCoal & Lignite
Nuclear Energy0
100
200
300
400
500
600
700
800
2010 2020
[TW
h]
[EURPROG]
Other renewables
Solar
Wind
Hydro
Biomass & Waste
Natural gas
Petroleum products
Coal & Lignite
Nuclear Energy
Demand

5761P25/FICHT-9661890-v2 3-57
3.3.3.4 Summary: Development of electricity generation
In summary, it can be stated that electricity generation is generally expected
to increase in all of the selected EU countries by 2020, with the highest
growth rates anticipated particularly in the Baltic countries. Otherwise, the
expected growth rates do not differ too much between the regional clusters
and also between the two scenarios presented by [EU Trends] and by
[EURPROG] (see Table 31). [EURPROG] generally represents the slightly
more optimistic view on additional future electricity generation with
+26% vs. +21% by [EU Trends]) and this particularly for power from
natural gas-fired power plants. Accordingly, the additional electricity from
natural gas in 2020 may be up to 90.3 TWh as indicated by [EURPROG] or
only 6.4 TWh according to [EU Trends].
This difference between the two studies is even greater than their total
forecast discrepancy, which is 228.2 TWh additional electricity production
predicted by [EU Trends] and 275 TWh predicted by [EURPROG]. [EU
Trends] for its part anticipates much more electricity generation expansion
from renewables, particularly from biomass & waste fuelled power plants
and also more solar power generation (cf. Table 32). [EURPROG] on its
part particularly predicts a reduction of electricity production from coal
(-17.2 TWh). At least no significant increase of electricity generated from
coal is anticipated according to [EU Trends].
Table 31: Electricity generation development in all selected EU countries
Table 32: Electricity generation development by fuel type in all selected EU
countries
Generation
[EU Trends] [EURPROG] [EU Trends] [EURPROG] [EU Trends] [EURPROG]
[GWh] [GWh] [GWh] [GWh] [%] [%]
North East 296,632 262,500 61,458 77,400 21% 29%
South East 216,367 206,700 46,638 60,500 22% 29%
Mediterranean 595,554 581,400 120,104 137,100 20% 24%
Total 1,108,553 1,050,600 228,200 275,000 21% 26%
2010 net additions until 2020 net additions until 2020
Generation
by fuel [EU Trends] [EURPROG] [EU Trends] [EURPROG] [EU Trends] [EURPROG]
[GWh] [GWh] [GWh] [GWh] [%] [%]
Nuclear Energy 142,871 136,600 69,158 87,100 48% 64%
Coal & Lignite 361,829 308,500 1,647 -18,900 0% -6%
Oil Shale 9,824 9,800 290 1,700 3% 17%
Petroleum products 48,578 38,000 -25,878 1,800 -53% 5%
Natural gas 318,383 330,100 6,389 90,300 2% 27%
Biomass & Waste 39,970 33,000 57,511 11,200 144% 34%
Hydro 121,480 122,200 10,449 5,000 9% 4%
Wind 51,682 57,000 83,620 81,600 162% 143%
Solar 7,493 9,900 21,667 14,400 289% 145%
Other renewables 6,443 5,500 3,347 800 52% 15%
Total 1,108,553 1,050,600 228,200 275,000 21% 26%
net additions until 20202010 net additions until 2020

5761P25/FICHT-9661890-v2 3-58
Figure 63: Electricity generation development in all selected EU countries
In total, over all selected EU countries, the electricity generation increase is
outpacing the demand increase up to 2020 and this is indicated in both
studies (see Figure 63). Growth rates for generation of 21% [EU Trends]
and 26% [EURPROG] are to be compared with growth rates for demand of
only 18% [EU Trends] and 23% [EURPROG] (cf. Table 6). The main
difference is that [EU Trends] sees the countries in sum almost already now
to be almost net electricity exporters whereas [EURPROG] is not expecting
this before 2020.
This trend towards more and more electricity exports is mainly driven by the
North East and South East European countries, which are either going to keep
their status as net electricity exporting regions (as is the case for South East
European countries) or are going to achieve it by2020. Net importers in 2010
are only the Mediterranean countries and it is expected that they will retain and
even expand that status at least until 2020.
Combining the analysis of sections 3.3.2 and 3.3.3 and the results from the
two studies, [EU Trends] and [EURPROG], regarding future development
of power capacities and generation, it is noted that the development of total
electricity generation and of generation capacities seems to be better
determined than the composition of future electricity generation.
The quite different results from country to country but also in sum, as
obtained from the two data sources, [EU Trends] and [EURPROG], cannot
be explained. The reason is that neither the scenario methods nor the basis
of expert judgement impacting the results of both studies are sufficiently
transparent. This holds particularly for [EURPROG], for which the scenario
may be obtained with different approaches and assumptions from the
EURELECTRIC members in the various countries. [EU Trends] refers to a
scenario framework that explicitly includes the latest climate policy
measures on EU level but also the mandatory national greenhouse gas
emission and energy targets set for 2020. So, to include the impact of these
policies on the anticipated power plant investment behaviour in the
proximity of the EU boundaries, the [EU Trends] scenario is taken as a
reference for this study.
0
200
400
600
800
1,000
1,200
1,400
1,600
2010 2020
[TW
h]
[EU Trends]Other renewables
Solar
Wind
Hydro
Biomass & Waste
Natural gas
Petroleum products
Oil Shale
Coal & Lignite
Nuclear Energy
Demand 0
200
400
600
800
1,000
1,200
1,400
1,600
2010 2020
[TW
h]
[EURPROG]
Other renewables
Solar
Wind
Hydro
Biomass & Waste
Natural gas
Petroleum products
Coal & Lignite
Nuclear Energy
Demand

5761P25/FICHT-9661890-v2 3-59
3.4 Need for Investments in New Power Capacities
In section 3.3 of this report, the future development of electricity supply is
investigated. This embraces anticipated power plant retirements, net
capacity additions and the associated development of electricity generation
up to 2020 for all selected EU countries. In this section, the needs for new
gross capacity additions up to 2020 are derived from this analysis.
Needed capacity additions are determined as net additions of capacities4
plus the necessary replacement of power plants that are going to be retired
by 2020. Regarding net additions, the two scenarios given by [EU Trends]
and [EURPROG] were compared and analysed in section 3.3.2. Capacity
figures of these two data sources are expressed in net electrical capacities.
Power plant retirements, though, were calculated from [WEPP] as presented
in section 3.3.1 and are expressed in gross electrical capacities.
In order to calculate only with comparable figures that are all expressed as
net electrical capacities4 and to maintain data consistency within datasets
taken only from the same data sources, the following approach is taken:
1. For each selected EU country and for each power plant technology as
classified by its fuel type, the relative capacity retirement from 2010 to
2020 as a%age as derived from [WEPP] (cf. section 3.3.1) is applied to
the respective power plant capacities installed in 2010 as listed by
[EU Trends]. This yields an estimate of the capacity retirement up to
2020 as given by [EU Trends]. To these ‘[EU Trends] capacity
retirements’ the net additions from the [EU Trends] Scenario are added
in order to obtain ‘[EU Trends] gross additions of capacities by 2020’
which represent the need for investments according to [EU Trends].
The results are presented in section 3.4.1
2. The same approach is applied with data of [EURPROG] instead of
[EU Trends] in order to obtain ‘[EURPROG] gross additions of
capacities by 2020’ which represent the needs for investments
according to [EURPROG]. These results are also presented in
section 3.4.1.
3. After comparing the two scenarios, the [EU Trends] Scenario is
selected due to its relevance for this study and because the
methodological approach applied in [EURPROG] is not transparent
enough. The needs for new capacity investments based on [EU Trends]
are thus further analysed in section 3.4.2.
4 ‘Capacity net additions’ should not be confused with ‘net electrical capacity’. The latter
term is defined for each power plant as its gross electrical capacity less the electrical power
required for the operation of the power plant itself. ‘Net additions’ of capacities, though,
refer to gross additions of new power plant capacities less decommissioned power plant
capacities. ‘Capacity net additions’ are therefore identical to the effective overall capacity
increase or decrease.

5761P25/FICHT-9661890-v2 3-60
3.4.1 Need for new power plant capacities derived from [EU Trends] and [EURPROG]
The need for new power capacities by 2020 as derived from [EU Trends]
and from [EURPROG] are presented in Figure 64 and Figure 65,
respectively. The figures are given in net electrical power plant capacities.
Figure 64: Need for new power plant capacities by country: [EU Trends] Scenario
Figure 65: Need for new power plant capacities by country: [EURPROG] Scenario

5761P25/FICHT-9661890-v2 3-61
At first glance, the different roles that Italy and Poland play in both
scenarios become visible. [EU Trends] determined much more net additions
for Italy than [EURPROG] did. Instead [EURPROG] assumes considerably
more net additions for Poland so that Italy and Poland almost require the
same amount of new power plant capacities at a level of about 30 GW by
2020 as calculated for the [EURPROG] Scenario. The high requirement for
new power plant capacities in Spain of about 41 to 42 GW is confirmed by
both scenarios. Apart from this, large differences between the two scenarios
not only for the absolute amount of new power plant requirements but also
for the required type of power plants are noted for almost all countries.
Instructive is an analysis of required new power plant capacities by fuel type
and country, as compared for both scenarios in Table 33 and Table 34.
Interestingly, the identified investment needs for power plants by almost all
fuel types are not all that different between [EU Trends] and [EURPROG] if
summed up over all the considered EU countries. Major differences are only
obtained for investments in new natural gas fired power plants and in new
biomass and waste power plants. The first are preferred by [EURPROG] by
an increment of about 10.5 GW and the latter are preferred by [EU Trends]
by an increment of about 9.7 GW. To a minor degree, [EU Trends] also sees
more chances for solar power plant additions (increment 4.6 GW), whereas
[EURPROG] foresees about 5.2 GW more investments in coal power plants
(the latter particularly for Poland, cf. section 3.3.2.1). Clearly [EU Trends]
anticipates generally more additions of renewable power plants whereas
[EURPROG] focuses more on fossil fuel-fired power plant additions.
Despite net capacity additions, although coal power plants are in general
perceived to be on a slightly decreasing trend as implied at least by [EU
Trends] (and apart from the case of Poland also by [EURPROG], cf. section
3.3.2.4 and Table 24), it is the technology with the second highest capacity
additions required by 2020 in the selected EU countries. More investments
in terms of GW capacity are only predicted for wind power (ca. 50 GW)
(see Table 33 and Table 34).
There is almost no difference between the total new power plant capacity
needs between the two scenarios and these are close at 153.8 GW
[EU Trends] and 155.4 GW [EURPROG].

5761P25/FICHT-9661890-v2 3-62
Table 33: Need for new power plant capacities for the [EU Trends] Scenario
Table 34: Need for new power plant capacities for the [EURPROG] Scenario
3.4.2 Scenario for new power plant capacity requirements
The quite different results from country to country but also in sum obtained
from the two data sources, [EU Trends] and [EURPROG], cannot be
explained. The reason is that neither the scenario methods nor the basis of
expert judgement impacting the results of the two studies are transparent
enough. This holds particularly for [EURPROG], for which the scenario
may be obtained with different approaches and assumptions from the
EURELECTRIC members in the various countries.
[EU Trends]
new power
plant capacities
[MW] Nu
cle
ar
En
erg
y
Co
al
& L
ign
ite
Oil
Sh
ale
Pe
tro
leu
m p
rod
ucts
Na
tura
l G
as
Bio
ma
ss &
wa
ste
Hy
dro
Win
d
So
lar
Oth
er
ren
ew
ab
les
To
tal
Bulgaria 985 1,269 0 0 246 243 484 1,347 70 7 4,651
Estonia 0 0 1,331 0 123 118 1 822 2 0 2,397
Finland 1,516 957 0 168 587 3,221 1,434 1,050 76 0 9,010
Greece 0 746 0 537 3,227 436 609 4,799 1,526 31 11,911
Hungary 320 650 0 0 1,259 818 409 413 76 22 3,967
Italy 1,579 4,127 0 2,698 525 3,935 7,161 18,778 2,930 270 42,003
Latvia 0 229 0 25 25 155 73 318 8 0 833
Lithuania 758 0 0 314 1,666 159 26 487 36 0 3,446
Poland 1,515 9,987 0 0 543 2,034 255 1,177 17 16 15,543
Romania 752 4,183 0 923 2,823 185 1,431 1,370 156 6 11,829
Slovak Republic 1,912 954 0 110 481 452 458 506 27 7 4,908
Slovenia 0 873 0 2 0 288 439 254 47 4 1,907
Spain 3,471 2,420 0 2,120 619 2,530 3,548 18,898 7,589 243 41,437
Total 12,808 26,395 1,331 6,897 12,124 14,573 16,328 50,220 12,560 606 153,842
North East 5,701 12,127 1,331 617 3,425 6,139 2,247 4,360 166 23 36,136
South East 2,057 7,721 0 1,462 7,555 1,970 3,372 8,184 1,875 70 34,265
Mediterranean 5,050 6,547 0 4,817 1,144 6,465 10,709 37,676 10,519 513 83,440
[EURPROG]
new power
plant capacities
[MW] Nu
cle
ar
En
erg
y
Co
al
& L
ign
ite
Oil
Sh
ale
Pe
tro
leu
m p
rod
ucts
Na
tura
l G
as
Bio
ma
ss &
wa
ste
Hy
dro
Win
d
So
lar
Oth
er
ren
ew
ab
les
To
tal
Bulgaria 1,900 2,325 0 0 773 0 470 1,617 0 0 7,085
Estonia 0 0 1,515 0 171 30 1 527 0 0 2,244
Finland 3,205 446 0 147 556 980 1,643 1,260 0 0 8,237
Greece 0 1,382 0 0 3,248 14 491 3,977 840 0 9,952
Hungary 0 1,241 0 129 2,360 630 30 470 0 20 4,880
Italy 1,579 3,935 0 2,878 928 2,111 7,161 8,670 2,580 200 30,042
Latvia 0 400 0 0 425 50 70 237 0 0 1,182
Lithuania 1,600 0 0 196 2,016 9 0 369 0 0 4,190
Poland 0 18,691 0 0 3,258 210 93 6,884 0 1 29,137
Romania 1,330 365 0 350 3,525 30 622 3,095 0 0 9,316
Slovak Republic 1,988 1,170 0 156 1,129 114 269 70 117 0 5,013
Slovenia 0 656 0 169 305 53 583 104 127 0 1,997
Spain 3,911 967 0 1,875 3,944 631 3,187 23,298 4,317 0 42,130
Total 15,513 31,578 1,515 5,900 22,636 4,861 14,620 50,579 7,981 221 155,403
North East 6,793 20,707 1,515 500 7,555 1,392 2,076 9,347 117 1 50,001
South East 3,230 5,969 0 648 10,210 727 2,196 9,263 967 20 33,230
Mediterranean 5,490 4,903 0 4,753 4,871 2,742 10,348 31,968 6,897 200 72,172

5761P25/FICHT-9661890-v2 3-63
[EU Trends] refers to a scenario framework that explicitly includes the latest
climate policy measures on EU level but also the mandatory national
greenhouse gas emission and energy targets set for 2020. This is also
reflected in the fact, that according to the scenario based on [EU Trends],
higher capacity requirements for low CO2 emission technologies such as
biomass power plants and solar power are identified, whereas [EURPROG]
sees more new capacity requirements for fossil fuel-fired power plants.
Interesting to note is that, according to both scenarios, the identified
requirements for new wind power plants in the EU countries concerned are
almost identical for both scenarios at more than 50 GW, but their allocation
of these new capacity requirements to the countries is quite different.
This study focuses on the analysis of the impact of the European Emission
Trading Scheme on power plant investments, given EU policies on national
greenhouse gas emission and energy targets set for 2020. Since this is only
explicitly reflected in the scenario as set out by [EU Trends], the calculated
[EU Trends] Scenario for capacity investment requirements (see Table 33)
is thus selected as being the relevant scenario for the purpose of this study.
According to the [EU Trends] Scenario, the total 153.8 GW capacity gap
from 2010 to 2020 is expected to be filled mainly by about 50.2 GW wind
power plant investments and about 26.4 GW coal power plant investments
(cf. Table 33). Wind power capacity additions focus on the two
Mediterranean countries Italy and Spain, whereas investments in new coal
fired power plants concentrate particularly on Poland.
Apart from these two power plant technologies (wind power and coal power
plants), further significant market shares for new power plant erections are
predicted for hydropower (16.3 GW, with the largest shares in the two
Mediterranean countries) and biomass and waste power plants (1.6 GW,
with significant shares in Italy and Finland). Required new capacities for
nuclear energy, solar power and natural gas fired power plants all amount to
about 12 GW. New solar power capacities will be particularly concentrated
in the Mediterranean countries and new natural gas power plants in South
East European countries, particularly in Greece and Romania. New nuclear
power plants are particularly required in the North East European countries,
but also in the Mediterranean countries.
As a result of the methodology applied it turns out that Estonia is expected
to build about 1.3 GW new oil shale-fired power plants, which is about 65%
of its installed capacity in 2010. This is not regarded to be realistic and
actually virtually no new oil shale-fired power plant investments are
expected for Estonia up to 2020. But since the age of the oil shale-fired
power plants in Estonia according to [WEPP] indicates substantial
retirements of this type of power plant and since, in contrast, [EU Trends]
implies a much lower retirement of these power plant capacities, it turns out
by the applied calculation that new capacities are needed in order to fill the
gap between existing decreasing capacities indicated by [WEPP] and higher
total installed capacities as outlined by [EU Trends]. Such constructive
vagueness is a result of the method applied.

5761P25/FICHT-9661890-v2 3-64
The regional focus is illustrated by the three figures below (Figure 66 to
Figure 68), which show the shares of new power plant capacity additions for
each country cluster considered.
Figure 66: New power plant capacities up to 2020 in North East European countries
Figure 67: New power plant capacities up to 2020 in South East European countries

5761P25/FICHT-9661890-v2 3-65
Figure 68 : New power plant capacities up to 2020 in Mediterranean countries
As shown by these three figures, power plant investments in North East
European countries will be dominated by new coal power plants and in
Mediterranean countries by new wind power plants. In the South East
European countries both technologies, coal power plants and wind power
plants, are dominant too. But additionally also new natural gas-fired power
plants play a major role in South East Europe.
Finally, Figure 69 depicts the shares of the country clusters regarding the
capacity gaps to be filled by 2020. 54% of new power plant capacities of the
selected EU countries are required in the two Mediterranean countries, 24%
in the six North East European countries and 22% in the five South East
European countries. This means that the two Mediterranean countries are
the main ones of the thirteen selected in which more than 50% of all new
power plant capacities are expected by 2020.
This is, though, in accordance with the electricity demand of the thirteen EU
countries investigated, which is also to more than 50% allocated to the two
Mediterranean countries. Table 35 compares the shares that the country
clusters have on the total electricity demand and on the new capacities as
derived from the [EU Trends] data.
50506%
65478% 4817
6%
11441%
64658%
1070913%
3767645%
1051912%
5131%
Mediterranean countries [MW]
Nuclear Energy
Coal + Lignite
Petroleum products
Gas
Biomass & waste
Hydro
Wind
Solar
Other renewables

5761P25/FICHT-9661890-v2 3-66
Figure 69: New power plant capacities up to 2020 by country cluster
Table 35: Electricity demand and new
capacities up to 2020 by country cluster
shares, as derived from [EU Trends].

5761P25/FICHT-9661890-v2 3-67
3.5 Conclusions on Power Plant Capacity Needs
In this chapter the development of electricity demand and supply in the
selected EU countries is investigated. The analysis is done for those
particular EU member states that either already have electricity
interexchange or at least have future electricity interexchange options across
direct borders or overseas to non-EU countries.
For the sake of clarity, the selected EU countries are classified into three
country clusters: North East European, South East European and
Mediterranean countries. As it turns out ex post, the proposed clustering is
reasonable in the sense that countries with similar characteristics are
bundled within the clusters.
Regarding power plant capacities and their development in the selected EU
countries, the analysed data sources [EU Trends] and [EURPROG] are
ambiguous. This highlights the restricted predictive power of the
predetermined scenarios outlined by the two studies. But also figures for
2010 already vary significantly from study to study. By comparison with
statistical data, no clear preference for one or the other study can be found.
Despite comprising only two countries and having the lowest%age net
capacity additions up to 2020 in relative terms (+18%), in absolute figures
the Mediterranean countries will face the highest capacity net additions of
about 35 GW according to [EU Trends]. In total, for all analysed EU
countries, about 62 GW net additions are projected according to [EU
Trends]. Positive capacity net additions focus mainly on wind power, solar
power and biomass power plants. Apart from renewable technologies also
nuclear power plants belong to the technologies with high capacity net
additions for all selected EU countries. In contrast, fossil fuel-fired power
plant capacities, particularly coal power plant capacities, are predicted to
contract and capacities for power plants fuelled with petroleum products are
even scheduled to almost halve by 2020.
The increase of installed power plant capacities (net additions) constitutes
only one driving force for new power plant investments, the other being
replacement of retiring capacities. Expected retirements of power plants up
to 2020 are derived from [WEPP]. Retirement rates are highest for North
East European countries (38%) followed by South East European countries
(32%) and Mediterranean countries (25%). For some types of power plants,
determined retirement rates are considerably higher. Apart from petroleum
fuelled power plants (76%), the highest retirement rates are found for coal-
fired power plants: 41% of these in the selected EU countries are going to
be decommissioned by 2020.

5761P25/FICHT-9661890-v2 3-68
So, although almost no capacity expansions for coal power plants can be
expected, the need for new coal power plants is generally high due to the
need for replacement of retiring capacities. This conclusion is drawn from
the calculation of new power plant capacities that are required for filling the
gap of a) retiring capacities and b) of positive net additions.
Required new power plant capacities are first calculated twice based on the
two data sources that offer capacity figure estimates for all countries for
2010 and 2020: [EU Trends] and [EURPROG]. By performing this
calculation for both data sources, the aforementioned discrepancies between
both scenarios partly level out and there is almost no difference between the
total new power plant capacity needs between the two scenarios. The
remaining discrepancies concern different assessments for individual
countries (particularly for Italy and Poland) as well as differences regarding
the role of various power plant technologies by fuel type. [EURPROG] in
particular indicates higher investment needs for natural gas-fired power
plants and for fossil fuel-fired power plants, whereas [EU Trends] generally
favours higher contributions of renewable technologies, particularly
biomass and waste power plants but solar power plants as well.
Particularly for [EURPROG], neither the scenario methods nor the basis of
expert judgement that impacts the results of the study are transparent. The
[EURPROG] Scenario may have been obtained with different approaches
and assumptions from the EURELECTRIC members in the various
countries. Since [EU Trends] refers to a scenario framework that explicitly
includes the latest climate policy measures on EU level but also the
mandatory national greenhouse gas emission and energy targets set for
2020, the [EU Trends] Scenario is thus finally applied in this project to
determine the requirements for new power plant capacity investments.
This main result regarding the required new power plant capacities up to
2020 is shown in Table 33. In total, a capacity gap of 153.8 GW is
determined. It is predicted to be filled mainly by about 50.2 GW wind
power investments and about 26.4 GW coal power plant investments. Wind
power capacity additions have its focus on the two Mediterranean countries
Italy and Spain, whereas investments in new coal-fired power plants are
particularly high in Poland.
Apart from these two power plant technologies (wind power and coal power
plants), further significant market shares for new power plant construction
are predicted for hydropower (16.3 GW, with the largest shares in the two
Mediterranean countries) and biomass and waste power plants (1.6 GW,
with significant shares in Italy and Finland). Required new capacities for
nuclear energy, solar power and natural gas-fired power plants all amount to
about 12 GW. New solar power capacities will be concentrated in the
Mediterranean countries and new natural gas power plants in South East
European countries, particularly in Greece and Romania. New nuclear
power plants are specifically required in the North East European countries,
but also in the Mediterranean countries.

5761P25/FICHT-9661890-v2 3-69
As a general trend, power plant investments in North East European
countries will be dominated by coal power plants, in Mediterranean
countries by wind power plants and in South East European countries, in
addition to these two technologies, natural gas-fired power plants will play a
major role. 54% of new power plant capacities of the selected EU countries
are required in the two Mediterranean countries, 24% in the six North East
European countries and 22% in the five South East European countries. The
Mediterranean countries Italy and Spain are not only the countries with the
highest identified capacity gaps in absolute terms, they are also the only net
electricity importing country cluster that is going to keep its importing
status, at least until 2020. As such, the Mediterranean countries are
preferred candidates for electricity imports from outside the EU. But as the
analysis has shown, generally all countries promise considerable potential
for new power plant capacity investments up to 2020.

5761P25/FICHT-9661890-v2 4-1
4. The Decision Making Model
For setting up the decision making model, first the electricity markets in the
EU generally are characterised (section 4.1), as they form the background
for the investment decision. Then each decision factor that influences the
investment decision for new power plants is discussed (section 4.2). In this
section it is also explained how the decision factors are integrated into the
model. In section 4.3 the model itself is introduced.
4.1 Characteristics of Electricity Markets and Electricity Price Settings
Electricity markets determine the revenues of power plants. Features of
electricity markets can thus crucially impact investment decisions for new
power plants.
The European electricity market is undergoing a fundamental long term
change that is mainly driven by two factors: On the one hand the ongoing
liberalisation and trans-European market integration and, on the other, hand
the integration of renewable energies and associated decentralisation.
Liberalisation was first introduced by an EC directive [96/92/EC] into
European markets and has since been continuously strengthened on EU
level. The aim is to create the framework for maximum competition and free
trade for grid-bound electricity. Elements of this concept are:
free choice of consumers to choose their electricity suppliers
non-discriminating grid access for suppliers
unbundling of generation, grid, trade and sales.
Since transmission and distribution of electricity tend to form natural
monopolies, regulatory authorities are perceived as necessary to secure
fairness and competition. Independent network system operators are
responsible for smooth grid operation. They manage voltage and frequency
control as well as any deviations from network schedules and from the usual
system operation modes.
European electricity markets can be separated into wholesale markets and
retail markets. Generators sell electricity on the wholesale electricity
markets. This trade occurs on the extra high voltage (EHV) level that is
usually the 380 kV grid. The price paid by the final consumers includes
several other price elements, like use-of-system charges, taxes etc. which
cannot be influenced by the generators. Hence, the relevant price for
generators is that on the 380 kV level. But retail pricing, too, is outlined
below although this is a minor influence when taking decisions on new
power plants.
Participants in the wholesale markets undertake various functions, including
bidding (purchasers), offering (generators), scheduling and dispatch (system

5761P25/FICHT-9661890-v2 4-2
operator), pricing (pricing manager) and clearing and settlement (clearing
manager). Although large consumers can take part directly in the wholesale
electricity markets, households and smaller consumers are usually supplied
by retailers and distribution companies that purchase electricity on the
wholesale market. The retail component of the market is made up of a
number of complex processes that address accuracy of metering, meter
reading, switching of consumers, and allocation of volumes of electricity to
trading.
Trading on wholesale markets occurs in spot markets, at power exchanges
and over-the-counter (OTC). Power exchanges are third parties that
facilitate transactions of defined electricity products between sellers and
buyers. Spot markets provide a trading platform for short term horizons,
mainly day-ahead and intraday markets. The spot market closes a few hours
before the actual physical delivery of the electricity. System operators use
real-time markets to balance generation against consumption within very
short time periods. Additionally, ancillary services are required to support
reliable delivery of electricity and these are sometimes also traded on power
exchanges. Power exchanges offer an anonymous market for electricity
trading. Additionally, bilateral contracts can be arranged, either via power
exchanges or separately. They often have a very long time horizon and limit
the price and volume risks of power plant operators as well as of large
consumers (price and volume risk hedging). A successful financing strategy
for an investment in a new power plant often requires that large electricity
volumes to be produced over the lifetime of the power plant are contracted
at a profitable price even already before a decision is taken on the
investment.
The costs of system operation are passed on to the consumer, depending on
the grid voltage level at which the consumer withdraws electricity. The
costs of the highest voltage are passed on to lower voltage levels and
distributed equally to all consumers of the same level. The retail prices that
consumers face are thus quite different from those prices that electricity
generators can obtain on the wholesale market. Also taxes or further
components of the retail electricity price have no direct impact on the
revenues of the generator.
Although efforts to develop affordable electricity storage technologies have
intensified in recent years, electricity is still a commodity that cannot be
stored efficiently, at least not at the final consumer. Thus electricity is
supplied to consumers when it is generated and the transmission system
must be in balance in real time. Electricity demand varies as a function of
season, day of the week and hour of the day. Wholesale electricity markets
organise time-focused and location-focused matching of demand with
supply at fluctuating market clearing prices.
Zonal pricing is a distinctive feature of European electricity markets, based
on discrete transmission zones called control areas. The transmission system
of each such area is operated and controlled by just one transmission system
operator (TSO). For all EU countries investigated in this study, the control

5761P25/FICHT-9661890-v2 4-3
areas are congruent with the national territories. What they have in common
is that no differentiation is made between the location of injected power nor
are there any limits on the power that could contractually be injected into a
given node of the network [KU Leuven]. The internal grid of a control area
is supposed to be strong enough to cope with any scenario of internal
dispatch. Rare cases of technical infeasibilities are resolved by the TSO and
its costs are charged to the users of the domestic electrical system via the
transmission tariffs. This model has been adopted to preclude discrimination
between network users. The internal grid of each zone must be capable of
handling all possible internal dispatch scenarios, or costs of rescheduling
generation units to achieve a feasible dispatch within an acceptable range.
Congestion across zones is relieved by charging different zonal prices. Also
congestion within the zones must be handled and is arranged by the TSOs
with a redispatch process.
In Nord Pool, separate balancing markets are used to manage and price
congestion [CIFE]. Sweden and Finland use ‘countertrade’ principles in
which the system operator pays for power that would be competitively
generated in an area but is constrained by transmission congestion. It also
pays the additional amount for electricity that would normally not be
competitive but needs to be brought on line to relieve congestion. The
system operator recovers the revenue through system-wide transmission
charges. In Norway, prices are lowered in surplus areas and raised in deficit
areas until congestion is relieved. Whatever costs that the system operator
incurs are recovered in a market settlement process among all market
participants.
For as much operation time as possible, profitable power plants must seek to
be ‘in the money’. The term ‘in the money’ characterises situations when
the variable operation costs of the plant are below the achievable market
prices, thus attaining profitable operation in the short term. Consequently,
auctions at Power Exchanges are organised according to the so-called merit-
order principle.
According to this principle, market agents submit their bids, specifying the
quantity and the price they are willing to sell/buy, with no knowledge of
other bids. All bids are sorted in an ascending ordering of price and are
aggregated to a market demand and supply curve (see Figure 70).
Intersection of the supply and the demand curve yields the market clearing
price and the market clearing volume. All volumes up to the market clearing
volume are transferred at the same market clearing price from all sellers that
have bid at a price equal or lower to the market clearing price to all buyers
that have bid at a price higher or equal to the market clearing price.

5761P25/FICHT-9661890-v2 4-4
Figure 70: Market clearing at power exchange auction (from [UPC])
The merit order curve of a country is an ascending ordering of the available
installed capacity in the system, based on the marginal cost of generation
(€/MWh) for each unit supplying the system. Examples of the merit order
curve in Spain for some years in the past are shown in Figure 71.
Figure 71: Merit order curves for Spain from 2003 to 2005 (from [LE])
Generators who are interested in selling their electricity production may
submit their offer based on sellers expecting that the market clearing price
will be higher. But over the long term, the remaining difference between
market prices and marginal costs must cover also their fixed costs, including
capital costs and fixed O&M costs. Fixed costs arise solely from making the

5761P25/FICHT-9661890-v2 4-5
power plant available, independently of its operation. Fixed costs include
particularly capital expenditures (CAPEX), annualised over the life time.
Power plants should run ‘in the money’ for as many operational hours as
possible during a year to quickly pay back its capital costs. Due to typical
intraday load profiles, though, some power plants are required and dedicated
to covering only additional peak load demand during some intraday periods,
mainly around noon. Due to their low annual operational time, peak load
power plants should not absorb high capital costs that would result in
excessive payback times. Instead, their profitable operation during their few
operational hours requires compensation by increased peak load prices.
Accordingly, wholesale electricity markets in Europe are segmented into
base load and peak load periods. This is reflected at the power exchanges
with different electricity products for base and peak load.
The physical nature of electricity does not allow for a true electricity spot
market with immediate electricity delivery. Instead transactions are
scheduled in advance of physical delivery. Buyers must provide their
demand profile for the day ahead in 15 minutes time intervals, usually at
14:00 of the day before physical delivery. On the forward markets also
electricity for delivery in months, quarters or years ahead can be traded.
The rising integration of renewable energy shares in the European electricity
generating mix will bring about major changes for the whole market and
impact all market players. The fluctuating wind and solar power supply will
very probably increase price volatility on the markets. This means
increasing price risks for power plant investors that can hardly be estimated
in advance of taking an investment decision. Even the role of peak load and
base load power plants may change fundamentally and in an unpredictable
way. For instance, high solar power availability around noon may generally
decrease peak prices. Furthermore, carbon dioxide (CO2) emission
certificate prices may reduce the number of operating coal power plants,
leading to a scarcity of base load power and to higher base load prices.
Additionally, another very crucial uncertainty for power plant investors
regards the operating hours that will remain for conventional power plants
in a future market with high renewable shares. This question addresses also
the market design, i.e. to which extent renewable electricity generation will
have to be absorbed fully at any time by the market and whether there will
be a market premium just for providing excess power plant capacities that
balance fluctuating generation from renewables. The existing merit-order
principle based on marginal (short term) costs may turn out not to work
properly in such markets and currently it is not clear what kind of market
design may follow. A return to pricing methods that were prevailing before
liberalisation and are still applied for use of system tariffs may be
considered as a likely scenario: Pricing based on a capacity price and an
energy price, instead of a flat kWh price.

5761P25/FICHT-9661890-v2 4-6
Furthermore, integration of renewable energies requires an almost
completely different grid system design. The grid must become capable of
connecting many decentralised facilities, of transmitting large volumes of
fluctuating renewable energies over long distances within Europe and it
must integrate demand-control features (smart grids), especially for system
stability reasons. In the European network controlled by the European
Network of Transmission System Operators for Electricity (ENTSO-E), the
TSOs are responsible for grid stability. This means that new power plants to
be connected have to demonstrate to the grid operator that the grid code will
be complied with and system stability will not be put at risk due to the new
generation capacity. In case of noncompliance, the TSO concerned could
reject the grid access for a new power plant.
4.2 Investment Decision Factors
4.2.1 Economic decision factors for investment
4.2.1.1 Fuel prices
The price development of fossil fuels is of great importance for power plant
investment. The predominant primary energy sources for electricity
generation are lignite, coal and natural gas. Crude oil and its products, heavy
and light fuel oil, play only a minor role for electricity generation. However,
crude oil is still and will remain for the foreseeable future the price leader in
the fuel market. The prices of all other fuels follow the price fluctuation of
crude oil (see Figure 72). The price of imported natural gas is directly linked
to the crude oil price in purchase contracts. Changes in fuel prices directly
affect investment decisions for power plants since increased fuel prices raise
the variable operating costs of a power plant.
Figure 72: Indexed fossil fuel prices

5761P25/FICHT-9661890-v2 4-7
The procurement options for primary energy sources differ greatly. For
example, to generate electricity from lignite in a specific country, the power
plant has to be close to the deposits of this energy source. This means that
lignite has no global market and there is no price uncertainty for power plant
operators regarding lignite prices.
Hard coal, however, competes with internationally traded hard coal that is
transported to the power plants. In this case, power plant operators are
bound to world market prices and they are exposed to price volatilities. As a
consequence, coal is mostly procured through long-term supply contracts
for defined fuel volumes at defined prices. This leads to a certain hedge
against fuel price volatility although the contracts include also a clause for
price indexation depending on the crude oil price. Imported coal for Central
European countries is shipped from oversees to the ARA harbours
(Amsterdam, Rotterdam, Antwerp). Statistics for CIF prices (incl. cost,
insurance, freight) of hard coal are available. It must be noted, however, that
the CIF prices also include the freight rates for overseas shipment, which are
extremely volatile and often amount to half of the coal CIF price (cf. Figure
73). Hence, countries with indigenous coal resources, like Poland, have a
distinct price advantage. Also the storability of coal can uncouple the
procurement of coal and its use for electricity generation to some extent.
Figure 73: Freight rates for coal
Natural gas prices have similar characteristics to electricity prices
(cf. section 4.2.1.5 below). Because of short-term trading transactions for
natural gas, these prices have higher volatility and price spikes compared to
coal. They also exhibit, alongside the use of natural gas for electricity
generation, a seasonal behaviour because of its use for heating.
Another issue is the long-term availability of fossil fuels. Their increasing
scarcity may result in fuel price increases. Projections for the long term
availability of crude oil are hard to predict and the development of the crude
oil market in the future is very uncertain, with significant pricing pressure

5761P25/FICHT-9661890-v2 4-8
also on the natural gas and coal markets. Reserve-to-production ratios for
coal and lignite are currently at around 150 years. This indicates that at least
there will be no short-term supply shortages on the coal market, even in the
event of rising coal demand on electricity markets.
Uncertainty regarding the development of fuel prices results in imprecise
planning criteria for power utilities. An increasing demand for gas due to
European CO2 emissions trading is another market risk. Similarly, rising
electricity demand can boost fuel prices. Uncertainty regarding fuel prices is
considered in the decision making model through three different scenarios
as described in more detail in section 5.1.2.
4.2.1.2 Prices for CO2 allowances
As with fuel prices, likewise the price for CO2 allowances has to be
considered as an uncertainty when generating electricity in thermal power
plants. EU allowances (EUAs) for CO2 have been traded since the adoption
of European CO2 emissions trading on the future and spot markets of
electricity stock exchanges in EU countries. For each trading day, electricity
stock exchanges publish a reference price per tonne for the Europe-wide
trading of EUAs.
To determine the prices of CO2 allowances, the fixed reduction target is
relevant. The costs of CO2 abatement as well as the demand for emission
allowances are higher the stricter the target. In future, this may lead to rising
prices for CO2 allowances and the variable costs of emission-intensive
power generation technologies may be forced up. On the other hand, a
possible shortage of CO2 allowances would have the effect of pushing up
CO2 prices, leading to a change in the competitive relationships in the
electricity generation sector. A surge in demand for natural gas due to its
lower CO2 content compared to coal cannot be excluded because coal-fired
power plants are and will remain responsible for most of the CO2 emissions
in the energy sector.
Since the inception of CO2 trading, each ton of emitted CO2 has acquired a
market value. This is independent of whether emission rights have to be
bought on the market or are allocated gratis. Accordingly, power utilities in
the EU have included the CO2 market value in their actions and calculations.
It is only to be expected that, since the adoption of CO2 emissions trading,
this market value has also been factored into electricity prices.
With full auctioning of CO2 allowances in the 3rd trading period starting in
2013, energy utilities have to purchase all their CO2 allowances. This will
turn windfall profits from allocated CO2 emission rights into operative costs
and will thus more directly assign a carbon burden to the competing power
technologies. It is expected that the market value of CO2 is already fully
taken into account in the electricity market, which is why an increase in
electricity prices is not expected due to the change to full auctioning.

5761P25/FICHT-9661890-v2 4-9
Nevertheless, the actual level of ETS prices does impact electricity prices.
The interlinkage of prices for fuel, CO2 allowances and electricity has to be
considered under the aspect of uncertainty. The price trend for CO2
allowances and the resulting costs for power plant projects remain unsure,
leading to uncertainty among potential investors. Given the long lifetime of
power plants it is important that reduction targets are set far into the future
to assess the development of costs for CO2 allowances. In the decision
making model, the uncertainty of prices for CO2 allowances is taken into
account by analyzing scenarios for different CO2 price developments (see
section 5.1.1)
4.2.1.3 Electricity demand
Electricity demand is of particular interest for the future electricity market
and hence for investments in power plants. The total demand as well as the
peak load demand change over the years and have an impact on electricity
prices and therefore on the profitability of new investments. Development of
electricity demand is influenced by various factors:
population development
overall economic development
development of the sectoral structures of the economy
development of electricity prices (partly subject to environmental policy
requirements)
development of specific consumption of electrical appliances
(for example energy efficiency and lifetime of electrical appliances)
development of energy consuming equipment and its use
development of coverage of new electrical appliances
development of energy efficiency standards for new equipment.
From the viewpoint of the power plant investor, the anticipated electricity
demand is reflected in expectations regarding future electricity prices. But
the constraints and conditions for electricity demand and prices have no
bearing on the decision on whether to install the new power plant inside or
outside the EU. The reason is that in both cases the power plant will supply
the same market in the EU country concerned. In general, the investor will
seek to reduce demand risk by selling a preferably large part of future
electricity generation before even taking the investment decision, via
bilateral contracts with customers.
4.2.1.4 Prices of power plants and availability of labour and capital
In recent years, prices for power plants have risen rapidly. The reasons are
the high demand for new power plants to replace aging ones, the increase in
prices for materials such as steel and copper, and the additional cost of
measures to improve efficiency. Ten years ago, steel prices were still about
300 €/t. In 2011, they attained a price of about 600 €/t. The price trend for
copper is somewhat similar. The energy efficiency of power plants has to be
increased steadily due to high primary energy prices and costs for CO2

5761P25/FICHT-9661890-v2 4-10
allowances. Therefore, new steam power plants, for example, are designed
for ultra-super critical (USC) steam conditions (260 bar/620°C). But this
requires high temperature-resistant materials that are costlier and increase
construction costs. Boiler manufactures try to compensate for the cost
increase by exploiting economies of scale with larger power plant units,
which has the effect of lowering specific investment costs the larger the
power plant.
If demand for power plants increases as expected over the next few years,
due to new and replacement investments, this will have a considerable
impact on investment decisions. The construction costs for coal-fired power
plants with USC conditions rated at 800 MW are in the order of about
2000 €/kW. The specific costs of gas-fired combined cycle gas turbine
(CCGT) power plants are in a range of about 700 €/kW. The actual costs of
power plants depend on the current market situation and on free capacities
of providers as well as on pricing aspects of the manufacturers of power
plant components. Also local aspects (labour costs for workers) may be
relevant. Furthermore, uncertainties about future exchange rates can have an
impact on the investment costs if power plant components are obtained from
outside the EU. As investors act internationally with global investment
activities in different countries, they can limit currency risks through
hedging short-term transactions in major currencies in the foreign currency
forward or future market. For longer periods, it is possible to hedge with a
series of long-dated forward contracts or with a currency swap. Since
hedging against currency risks is manageable for an international investor, it
is not explicitly considered in the decision making model.
The costs for power plant hardware are considered in the decision-making
model as specific power plant costs in Euros per kilowatt. These prices are
fixed for different types of power plants because investors will choose their
EPC contractors (Engineering Procurement and Construction) regardless of
the country where the power plant is built. However, prices for construction
works are considered through specific manpower costs in the respective
countries. The same applies to working staff during the operation period.
Accordingly, these aspects are factored into the decision-making model.
4.2.1.5 Electricity prices
Today, electrical energy can neither be stored directly nor be substituted by
other energy sources to any great extent, so supply must balance demand in
the national grid at all times. This results in short-term inelastic electricity
demand and in highly fluctuating electricity prices which is expressed by
their volatility. In particular, a seasonal variation is observed: in northern
Europe, electricity prices are higher in winter due to the usually higher level
of demand in this season. In addition, electricity prices also exhibit
characteristic daily and weekly patterns in the spot market. The high
volatility and the occurrence of extreme price spikes are among the
stochastic characteristics of electricity prices, referred to as the mean-
reversion process. Mean-reversion describes the tendency of electricity
prices to return to their long-term average after fluctuations.

5761P25/FICHT-9661890-v2 4-11
The wholesale price of electricity is established on the future and spot
markets of electricity stock exchanges of individual EU countries. Forward
contracts at these stock exchanges provide an opportunity to hedge against
price uncertainties in advance. Price volatility can be reduced and only little
mean-reversion can be achieved.
Overall, the introduction of wholesale markets leads to an increased
competitive situation for individual power plants themselves. Since
electricity prices vary greatly, the financial returns of power plants are
subject to high uncertainty. Revenues from the electricity prices are the
primary income source of power utilities which have to recover all their
costs with these. Thus, covering the full costs of electricity generation by
electricity prices is a fundamental prerequisite for long-term investments in
power plants.
In general, consumers may buy electricity either at the power exchange or
over the counter with bilateral contracts with power generators or suppliers.
Buying electricity from the power exchange may bring advantages.
However, it might be a risky undertaking due to volume and price risks.
Optimised procurement of electricity is achieved with a portfolio
management by combining several products of the market as shown in the
figure below. This approach is usually taken by large consumers and traders.
The same approach will be applied by potential investors of new power
plants, especially for projects outside the EU. They will try to secure the
bulk of their production with bilateral contracts with large consumers and
traders of electricity with portfolio management in order to mitigate risk
caused by price volatility on the power exchange (see Figure 74). This will
also be a security requirement for loans from banks, which usually finance
the major part of the capital expenditure for new power plants.
Figure 74: Example of portfolio management

5761P25/FICHT-9661890-v2 4-12
Competing power plants inside and outside the EU will supply their
generated electricity to the same EU market. As the prices are volatile, and
predictions are practically impossible, the plant with the lower electricity
generation costs will have a competitive advantage. Therefore it is sufficient
to compare only the relevant electricity generation costs of the power plants.
4.2.1.6 Taxes
Taxes relevant for power plant investors are corporate tax and fuel taxation.
In general, these tax rates could differ between all the countries considered.
For EU countries, though, fuel taxation has been harmonized. According to
the Council Directive [2003/96/EC], EU member states are exempted from
taxation on energy products used to produce electricity, i.e. on fuel taxes for
power generation. However, outside the EU, additional taxes on hard coal,
lignite and natural gas may be in place for power plant operators.
Electricity taxation is not dependent on the country of power plant
installation but rather on the country where electricity is consumed, which
in our investment analysis is always the EU country of each EU/non-EU
country pair under consideration. Thus electricity taxes do not result in any
discrimination of investments outside or inside the EU. Electricity taxes
have no direct impact on wholesale electricity prices which determine the
revenues for the power plant operator. Electricity taxes are therefore not
further taken into account in this study.
Corporate taxes affect the rate of return, in particular the rate of return on
equity (ROE). A project must provide a certain pre-tax return to satisfy the
expected after-tax return on ROE. Therefore, corporate taxes influence the
discount rate to be applied in the decision making model. Since corporate
tax rates vary considerably by country, the discount rates applied in the
decision making model generally differ for each country. Taxation
conditions could change over time, posing a risk to investors that must be
covered by the expected rate of return on investment. Uncertainty regarding
tax rates can be taken into account in the model by conducting sensitivity
analyses in cases where the current rate seems to be very low.
4.2.1.7 Financial risks from financing the investment
There were sharp drops in both electricity demand and prices at the start of
the financial crisis in 2008 while credit conditions for power plant projects
became more stringent as the creditors required a considerably higher equity
portion on the CAPEX. This resulted in a loss of attractiveness for
investments in such plants. There was thus an incentive to keep older,
depreciated plants running and to postpone investments in new ones, despite
the poor efficiency of the aging plants.
Also impacted was the profitability of renewable energies during the
economic crisis. Due to their high capital cost and falling fuel prices, they
5761P25/FICHT-9661890-v2 4-13
were put in a worse position by the economic crisis vis-à-vis conventional
electricity generation technologies. The energy sector, however, is far less
exposed to fluctuations in sales than other industries due to electricity
demand elasticity being generally low. Thus, the risk assessment by
investors may be lower.
Generally there are always funding risks, so the capital needed for a project
may not be available. For example, equity participants might fail to
contribute their determined amount or it may not be possible to raise the
target amount in the market. Another funding risk is re-financing, which
occurs if the period of initial funding does not match the duration of the
project. As funding is an essential part of project financing, it is sometimes
difficult to reduce the risk of not finding funding. The option of seeking
capital from a broad range of sources is a way of mitigating this risk. In
addition to funding risk, interest rate fluctuations present a significant risk
for highly-leveraged power plant financing arrangements. Arranging for
long-term financing at fixed rates mitigates the risk inherent in floating
rates. Furthermore, investors can enter into interest rate swaps to hedge
against interest fluctuations.
Loans for power plant projects have usually a debt maturity of about 15
years with a fixed interest rate. There is usually no need for prolongation of
the loan.
4.2.2 Non-tangible decision factors
The main non-tangible decision factors are for instance:
risks related to the longevity of this investment
associated technology innovation risks
political risks
non-acceptance by the public
plant availability.
Some of these factors can be taken into account in monetary terms via a risk
premium. Others can only be assessed through sensitivity or risk analyses.
The factors are discussed in the following.
4.2.2.1 Longevity of the project and associated technological risks
Power plant projects are designed for a life of 35 years based on prevailing
or foreseeable market conditions. Throughout this period, the invested
capital is tied up in the project. Changes in market conditions may adversely
impact the project’s profitability. Over the past thirty years, for instance,
emission standards have become more stringent, the electricity market has
been deregulated and carbon emissions have turned into a cost factor.
These types of risks are addressed in the decision-making model with a
‘venture premium’ on the return on equity. The usual magnitude of venture

5761P25/FICHT-9661890-v2 4-14
premiums for a power generation project is in the range of the risk-free rate
of return. For details see section 4.2.4.
4.2.2.2 Technology development
Power plants projects are designed to the state-of-the-art prevailing at the
time and built for a life of 35 years. Throughout this period, the invested
capital is tied up in the project but technological innovations may have an
adverse impact on the project’s profitability.
Power plant technologies are continuously improving, especially for
renewable energies, but also for thermal power plants. Further increases of
efficiency factors, cost reduction, pollutant abatement and progress on
safety aspects are expected. Coal-fired power plants with modern
technology, for example, are able to reduce CO2 emissions by 2.4 million
tonnes per year and fuel costs by 2.4% with only one%age point higher
efficiency. Supercritical coal-fired power plants are already state of the art.
Electricity generation costs, the development of electricity prices and the
political framework are other drivers for technological advancement. The
initial focus was on increasing the installed capacity. But to reduce
greenhouse gas emissions, improved fuel efficiency and thus a rise in the
efficiency factor of thermal power plants are objectives.
Nevertheless, the race of technologies for fastest development and highest
efficiencies presents a problem. At the time of an investment, it is possible
that other technologies will get ahead. Since investments in power plants are
long term, once spent, capital is locked in, resulting in sunk costs for the
investor. The potential benefits of new technologies may finally imply lower
electricity prices.
4.2.2.3 Power plant unavailability
For thermal power plants, there are two reasons for their non-availability.
For inspections and repair works power plants have to be shut down so they
are not always available. Usually this is done during off-peak times and the
outage can be estimated quite well. That is rerffered to as ‘planned non-
availability’. On the other hand there can also be unscheduled, forced power
plant outages. These result in a sudden shortfall in supply and a change of
market price. Accidents, fires or other failures lead to unscheduled power
plant outages. These are always subject to uncertainty. In addition, the
probability of an outage depends on the age, size and type of the power
plant. For example, by replacing older components with improved
components both availability and lifetime are optimised.
Statistics are compiled on power plant availability (e.g. Analysis of
unavailability of thermal power plants – [VGB TW]). These are taken into
account in the decision making model by assuming equivalent operation
hours (EOH) for the various plants types. EOH are defined approximately as
hours of the year minus hours of non-availability.
5761P25/FICHT-9661890-v2 4-15
4.2.2.4 Investment security and political risks due to plant location
Depending on the location there might be country-specific risks, examples
of which include civil unrest, guerrilla sabotage of projects, work stoppages,
any other form of force majeure, exchange controls, monetary policy,
inflationary conditions, corruption, political encroachment, etc. The country
risk serves as the ceiling for a project’s risk rating. For an example, credit
rating agencies place ceilings on specific project ratings through the
sovereign credit rating that the agency assigns to the country. This means
that no project can have a higher credit rating than that of the country
concerned. Specific mitigation might include political risk insurance against
force majeure events or allocating risk to local companies.
Political risks on the other hand are sometimes the ones of most significance
faced by investors because of the likelihood of sudden political change,
which can jeopardise projects at a critical stage. Such risks include changes
of a country’s political landscape, like change of administration, as well as
changes in national policies and regulatory frameworks. Power plant
schemes, especially in developing countries, continue to face significant
risks, albeit in more subtle forms like price regulation, restrictions on work
permits for foreign managers, renegotiation of contracts and even buyouts.
Political risks are covered in the decision-making model through a ‘country-
specific risk premium’ added to the risk-free rate of return on equity (ROE),
as described in more detail in section 4.2.4. The risk premium thus depends
on the country in which the investment is made.
4.2.2.5 Public resistance or acceptance
Construction projects of conventional power plants often experience
considerable public resistance. The acceptance for any new power plant has
decreased in industrial countries. Citizens’ protests may even result in
stopping a power plant project completely. Public resistance or acceptance
may differ in the countries considered and may therefore impact the
decision on power plant location. When decisions are taken on investments
in power plants, the aspect of public resistance or acceptance is considered
in the same way as country-specific risks and political risks (4.2.4.). The
investor will adapt the risk premium to mitigate the risk.
4.2.3 Appraisal of capital investment under uncertainty
Investment risks can also be managed partly by applying hedging strategies
(see 4.2.5 ), but any remaining risks have to be absorbed by an adequate
appraisal of the risks of capital investment. This is reflected in the
expectations on return on investment. From a portfolio of risky investments,
the expected returns are adjusted upwards to an amount that would cover
expected losses due to possible defaults of some of the investments in the
portfolio. Formally, this is implemented via the risk premium put on top of
the expectations on return from a risk-less investment. The risk premium is

5761P25/FICHT-9661890-v2 4-16
the incentive necessary for allocation of capital to more risky investments
rather than just investing in less risky ventures.
Apart from hedging and the risk premium approach, a third way of risk
assessment is sensitivity/scenario analysis. Whereas the risk premium
incorporates the expectancy value of the risk, the remaining risk attributable
to the spread around the expectancy could be covered by scenario analysis.
This is usually done by deriving not only a most expected scenario but also
a best case and a worst case scenario for the investment. Applying the above
described investment appraisal approach for different scenarios will give the
investor a picture of the range of potential future developments. Usually,
real investment behaviour tends to be risk averse, i.e. a more risk avoiding
investment is favoured compared to a more promising but risky investment.
Thus an investor would like the investment to yield a minimum expected
return even in the worst case scenario.
In a scenario, a consistent combination of variables is analysed. In our case
of power plant investment appraisal, such a set of variables that make up a
self-contained scenario includes fuel price paths and emissions trading
scheme price paths, since these correlate with each other (see section 5.1).
Thus the scenarios defined and analysed with the model contain dedicated
assumptions for the future CO2 price and fuel price developments (in real
terms).
Sensitivity analysis is a subset of scenario analysis where the effect of
specific variables on the return is analysed. Sensitivity analysis would mean
studying, for instance, the variation of the expected inflation rate on the
outcome of the investment appraisal. Both methods – scenario analysis and
sensitivity analysis – may be applied using the decision making model to
test the robustness of the investment appraisals.
4.2.4 Usual level of return on investment - weighted average costs of capital
Investments for power plants are usually financed by a combination of own
capital of the investors (equity) and bank loans. Accordingly, the expected
return on investment (ROI) is a weighted average of the return on equity and
the interest on the bank loans. As such, the ROI defines the imputed costs of
capital for the total investment, called weighted average costs of capital
(WACC). Banks usually require an equity share of about 30% of the capital
expenditures for power plant projects while 70% is covered by loans from
bank consortiums. The interest rate for long term bank loans within the EU
can be considered as quite stable in the range of about 5% to 6% in nominal
terms or about 3%age points in real terms (on top of inflation). It can be
further assumed that, due to the magnitude of the investments that are of an
order of a billion or billions of Euros, only financially strong investors will
be able to invest, who will have access to and possess credibility in the
financial market. Hence, favourable conditions for bank credits can be
achieved by such investors also for projects in neighbouring EU countries.

5761P25/FICHT-9661890-v2 4-17
Table 36 below shows typical conditions for WACC for power plant
projects. We are of the opinion that the crucial factor for the investor is the
return on equity (ROE) he is expecting from the project. The return on
equity can be broken down into four components:
The risk-free rate of return can be assumed as equal to the bank interest
rate.
The venture premium is typical for power plant projects, considering the
risks of a long-term investment and related technology risks. This is also
in the range of the risk-free rate of return.
The country-specific risk premium considers the economic and political
situation in each country.
Also to be factored in is the corporate tax rate.
It is noted that the WACC is used in the investment appraisal as discount
rate.
Table 36: Example of typical weighted average cost of capital (WACC) of power
plant projects
We are of the opinion that the first two components – risk-free return and
venture premium – are common within the EU for power plant projects and
will not significantly vary. A more challenging task is to define country
specific risks. This can be done by identifying the breakeven point of
benefits vs. risks as proposed in the model.
4.2.5 Hedging strategies for new power generation plants
Investors and corporations use hedging techniques to reduce their exposure
to various risks. Hedging against investment risk means employing strategic
instruments in the market to offset the risk of any adverse price movements.
The foundations of hedging in the electricity market are the same as for the
purely financial market. However, since the market is not as liquid, the
contracts being offered are not as extensive.
Futures and forward markets are important hedging instruments in the
development of efficient electricity markets. However, financial hedging

5761P25/FICHT-9661890-v2 4-18
instruments appear to have a much shorter time horizon than the term of the
investment in power plants. This leaves a substantial residual risk to
investors. Seeking to hedge short-term electricity price risks, they cannot
rely on these markets to help mitigate such risks.
The requirement of investors to hedge against uncertain future electricity
prices remains, if financial markets are not a practical tool for hedging
against short-term risk and volatile electricity prices. Contract hedges
between investors and consumers might provide a more promising basis for
hedging the risks associated with developing new power plants. In most
countries, though, consumers’ interest in signing long-term contracts is very
limited. Such long-term arrangements are more in the interest of industrial
customers to stabilise their input costs. But as the existence of surplus
capacity and relatively low electricity prices have discouraged long-term
contracts since liberalisation of the electricity markets, even the larger
consumers rely mainly on three-year contracts rather than signing long-term
contracts.
For the sake of completeness, organisational hedges are mentioned. For
future investments, today’s investors pay greater attention to companies
with stable revenue flows and a good customer base. Following
liberalisation, companies had to restructure to mitigate investment risks. A
strategy for companies making a significant investment in electricity
generation to hedge against the risk of volatile fuel prices is to acquire
companies which trade in fuels in order to hedge fuel cost risks with power
generation. Mergers are one mechanism to obtain more stable cash flows as
a source of finance for capital-intensive investments. Higher equity
financing is a way to cover more risky investments but at higher funding
costs.
4.2.6 Technical preconditions and risks
4.2.6.1 Technical concepts for power plants
The following power plant concepts are considered in the study:
steam power plant fired with lignite, for base load duty
steam power plant fired with hard coal, for base load duty
combined cycle gas turbine (CCGT), for base load and for intermediate
load duty
Open cycle gas turbine (GT) for peak load.
The technical concepts of these plants are briefly described below.
Steam power plant
A simplified heat flow diagram of a typical steam power plant is depicted in
the figure below. In the table under the diagram, the main technical
parameters are indicated of subcritical, supercritical and ultra-supercritical
cycle concepts.

5761P25/FICHT-9661890-v2 4-19
The plant’s main components are:
steam generator
flue gas cleaning system, limestone gypsum
water-steam cycle
steam turbine and generator
condenser cooling system (CCS) with cooling tower
auxiliary and ancillary systems
Figure 75: Simplified heat flow diagram of a steam power plant
Table 37: Typical technical parameters of steam power plants
Subcritical steam power plants are expected to remain the main choice in
countries with low fuel prices due to their simplicity, perceived higher
reliability, lower investment cost and lower technical risk. However, rising
fuel prices and the need for lower carbon emissions triggered by carbon
trading schemes have opened opportunities for an increase in the application
of supercritical (SC) and ultra-supercritical (USC) steam cycles.
boiler
t/h
LP-preheaters
HP-preheaters
Live steam bar / °C
Reheat steam bar / °C
Fuel MWt
MWe
Flue gas
Cleaning
Deaerator
Extractions
Item Unit
Steam conditions - SubC USC SubC USC
Live steam bar / °C 180/535 285 / 600 180/535 285 / 600
Reheat steam bar / °C 42 / 535 60 / 620 42 / 535 60 / 620
Ratet capacity, gross MW 900 1100 600 800
own consumption % 4.50% 4.50% 7.00% 7.40%
Efficiency, net % 40.00% 43.20% 41.00% 45.60%
Lignite Hard coal

5761P25/FICHT-9661890-v2 4-20
Hence, power plants with ultra-super critical steam parameters will be the
base case for EU countries. Furthermore, the plants concepts will allow
retrofitting with CCS systems.
Lignite-fired steam power plants are typical base load plants. They are quite
inflexible in operation as start-up takes some hours. Due to the high sulphur
content of the fuel referred to the calorific value, the cost to acquire carbon
certificates is very high.
New hard coal-fired steam power plants will also be operated for base load
duty. The costs for carbon certificates are still high.
The availability of steam power plants built to state-of-the-art designs is
high. The annual planned outage time for overhauls and maintenance is
about 4 to 5 weeks. Forced outages are very rare. Full availability for 7,500
equivalent full load operation hours is guaranteed.
The preparation phase for coal-fired plants, with studies, permit procedures
and tendering is estimated as about one year and the actual construction
time about four years.
Combined cycle gas turbine power plants
In CCGT power plants, the exhaust heat from the gas turbine at about 500°C
is utilised to generate high pressure (HP) steam in a heat recovery steam
generator (HRSG), which is then expanded in a steam turbine to generate
electricity. The total electrical generation capacity is made up of the
contributions from the gas turbine and the steam turbine.
The schematic in Figure 76 shows the configuration of a combined cycle
gas turbine plant, comprising a gas turbine with downstream HRSG and a
steam turbine. The HRSG can be a single or double pressure design. The
HRSG may also be equipped with supplementary firing as shown in the
schematic. The gas turbine and the steam turbine each have their own
generator. There are also ‘single shaft arrangements’ where the gas turbine,
steam turbine and generator are arranged on one common shaft.
Figure 76: Simplified heat flow diagram of a CCGT power plant
Air
Fuel
GG
Com
pres
sor
Tu
rbin
e
HP
-
Tu
rbin
e
MW
MW
G
MW
GLP
-
Tu
rbin
e
Gas turbineHP
Exhaust
LPHP
HP- Steam
LP- Steam
HRSG
Deaerator
Suppl. firing
(optional)

5761P25/FICHT-9661890-v2 4-21
Table 38: Main technical parameters of CCGT
power plants
The operation mode of CCGT power plants can be base load or intermediate
load. They are very flexible in operation as start-up to full load takes less
than one hour. This means they will be operated in future for balancing
transient grid loadings caused by fluctuations of supply from wind and solar
power plants.
This is, though, in itself a substantial risk as planning of their operation time
on grid will be hardly predictable. This means they have to cover their costs
by providing mainly back-up power.
The output and also the efficiency of CCGT power plants as well as of open
cycle turbine power plants depend on the ambient temperature. Part load
operation of gas turbines is feasible up to 60% of full load.
As most components for CCGT power plants are prefabricated, the
construction time is about two years.
4.2.6.2 Technical concepts for power grids
Generally, the basic structure of a power system relies on synchronous
connections between generators which operate all at the same frequency.
One of the great achievements of the last century has been the evolution of
large synchronous high voltage alternating current (HVAC) power grids, in
which all interconnected systems maintain the same precise frequency.
Alongside synchronous interconnection of power systems via HVAC
linkage, coupling of different power systems can be done by high voltage
direct current (HVDC) connections. HVDC schemes permit asynchronous
coupling of power systems, meaning for systems which operate at different
frequencies or are otherwise incompatible to allow them to exchange power
without requiring the tight coordination of a synchronous network.
4.2.6.2.1 HVAC connections
HVAC transmission technology is the main option for power transfer. The
specific costs per kilometre for a typical 400 kV double circuit overhead
line (OHL) vary widely from 0.43m €/km to 1.4m €/km, depending on the
Item Unit
Number of units - 2
Rated capacity per unit MW 400
own consumption % 1.50%
Efficiency, net % 55.30%
Live steam bar / °C 105 bar / 500°C

5761P25/FICHT-9661890-v2 4-22
route and climatic conditions. For this study, the costs of 0.43m €/km has
been considered as adequate for general cost assessments of HVAC lines.
This covers material and construction costs as well as landowners’
compensation payments. Investments in necessary upgrades or extensions of
involved local substations are not taken into account and these come on top
of the investment costs for new HVAC connections.
4.2.6.2.2 HVDC connections
In principle, there are two types of HVDC connections:
LCC technology (based on line commutated converters)
VSC technology (based on voltage source converters).
LCC technology has been developed in the past 50 years, being the classical
technology. By taking the present trend in HVDC technology into account,
the VSC type is considered as the technology of choice for future projects.
Implementation of VSC systems into the existing transmission networks is
more uncritical compared to the conventional HVDC technology. A main
advantage of VSC over LCC technology is segregated regulation of active
and reactive power. Reactive power compensation can support the partially
weak networks even if no active power is transmitted via the HVDC system.
This could be particularly important for HVDC applications in the Maghreb
and Balkan states. Moreover only VSC systems are able to use XLPE cables
which are considered as the more sophisticated cable technology vis-á-vis
mass impregnated cables. A typical configuration for HVDC systems is a
bi-polar configuration. The HVDC voltage is selected dependent on the
transmission capacity.
Regarding HVDC interconnection of power systems there are two typical
arrangements:
‘HVDC cable’: Long-distance point-to-point HVDC lines with an
HVDC/HVAC converter station at each end of the HVDC line, mostly
bi-pole schemes for transmission lines and mono-pole for submarine
cable connections; An HVDC cable link can be a feasible option for
offshore interconnection.
‘HVDC b2b’: Both converters in one location without any significant
HVDC line in between: this is called an HVDC back-to-back scheme
(HVDC b2b). HVDC b2b links are only applicable for onshore
interconnections.
These two types of HVDC schemes not only enable the interconnection of
asynchronous power systems, but are in some cases also an alternative to
usual HVAC links for interconnection of synchronous power systems. One
case is linkage over a very long distance of more than about 700 km, which
is preferably (i.e. more cheaply) realized with an HVDC connection. For
offshore links, HVDC cable links are the technology of choice at already
much lower distances (ca. 80 km). The reason is that the usual HVAC
cables cannot be used offshore for distances over more than about 80 km.

5761P25/FICHT-9661890-v2 4-23
Costs for HVDC links are typically much higher than for HVAC links. As a
result of investigations and analysis of existing projects, the main cost items
for HVDC technology are best approximated accordingly:
converter station costs: 0.22m €/MW
cable costs: 1m €/km
cable laying costs: 0.8m €/km.
Investments needed for upgrading existing local AC systems and their
capacity for integrating HVDC links are not taken into account in these cost
estimates. But all “converter station costs” comprising all components, like
switchgear, filters, converters and transformers, are taken into account. Two
converter stations per project are required and two XLPE cables per
transmission line. As a result of the growing demand for HVDC technology
and the high occupancy of cable factories and cable laying ships, prices
have risen in recent years. Another cost factor for offshore projects is the
depth of the sea and the resulting complexity of cable-laying. This is for
instance a particular issue for the very deep Mediterranean Sea and is taken
into account in the above cost estimate.
4.2.6.2.3 Interconnection technology of choice
In summary, the type of interconnection – HVAC, HVDC OHL/cable,
HVDC b2b – to be used depends on whether the power systems are
synchronous or asynchronous, over what distance they are to be linked and
via which media (onshore/offshore). In addition, cost efficiency plays an
important role. Generally, for each power transmission project, an
individual assessment must be made to identify the optimum technology.
Nevertheless, Table 39 gives an indication of the usual technology of choice
for different configurations of power system interconnection.
distance of
link [km]
link of asynchronous
power systems
link of synchronous
power systems
onshore offshore onshore offshore
0-80 HVDC
b2b or OHL
HVDC cable HVAC HVAC
80-700 HVDC cable HVAC HVDC cable
700 and more HVDC OHL HVDC cable HVDC OHL HVDC cable
Table 39: Usually applied technology for interconnection of power systems
4.2.6.2.4 Synchronous zones
There are several synchronous zones involved in the network areas of the
countries analysed in this study (see Figure 77). They are introduced in the
following. Based on the clustering of the EU countries under investigation,
namely North East European countries, South East European countries and
Mediterranean countries, also the operational status of the high voltage
networks in the different regions is presented.
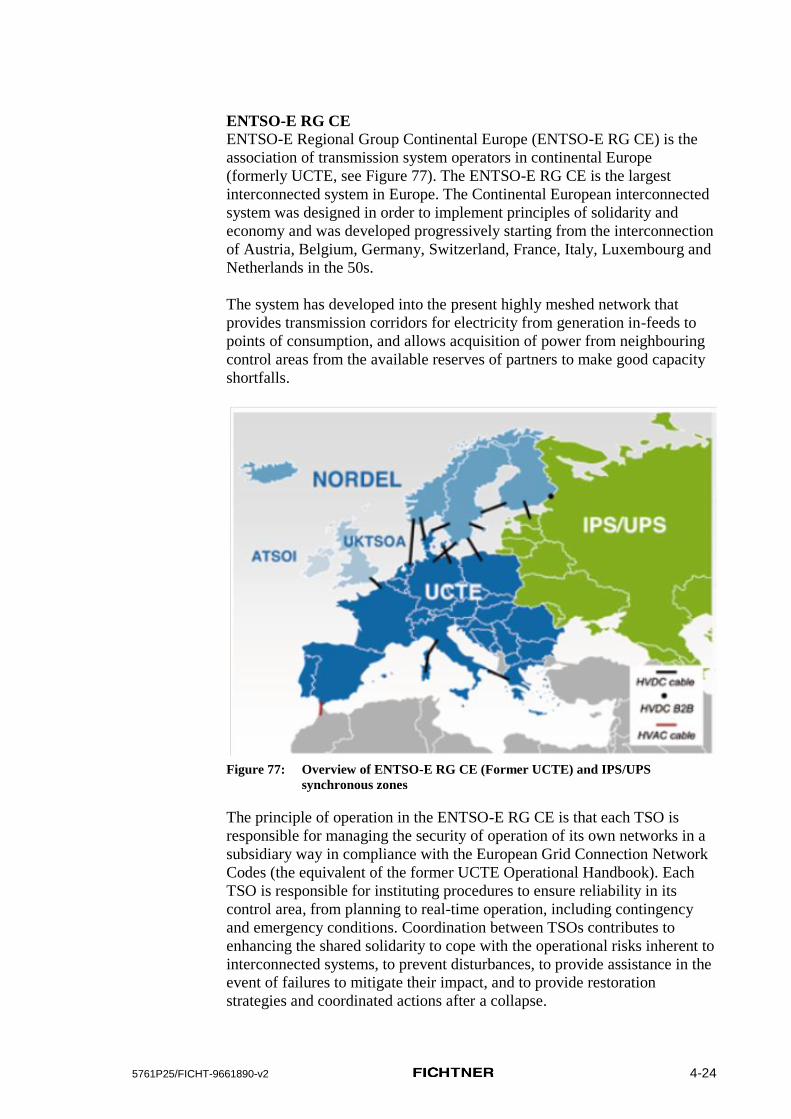
5761P25/FICHT-9661890-v2 4-24
ENTSO-E RG CE
ENTSO-E Regional Group Continental Europe (ENTSO-E RG CE) is the
association of transmission system operators in continental Europe
(formerly UCTE, see Figure 77). The ENTSO-E RG CE is the largest
interconnected system in Europe. The Continental European interconnected
system was designed in order to implement principles of solidarity and
economy and was developed progressively starting from the interconnection
of Austria, Belgium, Germany, Switzerland, France, Italy, Luxembourg and
Netherlands in the 50s.
The system has developed into the present highly meshed network that
provides transmission corridors for electricity from generation in-feeds to
points of consumption, and allows acquisition of power from neighbouring
control areas from the available reserves of partners to make good capacity
shortfalls.
Figure 77: Overview of ENTSO-E RG CE (Former UCTE) and IPS/UPS
synchronous zones
The principle of operation in the ENTSO-E RG CE is that each TSO is
responsible for managing the security of operation of its own networks in a
subsidiary way in compliance with the European Grid Connection Network
Codes (the equivalent of the former UCTE Operational Handbook). Each
TSO is responsible for instituting procedures to ensure reliability in its
control area, from planning to real-time operation, including contingency
and emergency conditions. Coordination between TSOs contributes to
enhancing the shared solidarity to cope with the operational risks inherent to
interconnected systems, to prevent disturbances, to provide assistance in the
event of failures to mitigate their impact, and to provide restoration
strategies and coordinated actions after a collapse.

5761P25/FICHT-9661890-v2 4-25
The South East European countries Bulgaria, Greece, Hungary, Romania
and Slovenia all operate synchronously within the ENTSO-E RG CE.
The non-EU countries in this area, Bosnia-Herzegovina, Croatia, Macedonia
(FYROM), Montenegro and Serbia are part of this regional group as well
and also operate synchronously within the ENTSO-E RG CE. The Albanian
grid is not officialy part of the ENTSO-E group, but is operated
synchronously as well.
There is also a working group working on inclusion of the Turkish grid into
the ENTSO-E RG CE via existing power lines to Greece and Romania.
Turkey would decouple itself from its other surrounding countries and join
the ENTSO-E grid permanently. At present, this configuration is established
on a trial basis that will lead to full implementation if this is successful.
The Mediterranean countries Italy and Spain are operating synchronously
within the ENTSO-E RG CE. Special consideration has to be given to the
interconnections between Mediterranean countries and the Maghreb
countries (Morocco, Algeria and Tunisia). Presently, Maghreb countries
operate synchronously with Spain through two 400 kV HVAC submarine
cable connections between Spain and Morocco. The Spanish TSO REE is
responsible for the operation of the Maghreb countries in parallel with
ENTSO-E RG CE. Special protection schemes are in place to ensure that the
Maghreb countries are disconnected from Spain in case of emergency, so as
not to jeopardize the security of operation in ENTSO-E RG CE.
From the electrical system point of view, the North East European
countries are in different synchronous operation zones. Estonia, Latvia and
Lithuania are included in the BRELL synchronous operation zone (Belarus-
Russia-Kaliningrad-Estonia-Latvia-Lithuania) which is a part of the
IPS/UPS (see below) interconnected system. Estonia is asynchronously
interconnected by an HVDC back-to-back link to Finland. Additionally, it is
to be noted that the IPS of Russian Kaliningrad is tightly interconnected to
the IPS of the Baltic States. The latter are now part of the European
ENTSO-E but are synchronously interconnected with the IPS/UPS system.
Poland and the Slovak Republic are integrated into the Regional Group
Continental Europe (RG CE) of the European Network of Transmission
System Operators for Electricity (ENTSO-E). Finland is included in the
Nordic Group of ENTSO-E. Finland is asynchronously interconnected via
an HVDC back-to-back link to the IPS/UPS system (Russia) and via an
HVDC cable connection to Estonia, the Estlink.
IPS/UPS
Apart from ENTSO-E, another major synchronously operating zone is the
Interconnected Power System/Unified Power System (IPS/UPS) (see Figure
77). The IPS/UPS is a power union presently comprising the synchronously
operated power systems of 13 countries: Azerbaijan, Belarus, Estonia,
Georgia, Kazakhstan, Kyrgyzstan, Latvia, Lithuania, Moldova, Mongolia,
Russia, Ukraine and Uzbekistan (Figure 78). It is actually based on the

5761P25/FICHT-9661890-v2 4-26
former USSR Unified Power System originally set up in the mid-50s of the
last century and continuously extended up to now.
Synchronous operation of the power systems of Commonwealth of
Independent States (CIS) countries is coordinated centrally by the Electric
Power Council of the CIS (EPC CIS). Within the framework of the EPC
CIS, the Commission on Operative-Technological Coordination of parallel
operation of the power systems of the CIS and Baltic countries (COTC)
establishes recommendatory principles of technological interaction and
develops corresponding documents, the operation rules.
Figure 78: IPS/UPS system synchronous zone
Cooperation of the Baltic power systems with the power systems of CIS
countries is performed within the framework of the BRELL Committee,
which was established on the basis of multilateral international agreement
between the TSOs of Belarus, Russia, Estonia, Latvia and Lithuania signed
in 2002.
IPS/UPS is the world’s most geographically extended power system,
spanning over eight time zones. Such vast territory implies certain specific
features of the power system, such as:
comprises internally almost balanced regional power systems connected
mostly by congested links
makes extensive use of long-distance EHV transmission lines up to
1150 kV
uses automatic emergency control systems (in certain cases the N-1
criterion is only satisfied by the automatic emergency control system).

5761P25/FICHT-9661890-v2 4-27
All power systems comprising the IPS/UPS are structurally allocated to 14
power regions:
6 IPSs in Russia: North West, Centre, Middle Volga, South, Ural, and
Siberia
Baltic States: Estonia, Latvia, and Lithuania
Ukraine and Moldova
Central Asia: Kazakhstan, Kirghiz Republic and Uzbekistan
individual power systems of other countries: Azerbaijan, Belarus,
Georgia and Mongolia.
Each power system regulates the active power balance with or without
frequency deviation correction, with or without automatic systems. The UPS
of Russia regulates frequency throughout synchronous zone.
Since 2003, the western part of the Ukrainian power system, the ‘Burshtyn
TPP Island’, has been disconnected from the rest of the system and operates
synchronously with ENTSO-E RG CE. There are connections to Bulgaria,
Hungary, Poland and Slovakia. A passive island scheme is also in operation
between Romania and Moldova.
The ENTSO-E RG CE has a system extension project group for system
integration of Ukraine/Moldova on a long-term basis. So planned
investments in HVDC connections risk becoming redundant after system
integration.
Synchronous coupling to ENTSO-E
ENTSO-E and IPS/UPS have differing operating characteristics. Between
2005 and 2008, an extensive study on synchronous interconnection between
IPS/UPS and ENTSO-E RG was undertaken. The results of the study
showed that, although theoretically possible, synchronous coupling of the
two systems may be considered only on a long-term perspective. A number
of technical, operational and organisational measures have to be
implemented, and the legal framework has to be established too. The
implementation phase for carrying out the identified measures and creating
the necessary conditions has been recognised as a long process. On a short
time scale, the construction of asynchronous links (HVDC connections)
may also be considered for system coupling. This certainly deserves further
consideration and investigation by the stakeholders concerned.
The ENTSO-E RG CE has two system extension project groups for dealing
with system integration and extension issues: Project Group Albania and
Project Group Ukraine/Moldova. On a mid-term perspective (10 years),
there are no other plans to extend the ENTSO-E RG CE synchronous
operation zone by adding other power systems.
5761P25/FICHT-9661890-v2 4-28
4.2.7 Regulatory environment in EU member states
The regulatory environment in the member states (MS) regarding energy
and electricity markets is largely determined by the energy policy of the EU.
Relevant directives on electricity generation are implemented in the
legislation of each EU country. Climate and environmental policies provide
a further legal framework that has to be considered before making
investment decisions for power plants.
Generally, for the transition to liberalised electricity markets, it is likely that
politics and markets have to be adjusted several times before a long-term
stable situation is attained. Future energy policy development can hardly be
predicted in detail but the general political vision for the EU is clearly stated
in the green paper ‘A European Strategy for Sustainable, Competitive and
Secure Energy’ [GreenPaper]. Sustainable energy development is the
overarching goal. The Energy Roadmap 2050 adopted by the European
Commission in 2011 [COM(2011) 885 final] sets the basis and strategy for
developing the long-term European energy framework. The mission
statement for the EU energy policy comprises the following four main goals
as also anchored in the Treaty of Lisbon of 2007:
integration of energy markets towards an efficient and competitive
internal market
security of energy supply
enhancement of energy efficiency and energy savings
development of new and renewable energy sources.
The enhancement and extension of the interconnection of European energy
networks is stated as a further objective for achieving these goals. The main
components of EU legislation that are relevant for power plant investment
decisions concern environmental legislation and the Third Energy Package
on the European internal energy market.
4.2.7.1 Environmental legislation
The most important environmental legislation that directly affects power
plants comprises the following EU directives:
The Large Combustion Plant (LCP) Directive [2001/80/EC]
The Integrated Pollution Prevention and Control (IPPC) Directive
[2008/1/EC]
The Industrial Emission (IE) Directive [2010/75/EU]
The Emissions Trading Scheme (ETS) Directive [2009/29/EC]
Large Combustion Plant Directive
The aim of the Large Combustion Plant Directive [2001/80/EC] is to cut
gaseous pollutant emissions to the air, such as sulphur dioxide (SO2), oxides
of nitrogen (NOx) and particulate matter. The LCP Directive applies to large
combustion plants with a thermal input of at least 50 MW. It includes all

5761P25/FICHT-9661890-v2 4-29
large power plants running on solid, liquid or gaseous fuel. The LCP
Directive stipulates that concentration-based Emission Limit Values (ELVs)
have to be fulfilled for all new and existing plants. The ELVs to be applied
depend on fuel, capacity and age of the combustion plant.
For new power plants authorised after 27 November 2002, compliance with
a set of ELVs as laid down in Part B of the LCP Directive must be fulfilled
(see Table 40). Concrete implementation of the LCP Directive by member
states may even stipulate tighter ELVs. Of the EU countries concerned, for
new plants tighter limits are only in place in Finland for NOx emissions
[ENTEC].
Table 40: Emission limits for new power plants under the LCP Directive [RENA]
Integrated Pollution Prevention and Control Directive
The Integrated Pollution Prevention and Control Directive [2008/1/EC] was
adopted in 2008 and repealed its predecessor version of 1996 [96/61/EC]. It
requires that industrial activities with a high pollution potential must have a
permit to ensure certain environmental conditions are met. The IPPC
Directive applies to a variety of industrial activities, including the energy
sector and combustion installations with a thermal input of at least 50 MW.
The IPPC Directive is a framework directive aiming at a high level of
protection for the environment as a whole. As such, it covers all
environmental media. The IPPC licensing system regulates effluent
discharge, emissions to air, waste management, noise and other
environmental impacts from specified activities by one integrated permit.
As a central principle of the IPPC Directive, installations to be operated
under integrated permits must comply with environmental standards that are
based on Best Available Technologies (BAT). Thus the IPPC Directive also
provides for information exchange on BAT that results in the BAT
Reference Documents (BREF) to be adopted by the European Commission.
Permit stipulations must take into account the installation’s technical
characteristics, its geographical location and local environmental conditions.
To receive a permit, an industrial or agricultural installation must meet
certain basic obligations [2008/1/EC]. In particular, it must:
All values are mg/m³ Gaseous (3 Vol. % O2) Liquid (3 Vol. % O2) Solid (6 Vol. % O2)
Load [MW] ≤ 100 ≤ 300 > 300 ≤ 100 ≤ 300 > 300 ≤ 100 ≤ 300 > 300
General 35 850 400-200* 200 850 200
Biomass 200
SO2 Liquefied gas 5
Coke oven 400
Blast furnace 200
General 200 400 200 400 200
Biomass 400 300 200
NOx Natural gas 150 100
GT natural gas 50
Gas turbine 120 120
General 5 50 30 50 30
Dust Blast furnace 10
Steel industry 30
*linear descending

5761P25/FICHT-9661890-v2 4-30
employ all appropriate pollution-prevention measures, namely the best
available technologies that generate the least waste, use less hazardous
substances, enable the substances generated to be recovered and recycled,
etc.
prevent all large-scale pollution
prevent, recycle or dispose of waste in the least polluting way possible
use energy efficiently
ensure accident prevention and damage limitation
return sites to their original state when the activity is over.
In addition, the decision to issue a permit must contain a number of specific
requirements, including:
emission limit values for polluting substances (except for greenhouse
gases if the emission trading scheme applies - see below)
any required soil, water and air protection measures
waste management
measures to be taken in exceptional circumstances, like leaks,
malfunctions, temporary or permanent stoppages, etc.
minimisation of long-distance or transboundary pollution
monitoring of emission releases
all other appropriate measures.
Industrial Emissions Directive
The Industrial Emissions (IE) Directive adopted in 2010 streamlines and
enhances EU policy on industrial emissions. It came into force on
6 January 2011 and has to be implemented by national legislation by
member states by 7 January 2013. The directive recasts seven other
directives - among them the LCP Directive and IPPC Directive - and
replaces them as of 7 January 2014. Only the LCP Directive will be
repealed with effect from 1 January 2016.
The aim of the IE Directive is to reduce harmful industrial emissions across
the EU, in particular through better application of Best Available
Technologies. Like with the IPPC Directive, the IE Directive is permit
based and aims at an integrated permit approach that takes into account the
entire environmental performance of the plant covering, for example,
emissions to air, water and land, generation of waste, use of raw materials,
energy efficiency, noise, prevention of accidents, and restoration of the site
upon closure. The permit conditions, including ELVs, must be based on
BAT, as defined in the IPPC Directive.
The IE Directive will introduce stricter EU-wide ELVs for SO2, NOx and
particulates in agreement with BAT levels from [LCP BREF 2006]. BAT
reference documents have to be updated and adopted by the Commission
within time periods of not more than eight years. For combustion plants in
the energy sector, the IE Directive holds when the plant’s thermal input is at
least 50 MW.

5761P25/FICHT-9661890-v2 4-31
If, due to geographical location or local environmental conditions or the
technical characteristics of the installation, the achievement of usual BAT-
induced emission levels would lead to disproportionately higher costs
compared to the environmental benefits, the licensing authorities are
allowed to set less strict emission limit values in specific cases.
For new plants, the standards enter into force on 7 January 2013. The new
ELVs for new large combustion plants are listed in Table 41.
Table 41: ELVs for new power plants from 2013 on, as required by the IE
Directive
The strict environmental standards usually favour gas-fired power plants. As
a consequence of the IE Directive, all coal-fired units must have efficient
electrostatic precipitation units or baghouse/fabric filters (cf. [IEA CCC])
plus flue gas desulphurisation units or equivalent technology to reduce SO2
emissions down to 150-400 mg/m3 (depending on plant size) or to achieve
over 92% removal (depending on plant size and age). Furthermore, all coal-
fired units must use low-NOx burners and/or selective catalytic reduction/
selective non catalytic reduction to reduce NOx emissions below 150-
300 mg/m3.
Fuel & Technology Input NOX SO2 CO Dust
MW(th) mg/Nm³ mg/Nm³ mg/Nm³ mg/Nm³
Pulverised Lignite 50-100 400 400 20
Coal and Lignite and other Solid fuels 50-100 300 400 20
Coal and Lignite and other Solid fuels 100-300 200 200 20
Coal and Lignite and other Solid fuels >300 150 150 10
Pulverised Lignite >300 200 150 10
Coal and Lignite and other Solid fuels
using fluidized bed combustion >300 200 10
Biomass 50-100 250 200 20
Biomass 100-300 200 200 20
Biomass >300 150 150 20
Peat 50-100 250 300 20
Peat 100-300 200 300 20
Peat using fluidized bed combustion 100-300 200 250 20
Peat >300 150 150 20
Peat using fluidized bed combustion >300 150 200 20
Liquid fuels (General) 50-100 300 350 20
Liquid fuels (General) 100-300 150 200 20
Liquid fuels (General) >300 100 150 10
Liquid (Distillate) (Gas Turbine) 50-100 50 350 100
Liquid (Distillate) (Gas Turbine) 100-300 50 200 100
Liquid (Distillate) (Gas Turbine) >300 50 150 100
Nat. Gas (General) 50-100 100 35 100 5
Nat. Gas (General) 100-300 100 35 100 5
Nat. Gas (General) >300 100 35 100 5
Nat. Gas (Gas Turbine ) N/A 50 N/A 100
Nat. Gas (Gas Turbine & Eff. > 35%) N/A N/A 100
Nat. Gas (Gas Engines) N/A 75 N/A 100

5761P25/FICHT-9661890-v2 4-32
Emissions Trading Scheme Directive
Reduction of CO2 emissions and other greenhouse gases (GHG) is not
covered by the industrial emissions control regime described above, but is
regulated separately. The ETS is the central instrument of the EU for
controlling GHG emissions, particularly for those from power plants. The
ETS covers inter alia all combustion installations with a rated maximum
thermal input of at least 20 MW. The principle of the ETS is to cap the
overall allowed GHG emissions and trade emission rights in order to
economically optimise the EU-wide emission reduction efforts.
The ETS was launched with Directive [2003/87/EC] in 2005, and is
organised into trading periods. With the ongoing second trading period from
2008 to 2012, the reduction commitment of 8% (compared to 1990 levels)
of the Kyoto Protocol is pursued. Also burden-sharing among the EU MS is
regulated. Each MS has its own emission cap. Most EU emission
allowances (EUA) were allocated free of charge among the MSs according
to national allocation plans (NAP). Only less than 4% of total EUA amounts
were auctioned in phase 2. Since 2008, not only the 27 EU MSs but also
Iceland, Liechtenstein and Norway take part in the ETS. Alongside
emissions from the energy sector, emissions from some selected industries,
too, fall under the ETS.
With Directive [2008/101/EC] aviation activities were included into the
ETS. Directive [2009/29/EC] improved and extended the ETS for the third
trading period, which is scheduled from 2013 to 2020. The scope was
extended to include some further industries, to include further types of
GHGs and to include rules for carbon capture and storage. About 43% of
the EU’s total GHG emissions will be covered by the ETS by 2013. For
power plant operators, the transition to the third operation period brings
about some fundamental changes.
The European Council of March 2007 made a firm commitment to reduce
the overall greenhouse gas emissions of the Community by at least 20 %
below 1990 levels by 2020. With Directive [2009/29/EC], the EU provided
for the contribution of the EU ETS to reach that target. The overall
reduction target of the EU is subdivided by sectors depending on whether a
sector falls under the ETS or not. For all ETS sectors, an overall emission
reduction of in total 21% from 2005 to 2020 was defined. Accordingly, the
EU-wide emission budget for all ETS sectors in total will be capped and
gradually reduced. In case of an international agreement with the EU on
stricter emission reduction targets of more than 20% by 2020, the ETS
Directive provides for appropriate tightening of the ETS emission reduction
targets.
Although free allocation of some EUAs is defined by EU-wide allocation
rules, auctioning will become the basic principle for assigning EUAs. From
2013 on more than 50% of EUAs will be auctioned. This auctioned share
will be steadily increased up to 100% in 2027.

5761P25/FICHT-9661890-v2 4-33
The auctioning principle holds particularly for the energy sector. All power
plants have to fully auction their emission rights. Only ten new MSs were
given the option of exempting themselves until 2019 from the 'full
auctioning' rule and continuing to allocate free of charge a limited number
of emission allowances to existing power plants. These MSs are Bulgaria,
Cyprus, Czech Republic, Estonia, Hungary, Latvia, Lithuania, Malta,
Poland and Romania. The revised ETS Directive stipulates that, even when
this derogation is granted, the level of free allocation in 2013 may not
exceed 70% of the allowances needed to cover emissions for the supply of
electricity to domestic consumers. In each year following 2013, this%age
has to decrease to zero in 2020. Most important: for new power plants no
derogations at all are provided and full auctioning of EUAs is required from
2013 onwards.
Although the ETS cap is defined for the whole EU, each MS auctions its
allocated share of emission rights. Determination of the volume of emission
rights of each MS follows a certain procedure: Firstly, emission amounts
dedicated for free allocation according to the EU-wide allocation rules are
deducted from the total ETS cap. Secondly, a further 5% of emission rights
is held back as a reserve for new market entrants. The remaining emission
rights are dedicated for auctioning and allocated to the MSs. 88% of the
auctioned emission rights is allocated to the MSs according to their shares in
the EU emission inventory from 2005. A further 10% is allocated to
specific MSs according to burden sharing rules for solidarity reasons. A
further 2% is allocated to those MSs that had already attained in 2005
20% emission reductions compared to 1990.
The requirements under the ETS for new power plants in the EU are taken
into account in the model by including the full costs from auctioning and
acquisition of the EUAs. Accordant CO2 price scenarios are taken from EC
documents (see 5.1.1). For non-EU countries, no CO2 emission costs are
taken into account, which may lead to a specific competitive advantage,
which is investigated in this study.
Use of credits from the project based mechanisms CDM and JI
Directive 2004/101/EC (the so-called ‘Linking Directive) allows
participants in the EU ETS to use credits generated from the Kyoto
Protocol’s project-based mechanisms CDM (Clean Development
Mechanism) and JI (Joint Implementation) for fulfilling their obligations
under the trading scheme.
CDM and JI have in common that they enable investments in emission
reduction projects, like renewable energy and energy efficiency measures,
abroad in countries that are also party to the Kyoto Protocol. In the case of
JI, these investments are undertaken in countries which in turn have an
emission reduction obligation. In the case of CDM, these projects are
implemented in countries with no obligation (developing countries).
For every ton of CO2 that is reduced by a CDM or JI project, a carbon
certificate is issued that can be used in the EU ETS. In the case of CDM

5761P25/FICHT-9661890-v2 4-34
these credits are called Certified Emission Reductions (CERs). In JI projects
Emission Reduction Units (ERUs) are generated. The idea is that emission
reductions achieved with CDM or JI projects can be more cost-efficient for
EU ETS participants in comparison to implementing more expensive
emission reductions within the EU.
The use of CERs and ERUs in the second trading period is allowed and
remaining unused credits from this period can be transferred for use in the
third trading period. Also credits from pre-2012 registered CDM projects
that will be generated after 2012 can be used. In any case, the use of CERs
is restricted to 50% of the reduction effort. However for the third trading
period, the ETS Directive restricts the use of CERS and ERUs from new
CDM and JI projects that have been registered post-2012 unless:
a satisfactory international agreement on climate change is approved by
the Community
or, in the absence of such an agreement
the EU enters into a bilateral agreement with a country.
An exemption is the acceptance of credits from new projects implemented
in Least Developed Countries (LDCs) after 2012. These can be used in the
third trading period even in the absence of such agreements as listed above.
However, among the non-EU countries contiguous with the EU there are no
LDCs.
As there has been neither an international agreement up to now nor have
there been any EU agreements with third countries, the use of CERs and
ERUs from new projects registered beyond 2013 is currently prohibited for
the third trading period.
4.2.7.2 Third Energy Package
The liberalisation of the European energy markets was triggered already in
1996 with a first energy package. It mandated all MSs to provide for a
competitive electricity market. The main contents of the second energy
package brought the obligation for vertically integrated power utilities to
unbundle under company law and organisationally. It would see electricity
generating companies separated from their transmission networks.
Furthermore, MSs were mandated to establish a regulation authority and
implement a system for regulated grid access.
The third legislative package for an internal EU gas and electricity market
was adopted in July 2009 and came into force in March 2011. The third
energy package comprises:
Directive [2009/72/EC] concerning common rules for the internal market
in electricity
Directive [2009/73/EC] concerning common rules for the internal market
in natural gas

5761P25/FICHT-9661890-v2 4-35
Regulation [2009/713/EC] establishing an Agency for the Cooperation of
Energy Regulators (ACER)
Regulation [2009/714/EC] on conditions for access to the network for
cross-border exchanges in electricity
Regulation [2009/715/EC] on conditions for access to the natural gas
transmission networks.
The energy package aims at bringing energy markets closer to the ideal of
one competitive and fully integrated market. Basic elements are:
public service obligations and customer protection
structural separation between transmission activities and
production/supply activities of vertically integrated companies (further
unbundling regulation)
empowering and independence of national, sector-specific regulators
new tools to harmonise market and network operation rules at pan-
European level
establishment of the institutional framework for ACER and ENTSOs.
With regard to natural gas markets, Directive [2009/73/EC] redefines rules
and measures applying to natural gas markets to increase market
transparency and guarantee fair competition and appropriate consumer
protection.
With regard to electricity markets the Directive [2009/72/EC] introduces
common rules for the generation, transmission, distribution and supply of
electricity. Persons from third countries are allowed to control or operate a
transmission system only if they comply with the requirements of effective
separation that apply inside the Community. For unbundling, the Directive
grants MSs a choice between three possible models:
Ownership Unbundling (OU)
Independent System Operator (ISO)
Independent Transmission System Operator (ITO)
The unbundling initiative shall facilitate non-discriminatory access to
transmission networks and fair competition between suppliers. It shall
furthermore stimulate investment in interconnectors which may negatively
impact the market share of the vertically related supplier.
With OU, the TSO owns and manages the transmission network. The
supplier shall have no control on the TSO and shall only be allowed to hold
minority shares but with no voting rights and no rights in appointment of
TSO administrators. A Member State has the right to opt for full OU in its
territory. Where a Member State has exercised that right, an undertaking
does not have the right to set up an ISO or an ITO. Furthermore, an
undertaking performing any of the functions of generation or supply cannot
directly or indirectly exercise control or any right over a transmission
system operator from a Member State that has opted for full ownership
unbundling [Säcker].

5761P25/FICHT-9661890-v2 4-36
According to the ISO model, the vertically integrated company still owns
the transmission network. Effective unbundling is based on a pillar of
organisational measures and measures relating to the governance of
transmission system operators and on a pillar of measures relating to
investment, connecting new production capacities to the network and
market integration through regional cooperation [Säcker].
The independence of the transmission operator should also, inter alia, be
ensured through certain ‘cooling-off’ periods during which no management
or other relevant activity giving access to the same information as could
have been obtained in a managerial position is exercised in the vertically
integrated undertaking.
The establishment of an ITO is a third alternative for the unbundling
mechanisms. Unlike an ISO, an ITO must not be broken off from the
vertically integrated company. Instead strict rules shall guarantee the
independence of the ITO from the remaining part of the company.
Independence implies separation of assets, installations and staff, and must
be implemented by company law. Commercial and financial business
transactions between the two parties must be in accordance with usual
market conditions and must be made fully transparent to the regulatory
authority. Additionally, an ITO is required to establish a non-discrimination
programme to guarantee non-discriminatory grid access rules and processes.
Apart from unbundling requirements, all European TSOs organised under
ENTSO are mandated to undertake trans-European cooperation and
common planning to establish a European supergrid. Furthermore, TSOs
should facilitate the participation of final customers and final customers’
aggregators in reserve and balancing markets [Säcker].
Cross-border trade
The EU regulation for cross-border electricity trade provides access to the
network for cross-border exchanges to create an internal market for
electricity and an increase of cross-border electricity flows. Because the
demand for cross-border power transfer can exceed transmission capacities,
the regulation sets an auction system for non-discriminatory access to
transmission capacities. According to [2009/714/EC], the conditions of the
auction process are formulated for management of congestion problems and
should provide correct economic signals to transmission system operators
and market participants in a market-based mechanism.
The cross-border capacity trade for electricity transmission in the ENTSO-E
area is transacted directly between the TSOs concerned, who have to
coordinate their congestion management in regional clusters. Some TSOs,
though, have established common platforms to simplify and centralize the
allocation procedure, e.g. the CASC.EU. This auction office trades the
cross-border transmission capacity for Central Western Europe, the borders
of Italy, Northern Switzerland and parts of Scandinavia [CASC].
Transmission system operators that are not allied in overarching trade

5761P25/FICHT-9661890-v2 4-37
platforms organize their allocations together with the appropriate TSO of
the bordering country. In this case, they set up joint ventures to transact the
capacity allocation business or come to an agreement that one of the
operators organizes the allocation system.
The TSOs have to undertake temporal segmentation of the ATCs they
provide. The allocated capacities are set in yearly, monthly, daily and
intraday periods, although there are variants. Some TSOs also have
quarterly and weekly periods for their auctions. The structure of the quantity
of the allocation per time unit is determined by the TSO. Every relevant
item of information on tendered values, registration for the bidding process,
net availability as well as conditions and allocation principles have to be
published by the TSOs, and these are mostly available on their websites.
The volume of the overall available capacity can be assigned in two ways.
Long-term rights are often allocated in the explicit market where only the
transmission right can be acquired whereas short-term rights (day ahead and
intraday) are mostly auctioned in the implicit market, also known as market
coupling or market splitting. In this case, the transmission right is brought
together with the electricity. The implicit market was established to
maximize the benefit of the capacity and the generation market, and to make
use of price signals that result in an easier power flow from low-price areas
to high-price areas [MAR].
In the allocation procedure, the tendered capacity is awarded to the highest
bid. Just before the allocated timeframe for the use of the transmission
capacity, the owner has to inform the TSO of the extent to which he will use
his option. Potential vacancies of the net capacity will be offered again in
the next window of opportunity. It is also possible to trade transfer rights in
the secondary market, although the TSOs can prohibit this procedure.
Revenues from capacity auctions are shared by the TSOs concerned and
have to be reinvested in new cross-border transmission lines, maintenance
and operation of existing capacities or implementing net cost reductions,
although there are exceptions that apply under specific conditions.
With its Third Energy Package and subsequent legislation, the EU has
established an obligatory inter-TSO compensation mechanism (ITC)
[THINK]. Under the ITC, TSOs are compensated for all costs incurred as a
result of hosting cross-border flows of electricity on their networks by those
TSOs from whose systems cross-border flows originate or where they end.
The costs shall be established on the basis of the forward-looking long-run
average incremental costs, taking into account losses, investment in new
infrastructure, and an appropriate share of the cost of existing infrastructure.
The concrete ITC methodology currently applied is laid down in Regulation
838/2010. Its central element is an ITC fund which shall provide (separately
calculated) compensation payments. The fund is calculated and distributed
annually based on an ex-post analysis. Contributions to the fund are
determined based on TSOs’ “proportion to the absolute value of net flows

5761P25/FICHT-9661890-v2 4-38
onto and from their national transmission system as a share of the sum of
the absolute value of net flows onto and from all national transmission
systems”. Thus the larger the imbalance between import and export flows of
a country, the larger will be its payment into the fund.
Third country import and export flows, termed perimeter flows, shall
contribute to the fund. The “perimeter fee” is fixed annually per MWh
transit. The unit price perimeter fee for 2012 is 0.80 €/MWh.
4.2.8 Regulatory environment in non-EU countries
Among the analysed non-EU countries, the regulatory environments for
investments in new power plants are generally specific for each country.
However, for the members of the European Energy Community (EEC), the
EEC treaty provides a common regulatory basis for PP investment
conditions and for electricity transmission. Thus the EEC and its relevance
for the analysed PP investment situations are introduced in 4.2.8.1.
The EEC is particularly relevant for regulating the market for (international)
electricity transmission. Whether access to the grid and to transmission
capacities for electricity transfer into the EU is possible without
discrimination and at reasonable conditions is of vital interest for a potential
PP investor (cf. section 4.2.8.2).
For non-EU countries, less strict environmental regulation for power plants
may be in force compared to EU power plants. This may allow power plants
to be installed without some of the environmental protection features
required by EU legislation or without paying attention to carbon costs. This
issue is discussed in 4.2.8.3. Also the impact of policies on the supply of
renewable energy in the targeted market in the EU is analysed in this
section.
4.2.8.1 Energy Community
The Energy Community (EEC) lays down a legal framework between the
European Union and South East European as well as other countries
contiguous to the EU. Its purpose is to extend the European internal energy
market to other countries.
The EEC Treaty was signed in 2005 by the European Community and then
nine Contractual Parties from South East Europe (cf. Figure 79). Following
ratification, the Treaty came into force on 1 July 2006. In Dec 2009 the
Energy Community Ministerial Council decided on the accession of
Moldova and Ukraine. With this decision, the geographical concept of the
Western Balkans, with which the process was initially linked, lost its
validity. Today, the motive behind the Energy Community Treaty is rather
the import of EU energy policy into non-EU countries. [EEC]

5761P25/FICHT-9661890-v2 4-39
Figure 79: Map of the Contractual Parties of the EEC
Among the non-EU countries analysed in this study, the European Energy
Community provides a common regulatory basis for:
Albania
Bosnia and Herzegovina
Croatia
FYROM (Former Yugoslav Republic of Macedonia)
Moldova
Montenegro
Serbia
Ukraine
Turkey is among the countries with an observer status but its membership is
desired on the part of Turkey as well as on the part of the EU. Thus it can be
assumed that potential power plant investments in Turkey even now and
certainly in the foreseeable future will have to comply with EEC rules so as
not to run the risk of turning into stranded investments after Turkey’s
accession to the Energy Community. For this reason, our analysis of the
investment conditions in Turkey considers the situation of Turkey as already
being a member of the Energy Community.

5761P25/FICHT-9661890-v2 4-40
Aims of the Treaty establishing the Energy Community
According to Article 2, the task of the Energy Community is to structure the
relationships between the parties and create a legal and economic
framework in relation to Network Energy in order to [EEC-LF_2010]:
create a stable regulatory and market framework capable of attracting
investment in gas networks, power generation, and transmission and
distribution networks
create a single regulatory space for trade in Network Energy as needed
to match the geographic extent of the product markets concerned
enhance the security of supply of the single regulatory space
improve the environmental situation in relation to Network Energy and
related energy efficiency, foster the use of renewable energy, and set out
the conditions for energy trading in the single regulatory space
develop Network Energy market competition over a broader geographic
spread and exploit economies of scale.
To facilitate this process, the Treaty establishing the Energy Community
defines the institutional setting and equips its stakeholders with specific
rights and duties.
Commitments by the Parties under the Treaty
As regards the commitments undertaken by the Parties to the Energy
Community, Article 3 of the Treaty establishes a three-tier structure which
may be described as the Treaty’s concentric circles:
The first, innermost circle in Title II of the Treaty “The Extension of the
Acquis Communautaire” addresses the Contractual Parties alone. Under
the Treaty, they have agreed to implement core parts of the EC acquis
communautaire, both sector-specific and in general. The Energy
Community acquis comprises the core EU energy legislation in the areas of
electricity, gas, environment, competition, renewables and energy
efficiency. Furthermore, Articles 24 and 25 of the Treaty allow for
adaptation of the acquis and implementing amendments made to it in the
course of evolution of EC law. After its coming into force, the Energy
Community acquis has been extended to include new energy policy areas as
well as to replace older acts by newer, revised ones. Separate acquis outline
the several energy fields [EEC].
Title II also requires the Contractual Parties to adopt development plans
with a view to bringing their energy sectors in line with generally applicable
standards of the EC.

5761P25/FICHT-9661890-v2 4-41
The second circle in Title III of the Treaty “Mechanism for operation of
Network Energy Markets” addresses the Contractual Parties as well as
seven EU member states connected to the region, namely Austria, Bulgaria,
Greece, Hungary, Italy, Romania and Slovenia. Title III contains provisions
for creating mechanisms for long-distance transportation of Network
Energy, adopting security of supply statements and promoting high levels of
energy provisions to citizens. It also urges harmonization of market designs,
mutual recognition of licenses and fostering free establishment of
companies, fostering development in the areas of renewable energy sources
and energy efficiency, as well as providing a framework for safeguarding
measures in the event of a sudden crisis. For the greater part, the provisions
in Title III require implementation through measures taken or to be taken by
the competent Energy Community institutions.
Finally, the third circle in Title IV of the Treaty “The Creation of a Single
Energy Market” addresses the Contractual Parties as well as the entire
European Community, i.e. all Parties. Basically, it provides for the free
movement of network energy and allows for further measures to be taken
with a view to creating a single energy market. Furthermore, Title IV
establishes an external energy trade policy and provides for a mechanism of
mutual assistance between the Parties in the event of energy disruption.
Further Titles (V-XII) refer to the organizational structures, such as the
institutions of the community, the decision making process, implementation,
regulatory aspects and dispute settlement [EEC].
The Acquis Communautaire of the EEC
The Acquis Communautaire of the EEC includes (among others) the
following EU Directives and Regulation:
ACQUIS COMMUNAUTAIRE ELECTRICITY
Directive 2003/54/EC concerning common rules for the internal market
in electricity
Regulation (EC) No 1228/2003 on conditions for access to the network
for cross-border exchanges in electricity, incl. amending Decision
2006/770/EC.
Directive 2005/89/EC concerning measures to safeguard security of
electricity supply and infrastructure investment
Directive 2001/77/EC on the promotion of electricity produced from
renewable energy sources in the internal electricity market
The Ministerial Council, furthermore, adopted the third legislative package
for an internal EU gas and electricity market (cf. section 4.2.7.2) in
October 2011. The general implementation deadline is set for 1 January
2015, only Article 11 of Directive 2009/72/EC (regarding ‘certification in
relation to third countries’) shall apply from 1 January 2017. With regard to
the EU regulation regarding cross-border electricity trading and congestion
management, the Permanent High Level Group of the Energy Community
drafted recently a decision to implement EU Regulation 838/2010 (cf.
section 4.2.7.2 above) by 1 January 2013 for all Energy Community
Members.

5761P25/FICHT-9661890-v2 4-42
ACQUIS COMMUNAUTAIRE ENVIRONMENT
The acquis on environment shall be implemented insofar as it affects
network energy. It includes inter alia:
Directive 85/337/EEC on the assessment of the effects of certain public
and private projects on the environment, as well as Directive 97/11/EC
amending Directive 85/337/EEC
Directive 2003/35/EC providing for public participation in respect of the
drawing up of certain plans and programs relating to the environment and
amending with regard to public participation and access to justice
Directives 85/337/EEC and 96/61/EC.
Directive 2001/80/EC on the limitation of emissions of certain pollutants
into the air from large combustion plants (LCP Directive)
Each Contracting Party shall endeavour to implement Directive
96/61/EC concerning integrated pollution prevention and control (IPPC
Directive), codified by Directive 2008/1/EC (cf. section 4.2.7.1).
In May 2012, all Contractual Parties noted the major challenges entailed in
implementation of the LCP Directive [EEC_taskforce], which must be
implemented after a transitional period by the end of 2017. Problems of
implementation concern, though, particularly retrofits and environmental
adjustments of existing plants, which is hampered mainly by lack of finance.
Most important: According to Article 15 of the treaty, construction and
operation of new power plants shall comply with the acquis communautaire
on the environment by when this treaty comes into force, i.e. since 2006.
According to Article 13 of the Treaty, the Contractual Parties recognise the
importance of the Kyoto Protocol and shall endeavour to accede it.
Although no explicit access to the EU ETS is mentioned in the Treaty,
Article 13 represents the political commitment of the Contractual Parties to
enhance climate protection standards. This may send a signal to potential
power plant investors that further limitations to CO2 emissions are planned
for the EEC countries.
ACQUIS COMMUNAUTAIRE COMPETITION
The competition acquis shall be implemented insofar as trading of network
energy between the Contractual Parties may be affected. It rests on three
pillars:
1. A prohibition on cartels corresponding to Article 81 of the EC Treaty.
2. A prohibition on abuses of dominant positions corresponding to
Article 82 of the EC Treaty.
3. A prohibition on state aid corresponding to Article 87 of the EC Treaty.
Moreover, the principles of the EC Treaty regarding public undertakings
and undertakings to which special or exclusive rights have been granted, in
particular Article 86(1) and (2) EC, apply to the Contractual Parties. These
articles prohibit state-organised restrictions of competition and defend

5761P25/FICHT-9661890-v2 4-43
undertakings with special missions that provide services of general
economic interest (SGEI). Generally, the entire liberalisation of the
electricity market is to be concluded by January 2015.
The regulations and structures for cross-border capacity trade within the
ENTSO-E union have also been adopted by the Energy Community in its
decision No. 2008/02/MC-EnC and therefore apply for the member states
[EEC-LF_2008]. As a consequence for power plant investments in these
countries, a transparent and non-discriminatory grid access as practised
within the EU and described above can be assumed.
However, there are some pending dispute cases that concern the lack of or
incorrect implementation or application of the EEC rules in some EEC
members. Disputes are managed within a so-called dispute settlement
mechanism to enforce the obligations assumed by the Parties that signed the
Treaty. The most prominent example with regard to the focus of this study
is the dispute settlement formulated by the Energy Community Secretariat
in January 2011 (CASES NO. 01-06/11). Albania, Bosnia and Herzegovina,
Croatia, the former Yugoslav Republic of Macedonia, Montenegro and
Serbia are requested to adopt a common coordinated congestion
management method and procedure for the allocation of transmission
capacity to the market. This obligation was due as from 31 December 2009.
COMPLIANCE WITH GENERALLY APPLICABLE STANDARDS
OF THE EUROPEAN COMMUNITY
Within one year of the date of entry into force of this Treaty, the Secretariat
shall draw up a list of the Generally Applicable Standards of the European
Community, to be submitted to the Ministerial Council for adoption. The
Contractual Parties shall, within one year of the adoption of the list, set up
development plans to bring their Network Energy sectors into line with
these Generally Applicable Standards of the European Community.
“Generally Applicable Standards of the European Community” shall refer to
any technical system standard that is applied within the European
Community and is necessary for operating network systems safely and
efficiently, including aspects of transmission, cross-border connections,
modulation and general technical system security standards [EEC].
Meaning of the EEC for PP investments and electricity import to EU. The countries of the Energy Community regulate their grid access for new
power plants on the basis of relevant EU regulations. The respective
directive 2009/72/EC concerning the common rules for the internal market
in electricity describes non-discriminatory grid access for new power plants
and was adopted by the EEC.
The TSOs have to organise a transparent procedure to check if the grid
capacity is sufficient for a requested power plant capacity and justify their
result by submitting calculations, pertinent data and evaluation criteria.
Furthermore, in case of a refusal, the TSO has to provide relevant
information on the measures that would have to be taken to extend the grid

5761P25/FICHT-9661890-v2 4-44
system to gain grid access. In general, only insufficient grid capacity can
lead to a negative response.
Originating from this regulation, a non-discriminatory access for IPPs in the
member states of the Energy Community can be regarded as assured.
Furthermore, the EEC implies non-discrimination rules for transmission
capacity booking and for transmission pricing. It is assumed that
deficiencies and disputes on implementation of the common EEC rules will
have been resolved within the period under investigation, i.e. by 2020, and
are thus not considered further in this study.
For electricity export from EEC countries into EU countries, the EEC treaty is
of supreme importance, because this provides for an intergovernmental
connection agreement that generally allows transmission links between the
countries concerned with the EU.
4.2.8.2 Electricity market regulations in non-EU countries
Electricity markets in the member states of the Energy Community are on
their way to implementation of European Standards (cf. 4.2.8.1 above). For
non-EU countries not being a member of the Energy Community, the
following regulations concerning cross-border electricity flows and capacity
allocation exist:
Considering Turkey it can be said that the country is an observer of the
EEC and expressed its interest in a full membership of the Energy
Community [EEC-OBS]. Additionally, Turkey is in the linking process to
the ENTSO-E grid and establishes an capacity auction system following the
European idea of liberalisation [TTOEU][TCBETL][TEIAS-ENTSOE]. The
new Electricity Market Import and Export Regulation provides that
wholesale companies are eligible for import/export of electricity and
capacity allocation procedures are managed by the TSO TEİAŞ.
Furthermore, synchronous connections capacity to the ENTSO-E region is
allocated by explicit auctions and over-the-counter trade of the capacities is
permitted. The period of allocation of whole or some portion of capacity an
interconnection line to a single user shall not be more than one year. The
allocation method generally underlies the principle of non-discriminatory
conducts, the development of competition and appropriateness of method
with liberal market aspects [TEIAS][NARUC].
The Baltic electricity network is highly integrated into the power system of
Russia, which currently helps the Baltic countries to maintain supply
adequacy. However, a long term political goal is for the Baltic countries to
desynchronise from the Russian network and synchronise to the EU
network. The timing of desynchronisation from the Russian network is
unlikely to take place before 2020 [ELFORSK].

5761P25/FICHT-9661890-v2 4-45
The EU set up a Baltic Energy Market Interconnection Plan (BEMIP) for
integration of the Baltic States into the EU energy networks. The target year
for the full implementation of a common Baltic electricity market integrated
with Nord Pool has been fixed at the year 2015 [CESI]. It shall be consistent
then with the key elements of the Nordic market design, which inter alia
include:
implicit auction between Baltic countries and towards Nordic countries
on a single trading platform
market transparency according to EU standards
harmonized network tariffs for generators
a common position and trading principles towards third countries.
In the long term, physical transactions from suppliers of non-EU countries
like Russia and Belarus might be envisaged through participation to the
power exchange or by means of bilateral contracts, provided that
‘reciprocity’ in the market rules as well as in the environmental and safety
standards is ensured [CESI].
Electricity markets in Russia are completely different designed than those in
EU countries. This complicates electricity exports from Russia. Russia
applies the nodal pricing model (ca. 8000 nodes in Russia), where each node
is assigned to an own price. This limits hedging possibilities via financial
contracts. Furthermore, the Russian electricity market is an ‘energy and
capacity’ market. As a result, the exporter’s capacity payment depends on
the forecast exports during peak hours. Capacity has to be reserved in
advance on a monthly basis and has to be paid regardless of whether the
capacity is used. Additionally, trading is complicated by different market
designs and trading cycles in the Russian day-ahead markets compared to
the Nordic market design [LUT].
There is no general framework on conditions for cross-border power trade
that count for all bordering countries of Russia. A free access to cross-
border capacities is not given and there is no explicit or implicit auction
mechanism of transmission capacity [Fortum][EURELEC][DMOERF].
Eurelectric and the CIS Electric Power Council are in a dialogue for
establishing compatible market rules. However a commitment from the EU
and CIS to prioritise the development of the functionality of the cross-
border trade is lacking [Fortum].
The bilateral trade between Finland and Russia is arranged with one Russian
exporter (Inter Rao, 1300 MW) and two Finish importers (RAO Nordic Oy,
980 MW and Inter Green Renewables and Trading AB, 320 MW). In
addition, 100 MW is available for direct trade at Nord Pool Spot [LUT] and
about +/- 100 MW for automatic frequency regulation in the Finish system
[Inter Rao]. Power transmissions are only feasible from Russia to the Finish
market [19] [20]. Free access to cross-border capacities is in practice not
available due to the balancing responsibility on the borders assigned to Inter
Rao. A market based allocation of cross-border capacity is missing
[Fortum].

5761P25/FICHT-9661890-v2 4-46
Electricity markets in the Maghreb countries are characterised by the so-
called ‘single buyer’ model. In the single buyer system, the producer and the
eligible customer contract on a certain volume [EUI]. Then the single buyer,
which is usually the TSO, buys the electricity from the producer at the price
agreed between them minus the cost of transport and distribution. The
electricity is then resold to the buyer at the price primarily agreed with the
producer. In the case where the single buyer does not have a duty to buy,
negotiated or regulated Third Party Access (TPA) applies. The single buyer
model raises important problems of transparency and accounting
unbundling [EUI].
However during recent years Maghreb countries modernised their electricity
market regulations in the course of the envisaged overall strategy of
Mediterranean countries to close the Mediterranean Energy Ring
(MEDRING).
In Algeria the electricity law (n°02-01 for electricity and gas distribution)
for the liberalisation of the Algerian electricity market was approved in
2002 [CREG]. The Law lays down all the provisions for the unbundling of
the former vertically integrated utility, SONELGAZ, as well as the role of
each market actor and the market model. The transmission system is
operated by one single grid operator (article 29). The system operator shall
work in a transparent and not discriminatory way. The law does however
not clearly state how the electricity trading and the allocation of
transmission capacity are to be organised [CREAD]. An auction mechanism
does not exist [MEDREG 2011].
An independent Regulatory Commission for Electricity and Gas
(Commission de régulation de l’électricité et du gaz, CREG) was
established. CREG shall (art. 113) oversee the competitive and transparent
functioning of the electricity market. The regulator has the power to approve
the system operator rules. In addition he also has the power to ask for
modifications before approval. Article 128 of the law on electricity states
that operators have to agree with the CREG sale and purchase contracts of
electricity. This provision permits CREG to know the exact quantity and
nature of the electricity sold in the market [CREAD].
The power generation sector was opened to private and public operators
(articles 6 and 7 of the electricity law) [CREG]. The law introduces
competition in the electricity generation segment, by principally permitting
any natural or legal person to install electricity generation capacities. A
formal permission by the regulatory commission for each new power plant
over 25 MW is required [CREAD].
Article 85 of the electricity law explicitly allows the export and import of
electricity, which can be performed by any legal or natural person [CREG].
The transit tariff is set by bilateral negotiations [MEDREG 2011].
International electricity transactions have to be confirmed by the regulatory
commission (CREG), which can refuse export activities if they have strong

5761P25/FICHT-9661890-v2 4-47
negative impacts on the national Algerian electricity supply (i.e. if demand
cannot be satisfied). Power plants that have been constructed exclusively for
the export of electricity are exempted from this reservation (article 86)
[CREG] – a clause that opens a legal door for pure export projects, such as
Desertec. However, transmission lines for export purposes only must not be
owned by private entities [CREAD].
According to the law, the state electricity and gas monopoly SONELGAZ,
which is also responsible for operation, management and development of
the grid, shall unbundle its activities [CREG]. As a consequence, the
company SONELGAZ has been restructured in the form of a holding
company. SONELGAZ/O.S. (Operateur Système) is responsible for the
operation and planning of the grid, but is not the owner. The network assets
are owned and utilised by SONELGAZ/GRTE, Gestionnaire réseau de
transport électricité [MEDRING_UP1]. SONELGAZ/O.S. as well as
SONELGAZ/GRTE are 100% subsidiaries of the SONELGAZ holding
[UIR].
The Algerian law of finance from 2009 constitutes a regulatory barrier for
international investors. Its article 58 stipulates that all the economic
activities in Algeria have to be done in partnership with Algerian
shareholders. Foreign trade companies can only hold up to 70% of the
capital of a company in Algeria. For all other economic activities, foreign
companies are allowed to have a domestic maximum share of 49% of the
capital [LDF_2009] [GTAI].
In Tunisia, private power generation projects are allowed since 1996.
The Tunisian state-owned electricity company (STEG) declared its intention
to create a North African electricity market, and to integrate it into the
European. The progressive integration of the Algerian, Morocco and
Tunisian electricity markets in the internal EU electricity market project is a
follow-up to the Protocol Agreement signed in Rome by the three Maghreb
countries and the EC in 2003. The objectives are:
Harmonizing the legislative and regulatory framework as well as the
industrial structure of the beneficiary countries to create a market of
electricity.
Make them compatible, for a second time, with European standards in
order to integrate this market with the EU one.
The National Agency for Energy Management (ANME) established by the
Law No. 2004-72 of 2 August 2004, has, as part of its mandate,
responsibility for regulating the energy sector in the country. [REEEP] In
February 2009 a new law was passed committing STEG to buy electrical
surplus generated by self-producers from renewable energy and to lease
them its transmission system to transport the surplus from an establishment
to another within the same group.
The Tunisian electricity sector is managed by vertically integrated utilities.
Currently, the main actor is STEG, being the exclusive electricity distributor

5761P25/FICHT-9661890-v2 4-48
and TSO. STEG also owns a large part of the existing power generation
facilities [MEDRING_UP1]. STEG has exclusive rights to import and
export electricity [GENI]. The current Tunisian legal framework provides
only for the production of electricity for own needs or intended for sale to
STEG. It does not provide for private production of electricity to be sold
directly on the market or exported [CONS].
Law No. 2009-7 allows power auto-production from renewable energy with
a right to sell to STEG up to 30% of power generated at a price equivalent
to high tariff prices [ANME]. Auto-producers are allowed to use the
national grid to transport power to point of consumption, on payment of a
transport fee, currently set at 0.005 DT / kWh [ANME]. The new electricity
transport contract allows self-producers to use sub-contracting in order to
ensure electricity production [ANME]. Decree No. 2009-2773 is fixing the
conditions for power transport, the surplus sale to STEG and upper limits of
these surpluses. The prices are set by order of the Minister of Energy
[ANME].
A major obstacle for the creation and development of regional electricity
trading in the Mediterranean area is the lack of shared rules on capacity
allocation, congestion management and inter-TSO compensation
mechanisms. The setting up of shared rules on the above issues is a
mandatory prerequisite for the free trading both between SEMC (Southern
and Eastern Mediterranean Countries) and with the NMC (Northern
Mediterranean Countries) [MEDRING_UP1].
In order to develop interconnection capacities, the IMME Project
(Intégration des Marchés Maghrébins de l’Electricité) has been launched.
IMME supports the development of an integrated electricity market between
Algeria, Morocco and Tunisia and between these three Maghreb countries
and the EU, through the harmonization of their legislative and regulatory
framework. The project focuses on the development of an integrated
electricity market among these three Maghreb countries, through the
adoption of a strategy, together with a plan of action, that will help them
adapt their legislative and regulatory framework. It also enhances the
technical knowledge of the different actors, including regulators and
ministries, with a view to creating a market that is compatible with the
legislative framework of the EU electricity market. These objectives
motivated the signature of the “Algiers Declaration” on 20 June 2010 by the
three Energy Ministers of Morocco, Algeria and Tunisia, in the presence of
the Energy Commissioner of the EU. According to the Algiers Declaration
the signing countries inter alia
reaffirm their desire to pursue the reforms of the national energy sectors,
pursue actions designed to harmonise the legislative and regulatory
frameworks and the technical and economic conditions required to create
a viable electricity market in and between the three Maghreb countries
and their integration into the European Union market,
agree that access to the networks must be non-discriminatory and
transparent, and subject to appropriate pricing,

5761P25/FICHT-9661890-v2 4-49
invite the network managers to draft a set of common rules to facilitate
cross-border trade in electricity,
emphasize the importance of developing new and renewable energies, of
promoting energy efficiency and of safeguarding the environment within
the framework of electricity market integration, pursuing a sustainable
development approach,
approve the Action Plan appended to the declaration,
mandate the permanent High Level Group to set up a monitoring
committee responsible for its implementation.
The second action of the IMME action plan is set out as follows: “To set up
in each country appropriate regulation authorities” [EEAS].
4.2.8.3 Environmental policies
Environmental regulation in non-EU countries may stipulate considerably
different emission limit standards for power plants compared to the
respective EU standards. Particularly if the non-EU ELVs are low, one may
suppose a competitive advantage to install a low technology power plant in
the non-EU country instead of a high tech power plant within the EU.
Installation of the power plant outside the EU would save investment costs
for installation of excess air cleaning devices or other environmental
protection installations.
However, in fact for investments into new power plants, there exist
environmental standards defined by World Bank that are implicitly effective
if national standards within a country are low. The reason is that for a power
plant investment it is common and essential to be financed by an
international bank consortium. These credit consortiums are mainly
established for large exposures, to minimize and share the risks that come
along with such a large investment. Otherwise, risks would be too high for a
single lender in the case of a power plant investment. The World Bank
standards are the internationally accepted standards that each power plant
investment usually has to fulfil in order to become bankable.
From a comparison of the World Bank ELV standards (see Table 42) with
the ELV standards for new EU power plants as set by the EU IE Directive
(cf. Table 41) it becomes evident, that EU standards fulfil the World Bank
standards. But on the other hand, World Bank standards are high enough to
urge for ambitious technologies. Fulfilling the only little more stringent EU
standards means only marginal additional investment costs for the EU
power plant compared to the non-EU power plant, if any additional costs at
all. Therefore equal investment costs for power plants within and beyond
the EU are used in the calculation model.

5761P25/FICHT-9661890-v2 4-50
Table 42: World Bank emission limit standards for power plant investments
In non-EU countries a potential investor may be concerned particularly
about the following questions:
According to which rules is grid access approved? Is grid access possible
without discrimination?
Which regulatory rules govern transmission costs for electricity imports
into EU?
According to which rules can transmission capacities for electricity
import into EU be booked? Is there access? And without discrimination?
Are (intergovernmental) connection agreements existing that allow for
electricity import into EU?
Is environmental regulation for new PP investments in non-EU countries
a lower or higher burden compared to PP investments within the EU?
Is environmental regulation for new PP investments in non-EU countries a
lower or higher burden compared to PP investments within the EU?
4.3 The Decision Making Model
4.3.1 General assumptions
The core task of the study is to compare power plant projects within an EU
country and alternatively in a neighbouring non-EU country. Either power
plant will supply its entire electricity production to the electricity markets of
the respective EU country. The objective is to evaluate which of the two
options is from the point of view of the potential investor economically the
most favourable. The model for such a decision making process will thus
represent the view of an international investor, who decides for the power
plant investment to be within or outside the EU.
IFC World Bank
NDA DA
mg / Nm3
Excess O2
in dry flue gas3% 3%
Particulate matter (PM) 50 30
Sulfur dioxide
expressed as SO2
200 - 850 200
Sulfur oxides SO2 and SO3
expressed as SO2
- -
Nitrogen oxides
expressed as NO2
400 200
Carbon monoxide CO - -
Notes: DA: Degraded airshed (Region w ith poor air quality), NDA: Non-degraded airshed
Item

5761P25/FICHT-9661890-v2 4-51
Since the market offers different prices and revenues for base and peak load
power plants within each pair of investment alternatives only power plants
with the same load characteristics are compared. This reflects that
investment in a base load power plant does not compete with investment in
a peak load power plant. For power plants with the same load
characteristics, effective electricity prices as well as revenues for both
regarded investment alternatives are the same.
As already explained in 4.2.1.5 competitive power plants inside and
outside EU shall supply their electricity to the same market. Thus, the
plant with the lowest electricity generation costs will have a
competitive advantage, Hence, the criterion for economic viability is
electricity generation cost. The project with the lowest electricity
generation costs will be the preferred investment from the viewpoint
of the investor.
Generally, each investor is different with regard to his risk-proclivity but
also with regard to his individual assessment, emphasis and expectations of
investment risks and success factors. Nevertheless a certain standard
investor is defined for this study in order to make the decision process
transparent under a given set of assumptions about the investor.
Due to the magnitude of the investment we assume that, the potential
investor is characterised to be active internationally with global investment
activities in different countries. He has therefore access to international
suppliers in the power plant business and is also creditworthy for
international creditors. It is thus assumed that the investor will obtain
favourable bank credit conditions as described in section 4.2.4.
The discount rate is the weighted average costs of capital (‘WACC’, see
section 4.2.4). The investment is financed with an equity share of 30% and
70% bank loans. In our approach, we assume that the investor will obtain
the same interest rate for the debt part of the investment regardless of the
location of the power plant project.
The actual variable in the WACC is the investor’s expectation on the
rate of return on equity (ROE) after tax.
We divide the total expected rate of return on equity in the following
components.
a risk free return rate which is identical to the bank interest rate
a venture premium which is typical for power plant investments in EU
countries considering the long life cycle and the associated technology
risks of the project
a country specific risk premium which is dependent on the specific invest
risk situation of the regarded non-EU country. This may also include
some credit default insurance.

5761P25/FICHT-9661890-v2 4-52
The model calculates all payment series during the life time of the
investment in 2010 Euros, in real terms using as discount rate WACC also
in real terms (see 4.2.4). Escalation rates for O&M costs are also in real
terms.
Additionally, the investor’s expectations on return shall also be independent
on taxation, after corporate tax. If taxation in a country is higher, the
investor’s claim on the return before tax is higher. Since corporate tax rates
are different in all countries, also the expected return and thus the WACC
will be different for all countries (cf. Table 46).
The investment decision is determined by the comparison of the levelized
costs of electricity (LEC) for the pairs of investment options (EU/non-EU).
The lower LEC indicates the more competitive is the investment, provided
that no qualitative objections are found. Qualitative aspects on the
investment decisions, which could not be integrated in the LEC figures, are
taken into account via a decision tree (see section 4.3.4).Finally, a ranking
of the remaining power plant options is determined for each country
according to their LEC.
The model provides also the unique possibility for the calculation of
the break-even point of the LEC for a power plant in the non-EU
country and that in the respective EU country based on the following
philosophy: The main benefit for investment outside EU is avoided
CO2 costs. This means, outside the EU the investor can increase his
ROE up to a limit where this benefit is balanced by higher returns. If
this ROE is not attractive enough for the investor there will be no
incentive for investing outside EU: This is done in the model with
‘goal seek option’ of MS-Excel by changing the ‘country specific risk
premium’ in the WACC.
4.3.2 Levelized electricity costs
The Consultant has developed an integrated user-friendly model in
MS-Excel. The model calculates the levelized electricity generation cost
(LEC) applying the NPV method based on the following formula:
1
1
€(1 )
MWh
(1 )
t nt
tt
t ne
tt
OPEXCAPEX
iLEC
W
i
Where:
CAPEX: Capital expenditures (CAPEX)
OPEXt: Operating expenses for each year of the life time
We: Electricity production for each year of the life time
i: Discount rate = WACC
t: Year of operation
n: Live time of the project

5761P25/FICHT-9661890-v2 4-53
4.3.3 The structure of the decision making model
The model is designed to calculate up to 5 power plant options for each
country inside and outside EU, which are:
Steam power plant fired with lignite for base load duty
Steam power plant fired with hard coal for base load duty
CCGT power plant fired with natural gas for base load
CCGT power plant fired with natural gas for intermediate load duty
Open cycle gas turbine power plant for peak duty.
For base load power plants 7,500 full load equivalent operating hours per
year are assumed. For intermediate load (CCGT) the assumption is
4,500 full load hours and for the peak load GT 1,250 full load hours. The
analysed power plants and their features and technical characteristics are
shown in Table 43.
Table 43: Characterisation of power plants analysed for this study
One file ‘Input’ contains all inputs to the model and hands them over to
each country file. In each country file the NPC and LEC are calculated for
all feasible power plant options and for all three scenarios A, B and C. The
results from the country files are then transmitted to a ‘Results’ file for
country-wise comparison and analysis of results.
In the NPC and LEC calculation all kind of costs are taken into account that
an investor has to consider in its investment decision. The economic and
technical input parameters and the concept of the model are illustrated in
Figure 80.
Unit Lignite Hard Coal CCGT CCGT GT
USC-PC USC-PC intermediate
base load base load base load load peak load
Rated power output, gross MW 1,100 800 800 800 150
Consumption auxiliaries % 4.5% 7.4% 1.5% 1.5% 1.0%
Electric efficiency, net % 43.2% 45.6% 55.3% 55.3% 38.0%
Specific CO2 emission factors g/kWhth (LCV) 404 342 202 202 202
Equivalent operating hours h / a 7,500 7,500 7,500 4,500 1,250
Lifetime a 35 35 25 25 25
Operating staff full time persons 80 70 35 35 20
Specific person years for construction works full time persons/a 675 675 375 375 150
Construction time a 5.0 4.0 2.5 2.5 1.0

5761P25/FICHT-9661890-v2 4-54
Figure 80: Structure of the decision making model
Technical parameters that are specifying the power plants are mainly those
given in Table 43. The main economic parameters for the power plants are
listed in Table 44.
Table 44: Assumed economical parameters by power plant type
5,6
The CAPEX is broken down in EPC cost, owner’s expenditures, and interest
during construction. Additionally, in order to consider possible country-
specific differences in construction costs, the costs for construction site
personnel are considered separately. For this purpose, country-specific
labour costs for construction site staff are considered, as derived from data
from [Eurostat_lab] (see Table 45).
5 without construction works
6 referred to EPC (inclusive CAPEX for construction)
Flow Diagram - Model Structure
Technical parameters WACC = Discount rateRated Power output Shares of investment capital
Consumption auxiliaries Bank interest rate
Electric efficiency Corporate tax
Specific CO2 emission factor Risk free return rate on equity
Equivalent operating hours Venture premium
Lifetime Country specific risk premium
Operating staff
Person years for construction
Construction time Economic constraints
CAPEX (excl. construction work costs)
Personnel costs for construction works
Energy and emission balance Owner's costs
Fuel consumption Fixed O&M costs
Electricity production Variable O&M costs
CO2 emissions Escalation rates for O&M costs
CAPEXEPC price - Grid connection costs
Construction works personnel costs
Owner's costs
Interest during construction
Fixed OPEXO&M costs
Personnel costs
Insurance and overhead costs
Variable OPEX ScenariosFuel costsCO2 emission costs
Variable O&M costs
Fuel prices
CO2 prices
Present value of life cycle costs
Present valus of electricity Levelised electricity costs
Unit Lignite Hard Coal CCGT CCGT GT
USC-PC USC-PC intermediate
base load base load base load load peak load
Specific CAPEX1€ / kW 1,975 1,720 600 600 450
Owner's costs2% 10% 10% 10% 10% 10%
Fixed O&M2% / a 1.5% 1.5% 1.0% 1.0% 0.5%
Insurance(of equipment)/overhead2% / a 0.5% 0.5% 0.5% 0.5% 0.5%
Variable O&M € / MWhe 1.70 1.00 3.00 3.00 4.50

5761P25/FICHT-9661890-v2 4-55
For the calculation of annual OPEX, also the labour costs for local operating
staff are considered to be individual for each country according to typical
figures in the energy sector derived from [Eurostat_lab]. Wages as of 2013
(in €(2010)/person/year) are still on quite different levels among the
countries considered (see Table 45).
It is assumed, that within the EU cost of labour will assimilate over
time, at least until 2050. Accordingly, different escalation rates are
underlying in the model in order to arrive at the same level in 2050.
Table 45: Country-specific model inputs
Apart from labour costs for power plant operation, further parts of the fixed
OPEX concern fixed O&M and overhead and insurance costs, which are
given as a rate on the EPC price (cf. Table 44). Variable OPEX includes
mainly fuel costs and CO2 costs, derived from scenario-specific fuel prices
and ETS prices. Additionally also variable O&M expenses are considered,
given as specific values in €/MWhe. They are particularly high for gas
turbines which require more O&M efforts than steam turbines.
Based on all the above the model calculates the OPEX and the present
values of all payment series during the lifetime of the project and finally the
LEC.
The LEC are calculated in €/MWh as composite generation cost
including all costs items and as marginal cost including only the
variable cost items.
In brief, the model does the following operations:
Power and energy balance
The LEC is the present value of the total costs divided with the present
value of the electricity production during the life time.
Discounting time is commissioning year of the power plant.
country wages escalation annual costs for wages escalation risk premium corporate
operating staff construction operating staff of OPEX after tax tax
%/a €/pers./a €/pers./a %/a %/a %/a
real 2013 2013 real on top of infl.
BG 5.6% 5,542 14,638 1.0% 0.0% 10%
EE 4.8% 16,102 19,098 1.0% 0.0% 21%
ES 0.8% 35,995 81,930 1.0% 0.0% 30%
FI 2.0% 52,778 51,875 1.0% 0.0% 25%
GR 1.0% 28,788 74,967 1.0% 0.0% 20%
HU 3.8% 11,869 27,259 1.0% 0.0% 19%
IT 1.3% 36,420 66,447 1.0% 0.0% 28%
LT 5.1% 10,688 17,360 1.0% 0.0% 15%
LV 5.1% 10,663 17,103 1.0% 0.0% 15%
PL 4.2% 13,818 23,563 1.0% 0.0% 19%
RO 5.1% 7,337 17,038 1.0% 0.0% 16%
SI 2.7% 22,284 40,296 1.0% 0.0% 20%
SK 4.1% 14,752 24,804 1.0% 0.0% 19%

5761P25/FICHT-9661890-v2 4-56
The calculation is conducted in real terms based on 2010 Euros.
The CAPEX includes also interest during construction
Each item of the OPEX considers also escalation in real terms, or
respectively the assumed real price paths for ETS prices and fuel prices.
The LEC are calculated as composite generation cost including all costs
items and as marginal cost including only the variable cost items.
All country-specific inputs to the model are marked in orange in Figure 80
and listed in Table 45 (apart from the scenario specific inputs which are
described in 5.1 and in Annex I and Annex II). Interestingly to see in Table
45 is the difference in the corporate tax rates applied among the regarded
EU countries, which range from 10% in Bulgaria to 30% in Spain. Tax rates
crucially increase the cost of capital, as becomes visible from Table 46.
Table 46: Weighted average cost of capital (WACC) for all analysed countries
4.3.4 Decision tree for non-monetary tangible factors and risks
With levelized costs of electricity all economically quantifiable impacts on
investment decisions are evaluated. Even risks which are often hard to
quantify can be approximately integrated quantitatively via estimated
appropriate risk premiums.
However, many factors that impact an investment decision for a new power
plant can hardly be expressed in monetary terms. This may particularly
concern technical preconditions for an investment, but also simple facts, i.e.
the local unavailability of lignite fuel. Such factors often represent criterions
that would lead to the exclusion of investment opportunities, independent on
its microeconomic analysis.
For the inclusion of such factors a decision tree is set up. With the decision
tree all those investment options shall be filtered off that are either
technically not feasible or are clearly far from being a viable option or
WACCn WACCn WACCr
after tax before tax before tax
nominal nominal on top of infl.
BG - Bulgaria % / a 6.76 %/a 7.12 %/a 4.61 %/a
EE - Estonia % / a 6.76 %/a 7.63 %/a 5.11 %/a
ES - Espania % / a 6.76 %/a 8.16 %/a 5.63 %/a
FI - Finland % / a 6.76 %/a 7.82 %/a 5.29 %/a
GR - Greece % / a 6.76 %/a 7.58 %/a 5.05 %/a
HU - Hungary % / a 6.76 %/a 7.53 %/a 5.01 %/a
IT - Italy % / a 6.76 %/a 8.00 %/a 5.47 %/a
LT - Lithuania % / a 6.76 %/a 7.33 %/a 4.82 %/a
LV - Latvia % / a 6.76 %/a 7.33 %/a 4.82 %/a
PL - Poland % / a 6.76 %/a 7.53 %/a 5.01 %/a
RO - Romania % / a 6.76 %/a 7.38 %/a 4.86 %/a
SI - Slovenia % / a 6.76 %/a 7.58 %/a 5.05 %/a
SK - Slovakia % / a 6.76 %/a 7.53 %/a 5.01 %/a
Average % / a 6.76 %/a 7.58 %/a 5.06 %/a
Unit

5761P25/FICHT-9661890-v2 4-57
competitively realisable. The following factors are considered and applied
in the decision tree:
feasible connectivity to ENTSO-E network
availability of fuel, particularly of lignite
politically caused investment obstacles
Feasible connectivity to ENTSO-E network
Power plants outside EU must be interconnected to the ENTSO-E network.
The feasibility of a connection of a power plant in a non-EU country to the
grid of a neighboured EU country is thoroughly described in section 4.2.6.2.
The preconditions depend on the grid features of the EU country on the one
hand and on the grid features of the non-EU country on the other hand.
Additionally, the distance of a transmission line as well as the geographic
conditions determine which type of power system coupling could be a
feasible option, if any at all.
Interconnections usually involve high capital expenditures and the
feasibility depends on the specific case. Furthermore, in many cases,
interconnection between countries inside and outside the ENTSO-E grid
may only be feasible in combination with dedicated grid enhancement
measures in the regarded EU country as well as within the ENTSO-E grid.
The cost for interconnection and reinforcement of the grid are in most case
prohibitively high and have an adverse impact on the economic viability of
the investment.
Interconnections overseas such like from North Africa to South Europe or
from Balkan countries to Italy are heavily dependent on the distance to
overcome. Apart from the Strait of Gibraltar and perhaps apart from the
shortest trace between Albania and Italy, all other regarded over-sea
connections require HVDC coupling, causing additional crucial capital cost
expenses. Those costs are taken into account in the model. But with the
decision tree those transmission options are excluded, for which a priori a
realistic technical solution is clearly not achievable.
Additionally, the number of asynchronous couplings to a synchronous
European grid zone may be a factor which influences the project feasibility.
This is because the balance of the whole system is heavily impacted by each
HVDC link and particularly by the interaction of the links with the HVAC
networks. That means for the model that according to a priority ranking only
some of the theoretically feasible links are opted in for the model.
Concerning such rankings the [TYNDP 2012] released recently in July 2012
by ENTSO-E is of great importance. It covers different 20-years-scenarios
for the development of the ENTSO-E grid. Each scenario displays a valid
generation adequacy assessment, encompassing jointly all foreseeable
futures and matching EU 202020 targets (see [SOAF 2012]). [TYNDP

5761P25/FICHT-9661890-v2 4-58
2012] also proposes generic planning standards that shall hold for the future
development of the network. Also an iterative analysis of market studies and
network modelling was performed that indicates not only technical but also
economic priorities.
Due to the role of the TYNDP within the EU policy and for the official
network development planning, the TYNDP has highest relevance for the
real expectable future grid development. Depending on the analysis of the
[TYNDP 2012] some of the regarded interconnections are thus either
highlighted or excluded within the decision tree (see section 6.1.1.2).
Availability of fuel
Fuel availability plays particularly a role for the case of lignite. Due to its
relatively high transport cost, the use of lignite is economically feasible only
for power plants in the neighbourhood of lignite deposits. In the following
EU countries are currently lignite power plants in operation: Bulgaria,
Greece, Hungary, Poland, Romania, Slovenia, Slovakia and Spain. As
mentioned below, however in Spain no new coal power plant at all is
considered to be feasible according to the political plan. Countries where
new lignite power plants are feasible are therefore regarded:
Bulgaria, Greece, Hungary, Poland, Romania, Slovenia, Slovakia
Also the availability of natural gas can be a critical factor that may exclude
in some countries a feasible natural gas power plant project. Important for
the power plant investor is to have natural gas pipeline capacities available
that are large enough to transport enough gas amounts to the power plant
and that are moreover not yet contracted for the delivery of other
consumers. Thus the available reserves of free natural gas pipeline
capacities is be a criterion in the decision tree.
In countries with ambient natural gas reserves, such as Algeria, gas delivery
for a power plant may not be a problem, in general. However in countries
with only very little natural gas reserves like in Morocco an affordable gas
supply at sufficient volumes may be an insurmountable obstacle for a
natural gas power plant venture. The capital costs for installing a pipeline
over very long distances dedicated for the supply of the power plant are
usually too large for the whole power plant project, let alone the additional
planning and development lead times for the pipeline. The same holds for
LNG ports, if they are not available anyway for other large natural gas
customers as well.
Political exclusion of certain power plant technologies
There are countries in which certain power plant technologies have no
chance for realisation of new projects. One example is Spain.
Spain’s policy in respect to power generation is determined by the Ministry
of Tourism and Economy’s report ‘Planificación de los Sectores de
Electricidad y Gas 2002-2011’ (Electricity and Gas Sector Planning) from
2002 and its revision from 2006 [SGDE 2006]. It includes a plan about the

5761P25/FICHT-9661890-v2 4-59
future power plant capacities to be installed in Spain. For new power plants
the plan exclusively refers to installations of new CCGTs. Only one
modernization of the coal power plant in As Pontes was included. Apart
from this, Spain focuses completely on new natural gas fired power plants.
This is also reflected in the Spanish NAP, where emission allocation for
coal plants was much more restrictive, thus promoting again power plants
on basis of natural gas. Spanish government also guaranteed to keep on this
strategy for the time further after the second allocation plan from 2008-
2012, thus giving the industry a basis for long-term planning security.
Against this background, no new coal power plants in Spain are regarded to
be feasible.
With the decision tree such cases of political exclusion of certain power
plant technologies in the countries considered are filtered off.
Further political investment obstacles could arise indirectly, for instance
from the ETS. Investors may not like to invest in a non-EU country in order
to avoid CO2 costs, when the regarded EU country has the real perspective
to become soon a member of the European Union that will take part into the
ETS. This could for instance concern power plant investments in Croatia.
Also the investment for a synchronous interconnection within the IPS/UPS
system from Russia to a Baltic country may not be triggered since for each
project a transmission license from the national regulatory body and from
EC as well is needed, as is required by ENTSO-E network code. Moreover,
the long term political goal of the three Baltic countries Estonia, Latvia and
Lithuania to decouple from the IPS/UPS system poses the risk for Russian-
Baltic cross-border transmission investments to become redundant.
Furthermore, grid access policy in non-EU countries (cf. section 4.2.8) can
be different compared to EU countries where power plant investors shall
generally obtain a non-discriminatory grid access. The decision tree will
thus exclude options which are not viable due to missing security for the
investor to obtain non-discriminatory grid access.
4.4 Conclusions
An integrated user-friendly model (MS Excel) was developed for this study.
The model calculates the levelized electricity generation cost (LEC)
applying the NPV. In the NPC and LEC calculation all kind of costs are
taken into account that an investor has to consider in its investment decision.
All cost series are calculated in real terms and discounted with the WACC.
Five power plant options are investigated pair-wise inside and outside of EU
countries, namely: a lignite power plant (base load), a hard coal power plant
(base load), two CCGTs (one for base load and one for intermediate load)
and a gas turbine (peak load). Economic and non-economic investment
decision factors are analysed from the investor’s point of view and are
integrated into the model.

5761P25/FICHT-9661890-v2 4-60
The project with the pair-wise lowest electricity generation costs is the
preferred investment from the viewpoint of the investor. LEC are calculated
from present values of all cost components divided with the present value of
the produced electricity.
The LEC are calculated in €/MWh as composite generation cost
including all costs items and as marginal cost including only the
variable cost items.
Uncertainty about the future range of cost developments is investigated with
a scenario analysis (see section 5.1). Other economic factors such as prices
of power plants, OPEX components and costs of capital are integrated into a
determination of levelized composite costs of electricity. Since investment
in a base load power plant does not compete with investment in a peak load
power plant, electricity prices do not matter in the pair-wise comparison of
investment options provided that power plants supplying for the same price
band (i.e. base load/peak load) are compared.
Non-economic investment factors concern mainly technically and politically
originating investment risks, as far as they cannot be hedged by the investor.
Investment risks are covered by the model either via
differentiated risk premiums,
scenario and sensitivity analysis and
a decision tree that excludes infeasible investment options.
With regard to risk premiums an adequate level of ROI is considered in the
WACC by dividing the imputed return rate on equity into
a risk free return rate which is identical to the bank interest,
a venture premium which is typical for power plant investments in EU
countries, and into
a further risk premium which is dependent on the specific invest risk
situation of the regarded non-EU country.
Scenario analysis concerns consistent fuel and CO2 price. Infeasibilities for
investment options as treated via the decision tree concern mainly
the available connectivity options from outside EU to the ENTSO-E
network
local availability of fuel, particularly of lignite
politically caused investment obstacles
(e.g. no coal power plants in Spain).

5761P25/FICHT-9661890-v2 5-1
5. Analysis of Investment Decisions in EU Countries
5.1 Scenarios
For studying the impact of full-auctioning of CO2 emission allowances on
the investment decisions for power plant installations, three different carbon
constraint scenarios are taken into account within this study. In accordance
with the specifications for the project as given by the European
Commission, the following three scenarios concerning EU carbon
constraints are analysed:
A) 20% greenhouse gas reduction by 2020 compared to 1990
B) 25% greenhouse gas reduction by 2020 compared to 1990 and 80% by
2050
C) 30% greenhouse gas reduction by 2020 compared to 1990 and 80% by
2050
These three scenarios are hitherto accordingly referred to as Scenario A, B
and C in this report. Scenario A conforms to the 20% EU emission
reduction target as established with Directive [2009/29/EC] and Decision
[406/2009/EC]. It represents the confirmed commitment of the Community
to reduce the EU’s overall greenhouse gas emissions by at least 20 % below
1990 levels by 2020. Since the EU policy to reach this target is already
adopted, Scenario A is carried out in the manner of a reference scenario of
unchanged policies.
Scenario A grounds on the also so-called reference scenario as described in
[SEC(2011) 288 final]. It is based on already implemented EU and national
policies with a cut-off date in March 2010. Thus scenario A not only implies
to reach the ETS target to achieve the 20% reduction target in 2020. But it
furthermore assumes full implementation of the non-ETS and renewable
energy legislations up to this point in time, such as the Effort Sharing
Decision [406/2009/EC] and Directive [2009/28/EC] that have set legally
binding national targets for 2020. Apart from that it is consistent with the
reference scenario until 2030 as published in [EU Trends], which has been
used, amongst others, in the analysis of options to move beyond 20% GHG
emission reductions (see also SEC(2010) 650).
However, an EU target of 20% by 2020 is seen just as a first step to put
emissions onto a path where developed countries will need to cut emissions
by 80-95% in order to keep global temperature increase below 2°C compared
to pre-industrial levels. The Copenhagen summit failed to achieve the goal of
a full, binding international agreement to tackle the 2°C goal globally.
Nevertheless the EU is considering higher emission reduction targets for the
Community by 2020 provided that carbon leakage is avoided. Carbon
leakage defines the risk that would occur if, for reasons of costs related to
climate policies, businesses transferred production to other countries which
have laxer constraints on GHG emissions and that would thus in overall lead
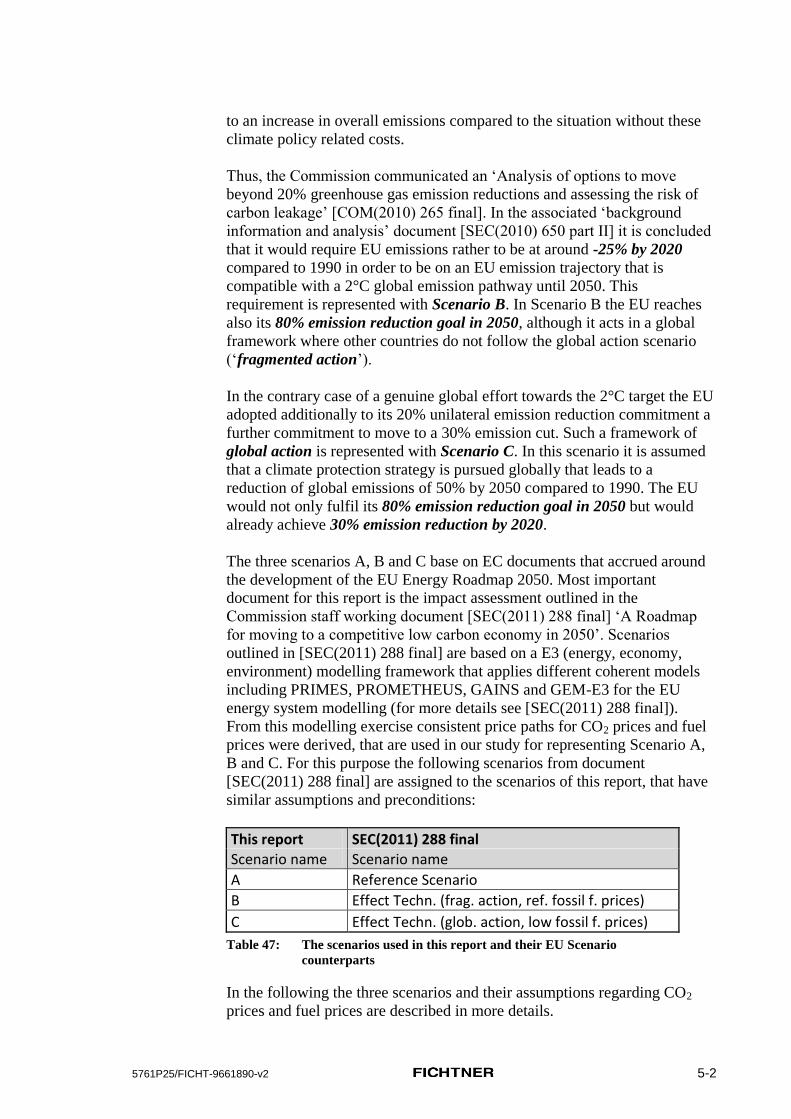
5761P25/FICHT-9661890-v2 5-2
to an increase in overall emissions compared to the situation without these
climate policy related costs.
Thus, the Commission communicated an ‘Analysis of options to move
beyond 20% greenhouse gas emission reductions and assessing the risk of
carbon leakage’ [COM(2010) 265 final]. In the associated ‘background
information and analysis’ document [SEC(2010) 650 part II] it is concluded
that it would require EU emissions rather to be at around -25% by 2020
compared to 1990 in order to be on an EU emission trajectory that is
compatible with a 2°C global emission pathway until 2050. This
requirement is represented with Scenario B. In Scenario B the EU reaches
also its 80% emission reduction goal in 2050, although it acts in a global
framework where other countries do not follow the global action scenario
(‘fragmented action’).
In the contrary case of a genuine global effort towards the 2°C target the EU
adopted additionally to its 20% unilateral emission reduction commitment a
further commitment to move to a 30% emission cut. Such a framework of
global action is represented with Scenario C. In this scenario it is assumed
that a climate protection strategy is pursued globally that leads to a
reduction of global emissions of 50% by 2050 compared to 1990. The EU
would not only fulfil its 80% emission reduction goal in 2050 but would
already achieve 30% emission reduction by 2020.
The three scenarios A, B and C base on EC documents that accrued around
the development of the EU Energy Roadmap 2050. Most important
document for this report is the impact assessment outlined in the
Commission staff working document [SEC(2011) 288 final] ‘A Roadmap
for moving to a competitive low carbon economy in 2050’. Scenarios
outlined in [SEC(2011) 288 final] are based on a E3 (energy, economy,
environment) modelling framework that applies different coherent models
including PRIMES, PROMETHEUS, GAINS and GEM-E3 for the EU
energy system modelling (for more details see [SEC(2011) 288 final]).
From this modelling exercise consistent price paths for CO2 prices and fuel
prices were derived, that are used in our study for representing Scenario A,
B and C. For this purpose the following scenarios from document
[SEC(2011) 288 final] are assigned to the scenarios of this report, that have
similar assumptions and preconditions:
This report SEC(2011) 288 final Scenario name Scenario name
A Reference Scenario
B Effect Techn. (frag. action, ref. fossil f. prices)
C Effect Techn. (glob. action, low fossil f. prices)
Table 47: The scenarios used in this report and their EU Scenario
counterparts
In the following the three scenarios and their assumptions regarding CO2
prices and fuel prices are described in more details.

5761P25/FICHT-9661890-v2 5-3
5.1.1 CO2 prices
The development of CO2 prices of the three scenarios is shown in Figure 81.
Depending on whether there is a long term reduction goal for 2050 (as in
scenarios B and C) or not (as in Scenario A), projected price paths are quite
differing, particularly after the year 2035. CO2 prices in Scenario A are
almost stagnating at a relatively low level of about 50 €(2010) / t CO2 from
2035 onwards in Scenario A (cf. Table 48). This corresponds to the only
low GHG reduction of 39% (compared to 1990) achieved by 2050 in this
Scenario A (cf. Table 49).
Figure 81: CO2 prices in the three scenarios (for derivation cf. description above)
From the decarbonisation scenarios B and C, the one with fragmented action
shows lower CO2 prices than the one where a global climate strategy is
pursued. The fossil fuel prices are the main reason for this: In a world with
global climate action, fossil fuel demand is significantly reduced and fossil
fuel prices relax accordingly. If other countries than the EU do not follow a
global action scenario (i.e. fragmented action, as in Scenario B), global
fossil fuel prices are assumed to be at much higher levels (see section 5.1.2).
Thus in general, in the scenarios high CO2 prices come with low fossil fuel
prices and vice versa. This is consistent, because high efforts for climate
protection put pressure on fossil fuel consumption and thus on fossil fuel
prices.
Higher fossil fuel prices support the shift away from fossil fuel use and help
thus naturally to achieve the emission reduction goals at lower CO2 prices.
In other words: The cases of global action or fragmented action determine,
whether the EU has to pay its CO2 emission reduction achievements rather
via increased fossil fuel price levels (fragmented action) than via higher CO2
prices (global action). The overall impact on the economy is however
different nevertheless, as is explained in [SEC(2011) 288 final].
0
20
40
60
80
100
120
140
160
180
200
2020 2025 2030 2035 2040 2045 2050
€(2
01
0) /
t C
O2
A
B
C

5761P25/FICHT-9661890-v2 5-4
Table 48: CO2 prices in the three scenarios (for derivation cf. description above)
Table 49: Total GHG reduction in the EU in the three scenarios (for derivation cf.
description above)
5.1.2 Fossil fuel prices
Also the fossil fuel prices in our three scenarios are referring to the
associated EU scenarios from [SEC(2011) 288 final] as assigned in Table
47. Natural gas and coal are the main relevant fuel types for power plants
and are the only fuel types assumed for the power plant types that are
analysed with this study (cf. section 4.3.2).
[SEC(2011) 288 final] contains explicit fuel price figures only for crude oil.
However in the energy roadmap 2050 communicated by the Commission in
December 2011 [SEC(2011) 1565 final, part I], there are natural gas and
coal prices mentioned for the reference scenario. The reference scenario in
this document is designed as an updated version of the reference scenario
from [SEC(2011) 288 final]. Thus, those fossil fuel prices are used for our
Scenario A.
In part II of the energy roadmap [SEC(2011) 1565 final, part II], global
fossil fuel prices for the decarbonisation scenarios are depicted in Figure 18
of that document. The decarbonisation scenarios are based on ‘global
climate action’ fossil fuel price trajectories. Accordingly these updated price
paths are used for representing our Scenario C.
Fossil fuel prices for Scenario B are derived from the oil price path of the
fragmented action scenario in [SEC(2011) 288 final] and its relation to the
reference oil price. The obtained relation is used for projecting an according
fragmented action oil price path out of the reference scenario from
document [SEC(2011) 1565 final]. With the oil-to-gas and gas-to-coal price
relations of the reference scenario of [SEC(2011) 1565 final, part I] the
belonging gas and coal price paths for the case of fragmented action are
derived.
The obtained natural gas price and coal price development
(indexed 2010 = 100%) for the three scenarios A, B and C is shown in
Figure 82 and in Figure 83. As becomes visible, fragmented action
(Scenario B) brings fossil fuel prices down compared to the reference
Scenario CO2 price (€2010/t CO2)
2020 2025 2030 2035 2040 2045 2050
A 16.57 20.08 36.14 50.20 52.21 51.20 50.20
B 25.10 34.14 51.20 53.21 64.26 92.37 147.59
C 25.10 38.15 60.24 64.26 78.31 115.46 190.76
Scenario Total GHG reduction in the EU vs. 1990
2005 2020 2030 2040 2050
A -7% -22% -29% -36% -39%
B -7% -26% -41% -61% -80%
C -7% -25% -40% -62% -80%
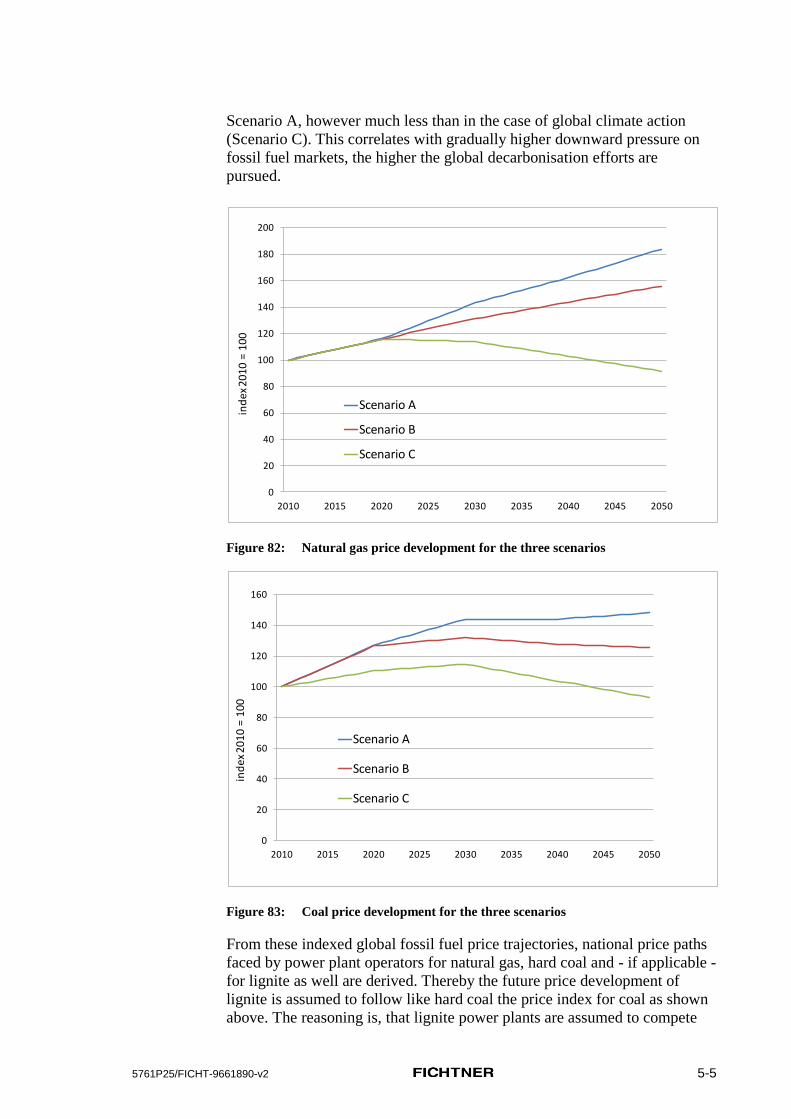
5761P25/FICHT-9661890-v2 5-5
Scenario A, however much less than in the case of global climate action
(Scenario C). This correlates with gradually higher downward pressure on
fossil fuel markets, the higher the global decarbonisation efforts are
pursued.
Figure 82: Natural gas price development for the three scenarios
Figure 83: Coal price development for the three scenarios
From these indexed global fossil fuel price trajectories, national price paths
faced by power plant operators for natural gas, hard coal and - if applicable -
for lignite as well are derived. Thereby the future price development of
lignite is assumed to follow like hard coal the price index for coal as shown
above. The reasoning is, that lignite power plants are assumed to compete
0
20
40
60
80
100
120
140
160
180
200
2010 2015 2020 2025 2030 2035 2040 2045 2050
ind
ex 2
01
0 =
10
0
Scenario A
Scenario B
Scenario C
0
20
40
60
80
100
120
140
160
2010 2015 2020 2025 2030 2035 2040 2045 2050
ind
ex 2
01
0 =
10
0
Scenario A
Scenario B
Scenario C

5761P25/FICHT-9661890-v2 5-6
most with hard coal power plants. Since there is no marketplace and market
price for lignite, lignite prices are actually represented by extraction costs
plus possible opportunity costs. Due to relatively high transport costs,
lignite power plants are only feasible at locations where enough lignite
resources for combustion in power plants are available. Among the
investigated EU countries this is the case in Bulgaria, Greece, Hungary,
Poland, Romania, Slovakia and Slovenia. In the following EU countries new
lignite power plants are not feasible: Estonia, Finland, Lithuania, Latvia,
Italy and Spain.
The global fossil fuel prices are used for describing the future price
trends on the fuel markets. However, as absolute values valid for the
starting year 2010 no global prices are used. Instead prices faced by
power plant operators in the investigated EU countries are taken. The
regional price levels are derived from mainly two sources, [IEA] and
[Eurostat_gas].
[IEA] lists for some countries annual mean ‘natural gas prices for electricity
generation (ex-tax)’ for the years up to 2010. If for some countries those
data were not available, data for ‘natural gas prices for industry’ were taken
and adjusted accordingly to represent prices faced by power plant operators.
Adjustment was also done by comparison and reconciliation with data from
[Eurostat_gas]. [Eurostat_gas] lists also ‘natural gas prices for industry’ for
different consumer specifications, with consumers drawing less or more
than 4,000,000 GJ/a.
Gas price values from the years 2009 and 2010 were averaged in order to
balance singular outlier values. All gas prices referring to the gross calorific
value of natural gas are factorised by 1.11 to obtain prices for net calorific
value (NCV). The finally obtained natural gas prices for 2010 in the
different EU countries are shown in Figure 84. They are assumed to
represent prices for a CCGT operated in intermediate load at 4,500 full load
hours per year.
In contrast to all other fuel prices, the 2010 natural gas price levels for
Romania and Poland shown in Figure 84 and Table 50 were not derived
directly from [IEA] and [Eurostat_gas] but were corrected according to the
market value principle. Natural gas prices derived from [IEA] and
[Eurostat_gas] for these two countries seemed to be far too low and not
sustainable from a long term market perspective. Such low price levels will
thus not be used for long term investment considerations. We adjusted the
natural gas price levels in both countries according to the market value
principle. The adjusted price levels were derived by comparing the levelized
electricity costs (LEC) of competing fossil fuel fired power plants in those
countries, assuming no carbon costs is accruing for the power plants. This
principle guarantees that coal fired power plants will at least in base load
and without emission trading compete in these countries with natural gas
fired power plants.

5761P25/FICHT-9661890-v2 5-7
Natural gas prices for power plants are usually dependent on the volumes of
natural gas withdrawn from the gas network. The higher the delivery
capacity, the lower the fees for the usage of the gas transport system. This is
expressed in an estimated fee of 6,500 €/MWt,NCV. For natural gas power
plants with other than 4,500 annual full load hours, the natural gas prices
shown in Figure 84 and Table 50 are adjusted accordingly within the model.
Also for hard coal, as far as available annual figures from [IEA] for ‘steam
coal prices for electricity generation’ are taken. This is the case for Finland,
Italy, Poland and Spain. For other countries, the cross-border price for hard
coal for the German market for 2010 from [VDKI] is taken as a proxy,
which is comparable to the cif ARA price achievable at most important
ports of debarkation in Europe. On this, 4€/t for cargo handling and
discharge and 6€/t for typical inland transport fee are put on top. For lignite,
an effective specific fuel cost value of 5.5 €/MWht,NCV is applied for 2010
based on Fichtner database.
Figure 84: Fuel prices for power plants in 2010 in €(2010) / MWht, NCV
0
5
10
15
20
25
30
35
40
BG EE ES FI GR HU IT LT LV PL RO SI SK
€(20
10)/
MW
h (N
CV
)
Country
Lignite Hard coal Natural gas

5761P25/FICHT-9661890-v2 5-8
Country Fuel price 2010 in €(2010)/MWhNCV
Lignite Hard coal Natural gas
BG 5.50 11.71 25.69
EE N.A. 11.71 25.85
ES N.A. 13.28 26.09
FI N.A. 10.85 21.95
GR 5.50 11.71 30.41
HU 5.50 11.71 31.32
IT N.A. 11.86 32.91
LT N.A. 11.71 30.07
LV N.A. 11.71 29.86
PL 5.50 9.95 23.75
RO 5.50 11.71 25.69
SI 5.50 11.71 37.12
SK 5.50 11.71 37.07
Table 50: Fuel prices for power plants in 2010
in €(2010) / MWht, NCV
All country-specific fuel prices in 2010 are compared in Table 50. Price
levels are particularly varying among countries for natural gas. Highest gas
prices are observed in Slovenia and Slovakia, whereas lowest prices are
achieved for natural gas delivery in Finland. Most natural gas prices are
however within a corridor of about 25 to 37 €(2010)/MWht,NCV (cf. Table
50). This is compared to a mean price of about 11.6 €(2010)/MWht,NCV for
hard coal and about half this value for lignite (5.5 €(2010)/MWht,NCV).
Based on the country-specific fuel price levels from Table 50 and on the
scenario-specific global fuel price developments as outlined in Figure 82
and Figure 83, for each country the annual fuel price development is
projected until 2050 and included in the decision making model. If the
lifetime of power plants should exceed 2050, a stagnating price level (in real
terms) is assumed for the years after 2050. The same prolongation after
2050 is applied to CO2 prices.
5.1.3 Levelized scenario prices
For the use in the model all fuel price path and CO2 price path as derived for
the different scenarios are levelized for each power plant and for each
country. This is done by discounting them among the lifetime of the
concerning power plant and transferring the net present values into
annuities. Since the lifetimes of the regarded power plants are varying, also
the levelized prices are varying by power plant type. And since the imputed
discount rates are different for each country (cf. Table 46), the levelized
prices are also varying by country.
The levelized prices can be seen as a constant price expressed in present
Euro value terms, which is equivalent to the actual price path over the

5761P25/FICHT-9661890-v2 5-9
power plant lifetime. Annex I and Annex II show the levelized CO2 prices
and levelized fuel prices for the three scenarios by country and power plant
type.
5.2 Change from 2nd to 3rd Emission Trading Period
In this section the changes from the second to the third trading phase of the
ETS are explained, as far as they concern investors for new power plants in
the regarded EU countries.
5.2.1 Free allocations of certificates in the second ETS period
Within the 2nd
ETS trading period from 2008 to 2012 there are two ways of
how to obtain emission allowances (EUAs) that are required for a new
power plant: Some parts of the EUAs may be allocated to the power plant
according to the NAP of the regarded country. And the remaining EUAs
need to be acquired either via auctioning or on the ETS market at prevailing
CO2 prices. In the case of over-allocation the surplus of EUAs could be sold
at the CO2 price.
Since the NAPs of the second trading period of the EU countries are
different, the allocation quota can be quite different for each regarded
country, even though for the same type of power plant. For this study the
emission certificate allocations for new power plants are analysed in those
countries, for which the allocation equations and their parameters were
available from [ISI]. These are the following countries: Bulgaria, Estonia,
Finland, Italy, Lithuania, Latvia, Slovak Republic and Slovenia.
The parameterisation of allocated emissions is constant for each single year
within the 2nd
ETS period (2008-2012), apart from Italy where the fuel
factors change within the ETS period. Thus, for Italy the allocation as it is
valid for 2012 is analysed. The resulting free allocation of certificates is
shown in Table 51. For better comparison the allocated certificates are
related to the net electricity generation of the plants, i.e. are given as
‘specific free allocation’ per generated kWhe. The figures are to be viewed
against the background of the actual CO2 emissions, for which in the third
trading period certificates will have to be fully auctioned. Those are given in
the second row of Table 51 as specific CO2 emissions per net electricity
generation.

5761P25/FICHT-9661890-v2 5-10
Table 51: Free allocations of certificates in the 2nd ETS period by country and
power plant (derived from [ISI])
The power plant operator must acquire the difference between actual CO2
emissions of the plant and the free allocated allowances. This gap is shown
in Table 52 as%age of the plant’s actual emissions. A negative figure in
Table 52 represents a negative deficit which in fact is a surplus of allocated
allowances. It reveals at a first glance how strong the endowment with the
required CO2 certificates is varying by power plant type, but also by
country. In countries like Bulgaria, Estonia, Latvia and Slovakia almost no
certificate deficits are remaining. Allocation rules in other countries, like for
instance Finland, are rather strict.
In some cases however, significant over-allocations of allowances is
revealed for new power plants that are built within the second trading phase.
Huge negative deficits, i.e. endowment with surplus certificates can be
observed particularly for the gas turbine power plants, and this particularly
in Lithuania and Italy.
Table 52: Certificate deficit after allocation (in%age of emissions)
Lithuania applies a uniform benchmark of 2,500 t/MWe per capacity. Thus
peak load power plants are greatly fostered compared to base load plants.
Apart from Lithuania also Slovenia applies a uniform benchmark of
350 t/GWhe for all new power plants but relates it to the projected (gross)
electricity generation of each power plant, which for our study is assumed to
be identical to the actual electricity generation. Thus the difference of the
allocation gaps among the power plants in Slovenia solely reflects different
efficiencies of the plants and different specific CO2 emission factors for the
used fuels. Accordingly, CCGTs come off best in relative CO2 allocation in
Slovenia.
Unit Lignite Hard Coal CCGT CCGT GT
USC-PC USC-PC intermediate
base load base load base load load peak load
Specific CO2 emission factor (fuel) g / kWht 404 342 202 202 202
CO2 emissions per kWhe g / kWhe 935 750 365 365 532
Specific free allocations
BG g / kWhe 947 778 353 353 352
EE g / kWhe N.A. 750 365 365 532
FI g / kWhe N.A. 155 90 150 780
IT g / kWhe N.A. 608 220 367 1,316
LT g / kWhe N.A. 360 338 564 2,020
LV g / kWhe N.A. 786 369 369 534
SI g / kWhe 330 340 320 320 318
SK g / kWhe 935 750 365 365 532
Percentual certificate deficit Unit Lignite Hard Coal CCGT CCGT GT
(after free allocations) USC-PC USC-PC intermediate
base load base load base load load peak load
BG % -1% -4% 3% 3% 34%
EE % 0% 0% 0% 0% 0%
FI % N.A. 79% 75% 59% -47%
IT % N.A. 19% 40% -1% -148%
LT % N.A. 52% 7% -54% -280%
LV % N.A. -5% -1% -1% 0%
SI % 65% 55% 12% 12% 40%
SK % 0% 0% 0% 0% 0%

5761P25/FICHT-9661890-v2 5-11
All other countries use benchmarks that are differentiated in different ways
and somehow related to the output of the power plant, which is either
capacity or generated electricity. The only exception is Estonia, where the
allocation basis is not output based, but based on projected emissions.
Consequently, the certificate deficit in Estonia is zero. It is also zero in
Slovakia, but the way of allocation is different. In Slovakia the specific
emission value in g/kWhe as well as the electricity generation are projected,
which also leads theoretically to the certificate allocation for exactly actual
emissions.
5.2.2 Microeconomic effects from change to full auctioning
The microeconomic effects from full auctioning are compared to the
situation with the NAPs in the second ETS phase. In order to determine the
microeconomic effects of the NAPs on new power plant investments, the
levelized CO2 costs of electricity are calculated with the decision making
model for all power plants in the regarded EU countries (cf. Table 53, Table
54 and Table 55). For these calculations the CO2 price paths of the three
scenarios (cf. section 5.1.1 and Annex I) are applied in order to demonstrate
their effect on electricity costs. This effect is expected to have no relevance
for electricity prices, because the market value of CO2 allowances is already
integrated into electricity prices since the commencement of CO2 emission
trading (cf. section 4.2.1.2). For this study, only the microeconomic effects
concerning the electricity costs from the view of a power plant investor are
focused. The change of the specific costs due to introduction of full
auctioning reflects the amount of windfall profits that were coming in the
2nd ETS with gratis allocated emission rights.
The resulting CO2 costs of electricity represent the additional costs on
electricity generation from a new power plant due to acquisition of the
remaining certificate deficit (cf. Table 52). The certificate deficit has to be
purchased over the whole lifetime of the plant at the prevailing CO2 prices
in each year.
CO2 price levels are generally increasing from Scenario A to Scenario C.
Accordingly, also levelized CO2 costs (or revenues) from purchase (or
selling) of the remaining certificate deficit (or surplus) are highest in
Scenario C. Again here, negative CO2 costs mean revenues for the operators
per generated MWhe. Those can be rather high. As for gas turbines in
Lithuania they amount to about 35 to 53 €/MWhe additional income,
depending on the regarded scenario. In general, new gas fired power plants -
particularly gas turbines - were less burdened by the 2nd
ETS period than
new coal fired power plants. This is generally in alignment with the polluter
pays principle.

5761P25/FICHT-9661890-v2 5-12
Table 53: Levelized CO2 costs of electricity in the second ETS period (Scenario A)
Table 54: Levelized CO2 costs of electricity in the second ETS period (Scenario B)
Table 55: Levelized CO2 costs of electricity in the second ETS period (Scenario C)
Variances among countries are huge and demonstrate that very different
investment conditions were effective for new power plants built within the
2nd
ETS period. It shall be emphasised however, that these calculations
assume, that the allocation rules of the 2nd
ETS period are applied over the
whole lifetime of the power plants. This was for sure not the expectation of
an investor that is installing a power plant within the time frame 2008 to
2012. Therefore the calculations are only hypothetical. For new power plant
projects as investigated in this study the allocation rules of the 2nd
ETS
period are irrelevant. In general, investment conditions may have even
improved from the second to the third ETS period alone by the fact, that
insecurities about the future development of the ETS periods as well as
distortions of competition have significantly been reduced with the 3rd
ETS
period.
But nevertheless does a comparison with CO2 costs accruing in the 3rd
ETS
period demonstrate the additional burden that the investor has to take into
Lignite Hard Coal CCGT CCGT GT
USC-PC USC-PC intermediate
base load base load base load load peak load
BG - Bulgaria € / MWhe -0,32 -0,77 0,29 0,29 4,31
EE - Estonia € / MWhe N.A. 0,00 0,00 0,00 0,00
FI - Finland € / MWhe N.A. 16,17 6,46 5,06 -5,82
IT - Italy € / MWhe N.A. 3,82 3,38 -0,05 -18,30
LT - Lithuania € / MWhe N.A. 10,83 0,64 -4,73 -35,40
LV - Latvia € / MWhe N.A. -1,00 -0,09 -0,09 -0,06
SI - Slovenia € / MWhe 16,63 11,26 1,07 1,07 5,04
SK - Slovakia € / MWhe 0,00 0,00 0,00 0,00 0,00
Scenario A Unit
Lignite Hard Coal CCGT CCGT GT
USC-PC USC-PC intermediate
base load base load base load load peak load
BG - Bulgaria € / MWhe -0,45 -1,08 0,39 0,39 5,86
EE - Estonia € / MWhe N.A. 0,00 0,00 0,00 0,00
FI - Finland € / MWhe N.A. 22,68 8,80 6,89 -7,93
IT - Italy € / MWhe N.A. 5,36 4,60 -0,07 -24,96
LT - Lithuania € / MWhe N.A. 15,21 0,87 -6,43 -48,15
LV - Latvia € / MWhe N.A. -1,41 -0,12 -0,12 -0,08
SI - Slovenia € / MWhe 23,34 15,80 1,46 1,46 6,86
SK - Slovakia € / MWhe 0,00 0,00 0,00 0,00 0,00
Scenario B Unit
Lignite Hard Coal CCGT CCGT GT
USC-PC USC-PC intermediate
base load base load base load load peak load
BG - Bulgaria € / MWhe -0,52 -1,24 0,43 0,43 6,49
EE - Estonia € / MWhe N.A. 0,00 0,00 0,00 0,00
FI - Finland € / MWhe N.A. 25,89 9,73 7,61 -8,76
IT - Italy € / MWhe N.A. 6,11 5,08 -0,08 -27,55
LT - Lithuania € / MWhe N.A. 17,42 0,96 -7,12 -53,33
LV - Latvia € / MWhe N.A. -1,61 -0,13 -0,13 -0,09
SI - Slovenia € / MWhe 26,70 18,07 1,62 1,62 7,59
SK - Slovakia € / MWhe 0,00 0,00 0,00 0,00 0,00
Scenario C Unit

5761P25/FICHT-9661890-v2 5-13
account due to full auctioning. This is calculated as the difference between
the CO2 costs in the 3rd and 2nd
ETS period, expressed in €/MWhe in Table
56, Table 57 and Table 58.
Although in the 3rd
ETS period the gas turbines lose their large advantages
from the 2nd
ETS period, they are in average still better off than lignite
power plants, due to the large specific CO2 emissions from lignite
combustion. The least worsening of investment conditions due to the
changes from 2nd to 3rd
ETS period will be for CCGT plants, particularly if
the CCGTs will run in base load. From this point of view, the change from
the 2nd
to the 3rd
trading phase does promote CCGT by providing them a
better competitive standing in the market.
Table 56: CO2 costs on electricity: difference of 3rd compared to 2
nd ETS period
(Scenario A)
Table 57: CO2 costs on electricity: difference of 3rd compared to 2
nd ETS period
(Scenario B)
Table 58: CO2 costs on electricity: difference of 3rd compared to 2
nd ETS period
(Scenario C)
Lignite Hard Coal CCGT CCGT GT
USC-PC USC-PC intermediate
base load base load base load load peak load
BG - Bulgaria € / MWhe 26.53 21.79 8.45 8.45 8.41
EE - Estonia € / MWhe N.A 20.56 8.61 8.61 12.53
FI - Finland € / MWhe N.A 4.22 2.10 3.51 18.28
IT - Italy € / MWhe N.A 16.40 5.14 8.57 30.70
LT - Lithuania € / MWhe N.A 9.99 8.05 13.41 48.04
LV - Latvia € / MWhe N.A 21.82 8.77 8.77 12.70
SI - Slovenia € / MWhe 9.06 9.34 7.55 7.55 7.51
SK - Slovakia € / MWhe 25.75 20.65 8.64 8.64 12.57
Scenario A Unit
Lignite Hard Coal CCGT CCGT GT
USC-PC USC-PC intermediate
base load base load base load load peak load
BG - Bulgaria € / MWhe 37.28 30.62 11.49 11.49 11.43
EE - Estonia € / MWhe N.A 28.85 11.73 11.73 17.07
FI - Finland € / MWhe N.A 5.92 2.87 4.78 24.91
IT - Italy € / MWhe N.A 23.00 7.01 11.69 41.86
LT - Lithuania € / MWhe N.A 14.04 10.95 18.24 65.35
LV - Latvia € / MWhe N.A 30.65 11.93 11.93 17.28
SI - Slovenia € / MWhe 12.72 13.12 10.28 10.28 10.23
SK - Slovakia € / MWhe 36.14 28.99 11.76 11.76 17.11
Scenario B Unit
Lignite Hard Coal CCGT CCGT GT
USC-PC USC-PC intermediate
base load base load base load load peak load
BG - Bulgaria € / MWhe 42.78 35.14 12.74 12.74 12.68
EE - Estonia € / MWhe N.A 32.98 12.97 12.97 18.87
FI - Finland € / MWhe N.A 6.75 3.17 5.28 27.52
IT - Italy € / MWhe N.A 26.23 7.74 12.90 46.21
LT - Lithuania € / MWhe N.A 16.08 12.12 20.21 72.37
LV - Latvia € / MWhe N.A 35.11 13.22 13.22 19.14
SI - Slovenia € / MWhe 14.55 15.00 11.37 11.37 11.32
SK - Slovakia € / MWhe 41.35 33.16 13.01 13.01 18.93
Scenario C Unit

5761P25/FICHT-9661890-v2 5-14
It shall be taken into account, however, that we look at power plants that
deliver for different price bands in the market, i.e. that are designed to
operate as peak load, intermediate load or base load power plant. Effectively
this means, that for peak load power plants higher electricity generation
costs are acceptable than for base load plants. Thus we express the
additional CO2 costs that accrue due to full auctioning in the 3rd
phase
(cf. Table 56 until Table 58) as%age of the composite costs of electricity
that accrue at installation in the 2nd trading phase. These%age changes of
electricity costs are listed for the three scenarios in Table 59, Table 60 and
Table 61.
Table 59: Electricity cost increase due to change from 2
nd to 3
rd ETS period
(Scenario A)
Table 60: Electricity cost increase due to change from 2
nd to 3
rd ETS period
(Scenario B)
Table 61: Electricity cost increase due to change from 2nd to 3rd ETS period
(Scenario C)
These figures demonstrate that the relatively highest effect due to the
change to full auctioning is not surprisingly found with lignite power plants.
Lignite Hard Coal CCGT CCGT GT
USC-PC USC-PC intermediate
base load base load base load load peak load
BG - Bulgaria % 60% 38% 12% 11% 6%
EE - Estonia % N.A. 35% 13% 11% 9%
FI - Finland % N.A. 6% 3% 5% 15%
IT - Italy % N.A. 25% 6% 9% 21%
LT - Lithuania % N.A. 14% 10% 17% 42%
LV - Latvia % N.A. 38% 11% 10% 9%
SI - Slovenia % 14% 13% 8% 7% 4%
SK - Slovakia % 56% 35% 9% 9% 7%
Scenario A Unit
Lignite Hard Coal CCGT CCGT GT
USC-PC USC-PC intermediate
base load base load base load load peak load
BG - Bulgaria % 86% 55% 17% 16% 8%
EE - Estonia % N.A. 50% 18% 16% 13%
FI - Finland % N.A. 7% 4% 7% 21%
IT - Italy % N.A. 35% 8% 13% 30%
LT - Lithuania % N.A. 19% 14% 24% 67%
LV - Latvia % N.A. 55% 16% 15% 12%
SI - Slovenia % 18% 18% 11% 10% 6%
SK - Slovakia % 80% 50% 13% 12% 10%
Scenario B Unit
Lignite Hard Coal CCGT CCGT GT
USC-PC USC-PC intermediate
base load base load base load load peak load
BG - Bulgaria % 103% 69% 20% 19% 10%
EE - Estonia % N.A. 61% 21% 19% 15%
FI - Finland % N.A. 8% 5% 7% 24%
IT - Italy % N.A. 42% 9% 15% 36%
LT - Lithuania % N.A. 23% 17% 29% 84%
LV - Latvia % N.A. 68% 19% 17% 14%
SI - Slovenia % 21% 21% 13% 12% 7%
SK - Slovakia % 95% 62% 15% 14% 12%
Average % 73% 44% 15% 16% 25%
Scenario C Unit

5761P25/FICHT-9661890-v2 5-15
This is particularly the case in Bulgaria and Slovakia, where electricity from
new lignite power plants becomes about 60% more expensive (+60% in BG
and +56% in SK) in Scenario A and about 100% more expensive (+103% in
BG and +95% in SK) in Scenario C. The competitiveness of hard coal
power plants is also worsened, but composite costs increase generally not as
much as those of lignite power plants. Again from this view it becomes
visible that CCGTs come off best. The relatively high additional burden for
gas turbines can be attributed to their very protective treatment (i.e. over-
allocation) in the NAPs of the 2nd
ETS period.
Generally, in countries with strict allocation rules in the 2nd
ETS period the
change to full auctioning imposes only low additional costs. This is
particularly the case for Finland where electricity costs of new power plants
increase only by (depending on the scenario) 6% to 8% for hard coal power
plants and by 3% to 7% for CCGTs due to the shift to full auctioning.
5.3 Levelized Costs of Electricity with Full Auctioning
The levelized costs of electricity in the 3rd
ETS period for new power plants
in all analysed EU countries are shown in Table 62, Table 63 and Table 64
for Scenarios A, B and C. Under the given scenario assumptions lignite
power plants are generally (i.e. in average over all analysed countries) the
most competitive power plants for base load, at least in Scenario A
(reference) and Scenario B (fragmented action). And this despite the CO2
costs of full auctioning integrated in these electricity costs.
It shall be emphasised, that Scenario C is the one with the highest CO2 costs
but lowest fuel costs (cf. section 5.1 and Annex I and Annex II). This would
shift the competitive advantage for base load power plants towards CCGT
plants. The reason is that CCGT plants do not only have lower CO2
emissions but also relatively high fuel cost components compared to coal
power plants (cf. Figure 85, Figure 86 and Figure 87). That’s why CCGT
plants are generally better off in a world with global climate action
(Scenario C) than with fragmented action (Scenario B), even though in both
scenarios the 80% CO2 reduction goal in 2050 is achieved.
Table 62: Levelized composite costs of electricity (Scenario A)
Lignite Hard Coal CCGT CCGT GT
USC-PC USC-PC intermediate
base load base load base load load peak load
BG - Bulgaria € / MWhe 70.98 79.12 76.85 83.15 146.99
EE - Estonia € / MWhe N.A. 80.04 77.31 83.93 149.59
ES - Spain € / MWhe N.A. 86.51 78.41 85.67 158.72
FI - Finland € / MWhe N.A. 79.48 69.24 76.39 143.04
GR - Greece € / MWhe 72.98 81.02 88.03 94.94 170.67
HU - Hungary € / MWhe 71.83 79.89 89.62 96.20 167.99
IT - Italy € / MWhe N.A. 82.14 93.63 100.77 179.35
LT - Lithuania € / MWhe N.A. 79.53 86.76 93.21 162.36
LV - Latvia € / MWhe N.A. 79.53 86.30 92.73 161.64
PL - Poland € / MWhe 71.88 74.86 72.61 79.18 142.93
RO - Romania € / MWhe 71.37 79.46 76.86 83.29 147.84
SI - Slovenia € / MWhe 72.44 80.45 102.84 109.58 189.04
SK - Slovakia € / MWhe 71.93 79.96 102.56 109.15 186.70
Scenario A Unit

5761P25/FICHT-9661890-v2 5-16
Table 63: Levelized composite costs of electricity (Scenario B)
Table 64: Levelized composite costs of electricity (Scenario C)
However, in some countries can CCGT power plants compete already in
Scenario A (with lowest ETS prices) with coal power plants, even in base
load. This holds for the countries Estonia, Spain and Finland, where no
cheap lignite PP alternatives are available. In Scenario B and particularly in
Scenario C with highest ETS prices the competitiveness of CCGT in base
load improves furthermore. Only Hungary, Italy, Slovenia and Slovakia
would still like to opt for new coal power plants in Scenario C for supplying
base load.
Furthermore, hard coal power plants can generally not compete with lignite
power plants, with the only exemption of Poland in Scenario C (in which
case however the CCGT base load power plant would be the most
favourable base load option anyway). Thus, contingent on the local
availability of lignite, new lignite-fuelled power plants are generally spoken
the most competitive technology of choice for base load power plants.
Hard coal power plants remain only an option in countries, where no lignite
is available. And even then a hard coal power plant is the most competitive
base load option only in Italy, Lithuania and Latvia in the scenarios A and B
(in Italy also in Scenario C).
Lignite Hard Coal CCGT CCGT GT
USC-PC USC-PC intermediate
base load base load base load load peak load
BG - Bulgaria € / MWhe 80.75 85.91 77.70 83.99 148.23
EE - Estonia € / MWhe N.A. 86.68 78.20 84.82 150.89
ES - Spain € / MWhe N.A. 92.79 79.34 86.60 160.07
FI - Finland € / MWhe N.A. 86.18 70.48 77.63 144.85
GR - Greece € / MWhe 82.53 87.67 88.53 95.43 171.38
HU - Hungary € / MWhe 81.40 86.56 90.03 96.60 168.58
IT - Italy € / MWhe N.A. 88.65 93.97 101.11 179.85
LT - Lithuania € / MWhe N.A. 86.26 87.25 93.69 163.07
LV - Latvia € / MWhe N.A. 86.25 86.80 93.24 162.38
PL - Poland € / MWhe 81.45 81.78 73.67 80.25 144.48
RO - Romania € / MWhe 81.01 86.17 77.74 84.17 149.11
SI - Slovenia € / MWhe 81.99 87.11 102.75 109.49 188.91
SK - Slovakia € / MWhe 81.50 86.63 102.47 109.06 186.56
Scenario B Unit
Lignite Hard Coal CCGT CCGT GT
USC-PC USC-PC intermediate
base load base load base load load peak load
BG - Bulgaria € / MWhe 84.14 86.15 75.28 81.57 144.70
EE - Estonia € / MWhe N.A. 86.76 75.86 82.48 147.47
ES - Spain € / MWhe N.A. 92.18 77.06 84.32 156.76
FI - Finland € / MWhe N.A. 86.50 68.70 75.85 142.27
GR - Greece € / MWhe 85.70 87.77 85.53 92.44 167.03
HU - Hungary € / MWhe 84.60 86.67 86.90 93.47 164.02
IT - Italy € / MWhe N.A. 88.57 90.74 97.88 175.15
LT - Lithuania € / MWhe N.A. 86.43 84.25 90.69 158.70
LV - Latvia € / MWhe N.A. 86.43 83.83 90.27 158.05
PL - Poland € / MWhe 84.64 82.51 71.60 78.17 141.46
RO - Romania € / MWhe 84.28 86.33 75.36 81.79 145.66
SI - Slovenia € / MWhe 85.16 87.21 98.83 105.56 183.19
SK - Slovakia € / MWhe 84.69 86.75 98.53 105.12 180.83
Scenario C Unit

5761P25/FICHT-9661890-v2 5-17
A large part of the composite levelized costs are marginal costs, i.e. variable
OPEX. Marginal costs are mainly containing fuel costs and CO2 costs,
depending on the type of power plant. An example of the cost breakdown
for all three analysed base load power plants is shown for Hungary with
Figure 85, Figure 86 and Figure 87. All three examples relate to Scenario C.
Figure 85: Cost breakdown of electricity generation costs for lignite power plant
in Hungary (Scenario C)
Figure 86: Cost breakdown of electricity generation costs for hard coal power plant
in Hungary (Scenario C)
Annualized CAPEX24%
Fixed O&M, excluding personnel costs
6%
Insurance/overhead2%
Operating staff expenses1%Variable O&M
2%
Fuel Costs16%
CO2 certificate costs49%
Cost Breakdown
Lignite PP
Annualized CAPEX21%
Fixed O&M, excluding personnel costs
5%
Insurance/overhead2%
Operating staff expenses1%
Variable O&M1%
Fuel Costs32%
CO2 certificate costs38%
Cost Breakdown
Hard Coal PP

5761P25/FICHT-9661890-v2 5-18
Figure 87: Cost breakdown of electricity generation costs for CCGT (base load)
in Hungary (Scenario C)
Although composite costs in Hungary in Scenario C are at almost the same
absolute level for the three base load power plants (cf. Table 64), the
relative composition of those costs is quite different among the plants.
Almost half of the electricity generation costs for the lignite power plant are
caused by CO2 certificates. For the hard coal power plant fuel costs and CO2
costs are both about equally dominating total costs, whereas the costs of the
CCGT are dominated by fuel costs.
The explicit calculation of the levelized costs and their composition that is
underlying Figure 85, Figure 86 and Figure 87 is shown exemplarily in
Table 65. On the basis on the annual energy and emission balance of each
power plant the CAPEX and its components as well as the OPEX in the
starting year and its components are compiled. All figures are brought on
present values by assuming certain annual escalation rates for OPEX
components. By relating the cost items in present values to the generated
electricity in present value leads to levelized cost items, either by summing
up total costs (composite costs) or only variable OPEX (marginal costs).
Annualized CAPEX8%
Fixed O&M, excluding personnel costs
1%
Insurance/overhead0%
Operating staff expenses0%
Variable O&M4%
Fuel Costs72%
CO2 certificate costs15%
Cost Breakdown
CCGT (base load)

5761P25/FICHT-9661890-v2 5-19
Table 65: Calculation of levelized costs in the model: The example of Hungary for Scenario C
Lignite Hard Coal CCGT CCGT GT
USC-PC USC-PC
base load base load base load intermediate load peak load
Annual electricity production Gwhe/a 7,879 5,556 5,910 3,546 186
Annual fuel consumption Gwht/a 18,238 12,184 10,687 6,412 488
Specific fuel costs (levelized, real) € / MWht 6.0 12.7 34.4 35.0 38.8
Annual CO2 emissions t/a 7,368,090 4,167,000 2,158,807 1,295,284 98,674
Specific CO2 certificate costs (levelized, real) € / t CO2 44.22 44.22 35.62 35.62 35.62
CAPEX mln € 2,650 1,656 557 557 77
EPC price (procurement cost, without construction) mln € 2,173 1,376 480 480 68
Construction works mln € 40 32 11 11 2
Owner's costs (referred to EPC) mln € 221 141 49 49 7
Interest during construction mln € 216 107 17 17 1
OPEX starting year mln € / a 494.5 374.1 470.7 289.4 24.5
Fixed O&M, excluding personnel costs mln € / a 33.2 20.6 4.8 4.8 0.3
Insurance(of equipment)/overhead mln € / a 11.06 6.88 2.40 2.40 0.34
Operating staff mln € / a 2.2 1.9 1.0 1.0 0.5
Variable O&M mln € / a 13.39 5.56 17.73 10.64 0.84
Fuel Costs (levelized, real) mln € / a 108.9 154.9 367.9 224.5 18.9
CO2 certificate costs (levelized, real) mln € / a 325.8 184.3 76.9 46.1 3.5
Present Values of Costs mln € 10,907 7,880 7,234 4,669 429
CAPEX mln € 2,650 1,656 557 557 77
Fixed O&M, excluding personnel costs 1.0% mln € 622 387 75 75 5
Insurance(of equipment)/overhead 1.0% mln € 207 129 38 38 5
Operating staff 3.8% mln € 62 55 21 21 12
Variable O&M 1.0% mln € 251 104 278 167 13
Fuel Costs mln € 1,782 2,534 5,183 3,162 267
CO2 certificate costs mln € 5,331 3,015 1,083 650 50
PV electricity production TWh 128.9 90.92 83.25 49.95 2.61
Levelized composite cost € / MWhe 84.6 86.7 86.9 93.5 164.0
Levelized marginal cost € / MWhe 57.1 62.2 78.6 79.6 125.9
Item Unit

5761P25/FICHT-9661890-v2 5-20
Remarkable is the generally rather high share of marginal costs that is
obtained among all scenarios. According to Table 66, Table 67 and Table 68
marginal cost make out even for lignite power plants always at least 60% or
more, due to the high share of CO2 costs. With such high marginal cost
parts, coal power plants come closer to the economic characteristics that are
obviously observed for peak load power plants.
Table 66: Marginal costs as%age of composite costs (Scenario A)
Table 67: Marginal costs as%age of composite costs (Scenario B)
Lignite Hard Coal CCGT CCGT GT
USC-PC USC-PC intermediate
base load base load base load load peak load
BG - Bulgaria € / MWhe 63% 71% 90% 84% 76%
EE - Estonia € / MWhe N.A. 69% 89% 83% 75%
ES - Spain € / MWhe N.A. 68% 88% 82% 71%
FI - Finland € / MWhe N.A. 66% 87% 80% 69%
GR - Greece € / MWhe 61% 68% 90% 85% 74%
HU - Hungary € / MWhe 62% 69% 91% 86% 77%
IT - Italy € / MWhe N.A. 67% 90% 85% 75%
LT - Lithuania € / MWhe N.A. 70% 91% 86% 78%
LV - Latvia € / MWhe N.A. 70% 91% 85% 78%
PL - Poland € / MWhe 62% 67% 89% 83% 74%
RO - Romania € / MWhe 62% 70% 89% 84% 76%
SI - Slovenia € / MWhe 61% 69% 92% 87% 79%
SK - Slovakia € / MWhe 62% 69% 92% 87% 80%
Scenario A Unit
Lignite Hard Coal CCGT CCGT GT
USC-PC USC-PC intermediate
base load base load base load load peak load
BG - Bulgaria € / MWhe 68% 73% 90% 84% 76%
EE - Estonia € / MWhe N.A. 71% 89% 84% 75%
ES - Spain € / MWhe N.A. 71% 88% 82% 71%
FI - Finland € / MWhe N.A. 69% 87% 80% 70%
GR - Greece € / MWhe 65% 71% 90% 85% 74%
HU - Hungary € / MWhe 66% 72% 91% 86% 77%
IT - Italy € / MWhe N.A. 70% 90% 85% 75%
LT - Lithuania € / MWhe N.A. 72% 91% 86% 78%
LV - Latvia € / MWhe N.A. 72% 91% 86% 78%
PL - Poland € / MWhe 66% 70% 89% 83% 74%
RO - Romania € / MWhe 67% 72% 90% 84% 76%
SI - Slovenia € / MWhe 66% 71% 92% 87% 79%
SK - Slovakia € / MWhe 66% 72% 92% 87% 80%
Scenario B Unit

5761P25/FICHT-9661890-v2 5-21
Table 68: Marginal costs as%age of composite costs (Scenario C)
Figure 88, Figure 89 and Figure 90 illustrate the components of electricity
costs for all three scenarios. From Scenario A to Scenario C increasingly
higher CO2 cost components are more or less offset by fuel cost components
that are generally decreasing from Scenario A to Scenario C. Figures of CO2
cost components and fuel cost components of levelized electricity costs are
also given in Annex III and Annex IV, respectively.
Lignite Hard Coal CCGT CCGT GT
USC-PC USC-PC intermediate
base load base load base load load peak load
BG - Bulgaria € / MWhe 69% 73% 90% 84% 76%
EE - Estonia € / MWhe N.A. 71% 89% 83% 74%
ES - Spain € / MWhe N.A. 70% 88% 82% 70%
FI - Finland € / MWhe N.A. 69% 87% 80% 69%
GR - Greece € / MWhe 67% 71% 90% 84% 74%
HU - Hungary € / MWhe 68% 72% 90% 85% 77%
IT - Italy € / MWhe N.A. 70% 90% 84% 74%
LT - Lithuania € / MWhe N.A. 72% 90% 85% 77%
LV - Latvia € / MWhe N.A. 72% 90% 85% 77%
PL - Poland € / MWhe 67% 70% 88% 82% 73%
RO - Romania € / MWhe 68% 72% 89% 84% 75%
SI - Slovenia € / MWhe 67% 71% 91% 87% 78%
SK - Slovakia € / MWhe 67% 72% 92% 87% 79%
Scenario C Unit

5761P25/FICHT-9661890-v2 5-22
Figure 88: Composition of levelized electricity costs in Scenario A
N.A.
N.A.
N.A.
N.A.
N.A.
N.A.
0 50 100 150 200
LigHC
BG CCGT baseCCGT intermediate
GT
LigHC
EE CCGT baseCCGT intermediate
GT
LigHC
ES CCGT baseCCGT intermediate
GT
LigHC
FI CCGT baseCCGT intermediate
GT
LigHC
GR CCGT baseCCGT intermediate
GT
LigHC
HU CCGT baseCCGT intermediate
GT
LigHC
IT CCGT baseCCGT intermediate
GT
LigHC
LT CCGT baseCCGT intermediate
GT
LigHC
LV CCGT baseCCGT intermediate
GT
LigHC
PL CCGT baseCCGT intermediate
GT
LigHC
RO CCGT baseCCGT intermediate
GT
LigHC
SI CCGT baseCCGT intermediate
GT
LigHC
SK CCGT baseCCGT intermediate
GT
€/MWhe
LEC - Scenario A
Fuel Costs CO2 Costs Variable O&M Costs Fixed Costs

5761P25/FICHT-9661890-v2 5-23
Figure 89: Composition of levelized electricity costs in Scenario B
N.A.
N.A.
N.A.
N.A.
N.A.
N.A.
0 50 100 150 200
LigHC
BG CCGT baseCCGT intermediate
GT
LigHC
EE CCGT baseCCGT intermediate
GT
LigHC
ES CCGT baseCCGT intermediate
GT
LigHC
FI CCGT baseCCGT intermediate
GT
LigHC
GR CCGT baseCCGT intermediate
GT
LigHC
HU CCGT baseCCGT intermediate
GT
LigHC
IT CCGT baseCCGT intermediate
GT
LigHC
LT CCGT baseCCGT intermediate
GT
LigHC
LV CCGT baseCCGT intermediate
GT
LigHC
PL CCGT baseCCGT intermediate
GT
LigHC
RO CCGT baseCCGT intermediate
GT
LigHC
SI CCGT baseCCGT intermediate
GT
LigHC
SK CCGT baseCCGT intermediate
GT
€/MWhe
LEC - Scenario B
Fuel Costs CO2 Costs Variable O&M Costs Fixed Costs

5761P25/FICHT-9661890-v2 5-24
Figure 90: Composition of levelized electricity costs in Scenario C
N.A.
N.A.
N.A.
N.A.
N.A.
N.A.
0 50 100 150 200
LigHC
BG CCGT baseCCGT intermediate
GT
LigHC
EE CCGT baseCCGT intermediate
GT
LigHC
ES CCGT baseCCGT intermediate
GT
LigHC
FI CCGT baseCCGT intermediate
GT
LigHC
GR CCGT baseCCGT intermediate
GT
LigHC
HU CCGT baseCCGT intermediate
GT
LigHC
IT CCGT baseCCGT intermediate
GT
LigHC
LT CCGT baseCCGT intermediate
GT
LigHC
LV CCGT baseCCGT intermediate
GT
LigHC
PL CCGT baseCCGT intermediate
GT
LigHC
RO CCGT baseCCGT intermediate
GT
LigHC
SI CCGT baseCCGT intermediate
GT
LigHC
SK CCGT baseCCGT intermediate
GT
€/MWhe
LEC - Scenario C
Fuel Costs CO2 Costs Variable O&M Costs Fixed Costs

5761P25/FICHT-9661890-v2 5-25
5.4 Conclusions
Based on the LEC calculation of the model, the microeconomic effects from
the change to full auctioning from 2nd
to 3rd
ETS period are analysed. The
investigation of NAPs of some EU countries shows that for new power
plants investment conditions in the 2nd
ETS period regarding emission
trading greatly vary among the type of power plants, but also among the EU
countries. Particularly gas turbines were effectively over-allocated with
emission rights. Whereas in some countries (particularly in Finland) a
deficit of more than 50% of the required certificates remains after
allocation, especially for coal power plants in Slovenia, Lithuania and
Finland. Levelized CO2 costs of electricity in the second ETS period range
in average around 5 to 9 €/MWhe for new coal power plants and around
0 to 2 €/MWhe for new CCGTs. New peak load gas turbines could in some
countries greatly benefit from over-allocation with an equivalent value of up
to 53 €/MWhe in Scenario C. CO2 costs are of course highest in Scenario C
and lowest in Scenario A. From Scenario A to Scenario C the difference
makes up for about another 50% higher CO2 costs for natural gas fired
power plants and for about another 60% higher CO2 costs for coal fired
power plants.
It shall be emphasised however, that the CO2 cost calculations assume, that
the allocation rules of the 2nd
ETS period are applied over the whole lifetime
of the power plants. This was for sure not the expectation of an investor that
is installing a power plant within the time frame 2008 to 2012. Therefore the
calculations are only hypothetical. For new power plant projects as
investigated in this study the allocation rules of the 2nd
ETS period are
irrelevant. In general, investment conditions may have even improved from
the second to the third ETS period alone by the fact, that insecurities about
the future development of the ETS periods as well as distortions of
competition have significantly been reduced with the 3rd
ETS period.
But nevertheless does a comparison with CO2 costs accruing in the 3rd
ETS
period demonstrate the additional burden that the investor has to take into
account due to full auctioning. The change from the 2nd
to the 3rd
phase of
ETS does the least harm to CCGT’s plants, which are not like GTs loosing
allocation privileges, but which are also not like coal power plants hit by
high specific CO2 emissions. Particularly if CCGTs will run in base load,
the change to the 3rd
ETS period causes them in average over all
investigated countries only between about 7 to 11 €/MWhe additional costs,
depending on the regarded scenario.
For the other power plant types CO2 additional costs caused by the change
from NAP allocation to full auctioning range roughly between about 15 to
30 €/MWhe as average over all countries. But for single countries in
Scenario C it can reach up to 72 €/MWhe for gas turbines in Lithuania or up
to 43 €/MWhe for lignite power plants in Bulgaria. The last-mentioned cases
would mean about a doubling of the total electricity costs.

5761P25/FICHT-9661890-v2 5-26
In the third ETS period full auctioning is the general principle applied for
new power plants. Nevertheless are the most CO2 emitting lignite fired
power plants still the most competitive base load power plant option, at least
in Scenario A and for some countries also in scenarios B and even in C.
However, in the global action decarbonisation Scenario C do the highest
CO2 prices combined with the lowest fuel prices shift the competitive
advantage for base load power plants generally towards natural gas fired
CCGT plants.
Another outcome from the LEC comparison: Hard coal power plants can
generally not compete with lignite power plants and are thus only in such
countries an option for base load, where no lignite is available and where
electricity generation from CCGT power plants is expensive. This is the
case for Italy and in scenarios A and B also for Lithuania and Latvia.
Remarkable is the generally rather high share of marginal costs among total
composite electricity costs in all three scenarios. Marginal cost make out
even for lignite power plants always at least 60% or more, due to the high
share of CO2 costs. With such high marginal cost shares, coal power plants
come closer to the economic characteristics that are obviously observed for
peak load power plants. In the example of Hungary in Scenario C, about
half the electricity costs of the lignite power plant are caused by CO2 costs.
For the hard coal power plant, fuel costs and CO2 costs are both about
equally dominating total costs, whereas the costs of the CCGT base load
plant are dominated by fuel costs.

5761P25/FICHT-9661890-v2 6-1
6. Non-EU Power Plant Investment Options in Competition to the EU
In this chapter, investigations are undertaken of investment options in new
power plants outside the EU that are dedicated for electricity transmission
into the EU.
First, all unfeasible investment options are eliminated in section 6.1 with the
decision tree. Then, specific conditions in the non-EU countries are
discussed and quantified in section 6.2. This concerns, on the one hand,
country-specific risks and, on the other, cross-border electricity transmission
costs and their impact on the investment decision. In section 6.3, a general
understanding is developed of the competitive advantage of investments
outside the EU that are in competition with the non-EU country regarding
the preferable site for a new power plant. Based on this understanding, the
pair-wise competiveness of pairs of countries is assessed using the model in
section 6.4. This leads to a list of the most promising investment conditions
for electricity import into the EU.
6.1 Application of the Decision Tree
Using the decision tree, investment factors are addressed that are non-
tangible or are not quantifiable with the decision-making model but would
lead to an exclusion of investment options. Hence, in the following, all
investment options are identified for which sufficient transmission capacity
for electricity import into the EU (section 6.1.1), access to fuel
(section 6.1.2), and acceptable political and regulatory investment
conditions (section 6.1.3) are available.
6.1.1 Transmission options for electricity import into the EU
In the following, the transmission options for electricity import from non-
EU countries into the EU are analysed. A lack of transmission opportunities
may pose either an insurmountable barrier or at least a considerable risk for
power plant investments that are scheduled for electricity export into the EU
and would thus prohibit the investment. The analysis focuses on
transmission options that could arise from using existing connections as
well as on transmission options from new transmission lines to be built
between EU and non-EU countries.
6.1.1.1 Existing transmission links
In this section, the existing grid is analyzed for electricity transmission
opportunities from non-EU to EU countries. The existing power lines
between EU and non-EU countries are listed and remaining free capacities
are identified and verified.

5761P25/FICHT-9661890-v2 6-2
Generally, it is noted that power systems like the ENTSO-E grid are highly
meshed with a large number of power lines, so determining free capacities is
a complex task. It would actually require simulation calculations for the
whole regional network, but for the purpose of this report a simplified
approach had to be taken by considering solely information on historical
free capacities along the power line itself without regarding any network
system feedback effects.
The current grid situation in Europe was analyzed based on the ENTSO-E-
grid map and all existing grid connections between EU and non-EU
countries at 220 kV and higher are listed in Table 69. Only these
connections are of relevance for new power plant projects. Description of
these power systems can be found in section 4.2.6.2.4.
Besides the physical and technical transfer capacity of a power line (total
transfer capacity, TTC), the capacity is described by the net transfer
capacity (NTC), which is fixed by subtracting a reserve capacity, termed the
transmission reliability margin (TRM), for reasons of security of supply.
Table 69 contains in one column the NTC values as (and if) published by
national TSOs.
The rights to use the lines for energy interexchange within a defined
capacity range are traded on a yearly, monthly and daily basis (already
allocated capacity, AAC). The available transfer capacity (ATC) of each
time-dependent capacity product remains for further usage and trading. To
determine the overall remaining ATC, the ATC values of all time-specific
capacity products as published on trading platforms are totalled. ATC and
NTC values are published by most TSOs or trading platforms to varying
qualities and differing intervals for the total of all lines connecting two
countries. NTC values as published for the most recent months and years
were used for this study. Seasonal variations were observed to be relatively
insignificant and played no further rule with regard to the rough accuracy.
NTC = TTC - TRM
ATC = NTC - AAC
However, at several borders, the physical power flows differ from the
scheduled market power flows in magnitude or even in direction due to
uncontrolled loop flows. These transit power flows are unscheduled, violate
the network security rules and make allocation of available transmission
capacities for further investments more difficult. The growing use of
renewable energies and the resulting impossibility of forecasting supply will
significantly decrease the ATC in future.
Consequently, actually measured physical power flows as they happen are a
better indicator for free capacities than ATC values. Physical load flows are
also published by the TSOs. We subtracted these from the NTC values to
obtain an estimate of free remaining capacities, as shown in column “free”
in Table 69.

5761P25/FICHT-9661890-v2 6-3
No
EU non-EU
sync
network conditions NTC
[MW]
free
[MW]
sufficient capacity
for new power
plants?
country / grid country / grid
1a
Turkey
/ sync. to ENTSO-E RG CE
x 2 x 400 kV n.a. n.a. new capacities due
to envisaged
synchronization
1b Bulgaria /
ENTSO-E RG CE
FYROM
/ ENTSO-E RG CE
x 1 x 400 kV 200-300 50-75 not enough free
capacity
1c Serbia
/ ENTSO-E RG CE
x 1 x 400 kV 250-300 70 not enough free
capacity
2 Estonia /
ENTSO-E RG Baltic
Russia
/ IPS/UPS
x 3 x 300 kV 1000 400 fluctuating values;
peak load GT
feasible
3 Finland /
ENTSO-E RG Nordic
Russia
/ IPS/UPS
1 x BtB in Russia + 2
x 400 kV
1100 100-400 fluctuating values;
peak load GT
feasible
4a
Turkey
/ sync. to ENTSO-E RG CE
x 1 x 400 kV n.a. n.a. new capacities due
to envisaged
synchronization
4b Greece /
ENTSO-E RG CE
Albania
/ sync. to ENTSO-E RG CE
x 1 x 400 kV 100-150 no free capacity
4c FYROM
/ ENTSO-E RG CE
x 2 x 400 kV 300 0-50 not enough free
capacity
5a
Hungary /
ENTSO-E RG CE
Ukraine (Burshtyn island)
/ sync. to ENTSO-E RG CE
x 1 x 400 kV +
1 x 220 kV
(800) n.a.7 no existing, reliable
data
5b Croatia
/ ENTSO-E RG CE
x 2 x 400 kV
(double circuit)
800 100 not enough free
capacity
5c Serbia
/ ENTSO-E RG CE
x 1 x 400 kV 600 200 peak load GT
feasible
6 Latvia /
ENTSO-E RG Baltic
Russia
/ IPS/UPS
x 1 x 300 kV 400 0 no free capacity
7a
Lithuania /
Belarus
/ IPS/UPS
x 1 x 750 kV +
4 x 300 kV
1100 400 fluctuating values;
peak load GT
feasible
7b ENTSO-E RG Baltic
Russia (Kaliningrad)
/ IPS/UPS
x 2 x 300 kV 550-650 50-100 not enough free
capacity
8 Poland /
ENTSO-E RG CE
Ukraine (Burshtyn island)
/ sync. ENTSO-E RG CE
x 1 x 220 kV
isolated mode
n.a. n.a.7 no existing, reliable
data
9a
Romania /
ENTSO-E RG CE
Moldova (islanded mode)
/ sync. to ENTSO-E RG CE
x 1 x 400 kV isolated
mode
160 0 no free capacity
9b Ukraine (Burshtyn island)
/ sync. to ENTSO-E RG CE
x 1 x 400 kV 150 50-100 not enough free
capacity
9c Serbia
/ ENTSO-E RG CE
x 1 existing 380 kV 400 50 not enough free
capacity
10 Slovak Republic /
ENTSO-E RG CE
Ukraine (Burshtyn Island)
/ sync. to ENTSO-E RG CE
x 1 x 400 kV n.a. n.a.7 no existing, reliable
data
11 Slovenia /
ENTSO-E RG CE
Croatia
/ ENTSO-E RG CE
x 2 x 400 kV +
2 x 220 kV
1000 100 not enough free
capacity
12 Spain /
ENTSO-E RG CE
Morocco
/ Maghreb Pool
x 1 x 400 kV
AC submarine-cable
600 0 not enough free
capacity
Table 69: Existing transmission lines between analysed EU and non-EU countries
Large investments in fossil power plants require long-term reservation of
transmission capacities. For this reason, the annually traded transmission
licenses have been analyzed too. If the demand for these long term
capacities is higher than the offered amounts and only daily capacities are
7 Free capacities are probably technically limited due to operation in the isolated network of
Burshtyn Island.

5761P25/FICHT-9661890-v2 6-4
available, it is assumed that, for a power plant investment, it will not be
possible to rely on the availability of existing transmission capacities and
thus the investment will not be feasible.
From Table 69, it becomes evident that the major part of the existing power
lines is already used close to its maximum capacity. The assessed free
capacities are rough estimates and derived from data of variable quality.
Only mean values over time are assessed, but short-term fluctuations of free
capacities can vary considerably and very often, as noted in the Table. For
several links, especially for connections to Burshtyn Island, there are no
reliable data available.
Burshtyn Island was isolated in 2003 from the rest of Ukraine’s
transmission network by de-energizing all lines between linking them. The
small island grid is in synchronous operation with the ENTSO-E RG CE, so
energy export into the EU is possible. The capacity of the existing lines is
both limited and already in full use. Apart from the existing lines to
Burshtyn Island, no further synchronized connections to ENTSO-E RG CE
are planned And according to our estimate there will be no grid
reinforcement projects to be completed up to 2020. The reason is that both
options – the island remaining in the ENTSO-E grid and reintegration into
Ukraine’s transmission grid – are under discussion, so the uncertainty for
any grid investments is critical.
All lines marked green in Table 69 display those transmission lines that are
deemed to offer sufficient free transmission capacity for a new power plant.
It is assumed that at least 200 MW of free capacity would be needed to
provide adequate security for power transmission for a new GT with 150
MW.
Estonia is connected to Russia through three 300 kV AC lines, and physical
power flows through them fluctuate widely. The estimated maximum free
capacity amounts to 400 MW. The same is noted for the connection between
Lithuania and Belarus. In both cases, only peak load power plants are
considered to be possible. Since the measured power flows can differ from
the scheduled ones and this is expected to become more pronounced, power
plant investments that have to rely on free electricity export capacities are
considered to be risky.
Finland and Russia are connected via a 1300 MW conventional HVDC
back-to-back station, located in Russia. The Finnish grid is connected to this
station via two 400 kV AC lines. The ATC values of this connection
likewise fluctuate greatly. The situation is comparable with the two cases
mentioned and described above.
Besides these currently available transmission capacities, the grid
connection between Turkey and Continental Europe (Greece and Bulgaria)
offers additional capacities too. Up to now, the transmission lines have been
de-energized or used only with strongly limited capacities. But since the
Turkish grid is about to be integrated into the ENTSO-E system – currently

5761P25/FICHT-9661890-v2 6-5
phase 3 of the temporary trial operation mode is ongoing – the transmission
capacity of the existing power-lines will be fully accessible. Table 70 lists
the existing grid connections between Turkey and the two EU countries
Greece and Bulgaria with their technical transfer capacity. The usable
network transfer capacities are estimated as 1000–1100 MW. The limitation
compared to the capacity values in the table result from bottlenecks in the
Serbian, Bulgarian and Romanian national grids [MEDRING_UP2].
However, investments in large power plant projects for electricity export
into the EU can be considered to become feasible.
Turkey EU Type Capacity
Babaeski Phillipi (Greece) AC single circuit 1510 MW
Babaeski Maritsa East (Bulgaria) AC single circuit 1500 MW
Hamitabat Maritsa East (Bulgaria) AC single circuit 1000 MW
Table 70: Existing connections between Turkey and the EU
6.1.1.2 New transmission links
In addition to already existing transmission lines from non-EU to EU
countries, in this section the prospects for new power links from non-EU to
EU countries are investigated. New lines may either support existing links
by increasing the transfer capacities or may create completely new
connections.
From the description of the European power system and its structure (see
section 4.2.6.2), some important facts about implementation of new transfer
capacities have to be considered. First of all, for all the potential electricity
import options from non-EU countries that are included in the IPS/UPS to
EU countries from the ENTSO-E RG CE system, imports are only possible
through HVDC back-to-back interconnections or point-to-point HVDC
transmission links. This applies to the following electricity import options:
Finland - Russia
Poland - Belarus
Poland- Ukraine
Slovakia - Ukraine (outside Burshtyn Island)
Hungary - Ukraine (outside Burshtyn Island)
Second, another important criterion for the decision on which transmission
system to use, AC or DC, is the distance between the countries to be
connected. For the distances considered for this study, all power lines on
land between synchronous networks can be constructed using conventional
and comparatively cheap AC technology. For subsea connections the length
for AC cables is strictly limited to about 60 km. Such an HVAC connection
is feasible, for instance, between Spain and Morocco due to the short length
of subsea cable of only 26 km. For longer distances, HVAC subsea cables
are not feasible, so subsea cable interconnections have employ the HVDC
technology. These considerations apply to following power import options:
5761P25/FICHT-9661890-v2 6-6
Ukraine - Bulgaria
Egypt - Greece
Libya - Greece
Libya - Italy
Tunisia - Italy
Turkey - Romania
Algeria - Spain
Tunisia - Spain
Multiple HVDC in-feeds into HVAC systems can pose particular challenges
for grid balances but such issues can be overcome technically by using the
recently developed voltage source converter (VSC) technology. Such
considerations apply especially for Spain and Italy, where multiple power
import options would be possible via HVDC submarine cables.
Identification of new transmission lines between EU and non-EU countries
is based on ENTSO-E’s Ten-Year Network Development Plan issued in
2010 [TYNDP 2010] and released as an update in 2012 [TYNDP 2012].
This is a compilation of transmission projects with European significance
that meet various requirements. Its intent is to provide an overview of
ongoing and confirmed transmission projects, and to ensure certainty when
planning further investments (power plants, etc). The TYNDP was
mandated by EU Directive 2009/713/EC [2009/713/EC] to coordinate EU-
wide network development. This underlines its official status.
As a prerequisite for new transmission line projects to be listed in the
TYNDP, the equipment has to be on HV level and shall lead to an increase
of the grid transfer capacity of at least 500 MW or secure an output of 1
GW/10,000 km² of generation. Data input for the TYNDP is supplied by the
national TSOs when publishing their yearly National Development Plans
and the Regional Development Plans published by the ENTSO-E regional
groups. The feasible integration of planned projects into the existing
network is for each project counterchecked by complex network
calculations performed by the TSOs.
Further, third party projects that are not part of the National Development
Plans may be included in the TYNDP upon application. The projects have to
fulfil the general TYNDP criteria outlined above, but they must also already
possess a transmission license to become part of the TYNDP. Because they
lack transmission licenses, several projects aren’t included and are therefore
investigated individually. Those projects, though, remain relevant since they
could still be granted transmission licenses. Thus for this study the TYNDP
was not the only source for identification of new transmission lines. Part of
the investigation was to determine which further projects are likely to be
completed by 2020 and could become further transmission options for new
power plants’ electricity transfer into the EU.
As a result, Table 71 lists the relevant projects – whether listed in the
TYNDP or not – that increase power imports into the EU from non-EU
countries. Additional information on technology, timing and reference

5761P25/FICHT-9661890-v2 6-7
number is likewise provided. Projects marked green are those that are
deemed to have a chance for realization within the next ten years and that
could provide enough transmission opportunities for new power plant
investments in non-EU countries dedicated for electricity export into the
EU. All transmission link capacities of the projects marked in green in Table
71 are assessed to be sufficient for all analysed types of fossil power plants.
N
o
EU non-EU
distanc
e
[km]
syn
c
project
descriptio
n
capacity
[MW]
project
status
time horizon
TYNDP
ref-no
country
/ grid
sub-
station
country
/ grid
sub-
station
1a
- Tunisia /
Maghreb Pool
Cap Bon / El
Haouria
350 km x HVDC
sea cable,
400 kV,
bipolar
1000
(second
stage)
permitting
long term
29.73
1b Villanova Montenegro /
ENTSO-E RG CE
Tivat 375 km
(sea)
75 km
(land)
x HVDC
sea cable,
500 kV,
bipolar
1000 under
construction
2015
28.70
1c Italy /
ENTSO-E
RG CE
- Algeria /
Maghreb Pool
- - HVDC
sea cable
500 -
1000
design &
permitting
long term
29.A97
1d Candia Croatia /
ENTSO-E RG CE
Konisko 220 km
(sea)
60 km
(land)
x HVDC
sea cable,
400 kV
500-
1000
under
consideration
long term
[HVDC_IT]
1e - Libya /
Mashreq Pool
- - HVDC
sea cable
n.a. under study
long term
[HVDC_IT]
1f Brindisi /
Foggia
Albania /
sync. to
ENTSO-E RG CE
Durres /
Vlore
- x HVDC
sea cable,
400 kV
2x 500
(two
stages)
(authorized)
laut Terna
long term
[HVDC_IT]
2a
Lithuania /
ENTSO-E
RG Baltic
Klaipeda Russia/Kaliningrad /
IPS/UPS
Sovetsk - x AC OHL,
330 kV
n.a. planned [BALTIC_NPP]
2b Jurbakas Russia/Kaliningrad /
IPS/UPS
Sovetsk - x AC OHL,
330 kV
n.a. planned [BALTIC_NPP]
3a
Poland /
- Russia/Kaliningrad /
IPS/UPS
Mamonovo - HVDC
Back-to-
Back
n.a. under
consideration
[BALTIC_NPP]
3b ENTSO-E
RG CE
Rzeszów Ukraine /
IPS/UPS
Chmielnicka - HVDC
Back-to-
Back
2x 600 planned In TYNDP
2010: 366
3c Narev Belarus /
IPS/UPS
Ross - HVDC OHL 600 -
1000
- [BALTIC_NPP]
4a
Constanta Turkey /
sync. to
ENTSO-E RG CE
Aliberköy 320 km
(sea)
80 km
(land)
x HVDC
sea cable
1000 planned
long term
[HVDC_TR]
4b
Romania /
ENTSO-E
RG CE
- Serbia /
ENTSO-E RG CE
- 120 -
170 km
(est.)
x AC OHL,
400 kV,
double
circuit
n.a. design &
permitting
2015/2019
50.238
4c Suceava Moldova
(islanded) /
sync. to
ENTSO-E RG CE
Balti 115 km AC OHL,
400 kV
n.a. under
consideration
long term
[AC_MOL]
Table 71: Potential transmission projects
In total, there are four ENTSO-E projects considered to be relevant. Three
of these connect the Italian grid with the surrounding countries via HVDC
subsea cables. The Italy - Montenegro link is already under construction.
Between Romania and Serbia, one 400 kV AC power line with double

5761P25/FICHT-9661890-v2 6-8
circuit configuration is currently under construction, to offer an additional
physical capacity of 1500 MW.
Projects 2a, 2b, 3a plus another direct HVDC link between Kaliningrad and
Germany are being developed in connection with the planned nuclear power
plant in the Kaliningrad region [B_NPP]. Construction of the Baltic Nuclear
Power Plant started in February 2012 and commercial operation of the two
1000 MW blocks is scheduled to start in 2018. These will replace existing
gas-fired power plants. The residual still large energy surplus will be
exported into surrounding countries, for which purpose the above power
links are planned. It is expected that their capacity will be fully required for
evacuation of the new NPP’s electricity. No other new power plants
dedicated for electricity exports into the EU will find sufficient free
remaining capacities as required for an investment decision.
Italy with its very special geographic position offers a huge number of
possible transmission connections to non-EU countries. Besides the three
ENTSO-E projects, three third party projects are discussed. The 500 MW
HVDC connection between Italy and Albania (1f) is, according to the Italian
TSO TERNA, already authorized and therefore considered to be relevant.
Connections 1d to Croatia and 1e to Libya are already being discussed but
as yet no reliable forecast can be made as both projects are still under
consideration or study.
Project 3b in Table 71 foresees a re-launch of a 750 kV transmission line
between Rzeszów (Poland) and Chmielnicka (Ukraine, outside of Burshtyn
Island), that is currently out of operation. This concerns connection of the
asynchronous systems of Poland and Ukraine. The project is listed in the
[TYNDP 2010]. A back-to-back converter station with a rating of 2x 600
MW in the area of the Rzeszów station is considered. The Polish TSO PSE
analysed various options for interconnected operation. Although listed in
ENTSO-E’s first [TYNDP 2010] and although the Polish ENTSO-E
member PSE is involved in this project,the project was sorted out in
ENTSO-E’s second [TYNDP 2012] and is no more listed among the future
transmission projects. It is thus seen to have no prospects for realisation by
2020.
The HVDC connection between Belarus and Poland, Project 3d in Table 71,
will either be developed by a private investor or by the Polish state owned
TSO [PSEDP 2012, CICS]. Due to financing problems and political
uncertainty, the project is currently on hold (cf. section 8). The plan is to
build a new line over an existing route that is now outdated and no longer
usable and to connect via a back-to-back link to the Belarus territory.
In addition to the already discussed transmission link between Serbia and
Romania, an HVDC subsea cable connection between Turkey and Romania
(4a) has been under discussion for several years and deemed to be feasible
and realizable within the next ten years, so this project is considered in this
report. But reinforcement of existing power lines connecting Romania and
Moldavia is not considered relevant as Moldova is dependent on the grid

5761P25/FICHT-9661890-v2 6-9
connection to Ukraine and electricity imports from Ukraine. This avoids
planning reliability for any potential grid link investments (4c).
All transmission projects that offer potential electricity import options into
the EU for new power plants to be built outside the EU are included in
Table 72. Also a CAPEX estimate of the projects is given in this table. It
must be emphasized, though, that this can only be a best guess due to
limited information on the projects. Actual CAPEX for the projects may
deviate considerably from case to case.
For CAPEX estimation, the cost figures as assessed in section 4.2.6.2 are
used. If no parameters on the planned interconnections are given (cf. Table
71), a bi-polar system with a voltage of ±500 kV and a transmission
capacity of 1000 MW is assumed for HVDC links. For some projects, the
full information needed for price estimates is not given, in which case
assumptions are made, marked * in the column type/description. If the
project data offers a range of capacity and distance values, the maximum
numbers are chosen. For the planned AC OHL power line between Romania
and Serbia, the stated project capacity is based on standard assumptions for
similar projects.
connection ENTSO-E Number Type / description CAPEX Capacity
Italy - Albania private investor HVDC connection
2 x 500 MW
330 km sea cable
594 Mio€ cable
440 Mio€
converter
1,000 MW transmission
capacity of HVDC system
Italy - Tunisia TYNDP 2012
project 29.73
HVDC connection
1000 MW
350 km sea cable
630 Mio€ cable
440 Mio€
converter
1,000 MW transmission
capacity of HVDC system
Italy -
Montenegro
TYNDP 2012
project 28.70
HVDC connection
1000 MW
375 km sea cable
75 km land cable
675 Mio€ cable
440 Mio€
converter
1,000 MW transmission
capacity of HVDC system
Italy - Algeria TYNDP 2012
project 29.A97
HVDC connection
500-1000 MW
310 km DC cable
558 Mio€ cable
440 Mio€
converter
1,000 MW transmission
capacity of HVDC system
Poland - Belarus private investor or
Polish TSO
B2B, based on renewed
120 km AC line
600-1000 MW
52 Mio€ cable
264-440 Mio€
converter
up to 1,000 MW transmission
capacity (B2B)
Romania -
Turkey
private investor HVDC connection
1000 MW *
320 km sea cable,
80 km land cable
720 Mio€ cable
440 Mio€
converter
1,000 MW transmission
capacity of HVDC system
Romania - Serbia TYNDP 2012
project 50.238
AC double circuit OHL
400 kV
120 - 175 km *
65 Mio€
HVAC OHL
1,500 MW total transmission
capacity of OHL (n-1)
Table 72: Relevant transmission projects and their estimated CAPEX
6.1.1.3 Remaining transmission options for electricity import into the EU
From the analysis of existing as well as potential new transmission lines into
the EU, the following transmission options for electricity import into the EU
from new fossil fired power plants outside the EU are identified (see Table
73). As it turns out, transmission options are scarce. Only thirteen options
remain that could provide sufficient transmission capacity for new power
plants in non-EU countries for exporting their entire electricity generation
into the EU.

5761P25/FICHT-9661890-v2 6-10
Table 73: Transmission options for electricity import into the EU from new fossil fired power plants outside the EU
existing / EU non-EU sync./async. type of possible PP types of
new country grid country grid Energy Community connection capacity [MW] power plant
existing Bulgaria ENTSO-E RG CE Turkey sync. ENTSO-E RG CE not yet sync. HVAC n.a. all
existing Greece ENTSO-E RG CE Turkey sync. ENTSO-E RG CE not yet sync. HVAC n.a. all
existing Estonia ENTSO-E RG BALTIC Russian Federation IPS/UPS no sync. HVAC 400 GT
existing Finland ENTSO-E RG NORDIC Russian Federation IPS/UPS no asnyc. B2B 100-400 GT
existing Hungary ENTSO-E RG CE Serbia ENTSO-E RG CE yes sync. HVAC 200 GT
existing Lithuania ENTSO-E RG BALTIC Belarus IPS/UPS no sync. HVAC 400 GT
new Italy ENTSO-E RG CE Tunisia Maghreb Pool no sync. HVDC (sea) 1000 all
new Italy ENTSO-E RG CE Montenegro ENTSO-E RG CE yes sync. HVDC (sea) 1000 all
new Italy ENTSO-E RG CE Algeria Maghreb Pool no sync. HVDC (sea) 500-1000 all
new Italy ENTSO-E RG CE Albania sync. ENTSO-E RG CE yes sync. HVDC (sea) 500-1000 all
new Poland ENTSO-E RG CE Belarus IPS/UPS no asnyc. B2B 600-1000 all
new Romania ENTSO-E RG CE Turkey sync. ENTSO-E RG CE not yet sync. HVDC (sea) n.a. all
new Romania ENTSO-E RG CE Serbia ENTSO-E RG CE yes sync. HVAC 1500 all

5761P25/FICHT-9661890-v2 6-11
Six options are based on utilization of existing interconnections. In four of
these, the remaining free transmission capacities of the links, though, are not
enough to secure electricity export from large CCGT or coal-fired power
plants with more than 400 MW. For these four electricity export options into
the EU, only investment in new natural gas-fired turbines with a capacity of
150 MW is considered. These four electricity transmission options are:
from Russia to Estonia
from Russia to Finland
from Serbia to Hungary
from Belarus to Lithuania.
Only the existing grid connections between Turkey and the two EU
countries Greece and Bulgaria will reliably offer sufficient transfer capacity
for new large power plants to be installed in Turkey, but not before full
integration of Turkey into the ENTSO-E network. All six identified existing
connections are HVAC links, apart from the existing HVDC back-to-back
link from Russia to Finland.
For the additional seven transmission options for new grid connections, it is
assumed that all provide at least 1000 MW transmission capacity for
electricity import into the EU. For the connections from Albania and
Algeria this may be at least the case after having finished the second
expansion stage (i.e. 2 x 500 MW). Five potential new connections are
HVDC lines, one based on HVDC back-to-back (Belarus - Poland) and one
is an HVAC connection extension from Serbia to Romania.
The new power plants associated with the identified electricity transmission
options into the EU would be hosted by the following eight non-EU
countries:
Non-EU country Member of Energy Community
Albania Yes
Algeria No
Belarus No
Montenegro Yes
Russia No
Serbia Yes
Tunisia No
Turkey Observer status, Membership envisaged
Table 74: Non-EU countries with transmission options for electricity import into
EU
With regard to the political and regulatory environment for power plant
investments in these countries, their membership in the Energy Community
is of significance and is denoted in Table 74. Turkey has the status of an
observer in the Energy Community, but membership is sought on the part of
Turkey as well as on the part of the EU. It may thus be assumed that
potential power plant investments in Turkey will even now already have to

5761P25/FICHT-9661890-v2 6-12
comply with Energy Community rules in order not to risk becoming a
stranded investment after the Turkey’s accession. For this reason, our
analysis of the regulatory environment in Turkey considers Turkey as
already being a member of the Energy Community.
6.1.2 Fuel Availability for New Power Plants
In the next step, the identified transmission options (cf. Table 73) and their
associated power plant investment options in non-EU countries are further
assessed regarding fuel availability.
According to Table 73, for Russia only GT power plants are considered. For
all other countries, also lignite- and hard coal-fired power plants are a priori
an option. Whereas hard coal could be imported, firing lignite is
economically feasible only for power plants in the neighbourhood of lignite
deposits. This is not the case in Algeria, Tunisia and Belarus. In Albania,
lignite resources are available in principle, however fuel quality is poor and
specific extraction costs are almost double per MWh energy content the
price of imported hard coal. Thus lignite power plants in Albania are not
considered further for this study.
In the case of Turkey, a new power plant associated with the envisaged
connection from Turkey to Romania would be sited too far from Turkish
lignite resources. However, lignite mines in the Trakya basin on the Turkish
part of the European tectonic plate (Thrace region) close to EU neighbours
could provide fuel for power plants dedicated for electricity export to
Bulgaria or Greece. Other countries with lignite resources are Montenegro
and Serbia. Serbia could use lignite for a power plant dedicated for
electricity export to Romania.
In Montenegro and Albania, no natural gas fired power plants are feasible at
present due to the lack of a natural gas supply. For both countries, the
prospects for such a supply depend heavily on future realisation of the Trans
Adriatic Pipeline (TAP) project. TAP is planned to transport gas from the
Caspian region via Greece and Albania and across the Adriatic Sea to
southern Italy and further into Western Europe.
TAP competes with the Nabucco West pipeline for opening the new
Southern Gas Corridor to Europe and establish a new market outlet for
natural gas from the Caspian Sea. A decision is scheduled for 2013. Gas
from the Azerbaijani Shah Deniz-2 project is regarded as the main source
for the TAP project, but will not be available before 2018. For transport to
Montenegro, a connection to the Ionian Adriatic Pipeline (IAP) project
would be necessary. IAP is another pipeline project planned to connect
Albania and Montenegro with Croatia. For the timeframe of this study up to
the end of the third ETS in 2020, the maturities of the natural gas pipeline
projects are assessed to be insufficient for investment decisions for any
natural gas power plants in Albania or Montenegro. But all other non-EU
countries considered can either import natural gas via pipeline or even use
indigenous natural gas production like in Algeria, Tunisia and Russia.

5761P25/FICHT-9661890-v2 6-13
In summary, Table 75 adds to the power plant options as listed in Table 73
the fossil fuel availabilities as discussed above.
Table 75: Transmission options for electricity import into the EU from new fossil
fuel power plants outside the EU and the associated fuel availability
6.1.3 Political and regulatory constraints in non-EU countries
The EU has set up a Baltic Energy Market Interconnection Plan (BEMIP)
for integration of the Baltic States into the EU energy networks. A long term
political goal is for the Baltic countries to desynchronise from the Russian
network and synchronise with the EU network [ELFORSK]. The target year
for full implementation of the common Baltic market integrated with Nord
Pool has been fixed as 2015 (see also 4.2.8.2). Due to this political
development, new power plants in Russia dedicated for electricity export to
the Baltic States are no longer a practical proposition. Instead they face the
risk of becoming decoupled after network desynchronisation. Furthermore,
with the integration of the Baltic countries into the ENTSO-E networks, also
the configuration of the Baltic electricity market will be adjusted
accordingly [CESI], so the Baltic and Russian electricity market designs
will completely differ due to their specific characteristics and features. This
will complicate trading and cross-border transmission capacity management
(cf. 4.2.8.2), as is already observable today for the cross-border transmission
capacities between Russia and Finland, for which there are no prospects for
investors in transmission capacity access. For these reasons, the option to
import electricity from new power plants in Russia to the EU is not
considered to be realistic and is eliminated from further consideration.
A similar situation due to decoupling from the IPS/UPS system of the Baltic
countries arises with Belarus. Additionally, the political situation in Belarus
makes it difficult for investors to gain enough confidence for financing
power plant projects. An example is given in section 8.2. Thus also new
power plants in Belarus for electricity export to the EU are not taken into
existing / EU non-EU types of fossil fuel sources for non-EU power plant fossil fuel sources for non-EU PP
new country country power plant lignite hard coal natural gas
existing Bulgaria Turkey all indigenous import import
existing Greece Turkey all indigenous import import
existing Estonia Russian Federation GT - - indigenous
existing Finland Russian Federation GT- -
indigenous
existing Hungary Serbia GT - - import
existing Lithuania Belarus GT- -
import
new Italy Tunisia all - import indigenous
new Italy Montenegro all indigenous import -
new Italy Algeria all - import indigenous
new Italy Albania all not viable import -
new Poland Belarus all - import import
new Romania Turkey all - import import
new Romania Serbia all indigenous import import

5761P25/FICHT-9661890-v2 6-14
account further in this study as they are not a realisable investment option
until 2020.
6.2 Identification and Quantification of Country-Specific Conditions
The overall objective of this study is to analyse whether power plants built
in countries adjacent to EU for electricity export for final consumption
within the EU have a significant competitive advantage due to the fact that
there are no carbon costs for electricity generation outside the EU.
In a first stage we calculate in the study with our model the levelized
electricity generation cost (LEC). Furthermore, we also determine the
maximum additional “rate of return” that an investor could obtain up to the
point where the potential advantage provided by the avoided CO2 costs is
just offset by higher returns.
However, the LEC does not provide a complete picture of the potential
competitive advantage. To round this off another two aspects must be
included in the considerations:
possible country risks
cost for electricity transport from the power plant to the EU grid.
Taking into consideration the project cost incurred by these two aspects may
reduce the potential advantage provided by avoided CO2 costs. For the sake
of completeness these two aspects are discussed and analysed in the
following two sections.
6.2.1 Consideration of country risks
A key question when investing in power plant projects in the European
Union’s adjacent countries, in particular in Eastern Europe or in North
Africa, relates to whether there is more risk that must be addressed and to
what extent. In this context, we must identify the types of risks, try to assess
their likelihood of occurrence and quantify their impact on project costs and
returns. Of course, this must always be done for each project, but in the
following these aspects are addressed in general terms only.
In our case, country risks may include political risks, sovereign credit
default risks, economic risks, currency risks and transfer risks.
The political situations in Eastern European and North African countries are
undergoing a transition and political risks are to be expected, like
subversion of the political system, insurgency or the risk of nationalization
in the course of regime change. The general expectation, though, is that such
a change will occur gradually rather towards more democracy and a free
market economy, at least over the medium to long term. Hence, we consider
the scale of the impact of political risks on investments for power plants
with long service lives built for power export to EU will be low to medium.

5761P25/FICHT-9661890-v2 6-15
Economic risks and sovereign credit default risks are actually unpredictable
and can occur in European as well as in non-European countries in the
course of global financial and economic turmoil. If such an event happens in
a single country it might not have significant influence on power plant
projects that supply electricity within the EU. In contrast, the income
coming from the EU will be welcome. Hence, these risks, too, would appear
to have only a limited impact on the investment.
Currency risk and transfer risk of revenues is the most significant risk when
investing in foreign countries. However, in our case such a risk is actually
non-existent as the electricity exported into the EU grid will be paid by the
receiver within the EU. Hence, revenues must not be retransferred and will
remain at the disposal of the investor in a secure country of his choice.
In summary, this means that country risks for power plant projects in
adjacent EU countries in Eastern Europe or North Africa can be regarded as
medium to low or, in part, as non-existent. Nevertheless, investors and
creditors will always consider some risk in their decision. Therefore, at least
a quantification of the magnitude of country risks will be helpful. A useful
instrument for this purpose is provided by the rating agencies.
The creditworthiness of a country or entity is evaluated by rating agencies.
In general, the rating is an evaluation of the debtor’s ability to pay back the
debt and the likelihood of default. Credit ratings are expressed in rating
classes as shown in Table 76. These ratings are considered to be investment
grade, which means that the security or the entity being rated carries a level
of quality that many institutions require when considering overseas
investments. Ratings that fall under “BBB” are considered to be speculative
or “junk”. Updated ratings are listed in Table 76.
Table 76: Rating classes
In this context, it must be pointed out that the ratings are always snapshot
views of a country’s economic situation and are readjusted if changes occur.
Updated ratings for countries are available, e.g. in the British newspaper
[The Guardian].
Moody's Standard &
Poor's
Aaa AAA Investment Lowest Risk
Aa AA Investment Low Risk
A A Investment Low Risk
Baa BBB Investment Medium Risk
Ba, B BB, B Junk High Risk
Caa/Ca/C CCC/CC/C Junk Highest Risk
C D Junk In Default
Agency
Grade Risk

5761P25/FICHT-9661890-v2 6-16
Credit insurance companies as Hermes in Germany usually rely on the
“OECD arrangement on officially supported export credits” in defining their
credit default premiums. In this document countries are classified in 8
country risk categories 0 to 7. Countries of the category 0 are the high
income OECD countries with country risk zero. All the others have a higher
classification which means a higher country risk. For instance the following
countries are currently classified as follows: Spain 0; Poland 0, Bulgaria 4,
Russia 3, Turkey 4, Morocco 3, Ukraine 7. (See
http://www.oecd.org/tad/exportcredits/cre-crc-current-internet-rev1.pdf)
The risk rates are calculated with a model for Commercial Interest
Reference Rates (CIRRs) for each country separately, considering several
financial parameters. The main risks included are the transfer risk and
currency risk. In our case we are of the opinion that both are only partly
relevant because there is no risk of transfer since the revenues are paid
within the EU and the currency risk is limited only to the services for the
power plant provided by locals such as operating staff, civil works etc.
A widely used approach for risk consideration is to include an increment as
a risk premium in the weighted average cost of capital (WACC) that is used
as discount rate. This is an increment above a standard rate. In our approach,
the WACC includes three elements: the risk-free rate, the venture premium
for the particular investment and the country risk premium. The latter two
are considered only for the equity share of capital expenditures.
The premiums are usually expressed in basis points (Bps). A 1%age point is
equal to 100 basis points and is used to denote the increment above a
standard risk-free rate. Basis point 300, for instance, means that 3%age
points must be added to the standard rate. In Table 77, estimates of the
country risk premiums for corporate bonds and for government bonds in
basic points are shown depending on the country ratings.
Table 77: Country risk premiums by rating class
The figures in the table above consider all the risk to their full extent.
However, we mentioned above that country risks for power plant projects
for electricity exports to EU have only a limited impact on the investment
and the most important currency and transfer risks are non-existent in our
case. Therefore, the country risk premiums will be low.
Rating class
Aaa
Aa1
Aa2
Aa3
A1
A2
A3
Baa1
Baa2
Baa3
Ba1
Ba2
Ba3
B1
B2
B3
Caa
Corporate Bonds, Bps 0 60 65 70 80 90 85 120 130 145 250 300 400 450 550 650 750
Government Bonds, Bps 0 75 85 90 100 125 135 150 175 200 325 400 525 600 750 850 900
Source: San José State University Dpt of economics, USA, Based upon information from Moody's and Bondonline.com

5761P25/FICHT-9661890-v2 6-17
As a consequence, we can conclude that the advantage of the avoided
CO2 costs leaves a sufficient margin for increasing the rate of return
and provide a significant competitive advantage for envisaged power
plant projects in adjacent EU countries. It is to be noted, however, that
in order to retain a competitive advantage the investor can draw down
only a part of this margin that is within his own judgment.
6.2.2 Influence of transmission costs on the viability of the investment
The cost for transport of the generated power into the EU’s transmission
system are calculated using the decision making model. This transmission
cost will be especially high for power plants located in regions with
transmission grids that are not synchronized with the grid of the
neighbouring EU country and that have thus to install costly converter
stations. In any case, feeding power into the EU grid will have cost
implications on top of the pure generation cost.
In section 4.2.6.2 the required technical infrastructure and typical capital
expenditures for such transport systems are described. In the following
Table 78 we roughly calculate and compare the advantage from avoided
CO2 cost versus transport cost for the power plant types considered in the
study in order to determine the actual advantages after transmission cost.
In the table, the calculation is conducted for a typical case of transmission
via an HVDC system as an example under the following constraints:
CAPEX for an 800 MW HVDC transmission system including the two
converter stations and a transmission line of 50 km between the power
plant and the EU 380 kV grid €508m
lifetime 35 years, discount rate on real terms 6%/a
system losses 2%/a
Based on these assumptions, the following specific capacity cost and
electricity cost are calculated:
capacity cost 53 €/kWa referred to transmitted power in kW
electricity cost 0.80 €/MWh referred to the transmitted energy in MWh
Example 1: Transmission cost for base load of 800 MW 6,000 GWh/a:
C= 53 x 800,000 +0.8 x 6,000,000 = 47,200,000 €/a
Specific cost: 47,200,000 /6,0000,000 = 7.87 €/ MWh
Example 2: Transmission cost for peak load of 150 MW 225 GWh/a:
C= 53 x 150,000 +0.8 x 225,000 = 8,130,000 €/a
Specific cost: 8,130,000 /225,000 = 36.13 €/ MWh
The results for the three scenarios are depicted in Table 78 and visualized in
Figure 91. The outcome shows the remaining benefit from the avoided CO2
cost after deduction of the transmission cost. Of course, the technical

5761P25/FICHT-9661890-v2 6-18
feasibility and cost implications must be determined for each project
separately.
Table 78: Power transmission cost vs. avoided CO2 cost
Figure 91: Benefit of avoided CO2 cost minus transmission cost
From the outcome of the calculations and the results depicted in the
table and figure above, it is evident that only coal-fired baseload
power plants with high CO2 emissions prove to have a significant
advantage from the avoided CO2 costs that by far outweighs
transmission cost. In contrast, the benefit of even baseload gas-fired
CCGT plants with lower CO2 emissions appear to be moderate. The
transmission cost for intermediate and peak load power cannot be
compensated by the avoided CO2 costs for the illustrated case.
Lignite
base
Hard
Coal
base
CCGT
base
CCGT
in'diat-
SCGT
peak
7,500 h/a 7,500 h/a 7,500 h/a 4,500 h/a 1,500 h/a
Basic constraints tCo2 / MWhe 0.91 0.74 0.36 0.36 0.59
Annual CO2 Emissions ktCo2 / a 5,466 4,459 2,163 1,298 134
Transmission cost mlin € / a 47.48 47.48 47.48 45.56 8.18 Scenario A
Levelized spec. CO2 cost € / t 27.47 27.47 23.61 23.61 23.61
Avoided annual CO2 cost mlin € / a 150.17 122.48 51.06 30.64 3.15
Benefit CO2 cost - transmissions cost mlin € / a 102.68 75.00 3.58 (14.93) (5.03)
Scenario B
Levelized spec. CO2 cost € / t 38.56 38.56 32.15 32.15 32.15
Avoided annual CO2 cost mlin € / a 210.78 171.92 69.52 41.71 4.30
Benefit CO2 cost - transmissions cost mlin € / a 163.30 124.44 22.04 (3.85) (3.89)
Scenario C
Levelized spec. CO2 cost € / t 44.10 44.10 35.56 35.56 35.56
Avoided annual CO2 cost mlin € / a 241.07 196.63 76.91 46.14 4.75
Benefit CO2 cost - transmissions cost mlin € / a 193.58 149.14 29.42 0.58 (3.43)
Item Unit
-50.0
0.0
50.0
100.0
150.0
200.0
250.0
20 25 30 35 40 45 50
CO
2b
en
efit
min
us
tran
smis
sio
n c
ost
mln
/a
CO2 price € /t
Lignite base Hard coal base CCGT base CCGT in'te SCGT peak

5761P25/FICHT-9661890-v2 6-19
The calculations are for grids that are not synchronized with EU grids
and that thus require an extensive HVDC link (subsea cable or B2B) to
be built. The impact of the transmission costs may be less for power plant
sites in areas with grids synchronized with the EU grids that can employ
less expensive HVAC technology; nevertheless, the general trend of this
outcome will not be reversed.
A predominance of transmission costs over CO2 costs is also effective
for renewable energy projects, for two reasons:
1. There is no advantage for renewable power from avoided CO2
costs as is the case for fossil power.
2. Due to their low capacity factor (full load operating hours) the
specific transmission cost will be high for plants outside the EU if
such cost are to be charged.
6.3 Prospects for Investments outside the EU
Assessments and evaluations of investments for power plant projects are
prepared using the developed model pair-wise for specific countries in- and
outside the EU. However, in these calculations there are many variables
dependent on the countries and some important aspects may not appear
sufficiently clearly.
So before starting calculation and evaluation of the results for power plant
investment in specific countries, some discussions of important aspects in
parametric form which are applicable independent of the specific country
are presented and discussed in this section. The calculations are conducted
with a simplified model to determine the electricity generation cost.
6.3.1 Competitive advantage provided by avoided carbon cost
The main incentive for investing in power plants outside the EU is provided
by the avoided CO2 cost. The magnitude of this advantage is shown in the
following Table 79, Table 80 and Table 81 for the three scenarios.
The second block of the tables show the electricity generation cost including
and excluding CO2 cost. As becomes evident for all three scenarios, the
difference is quite high for coal-fired power plants while it is moderate for
gas-fired CCGT power plants in base load mode. For peak load plants, the
advantage is marginal only. CCGTs operated in intermediate load have still
some advantage but not to the same extent as coal-fired power plants.
In the third block of the tables, also the maximum discount rate (based on
WACC) is shown for which the electricity generation cost excluding CO2
cost would become equal to that including CO2 cost. This value is termed
‘break even WACC’, and ‘break even discount rate’ in the further context of

5761P25/FICHT-9661890-v2 6-20
this study. In all three scenarios, these break-even discount rates are quite
high. In this context it is worth noting that for an investor the return on
equity (RoE) is most important. With the given shares on assets that are at
the basis of the calculation of the WACC, the RoE is roughly twice as high
as the discount rate (see Figure 92).
However, in order to have a competitive advantage the investor will draw
down only a part of this margin so that the electricity generation cost will be
lower compared to those of the same type of power plant inside the EU.
Table 79: Influence of CO2 cost on levelized electricity cost, Scenario A
Table 80: Influence of CO2 cost on levelized electricity cost, Scenario B
Table 81: Influence of CO2 cost on levelized electricity cost, Scenario C
Scenario A UnitLignite
base
Hard coal
base
CCGT
base
CCGT
int'ate
SCGT
peak
Fuel cost €/MWht 7.19 15.32 37.20 37.78 41.54
Fuel cost Mio € / a 124.7 161.8 196.2 119.5 22.7
CO2 cost € / t 27.47 27.47 23.61 23.61 23.61
Discount rat, in nominal terms (WACCn) - 7.5% 7.5% 7.5% 7.5% 7.5%
CO2 cost Mio € / a 189.3 99.2 25.1 15.1 2.6
Levelized electricity cost, including CO2 cost €/MWhe 63.09 74.53 86.06 89.60 170.96
Levelized electricity cost, excluding CO2 cost €/MWhe 38.82 54.12 77.55 81.09 156.94
CO2 cost Mio € / a 0.00 0.00 0.00 0.00 0.00
Discount rate, in nominal terms (WACCn) - 18.6% 18.0% 20.2% 15.4% 15.3%
Levelized electricity cost, excluding CO2 cost €/MWhe 63.09 74.53 86.06 89.60 170.96
Scenario B UnitLignite
base
Hard coal
base
CCGT
base
CCGT
int'ate
SCGT
peak
Fuel cost €/MWht 6.84 14.56 35.75 36.33 40.09
Fuel cost Mio € / a 118.5 153.8 188.5 114.9 21.9
CO2 cost € / t 38.56 38.56 32.15 32.15 32.15
Discount rate, in nominal terms 7.5% 7.5% 7.5% 7.5% 7.5%
CO2 cost Mio € / a 265.8 139.3 34.2 20.5 3.6
Levelized electricity cost, including CO2 cost €/MWhe 72.10 81.12 86.55 90.09 171.76
Levelized electricity cost, excluding CO2 cost €/MWhe 38.03 52.47 74.96 78.50 152.67
CO2 cost Mio € / a 0.00 0.00 0.00 0.00 0.00
Discount rate, in nominal terms - 23% 22% 24% 18% 14%
Levelized electricity cost, excluding CO2 cost €/MWhe 72.10 81.12 86.55 90.09 171.76
Scenario C UnitLignite
base
Hard coal
base
CCGT
base
CCGT
int'ate
SCGT
peak
Fuel cost €/MWht 5.97 12.71 33.41 33.99 37.74
Fuel cost Mio € / a 103.5 134.2 176.1 107.5 20.7
CO2 cost € / t 44.10 44.10 35.56 35.56 35.56
Discount rat, in nominal terms 7.5% 7.5% 7.5% 7.5% 7.5%
CO2 cost Mio € / a 303.9 159.3 37.9 22.7 3.9
Levelized electricity cost, including CO2 cost €/MWhe 75.07 81.22 83.59 87.13 166.89
Levelized electricity cost, excluding CO2 cost €/MWhe 36.10 48.45 70.78 74.32 145.77
CO2 cost Mio € / a 0.00 0.00 0.00 0.00 0.00
Discount rate, in nominal terms - 25% 24% 26% 19% 15%
Levelized electricity cost, excluding CO2 cost €/MWhe 75.07 81.22 83.59 87.13 166.89

5761P25/FICHT-9661890-v2 6-21
Figure 92: Rate of return on equity vs. discount rate
6.3.2 Competitive advantage provided by marginal cost
Investors of power plants will first try to sell the bulk of their electricity
production by power purchase agreements with TSO, traders and large
consumers. The remaining production will be offered on the power
exchange. Offers on the power exchange are usually made on the basis of
the marginal cost plus a moderate portion of the fixed productions cost so
that the offer will be lower than the market clearing point and will be
accepted. CO2 costs are marginal cost. As they are avoided they provide a
significant additional advantage to power plants outside the EU.
As Table 82, Table 83 and Table 84 reveal, again this advantage is
significant for coal-fired power plants in all three scenarios, while it
decreases for gas-fired power plants. This is generally a disadvantage of
gas-fired power plants, with or without CO2 costs. The reason is that fuel
costs are marginal costs as well and, due to the higher price for gas in most
cases, marginal costs are high.
Table 82: Share of marginal costs in total electricity generation cost, Scenario A
5%
10%
15%
20%
25%
30%
35%
7% 8% 9% 10% 11% 11% 12% 13% 14% 15% 15% 16% 17%
Rat
e o
f re
turn
on
eq
uit
y af
ter
tax
WACC before corporate tax
Item Equity Loan
Asset shares 30% 70%
Rates in nominal terms after tax 11.0 %/a 5.0 %/a
WACC after tax 6.8 %/a
Corporate tax, nominal 3.7 %/a n.a.
Cost capital, before tax 14.7 %/a 5.0 %/a
WACC n in nominal terms, before tax 7.87 %/a
WACC: Weight Average Cost of Capital (=discount rate)
Scenario A UnitLignite
base
Hard coal
base
CCGT
base
CCGT
int'ate
SCGT
peak
Electricity generation cost, including CO2 cost
Total €/MWhe 63.09 74.53 86.06 89.60 170.96
Only marginal cost €/MWhe 41.91 55.00 78.39 79.42 139.63
Electricity generation cost, excluding CO2 cost
Total €/MWhe 38.82 54.12 77.55 81.09 156.94
Only marginal cost €/MWhe 17.64 34.58 69.88 70.91 125.61
Note: Fuel prices as given for this scenario Note: Calculated with the same discount rate

5761P25/FICHT-9661890-v2 6-22
Table 83: Share of marginal costs in total electricity generation cost, Scenario b
Table 84: Share of marginal costs in total electricity generation cost, Scenario C
6.4 Presentation and discussion of the country specific results
The power plant investment options in non-EU countries that qualified
under the decision tree procedures (see section 6.1) for potential electricity
import into the EU are now analysed to establish their competitiveness vis-
à-vis alternative power plant investments in the neighbouring EU country.
Comparisons are made on the basis of levelized electricity costs (LEC) and
are performed separately for each market segment, i.e. for base load,
intermediate load and peak load power plants. The decision making model
as explained in chapter 4 is applied for the LEC calculation. An example of
such a calculation for the country-pair Italy-Tunisia is shown in Table 85.
For the remaining country-pairs, calculations are shown in Annex V.
Calculations for non-EU countries are done in a first run without adding any
country-specific risk premiums. Under such conditions, the levelized CO2
costs (LCO2) for ETS certificates of a new EU power plant mean a
competitive advantage for the power plant in the non-EU country in terms
of a lower LEC. On the other hand, in the non-EU country levelized
transmission costs (LTC) accrue for electricity export to the EU. The extent
to which LCO2 outweighs LTC usually determines the competitiveness
between EU and non-EU country investment, provided that other factors
impacting the LEC, such as fuel costs, tax rates, etc. don’t differ too much
between the two countries.
In the example below (Table 85), for instance in Scenario A in the base load
case, 20.2 €/MWhe LCO2 for a hard coal power plant in Italy stands vis-á-
vis only 9.4 €/MWhe LTC for a hard coal power plant in Tunisia.
Accordingly, the LEC is lower in Tunisia than in Italy in this case.
The model selects the most competitive power plant with the least LEC that
is outside the EU but it is not necessarily of the same type as the one inside
the EU. But for the case of Italy and Tunisia it is always hard coal power
plant in base load for both countries.
Scenario B UnitLignite
base
Hard coal
base
CCGT
base
CCGT
int'ate
SCGT
peak
Electricity generation cost, including CO2 cost
Total €/MWhe 72.10 81.12 86.55 90.09 171.76
Only marginal cost €/MWhe 50.92 61.59 78.88 79.91 140.43
Electricity generation cost, excluding CO2 cost
Total €/MWhe 38.03 52.47 74.96 78.50 152.67
Only marginal cost €/MWhe 16.85 32.94 67.29 68.32 121.34
Note: Fuel prices as given for this scenario Note: Calculated with the same discount rate
5761P25/FICHT-9661890-v2 6-23
In such a case, though, the competitive advantage of the non-EU project
holds only under the assumption that the investor will be satisfied with a
WACC of 5.6% in real terms. As it is calculated without any country-
specific risk premium, the WACC of Tunisia is then almost identical to that
of Italy (5.5%), the difference being only due to the differing corporate tax
rates.
But in reality the investor would like to be compensated for higher
investment risks outside the EU through higher returns. Consequently, the
competitiveness of the non-EU power plant depends finally on a low enough
benchmark value for the WACC that is applied for appraisal of the non-EU
investment.
The WACC that the non-EU investment can just afford in order to remain
marginally competitive with the respective EU power plant is shown in the
column “non-EU breakeven”. It is the result of a calculation in which the
non-EU WACC is set accordingly in order to obtain the same LEC for the
non-EU power plant as for the EU power plant. In base load in Scenario A
this is the case at a WACC of 12.0% inflation-adjusted (see Table 85). An
investment consortium being satisfied with an ROI not higher than 12% will
be able to compete in base load with the Italian power plant investment.
However, the investment consortium would with such a WACC benchmark
go for a less capital-intensive CCGT power plant in Tunisia instead of going
for the hard coal power plant, which would no longer be the best choice for
base load under such conditions.
For a power plant investment in Tunisia planned to supply base load in
Italy, the following situation holds in Scenario A:
without any country-specific risk premium (WACC = 5.6%) a hard coal
power plant would be the most competitive investment
at a ‘break even WACC’ of 12.0%, a CCGT would be the most
competitive investment with just the same LEC as the Italian power plant
alternative.
In actual fact, the non-EU investment would opt for a WACC (and for the
most competitive specific type of power plant at this WACC) that is above
the minimum WACC (no country-specific risk) but close below the
breakeven WACC in order to achieve a strategic advantage of lower LEC
compared to the EU power plant.
In reality, for the non-EU investment, a WACC value (and the most
competitive specific type of power plant at this WACC) would have to
be used in investment calculations, that is above the minimum WACC
in order to include a country-specific risk premium, but that is close
below the breakeven WACC in order to achieve a strategic advantage
of still lower LEC compared to the EU power plant. The investor has
to plan for a WACC somewhere within this range, otherwise the non-
EU investment would not be feasible.

5761P25/FICHT-9661890-v2 6-24
The competitiveness of the non-EU power plant stems in the example above
from the fact that the LCO2 accruing in the EU country exceeds the LTC
accruing in the non-EU country.
The dominance of LCO2 over LTC, though, diminishes when the case is
changed from base load to intermediate load and to peak load. This is for
two reasons: First of all, only CO2 saving power plant technologies with low
LCO2 are applied in peak load (GT) and particularly in intermediate load
(CCGT). This becomes obvious from Annex III.
Secondly, the CAPEX for the transmission investment levelizes over much
fewer full load hours in intermediate and peak load than in base load. That’s
why LTCs generally increase for intermediate load power plants and
particularly for peak load power plants (cf. also section 6.4.1). This is also
apparent from Table 85. As a result of both effects – reduced LCO2 and
increased LTC – Tunisian peak load GTs cannot compete with Italian ones
in all three scenarios, even if no country-specific risk premium is factored
in. Accordingly, no WACC for breakeven with LEC can be found.
A similar trend may also be noted for the other analysed country pairs
(cf. Annex V): New peak load power plants and, in part, also new
intermediate load power plants in the non-EU countries dedicated for
electricity export to the EU have problems competing with the respective
investment alternatives within the EU. The overall picture for all cases and
all country-pairs is analysed in section 6.4.2 and compared between the
scenarios. Finally, in section 6.4.3 a list of the most promising investment
opportunities is presented. But prior to this, underlying country-specific
assumptions in the model are introduced in section 6.4.1.

5761P25/FICHT-9661890-v2 6-25
Table 85: Main results from the decision making model for competing power plant investments between Italy and Tunisia
Base load Intermediate load Peak Load
Scenario A EU Non-EU Non-EU breakeven EU Non-EU Non-EU breakeven EU Non-EU Non-EU breakeven
Italy Tunesia Tunesia Italy Tunesia Tunesia Italy Tunesia Tunesia
Hard Coal Hard Coal CCGT CCGT CCGT CCGT GT GT GT
USC-PC USC-PC -
Item base load base load base load intermediate load intermediate load intermediate load peak load peak load peak load
Levelized composite cost € / MWhe 82.1 69.3 82.1 100.8 86.1 100.8 179.3 189.9 n.a.
Levelized marginal cost € / MWhe 55.3 34.6 50.5 85.5 53.9 51.9 134.5 88.5 n.a.
Levelized CO2 certificate cost € / MWhe 20.2 0.0 0.0 8.5 0.0 0.0 12.4 0.0 n.a.
Levelized transmission cost € / MWhe n.a. 9.4 18.2 n.a. 17.9 28.1 n.a. 64.6 n.a.
WACC (discount rate, real) % 5.5% 5.6% 12.0% 5.5% 5.6% 10.9% 5.5% 5.6% n.a.
Scenario B EU Non-EU Non-EU breakeven EU Non-EU Non-EU breakeven EU Non-EU Non-EU breakeven
Italy Tunesia Tunesia Italy Tunesia Tunesia Italy Tunesia Tunesia
Hard Coal Hard Coal CCGT CCGT CCGT CCGT GT GT GT
USC-PC USC-PC -
Item base load base load base load intermediate load intermediate load intermediate load peak load peak load peak load
Levelized composite cost € / MWhe 88.6 67.8 88.6 101.1 84.2 101.1 179.8 187.2 n.a.
Levelized marginal cost € / MWhe 61.8 33.0 48.7 85.9 52.1 50.6 135.0 85.8 n.a.
Levelized CO2 certificate cost € / MWhe 28.4 0.0 0.0 11.6 0.0 0.0 16.9 0.0 n.a.
Levelized transmission cost € / MWhe n.a. 9.4 23.3 n.a. 17.9 29.1 n.a. 64.6 n.a.
WACC (discount rate, real) % 5.5% 5.6% 15.9% 5.5% 5.6% 11.4% 5.5% 5.6% n.a.
Scenario C EU Non-EU Non-EU breakeven EU Non-EU Non-EU breakeven EU Non-EU Non-EU breakeven
Italy Tunesia Tunesia Italy Tunesia Tunesia Italy Tunesia Tunesia
Hard Coal Hard Coal CCGT CCGT CCGT CCGT GT GT GT
USC-PC USC-PC -
Item base load base load base load intermediate load intermediate load intermediate load peak load peak load peak load
Levelized composite cost € / MWhe 88.6 63.8 88.6 97.9 81.2 97.9 175.1 182.8 n.a.
Levelized marginal cost € / MWhe 61.7 29.0 47.4 82.6 49.1 48.8 130.3 81.4 n.a.
Levelized CO2 certificate cost € / MWhe 32.3 0.0 0.0 12.8 0.0 0.0 18.7 0.0 n.a.
Levelized transmission cost € / MWhe n.a. 9.4 24.0 n.a. 17.9 28.2 n.a. 64.6 n.a.
WACC (discount rate, real) % 5.5% 5.6% 16.5% 5.5% 5.6% 11.0% 5.5% 5.6% n.a.
5761P25/FICHT-9661890-v2 6-26
6.4.1 Underlying country-specific assumptions
After having explained by way of example the outcomes of the model, now
the assumptions underlying the model for the non-EU countries are
introduced in this section. These assumptions concern costs for cross-border
transmission into the EU, fuel prices in the non-EU countries as well as
further country specific model inputs, such as taxes and labour costs.
In our decision making model, transmission costs are included via the
specific CAPEX for each transmission option. They thus act as fixed costs
within the model. That means they are costs that arise for the availability of
the transmission capacity, independent of the power plant’s actual
generation. The lower the annual full load hours of the power plant, the
higher the specific/levelized transmission cost per generated kWh. This
means increased levelized transmission cost for intermediate and
particularly for peak load power plants compared to base load power plants.
Furthermore, the CAPEX considered for transmission depends on the power
plant’s capacity in the model. Accordingly, a 150 MW GT is not burdened
with the whole CAPEX of a 1000 MW transmission project, but only with
15% of it to match the transmission capacity part to be reserved for the GT.
In general, it must be emphasized, though, that the figures for transmission
CAPEX factored into our decision making model have a relatively low
accuracy compared with the electricity generation cost free power plant (i.e.
up to the plant boundary). This is also because there is insufficient
information on transmission distances and capacities, since costs for
transmitting power from potential power plant sites outside the EU and
transmission CAPEX figures can vary widely from project to project.
Additionally, CAPEX for converter stations has experienced an increasing
trend recently, among other things because of a greater number of ongoing
HVDC projects worldwide. Our estimates of transmission CAPEX are
based on specific CAPEX values as given in section 4.2.6.2 and result in
specific CAPEX values (per GW transmission capacity) for country pairs as
shown in Table 86.
For non-EU power plants that would like to export electricity to the EU via
existing interconnections, figures for transmission fees are generally not
available, so an appraisal has been made on the basis of the current
replacement value of the existing line. Since the analysed transmission
options that are based on existing lines are all HVAC interconnections, the
assigned CAPEX values for replacement (cf. Table 86) and thus the
resulting levelized transmission costs are relatively low.

5761P25/FICHT-9661890-v2 6-27
Table 86: Transmission options with associated specific transmission CAPEX and
fuel prices in non-EU countries in 2010
From Table 88 to Table 96 below, it becomes evident that LTC values for
base load options with existing transmission lines are in the range of about
0.5 €/MWhe. For intermediate load and particularly for peak load these
increase up to about 3.5 €/MWhe. Thus, for existing transmission options,
LTC does not have a serious negative impact on the competitiveness of the
non-EU power plant, at least not in base load. The same holds true for the
new connection to be built between RO and RS, where also low LTCs
(because they are HVAC connections) hardly affect competitiveness.
For the other five non-EU investment options that depend on the installation
of new expensive HVDC subsea cables, the incurred LTCs based on our
CAPEX appraisal lie roughly within the following ranges:
approx. 8 - 9 €/MWh for base load
approx. 16 - 18 €/MWh for intermediate load
approx. 58 - 66 €/MWh for peak load
With these values, LTCs can considerably lessen the competitiveness of
non-EU projects that depend on new transmission lines, particularly for
intermediate load and definitely for peak load.
Whereas all LTC values depend on base/intermediate/peak load, LCO2s that
arise on the part of the competing power plant within the EU depend on the
scenario considered, with LCO2s generally increasing from Scenario A to C.
Furthermore LCO2s can differ considerably between the types of base load
power plants (cf. Annex III).
Table 86 also presents fossil fuel prices in non-EU countries in 2010. Those
are derived from the same data sources as used for data gathering for EU
countries (see section 5.1.2), amended with further specific information
from sources for local fuel price levels. How fuel prices change up to 2050
is likewise based on the same long-term price development that underlies
the EU fuel price scenarios (see also section 5.1.2).
Other country-specific model inputs for corporate taxes and labour costs are
shown in Table 87. Although labour costs start at relatively low levels, a
existing / EU non-EU sync./async. type of types of CAPEX fossil fuel prices in 2010 [€/MWht]
new country country connection power plant [Mio €/GW] lignite hard coal natural gas
existing Bulgaria Turkey sync. HVAC all 43 6 11.81 30.31
existing Greece Turkey sync. HVAC all 65 6 11.81 30.31
existing Hungary Serbia sync. HVAC GT 65 - - 29.75
new Italy Tunisia sync. HVDC (sea) all 1070 - 11.71 22.64
new Italy Montenegro sync. HVDC (sea) all 1115 10 11.71 -
new Italy Algeria sync. HVDC (sea) all 998 - 11.71 22.64
new Italy Albania sync. HVDC (sea) all 1034 - 11.71 -
new Romania Turkey sync. HVDC (sea) all 1160 - 11.81 30.31
new Romania Serbia sync. HVAC all 65 6 11.71 30.71

5761P25/FICHT-9661890-v2 6-28
gradual rise up to 2050 to EU labour cost levels is assumed, which results in
the relatively high escalation rates applied in the model for these costs.
Table 87: Country-specific model inputs for non-EU countries
6.4.2 Scenario comparison
In the following, all investment prospects as calculated with the decision
making model are compared between the three scenarios, as shown in Table
88 to Table 96. The nine tables break down the results by the three scenarios
A, B and C as well as by the cases of base load, intermediate load and peak
load. Listed for each case in the tables are the nine analysed country
EU/non-EU pairs and the following belong outcomes,
based on LEC, the least cost power plant types – for base load there is a
choice between three such types to be calculated by the model
their LEC as well as LCO2 (EU) and LTC (non-EU)
the discount rate, i.e. WACC, at which break-even of non-EU’s LEC
with EU’s is attained, together with the respective power plant type with
for this break-even
whether the transmission option is based on an existing (3x) or a new
(6x) transmission link.
Corporate Labour costs Escalation of labour costs Escalated to Commissioning Year
tax construction operating staff construction operating staff
Non EU %/a €/pers./a €/pers./a %/a %/a
country 2010 2010 real real
AL 16% 3,000 12,444 7.8% 5.6%
DZ 25% 6,266 10,965 5.8% 5.9%
ME 9% 11,526 20,170 4.2% 4.3%
RS 10% 11,526 20,170 4.2% 4.3%
TN 30% 6,266 10,965 5.8% 5.9%
TR 20% 20,239 35,418 2.7% 2.8%

5761P25/FICHT-9661890-v2 6-29
Table 88: Competing base load power plants, Scenario A
Table 89: Competing intermediate load power plants, Scenario A
Table 90: Competing of peak load power plants, Scenario A
Scenario A
Base Load
linkage: EU non-EU break even
existing / country power LEC LCO2 country power LEC LTC power WACC
new plant [€/MWhe] [€/MWhe] plant [€/MWhe] [€/MWhe] plant real [%]
existing BG Lignite 71.0 26.2 TR Lignite 47.4 0.4 Lignite 13.2%
existing GR Lignite 73.0 25.7 TR Lignite 47.1 0.5 Lignite 13.8%
existing HU n.a. n.a. n.a. RS n.a. n.a. n.a. n.a. n.a.
new IT Hard Coal 82.1 20.2 TN Hard Coal 69.3 9.4 CCGT 12.0%
new IT Hard Coal 82.1 20.2 ME Hard Coal 66.8 8.6 Hard Coal 9.1%
new IT Hard Coal 82.1 20.2 DZ Hard Coal 67.7 8.4 CCGT 12.8%
new IT Hard Coal 82.1 20.2 AL Hard Coal 66.6 8.3 Hard Coal 9.5%
new RO Lignite 71.4 25.9 TR Hard Coal 69.9 9.5 Hard Coal 5.5%
new RO Lignite 71.4 25.9 RS Lignite 45.7 0.5 Lignite 13.5%
Scenario A
Intermediate Load
linkage: EU non-EU break even
existing / country power LEC LCO2 country power LEC LTC power WACC
new plant [€/MWhe] [€/MWhe] plant [€/MWhe] [€/MWhe] plant real [%]
existing BG CCGT 83.1 8.7 TR CCGT 86.5 0.7 n.a. n.a.
existing GR CCGT 94.9 8.6 TR CCGT 86.6 1.0 CCGT 13.8%
existing HU n.a. n.a. n.a. RS n.a. n.a. n.a. n.a. n.a.
new IT CCGT 100.8 8.5 TN CCGT 86.1 17.9 CCGT 10.9%
new IT CCGT 100.8 8.5 ME n.a. n.a. n.a. n.a. n.a.
new IT CCGT 100.8 8.5 DZ CCGT 84.1 16.2 CCGT 11.6%
new IT CCGT 100.8 8.5 AL n.a. n.a. n.a. n.a. n.a.
new RO CCGT 83.3 8.7 TR CCGT 104.2 18.4 n.a. n.a.
new RO CCGT 83.3 8.7 RS CCGT 84.8 1.0 n.a. n.a.
Scenario A
Peak Load
linkage: EU non-EU break even
existing / country power LEC LCO2 country power LEC LTC power WACC
new plant [€/MWhe] [€/MWhe] plant [€/MWhe] [€/MWhe] plant real [%]
existing BG GT 147.0 12.7 TR GT 158.7 2.5 n.a. n.a.
existing GR GT 170.7 12.6 TR GT 156.7 3.7 GT 9.8%
existing HU GT 168.0 12.6 RS GT 152.4 3.5 GT 10.1%
new IT GT 179.3 12.4 TN GT 189.9 64.6 n.a. n.a.
new IT GT 179.3 12.4 ME n.a. n.a. n.a. n.a. n.a.
new IT GT 179.3 12.4 DZ GT 182.8 58.3 n.a. n.a.
new IT GT 179.3 12.4 AL n.a. n.a. n.a. n.a. n.a.
new RO GT 147.8 12.6 TR GT 222.0 66.2 n.a. n.a.
new RO GT 147.8 12.6 RS GT 153.1 3.5 n.a. n.a.

5761P25/FICHT-9661890-v2 6-30
Table 91: Competing of base load power plants, Scenario B
Table 92: Competing of intermediate load power plants, Scenario B
Table 93: Competing of peak load power plants, Scenario B
Scenario B
Base Load
linkage: EU non-EU break even
existing / country power LEC LCO2 country power LEC LTC power WACC
new plant [€/MWhe] [€/MWhe] plant [€/MWhe] [€/MWhe] plant real [%]
existing BG CCGT 77.7 11.9 TR Lignite 46.6 0.4 Lignite 15.4%
existing GR Lignite 82.5 36.1 TR Lignite 46.3 0.5 Lignite 16.8%
existing HU n.a. n.a. n.a. RS n.a. n.a. n.a. n.a. n.a.
new IT Hard Coal 88.6 28.4 TN Hard Coal 67.8 9.4 CCGT 15.9%
new IT Hard Coal 88.6 28.4 ME Hard Coal 65.0 8.6 Hard Coal 11.0%
new IT Hard Coal 88.6 28.4 DZ Hard Coal 66.1 8.4 CCGT 16.7%
new IT Hard Coal 88.6 28.4 AL Hard Coal 64.9 8.3 Hard Coal 11.5%
new RO CCGT 77.7 11.8 TR Hard Coal 68.3 9.5 Hard Coal 7.7%
new RO CCGT 77.7 11.8 RS Lignite 44.9 0.5 Lignite 15.6%
Scenario B
Intermediate Load
linkage: EU non-EU break even
existing / country power LEC LCO2 country power LEC LTC power WACC
new plant [€/MWhe] [€/MWhe] plant [€/MWhe] [€/MWhe] plant real [%]
existing BG CCGT 84.0 11.9 TR CCGT 83.9 0.7 CCGT 5.2%
existing GR CCGT 95.4 11.7 TR CCGT 84.0 1.0 CCGT 15.1%
existing HU n.a. n.a. n.a. RS n.a. n.a. n.a. n.a. n.a.
new IT CCGT 101.1 11.6 TN CCGT 84.2 17.9 CCGT 11.4%
new IT CCGT 101.1 11.6 ME n.a. n.a. n.a. n.a. n.a.
new IT CCGT 101.1 11.6 DZ CCGT 82.2 16.2 CCGT 12.1%
new IT CCGT 101.1 11.6 AL n.a. n.a. n.a. n.a. n.a.
new RO CCGT 84.2 11.8 TR CCGT 101.6 18.4 n.a. n.a.
new RO CCGT 84.2 11.8 RS CCGT 82.2 1.0 CCGT 6.9%
Scenario B
Peak Load
linkage: EU non-EU break even
existing / country power LEC LCO2 country power LEC LTC power WACC
new plant [€/MWhe] [€/MWhe] plant [€/MWhe] [€/MWhe] plant real [%]
existing BG GT 148.2 17.3 TR GT 154.9 2.5 n.a. n.a.
existing GR GT 171.4 17.1 TR GT 152.9 3.7 GT 10.8%
existing HU GT 168.6 17.1 RS GT 148.6 3.5 GT 11.0%
new IT GT 179.8 16.9 TN GT 187.2 64.6 n.a. n.a.
new IT GT 179.8 16.9 ME n.a. n.a. n.a. n.a. n.a.
new IT GT 179.8 16.9 DZ GT 180.0 58.3 n.a. n.a.
new IT GT 179.8 16.9 AL n.a. n.a. n.a. n.a. n.a.
new RO GT 149.1 17.2 TR GT 218.2 66.2 n.a. n.a.
new RO GT 149.1 17.2 RS GT 149.2 3.5 n.a. n.a.

5761P25/FICHT-9661890-v2 6-31
Table 94: Competing of base load power plants, Scenario C
Table 95: Competing of intermediate load power plants, Scenario C
Table 96: Competing of peak load power plants, Scenario C
Scenario C
Base Load
linkage: EU non-EU break even
existing / country power LEC LCO2 country power LEC LTC power WACC
new plant [€/MWhe] [€/MWhe] plant [€/MWhe] [€/MWhe] plant real [%]
existing BG CCGT 75.3 13.2 TR Lignite 44.6 0.4 Lignite 15.1%
existing GR CCGT 85.5 13.0 TR Lignite 44.3 0.5 CCGT 20.3%
existing HU n.a. n.a. n.a. RS n.a. n.a. n.a. n.a. n.a.
new IT Hard Coal 88.6 32.3 TN Hard Coal 63.8 9.4 CCGT 16.5%
new IT Hard Coal 88.6 32.3 ME Hard Coal 60.9 8.6 Hard Coal 11.8%
new IT Hard Coal 88.6 32.3 DZ Hard Coal 62.0 8.4 CCGT 17.2%
new IT Hard Coal 88.6 32.3 AL Hard Coal 60.8 8.3 Hard Coal 12.3%
new RO CCGT 75.4 13.1 TR Hard Coal 64.2 9.5 Hard Coal 8.1%
new RO CCGT 75.4 13.1 RS Lignite 42.8 0.5 Lignite 15.3%
Scenario C
Intermediate Load
linkage: EU non-EU break even
existing / country power LEC LCO2 country power LEC LTC power WACC Δ LEC
new plant [€/MWhe] [€/MWhe] plant [€/MWhe] [€/MWhe] plant real [%] [€/MWhe]
existing BG CCGT 81.6 13.2 TR CCGT 79.7 0.7 CCGT 6.7% 1.9
existing GR CCGT 92.4 13.0 TR CCGT 79.7 1.0 CCGT 14.3% 12.7
existing HU n.a. n.a. n.a. RS n.a. n.a. n.a. n.a. n.a. n.a.
new IT CCGT 97.9 12.8 TN CCGT 81.2 17.9 CCGT 11.0% 16.7
new IT CCGT 97.9 12.8 ME n.a. n.a. n.a. n.a. n.a. n.a.
new IT CCGT 97.9 12.8 DZ CCGT 79.1 16.2 CCGT 11.6% 18.8
new IT CCGT 97.9 12.8 AL n.a. n.a. n.a. n.a. n.a. n.a.
new RO CCGT 81.8 13.1 TR CCGT 97.4 18.4 n.a. n.a. -15.6
new RO CCGT 81.8 13.1 RS CCGT 77.9 1.0 CCGT 7.8% 3.9
Scenario C
Peak Load
linkage: EU non-EU break even
existing / country power LEC LCO2 country power LEC LTC power WACC
new plant [€/MWhe] [€/MWhe] plant [€/MWhe] [€/MWhe] plant real [%]
existing BG GT 144.7 19.2 TR GT 148.7 2.5 n.a. n.a.
existing GR GT 167.0 18.9 TR GT 146.7 3.7 GT 10.6%
existing HU GT 164.0 18.9 RS GT 142.3 3.5 GT 10.8%
new IT GT 175.1 18.7 TN GT 182.8 64.6 n.a. n.a.
new IT GT 175.1 18.7 ME n.a. n.a. n.a. n.a. n.a.
new IT GT 175.1 18.7 DZ GT 175.5 58.3 n.a. n.a.
new IT GT 175.1 18.7 AL n.a. n.a. n.a. n.a. n.a.
new RO GT 145.7 19.0 TR GT 212.1 66.2 n.a. n.a.
new RO GT 145.7 19.0 RS GT 143.0 3.5 GT 5.5%

5761P25/FICHT-9661890-v2 6-32
Base load
Apart from restrictions on depending on whether there is sufficient
transmission capacity or on fuel availability, three types of power plants are
available in principle in each country for supplying base load: lignite-fired
power plant, hard coal-fired power plant or natural gas-fired CCGT.
Between Serbia and Hungary the available transmission capacity allows
only for the export from a GT. Since also no new transmission line is
planned between these countries, no base load and peak load transfer is
possible for this country pair. The results reveal that without any country-
specific risk premium, all baseload power plants of the non-EU countries
considered would be competitive with their EU counterparts due to the
avoided CO2 cost. However, the model does not always come up with the
same types of power plants outside and inside the EU.
In Scenario A, all preferred power plant options for base load in the EU
countries fire coal. Without any country-specific risk premium, the
associated non-EU alternatives would favour in each case the same types of
power plants as in the EU country, apart from Turkey which would not be
able to use lignite for supplying Romania with power. However, factoring in
a risk premium up to the point where the non-EU LEC attains break-even
with the EU-LEC would provide an incentive in the Maghreb countries to
invest in CCGTs for base load instead, due to the relatively cheap
indigenous natural gas reserves. The consequence would be, though, that
there would no longer be a competitive advantage!
Due to higher ETS prices in Scenario B and particularly in Scenario C,
CCGTs displace lignite power plants as the most competitive baseload
power plant of choice in Romania and Bulgaria, and for Scenario C also in
Greece. This is because there are no carbon costs in the non-EU countries
and thus no carbon cost increase. Instead, fuel prices decreasing from
Scenario A to C are the only drivers in non-EU countries for the shift away
from more capital-intensive coal power plants towards CCGT.
For EU countries, not only fuel prices but also CO2 prices account for the
difference between the scenarios. The competitive advantage of non-EU
investments compared to EU investments thus generally increases with a
change from Scenario A to the decarbonisation scenarios B and C, at least
when coal power plants in the EU countries are the best choice for
comparison. This is reflected in higher break-even WACCs in Scenario B
and particularly in Scenario C. The situation is different with CCGT plants
that, even with the EU-ETS are generally better off in a world with global
climate action (Scenario C) than with fragmented action (Scenario B), due
to lower natural gas prices (cf. section 5.3).
According to the breakeven WACCs, the most promising options regarding
competitiveness are found for Turkey, Serbia and the Maghreb countries,
even though the latter have to bear relatively high LTCs for new
transmission links. Serbia and Turkey however can benefit from lower
LTCs due to existing transmission lines. The option for exporting base load
power from Turkey to Romania, though, would depend on a relatively

5761P25/FICHT-9661890-v2 6-33
costly HVDC subsea cable, which is why this option competes poorly with
the Romanian power plant investment and break-even WACCs of only
between 5.5% (Scenario A) and 8.1% (Scenario C) are achieved.
Intermediate load
Accordingly for intermediate load, when transmission costs have a higher
impact on levelized costs, even without a country risk premium Turkish
power export to Romania is not competitive with the Romanian power
plant, at least not in Scenario A and only weakly in Scenarios B and C. Due
to differing natural gas prices (cf. Annex IV) Turkish export of intermediate
load is competitive only in comparison to Greece, but not (Scenario A) or
not very much (Scenario B and C) in comparison to Bulgaria. Among the
countries with high LTC for new transmission projects only the Maghreb
country projects survive in competition with EU projects. Montenegro and
Albania have no natural gas access and thus neither an intermediate nor a
peak load option.
Peak load
Peak load power plants that depend on new HVDC transmission line
projects have, for LTC levels of roundabout 60 €/MWhe clearly no chance
to compete with EU peak load power plants. In this competition, only
Turkish GTs for export to Greece and Serbian GTs for export to Hungary
could benefit from the carbon costs of the GT power plants in the respective
EU countries, resulting in breakeven WACC levels of around 10%. In
Scenario C, additionally a Serbian GT for peak load supply to Romania via
a new HVAC transmission line attains competitiveness.
6.4.3 List of most promising investment prospects
The following tables show the most promising investment options in non-
EU countries for base load (Table 97), intermediate load (Table 98) and
peak load (Table 99). The most promising options are those with the highest
calculated breakeven WACC as highlighted with the darkest green
backgrounds. The colours of the WACC figures additionally indicate the
type of power plant that would be the best choice in the breakeven case.

5761P25/FICHT-9661890-v2 6-34
Table 97: Base Load: List of investment options and their break even WACCs
The highest breakeven WACCs for base load in the non-EU countries are in
the order of 13.x % in Scenario A, up to almost 17% in Scenario B and
more than 20% in Scenario C (see Table 97). One frontrunner among the
country-pairs is identified:
Turkey - Greece
This option is based on the use of existing transmission lines. If the investor
plans with a discount rate close to the break even WACC, then a lignite-
fired power plant would be the best choice, to be exchanged only in
Scenario C against a CCGT. The use of existing transmission lines without
high transmission CAPEX is a prerequisite for this highlighted investment
option to be so competitive.
A second group of two prospective non-EU investment alternatives is given
in the Maghreb countries for power export to Italy:
Algeria - Italy
Tunisia - Italy
Both Maghreb options benefit from the chance to use relatively cheap
indigenous natural gas resources for CCGT base load power plants. This
advantage allows them to compensate the relatively high transmission costs
due to the subsea cable link investments required for the connection to the
Maghreb countries.
Also, thanks to low transmission costs two further investments promise
almost the same high level of competitiveness, expressed by high break
even WACCs in a range between 13% (Scenario A) and 15% (Scenario C):
Base Load
linkage: EU non-EU Non-EU power plant / break even WACC
existing / country country for scenario
new A B C
existing BG TR Lignite 13.2% Lignite 15.4% Lignite 15.1%
existing GR TR Lignite 13.8% Lignite 16.8% CCGT 20.3%
existing HU RS n.a. n.a. n.a.
new IT TN CCGT 12.0% CCGT 15.9% CCGT 16.5%
new IT ME Hard Coal 9.1% Hard Coal 11.0% Hard Coal 11.8%
new IT DZ CCGT 12.8% CCGT 16.7% CCGT 17.2%
new IT AL Hard Coal 9.5% Hard Coal 11.5% Hard Coal 12.3%
new RO TR Hard Coal 5.5% Hard Coal 7.7% Hard Coal 8.1%
new RO RS Lignite 13.5% Lignite 15.6% Lignite 15.3%

5761P25/FICHT-9661890-v2 6-35
Turkey - Bulgaria
Serbia - Romania
For these two options only lignite comes into consideration in all three
scenarios. Export of base load power from Turkey to Greece instead of to
Bulgaria would, though, be more profitable.
Table 98: Intermediate Load: List of investment options and their break even
WACCs
When looking at investments in intermediate load power plants (cf. Table
98), basically the same investment options remain as highlighted already for
base load power plants. With break even WACCs of up to 15%, the
frontrunner among the intermediate load power plants remains:
Turkey - Greece
With lower break even WACCs also the Maghreb alternatives remain
attractive:
Algeria - Italy
Tunisia - Italy
The options Turkey - Bulgaria and Serbia - Romania clearly lose
attractiveness for intermediate load power plants and would no longer even
be competitive in the reference Scenario A. Montenegro and Albania are
likewise a priori discarded as intermediate and peak load options due to lack
of access to natural gas supplies for CCGT or GT. For peak load GTs (see
Table 99) only the use of the following existing transmission lines remains
an option for:
Turkey - Greece
Serbia - Hungary
Intermediate Load
linkage: EU non-EU Non-EU power plant / break even WACC
existing / country country scenario
new A B C
existing BG TR n.a. CCGT 5.2% CCGT 6.7%
existing GR TR CCGT 13.8% CCGT 15.1% CCGT 14.3%
existing HU RS n.a. n.a. n.a.
new IT TN CCGT 10.9% CCGT 11.4% CCGT 11.0%
new IT ME n.a. n.a. n.a.
new IT DZ CCGT 11.6% CCGT 12.1% CCGT 11.6%
new IT AL n.a. n.a. n.a.
new RO TR n.a. n.a. n.a.
new RO RS n.a. CCGT 6.9% CCGT 7.8%

5761P25/FICHT-9661890-v2 6-36
with breakeven WACCs fluctuating rather independently of the scenario
considered at around 10%-11%. The option RO-RS in Scenario C also just
attains competitiveness but at a breakeven WACC of only 5.5%, and so only
slightly higher than the Serbian WACC of 4.6% that is calculated without
any country-specific risk premium (cf. Annex V).
Table 99: Peak Load: List of investment options and their breakeven WACCs
For peak load power plants, the gains that a power plant investment in a
non-EU country can attain due to the advantage of absence of carbon costs
is no longer significantly dependent on the scenario considered, for which
there are two reasons:
1. LCO2 expenditure accounts for only a small fraction of overall LECs
for peak load.
2. For gas turbines, fuel prices play a preeminent role but outweigh ETS
prices for all three scenarios.
For intermediate load and particularly for base load, however, these aspects
dwindle in significance and carbon costs enhance the competitiveness of the
non-EU power plants. That’s why for base load the observed breakeven
WACCs are generally higher in Scenario C than in Scenario A.
Generally, base load power plants provide the most attractive
investment options, for two reasons:
1. Levelized transmission costs are lowest at highest annual full load
hours.
2. Base load is the segment that is most attractive for CO2 intensive
coal power plants, which in particular allows non-EU investments
to prove their superiority regarding carbon costs.
Peak Load
linkage: EU non-EU Non-EU power plant / break even WACC
existing / country country scenario
new A B C
existing BG TR n.a. n.a. n.a.
existing GR TR GT 9.8% GT 10.8% GT 10.6%
existing HU RS GT 10.1% GT 11.0% GT 10.8%
new IT TN n.a. n.a. n.a.
new IT ME n.a. n.a. n.a.
new IT DZ n.a. n.a. n.a.
new IT AL n.a. n.a. n.a.
new RO TR n.a. n.a. n.a.
new RO RS n.a. n.a. GT 5.5%

5761P25/FICHT-9661890-v2 6-37
The aforementioned six highlighted country pairs and the relative
competitiveness averaged over all three scenarios of the non-EU versus the
EU power plant investment options are illustrated in Figure 93 for the three
different market segments base/intermediate/peak load.
Figure 93: Relative competitiveness of most relevant investment options
Turkey, Algeria, Tunisia and Serbia are the most promising non-EU
countries for new power plant investments that would profitably export
power, preferably base load, to EU countries. Greece and Italy and, with
minor importance, also Bulgaria, Romania and Hungary may import such
electricity.
Turkey-Greece
Algeria-Italy
Tunisia-Italy
Serbia-Romania
Turkey-Bulgaria
Serbia-Hungary
base load
intermediate load
peak load

5761P25/FICHT-9661890-v2 7-1
7. Renewable Energy and CDM Projects
In the previous chapters of this study, investment in power plants fired with
fossil energies inside and outside the EU have been analysed with the main
objective of assessing the economic and microeconomic impacts of full
auctioning of emission rights on investment decisions by potential investors.
The objective of this part of the study is to analyse the possibility of
investing in electricity generation from renewable energy within the
framework of CDM in non-EU countries and whether such CDM projects
could lead to double-counting and could thus undermine the EU ETS.
7.1 Differences between Fossil and Renewable Energy Projects
Before starting with the investigation of projects within the framework of
CDM, some important differences between power generation from fossil
energy versus renewable energy in general shall be outlined and discussed.
The main difference is that there are no CO2 emissions from renewable
energy, so there is no advantage of avoided CO2 cost as is the case for fossil
fired power generation. Under this aspect, there is no inducement for
investing outside the EU for electricity import into the EU.
Electricity from renewable energy is promoted in the EU. The Renewable
Energy Directive [2009/28/EC] establishes a common framework for
production and promotion of energy from renewable sources. Some member
states oblige grid operators to take off renewable electricity and remunerate
this with a relatively attractive feed-in tariff. This obligation does not apply
for electricity produced outside the EU.
An important aspect concerns the location of the power plants. For fossil
fired power plants, the location is not a decisive factor for the economic
viability of a project. In practice, power plants are built where electricity is
needed, so the main criterion for site selection is closeness to major centres
of consumption as well as power grid accessibility. Climatic conditions have
also some effect because the energy efficiency of power plants is lower in
hot climates but, as mentioned above, there is no free choice of the locations
as power generation is to be placed close to the demand centres.
In contrast, location is the most decisive criterion for site selection for
renewable energy projects. Apart from availability of grid access, renewable
energy projects are only viable in locations offering favourable natural
resources, like solar radiation and wind. In this respect, we have first to
distinguish between wind and solar power.
Wind resources provide favourable conditions for wind power in the EU,
especially offshore, and investors will scarcely find better locations outside
the EU. Solar power projects, though, with concentrated solar power
technologies are an attractive option in North Africa where the solar
irradiation provides excellent conditions. Only few locations with sufficient
irradiation are available in the southern Mediterranean EU countries. Hence,

5761P25/FICHT-9661890-v2 7-2
an attractive option for solar power generation on a large scale for import
into the EU is solar power plants in North Africa.
A major drawback of power from renewable energy is its intermittent nature
depending on time of the day and the current availability of the natural
resource. In this respect, too, a distinction has to be made between wind and
solar energy. While wind power may be available day and night depending
on wind intensity, solar irradiation is available only during daytime with
hours of sufficient irradiation. However, there are state-of-the art thermal
storage technologies for solar energy while storage is technically much
more demanding and cost intensive for wind power, mainly because of its
much higher production rate.
Under the aspect of security of supply, electricity from renewable energy
requires sufficient backup capacities from fossil power plants. As a worst
case we can assume that a duplication of capacities is required to ensure
power supply at any time. Under this assumption, the following Table 100 is
developed that provides a rough assessment of the cost implications for
selected options with combinations of renewable and fossil power.
Table 100: Cost implications renewable power and combinations of renewable and
fossil power
Another aspect that is to be highlighted is the low capacity utilization factor
of power supply from renewable energy that might also be a major barrier
for import of electricity from renewable energy into the EU. As already
shown in the previous chapters, transmission costs become higher with
lower capacity factors.
Type of plant Symbol
Rated
output
MW
Life
time
a
CAPEX
€ / kWgross
Discount
rate real
%/a
Fuel cost
€ / MWht
EOH
h/a
Capacity
cost
€ /kW x a
LEC
total
€ / MWh
LEC
marginal
€ / MWh
Single power plant units
Steam power plant, hard coal SPP_coal 800 35 1,900 5.5% 13.00 7,500 169 56.49 30.01
Combine cycle gas turbine CCGT_NG 800 25 660 5.5% 25.00 7,500 60 56.69 48.71
Combine cycle gas turbine CCGT_NG 800 25 660 5.5% 30.00 4,500 60 71.05 57.75
Gas turbine SCGT_NG 150 25 500 5.5% 35.00 1,250 43 131.18 97.11
Wind farm on-shore W_Land 25 25 2,000 5.5% - 2,200 170 77.44 -
Wind farm off-shore *) W_Sea 250 25 4,500 5.5% - 4,500 406 90.23 -
CSP_ parabolic trough_8 h TES **) CSP 150 25 4,500 5.5% - 4,500 457 102.51 1.00
PV ***) PV 50 20 1,000 5.5% - 1,500 89 59.58 -
Plant combinations for base load
W_Land 25 2,000 5.5% - 2,200 170
CCGT 25 660 5.5% 25.00 5,300 60
W_Sea_CCGT 25 4,500 5.5% - 4,500 406
CCGT 25 660 5.5% 30.00 3,000 60
Plant combinations for intermediate load
W_Land 25 2,000 5.5% - 2,200 170
CCGT 25 660 5.5% 30.00 2,300 60
W_Land 25 2,000 5.5% - 2,200 170
SSCT 25 500 5.5% 35.00 2,300 43
PV_SCGT 20 1,000 5.5% - 1,500 89
SSGT 20 500 5.5% 35.00 3,000 43
*) site North Sea **) site South Spain ***) South Germany
65.12 34.42
86.60 24.48
Wind on-shore + CCGT
Wind off-shore + CCGT
Wind on-shore + CCGT
Wind on-shore + SCGT
PV + SCGT
25
250
25
25
50
80.68 29.52
96.19 48.86
94.06 64.74

5761P25/FICHT-9661890-v2 7-3
In summary we can conclude that export of electricity from renewable
energy from power plants in countries adjacent to the EU into the EU
is currently not an attractive option for investors. It could become
attractive for large-scale solar energy projects that can exploit
economies of scale for both power generation and power transmission.
In this respect, the planned Desertec project can be mentioned as a
viable alternative for the medium term.
7.2 Increased CO2 emissions from CDM projects?
This section describes to what extent renewable energy power plants erected
for importing electricity into the European Union may qualify for Certified
Emission Reductions (CERs) from CDM projects (section 7.2.2) and under
which conditions this may lead to double counting (section 7.2.3). This is
compared in section 7.2.4 with the carbon leakage effect caused by
importing fossil fuel power into the EU. First, though, the CDM regulations
in general are described in the next section.
7.2.1 CDM regulations
CDM projects are possible in non-Annex-I countries of the United Nations
Framework Convention on Climate Change (UNFCCC), i.e. countries with
no binding emission reduction targets. From the group of countries
investigated here these are:
Algeria
Bosnia and Herzegovina
Egypt
Libya
The Former Yugoslav Republic of Macedonia
Moldova
Montenegro
Morocco
Serbia
Tunisia
Directive 2004/101/EC (the ‘Linking Directive’) allows participants of the
EU ETS to use credits generated from the Kyoto Protocol’s project-based
mechanisms CDM (Clean Development Mechanism) and JI (Joint
Implementation) for fulfilling their obligations under the trading scheme.
CDM and JI have in common that they enable investments in emission
reduction projects (e.g. renewable energy, energy efficiency measures) to be
made abroad in countries that are also party to the Kyoto Protocol. In the
case of JI, these investments are made in countries which in turn have an
emission reduction obligation. In the case of the CDM, these projects are
implemented in countries with no obligation (developing countries).

5761P25/FICHT-9661890-v2 7-4
For every ton of CO2 that is reduced by a CDM or JI project, a carbon
certificate is issued that can be used in the EU ETS. In the case of CDM,
these credits are called Certified Emission Reductions (CERs). In JI
projects, Emission Reduction Units (ERUs) are generated.
It is important to understand that the CDM does not seek to reduce
greenhouse gas emissions beyond the binding emission reduction targets
under the Kyoto protocol. Rather the CDM is intended to provide an
incentive for emission reduction measures outside Annex-I countries, i.e.
countries with binding emission reduction targets, through investments by
entities from Annex-I countries. It is expected that in this way the total costs
of the targeted emission reduction are reduced because the emission
reduction potential in non-Annex I countries is expected to be exploitable at
lower costs than in Annex-I countries.
These CERs can be traded in the European Emissions Trading Scheme (EU
ETS), thus enlarging the volume of available emission allowances. The use
of CERs and ERUs in the second trading period is allowed and remaining
unused credits from this period can be transferred for use in the third trading
period. Also credits from pre-2012 registered CDM projects that will be
generated after 2012 can be used. In any case, the use of CERs is restricted
to 50% of the reduction effort.
But for new projects, at present (October 2012) the possibility of trading in
CERs in the EU ETS is restricted. CERs will only be eligible for the EU
ETS from emission reduction projects registered by 31 December 2012.
Thus new power plants seeking registration after this date will not be
eligible for the EU ETS. The validation and registration process usually
takes between six months and two years. An emission reduction project, i.e.
a renewable energy power plant, needs to be sufficiently advanced prior to
seeking registration with the UNFCCC. Thus, we expect a rather limited
number of renewable energy power plants that have not yet been realised to
have been registered by 31 December 2012.

5761P25/FICHT-9661890-v2 7-5
Country Registered Application in
process
No. of
projects
tCO2/a No. of
Projects
tCO2/a
Algeria - - - -
Bosnia and
Herzegovina - - - -
Egypt 1 170,364 - -
Libya - - - -
The Former Yugoslav
Republic of
Macedonia - - - -
Republic of Moldova - - - -
Montenegro - - - -
Morocco 3 733,358 - -
Serbia 3 1,291,830 - -
Tunisia - - - -
Table 101: Number of projects and certified emission reductions of renewable
energy power plants registered or in process between 1 January 2011 and 31 August
2012
Table 101 provides an indication by depicting renewable energy power
plants that have been registered or are seeking registration between
1 January 2011 and 31 August 2012. No projects are currently in the process
of application in the countries of interest. In this regard, a certain loophole
exists with the Programme of Activities (PoA) under the UNFCCC which
bundles several individual power plants to a CDM project: As long as a PoA
is registered before 31 December 2012, the CERs generated under this PoA
will be eligible for the EU ETS even if a specific renewable energy power
plant is incorporated into the PoA after 31 December 2012.
For the third trading period, though, the ETS Directive restricts the use of
CERS and ERUs from new CDM and JI projects that have been registered
post-2012 unless:
a satisfactory international agreement on climate change is approved by
the Community
or, in the absence of such an agreement,
the EU enters into a bilateral agreement with a country.
An exception is the acceptance of credits from new projects implemented in
Least Developed Countries (LDCs) after 2012. They can be used in the third
trading period even in the absence of such agreements as stated above. But
among the non-EU countries adjacent to the EU there are no LDCs. The
restricted access of CERs into the EU ETS, though, only holds as long as no
international legally binding emissions reduction target as a follow-up to the
Kyoto protocol has been established.

5761P25/FICHT-9661890-v2 7-6
7.2.2 Qualification of REN projects for CDM
Investments in electricity generation capacity from renewable energy under
Clean Development Mechanism (CDM) projects in non-EU countries
represent a special case. Beyond the pure generation of electricity,
renewable energy power plants may potentially also generate CERs under
the umbrella of the UNFCCC in the above listed Annex I non-EU countries.
For grid-connected electricity generation from renewable energy, the
calculation of CERs is stipulated in the Approved Consolidated Baseline
and Monitoring Methodology [ACM0002]. The baseline for a CDM project
activity (i.e. the renewable energy power plant in our case) is the scenario
that reasonably represents the anthropogenic emissions by sources of
greenhouse gases that would occur in the absence of the proposed project
activity [3/CMP]. In other words, a baseline for a CDM project activity is a
hypothetical reference case, representing the volume of greenhouse gases
that would have been emitted if the project were not implemented.
Therefore, the baseline can be used to determine:
1. whether a CDM project activity is additional
and
2. the volume of additional greenhouse gas emission reductions
achieved by a project activity.
If the CDM project activity (i.e. the renewable energy power plant in our
case) is deemed not to be ‘additional’, the project does not qualify for the
CDM and thus does not generate CERs. The analysis of additionality is
highly project specific and so this cannot be determined generically here for
the case of renewable energy power plants importing electricity into the EU.
In contrast, the determination of the baseline for the purpose of calculating
CERs can be achieved on a more generic level.
[ACM0002] stipulates that, if the project activity is the installation of a new
grid-connected renewable power plant/unit, the baseline scenario is the
following: electricity delivered to the grid by the project activity would have
otherwise been generated by the operation of grid-connected power plants
and by the addition of new generation sources, as reflected in the combined
margin (CM) calculations described in the “Tool to calculate the emission
factor for an electricity system” [UN_Tool]. This tool defines the Project
Electricity System (PES) as the spatial extent of the power plants that are
physically connected through transmission and distribution lines to the
project activity (e.g. the renewable energy power plant location) and that
can be dispatched without significant transmission constraints. This tool
offers two criteria for defining transmission constraints:
In the case of electricity systems with spot markets for electricity: there
are differences in electricity prices (excluding transmission and
distribution costs) of more than 5% between the systems during 60% or
more of the hours of the year.
5761P25/FICHT-9661890-v2 7-7
The transmission line is operated at 90% or more of its rated capacity
during 90% or more of the hours of the year.
The tool further defines a Connected Electricity System (CES) which is an
electricity system that is connected by transmission lines to the PES.
According to this definition, system boundaries are defined in such a way
that power plants within the CES can be dispatched without significant
transmission constraints but transmission to the PES has significant
transmission constraints. Electricity transfers from the PES to CESs are
defined as electricity exports. Electricity exports should not be subtracted
from electricity generation data used for calculating and monitoring the
electricity emission factors. If a CES is located partially or totally in
Annex I countries, like in the EU, then the emission factor of that CES
should be considered zero.
Thus how will the emission reduction of a renewable energy power plant
situated in a non-Annex I country and dedicated for export into the
European Union be assessed under the CDM? First it depends on the actual
physical connection of the renewable energy power plant (REN PP). If the
REN PP is feeding into an HV line dedicated for the transfer of electricity
into the European Union, then the national grid of the host country is not
affected. No emissions are avoided in a non-Annex I country with the
outcome that no CERs are issued for the REN power plant.
A similar case arises if the REN power plant feeds into the national grid and
the national grid is connected physically to the European Union and a power
purchase agreement of the REN PP with a purchaser in the European Union
is in place. Then the REN PP would be deemed to be not substituting power
supply in the non-Annex I country, so it would not qualify under the CDM.
In both cases, UNFCCC regulations provide sufficient safeguards to avoid
double counting. A different case arises if the REN PP feeds into the
national grid and the national grid is connected physically to the European
Union and no power purchase agreement of the REN PP with a purchaser in
the European Union is in place. Then the REN power plant would be
eligible under the CDM. CERs in the amount of avoided national emissions
would be issued.
In summary: only in those cases
- where the REN power plant is directly and exclusively connected to
a direct power line into the European electricity system
or
- when the power purchase agreement of the REN power plant is made
directly with a purchaser in the European electricity system,
do UNFCCC regulations prohibit the approval of CERs under the
Clean Development Mechanism.
5761P25/FICHT-9661890-v2 7-8
7.2.3 Double counting effect from CDM projects
REN PP projects situated in non-Annex I countries and dedicated for
electricity import into the European Union may unduly benefit from
achieving CERs although the electricity generation does not avoid any
emissions in the host country. As assessed from the UNFCCC regulations,
this could become the case for all REN PPs that are not directly and
exclusively connected to a direct power line into the EU or that have a
power purchase agreement directly with a purchaser in the EU. However, if
the electricity generated from a CDM project is to be supplied to the EU,
this increases overall global emissions. In the following, the
mechanism/reasoning behind this is illustrated.
In the above case of interest, the following effects could accrue to the EU
ETS:
a) CERs issued from such projects could be used by installations included
in the EU ETS. Thus within the EU it would allow for overall higher CO2
emissions on top of the ETS cap, justified as compliance for the emission
reductions achieved outside the EU.
Example: Assume the number of allowances that have to be acquired
with costs by all ETS market participants is 1000 EUAs. Now a
renewable CDM project is to be realized outside the EU which
grants CERs that are equivalent to 3 EUAs. The 3 EUAs can be used
additionally in the ETS market, expanding the CO2 emissions that
are effectively allowed to an equivalent of 1003 EUAs.
b) However, to the extent this electricity from CDM projects is imported
into the EU, the associated emission reductions are not actually achieved
outside the EU. Instead the emission reductions are effective within the
ETS framework. In practice, the reductions allow higher emissions from
other sources within the ETS cap. (This to be compared with the effect
from CERs explained in a), which allows higher emissions on top of the
ETS cap.)
Example: Due to the import of the renewable electricity from the
CDM project, the electricity demand of the EU is supplied at a level
of CO2 emissions that is equivalently lowered by 3 EUAs. The
overall ETS cap is not changed by this, but the demand for
allowances is decreased, resulting in a lower allowances price.
Emissions to the equivalent of 3 EUAs can instead be emitted
somewhere else under the EU ETS, for instance by industrial
applications.
So, combining a) and b), the emission reductions from the CDM project
outside the EU allow duplicated compensation under the ETS instead of
only once (so-called ‘double counting’). The upshot is that this effectively
causes higher total emission volumes over all involved countries.

5761P25/FICHT-9661890-v2 7-9
Example: Regard the examples of a) and b) from above. Since
electricity from the renewable CDM project is transmitted to the EU,
emissions in the non-EU country concerned are not changed.
Emissions in the EU, though, are increased by 3 units. Thus in total
an increase of CO2 emissions equivalent to 3 EUAs is brought about.
In such a scenario, the integrity of the EU ETS is undermined under the
aspects of environmental protection (1003 EUAs equivalent CO2 emissions
instead of 1000 EUAs) and economics (downward pressure on allowance
price conveys wrong or distorted economic signals to installations).
It must be emphasized here that this increase of emissions is not caused by
renewable CDM projects in general. Instead, only if the generated electricity
from the REN PP is imported into the EU and if it is granted CERs, then
this situation causes double counting of emission reductions. This is because
issuance of CERs is authorised on the assumption that the renewable
electricity produced is displacing more CO2 intensive electricity somewhere
else. However, if this electricity is exported to and consumed in the EU, it
cannot be used to displace more CO2 intensive electricity consumption in
the country generating this renewable electricity. As a consequence, the
CERs are used to justify the emission of more greenhouse gases in the EU
without offsetting emissions elsewhere.
Without electricity imports no double counting and no overall increase of
emissions results from CDM projects:
Example: Regard again the examples of a) and b) from above but
now assume that, unlike b), the electricity is not imported into the
EU. Again the overall ETS would be increased up to 1003 EUAs due
to CERs from the CDM project (compare with a)). However the
CDM project would, in the non-EU country, effectively reduce 3
units of carbon emissions for which it was granted. The emission
reduction of 3 EUAs outside the EU compensates for the 3 EUAs
more within the EU. Effectively, in total no more emissions have
been caused by the project than without it.
It is only in the case of imports into the EU that electricity from REN
CDM projects cannot displace CO2 intensive electricity consumption
in the generating non-EU country and would thus be endowed with
unjustified CERs that come on top of the ETS emission cap and would
bring about globally increased emissions.
7.2.4 Electricity import into the EU and its impact on overall CO2 emissions
The example given for increased overall CO2 emissions from a renewable
CDM project will now be compared with the carbon leakage effect for the
case where instead a fossil fuel fired power plant in the non-EU country is
transferring its generated electricity into the EU.
5761P25/FICHT-9661890-v2 7-10
Example: Assume again that the number of allowances that have to
be acquired and paid for by all ETS market participants is 1000
EUAs. Now assume that the EU imports electricity from a fossil fuel
fired power plant outside the EU that causes CO2 emissions
equivalent to 3 EUAs. The imported electricity does not impact the
overall ETS cap. Emissions from electricity generation within the
EU can instead be emitted somewhere else within the EU ETS, for
instance by industrial applications. However in the non-EU country
CO2 emissions are increased equivalent to 3 EUAs without having
any further impact on the electricity supply and the CO2 emissions in
this country. Thus in total a carbon leakage effect equivalent to 3
EUAs is caused.
From an environmental point of view, the effect would be the same as in the
case of imported electricity from the CDM project. The environmental and
economic integrity of the EU ETS is again undermined. However, there are
some general differences between the carbon leakage effect from fossil fuel
fired power plants and the double counting effect from renewable CDM
projects:
The amount of carbon leakage in terms of additional CO2 emissions
depends for the case of the fossil power import on the CO2-efficiency of
the fossil fuel fired power plant per generated unit of electricity. In the
example of the fossil fuel power import above, a non-CO2-efficient
power plant may emit the equivalent of 4 EUAs instead of only 3 EUAs
in order to supply the same amount of electricity to the EU. This would
increase the carbon leakage effect accordingly.
For the CDM project, however, the amount of increased emissions
depends on the credited CERs in terms of EUA equivalents. This
depends for a renewable power plant project on the applied baseline
scenario (see section 7.2.2). According to the conclusions from 7.2.2, the
only electricity generated by CDM projects that is eligible for CERs is
that which is not imported via a direct and exclusively connected power
line into the EU and that is not sold via a power purchase agreement to a
purchaser in the EU. In the remaining cases, usually the national CO2
emission factor of the respective non-EU country will be the starting
point for the baseline calculation and for the number of granted CERs,
because in the CDM assessment of the project the electricity export to the
EU will not be detectable.
Whereas for fossil fuel fired power plants the inducement of the ETS
for carbon leakage results from the carbon costs for fossil fuel fired
power plants, for renewable CDM projects the inducement consists of the
reimbursement of the granted CERs.

5761P25/FICHT-9661890-v2 7-11
Another, albeit less important, difference between the two scenarios is
that the emissions on top of the EU ETS cap arise at different locations:
outside the EU, in the case of fossil fuel power import into the EU,
and
inside the EU in the case of import of CDM power import into the EU.
Because of the limited number of already established and ongoing REN
PP CDM project activities in countries neighbouring the EU (cf. Table
101), the threat of a substantial overall increase of CO2 emissions from
CDM projects stems more from new CDM projects to be planned rather
than from already established CDM projects. However, when considering
fossil fuel fired power plants also the huge amount of already existing
power plant capacities could potentially contribute to carbon leakage if
generated electricity is transmitted to the EU.
In the context of the latter aspect it may be emphasized, that each
electricity import into the EU - also from existing power plants - cannot
contribute to lessening CO2 emissions within the EU due to the fixed ETS
cap. But instead electricity import into the EU from existing power plants
may be perceived as carbon leakage in the special case of if the electricity
could be used instead within the non-EU country to avoid other CO2
emissions from power generation. This may even concern the import of
CO2-free electricity into the EU. An example that may be given is Ukraine,
which is planning to export CO2-free electricity from its existing nuclear
power plants to the EU and to compensate these power exports with
increased electricity generation from its aging fossil fuel power plant fleet.
Similarly, electricity exports from the EU to neighbouring countries
would cause in reverse a ‘negative carbon leakage effect’, i.e. would
improve the global CO2 emission balance. Power generation in the
importing non-EU country would then be avoided and would usually also
give rise to CO2 emission reductions in the country concerned. Within the
EU, however, CO2 emissions would remain the same due to the fixed
emission cap. Thus in total (i.e. EU plus non-EU), CO2 emissions would be
reduced.

5761P25/FICHT-9661890-v2 8-1
8. List and Scale of Known Investments
Set out in the following are ongoing, planned and potential investments in
new electricity generation capacity in the non-EU countries considered
whose purpose is to supply electricity to the EU. The projects as listed in
Table 102 were identified based on our own research and publicly available
information on the web.
Country Export to Power plant fuel Capacity… …for export
Albania Italy Hard coal 1,600 MW 1,360 MW
Belarus Poland Hard coal 920 MW 600(?)-920 MW
Tunisia Italy Natural gas, CCGT 1,200 MW 800 MW
Table 102: Ongoing, planned and potential investments in new power plants for
electricity import into the EU
8.1 Coal-fired Power Plant in Albania to Supply Italy with Electricity
The Italian utility Enel plans to build a coal-fired thermal power plant in
Porto Romano near the City of Durres in Albania. Enel already set up a joint
venture with Albanian industrial firms in 2009 [REUT]. According to [CEE
2010], the planned two units of 800 MW each are to be fired by imported
hard coal and are dedicated to export about 85% of the generated electricity
via HVDC undersea cables to Italy. If the power plant were to be erected in
Italy instead, Enel would have to buy CO2 emission rights.
Environmental associations have protested against the Albanian government
as well as the Italian project developer and complain about unanswered
questions concerning the impacts and aims of the power plant project. As a
consequence of the project, total Albanian CO2 emissions would increase
approximately by a factor of 2.5 from the current level, according to [CEE
2010]. Since Albania’s present overall CO2 emissions are at about the same
level as in 1990, any future CO2 reduction strategies of Albania would be
seriously undermined by the new project. This raises also concerns that the
project could seriously hamper Albania’s ambitions to join the EU. Also the
competitiveness of the economy could be impaired due to the high CO2
emission costs that would result from participation in the ETS that would be
a condition for accession to the European Union.
The Albanian government and Enel argue that energy security would be
improved and have announced cost-price electricity supply for Albania
[CEE 2010]. An environmental impact study for this undertaking, though, is
regarded as inadequate by its opponents because of deficiencies in the
analyses of emissions, socio-economic factors as well as environmental
management and monitoring plans [CEE 2009]. And from the viewpoint of
security of supply, [CEE 2010] sees no need for such a large scale power
plant in Albania.
According to our estimation (cf. Table 86), the CAPEX for the transmission
project is in the order of €1 billion .

5761P25/FICHT-9661890-v2 8-2
8.2 Hard Coal PP in Belarus for Exporting Electricity to Poland
The Polish investment company Kulczyk Holding and the Belarusian state
production association Belenergo signed a cooperation agreement in 2010
following a letter of intent from 2008 to build a 920 MW coal-fired thermal
power plant in Belarus [BNAA]. This is to be located in the Grodno region
at the city of Zelva near the Polish border [OOI]. 10% of the designated
hard coal fuel is to be substituted by Belarusian peat in line with a state
program for deploying the country’s own energy resources in the national
fuel balance. The remainder is to be imported by train from Russia, Ukraine
and Poland, here especially from the Bogdanka Colliery [GDP, BNAA].
According to the offer from the Ministry of Energy of the Republic of
Belarus, the investment is to be realised under a private and public
partnership as a BOT or BOOT scheme that proposes construction of the
power plant by the investor and its operation over a specified period to earn
a profit and amortize the investment [OOI]. Furthermore, the Republic of
Belarus guarantees to the developer that it will purchase all the generated
electricity, assuming 5,500 full-load operating hours. Additionally, it
declares to build the needed power lines to connect the plant to the
Belarusian grid at its own expense [OOI]. Belarus had been looking for an
investor to build a coal-burning condensing plant in Zelva. Subsequently
Belarus and the Polish Kulczyk Holding made a deal between Belarusian
Grodnoenergo and the Polish holding company to build a 920 MW coal-
fired plant in Belarus’ Zelva, and a 400 kV power line with a DC link to
connect the Belarusian Ros Substation with the Polish power grid [EXBY].
The Polish and Belarusian power grids are in asynchronous operation.
Power will be transmitted between the cities of Ros (BY) and Narev (PL)
via a 400 kV line and a back-to-back DC link on the Belarusian side to
export the generated electricity to the neighbouring EU country, Poland
[BNAA, BAKU, CICS]. For this purpose, the intention is to build the new
line along the existing corridor of a retired 220 kV transmission line
between Bialystok and Ros over a distance of 120 km – 75 km on Polish
and 45 km on Belarusian territory [PSEDP 2010]. The mooted capacity of
the new connection will be 600–1,000 MW. Realisation of the construction
is excluded before the year 2015 [PSEDP 2012, B_NPP, PSE, GDP].
Nevertheless, the Polish TSO quotes a three-year implementation time after
authorisation [PSE].
Regarding financial aspects, the development strategy results in estimated
project costs of €1.5 billion to be funded by foreign loans and Belarusian
funds guaranteed by the Government of Belarus [GDP].
In May 2011, the project was put on hold because the Polish and Belarusian
investors failed to reach a consensus on its funding [EXBY]. The Polish
party under Jan Kulczyk suspended the deal because of increasing
difficulties over financing conditions. According to Kulczyk, a project of
this scale requires bank interests and ‘given the current climate surrounding
[in] Belarus it would be hard to finance such a project.’ At this point of

5761P25/FICHT-9661890-v2 8-3
time, Belarus’s foreign-currency reserves had reached a low level and the
country’s current-account deficit increased up to 16% of its gross domestic
product [BL, BAKU, EXBY].
In May 2012, Prime-TASS reported that a further decision to build the
Zelva power plant depends on the development of global coal and gas prices
[EXBY]. Prime-TASS referred to a draft programme for Belarus’ industrial
development that spans a period up to 2020.
8.3 Italian Tunisian Power Plant Project ELMED
In August 2008, the Italian and Tunisian Ministers for Economic
Development signed an intergovernmental agreement for the energy sector
on a joint electricity generation and transmission project [TER 2009]. The
Italian grid and transmission system operator Terna and the Tunisian state-
owned organisation responsible for electricity generation, transmission and
distribution, the Société Tunisienne de l’Électricité et du Gaz (STEG), were
commissioned to develop a power plant in Tunisia and to build a related
transmission system between Italy and Tunisia.
For this purpose, Terna and STEG entered into a partnership agreement in
March 2009 to set up the Tunisian-Italian joint venture ELMED to realise
the electricity generation and transmission project. A prequalification phase
for potential operators of the transmission line started in 2010 [FIPA].
The connection is to be an HVDC subsea cable with a final transmission
capacity of 1000 MW. Starting in the city of Al-Haouaria, crossing the
Mediterranean Sea and arriving at the Sicilian city of Partanna results in a
total distance of about 200 km for the link [GENI]. The interconnector is
planned for development in two stages: 400-500 MW in the first phase and
500 MW in the second phase. For the second phase, reinforcement of the
Sicilian grid is a prerequisite [MEDRING_UP1]. The final configuration
will be a bipole at ± 400 kV DC [MEDRING_UP1] for bidirectional
connection of the Tunisian grid to Western Europe [GENI].
The scheme includes a 1200 MW thermal power plant in Al Haouaria
(Tunisia) [TER 2010] that will be coal- or gas-fired [MEDRING_UP1].
According to [FIPA], it will be a CCGT plant and will include a renewable
energy component of at least 100 MW.
The interconnector will be operated in the form of a “merchant”
interconnection with 80% of capacity exempted from TPA and reserved for
the investor in the new power plant. This value is compliant with the Italian
Ministerial Decree on Merchant Lines issued in October 2005
[MEDRING_UP1]. The interconnector is expected to enter into operation in
2016 [MEDRING_UP1]. In [TYNDP 2012], the ELMED transmission line
is quoted as being under the “design and permitting” process and described
as “delayed due to longer than expected authorisation procedures”.

5761P25/FICHT-9661890-v2 8-4
This means that 800 MW of the power plant capacity is dedicated for
electricity export to Italy, with 400 MW for STEG to supply the Tunisian
market [GENI].
The balance of 200 MW transmission capacity is open for third party access
under the rules and procedures established by the Italian and Tunisian
governments [GENI]. This capacity may eventually be used for trading
“green energy” between the Maghreb and Italy on the basis of Art. 9 of the
EC Directive [2009/28/EC] on “the promotion of the use of energy from
renewable sources” [MEDRING_UP1], and the power plant will not be
commissioned before 2017 [PEI]. The IPP should be developed under a
build-own-operate basis with a 20–30 years concession. [PEI]
According to our estimation (cf. Table 86), the transmission CAPEX for the
project is in the same range of about €1 billion, like for the Italy-Albania
project. But due to low-cost natural gas in Tunisia, the competitive
advantage enjoyed by this project is assessed in the model to be higher than
for power transmission from Albania.
8.4 Conclusions
The presented investment projects underline the prominent role that Italy
plays as a potential importer of electricity from new power plants outside
the EU that may be installed with the aim of supplying electricity into the
EU. The example of the planned power plant investment in Belarus shows
how important the political situation as well as a synchronized power
connection to the EU network can be.

5761P25/FICHT-8732861-v2G 9-1
9. References
[96/61/EC] COUNCIL DIRECTIVE 96/61/EC of 24 September 1996
concerning integrated pollution prevention and control
[96/92/EC] Directive 96/92/EC of the European Parliament and of the Council of 19
December 1996 concerning common rules for the internal market in
electricity
[406/2009/EC] DECISION No 406/2009/EC OF THE EUROPEAN PARLIAMENT
AND OF THE COUNCIL of 23 April 2009 on the effort of Member
States to reduce their greenhouse gas emissions to meet the
Community’s greenhouse gas emission reduction commitments up to
2020
[2001/80/EC] DIRECTIVE 2001/80/EC OF THE EUROPEAN PARLIAMENT AND
OF THE COUNCIL of 23 October 2001 on the limitation of emissions
of certain pollutants into the air from large combustion plants
[2003/87/EC] DIRECTIVE 2003/87/EC OF THE EUROPEAN PARLIAMENT AND
OF THE COUNCIL of 13 October 2003 establishing a scheme for
greenhouse gas emission allowance trading within the Community and
amending Council Directive 96/61/EC
[2003/96/EC] COUNCIL DIRECTIVE 2003/96/EC of 27 October 2003
restructuring the Community framework for the taxation of energy
products and electricity
[2008/1/EC] DIRECTIVE 2008/1/EC OF THE EUROPEAN PARLIAMENT AND
OF THE COUNCIL of 15 January 2008 concerning integrated pollution
prevention and control
[2008/101/EC DIRECTIVE 2008/101/EC OF THE EUROPEAN PARLIAMENT AND
OF THE COUNCIL of 19 November 2008 amending Directive
2003/87/EC so as to include aviation activities in the scheme for
greenhouse gas emission allowance trading within the Community
[2009/28/EC] DIRECTIVE 2009/28/EC OF THE EUROPEAN PARLIAMENT AND
OF THE COUNCIL of 23 April 2009 on the promotion of the use of
energy from renewable sources and amending and subsequently
repealing Directives 2001/77/EC and 2003/30/EC
[2009/29/EC] DIRECTIVE 2009/29/EC OF THE EUROPEAN PARLIAMENT AND
OF THE COUNCIL of 23 April 2009 amending Directive 2003/87/EC
so as to improve and extend the greenhouse gas emission allowance
trading scheme of the Community
[2009/72/EC] DIRECTIVE 2009/72/EC OF THE EUROPEAN PARLIAMENT AND
OF THE COUNCIL of 13 July 2009 concerning common rules for the
internal market in electricity and repealing Directive 2003/54/EC
[2009/73/EC] DIRECTIVE 2009/73/EC OF THE EUROPEAN PARLIAMENT AND
OF THE COUNCIL of 13 July 2009 concerning common rules for the
internal market in natural gas and repealing Directive 2003/55/EC
[2009/713/EC] REGULATION (EC) No 713/2009 OF THE EUROPEAN
PARLIAMENT AND OF THE COUNCIL of 13 July 2009
establishing an Agency for the Cooperation of Energy Regulators
[2009/714/EC] REGULATION (EC) No 714/2009 OF THE EUROPEAN
PARLIAMENT AND OF THE COUNCIL of 13 July 2009 on
conditions for access to the network for cross-border exchanges in
electricity and repealing Regulation (EC) No 1228/2003
[2009/715/EC] REGULATION (EC) No 715/2009 OF THE EUROPEAN
PARLIAMENT AND OF THE COUNCIL of 13 July 2009
on conditions for access to the natural gas transmission networks and
repealing Regulation (EC) No 1775/2005

5761P25/FICHT-8732861-v2G 9-2
[2010/75/EU] DIRECTIVE 2010/75/EU OF THE EUROPEAN PARLIAMENT AND
OF THE COUNCIL of 24 November 2010 on industrial emissions
(integrated pollution prevention and control)
[3/CMP] The Conference of the Parties serving as the meeting of the Parties to the
Kyoto Protocol: Decision 3/CMP.1 Modalities and procedures for a
clean development mechanism
as defined in Article 12 of the Kyoto Protocol
http://cdm.unfccc.int/Reference/COPMOP/08a01.pdf
[406/2009/EC] DECISION No 406/2009/EC OF THE EUROPEAN PARLIAMENT
AND OF THE COUNCIL of 23 April 2009 on the effort of Member
States to reduce their greenhouse gas emissions to meet the
Community’s greenhouse gas emission reduction commitments up to
2020
[ACM0002] UNFCCC: ACM0002: Consolidated baseline methodology for grid-
connected electricity generation from renewable sources --- Version
13.0.0.
http://cdm.unfccc.int/methodologies/DB/UB3431UT9I5KN2MUL2FGZ
XZ6CV71LT/view.html
[ANME] Abdelkarim GHEZAL, Director of ANME: Role of ANME in the
promotion of renewable energy in Tunisia, presentation on the EMIS
FORUM SOLAR ENERGY & ENERGY EFFICIENCY (FORSEE)
Tunis, 25-26th June 2012, www.miraproject.eu
[BAKU] BakuToday: Polish businessman has suspended the construction of
power plant in Belarus, 17.05.2011;
http://www.bakutoday.net/polish-businessman-has-suspended-the-
construction-of-power-plant-in-belarus.html ,20.06.2012
[BL] Bloomberg: Kulczyk Suspends Plan To Build Coal-Fired Power Plant In
Belarus, by Pawel Kozlowski and Marek Strzelecki, 16.05.2011;
http://www.bloomberg.com/news/2011-05-16/kulczyk-suspends-plan-to-
build-coal-fired-power-plant-in-belarus.html ,20.06.2012
[BNAA] Belarus News and Analysis: Kulczyk to invest in Belarus energy,
27.08.2010;
http://www.data.minsk.by/belarusnews/082010/175.html ,20.06.2012
[BTA] Belarus Telegraph Agency: Belarus keen on new energy projects with
eastern partnership, 10.12.2009,
http://news.belta.by/en/news/econom?id=461344
[B_NPP] Baltic NPP – Russian contribution to power sector development in the
Baltic sea region: by Maxim Kozlov, 25.11.2010
http://www.norden39.ru/galery/_norden/page/energy/energy%20conf%2
0%2024-25_11_10/Presentations%2024-
25.11.2010/kozlov_maxim_eng.pdf
[CASC] http://www.casc.eu/en/About-us/Our-History/CASCEU-Presentation
[CEE 2009] CEE: Quality review of the EIA for the Porto Romano Power Plant,
March 2009,
http://bankwatch.org/sites/default/files/TPP_Portoromano_EIA_Quality
_Review.pdf
[CEE 2010] Energy and Environment for Sustainable Development Association,
Albania; CEE Bankwatch Network, Czech Republic; EDEN Center,
Albania: Over the edge -Enel’s plans to export its pollution to Porto
Romano, Albania, April 2010
http://bankwatch.org/sites/default/files/PortoRomanoOverTheEdge.pdf

5761P25/FICHT-8732861-v2G 9-3
[CESI] Centro Elettrotecnico Sperimentale Italiano, Updating “T E N-Energy-
Invest” study with particular attention paid to the future
development of the Energy Market in the Baltic region – Methodology
to prioritise infrastructure projects–, Working Group Baltic Electricity
Market, Market Design, Present Regulatory and Legal Framework,
Existing Barriers in the Baltic Member States of Estonia, Latvia and
Lithuania – Roadmap towards an integrated power market between the
Baltic Member States and the Nordic Countries, March 2009
http://ec.europa.eu/energy/infrastructure/doc/2009_bemip_a9012549-
market-design-final_-_8_may_2009.pdf
[CIA] Central Intelligence Agency, CIA World Factbook, 1st January 2011,
https://www.cia.gov/library/publications/the-world-factbook/index.html
[CICS] CICS: Poland-Belarus plan €1.5bn power plant venture, 25.01.2010
http://www.icis.com/heren/articles/2010/01/25/9328642/poland-belarus-
plan-1.5bn-power-plant-venture.html , 20.06.2012
[CIFE] Center for integrated facility engineering:
International Comparisons of Electricity Restructuring: Considerations
for Japan, 2004
http://www.stanford.edu/group/CIFE/online.publications/TR150.pdf
[COM(2010)
265 final]
COMMUNICATION FROM THE COMMISSION TO THE
EUROPEAN PARLIAMENT, THE COUNCIL, THE EUROPEAN
ECONOMIC AND SOCIAL COMMITTEE AND THE COMMITTEE
OF THE REGIONS, Analysis of options to move beyond 20%
greenhouse gas emission reductions and assessing the risk of carbon
leakage, Brussels 2010
[COM(2011)
885 final]
COMMUNICATION FROM THE COMMISSION TO THE
EUROPEAN PARLIAMENT, THE COUNCIL, THE EUROPEAN
ECONOMIC AND SOCIAL COMMITTEE AND THE COMMITTEE
OF THE REGIONS, Energy Roadmap 2050, Brussels 2011
[CONS] MVVdecon/ENEA/RTE-I/Sonelgaz/Terna, EU funded regional project
“Paving the Way for the Mediterranean Solar Plan”, Activity 1.1.1:
Benchmarking of existing practice against
EU norms - Country Report Tunisia, September 2011
http://www.pavingtheway-msp.eu/fileadmin/paving-the-way/Tunisa.pdf
[CREAD] Centre de Recherche en Economie Appliquée pour le Développement
(CREAD) and Wuppertal Institute for Climate, Environment and
Energy:
Algeria – A Future Supplier of Electricity from Renewable Energies for
Europe? Algeria’s Perspective and Current European Approaches,
01.08.2010
http://personal.lse.ac.uk/kumetat/pdfs/Algeria_final_report.pdf

5761P25/FICHT-8732861-v2G 9-4
[CREG] loi n°02-01 du 5 février 2002 relative à l’électricité et à la distribution du
gaz par canalisation
http://www.creg.gov.dz/images/stories/PDF/Loi02_01fr.pdf
[DMOERF] Anatoly Yanovsky, Deputy Minister of Energy of The Russian
Federation, Presentation in Brussels, March 2012,
http://www.docstoc.com/docs/122186451/55-50-in-TNK-BP-SHELL-
27-5-minus-1-share-in-Sakhalin-2-SHELL-a-joint-venture-with-Union-
and-joint-operation-of-the-power-systems-Agreement
[EEAS] http://eeas.europa.eu/delegations/algeria/documents/newsletters/juillet_a
out_2010_fr.pdf
[EEC] http://www.energy-community.org, 05.03.2012
[EEC-
LF_ 2008]
The Energy Community, Legal Framework 1st Edition,
1 December 2008;
[EEC-
LF_ 2010]
The Energy Community, Legal Framework, 2nd Edition, 1 November
2010 [EEC_
taskforce]
Energy Community Task Force on Environment, 3rd Meeting,
23 May 2012,
http://www.energy-community.org/pls/portal/docs/1662177.PDF
[EIU] Economist Intelligence Unit, Energy Reports for individual countries,
Published between September 2010 and June 2011
[ELFORSK] Elforsk report from Pöyry Management Consulting: Nordic & Baltic
Power Market - Challenges in market integration, Elforsk report 12:17,
May 2012, http://www.elforsk.se/Rapporter/?rid=12_17_
[ENTEC] Entec UK Limited:
Preparation of the review relating to the Large Combustion Plant
Directive, 2005
http://ec.europa.eu/environment/air/pdf/final_report_05225.pdf
[ENTSO-E] European Network of Transmission System Operators for Electricity,
Statistical Database
[EUI] EUI Working Papers, ROBERT SCHUMAN CENTRE FOR
ADVANCED STUDIES, RSCAS 2011/09, Capacity to compete: Recent
trends in access regimes in electricity and natural gas networks,
http://www.florence-
school.eu/portal/page/portal/LDP_HOME/Publications/Working%20pap
ers/2011/RSCAS_2011_09_0.pdf
[EURELEC] Olga Mikhailova: EU-Russia: the need for cross-border trade and the
increasing role of electricity, presentation on the Eurelectric Workshop
‘One voice within one EU market’, 12.09.2011
[Eurostat] Eurostat, European Commission, Electricity production and supply
statistics, June 2011
[Eurostat_gas] Eurostat, European Commission:
Gas - industrial consumers - half-yearly prices - New methodology from
2007 onwards [nrg_pc_203]
[Eurostat_lab] Eurostat, European Commission:
Monthly labour costs - Nace Rev. 2 [lc_an_costm_r2];
sectors: ‘Electricity, gas, steam and air conditioning supply ‘ and
‘Construction’; size class: 10 employees or more, last update 6.3.2012

5761P25/FICHT-8732861-v2G 9-5
[EURPROG] Eurelectric
Statistics and prospects for the European electricity sector,
36th Edition (EURPROG 2008), April 2009
Statistics and prospects for the European electricity sector
37th Edition (EURPROG 2009), October 2009
Power Statistics 2010, 38th Edition (EURPROG 2010), 2
nd December
2010
[EU Trends] European Commission, EU energy trends to 2030 - Update 2009,
Brussels, 4th August 2010
[EXBY] EXPORT.BY, internet portal by the Belarusian National Centre for
Marketing and Price Study: Belarus’ coal power project depends on
global price of coal, gas, 24.05.2012, ;
http://export.by/en/?act=news&mode=view&id=42626 , 20.06.2012
[FIPA] Foreign Investment Promotion Agency FIPA-TUNISIA: Electric power
plant in Al-Haouaria region;
http://www.investintunisia.tn/site/en/article.php?id_article=610,
27/06/2012
[Fortum] Fortum, Måns Holmberg: European and Russian Electricity Trade -
Baltic and Russian Development and Challenges, Market Design
Seminar: Stockholm, 8.3.2012
[GDP] Grodnoenergo Development Plan,
http://www.energo.grodno.by/en/content/development-strategy,
20.06.2012
[GENI] Global Energy Network Institute:
Tunisia integrates electricity network between Europe and North Africa,
Global Arab Network 11/10/2009;
http://www.geni.org/globalenergy/library/technical-
articles/transmission/global-arab-network/tunisia-integrates-electricity-
network-between-europe-and-north-africa/index.shtml
27/.6/2012
[GreenPaper] COM(2006) 105 final, GREEN PAPER, A European Strategy for
Sustainable, Competitive and Secure Energy, European Commission,
Brussels 2006
[GTAI] Germany Trade & Invest, Bereich Recht, Ausländisches Wirtschafts-
und Steuerrecht, Dr. Sven Klaiber, Niko Sievert: Recht kompakt:
Algerien, September 2010
http://www.gtai.de/GTAI/Content/DE/Trade/_SharedDocs/Pdf/Recht-
kompakt/nahost-algerien.pdf
[IEA] International Energy Agency:
Energy prices and taxes, Quarterly statistics, Fourth Quarter 2011
[IEA CCC] International Energy Agency Clean Coal Centre, Dr. Lesley Sloss:
Legislation in the EU and the impact on existing plant
(Presentation at the International Conference on Efficient Power
Generation 19-20 September 2011, Moscow, Russia),
http://www.iea.org/Platform/workshops/Russia/Sloss.pdf
[Inter Rao] Inter RAO UES: Recent changes in the electricity trade
between Russia and Finland,
http://www.fingrid.fi/en/customers/Customer%20attachments/Seminars/
2012/Recent%20changes%20in%20the%20electricity%20trade%20betw
een.pdf
[ISI] Fraunhofer ISI:
Comparison of allocation rules of EU member states (2008-2012) for the
power sector, Karlsruhe 2008

5761P25/FICHT-8732861-v2G 9-6
[KU Leuven] Katholieke Universiteit Leuven:
Zonal network model of European interconnected electricity network,
2005
http://www.kuleuven.be/ei/Public/Agenda-bestanden/Session%202-
1%20-%20Purchala%20-%20paper.pdf
[LCP BREF
2006]
Integrated pollution prevention and control reference document on best
available techniques for large combustion plants, 2006
http://eippcb.jrc.ec.europa.eu/reference/BREF/lcp_bref_0706.pdf
[LDF_2009] Algerie - Loi de finances complementaire pour 2009
http://www.droit-afrique.com/images/textes/Algerie/Algerie%20-
%20LF%202009%20complementaire.pdf
[LE] London Economics in association with Global Energy Decisions:
Structure and Performance of Six European Wholesale Electricity
Markets in 2003, 2004 and 2005, Executive Summary, 2007
http://ec.europa.eu/competition/sectors/energy/inquiry/electricity_final_e
xecsum.pdf
[LUT] Prof. Satu Viljainen, Lappeenranta University of Technology, Market
Design Seminar: Baltic and Russian power market – development and
challenges, Stockholm, 8.3.2012
http://www.elforsk.se/Documents/Market%20Design/seminars/BalticRu
ssia/02_LUT.pdf
[MAR] http://www.marketcoupling.com/downloads/faq
[MEDREG
2011]
MEDREG Institutional and Electricity Ad Hoc Group:
Survey on the legal framework for management of electricity
interconnections in the Mediterranean region, December 2011
http://www.medreg-regulators.org/portal/page/portal/MEDREG_HOME
/PUBLICATIONS/Electricity
[MEDRING_
UP1]
MEDRING UPDATE, VOLUME I, OVERVIEW OF THE POWER
SYSTEMS OF THE MEDITERRANEAN BASIN, Final Draft, MED-
EMIP, April 2010
http://ec.europa.eu/energy/international/studies/doc/2010_04_medring_v
ol1.pdf, 05.09.2012
[MEDRING_
UP2]
MEDRING UPDATE, VOLUME II, ANALYSIS AND PROPOSALS
OF SOLUTIONS FOR THE CLOSURE OF THE RING AND NORTH-
SOUTH ELECTRICAL CORRIDORS, Final Draft, MED-EMIP, April
2010
http://ec.europa.eu/energy/international/studies/doc/2010_04_medring_v
ol2.pdf
[NARUC] National Association of Regulatory Utility Commissioners: The system
of cross border electricity exchanges in Turkey, Fatih Kölmek
12.13.2011
http://www.naruc.org/international/Documents/Turkey_eng%20%5BCo
mpatibility%20Mode%5D.pdf
[EEAS] European External Action Service , Revue de la Délégation de l’Union
européene en Algérie, Juillet/Août 2010 - n°14,
http://eeas.europa.eu/delegations/algeria/documents/newsletters/juillet_a
out_2010_fr.pdf
[EEC-OBS] http://www.energy-
community.org/portal/page/portal/ENC_HOME/ENERGY_COMMUNI
TY/Stakeholders/Observers
[OOI] Offer Of Investment, Ministry of Energy of the Republic of Belarus,
State Production association “Belenergo” , Republican Unitary
enterprise “Grodnoenergo”, 2011

5761P25/FICHT-8732861-v2G 9-7
[TEIAS-
ENTSOE]
PUBLIC ANNOUNCEMENT of TEİAŞ on the extension of the third
phase of the trial synchronous operation of the Turkish power system
with Continental Europe, 14 September 2012,
http://www.teias.gov.tr/Entsoe.aspx
[PEI Power Engineering International, International: Tunisia to tender 1200
MW Elmed IPP, 01/06/2011
http://www.powerengineeringint.com/articles/print/volume-19/issue
6/regulars/world-news/international.html
[PNB 2010] Polish News Bulletin: PSE Operator to Invest ZL8-12bn in Transmission
Capacity, 04.05.2010,
http://www.accessmylibrary.com/article-1G1-228654797/pse-operator-
invest-zl8.html
[PNB 2011] Polish News Bulletin: Poland- Belarus connection, 06.05.2011,
http://www.accessmylibrary.com/article-1G1-255650133/poland-
belarus-connection.html
[PSE] PSE Operator S.A. Poland: Development of cross-border transmission
lines in Poland and their significance for the Central East European
energy market,
http://www.google.de/url?sa=t&rct=j&q=&esrc=s&source=web&cd=1&
cad=rja&ved=0CCoQFjAA&url=http%3A%2F%2Fwww.worldenergy.o
rg%2Fdocuments%2Fcongresspapers%2F314.pdf&ei=3SpiUJ61OsfE4g
SnuoCYBA&usg=AFQjCNEPvwM4j9ShNRf66pE_ZLo1avrzXg
[PSEDP 2010] Polish Transmission System Operator PSE: Development Plan for
purposes of meeting current and future electricity demand in the period
2010 – 2025 , March 2010, p. 54 http://www.pse-operator.pl/index.php?modul=10&gid=402
[PSEDP 2012] Polish Transmission System Operator PSE: Updated Development Plan
for meeting current and future electricity demand in the period 2010 –
2025, July 2011, p.9,
http://www.pse-operator.pl/index.php?modul=10&gid=402
[REEEP] Renewable Energy & Energy Efficiency Partnership, Policy Database
Details: Tunisia (2012)
http://www.reeep.org/index.php?id=9353&text=policy-
database&special=viewitem&cid=139
[RENA] Regional Environmental Network for Accession (RENA):
Working Group 4 – ECENA - Activity Scheme 4.1, 2011
http://www.renanetwork.org/documents/wgroups/WG%204%20Manual
%20batch%201%20BiH%20-%20Extra%20Materials
[REUT] Reuters UK: Italy’s ENEL seeks Albanian partners for coal plant, 18 Feb
2009
http://uk.reuters.com/article/2009/02/18/albania-enel-power-
idUKLI81470220090218
[Säcker] Säcker, Franz Jürgen (Hrsg.): Das dritte Energiepaket für den
Elektrizitätsbereich, Frankfurt am Main, 2009, p.20 et seq.
[SEC(2010)
650 part II]
COMMUNICATION FROM THE COMMISSION TO THE
EUROPEAN PARLIAMENT, THE COUNCIL, THE EUROPEAN
ECONOMIC AND SOCIAL COMMITTEE AND THE COMMITTEE
OF THE REGIONS, Analysis of options to move beyond 20%
greenhouse gas emission reductions and assessing the risk of carbon
leakage, Background information and analysis, Part II, Brussels 2010

5761P25/FICHT-8732861-v2G 9-8
[SEC(2011)
288 final]
COMMUNICATION FROM THE COMMISSION TO THE
EUROPEAN PARLIAMENT, THE COUNCIL, THE EUROPEAN
ECONOMIC AND SOCIAL COMMITTEE AND THE COMMITTEE
OF THE REGIONS, A Roadmap for moving to a competitive low
carbon economy in 2050, Brussels 2011
[SGDE 2006] SECRETARÍA GENERAL DE ENERGÍA: PLANIFICACIÓN DE LOS
SECTORES DE ELECTRICIDAD Y GAS 2002-2011
REVISIÓN 2005-2011, Marzo de 2006
[SEC(2011)
1565 final]
COMMISSION STAFF WORKING PAPER, Impact Assessment,
Accompanying the document COMMUNICATION FROM THE
COMMISSION TO THE COUNCIL, THE EUROPEAN
PARLIAMENT, THE EUROPEAN ECONOMIC AND SOCIAL
COMMITTEE AND THE COMMITTEE OF THE REGIONS, Energy
Roadmap 2050, Brussels 2011
[SOAF 2012] European Network of Transmission System Operators for Electricity,
SCENARIO OUTLOOK & ADEQUACY FORECAST 2012-2030,
Brussels 2012, https://www.entsoe.eu/system-development/system-
adequacy-and-market-modeling/soaf-2012-2030/
[STC] Swedish Trade Council, Fact Pack Wind and Solar Energy Morocco
Algeria and Tunisia; EXPORT RÅDET Renewable Energy in Maghreb,
Presentation January 2011,
http://ebookbrowse.com/fact-pack-wind-and-solar-energy-morocco-
algeria-and-tunisia-2-pdf-d179654596, 27/06/2012
[TCBETL] Hergüner, Bilgen, Özeke: Newsletter on Turkish Law Development,
Turkey: Cross-Border Energy Trading Legislation Further Liberalized
Winter 2011/12, ISSN 1308-1632, http://www.the-
atc.org/data/herguner/201201-NewsletterWinter20112012.pdf
[TER 2009] Terna S.p.A. - Rete Elettrica Nazionale: Italy: Mediterranean Electricity
Hub: Overview, 03/02/2009;
http://www.terna.it/LinkClick.aspx?FileTicket=79507, 27/06/2012
[TER 2010] Terna S.p.A. - Rete Elettrica Nazionale: Elmed Project for Tunisia
http://www.terna.it/default/home_en/the_company/about_terna/terna_gr
oup_abroad/growth_abroad/elmed_project.aspx
[The
Guardian]
http://www.guardian.co.uk/news/datablog/2010/apr/30/credit-ratings-
country-fitch-moodys-standard
[THINK] von Hirschhausen et al.: Topic 6, EU Involvement in Electricity and
Natural Gas Transmission Grid Tarification, Final Report, January 2012,
European University Institute (http://think.eui.eu),
http://www.energy.eu/publications/EU_Involvement_in_electricity_and_
natural_gas_transmission_grid_tarification.pdf
[TEIAS] TEIAS, Electricity Market Import and Export Regulation, PART ONE:
Objective, Scope, Legal Basis, Definitions and Abbreviations,
www.teias.gov.tr/yonetmelikler/import.doc
[TTOEU] ICIS-Heren: Turkey to link electricity grids with Europe in June –
ENTSO-E, 04 May 2011,
http://www.icis.com/heren/articles/2011/05/04/9456938/turkey-to-link-
electricity-grids-with-europe-in-june.html
[TYNDP
2010]
ENTSO-E: 10-Year Network Development Plan 2010,
https://www.entsoe.eu/system-development/tyndp/tyndp-2010/
[TYNDP
2012]
ENTSO-E: 10-Year Network Development Plan 2012, 5 July 2012;
https://www.entsoe.eu/news/announcements/newssingleview/browse/1/a
rticle/entso-e-releases-the-ten-year-network-development-plan-
2012/?tx_ttnews%5BbackPid%5D=43&cHash=a509cc4985ad30463b46
b08d4f41c8aa, 26/07/2012

5761P25/FICHT-8732861-v2G 9-9
[UIR] Umweltinvestitionsradar, established within the climate-pro project,
support by German Federal Ministry of Education and Research,
http://uir.fh-
bingen.de/fileadmin/user_upload/Algerien/Energie/Datenbl%C3%A4tter
/Akteure/db_al_en_Akteure_OS_2010_12_20.pdf
[UN_Tool] UNFCCC: Tool to calculate the emission factor for an electricity system.
http://cdm.unfccc.int/methodologies/PAmethodologies/tools/am-tool-07-
v2.2.1.pdf
[UPC] Universidad Pontificia Comillas:
Role of the physical power exchanges in the electricity wholesale
market, 2008
http://www.iit.upcomillas.es/docs/TM-08-110.pdf
[VDKI] Verein der Kohleimporteure: Jahresbericht 2011
[VGB TW] VGB PowerTech e.V., Technical-Scientific Reports: “Analysis of
unavailability of thermal power plants 2001 - 2010”, October 2011
[WEPP] UDI Products Group, World Electric Power Plants Data Base, June 2011

5761P25/FICHT-9661890-v2 10-1
10. Glossary
AAC Already Allocated Capacity
AC Alternating Current
ACER Agency for the Cooperation of Energy Regulators
ARA Amsterdam, Rotterdam, Antwerp
ATC Available Transfer Capacity
B2B Back-to-Back
BAT Best Available Technologies
BEMIP Baltic Energy Market Interconnection Plan
BOT Build Operate Transfer
BOOT Build Own Operate Transfer
BREF BAT Reference Documents
BRELL BRELL synchronous operation zone (Belarus-Russia-Kaliningrad-
Estonia-Latvia-Lithuania)
CAPEX Capital expenditures
CCGT Combined cycle gas turbine
CCS Condenser cooling system
CDM Clean Development Mechanism
CER Certified Emission Reduction
CES Connected Electricity System
CIF incl. Cost Insurance Freight
CIS Commonwealth of Independent States
CM Combined margin
CO2 Carbon dioxide
COTC Commission on Operative-Technological Coordination of parallel
operation of the power systems of the CIS and Baltic countries
CREG Commission de régulation de l’électricité et du gaz
DC Direct Current
EC European Commission
EEA European Economic Area
EHV Extra High Voltage level
ELVs Emission Limit Values
ENTSO European Network of Transmission System Operators
ENTSO-E European Network of Transmission System Operators for Electricity
ENTSO-E RG CE ENTSO-E Regional Group Central Europe
EOH Equivalent Operation Hours
EPC Engineering, Procurement, Construction
EPC CIS Electric Power Council of the CIS
ERUs Emission Reduction Units from Joint Implementation (JI) projects
ETS Emission Trading Scheme
EUA EU Allowances
GHG Greenhouse gases
GT Open cycle gas turbine
HP High pressure
HRSG Heat recovery steam generator
HVAC High Voltage Alternating Current
HVDC High Voltage Direct Current
IE Industrial Emissions
IED Industrial Emissions Directive
IPPC Integrated Pollution Prevention and Control
IPS Interconnected Power Systems

5761P25/FICHT-9661890-v2 10-2
ISO Independent System Operator
ITO Independent Transmission System Operator
JI Joint Implementation
LCC Line Commutated Converter
LCO2 Levelized CO2 cost of electricity
LCP Large Combustion Plant
LDC Least Developed Countries
LEC Levelized electricity cost
LNG Liquefied natural gas
LTC Levelized transmission cost of electricity
MEDRING Mediterranean Energy Ring
MS Member States
NAP National allocation plans
NCV Net calorific value
NOx Oxides of nitrogen
NPC Net present cost
NTC Net transfer capacity
OHL Overhead line
OPEX Operational expenditures
OTC Over-The-Counter
OU Ownership Unbundling
O&M Operation and maintenance
PES Project Electricity System
PoA Programme of Activities
PV Present value
REE Red Eléctrica de España
REN PP Renewable Energy Power Plant
RG CE Regional Group Continental Europe
ROE Return on equity
ROI Return on investment
SC Supercritical steam conditions
SO2 Sulphur dioxide
TNP Transitional National Plan
TRM Transmission Reliability Margin
TSO Transmission System Operator
TYNDP Ten Year Network Development Plan
UCTE Union for the Coordination of Transmission of Electricity
UNFCCC United Nations Framework Convention on Climate Change
UPS Unified Power Systems
USC Ultra-super critical steam conditions
VSC Voltage Source Converter
WACC Weighted average costs of capital
WACCr Weighted average costs of capital, real
WACCn Weighted average costs of capital, nominal
XLPE Cross Linked Polyethylene

5761P25/FICHT-9661890-v2 11-1
11. Annex
11.1 Annex I: Levelized CO2 Prices
Lignite Hard Coal CCGT CCGT GT
USC-PC USC-PC intermediate
base load base load base load load peak load
BG - Bulgaria € / t CO2 28.03 28.03 23.93 23.93 23.93
EE - Estonia € / t CO2 N.A. 27.41 23.58 23.58 23.58
ES - Espania € / t CO2 N.A. 26.78 23.22 23.22 23.22
FI - Finland € / t CO2 N.A. 27.18 23.45 23.45 23.45
GR - Greece € / t CO2 27.47 27.47 23.61 23.61 23.61
HU - Hungary € / t CO2 27.53 27.53 23.65 23.65 23.65
IT - Italy € / t CO2 N.A. 26.97 23.32 23.32 23.32
LT - Lithuania € / t CO2 N.A. 27.76 23.78 23.78 23.78
LV - Latvia € / t CO2 N.A. 27.76 23.78 23.78 23.78
PL - Poland € / t CO2 27.53 27.53 23.65 23.65 23.65
RO - Romania € / t CO2 27.71 27.71 23.75 23.75 23.75
SI - Slovenia € / t CO2 27.47 27.47 23.61 23.61 23.61
SK - Slovakia € / t CO2 27.53 27.53 23.65 23.65 23.65
Average € / t CO2 27.61 27.47 23.61 23.61 23.61
Scenario A Unit
Lignite Hard Coal CCGT CCGT GT
USC-PC USC-PC intermediate
base load base load base load load peak load
BG - Bulgaria € / t CO2 39.38 39.38 32.53 32.53 32.53
EE - Estonia € / t CO2 N.A. 38.47 32.11 32.11 32.11
ES - Espania € / t CO2 N.A. 37.54 31.67 31.67 31.67
FI - Finland € / t CO2 N.A. 38.13 31.95 31.95 31.95
GR - Greece € / t CO2 38.56 38.56 32.15 32.15 32.15
HU - Hungary € / t CO2 38.65 38.65 32.19 32.19 32.19
IT - Italy € / t CO2 N.A. 37.82 31.80 31.80 31.80
LT - Lithuania € / t CO2 N.A. 38.99 32.35 32.35 32.35
LV - Latvia € / t CO2 N.A. 38.99 32.35 32.35 32.35
PL - Poland € / t CO2 38.65 38.65 32.19 32.19 32.19
RO - Romania € / t CO2 38.91 38.91 32.31 32.31 32.31
SI - Slovenia € / t CO2 38.56 38.56 32.15 32.15 32.15
SK - Slovakia € / t CO2 38.65 38.65 32.19 32.19 32.19
Average € / t CO2 38.77 38.56 32.15 32.15 32.15
Scenario B Unit
Lignite Hard Coal CCGT CCGT GT
USC-PC USC-PC intermediate
base load base load base load load peak load
BG - Bulgaria € / t CO2 45.19 45.19 36.06 36.06 36.06
EE - Estonia € / t CO2 N.A. 43.98 35.51 35.51 35.51
ES - Espania € / t CO2 N.A. 42.75 34.94 34.94 34.94
FI - Finland € / t CO2 N.A. 43.53 35.30 35.30 35.30
GR - Greece € / t CO2 44.10 44.10 35.56 35.56 35.56
HU - Hungary € / t CO2 44.22 44.22 35.62 35.62 35.62
IT - Italy € / t CO2 N.A. 43.12 35.11 35.11 35.11
LT - Lithuania € / t CO2 N.A. 44.67 35.82 35.82 35.82
LV - Latvia € / t CO2 N.A. 44.67 35.82 35.82 35.82
PL - Poland € / t CO2 44.22 44.22 35.62 35.62 35.62
RO - Romania € / t CO2 44.56 44.56 35.77 35.77 35.77
SI - Slovenia € / t CO2 44.10 44.10 35.56 35.56 35.56
SK - Slovakia € / t CO2 44.22 44.22 35.62 35.62 35.62
Average € / t CO2 44.37 44.10 35.56 35.56 35.56
Scenario C Unit

5761P25/FICHT-9661890-v2 11-2
11.2 Annex II: Levelized Fuel Prices
Lignite Hard Coal CCGT CCGT GT
USC-PC USC-PC intermediate
base load base load base load load peak load
BG - Bulgaria € / MWht 7.22 15.37 31.46 32.04 35.79
EE - Estonia € / MWht N.A. 15.31 31.52 32.10 35.85
ES - Espania € / MWht N.A. 17.29 31.68 32.25 36.01
FI - Finland € / MWht N.A. 14.16 26.64 27.22 30.98
GR - Greece € / MWht 7.19 15.32 37.20 37.78 41.54
HU - Hungary € / MWht 7.20 15.32 38.35 38.93 42.69
IT - Italy € / MWht N.A. 15.46 40.17 40.75 44.50
LT - Lithuania € / MWht N.A. 15.35 36.85 37.43 41.19
LV - Latvia € / MWht N.A. 15.35 36.59 37.17 40.93
PL - Poland € / MWht 7.20 13.02 29.17 29.75 33.51
RO - Romania € / MWht 7.21 15.34 31.52 32.09 35.85
SI - Slovenia € / MWht 7.19 15.32 45.54 46.11 49.87
SK - Slovakia € / MWht 7.20 15.32 45.50 46.07 49.83
Average € / MWht 7.20 15.23 35.55 36.13 39.89
Scenario A Unit
Lignite Hard Coal CCGT CCGT GT
USC-PC USC-PC intermediate
base load base load base load load peak load
BG - Bulgaria € / MWht 6.85 14.58 30.19 30.77 34.52
EE - Estonia € / MWht N.A. 14.56 30.29 30.87 34.62
ES - Espania € / MWht N.A. 16.47 30.48 31.06 34.82
FI - Finland € / MWht N.A. 13.48 25.61 26.19 29.95
GR - Greece € / MWht 6.84 14.56 35.75 36.33 40.09
HU - Hungary € / MWht 6.84 14.56 36.85 37.43 41.18
IT - Italy € / MWht N.A. 14.72 38.65 39.22 42.98
LT - Lithuania € / MWht N.A. 14.57 35.39 35.97 39.72
LV - Latvia € / MWht N.A. 14.57 35.14 35.72 39.48
PL - Poland € / MWht 6.84 12.37 27.81 28.38 32.14
RO - Romania € / MWht 6.84 14.57 30.14 30.72 34.47
SI - Slovenia € / MWht 6.84 14.56 43.76 44.34 48.10
SK - Slovakia € / MWht 6.84 14.56 43.72 44.30 48.05
Average € / MWht 6.84 14.47 34.14 34.72 38.47
Scenario B Unit
Lignite Hard Coal CCGT CCGT GT
USC-PC USC-PC intermediate
base load base load base load load peak load
BG - Bulgaria € / MWht 5.97 12.71 28.14 28.72 32.47
EE - Estonia € / MWht N.A. 12.71 28.30 28.88 32.64
ES - Espania € / MWht N.A. 14.42 28.56 29.14 32.90
FI - Finland € / MWht N.A. 11.78 23.95 24.53 28.29
GR - Greece € / MWht 5.97 12.71 33.41 33.99 37.74
HU - Hungary € / MWht 5.97 12.71 34.43 35.00 38.76
IT - Italy € / MWht N.A. 12.88 36.19 36.77 40.53
LT - Lithuania € / MWht N.A. 12.71 29.49 30.07 33.82
LV - Latvia € / MWht N.A. 12.71 32.80 33.37 37.13
PL - Poland € / MWht 5.97 10.80 25.97 26.54 30.30
RO - Romania € / MWht 5.97 12.71 28.13 28.71 32.46
SI - Slovenia € / MWht 5.97 12.71 40.90 41.48 45.23
SK - Slovakia € / MWht 5.97 12.71 40.85 41.43 45.18
Average € / MWht 5.97 12.64 31.62 32.20 35.96
Scenario C Unit

5761P25/FICHT-9661890-v2 11-3
11.3 Annex III: Levelized CO2 Costs of Electricity
Lignite Hard Coal CCGT CCGT GT
USC-PC USC-PC intermediate
base load base load base load load peak load
BG - Bulgaria € / MWhe 26.21 21.02 8.74 8.74 12.72
EE - Estonia € / MWhe N.A. 20.56 8.61 8.61 12.53
ES - Espania € / MWhe N.A. 20.09 8.48 8.48 12.34
FI - Finland € / MWhe N.A. 20.39 8.56 8.56 12.46
GR - Greece € / MWhe 25.69 20.60 8.63 8.63 12.55
HU - Hungary € / MWhe 25.75 20.65 8.64 8.64 12.57
IT - Italy € / MWhe N.A. 20.23 8.52 8.52 12.40
LT - Lithuania € / MWhe N.A. 20.82 8.69 8.69 12.64
LV - Latvia € / MWhe N.A. 20.82 8.69 8.69 12.64
PL - Poland € / MWhe 25.75 20.65 8.64 8.64 12.57
RO - Romania € / MWhe 25.91 20.78 8.67 8.67 12.62
SI - Slovenia € / MWhe 25.69 20.60 8.63 8.63 12.55
SK - Slovakia € / MWhe 25.75 20.65 8.64 8.64 12.57
Average € / MWhe 25.82 20.60 8.63 8.63 12.55
Scenario A Unit
Lignite Hard Coal CCGT CCGT GT
USC-PC USC-PC intermediate
base load base load base load load peak load
BG - Bulgaria € / MWhe 36.83 29.54 11.88 11.88 17.29
EE - Estonia € / MWhe N.A. 28.85 11.73 11.73 17.07
ES - Espania € / MWhe N.A. 28.16 11.57 11.57 16.84
FI - Finland € / MWhe N.A. 28.60 11.67 11.67 16.98
GR - Greece € / MWhe 36.06 28.92 11.74 11.74 17.09
HU - Hungary € / MWhe 36.14 28.99 11.76 11.76 17.11
IT - Italy € / MWhe N.A. 28.36 11.62 11.62 16.91
LT - Lithuania € / MWhe N.A. 29.24 11.82 11.82 17.20
LV - Latvia € / MWhe N.A. 29.24 11.82 11.82 17.20
PL - Poland € / MWhe 36.14 28.99 11.76 11.76 17.11
RO - Romania € / MWhe 36.39 29.18 11.80 11.80 17.18
SI - Slovenia € / MWhe 36.06 28.92 11.74 11.74 17.09
SK - Slovakia € / MWhe 36.14 28.99 11.76 11.76 17.11
Average € / MWhe 36.25 28.92 11.74 11.74 17.09
Scenario B Unit
Lignite Hard Coal CCGT CCGT GT
USC-PC USC-PC intermediate
base load base load base load load peak load
BG - Bulgaria € / MWhe 42.26 33.89 13.17 13.17 19.17
EE - Estonia € / MWhe N.A. 32.98 12.97 12.97 18.87
ES - Espania € / MWhe N.A. 32.06 12.76 12.76 18.57
FI - Finland € / MWhe N.A. 32.65 12.89 12.89 18.76
GR - Greece € / MWhe 41.24 33.07 12.99 12.99 18.90
HU - Hungary € / MWhe 41.35 33.16 13.01 13.01 18.93
IT - Italy € / MWhe N.A. 32.34 12.82 12.82 18.66
LT - Lithuania € / MWhe N.A. 33.50 13.09 13.09 19.04
LV - Latvia € / MWhe N.A. 33.50 13.09 13.09 19.04
PL - Poland € / MWhe 41.35 33.16 13.01 13.01 18.93
RO - Romania € / MWhe 41.67 33.42 13.07 13.07 19.02
SI - Slovenia € / MWhe 41.24 33.07 12.99 12.99 18.90
SK - Slovakia € / MWhe 41.35 33.16 13.01 13.01 18.93
Average € / MWhe 41.50 33.08 12.99 12.99 18.90
Scenario C Unit

5761P25/FICHT-8732861-v2G 11-4
11.4 Annex IV: Levelized Fuel Costs of Electricity
Lignite Hard Coal CCGT CCGT GT
USC-PC USC-PC intermediate
base load base load base load load peak load
BG - Bulgaria € / MWhe 16.71 33.71 56.89 57.93 94.19
EE - Estonia € / MWhe N.A. 33.58 57.00 58.04 94.35
ES - Espania € / MWhe N.A. 37.92 57.28 58.32 94.76
FI - Finland € / MWhe N.A. 31.06 48.18 49.22 81.52
GR - Greece € / MWhe 16.65 33.59 67.28 68.32 109.31
HU - Hungary € / MWhe 16.66 33.61 69.35 70.40 112.33
IT - Italy € / MWhe N.A. 33.91 72.64 73.69 117.12
LT - Lithuania € / MWhe N.A. 33.66 66.64 67.69 108.38
LV - Latvia € / MWhe N.A. 33.66 66.17 67.22 107.71
PL - Poland € / MWhe 16.66 28.55 52.75 53.80 88.17
RO - Romania € / MWhe 16.68 33.64 56.99 58.04 94.34
SI - Slovenia € / MWhe 16.65 33.59 82.34 83.39 131.23
SK - Slovakia € / MWhe 16.66 33.61 82.27 83.31 131.13
Average € / MWhe 16.67 33.39 64.29 65.34 104.96
Scenario A Unit
Lignite Hard Coal CCGT CCGT GT
USC-PC USC-PC intermediate
base load base load base load load peak load
BG - Bulgaria € / MWhe 15.86 31.98 54.60 55.64 90.86
EE - Estonia € / MWhe N.A. 31.92 54.77 55.82 91.11
ES - Espania € / MWhe N.A. 36.13 55.12 56.17 91.62
FI - Finland € / MWhe N.A. 29.56 46.32 47.36 78.81
GR - Greece € / MWhe 15.83 31.93 64.65 65.70 105.49
HU - Hungary € / MWhe 15.83 31.94 66.64 67.68 108.38
IT - Italy € / MWhe N.A. 32.29 69.89 70.93 113.11
LT - Lithuania € / MWhe N.A. 31.96 64.00 65.04 104.54
LV - Latvia € / MWhe N.A. 31.96 63.55 64.60 103.89
PL - Poland € / MWhe 15.83 27.13 50.28 51.33 84.58
RO - Romania € / MWhe 15.84 31.95 54.50 55.55 90.72
SI - Slovenia € / MWhe 15.83 31.93 79.14 80.18 126.57
SK - Slovakia € / MWhe 15.83 31.94 79.06 80.10 126.45
Average € / MWhe 15.84 31.74 61.73 62.78 101.24
Scenario B Unit
Lignite Hard Coal CCGT CCGT GT
USC-PC USC-PC intermediate
base load base load base load load peak load
BG - Bulgaria € / MWhe 13.82 27.87 50.88 51.93 85.45
EE - Estonia € / MWhe N.A. 27.88 51.18 52.23 85.89
ES - Espania € / MWhe N.A. 31.62 51.65 52.69 86.57
FI - Finland € / MWhe N.A. 25.83 43.31 44.36 74.44
GR - Greece € / MWhe 13.82 27.88 60.41 61.46 99.32
HU - Hungary € / MWhe 13.82 27.88 62.25 63.30 102.00
IT - Italy € / MWhe N.A. 28.24 65.45 66.49 106.65
LT - Lithuania € / MWhe N.A. 27.87 53.33 54.37 89.01
LV - Latvia € / MWhe N.A. 27.87 59.31 60.35 97.71
PL - Poland € / MWhe 13.82 23.68 46.96 48.00 79.74
RO - Romania € / MWhe 13.82 27.87 50.87 51.91 85.43
SI - Slovenia € / MWhe 13.82 27.88 73.96 75.01 119.04
SK - Slovakia € / MWhe 13.82 27.88 73.87 74.91 118.90
Average € / MWhe 13.82 27.71 57.19 58.23 94.63
Scenario C Unit

5761P25/FICHT-8732861-v2G 11-5
11.5 Annex V: Results for power plant investment competition between EU and non-EU countries
Bulgaria - Turkey
Base load Intermediate load Peak Load
Scenario A EU Non-EU Non-EU breakeven EU Non-EU Non-EU breakeven EU Non-EU Non-EU breakeven
Bulgaria Turkey Turkey Bulgaria Turkey Turkey Bulgaria Turkey Turkey
Lignite Lignite Lignite CCGT CCGT CCGT GT GT GT
USC-PC USC-PC USC-PC
Item base load base load base load intermediate load intermediate load intermediate load peak load peak load peak load
Levelized composite cost € / MWhe 71.0 47.4 71.0 83.1 86.5 n.a. 147.0 158.7 n.a.
Levelized marginal cost € / MWhe 44.9 18.6 17.6 70.0 71.4 n.a. 111.9 114.0 n.a.
Levelized CO2 certificate cost € / MWhe 26.2 0.0 0.0 8.7 0.0 n.a. 12.7 0.0 n.a.
Levelized transmission cost € / MWhe n.a. 0.4 0.8 n.a. 0.7 n.a. n.a. 2.5 n.a.
WACC (discount rate, real) % 4.6% 5.1% 13.2% 4.6% 5.1% n.a. 4.6% 5.1% n.a.
Scenario B EU Non-EU Non-EU breakeven EU Non-EU Non-EU breakeven EU Non-EU Non-EU breakeven
Bulgaria Turkey Turkey Bulgaria Turkey Turkey Bulgaria Turkey Turkey
CCGT Lignite Lignite CCGT CCGT CCGT GT GT GT
- USC-PC USC-PC
Item base load base load base load intermediate load intermediate load intermediate load peak load peak load peak load
Levelized composite cost € / MWhe 77.7 46.6 77.7 84.0 83.9 84.0 148.2 154.9 n.a.
Levelized marginal cost € / MWhe 69.8 17.8 17.1 70.9 68.8 68.8 113.2 110.2 n.a.
Levelized CO2 certificate cost € / MWhe 11.9 0.0 0.0 11.9 0.0 0.0 17.3 0.0 n.a.
Levelized transmission cost € / MWhe n.a. 0.4 0.9 n.a. 0.7 0.7 n.a. 2.5 n.a.
WACC (discount rate, real) % 4.6% 5.1% 15.4% 4.6% 5.1% 5.2% 4.6% 5.1% n.a.
Scenario C EU Non-EU Non-EU breakeven EU Non-EU Non-EU breakeven EU Non-EU Non-EU breakeven
Bulgaria Turkey Turkey Bulgaria Turkey Turkey Bulgaria Turkey Turkey
CCGT Lignite Lignite CCGT CCGT CCGT GT GT GT
- USC-PC USC-PC
Item base load base load base load intermediate load intermediate load intermediate load peak load peak load peak load
Levelized composite cost € / MWhe 75.3 44.6 75.3 81.6 79.7 81.6 144.7 148.7 n.a.
Levelized marginal cost € / MWhe 67.4 15.8 15.6 68.4 64.6 64.5 109.6 104.0 n.a.
Levelized CO2 certificate cost € / MWhe 13.2 0.0 0.0 13.2 0.0 0.0 19.2 0.0 n.a.
Levelized transmission cost € / MWhe n.a. 0.4 0.9 n.a. 0.7 0.8 n.a. 2.5 n.a.
WACC (discount rate, real) % 4.6% 5.1% 15.1% 4.6% 5.1% 6.7% 4.6% 5.1% n.a.

5761P25/FICHT-8732861-v2G 11-6
Greece - Turkey
Base load Intermediate load Peak Load
Scenario A EU Non-EU Non-EU breakeven EU Non-EU Non-EU breakeven EU Non-EU Non-EU breakeven
Greece Turkey Turkey Greece Turkey Turkey Greece Turkey Turkey
Lignite Lignite Lignite CCGT CCGT CCGT GT GT GT
USC-PC USC-PC USC-PC
Item base load base load base load intermediate load intermediate load intermediate load peak load peak load peak load
Levelized composite cost € / MWhe 73.0 47.1 73.0 94.9 86.6 94.9 170.7 156.7 170.7
Levelized marginal cost € / MWhe 44.3 18.6 17.5 80.3 71.4 67.3 126.9 114.0 110.3
Levelized CO2 certificate cost € / MWhe 25.7 0.0 0.0 8.6 0.0 0.0 12.6 0.0 0.0
Levelized transmission cost € / MWhe n.a. 0.5 1.2 n.a. 1.0 2.1 n.a. 3.7 565.1%
WACC (discount rate, real) % 5.1% 5.1% 13.8% 5.1% 5.1% 13.8% 5.1% 5.1% 9.8%
Scenario B EU Non-EU Non-EU breakeven EU Non-EU Non-EU breakeven EU Non-EU Non-EU breakeven
Greece Turkey Turkey Greece Turkey Turkey Greece Turkey Turkey
Lignite Lignite Lignite CCGT CCGT CCGT GT GT GT
USC-PC USC-PC USC-PC
Item base load base load base load intermediate load intermediate load intermediate load peak load peak load peak load
Levelized composite cost € / MWhe 82.5 46.3 82.5 95.4 84.0 95.4 171.4 152.9 171.4
Levelized marginal cost € / MWhe 53.8 17.8 17.0 80.8 68.8 65.7 127.6 110.2 107.3
Levelized CO2 certificate cost € / MWhe 36.1 0.0 0.0 11.7 0.0 0.0 17.1 0.0 0.0
Levelized transmission cost € / MWhe n.a. 0.5 1.5 n.a. 1.0 2.2 n.a. 3.7 606.5%
WACC (discount rate, real) % 5.1% 5.1% 16.8% 5.1% 5.1% 15.1% 5.1% 5.1% 10.8%
Scenario C EU Non-EU Non-EU breakeven EU Non-EU Non-EU breakeven EU Non-EU Non-EU breakeven
Greece Turkey Turkey Greece Turkey Turkey Greece Turkey Turkey
CCGT Lignite CCGT CCGT CCGT CCGT GT GT GT
- USC-PC -
Item base load base load base load intermediate load intermediate load intermediate load peak load peak load peak load
Levelized composite cost € / MWhe 85.5 44.3 85.5 92.4 79.7 92.4 167.0 146.7 167.0
Levelized marginal cost € / MWhe 76.7 15.8 62.5 77.8 64.6 64.0 123.2 104.0 103.5
Levelized CO2 certificate cost € / MWhe 13.0 0.0 0.0 13.0 0.0 0.0 18.9 0.0 0.0
Levelized transmission cost € / MWhe n.a. 0.5 1.8 n.a. 1.0 2.1 n.a. 3.7 600.0%
WACC (discount rate, real) % 5.1% 5.1% 20.3% 5.1% 5.1% 14.3% 5.1% 5.1% 10.6%

5761P25/FICHT-8732861-v2G 11-7
Hungary - Serbia
Base load Intermediate load Peak Load
Scenario A EU Non-EU Non-EU breakeven EU Non-EU Non-EU breakeven EU Non-EU Non-EU breakeven
Hungary Serbia Serbia Hungary Serbia Serbia Hungary Serbia Serbia
Lignite Lignite Lignite CCGT CCGT CCGT GT GT GT
USC-PC USC-PC USC-PC
Item base load base load base load intermediate load intermediate load intermediate load peak load peak load peak load
Levelized composite cost € / MWhe n.a. n.a. n.a. n.a. n.a. n.a. 168.0 152.4 168.0
Levelized marginal cost € / MWhe n.a. n.a. n.a. n.a. n.a. n.a. 129.9 112.5 108.4
Levelized CO2 certificate cost € / MWhe n.a. n.a. n.a. n.a. n.a. n.a. 12.6 0.0 0.0
Levelized transmission cost € / MWhe n.a. n.a. n.a. n.a. n.a. n.a. n.a. 3.5 578.6%
WACC (discount rate, real) % n.a. n.a. n.a. n.a. n.a. n.a. 5.0% 4.6% 10.1%
Scenario B EU Non-EU Non-EU breakeven EU Non-EU Non-EU breakeven EU Non-EU Non-EU breakeven
Hungary Serbia Serbia Hungary Serbia Serbia Hungary Serbia Serbia
Lignite Lignite Lignite CCGT CCGT CCGT GT GT GT
USC-PC USC-PC USC-PC
Item base load base load base load intermediate load intermediate load intermediate load peak load peak load peak load
Levelized composite cost € / MWhe n.a. n.a. n.a. n.a. n.a. n.a. 168.6 148.6 168.6
Levelized marginal cost € / MWhe n.a. n.a. n.a. n.a. n.a. n.a. 130.5 108.7 105.5
Levelized CO2 certificate cost € / MWhe n.a. n.a. n.a. n.a. n.a. n.a. 17.1 0.0 0.0
Levelized transmission cost € / MWhe n.a. n.a. n.a. n.a. n.a. n.a. n.a. 3.5 617.6%
WACC (discount rate, real) % n.a. n.a. n.a. n.a. n.a. n.a. 5.0% 4.6% 11.0%
Scenario C EU Non-EU Non-EU breakeven EU Non-EU Non-EU breakeven EU Non-EU Non-EU breakeven
Hungary Serbia Serbia Hungary Serbia Serbia Hungary Serbia Serbia
Lignite Lignite CCGT CCGT CCGT CCGT GT GT GT
USC-PC USC-PC -
Item base load base load base load intermediate load intermediate load intermediate load peak load peak load peak load
Levelized composite cost € / MWhe n.a. n.a. n.a. n.a. n.a. n.a. 164.0 142.3 164.0
Levelized marginal cost € / MWhe n.a. n.a. n.a. n.a. n.a. n.a. 125.9 102.5 101.9
Levelized CO2 certificate cost € / MWhe n.a. n.a. n.a. n.a. n.a. n.a. 18.9 0.0 0.0
Levelized transmission cost € / MWhe n.a. n.a. n.a. n.a. n.a. n.a. n.a. 3.5 606.8%

5761P25/FICHT-8732861-v2G 11-8
Italy - Montenegro
Base load Intermediate load Peak Load
Scenario A EU Non-EU Non-EU breakeven EU Non-EU Non-EU breakeven EU Non-EU Non-EU breakeven
Italy Montenegro Montenegro Italy Montenegro Montenegro Italy Montenegro Montenegro
Hard Coal Hard Coal Hard Coal CCGT CCGT CCGT GT GT GT
USC-PC USC-PC USC-PC
Item base load base load base load intermediate load intermediate load intermediate load peak load peak load peak load
Levelized composite cost € / MWhe 82.1 66.8 82.1 100.8 n.a. n.a. 179.3 n.a. n.a.
Levelized marginal cost € / MWhe 55.3 34.9 33.7 85.5 n.a. n.a. 134.5 n.a. n.a.
Levelized CO2 certificate cost € / MWhe 20.2 n.a. 0.0 8.5 n.a. n.a. 12.4 n.a. n.a.
Levelized transmission cost € / MWhe n.a. 8.6 14.2 n.a. 16.8 n.a. n.a. 60.6 n.a.
WACC (discount rate, real) % 5.5% 4.6% 9.1% 5.5% 4.6% n.a. 5.5% 4.6% n.a.
Scenario B EU Non-EU Non-EU breakeven EU Non-EU Non-EU breakeven EU Non-EU Non-EU breakeven
Italy Montenegro Montenegro Italy Montenegro Montenegro Italy Montenegro Montenegro
Hard Coal Hard Coal Hard Coal CCGT CCGT CCGT GT GT GT
USC-PC USC-PC USC-PC
Item base load base load base load intermediate load intermediate load intermediate load peak load peak load peak load
Levelized composite cost € / MWhe 88.6 65.0 88.6 101.1 n.a. n.a. 179.8 n.a. n.a.
Levelized marginal cost € / MWhe 61.8 33.1 32.3 85.9 n.a. n.a. 135.0 n.a. n.a.
Levelized CO2 certificate cost € / MWhe 28.4 n.a. 0.0 11.6 n.a. n.a. 16.9 n.a. n.a.
Levelized transmission cost € / MWhe n.a. 8.6 16.8 n.a. 16.8 n.a. n.a. 60.6 n.a.
WACC (discount rate, real) % 5.5% 4.6% 11.0% 5.5% 4.6% n.a. 5.5% 4.6% n.a.
Scenario C EU Non-EU Non-EU breakeven EU Non-EU Non-EU breakeven EU Non-EU Non-EU breakeven
Italy Montenegro Montenegro Italy Montenegro Montenegro Italy Montenegro Montenegro
Hard Coal Hard Coal Hard Coal CCGT CCGT CCGT GT GT GT
USC-PC USC-PC USC-PC
Item base load base load base load intermediate load intermediate load intermediate load peak load peak load peak load
Levelized composite cost € / MWhe 88.6 60.9 88.6 97.9 n.a. n.a. 175.1 n.a. n.a.
Levelized marginal cost € / MWhe 61.7 29.0 28.9 82.6 n.a. n.a. 130.3 n.a. n.a.
Levelized CO2 certificate cost € / MWhe 32.3 n.a. 0.0 12.8 n.a. n.a. 18.7 n.a. n.a.
Levelized transmission cost € / MWhe n.a. 8.6 17.9 n.a. 16.8 n.a. n.a. 60.6 n.a.
WACC (discount rate, real) % 5.5% 4.6% 11.8% 5.5% 4.6% n.a. 5.5% 4.6% n.a.

5761P25/FICHT-8732861-v2G 11-9
Italy - Algeria
Base load Intermediate load Peak Load
Scenario A EU Non-EU Non-EU breakeven EU Non-EU Non-EU breakeven EU Non-EU Non-EU breakeven
Italy Algeria Algeria Italy Algeria Algeria Italy Algeria Algeria
Hard Coal Hard Coal CCGT CCGT CCGT CCGT GT GT GT
USC-PC USC-PC -
Item base load base load base load intermediate load intermediate load intermediate load peak load peak load peak load
Levelized composite cost € / MWhe 82.1 67.7 82.1 100.8 84.1 100.8 179.3 182.8 n.a.
Levelized marginal cost € / MWhe 55.3 34.7 50.3 85.5 54.1 51.7 134.5 88.8 n.a.
Levelized CO2 certificate cost € / MWhe 20.2 0.0 0.0 8.5 0.0 0.0 12.4 0.0 n.a.
Levelized transmission cost € / MWhe n.a. 8.4 17.9 n.a. 16.2 27.4 n.a. 58.3 n.a.
WACC (discount rate, real) % 5.5% 5.3% 12.8% 5.5% 5.3% 11.6% 5.5% 5.3% n.a.
Scenario B EU Non-EU Non-EU breakeven EU Non-EU Non-EU breakeven EU Non-EU Non-EU breakeven
Italy Algeria Algeria Italy Algeria Algeria Italy Algeria Algeria
Hard Coal Hard Coal CCGT CCGT CCGT CCGT GT GT GT
USC-PC USC-PC -
Item base load base load base load intermediate load intermediate load intermediate load peak load peak load peak load
Levelized composite cost € / MWhe 88.6 66.1 88.6 101.1 82.2 101.1 179.8 180.0 n.a.
Levelized marginal cost € / MWhe 61.8 33.0 48.5 85.9 52.2 50.5 135.0 86.0 n.a.
Levelized CO2 certificate cost € / MWhe 28.4 0.0 0.0 11.6 0.0 0.0 16.9 0.0 n.a.
Levelized transmission cost € / MWhe n.a. 8.4 22.7 n.a. 16.2 28.4 n.a. 58.3 n.a.
WACC (discount rate, real) % 5.5% 5.3% 16.7% 5.5% 5.3% 12.1% 5.5% 5.3% n.a.
Scenario C EU Non-EU Non-EU breakeven EU Non-EU Non-EU breakeven EU Non-EU Non-EU breakeven
Italy Algeria Algeria Italy Algeria Algeria Italy Algeria Algeria
Hard Coal Hard Coal CCGT CCGT CCGT CCGT GT GT GT
USC-PC USC-PC -
Item base load base load base load intermediate load intermediate load intermediate load peak load peak load peak load
Levelized composite cost € / MWhe 88.6 62.0 88.6 97.9 79.1 97.9 175.1 175.5 n.a.
Levelized marginal cost € / MWhe 61.7 29.0 47.4 82.6 49.1 48.7 130.3 81.5 n.a.
Levelized CO2 certificate cost € / MWhe 32.3 0.0 0.0 12.8 0.0 0.0 18.7 0.0 n.a.
Levelized transmission cost € / MWhe n.a. 8.4 23.4 n.a. 16.2 27.5 n.a. 58.3 n.a.
WACC (discount rate, real) % 5.5% 5.3% 17.2% 5.5% 5.3% 11.6% 5.5% 5.3% n.a.

5761P25/FICHT-8732861-v2G 11-10
Italy - Albania
Base load Intermediate load Peak Load
Scenario A EU Non-EU Non-EU breakeven EU Non-EU Non-EU breakeven EU Non-EU Non-EU breakeven
Italy Albania Albania Italy Albania Albania Italy Albania Albania
Hard Coal Hard Coal Hard Coal CCGT CCGT CCGT GT GT GT
USC-PC USC-PC USC-PC
Item base load base load base load intermediate load intermediate load intermediate load peak load peak load peak load
Levelized composite cost € / MWhe 82.1 66.6 82.1 100.8 n.a. n.a. 179.3 n.a. n.a.
Levelized marginal cost € / MWhe 55.3 34.8 33.6 85.5 n.a. n.a. 134.5 n.a. n.a.
Levelized CO2 certificate cost € / MWhe 20.2 n.a. 0.0 8.5 n.a. n.a. 12.4 n.a. n.a.
Levelized transmission cost € / MWhe n.a. 8.3 13.7 n.a. 16.1 n.a. n.a. 57.9 n.a.
WACC (discount rate, real) % 5.5% 4.9% 9.5% 5.5% 4.9% n.a. 5.5% 4.9% n.a.
Scenario B EU Non-EU Non-EU breakeven EU Non-EU Non-EU breakeven EU Non-EU Non-EU breakeven
Italy Albania Albania Italy Albania Albania Italy Albania Albania
Hard Coal Hard Coal Hard Coal CCGT CCGT CCGT GT GT GT
USC-PC USC-PC USC-PC
Item base load base load base load intermediate load intermediate load intermediate load peak load peak load peak load
Levelized composite cost € / MWhe 88.6 64.9 88.6 101.1 n.a. n.a. 179.8 n.a. n.a.
Levelized marginal cost € / MWhe 61.8 33.1 32.3 85.9 n.a. n.a. 135.0 n.a. n.a.
Levelized CO2 certificate cost € / MWhe 28.4 n.a. 0.0 11.6 n.a. n.a. 16.9 n.a. n.a.
Levelized transmission cost € / MWhe n.a. 8.3 16.2 n.a. 16.1 n.a. n.a. 57.9 n.a.
WACC (discount rate, real) % 5.5% 4.9% 11.5% 5.5% 4.9% n.a. 5.5% 4.9% n.a.
Scenario C EU Non-EU Non-EU breakeven EU Non-EU Non-EU breakeven EU Non-EU Non-EU breakeven
Italy Albania Albania Italy Albania Albania Italy Albania Albania
Hard Coal Hard Coal Hard Coal CCGT CCGT CCGT GT GT GT
USC-PC USC-PC USC-PC
Item base load base load base load intermediate load intermediate load intermediate load peak load peak load peak load
Levelized composite cost € / MWhe 88.6 60.8 88.6 97.9 n.a. n.a. 175.1 n.a. n.a.
Levelized marginal cost € / MWhe 61.7 29.0 28.9 82.6 n.a. n.a. 130.3 n.a. n.a.
Levelized CO2 certificate cost € / MWhe 32.3 n.a. 0.0 12.8 n.a. n.a. 18.7 n.a. n.a.
Levelized transmission cost € / MWhe n.a. 8.3 17.3 n.a. 16.1 n.a. n.a. 57.9 n.a.
WACC (discount rate, real) % 5.5% 4.9% 12.3% 5.5% 4.9% n.a. 5.5% 4.9% n.a.

5761P25/FICHT-8732861-v2G 11-11
Romania - Turkey
Base load Intermediate load Peak Load
Scenario A EU Non-EU Non-EU breakeven EU Non-EU Non-EU breakeven EU Non-EU Non-EU breakeven
Romania Turkey Turkey Romania Turkey Turkey Romania Turkey Turkey
Lignite Hard Coal Hard Coal CCGT CCGT CCGT GT GT GT
USC-PC USC-PC USC-PC
Item base load base load base load intermediate load intermediate load intermediate load peak load peak load peak load
Levelized composite cost € / MWhe 71.4 69.9 71.4 83.3 104.2 n.a. 147.8 222.0 n.a.
Levelized marginal cost € / MWhe 44.5 35.0 34.9 69.8 71.4 n.a. 111.6 114.0 n.a.
Levelized CO2 certificate cost € / MWhe 25.9 0.0 0.0 8.7 0.0 n.a. 12.6 0.0 n.a.
Levelized transmission cost € / MWhe n.a. 9.5 10.0 n.a. 18.4 n.a. n.a. 66.2 n.a.
WACC (discount rate, real) % 4.9% 5.1% 5.5% 4.9% 5.1% n.a. 4.9% 5.1% n.a.
Scenario B EU Non-EU Non-EU breakeven EU Non-EU Non-EU breakeven EU Non-EU Non-EU breakeven
Romania Turkey Turkey Romania Turkey Turkey Romania Turkey Turkey
CCGT Hard Coal Hard Coal CCGT CCGT CCGT GT GT GT
- USC-PC USC-PC
Item base load base load base load intermediate load intermediate load intermediate load peak load peak load peak load
Levelized composite cost € / MWhe 77.7 68.3 77.7 84.2 101.6 n.a. 149.1 218.2 n.a.
Levelized marginal cost € / MWhe 69.7 33.3 33.0 70.7 68.8 n.a. 112.9 110.2 n.a.
Levelized CO2 certificate cost € / MWhe 11.8 0.0 0.0 11.8 0.0 n.a. 17.2 0.0 n.a.
Levelized transmission cost € / MWhe n.a. 9.5 12.9 n.a. 18.4 n.a. n.a. 66.2 n.a.
WACC (discount rate, real) % 4.9% 5.1% 7.7% 4.9% 5.1% n.a. 4.9% 5.1% n.a.
Scenario C EU Non-EU Non-EU breakeven EU Non-EU Non-EU breakeven EU Non-EU Non-EU breakeven
Romania Turkey Turkey Romania Turkey Turkey Romania Turkey Turkey
CCGT Hard Coal Hard Coal CCGT CCGT CCGT GT GT GT
- USC-PC USC-PC
Item base load base load base load intermediate load intermediate load intermediate load peak load peak load peak load
Levelized composite cost € / MWhe 75.4 64.2 75.4 81.8 97.4 n.a. 145.7 212.1 n.a.
Levelized marginal cost € / MWhe 67.3 29.3 29.2 68.3 64.6 n.a. 109.5 104.0 n.a.
Levelized CO2 certificate cost € / MWhe 13.1 0.0 0.0 13.1 0.0 n.a. 19.0 0.0 n.a.
Levelized transmission cost € / MWhe n.a. 9.5 13.4 n.a. 18.4 n.a. n.a. 66.2 n.a.
WACC (discount rate, real) % 4.9% 5.1% 8.1% 4.9% 5.1% n.a. 4.9% 5.1% n.a.

5761P25/FICHT-8732861-v2G 11-12
Romania - Serbia
Base load Intermediate load Peak Load
Scenario A EU Non-EU Non-EU breakeven EU Non-EU Non-EU breakeven EU Non-EU Non-EU breakeven
Romania Serbia Serbia Romania Serbia Serbia Romania Serbia Serbia
Lignite Lignite Lignite CCGT CCGT CCGT GT GT GT
USC-PC USC-PC USC-PC
Item base load base load base load intermediate load intermediate load intermediate load peak load peak load peak load
Levelized composite cost € / MWhe 71.4 45.7 71.4 83.3 84.8 n.a. 147.8 153.1 n.a.
Levelized marginal cost € / MWhe 44.5 18.7 17.6 69.8 70.4 n.a. 111.6 112.5 n.a.
Levelized CO2 certificate cost € / MWhe 25.9 0.0 0.0 8.7 0.0 n.a. 12.6 0.0 n.a.
Levelized transmission cost € / MWhe n.a. 0.5 1.2 n.a. 1.0 n.a. n.a. 3.5 n.a.
WACC (discount rate, real) % 4.9% 4.6% 13.5% 4.9% 4.6% n.a. 4.9% 4.6% n.a.
Scenario B EU Non-EU Non-EU breakeven EU Non-EU Non-EU breakeven EU Non-EU Non-EU breakeven
Romania Serbia Serbia Romania Serbia Serbia Romania Serbia Serbia
CCGT Lignite Lignite CCGT CCGT CCGT GT GT GT
- USC-PC USC-PC
Item base load base load base load intermediate load intermediate load intermediate load peak load peak load peak load
Levelized composite cost € / MWhe 77.7 44.9 77.7 84.2 82.2 84.2 149.1 149.2 n.a.
Levelized marginal cost € / MWhe 69.7 17.8 17.1 70.7 67.8 67.0 112.9 108.7 n.a.
Levelized CO2 certificate cost € / MWhe 11.8 0.0 0.0 11.8 0.0 0.0 17.2 0.0 n.a.
Levelized transmission cost € / MWhe n.a. 0.5 1.4 n.a. 1.0 1.2 n.a. 3.5 n.a.
WACC (discount rate, real) % 4.9% 4.6% 15.6% 4.9% 4.6% 6.9% 4.9% 4.6% n.a.
Scenario C EU Non-EU Non-EU breakeven EU Non-EU Non-EU breakeven EU Non-EU Non-EU breakeven
Romania Serbia Serbia Romania Serbia Serbia Romania Serbia Serbia
CCGT Lignite Lignite CCGT CCGT CCGT GT GT GT
- USC-PC USC-PC
Item base load base load base load intermediate load intermediate load intermediate load peak load peak load peak load
Levelized composite cost € / MWhe 75.4 42.8 75.4 81.8 77.9 81.8 145.7 143.0 145.7
Levelized marginal cost € / MWhe 67.3 15.8 15.6 68.3 63.5 63.3 109.5 102.5 102.4
Levelized CO2 certificate cost € / MWhe 13.1 0.0 0.0 13.1 0.0 0.0 19.0 0.0 0.0
Levelized transmission cost € / MWhe n.a. 0.5 1.3 n.a. 1.0 1.3 n.a. 3.5 386.3%
WACC (discount rate, real) % 4.9% 4.6% 15.3% 4.9% 4.6% 7.8% 4.9% 4.6% 5.5%

5761P25/FICHT-8732861-v2G 11-13
Copyright © 2022 FDOKUMEN