Frequency-based transit assignment considering seat capacities
32
Frequency-based Transit Assignment Considering Seat Capacities Jan-Dirk Schmöcker a , Achille Fonzone b , Hiroshi Shimamoto a , Fumitaka Kurauchi c and Michael G H Bell b a Department of Urban Management, Kyoto University, Japan, b Centre for Transport Studies, Imperial College London, UK c Department of Civil Engineering, Gifu University, Japan Published as: Schmöcker, J.-D., Fonzone, A., Shimamoto, H., Kurauchi, F. and Bell, M.G.H. (2011). Frequency-based Transit Assignment Considering Seat Capacities. Transportation Research Part B. 45 (2), 392-408. Transportation Research B, 42(10), 925-945. - Journal version available from: doi: 10.1016/j.trb.2010.07.002 Abstract This paper proposes a frequency-based assignment model that considers travellers probability of finding a seat in their perception of route cost and hence also their route choice. The model introduces a “fail -to-sit” probability at boarding points with travel costs based on the likelihood of travelling seated or standing. Priority rules are considered; in particular it is assumed that standing on-board passengers will occupy any available seats of alighting passengers before newly boarding passengers can fill any remaining seats. At the boarding point passengers are assumed to mingle, meaning that FIFO is not observed, as is the case for many crowded bus and metro stops, particularly in European countries. The route choice considers the common lines problem and an user equilibrium solution is sought through a Markov type network loading process and the method of successive averages. The model is first illustrated with a small example network before being applied to the inner zone of London’s underground network. The effect of different values passengers might attach to finding a seat are illustrated. Applications of the model for transit planning as well as for information provision at the journey planner stage are discussed. Keywords: Transit Assignment, Frequency-based, Seat Capacities 1. INTRODUCTION It is well known that passengers appreciate being able to sit on public transport services. London Underground for example found that passengers perceive the cost for standing in a
Transcript of Frequency-based transit assignment considering seat capacities

Frequency-based Transit Assignment Considering Seat Capacities
Jan-Dirk Schmöckera, Achille Fonzoneb, Hiroshi Shimamotoa, Fumitaka Kurauchic and
Michael G H Bellb
a Department of Urban Management, Kyoto University, Japan,
b Centre for Transport Studies, Imperial College London, UK
c Department of Civil Engineering, Gifu University, Japan
Published as: Schmöcker, J.-D., Fonzone, A., Shimamoto, H., Kurauchi, F. and Bell, M.G.H. (2011). Frequency-based Transit Assignment Considering Seat Capacities. Transportation Research Part B. 45 (2), 392-408. Transportation Research B, 42(10), 925-945. - Journal version available from: doi: 10.1016/j.trb.2010.07.002
Abstract
This paper proposes a frequency-based assignment model that considers travellers
probability of finding a seat in their perception of route cost and hence also their route
choice. The model introduces a “fail-to-sit” probability at boarding points with travel costs
based on the likelihood of travelling seated or standing. Priority rules are considered; in
particular it is assumed that standing on-board passengers will occupy any available seats of
alighting passengers before newly boarding passengers can fill any remaining seats. At the
boarding point passengers are assumed to mingle, meaning that FIFO is not observed, as is
the case for many crowded bus and metro stops, particularly in European countries. The
route choice considers the common lines problem and an user equilibrium solution is sought
through a Markov type network loading process and the method of successive averages.
The model is first illustrated with a small example network before being applied to the inner
zone of London’s underground network. The effect of different values passengers might
attach to finding a seat are illustrated. Applications of the model for transit planning as well
as for information provision at the journey planner stage are discussed.
Keywords: Transit Assignment, Frequency-based, Seat Capacities
1. INTRODUCTION
It is well known that passengers appreciate being able to sit on public transport services.
London Underground for example found that passengers perceive the cost for standing in a

crush-loaden train 2.7 the value of the actual travel time (LUL, 1988). The U.K.’s Passenger
Demand Forecasting Handbook 2001 then reports that this value can even increase
significantly depending on length of journey as well as journey purpose (ATOC, 2001).
Similarly, in Tokyo it can be frequently observed that some passengers attach significant
value to being able to sit. At line terminals passengers frequently do not board the first
departing train but rather wait for the following service if they are certain to be able to sit,
especially if this service is already available to board.
It is therefore reasonable to assume that seat availability has an influence on passengers’
route and departure time choice and should hence be considered in assignment models.
Previous approaches, whether frequency- or schedule-based, have mainly focused on line
capacities, though there has also been some limited research on modelling the effect of in-
vehicle congestion. The main complexity for this problem is the consideration of priority rules
between sitting passengers, passengers on-board and newly boarding passengers. Simple
crowding cost functions where the cost is depending on the number of passengers have
their limitations. They do reflect the inconvenience among standing passengers with growing
congestion but do not consider that sitting passengers will be only mildly affected by the line
crowding.
The following Section 2 firstly reviews the existing literature before proposing a frequency-
based transit assignment model that explicitly considers the likelihood of finding a seat and
appropriate priority rules as part of the perceived cost that is considered for route choice.
Section 3 then describes the network from which the priority rules follow as explained in
Section 4. Section 5 introduces the generalised cost function and the search for the shortest
hyperpath which considers the common lines problem. Section 6 describes the network
loading and formulates the deterministic user equilibrium as a fixed point problem. The
problem is solved with the solution algorithm described in Section 6.3 that embeds the
method of successive averages. Section 7 illustrates the approach first on a small example
network before Section 8 describes an application to the London network. Finally, Section 9
concludes and points out areas of further work as well as model applications.
2. LITERATURE REVIEW
Congested transit assignment has recently attracted significant research attention. Within
the group of frequency based transit assignment models the capacity constrained
assignment problem has been addressed by several authors either by using various forms of
an effective frequency model (see e.g. Cepeda et al (2006) for a recent paper which also

summarises previous work starting from De Cea and Fernandez (1993)) or by using “fail-to-
board probabilities” (Kurauchi et al, 2003; Schmöcker et al, 2008). Within the group of
schedule-based assignment models the departure time as well as route choice under
consideration of congestion have been addressed simultaneously. In particular Tian et al
(2007) describe a schedule-based transit model that considers congestion effects including
seat availability. They formulate an equilibrium model for a many-to-one network applicable
for the morning commute into the city centre of large metropolitan areas. Reducing the
model to a many-to-one network has the advantage that it avoids the problem of standing
passengers being able to find a seat during the journey through alighting passengers. Using
a schedule based model allows to model further explicitly the optimal departure time
considering schedule delays and the generalised travel cost. The paper illustrates that in an
equilibrium situation some long distance commuters will travel before and some will travel
after the peak. Tian et al further illustrate that the spread in optimal departure times
increases the longer the travel distance as the travel costs of standing gain in importance
compared to the early or late arrival penalties.
Sumalee et al (2009) have developed a stochastic transit assignment model that explicitly
considers the effect of seat availability on route choice as well as departure time choice.
They consider priorities of on-board passengers over newly boarding passengers and further
assume that a) passengers who are travelling further and b) passengers who have stood for
a longer time have a higher motivation in chasing any free seats. Whereas the first
assumption is intuitive the second assumption might be challenged as standing longer might
mean that these passengers in fact have a lower motivation to find a seat. The assumption
further introduces another complexity as “the past” has to be considered in modelling
travellers’ behaviour at each decision point. The seat allocation is solved by a simulation
type approach at each station allocating firstly all standing and then, in case seats are still
vacant, all newly boarding passengers to seats. The model described in Sumalee et al
(2009) is tested on a small example network, illustrating the effects of limited seat numbers
on the service performance as well as the overall costs for passengers. Questions remain
however, whether this model is feasible to be used for transit planning in large scale
networks where an equilibrium finding approach that includes simulation might turn out to be
too computationally expensive.
This paper proposes a simpler model to be used within frequency based assignment for
transportation planning when on-board congestion is an issue. The approach considers the
priority rules of already seated passengers as well as the priority of standing passengers
over newly boarding passengers. It further assumes that all passengers on the platform have

the same chance of finding a seat when boarding (“mingling” rather than FIFO). Similarly, it
is assumed that passengers on-board have the same motivation finding a seat irrespective
of their remaining travel time on this line. The perceived cost of standing is however thought
to be distance dependent and hence influences route choice. As part of the perceived cost it
is further considered that at each stop passengers might have the chance to find a seat
through alighting passengers. An approach with similar assumptions has been developed by
Leurent (2008). In his model, however, the loading along a line is based on route sections
which can lead to complex network descriptions for long lines as there are arcs from each
possible boarding point of the line to each possible alighting point. Each combination of
boarding and alighting nodes is transformed into links for all possible stand and sit
combinations. In his approach the mean cost for each route section is derived which is then
used to find the optimal hyperpath. Leurent and Liu (2009) apply the approach to the Paris
network and provide further evidence that considering seat availability can indeed have a
significant effect on line loadings and overall passenger cost. They found that line loads
change by up to 30% compared to a base case not considering seat availability.
3. NETWORK DESCRIPTION AND NOTATION
In contrast to the Leurent (2008) approach the model proposed here develops a more
compact network description (at least when there are lines with a large number of stops)
based on line sections rather than route sections. The model hence also does not rely on the
mean or variance in costs over route sections. Instead “fail-to-sit” probabilities are introduced
in order to be able to consider the influence of seat availability on passengers route choice in
large scale transportation networks. The main idea of the approach is illustrated in Figure 1.

Figure 1: Network representation of a single platform
The stop node (Stop) represents the bus stop or platform at which passengers wait for the
service to arrive. From each stop node passengers might be able to board several services.
It is assumed that the common lines problem applies so that the hyperpath minimising
passengers expected travel cost might contain non-zero boarding probabilities for several
boarding nodes. Besides the stop node in total 5 nodes and 8 arcs are associated with each
line. The names of the nodes are self-explanatory. All nodes except those Stop are
platform and line specific, i.e. nodes Sit-Arr, Sit-Dep, Stand-Arr, Stand-Dep, Board can be
uniquely identified by their platform u and their line l. For simplicity Figure 1 only illustrates all
nodes and links associated with a single line at one platform.
The S within the arc names stands for success or sitting whereas the F is used to describe
failing (to sit). The eight arcs types are hence, SS: “keep sitting” (success + success), FF:
“keep standing”, FS: “previously standing getting a seat”, BS: “board and sit”, BF: “Board and
stand” and SA: “Sit and alight”, FA: “Stand and alight” and B: “Boarding”. Besides these line
specific arcs at each stop node there might be a number of further walking arcs for
passengers transferring to other platforms Tr as well as access arcs Ac and egress arcs Eg
for passengers starting or ending their journey at this station.
The second stop node in Figure 1 indicates that a second line serves the same platform. The
passenger’s choice is therefore to decide which line(s) to include in his hyperpath from each
stop node. Alternatively the passenger might decide to take a walking link. Note that the
network description with the “dual sitting and standing line” allows for a second choice not
much discussed in the literature. Depending on whether the passenger has obtained a seat
he might choose to stay on-board or alight. This choice behaviour might be observed among
Stop
Board
Sit-
dep
Stand-
dep
Sit-
arr
Stand-
arr
Board
SSul
FFul
Sul
Ful
Sp(u)l
Fp(u)l

commuters who can transfer at a number of stations. Depending on whether they obtained a
seat they might decide to transfer at an earlier or later possibility. Alternatively one might
assume that passengers determine their alighting point independent of whether they
obtained a seat or not. Sections 5 and 6 will show that this assumption is mathematically
more convenient as it more likely leads to a unique solution.
In addition to the nodes and arcs introduced above, for the formulation of the assignment
model following flow-independent and flow-dependent variables will be used:
Flow independent variables:
O: Set of origins (with o O)
D: Set of destinations (with d D)
L: Set of transit lines (with l L and l(a) denoting the line of arc a)
seatl: Number of seats on line l
fl: Frequency of transit line l
Ul: Set of platforms served by line l (with u Ul and p(u)l denoting the platform
of the previous station of line l and u(a) denoting the platform of the head
node of arc a)
I: Set of nodes (with i I) with subsets Sit-Arr, Sit-Dep, Stand-Arr, Stand-Dep,
Board, Stop I nodes as illustrated in Fig.1
A: Set of arcs (with aA and Aih denoting the forward star of node i that are
included in hyperpath h) with subsets SS, FS, FF, BS, BF, SA, FA, B, S, F,
Ac, Eg, Tr A as illustrated in Fig. 1
ca: Cost of travelling on arc a connecting nodes i and j
SP: Standing penalty, indicates the increase in perceived cost if standing
compared to being seated.
Out(a): The tail node of arc a
In(a): The head node of arc a
yod: Demand from origin o to destination d
Hod: Set of all feasible hyperpaths between OD pair od (with h Hod)
Ph: Set of elementary paths within hyperpath h (with p Ph)
gh: Cost of travelling hyperpath h from origin o to destination d
wih: Expected waiting time at node i when travelling on hyperpath h
Flow dependent variables:
xa: Passenger flow on arc a (with od
ax denoting the OD specific arc flow)

vi: Passenger flow vector traversing node i (vid: and destined for d)
BS
iq : Fail probability to get a seat for newly boarding passengers at node i
Board
FS
iq : Fail probability to get a seat for on-board standing arriving at node i Stand-
Arr
spai: Vacant seats at node i after passenger alighted (before new passengers
boarding)
spri: Remaining vacant seats at node i (after all passengers boarded)
zh: Flow on hyperpath h within the set of used hyperpaths to destination d
ah: Probability of using arc a when travelling on hyperpath h
ih: Probability of traversing node i when travelling on hyperpath h
ah: Probability of choosing arc a when traveller is at Out(a) and travelling on
hyperpath h. Similarly, ad denotes the probability of choosing arc a from
Out(a) and travelling to destination d. Let h and d denote the
corresponding arc and node transition matrices.
Note that the above network description ensures that the Markov property holds. This means
that arc split probabilities only depend on the traveler’s current node position which can be
expressed as h = d for the shortest hyperpath h from all origins o with the same destination
d. This important property is utilised in the following to establish priority rules and for route
choice.
4. PRIORITY RULES
For simplicity the model presented here assumes that all passengers wishing to board a
service are able to do so, meaning that the capacity of standing arcs is not limited.
Therefore, once a service that is within the set of attractive lines has arrived the passenger
only faces uncertainty whether it is possible to find a seat. It is assumed that all passengers
prefer to sit. This is expressed as the path split between successful transferring to the Sit-
dep node or (unsuccessfully) transferring to the Stand-dep node. The passengers who are
already on board are assumed to have priority over the newly boarding passengers in two
ways: Firstly, passengers arriving at a station sitting (Sit-arr) are guaranteed a seat, so that
they either alight or remain sitting. Secondly, passengers arriving standing (Stand-arr) who
do not alight are further assumed to have priority over the passengers newly boarding, i.e.

these passengers have a prior chance to occupy any seat that might become vacant through
alighting passengers. These priority rules can be expressed as follows:
ulSl xseat , LlUu l , (1)
ulululul BSFSSSS xxxx , LlUu l , (2)
with ullupulul FAFFSFS xxqx
)(1
(3)
and ululul BBSBS xqx 1
(4)
ulullupulululul BBSFAFFSBFFFF xqxxqxxx
)( , LlUu l , (5)
with FAFFSFF xxqxlupulul
)(
, LlUu l , (6)
and ululul BBSBF xqx
, LlUu l , (7)
otherwise1,min1
if0
:
)(
)(
ullup
ul
ullup
FAF
SSl
FAF
FS
ul
xx
xseat
xx
q , LlUu l , (8)
otherwise1,min,0max1
0 if0
:
ul
ulul
ul
B
FSSSl
B
BS
ul
x
xxseat
x
q , LlUu l , (9)
Where xa denotes the flow on arc a.. Eq. (1) ensures that the overall seat availability of the
service is not exceeded. Eq. (2) and (3) describe the flows of the passengers leaving the
station sitting and standing respectively. To ensure the seat capacity constraints are kept the
probabilities describing the chance of not getting a seat for those who were already on board
but are standing and those newly attempting to board – qFS and qBS respectively – need to
be adjusted. These adjustments are done with Eq. (4) and (5), which imply that
FS
ulq is non-zero or all passengers who boarded line l before it arrives at station u have
found a seat already which means also that there might be seats available for
passengers boarding the service at this station.
BS
ulq is non-zero or all passengers boarding the service anew at this stop have found a
seat which means that there might be still empty spaces after the departure of the
service from current station u.
Fail probabilities are by default set to zero when there is no flow, i.e. when all
passengers alight FS
ulq is zero, or, when no one is boarding then BS
ulq is zero.
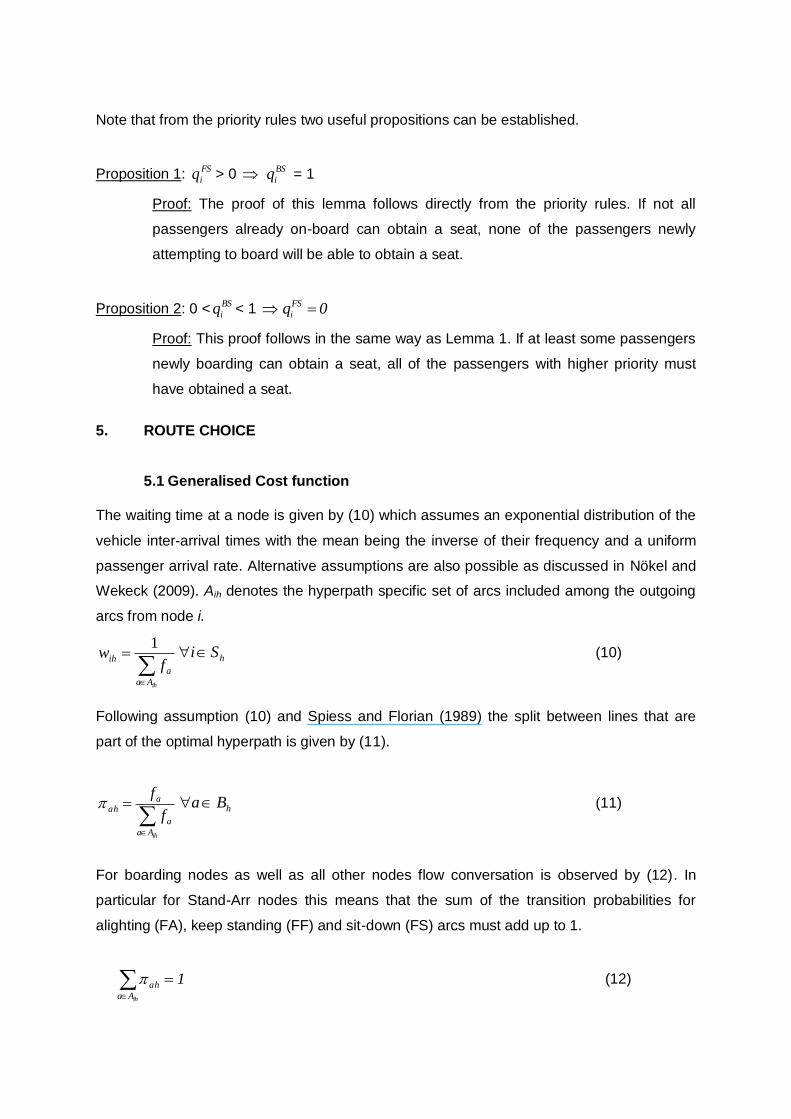
Note that from the priority rules two useful propositions can be established.
Proposition 1: FS
iq > 0 BS
iq = 1
Proof: The proof of this lemma follows directly from the priority rules. If not all
passengers already on-board can obtain a seat, none of the passengers newly
attempting to board will be able to obtain a seat.
Proposition 2: 0 <BS
iq < 1 0qFS
i
Proof: This proof follows in the same way as Lemma 1. If at least some passengers
newly boarding can obtain a seat, all of the passengers with higher priority must
have obtained a seat.
5. ROUTE CHOICE
5.1 Generalised Cost function
The waiting time at a node is given by (10) which assumes an exponential distribution of the
vehicle inter-arrival times with the mean being the inverse of their frequency and a uniform
passenger arrival rate. Alternative assumptions are also possible as discussed in Nökel and
Wekeck (2009). Aih denotes the hyperpath specific set of arcs included among the outgoing
arcs from node i.
ihAa
a
ihf
w1
hSi (10)
Following assumption (10) and Spiess and Florian (1989) the split between lines that are
part of the optimal hyperpath is given by (11).
ihAa
a
aah
f
f hBa
(11)
For boarding nodes as well as all other nodes flow conversation is observed by (12). In
particular for Stand-Arr nodes this means that the sum of the transition probabilities for
alighting (FA), keep standing (FF) and sit-down (FS) arcs must add up to 1.
1ihAa
ah
(12)

As in Nguyen and Pallentino (1988) let the probability of choosing any particular path p of a
hyperpath h, p, be denoted as
h
ap
Aa
ahp
, hPp . (13)
with ap equal to 1 if arc a is an element of path p and 0 otherwise. It follows therefore that
1 hPp
p (14)
Further ih is defined as the “probability of traversing node i when travelling hyperpath h” and
εip is equal to 1 if node i is an element of path p and 0 otherwise so that
hPp
pipih , hIi (15)
ah is defined as the probability of using arc a when travelling hyperpath h , so that
hPp
papah , hAa (16)
Using the definitions for ih and ah, the notation of the generalised cost for travelling on
hyperpath gh can be described as:
hhh Fa
aah
Sa
aah
Stopi
ihihh cSPcwg (17)
Costs occur at the stop nodes Stoph that are part of the hyperpath as well as on sitting line
arcs Sh and standing line arcs Fh. In (10) wih is hence the expected waiting time at boarding
node i and ca the travel time on sitting and standing links. Standing is further penalised by
the factor SP. A standing penalty SP > 1 means that the probability of getting a seat is one
factor in passengers’ route choice and hence needs to be reflected in the search for the
optimal hyperpath. Note that SP < 1 is unreasonable as it would imply that people are more
willing to stand than to get a seat and that SP = 1 indicates the same perceived cost for
travelling standing or sitting which implies that finding a seat is not a factor for route choice.
ih and ah represent the probabilities of traversing node i and link a respectively when
travelling on hyperpath h.
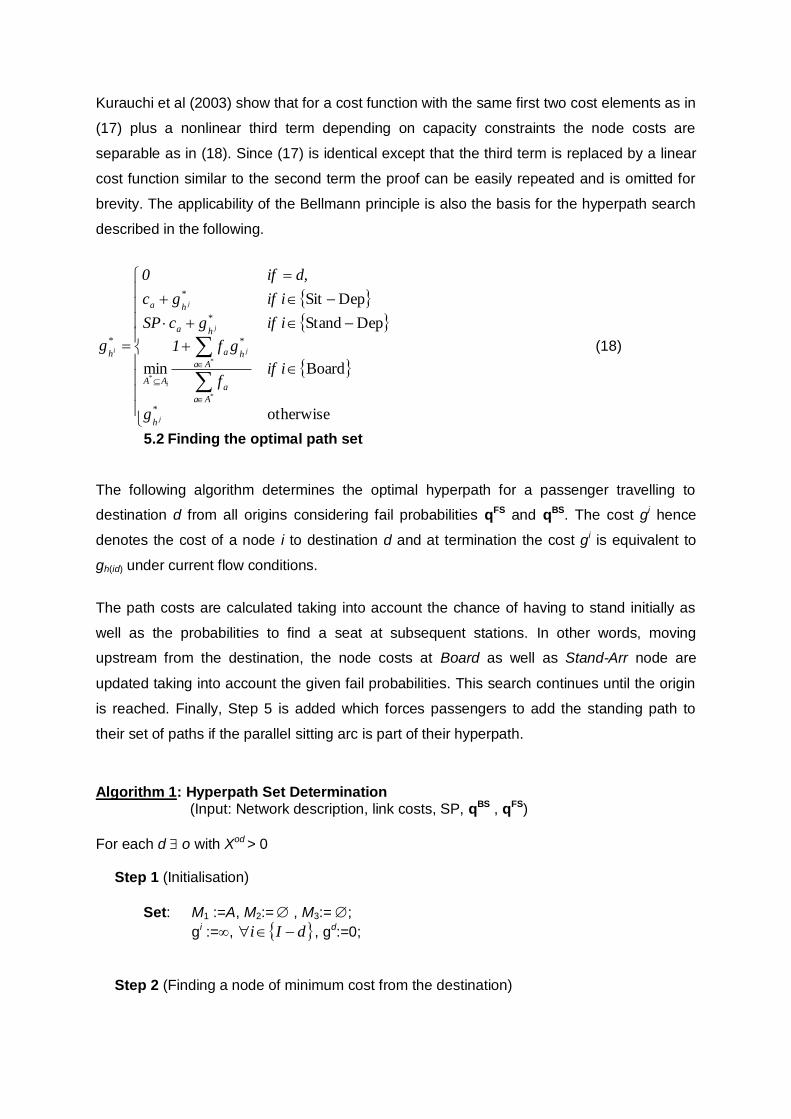
Kurauchi et al (2003) show that for a cost function with the same first two cost elements as in
(17) plus a nonlinear third term depending on capacity constraints the node costs are
separable as in (18). Since (17) is identical except that the third term is replaced by a linear
cost function similar to the second term the proof can be easily repeated and is omitted for
brevity. The applicability of the Bellmann principle is also the basis for the hyperpath search
described in the following.
otherwise
Boardmin
DepStand
DepSit
*
*
h
Aa
a
Aa
*
ha
AA
*
ha
*
ha
h
j
*
*
j
i*
j
j
i
g
iiff
gf1
iifgcSP
iifgc
d,if0
g (18)
5.2 Finding the optimal path set
The following algorithm determines the optimal hyperpath for a passenger travelling to
destination d from all origins considering fail probabilities qFS and qBS. The cost gi hence
denotes the cost of a node i to destination d and at termination the cost gi is equivalent to
gh(id) under current flow conditions.
The path costs are calculated taking into account the chance of having to stand initially as
well as the probabilities to find a seat at subsequent stations. In other words, moving
upstream from the destination, the node costs at Board as well as Stand-Arr node are
updated taking into account the given fail probabilities. This search continues until the origin
is reached. Finally, Step 5 is added which forces passengers to add the standing path to
their set of paths if the parallel sitting arc is part of their hyperpath.
Algorithm 1: Hyperpath Set Determination
(Input: Network description, link costs, SP, qBS , qFS)
For each d o with Xod > 0 Step 1 (Initialisation)
Set: M1 :=A, M2:= , M3:= ;
gi :=, dIi , gd:=0;
Step 2 (Finding a node of minimum cost from the destination)

Find a* such that )(* *
1
minarg aIn
aMa
gca
;
Set M1:=M1-{a*}, M2:=M2 +{a*};
Step 3 (Updating node labels)
if StopaOut * and BoardaIn *
then
Find a set of arcs, such that
*
*
2*
)(
)(
1
min:
Aa
al
Aa
aIn
al
MAA
aOut
f
gf
gi
; 2MAa i ,
if *Aa then Set M2:=M2-{a}, M3:=M3+{a};
else if BoardaOut *
if
*u
**
*u*
1)( aadepSit
BS
aOut
BS
aOut
depStandaOut gqqgg then
*u
**
*u*
1:)( aadepSit
BS
aOut
BS
aOut
depStandaOut gqqgg
else Set M2:=M2-{a
*}, M3:=M3+{a*};
else if arrStandaOut * and StopaIn )( *
if
*u
**
*u*
1)( aadepSit
FS
aOut
FS
aOut
depStandaOut gqqgg then
*u
**
*u*
1:)( aadepSit
FS
aOut
FS
aOut
depStandaOut gqqgg
else Set M2:=M2-{a
*}, M3:=M3+{a*};
else
if )()( *
*
* aIn
a
aOut gcg then
)()( *
*
*
: aIn
a
aOut gcg
else Set M2:=M2-{a
*}, M3:=M3+{a*};
Step 4 (Iteration, Termination of Arc Search Loop)
Repeat (2) to (4) until M1=
Step 5 (Add BF and FF arcs to hyperpath)
BFMa 3
Find a’ BS with platform u(a’) = u(a) and line l(a’) = l(a)
if a’ M2 then
Set M2:=M2+{a}, M3:=M3-{a*};

FFMa 3
Find a’ FS with platform u(a’) = u(a) and line l(a’) = l(a)
if a’ M2 then
Set M2:=M2+{a}, M3:=M3-{a*};
5.3 Transition Probabilities
Once the set of optimal links has been determined, the optimal hyperpath for each OD pair
can be determined. The split among paths is defined in (11) and the split among the sitting
and standing lines considers the fail probabilities in order to observe the priority rules.

Algorithm 2: Arc Split Determination (Input: Line frequencies, M2, qBS , qFS)
For each d o with yod > 0
2Ma set a =0,
2Ma ,
if StopaOut then
2
)()(
MAa
alalah
i
ff
else if BoardaOut then
otherwise
)(if
)(aOut
BS
aOut
ahq
depSitaInq1
else if ArrStandaOut then
otherwise
)(if
)(aOut
FS
aOut
ahq
depSitaInq1
else
1ah ;
Note that for a single hyperpath at arrival nodes either the alighting links or the remain on
board links (SS arc from Sit-Arr and {FS, FF} arcs from Stand-Arr) are attractive. In the
equilibrium solution presented in the following, however, several hyperpaths might be
attractive, so that the split between alighting and remaining on board is not binary anymore.
Further, if the passenger’s choice of transfer point is assumed to possibly depend on having
obtained a seat or not, this means that a standing passenger possibly prefers to alight earlier
whereas a sitting passenger prefers to alight later. To assume the opposite, i.e. that a
traveler decides his alighting point at the time of boarding requires that (19) is fulfilled. In the
hyperpath search this “predetermined alighting” might be introduced by the adjustment to the
arc split probabilities described in Algorithm 3. This guarantees that both standing and sitting
passengers alight with a probability ζ. The algorithm updates FA, SA, SS, which are
independent of the fail probabilities. To preserve flow conversation also updates
1q1ulul FShFS and 1q
ulul FShFF are required. However, the solution
algorithm described in the following will show that fail probability dependent arc splits are
updated in a separate iterative procedure, so that these updates might be omitted in
Algorithm 3.
Probability ζ can be interpreted as pessimism or risk-aversion, in case the shortest route
differs between sitting and standing passengers. The pessimistic passenger with ζ = 1 had
decided to alight from this station when boarding (following the shortest hyperpath from the

Stand-Arr node), whereas the optimistic passenger with ζ = 0 had decided to remain on
board (following the shortest hyperpath from the Sit-Arr node).
The case studies show that including Algorithm 3 in the solution approach is not needed for
most SP values. However, ensuring (19) through Algorithm 3 allows establishing Proposition
3. The following Section 6 will then utilise this proposition to establish proofs on the
convergence.
hSAhFA ulul
HhLlUu l , , (19)
Algorithm 3: Pre-determined alighting adjustment (Input: FA, SA, SS, ζ)
HhLlUu l , ,
01 hSAhFA ulul and if
hFAul
hSAul
1hSSul
Proposition 3: If (19) is fulfilled, then, for a given set of hyperpaths, the demand for a line at
each station is independent of the fail probabilities.
Proof: The boarding demand Bul is determined by the arc split at stop nodes which
are fixed according to (11) and independent of fail probabilities. Further, the incoming
arc flows at stop nodes from walking arcs are determined by the transition
probabilities in Algorithm 2 and independent of fail probabilities. Finally, Eq. (19)
implies that the demand at stop nodes from alighting passengers is independent of
the proportion of passengers that are sitting or standing. In conclusion, the sum of the
incoming (and outgoing) demand at stop nodes and hence for lines is independent of
qFS and qBS. Qed.
6. NETWORK LOADING AND DUE SOLUTION
6.1 Network loading
The arc split probabilities can be converted into network flows by the simple method in
Spiess and Florian (1989) where the demand is loaded from its origin in the order of
decreasing link costs plus node potentials. Though the method is feasible it is

computationally expensive as it requires a loop over all OD pairs. Kurauchi et al (2003) or
Schmöcker et al (2008) utilise instead the Markov property of the network to assign demand,
which is the approach described in the following:
By defining a link with its head and tail node the arc transition matrix d can be rewritten as
node transition matrix d. Further let Өd denote the sub-matrix of transition probabilities to an
intermediate node j and be a vector of transition probabilities from node i to destination d.
Then
1
1
11
1
n
ndd Θδ
0
Π (20)
When d is multiplied by itself k times, dk is obtained which denotes the probability of
reaching any node within k moves.
1
1
11
1
n
n
k
d
kk
d Θδ
0
Π (21)
When the transition is repeated ad infinitum, all traffic should be absorbed into the
destination, i.e. 0lim
k
dk
Θ . By using this relationship, the probability dk= denotes the
probability that traffic destined to d traverses from i to j which can be calculated as in (22)
(see for example Bell, 1995):
IΘIδ
0II 1
101
d
kd
k
dd
k
d (22)
This series is convergent provided dk → 0 as k →. If the row sums of d
k are bounded by
1 and at least one row sum is strictly less than 1, and provided each destination is reachable
from any arc, it follows from the Perron-Frobenius Theorem (see Cox and Miller, 1965) that
all the eigen values of dk are strictly less than 1 and so d
k → 0 as k →. Provided has
at least one non-zero element, convergence of the series is guaranteed.
The submatrix d can further be divided into two submatrices and two zero vectors:

1
12
1
oo
o
o
d
d
d
nnn
nn
n
Θ0
Θ0
Θ (23)
The two vectors of zero indicate that there are no transitions from one origin to another origin
and that there are no transitions from an intermediate node to an origin. 1d is the matrix of
transition probabilities from all origins to all intermediate nodes, and 2d is the matrix of
transition probabilities from one intermediate node to another intermediate node. It follows
that in (20) the inverse of I-d can be calculated as in (24):
1
2
1
211
d
ddd
ΘI0
ΘIΘIΘI (24)
With yd as the vector of traffic produced at origins o destined to d the vector of traffic
traversing intermediate node i, vd, can be obtained from (25).
1
21
dd
t
dd ΘIΘyv (25)
Finally, arc traffic volumes xd are calculated using vd
d d
d
dd
d
dv
yΘΘxx 21 (26)
The computationally expensive operation of the assignment is the inversion of the submatrix
2d. Schmöcker (2006) discusses that the size of the matrix that requires inversion can be
further reduced by splitting the nodes into two parts according to whether a direct transition
between these is possible. In the network shown in Figure 1 there is for example never a
direct transition between Stop nodes and Sit-dep and Stand-dep nodes. Following Strassen
(1969) matrix inversion of 2d can then be replaced by inverting only the matrix of nodes
excluding Sit-dep and Stand-dep nodes plus four matrix multiplications. These can be
efficiently carried out by utilizing the sparsity of the transition matrix.
6.2 Network equilibrium conditions
The network equilibrium can be found when the following three complementary slackness
conditions apply:

Let H* be defined as the set of optimal hyperpaths to destination d. Firstly, the user
equilibrium implies that for all destinations H* is empty or the cost difference g' between the
used hyperpaths h and all other (unused) hyperpaths h’ H is zero (Wardrop principle). This
can be expressed with (27) where the cost difference g' is defined as in (28) and zh* is the
flow on the hyperpath h in the set of optimal hyperpaths H*. The cost of the minimum cost
hyperpath in H*od is denoted as
min
odg . The problem becomes a fixed point problem as route
costs depend on the failure probabilities, which themselves depend on the route flows which
in turn depend on route costs. For simplicity only in the first line of (27) the functional
dependencies of qBS and qFS are denoted.
0),(),,(, *****'* seatsxqseatsxqzFSBS
hh gz ,
0qqzgFSBS
***' ,, , odHh Dd Oo (27)
min***',, odhh ggg FSBSqqz , odHh Dd Oo (28)
Secondly, for each boarding point of each line it must be true that either qi
FS (the fail-to-sit
probability for passengers already on-board) is zero or all seats must be filled before any
newly boarding passengers can attempt to find a seat. Thirdly, qiBS (the fail-to-sit probability
for newly boarding passengers) must be zero or there must be no spaces left when the
vehicle is leaving the stop. These latter two complementary slackness conditions are
expressed with (29) for stand-arrival nodes (Stand-Arr) and (31) for boarding nodes (Board);
spa denotes the available seats after passengers have alighted and before new passengers
are boarding and spr denotes the seats remaining empty after the service has left the
platform.
0*** FSaFS
qzspq , 0qzspFSa
**, , 10 * FS
iqi (29)
With
ulul FSSSl
a xxseatssp ul, LlUu l , (30)
0*** SrS
qzspqBB
, 0qzspSr
**, B, 10
* BS
iqi (31)
With
ulsitl
r xseatssp ul, LlUu l , (32)
In summary, the assignment has to find (z*,qFS*,qBS*) such that (27), (29) and (31) are
fulfilled. The existence of a solution to this fixed point problem is guaranteed as any demand

exceeding the seat capacity can be simply assigned to the uncapacitated standing arcs with
non-zero failures to sit. However, Leurent (2008) show that in general multiple solutions to
the assignment problem might exist that fulfill (27). Uniqueness can only be guaranteed for
specific cases. Firstly, for SP = 1 uniqueness is guaranteed as only a single hyperpath for
each OD pair will be used. Secondly, for very large SP multiple solutions become less likely.
This is because with increasing SP the relative importance of standing in the generalized
cost function increases. Therefore, only that split of hyperpaths on which passengers
experience least standing and other hyperpath combinations are less likely to be attractive.1
Further, the following section shows that for each set of hyperpaths used a unique solution
exists that fulfills (29) and (31).
6.3 Correction algorithm and solution uniqueness
To fulfill conditions (29) and (31) for a given set of hyperpaths for each OD pair an iterative
procedure is developed (Algorithm 4). In Step 1 of the first iteration the transition
probabilities of all arcs are obtained. In Step 1 of subsequent iterations it is sufficient to
update only the transition probabilities for the arcs that have a boarding node (Board) or a
Stand Arrival node (Stand-Arr) as outgoing nodes.
Algorithm 4: Correction of fail probabilities (Input: Network description, Ah, q
BS , qFS)
Repeat Steps 1 to 3 until qFS and qBS cease to change
Step 1: Obtain transition probabilities (Alg. 2 and 3) d (Ah, qFS, qBS)
Step 2: Network loading (as in Section 6.1) x (d)
Step 3: Update fail probabilities (with Eqs. 8 and 9) qBS(x,seats), qFS(x,seats)
Proposition 4: The correction algorithm (Alg. 4) finds a unique solution for a given set of
hyperpaths that fulfills the capacity constraints (29) and (31) in case (19) is fulfilled (pre-
determined alighting).
Proof: Since Ah is assumed to be fixed a unique solution is obtained if qBS as well as
qFS are unique. The uniqueness of qFS follows from Lemma 1 and that of qBS from
Lemma 2.
Lemma 1: The fail to sit probabilities qFS are unique for a given set of hyperpaths if (19) is
fulfilled.
1 In the 4 station Paris network instance given in Leurent (2008), for example only for 1.71 < SP < 1.96 with demand set to 6000 multiple solutions are possible.

Proof: Suppose the fail-to-sit probabilities for passengers already on board are not
unique, i.e. suppose that there are two values 'FS
iq > FS
iq > 0. This implies that x’FF =
xFF + δ and x’FS = xFS – δ. Further, x’BS = xBS = 0 according to Proposition 1 and hence
also x’FS = xFS since the boarding demand xBS + xFS must be constant according to
Proposition 3. Since 'FS
iq > 0 means that the capacity constraints must be fulfilled this
implies further that (1) must be an equality. Therefore (2) implies that x’SS = xSS – δ.
This leads to a contradiction as Proposition 3 and (13) imply that the total demand for
passengers continuing to travel on the line at a station is constant, i.e. x’Sp(u)l + x’Fp(u)l =
xSp(u)l + xFp(u)l. However, x’SS + x’FF + x’FS = (xSS + δ) + (xFF + δ) + (xFS – δ) > xSS + xFS +
xBS.
The proof for 'FS
iq < FS
iq can be derived in the same way leading to x’SS + x’FF + x’FS = (xSS
- δ) + (xFF - δ) + (xFS + δ) < xSS + xFS + xBS. Finally FS
iq = 0 for all stations implies that no
capacity constraints are active, so that any 'FS
iq > 0 implies that passengers are
standing though seats are available which contradicts the definition of the fail
probabilities in (8). Qed.
Lemma 2: The fail to sit probabilities qBS are unique for a given set of hyperpaths if (19) is
fulfilled.
Proof: Suppose the fail-to-sit probabilities for passengers newly boarding are not
unique, i.e. suppose that there are two values 'BS
iq > BS
iq . This implies that x’BS = xBS -
δ and x’BF = xBF + δ. Since less passengers obtain a seat this must mean that more
passengers of the already on-board standing passengers are able to sit. This means
that 'FS
iq < FS
iq which leads to a contradiction according to Lemma 1. Alternatively, if no
on-board passengers are standing, this leads to a direct contradiction of the capacity
constraints and the definition of the of the fail probabilities in (9). The proof for 'BS
iq >
BS
iq can be derived in the same way leading to 'FS
iq > FS
iq and a contradiction
according to Lemma 1. Qed.
Proposition 5: If uniqueness is guaranteed, the solution of the correction algorithm is found in
a maximum of 2n - 3 iterations where n is the number of stations of the longest line in the
network.

Proof: In the first iteration of the correction algorithm the final value for BS
iq of the
starting node i of the line can be found as both seats and demand iBx are unique and
iSSx as well as iFSx must be zero. This means that in Step 2 of the second iteration the
final values for iSx ,
iFx as well as 1iSSx are found where i+1 is the downstream station
of i. Therefore in Step 3 of the second iteration the final value FS
iq 1 is found. Hence in
the third iteration the final value for BS
iq 1 are found and so on until the end of the line.
Since BS
iq ,FS
nq and BS
nq are all necessarily zero the unique solution can be found in a
maximum of 2n - 3 iterations. Qed.
Note that in practice the correction algorithm terminates much faster. Whenever the final
value of a node at any location on the line is found in subsequent iteration also the fail-to-
board probability of the downstream node can be finalized. Therefore, especially in networks
with low level of congestion with large numbers of nodes having zero fail-probability, often
final values of several line sections are found within the same iteration. Therefore, though in
Step 2 network loading can be computationally expensive, the above correction algorithm is
in most cases faster than sequential loading of each line similar to Leurent (2008) which
would be an alternative way to ensure the capacity constraints.
6.4 Solution algorithm for a DUE Solution
From (28) follows that a gap function to assess the distance of a solution to an equilibrium solution is
minmaxmax odhHhod
ggGod
(33)
Assessing (33) is however not suitable for large scale problems as it would require
calculation of costs on each hyperpath used. In analogy to Cepeda et al (2006) a feasible
gap function based on destination specific arc flows can be derived. Cepeda et al`s proof is
based on the Bellmann property of node cost separability as in (18). If at all nodes, costs on
all outgoing arcs that are part of the set of optimal hyperpaths plus node costs of the
downstream nodes are equal then equilibrium conditions are fulfilled. According to (17) and
considering the network in Figure 1 this condition is trivial for all nodes in the model
proposed here except for stop nodes, since either all outgoing arcs carry no cost or there is
only one outgoing arc which hence must be part of all hyperpaths.
This leaves a proof for the stop nodes at which the split between optimal hyperpaths occurs.
Whereas in the Cepeda et al (2006) problem the frequencies of lines are dependent on line

flows, frequencies are assumed constant here which reduces the complexity. In analogy to
Section 3.2 in Cepeda et al (2006) following theorem can be posed and proven:
Eq. (34) must hold for all feasible flows and the inequality will become an equality at
equilibrium.
Aia
d
a
i
al
d
a
AaAia
d
a
aIn xgf
xxg
i)(
)( max Stop (34)
The general proof for flow dependent frequencies can now be simplified as follows: In (11)
flows at stop nodes are split according to frequency, hence
'
)'(
)(
ah
ha
al
al
h
d
af
fzx (35)
Since the shortest arc will be an arc which belongs to every used optimal strategy it follows
for the second term in (34) that the maximum will be
a
'
)'()(
maxh
ha
al
h
al
d
a
Aa f
z
f
x
i
(36)
And therefore (34) can be restated as
iid Aa
d
a
i
Hh
ha
al
alaj
h xgf
1fgz
)(
)()( (37)
At equilibrium this becomes an equality since the left hand side of (37) is simply the sum
over the node costs of the downstream nodes plus the waiting time (10) which completes the
proof. From this theorem it follows directly that minimization of a gap function based on
network flows leads to equilibrium conditions.
The cost of a hyperpath in (17) is determined by flow independent costs ca, wih and SP as
well as the flow dependent probability of finding a seat which are determined by qBS and qFS.
Minimising the gap function means hence to find the set of optimal qBS and qFS or,
equivalently, arc split probabilities at boarding and stand-arrival nodes. For an iterative
solution algorithm that ensures convergence to (at least locally optimal) equilibrium flows,
the variation in fail probabilities between iterations k and k-1 can hence approximately
describe the distance to an equilibrium solution. In summary, an even simpler approximate
gap function can be described as:
1kFS
i
kFS
ii
1kBS
i
kBS
ii
qqqqGArrStandBoard
max,maxmax
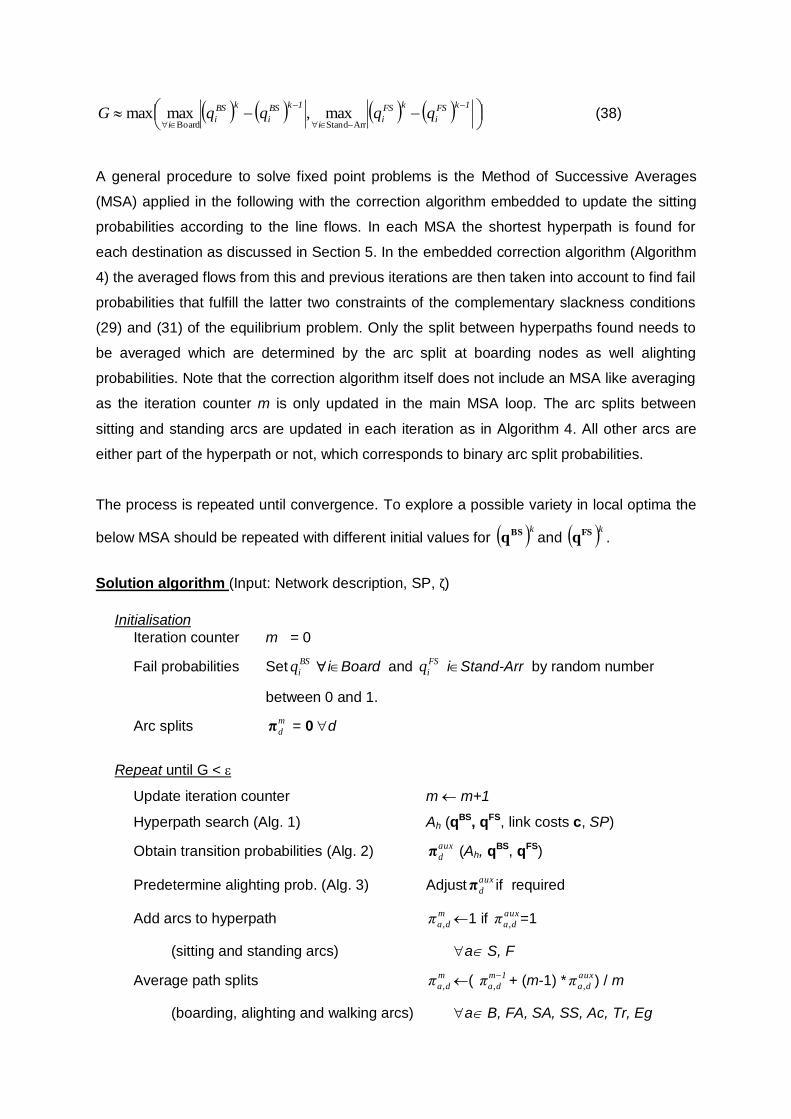
(38)
A general procedure to solve fixed point problems is the Method of Successive Averages
(MSA) applied in the following with the correction algorithm embedded to update the sitting
probabilities according to the line flows. In each MSA the shortest hyperpath is found for
each destination as discussed in Section 5. In the embedded correction algorithm (Algorithm
4) the averaged flows from this and previous iterations are then taken into account to find fail
probabilities that fulfill the latter two constraints of the complementary slackness conditions
(29) and (31) of the equilibrium problem. Only the split between hyperpaths found needs to
be averaged which are determined by the arc split at boarding nodes as well alighting
probabilities. Note that the correction algorithm itself does not include an MSA like averaging
as the iteration counter m is only updated in the main MSA loop. The arc splits between
sitting and standing arcs are updated in each iteration as in Algorithm 4. All other arcs are
either part of the hyperpath or not, which corresponds to binary arc split probabilities.
The process is repeated until convergence. To explore a possible variety in local optima the
below MSA should be repeated with different initial values for kBSq and kFS
q .
Solution algorithm (Input: Network description, SP, ζ)
Initialisation
Iteration counter m = 0
Fail probabilities SetBS
iq iBoard and FS
iq iStand-Arr by random number
between 0 and 1.
Arc splits m
dπ = 0 d
Repeat until G <
Update iteration counter m m+1
Hyperpath search (Alg. 1) Ah (qBS, qFS, link costs c, SP)
Obtain transition probabilities (Alg. 2) aux
dπ (Ah, qBS, qFS)
Predetermine alighting prob. (Alg. 3) Adjustaux
dπ if required
Add arcs to hyperpath m
daπ , 1 if aux
daπ , =1
(sitting and standing arcs) a S, F
Average path splits m
daπ , ( 1m
daπ
, + (m-1) *aux
daπ , ) / m
(boarding, alighting and walking arcs) a B, FA, SA, SS, Ac, Tr, Eg

Repeat until qFS and qBS cease to change (Embedded Alg. 4, Correction algorithm)
Update board and sit proportion m
daπ , aux
daπ ,
a BS, BF
Update stand and sit down proportion m
daπ , m
dFA
aux
da alauπ1π ,, )()(
a FS,FF
Network loading (as in 6.1) x (m
dπ )
Update fail probabilities (Eqs. 8 and 9) qBS (x, seats); qFS (x, seats)
7. ILLUSTRATION WITH SMALL EXAMPLE
The approach is illustrated with the network and demand matrix shown in Figure 2. 400
passengers wish to travel from Station A with only 300 seats being maximal available (200
on Line 1 and 100 on Line 2). Passengers to destinations C and D have the choice between
different route strategies such as “Take Line 1”, “Take Line 2 only” or “Take Line 1 or 2
whichever comes first” whereas passengers travelling to B have to take Line 1.
Demand per hour
B C D
A 100 100 200
B - 100 200
C - - 200
Figure 2: Example network and demand matrix
The sensitivity of the equilibrium to the standing penalty SP has been tested with 5 values
(1, 2, 5, 10, 20). Further, the converge towards the user equilibrium solution has been tested
with different maximum numbers of iterations.
Figure 3 shows the cost of the shortest hyperpath found between the OD pair A to D in each
MSA iteration and for different SP. In the first iteration, independent of any SP, the shortest
uncongested hyperpath is found which in this case is the hyperpath H1: “Take L2 at A and

stay on it until D” with an uncongested cost of 35 (Wait time 12min, travel time 23min). With
increasing congestion for all SP >1 the hyperpath H2: “Take Line 1 or 2 at Station A
whichever comes first and do not change at Station C” becomes also attractive. For example
at the equilibrium for SP=2 both hyperpaths have the same cost of 38.96. (H1 cost: wait
12min + L2,AC: 18.9min + L2,AC:8.1min = 38.96; H2 cost: wait 4min + 2/3 (L1,AB: 14.96min +
L1,BC: 12min + L1,CD:12min) + 1/3 (L2,AC: 18.9min + L2,AC:8.1min) = 38.96). Other
hyperpaths have higher costs and are not used.
When SP = 1 users do not differentiate route costs depending on standing or sitting,
therefore a single run of the solution algorithm is sufficient as in all iterations the same
shortest hyperpath is found. After around 10 MSA iterations the cost difference on all used
hyperpaths has converged to an acceptable level for all SP. The correction algorithm
embedded in each iteration converges fast. For this network in no MSA iteration more than 4
iterations are needed. Tests with different initial conditions for qBS and qFS do not show any
significant differences in the resulting equilibrium conditions.
Table 1 shows the results for SP1 and 2 and Figure 3 illustrates the variation in number of
passengers failing to find a seat on both lines for different values assigned to SP. In case of
SP = 1 seat availability is not considered in the route choice meaning that passengers only
consider minimising the expected travel time. In this case, Line 2, offering a faster
connection to C, becomes very crowded at Station A whereas there are still spaces left when
Line 1 departs Station A. In case of higher line penalties all seats become fully occupied
which means that less passengers from Station A have to stand. As illustrated this is also
reflected in lower, but fairly equal fail-to-sit probabilities qBS11 and qBS
12.

Table 1: Results for different standing penalties
SP = 1 After 2 MSA iterations
Station Line Sit Stand qBS qFS
A 1 166.7 0.0 0.00 --
B 1 200.0 166.7 0.56 0.00
C 1 200.0 133.3 1.00 0.00
A 2 100.0 133.3 0.57 --
C 2 100.0 166.7 1.00 0.87
SP = 2 After 100 MSA iterations Station Line Sit Stand qBS qFS
A 1 200.0 65.3 0.25 --
B 1 200.0 265.3 0.88 0.00
C 1 200.1 231.9 1.00 0.56
A 2 100.0 34.7 0.26 --
C 2 100.0 68.0 1.00 0.05
Figure 3: Fail to sit probabilities a) qBS and b) qFS for different SP
Note that the total number of passengers having to stand not necessarily reduces as a
consequence. Passengers from B will suffer from the preference of passengers from A to
rather choose Line 1 with higher seat availability. Those passengers failing to find a seat on
Line 1 at A take up the seats of those passengers alighting at B. As there are never more
than 300 passengers boarding Line 1 at A, qFS21 is always zero, meaning that all passengers
from A find a seat at least at B. Passengers newly boarding at C have no chance of finding a
seat on either line for SP = 1 or SP = 2. This is because passengers travelling from A or B to
D will not alight at C. Only in the case of SP = 5 there is a very slim possibility that
passengers find a seat. This is because some passengers to C will alight and some
passengers from A to D will have taken Line 1 where there is a higher chance of finding a
seat at A or at B due to alighting passengers.
0
0.2
0.4
0.6
0.8
1
L1 L2 L1 L1 L2
A B C
Bo
ard
ing
sit
tin
g f
ailu
re p
rob
ab
ility
(q
BS )
Node & line
SP 1
SP 2
SP 5
SP 10
SP 20
0
0.2
0.4
0.6
0.8
1
L1 L2
Stan
din
g si
ttin
g fa
ilure
pro
bab
ility
(q
FS)
Line at node C
SP 1
SP 2
SP 5
SP 10
SP 20

8. LONDON CASE STUDY
In order to illustrate the feasibility of the concept to be applied to larger networks the model
has been applied to the inner part of the London Underground network as shown in Figure 4,
which includes 74 stations and 11 lines. Different branches of District and Northern lines
have been modeled as different lines; the resulting network consisting of 14 transit lines
(corresponding to 28 oriented lines) and 297 transit arcs. With the network description as in
Figure 1 this results in a total of 1751 nodes and 3233 arcs being created.
Figure 4: London Underground network modeled (taken and adjusted from Transport for
London)
The model has been run for demand and supply of transit services in the morning peak
hours (7 – 10 am) with data on run times, walking times between platforms and demand data
obtained from Transport for London. All demand and supply data correspond to timetables
and observations made in 2001. In the OD matrix 2,830 non-zero elements generate a total
of 636,904 trips for the 3hour period.
The hyperpath search for this network size is still very fast requiring less than a second. A
single iteration of the correction algorithm including assignment requires around 1min on an
Intel® Core™ Duo CPU with 2.99 GHz, 1.93 GB RAM. Simulations have been carried out
with SP equal to 1, 2, 3 and 5. Initialisation with random seeds has been tested and the
model has further been run with and without predetermined alighting. For low SP the
alighting behaviour assumption does not make a significant difference in the convergence
Northern
South (Bank)
Northern South
(Waterloo)
Bakerloo
SouthVictoria South
District South
District
West
Central
West
H.&City
West
Bakerloo
West
Metropolitan
NorthJubilee
North
Northern
North
Victoria North
Piccadilly North
Central East
District,
H.&City East
Jubilee East
Piccadilly
West

behaviour but for SP=5 no solution to the correction algorithm can be found in case the
adjustment of Algorithm 3 is omitted. This is because for large SP the correction itself
influences demand at stop nodes preventing convergence as discussed in Section 5.3. The
following figures therefore show the results assuming predetermined alighting, with ζ as
indicated.
Convergence of destination specific arc flows and the approximate gap measure (38) for
SP=2 is illustrated in Figure 5. It appears that depending on the initialization of the fail
probabilities the MSA converges to slightly different solutions, though the differences are not
significant. For SP = 3 on 10 arcs (out of 596 sitting and standing arcs) the difference
between flows is above 100 passengers. On all these links this is, however, less than 3% of
the total flow. For SP = 2 the difference on all links is less than 100 passengers. Figure 6
illustrates the convergence behaviour of the correction algorithm. The longest line in the
network is the circle line with 28 stations, so that according to Proposition 5 at most 53
correction algorithms are required. The figure shows that this condition is fulfilled. Increasing
ζ also leads to a slight increase in the average number of correction algorithms per MSA.
This is because with more pessimism the total number of boardings and alightings increases.
Figure 5: Convergence of the MSA (SP= 2, ζ=0.5)
0
100
200
300
400
500
600
700
800
900
1000
0
0.1
0.2
0.3
0.4
0.5
0.6
0.7
0.8
0.9
1
0 20 40 60 80 100
Max
dif
. in
lin
k fl
ow
s
Max
. d
if.
in q
MSA iteration
qBS and qFS gap
Destination specific flow gap

Figure 6: Number of correction algorithms needed per MSA iteration for different SP
Figure 7 illustrates the overall congestion in the London network. In all modeled scenarios at
least 155 out of the 298 arcs are crowded, i.e. all seats are taken. Interestingly with higher
SP the total number of congested links is increasing rather than decreasing, illustrating the
priority effects as well as that a large number of passenger do not have attractive options to
avoid crowded lines. Therefore also the calculation time increases for higher SP as more
iterations for the correction algorithm are needed within each MSA to fulfill equilibrium
conditions (Figure 7). The most congested line sections can be found on the Victoria line as
well as the Central line which corresponds to observations. In particular some sections of the
fast Victoria Line loose passengers with higher SP as some transfer to slower but less
crowded alternatives (e.g. Victoria Line section between Euston and Warren Street: 45974
passengers for SP1 and 41446 passengers in SP2). The effect of ζ on the number of
congested arcs is minimal, though the loads on single arcs varies by up to 7800 passengers
for SP=5, comparing solutions of ζ=0 and ζ=1.
Figure 7: Number of arcs with fail probability > 0 (ζ = 0.5)
0
5
10
15
20
25
30
35
40
45
50
1 11 21 31 41
Co
rre
ctio
n a
lgo
rith
ms
wit
hin
MSA
MSA iteration
SP2 (ζ = 0.5)
SP3 (ζ = 0.5)
SP5 (ζ = 0.5)
155
101
185
121
192
129
201
141
0
50
100
150
200
250
qBS qFS
Nu
mb
er
of
arcs
SP1
SP2
SP3
SP5

9. CONCLUSION AND APPLICATIONS
This paper described an equilibrium transit assignment approach that explicitly considers
seat availability and the resulting priority rules for on-board and newly boarding passengers.
The network is represented as a sitting and a standing line with standing passengers being
able to “upgrade” at each station to the “sitting line” because of seated passengers alighting.
Though this approach requires a large number of nodes and arcs for the network description
a solution to the hyperpath search and user equilibrium assignment problem is presented
that is feasible to be applied to large networks.
The approach has been tested with an application to the inner part of the London
Underground network. When the importance of being able to travel sitting increases (higher
SP) passengers tend to split among more lines resulting in rather different equilibrium
solutions. Our results hence confirm the importance of considering standing penalties for
transit assignment problems.
The approach presented here using “fail-to-sit probabilities” clearly has similarities to
previous work by the same authors on fail-to-board probabilities to consider capacity
constraints. A straightforward extension of this work is therefore to include “fail-to sit” as well
as “fail-to-board” probabilities in the same model. In this way the total capacity as well as the
seat capacity of lines can be considered. Further, one could add a BPR type function for the
costs on standing links in order to reflect the increasing inconvenience by standing in
crowded trains or buses. Schmöcker et al (2008) extend the fail-to-board approach to
consider dynamic effects. The same ideas can also be transferred to the approach
presented in this paper to consider the changing availability of seats during the day. The
main complexity of the Schmöcker et al (2008) approach is how to reassign passengers who
have to wait at the platform for the next service because of insufficient total service capacity.
In the seat capacity model “failed passengers” can be simply assigned to the standing links,
hence avoiding these problems.
The model can be used in several ways. Firstly, a direct application is for transport planning
purposes to better understand the influence of providing more seats either through service
frequency variations or through changed vehicle configurations. Further, the effect of turning
vehicles short or, mainly for bus services, changing the route of services will have an effect
on the equilibrium as in particular passengers from the new terminals will have an increased
chance to obtain a seat. Secondly, the model could be used to provide customers with

information about the “average” seat availability from stops. For some passengers groups
this information might be a decision criterion before deciding on a particular route. Whereas
passengers at bus stops expect information about loads of the next arriving service, a static
model as presented here could be used at the journey planning stage. Information could be
given, for example, when passengers are selecting their route via a “journey planner”
webpage. Currently often expected travel times, number of interchanges and walking times
between platforms are given as information to choose between different route options.
Adding information on the probability of finding a seat, especially at the boarding point, could
be a useful addition.
Acknowledgement This research was partially supported by the U.K.’s Engineering Physics and Science Research Council and from the “Exploratory Research Grant” (20656080) from the Japan Society for the Promotion of Science. References
ATOC (2001). Passenger Demand Forecasting Handbook, Chapter C9, Crowding: Evidence. Cepeda, M., Cominetti, R., Florian, M. (2006). A transit network model with strict capacity
constraints: Characterization and computation of equilibria. Transportation Research Part B, 40 (6), 437-459.
Bell, M. G. H. (1995). Alternatives to Dial's logit assignment algorithm. Transportation Research Part B 29 (4), 287-295.
Bell, M. G. H., Schmöcker, J.-D., Iida, Y. and Lam, W. H. K. (2002). Transit assignment: An application of absorbing Markov chains, In: M. A. P. Taylor (ed.), Transportation and Traffic Theory in the 21st Century, 2002, 43–62.
Cepeda, M., Cominetti, R. and Florian, M. (2006). A frequency-based assignment model for congested transit networks with strict capacity constraints: Characterization and computation of equilibria. Transportation Research Part B 40 (6), 437-459.
Cox, D R and Miller, H. D. (1965). The Theory of Stochastic Processes. Chapman and Hall: London.
De Cea, J. and Fernández, E. (1993). Transit assignment for congested public transport system: An equilibrium model. Transportation Science 27 (2), 133-147.
Kurauchi, F., Bell, M.G.H, Schmöcker, J.-D. (2003). Capacity Constrained Transit Assignment with Common Lines. Journal of Mathematical Modeling and Algorithms 2 (4), 309-327.
Leurent F. (2008) Modelling seat congestion in transit assignment. HAL articles online. Available online http://hal.archives-ouvertes.fr/hal-00348409/fr/ [Accessed February 2010].
Leurent, F. and Liu, K. (2009). On Seat Congestion, Passenger Comfort and Route Choice in Urban Transit: A network equilibrium assignment model with application to Paris. Paper presented at 88th Annual Transportation Research Board Meeting, Washington D.C., January 2009.
London Underground Limited (1988). London Underground Limited: Research into Crowding Penalties for LUL and LRT. LRT Operational Research Report, OR 88/4, February 1988, Unpublished.
Nguyen, S. and S. Pallottino (1988). Equilibrium traffic assignment for large scale transit networks. European Journal of Operational Research 37 (2), 176-186.

Nökel, K. and S. Wekeck (2009). Boarding and alighting in frequency-based transit assignment. Paper presented at 88th Annual Transportation Research Board Meeting, Washington D.C., January 2009.
Schmöcker, J.-D. (2006). Dynamic Capacity Constrained Transit Assignment. Ph.D. thesis, Imperial College London, U.K., July 2006.
Schmöcker, J.-D., Kurauchi, F. and Bell, M.G.H. (2008). A Quasi-Dynamic Capacity Constrained Frequency-Based Transit Assignment Model. Transportation Research Part B 42 (10), 925-945.
Spiess, H and Florian, M. (1989). Optimal Strategies: A new assignment model for transit networks. Transportation Research Part B, 23 (2), 83-102.
Strassen, V. (1969). Gaussian Elimination is not Optimal. Numerische Mathematik 13 (4), 354.-356.
Sumalee, A., Tan, Z. J., and Lam, W. H. K. (2009). Dynamic stochastic transit assignment with explicit seat allocation model. Transportation Research Part B 43 (8-9), 895-912.
Tian, Q., Huang, H.-J. and Yang, H. (2007). Commuting Equilibria on a mass transit system with capacity constraints Proceedings of the 17th International Symposium on Transportation and Traffic Theory (ISTTT), Elsevier: Oxford, 261-384.