MetaboAnalyst: a web server for metabolomic data analysis and interpretation
9
W652–W660 Nucleic Acids Research, 2009, Vol. 37, Web Server issue Published online 8 May 2009 doi:10.1093/nar/gkp356 MetaboAnalyst: a web server for metabolomic data analysis and interpretation Jianguo Xia 1 , Nick Psychogios 2 , Nelson Young 2 and David S. Wishart 1,2,3, * 1 Department of Biological Sciences, 2 Department of Computing Science, University of Alberta and 3 National Research Council, National Institute for Nanotechnology (NINT), Edmonton AB T6G 2E8, Canada Received February 9, 2009; Revised April 16, 2009; Accepted April 22, 2009 ABSTRACT Metabolomics is a newly emerging field of ‘omics’ research that is concerned with characterizing large numbers of metabolites using NMR, chromatogra- phy and mass spectrometry. It is frequently used in biomarker identification and the metabolic profil- ing of cells, tissues or organisms. The data proces- sing challenges in metabolomics are quite unique and often require specialized (or expensive) data analysis software and a detailed knowledge of che- minformatics, bioinformatics and statistics. In an effort to simplify metabolomic data analysis while at the same time improving user accessibility, we have developed a freely accessible, easy-to-use web server for metabolomic data analysis called MetaboAnalyst. Fundamentally, MetaboAnalyst is a web-based metabolomic data processing tool not unlike many of today’s web-based microarray analysis packages. It accepts a variety of input data (NMR peak lists, binned spectra, MS peak lists, compound/concentration data) in a wide vari- ety of formats. It also offers a number of options for metabolomic data processing, data normalization, multivariate statistical analysis, graphing, metabo- lite identification and pathway mapping. In particu- lar, MetaboAnalyst supports such techniques as: fold change analysis, t-tests, PCA, PLS-DA, hierar- chical clustering and a number of more sophisti- cated statistical or machine learning methods. It also employs a large library of reference spectra to facilitate compound identification from most kinds of input spectra. MetaboAnalyst guides users through a step-by-step analysis pipeline using a variety of menus, information hyperlinks and check boxes. Upon completion, the server generates a detailed report describing each method used, embedded with graphical and tabular outputs. MetaboAnalyst is capable of handling most kinds of metabolomic data and was designed to perform most of the common kinds of metabolomic data analyses. MetaboAnalyst is accessible at http:// www.metaboanalyst.ca INTRODUCTION Metabolomics is a field of ‘omics’ science that aims to study global metabolic changes in biological systems (1). It is largely based on the use of nuclear magnetic res- onance (NMR) spectroscopy, gas chromatography mass spectrometry (GC–MS) and liquid chromatography mass spectrometry (LC–MS) to detect, identify and quantify small molecule metabolites from biological tissues and biofluids (2). Typically hundreds to thousands of com- pounds or spectral features can be seen in a typical high throughput metabolomic assay. While still a relatively new member of the ‘omics’ family, metabolo- mics is already finding applications in a wide variety of research fields including disease diagnosis (3), drug toxicity studies (4) and functional genomics (5). With the rapid growth of this field, there is an increasing demand for dedicated software tools that support the processing and analysis of metabolomic data from a variety of ana- lytical platforms. There are two major approaches to analyzing metabo- lomic data—chemometric approaches and quantitative approaches (2). With chemometric approaches the com- pounds are not initially identified—only their spectral pat- terns and intensities are recorded, statistically compared and used to identify the relevant spectral features that distinguish sample classes. Once these features have been identified, a variety of approaches may then used to iden- tify the metabolites corresponding to the most important features. Chemometric approaches can be applied to data acquired by NMR, Fourier transform infrared spectros- copy (FTIR) and direct injection mass spectrometry (DIMS). In contrast to chemometric approaches, quanti- tative metabolomics (or targeted profiling) aims to for- mally identify and quantify all detectable metabolites from the spectra, prior to subsequent data analysis. Metabolites are identified and quantified by comparing *To whom correspondence should be addressed. Tel: +1 780 492 0383; Fax: +1 780 492 5303; Email: [email protected] ß 2009 The Author(s) This is an Open Access article distributed under the terms of the Creative Commons Attribution Non-Commercial License (http://creativecommons.org/licenses/ by-nc/2.0/uk/) which permits unrestricted non-commercial use, distribution, and reproduction in any medium, provided the original work is properly cited. by guest on June 2, 2016 http://nar.oxfordjournals.org/ Downloaded from
-
Upload
independent -
Category
Documents
-
view
3 -
download
0
Transcript of MetaboAnalyst: a web server for metabolomic data analysis and interpretation
W652–W660 Nucleic Acids Research, 2009, Vol. 37, Web Server issue Published online 8 May 2009doi:10.1093/nar/gkp356
MetaboAnalyst: a web server for metabolomicdata analysis and interpretationJianguo Xia1, Nick Psychogios2, Nelson Young2 and David S. Wishart1,2,3,*
1Department of Biological Sciences, 2Department of Computing Science, University of Alberta and3National Research Council, National Institute for Nanotechnology (NINT), Edmonton AB T6G 2E8, Canada
Received February 9, 2009; Revised April 16, 2009; Accepted April 22, 2009
ABSTRACT
Metabolomics is a newly emerging field of ‘omics’research that is concerned with characterizing largenumbers of metabolites using NMR, chromatogra-phy and mass spectrometry. It is frequently usedin biomarker identification and the metabolic profil-ing of cells, tissues or organisms. The data proces-sing challenges in metabolomics are quite uniqueand often require specialized (or expensive) dataanalysis software and a detailed knowledge of che-minformatics, bioinformatics and statistics. In aneffort to simplify metabolomic data analysis whileat the same time improving user accessibility, wehave developed a freely accessible, easy-to-useweb server for metabolomic data analysis calledMetaboAnalyst. Fundamentally, MetaboAnalyst isa web-based metabolomic data processing toolnot unlike many of today’s web-based microarrayanalysis packages. It accepts a variety of inputdata (NMR peak lists, binned spectra, MS peaklists, compound/concentration data) in a wide vari-ety of formats. It also offers a number of options formetabolomic data processing, data normalization,multivariate statistical analysis, graphing, metabo-lite identification and pathway mapping. In particu-lar, MetaboAnalyst supports such techniques as:fold change analysis, t-tests, PCA, PLS-DA, hierar-chical clustering and a number of more sophisti-cated statistical or machine learning methods. Italso employs a large library of reference spectra tofacilitate compound identification from most kindsof input spectra. MetaboAnalyst guides usersthrough a step-by-step analysis pipeline using avariety of menus, information hyperlinks and checkboxes. Upon completion, the server generates adetailed report describing each method used,embedded with graphical and tabular outputs.MetaboAnalyst is capable of handling most kinds
of metabolomic data and was designed to performmost of the common kinds of metabolomic dataanalyses. MetaboAnalyst is accessible at http://www.metaboanalyst.ca
INTRODUCTION
Metabolomics is a field of ‘omics’ science that aimsto study global metabolic changes in biological systems(1). It is largely based on the use of nuclear magnetic res-onance (NMR) spectroscopy, gas chromatography massspectrometry (GC–MS) and liquid chromatography massspectrometry (LC–MS) to detect, identify and quantifysmall molecule metabolites from biological tissues andbiofluids (2). Typically hundreds to thousands of com-pounds or spectral features can be seen in a typicalhigh throughput metabolomic assay. While still arelatively new member of the ‘omics’ family, metabolo-mics is already finding applications in a wide varietyof research fields including disease diagnosis (3), drugtoxicity studies (4) and functional genomics (5). With therapid growth of this field, there is an increasing demandfor dedicated software tools that support the processingand analysis of metabolomic data from a variety of ana-lytical platforms.
There are two major approaches to analyzing metabo-lomic data—chemometric approaches and quantitativeapproaches (2). With chemometric approaches the com-pounds are not initially identified—only their spectral pat-terns and intensities are recorded, statistically comparedand used to identify the relevant spectral features thatdistinguish sample classes. Once these features have beenidentified, a variety of approaches may then used to iden-tify the metabolites corresponding to the most importantfeatures. Chemometric approaches can be applied to dataacquired by NMR, Fourier transform infrared spectros-copy (FTIR) and direct injection mass spectrometry(DIMS). In contrast to chemometric approaches, quanti-tative metabolomics (or targeted profiling) aims to for-mally identify and quantify all detectable metabolitesfrom the spectra, prior to subsequent data analysis.Metabolites are identified and quantified by comparing
*To whom correspondence should be addressed. Tel: +1 780 492 0383; Fax: +1 780 492 5303; Email: [email protected]
� 2009 The Author(s)This is an Open Access article distributed under the terms of the Creative Commons Attribution Non-Commercial License (http://creativecommons.org/licenses/by-nc/2.0/uk/) which permits unrestricted non-commercial use, distribution, and reproduction in any medium, provided the original work is properly cited.
by guest on June 2, 2016http://nar.oxfordjournals.org/
Dow
nloaded from

the NMR, GC–MS or LC–MS spectrum of the bio-sample of interest to a set of authentic (isotopicallylabeled) standards or to a spectral reference libraryobtained from authentic standards. This approachrequires that the compounds of interest to be known apriori. With the availability of several comprehensivemetabolomic databases (6–9) and metabolome libraries,quantitative metabolomics is becoming increasinglycommon.
Whether the resulting data is chemometric data orquantitative data, what is not commonly realized bymany metabolomics researchers is that metabolomicsdata share a great deal of similarity with microarraydata. Both types of data matrices are large and featurerich. Likewise the objectives in microarray analysis aresimilar to those in metabolomic analysis. For example,both kinds of studies are aimed at identifying significantfeatures associated with certain conditions (biomarker dis-covery) or for diagnosis (classification). Furthermore,both kinds of studies are often challenged with theproblem of dealing with a limited sample size and ahigh-dimensional feature space. By using the robust dataprocessing algorithms originally developed for microarrayanalysis and applying them to metabolomic analysis, webelieved it could be possible to create a powerful suite oftools for metabolomic data processing. In particular,we chose to work with the resources available from theopen source R-project (http://www.R-project.org) and theR-based Bioconductor project (10). These software repo-sitories are widely considered to be the most completecollection of up-to-date statistical and machine learningalgorithms for microarray data analysis. The algorithmsare actively developed and conscientiously maintained byR-project team members and external contributors.In many respects they have become the reference toolsfor the microarray field. By combining these R-based ana-lytical tools with metabolite identification and pathwaymapping tools originally developed in our own laboratory(6,11), we have created MetaboAnalyst—a web-basedserver for processing, analyzing, visualizing and annotat-ing high throughput metabolomic data.
In particular, MetaboAnalyst is able to process a widevariety of metabolomic data types including compoundconcentration tables (for quantitative metabolomics) aswell as spectrally binned data, NMR/MS peak lists andGC/LC-MS spectra (NetCDF, mzXML, mzDATA—forchemometric metabolomics). It also provides a compre-hensive list of analysis options for normalization, featureidentification, dimensional reduction clustering andclassification. Furthermore, MetaboAnalyst producescolorful graphical output and it supports a number ofcompound identification and pathway mapping tools fordata annotation. Additional details about the server, itsinterface and its analytical features are provided in thefollowing pages.
PROGRAM DESCRIPTION AND METHODS
MetaboAnalyst’s web interface was developed using JavaServer Faces (JSF) technology (http://java.sun.com/
javaee/javaserverfaces). The backend statistical computingand visualization operations were carried out usingfunctions from the R and Bioconductor packages.The integration between Java and R was establishedthrough the Rserve package (http://www.rforge.net/Rserve). Spectral matching and pathway identificationsoftware was developed in Java using the spectral librariesand pathway libraries developed for the HumanMetabolome Project (6) and MetaboMiner (11).JSF is a very powerful technology for developing
Java-based web applications. It is designed to simplifythe development of user interfaces for Java EnterpriseEdition (Java EE) applications by automatic handling oflow level HTTP requests and user input processing. JSFuses a component-based model for web development.Using the visual JSF web application tool offered by theNetBeans (http://www.netbeans.org) integrated develop-ment environment (IDE), components can be literally‘painted’ on a virtual JSF page by dragging-and-droppingthem from a palette of JSF component library. Eventhandlers can then be defined for each component thesame way as for developing standalone Java graphicuser interface (GUI) application. Finally, navigationrules are specified for each page from a central XML con-figuration file (faces-config.xml). User actions on a webinterface will trigger an event whose return value deter-mines which page is to be displayed subsequently based onthe navigation rules specified for that page. This approachfacilitates modular and flexible design, making web appli-cation development much simpler and faster.MetaboAnalyst consists of several functional modules
which will be discussed, in detail, later. These functionsare carried out by several R scripts and Bioconductorfunction calls. Detailed information about the individualpackages used and the R scripts can be downloaded fromthe MetaboAnalyst home page. When MetaboAnalystis run, the executed R commands are recorded to a tem-porary text file. During the summary report generation,this R command history is examined and the last call foreach analysis performed is re-evaluated using the RSweave function which executes the R commands andwrites text descriptions along with tabular and graphicalresults into a LaTeX file. Finally, the LaTeX file is con-verted into a PDF report describing the analysis, which isavailable to the user for download.MetaboAnalyst is currently hosted on GlassFish
(version 2 update release 2, https://glassfish.dev.java.net)installed on a Linux operating system (Fedora Core 9).The server is equipped with two Intel Pentium 4 proces-sors (2.8GHz each) and 4GB of physical memory.The web application is platform independent and hasbeen tested successfully under both Linux and Windowsoperating systems. R (version 2.8.0) is currently installedon the same machine with latest Bioconductor release 2.3and Rserve 0.5–2.A diagram illustrating MetaboAnalyst’s workflow is
shown in Figure 1. MetaboAnalyst is not a ‘single-click’analysis tool, but rather it is an on-line analysis pipelinesimilar in concept to several existing on-line microarrayanalysis tools such as GEPAS (12) and CARMAweb (13).It is primarily designed to allow users to conduct
Nucleic Acids Research, 2009, Vol. 37, Web Server issue W653
by guest on June 2, 2016http://nar.oxfordjournals.org/
Dow
nloaded from

two-group discriminant analysis (i.e. control vs. non-con-trol—the most common type of metabolomic analysis) forclassification and ‘significant feature’ identification.MetaboAnalyst also supports both paired and unpaireddata analyses. A typical MetaboAnalyst run consists ofsix steps: (i) data upload, (ii) processing, (iii) normaliza-tion, (iv) statistical analysis, (v) annotation and (vi) sum-mary report download. Users are guided through thesesteps by MetaboAnalyst’s intuitive interface and the nav-igation bar on the left panel of each page. Completed stepsare indicated by a change in color. Certain downstreamanalyses may not be allowed depending on the context ortype of analyses previously performed. Detailed descrip-tions, help files or helpful hints are either shown on thecorresponding web pages or are provided as mouse-overpop-up balloons. This support is further enhanced bythe availability of several step-by-step tutorials, sampledata sets (NMR, GC/LC–MS, binned data, etc.), samplesummary files and frequently asked questions (FAQs)available on MetaboAnalyst’s web site.
Step 1: data upload
Users can begin a MetaboAnalyst analysis by pressing the‘Click Here to Start’ link on the MetaboAnalyst’s home
page. This takes users to the data upload page. Becausethere is no widely-accepted standard format for reportingmetabolomics experiments MetaboAnalyst has beendesigned to accept diverse data types including compoundconcentration tables (from quantitative metabolomic stu-dies), binned spectral data, NMR or MS peak lists, as wellas raw GC–MS and raw LC–MS spectra. For compoundconcentration or binned spectral data, MetaboAnalystrequires that they be uploaded as a comma separatedvalues (CSV) table with class labels (control and abnor-mal, say) immediately following the sample names. Forpeak list data, MetaboAnalyst requires that they beuploaded as two zipped folders containing peak list filesfrom the two respective groups. Each file should be a twoor three-column CSV list indicating peak positions (che-mical shift for NMR peaks, mass and/or retention time forMS peaks) and intensities, respectively. Examples of theseformats and more detailed explanations of the formattingrequirements are provided on the MetaboAnalyst homepage. Vendor-specific, proprietary GC–MS or LC–MSspectra should be first converted to open exchange fileformats (NetCDF, mzXML, mzDATA) and uploaded astwo zipped folders corresponding to the two groups beinganalyzed. Detailed instructions on how to specify paired
Figure 1. A diagram illustrating MetaboAnalyst’s workflow and data processing options. Different data inputs are first transformed into compatibledata matrices using several different processing methods. A variety of algorithms are implemented for data normalization, analysis, and annotation.The number of available options is shown inside the round brackets for each category. At the end of any given analysis, a comprehensive PDFreport, the processed data, and high-resolution images are available for download.
W654 Nucleic Acids Research, 2009, Vol. 37,Web Server issue
by guest on June 2, 2016http://nar.oxfordjournals.org/
Dow
nloaded from

information (for paired data analysis) as well as examplesfor each data type are available through MetaboAnalyst’s‘Data Formats’ link on the home page.
Step 2: data processing and data integrity checking
Depending on the type of uploaded data, different pro-cessing strategies can be employed to convert the rawnumbers into a data matrix suitable for downstream ana-lysis. For compound concentration lists, the data can beused immediately after MetaboAnalyst’s data integritycheck. For binned spectral data, a linear filter is firstapplied in order to remove baseline noise. This is donebecause most data processing algorithms do not workproperly with many near-zero values. For NMR and/orMS peak lists, MetaboAnalyst first groups the peaksacross all samples based on their positions. For GC–MSand LC–MS spectra or total ion chromatograms, the pro-gram performs peak detection, peak grouping, and reten-tion time correction sequentially using the popular XCMSpackage (14). Users can adjust the default parameters foreach processing step.
Often there are large numbers of missing values in atypical quantitative metabolomics dataset (10–40% inour experience). Most of these missing values are due tovarious compounds in certain samples being below theinstrument detection limits. To allow selected analyses toproceed (without divide-by-zero problems) these missingvalues are replaced by the half of the minimum valuefound in the dataset by default. We also implemented avariety of methods which enable users to manually orautomatically perform missing value exclusion, missingvalue replacement, as well as missing value imputationby Probabilistic PCA (PPCA), Bayesian PCA (BPCA)and Singular Value Decomposition Imputation(SVDImpute) (15,16). In addition, as part of the dataintegrity check, MetaboAnalyst also verifies class labelsand pair specification (if applicable) to make sure allthe required information is present and consistent beforeproceeding to the next step.
Step 3: data normalization
At this stage, the uploaded data is compiled into a table inwhich each sample is formally represented by a row andeach feature identifies a column. With the data structuredin this format, two types of data normalization proto-cols—row-wise normalization and column-wise normali-zation—may be used. These are often applied sequentiallyto reduce systematic variance and to improve the perfor-mance for downstream statistical analysis. Row-wise nor-malization aims to normalize each sample (row) so that itis comparable to the other. Four commonly used metabo-lomic normalization methods have been implemented inMetaboAnalyst, including normalization to a constantsum, normalization to a reference sample (probabilisticquotient normalization) (17), normalization to a referencefeature (creatinine or an internal standard) and sample-specific normalization (dry weight or tissue volume).In contrast to row-wise normalization, column-wisenormalization aims to make each feature (column) morecomparable in magnitude to the other. Four widely-used
methods are offered in MetaboAnalyst—log transforma-tion, auto-scaling, Pareto scaling and range scaling.Given the vast dynamic range of many features (com-pound concentration or ion abundance) in metabolomicsdata, normalization is highly recommended. The effectsand utility of these different normalization strategieshave been discussed in detail elsewhere (18) and aredescribed further in MetaboAnalyst’s online tutorials.
Step 4: data analysis
MetaboAnalyst’s data analysis module is a collection ofwell-established statistical and machine learning algo-rithms that have been shown to be particularly robustfor high-dimensional data analysis. These algorithms areorganized into five analysis ‘paths’ for users to explore.
Univariate analysis path. Because of their simplicity andinterpretability, univariate analyses are often first used toobtain an overview or rough ranking of potentially impor-tant features before applying more sophisticated analyses.Univariate analysis examines each variable separately anddoes not consider the effect of multiple comparisons.MetaboAnalyst’s univariate analysis path supports threecommonly used methods—fold-change analysis, t-testsand volcano plots. In a t-test one attempts to determinewhether the means of two groups are distinct. Once at-value is determined, a P-value can be calculated thatcan be used to determine whether this distinction is statis-tically significant. Both paired (same individuals measuredbefore and after an intervention) and unpaired (indivi-duals randomly assigned to two groups) analyses aresupported. Volcano plots are used to compare the sizeof the fold change to the statistical significance level.The horizontal axis plots the fold change between thetwo groups (on a log scale), while the vertical axis repre-sents the P-value for a t-test of differences between sam-ples (on a negative log scale).
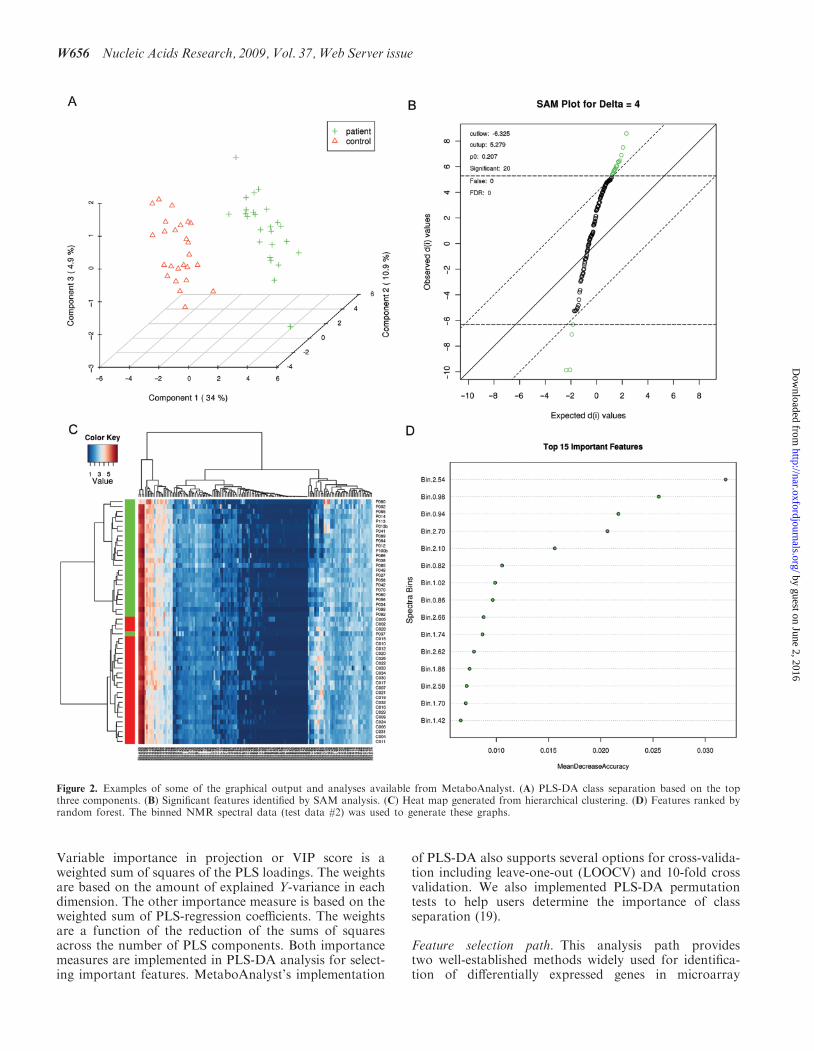
Chemometric analysis path. This analysis path offersthe two most commonly used chemometric methods—principal component analysis (PCA) and partial-leastsquares discriminant analysis (PLS-DA). PCA is an unsu-pervised method aiming to find the directions of maximumvariance in a data set (X) without referring to the classlabels (Y). PLS-DA is a supervised method that uses mul-tiple linear regression technique to find the direction ofmaximum covariance between a data set (X) and theclass membership (Y). For both methods, the originalvariables are summarized into much fewer variablesusing their weighted averages. These new variables arecalled scores. The weighting profiles are called loadings.MetaboAnalyst provides various views commonly usedfor PCA and PLS-DA analysis. Users can specify eachaxis to view the patterns between different components.Both two-dimensional (2D) and three-dimensional (3D)views are implemented. A 3D PLS-DA score plot isshown in Figure 2A. As a supervised method, PLS-DAcan perform both classification and feature selection.The algorithm uses cross-validation to select an optimalnumber of components for classification. Two featureimportance measures are commonly used in PLS-DA.
Nucleic Acids Research, 2009, Vol. 37, Web Server issue W655
by guest on June 2, 2016http://nar.oxfordjournals.org/
Dow
nloaded from
Variable importance in projection or VIP score is aweighted sum of squares of the PLS loadings. The weightsare based on the amount of explained Y-variance in eachdimension. The other importance measure is based on theweighted sum of PLS-regression coefficients. The weightsare a function of the reduction of the sums of squaresacross the number of PLS components. Both importancemeasures are implemented in PLS-DA analysis for select-ing important features. MetaboAnalyst’s implementation
of PLS-DA also supports several options for cross-valida-tion including leave-one-out (LOOCV) and 10-fold crossvalidation. We also implemented PLS-DA permutationtests to help users determine the importance of classseparation (19).
Feature selection path. This analysis path providestwo well-established methods widely used for identifica-tion of differentially expressed genes in microarray
Figure 2. Examples of some of the graphical output and analyses available from MetaboAnalyst. (A) PLS-DA class separation based on the topthree components. (B) Significant features identified by SAM analysis. (C) Heat map generated from hierarchical clustering. (D) Features ranked byrandom forest. The binned NMR spectral data (test data #2) was used to generate these graphs.
W656 Nucleic Acids Research, 2009, Vol. 37,Web Server issue
by guest on June 2, 2016http://nar.oxfordjournals.org/
Dow
nloaded from

experiments—Significance Analysis of Microarrays (andMetabolites) (SAM) (20) and Empirical BayesianAnalysis of Microarrays (and Metabolites) (EBAM)(21). However, these methods are very general for identi-fication of significant features in high-dimensional dataand are not restricted to the analysis of microarray data.SAM is designed to address false discovery rate problems(FDR) when running multiple tests on high-dimensionaldata. It first assigns a significance score to each variablebased on its change relative to the standard deviation ofrepeated measurements. Then it chooses variables withscores greater than an adjustable threshold and comparestheir relative difference to the distribution estimatedby random permutations of the class labels. For eachthreshold, a certain proportion of the variables in the per-mutation set will be found to be significant by chance. Thenumber is used to calculate the FDR. In this way SAM isable to perform permutation testing, something that is notdone in MetaboAnalyst’s t-tests. The EBAM algorithm isessentially a variation of the SAM method. The only dif-ference is that EBAM uses a modified t-statistic in calcu-lating its score. Typical SAM and EBAM plots areprovided to assist users in choosing the best parametersand viewing the results. Tables containing numericdetails are also available through hyperlinks in additionto these graphical presentations. A SAM plot is shown inFigure 2B.
Cluster analysis path. MetaboAnalyst’s cluster analysisallows a closer interrogation of samples with similar abun-dance profiles. This path includes two major approachesof clustering analysis — hierarchical clustering and parti-tional clustering. Hierarchical (agglomerative) clusteringbegins with each sample considered as separate clusterand then proceeds to combine them until all samplesbelong to one cluster. A variety of dissimilarity measures(Euclidean distance, Pearson’s correlation, andSpearman’s rank correlation) and clustering methods(average linkage, complete linkage, single linkage andWard’s linkage) have been implemented inMetaboAnalyst. The result of hierarchical clustering isusually presented as a dendrogram or heat map, both ofwhich are available in MetaboAnalyst. A heat map view ispresented in Figure 2C using one of our test data sets.Partitional clustering attempts to directly decompose thedata set into a user-specified number of disjoint clusters.Two widely used methods, k-means clustering and self-organizing map (SOM) have been implemented inMetaboAnalyst. k-Means clustering aims to create k clus-ters such that the sum of squares from points to theassigned cluster centers’ is minimized. SOM is an unsuper-vised neural network based around the concept of a gridof interconnected nodes, each of which contains a model.The model clusters begin as random values, but during theiterative training process, they are updated to representdifferent subsets of the training set. Users indicate thecluster number by specifying the expected dimension ofthe grid. The clusters from both k-means and SOM arepresented as aggregated expression profiles in which sam-ples in each cluster are plotted as line graphs on top ofeach other using their feature values.
Supervised classification path. Class prediction usingmetabolomics data is increasingly important in studiesaiming for early diagnosis, prognosis or treatment out-comes. MetaboAnalyst offers three powerful supervisedclassification methods—PLS-DA, random forest (22)and support vector machine (SVM). These methods haveproved to be robust for high-dimensional data and arewidely used for other ‘omics’ data analysis. In addition,they can also help prioritize features that contribute sig-nificantly to the performance. PLS-DA based featureselection and classification was previously discussed inthe chemometrics path. Random forest uses an ensembleof classification trees, each of which is grown by randomfeature selection from a bootstrap sample at each branch.Class prediction is based on the majority vote of theensemble. During tree construction, about one-third ofthe instances are left out of the bootstrap sample. Thisdata is then used as test sample to obtain an unbiasedestimate of the classification (OOB) error. Variable impor-tance is evaluated by measuring the increase of the OOBerror when it is permuted. Figure 2D shows the importantfeatures ranked by random forest. The SVM classificationalgorithm aims to find a nonlinear decision function in theinput space by mapping the data into a higher dimensionalfeature space and separating it by means of a maximummargin hyperplane (23). MetaboAnalyst’s SVM analysis isdone through recursive feature selection and sample clas-sification using a linear kernel (24). Features are selectedbased on their relative contribution in the classificationusing cross validation error rates. The least importantfeatures are eliminated in the subsequent steps. Thisprocess creates a series of SVM models. The featuresused by the best model are considered to be importantand are ranked by their frequencies of being selected inthe model.
Step 5: Data annotation (peak search and pathwaymapping)
A key step in placing statistically significant findings fromchemometric analyses (as opposed to quantitative meta-bolomic analyses) into a biological context is to identifysignificantly altered compounds represented by certainspectral bins or certain clusters of spectral peaks. Once auser has identified lists of MS or NMR peaks that exhibitstatistically significant changes, they may use one of sev-eral spectral comparison routines and spectral libraries toattempt to identify the compound(s) based on either listsof MS peaks (from MS or MS/MS data), GC-–MS peaks(from EI mass values and retention indices) or NMRpeaks (from 1H, 13C or heteronuclear NMR spectra).These compound identification routines and spectral ref-erence libraries were originally developed for the HMDBand for MetaboMiner (11). While not as comprehensive assome commercial libraries or commercial software, thesefreely available tools have been shown to be quite power-ful in identifying many common compounds. Once com-pound information becomes available (via quantitativeroutes or via MetaboAnalyst’s metabolite ID software),more insight can be obtained by which metabolicpathways are involved. Pathway mapping has been
Nucleic Acids Research, 2009, Vol. 37, Web Server issue W657
by guest on June 2, 2016http://nar.oxfordjournals.org/
Dow
nloaded from

implemented in MetaboAnalyst using more than 70 path-way diagrams and metabolite libraries derived from theHMDB. Users simply type the names (or synonyms) ofthe metabolites identified and MetaboAnalyst providesthe list of pathways in which these metabolites arefound, along with hyperlinks to their pathway images.All results are linked to the HMDB where users canobtain more detailed information for each metabolite orpathway.
Step 6: summary report download
When users finish their analyses and click the downloadlink, a comprehensive report will be generated containinga detailed description of each step performed embeddedwith graphical and tabular outputs. In addition, the pro-cessed numeric data, high-resolution images (PNGformat), R scripts, as well as the R command history arealso available for downloading. Users familiar with R caneasily reproduce the results on their local machine afterinstallation of R and the required packages. Users havethe option of providing an email address (to which thesummary report is sent) or simply downloading the com-pressed file that contains all the data (graphs, tables, etc.)produced during the analysis. A sample summary report isavailable for download from MetaboAnalyst’s homepage.Raw data files are stored on the server in a temporaryfolder for up to 72 hrs and then deleted from the serverusing an automatic ‘cron’ job. After the user has analyzedtheir data and logs out (after providing their emailaddress) they are sent a URL via email that will allowthem to return to their analysis session. Allimages, figures and tables generated by a MetaboAnalystsession are downloadable and may be permanently storedon the user’s own hard drive.
Tutorials and sample data sets
The inherent complexity of many data processing techni-ques combined with lack of familiarity that many usersmay have with some of the analytical approaches usedby MetaboAnalyst led us to develop a number of tutorialsand sample data sets. This was also done so that new userscould become more familiar with MetaboAnalyst’sexpected inputs and outputs. Under the ‘Try our testdata’ in the data upload window, users will find eight dif-ferent data sets labeled as: (i) concentrations (a metaboliteconcentration table); (ii) NMR spectral bins; (iii) NMRpeak lists; (iv) concentrations (paired, time series); (v) MSpeak intensities; (vi) MS peak lists; (vii) LC-MS spectra inNetCDF format and (viii) GC-MS spectra in NetCDFformat. Users may process these data by clicking onthe radio button beside a given data set and pressing theSubmit button. Alternately, these example data sets can bedownloaded and subsequently ‘uploaded’ using the‘Upload your data’ section. Once a test data set is sub-mitted (or uploaded) the user may navigate throughMetaboAnalyst in any way they choose.MetaboAnalyst also has four step-by-step tutorials
describing several analysis paths using a number of differ-ent data sets. These tutorials are available from both thehomepage and from the data upload page. Tutorial #1
uses the Metabolite concentration list (data set #1).Tutorial #2 uses the Binned NMR spectra (data set #2),Tutorial #3 uses the paired concentration data (data set#4) and Tutorial #4 uses the LC-MS spectra in NetCDFformat (data set #7). MetaboAnalyst also has �20 FAQsto complement the information found in the tutorials.These tutorials and FAQs will be updated frequentlybased on user feedback.
Comparison to other software and limitations
Many metabolomic analyses are currently done usinglocal installations of commercial statistical softwarepackages such as MatLab, MS-Excel, SigmPlot andSIMCA-P. SIMCA-P (Umetrics), in particular, is verywidely used by the metabolomics community. Whilequite expensive, SIMCA-P offers excellent graphic cap-abilities and comprehensive analysis options for threemultivariate methods (PCA, PLS/OPLS and SIMCA).MetaboAnalyst supports two of these multivariate meth-ods (PCA and PLS) but it also offers many other methods(i.e. volcano plots, SAM, k-means, SOM, random forest,SVM) not found in SIMCA-P. While MetaboAnalyst doesnot have the graphical flexibility of SIMCA-P, it isdesigned to be more accessible (via the web), freely avail-able, and easier to use. In addition, MetaboAnalyst pro-vides its own metabolite and pathway identificationtools—something that is not found in any dedicated sta-tistical software package. However, MetaboAnalyst’sdependence on the HMDB infrastructure means that itscoverage of plant and microbial metabolism is somewhatincomplete.
To the best of our knowledge, the only other webapplication that offers a similar service toMetaboAnalyst is MeltDB (25). MeltDB is centered onMS-based metabolomics data storage, administration,analysis and annotation. Unfortunately, this serverappears to have security certificate issues with a numberof common browsers (Firefox, Netscape) and requires auser login and password to obtain access. According tothe article, MeltDB appears to offer some of the featuresfound in MetaboAnalyst such as t-tests, volcano plots,PCA and heat maps. However, these analyses arerestricted to GC/LC-MS data only. MetaboAnalyst pro-vides support for many more diverse data types, moreadvanced data analysis methods, more comprehensivedata annotation tools as well as automated report gener-ation utilities.
The current implementation of MetaboAnalyst primar-ily supports (i) biomarker discovery and (ii) two-groupdiscrimination. We believe these kinds of analyses aremost relevant to the widest range of metabolomics studies.Multiclass problems can always be converted into a seriesof two-class problems through pair-wise decomposition.Temporal studies (more than two time points) can betreated as a special case of multi-class problem anddecomposed into a series of paired two-group analyses(see Tutorial #3 for an example of a time series analysis).We hope to add more functions to support simultaneousanalysis of multiple time-points in the near future.
W658 Nucleic Acids Research, 2009, Vol. 37,Web Server issue
by guest on June 2, 2016http://nar.oxfordjournals.org/
Dow
nloaded from

MetaboAnalyst makes extensive use of high-leveldata inputs (i.e. concentrations, peak lists) that requiresusers to perform some manual processing steps prior touploading the data. The support for raw or partiallyprocessed GC-MS and LC-MS spectra is currentlyachieved through the XCMS package (14). However, soft-ware to handle unprocessed NMR spectra is not so readilyavailable. Steps such as phasing, baseline correction, refer-encing, peak detection and deconvolution must be manu-ally checked by an experienced analyst to ensure theintegrity of the results. As a result, MetaboAnalyst doesnot accept raw NMR spectra. Likewise, MetaboAnalyst isnot (yet) capable of handling or interpreting capillary elec-trophoretic (CE) data, FTIR data, coulometric electrodearray (CEA) data or raw chromatographic (HPLC orUPLC) data. Certainly if the user community grows sig-nificantly in these areas, efforts will be made to accommo-date these analytical platforms. Indeed, MetaboAnalyst’smodular and flexible framework should facilitate futuredevelopment efforts to keep up with this fast-changingfield.
CONCLUSIONS
MetaboAnalyst is a comprehensive, web-based tooldesigned to facilitate high-throughput metabolomics stu-dies. It accepts a variety of input data (NMR peak lists,binned NMR or MS spectra, MS peak lists, compound/concentration data) in a wide variety of formats. It alsooffers a number of options for metabolomic data proces-sing, data normalization, multivariate statistical analysis,graphing, metabolite identification and pathway mapping.Through its intuitive interface and high quality graphics,users are presented with data overviews from differentperspectives (i.e. PCA plots, heat maps), lists of candidatebiomarkers identified by simple univariate analysis (i.e.volcano plots), as well as estimated classification perfor-mances by several powerful algorithms (i.e. random forest,SVM). Further biological insight can be gained by tappinginto the HMDB using MetaboAnalyst’s annotation tools.MetaboAnalyst’s structured navigation, extensive docu-mentation, as well as its comprehensive analysis reportsshould allow new users to analyze their data withoutsignificant training or without significant likelihood ofstatistical misadventure.
FUNDING
Alberta Ingenuity Fund (AIF), the Alberta Life SciencesInstitute (ALSI), the Canadian Institutes for HealthResearch (CIHR) and Genome Alberta, a division ofGenome Canada. Funding for open access charge:Canadian Institutes for Health Research.
Conflict of interest statement. None declared.
REFERENCES
1. Fiehn,O. (2002) Metabolomics—the link between genotypes andphenotypes. Plant Mol. Biol., 48, 155–171.
2. Wishart,D.S. (2008) Quantitative metabolomics using NMR. TrendsAnal. Chem, 27, 228–237.
3. Moolenaar,S.H., Engelke,U.F.H. and Wevers,R.A. (2003)Proton nuclear magnetic resonance spectroscopy of body fluids inthe field of inborn errors of metabolism. Ann. Clin. Biochem., 40,16–24.
4. Kaddurah-Daouk,R., Kristal,B.S. and Weinshilboum,R.M. (2008)Metabolomics: a global biochemical approach to drug response anddisease. Ann. Rev. Pharmacol. Toxicol., 48, 653–683.
5. Bino,R.J., Hall,R.D., Fiehn,O., Kopka,J., Saito,K., Draper,J.,Nikolau,B.J., Mendes,P., Roessner-Tunali,U., Beale,M.H. et al.(2004) Potential of metabolomics as a functional genomics tool.Trends Plant Sci., 9, 418–425.
6. Wishart,D.S., Tzur,D., Knox,C., Eisner,R., Guo,A.C., Young,N.,Cheng,D., Jewell,K., Arndt,D., Sawhney,S. et al. (2007) HMDB:the human metabolome database. Nucleic Acids Res., 35,D521–D526.
7. Cui,Q., Lewis,I.A., Hegeman,A.D., Anderson,M.E., Li,J.,Schulte,C.F., Westler,W.M., Eghbalnia,H.R., Sussman,M.R. andMarkley,J.L. (2008) Metabolite identification via theMadison Metabolomics Consortium Database. Nat. Biotechnol., 26,162–164.
8. Smith,C.A., O’Maille,G., Want,E.J., Qin,C., Trauger,S.A.,Brandon,T.R., Custodio,D.E., Abagyan,R. and Siuzdak,G. (2005)METLIN—a metabolite mass spectral database. Therap. DrugMonitor., 27, 747–751.
9. Kopka,J., Schauer,N., Krueger,S., Birkemeyer,C., Usadel,B.,Bergmuller,E., Dormann,P., Weckwerth,W., Gibon,Y., Stitt,M.et al. (2005) [email protected]: the Golm Metabolome Database.Bioinformatics, 21, 1635–1638.
10. Gentleman,R.C., Carey,V.J., Bates,D.M., Bolstad,B., Dettling,M.,Dudoit,S., Ellis,B., Gautier,L., Ge,Y., Gentry,J. et al. (2004)Bioconductor: open software development for computational biol-ogy and bioinformatics. Genome Biol., 5, R80.
11. Xia,J., Bjorndahl,T.C., Tang,P. and Wishart,D.S. (2008)MetaboMiner—semi-automated identification of metabolitesfrom 2D NMR spectra of complex biofluids. BMC Bioinformatics,9, 507.
12. Herrero,J., Al-Shahrour,F., Diaz-Uriarte,R., Mateos,A.,Vaquerizas,J.M., Santoyo,J. and Dopazo,J. (2003) GEPAS: a web-based resource for microarray gene expression data analysis. NucleicAcids Res., 31, 3461–3467.
13. Rainer,J., Sanchez-Cabo,F., Stocker,G., Sturn,A. and Trajanoski,Z.(2006) CARMAweb: comprehensive R- and bioconductor-basedweb service for microarray data analysis. Nucleic Acids Res., 34,W498–W503.
14. Smith,C.A., Want,E.J., O’Maille,G., Abagyan,R. and Siuzdak,G.(2006) XCMS: processing mass spectrometry data for metaboliteprofiling using nonlinear peak alignment, matching, and identifica-tion. Anal. Chem., 78, 779–787.
15. Steinfath,M., Groth,D., Lisec,J. and Selbig,J. (2008) Metaboliteprofile analysis: from raw data to regression and classification.Physiol. Plant, 132, 150–161.
16. Stacklies,W., Redestig,H., Scholz,M., Walther,D. and Selbig,J.(2007) pcaMethods—a bioconductor package providing PCAmethods for incomplete data. Bioinformatics, 23, 1164–1167.
17. Dieterle,F., Ross,A., Schlotterbeck,G. and Senn,H. (2006)Probabilistic quotient normalization as robust method to accountfor dilution of complex biological mixtures: application in 1H NMRmetabonomics. Anal. Chem., 78, 4281–4290.
18. van den Berg,R.A., Hoefsloot,H.C., Westerhuis,J.A., Smilde,A.K.and van der Werf,M.J. (2006) Centering, scaling, and trans-formations: improving the biological information content ofmetabolomics data. BMC Genomics, 7, 142.
19. Bijlsma,S., Bobeldijk,I., Verheij,E.R., Ramaker,R., Kochhar,S.,Macdonald,I.A., van Ommen,B. and Smilde,A.K. (2006)Large-scale human metabolomics studies: a strategy for data (pre-)processing and validation. Anal. Chem., 78, 567–574.
20. Tusher,V.G., Tibshirani,R. and Chu,G. (2001) Significance analysisof microarrays applied to the ionizing radiation response. Proc. NatlAcad. Sci. USA, 98, 5116–5121.
21. Efron,B., Tibshirani,R., Storey,J.D. and Tusher,V. (2001) EmpiricalBayes analysis of a microarray experiment. J. Amer. Statist. Assoc.,96, 1151–1160.
Nucleic Acids Research, 2009, Vol. 37, Web Server issue W659
by guest on June 2, 2016http://nar.oxfordjournals.org/
Dow
nloaded from

22. Breiman,L. (2001) Random forests. Machine Learning, 45, 5–32.23. Burges,C.J.C. (1998) A tutorial on Support Vector Machines for
pattern recognition. Data Mining and Knowledge Discovery, 2,121–167.
24. Zhang,X., Lu,X., Shi,Q., Xu,X.Q., Leung,H.C., Harris,L.N.,Iglehart,J.D., Miron,A., Liu,J.S. and Wong,W.H. (2006)Recursive SVM feature selection and sample
classification for mass-spectrometry and microarray data. BMCBioinformatics, 7, 197.
25. Neuweger,H., Albaum,S.P., Dondrup,M., Persicke,M., Watt,T.,Niehaus,K., Stoye,J. and Goesmann,A. (2008) MeltDB: a softwareplatform for the analysis and integration of metabolomicsexperiment data. Bioinformatics, 24, 2726–2732.
W660 Nucleic Acids Research, 2009, Vol. 37,Web Server issue
by guest on June 2, 2016http://nar.oxfordjournals.org/
Dow
nloaded from