Meta-Analysis of Molecular Association Studies: Vitamin D Receptor Gene Polymorphisms and BMD as a...
10
Meta-Analysis of Molecular Association Studies: Vitamin D Receptor Gene Polymorphisms and BMD as a Case Study Ammarin Thakkinstian, 1 Catherine D’Este, 2 John Eisman, 3 Tuan Nguyen, 3 and John Attia 2 ABSTRACT: With the rise of molecular and genetic epidemiology, molecular association studies are increas- ingly common; however, meta-analysis of these studies has been a neglected area. This study performed a meta-analysis of the association of the vitamin D receptor (VDR) gene polymorphisms and BMD. We also highlight methodological issues that need to be resolved. Introduction: With the rise of molecular and genetic epidemiology, molecular association studies are increasingly common; however, meta-analysis of these studies has been a neglected area. This study performed a meta-analysis of the association of vitamin D receptor (VDR) gene polymorphisms and BMD/osteoporosis and highlights methodological issues. Materials and Methods: Studies published from 1994 to 2001 were identified through Medline using PubMed software. The reference lists of the articles retrieved were also reviewed. Where eligible papers had insufficient information, we contacted authors by mail (up to three mailings) for additional information. Any observational study, which tested the association between VDR BsmI genotypes and either BMD or osteoporosis at the femoral neck or spine in adult women, was included in the review. Data were extracted independently by two reviewers (AT and JA) using a standardized data extraction form. Results: The B allele was significantly associated with BMD at the spine; it seemed to follow a recessive model, with the BB genotype having lower BMD than Bb/bb genotypes at baseline, which led to greater bone mineral loss over time. Highlighted methodological lessons included the need to check Hardy-Weinberg equilibrium and the impor- tance of exploring heterogeneity, pooling data in a manner that is sensitive to genetic models, and avoiding multiple comparisons. Conclusion: With the proliferation of molecular association studies, there will be an increased need to quantify the magnitude of the risk associated with genetic polymorphisms. This will likely entail meta-analytic methods, and this meta-analysis highlights some of the methodological issues that will need to be resolved. J Bone Miner Res 2004;19:419 – 428. Published online on December 29, 2003; doi: 10.1359/JBMR.0301265 Key words: vitamin D receptor, polymorphism, model, meta-analysis, regression INTRODUCTION O STEOPOROSIS IS A DIMINUTION of skeletal mass in which bone is normally mineralized, but the amount of bone tissue in a given volume of bone is reduced, causing me- chanical weakness and leading to fractures, especially of the hip and spine, which can occur either spontaneously or with minimal trauma. (1) One of the primary predictors of this fracture risk is BMD (g/cm 2 ). Although many environ- mental factors impact BMD, a large component of variation in BMD seems to be genetic. (2,3) Twin and familial studies show heritabilities of 60 – 80% for BMD. (4,5) Dissecting the genes responsible for this contribution can be achieved by two broad lines of inquiry: linkage analysis, using fam- ily pedigrees and genome-wide markers (which will not be discussed here), and molecular association studies, using candidate genes in a population-based study design. A number of polymorphisms in multiple candidate genes have been investigated in this regard, (6) the vitamin D receptor (VDR) gene being the first (7) and most inten- sively studied. (3,8) The VDR plays a role in regulating calcium homoeostasis through binding and nuclear trans- locating of 1,25(OH) 2 D 3 , affecting bone resorption, and increasing calcium absorption. Although numerous asso- ciation studies relating polymorphisms in this gene to BMD have been published, results are conflicting, (9) possibly because of variations in study design, small sample sizes, and heterogeneous populations, among other issues. Dr Eisman holds a patent in relation to VDR and osteoporosis. All other authors have no conflict of interest. 1 Clinical Epidemiology Unit, Faculty of Medicine, Ramathibodi Hospital, Mahidol University, Bangkok, Thailand; 2 Centre for Clinical Epidemiology and Biostatistics, Faculty of Medicine and Health Science, Newcastle University, Newcastle, New South Wales, Australia; 3 The Garvan Institute of Medical Research, St Vincent’s Hospital, Darlinghurst, Sydney, New South Wales, Australia. JOURNAL OF BONE AND MINERAL RESEARCH Volume 19, Number 3, 2004 Published online on December 29, 2003; doi: 10.1359/JBMR.0301265 © 2004 American Society for Bone and Mineral Research 419
-
Upload
independent -
Category
Documents
-
view
3 -
download
0
Transcript of Meta-Analysis of Molecular Association Studies: Vitamin D Receptor Gene Polymorphisms and BMD as a...

Meta-Analysis of Molecular Association Studies: Vitamin D Receptor GenePolymorphisms and BMD as a Case Study
Ammarin Thakkinstian,1 Catherine D’Este,2 John Eisman,3 Tuan Nguyen,3 and John Attia2
ABSTRACT: With the rise of molecular and genetic epidemiology, molecular association studies are increas-ingly common; however, meta-analysis of these studies has been a neglected area. This study performed ameta-analysis of the association of the vitamin D receptor (VDR) gene polymorphisms and BMD. We alsohighlight methodological issues that need to be resolved.
Introduction: With the rise of molecular and genetic epidemiology, molecular association studies are increasinglycommon; however, meta-analysis of these studies has been a neglected area. This study performed a meta-analysisof the association of vitamin D receptor (VDR) gene polymorphisms and BMD/osteoporosis and highlightsmethodological issues.Materials and Methods: Studies published from 1994 to 2001 were identified through Medline using PubMedsoftware. The reference lists of the articles retrieved were also reviewed. Where eligible papers had insufficientinformation, we contacted authors by mail (up to three mailings) for additional information. Any observational study,which tested the association between VDR BsmI genotypes and either BMD or osteoporosis at the femoral neck orspine in adult women, was included in the review. Data were extracted independently by two reviewers (AT and JA)using a standardized data extraction form.Results: The B allele was significantly associated with BMD at the spine; it seemed to follow a recessive model, withthe BB genotype having lower BMD than Bb/bb genotypes at baseline, which led to greater bone mineral loss overtime. Highlighted methodological lessons included the need to check Hardy-Weinberg equilibrium and the impor-tance of exploring heterogeneity, pooling data in a manner that is sensitive to genetic models, and avoiding multiplecomparisons.Conclusion: With the proliferation of molecular association studies, there will be an increased need to quantify themagnitude of the risk associated with genetic polymorphisms. This will likely entail meta-analytic methods, and thismeta-analysis highlights some of the methodological issues that will need to be resolved.J Bone Miner Res 2004;19:419–428. Published online on December 29, 2003; doi: 10.1359/JBMR.0301265
Key words: vitamin D receptor, polymorphism, model, meta-analysis, regression
INTRODUCTION
OSTEOPOROSIS IS A DIMINUTION of skeletal mass in whichbone is normally mineralized, but the amount of bone
tissue in a given volume of bone is reduced, causing me-chanical weakness and leading to fractures, especially of thehip and spine, which can occur either spontaneously orwith minimal trauma.(1) One of the primary predictors ofthis fracture risk is BMD (g/cm2). Although many environ-mental factors impact BMD, a large component of variationin BMD seems to be genetic.(2,3) Twin and familial studiesshow heritabilities of �60–80% for BMD.(4,5) Dissectingthe genes responsible for this contribution can be achieved
by two broad lines of inquiry: linkage analysis, using fam-ily pedigrees and genome-wide markers (which will notbe discussed here), and molecular association studies, usingcandidate genes in a population-based study design.
A number of polymorphisms in multiple candidategenes have been investigated in this regard,(6) the vitaminD receptor (VDR) gene being the first(7) and most inten-sively studied.(3,8) The VDR plays a role in regulatingcalcium homoeostasis through binding and nuclear trans-locating of 1�,25(OH)2D3, affecting bone resorption, andincreasing calcium absorption. Although numerous asso-ciation studies relating polymorphisms in this gene toBMD have been published, results are conflicting,(9)
possibly because of variations in study design, smallsample sizes, and heterogeneous populations, amongother issues.
Dr Eisman holds a patent in relation to VDR and osteoporosis.All other authors have no conflict of interest.
1Clinical Epidemiology Unit, Faculty of Medicine, Ramathibodi Hospital, Mahidol University, Bangkok, Thailand; 2Centre for ClinicalEpidemiology and Biostatistics, Faculty of Medicine and Health Science, Newcastle University, Newcastle, New South Wales, Australia;3The Garvan Institute of Medical Research, St Vincent’s Hospital, Darlinghurst, Sydney, New South Wales, Australia.
JOURNAL OF BONE AND MINERAL RESEARCHVolume 19, Number 3, 2004Published online on December 29, 2003; doi: 10.1359/JBMR.0301265© 2004 American Society for Bone and Mineral Research
419
Meta-analysis may be able to overcome the shortcomingsof individual studies; by systematically combining resultsfrom individual studies, this method increases the power todetect an association, increases the precision of the magni-tude of effect, and sheds light on reasons for discrepantresults by exploring heterogeneity. Although methods formeta-analysis of traditional association studies are well es-tablished,(10,11) applying this method to molecular associa-tion studies raises unique issues. Some of these relate tosources of error at the individual study level and have beenenumerated previously(12–14) (e.g., population stratification,genotyping error, linkage dysequilibrium, and gene–environment interaction). Others relate to pooling the datain a way that reflects the biology of gene effects andhandling at least three separate genotype groups while con-trolling for multiple comparisons.(15)
We performed a meta-analysis of the VDR BsmI poly-morphism in relation to BMD and change in BMD. We alsoviewed this as a case study, highlighting methodologicalissues in the meta-analysis of molecular association studies.
MATERIALS AND METHODS
Search strategy
We searched for all observational studies published fromJanuary 1994 (when the first VDR association study waspublished) to May 2001 using PubMed software to searchMedline. The search terms were as follows.
1. vitamin D receptor or VDR (MeSH)2. genotype(s) or allele(s) or polymorphism(s) (MeSH)3. bone mineral density or BMD or bone density (MeSH)4. low BMD or low density (textword)5. osteoporosis (MeSH)6. fracture (MeSH)7. (1 and 2) and (3 or 4 or 5 or 6)
The reference lists of the articles retrieved were alsoreviewed to identify publications on the same topic. Themost complete and recent results were used when there weremultiple publications from the same study group.
Inclusion criteria
Any observational study (cohort, case-control, and cross-sectional study), regardless of sample size, which tested theassociation between VDR BsmI genotypes and either BMDor osteoporosis at the femoral neck or spine and fulfilled thefollowing criteria, was included.
● BMD measurements at lumbar spine or femoral neckby DXA or dual-photon absorptiometry (DPA) method
● Results described in sufficient detail for extraction ofdata, that is, mean and SD of BMD and number ofsubjects for each VDR genotype for continuous out-comes. Where eligible papers had insufficient informa-tion, we contacted authors by mail (up to three mail-ings) for additional information.
● Participants were pre- or postmenopausal adult women● VDR polymorphism was determined by the BsmI re-
striction site. The possible genotypes were BB, Bb, or
bb, where B and b indicate absence and presence of therestriction site, respectively.
● Outcomes were mean BMD or percent change in BMDper year.
Data extraction
Data were extracted independently by two reviewers (ATand JA) using a standardized data extraction form. Anydisagreement was resolved by discussion and consensus.Co-variables such as mean age, mean body mass index(BMI), study frame (e.g., population-based versus hospital-based), ethnicity, and menopausal status were also extractedfor each study.
Quality score assessment
Quality of studies was also independently assessed by thesame two reviewers. Quality scoring criteria were modifiedfrom previous meta-analyses of observational studies(16–19)
(Appendix 1).
Statistical analysis
Studies were pooled separately according to site of BMDmeasurement. Data analysis followed the methods de-scribed in a separate paper.(20) Briefly, this method followsfive steps.
1. Checking each study for Hardy-Weinberg equilibrium(HWE) and doing a sensitivity analysis including andexcluding studies not in HWE
2. Checking for heterogeneity, and if present, trying toascertain reasons for this, rather than pooling
3. Using ANOVA methods to test for an overall geneeffect
4. If ANOVA is significant, looking at multiple pairwisecomparisons to determine the genetic model, for exam-ple, dominant, recessive, etc.
5. Using the genetic model to collapse the three genotypegroups into two groups and using random or fixedeffects models to pool the data
HWE was checked in the entire cohort using a �2 good-ness of fit test.(21) A Q-test of heterogeneity based on thestandardized mean difference (SMD) was performed sepa-rately for three differences of means (BB versus bb [D1], Bbversus bb [D2], and BB versus Bb [D3]). The SMD, calcu-lated using Cohen’s method,(11,22) was chosen because theBMDs were measured using different methods or scanners.If there was heterogeneity on at least one comparison, werefrained from pooling and instead explored the cause ofheterogeneity(23) by fitting the co-variables described abovein a meta-regression model.(24,25)
ANOVA was used to determine whether the VDR geno-types could significantly explain BMD. The outcome vari-able in the analysis was the mean BMD in each genotypegroup, and the unit of analysis was study. The weightedleast-squares method was used to determine the main dif-ference in the mean level of the BMD between genotypes,with weights proportional to the inverse of the variance ofthe mean of each group in each study. If there was an overallgene effect, the mode of inheritance was further determined
420 THAKKINSTIAN ET AL.
using linear regression. The genotypes and study were fittedin the model as indicator variables. The double positive wastreated as a reference group (bb), and the three pairwisedifferences were tested (BB versus bb [D1], Bb versus bb[D2], and BB versus Bb [D3]). These differences were usedto indicate the most appropriate genetic model, as outlinedbelow.
1. If D1 � D3 � 0 and D2 � 0, then a recessive model issuggested.
2. If D1 � D2 � 0 and D3 � 0, then a dominant model issuggested.
3. If D2 � �D3 � 0 and D1 � 0, then a completeoverdominant model is suggested.
4. If D1 � D2 � 0 and D1 � D3 � 0, then a codominantmodel is suggested.
Once the best genetic model was identified, this modelwas used to collapse the three genotypes into two groups(except in the case of a codominant model) and pool theresults using traditional meta-analysis. Again, heterogeneitywas checked. If heterogeneity was absent, pooling using thefixed-effects model was used; if present, the random-effectsmodel was used. Publication bias was checked using Egg-er’s test.(11,26,27)
Sensitivity analyses were performed by including or ex-cluding studies not in HWE and by excluding the largeststudies from analysis. All analyses were performed usingSTATA version 6.0.(28) A p value less than 0.05 was con-sidered statistically significant, except for tests of heteroge-neity, where a level of 0.10 was used.
RESULTS
Characteristics of studies
Sixty-one studies were identified by the specified searchterms. Twenty-two studies were ineligible for the followingreasons: three studies were conducted in men only, onestudy reported results for men and women together, threewere twin studies , two studies were in prepubertal subjects,three studies reported BMD only as a Z-score, one studyreported BMD for the whole body only, one study used aCT scanner, and eight studies did not address the BsmIpolymorphism. Therefore, 39 studies were considered in theanalysis.(29–67) The characteristics of the studies are givenin Table 1.
BsmI polymorphisms and spine BMD
Thirty-four studies determined association betweenspine BMD and the BsmI polymorphism in adultwomen.(29,31– 43,45,46,48 –52,54 –56,58 – 67) Seven studies werenot eligible for the following reasons: two studies(46,64)
seemed to be duplicates and five studies(34,43,51,60,61) did notprovide mean BMD for BB or Bb genotype. Hence, 27studies were considered in the analysis, of which5(38,42,48,49,62) did not observe HWE.
Among the 22 studies in HWE,(29,31–33,35–37,39–41,45,50,52,
54–56,58,59,63,65–67) heterogeneity was assessed for the threepairwise comparisons of D1, D2, and D3 and was found to bepresent in all three (�2 � 35.7, df � 21, p � 0.024 for D1;�2 � 30.4, df � 21, p � 0.085 for D2; �2 � 31.4, df � 21,
p � 0.068 for D3). Meta-regression indicated that meno-pausal status was significantly associated with the SMD(coefficient � �0.32, p � 0.046); therefore, we performeda subgroup analysis according to menopausal status.
Postmenopausal women: There were 13 studies on postmeno-pausal women that were in HWE.(29,35–37,39,41,50,52,54,55,59,66,67)
The average age and BMI ranged from 51 to 75 years and 23to 29 kg/m2, respectively; one(36) and four studies(29,36,41,67) didnot provide mean age and BMI, respectively. The frequency ofallele B ranged from 0.29 to 0.53. Total sample sizes were 454(range, 2–107), 1345 (range, 14–306), and 901 (range, 7–196)for BB, Bb, and bb groups, respectively (Table 2).
There was no evidence of heterogeneity in D1, D2, and D3
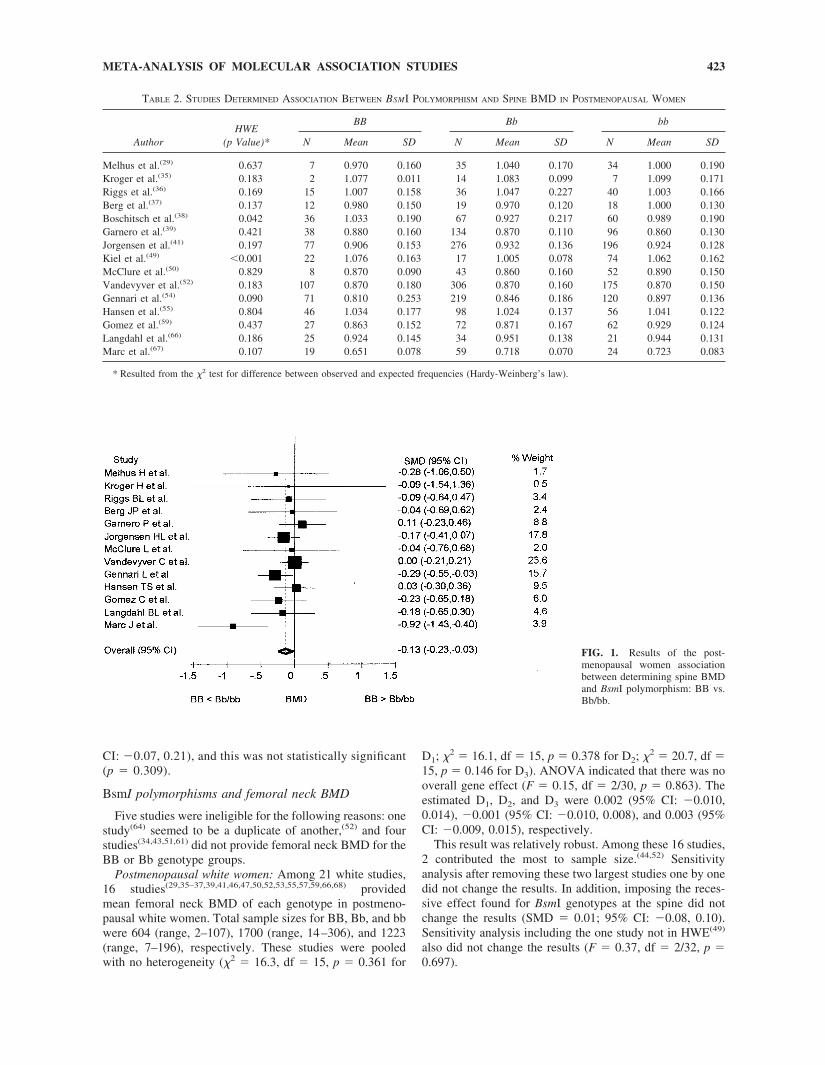
(�2 � 16.1, df � 12, p � 0.185 for D1; �2 � 15.1, df � 12,p � 0.235 for D2; �2 � 13.8, df � 12, p � 0.315 for D3).ANOVA was used to determine the overall gene effect; wefound an association between the BsmI genotype and spineBMD (F � 4.16, df � 2/24, p � 0.028). The estimatedeffect sizes were D1 � �0.027 (95% CI: �0.046, �0.008),D2, � �0.007 (95% CI: �0.021, 0.006), and D3 � �0.019(95% CI: �0.037, �0.001). D1 and D3 were statisticallysignificant, whereas D2 was not, indicating that a recessiveeffect was most likely. The mean spine BMDs of the Bb andbb groups were combined. The SMD among BB versusBb/bb was estimated, and heterogeneity was again checked.The estimated pooled SMD was �0.131 (95% CI: �0.232,�0.029), with no heterogeneity (�2 � 15.41, df � 12, p �0.220; Fig. 1). The estimated effect size was �0.022 (95%CI: �0.036, �0.007), that is, those with the BB genotypehad a lower spine BMD than those with the Bb/bb geno-types by about 0.022 g/cm2. There was no evidence ofpublication bias for this result (coefficient � �0.52, SE �0.74, p � 0.498 by Egger’s test).
This result was also quite robust. After adjusting for age,D1, D2, and D3 remained similar; the values were �0.028(95% CI: �0.048, �0.008), �0.008 (95% CI: �0.022,0.006), and �0.019 (95% CI: �0.038, �0.001), respec-tively. Too few studies reported BMI to adjust for thisvariable.
Sensitivity analysis was also performed by taking out thetwo largest studies,(41,52) which contributed 24% and 18%of the total weight; the recessive effects persisted.
Sensitivity analysis was also performed by including thetwo studies(38,49) that did not observe HWE. Among the 15studies,(29,35–39,41,49,50,52,54,55,59,66,67) there was heterogene-ity in D3 (�2 � 25.14, df � 14, p � 0.033) but not in D1 (�2
� 20.14, df � 14, p � 0.126) and D2 (�2 � 18.25, df � 14,p � 0.196). Neither meta-regression nor subgroup analysiscould detect the causes of heterogeneity (data not shown).Applying ANOVA methods despite the heterogeneity indi-cated that the gene effect was no longer statistically signif-icant (F � 2.62, df � 2/28, p � 0.092).
Premenopausal women: Nine studies in premenopausalwomen were in HWE.(31–33,36,41,45,58,63,65) Mean age andBMI ranged from 28 to 40 years and 22 to 25 kg/m2,respectively. Total sample size of BB, Bb, and bb groupswere 275 (range, 8–114), 798 (range, 12–323), and 553(range, 9–240), respectively (Table 3). D1 and D2 werehomogeneous but D3 was not (�2 � 9.21, df � 8, p � 0.325;�2 � 3.92, df � 8, p � 0.864; �2 � 13.37, df � 8, p �
421META-ANALYSIS OF MOLECULAR ASSOCIATION STUDIES

0.100; respectively). Meta-regression indicated that studyframe, that is, population-based versus non–population-based, was associated with the SMD, and this might be thecause of the heterogeneity (coefficient � 0.598, SE �0.223, p � 0.007).
A subgroup analysis was performed using only the sixpopulation-based studies.(33,36,45,58,63,65) Sample sizes ofgenotype groups BB, Bb, and bb were 242 (range,8 –114), 691 (range, 26 –323), and 465 (range, 9 –240),respectively. There was no evidence of heterogeneity forD1 (�2 � 0.65, df � 5, p � 0.986), D2 (�2 � 2.17, df �
5, p � 0.825), or D3 (�2 � 1.87, df � 5, p � 0.867).ANOVA indicated that there was no main effect of gene(F � 2.78, df � 2/10, p � 0.110), and we concluded thatthere was no association between the VDR gene and spineBMD in premenopausal women (D1, D2, and D3 were0.013 [95% CI: 0.001, 0.026], 0.006 [95% CI: �0.004,0.016], and 0.007 [95% CI: �0.005, 0.019], respec-tively). However, to explore if the recessive model indi-cated in the postmenopausal group might be applicable tothe premenopausal group, we imposed a recessive modelin these six studies; the estimated SMD was 0.07 (95%
TABLE 1. CHARACTERISTICS OF STUDIES DETERMINING ASSOCIATION BETWEEN BSMT POLYMORPHISM AND BMD
Author Year Ethnicity SubjectMeanage
MeanBMI
Percentageallele B
Studydesign
Studyframe
Qualityscore
BMD measurement
Method Site
Melhus et al.(29) 1994 White Postmen 69.8 — 32 � 4 CC Unknown 1 DXA SP�FNYamagata et al.(30) 1994 Asian Pre � postmen 45.5 — 26 � 3 C Unknown 5 Hologic SPBarger-Lux et al.(31) 1995 White Premen 36.9 24.3 50 � 7 CS Unknown 2 Norland SPFleet et al.(32) 1995 Mixed Premen 29.9 24.5 34 � 3 CS Unknown 5 Lunar SP � FNGarnero et al.(33) 1995 White Premen 40.4 23.0 42 � 2 CS Pop 6 Hologic SP � FNHoward et al.(34) 1995 White Premen 35.4 23.0 48 � 11 CS Unknown 3 Lunar SP � FNKroger et al.(35) 1995 White Postmen 52.5 26.4 39 � 6 CS Pop 5 LunarDPA SP � FNRiggs et al.(36) 1995 White Pre, Post — — 40 � 3 C Pop 7 Lunar � other SP � FNBerg et al.(37) 1996 White Postmen 65 25.3 44 � 5 C Unknown 4 Lunar SP � FNBoschitsch et al.(38) 1996 White Postmen 55 — 43 � 3 CS Hosp 7 Lunar SPGarnero et al.(39) 1996 White Postmen 58.4 24.0 39 � 2 C Pop 8 Hologic SP � FNHouston et al.(40) 1996 White Postmen 59.6 — 45 � 3 CS Pop � Hosp 7 Norland SP � FNJorgensen et al.(41) 1996 White Pre, Post 46.5 — 39 � 1 CS Pop � Hosp 7 Hologic SP � FNSalamone et al.(42) 1996 White Premen 46.9 24.9 40 � 2 C Pop 5 Hologic SP � FNTokita et al.(43) 1996 Asian Premen 29.9 19.9 10 � 2 CS Unknown 8 Hologic SP � FNUitterlinden et al.(44) 1996 White Postmen 67.5 26.2 41 � 1 C Pop 7 DXA FNAlahari et al.(45) 1997 White Premen 36.8 22.5 42 � 4 CS Pop 5 Hologic SP � FNGennari et al.(46) 1997 White Postmen 60.8 24.1 44 � 3 CS Hosp 9 Hologic SP � FNGraafmans et al.(47) 1997 White Postmen 77.9 28.4 48 � 4 CRC Unknown 7 DXA FNJinxiu et al.(48) 1997 Asian Pre, Post — — 5 � 1 CS Unknown 5 Lunar SP � FNKiel et al.(49) 1997 White Postmen — — 27 � 4 C Pop 7 LunarDPA SP � FNMcClure et al.(50) 1997 White Postmen 65.8 28.9 29 � 3 CS Unknown 4 Hologic SP � FNOngphiphadhanakul et al.(51) 1997 Asian Postmen 60.4 24.3 11 � 2 CS Pop � Hosp 7 Lunar SP � FNVandevyver et al.(52) 1997 White Postmen 75.2 27.9 44 � 1 CC Unknown 7 Hologic SP � FNZmuda et al.(53) 1997 White Postmen 71.7 31.1 36 � 4 CS Pop 7 DXA FNGennari et al.(54) 1998 White Postmen 57.7 24.6 44 � 2 CS Hosp 9 Hologic SPHansen et al.(55) 1998 White Postmen 50.8 25.8 48 � 3 CS Pop 9 Hologic SP � FNHauache et al.(56) 1998 Mixed Pre � Post 33.3 25.5 35 � 4 CC Unknown 6 Lunar SP � FNTsuritani et al.(57) 1998 White Postmen 64.7 24.6 38 � 4 CS Unknown 3 DXA FNWilling et al.(58) 1998 Mixed Premen 34 — 43 � 2 C Pop 9 Lunar SP � FNGomez et al.(59) 1999 White Postmen 67.1 28.0 39 � 3 C Pop 7 Hologic SP � FNKikuchi et al.(60) 1999 Asian Postmen 59.5 22.1 11 � 2 CS Pop 5 Hologic SPLau et al.(61) 1999 Asian Postmen 75.3 23.4 4 � 1 CS Pop 6 Unknown SP � FNPoggi et al.(62) 1999 White Pre � post 56.8 — 47 � 4 CS Unknown 6 DXA SPRubin et al.(63) 1999 White Premen 27.5 21.7 41 � 1 CS Pop 7 Lunar SP � FNVandevyver et al.(64) 1999 White Postmen 74.8 27.8 42 � 2 CS Unknown 7 Hologic SP � FNHolmberg-Marttila(65) 2000 White Premen 31.2 25.1 49 � 5 CS Pop 7 Norland SP � FNLangdahl et al.(66) 2000 White Postmen 55.7 23.2 53 � 4 CC Pop 7 Hologic SP � FNMarc et al.(67) 2000 White Postmen 65.9 — 48 � 3 CS Hosp 6 LunarDPA SP
Ethnicity: Mixed, white � black.Subject: Post/Postmen, postmenopause; Pre/Premen, premenopause; Pre, Post, premenopause and postmenopause separately; Pre � Post, mixed
premenopause and postmenopause.Design: CS, cross-sectional; C, cohort; CRT, cross-sectional on randomized control trial; CC, case-control.Frame: Pop, population-base; Hosp, hospital-base.Method: DXA, dual-energy X-ray absorptiometer; DPA, dual-photon absorptiometer.Site: SP, spine; FN, femoral neck.
422 THAKKINSTIAN ET AL.
CI: �0.07, 0.21), and this was not statistically significant(p � 0.309).
BsmI polymorphisms and femoral neck BMD
Five studies were ineligible for the following reasons: onestudy(64) seemed to be a duplicate of another,(52) and fourstudies(34,43,51,61) did not provide femoral neck BMD for theBB or Bb genotype groups.
Postmenopausal white women: Among 21 white studies,16 studies(29,35–37,39,41,46,47,50,52,53,55,57,59,66,68) providedmean femoral neck BMD of each genotype in postmeno-pausal white women. Total sample sizes for BB, Bb, and bbwere 604 (range, 2–107), 1700 (range, 14–306), and 1223(range, 7–196), respectively. These studies were pooledwith no heterogeneity (�2 � 16.3, df � 15, p � 0.361 for
D1; �2 � 16.1, df � 15, p � 0.378 for D2; �2 � 20.7, df �15, p � 0.146 for D3). ANOVA indicated that there was nooverall gene effect (F � 0.15, df � 2/30, p � 0.863). Theestimated D1, D2, and D3 were 0.002 (95% CI: �0.010,0.014), �0.001 (95% CI: �0.010, 0.008), and 0.003 (95%CI: �0.009, 0.015), respectively.
This result was relatively robust. Among these 16 studies,2 contributed the most to sample size.(44,52) Sensitivityanalysis after removing these two largest studies one by onedid not change the results. In addition, imposing the reces-sive effect found for BsmI genotypes at the spine did notchange the results (SMD � 0.01; 95% CI: �0.08, 0.10).Sensitivity analysis including the one study not in HWE(49)
also did not change the results (F � 0.37, df � 2/32, p �0.697).
FIG. 1. Results of the post-menopausal women associationbetween determining spine BMDand BsmI polymorphism: BB vs.Bb/bb.
TABLE 2. STUDIES DETERMINED ASSOCIATION BETWEEN BSMI POLYMORPHISM AND SPINE BMD IN POSTMENOPAUSAL WOMEN
AuthorHWE
(p Value)*
BB Bb bb
N Mean SD N Mean SD N Mean SD
Melhus et al.(29) 0.637 7 0.970 0.160 35 1.040 0.170 34 1.000 0.190Kroger et al.(35) 0.183 2 1.077 0.011 14 1.083 0.099 7 1.099 0.171Riggs et al.(36) 0.169 15 1.007 0.158 36 1.047 0.227 40 1.003 0.166Berg et al.(37) 0.137 12 0.980 0.150 19 0.970 0.120 18 1.000 0.130Boschitsch et al.(38) 0.042 36 1.033 0.190 67 0.927 0.217 60 0.989 0.190Garnero et al.(39) 0.421 38 0.880 0.160 134 0.870 0.110 96 0.860 0.130Jorgensen et al.(41) 0.197 77 0.906 0.153 276 0.932 0.136 196 0.924 0.128Kiel et al.(49) �0.001 22 1.076 0.163 17 1.005 0.078 74 1.062 0.162McClure et al.(50) 0.829 8 0.870 0.090 43 0.860 0.160 52 0.890 0.150Vandevyver et al.(52) 0.183 107 0.870 0.180 306 0.870 0.160 175 0.870 0.150Gennari et al.(54) 0.090 71 0.810 0.253 219 0.846 0.186 120 0.897 0.136Hansen et al.(55) 0.804 46 1.034 0.177 98 1.024 0.137 56 1.041 0.122Gomez et al.(59) 0.437 27 0.863 0.152 72 0.871 0.167 62 0.929 0.124Langdahl et al.(66) 0.186 25 0.924 0.145 34 0.951 0.138 21 0.944 0.131Marc et al.(67) 0.107 19 0.651 0.078 59 0.718 0.070 24 0.723 0.083
* Resulted from the �2 test for difference between observed and expected frequencies (Hardy-Weinberg’s law).
423META-ANALYSIS OF MOLECULAR ASSOCIATION STUDIES
Premenopausal white women: Six studies(33,36,41,45,63,65)
determined association between femoral neck BMD andBsmI polymorphism in premenopausal women. The samplesizes for BB, Bb, and bb groups were 181 (range, 8–114),533 (range, 25–323), and 361 (range, 9–240), respectively.All pairwise comparisons were homogeneous (�2 � 4.2,df � 5, p � 0.523 for D1; �2 � 4.2, df � 5, p � 0.520 forD2; �2 � 3.3, df � 5, p � 0.653 for D3). ANOVA found noassociation between the VDR gene and femoral neck BMDin this group (F � 2.44, df � 2/10, p � 0.137). Theestimated D1, D2, and D3 were 0.022 (95% CI: �0.0002,0.043), 0.006 (95% CI: �0.009, 0.022), and 0.015 (95% CI:�0.005, 0.036), respectively.
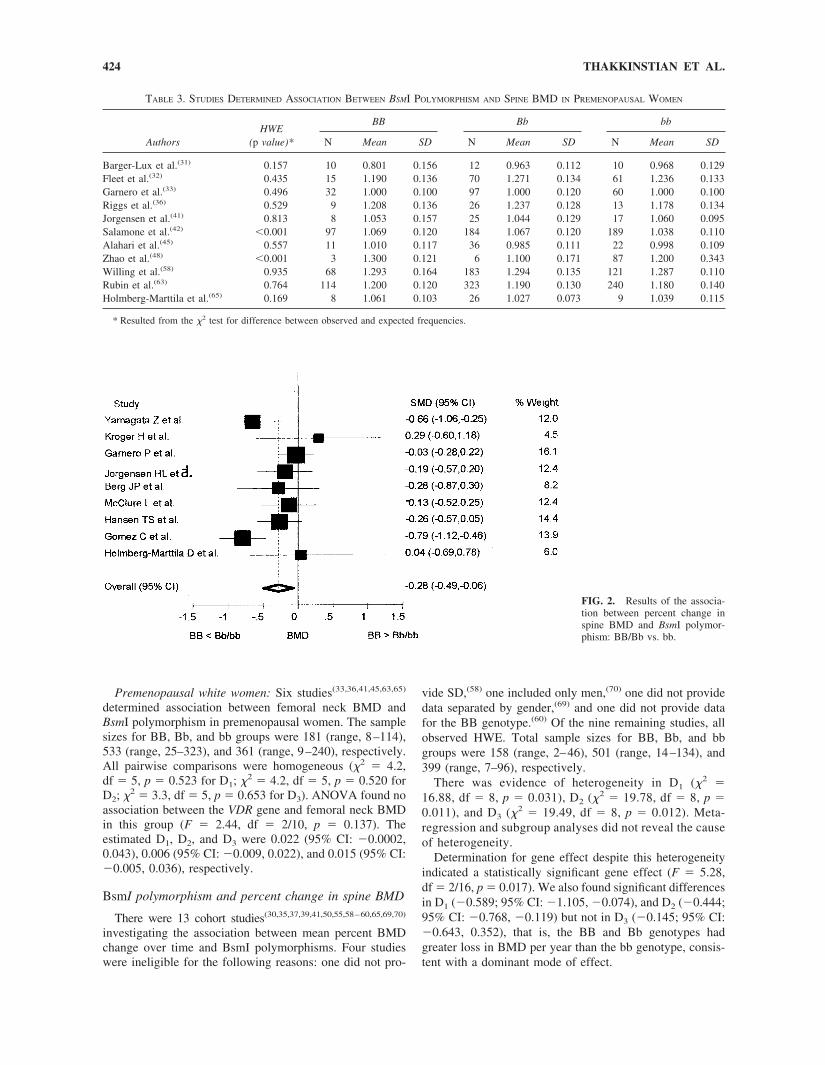
BsmI polymorphism and percent change in spine BMD
There were 13 cohort studies(30,35,37,39,41,50,55,58–60,65,69,70)
investigating the association between mean percent BMDchange over time and BsmI polymorphisms. Four studieswere ineligible for the following reasons: one did not pro-
vide SD,(58) one included only men,(70) one did not providedata separated by gender,(69) and one did not provide datafor the BB genotype.(60) Of the nine remaining studies, allobserved HWE. Total sample sizes for BB, Bb, and bbgroups were 158 (range, 2–46), 501 (range, 14–134), and399 (range, 7–96), respectively.
There was evidence of heterogeneity in D1 (�2 �16.88, df � 8, p � 0.031), D2 (�2 � 19.78, df � 8, p �0.011), and D3 (�2 � 19.49, df � 8, p � 0.012). Meta-regression and subgroup analyses did not reveal the causeof heterogeneity.
Determination for gene effect despite this heterogeneityindicated a statistically significant gene effect (F � 5.28,df � 2/16, p � 0.017). We also found significant differencesin D1 (�0.589; 95% CI: �1.105, �0.074), and D2 (�0.444;95% CI: �0.768, �0.119) but not in D3 (�0.145; 95% CI:�0.643, 0.352), that is, the BB and Bb genotypes hadgreater loss in BMD per year than the bb genotype, consis-tent with a dominant mode of effect.
FIG. 2. Results of the associa-tion between percent change inspine BMD and BsmI polymor-phism: BB/Bb vs. bb.
TABLE 3. STUDIES DETERMINED ASSOCIATION BETWEEN BSMI POLYMORPHISM AND SPINE BMD IN PREMENOPAUSAL WOMEN
AuthorsHWE
(p value)*
BB Bb bb
N Mean SD N Mean SD N Mean SD
Barger-Lux et al.(31) 0.157 10 0.801 0.156 12 0.963 0.112 10 0.968 0.129Fleet et al.(32) 0.435 15 1.190 0.136 70 1.271 0.134 61 1.236 0.133Garnero et al.(33) 0.496 32 1.000 0.100 97 1.000 0.120 60 1.000 0.100Riggs et al.(36) 0.529 9 1.208 0.136 26 1.237 0.128 13 1.178 0.134Jorgensen et al.(41) 0.813 8 1.053 0.157 25 1.044 0.129 17 1.060 0.095Salamone et al.(42) �0.001 97 1.069 0.120 184 1.067 0.120 189 1.038 0.110Alahari et al.(45) 0.557 11 1.010 0.117 36 0.985 0.111 22 0.998 0.109Zhao et al.(48) �0.001 3 1.300 0.121 6 1.100 0.171 87 1.200 0.343Willing et al.(58) 0.935 68 1.293 0.164 183 1.294 0.135 121 1.287 0.110Rubin et al.(63) 0.764 114 1.200 0.120 323 1.190 0.130 240 1.180 0.140Holmberg-Marttila et al.(65) 0.169 8 1.061 0.103 26 1.027 0.073 9 1.039 0.115
* Resulted from the �2 test for difference between observed and expected frequencies.
424 THAKKINSTIAN ET AL.

Mean change in BMD for genotype groups BB and Bbwere therefore collapsed. With the random effect model, theestimated SMD was �0.28 (95% CI: �0.49, �0.06), andthis was statistically significant (Z � 2.55, p � 0.011). Theestimated difference was �0.43, that is, those with BB andBb genotypes had a mean percent BMD loss per year of0.43 more than those with genotype bb (see Fig. 2). Egger’stest indicated no publication bias (coefficient � 0.48, SE �1.648937, p � 0.778)
BsmI polymorphism and percent change in femoralneck BMD
There were 11 studies(35,37,39,41,47,50,55,58,59,65,70) that de-termined the association between mean percent BMDchange at the femoral neck and the BsmI polymorphism.Two studies were excluded: one did not provide SDs,(58)
and one included only men.(70) The total sample sizes forBB, Bb, and bb groups were 169 (range, 2–46), 501 (range,14–134), and 364 (range, 7–96), respectively.
Heterogeneity was present (�2 � 75.85, df � 8, p �0.008 for D1; �2 � 84.41, df � 8, p � 0.001 for D2; �2 �26.70, df � 8, p � 0.001 for D3). Neither meta-regressionnor subgroup analyses could identify the causes of hetero-geneity. Determination of gene effect despite heterogeneityindicated no association between genotypes and mean per-cent BMD change (F � 2.82, df � 2/20, p � 0.089). Theestimated D1, D2, and D3 were �0.627 (95% CI: �1.44,0.185), �0.619 (95% CI: �1.199, �0.039), and �0.008(95% CI: �0.773, 0.758), respectively. Imposing a domi-nant model, as found for change in spine BMD, did notchange the results; the estimated SMD was �0.27 (95% CI:�0.81 to 0.27), and this was not significant (p � 0.329).
DISCUSSION
We used a new process of meta-analysis to pool molec-ular association studies addressing the relationship betweenthe most common VDR gene polymorphism and variousmeasures of bone mass. Our main result was the presence ofan association between the BsmI polymorphism and spinalBMD in postmenopausal, but not premenopausal, women.This association was modest and seemed to follow a reces-sive mode of action; those with the BB genotype had lowerBMD than those with the Bb/bb genotype by �0.022 g/cm2.This result was very robust; sensitivity analyses that re-moved the largest studies, those not in HWE, and thoseadjusted for age did not significantly change the magnitudeof the gene effect or the genetic model. This effect is alsoconsistent with results from previous meta-analyses; Cooperet al.(71) found an effect size of 0.03 g/cm2 or 2.5% in thesame direction, although this did not reach significance (p �0.062). Gong et al.(72) also concluded that there was asignificant association, although they could not state themagnitude.
The magnitude of the decrease in spinal BMD with theBB genotype is very modest. To put this in context, the geneeffect is similar to “aging the bones” by 1 year or decreasingBMD by 0.3 SD. Given that the average BMD for the Bb/bbgenotype groups was 0.933, this gene effect represents a2.4% decrease in spinal BMD. If each SD decrease in BMD
causes a 50% increase in the risk of fractures and we assumethat one SD � 10% as a minimum, the gene effect wouldtranslate into a �12% increase in the risk of fractures inthose with the BB genotype. Given that the pooled preva-lence of the BB genotype was 16.8%, this results in anestimated population attributable risk of spine fracture of1.98%, that is, almost 2% of the spine fractures in thegeneral population can be attributed to the BB genotype.
One caveat with our analysis is that it is based on regres-sion analysis. Other approaches to dealing with multiplecomparisons (e.g., Tukey’s, Scheffe’s, or Bonferroni’stests) can also be applied after ANOVA, but they are moreconservative. For example, applying Tukey’s test on BMDin postmenopausal women indicated a significant differencein D1 (95% CI: �0.049, �0.005) but not in D2 (95% CI:�0.024, 0.010) or D3 (95% CI: �0.019, 0.009). Thus,although the overall gene effect persists, the recessivemodel is undetectable with this approach.
This gene effect was not seen in premenopausal women.This seems to be consistent with results from calcium sup-plementation trials; calcium supplementation seems to de-crease BMD loss at the spine in late, but not early, post-menopausal women(73) and has no effect in premenopausalwomen.(74)
Pooled results relating BsmI genotype to change in spinalBMD per year were heterogeneous, and we were unable toidentify the source. Pooling despite this heterogeneity indi-cated a dominant model, such that BB and Bb genotypeslost more BMD per year than bb genotypes. Thus, it seemsthat the B allele carries a double deleterious effect, leadingto lower baseline BMD and greater losses in BMD at thespine, although we are cautious about this latter conclusionbecause of heterogeneity.
We did not find any association between BsmI polymor-phisms and femoral neck BMD. This lack of associationwas relatively robust in sensitivity analysis. This result is atvariance with previous meta-analyses,(71,72) which found asignificantly lower BMD in the BB group by �0.02g/cm2,(71) as well as biological data, indicating that femoralneck BMD does respond to calcium supplementation.(73)
The reason for this discrepancy is unclear; it may be be-cause of the small number of studies included in the previ-ous meta-analyses, that is, more negative studies have ap-peared since then, or it may be because of the fact thatprevious meta-analyses pooled despite the presence of het-erogeneity.
With the explosion in molecular epidemiological methodsand microarray technology, the hope is that genetic “riskprofiles” for various diseases can be developed. The currentparadigm in the field suggests that polymorphisms in mul-tiple genes, each with a small effect, will act, or interact,together to determine overall risk. If this proves true, verylarge individual studies, or meta-analyses of multiplesmaller studies, will be needed to detect these marginal tomodest genetic effects. Although there are many attemptsunderway to create large scale DNA and information data-bases to allow large scale association studies, these willlikely take many years to set up, and it is likely thatmeta-analysis will remain the method of choice in the nearfuture. To date, few methods have been developed for
425META-ANALYSIS OF MOLECULAR ASSOCIATION STUDIES
meta-analysis of molecular association studies.(15) Thismeta-analysis is instructive in identifying a number of meth-odologic problems and issues particular to molecular stud-ies.
1. Heterogeneity. Although it is good practice to exploreheterogeneity in meta-analysis of traditional studies, forexample, RCTs, it seems that this is particularly impor-tant in molecular association studies. The possiblesources of heterogeneity are numerous and includesome unique to genetics, such as population stratifica-tion, admixture, linkage disequilibrium, HWE, andvarying allele frequencies in different ethnic groups.Pooling results despite heterogeneity has the potentialto generate meaningless or even misleading re-sults,(23,25,75) perhaps more so with molecular associa-tion studies than traditional studies. In our example,pooling despite heterogeneity gave different resultsthan pooling homogenous subgroups. In addition, meta-regression was not always able to uncover the source ofheterogeneity, and as in traditional meta-analysis, oneneeds to be guided by clinical judgment and biologicalevidence.
2. Pooling data from more than two groups. At minimum,di-allelic polymorphisms will generate three genotypegroups (as in our example); however, there are poten-tially many more genotype groups, and meta-analyticmethods need to be developed that handle multiplegroups and do so in a way that reflects potential geneticmodels of action (e.g., dominant, recessive, co-dominant, etc.).
3. Putting genetic data in context. In our example, too fewstudies measured and included potential confoundersand effect modifiers such as menopausal status, calciumintake, smoking and alcohol history, and BMI. To usegenetic polymorphisms clinically, one would need toaccount for these co-variates to estimate the incremen-tal information provided by genotyping, above andbeyond that obtained from “traditional” variables.
4. Gene–environment interaction. Gene environmentinteractions may also be significant; for example, a BBgenotype may have one effect if calcium intake is lowand another if intake is high. Gene–gene interactionsmay also occur (e.g., VDR polymorphisms may interactwith polymorphisms in the estrogen receptor or colla-gen A1 genes to influence BMD).
5. The need for biological data. In our example, it wasdisappointing that after 8 years of research, so little wasknown about the functional effects of the BsmI poly-morphism. There is a strong need to have biologicaldata to help formulate the hypotheses regarding molec-ular associations.
In summary, with the proliferation of molecular associa-tion studies, the ease of genotyping, and the prospect ofdeveloping genetic risk profiles for complex diseases, therewill be an increased need to quantify the magnitude of therisk associated with genetic polymorphisms. This will likelyentail meta-analytic methods, and this meta-analysis high-lights some of the methodological issues that will need to beresolved.
ACKNOWLEDGMENTS
We thank Prof Gerard Lucotte and Drs Bente L Langdahl,G Sigurdsson, HL Jorgensen, B Lawrence Riggs, J Marc,Patrick Garnero, Joseph M Zmuda, Omar M Hauache, andMaria Luisa Brandi for generously providing us with addi-tional information on their studies.
REFERENCES
1. Anonymous 1998 Osteoporosis: Review of the evidence for pre-vention, diagnosis and treatment and cost-effectiveness analysis.Executive summary. Osteoporos Int 8(Suppl 4):S3–S80.
2. Zmuda JM, Cauley JA, Ferrel RE 2000 Molecular epidemiology ofvitamin D receptor gene variants. Epidemiol Rev 22:203–217.
3. Ralston SH 1997 The genetic of osteoporosis. QJM 90:247–251.4. Eisman JA 1999 Genetics of osteoporosis. Endocr Rev 20:788–
804.5. Pocock NA, Eisman JA, Hopper JL, Yeates MG, Sambrook PN,
Eberl S 1987 Genetic determinants of bone mass in adults: A twinstudy. J Clin Invest 80:706–710.
6. Ralston SH 1997 Genetic markers of bone metabolism and bonedisease. Scand J Clin Lab Invest Suppl 227:114–121.
7. Morrison NA, Qi JC, Tokita A, Kelly PJ, Crofts L, Nguyen TV,Sambrook PN, Eisman JA 1994 Prediction of bone density fromvitamin D receptor alleles. Nature 367:284–287.
8. Haussler MR, McCain TA 1977 Basic and clinical concepts relatedto vitamin D metabolism (first of two parts). N Engl J Med297:974–983.
9. Eisman JA 2001 Pharmacogenetics of the vitamin D receptor andosteoporosis. Drug Metab Dispos 29:505–512.
10. Petitti DB 1994 Meta-Analysis, decision Analysis and Cost-Effectiveness Analysis: Methods for Quantitative Synthesis inMedicine. Oxford University Press, New York, NY, USA.
11. Egger M, Smith GD, Altman DG 2001 Systematic Reviews inHealth Care: Meta-Analysis in Context, 2nd ed. BMJ Books,London, UK.
12. Weiss ST, Silverman EK, Palmer LJ 2001 Case-control associationstudies in pharmacogenetics. Pharmacogenomics J 1:157–158.
13. Silverman EK, Palmer LJ 2000 Case-control association studiesfor the genetics of complex respiratory diseases. Am J Respir CellMol Biol 22:645–648.
14. Weiss ST 2001 Association studies in asthma genetics. Am JRespir Crit Care Med 164:2014–2015.
15. Attia J, Thakkinstian A, D’Este C 2003 Systematic review ofmeta-analyses of molecular association studies: Methodologic les-son for genetic epidemiology. J Clin Epidemiol 56:297–303.
16. Harris RP, Helfand M, Woolf SH, Lohr KN, Mulrow CD, TeutschSM, Atkins D 2001 Current methods of the US Preventive ServicesTask Force: A review of the process. Am J Prev Med 20(Suppl3):21–35.
17. LeBlanc ES, Janowsky J, Chan BKS, Nelson HD 2001 Hormonereplacement therapy and cognition: Systematic review and meta-analysis. JAMA 285:1489–1499.
18. van Tulder MW, Assendelft WJ, Koes BW, Bouter LM 1997Spinal radiographic findings and nonspecific low back pain. Asystematic review of observational studies. Spine 22:427–434.
19. Xu L, McElduff P, D’Este C, Attia J 2003 A meta-analysis of theeffect of dietary and supplementary calcium on bone health inwomen; too little, too late? Br J Nutr (in press).
20. Thakkinstian A, McElduff P, D’Este C, Duffy D, Attia J 2002 Amethod for meta-analysis of molecular association studies. in press
21. Sham P 1998 Statistics in Human Genetics. Arnold, London, UK.22. Bradburn MJ, Deeks JJ, Altman DG 1998 Metan-an alternative
meta-analysis command. Stata Tech Bull 44:4–15.23. Thompson SG 1994 Why sources of heterogeneity in meta-
analysis should be investigated. BMJ 309:1351–1355.24. Thompson SG, Smith TC, Sharp SJ 1997 Investigating underlying
risk as a source of heterogeneity in meta-analysis. Stat Med 16:2741–2758.
25. Thompson SG, Sharp SJ 1999 Explaining heterogeneity in meta-analysis: A comparison of methods. Stat Med 18:2693–2708.
26. Steichen TJ, Egger M, Sterne J 1998 Tests for publication bias inmeta-analysis. Stata Tech Bull 44:3–4.
426 THAKKINSTIAN ET AL.

27. Egger M, Davey Smith G, Schneider M, Minder C 1997 Bias inmeta-analysis detected by a simple, graphical test. BMJ 315:629–634.
28. StataCorp 2001 Stata Statistical Software: Release 7.0. Stata Cor-poration, Collage Station, TX, USA.
29. Melhus H, Kindmark A, Amer S, Wilen B, Lindth E, Ljunghall S1994 Vitamin D receptor genotypes in osteoporosis. Lancet 344:949–950.
30. Yamagata Z, Miyamura T, Iijima S, Asaka A, Sasaki M, Kato J,Koizumi K 1994 Vitamin D receptor gene polymorphism and bonemineral density in healthy Japanese women. Lancet 344:1027.
31. Barger-Lux MJ, Heaney RP, Hayes J, DeLuca HF, Johnson ML,Gong G 1995 Vitamin D receptor gene polymorphism, bone mass,body size, and vitamin D receptor density. Calcif Tissue Int 57:161–162.
32. Fleet JC, Harris SS, Wood RJ, Dawson-Hughes B 1995 The BsmI vitamin D receptor restriction fragment length polymorphism(BB) predicts low bone density in premenopausal Black and Whitewomen. J Bone Miner Res 10:985–990.
33. Garnero P, Borel O, Sornay-Rendu E, Delmas PD 1995 Vitamin Dreceptor gene polymorphisms do not predict bone turnover andbone mass in healthy premenopausal women. J Bone Miner Res10:1283–1288.
34. Howard G, Nguyen T, Morrison N, Watanabe T, Sambrook P,Eisman J, Kelly PJ 1995 Genetic influences on bone density:Physiological correlates of vitamin D receptor gene alleles inpremenopausal women. J Clin Endocrinol Metab 80:2800–2805.
35. Kroger H, Mahonen A, Ryhanen S, Turunen A-M, Alhava E,Maenpaa P 1995 Vitamin D receptor genotypes and bone mineraldensity. Lancet 345:1238.
36. Riggs BL, Nguyen TV, Melton LJ, Morrison NA, O’Fallon WM,Kelly PJ, Egan KS, Sambrook PN, Muhs JM, Eisman JA 1995 Thecontribution of vitamin D receptor gene alleles to the determinationof bone mineral density in normal and osteoporotic women. J BoneMiner Res 10:991–996.
37. Berg JP, Falch JA, Haug E 1996 Fracture rate, pre-and postmeno-pausal bone mass and early and late postmenopausal bone loss arenot associated with vitamin D receptor genotype in a high-endemicarea of osteoporosis. Eur J Endocrinol 135:96–100.
38. Boschitsch E, Suk EK, Mayr WR, Lang T, Schwartz WM, PanzerS, Ewald B, Eun-Kyun S, Richard MW, Thomas L, Dieter SW,Simon P 1996 Genotypes of the vitamin-D-receptor gene and bonemineral density in Caucasoid postmenopausal females. Maturitas24:91–96.
39. Garnero P, Borel O, Sornay-Rendu E, Arlot ME, Delmas PD 1996Vitamin D receptor gene polymorphisms are not related to boneturnover, rate of bone loss, and bone mass in postmenopausalwomen: The OFELY study. J Bone Miner Res 11:827–834.
40. Houston LA, Grant SF, Reid DM, Ralston SH 1996 Vitamin Dreceptor polymorphism, bone mineral density, and osteoporoticvertebral fracture: Studies in a UK population. Bone 18:249–252.
41. Jorgensen HL, Scholler J, Sand JC, Bjuring M, Hassager C, Chris-tiansen C 1996 Relation of common allelic variation at vitamin Dreceptor locus to bone mineral density and postmenopausal boneloss: Cross sectional and longitudinal population study. BMJ 313:586–590.
42. Salamone LM, Ferrell R, Black DM, Palermo L, Epstein RS, PetroN, Streadman N, Kuller LH, Cauley JA 1996 The associationbetween vitamin D receptor gene polymorphisms and bone mineraldensity at the spine, hip and whole-body in premenopausal women.Osteoporos Int 6:63–68.
43. Tokita A, Matsumoto H, Morrison NA, Tawa T, Miura Y, Fuka-mauchi K, Mitsuhashi N, Irimoto M, Yamamori S, Miura M,Watanabe T, Kuwabara Y, Yabuta K, Eisman JA 1996 Vitamin Dreceptor alleles, bone mineral density and turnover in premeno-pausal Japanese women. J Bone Miner Res 11:1003–1009.
44. Uitterlinden AG, Pols HA, Burger H, Huang Q, Van Daele PL,Van Duijn CM, Hofman A, Birkenhager JC, Van Leeuwen JP 1996A large-scale population-based study of association of vitamin Dreceptor gene polymorphisms with bone mineral density. J BoneMiner Res 11:1241–1248.
45. Alahari KD, Lobaugh B, Econs MJ 1997 Vitamin D receptoralleles do not correlate with bone mineral density in premeno-pausal Caucasian women from the southeastern United States.Metabolism 46:224–226.
46. Gennari L, Becherini L, Masi L, Gonnelli S, Cepollaro C, MartiniS, Mansani R, Brandi ML 1997 Vitamin D receptor genotypes and
intestinal calcium absorption in postmenopausal women. CalcifTissue Int 61:460–463.
47. Graafmans WC, Lips P, Ooms ME, van Leeuwen JP, Pols HA,Uitterlinden AG 1997 The effect of vitamin D supplementation onthe bone mineral density of femoral neck is associated with vitaminD receptor genotype. J Bone Miner Res 12:1241–1245.
48. Zhao J, Zhou X, Meng X, Liu G, Xing X, Liu H, Xu L 1997Polymorphisms of vitamin D receptor gene and its association withbone mineral density and osteocalcin in Chinese. Chin Med J(Engl) 110:366–371.
49. Kiel DP, Myers RH, Cupples LA, Kong XF, Zhu XH, Ordovas J,Schaefer EJ, Felson DT, Rush D, Wison PWF, Eisman JA, HolickMF 1997 The BsmI vitamin D receptor restriction fracment lengthpolymorphism (bb) influences the effect of calcium intake on bonemineral density. J Bone Miner Res 12:1049–1057.
50. McClure L, Eccleshall TR, Gross C, Villa ML, Lin N, Ra-maswamy V, Kohlmeier L, Kelsey JL, Marcus R, Feldman D 1997Vitamin D receptor polymorphisms, bone mineral density, andbone metabolism in postmenopausal Mexican-American women.J Bone Miner Res 12:234–240.
51. Ongphiphadhanakul B, Rajatanavin R, Chanprasertyothin S, Chailur-kit L, Piaseu N, Teerarungsikul K, Sirisriro R, Komindr S, Puavilai G1997 Vitamin D receptor gene polymorphism is associated withurinary calcium excretion but not with bone mineral density in post-menopausal women. J Endocrinol Invest 20:592–596.
52. Vandevyver C, Wylin T, Cassiman JJ, Raus J, Geusens P 1997Influence of vitamin D receptor gene alleles on bone mineraldensity in postmenopausal and osteoporotic women. J Bone MinerRes 12:241–247.
53. Zmuda JM, Cauley JA, Danielson ME, Wolf RL, Ferrell RE 1997Vitamin D receptor gene polymorphisms, bone turnover, and ratesof bone loss in older African-American women. J Bone Miner Res12:1446–1452.
54. Gennari L, Becherini L, Masi L, Mansani R, Gonnelli S, CepollaroC, Martini S, Montagnani A, Lentini G, Becorpi AM, Brandi ML1998 Vitamin D and estrogen receptor allelic variants in Italianpostmenopausal women: Evidence of multiple gene contribution tobone mineral density. J Clin Endocrinol Metab 83:939–944.
55. Hansen TS, Abrahamsen B, Henriksen FL, Hermann AP, JensenLB, Horder M, Gram J 1998 Vitamin D receptor alleles do notpredict bone mineral density or bone loss in Danish perimeno-pausal women. Bone 22:571–575.
56. Hauache OM, Lazaretti-Castro M, Andreoni S, Gimeno SGA,Brandao C, Ramalho AC, Kasamatsu TS, Kunii I, Hayashi LF, DibSA, Vieira JGH 1998 Vitamin D receptor gene polymorphism: Cor-relation with bone mineral density in a Brazilian population withinsulin-dependent diabetes mellitus. Osteoporos Int 8:204–210.
57. Tsuritani I, Brooke-Wavell KS, Mastana SS, Jones PR, HardmanAE, Yamada Y 1998 Does vitamin D receptor polymorphisminfluence the response of bone to brisk walking in postmenopausalwomen? Horm Res 50:315–319.
58. Willing M, Sowers M, Aron D, Clark MK, Burns T, Bunten C,Crutchfield M, D’Agostino D, Jannausch M 1998 Bone mineraldensity and its change in white women: Estrogen and vitamin Dreceptor genotypes and their interaction. J Bone Miner Res 13:695–705.
59. Gomez C, Naves ML, Barrios Y, Diaz JB, Fernandez JL, Salido E,Torres A, Cannata JB 1999 Vitamin D receptor gene polymor-phisms, bone mass, bone loss and prevalence of vertebral fracture:Differences in postmenopausal women and men. Osteoporos Int10:175–182.
60. Kikuchi R, Uemura T, Gorai I, Ohno S, Minaguchi H 1999 Earlyand late postmenopausal bone loss is associated with BsmI vitaminD receptor gene polymorphism in Japanese women. Calcif TissueInt 64:102–106.
61. Lau EM, Young RP, Ho SC, Woo J, Kwok JL, Birjandi Z, ThomasGN, Sham A, Critchley JA 1999 Vitamin D receptor gene poly-morphisms and bone mineral density in elderly Chinese men andwomen in Hong Kong. Osteoporos Int 10:226–230.
62. Poggi M, Aterini S, Nicastro L, Chiarugi V, Ruggiero M, Pacini S,Gulisano M 1999 Lack of association between body weight, bonemineral density and vitamin D receptor gene polymorphism innormal and osteoporotic women. Dis Markers 15:221–227.
63. Rubin LA, Hawker GA, Peltekova VD, Fielding LJ, Ridout R,Cole DE 1999 Determinants of peak bone mass: Clinical andgenetic analyses in a young female Canadian cohort. J Bone MinerRes 14:633–643.
427META-ANALYSIS OF MOLECULAR ASSOCIATION STUDIES

64. Vandevyver C, Vanhoof J, Declerck K, Stinissen P, VandervorstC, Michiels L, Cassiman JJ, Boonen S, Raus J, Geusens P 1999Lack of association between estrogen receptor genotypes and bonemineral density, fracture history, or muscle strength in elderlywomen. J Bone Miner Res 14:1576–1582.
65. Holmberg-Marttila D, Sievanen H, Jarvinen TL, Jarvinen TA 2000Vitamin D and estrogen receptor polymorphisms and bone mineralchanges in postpartum women. Calcif Tissue Int 66:184–189.
66. Langdahl BL, Gravholt CH, Brixen K, Eriksen EF 2000 Polymor-phisms in vitamin D receptor gene and bone mass, bone turnoverand osteoporotic fractures. Eur J Clin Invest 30:608–617.
67. Marc J, Prezelj J, Komel R, Kocijancic A 2000 Association of vitaminD receptor gene polymorphism with bone mineral density in Slov-enian postmenopausal women. Gynecol Endocrinol 14:60–64.
68. Uitterlinden AG, Weel AE, Burger H, Fang Y, van Duijn CM,Hofman A, van Leeuwen JP, Pols HA 2001 Interaction betweenthe vitamin D receptor gene and collagen type Ialpha1 gene insusceptibility for fracture. J Bone Miner Res 16:379–385.
69. Ferrari S, Rozzoli R, Chevalley T, Slosman D, Eisam JA, BonjourJ-P 1995 Vitamin-D-receptor-gene polymorphisms and change inlumbar-spine bone mineral density. Lancet 345:423–424.
70. Lorentzon M, Lorentzon R, Nordstrom P 2000 Vitamin D receptorgene polymorphism is associated with birth height, growth toaldolescence, and adult stature in healthy caucasian men: A cross-sectional and longitudinal study. J Clin Endocrinol Metab 85:1666–1671.
71. Cooper GS, Umbach DM 1996 Are vitamin D receptor polymor-phisms associated with bone mineral density? A meta-analysis.J Bone Miner Res 11:1841–1849.
72. Gong G, Stern H, Cheng S, Fong N, Mordeson J, Deng H, ReckerR 1999 The association of bone mineral density with vitamin Dreceptor gene polymorphisms. Osteoporos Int 9:55–64.
73. Dawson-Hughes B, Dallal GE, Krall EA, Sadowski L, Sahyoun N,Tannenbaum S 1990 A controlled trial of the effect of calciumsupplementation on bone density in postmenopausal women.N Engl J Med 323:878–883.
74. Baran D, Sorensen A, Grimes J, Lew R, Karellas A, Johnson B,Roche J 1990 Dietary modification with dairy products for pre-venting vertebral bone loss in premenopausal women: A three-yearprospective study. J Clin Endocrinol Metab 70:268–270.
75. Walter SD 1997 Variation in baseline risk as an explanation ofheterogeneity in meta-analysis. Stat Med 16:2883–2900.
Address reprint requests to:Ammarin Thakkinstian, MMS
Clinical Epidemiology UnitFaculty of Medicine
Ramathibodi HospitalRama 6 Road
Bangkok 10400, ThailandE-mail: [email protected]
Received in original form February 14, 2003; in revised formAugust 17, 2003; accepted October 10, 2003.
APPENDIX 1. CRITERIA OF METHODLOGIC QUALITY ASSESSMENT FOR
CROSS-SECTIONAL OR COHORT STUDY
Criteria Score
A. Representativeness of subjectsConsecutive/randomly selected from population withclearly defined sampling frame
2
Consecutive/randomly selected from populationwithout clearly defined sampling frame
1
Not described 0B. Ascertainment of BMD measurement
Clearly described standard method of measuringBMD, for example, using DXA, with details aboutcalibration
2
Described standard method of measuring BMD, forexample, using DEXA, without details aboutcalibration
1
Not described 0C. Ascertainment of VDR genotype
Genotyping done under “blind” conditions 1Unblinded or not mentioned 0
D. HWEChecking goodness of fit of HWE with appropriatestatistics
2
Checking goodness of fit of HWE withinappropriate statistics
1
Not mentioned 0E. Assessment of association
Appropriate statistic used with adjusting three ormore confounders, for example, regression/ANCOVA
4
Appropriate statistic used with adjusting twoconfounders, for example, regression/ANCOVA
3
Appropriate statistic used with adjusting oneconfounder, for example, regression/ANCOVA
2
Appropriate statistic used without adjustingconfounders, for example, regression/ANOVA
1
Inappropriate statistic used, for example, pairwisecomparison using t-test
0
Total 11
428 THAKKINSTIAN ET AL.