Meta-analysis of Marital Dissolution and Mortality: Reevaluating the Intersection of Gender and Age
35
Meta-analysis of Marital Dissolution and Mortality: Reevaluating the Intersection of Gender and Age Eran Shor [Assistant Professor], Department of Sociology, McGill University, Montreal David J. Roelfs [Assistant Professor], Department of Sociology, University of Louisville, Kentucky Paul Bugyi [PhD candidate], and Department of Sociology, Stony Brook University, New York Joseph E. Schwartz [Professor] Department of Psychiatry and Behavioral Science, Stony Brook University, New York Abstract The study of marital dissolution (i.e. divorce and separation) and mortality has long been a major topic of interest for social scientists. We conducted meta-analyses and meta-regressions on 625 mortality risk estimates from 104 studies, published between 1955 and 2011, covering 24 countries, and providing data on more than 600 million persons. The mean hazard ratio (HR) for mortality in our meta-analysis was 1.30 (95% confidence interval [CI], 1.23-1.37) among HRs adjusted for age and additional covariates. The mean HR was higher for men (HR, 1.37; 95% CI, 1.27-1.49) than for women (HR, 1.22; 95% CI: 1.13-1.32), but the difference between men and women decreases as the mean age increases. Other significant moderators of HR magnitude included sample size; being from Western Europe, Israel, the United Kingdom and former Commonwealth nations; and statistical adjustment for general health status. Keywords Meta-analysis; Meta-regression; Marital dissolution; Mortality; Gender; Age Introduction The association between marital status, health, and mortality was one of the first issues to be systematically studied by sociologists and demographers, dating back to Durkheim’s classic study on suicide (Durkheim, 1951 [1897]). Over the years, numerous studies have examined this relationship, with many of them focusing on the risk of death among divorced and separated persons. The vast majority of these studies reported an increased risk of death for divorced and separated people. However, a few studies found no significant association (Burgoa et al., 1998; Goldman et al., 1995) and the magnitude of the relative risk varied © 2012 Elsevier Ltd. All rights reserved. Corresponding Author Mailing Address: Department of Sociology, McGill University, Room 713, Leacock Building, 855 Sherbrooke Street West, Montreal, Quebec, Canada H3A 2T7, Phone: 514-803-5986, [email protected]. Publisher's Disclaimer: This is a PDF file of an unedited manuscript that has been accepted for publication. As a service to our customers we are providing this early version of the manuscript. The manuscript will undergo copyediting, typesetting, and review of the resulting proof before it is published in its final citable form. Please note that during the production process errors may be discovered which could affect the content, and all legal disclaimers that apply to the journal pertain. NIH Public Access Author Manuscript Soc Sci Med. Author manuscript; available in PMC 2014 January 06. Published in final edited form as: Soc Sci Med. 2012 July ; 75(1): . doi:10.1016/j.socscimed.2012.03.010. NIH-PA Author Manuscript NIH-PA Author Manuscript NIH-PA Author Manuscript
-
Upload
oldwestbury -
Category
Documents
-
view
1 -
download
0
Transcript of Meta-analysis of Marital Dissolution and Mortality: Reevaluating the Intersection of Gender and Age
Meta-analysis of Marital Dissolution and Mortality: Reevaluatingthe Intersection of Gender and Age
Eran Shor [Assistant Professor],Department of Sociology, McGill University, Montreal
David J. Roelfs [Assistant Professor],Department of Sociology, University of Louisville, Kentucky
Paul Bugyi [PhD candidate], andDepartment of Sociology, Stony Brook University, New York
Joseph E. Schwartz [Professor]Department of Psychiatry and Behavioral Science, Stony Brook University, New York
AbstractThe study of marital dissolution (i.e. divorce and separation) and mortality has long been a majortopic of interest for social scientists. We conducted meta-analyses and meta-regressions on 625mortality risk estimates from 104 studies, published between 1955 and 2011, covering 24countries, and providing data on more than 600 million persons. The mean hazard ratio (HR) formortality in our meta-analysis was 1.30 (95% confidence interval [CI], 1.23-1.37) among HRsadjusted for age and additional covariates. The mean HR was higher for men (HR, 1.37; 95% CI,1.27-1.49) than for women (HR, 1.22; 95% CI: 1.13-1.32), but the difference between men andwomen decreases as the mean age increases. Other significant moderators of HR magnitudeincluded sample size; being from Western Europe, Israel, the United Kingdom and formerCommonwealth nations; and statistical adjustment for general health status.
KeywordsMeta-analysis; Meta-regression; Marital dissolution; Mortality; Gender; Age
IntroductionThe association between marital status, health, and mortality was one of the first issues to besystematically studied by sociologists and demographers, dating back to Durkheim’s classicstudy on suicide (Durkheim, 1951 [1897]). Over the years, numerous studies have examinedthis relationship, with many of them focusing on the risk of death among divorced andseparated persons. The vast majority of these studies reported an increased risk of death fordivorced and separated people. However, a few studies found no significant association(Burgoa et al., 1998; Goldman et al., 1995) and the magnitude of the relative risk varied
© 2012 Elsevier Ltd. All rights reserved.
Corresponding Author Mailing Address: Department of Sociology, McGill University, Room 713, Leacock Building, 855 SherbrookeStreet West, Montreal, Quebec, Canada H3A 2T7, Phone: 514-803-5986, [email protected].
Publisher's Disclaimer: This is a PDF file of an unedited manuscript that has been accepted for publication. As a service to ourcustomers we are providing this early version of the manuscript. The manuscript will undergo copyediting, typesetting, and review ofthe resulting proof before it is published in its final citable form. Please note that during the production process errors may bediscovered which could affect the content, and all legal disclaimers that apply to the journal pertain.
NIH Public AccessAuthor ManuscriptSoc Sci Med. Author manuscript; available in PMC 2014 January 06.
Published in final edited form as:Soc Sci Med. 2012 July ; 75(1): . doi:10.1016/j.socscimed.2012.03.010.
NIH
-PA Author Manuscript
NIH
-PA Author Manuscript
NIH
-PA Author Manuscript
substantially. Specifically, the wide range of mortality risks often varies by socio-demographic variables such as gender (Burgoa et al., 1998; Kolip, 2005; Kravdal, 2003;Zajacova, 2006), age (Breeze et al., 1999; Helweg-Larsen et al., 2003), geographicallocation (Artnik et al., 2006; Keller, 1969), and how well the study controlled for covariates(Bagiella et al., 2005; Moos et al., 1994).
Three main streams of research emerge from the literature: research into possibleconfounding, examinations of possible mediating mechanisms, and studies of possiblemoderating factors. We begin with a brief review of research on confounding factors and onpotential mediators. The current trend in the literature, however, is towards identifying therole of moderating factors in the marital dissolution-mortality association (Hughes & Waite,2009; Williams & Umberson, 2004). Since meta-analysis and meta-regression techniquesare well suited for investigating these moderating factors, we focus the present paper on thislatter research stream.
Research on confounding factorsFirst, some scholars have suggested that the association between marital dissolution andmortality may in fact be at least partly spurious. According to this line of reasoning, thisassociation is largely the result of physical health, psychological health, economic, andbehavioral factors. For example, Mastekaasa (1994) argued that low psychologicalwellbeing of either one or both partners may in fact be present for many years before maritaldissolution and serve as one of the main causes for this dissolution. Parlin and Johnson(1977) and Rushing (1979) also argued that those who are psychologically unstable may beless able to sustain marriages. Similarly, Gottman and Levenson (1992) showed that lowerphysical health may predict marital dissolution. People who suffer from physical healthproblems are not only less likely to get married, but are also more likely to suffer frommarital stress, marital problems, and eventually marital dissolution
Preexisting economic difficulties may also increase the likelihood of marital dissolutionrather than being its result. Hansen (2005) for example, who conducted an eight year paneldata study of unemployment and marital dissolution, found that unemployment leads to anincreased risk of martial dissolution. Yet, as many other studies have previously shown,unemployment and economic adversity are also clearly associated with health problems(Alavinia & Burdorf, 2008; Bambra & Eikemo, 2009; Hammarstrom, 1994; Janlert, 1997;Jin et al., 1995; Murphy & Athanasou, 1999) and a higher risk of mortality (Ahs &Westerling, 2006; Costa & Segnan, 1987; Iversen et al., 1987; Martikainen, 1990; Moser etal., 1987; Tsai et al., 2004). Finally, a variety of behaviors which may be damaging to aperson’s health and increase the risk of mortality may also lead to marital tensions andhigher marital dissolution rates. These include, among others, excessive substance abuse,alcoholism, smoking, reckless driving, inadequate diets, and eating disorders (Amato &Rogers, 1987; Mudar et al., 2001; Wyke & Ford, 2002; Yamaguchi & Kandel, 1997).
Research on mediation mechanismsPrevious studies suggested three predominant factors through which marital dissolution maylead to negative health consequences: social support, economic well-being, and physical andmental health. First, much of the sociological and public health literature has concluded thatsocial support provides people with a variety of physical and mental health benefits thatdecrease mortality rates (e.g. Berkman, 1985; Blazer, 1982; Cornell, 1992; Litwak et al.,1989; Rosengren et al. 1993; Schaefer et al., 1981; Uchino et al., 1996). In her analysis ofJapanese families, Cornell (1992) found that married women enjoy better relationshipswithin the household and consequently lower mortality rates. Lye (1996) found that divorceweakens parent-child relations, and Kalmijn (2007) showed that when men divorce, they
Shor et al. Page 2
Soc Sci Med. Author manuscript; available in PMC 2014 January 06.
NIH
-PA Author Manuscript
NIH
-PA Author Manuscript
NIH
-PA Author Manuscript
tend to receive reduced social support from their children. These studies suggest thatmarriage provides people with important resources in the form of social support, which mayserve as a buffer against health problems and mortality risks. When the marriage ends, thissupport system often weakens, and with it also the emotional support and regulation ofhealth behaviors associated with being married (Ross et al., 1990; Umberson et al., 1992)
A second mediating factor examined in the marital dissolution literature is economic well-being. Both Lillard and Waite (1995) and Rogers (1995) showed that divorced and separatedpeople die at a higher rate than married people, and that the relationship is explained partlyby economic factors. Smock’s (1993, 1994) findings suggested that financially women aremore adversely affected by divorced. Duncan and Hoffman (1985) found that if womenremarry, the negative effect of their previous economic loss is eliminated. McManus andDiPrete (2001), while acknowledging the economic disadvantages of women followingdivorce, showed that men also incurred a serious financial penalty from divorce due to theloss of a second income and the payment of child support. Such economic disadvantagesmay, with time, translate into diminished health coverage and cheaper and less healthynutrition, which eventually lead to poorer health and higher mortality rates.
The third mediating factor emphasized in the marital dissolution literature relates to stressand mental health (Williams & Umberson, 2004). Some have argued for a marital resourcemodel, suggesting that marriage increases people’s psychological well-being (Cherlin et al.,1998; Gove, 1973). Kessler and Essex (1982), for example, found that married people areless susceptible to stressful events, an advantage which is lost when the marriage ends.Others suggested that marital dissolution itself may have a negative effect on mental health(Parlin & Johnson, 1977; Williams et al., 2008), which may lead to higher mortality rates.According to this crisis model, the stress associated with marital dissolution directlyundermines health (Booth & Amaro, 1991; Williams et al., 1992).
Moderating Factors in the Marital Dissolution-Mortality AssociationThe contribution of meta-analysis and meta-regression techniques to our understanding ofconfounding and mediation mechanisms is limited. However, these methods are especiallyhelpful in investigating moderating factors in the relationship of marital dissolution andmortality. In a recent meta-analysis of marital status (including marital dissolution) andmortality among the elderly, Manzoli et al. (2007) found that divorced and separated personshad a 16% higher risk of mortality than the risk of married persons. The inclusion criteriathey used, however, were quite restrictive and their analysis leaves many questionsunanswered. Their study examined only the elderly (65 and older), was limited to studiespublished between 1994 and 2005, and included relative risks (RRs) only if the originalstudies adjusted for age, sex, and additional covariates.
Additional meta-analyses are therefore needed to determine the magnitude of the associationfor younger age groups and to determine whether gender or geographic region becomesignificant factors once these younger age groups are included in the analysis (both genderand region were non-significant in the Manzoli et al. study). Furthermore, Manzoli et al.only examined the effects of statistical adjustment and follow-up duration on the risk ofmortality of married vs. unmarried individuals, a category in which divorced/separated,widowed, and never married individuals were joined together. Therefore, no conclusioncould be drawn regarding marital dissolution and trends in mortality risk over time were notinvestigated.
Perhaps the most interesting finding in the analysis of Manzoli et al. (2007) was the lack of astatistically significant difference in the risk of mortality between divorced men anddivorced women. This finding is especially surprising given that a host of previous studies
Shor et al. Page 3
Soc Sci Med. Author manuscript; available in PMC 2014 January 06.
NIH
-PA Author Manuscript
NIH
-PA Author Manuscript
NIH
-PA Author Manuscript
have established the existence of a gender difference in the risk; divorced men were oftenfound to be at a higher risk for health problems and mortality than divorced women (e.g.Burgoa et al., 1998; Hajdu et al., 1995; Ikeda et al., 2007; Kolip, 2005; Lillard & Waite,1995). This suggests a possible interaction effect between age and gender, where the genderdifferences in the risk for mortality following marital dissolution diminish at older ages.This supposition seems to be supported by the findings of a number of studies which showedthat the risk of mortality following marital dissolution is higher at younger ages than it is atolder ages (e.g. Hajdu et al., 1995; Kravdal, 2007). However, other researchers havesuggested that because older adults often experience a pile-up effect of stressors, thenegative health effects of marital dissolution should be greater for older compared toyounger individuals (Ensel & Lin, 2000; Ensel et al., 1996; Williams & Umberson, 2004).
Another potentially important moderating factor is the recency of the marital dissolution.Williams and Umberson (2004) suggested that the health decline associated with maritaldissolution should dissipate with time. Conversely, Hughes and Waite (2009) have foundthat those people who spent a greater portion of their lives divorced had more healthproblems. To date, very few studies have compared varying follow-up durations in order toempirically examine the moderating effects of marital dissolution recency on the risk ofmortality. The few that have done so mostly found higher mortality rates when maritaldissolution occurred more recently, but results were not consistent (Brockmann & Klein,2002; Jenkinson et al., 1993). Furthermore, gender is potentially implicated with respect tothe moderating effects of dissolution recency because men are more likely than women toremarry (Glick & Lin, 1987), and remarriage serves as a potential buffer against the long-term harmful effects of marital dissolution.
The potential role of cultural differences is also of interest as marital dissolution has beenstudied extensively across the globe. Some of the previous studies reported particularly high(two to five times higher) mortality hazard ratios following marital dissolution in EasternEuropean countries (Artnik et al., 2006; Dzurova, 2000; Malyutina et al., 2004), inScandinavia (Rosengren et al., 1993; Rosengren et al., 1989; Villingshoj et al., 2006), and inJapan (Nagata et al., 2003). Yet other studies of Eastern European (Mollica et al., 2001) andScandinavian (Nilsson et al., 2005; Nybo et al., 2003; Samuelsson & Dehlin, 1993)countries found either no association between marital dissolution and mortality, or even attimes a negative association, where divorced people lived longer. While a pattern is difficultto discern, culture is clearly a potential moderator of the marital dissolution-mortalityassociation. Theoretically, one may expect marital dissolution to have a more substantialnegative impact in relatively conservative and traditional societies (such as East Asia or theArab world), where divorce is looked upon unfavorably and the cultural stigma is stronger.
HypothesesThe present meta-analysis contributes to the body of knowledge on marital dissolution byutilizing the heterogeneity of research settings found in the literature to assess the impact ofpotential moderators. Some, such as gender and age, are easier to evaluate within anindividual study (although most previous studies still did not examine them). Others—suchas marital dissolution recency and cultural differences—have rarely been addressed byindividual studies and are much more easily examined by comparing across studies. Meta-analysis and meta-regression techniques are well-suited to this task, allowing more nuancedcomparisons of various moderators. Following our theoretical discussion, we conduct testsof gender-age interactions, gender-recency interactions, geographic region, time period, anda number of specific study design characteristics. The research reviewed above suggests anumber of hypotheses regarding potential moderating factors. We test five basic hypotheses:
Shor et al. Page 4
Soc Sci Med. Author manuscript; available in PMC 2014 January 06.
NIH
-PA Author Manuscript
NIH
-PA Author Manuscript
NIH
-PA Author Manuscript
H1: The overall mortality hazard ratio of those who experienced marital dissolution willbe higher than the mortality hazard ratio of married people.
H2: The mortality hazard ratio associated with marital dissolution will be greater foryounger age groups than for older ones.
H3: Divorced men will have a higher mortality hazard ratio than divorced women.However, this difference will be most pronounced in younger ages, and in older agesthe difference in risk will decline.
H4: The harmful effects of marital dissolution will be most pronounced during the firstfew years following marital dissolution and will decrease thereafter. This decrease,however, will be more substantial for men than for women.
H5: The harmful effects of marital dissolution will be more strongly felt by individualsin relatively traditional and conservative cultures.
MethodsSearch strategy and coding procedures
In June 2005, we conducted a search of electronic bibliographic databases to retrieve allpublications combining the concepts of psychosocial stress and all-cause mortality. We used100 search clauses for Medline, 97 for EMBASE, 81 for CINAHL, and 20 for Web ofScience (see Section 1 of Appendix for the full search algorithm used for Medline;information on the remaining search algorithms is available from authors upon request). Weidentified 1570 unique publications. Using these results as a base, we iteratively searchedthe bibliographies of eligible publications; the lists of sources citing an eligible publication;and the sources identified as “similar to” an eligible publication. We exhausted the literatureafter 9 iterations (the full description of this iterative search protocol is available from theauthors upon request). We re-ran the electronic keyword searches in these databases andcompleted the search and coding stages in January 2012.
The electronic database searches were performed by a research librarian. Two authorstrained in meta-analysis coding procedures independently determined publication eligibilityand extracted the data from the articles. Data was entered into and publications were trackedthroughout the process using basic spreadsheets (See Section 2 of Appendix for full list ofvariables for which data were sought). Any unpublished work encountered was consideredfor study inclusion. Although our search was conducted in English, we were able to locateand translate the relevant portions of 35 publications written in German, Danish, French,Spanish, Dutch, Polish, or Japanese. The most frequent reasons for study exclusion includethe lack of an eligible psychosocial stress or social isolation measure, failure to report a ratiomeasure of mortality risk, and confounding in the dependent variable such that the outcomewas not strictly all-cause mortality. Figure 1 summarizes the number of publicationsconsidered at each step of the search process. The full database contains 282 publicationsexamining the effects of various stressful events on all-cause mortality. To evaluate codingaccuracy we randomly selected and recoded 40 of these publications (including 446 pointestimates). No major errors were found.
The present analysis uses the subset of articles (n = 104) that reported the effect of maritaldissolution on all-cause mortality. 98 of these publications appeared in peer-reviewedjournals; four in a book chapter; and one in an unpublished dissertation. One publication wastranslated from Spanish, two from Danish, and one from German in consultation with nativespeakers; the remaining 100 publications were in English (see Table 1).
Shor et al. Page 5
Soc Sci Med. Author manuscript; available in PMC 2014 January 06.
NIH
-PA Author Manuscript
NIH
-PA Author Manuscript
NIH
-PA Author Manuscript
Statistical methods and inclusion criteriaFor the present analyses, a study was included if the outcome variable was all-causemortality and a clear comparison was made between a group of people who were divorcedor separated at baseline and another group who were married at baseline. No studies thatused the general population were included in the analyses. In total, the 104 publicationsprovided 625 point estimates for analysis. Cross-sectional studies were included in theanalysis provided that the design of the study closely followed that of a longitudinal study.An indicator variable was created in order to examine the possible effects of this inclusiondecision.
Statistical methods varied from study to study, necessitating the conversion of odds ratios,rate ratios, standardized mortality ratios, relative risks, and hazard ratios (HRs) into acommon metric. All non-hazard-ratio point estimates were converted to hazard ratios—themost frequently reported type (See Section 3 of Appendix). As is standard practice, we usedthe standard errors reported in the publications to calculate the inverse variance weights.When not reported, standard errors were calculated using (1) confidence intervals, (2) tstatistics, (3) χ2 statistics, or (4) p-values. When upper-limit p-values were the only estimateof statistical significance available (e.g. in cases where we knew only that the p-value laysomewhere between .01 and .05), the midpoint of the upper and lower limits was used toestimate the p-value. In 222 cases (out of the 625 point estimates) no measure of statisticalsignificance was reported and standard errors were estimated using multiple regression (seesection 4 of Appendix). An indicator variable was created so analyses could be conductedboth with and without data points where the standard error was estimated.
Many meta-analysts prefer to use only the most general point estimates reported in a givenpublication. While this strategy makes it easier to maintain independence between pointestimates and makes the calculations of the inverse variance weights straight-forward, it alsoresults in a substantial loss of information. We sought instead to maximize the number ofpoint estimates analyzed, capturing variability both between and within each publicationrather than just the former (For a similar analytic strategy see Roelfs et al., 2010; 2011;Roelfs et al., 2011; Shor et al., 2012). In cases where a given set of person-years wasrepresented more than once, we utilized a variance adjustment procedure (See Section 5 ofAppendix).
To control for time- and location-specific marital dissolution norms, we gathered data on thenumber of divorces per 1,000 persons, matched to the remaining data by country andbaseline start year. Data were obtained primarily from the United Nations DemographicYearbook from 1958, 1976, 1982, 1990, 1991, 1993-2000, 2002, 2003, 2005, and 2006.Additional data were obtained from the 1869, 1879, 1889, 1899, 1909, and 1920Netherlands Censuses and from the 1997 China Statistical Yearbook.
Two measures of study quality were adopted to assess study bias. First, the 2 authors whoperformed the coding assigned a 3-level subjective rating to each publication. Publicationswere rated as low quality if they contained obvious reporting errors or applied statisticalmethods incorrectly (in these cases, data were coded only when sufficient information wasavailable to extract corrected relative risk estimates). Publications were rated as high qualityif models were well-specified (i.e. the correct model was used relative to the state of the artat the time of publication) and discussions and reporting of study results were detailed.Second, based on the results of a principal components factor analysis, we constructed ascale measure (continuous, range = 0 to 10) using the following: (a) the 5-year impact factor(ISI Web of Knowledge, 2009) of the journal in which the article was published (an impactfactor of 1 was assigned when the impact factor was not available); and (b) the number ofcitations received per year since publication according to ISI Web of Knowledge. See
Shor et al. Page 6
Soc Sci Med. Author manuscript; available in PMC 2014 January 06.
NIH
-PA Author Manuscript
NIH
-PA Author Manuscript
NIH
-PA Author Manuscript
Section 6 of Appendix for additional information on the factor analysis. The Spearmancorrelation between the subjective rating and the factor-analysis-derived rating was low (rho= 0.173; p < 0.001). The factor analysis further indicated that these two measures tappeddifferent dimensions of quality.
Both Q-tests and I2 measures were used to assess the presence and magnitude ofheterogeneity in the data (Huedo-Medina, Sanchez-Meca, & Marin-Martinez, 2006). Q-testresults from preliminary analyses revealed substantial heterogeneity across studies’ effectsizes. In light of this all meta-analyses and meta-regression analyses were calculated bymaximum likelihood using a random effects model. Analysis was performed with SPSS 19.0using matrix macros provided by Lipsey and Wilson (2001). The possibility of selection andpublication bias was examined using a funnel plot of the log HRs against sample size. Dueto heterogeneity in the data, funnel plot asymmetry was tested using both Egger’s test(Egger & Davey-Smith, 1998) and weighted least squares regressions of the log HRs on theinverse of the sample size (Moreno et al., 2009; Peters et al., 2006).
Analyses performed include meta-analyses of subgroups and multivariate meta-regressionanalyses. The following covariates were used in these analyses: (1) whether standard errorwas estimated (yes or no); (2) whether death rate was estimated (yes or no); (3) age of thepublication, divided by 10; (4) age of the study, divided by 10; (5) age of the study, squared;(6) duration of the baseline period, in years; (7) years elapsed between the end of baselineand the beginning of follow-up; (8) maximum follow-up duration, in years; (9) whether astudy used a longitudinal design; (10) whether study sample consisted of persons withprevious stressful experiences or chronic health problems (yes or no); (11) proportion ofrespondents who were male; (12) mean age of sample at baseline, divided by 10; (13) agerange of sample at baseline, divided by 10; (14) a series of interaction terms between gender,mean age, and follow-up duration; (15) a series of variables indicating whether gender, age,socioeconomic status, health, and other social characteristics were statistically controlled;(16) sample size, log transformed; (17) geographic region; (18) number of divorces per1,000 population in corresponding nation-year; (19) subjective quality rating; and (20) thecomposite scale of study quality.
ResultsTable 2 provides descriptive statistics on the 625 mortality risk estimates included in thisstudy. Data were obtained from 104 studies published between 1955 and 2011, covering 24countries, and representing more than 600 million people. Men and women are both well-represented in the dataset and 82.7% of the risk estimates came from study samples withmean ages greater than or equal to 40 years. The median of the maximum follow-upduration across all studies was 6.5 years. Of the HRs analyzed, Over 95% come from studiesassigned a subjective quality rating of average or high; the mean 5-year impact factor was3.59; and the mean number of citations received per year since publication was 2.07.
Table 3 presents the results of a number of meta-analyses. All analyses were stratified by thelevel of statistical adjustment of the risk estimate. Supporting our first hypothesis, personswho divorced or separated were significantly more likely to die than those who weremarried. The mean unadjusted HR was 1.51 (95% confidence interval [CI], 1.45-1.58; n =327 HRs); age-adjusted HR, 1.49 (95% CI, 1.40-1.59; n = 120); and HR adjusted for age andadditional covariates, 1.30 (95% CI, 1.23-1.37; n = 178). These results show that, in studiescontrolling for multiple covariates, marital dissolution is associated with a 30% higher riskof mortality. Table 3 also shows that the exclusion of HRs based on estimated death rates orthe exclusion of HRs where the standard error was estimated does not substantively alter themean HRs.
Shor et al. Page 7
Soc Sci Med. Author manuscript; available in PMC 2014 January 06.
NIH
-PA Author Manuscript
NIH
-PA Author Manuscript
NIH
-PA Author Manuscript
Subgroup Meta-analyses and Meta-regression AnalysesIn the interest of presenting conservative results, from this point forward the discussion ofTable 3 will focus only on HRs adjusted for age and additional covariates. Table 3 showsthat marital dissolution was associated with decreased longevity for both genders. However,in accordance with our hypothesis, the magnitude of the association was greater for men(HR, 1.37; 95% CI, 1.27-1.49; n = 79 HRs) than for women (HR, 1.22; 95% CI, 1.13-1.32; n= 75). Table 4 presents the results of three meta-regression analyses, the first modelconsisting of all first order effects, the second model adding three interaction terms, and thethird consisting of the final parsimonious model. All three models confirm that the risk ofdeath for men who lost their spouse was substantially higher than the risk for women.
An interesting result comes from comparing groups by average age at baseline. There are noHRs adjusted for age and for additional variables for the age groups of 20-29 and 30-39.However, the unadjusted and age adjusted mean HRs for these two age groups suggest thatthe risk of mortality following marital dissolution in these younger age groups is higher thanit is in older age groups. Indeed, in accordance with our hypothesis, marital dissolution isassociated with increased mortality in almost all age groups, but there is a decrease in themagnitude of the association at older ages. In the 40 and 50 age group, divorced andseparated persons had a 55% higher risk of death than married persons (HR, 1.55; 95% CI,1.27-1.90; n = 13). The risk was still high for those aged 50 to 59 years (HR, 1.59; 95% CI,1.34-1.89; n=13), but then decreased substantially for those aged 60 to 69 (HR, 1.36; 95%CI, 1.24-1.50; n=44), 70 to 79 (HR, 1.17; 95% CI, 1.01-1.36; n=17), and 80 or older (HR,1.22; 95% CI, 1.14-1.31; n=90). The results of the meta-regression analysis (Model 3 ofTable 4) reflect this downward trend among the latter four age groups (a 6% decrease foreach additional 10 years; p < .001).
The impacts of gender and age on the magnitude of the HR are more complex than the meta-analyses can reveal. Models 2 (full model) and 3 (parsimonious model) of Table 4 bothshow a significant interaction effect between these two variables. In Model 3, theexponentiated regression coefficient for gender is 2.43 (95% CI, 2.02-2.91), 0.94 (95% CI,0.92-0.96) for mean age, and 0.88 (95% CI, 0.85-0.91) for the interaction between genderand mean age. Taken together, these results tell us that the risk of death for men declinesmore rapidly with age than it does for women. By about 70 years of age, there is no longer asignificant difference between men and women, with the mean HR for men falling below themean HR for women at greater ages. However, by about 90 years of age there is littlesubstantive difference remaining between persons who were divorced or separated andmarried persons. Figure 2 shows the gender-mean age interaction based on calculations fromModel 3 of Table 4 (see Section 7 of Appendix for details).
The results reported in Table 3 show that there is no clear trend in HRs by follow-upduration. Model 2 of Table 4 confirms this pattern, as the exponentiated regressioncoefficients were not significant for follow-up duration (p = 0.7470) or for the gender-followup interaction (p = 0.0790). The results in Table 3 show that marital dissolution wasassociated with substantially elevated mortality in studies conducted between 1950 and 1959(HR, 1.62; CI, 1.18-2.22). The magnitude of the association declined in studies with abaseline year in subsequent decades. The mean HR was 1.21 (95% CI, 1.04-1.40) for studieswith a baseline between 1960 and 1969, and 1.22 (95% CI, 1.14-1.31) for studies with abaseline between 1970 and 1979. However, beginning in 1980 the risk of mortalityassociated with marital dissolution began to increase again, with a mean HR of 1.35 (95%CI, 1.25-1.44) for studies with a baseline between 1980 and 1989 and to 1.42 (1.26-1.58) instudies with a baseline between 1990 and 1999. While these results suggest that theassociation between marital dissolution and mortality may be curvilinear across baseline
Shor et al. Page 8
Soc Sci Med. Author manuscript; available in PMC 2014 January 06.
NIH
-PA Author Manuscript
NIH
-PA Author Manuscript
NIH
-PA Author Manuscript
years (i.e. the age of the study), the results from Model 2 of Table 4 show no significantlinear (p = 0.4100) or curvilinear (p = 0.4180) relationship.
With only two exceptions, the magnitude of the association between marital dissolution andmortality did not differ between regions of the world. The lack of statistical significance formost regions in Model 3 of Table 4 indicates that the magnitude of the mean HR wasapproximately the same in Scandinavia (the reference group); in the United States (p =0.6570); in the Eastern European nations (p = 0.3280); in China, Japan, Taiwan, andVietnam (p = 0.9460); and in Bangladesh, Brazil, and Lebanon (p = 0.3080). The mean HRwas 15% lower in the United Kingdom, Canada, Australia, and New Zealand (p < 0.0001)and 21% lower in the Western European nations and Israel (p < 0.0001) when compared tothe mean HR in Scandinavia. The results from Model 2 of Table 4 show that the number ofdivorces per 1,000 persons in a given nation-year also did not predict HR magnitude (p =0.9820).
Table 4 shows that other significant predictors of HR magnitude include the indicator forwhether the study sample consisted of persons with pre-existing health or stress conditions(a 14% decrease in the mean HR if so; p=.0160), the age range of the study sample (a 2%decrease in the mean HR for each additional 10 years of age range; p = 0.0070), and the logof the sample size (p < 0.0001). Table 4 also shows that HRs in studies where the standarderror was estimated were somewhat lower when compared with studies where it was notestimated (a 9% decrease; p = .0010).
Analysis of Data HeterogeneityThe between-groups Cochrane’s Q for the meta-analysis of all 625 HRs was statisticallysignificant (p < 0.0001) and the I2 statistic was high ( I, = 89.8; 95% CI, 72.7-96.2),indicating that important moderating variables exist and supporting the decisions to userandom effects models and conduct sub-group meta-analyses. Since the discussion of themeta-analyses focused on HRs adjusted for age and additional covariates, the correspondingheterogeneity test results were carefully examined. As shown in Table 3, the Q-tests forthese sub-group meta-analyses were statistically significant for only two cases, the HRsfrom the 40-49.9 age group (p = 0.0075) and from the 2-year follow-up group (p = 0.0080).I2 tests for these subgroups indicate heterogeneity was high for the 40-49.9 age group (I2 =55.7; 95% CI, 17.5-76.2) and the 2-year follow-up group (I2 = 63.2; 95% CI, 21.1-82.9).The results from these three sub-group meta-analyses should be treated conservatively.However, all remaining subgroup analysis Q-tests and I2 tests were non-significant,indicating that heterogeneity was adequately accounted for by the use of a random effectsmodel.
Meta-regressions were also used to examine possible sources of heterogeneity in the data.The model fit statistics for Model 3 of Table 4 (R2 = 0.5301; p < 0.0001 for Cochrane’s Q ofthe model) indicate that this model captured a very substantial portion of the heterogeneityin the data. Nevertheless, the unexplained heterogeneity variance component for this and theother models shown in Table 4 remained highly significant (each p < 0.001), confirming theneed to use a random effects model for all analyses.
DiscussionThe results of the meta-analyses and meta-regressions show that the association betweenmarital dissolution and mortality was not uniform across all subgroups and importantmoderators must be considered. In accordance with our hypothesis, among HRs adjusted forage and additional covariates, the risk of death for those who were divorced or separatedwas 30% higher than the risk among married persons. The association was greater for men
Shor et al. Page 9
Soc Sci Med. Author manuscript; available in PMC 2014 January 06.
NIH
-PA Author Manuscript
NIH
-PA Author Manuscript
NIH
-PA Author Manuscript
(an increased risk of 37%) than for women (an increase in risk of only 22%). These findingsboth expand and revisit the analysis of Manzoli et al. (2007), who conducted a meta-analysisof marital status and mortality among the elderly (65 and older) using studies publishedbetween 1994 and 2005. While Manzoli et al. found a 16% increase in mortality for elderlypeople who experienced marital dissolution, the current study found a more substantialincrease in the risk (17% to 36% increase in risk, depending on the specific age group) forthe elderly and an even higher risk (almost 60% increase in risk) for younger age groups.Furthermore, while Manzoli et al. found no differences across genders, our study shows thatat least in younger age groups divorced and separated men have a higher risk of mortalitythan divorced or separated women.
Manzoli et al. argued that the typology of interpersonal ties has changed over the years,reflecting the cultural and socio-economic modifications that occurred in rapidly evolvingsocieties (See also Henrard, 1996). By including in their analysis only studies that werepublished after 1994, Manzoli et al. were able to use only those studies conducted usinglongitudinal data but they could not evaluate the effect of these social trends on themagnitude of the risk. Our study, on the other hand, included study findings from earlierperiods and found that the risk of mortality among divorced and separated persons has beenrelatively stable over time. Model 2 of Table 4 shows that the mean HRs did notsignificantly decline (p = 0.4100) with each additional 10 years that passed since baselinedata collection.
Consistent with our theoretical suppositions, we found an interaction effect between genderand mean age. The mean HRs for both men and women declined as mean age increased, butmore so for men than for women. Figure 2 shows a mean HR of 2.12 among samples of menwith a mean age of 40 years. At the same mean age, the mean HR among women was 1.45.Among samples with a mean age of 70, the mean HR is 1.20 for both men and women.Among samples with a mean age of 90, the mean HR is not significantly different from 1.00for women and is below 1.00 for men (calculated HR = 0.82). Some caution must beexercised when interpreting this finding. When the underlying death rates are very high inboth the case and control groups (as is the case at older ages) ratio statistics such as the HRoften lack statistical power to detect group differences. Given the magnitude of the age-effect, however, it is still likely that the observed age effects are substantively meaningfulrather than merely a statistical artifact. Therefore, possible explanations for this finding needto be considered.
The pronounced gender difference in hazard ratios in the younger age groups may seemsomewhat surprising given what we know about the disproportionate economicconsequences of marital dissolution for men and women. A large body of research hasestablished that women experience much larger reductions in income and standard of livingfollowing divorce than do men (e.g. Holden & Smock, 1991; McManus & DiPrete, 2001;Smock, 1994; Smock et al., 1999). Therefore one could have expected women’s health, andtheir subsequent mortality risk, to be more adversely affected. However, consistent withprevious research findings, our findings show that the mean mortality risk for middle-agedmen was substantively higher than the risk for women.
One plausible explanation for the findings presented in Figure 2 might be that menexperience a more dramatic decline in supportive social ties following divorce while womenare better able to maintain their ties. Previous research has shown that in married coupleswomen perform the majority of the work for maintaining parent-child relationships(Kaufman & Uhlenberg, 1998; Lye, 1996; Lye et al., 1995). Furthermore, in a recent studyKalmijn (2007) found that, in comparison to women, men experienced greater declines insocial support from their children following marital dissolution. This effect was especially
Shor et al. Page 10
Soc Sci Med. Author manuscript; available in PMC 2014 January 06.
NIH
-PA Author Manuscript
NIH
-PA Author Manuscript
NIH
-PA Author Manuscript
strong if the marital dissolution occurred at an early stage. This finding may explain theinteraction effect in Figure 2, where the difference in mean hazard ratios between men andwomen was much more pronounced at middle-age than at older ages. Social support appearsto be a possible moderating factor in the gender differences in mortality following maritaldissolution, but our data do not allow for a direct test of this hypothesis.
Another possible explanation for the findings presented in Figure 2 is that the deleteriouseffects of marital dissolution wane over time. Most marital dissolutions occur at a youngerage, when the familial cell is relatively vulnerable (Fergusson, Horwood, & Shannon, 1984;Thornton & Rodgers, 1987). The relative instability of non-elderly couples may be the resultof the pressures associated with child rearing, changes in the nuclear family structure whenchildren leave the household, and the greater availability of alternate partners. One may thusargue that the lower excess risk of mortality following marital dissolution at older ages maysimply reflect the effects of remarriage or habituation. According to this logic individualswho have lived without a partner for a long time may have adjusted to their status and foundways to compensate for the loss of social and economic support. This habituationhypothesis, however, is refuted by lack of significance for the interaction between genderand follow-up duration. In contrast to our hypothesis, the adverse effects of maritaldissolution did not diminish over time for either men or women.
Finally, the analysis of differences in the risk of mortality by region failed to uncoverdifferences in the effects of marital dissolution between most of the regions of the developedworld. Mean HRs were approximately equal (ranging from 1.13 to 1.59; see Table 3) inScandinavia; the United States; the United Kingdom, Canada, Australia, and New Zealand;East Europe; West Europe and Israel; and in China, Japan, Taiwan, and Vietnam. Themagnitude of the effect only differed for the grouping of Bangladesh, Brazil, and Lebanon,though this apparent difference is not significant once other possible confounders are takeninto consideration (see Table 4). Though the results from Table 4 show a significantreduction in the mean HR for the United Kingdom, Canada, Australia, and New Zealand andfor West Europe and Israel, these results should be treated with caution. The lack ofsignificance associated with the number of divorces per 1,000 people suggests that broadcultural differences are not strong predictors of differences in the relative mortality rateassociated with marital dissolution.
LimitationsA major limitation of our study is one that is shared by many meta-analyses: reporting bias,or more specifically the non-reporting of non-significant findings, also known as the file-drawer effect (Berman & Parker, 2002; Egger & Davey-Smith, 1998). This tendency maylead to an over estimation of the mean HRs. Therefore, one should be especially careful ininterpreting mean HRs which are relatively close to 1, even when these are significant (as isthe case with some of the results in the current meta-analysis). A funnel plot of the log HRsagainst sample size appears somewhat asymmetric around the mean HR, suggesting thepossibility of publication bias (Figure 3). Using Egger’s test (Egger & Davey-Smith, 1998),there was significant evidence of publication bias (p < 0.001). Using Peters et al.’s test(Moreno et al., 2009; Peters et al., 2006) there was also evidence of publication bias amongthe unadjusted HRs (p < 0.001) and among HRs adjusted for age and additional covariates(p = 0.006), but not among HRs adjusted for age only (p = 0.274). The significant negativeregression coefficients for the inverse of the sample size indicate that small studies withlarge HRs are missing from the analysis. Due to ongoing concerns with formal methods tocorrect for publication bias, such as the “trim and fill” method (Terrin, Schmid, Lau, &Olkin, 2003), we have not performed additional analyses using adjusted data. However, thenature of the bias is such that our results would tend to underestimate the mean HR rather
Shor et al. Page 11
Soc Sci Med. Author manuscript; available in PMC 2014 January 06.
NIH
-PA Author Manuscript
NIH
-PA Author Manuscript
NIH
-PA Author Manuscript
than overestimate it. The direction of the regression coefficients indicates that it is unlikelythat publication bias caused an overestimation of the risk associated with marital dissolution.
A second limitation of the present study lies in the incomplete nature of the possibleconfounding and moderating variables included in the analysis. While the heterogeneity testresults support the conclusion that a substantial portion of data variability has beenaccounted for, the continued need for random effects models indicates that importantconfounding and/or moderating factors were excluded from the models. A major goal of thisresearch was to evaluate such factors, but additional research is clearly needed to furtheridentify the sources of the data heterogeneity we observed.
A third limitation stems from the nature of the data. Most of the research on maritaldissolution and mortality was conducted in the developed world. Relatively few publicationsused data from East Asia, the Middle East, and South America, and none used data fromAfrica. This limitation has two important consequences. First, the sample sizes in thedeveloping world are small and any conclusions about the difference between the developedand the developing world should be made with caution. Second, since most of the resultscome from the developed countries they should not be extrapolated to populations indeveloping countries.
ConclusionIn conclusion, this study shows that marital dissolution is associated with a substantiallyincreased risk of death among broad segments of the population. However, importantmoderators of this association – such as gender, age, and general health status – must becarefully considered in order to better understand this association. Future research shouldfocus on understanding the health, socio-economic and behavioral factors through whichthis association is manifested, especially for younger men and women. Further research indeveloping countries is also needed to determine the magnitude of the risk. Since themajority of the world’s population resides in developing nations, much work remains to bedone.
Supplementary MaterialRefer to Web version on PubMed Central for supplementary material.
AcknowledgmentsThe authors are grateful for the support provided by Grant HL-76857 from the National Institutes of Health. Thefunding source had no involvement in the collection, analysis and interpretation of the data, in the writing of thereport, and in the decision to submit the paper for publication.
ReferencesAhs AMH, Westerling R. Mortality in Relation to Employment Status during Different Levels of
Unemployment. Scandinavian Journal of Public Health. 2006; 34(2):159–167. [PubMed: 16581708]
Alavinia SM, Burdorf A. Unemployment and Retirement and Ill-Health: A Cross-Sectional AnalysisAcross European Countries. International Archives of Occupational and Environmental Health.2008; 82(1):39–45. [PubMed: 18264715]
Amato PR, Rogers SJ. A Longitudinal Study of Marital Problems and Subsequent Divorce. Journal ofMarriage and the Family. 1987; 59:612–624.
Artnik B, Vidmar G, Javornik J, Laaser U. Premature Mortality in Slovenia in Relation to SelectedBiological, Socioeconomic, and Geographical Determinants. Croatian Medical Journal. 2006; 47(1):103–113. [PubMed: 16489703]
Shor et al. Page 12
Soc Sci Med. Author manuscript; available in PMC 2014 January 06.
NIH
-PA Author Manuscript
NIH
-PA Author Manuscript
NIH
-PA Author Manuscript
Bagiella E, Hong V, Sloan RP. Religious Attendance as a Predictor of Survival in the EPESE Cohorts.International Journal of Epidemiology. 2005; 34(2):443–451. [PubMed: 15659472]
Bambra C, Eikemo T. Welfare State Regimes, Unemployment and Health: A Comparative Study ofthe Relationship Between Unemployment and Self-Reported Health in 23 European Countries.Journal of Epidemiology and Community Health. 2009; 63(2):92–98. [PubMed: 18930981]
Ben-Shlomo Y, Smith GD, Shipley M, Marmot MG. Magnitude and Causes of Mortality Differencesbetween Married and Unmarried Men. Journal of Epidemiology and Community Health. 1993;47(3):200–205. [PubMed: 8350032]
Berkman, LF. The Relationship of Social Networks and Social Support to Morbidity and Mortality. In:Cohen, S.; Syme, SL., editors. Social Support and Health. New York: Academic Press; 1985. p.240-259.
Berkson J. Mortality and Marital Status: Reflections on the Derivation of Etiology from Statistics.American Journal of Epidemiology. 1962; 52(8):1318–1329.
Berman NG, Parker RA. Meta-Analysis: Neither Quick nor Easy. BMC Medical ResearchMethodology. 2002; 2:10–18. [PubMed: 12171604]
Berntsen KN. Trends in total and cause-specific mortality by marital status among elderly Norwegianmen and women. BMC Public Health. 2011; 11
Blazer DG. Social Support and Mortality in an Elderly Community Population. American Journal ofEpidemiology. 1982; 115(5):684–694. [PubMed: 7081200]
Booth A, Amaro PR. Divorce and Psychological Stress. Journal of Health and Social Behavior. 1991;32:396–407. [PubMed: 1765629]
Breeze E, Sloggett A, Fletcher A. Socioeconomic and Demographic Predictors of Mortality andInstitutional Residence among Middle Aged and Older People: Results from the LongitudinalStudy. Journal of Epidemiology and Community Health. 1999; 53(12):765–774. [PubMed:10656085]
Brockmann H, Klein T. Family Biography and Mortality in East and West Germany. Zeitschrift FurGerontologie Und Geriatrie. 2002; 35(5):430–440. [PubMed: 12395237]
Brockmann H, Klein T. Love and Death in Germany: The Marital Biography and its Effect onMortality. Journal of Marriage and the Family. 2004; 66(3):567–581.
Burgoa M, Regidor E, Rodriguez C, Gutierrez-Fisac JL. Mortality by Cause of Death and MaritalStatus in Spain. European Journal of Public Health. 1998; 8(1):37–42.
Cherlin AJ, Chase-Landsdale PL, McRae C. Effects of Parental Divorce on Mental Health Throughoutthe Life Course. American Sociological Review. 1998; 63:239–249.
Cheung YB. Marital Status and Mortality in British Women: A Longitudinal Study. InternationalJournal of Epidemiology. 2000; 29(1):93–99. [PubMed: 10750609]
Choi H, Marks NF. Socioeconomic Status, Marital Status Continuity and Change, Marital Conflict,and Mortality. Journal of Aging and Health. 2011; 23(4):714–742. [PubMed: 21273502]
Comstock GW, Tonascia JA. Education and Mortality in Washington County, Maryland. Journal ofHealth and Social Behavior. 1977 Mar.18:54–61. [PubMed: 641331]
Cornell LL. Intergenerational Relationships, Social Support, and Mortality. Social Forces. 1992; 71(1):53–62.
Costa G, Segnan N. Unemployment and Mortality. British Medical Journal. 1987 Jun.294:1550–1551.[PubMed: 3111631]
Doblhammer G. Reproductive History and Mortality Later in Life: A Comparative Study of Englandand Wales and Austria. Population Studies - A Journal of Demography. 2000; 54(2):169–176.
Duncan GJ, Hoffman SD. A Reconsideration of the Economic Consequences of Marital Dissolution.Demography. 1985; 22(4):485–497. [PubMed: 4076480]
Dupre ME, Beck AN, Meadows SO. Marital Trajectories and Mortality Among US Adults. AmericanJournal of Epidemiology. 2009; 170(5):546–555. [PubMed: 19584130]
Durkheim, E. Suicide. Glencoe: IL: Free Press; 1951 [1897].
Dzurova D. Mortality Differentials in the Czech Republic during the Post-1989 Socio-politicalTransformation. Health and Place. 2000; 6(4):351–362. [PubMed: 11027960]
Shor et al. Page 13
Soc Sci Med. Author manuscript; available in PMC 2014 January 06.
NIH
-PA Author Manuscript
NIH
-PA Author Manuscript
NIH
-PA Author Manuscript
Ebrahim S, Wannamethee G, McCallum A, Walker M, Shaper AG. Marital Status, Change in MaritalStatus, and Mortality in Middle-aged British Men. American Journal of Epidemiology. 1995;142(8):834–842. [PubMed: 7572960]
Egger M, Davey-Smith G. Meta-analysis: Bias in Location and Selection of Studies. British MedicalJournal. 1998; 316:61–66. [PubMed: 9451274]
Ensel WM, Lin N. Age, the Stress Process, and Physical Disease. Journal of Aging and Health. 2000;12(2):139–168. [PubMed: 11010694]
Ensel WM, Peek KM, Lin N, Lai G. Stress in the Life Course: A Life History Approach. Journal ofAging and Health. 1996; 8(3):389–416. [PubMed: 10165981]
Fergusson DM, Horwood LJ, Shannon FT. A Proportional Hazards Model of Family Breakdown.Journal of Marriage and Family. 1984; 46:539–549.
Glick PC, Lin SL. Remarriage After Divorce: Recent Changes and Demographic Variations.Sociological Perspectives. 1987; 30(2):162–179. [PubMed: 12315138]
Goldman N, Hu YR. Excess Mortality among the Unmarried: A Case Study of Japan. Social Science& Medicine. 1993; 36(4):533–546. [PubMed: 8434277]
Goldman N, Korenman S, Weinstein R. Marital Status and Health among the Elderly. Social Science& Medicine. 1995; 40(12):1717–1730. [PubMed: 7660185]
Goodwin JS, Hunt WC, Key CR, Samet JM. The Effect of Marital Status on Stage, Treatment, andSurvival of Cancer Patients. Journal of the American Medical Association. 1987; 258(21):3125–3130. [PubMed: 3669259]
Gottman JM, Levenson RM. Marital Processes Predictive of Later Dissolution: Behavior, Phsiology,and Health. Journal of Personality and Social Psychology. 1992; 63(2):221–223. [PubMed:1403613]
Gove WR. Sex, Marital Status, and Mortality. American Journal of Sociology. 1973; 79(1):45–67.
Granlund D, Chuc NT, Phuc HD, Lindholm L. Inequality in mortality in Vietnam during a period ofrapid transition. Social Science & Medicine. 2010; 70(2):232–239. [PubMed: 19879682]
Grundy E, Kravdal O. Reproductive History and Mortality in Late Middle Age among Norwegian Menand Women. American Journal of Epidemiology. 2008; 167(3):271–279. [PubMed: 18000019]
Grundy EMD, Tomassini C. Marital history, health and mortality among older men and women inEngland and Wales. BMC Public Health. 2010; 10
Hajdu P, McKee M, Bojan F. Changes in Premature Mortality Differentials by Marital Status inHungary and in England and Wales. European Journal of Public Health. 1995; 5(4):259–264.
Hammarstrom A. Health Consequences of Youth Unemployment: Review from a Gender Perspective.Social Science and Medicine. 1994; 38(5):699–709. [PubMed: 8171348]
Hank K. Childbearing history, later-life health, and mortality in Germany. Population Studies-aJournal of Demography. 2010; 64(3):275–291.
Hansen HT. Unemployment and Marital Dissolution. European Sociological Review. 2005; 21(2):135–148.
Hayward MD, Gorman BK. The Long Arm of Childhood: The Influence of Early-life SocialConditions on Men’s Mortality. Demography. 2004; 41(1):87–107. [PubMed: 15074126]
Helweg-Larsen M, Kjoller M, Thoning H. Do Age and Social Relations Moderate the Relationshipbetween Self-rated Health and Mortality among Adult Danes? Social Science & Medicine. 2003;57(7):1237–1247. [PubMed: 12899907]
Hemstrom O. Is Marriage Dissolution Linked to Differences in Mortality Risks for Men and Women?Journal of Marriage and the Family. 1996; 58(2):366–378.
Henrard JC. Cultural Problems of Aging Especially Regarding Gender and Intergenerational Equity.Social Science & Medicine. 1996; 43:667–680. [PubMed: 8870131]
Henretta JC. Early Childbearing, Marital Status, and Women’s Health and Mortality after Age 50.Journal of Health & Social Behavior. 2007; 48(3):254–266. [PubMed: 17982867]
Henretta JC. Lifetime Marital History and Mortality After Age 50. Journal of Aging and Health. 2010;22(8):1198–1212. [PubMed: 20660636]
Holden KC, Smock PJ. The Economic Costs of Marital Dissolution: Why Do Women Bear aDisproportionate Cost? Annual Review of Sociology. 1991; 17:51–78.
Shor et al. Page 14
Soc Sci Med. Author manuscript; available in PMC 2014 January 06.
NIH
-PA Author Manuscript
NIH
-PA Author Manuscript
NIH
-PA Author Manuscript
Horwitz O, Weber J. Marital Status and Mortality. I. Sygeplejersken. 1974a; 74(10):10–14. [PubMed:4494421]
Horwitz O, Weber J. Marital Status and Mortality. II. Sygeplejersken. 1974b; 74(11):20–25. [PubMed:4494430]
Huedo-Medina TB, Sanchez-Meca J, Marin-Martinez F. Assessing Heterogeneity in Meta-analysis: QStatistic or I2 Index? Psychological Methods. 2006; 11(2):193–206. [PubMed: 16784338]
Hughes ME, Waite LJ. Marital Biography and Health at Mid-Life. Journal of Health and SocialBehavior. 2009; 50(3):344–358. [PubMed: 19711810]
Hurt LS, Ronsmans C, Saha S. Effects of Education and Other Socioeconomic Factors on Middle AgeMortality in Rural Bangladesh. Journal of Epidemiology and Community Health. 2004; 58:315–320. [PubMed: 15026446]
Ikeda A, Iso H, Toyoshima H, Fujino Y, Mizoue T, Yoshimura T, et al. Marital Status and Mortalityamong Japanese Men and Women: The Japan Collaborative Cohort Study. BMC Public Health.2007; 7:73. [PubMed: 17484786]
Iribarren C, Jacobs DR, Kiefe CI, Lewis CE, Matthews KA, Roseman JM, et al. Causes andDemographic, Medical, Lifestyle and Psychosocial Predictors of Premature Mortality: TheCARDIA Study. Social Science & Medicine. 2005; 60(3):471–482. [PubMed: 15550296]
ISI Web of Knowledge. Journal Citation Reports. 2009. http://wokinfo.com/products_tools/analytical/jcr/
Iversen L, Andersen O, Andersen PK, Christoffersen K, Keiding N. Unemployment and Mortality inDenmark, 1970-80. British Medical Journal. 1987; 295(6603):879–884. [PubMed: 3119084]
Iwasaki M, Otani T, Sunaga R, Miyazaki H, Xiao L, Wang N, et al. Social Networks and MortalityBased on the Komo-Ise Cohort Study in Japan. International Journal of Epidemiology. 2002;31(6):1208–1218. [PubMed: 12540724]
Janlert U. Unemployment as a Disease and Diseases of the Unemployed. Scandinavian Journal ofWork and Environmental Health. 1997; 23(Supplement 3):79–83.
Jenkinson CM, Madeley RJ, Mitchell JRA, Turner ID. The Influence of Psychosocial Factors onSurvival after Myocardial Infarction. Public Health. 1993; 107(5):305–317. [PubMed: 8248465]
Jin RL, Shah CP, Svoboda TJ. The Impact of Unemployment on Health: A Review of the Evidence.Canadian Medical Association Journal. 1995; 153(5):529–540. [PubMed: 7641151]
Johansen C, Schou G, Soll-Johanning H, Mellemgaard A, Lynge E. Influence of Marital Status onSurvival from Colon and Rectal Cancer in Denmark. British Journal of Cancer. 1996; 74(6):985–988. [PubMed: 8826871]
Johnson NJ, Backlund E, Sorlie PD, Loveless CA. Marital Status and Mortality: The NationalLongitudinal Mortality Study. Annals of Epidemiology. 2000; 10(4):224–238. [PubMed:10854957]
Joung IMA, Glerum JJ, van Poppel JWPF, Mackenbach JP. The Contribution of Specific Causes ofDeath to Mortality Differences by Marital Status in the Netherlands. European Journal of PublicHealth. 1996; 6(2):142–149.
Kalediene R, Petrauskiene J, Starkuviene S. Inequalities in Mortality by Marital Status during Socio-economic Transition in Lithuania. Public Health. 2007 May.121:385–392. [PubMed: 17336352]
Kalmijn M. Gender Differences in the Effects of Divorce, Widowhood and Remarriage onIntergenerational Support: Does Marriage Protect Fathers? Social Forces. 2007; 85(3):1079–1104.
Kaplan RM, Kronick RG. Marital Status and Longevity in the United States Population. Journal ofEpidemiology and Community Health. 2006; 60(9):760–765. [PubMed: 16905719]
Kaufman G, Uhlenberg P. Effects of Life Course Transitions on the Quality of Relationships BetweenAdult Children and their Parents. Journal of Marriage and Family. 1998; 60:924–938.
Keller AZ. Survivorship with Mouth and Pharynx Cancer and their Association with Cirrhosis of theLiver, Marital Status, and Residence. American Journal of Public Health Nations Health. 1969;59(7):1139–1153.
Kessler RC, Essex M. Marital Status and Depression: The Importance of Coping Resources. SocialForces. 1982; 61(2):484–507.
Shor et al. Page 15
Soc Sci Med. Author manuscript; available in PMC 2014 January 06.
NIH
-PA Author Manuscript
NIH
-PA Author Manuscript
NIH
-PA Author Manuscript
Kohler I, Kohler HP. The Effect of Marriage on Mortality: Selection or Protection? Evidence fromDanish Twins using Fixed-Effect Survival Models. Unpublished.
Kohler IV, Preston SH. Ethnic and religious differentials in Bulgarian mortality, 1993-98. PopulationStudies-a Journal of Demography. 2011; 65(1):91–113.
Kolip P. The Association between Gender, Family Status and Mortality. Journal of Public Health.2005 Nov.13:309–312.
Kraus A, Lilienfeld A. Some Epidemiological Aspects of the High Mortality Rate in the YoungWidowed Group. Journal of Chronic Diseases. 1959; 10(3):207–217. [PubMed: 14411769]
Kravdal O. Children, Family and Cancer Survival in Norway. International Journal of Cancer. 2003;105(2):261–266.
Kravdal O. A Fixed-effects Multilevel Analysis of how Community Family Structure AffectsIndividual Mortality in Norway. Demography. 2007; 44(3):519–537. [PubMed: 17913009]
Kroenke CH, Kubzansky LD, Schernhammer ES, Holmes MD, Kawachi I. Social Networks, SocialSupport, and Survival after Breast Cancer Diagnosis. Journal of Clinical Oncology. 2006; 24(7):1105–1111. [PubMed: 16505430]
Kumle, M.; Lund, E. Patterns of Childbearing and Mortality in Norwegian Women. A 20-year Follow-up of Women Aged 40-96 in the 1970 Norwegian Census. In: Robine, J-M.; Kirkwood, TBL.;Allard, M., editors. Sex and Longevity: Sexuality, Gender, Reproduction, Parenthood. Berlin:Springer; 2000. p. 117-128.
Laaksonen M, Tarkiainen L, Martikainen P. Housing wealth and mortality: A register linkage study ofthe Finnish population. Social Science & Medicine. 2009; 69(5):754–760. [PubMed: 19604611]
Lillard LA, Panis CWA. Marital Status and Mortality: The Role of Health. Demography. 1996; 33(3):313–327. [PubMed: 8875065]
Lillard LA, Waite LJ. Til Death Do Us Part - Marital Disruption and Mortality. American Journal ofSociology. 1995; 100(5):1131–1156. MANUSCRIPT.
Lipsey, MW.; Wilson, DB. Practical Meta-Analysis. Thousand Oaks, CA: Sage; 2001.
Litwak E, Messeri P, Wolfe S, Gorman S, Silverstein M, Guilarte M. Organizational Theory, SocialSupports, and Mortality-Rates - a Theoretical Convergence. American Sociological Review. 1989;54(1):49–66.
Liu H. Till Death Do Us Part: Marital Status and US Mortality Trends, 1986-2000. Journal ofMarriage and Family. 2009; 71(5):1158–1173.
Liu LJ, Sullivan DH. Relationship between Social Demographic Factors and Survival Within OneYear of Hospital Discharge in a Cohort of Elderly Male Patients. Journal of Epidemiology. 2003;13(4):203–210. [PubMed: 12934963]
Lye DN. Adult Child-Parent Relationships. Annual Review of Sociology. 1996; 22:79.
Lye DN, Klepinger DH, Hyle PD, Nelson A. Childhood Living Arrangements and Adult Children’sRelations with their Parents. Demography. 1995; 32:261–280. [PubMed: 7664964]
Makuc, DM.; Feldman, JJ.; Kleinman, JC.; Pierre, MBJ. Sociodemographic Differentials in Mortality.In: Cornoni-Huntley, J.; Huntley, RR.; Feldman, JJ., editors. Health Status and Well-being of theElderly: National Health and Nutrition Examination Survey-I Epidemiologic Follow-up Study.New York: Oxford University Press; 1990. p. 155-171.
Malyutina S, Bobak M, Simonova G, Gafarov V, Nikitin Y, Marmot M. Education, Marital Status, andTotal and Cardiovascular Mortality in Novosibirsk, Russia: A Prospective Cohort Study. Annals ofEpidemiology. 2004; 14(4):244–249. [PubMed: 15066603]
Manor O, Eisenbach Z, Israeli A, Friedlander Y. Mortality Differentials among Women: The IsraelLongitudinal Mortality Study. Social Science & Medicine. 2000; 51(8):1175–1188. [PubMed:11037208]
Manor O, Eisenbach Z, Peritz E, Friedlander Y. Mortality Differentials among Israeli Men. AmericanJournal of Public Health. 1999; 89(12):1807–1813. [PubMed: 10589307]
Manzoli L, Villari P, Pirone GM, Boccia A. Marital Status and Mortality in the Elderly: A SystematicReview and Meta-Analysis. Social Science and Medicine. 2007; 64(1):77–94. [PubMed:17011690]
Shor et al. Page 16
Soc Sci Med. Author manuscript; available in PMC 2014 January 06.
NIH
-PA Author Manuscript
NIH
-PA Author Manuscript
NIH
-PA Author Manuscript
Martelin, T. Socio-demographic Differentials in Mortality at Older Ages in Finland. In: Caselli, G.;Lopez, AD., editors. Health and Mortality among Elderly Population. New York: Clarendon Press;1996. p. 112-134.
Martelin T, Koskinen S, Valkonen T. Sociodemographic Mortality Differences among the Oldest Oldin Finland. Journals of Gerontology Series B-Psychological Sciences and Social Sciences. 1998;53(2):S83–S90.
Martikainen PT. Unemployment and Mortality among Finnish Men 1981-85. British Medical Journal.1990; 301(6749):407–411. [PubMed: 2282395]
Martikainen PT. Womens Employment, Marriage, Motherhood and Mortality - a Test of the MultipleRole and Role Accumulation Hypotheses. Social Science and Medicine. 1995; 40(2):199–212.[PubMed: 7899932]
Martikainen PT, Martelin T, Nihtila E, Majamaa K, Koskinen S. Differences in Mortality by MaritalStatus in Finland from 1976 to 2000: Analyses of Changes in Marital-status Distribution, Socio-demographic and Household Composition, and Cause of Death. Population Studies - A Journalof Demography. 2005; 59(1):99–115.
Mastekaasa A. Psychological Well-Being and Marital Dissolution. Journal of Family Issues. 1994;15(2):208–228.
Matthews KA, Gump BB. Chronic Work Stress and Marital Dissolution Increase Risk of PosttrialMortality in Men from the Multiple Risk Factor Intervention Trial. Archives of InternalMedicine. 2002; 162(3):309–315. [PubMed: 11822923]
McManus PA, DiPrete TA. Losers and Winners: The Financial Consequences of Separation andDivorce for Men. American Sociological Review. 2001; 66:246–268.
Mellstrom D, Nilsson A, Oden A, Rundgren A, Svanborg A. Mortality among the Widowed inSweden. Scandinavian Journal of Social Medicine. 1982; 10(2):33–41. [PubMed: 7178869]
Mendes De Leon CF, Appels WPMA, Otten FWJ, Schouten EGW. Risk of Mortality and CoronaryHeart Disease by Marital Status in Middle-aged Men in the Netherlands. International Journal ofEpidemiology. 1992; 21(3):460–466. [PubMed: 1634306]
Metayer C, Coughlin SS, McCarthy EP. Marital Status as a Predictor of Survival in Idiopathic DilatedCardiomyopathy: The Washington, DC Dilated Cardiomyopathy Study. European Journal ofEpidemiology. 1996; 12(6):573–582. [PubMed: 8982616]
Mollica RF, Srajlic N, Chernoff M, Lavelle J, Vukovic IS, Massagli MP. Longitudinal Study ofPsychiatric Symptoms, Disability, Mortality, and Emigration among Bosnian Refugees. Journalof the American Medical Association. 2001; 286(5):546–554. [PubMed: 11476656]
Molloy GJ, Stamatakis E, Randall G, Hamer M. Marital Status, Gender and Cardiovascular Mortality:Behavioural, Psychological Distress and Metabolic Explanations. Social Science & Medicine.2009; 69:223–228. [PubMed: 19501442]
Moos RH, Brennan PL, Mertens JR. Mortality Rates and Predictors of Mortality among Late Middle-aged and Older Substance-abuse Patients. Alcoholism - Clinical and Experimental Research.1994; 18(1):187–195.
Moreno SG, Sutton AJ, Ades AE, Stanley TD, Abrams KR, Peters JL, et al. Assessment ofRegression-based Methods to Adjust for Publication Bias through a Comprehensive Study. BMCMedical Research Methodology. 2009; 9(2)
Moser KA, Goldblatt PO, Fox AJ, Jones DR. Unemployment and Mortality: Comparison of the 1971and 1981 Longitudinal Study Census Samples. British Medical Journal. 1987; 294(6564):86–90.[PubMed: 3105667]
Mudar P, Leonard KE, Soltysinski K. Discrepant Substance Use and Marital Functioning in NewlywedCouples. Journal of Consulting and Clinical Psychology. 2001; 69(1):130–134. [PubMed:11302271]
Murphy G, Athanasou JA. The Effect of Unemployment on Mental Health. Journal of Occupationaland Organizational Psychology. 1999; 72:83–99.
Nagata C, Takatsuka N, Shimizu H. The Impact of Changes in Marital Status on the Mortality ofElderly Japanese. Annals of Epidemiology. 2003; 13(4):218–222. [PubMed: 12684186]
Shor et al. Page 17
Soc Sci Med. Author manuscript; available in PMC 2014 January 06.
NIH
-PA Author Manuscript
NIH
-PA Author Manuscript
NIH
-PA Author Manuscript
Nilsson PM, Nilsson JA, Ostergren PO, Berglund G. Social Mobility, Marital Status, and MortalityRisk in an Adult Life Course Perspective: The Malmo Preventive Project. Scandinavian Journalof Public Health. 2005; 33(6):412–423. [PubMed: 16332606]
Norekval TM, Fridlund B, Rokne B, Segadal L, Wentzel-Larsen T, Nordrehaug JE. Patient-reportedoutcomes as predictors of 10-year survival in women after acute myocardial infarction. Healthand Quality of Life Outcomes. 2010; 8
Nybo H, Petersen HC, Gaist D, Jeune B, Andersen K, McGue M, et al. Predictors of Mortality in 2,249Nonagenarians - The Danish 1905-cohort Survey. Journal of the American Geriatrics Society.2003; 51(10):1365–1373. [PubMed: 14511155]
Ortmeyer, CE. Variation in Mortality, Morbidity, and Health Care by Marital Status. In: Erhardt, CL.;Berlin, JE., editors. Mortality and Morbidity in the United States. Cambridge, MA: HarvardUniversity Press; 1974. p. 159-188.
Parlin LI, Johnson JS. Marital Status, Life-strains and Depression. American Sociological Review.1977; 42(5):704–715. [PubMed: 931191]
Patel MK, Patel DA, Lu M, Elshaikh MA, Munkarah A, Movsas B. Impact of Marital Status onSurvival Among Women With Invasive Cervical Cancer: Analysis of Population-BasedSurveillance, Epidemiology, and End Results Data. Journal of Lower Genital Tract Disease.2010; 14(4):329–338. [PubMed: 20885161]
Peters JL, Sutton AJ, Jones DR, Abrams KR, Rushton L. Comparison of Two Methods to DetectPublication Bias in Meta-analysis. Journal of the American Medical Association. 2006; 295(6):676–680. [PubMed: 16467236]
Rahman MO. Excess Mortality for the Unmarried in Rural Bangladesh. International Journal ofEpidemiology. 1993; 22(3):445–456. [PubMed: 8359960]
Rahman MO. The Effects of Spouses on the Mortality of Older People in Rural Bangladesh. HealthTransition Review. 1997; 7:1–12.
Regidor E, Calle ME, Dominguez V, Navarro P. [Mortality by Social and Economic Characteristics:The Mortality Study of the Autonomous Community of Madrid, Spain]. Medicina Clinica(Barcelona). 2001; 116(19):726–731.
Rendall MS, Weden MM, Favreault MM, Waldron H. The Protective Effect of Marriage for Survival:A Review and Update. Demography. 2011; 48(2):481–506. [PubMed: 21526396]
Roelfs DJ, Shor E, Davidson KW, Schwartz JE. War-Related Stress Exposure and Mortality: A Meta-Analysis. The International Journal of Epidemiology. 2010; 39:1499–1509.
Roelfs DJ, Shor E, Davidson KW, Schwartz JE. Losing Life and Livelihood: A Systematic Reviewand Meta-Analysis of Unemployment and All-Cause Mortality. Social Science & Medicine.2011; 72(6):840–854. [PubMed: 21330027]
Roelfs DJ, Shor E, Kalish R, Yogev T. The Rising Relative Risk of Mortality among Singles: Meta-analysis and Meta-regression. American Journal of Epidemiology. 2011; 74(4):379–389.[PubMed: 21715646]
Rogers RG. Marriage, Sex, and Mortality. Journal of Marriage and the Family. 1995; 57(2):515–526.
Rosengren A, Orthgomer K, Wedel H, Wilhelmsen L. Stressful Life Events, Social Support, andMortality in Men Born in 1933. British Medical Journal. 1993; 307(6912):1102–1105. [PubMed:8251807]
Rosengren A, Wedel H, Wilhelmsen L. Marital Status and Mortality in Middle-Aged Swedish Men.American Journal of Epidemiology. 1989; 129(1):54–64. [PubMed: 2910072]
Ross CE, Mirowsky J, Goldsteen K. The Impact of the Family on Health:Decade in Review. Journal ofMarriage and the Family. 1990; 52:1059–1078.
Rushing WA. Marital Status and Mental Disorder: Evidence on Favor of a Behavioral Model. SocialForces. 1979; 58(2):540–556.
Samuelsson G, Dehlin O. Family Network and Mortality - Survival Chances Through the Life-Span ofan Entire Age Cohort. International Journal of Aging and Human Development. 1993; 37(4):277–295. [PubMed: 8307647]
Schaefer C, Coyne JC, Lazarus RS. The Health-Related Functions of Social Support. Journal ofBehavioral Medicine. 1981; 4(4):381–406. [PubMed: 7338894]
Shor et al. Page 18
Soc Sci Med. Author manuscript; available in PMC 2014 January 06.
NIH
-PA Author Manuscript
NIH
-PA Author Manuscript
NIH
-PA Author Manuscript
Sheps MC. Marriage and Mortality. American Journal of Public Health. 1961; 51(4):547–555.[PubMed: 18017837]
Shkolnikov VM, Jasilionis D, Andreev EM, Jdanov DA, Stankuniene V, Ambrozaltiene D. Linkedversus Unlinked Estimates of Mortality and Length of Life by Education and Marital Status:Evidence from the First Record Linkage Study in Lithuania. Social Science & Medicine. 2007;64(7):1392–1406. [PubMed: 17196723]
Shor E, Roelfs DJ, Curreli M, Clemow L, Burg M, Schwartz JE. Widowhood and Mortality: A Meta-analysis and Meta-regression. Demography. 2012 In Press.
Shurtleff D. Mortality and Marital Status. Public Health Reports. 1955; 70(3):248–252. [PubMed:14357544]
Shurtleff D. Mortality among the Married. Journal of the American Geriatrics Society. 1956; 4(7):654–666. [PubMed: 13331733]
Singh GK, Siahpush M. All-Cause and Cause-Specific Mortality of Immigrants and Native Born in theUnited States. American Journal of Public Health. 2001; 91(3):392–399. [PubMed: 11236403]
Singh GK, Siahpush M. Ethnic-immigrant Differentials in Health Behaviors, Morbidity, and Cause-specific Mortality in the United States: An Analysis of Two National Data Bases. HumanBiology. 2002; 74(1):83–109. [PubMed: 11931581]
Smith KR, Waitzman NJ. Double Jeopardy - Interaction Effects of Marital and Poverty Status on theRisk of Mortality. Demography. 1994; 31(3):487–507. [PubMed: 7828768]
Smith KR, Zick CD. Linked Lives, Dependent Demise - Survival Analysis of Husbands and Wives.Demography. 1994; 31(1):81–93. [PubMed: 8005344]
Smock PJ. The Economic Costs of Marital Disruption for Young Women Over the Past Two Decades.Demography. 1993; 30(3):353–371. [PubMed: 8405603]
Smock PJ. Gender and the Short-Run Economic Consequences of Marital Disruption. Social Forces.1994; 73(1):243–262.
Smock PJ, Manning WD, Gupta S. The Effect of Marriage and Divorce on Women’s Economic Well-being. American Sociological Review. 1999; 64:794–812.
Sorlie PD, Backlund E, Keller JB. U.S. Mortality by Economic, Demographic, and SocialCharacteristics - The National Longitudinal Mortality Study. American Journal of Public Health.1995; 85(7):949–956. [PubMed: 7604919]
Spence, NJ. Sociology. Tallahassee: Florida State University; 2006. Reproductive Patterns andWomen’s Later Life Health.
Terrin N, Schmid CH, Lau J, Olkin I. Adjusting for Bias in the Presence of Heterogeneity. Statistics inMedicine. 2003; 22:2113–2126. [PubMed: 12820277]
Thornton A, Rodgers W. The Influence of Individual and Historical Time on Marital Dissolution.Demography. 1987; 24:1–22. [PubMed: 3556685]
Tsai SL, Lan CF, Lee CH, Huang N, Chou YJ. Involuntary Unemployment and Mortality in Taiwan.Journal of the Formosan Medical Association. 2004; 103:900–907. [PubMed: 15624038]
Tucker JS, Friedman HS, Schwartz JE, Criqui MH, Tomlinson-Keasey C, Wingard DL, et al. ParentalDivorce: Effects on Individual Behavior and Longevity. Journal of Personality and SocialPsychology. 1997; 73(2):381–391. [PubMed: 9248055]
Tucker JS, Friedman HS, Wingard DL, Schwartz JE. Marital History at Midlife as a Predictor ofLongevity: Alternative Explanations to the Protective Effect of Marriage. Health Psychology.1996; 15(2):94–101. [PubMed: 8681925]
Uchino BN, Cacioppo JT, Kiecolt-Glaser JK. The Relationship between Social Support andPsychological Processes: A Review with Emphasis on Underlying Mechanisms and Implicationsfor Health. Psychological Bulletin. 1996; 119(3):488–531. [PubMed: 8668748]
Umberson D, Wortman CB, Kessler RC. Widowhood and Depression: Explaining Long-Term GenderDifferences in Volunerability. Journal of Health and Social Behavior. 1992; 33(1):10–24.[PubMed: 1619255]
Va P, Yang WS, Nechuta S, Chow WH, Cai H, Yang G, et al. Marital Status and Mortality amongMiddle Age and Elderly Men and Women in Urban Shanghai. PloS one. 2011; 6(11):e26600.[PubMed: 22073174]
Shor et al. Page 19
Soc Sci Med. Author manuscript; available in PMC 2014 January 06.
NIH
-PA Author Manuscript
NIH
-PA Author Manuscript
NIH
-PA Author Manuscript
Vallin J, Nizard A. Mortality by Marital Status: Marriage Selection or Marriage Protection. Population(French Edition). 1977 Sep.32:95–125.
van Poppel FWA, Joung IMA. Long-term Trends in Marital Status Mortality Differences in theNetherlands 1850-1970. Journal of Biosocial Science. 2001; 33(2):279–303. [PubMed:11284632]
Villingshoj M, Ross L, Thomsen BL, Johansen C. Does Marital Status and Altered Contact with theSocial Network Predict Colorectal Cancer Survival? European Journal of Cancer. 2006; 42(17):3022–3027. [PubMed: 17008092]
Wang L, Wilson SE, Stewart DB, Hollenbeak CS. Marital status and colon cancer outcomes in USSurveillance, Epidemiology and End Results registries: Does marriage affect cancer survival bygender and stage? Cancer Epidemiology. 2011; 35(5):417–422. [PubMed: 21466984]
Williams DR, Takeuchi DT, Adair RK. Marital Status and Psychiatric Disorders among Blacks andWhites. Journal of Health and Social Behavior. 1992; 33(140-157)
Williams K, Sassier S, Nicholson LM. For Better or for Worse: The Consequences of Marriage andCohabitation for Single Mothers. Social Forces. 2008; 86:1481–1512.
Williams K, Umberson D. Marital Status, Marital Transitions, and Health: A Gendered Life CoursePerspective. Journal of Health and Social Behavior. 2004; 45:81–98. [PubMed: 15179909]
Wyke S, Ford G. Competing Explanation for Associations between Marital Status and Health. SocialScience and Medicine. 2002; 34(5):523–532. [PubMed: 1604359]
Xavier AJ, d’Orsi E, Sigulem D, Ramos LR. Time orientation and executive functions in theprediction of mortality in the elderly: Epidoso study. Revista de Saude Publica. 2010; 44(1):148–158. [PubMed: 20140339]
Yamaguchi K, Kandel DB. The Influence of Spuses’ Behavior and Marital Dissolution on MarijuanaUse: Causation or Selection. Journal of Marriage and the Family. 1997; 59:22–36.
Zajacova A. Education, Gender, and Mortality: Does Schooling have the Same Effect on Mortality forMen and Women in the US? Social Science & Medicine. 2006; 63(8):2176–2190. [PubMed:16781036]
Zajacova A, Hummer RA. Gender differences in education effects on all-cause mortality for white andblack adults in the United States. Social Science & Medicine. 2009; 69(4):529–537. [PubMed:19589633]
Zhang J, Yu KF. What’s the Relative Risk? A Method of Correcting the Odds Ratio in Cohort Studiesof Common Outcomes. Journal of the American Medical Association. 1998; 280:1690–1691.[PubMed: 9832001]
Zick CD, Smith KR. Marital Transitions, Poverty, and Gender Differences in Mortality. Journal ofMarriage and the Family. 1991; 53(2):327–336.
Shor et al. Page 20
Soc Sci Med. Author manuscript; available in PMC 2014 January 06.
NIH
-PA Author Manuscript
NIH
-PA Author Manuscript
NIH
-PA Author Manuscript
Research Highlights
• The risk of early mortality among the divorced and separated is 30% higher thanthe risk among the married
• Divorced men are more at risk than divorced women, but the differencesbetween men and women decrease with age
• The harmful effects of marital dissolution are most pronounced during the firstfew years following the dissolution.
Shor et al. Page 21
Soc Sci Med. Author manuscript; available in PMC 2014 January 06.
NIH
-PA Author Manuscript
NIH
-PA Author Manuscript
NIH
-PA Author Manuscript
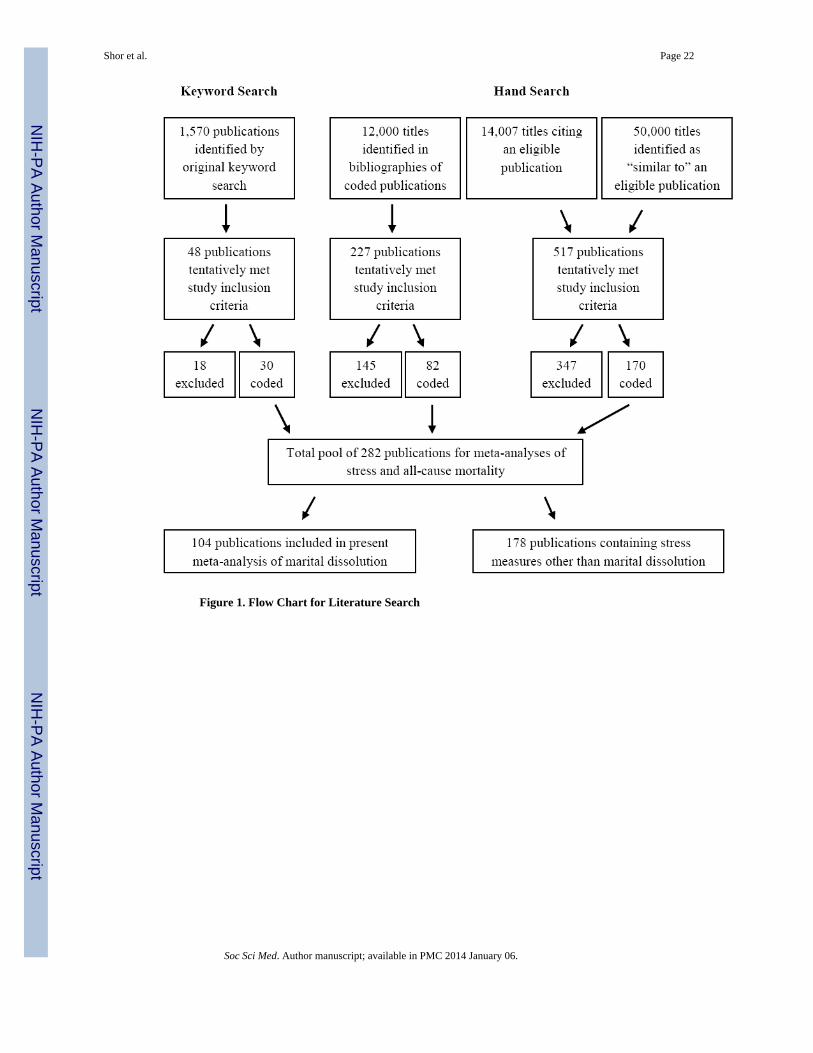
Figure 1. Flow Chart for Literature Search
Shor et al. Page 22
Soc Sci Med. Author manuscript; available in PMC 2014 January 06.
NIH
-PA Author Manuscript
NIH
-PA Author Manuscript
NIH
-PA Author Manuscript
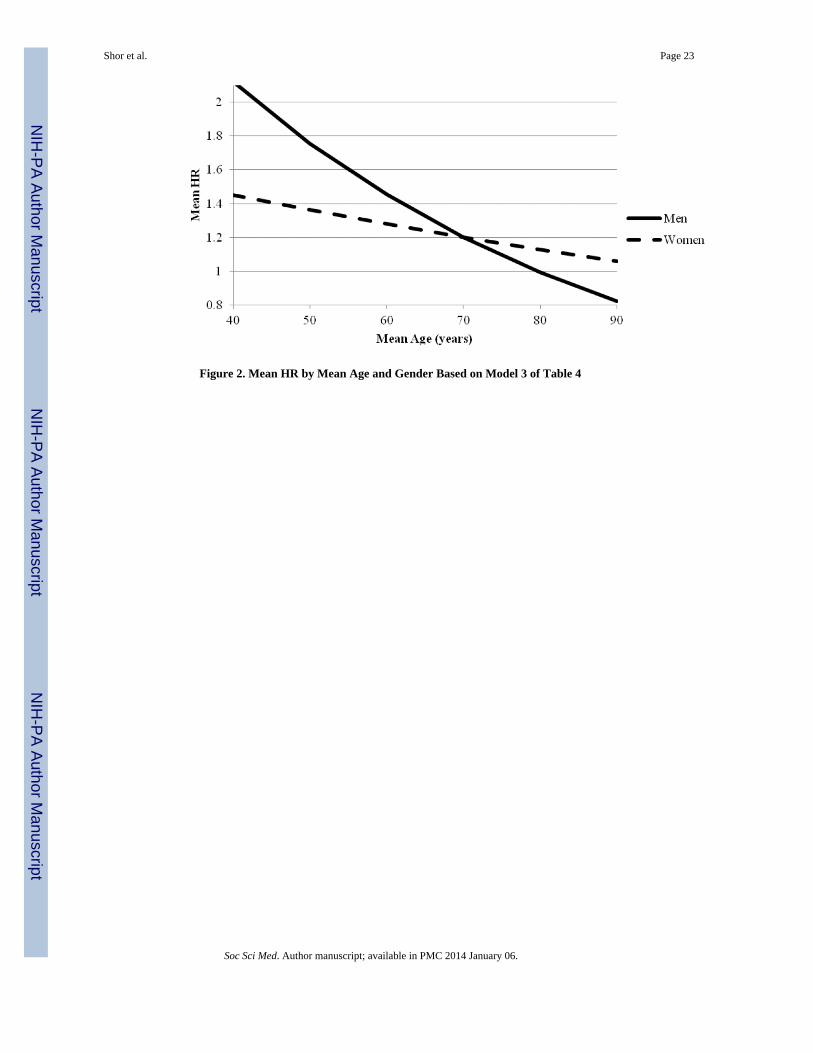
Figure 2. Mean HR by Mean Age and Gender Based on Model 3 of Table 4
Shor et al. Page 23
Soc Sci Med. Author manuscript; available in PMC 2014 January 06.
NIH
-PA Author Manuscript
NIH
-PA Author Manuscript
NIH
-PA Author Manuscript
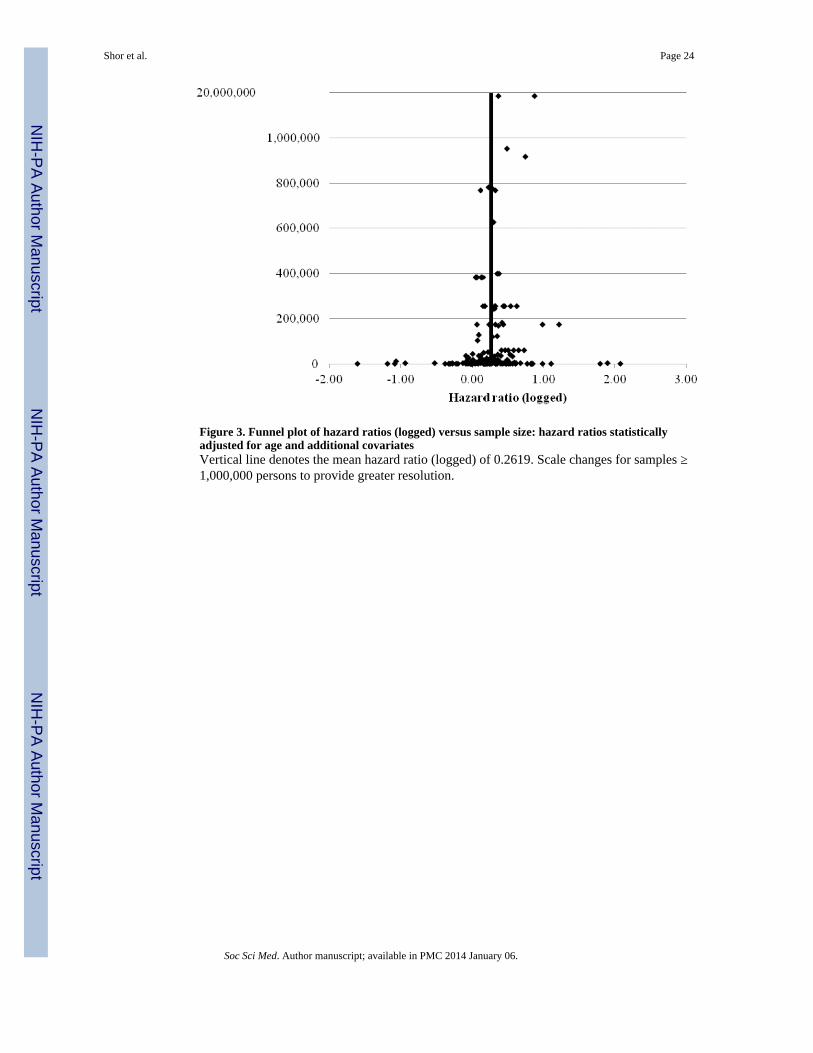
Figure 3. Funnel plot of hazard ratios (logged) versus sample size: hazard ratios statisticallyadjusted for age and additional covariatesVertical line denotes the mean hazard ratio (logged) of 0.2619. Scale changes for samples ≥1,000,000 persons to provide greater resolution.
Shor et al. Page 24
Soc Sci Med. Author manuscript; available in PMC 2014 January 06.
NIH
-PA Author Manuscript
NIH
-PA Author Manuscript
NIH
-PA Author Manuscript
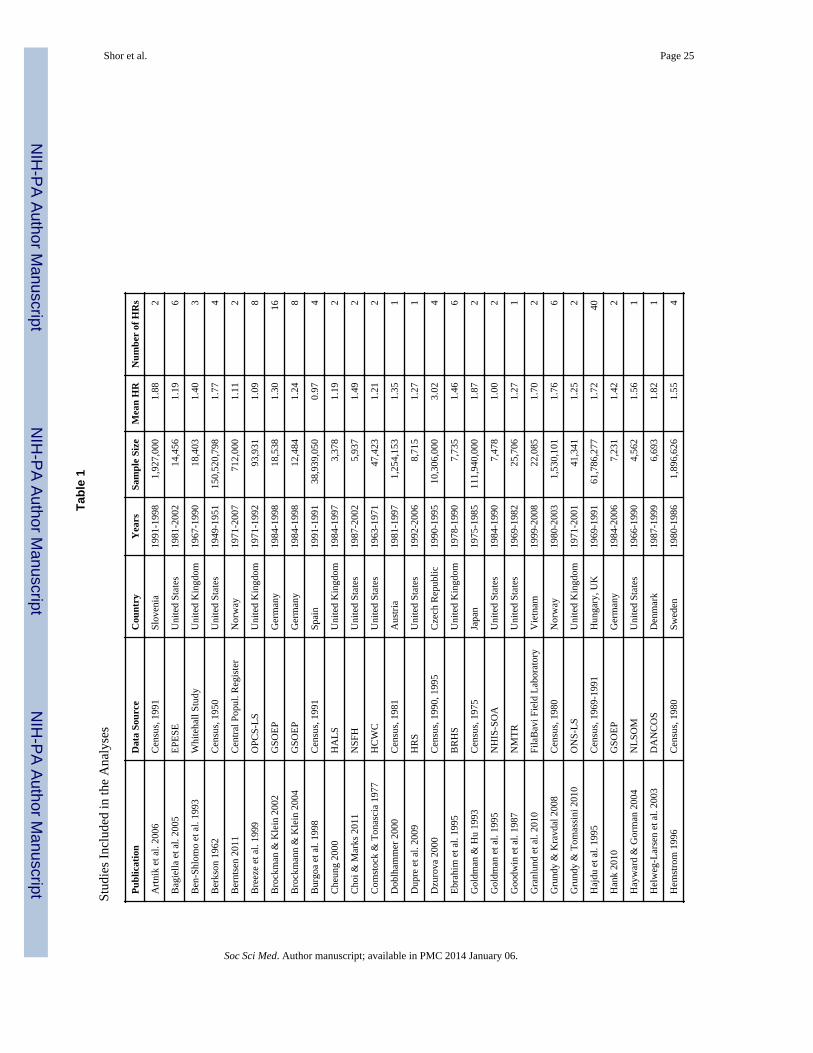
NIH
-PA Author Manuscript
NIH
-PA Author Manuscript
NIH
-PA Author Manuscript
Shor et al. Page 25
Tabl
e 1
Stud
ies
Incl
uded
in th
e A
naly
ses
Pub
licat
ion
Dat
a So
urce
Cou
ntry
Yea
rsSa
mpl
e Si
zeM
ean
HR
Num
ber
of H
Rs
Art
nik
et a
l. 20
06C
ensu
s, 1
991
Slov
enia
1991
-199
81,
927,
000
1.88
2
Bag
iella
et a
l. 20
05E
PESE
Uni
ted
Stat
es19
81-2
002
14,4
561.
196
Ben
-Shl
omo
et a
l. 19
93W
hite
hall
Stud
yU
nite
d K
ingd
om19
67-1
990
18,4
031.
403
Ber
kson
196
2C
ensu
s, 1
950
Uni
ted
Stat
es19
49-1
951
150,
520,
798
1.77
4
Ber
ntse
n 20
11C
entr
al P
opul
. Reg
iste
rN
orw
ay19
71-2
007
712,
000
1.11
2
Bre
eze
et a
l. 19
99O
PCS-
LS
Uni
ted
Kin
gdom
1971
-199
293
,931
1.09
8
Bro
ckm
an &
Kle
in 2
002
GSO
EP
Ger
man
y19
84-1
998
18,5
381.
3016
Bro
ckm
ann
& K
lein
200
4G
SOE
PG
erm
any
1984
-199
812
,484
1.24
8
Bur
goa
et a
l. 19
98C
ensu
s, 1
991
Spai
n19
91-1
991
38,9
39,0
500.
974
Che
ung
2000
HA
LS
Uni
ted
Kin
gdom
1984
-199
73,
378
1.19
2
Cho
i & M
arks
201
1N
SFH
Uni
ted
Stat
es19
87-2
002
5,93
71.
492
Com
stoc
k &
Ton
asci
a 19
77H
CW
CU
nite
d St
ates
1963
-197
147
,423
1.21
2
Dob
lham
mer
200
0C
ensu
s, 1
981
Aus
tria
1981
-199
71,
254,
153
1.35
1
Dup
re e
t al.
2009
HR
SU
nite
d St
ates
1992
-200
68,
715
1.27
1
Dzu
rova
200
0C
ensu
s, 1
990,
199
5C
zech
Rep
ublic
1990
-199
510
,306
,000
3.02
4
Ebr
ahim
et a
l. 19
95B
RH
SU
nite
d K
ingd
om19
78-1
990
7,73
51.
466
Gol
dman
& H
u 19
93C
ensu
s, 1
975
Japa
n19
75-1
985
111,
940,
000
1.87
2
Gol
dman
et a
l. 19
95N
HIS
-SO
AU
nite
d St
ates
1984
-199
07,
478
1.00
2
Goo
dwin
et a
l. 19
87N
MT
RU
nite
d St
ates
1969
-198
225
,706
1.27
1
Gra
nlun
d et
al.
2010
Fila
Bav
i Fie
ld L
abor
ator
yV
ietn
am19
99-2
008
22,0
851.
702
Gru
ndy
& K
ravd
al 2
008
Cen
sus,
198
0N
orw
ay19
80-2
003
1,53
0,10
11.
766
Gru
ndy
& T
omas
sini
201
0O
NS-
LS
Uni
ted
Kin
gdom
1971
-200
141
,341
1.25
2
Haj
du e
t al.
1995
Cen
sus,
196
9-19
91H
unga
ry, U
K19
69-1
991
61,7
86,2
771.
7240
Han
k 20
10G
SOE
PG
erm
any
1984
-200
67,
231
1.42
2
Hay
war
d &
Gor
man
200
4N
LSO
MU
nite
d St
ates
1966
-199
04,
562
1.56
1
Hel
weg
-Lar
sen
et a
l. 20
03D
AN
CO
SD
enm
ark
1987
-199
96,
693
1.82
1
Hem
stro
m 1
996
Cen
sus,
198
0Sw
eden
1980
-198
61,
896,
626
1.55
4
Soc Sci Med. Author manuscript; available in PMC 2014 January 06.
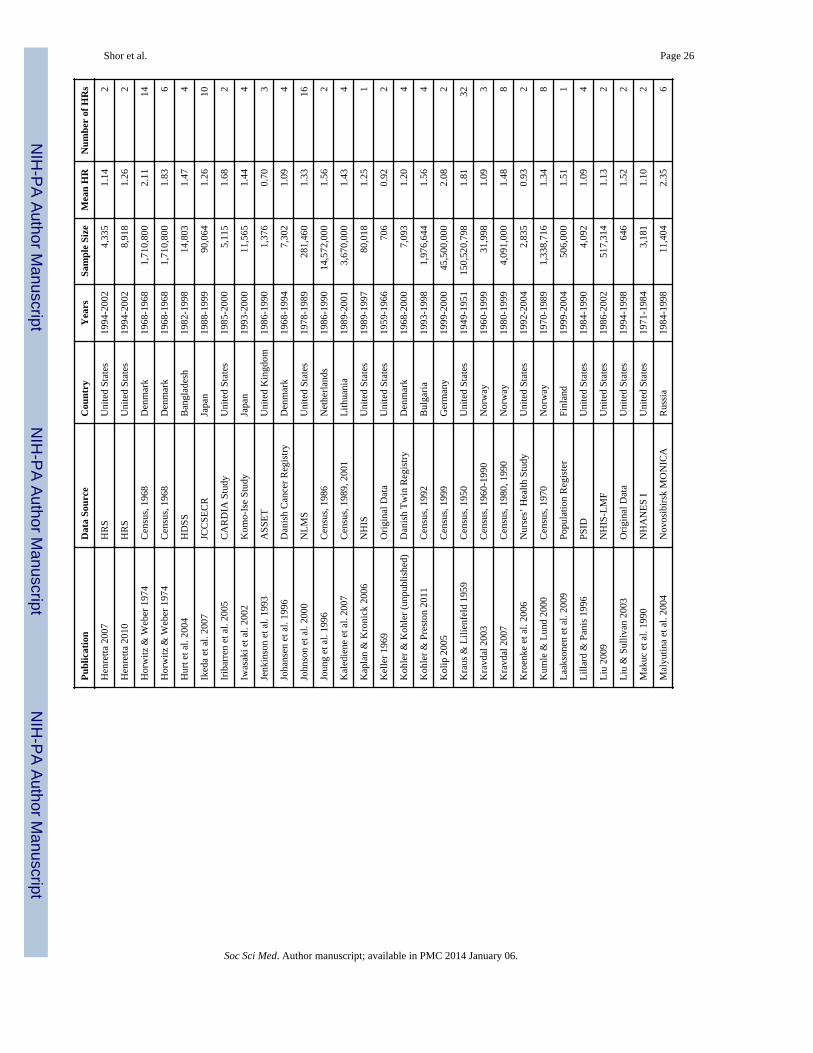
NIH
-PA Author Manuscript
NIH
-PA Author Manuscript
NIH
-PA Author Manuscript
Shor et al. Page 26
Pub
licat
ion
Dat
a So
urce
Cou
ntry
Yea
rsSa
mpl
e Si
zeM
ean
HR
Num
ber
of H
Rs
Hen
retta
200
7H
RS
Uni
ted
Stat
es19
94-2
002
4,33
51.
142
Hen
retta
201
0H
RS
Uni
ted
Stat
es19
94-2
002
8,91
81.
262
Hor
witz
& W
eber
197
4C
ensu
s, 1
968
Den
mar
k19
68-1
968
1,71
0,80
02.
1114
Hor
witz
& W
eber
197
4C
ensu
s, 1
968
Den
mar
k19
68-1
968
1,71
0,80
01.
836
Hur
t et a
l. 20
04H
DSS
Ban
glad
esh
1982
-199
814
,803
1.47
4
Iked
a et
al.
2007
JCC
SEC
RJa
pan
1988
-199
990
,064
1.26
10
Irib
arre
n et
al.
2005
CA
RD
IA S
tudy
Uni
ted
Stat
es19
85-2
000
5,11
51.
682
Iwas
aki e
t al.
2002
Kom
o-Is
e St
udy
Japa
n19
93-2
000
11,5
651.
444
Jenk
inso
n et
al.
1993
ASS
ET
Uni
ted
Kin
gdom
1986
-199
01,
376
0.70
3
Joha
nsen
et a
l. 19
96D
anis
h C
ance
r R
egis
try
Den
mar
k19
68-1
994
7,30
21.
094
John
son
et a
l. 20
00N
LM
SU
nite
d St
ates
1978
-198
928
1,46
01.
3316
Joun
g et
al.
1996
Cen
sus,
198
6N
ethe
rlan
ds19
86-1
990
14,5
72,0
001.
562
Kal
edie
ne e
t al.
2007
Cen
sus,
198
9, 2
001
Lith
uani
a19
89-2
001
3,67
0,00
01.
434
Kap
lan
& K
roni
ck 2
006
NH
ISU
nite
d St
ates
1989
-199
780
,018
1.25
1
Kel
ler
1969
Ori
gina
l Dat
aU
nite
d St
ates
1959
-196
670
60.
922
Koh
ler
& K
ohle
r (u
npub
lishe
d)D
anis
h T
win
Reg
istr
yD
enm
ark
1968
-200
07,
093
1.20
4
Koh
ler
& P
rest
on 2
011
Cen
sus,
199
2B
ulga
ria
1993
-199
81,
976,
644
1.56
4
Kol
ip 2
005
Cen
sus,
199
9G
erm
any
1999
-200
045
,500
,000
2.08
2
Kra
us &
Lili
enfe
ld 1
959
Cen
sus,
195
0U
nite
d St
ates
1949
-195
115
0,52
0,79
81.
8132
Kra
vdal
200
3C
ensu
s, 1
960-
1990
Nor
way
1960
-199
931
,998
1.09
3
Kra
vdal
200
7C
ensu
s, 1
980,
199
0N
orw
ay19
80-1
999
4,09
1,00
01.
488
Kro
enke
et a
l. 20
06N
urse
s’ H
ealth
Stu
dyU
nite
d St
ates
1992
-200
42,
835
0.93
2
Kum
le &
Lun
d 20
00C
ensu
s, 1
970
Nor
way
1970
-198
91,
338,
716
1.34
8
Laa
kson
en e
t al.
2009
Popu
latio
n R
egis
ter
Finl
and
1999
-200
450
6,00
01.
511
Lill
ard
& P
anis
199
6PS
IDU
nite
d St
ates
1984
-199
04,
092
1.09
4
Liu
200
9N
HIS
-LM
FU
nite
d St
ates
1986
-200
251
7,31
41.
132
Liu
& S
ulliv
an 2
003
Ori
gina
l Dat
aU
nite
d St
ates
1994
-199
864
61.
522
Mak
uc e
t al.
1990
NH
AN
ES
IU
nite
d St
ates
1971
-198
43,
181
1.10
2
Mal
yutin
a et
al.
2004
Nov
osib
irsk
MO
NIC
AR
ussi
a19
84-1
998
11,4
042.
356
Soc Sci Med. Author manuscript; available in PMC 2014 January 06.
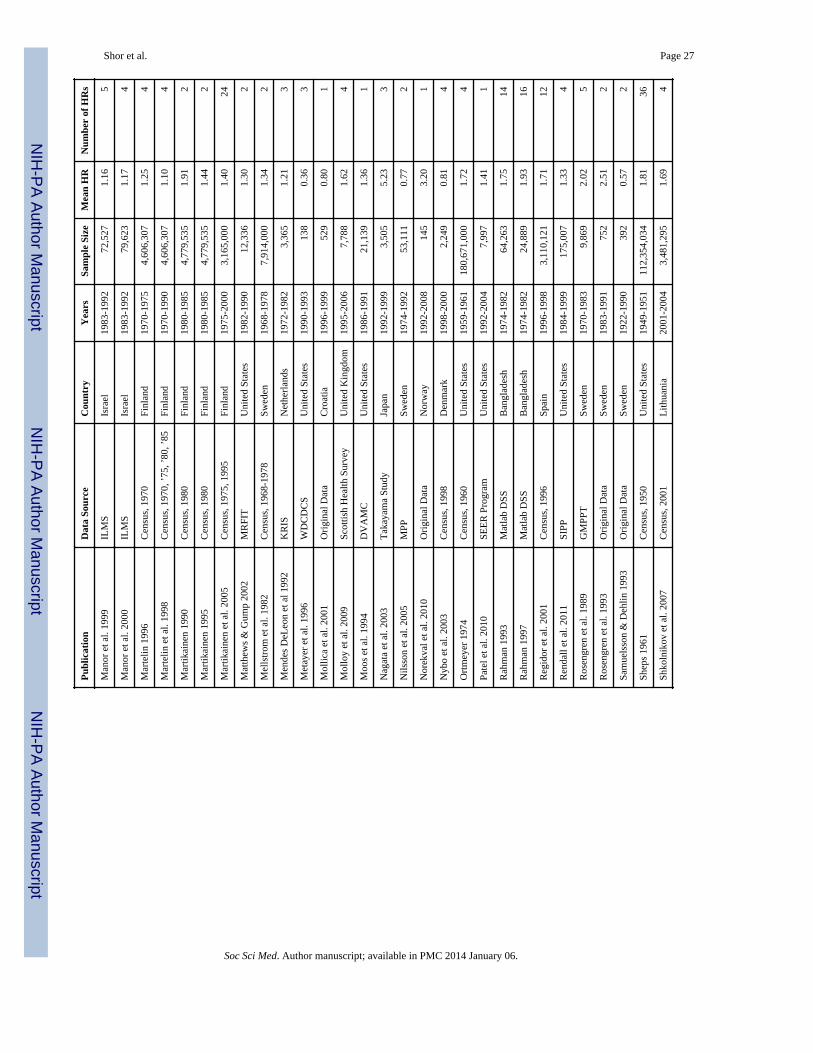
NIH
-PA Author Manuscript
NIH
-PA Author Manuscript
NIH
-PA Author Manuscript
Shor et al. Page 27
Pub
licat
ion
Dat
a So
urce
Cou
ntry
Yea
rsSa
mpl
e Si
zeM
ean
HR
Num
ber
of H
Rs
Man
or e
t al.
1999
ILM
SIs
rael
1983
-199
272
,527
1.16
5
Man
or e
t al.
2000
ILM
SIs
rael
1983
-199
279
,623
1.17
4
Mar
telin
199
6C
ensu
s, 1
970
Finl
and
1970
-197
54,
606,
307
1.25
4
Mar
telin
et a
l. 19
98C
ensu
s, 1
970,
’75
, ’80
, ’85
Finl
and
1970
-199
04,
606,
307
1.10
4
Mar
tikai
nen
1990
Cen
sus,
198
0Fi
nlan
d19
80-1
985
4,77
9,53
51.
912
Mar
tikai
nen
1995
Cen
sus,
198
0Fi
nlan
d19
80-1
985
4,77
9,53
51.
442
Mar
tikai
nen
et a
l. 20
05C
ensu
s, 1
975,
199
5Fi
nlan
d19
75-2
000
3,16
5,00
01.
4024
Mat
thew
s &
Gum
p 20
02M
RFI
TU
nite
d St
ates
1982
-199
012
,336
1.30
2
Mel
lstr
om e
t al.
1982
Cen
sus,
196
8-19
78Sw
eden
1968
-197
87,
914,
000
1.34
2
Men
des
DeL
eon
et a
l 199
2K
RIS
Net
herl
ands
1972
-198
23,
365
1.21
3
Met
ayer
et a
l. 19
96W
DC
DC
SU
nite
d St
ates
1990
-199
313
80.
363
Mol
lica
et a
l. 20
01O
rigi
nal D
ata
Cro
atia
1996
-199
952
90.
801
Mol
loy
et a
l. 20
09Sc
ottis
h H
ealth
Sur
vey
Uni
ted
Kin
gdom
1995
-200
67,
788
1.62
4
Moo
s et
al.
1994
DV
AM
CU
nite
d St
ates
1986
-199
121
,139
1.36
1
Nag
ata
et a
l. 20
03T
akay
ama
Stud
yJa
pan
1992
-199
93,
505
5.23
3
Nils
son
et a
l. 20
05M
PPSw
eden
1974
-199
253
,111
0.77
2
Nor
ekva
l et a
l. 20
10O
rigi
nal D
ata
Nor
way
1992
-200
814
53.
201
Nyb
o et
al.
2003
Cen
sus,
199
8D
enm
ark
1998
-200
02,
249
0.81
4
Ort
mey
er 1
974
Cen
sus,
196
0U
nite
d St
ates
1959
-196
118
0,67
1,00
01.
724
Pate
l et a
l. 20
10SE
ER
Pro
gram
Uni
ted
Stat
es19
92-2
004
7,99
71.
411
Rah
man
199
3M
atla
b D
SSB
angl
ades
h19
74-1
982
64,2
631.
7514
Rah
man
199
7M
atla
b D
SSB
angl
ades
h19
74-1
982
24,8
891.
9316
Reg
idor
et a
l. 20
01C
ensu
s, 1
996
Spai
n19
96-1
998
3,11
0,12
11.
7112
Ren
dall
et a
l. 20
11SI
PPU
nite
d St
ates
1984
-199
917
5,00
71.
334
Ros
engr
en e
t al.
1989
GM
PPT
Swed
en19
70-1
983
9,86
92.
025
Ros
engr
en e
t al.
1993
Ori
gina
l Dat
aSw
eden
1983
-199
175
22.
512
Sam
uels
son
& D
ehlin
199
3O
rigi
nal D
ata
Swed
en19
22-1
990
392
0.57
2
Shep
s 19
61C
ensu
s, 1
950
Uni
ted
Stat
es19
49-1
951
112,
354,
034
1.81
36
Shko
lnik
ov e
t al.
2007
Cen
sus,
200
1L
ithua
nia
2001
-200
43,
481,
295
1.69
4
Soc Sci Med. Author manuscript; available in PMC 2014 January 06.
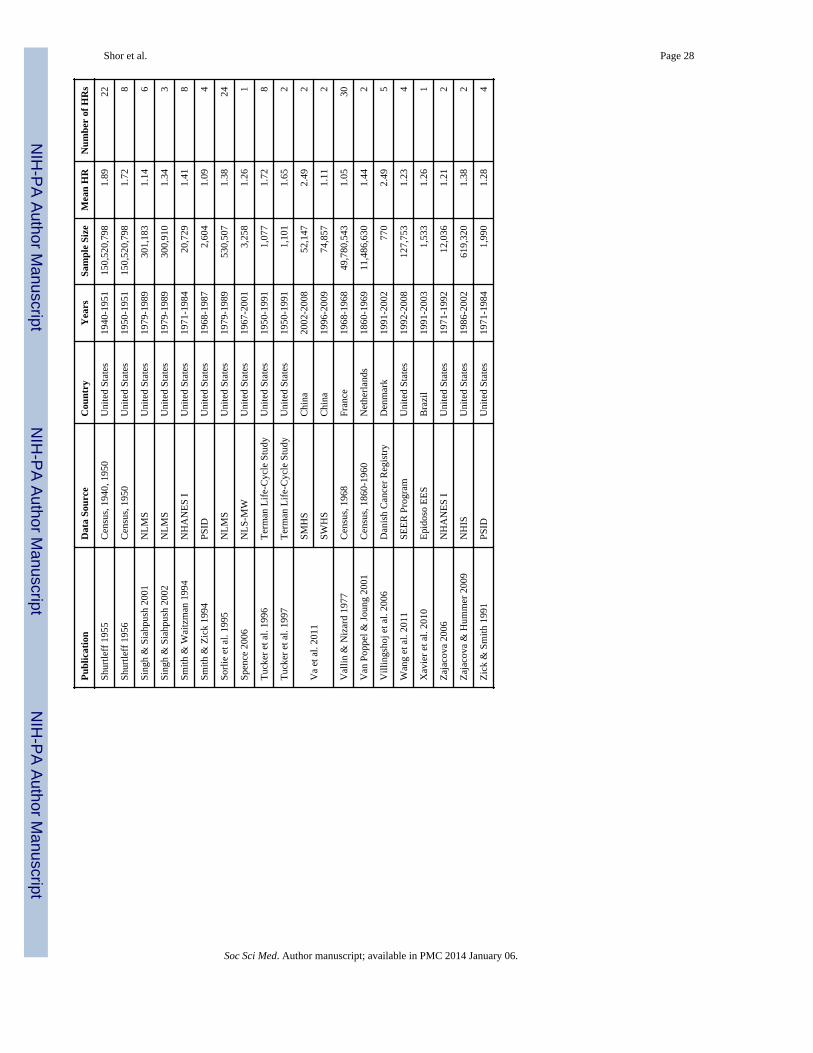
NIH
-PA Author Manuscript
NIH
-PA Author Manuscript
NIH
-PA Author Manuscript
Shor et al. Page 28
Pub
licat
ion
Dat
a So
urce
Cou
ntry
Yea
rsSa
mpl
e Si
zeM
ean
HR
Num
ber
of H
Rs
Shur
tleff
195
5C
ensu
s, 1
940,
195
0U
nite
d St
ates
1940
-195
115
0,52
0,79
81.
8922
Shur
tleff
195
6C
ensu
s, 1
950
Uni
ted
Stat
es19
50-1
951
150,
520,
798
1.72
8
Sing
h &
Sia
hpus
h 20
01N
LM
SU
nite
d St
ates
1979
-198
930
1,18
31.
146
Sing
h &
Sia
hpus
h 20
02N
LM
SU
nite
d St
ates
1979
-198
930
0,91
01.
343
Smith
& W
aitz
man
199
4N
HA
NE
S I
Uni
ted
Stat
es19
71-1
984
20,7
291.
418
Smith
& Z
ick
1994
PSID
Uni
ted
Stat
es19
68-1
987
2,60
41.
094
Sorl
ie e
t al.
1995
NL
MS
Uni
ted
Stat
es19
79-1
989
530,
507
1.38
24
Spen
ce 2
006
NL
S-M
WU
nite
d St
ates
1967
-200
13,
258
1.26
1
Tuc
ker
et a
l. 19
96T
erm
an L
ife-
Cyc
le S
tudy
Uni
ted
Stat
es19
50-1
991
1,07
71.
728
Tuc
ker
et a
l. 19
97T
erm
an L
ife-
Cyc
le S
tudy
Uni
ted
Stat
es19
50-1
991
1,10
11.
652
Va
et a
l. 20
11SM
HS
Chi
na20
02-2
008
52,1
472.
492
SWH
SC
hina
1996
-200
974
,857
1.11
2
Val
lin &
Niz
ard
1977
Cen
sus,
196
8Fr
ance
1968
-196
849
,780
,543
1.05
30
Van
Pop
pel &
Jou
ng 2
001
Cen
sus,
186
0-19
60N
ethe
rlan
ds18
60-1
969
11,4
86,6
301.
442
Vill
ings
hoj e
t al.
2006
Dan
ish
Can
cer
Reg
istr
yD
enm
ark
1991
-200
277
02.
495
Wan
g et
al.
2011
SEE
R P
rogr
amU
nite
d St
ates
1992
-200
812
7,75
31.
234
Xav
ier
et a
l. 20
10E
pido
so E
ES
Bra
zil
1991
-200
31,
533
1.26
1
Zaj
acov
a 20
06N
HA
NE
S I
Uni
ted
Stat
es19
71-1
992
12,0
361.
212
Zaj
acov
a &
Hum
mer
200
9N
HIS
Uni
ted
Stat
es19
86-2
002
619,
320
1.38
2
Zic
k &
Sm
ith 1
991
PSID
Uni
ted
Stat
es19
71-1
984
1,99
01.
284
Soc Sci Med. Author manuscript; available in PMC 2014 January 06.
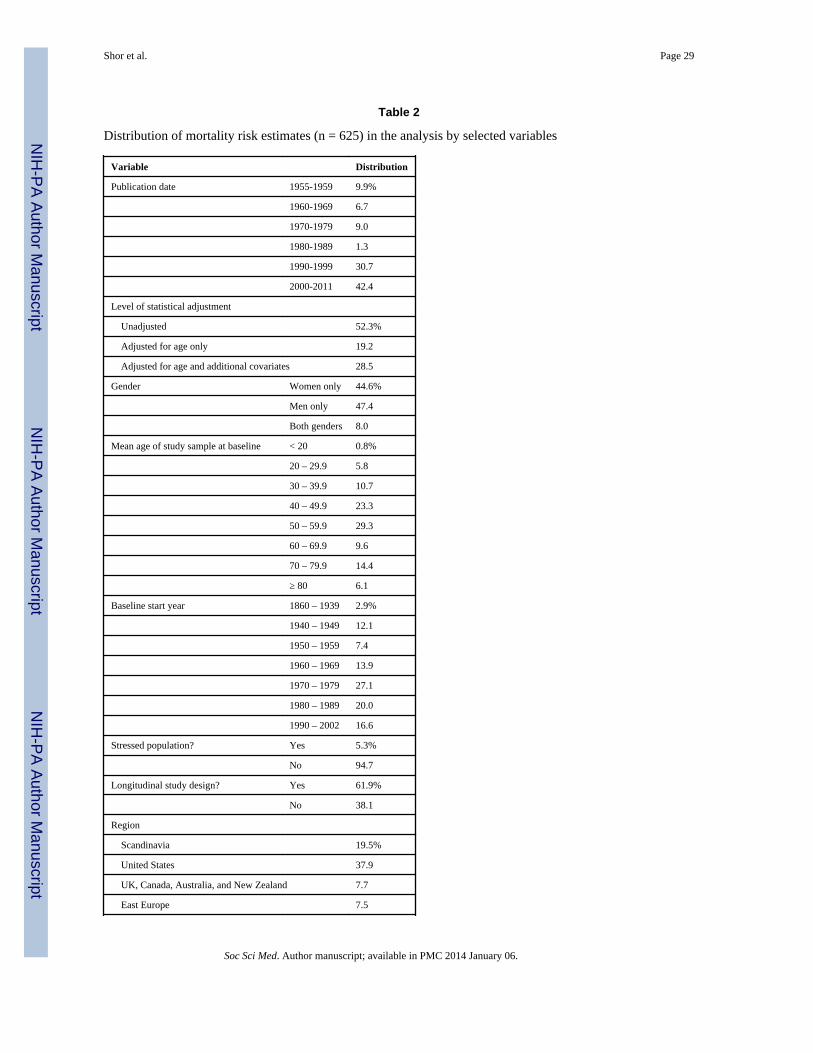
NIH
-PA Author Manuscript
NIH
-PA Author Manuscript
NIH
-PA Author Manuscript
Shor et al. Page 29
Table 2
Distribution of mortality risk estimates (n = 625) in the analysis by selected variables
Variable Distribution
Publication date 1955-1959 9.9%
1960-1969 6.7
1970-1979 9.0
1980-1989 1.3
1990-1999 30.7
2000-2011 42.4
Level of statistical adjustment
Unadjusted 52.3%
Adjusted for age only 19.2
Adjusted for age and additional covariates 28.5
Gender Women only 44.6%
Men only 47.4
Both genders 8.0
Mean age of study sample at baseline < 20 0.8%
20 – 29.9 5.8
30 – 39.9 10.7
40 – 49.9 23.3
50 – 59.9 29.3
60 – 69.9 9.6
70 – 79.9 14.4
≥ 80 6.1
Baseline start year 1860 – 1939 2.9%
1940 – 1949 12.1
1950 – 1959 7.4
1960 – 1969 13.9
1970 – 1979 27.1
1980 – 1989 20.0
1990 – 2002 16.6
Stressed population? Yes 5.3%
No 94.7
Longitudinal study design? Yes 61.9%
No 38.1
Region
Scandinavia 19.5%
United States 37.9
UK, Canada, Australia, and New Zealand 7.7
East Europe 7.5
Soc Sci Med. Author manuscript; available in PMC 2014 January 06.
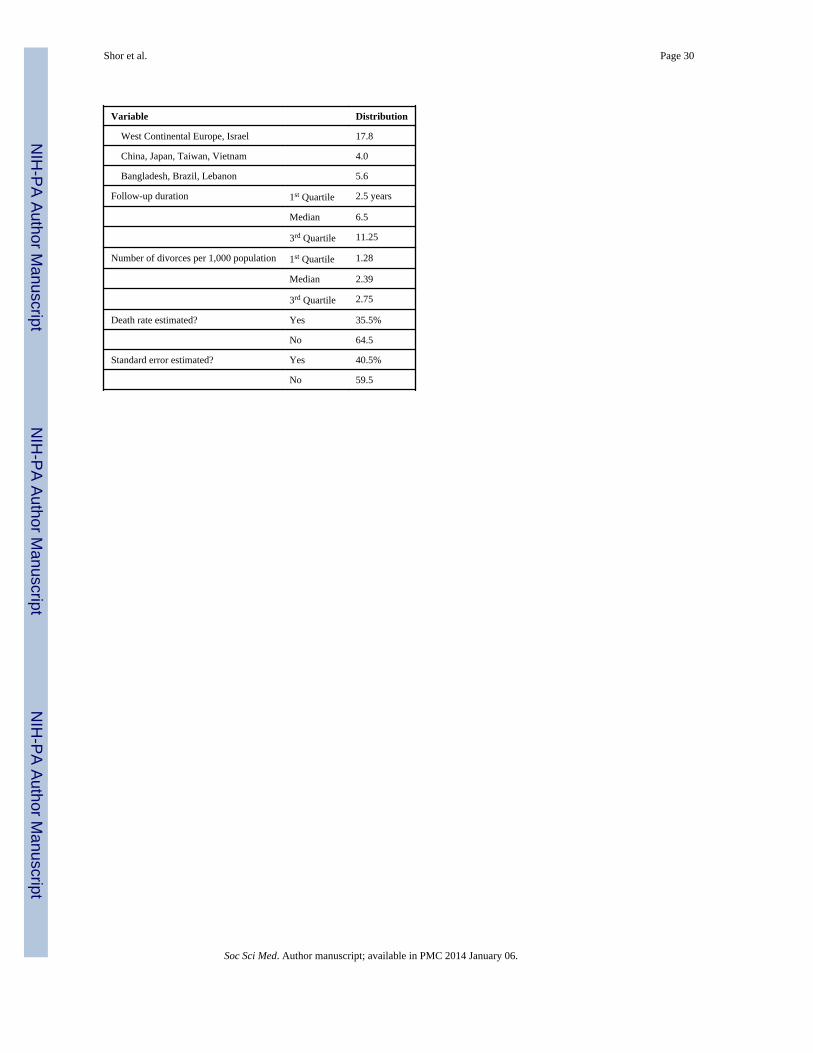
NIH
-PA Author Manuscript
NIH
-PA Author Manuscript
NIH
-PA Author Manuscript
Shor et al. Page 30
Variable Distribution
West Continental Europe, Israel 17.8
China, Japan, Taiwan, Vietnam 4.0
Bangladesh, Brazil, Lebanon 5.6
Follow-up duration 1st Quartile 2.5 years
Median 6.5
3rd Quartile 11.25
Number of divorces per 1,000 population 1st Quartile 1.28
Median 2.39
3rd Quartile 2.75
Death rate estimated? Yes 35.5%
No 64.5
Standard error estimated? Yes 40.5%
No 59.5
Soc Sci Med. Author manuscript; available in PMC 2014 January 06.
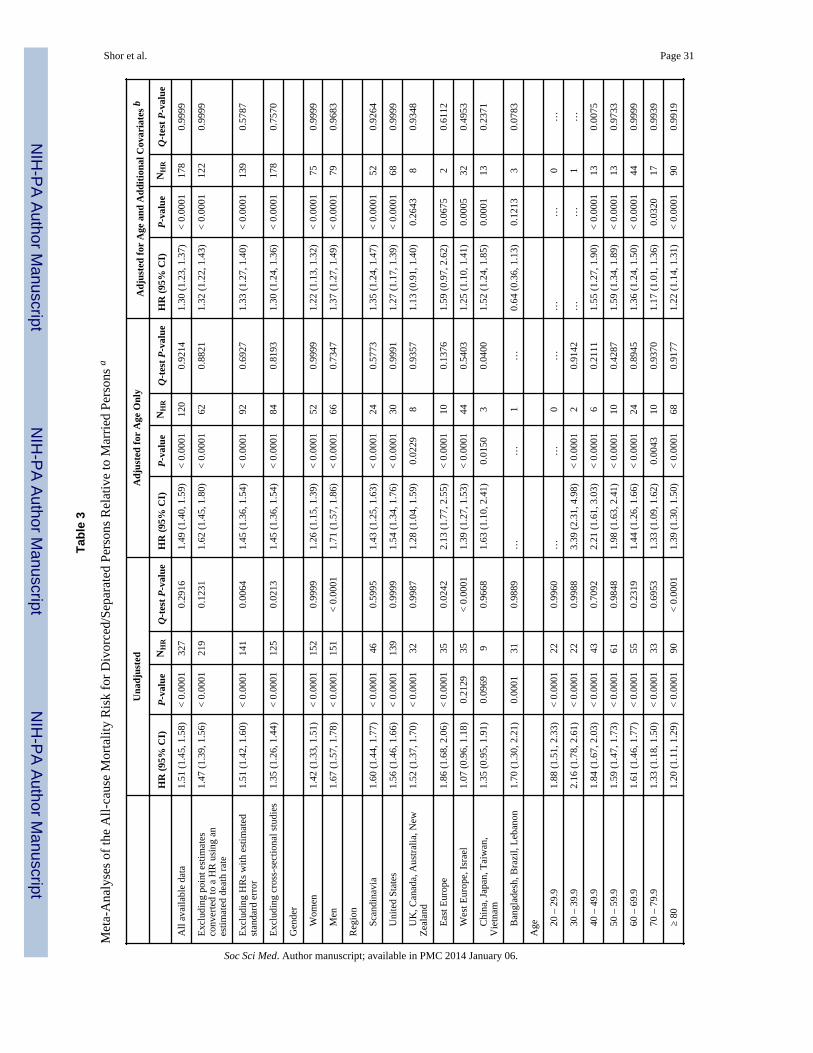
NIH
-PA Author Manuscript
NIH
-PA Author Manuscript
NIH
-PA Author Manuscript
Shor et al. Page 31
Tabl
e 3
Met
a-A
naly
ses
of th
e A
ll-ca
use
Mor
talit
y R
isk
for
Div
orce
d/Se
para
ted
Pers
ons
Rel
ativ
e to
Mar
ried
Per
sons
a
Una
djus
ted
Adj
uste
d fo
r A
ge O
nly
Adj
uste
d fo
r A
ge a
nd A
ddit
iona
l Cov
aria
tes
b
HR
(95
% C
I)P
-val
ueN
HR
Q-t
est
P-v
alue
HR
(95
% C
I)P
-val
ueN
HR
Q-t
est
P-v
alue
HR
(95
% C
I)P
-val
ueN
HR
Q-t
est
P-v
alue
All
avai
labl
e da
ta1.
51 (
1.45
, 1.5
8)<
0.0
001
327
0.29
161.
49 (
1.40
, 1.5
9)<
0.0
001
120
0.92
141.
30 (
1.23
, 1.3
7)<
0.0
001
178
0.99
99
Exc
ludi
ng p
oint
est
imat
esco
nver
ted
to a
HR
usi
ng a
nes
timat
ed d
eath
rat
e
1.47
(1.
39, 1
.56)
< 0
.000
121
90.
1231
1.62
(1.
45, 1
.80)
< 0
.000
162
0.88
211.
32 (
1.22
, 1.4
3)<
0.0
001
122
0.99
99
Exc
ludi
ng H
Rs
with
est
imat
edst
anda
rd e
rror
1.51
(1.
42, 1
.60)
< 0
.000
114
10.
0064
1.45
(1.
36, 1
.54)
< 0
.000
192
0.69
271.
33 (
1.27
, 1.4
0)<
0.0
001
139
0.57
87
Exc
ludi
ng c
ross
-sec
tiona
l stu
dies
1.35
(1.
26, 1
.44)
< 0
.000
112
50.
0213
1.45
(1.
36, 1
.54)
< 0
.000
184
0.81
931.
30 (
1.24
, 1.3
6)<
0.0
001
178
0.75
70
Gen
der
W
omen
1.42
(1.
33, 1
.51)
< 0
.000
115
20.
9999
1.26
(1.
15, 1
.39)
< 0
.000
152
0.99
991.
22 (
1.13
, 1.3
2)<
0.0
001
750.
9999
M
en1.
67 (
1.57
, 1.7
8)<
0.0
001
151
< 0
.000
11.
71 (
1.57
, 1.8
6)<
0.0
001
660.
7347
1.37
(1.
27, 1
.49)
< 0
.000
179
0.96
83
Reg
ion
Sc
andi
navi
a1.
60 (
1.44
, 1.7
7)<
0.0
001
460.
5995
1.43
(1.
25, 1
.63)
< 0
.000
124
0.57
731.
35 (
1.24
, 1.4
7)<
0.0
001
520.
9264
U
nite
d St
ates
1.56
(1.
46, 1
.66)
< 0
.000
113
90.
9999
1.54
(1.
34, 1
.76)
< 0
.000
130
0.99
911.
27 (
1.17
, 1.3
9)<
0.0
001
680.
9999
U
K, C
anad
a, A
ustr
alia
, New
Zea
land
1.52
(1.
37, 1
.70)
< 0
.000
132
0.99
871.
28 (
1.04
, 1.5
9)0.
0229
80.
9357
1.13
(0.
91, 1
.40)
0.26
438
0.93
48
E
ast E
urop
e1.
86 (
1.68
, 2.0
6)<
0.0
001
350.
0242
2.13
(1.
77, 2
.55)
< 0
.000
110
0.13
761.
59 (
0.97
, 2.6
2)0.
0675
20.
6112
W
est E
urop
e, I
srae
l1.
07 (
0.96
, 1.1
8)0.
2129
35<
0.0
001
1.39
(1.
27, 1
.53)
< 0
.000
144
0.54
031.
25 (
1.10
, 1.4
1)0.
0005
320.
4953
C
hina
, Jap
an, T
aiw
an,
Vie
tnam
1.35
(0.
95, 1
.91)
0.09
699
0.96
681.
63 (
1.10
, 2.4
1)0.
0150
30.
0400
1.52
(1.
24, 1
.85)
0.00
0113
0.23
71
B
angl
ades
h, B
razi
l, L
eban
on1.
70 (
1.30
, 2.2
1)0.
0001
310.
9889
……
1…
0.64
(0.
36, 1
.13)
0.12
133
0.07
83
Age
20
– 2
9.9
1.88
(1.
51, 2
.33)
< 0
.000
122
0.99
60…
…0
……
…0
…
30
– 3
9.9
2.16
(1.
78, 2
.61)
< 0
.000
122
0.99
883.
39 (
2.31
, 4.9
8)<
0.0
001
20.
9142
……
1…
40
– 4
9.9
1.84
(1.
67, 2
.03)
< 0
.000
143
0.70
922.
21 (
1.61
, 3.0
3)<
0.0
001
60.
2111
1.55
(1.
27, 1
.90)
< 0
.000
113
0.00
75
50
– 5
9.9
1.59
(1.
47, 1
.73)
< 0
.000
161
0.98
481.
98 (
1.63
, 2.4
1)<
0.0
001
100.
4287
1.59
(1.
34, 1
.89)
< 0
.000
113
0.97
33
60
– 6
9.9
1.61
(1.
46, 1
.77)
< 0
.000
155
0.23
191.
44 (
1.26
, 1.6
6)<
0.0
001
240.
8945
1.36
(1.
24, 1
.50)
< 0
.000
144
0.99
99
70
– 7
9.9
1.33
(1.
18, 1
.50)
< 0
.000
133
0.69
531.
33 (
1.09
, 1.6
2)0.
0043
100.
9370
1.17
(1.
01, 1
.36)
0.03
2017
0.99
39
≥
801.
20 (
1.11
, 1.2
9)<
0.0
001
90<
0.0
001
1.39
(1.
30, 1
.50)
< 0
.000
168
0.91
771.
22 (
1.14
, 1.3
1)<
0.0
001
900.
9919
Soc Sci Med. Author manuscript; available in PMC 2014 January 06.
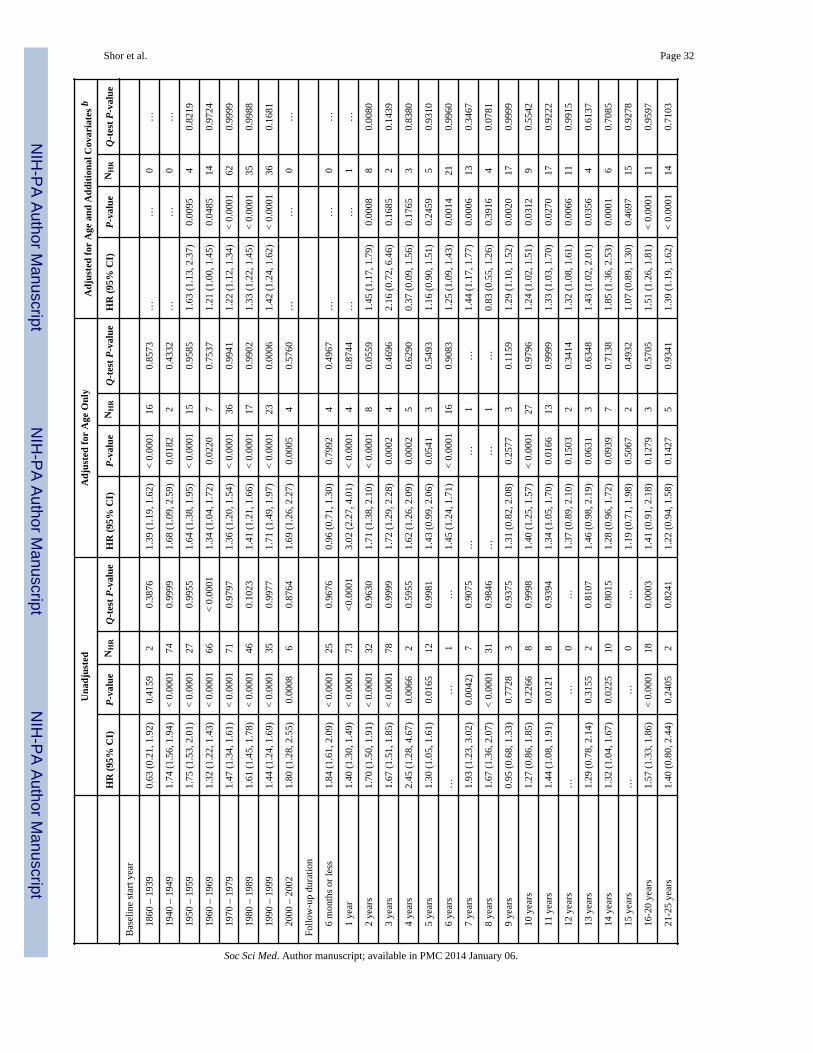
NIH
-PA Author Manuscript
NIH
-PA Author Manuscript
NIH
-PA Author Manuscript
Shor et al. Page 32
Una
djus
ted
Adj
uste
d fo
r A
ge O
nly
Adj
uste
d fo
r A
ge a
nd A
ddit
iona
l Cov
aria
tes
b
HR
(95
% C
I)P
-val
ueN
HR
Q-t
est
P-v
alue
HR
(95
% C
I)P
-val
ueN
HR
Q-t
est
P-v
alue
HR
(95
% C
I)P
-val
ueN
HR
Q-t
est
P-v
alue
Bas
elin
e st
art y
ear
18
60 –
193
90.
63 (
0.21
, 1.9
2)0.
4159
20.
3876
1.39
(1.
19, 1
.62)
< 0
.000
116
0.85
73…
…0
…
19
40 –
194
91.
74 (
1.56
, 1.9
4)<
0.0
001
740.
9999
1.68
(1.
09, 2
.59)
0.01
822
0.43
32…
…0
…
19
50 –
195
91.
75 (
1.53
, 2.0
1)<
0.0
001
270.
9955
1.64
(1.
38, 1
.95)
< 0
.000
115
0.95
851.
63 (
1.13
, 2.3
7)0.
0095
40.
8219
19
60 –
196
91.
32 (
1.22
, 1.4
3)<
0.0
001
66<
0.0
001
1.34
(1.
04, 1
.72)
0.02
207
0.75
371.
21 (
1.00
, 1.4
5)0.
0485
140.
9724
19
70 –
197
91.
47 (
1.34
, 1.6
1)<
0.0
001
710.
9797
1.36
(1.
20, 1
.54)
< 0
.000
136
0.99
411.
22 (
1.12
, 1.3
4)<
0.0
001
620.
9999
19
80 –
198
91.
61 (
1.45
, 1.7
8)<
0.0
001
460.
1023
1.41
(1.
21, 1
.66)
< 0
.000
117
0.99
021.
33 (
1.22
, 1.4
5)<
0.0
001
350.
9988
19
90 –
199
91.
44 (
1.24
, 1.6
9)<
0.0
001
350.
9977
1.71
(1.
49, 1
.97)
< 0
.000
123
0.00
061.
42 (
1.24
, 1.6
2)<
0.0
001
360.
1681
20
00 –
200
21.
80 (
1.28
, 2.5
5)0.
0008
60.
8764
1.69
(1.
26, 2
.27)
0.00
054
0.57
60…
…0
…
Follo
w-u
p du
ratio
n
6
mon
ths
or le
ss1.
84 (
1.61
, 2.0
9)<
0.0
001
250.
9676
0.96
(0.
71, 1
.30)
0.79
924
0.49
67…
…0
…
1
year
1.40
(1.
30, 1
.49)
< 0
.000
173
<0.
0001
3.02
(2.
27, 4
.01)
< 0
.000
14
0.87
44…
…1
…
2
year
s1.
70 (
1.50
, 1.9
1)<
0.0
001
320.
9630
1.71
(1.
38, 2
.10)
< 0
.000
18
0.05
591.
45 (
1.17
, 1.7
9)0.
0008
80.
0080
3
year
s1.
67 (
1.51
, 1.8
5)<
0.0
001
780.
9999
1.72
(1.
29, 2
.28)
0.00
024
0.46
962.
16 (
0.72
, 6.4
6)0.
1685
20.
1439
4
year
s2.
45 (
1.28
, 4.6
7)0.
0066
20.
5955
1.62
(1.
26, 2
.09)
0.00
025
0.62
900.
37 (
0.09
, 1.5
6)0.
1765
30.
8380
5
year
s1.
30 (
1.05
, 1.6
1)0.
0165
120.
9981
1.43
(0.
99, 2
.06)
0.05
413
0.54
931.
16 (
0.90
, 1.5
1)0.
2459
50.
9310
6
year
s…
…1
…1.
45 (
1.24
, 1.7
1)<
0.0
001
160.
9083
1.25
(1.
09, 1
.43)
0.00
1421
0.99
60
7
year
s1.
93 (
1.23
, 3.0
2)0.
0042
)7
0.90
75…
…1
…1.
44 (
1.17
, 1.7
7)0.
0006
130.
3467
8
year
s1.
67 (
1.36
, 2.0
7)<
0.0
001
310.
9846
……
1…
0.83
(0.
55, 1
.26)
0.39
164
0.07
81
9
year
s0.
95 (
0.68
, 1.3
3)0.
7728
30.
9375
1.31
(0.
82, 2
.08)
0.25
773
0.11
591.
29 (
1.10
, 1.5
2)0.
0020
170.
9999
10
yea
rs1.
27 (
0.86
, 1.8
5)0.
2266
80.
9998
1.40
(1.
25, 1
.57)
< 0
.000
127
0.97
961.
24 (
1.02
, 1.5
1)0.
0312
90.
5542
11
yea
rs1.
44 (
1.08
, 1.9
1)0.
0121
80.
9394
1.34
(1.
05, 1
.70)
0.01
6613
0.99
991.
33 (
1.03
, 1.7
0)0.
0270
170.
9222
12
yea
rs…
…0
…1.
37 (
0.89
, 2.1
0)0.
1503
20.
3414
1.32
(1.
08, 1
.61)
0.00
6611
0.99
15
13
yea
rs1.
29 (
0.78
, 2.1
4)0.
3155
20.
8107
1.46
(0.
98, 2
.19)
0.06
313
0.63
481.
43 (
1.02
, 2.0
1)0.
0356
40.
6137
14
yea
rs1.
32 (
1.04
, 1.6
7)0.
0225
100.
8015
1.28
(0.
96, 1
.72)
0.09
397
0.71
381.
85 (
1.36
, 2.5
3)0.
0001
60.
7085
15
yea
rs…
…0
…1.
19 (
0.71
, 1.9
8)0.
5067
20.
4932
1.07
(0.
89, 1
.30)
0.46
9715
0.92
78
16
-20
year
s1.
57 (
1.33
, 1.8
6)<
0.0
001
180.
0003
1.41
(0.
91, 2
.18)
0.12
793
0.57
051.
51 (
1.26
, 1.8
1)<
0.0
001
110.
9597
21
-25
year
s1.
40 (
0.80
, 2.4
4)0.
2405
20.
8241
1.22
(0.
94, 1
.58)
0.14
275
0.93
411.
39 (
1.19
, 1.6
2)<
0.0
001
140.
7103
Soc Sci Med. Author manuscript; available in PMC 2014 January 06.
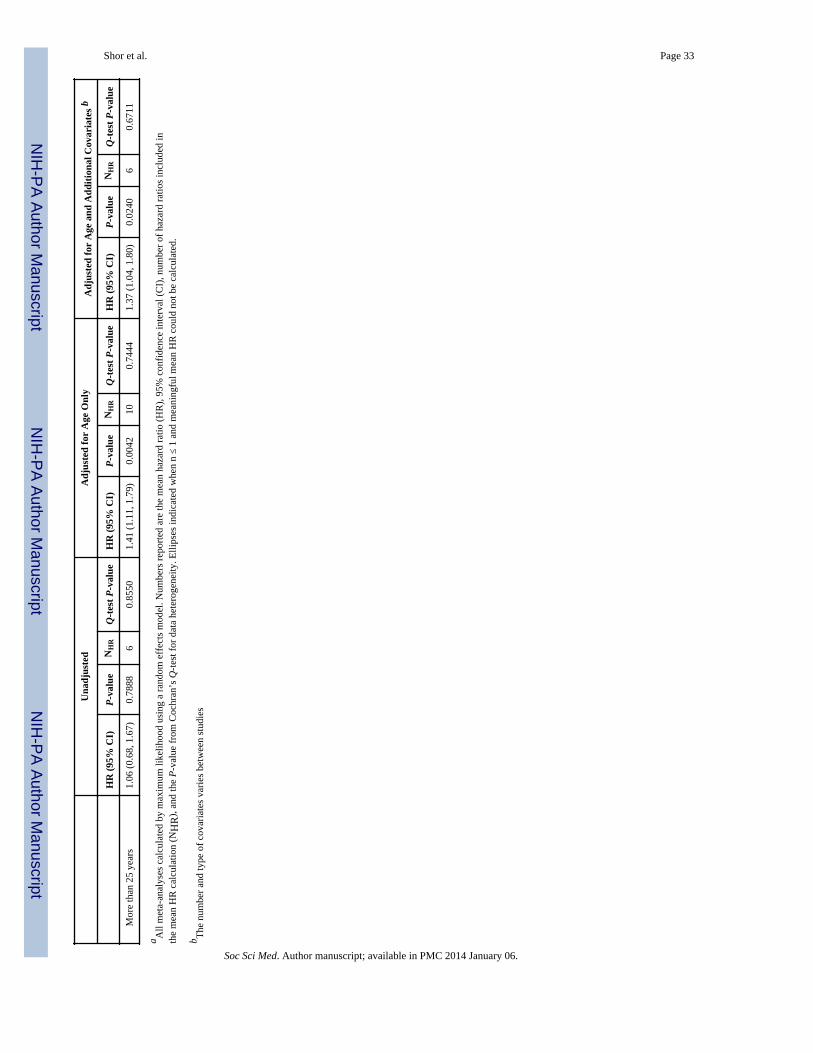
NIH
-PA Author Manuscript
NIH
-PA Author Manuscript
NIH
-PA Author Manuscript
Shor et al. Page 33
Una
djus
ted
Adj
uste
d fo
r A
ge O
nly
Adj
uste
d fo
r A
ge a
nd A
ddit
iona
l Cov
aria
tes
b
HR
(95
% C
I)P
-val
ueN
HR
Q-t
est
P-v
alue
HR
(95
% C
I)P
-val
ueN
HR
Q-t
est
P-v
alue
HR
(95
% C
I)P
-val
ueN
HR
Q-t
est
P-v
alue
M
ore
than
25
year
s1.
06 (
0.68
, 1.6
7)0.
7888
60.
8550
1.41
(1.
11, 1
.79)
0.00
4210
0.74
441.
37 (
1.04
, 1.8
0)0.
0240
60.
6711
a All
met
a-an
alys
es c
alcu
late
d by
max
imum
like
lihoo
d us
ing
a ra
ndom
eff
ects
mod
el. N
umbe
rs r
epor
ted
are
the
mea
n ha
zard
rat
io (
HR
), 9
5% c
onfi
denc
e in
terv
al (
CI)
, num
ber
of h
azar
d ra
tios
incl
uded
inth
e m
ean
HR
cal
cula
tion
(NH
R),
and
the
P-v
alue
fro
m C
ochr
an’s
Q-t
est f
or d
ata
hete
roge
neity
. Elli
pses
indi
cate
d w
hen
n ≤
1 an
d m
eani
ngfu
l mea
n H
R c
ould
not
be
calc
ulat
ed.
b The
num
ber
and
type
of
cova
riat
es v
arie
s be
twee
n st
udie
s
Soc Sci Med. Author manuscript; available in PMC 2014 January 06.
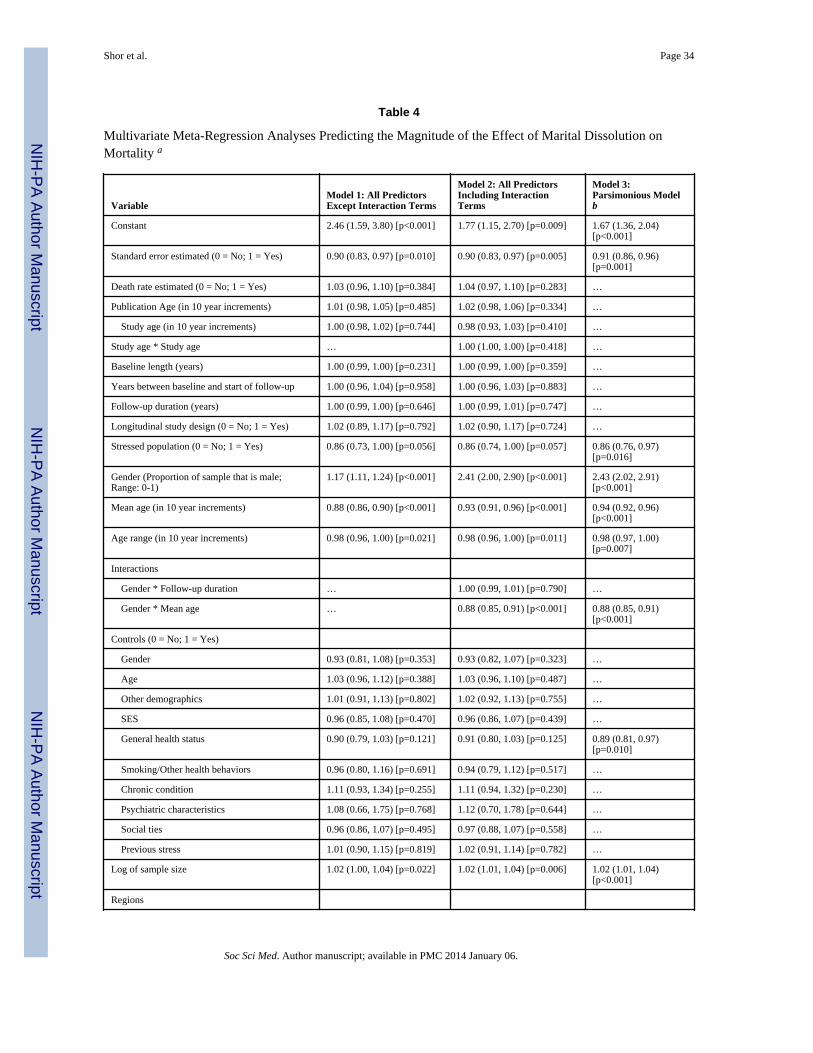
NIH
-PA Author Manuscript
NIH
-PA Author Manuscript
NIH
-PA Author Manuscript
Shor et al. Page 34
Table 4
Multivariate Meta-Regression Analyses Predicting the Magnitude of the Effect of Marital Dissolution onMortality a
VariableModel 1: All PredictorsExcept Interaction Terms
Model 2: All PredictorsIncluding InteractionTerms
Model 3:Parsimonious Modelb
Constant 2.46 (1.59, 3.80) [p<0.001] 1.77 (1.15, 2.70) [p=0.009] 1.67 (1.36, 2.04)[p<0.001]
Standard error estimated (0 = No; 1 = Yes) 0.90 (0.83, 0.97) [p=0.010] 0.90 (0.83, 0.97) [p=0.005] 0.91 (0.86, 0.96)[p=0.001]
Death rate estimated (0 = No; 1 = Yes) 1.03 (0.96, 1.10) [p=0.384] 1.04 (0.97, 1.10) [p=0.283] …
Publication Age (in 10 year increments) 1.01 (0.98, 1.05) [p=0.485] 1.02 (0.98, 1.06) [p=0.334] …
Study age (in 10 year increments) 1.00 (0.98, 1.02) [p=0.744] 0.98 (0.93, 1.03) [p=0.410] …
Study age * Study age … 1.00 (1.00, 1.00) [p=0.418] …
Baseline length (years) 1.00 (0.99, 1.00) [p=0.231] 1.00 (0.99, 1.00) [p=0.359] …
Years between baseline and start of follow-up 1.00 (0.96, 1.04) [p=0.958] 1.00 (0.96, 1.03) [p=0.883] …
Follow-up duration (years) 1.00 (0.99, 1.00) [p=0.646] 1.00 (0.99, 1.01) [p=0.747] …
Longitudinal study design (0 = No; 1 = Yes) 1.02 (0.89, 1.17) [p=0.792] 1.02 (0.90, 1.17) [p=0.724] …
Stressed population (0 = No; 1 = Yes) 0.86 (0.73, 1.00) [p=0.056] 0.86 (0.74, 1.00) [p=0.057] 0.86 (0.76, 0.97)[p=0.016]
Gender (Proportion of sample that is male;Range: 0-1)
1.17 (1.11, 1.24) [p<0.001] 2.41 (2.00, 2.90) [p<0.001] 2.43 (2.02, 2.91)[p<0.001]
Mean age (in 10 year increments) 0.88 (0.86, 0.90) [p<0.001] 0.93 (0.91, 0.96) [p<0.001] 0.94 (0.92, 0.96)[p<0.001]
Age range (in 10 year increments) 0.98 (0.96, 1.00) [p=0.021] 0.98 (0.96, 1.00) [p=0.011] 0.98 (0.97, 1.00)[p=0.007]
Interactions
Gender * Follow-up duration … 1.00 (0.99, 1.01) [p=0.790] …
Gender * Mean age … 0.88 (0.85, 0.91) [p<0.001] 0.88 (0.85, 0.91)[p<0.001]
Controls (0 = No; 1 = Yes)
Gender 0.93 (0.81, 1.08) [p=0.353] 0.93 (0.82, 1.07) [p=0.323] …
Age 1.03 (0.96, 1.12) [p=0.388] 1.03 (0.96, 1.10) [p=0.487] …
Other demographics 1.01 (0.91, 1.13) [p=0.802] 1.02 (0.92, 1.13) [p=0.755] …
SES 0.96 (0.85, 1.08) [p=0.470] 0.96 (0.86, 1.07) [p=0.439] …
General health status 0.90 (0.79, 1.03) [p=0.121] 0.91 (0.80, 1.03) [p=0.125] 0.89 (0.81, 0.97)[p=0.010]
Smoking/Other health behaviors 0.96 (0.80, 1.16) [p=0.691] 0.94 (0.79, 1.12) [p=0.517] …
Chronic condition 1.11 (0.93, 1.34) [p=0.255] 1.11 (0.94, 1.32) [p=0.230] …
Psychiatric characteristics 1.08 (0.66, 1.75) [p=0.768] 1.12 (0.70, 1.78) [p=0.644] …
Social ties 0.96 (0.86, 1.07) [p=0.495] 0.97 (0.88, 1.07) [p=0.558] …
Previous stress 1.01 (0.90, 1.15) [p=0.819] 1.02 (0.91, 1.14) [p=0.782] …
Log of sample size 1.02 (1.00, 1.04) [p=0.022] 1.02 (1.01, 1.04) [p=0.006] 1.02 (1.01, 1.04)[p<0.001]
Regions
Soc Sci Med. Author manuscript; available in PMC 2014 January 06.
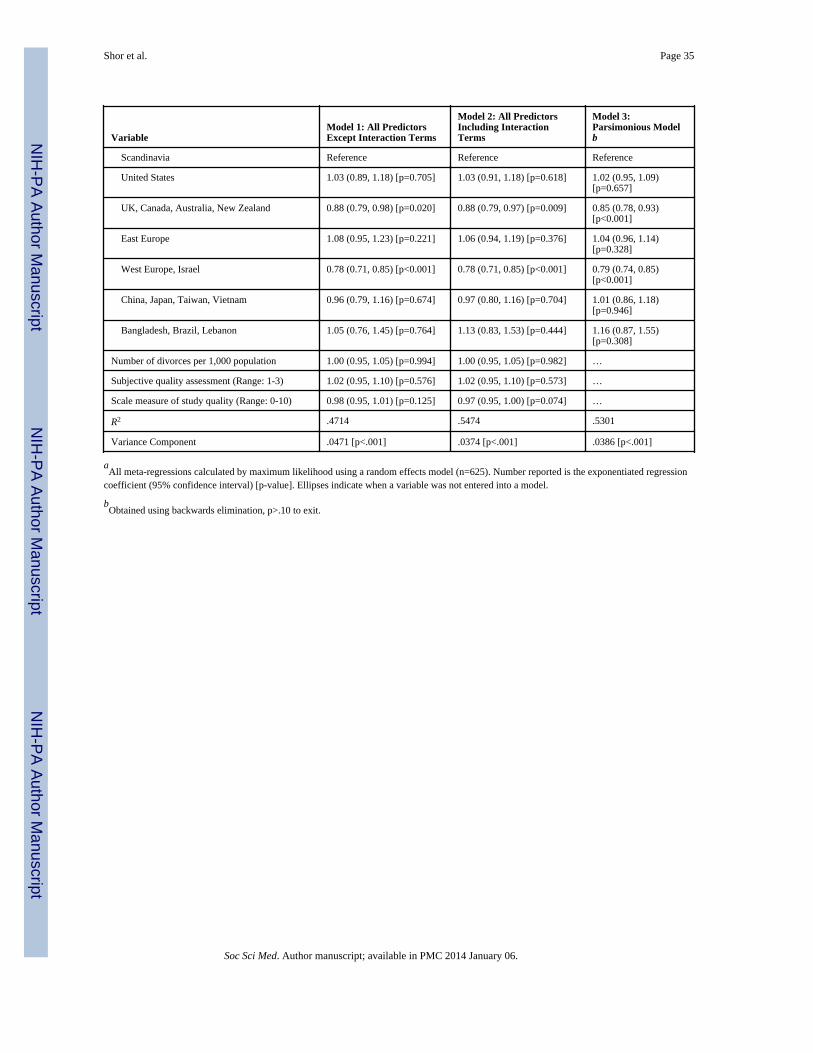
NIH
-PA Author Manuscript
NIH
-PA Author Manuscript
NIH
-PA Author Manuscript
Shor et al. Page 35
VariableModel 1: All PredictorsExcept Interaction Terms
Model 2: All PredictorsIncluding InteractionTerms
Model 3:Parsimonious Modelb
Scandinavia Reference Reference Reference
United States 1.03 (0.89, 1.18) [p=0.705] 1.03 (0.91, 1.18) [p=0.618] 1.02 (0.95, 1.09)[p=0.657]
UK, Canada, Australia, New Zealand 0.88 (0.79, 0.98) [p=0.020] 0.88 (0.79, 0.97) [p=0.009] 0.85 (0.78, 0.93)[p<0.001]
East Europe 1.08 (0.95, 1.23) [p=0.221] 1.06 (0.94, 1.19) [p=0.376] 1.04 (0.96, 1.14)[p=0.328]
West Europe, Israel 0.78 (0.71, 0.85) [p<0.001] 0.78 (0.71, 0.85) [p<0.001] 0.79 (0.74, 0.85)[p<0.001]
China, Japan, Taiwan, Vietnam 0.96 (0.79, 1.16) [p=0.674] 0.97 (0.80, 1.16) [p=0.704] 1.01 (0.86, 1.18)[p=0.946]
Bangladesh, Brazil, Lebanon 1.05 (0.76, 1.45) [p=0.764] 1.13 (0.83, 1.53) [p=0.444] 1.16 (0.87, 1.55)[p=0.308]
Number of divorces per 1,000 population 1.00 (0.95, 1.05) [p=0.994] 1.00 (0.95, 1.05) [p=0.982] …
Subjective quality assessment (Range: 1-3) 1.02 (0.95, 1.10) [p=0.576] 1.02 (0.95, 1.10) [p=0.573] …
Scale measure of study quality (Range: 0-10) 0.98 (0.95, 1.01) [p=0.125] 0.97 (0.95, 1.00) [p=0.074] …
R2 .4714 .5474 .5301
Variance Component .0471 [p<.001] .0374 [p<.001] .0386 [p<.001]
aAll meta-regressions calculated by maximum likelihood using a random effects model (n=625). Number reported is the exponentiated regression
coefficient (95% confidence interval) [p-value]. Ellipses indicate when a variable was not entered into a model.
bObtained using backwards elimination, p>.10 to exit.
Soc Sci Med. Author manuscript; available in PMC 2014 January 06.