Intersection Design & Operation for Road Safety - IRF India ...
58
Intersection Design & Operation for Road Safety International Road Federation -India Chapter 2 nd Webinar Road Safety Engineering for Improving Safety 12 March 2021 Prof. (Dr.) Gaurang J Joshi Professor Transportation Engineering & Planning Civil Engineering Department, SVNIT Surat 1 Road Safety Challenges in India and Preparation of Action Plan
-
Upload
khangminh22 -
Category
Documents
-
view
0 -
download
0
Transcript of Intersection Design & Operation for Road Safety - IRF India ...

Intersection Design & Operation
for Road Safety
International Road Federation -India Chapter2nd Webinar
Road Safety Engineering for Improving Safety12 March 2021
Prof. (Dr.) Gaurang J JoshiProfessor
Transportation Engineering & PlanningCivil Engineering Department, SVNIT Surat 1
Road Safety Challenges in
India and Preparation of
Action Plan

Planning
Operation &
Manage-ment
Efficiency
Safety
Delay
Design
Traffic Facility Provision /
Improvement
Sustainability• Economical
• Environmental• Social
Background
• Traffic safety: nation's economy and people's welfare.
• Intersections are the most critical locations: Efficiency and safety.
• Complex intersections: continual developments/alterations in urban
areas
• Confusing, overbuilt and unavoidable: difficult locations on a road
network.
• To ensure safe and efficient movement: controls at different levels.
• Due to the heterogeneity and non-lane based traffic delay arise.
• India, most of the intersections are uncontrolled

• Inappropriate traffic control at intersection
• Inadequate sight distance at intersection
• Inadequate guidance for motorists
• Vehicle conflicts with pedestrian
• Poor operational performance of signalised intersection
• Misjudgement of gaps in traffic
• Over-Speeding and Dilemma
• Non-compliance with intersection traffic control devices
• Signs and Marking are absent
• Lack of proper visibility
• Facilities for users like pedestrian and non-motorized
vehicles are rarely provided
Major Problems Observed at Intersections
Auxiliary lanes Provision
Pedestrian Facilities
On-street parking
Accidents, persons killed and injured by type of traffic control 2017-2018
Accident by type of road junction at the All India level for 2017-2018
As per report of Road Accident in India (MoRTH 2018)
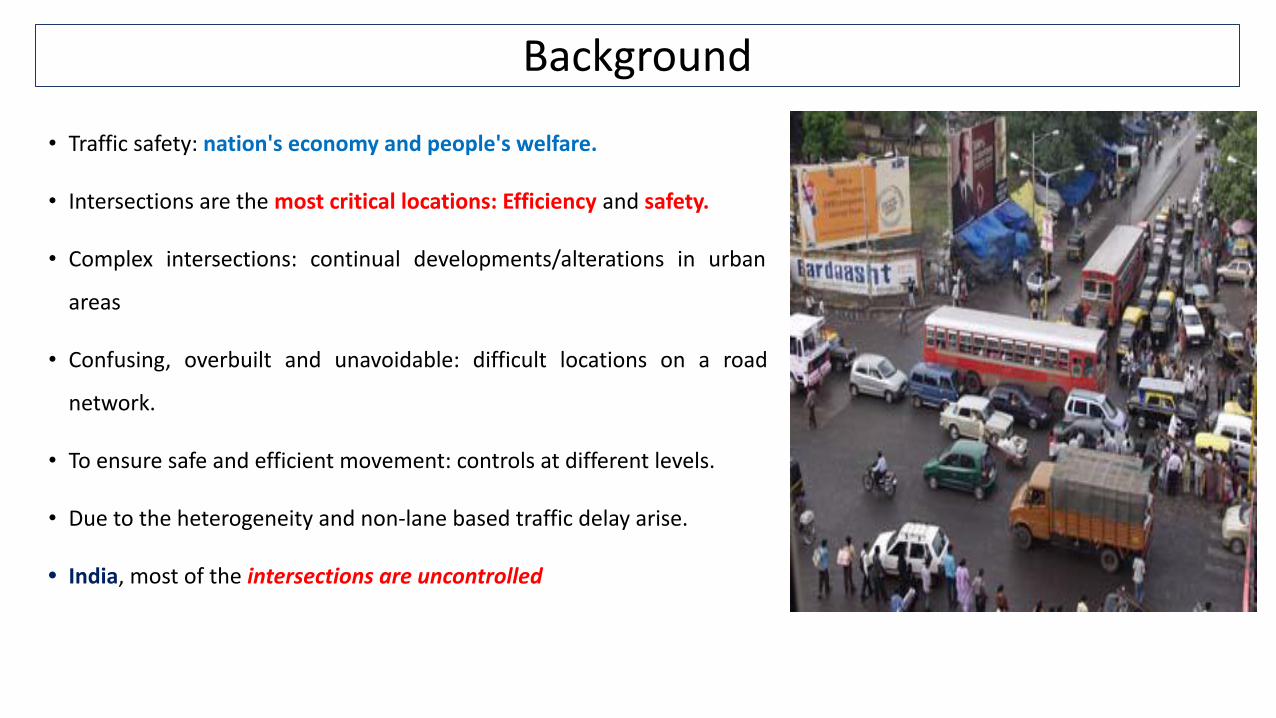
Need for Safety in Design of Intersections
Junction
Type
Number of Accidents Persons Killed Persons Injured
2017 2018 2017 2018 2017 2018
T-Junction56,363
(12.1%)
57,652
(12.3%)
16,939
(11.5%)
15,608
(10.3%)
57,072
(12.1%)
55,589
(11.8%)
Y-Junction31,249
(6.7%)
26,220
(5.6%)
9,806
(6.6%)
7,866
(5.2%)
31,108
(6.6%)
24,003
(5.1%)
Four arm
Junction
34,630
(7.4%)
28,125
(6%)
9,832
(6.6%)
7,652
(5.1%)
32,341
(6.9%)
26,178
(5.6%)
Staggered
Junction
26,695
(5.7%)
22,557
(4.8%)
8,790
(5.9%)
7,921
(5.2%)
26,526
(5.6%)
21,411
(4.6%)
Round about
Junction
26,916
(5.8%)
50,515
(4.4%)
8,706
(5.8%)
6,765
(4.5%)
27,032
(5.7%)
19,193
(4.1%)
Others*2, 89,057
(62.2%)
3, 11,975
(66.8%)
93,939
(63.5%)
1, 05,605
(69.7%)
2, 96,896
(63%)
3,
23,044
(68.8%)
*Any other type not covered by the specified road junction
given above such as junction with greater than 4 arm,
Manned and unmanned rail crossing, expressway.
Traffic ControlNumber of Accidents Persons Killed Persons Injured
2017 2018 2017 2018 2017 2018
Traffic Light
Signal
16,563
(3.6%)
13,726
(2.9%)
4,058
(2.7%)
3,325
(2.2%)
15,547
(3.3%)
12,468
(2.7%)
Police
Controlled
13,577
(2.9%)
12,793
(2.7%)
4,114
(2.8%)
4,090
(2.7%)
12,590
(2.7%)
11,519
(2.5%)
Stop Sign11,140
(2.4%)
6,513
(1.4%)
3,346
(2.3%)
2,491
(1.6%)
10,812
(2.3%)
5,665
(1.2%)
Flashing
Signal/Blinker
10,549
(2.3%)
7,904
(1.7%)
2,896
(2%)
2,757
(1.8%)
10,644
(2.3%)
7,378
(1.6%)
Uncontrolled1, 24,024
(26.7%)
1, 14,133
(24.4%)
39,560
(26.7%)
33,149
(21.9%)
1,24,486
(26.4)
1, 09,344
(23.3%)
Others*2, 89,057
(62.2%)
3, 11,975
(66.8%)
93,939
(63.5%)
1, 05,605
(69.7%)
2, 96,896
(63%)
3, 23,044
(68.8%)

Intersection Hierarchy by control
• Uncontrolled Intersection (stop-control)
• Uncontrolled Intersection with Channelizers (Free-Left
turn)
• Uncontrolled Intersection with Central Traffic Island
• Uncontrolled Intersection with Roundabout
• Partially Controlled Interaction (Police-Controlled)
• Signalized Intersection
• Toggled Signal Timings
• Grade Separators
Red
uce
d C
on
flic
ts -
Imp
rove
d S
afet
y

Hierarchy of Operation Control for Different Intersections
Right of WayA – 60m/45mB – 36m C - 30m D – 18m E - < 9m

Hierarchy of Rural Intersections
Class Type
AA Rotary / GS
AB Rotary /Roundabout
AC Priority
BB Priority / Roundabout
BC Priority
BD Priority
CC Priority / Roundabout
CD Priority / Roundabout
DD Priority
DE Priority
EE Priority
Category of Road
Category of Road
(NH) National Highway -(A)
(SH) State Highway-(B)
(MDR) Major District Road-(C)
(ODR) Other District Road-(D)
(VR) Village Road -(E)
(NH) National Highway -(A) AA AB AC - -
(SH) State Highway-(B) - BB BC BD -
(MDR) Major District Road-(C) - CC CD -
(ODR) Other District Road-(D) - - DD DE
(VR) Village Road -(E) - - - EE
Intersection Matrix – Non Urban (Rural) Roads

Criteria for Upgradation of Intersection
• Justification of a traffic signal should be mainly based on traffic signal warrants. (IRC: 93-1985)
1. Diversion of Traffic
2. Geometric Correction
3. Provision of Roundabout
4. Signalization
5. Grade separated Interchange
6. Traffic demand management:
Diversion / Change in Composition
Steps for Upgradation of Intersection so as to meet traffic demand:
Intersection Selection based on Traffic Flow Combination (U.K. Practice)

Design of a safe intersection depends on :
Human Factors
Driving habits
Ability to make
decisions
Driver expectancy.
Decision and reaction
time
Conformance to natural paths of
movements
Pedestrian use and habits.
Traffic Considerations
Design and actual
capacities
Design hour turning
movements
Size and operating
characteristics of
vehicles,
Types of movement
Vehicle speeds.
Transit involvement
Source: (IRC:SP:41-1994)
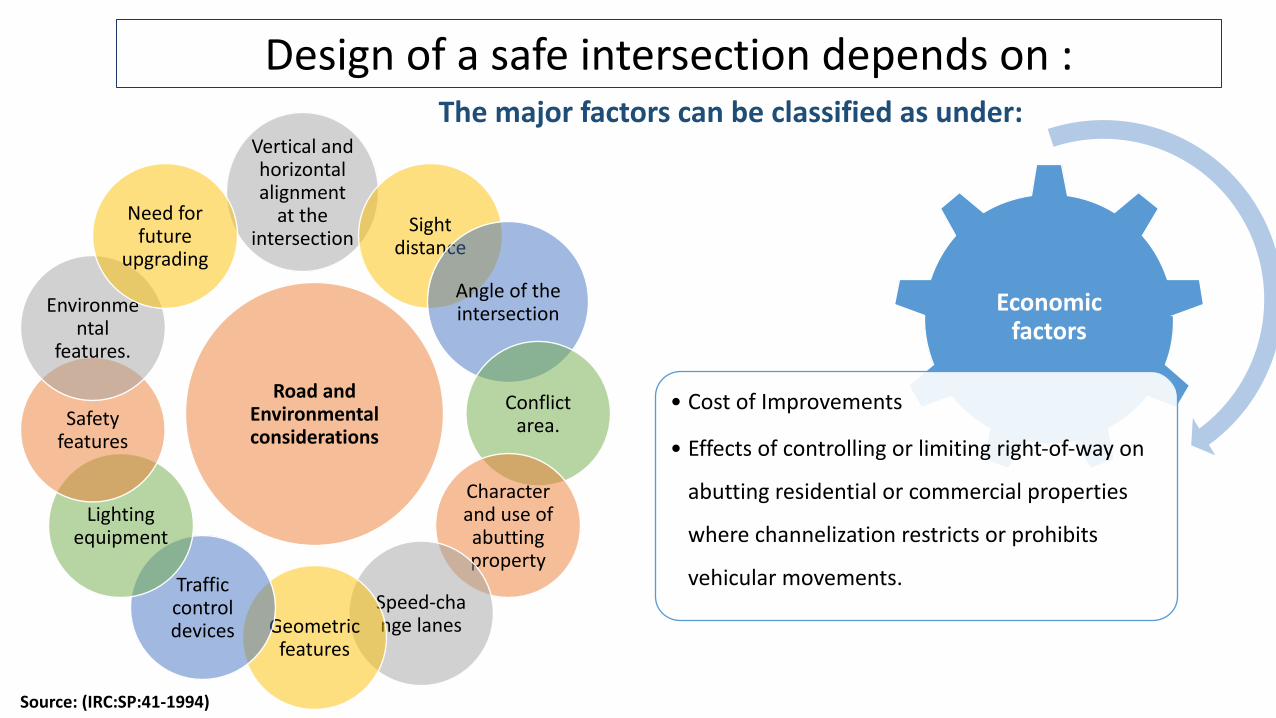
Design of a safe intersection depends on :The major factors can be classified as under:
Road and Environmental considerations
Vertical and horizontal alignment
at the intersection
Sight distance
Angle of the intersection
Conflict area.
Character and use of abutting property
Speed-change lanesGeometric
features
Traffic control devices
Lighting equipment
Safety features
Environmental
features.
Need for future
upgrading
Economic factors
• Cost of Improvements
• Effects of controlling or limiting right-of-way on
abutting residential or commercial properties
where channelization restricts or prohibits
vehicular movements.
Source: (IRC:SP:41-1994)

Basic Design Principles
Source: (IRC:SP:41-1994)
1. Uniformity
and Simplicity
2. Minimise Conflicts
points
3. Safety
4. Alignments and Profile
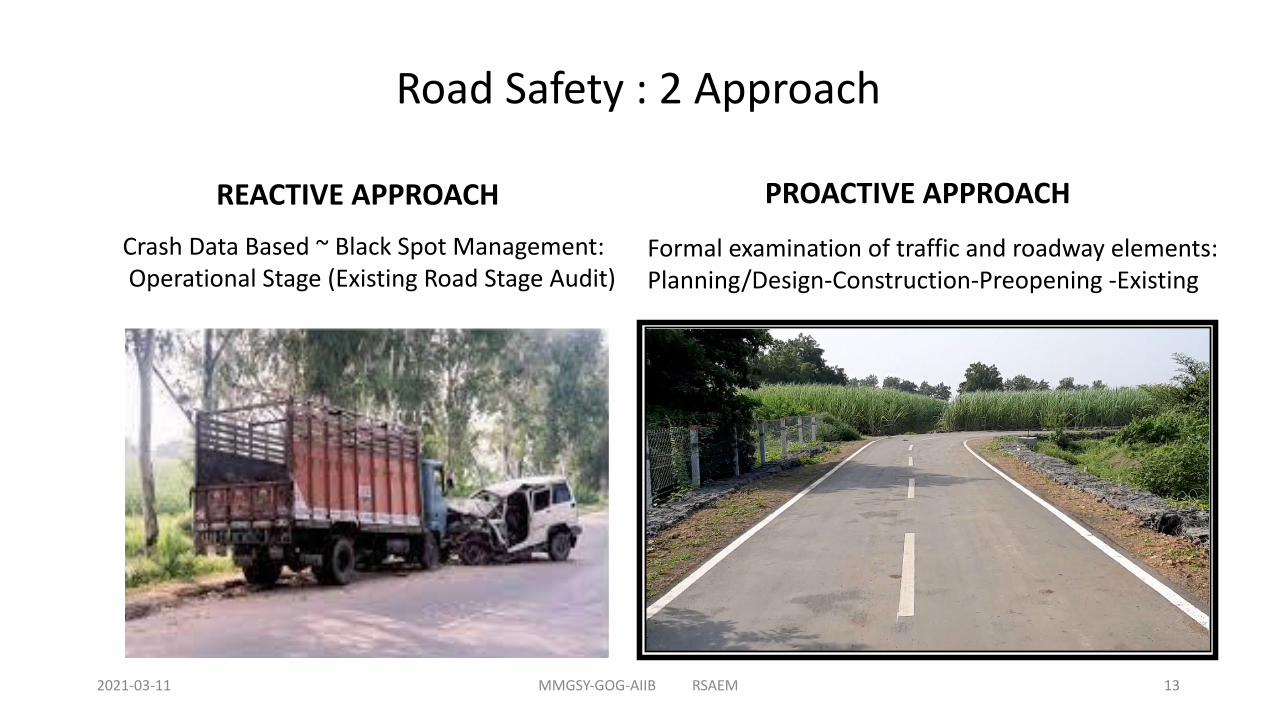
Road Safety : 2 Approach
REACTIVE APPROACH PROACTIVE APPROACH
Crash Data Based ~ Black Spot Management: Operational Stage (Existing Road Stage Audit)
Formal examination of traffic and roadway elements:Planning/Design-Construction-Preopening -Existing
2021-03-11 13MMGSY-GOG-AIIB RSAEM

• Improper geometry and inadequate channelization of traffic flow provoking conflicting traffic movements
• Insufficient pavement markings on the pavement and on channelizing islands.
• Junction signage is insufficient.
• Absence of lighting resulting in insufficient illumination.
• Inadequate sight distance to/from the side road approaches.
• Parking near junctions and encroachment of junction area by roadside hawkers
Intersections: Planning and Design Issues
Kamrej- Shampur Road (SH-167) Mahuva – Anawal Road (SH-165) Mahuva – Anawal Road (SH-165)
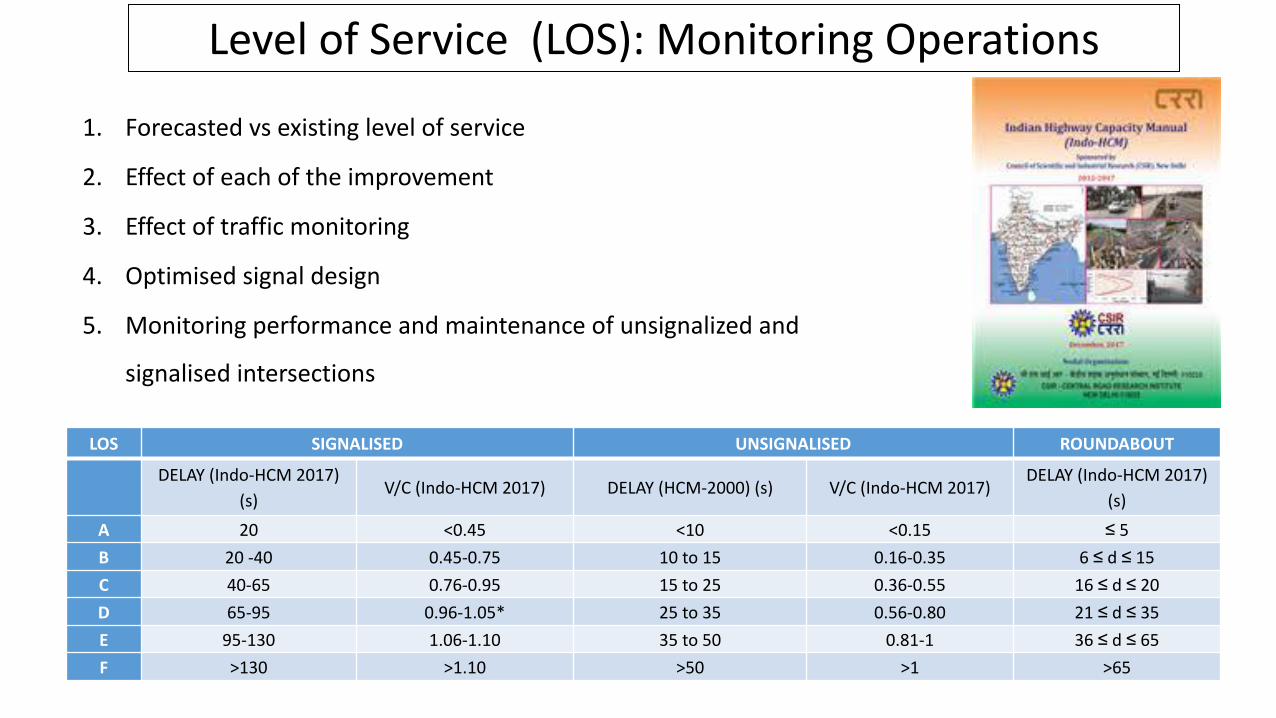
LOS SIGNALISED UNSIGNALISED ROUNDABOUT
DELAY (Indo-HCM 2017)
(s)V/C (Indo-HCM 2017) DELAY (HCM-2000) (s) V/C (Indo-HCM 2017)
DELAY (Indo-HCM 2017)
(s)
A 20 <0.45 <10 <0.15 ≤ 5
B 20 -40 0.45-0.75 10 to 15 0.16-0.35 6 ≤ d ≤ 15
C 40-65 0.76-0.95 15 to 25 0.36-0.55 16 ≤ d ≤ 20
D 65-95 0.96-1.05* 25 to 35 0.56-0.80 21 ≤ d ≤ 35
E 95-130 1.06-1.10 35 to 50 0.81-1 36 ≤ d ≤ 65
F >130 >1.10 >50 >1 >65
Level of Service (LOS): Monitoring Operations
1. Forecasted vs existing level of service
2. Effect of each of the improvement
3. Effect of traffic monitoring
4. Optimised signal design
5. Monitoring performance and maintenance of unsignalized and
signalised intersections

Source: Google Satellite Image
Study Area : Kamrej Intersection Kamrej Intersection : Major Movements
A Case study ~ Kamrej Intersection improvement (Nh-48 & Surat-Kamrej BRT Corridor)

Illegal Parking on roadsides
Kamrej Gam Approach
Mumbai to Surat Approach
Roadside friction at Kamrej
Mumbai to Surat Approach
Ahmedabad to Kamrej Gam Approach
Vendors occupied space on footpath
Sight distance is reduced at turning

Lack of proper pedestrian infrastructure
Safety of Pedestrians is big issue
Wrong (Illegal) side movement of vehicles
Ahmedabad Approach
Mumbai Approach
Many illegal movements are observed due to nearby residential areas

Reconnaissance survey
• Site visit
Road Traffic Survey• Traffic Videographic
survey
Traffic Data extraction• Traffic count from
recorded video
Traffic analysis• V/C ratio• Traffic flow• Traffic composition
Design of intersection• Traffic island• Slip lane• Median
Drawing preparation• Development Plan• Road signages• Road markings • Typical cross sections
Demarcation queriesWhile actual
implementation
Intersection Re-design Methodology

� Proposed channelizing island for separation of
Left turning traffic for each approach.
� Large amount of pedestrian flow is observed.
Speed table is recommended considering safety of
pedestrian while crossing the road.
� Continuous footpath protected with railing for safe
pedestrian movement.
� Central island is proposed with four lanes, which
can regulate traffic coming from various directions
and prevent traffic jam condition.
Improvement Measures

� Haphazard parking is observed at
intersection area which is affecting
traffic flow.
� To prevent haphazard parking on
road, separate parking space is
proposed for auto rickshaw, taxi, etc.
ENTRYEXIT
Proposed auto rickshaw stand at MFZ (Multi functional zone)
Improvement Measures

Space below the bridge can be used as multi functional zone.
Improvement Measures

Design model – Base condition
Ahmedabad
KamrejRoyal residency
MumbaiSurat
Design model – Central Island
Design model – Widened Roads
Design model – Central Island + Free Left
Ahmedabad KamrejRoyal residency
MumbaiSurat
Ahmedabad
KamrejRoyal residency
MumbaiSurat
Ahmedabad Kamrej
Royal residency
MumbaiSurat
Traf
fic
Sim
ula
tio
n

Aggregate Improvement Model
Ahmedabad
Kamrej
Royal residency
MumbaiSurat
Ahmedabad Kamrej Royal residency
MumbaiSurat
Royal residency
Mumbai
Surat
Ahmedabad
Kamrej
Royal residency Mumbai
Surat
Ahmedabad
Kamrej

MovementsBase Model
(s)Central Island
(s)Widened Roads
(s)
Central Island + Widened Roads
(s)
Central Island+ Free left
(s)
Final Model(s)
Surat-Ahmedabad 18 20 21 23 13 12
Surat-Kamrej 92 83 93 83 68 63
Surat-Mumbai 92 83 91 87 78 76
Ahmedabad-Kamrej 78 76 79 79 8 7
Ahmedabad-Mumbai 72 73 64 79 86 62
Ahmedabad-Surat 73 67 70 80 87 61
Kamrej-Mumbai 82 84 85 89 14 15
Kamrej-Surat 80 83 78 91 85 71
Kamrej-Ahmedabad 79 84 76 94 81 69
Mumbai-Surat 15 20 13 20 4 3
Mumbai-Ahmedabad 107 60 60 62 47 51
Mumbai-Kamrej 115 58 56 61 38 39
Delay For Different Scenarios

Movements Base Model Roundabout Widened RoadsCentral Island + Widened Roads
Central Island + Free left
Final Model
Surat-Ahmedabad C C B B A ASurat-Kamrej F F D D D C
Surat-Mumbai F F D D D DAhmedabad-Kamrej F F D D A A
Ahmedabad-Mumbai F F C D D CAhmedabad-Surat F F D D D CKamrej-Mumbai F F D D A A
Kamrej-Surat F F D D D DKamrej-Ahmedabad F F D D D D
Mumbai-Surat B B A A A AMumbai-Ahmedabad F F C C C C
Mumbai-Kamrej F F C C B B
Level of Service (LOS): Simulation

Haphazard Parking creates traffic jam
condition
BEFORE
Field Implementation
AFTER

Anuvrat Dwar Intersection Design (Urban)

Google Satellite View of Existing Anuvrat Dwar Junction

Anuvrat Dwar Intersection Turning Movement Diagram

Anuvrat Dwar Intersection Design

Anuvrat Dwar Intersection Conflict Diagram (IS-1) : Existing vs Proposed Comparison
Vehicle conflicts Points
Intersection 1
Crossing Type
1 Crossing 3
2 Merging 3
3 Diverging 4
Total 10
• Existing
• Proposed

Anuvrat Dwar Intersection Conflict Diagram (IS-2) : Existing vs Proposed Comparison
Vehicle conflicts Points
Intersection 2
Crossing Type
1 Crossing 4
2 Merging 8
3 Diverging 7
Total 19
• Existing
• Proposed

Anuvrat Dwar Intersection Conflict Diagram (IS-3) : Existing vs Proposed Comparison
Vehicle conflicts Points
Intersection 3
Crossing Type
1 Crossing 7
2 Merging 9
3 Diverging 3
Total 19
• Existing
• Proposed

Intersection Design Implementation Stage- 1
• Diverting all the traffic movements from
Panas Gam Approach towards Indian Oil
Petrol Pump Approach by Temporary
Barricading.
• Temporary diversion is recommended to see
response of road users for proposed design.

Intersection Design Implementation Stage- 2
• Restricting all types of vehicle movements
on road adjacent to Veer Hanuman
temple by temporary Barricading.
• This area can be developed with
horticulture and/or landscaping.

Intersection Design Implementation Stage- 3
• One-way Traffic Movement on Indian Oil
Petrol Pump Approach and Veer Hanuman
Mandir Approach.
• This is major modification proposed from
traffic operation point of view.

Intersection Design Implementation Stage- 4
• Demolition of RCC Wall Structure under
Fly Over and temporary construction of
Central Elliptical Island as per design.
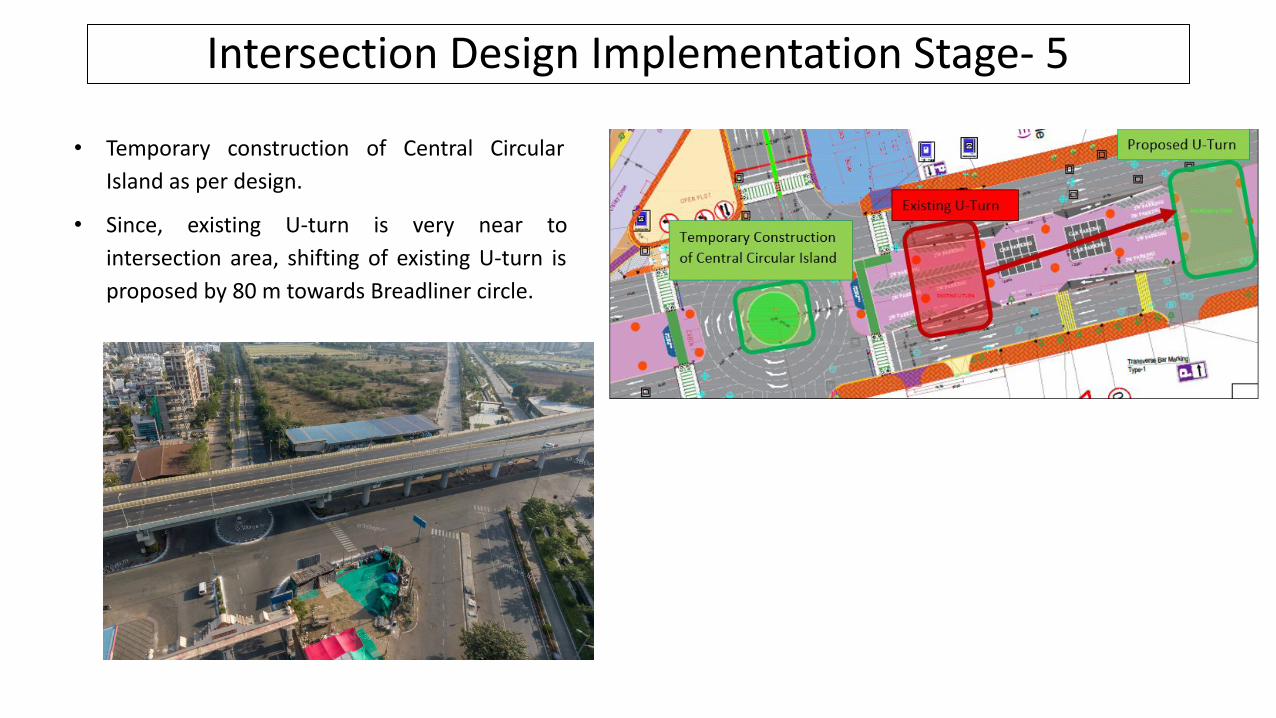
Intersection Design Implementation Stage- 5
• Temporary construction of Central Circular
Island as per design.
• Since, existing U-turn is very near to
intersection area, shifting of existing U-turn is
proposed by 80 m towards Breadliner circle.

Intersection Design Implementation Stage- 6
• Temporary Construction of Channelizing Island
as per design.
• It is essential for free left turning movement.

Intersection Design Implementation Stage- 7
• Shifting of Evershine Marble Gates as per design to
ensure that provision of property access near
intersection area may cause serious safety issues for
road users.

Intersection Design Implementation Stage- 8
• Providing continuous pedestrian footpath and
pedestrian crosswalk as per design along all the
approaches.
• Continuous and safe pedestrian movement from one
approach to any other is the measure for pedestrian
safety.

Intersection Design Implementation Stage- 9
• Provision of Public Bike Sharing (PBS) docking
stations at locations proposed in design drawing.
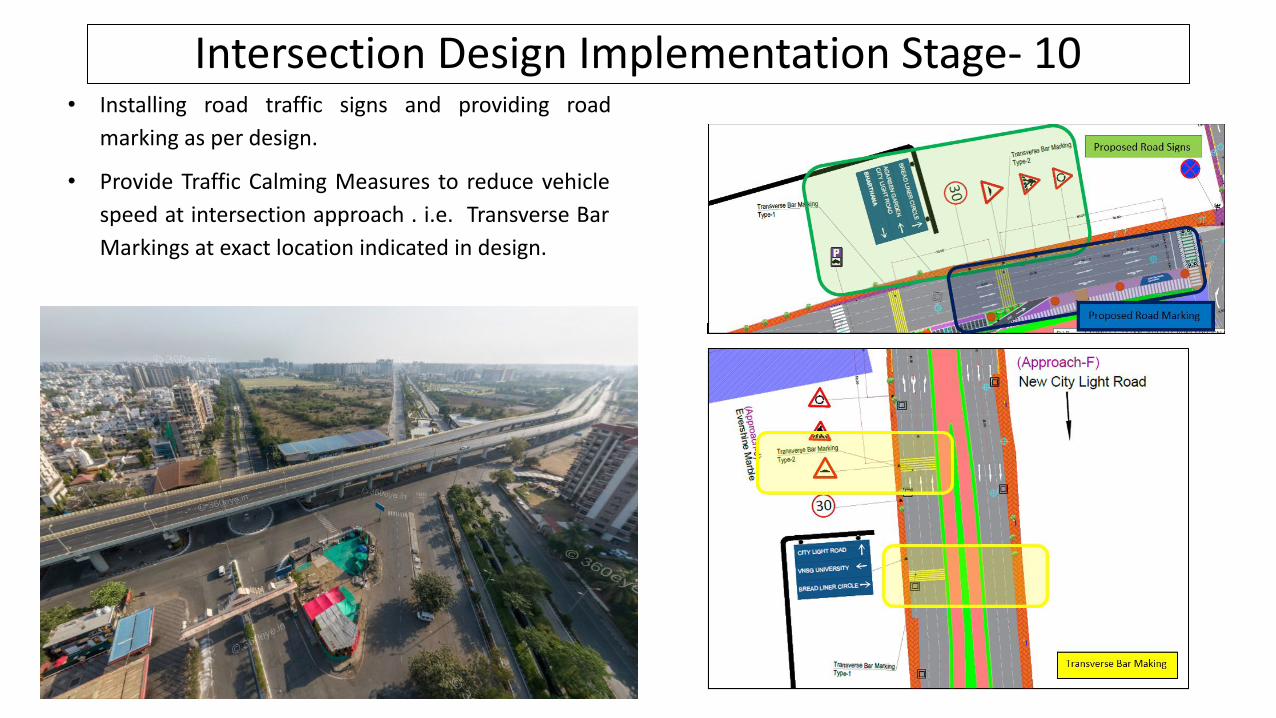
Intersection Design Implementation Stage- 10• Installing road traffic signs and providing road
marking as per design.
• Provide Traffic Calming Measures to reduce vehicle
speed at intersection approach . i.e. Transverse Bar
Markings at exact location indicated in design.

Intersection Design Implementation Stage- 11
• Provision of parking for car and two-wheeler as per
design drawing.

Pictorial View of Study Site: (a) Rachana Circle, Surat (b) Vadodara (c) Udhana, Surat (d) Prime Arcade, Surat (e) Faridabad, Delhi
Intersection Operations’ Safety Analysis ~ Crossing Conflicts
(a) (b) (c)
(d) (e)

Spatial distribution of Crossing Conflicts
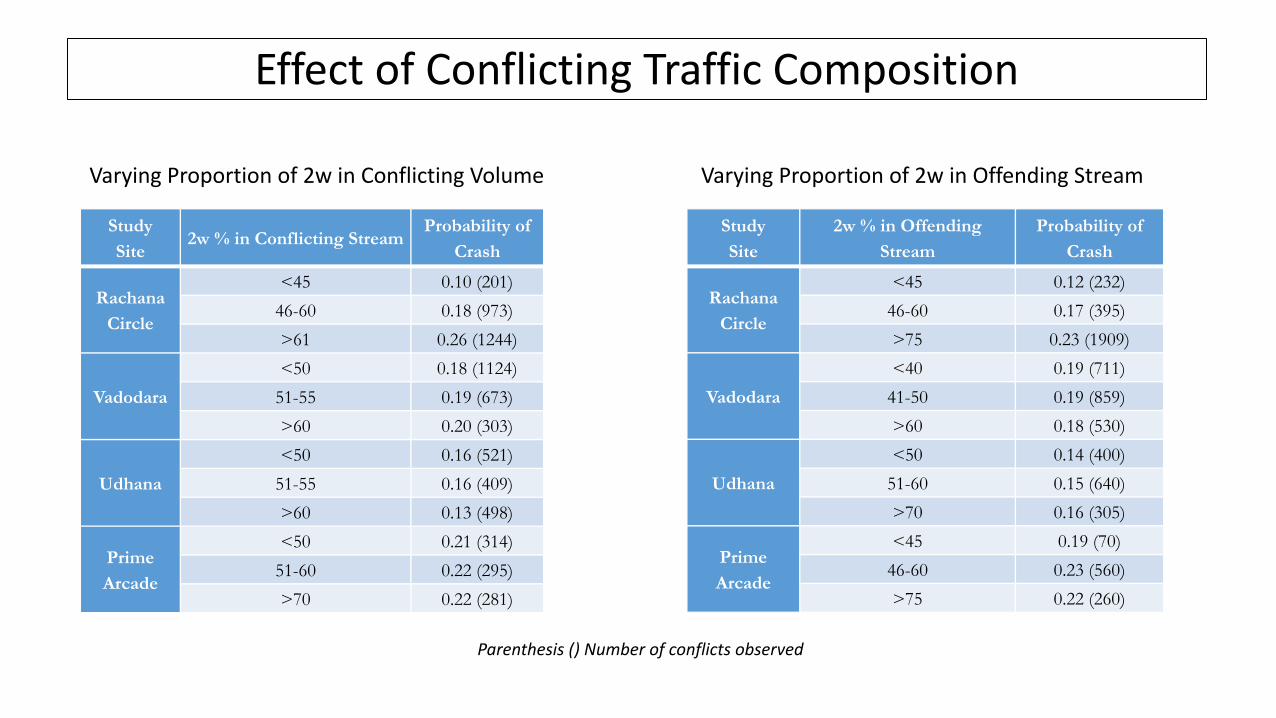
Varying Proportion of 2w in Conflicting Volume
StudySite
2w % in Conflicting Stream Probability of
Crash
Rachana Circle
<45 0.10 (201)46-60 0.18 (973)>61 0.26 (1244)
Vadodara<50 0.18 (1124)
51-55 0.19 (673)>60 0.20 (303)
Udhana<50 0.16 (521)
51-55 0.16 (409)>60 0.13 (498)
Prime Arcade
<50 0.21 (314)51-60 0.22 (295)>70 0.22 (281)
Parenthesis () Number of conflicts observed
Varying Proportion of 2w in Offending Stream
StudySite
2w % in Offending Stream
Probability of Crash
Rachana Circle
<45 0.12 (232)46-60 0.17 (395)>75 0.23 (1909)
Vadodara<40 0.19 (711)
41-50 0.19 (859)>60 0.18 (530)
Udhana<50 0.14 (400)
51-60 0.15 (640)>70 0.16 (305)
Prime Arcade
<45 0.19 (70)46-60 0.23 (560)>75 0.22 (260)
Effect of Conflicting Traffic Composition

Risk Characterization
Severity varying with speed??
PET Value (s)Speed of Conflicting
vehicle (kmph)Risk Characterization Conflict Location
-1 to 0 35-50 Fatal Accident
Rear-end of conflicting vehicle
-2.13 to -1 30-45 Grievous Injury Accident
-3.73 to -2.14 25-37 Minor Injury Accident
-6 to -3.74 12-32 Non-Injury Accident
0 to 1 35-50 Fatal Accident
Front-end of conflicting vehicle
1 to 2.33 25-45 Grievous Injury Accident
2.34 to 3.9 15-35 Minor Injury Accident
4 to 6 12-32 Non-Injury Accident
Validation with crash data
Obtained through clustering

Disordered and Ordered Traffic Flow Conditions
a) ITO intersection, New Delhi, India
b) MI Road Jaipur, India
c) Old RTO intersection, Surat, India
d) USA: Universal Studio City, Lankershim
Boulevard, California
Signalized Intersections


Spatio-Temporal Characteristics
• Conflicts exist in the upstream area
of the stop line during red phase.
• As time progresses, occurrence zone
of conflict, shifts away from the stop
line in the upstream section
• At the end of the red phase and
start of the green phase, the conflict
intensive zone starts appearing at
and immediately after the stop line

Involvement of Vehicle class in conflicts
2W’s involve in more
numbers of conflicts

Comparison of Conflicts between Ordered and Disordered Traffic flow conditions
• Spatial plot of interactions
• X-Axis: Longitudinal Distance
• Y-Axis: Carriageway Width
• Zero on x axis represents stop line
Identified Probable Conflicts
(USA)
Identified Probable Conflicts (India)

Challenges ~ Safety at Intersections
Intersection Design
• Based on single value of design vehicle, design driver, normal weather
• Considering full compliance by users
• Inequity among provisions for different road users
• Expecting perfect implementation of what is designed
• Assuming ideal traffic operation / perfect roadway conditions
Intersection Operation
• Variability in road user characteristics
• Variability in traffic ~ vehicle & pedestrian characteristics
• Varying compliance level by different road users ~ Driver Behaviour
• Inadequate / implementation and enforcement
• Static Controls / Communication
Adequate & Reliable Traffic Data Availability ?????

IRC: 35-2015IRC: 67-2012 IRC: 79-2019 IRC: 99-2018 IRC: 108-2015
References- IRC Codes
IRC:65-2017IRC:SP 41-1994 IRC:92-2017IRC:93-1985 IRC:103-2012

RESEARCH GROUP

THANK YOU…!
SVNIT