Mestrado Integrado em Medicina Dentária Faculdade de ...
32
Mestrado Integrado em Medicina Dentária Faculdade de Medicina da Universidade de Coimbra Avaliação do aumento da temperatura pulpar induzida por fotopolimerizadores com recurso a redes de Bragg gravadas em fibra ótica: estudo piloto Evaluation of pulpal temperature rise induced by light curing units with fiber Bragg grating sensors: a pilot study Clara Jacinta Rodrigues Rebelo Orientador: Prof. Doutor João Carlos Ramos Co-orientadora: Dra. Alexandra Vinagre Coimbra, 2014
-
Upload
khangminh22 -
Category
Documents
-
view
5 -
download
0
Transcript of Mestrado Integrado em Medicina Dentária Faculdade de ...

Mestrado Integrado em Medicina Dentária Faculdade de Medicina
da Universidade de Coimbra
Avaliação do aumento da temperatura pulpar induzida por
fotopolimerizadores com recurso a redes de Bragg gravadas em
fibra ótica: estudo piloto
Evaluation of pulpal temperature rise induced by light curing units
with fiber Bragg grating sensors: a pilot study
Clara Jacinta Rodrigues Rebelo
Orientador: Prof. Doutor João Carlos Ramos
Co-orientadora: Dra. Alexandra Vinagre
Coimbra, 2014

2
Avaliação do aumento da temperatura pulpar induzida por
fotopolimerizadores com recurso a redes de Bragg gravadas em
fibra ótica: estudo piloto
Evaluation of pulpal temperature rise induced by light curing units
with fiber Bragg grating sensors: a pilot study
Rebelo C.*, Ramos J. C.**, Vinagre A.***
* Aluna do quinto ano do Mestrado Integrado em Medicina Dentária da Faculdade de
Medicina da Universidade de Coimbra
** Professor auxiliar do Mestrado Integrado em Medicina Dentária da Faculdade de Medicina
da Universidade de Coimbra
*** Assistente convidada do Mestrado Integrado em Medicina Dentária da Faculdade de
Medicina da Universidade de Coimbra
Dissertação submetida à Faculdade de Medicina da Universidade de Coimbra em
cumprimento parcial dos requisitos para atribuição do grau de Mestrado Integrado em
Medicina Dentária.
Área de Medicina Dentária, Faculdade de Medicina, Universidade de Coimbra
Av. Bissaya Barreto, Blocos de Celas
3000-075 Coimbra
Portugal
E-mail: [email protected]

3
Abstract
Introduction: There are several clinical procedures that expose teeth to temperatures
above physiologic conditions. Temperature rise can be transmitted to the pulp tissue and lead
to cell injuries if it reaches a certain threshold. Light emitting diode (LED) light-curing units
(LCUs) are one of the main tools that may induce temperature rise. With the current tendency
to increase the power intensity of LEDs one can speculate about the clinical injuries that can
be induced by those devices.
Objectives: The aim of this research was to make an in vitro pilot study regarding the
ability of optical fiber Bragg grating (FBG) sensors to assess the pulp chamber temperature
rise induced by LED LCUs in different polymerization modes.
Materials and Methods: Four different LED LCUs were used to this study: Bluephase
20i (Ivoclar Vivadent, Schaan, Liechtenstein), Demi Ultra (Kerr, Orange, CA, U.S.A), SPEC 3
(Coltène Whaledent, Cuyahoga Falls, OH, U.S.A.) and Valo (Ultradent, South Jordan, UT,
U.S.A). In order to test the maximum temperature achieved by those devices, the light tips
were placed directly on the surface of the FBG sensor, according to thirteen curing protocols.
Nine of those performed four light emissions providing a 30 seconds interval between each
one to test the cumulative effect of temperature rise. The remaining four were performed in a
single period. Afterwards, three upper premolars extracted on account of orthodontic reasons
were immediately stored in a 37°C saline bath to preserve the integrity of the pulpal tissues
and to simulate the physiologic temperature. Thereafter, the palatal surface of the crown was
perforated with a very small diameter round bur where an FBG sensor was introduced in the
pulpal chamber until de centre of pulp tissue. The LED LCUs were positioned at the buccal
surface of the teeth and, according to the curing protocols previously selected, the teeth were
irradiated and the temperature variation was registered. Within each test baseline temperature
recovering was ensured. The tests were repeated in the different curing modes and the results
were compared considering the polymerization time and the irradiance of each LED
LCU.polymerization mode. Statistical analysis was performed with non-parametric tests at a
significance level of 0.05. Pearson Correlation was used to establish association between
energy density and temperature variation.
Results: For all four peak light-curing protocols an increase of the intra-pulp temperature
was always registered but the cumulative effect of light emissions was only significant (p<0.05)
for the following curing modes: Bluephase turbo Power 1, Demi Ultra PLS and Standard, SPEC
Standard, Valo High Power 1 and Xtra Power 1. A strong positive correlation was found
between energy density and intra-pulp temperature increase (R=0.658; p=0.01).

4
Conclusions: In the experimental conditions of this study, some curing modes with high
energy densities can induced a critical temperature rise in pulp tissue. FBG sensors proved to
be an accurate method for intra-pulp temperature measurements.
Keywords: Temperature, dental pulp, light curing unit, light-curing

5
Resumo
Introdução: Na prática clínica diária existem diversos procedimentos que expõem os
dentes a temperaturas acima da condição fisiológica. Estes aumentos de temperatura podem
ser transmitidos ao tecido pulpar e induzir danos celulares se atingirem determinados valores
considerados críticos. Os aparelhos fotopolimerizadores de díodos emissores de luz
apresentam-se como um dos principais equipamentos que podem gerar um aumento de
temperatura. Dada a tendência atual para o aumento da densidade de potência destes
aparelhos fotopolimerizadores, as temperaturas atingidas pelos mesmos e transmitidas aos
tecidos dentários devem ser analisadas a fim de se aferir a sua segurança.
Objetivos: Realizar um estudo piloto in vitro para avaliar a capacidade de medição de
temperatura das redes de Bragg gravadas em fibra ótica (FBG), bem como a variação de
temperatura induzida no tecido pulpar por diferentes aparelhos fotopolimerizadores de LEDs
em diferentes modos de fotopolimerização.
Materiais e Métodos: Quatro aparelhos fotopolimerizadores de LEDs foram
selecionados para este estudo: Bluephase 20i (Ivoclar Vivadent, Schaan, Liechtenstein), Demi
Ultra (Kerr, Orange, CA, U.S.A), SPEC 3 (Coltène Whaledent, Cuyahoga Falls, OH, U.S.A.) e
Valo (Ultradent, South Jordan, UT, U.S.A).. De modo a registar a temperatura máxima atingida
na superfície da ponta dos fotopolimerizadores, a temperatura emitida foi inicial e diretamente
medida encostando o sensor da rede de Bragg gravada em fibra ótica na sua superfície
durante a emissão de 13 modos de fotopolimerização previamente distribuídos pelos 4
aparelhos.
Foram realizadas quatro emissões de luz com 30 segundos de intervalo entre cada uma
em nove dos treze modos de fotopolimerização, a fim de aferir o efeito cumulativo do aumento
da temperatura. Nos restantes quatro modos as emissões de luz foram realizados num único
período de tempo. De seguida, 3 pré-molares hígidos foram extraídos no seguimento de
tratamentos ortodônticos e preservados em soro fisiológico a 37°C de modo a manter a
integridade dos tecidos pulpares, simulando também a temperatura in vivo. Posteriormente,
as superfícies palatinas foram perfuradas com uma broca diamantada esférica de pequeno
calibre e o sensor foi introduzido na câmara pulpar. Os aparelhos fotopolimerizadores foram
posicionados junto às superfícies vestibulares dos dentes e os programas de
fotopolimerização previamente estabelecidos foram testados, sendo a variação de
temperatura registada pelo mesmo. Entre cada medição foi assegurada a recuperação da
temperatura de base inicial (±37°C). Os resultados foram comparados considerando o tempo
de polimerização e a radiância de cada modo de fotopolimerização.
6
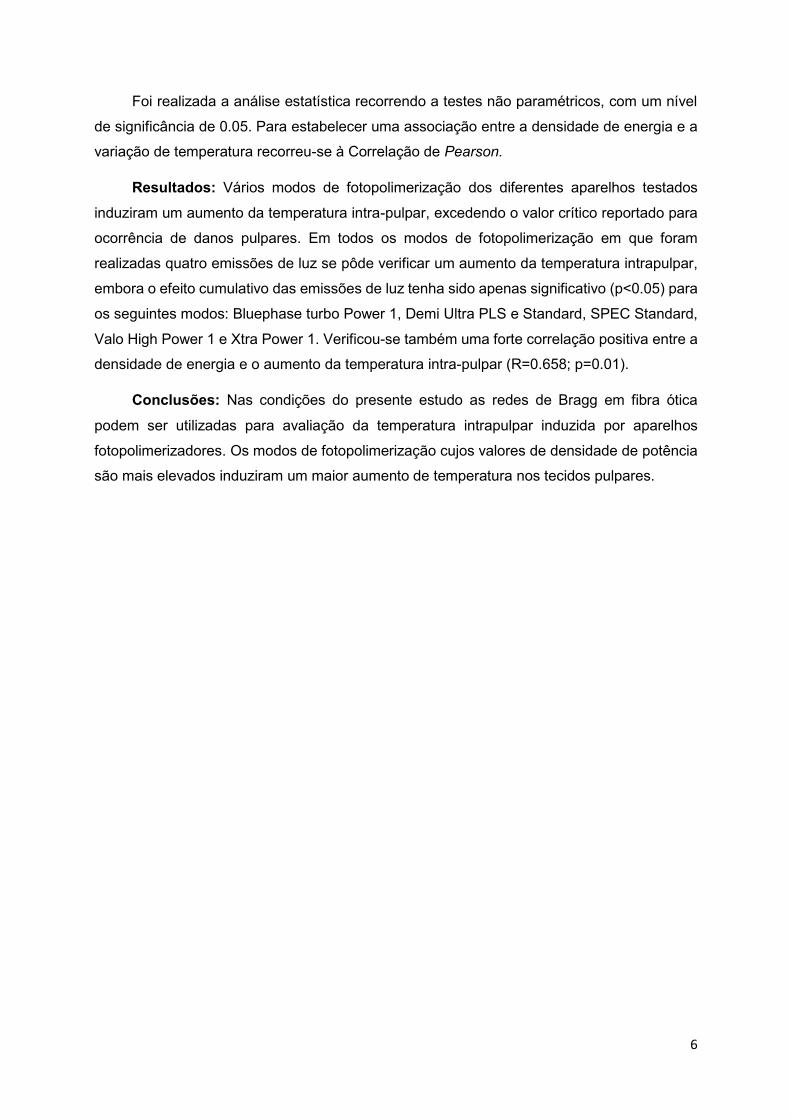
Foi realizada a análise estatística recorrendo a testes não paramétricos, com um nível
de significância de 0.05. Para estabelecer uma associação entre a densidade de energia e a
variação de temperatura recorreu-se à Correlação de Pearson.
Resultados: Vários modos de fotopolimerização dos diferentes aparelhos testados
induziram um aumento da temperatura intra-pulpar, excedendo o valor crítico reportado para
ocorrência de danos pulpares. Em todos os modos de fotopolimerização em que foram
realizadas quatro emissões de luz se pôde verificar um aumento da temperatura intrapulpar,
embora o efeito cumulativo das emissões de luz tenha sido apenas significativo (p<0.05) para
os seguintes modos: Bluephase turbo Power 1, Demi Ultra PLS e Standard, SPEC Standard,
Valo High Power 1 e Xtra Power 1. Verificou-se também uma forte correlação positiva entre a
densidade de energia e o aumento da temperatura intra-pulpar (R=0.658; p=0.01).
Conclusões: Nas condições do presente estudo as redes de Bragg em fibra ótica
podem ser utilizadas para avaliação da temperatura intrapulpar induzida por aparelhos
fotopolimerizadores. Os modos de fotopolimerização cujos valores de densidade de potência
são mais elevados induziram um maior aumento de temperatura nos tecidos pulpares.

7
Introduction
It has been shown that clinical procedures using ultrahigh-speed tooth preparation
devices1-3, electrothermal debonding of ceramic brackets4-6 and orthodontic bonding7-9, laser
in caries detection and prevention3, 10, power-bleaching11, 12, hypersensitivity treatment13,
fabrication of provisional restorations14-17, heated composites18 and the use of light-curing units
(LCUs)19-32 can lead to intrapulpal temperature rise. Those potential harmful stimuli may
develop symptoms like hyperalgesia, dentinal hypersensitivity and spontaneous pain typical of
acute pulpitis33. Histopathologically, some changes could be detected, such as burn reactions
at the periphery of the pulp including injuries on the odontoblastic layer and ultimately their
degeneration, protoplasm coagulation, expansion of liquid in the dentinal tubules and pulp with
increased outward flow from tubules14, 18.
However, there are many factors influencing the thermal behaviour of dentine pulp
complex in vivo, including the type, intensity and duration of the applied thermal stimulus, the
remaining dental thickness, the fluid motion in dentinal tubules, the pulp microcirculation and
the pulpal blood flow changes due to stimulation of the pulpal nervous system27.
In an attempt to reduce the heat transferred to pulp tissues, many techniques have been
suggested. Pulse modulation, which enables the control light irradiance and temperature rise
in light emitting diodes (LEDs)30, ramp curing techniques or 2-step curing protocols are also
options that should be considered31. A more conservative cavity preparation, allowing thicker
dentin overlying the pulp chamber, helps to prevent the increase of thermal temperatures in
pulp during curing22. If not possible, in deep cavities with less than 0.5 mm residual dentin
thickness, a thermal isolation layer of 1 to 2 mm thickness can be provided with a glass ionomer
cement31. Performing short intervals between grinding steps when using high-speed
instruments1 and air and water cooling2, 3, 13, 14 can also limit the temperature rise during tooth
preparation and dissipate the frictional heat generated on the surface.
In 1965, Zach and Cohen in a histological experimental animal model using rhesus
monkeys demonstrated that temperature rise just of 5.5ºC in healthy pulps can induced
necrosis in about 15s of the teeth. When the intra-pulpal temperature increase was sustained
at 11.1ºC for 10 seconds, approximately 60 to 70% teeth developed irreversible pulpitis34.
Nevertheless, more recent in vivo studies suggested that average increases of 11.2°C do not
damage the pulp, since no signs of inflammation, and no reparative processes were detected
in the test samples, clinically and histologically, within 68 to 91 days after the treatment33.
According to Baldissara et al., this fact is due to the different methods through which the
thermal stimulus was provided in Zach and Cohen’s study 33.
8
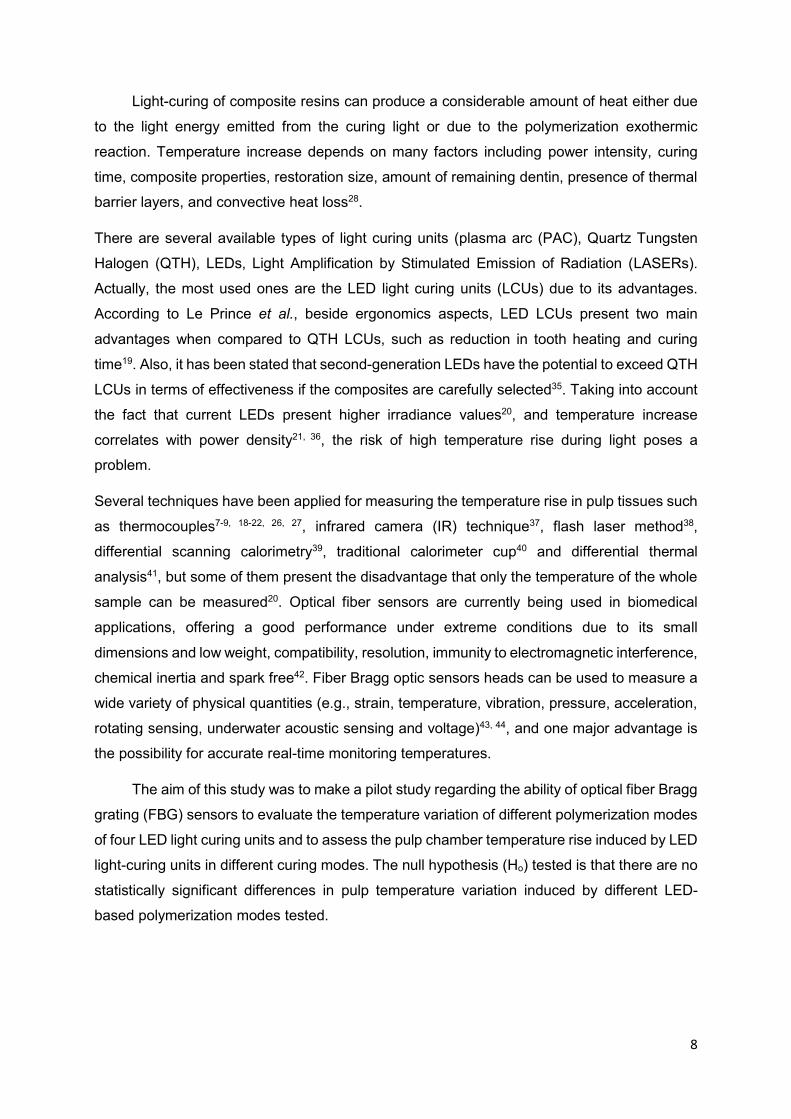
Light-curing of composite resins can produce a considerable amount of heat either due
to the light energy emitted from the curing light or due to the polymerization exothermic
reaction. Temperature increase depends on many factors including power intensity, curing
time, composite properties, restoration size, amount of remaining dentin, presence of thermal
barrier layers, and convective heat loss28.
There are several available types of light curing units (plasma arc (PAC), Quartz Tungsten
Halogen (QTH), LEDs, Light Amplification by Stimulated Emission of Radiation (LASERs).
Actually, the most used ones are the LED light curing units (LCUs) due to its advantages.
According to Le Prince et al., beside ergonomics aspects, LED LCUs present two main
advantages when compared to QTH LCUs, such as reduction in tooth heating and curing
time19. Also, it has been stated that second-generation LEDs have the potential to exceed QTH
LCUs in terms of effectiveness if the composites are carefully selected35. Taking into account
the fact that current LEDs present higher irradiance values20, and temperature increase
correlates with power density21, 36, the risk of high temperature rise during light poses a
problem.
Several techniques have been applied for measuring the temperature rise in pulp tissues such
as thermocouples7-9, 18-22, 26, 27, infrared camera (IR) technique37, flash laser method38,
differential scanning calorimetry39, traditional calorimeter cup40 and differential thermal
analysis41, but some of them present the disadvantage that only the temperature of the whole
sample can be measured20. Optical fiber sensors are currently being used in biomedical
applications, offering a good performance under extreme conditions due to its small
dimensions and low weight, compatibility, resolution, immunity to electromagnetic interference,
chemical inertia and spark free42. Fiber Bragg optic sensors heads can be used to measure a
wide variety of physical quantities (e.g., strain, temperature, vibration, pressure, acceleration,
rotating sensing, underwater acoustic sensing and voltage)43, 44, and one major advantage is
the possibility for accurate real-time monitoring temperatures.
The aim of this study was to make a pilot study regarding the ability of optical fiber Bragg
grating (FBG) sensors to evaluate the temperature variation of different polymerization modes
of four LED light curing units and to assess the pulp chamber temperature rise induced by LED
light-curing units in different curing modes. The null hypothesis (Ho) tested is that there are no
statistically significant differences in pulp temperature variation induced by different LED-
based polymerization modes tested.

9
Materials and Methods
Fiber Bragg grating (FBG) sensors produced by the Instituto de Telecomunicações (Pólo
de Aveiro, Portugal) were used to assess the temperature variation in the pulpal tissues
induced by four different LED light-curing units: Bluephase 20i, Demi Ultra, S.P.E.C. 3 and
Valo in different selected polymerization modes (Table I).
Table I: Materials used in this study, selected polymerization modes, wavelength, power density and
batch numbers.
Light Curing Unit Polymerization
programs Light type
Wavelength nm
Maximum Power density mW/cm2
Batch Number
Bluephase 20i Ivoclar Vivadent, Schaan,
Liechtenstein
High Power Polywave LED
385-515 2000 506475 Turbo
Demi Ultra Kerr, Orange, CA, U.S.A.
Pulsatile Level Shifting
LED 450-470 1250 784000644
Continuous
SPEC 3 Coltène Whaledent, Cuyahoga Falls, OH,
U.S.A.
Standard
LED 455-465 3000 130620166 3K
Ortho
Valo Ultradent, South Jordan,
UT, U.S.A
Standard
LED 395-480 4500
V04639 High Power
Xtra Power
The FBG sensor is inscribed into a photosensitive single mode optical fiber comprising
a core with 9,6 μm diameter, made of silica doped with germanium and boron, surrounded by
a cladding layer with 125 μm diameter, made of high purity silica. To provide mechanical
resistance, the fiber was coated with a polymer, consisting in a urethane acrylate coating. This
whole procedure results in an overall fiber diameter of 250 μm45, 46.
The FBG sensors used in this study were inscribed in a standard single mode
photosensitive fiber (FiberCore PS1250/1500) with a UV light (248 nm) with a KrF excimer
laser, using the phase mask technique45, 46. The region where the fiber has a protective coating
has been removed to allow recording FBG. The optical sensing interrogator used was the
sm125-500 (Micron Optics Inc, Atlanta, USA) with a wavelength resolution of 1 pm. The
interrogator has a wavelength measurement range between 1510-1590 nm. A fiber Bragg
grating sensor is a periodic modulation of the refractive index inscribed in the fiber core of a
single-mode optical fiber along a small length, with 1 mm in this study. This periodic modulation
of refractive index in the fiber core acts as a highly selective wavelength filter that satisfies the
Bragg condition. When the fiber containing the FBG is illuminated by a broadband light source,

10
only wavelengths that satisfy the Bragg condition are reflected, being all the others transmitted.
When that condition is not satisfied, the components become progressively out of phase,
nullifying themselves45, 46.
The Bragg condition is given by: λB= 2Λneff
Where λB is the Bragg wavelength, Λ is the periodic modulation of the refractive index
and neff the effective refractive index of the fiber core45, 46. The effective refractive index, as
well as the periodic spacing between the grating planes, will be affected by changes in strain
and/or temperature which will amend the center wavelength of light back reflected from a Bragg
grating. Using the first equation, the shift in the Bragg grating center wavelength due to strain
and temperature changes is given by:
∆λ𝐵 = ∆λ𝐵𝑙 + ∆λ𝐵𝑇 = 2(Λ𝜕𝑛
𝜕𝑙+ 𝑛
𝜕Λ
𝜕𝑙)∆𝑙 + 2(Λ
𝜕𝑛
𝜕𝑇+ 𝑛
𝜕Λ
𝜕𝑇)∆𝑇 = S𝑙∆𝑙 + S𝑇∆𝑇
Where ΔλBl is the strain-induced wavelength shift and ΔλBT is the temperature-induced
wavelength shift. The shift of the Bragg wavelength due to strain is mainly due to changes in
the grating period. The wavelength shift due to temperature changes is mainly justified by the
corresponding shift in the refractive index. Sl and ST are constant values and represent the
strain and temperature sensitivities of the FBG sensors.
In this work, the first term of the equation was considered null, assuming that the entire
Bragg wavelength variation was resulted of thermal changes. The considered temperature
sensitivity (ST) of the FBG sensors was 0.0089 nm/ºC.
Surface and intra-pulp measurement of temperature variations
Thirteen curing protocols were established considering basic manufacturer’s
recommendations of the light-curing units. From the abovementioned, nine performed four light
emissions providing a 30 seconds interval between each one to test the cumulative effect of
temperature rise. Temperature was registered in the four emission peaks. The remaining four
were performed in a single period. For all polymerization modes, energy density was calculated
by multiplying the power density with the exposure time in each curing mode (table II).

11
Table II: Curing modes used in this study.
Light Curing
Unit Curing Mode
Power Density
(mW/cm2)
Time period x
number of emissions
Energy
Density
(mJ/cm2)
Bluephase
20i
High Power 1200 20sx4
(30 seconds interval) 96000
Turbo 1 2000 5sx4
(30 seconds interval) 40000
Turbo 2 2000 10s 20000
Demi Ultra PLS
Pulsatile level shifting* 20sx4 (30 seconds interval)
*
Standard 1250 20sx4
(30 seconds interval) 100000
SPEC 3
Standard 1600 15sx4
(30 seconds interval) 96000
3K 2000 3sx4
(30 seconds interval) 24000
Ortho 3000 6s 18000
Valo
Standard 1000 20sx4
(30 seconds interval) 80000
High Power 1 1400 4sx4
(30 seconds interval) 22400
Xtra Power 1 3000-4500 3sx4
(30 seconds interval) 45000
High Power 2 1400 12s 16800
Xtra Power 2 3000-4500 6s 13500
*The energy density could not be calculated due to lack of value of the power density.
For surface temperature measurements all devices were positioned and stabilized in an
adjustable support and the FBG sensor was placed adjacent to the light tip, without
interference of any physical barrier (Figure 1). The FBG sensor was connected to the optical
sensing interrogator that recorded and transferred in real time the temperature variation,
measured in Celsius degrees, to a personal computer.

12
Figure 1: Surface temperature measurement of the LED LCUs with a FBG sensor.
For intra-pulp temperature measurements three caries free human upper premolars
were collected immediately after extraction on account of orthodontic reasons after the
patient`s informed consent, as approved by the Medical Faculty Ethical Committee.
The teeth were cleaned from all surrounding soft tissues and stored in a 37°C saline
bath. Buccal-palatal and mesio-distal widths were measured with a micrometer (Mitutoyo, 156-
105, Japan).
Table III: Teeth dimensions.
Buccal-palatal Width (mm) Mesio-distal Width (mm)
Tooth 1 7.9 6
Tooth 2 9.9 6.9
Tooth 3 9.9 6.8
The palatal surfaces of the crowns were then perforated with a small diameter round bur
(Diatech, Coltène, ref. 801, Switzerland) until it reached the pulp chamber. A 25-gauge, 16mm-
long needle (B. Braun Medical Inc, Melsungen, Germany) was placed in the hole until it
reached the buccal pulp chamber wall. An X-ray was taken to check whether the needle was
accurately positioned (Figure 2).
Figure 2: Radiograph checking the needle’s position.

13
Thereafter, the teeth were fixed in an individualized acrylic support and immersed up to
the cemento-enamel junction in a 37 ± 1ºC distilled thermostatic water bath (Thermostatic bath,
model no. 601/3, Nahita) which was double-monitored (Figure 3) using a digital thermometer
(Aquarium Thermo Sensor Thermometer, Marina).
Figure 3: Double temperature monitoring of thermostatic bath with digital thermometer.
The needle was used as a carrier for the FBG sensor and after reaching the correct
position it was removed from de pulp chamber, allowing the FBG sensor to stay inside and in
contact with the pulp tissue. Intra-pulp temperature assessment induced by the LED LCUs in
the pre-established curing modes (table II) was accomplished by placing the light tips touching
the buccal surface of the teeth (figure 4). The experimental model is represented on figure 5.
Figure 4: Intra-pulp temperature measurement. a) LED LCU positioned against the buccal
surface of the teeth; b) LED light curing irradiation.
a b

14
Figure 5: Experimental model: 1-optical sensing interrogator; 2-FBG sensor, 3- thermostatic water bath,
4- digital thermometer for double monitoring, 5-LCU, 6-LCU holder/support, 7- acrylic support.
Between each tested curing protocol it was ensured a complete reset of the pulp baseline
temperature. After all measurements the teeth were preserved in a 10% buffered formalin
solution and sectioned to measure the buccal thickness of enamel and dentin using a thickness
gauge (Kroeplin Poco D, 131099, Germany).
Table IV: Buccal thickness of enamel and dentin.
Thickness of buccal wall (mm)
Tooth 1 2.95
Tooth 2 3
Tooth 3 3.1
Statistical analysis
Statistical analysis was performed using SPSS20®. Differences between homologous
peaks of different curing modes were analysed using Kruskal-Wallis or Mann-Whitney tests.
Temperature variation within the same curing mode was assessed with the Friedman test.
Mixed-ANOVA was used to determine differences between the variations of temperature
among different curing modes, considering the Bonferroni correction for pairwise comparisons.
Pearson Correlation was used to establish association between energy density and
temperature variation. Significance level was set to α=0.05.
1
2
3
4
5
6
7
Distilled Water

15
Results
Descriptive statistics
Surface temperature rise induced by LED light-curing units and curing protocols is
presented in table V.
Table V: Surface temperatures induced by each curing protocol.
Surface Temperature (oC)
LED LCU Curing Mode 1st Peak 2nd Peak 3rd Peak 4th Peak
Bluephase 20i
High Power 5.24 3.30 4.79 4.68
Turbo 1 10.59 10.47 10.35 10.66
Turbo 2 11.07 -
- -
Demi Ultra PLS 21.03 23.16 24.66 25.10
Standard 14.02 17.75 15.51 17.43
SPEC 3
Standard * * * *
3K * * * *
Ortho 19.66 - - -
Valo
Standard 12.59 14.63 15.29 16.18
High Power 1 16.35 17.44 17.66 18.09
High Power 2 17.89 - - -
Xtra Power 1 * * * *
Xtra Power 2 6.61 - - -
*the equipment acquisition rate (2 Hz/second) is insufficient to follow the Bragg wavelength variation caused by the marked increase of temperature.
For surface measurements a relatively high temperature was registered for the highest
power density light-curing protocols tested. Nevertheless the higher surface temperature was
registered for the Pulsatile Level Shifting (PLS) polymerization mode of the Demi Ultra light-
curing unit.
The mean intra-pulp temperature rise is presented in table VI.

16
Table VI: Surface temperatures induced by each curing protocol.
Intra-pulp temperatures (oC)
(Mean ±Std. Deviation)
LED LCU Curing Mode 1st Peak 2nd Peak 3rd Peak 4th Peak
Bluephase 20i
High Power 3.72±1.16 6.15±0.42 6.86±1.42 7.24±1.53
Turbo 1 2.62±0.43 3.58±0.54 4.28±0.91 4.96±0.84
Turbo 2 4.23±1.17 - - -
Demi Ultra PLS 4.28±1.34 6.53±2.12 7.87±2.36 9.04±3.05
Standard 3.27±1.23 5.47±1.5 7.11±1.51 7.69±2.23
SPEC 3
Standard 3.63±0.95 5.97±1.3 7.29±1.59 7.67±2.13
3K 1.92±0.03 3.03±0.49 3.5±0.9 4.06±1.55
Ortho 5.71±1.33 - - -
Valo
Standard 8.63±1.94 9.95±1.9 10.13±1.64 10.46±2.51
High Power 1 1.9±0.79 2.7±0.88 3.39±1.07 3.73±1.39
High Power 2 5.35±1.63 - - -
Xtra Power 1 2.65±1.4 3.65±1.34 4.55±1.42 4.99±1.56
Xtra Power 2 4.29±1.55 - - -
On the 1st and 4th peaks, the highest intra-pulp temperature values registered by the FBG
sensor were 8.63ºC and 10.46ºC, respectively, both for Valo Standard. The lowest values of
1st and 4th peaks were registered on the Valo High Power 1, achieving 1.9ºC and 3.73ºC,
respectively.
For Bluephase 20i Kruskal-Wallis test found no statistically significant differences
between the first peak of all curing modes (Χ2(2)=4.36, p=0.113). Mann-Whitney test found no
statistically significant differences between the fourth peak for High Power and Turbo 1: U=1,
Z=-1,528, p=0.127.
Considering the two curing modes of Bluephase 20i with 4 light emissions, mixed-
ANOVA determined a statistical significant difference between the High Power and the Turbo
1, with the higher temperature rise associated to the higher energy density mode as
represented in graphic 1: F(1,4)=13.19, p=0.022. Friedman test detected statistically significant
increases in temperature for Turbo 1: Χ2(3)=9.0, p=0.029. High Power curing mode did not
present a statistically significant temperature rise: Χ2(3)=6.6, p=0.086.

17
Graphic 1: Comparison of temperature variation between Bluephase 20i High Power and Turbo 1
curing modes.
For Demi Ultra Mann-Whitney test found no statistically significant differences between
both the first and the fourth peak of the PLS and Standard modes: U=3, Z=-0,665, p=0.513
and U=2, Z=-1,091, p=0.275 respectively. No statistically significant differences were found
between these two curing modes, as confirmed by the F test of the mixed-ANOVA procedure,
F(1,4)=0.455, p=0.537, and plotted in graphic 2. Friedman test detected statistically significant
increases in temperature for the two curing modes: Χ2(3)=9.0, p=0.029 for PLS and Χ2(3)=8.2,
p=0.042 for the Standard mode.
Graphic 2: Comparison of temperature variation between Demi Ultra PLS and Standard curing modes.

18
For SPEC 3 there was a statistically significant difference between the first peak of all
modes, as assessed by the Kruskal-Wallis test: Χ2(2)=7, p=0.02. Pairwise comparisons
revealed that Standard and 3K modes were statistically different (p=0.036), as well as 3K and
Ortho (p=0.008). No differences were determined between Standard and Ortho modes
(p=0.092). Mann-Whitney test found no statistically significant differences between the fourth
peak of the modes Standard and 3K: U=1, Z=-1,528, p=0.127.
Considering the two modes of SPEC 3 with 4 light emissions, mixed-ANOVA determined
a statistically significant difference between the Standard and the 3K mode, with the higher
temperature rise associated to the higher energy density mode as represented in graphic 3:
F(1,4)=9.947, p=0.034. Friedman test detected statistically significant increases in
temperature for Standard curing program: Χ2(3)=9.0, p=0.029. 3K mode did not present a
statistically significant temperature rise: Χ2(3)=6.6, p=0.086.
Graphic 3: Comparison of temperature variation between SPEC Standard and 3K curing modes.
For Valo LED there was a statistically significant difference between the first peak of all
modes of Valo, as assessed by the Kruskal-Wallis test: Χ2(4)=10.733, p=0.03. Pair-to-pair
comparisons revealed that temperature rise in the Standard mode was statistically higher than
all other modes except the High Power 2 mode. The temperature achieved in the first peak of
the High Power 1 mode was statistically lower to the High Power 2 mode (table VII).

19
Table VII: Pair-to-pair comparisons of the temperature rise in the first peak for Valo LED
Compared curing modes p
Standard
High Power 1 p= 0,005*
Xtra Power 1 p= 0,012*
Xtra Power 2 p= 0,039*
High Power 2 p= 0,088
High Power 1
High Power 2 p= 0,030*
Xtra Power 1 p= 0,471
Xtra Power 2 p= 0,077
Xtra Power 1 High Power 2 p= 0,095
Xtra Power 2 p=0,245
High Power 2 Xtra Power 2 p=0,462
*Results with statistically significant differences.
One-Way ANOVA determined that the differences between the fourth peak of these
curing modes were statistically significant: F(2)= 10.78, p=0.01. However, the corresponding
non-parametric test Kruskall-Wallis detected no statistically significant differences between the
Standard, High Power 1 and Xtra Power 1 modes of Valo LED: Χ2(2)=5.60, p=0.061.
Mixed-ANOVA determined a statistical significant difference between the 3 curing modes
of Valo with four light emissions: F(2,6)=16.59, p=0.004. Post-hoc multicomparisons with
Bonferroni correction determined that the Standard mode was statistically associated to higher
temperature rise compared to the other two modes (p=0.005 vs High Power 1, p=0.012 vs Xtra
Power 1) as observed in graphic 4. High Power 1 mode and Xtra Power 1 mode presented no
differences (p>0.05). Friedman test detected statistically significant increases in temperature
for both High Power and Xtra Power modes: Χ2(3)=8.2, p=0.042. Standard curing mode did
not present a statistically significant temperature rise: Χ2(3)=6.3, p=0.096.

20
Graphic 4: Comparison of temperature variation between Valo Standard, High Power 1 and Xtra Power
1 curing modes.
Comparison of LED LCUs with similar energy densities
All curing modes were divided into 3 groups according to similar emitted energy
densities: between 80000-100000 mJ/cm2 (Bluephase High Power, Demi Ultra Standard,
SPEC 3 Standard and Valo Standard), between 40000-45000 mJ/cm2 (Bluephase Turbo and
Valo Xtra Power 1) and between 13500-24000 mJ/cm2 (Bluephase Turbo 2, SPEC 3K and
Ortho, Valo High Power 1, High Power 2 and Xtra Power 2).
For the first group with energy densities ranging from 80000 to 100000 mJ/cm2, mixed
ANOVA detected no statistically significant interaction between the LCU used and light
emission on temperature variation: F(3.56, 9.5)=1.498, p=0.278. The main effect light emission
showed a statistically significant increase in temperature at the different peaks: F(1.19,
9.5)=53,19, p<0.01.
There was a statistically significant difference between the temperature rise induced by
the different LCUs: F(3,8)=4.524, p=0.039. Graphic 5 represents the mean temperature
variation induced by Bluephase High Power, Demi Ultra Standard, SPEC Standard and Valo
Standard curing modes over the four light emissions.

21
Graphic 5: Comparison of temperature variation between Bluephase High Power 1, Demi Ultra
Standard, SPEC Standard and Valo Standard curing modes.
Post hoc analysis revealed that temperature variation was only statistically different in
the first and second peaks: F(3)= 10.382, p=0.004 and F(3)=6.59, p=0.015, respectively. Valo
Standard curing mode was statistically different from all other LCUs in the first peak and all
except Demi Ultra Standard curing mode in the second peak (table VIII).
Table VIII: Pairwise comparisons between peaks of curing modes with energy density values of 80000-
100000 mJ/cm2 (A-Bluephase High Power; B-Demi Ultra Standard; C-SPEC 3 Standard; D-Valo
Standard).
Pairwise
Comparisons
Peak 1 Peak 2 Peak 3 Peak 4
Mean
difference p
Mean
difference p
Mean
difference p
Mean
difference p
A B 0.45 >0.05 0.67 >0.05 -0.25 >0.05 -0.45 >0.05
C 0.09 >0.05 0.17 >0.05 -0.17 >0.05 -0.43 >0.05
D -4.91 0.014* -3.80 0.061 -3.59 0.25 -3.22 0.610
B C -0.36 >0.05 -0.50 >0.05 0.09 >0.05 0.01 >0.05
D -5.37 0.008* -4.48 0.026* -3.34 0.325 -2.77 0.903
C D -5.00 0.013* -3.98 0.05 -3.43 0.297 -2.78 0.891
*Results with statistically significant differences.

22
For the second group with energy densities ranging from 40000 to 45000 mJ/cm2, no
statistically significant differences were found between the first peak of Valo High Power 2 and
the 4th peak of Bluephase Turbo 1, peaks corresponding to the same energy density,
presenting a mean difference of -0.39 (95%CI [-3.32, 2.54], t (4)= -0.370, p=0.73.
For the third group with energy densities ranging from 13500 to 24000 mJ/cm2, no
statistically significant differences were found between any of the curing modes with energy
density ranging from 13500 to 24000 mJ/cm2 (Valo Xtra Power 2, Valo Xtra Power 1, SPEC
Ortho, BP Turbo 2,Valo HP 1, SPEC 3K ): F(5)= 0.765, p=0.592.
Pearson Correlation
Energy density was determined for every peak of the different curing modes of the 4
LCUs and associated to the corresponding temperature variation using Pearson Correlation.
A strong positive correlation was established between these two variables (R=0.658),
statistically significant at the p=0.01 level.
According data relative to pulp temperature rise between curing modes tested, the null
hypothesis should be rejected.

23
Discussion
Nowadays, the most widely used light sources for light-curing procedures are the QTH
and LED lights. More recently, higher light intensity modes have been introduced in LED LCUs
arising some questions about the potential side effects in pulp tissue. The thermal changes
during light curing are recognized, but there is lack of information about the temperature
changes in pulpal areas under different curing protocols and applications.
There are several factors that seem to influence this temperature variation, such as the
LCU type and energy density21, the distance between the tooth and the light output7, the type
of tooth7, the remaining dentin thickness22 and the pulp health conditions32.
Several studies compared the temperature increase on pulp chamber induced by QTH,
LED and Plasma Arc (PAC) LCUs on composite polymerization, orthodontic bonding,
bleaching treatments, among other procedures7-9, 11, 18-22. Some in vitro studies evaluated the
pulp temperature rise induced by the abovementioned LCUs types during orthodontic
bonding7-9. Temperature was measured by thermocouples placed in the pulp chambers and
results shown higher temperature values for QTH LCUs in all studies. According to these
authors, LED LCUs induce lower temperature rise than QTH curing lights with similar energy
density values. Other studies reached the same conclusion comparing QTH and LED LCUs
temperature rise during composite resin polymerization20, 22. Those results may be explained
by the different properties of those two light sources. In halogen units, only 1 per cent of the
total energy input is converted into light with the remaining energy generated as heat. The
short life of halogen bulbs and the noisy cooling fan are other disadvantages47. On the contrary,
LED units generate minimal heat and have a lifetime of more than 10 000 hours, do not need
a cooling fan, and are silent47. In the present study we only focused on LED LCUs because
LED technology is developing at a fast pace and high-intensity LED curing lights tend to
replace the oldest QTH lights.
When comparing the intra-pulp temperatures induced by LED LCUs on several studies
with the temperatures achieved in this experiment for similar energy densities, it can be
observed that in the present experiment, temperatures were generally higher. Uzel et al.
reported a temperature rise of 1.35±0.1ºC in a pre-molar during orthodontic bonding,
performed with a LED LCU curing program whose energy density was 22000 mJ/cm27. In our
experiment for an energy density of 22400 mJ/cm2 corresponding to Valo High Power 1 curing
mode, the temperature increase was 3.73±1.39ºC. The same can be observed in a study of
orthodontic buccal tubes bonding in molars. Using a curing program with an energy density of
14000 mJ/cm2, the temperature increase was 0.52±0.2ºC8, whereas in Valo Xtra Power 2
curing mode, for an energy density of 13500 mJ/cm2, the temperature increase was

24
4.29±1.55ºC. These differences are probably due to the interposition of a metallic bracket that
inhibits light transmission and increases the distance between the tip of the LCU and the pulp
chamber. Park et al. conducted an experiment in which they measured the temperature
increase on the pulp chamber of a pre-molar simulating the microcirculation with a water flow.
The tip of the LED LCU was positioned at 1mm from the buccal surface and the energy density
of the curing program was 96000 mJ/cm2, reaching a temperature increase of 11.3±0.16ºC26.
In the present study, Bluephase High Power 1 curing mode induced lower temperatures (7.24
±1.53ºC) for the same energy density. However, Valo Standard mode has an energy density
of 80000 mJ/ cm2 but it induced a higher temperature increase (10.46±2.51ºC), similar to the
results of Park et al. study.
In this in vitro study, FBG sensors were selected to evaluate real time temperature
alterations by placing the tip of the light-curing devices touching the buccal surface of the teeth.
Although this approach cannot simulate an absolute restorative clinical condition since no
cavities were performed, we can speculate that pulp temperature rise induced by the LED
devices in the present conditions would be lower due to the insulating properties of enamel
and dentin. Yazici et al. compared the pulp chamber temperature rise between a class II
occlusodistal cavity with a remaining dentin thickness of 2 mm and 1 mm in a human
mandibular molar during the composite polymerization with different LCUs. The authors
observed that a higher temperature rise was verified in the cavity with a remaining dentin
thickness of 1 mm, concluding that a more conservative cavity preparation, allowing thicker
dentin overlying the pulp chamber, can prevent increased thermal temperatures in pulp during
curing22. In the present study, only upper premolars were chosen because they have an
intermediary risk of thermal damage, between incisors and molars7, 48. Nevertheless, some
differences in tooth morphology could be seen but a relative constant enamel and dentinal
structure and thickness of the buccal wall was found among the selected teeth.
The distance between the light output and the tooth surface also influence the
temperature increase. Uzel et al. conducted an experiment with mandibular incisors and pre-
molars in which was observed that a higher temperature rise was registered with a distance of
0 mm than with 10 mm in the same tooth. The authors concluded as well that temperature rise
is higher in mandibular incisors than in pre-molars7. This fact is related to the microstructure of
tooth, which is heterogeneous and varies significantly from one sample to another with gender,
age and race of the teeth donators, as well as differences between the different types of teeth32.
Although an in vivo study suggested that average increases of 11.2°C do not damage
the pulp33, all temperature increases over 5.5ºC observed in Zach and Cohen’s study34 must
still be viewed as critical. In this study several polymerization modes of the different tested LED
25
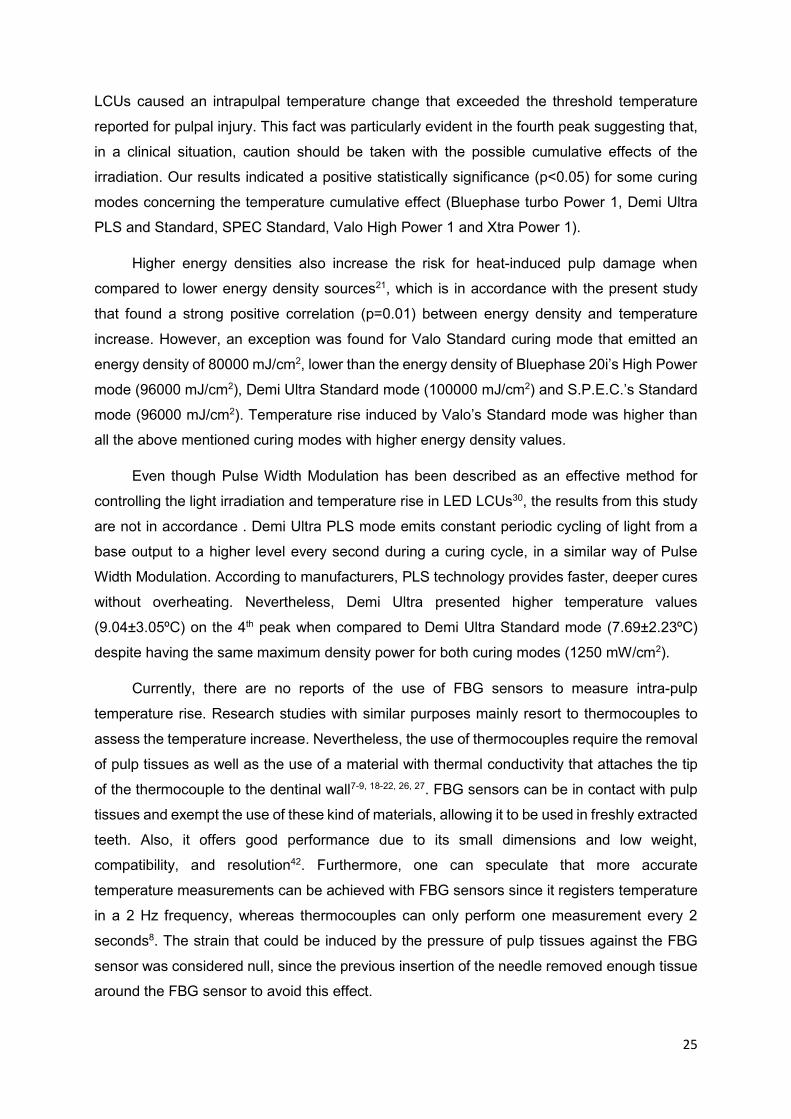
LCUs caused an intrapulpal temperature change that exceeded the threshold temperature
reported for pulpal injury. This fact was particularly evident in the fourth peak suggesting that,
in a clinical situation, caution should be taken with the possible cumulative effects of the
irradiation. Our results indicated a positive statistically significance (p<0.05) for some curing
modes concerning the temperature cumulative effect (Bluephase turbo Power 1, Demi Ultra
PLS and Standard, SPEC Standard, Valo High Power 1 and Xtra Power 1).
Higher energy densities also increase the risk for heat-induced pulp damage when
compared to lower energy density sources21, which is in accordance with the present study
that found a strong positive correlation (p=0.01) between energy density and temperature
increase. However, an exception was found for Valo Standard curing mode that emitted an
energy density of 80000 mJ/cm2, lower than the energy density of Bluephase 20i’s High Power
mode (96000 mJ/cm2), Demi Ultra Standard mode (100000 mJ/cm2) and S.P.E.C.’s Standard
mode (96000 mJ/cm2). Temperature rise induced by Valo’s Standard mode was higher than
all the above mentioned curing modes with higher energy density values.
Even though Pulse Width Modulation has been described as an effective method for
controlling the light irradiation and temperature rise in LED LCUs30, the results from this study
are not in accordance . Demi Ultra PLS mode emits constant periodic cycling of light from a
base output to a higher level every second during a curing cycle, in a similar way of Pulse
Width Modulation. According to manufacturers, PLS technology provides faster, deeper cures
without overheating. Nevertheless, Demi Ultra presented higher temperature values
(9.04±3.05ºC) on the 4th peak when compared to Demi Ultra Standard mode (7.69±2.23ºC)
despite having the same maximum density power for both curing modes (1250 mW/cm2).
Currently, there are no reports of the use of FBG sensors to measure intra-pulp
temperature rise. Research studies with similar purposes mainly resort to thermocouples to
assess the temperature increase. Nevertheless, the use of thermocouples require the removal
of pulp tissues as well as the use of a material with thermal conductivity that attaches the tip
of the thermocouple to the dentinal wall7-9, 18-22, 26, 27. FBG sensors can be in contact with pulp
tissues and exempt the use of these kind of materials, allowing it to be used in freshly extracted
teeth. Also, it offers good performance due to its small dimensions and low weight,
compatibility, and resolution42. Furthermore, one can speculate that more accurate
temperature measurements can be achieved with FBG sensors since it registers temperature
in a 2 Hz frequency, whereas thermocouples can only perform one measurement every 2
seconds8. The strain that could be induced by the pressure of pulp tissues against the FBG
sensor was considered null, since the previous insertion of the needle removed enough tissue
around the FBG sensor to avoid this effect.
26
The temperature rise recorded in this study may not reflect the temperature changes in
vivo. The potential effect of blood circulation, dentinal fluid flow and surrounding periodontal
tissues in heat dissipation must be taken into account26. According to Kodonas et al., blood
microcirculation is the main regulatory system for heat distribution in teeth as it is sufficient to
dissipate the heat transferred by external thermal stimuli to the dentine pulp complex. The
authors conducted an experiment whose purpose was to assess the intra-chamber
temperature induced by various LCUs on tooth surface with and without a continuous water
flow inside the pulp chamber simulating pulp microcirculation. They concluded that when the
simulated pulp microcirculation was absent, the temperature increase was above 6ºC. On the
contrary, with the cooling effect of water flow, the temperatures were kept bellow 6ºC27.
Furthermore, the surrounding periodontal tissues can promote heat convection in vivo, also
limiting the intrapulpal temperature rise2. The experimental design of this study intended to
reproduce the heat convection mechanism by submerging the teeth in a 37ºC water bath.
Nevertheless, although the FBG sensor was surrounded by pulp tissue, heat conduction of
blood circulation and fluid motion in the dentin tubules was not simulated. Consequently, the
results should be carefully interpreted. The experimental model of the present study can be
improved if microcirculation is simulated with a 37ºC saline solution.

27
Conclusions
Taking into account the inherent limitations of this experimental model it can be concluded
that:
The cumulative effect of light emissions in pulp temperature rise must be considered
since it was found to be statistically significant for the following curing modes: Bluephase turbo
Power 1, Demi Ultra PLS and Standard, SPEC Standard, Valo High Power 1 and Xtra Power
1. Although the remaining curing modes presented no statistically significance for cumulative
effect on temperature elevation, temperature rise between peak emissions was always
registered whereby caution must be taken in a clinical point of view.
A positive correlation can be established between the energy density and the intra-pulp
temperature increase.
FBG sensors proved to be an accurate method for pulp temperature measurements in
the conditions of the present study.

28
Acknowledgements
First, I want to express my gratefulness to Professor João Carlos Ramos and to Dr.
Alexandra Vinagre for all the support, advices and knowledge they provided me. It is always
inspiring to work with such wonderful persons with great professional skills and great humanity.
Also, I cannot forget the selfless contribution of Dr. Ana Messias to the statistical
analysis, always willing to help me.
Furthermore I would like to acknowledge the support from Professor Rogério Nogueira
and Professor Nélia Alberto, from Instituto de Telecomunicações, Universidade de Aveiro,
which provided me their time, knowledge and materials to accomplish the experimental tasks.
I would also like to thank Cláudia Brites for her laboratory support and to Ivoclar Vivadent, Kerr,
Coltène Whaledent and Ultradent for providing the LED LCUs tested in this study.
At last but not the least, I want to thank my parents, to whom I owe everything I am and
everything that I achieved, and also to my dearest friends that shared this journey with me.

29
References
1. Ottl P, Lauer HC. Temperature response in the pulpal chamber during ultrahigh-speed
tooth preparation with diamond burs. The Journal of prosthetic dentistry. 1998;80 (1).
2. Bicakci AA, Kocoglu-Altan B, Celik-Ozenci C, Tekcan M, Babacan H, Gungor E.
Histopathologic evaluation of pulpal tissue response to various adhesive cleanup
techniques. American journal of orthodontics and dentofacial orthopedics. 2010;138(1):1-
7.
3. Cavalcanti B, Lage-Marques JL, Rode SM. Pulpal temperature increases with Er:YAG
laser and high-speed handpieces. The Journal of prosthetic dentistry. 2003; 90(5).
4. Uhl A, Volpel A, Sigusch BW. Influence of heat from light curing units and dental composite
polymerization on cells in vitro. Journal of dentistry. 2006;34(4):298-306.
5. Lee-Knight CT, Wylie SG, Major PW, Glover KE, Grace M. Mechanical and electrothermal
debonding: Effect on ceramic veneers and dental pulp. American Journal of Orthodontics
and Dentofacial Orthopedics. 1997;112 (3).
6. Azzeh E, Feldon PJ. Laser debonding of ceramic brackets: a comprehensive review.
American journal of orthodontics and dentofacial orthopedics. 2003;123(1):79-83.
7. Uzel A, Buyukyilmaz T, Kayalioglu M, Uzel I. Temperature Rise During Orthodontic
Bonding With various curing lights - an in vitro study. Angle Orthodontist. 2006;76( 2).
8. Ulusoy C, Irmak O, Bagis YH, Ulusoy OI. Temperature rise and shear bond strength of
bondable buccal tubes bonded by various light sources. European journal of orthodontics.
2008;30(4):413-7.
9. Malkoc S, Uysal T, Usumez S, Isman E, Baysal A. In-vitro assessment of temperature rise
in the pulp during orthodontic bonding. American journal of orthodontics and dentofacial
orthopedics. 2010;137(3):379-83.
10. Rizoiu I, Kohanghadosh F, Kimmel A, Eversole L. Pulpal thermal responses to an
erbium,chromium:YSGG pulsed laser hydrokinetic system. Oral Surgery, Oral Medicine,
Oral Pathology. 1998;86(2).
11. Buchalla W, Attin T. External bleaching therapy with activation by heat, light or laser--a
systematic review. Dental materials. 2007;23(5):586-96.

30
12. He LB, Shao MY, Tan K, Xu X, Li JY. The effects of light on bleaching and tooth sensitivity
during in-office vital bleaching: a systematic review and meta-analysis. Journal of
dentistry. 2012;40(8):644-53.
13. Srimaneepong V, Palamara J, Wilson P. Pulpal space pressure and temperature changes
from NdYAG laser irradiation of dentin. Journal of dentistry. 2002;30:291-6.
14. Castelnuovo J, Tjan A. Temperature rise in pulpal chamber during fabrication of
provisional resinous crowns. The Journal of prosthetic dentistry. 1997.
15. Michalakis K, Pissiotis A, Hirayama H, Kang K, Kafantaris N. Comparison of temperature
increase in the pulp chamber during the polymerization of materials used for the direct
fabrication of provisional restorations. The Journal of prosthetic dentistry. 2006;96(6):418-
23.
16. Chiodera G, Gastaldi G, Millar BJ. Temperature change in pulp cavity in vitro during the
polymerization of provisional resins. Dental Materials. 2009;25(3):321-5.
17. Seelbach P, Finger WJ, Ferger P, Balkenhol M. Temperature rise on dentin caused by
temporary crown and fixed partial denture materials: influencing factors. Journal of
dentistry. 2010;38(12):964-73.
18. Daronch M, Rueggeberg FA, Hall G, De Goes MF. Effect of composite temperature on in
vitro intrapulpal temperature rise. Dental Materials. 2007;23(10):1283-8.
19. Leprince J, Devaux J, Mullier T, Vreven J, Leloup G. Pulpal-temperature rise and
polymerization efficiency of LED curing lights. Operative dentistry. 2010;35(2):220-30.
20. Uhl A, Mills RW, Jandt KD. Polymerization and light-induced heat of dental composites
cured with LED and halogen technology. Biomaterials. 2003;24(10):1809-20.
21. Hannig M, Bott B. In-vitro pulp chamber temperature rise during composite resin
polymerization with various light-curing sources. Dental Materials 1999;15: 275–81.
22. Yazici AR, Muftu A, Kugel G, Perry RD. Comparison of temperature changes in the pulp
chamber induced by various light curing units, in vitro. Operative dentistry.
2006;31(2):261-5.
23. Jandt KD, Mills RW. A brief history of LED photopolymerization. Dental Materials.
2013;29(6):605-17.
24. Martins GR, Cavalcanti BN, Rode SM. Increases in intrapulpal temperature during
polymerization of composite resin. The Journal of prosthetic dentistry. 2006;96(5):328-31.

31
25. Stewardson DA, Shortall AC, Harrington E, Lumley PJ. Thermal changes and cure depths
associated with a high intensity light activation unit. Journal of dentistry. 2004;32(8):643-
51.
26. Park SH, Roulet JF, Heintze SD. Parameters influencing increase in pulp chamber
temperature with light-curing devices: curing lights and pulpal flow rates. Operative
dentistry. 2010;35(3):353-61.
27. Kodonas K, Gogos C, Tziafas D. Effect of simulated pulpal microcirculation on intrapulpal
temperature changes following application of heat on tooth surfaces. International
endodontic journal. 2009;42(3):247-52.
28. Jakubinek MB, O'Neill C, Felix C, Price RB, White MA. Temperature excursions at the
pulp-dentin junction during the curing of light-activated dental restorations. Dental
Materials. 2008;24(11):1468-76.
29. Hussey DL, Biagionit PA, Lameyf PJ. Thermographic measurement of temperature
change during resin composite polymerization in vivo. Journal of Dentistry. 1995;23
(5):267-71.
30. Huang T, Hung C, Tsai C. Reducing, by Pulse Width Modulation, the Curing Temperature
of a Prototype High-power LED Light Curing Unit. Dental Materials Journal 2006;25(2)
:309-15.
31. Kwon SJ, Park YJ, Jun SH, Ahn JS, Lee IB, Cho BH, et al. Thermal irritation of teeth during
dental treatment procedures. Restorative dentistry & endodontics. 2013;38(3):105-12.
32. Lin M, Xu F, Lu TJ, Bai BF. A review of heat transfer in human tooth--experimental
characterization and mathematical modeling. Dental Materials. 2010;26(6):501-13.
33. Baldissara P, Catapano S, Scotti R. Clinical and histological evaluation of thermal injury
thresholds in human teeth: a preliminary study. Journal of oral rehabilitation.
1997;24(11):791-801.
34. Zach L, Cohen G. Pulp response to externally applied heat. Oral Surgery Oral Medicine
Oral PAthology Oral Radiology and Endodontics. 1965;19:515-30.
35. Uhl A, Sigusch BW, Jandt KD. Second generation LEDs for the polymerization of oral
biomaterials. Dental Materials. 2004;20(1):80-7.
36. Hansen E, Asmussen E. Correlation between depth of cure and temperature rise of light-
activated resin. Scand J Dent Res 1993;101:176-9.

32
37. Panas A, Preiskorn M, Dabrowski M, Zmuda S. Validation of hard tooth tissue thermal
diffusivity measurements applying an infrared camera. Infrared Phys Technol
2007;49:302–5
38. Panas A, Zmuda S, Terpiłowski J, Preiskorn M. Investigation of the thermal diffusivity of
human tooth hard tissue. Int JThermophys. 2003;24:837–48.
39. Magalhães M, Ferreira R, Grossi P, Andrade R. Measurement of thermophysical
properties of human dentin: effect of open porosity. Journal of dentistry. 2008;36:588–94.
40. Xu H, Smith D, Jahanmir S, Romberg E, Kelly J, Thompson V, et al. Indentation damage
and mechanical properties of human enamel and dentin. Journal of dental research. 1998
77(3):472-80.
41. Lloyd C. A differential thermal analysis (DTA) for the heats of reaction and temperature
rises produced during the setting of tooth coloured restorative materials. Journal of oral
rehabilitation. 1984 11(2):111-21.
42. Barrera D, Sales S. A high-temperature fiber sensor using a low cost interrogation
scheme. Sensors. 2013;13(9):11653-9.
43. Chang YT, Yen CT, Wu YS, Cheng HC. Using a fiber loop and fiber bragg grating as a
fiber optic sensor to simultaneously measure temperature and displacement. Sensors.
2013;13(5):6542-51.
44. Kou JL, Ding M, Feng J, Lu YQ, Xu F, Brambilla G. Microfiber-based Bragg gratings for
sensing applications: a review. Sensors. 2012;12(7):8861-76.
45. Othonos A. Fiber Bragg gratings. 1997.
46. Carvalho L, Alberto NJ, Gomes PS, Nogueira RN, Pinto JL, MH F. In the trail of a new bio-
sensor for measuring strain in bone: osteoblastic biocompatibility. Biosens Bioelectron
2011;26 (10):4046-52.
47. Türkkahraman H, Küçükesmen HC. Orthodontic bracket shear bond strengths produced
by two high-power light-emitting diode modes and halogen light. Angle Orthod
2005;75(5):854-7.
48. Jost-Brinkmann PG, Stein H, Miethke RR, Nakata M. Histologic investigation of the human
pulp after thermodebonding of metal and ceramic brackets. Am J Orthod Dentofacial
Orthop. 1992;102 (5):410-7.