Mesoscale Modeling and Validation of Texture Evolution during Asymmetric Rooling and Static...
8
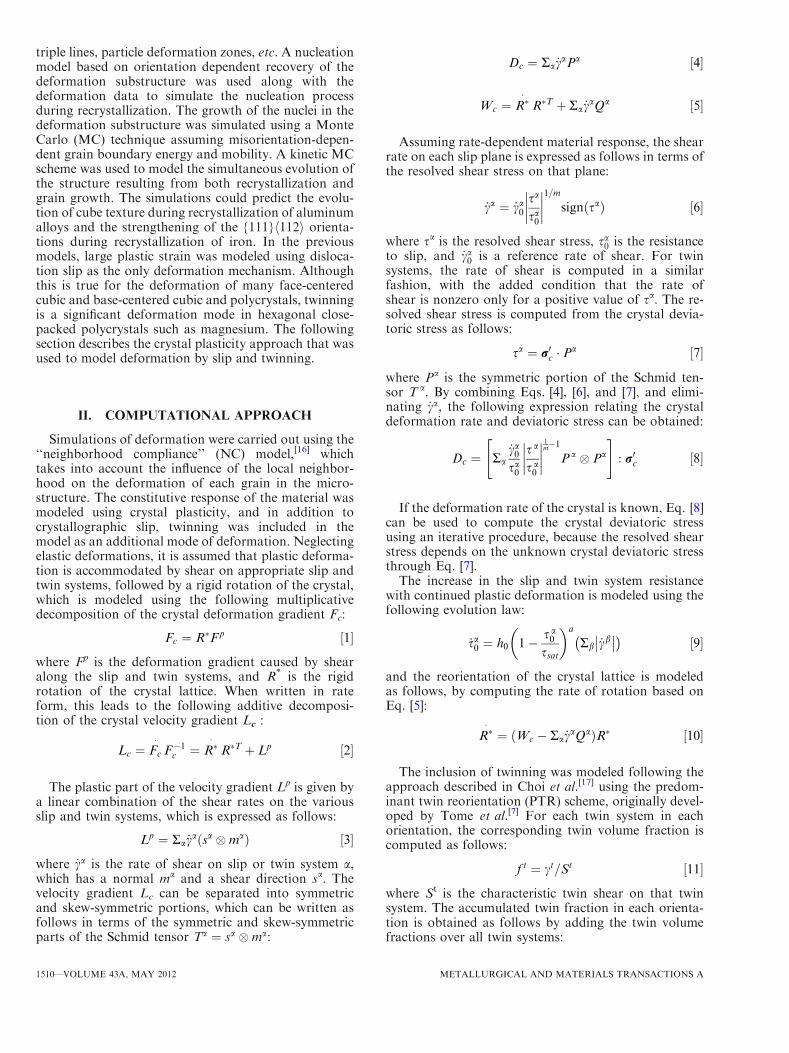
Mesoscale Modeling and Validation of Texture Evolution during Asymmetric Rolling and Static Recrystallization of Magnesium Alloy AZ31B B. RADHAKRISHNAN, S.B. GORTI, G.M. STOICA, G. MURALIDHARAN, A.D. STOICA, X.-L. WANG, E.D. SPECHT, E. KENIK, and T. MUTH The focus of the present research is to develop an integrated deformation and recrystallization model for magnesium alloys at the microstructural length scale. It is known that in magnesium alloys nucleation of recrystallized grains occurs at various microstructural inhomogeneities such as twins and localized deformation bands. However, models need to be developed that can predict the evolution of the grain structure and texture developed during recrystallization and grain growth, especially when the deformation process follows a complicated deformation path such as in asymmetric rolling. The deformation model is based on a crystal plasticity approach implemented at the length scale of the microstructure that includes deformation mechanisms based on dislocation slip and twinning. The recrystallization simulation is based on a Monte Carlo technique that operates on the output of the deformation simulations. The nucleation criterion during recrystallization is based on the local stored energy, and the Monte Carlo technique is used to simulate the growth of the nuclei resulting from local stored energy dif- ferences and curvature. The model predictions are compared with experimental data obtained through electron backscatter analysis and neutron diffraction. DOI: 10.1007/s11661-011-0896-4 Ó The Author(s) 2011. This article is published with open access at Springerlink.com I. INTRODUCTION WROUGHT magnesium alloys have limited room- temperature (RT) ductility that is closely related to the crystallographic texture that develops during plastic deformation. [1] For example, during rolling or extrusion, a strong basal texture develops that severely reduces the available deformation modes by slip or twinning. Con- siderable effort has been made to increase the RT ductility of wrought magnesium alloys by inducing the formation of nonbasal texture components during ther- momechanical processing. One set of approaches is based on alloying that induces deformation banding [2] or particle-stimulated nucleation, [3] resulting in significant weakening of the basal texture component. Another approach involves designing deformation paths and annealing sequences that weaken the basal texture [4–6] such as asymmetric rolling, cyclic extrusion, and com- pression and electropulsing. The texture that develops during asymmetric rolling of wrought magnesium alloys is influenced by several variables, including rolling temperature, speed, com- pression to shear ratio, and the plastic strain. Texture can also be influenced significantly by the components that nucleate and grow during static/dynamic recrystal- lization that occurs under a given deformation path. Even though micromechanical models that can predict the texture evolution through dislocation slip and twinning during large plastic deformation in magnesium alloys have been under development for a while, [7–9] microstructural length scale models that can predict the texture evolution under the combined influence of deformation and recrystallization in these alloys are not well developed. The focus of this effort is to develop a coupled deformation and recrystallization model for a wrought magnesium alloy and to validate the model using experimental data. Specifically, the effort involved the investigation of static recrystallization of the mag- nesium alloy AZ31 using in situ neutron diffraction. The computational approach is based on an extension of previous work by the authors in predicting the texture evolution during thermomechanical processing of alu- minum alloys and steels using a coupled deformation and annealing simulation approach. [10–15] In these mod- els, a crystal plasticity–based approach was used to model the inhomogeneous deformation at the micro- structural length scale. The deformation model captured the heterogeneity of the stored energy at various microstructural locations such as grain boundaries, B. RADHAKRISHNAN and S.B. GORTI, Senior Research Staffs, are with the Computer Science and Mathematics Division, Oak Ridge National Laboratory, Oak Ridge, TN 37830. Contact e-mail: radha [email protected] G.M. STOICA, Postdoctoral Researcher, A.D. STOICA, Research Staff, and X.-L. WANG, Distinguished Research and Development Staff, are with the Neutron Scattering Sciences Division, Oak Ridge National Laboratory. G. MURALIDHARAN, Research and Development Staff, E.D. SPECHT, Senior Research Staff, and T. MUTH, Research Scientist, are with the Materials Science and Technology, Oak Ridge National Laboratory. E. KENIK, now retired, was formerly Senior Research Staff with the Materials Science and Technology, Oak Ridge National Laboratory. Manuscript submitted February 25, 2011. Article published online October 1, 2011 METALLURGICAL AND MATERIALS TRANSACTIONS A VOLUME 43A, MAY 2012—1509
-
Upload
independent -
Category
Documents
-
view
0 -
download
0
Transcript of Mesoscale Modeling and Validation of Texture Evolution during Asymmetric Rooling and Static...
Mesoscale Modeling and Validation of Texture Evolution duringAsymmetric Rolling and Static Recrystallization of MagnesiumAlloy AZ31B
B. RADHAKRISHNAN, S.B. GORTI, G.M. STOICA, G. MURALIDHARAN,A.D. STOICA, X.-L. WANG, E.D. SPECHT, E. KENIK, and T. MUTH
The focus of the present research is to develop an integrated deformation and recrystallizationmodel for magnesium alloys at the microstructural length scale. It is known that in magnesiumalloys nucleation of recrystallized grains occurs at various microstructural inhomogeneities suchas twins and localized deformation bands. However, models need to be developed that canpredict the evolution of the grain structure and texture developed during recrystallization andgrain growth, especially when the deformation process follows a complicated deformation pathsuch as in asymmetric rolling. The deformation model is based on a crystal plasticity approachimplemented at the length scale of the microstructure that includes deformation mechanismsbased on dislocation slip and twinning. The recrystallization simulation is based on a MonteCarlo technique that operates on the output of the deformation simulations. The nucleationcriterion during recrystallization is based on the local stored energy, and the Monte Carlotechnique is used to simulate the growth of the nuclei resulting from local stored energy dif-ferences and curvature. The model predictions are compared with experimental data obtainedthrough electron backscatter analysis and neutron diffraction.
DOI: 10.1007/s11661-011-0896-4� The Author(s) 2011. This article is published with open access at Springerlink.com
I. INTRODUCTION
WROUGHT magnesium alloys have limited room-temperature (RT) ductility that is closely related to thecrystallographic texture that develops during plasticdeformation.[1] For example, during rolling or extrusion,a strong basal texture develops that severely reduces theavailable deformation modes by slip or twinning. Con-siderable effort has been made to increase the RTductility of wrought magnesium alloys by inducing theformation of nonbasal texture components during ther-momechanical processing. One set of approaches isbased on alloying that induces deformation banding[2] orparticle-stimulated nucleation,[3] resulting in significantweakening of the basal texture component. Anotherapproach involves designing deformation paths andannealing sequences that weaken the basal texture[4–6]
such as asymmetric rolling, cyclic extrusion, and com-pression and electropulsing.The texture that develops during asymmetric rolling
of wrought magnesium alloys is influenced by severalvariables, including rolling temperature, speed, com-pression to shear ratio, and the plastic strain. Texturecan also be influenced significantly by the componentsthat nucleate and grow during static/dynamic recrystal-lization that occurs under a given deformation path.Even though micromechanical models that can predictthe texture evolution through dislocation slip andtwinning during large plastic deformation in magnesiumalloys have been under development for a while,[7–9]
microstructural length scale models that can predict thetexture evolution under the combined influence ofdeformation and recrystallization in these alloys arenot well developed. The focus of this effort is to developa coupled deformation and recrystallization model for awrought magnesium alloy and to validate the modelusing experimental data. Specifically, the effort involvedthe investigation of static recrystallization of the mag-nesium alloy AZ31 using in situ neutron diffraction.The computational approach is based on an extension
of previous work by the authors in predicting the textureevolution during thermomechanical processing of alu-minum alloys and steels using a coupled deformationand annealing simulation approach.[10–15] In these mod-els, a crystal plasticity–based approach was used tomodel the inhomogeneous deformation at the micro-structural length scale. The deformation model capturedthe heterogeneity of the stored energy at variousmicrostructural locations such as grain boundaries,
B. RADHAKRISHNAN and S.B. GORTI, Senior Research Staffs,are with the Computer Science and Mathematics Division, Oak RidgeNational Laboratory, Oak Ridge, TN 37830. Contact e-mail: [email protected] G.M. STOICA, Postdoctoral Researcher, A.D.STOICA, Research Staff, and X.-L. WANG, Distinguished Researchand Development Staff, are with the Neutron Scattering SciencesDivision, Oak Ridge National Laboratory. G. MURALIDHARAN,Research andDevelopment Staff, E.D. SPECHT, SeniorResearch Staff,and T. MUTH, Research Scientist, are with the Materials Science andTechnology, Oak Ridge National Laboratory. E. KENIK, now retired,was formerly Senior Research Staff with the Materials Science andTechnology, Oak Ridge National Laboratory.
Manuscript submitted February 25, 2011.Article published online October 1, 2011
METALLURGICAL AND MATERIALS TRANSACTIONS A VOLUME 43A, MAY 2012—1509
triple lines, particle deformation zones, etc. A nucleationmodel based on orientation dependent recovery of thedeformation substructure was used along with thedeformation data to simulate the nucleation processduring recrystallization. The growth of the nuclei in thedeformation substructure was simulated using a MonteCarlo (MC) technique assuming misorientation-depen-dent grain boundary energy and mobility. A kinetic MCscheme was used to model the simultaneous evolution ofthe structure resulting from both recrystallization andgrain growth. The simulations could predict the evolu-tion of cube texture during recrystallization of aluminumalloys and the strengthening of the {111}h112i orienta-tions during recrystallization of iron. In the previousmodels, large plastic strain was modeled using disloca-tion slip as the only deformation mechanism. Althoughthis is true for the deformation of many face-centeredcubic and base-centered cubic and polycrystals, twinningis a significant deformation mode in hexagonal close-packed polycrystals such as magnesium. The followingsection describes the crystal plasticity approach that wasused to model deformation by slip and twinning.
II. COMPUTATIONAL APPROACH
Simulations of deformation were carried out using the‘‘neighborhood compliance’’ (NC) model,[16] whichtakes into account the influence of the local neighbor-hood on the deformation of each grain in the micro-structure. The constitutive response of the material wasmodeled using crystal plasticity, and in addition tocrystallographic slip, twinning was included in themodel as an additional mode of deformation. Neglectingelastic deformations, it is assumed that plastic deforma-tion is accommodated by shear on appropriate slip andtwin systems, followed by a rigid rotation of the crystal,which is modeled using the following multiplicativedecomposition of the crystal deformation gradient Fc:
Fc ¼ R�Fp ½1�
where Fp is the deformation gradient caused by shearalong the slip and twin systems, and R* is the rigidrotation of the crystal lattice. When written in rateform, this leads to the following additive decomposi-tion of the crystal velocity gradient Lc :
Lc ¼ Fc
�F�1c ¼ R�
�R�T þ Lp ½2�
The plastic part of the velocity gradient Lp is given bya linear combination of the shear rates on the variousslip and twin systems, which is expressed as follows:
Lp ¼ Ra _ca sa �mað Þ ½3�
where _ca is the rate of shear on slip or twin system a,which has a normal ma and a shear direction sa. Thevelocity gradient Lc can be separated into symmetricand skew-symmetric portions, which can be written asfollows in terms of the symmetric and skew-symmetricparts of the Schmid tensor Ta ¼ sa �ma:
Dc ¼ Ra _caPa ½4�
Wc ¼ R��R�T þ Ra _caQa ½5�
Assuming rate-dependent material response, the shearrate on each slip plane is expressed as follows in terms ofthe resolved shear stress on that plane:
_ca ¼ _ca0
sa
sa0
����
����
1=m
signðsaÞ ½6�
where sa is the resolved shear stress, sa0 is the resistance
to slip, and _ca0 is a reference rate of shear. For twin
systems, the rate of shear is computed in a similarfashion, with the added condition that the rate ofshear is nonzero only for a positive value of sa. The re-solved shear stress is computed from the crystal devia-toric stress as follows:
sa ¼ r0c � Pa ½7�
where Pa is the symmetric portion of the Schmid ten-sor T a. By combining Eqs. [4], [6], and [7], and elimi-nating _ca, the following expression relating the crystaldeformation rate and deviatoric stress can be obtained:
Dc ¼ Ra_ca0
sa0
sa
s a0
����
����
1m�1
P a � Pa
" #
: r0c ½8�
If the deformation rate of the crystal is known, Eq. [8]can be used to compute the crystal deviatoric stressusing an iterative procedure, because the resolved shearstress depends on the unknown crystal deviatoric stressthrough Eq. [7].The increase in the slip and twin system resistance
with continued plastic deformation is modeled using thefollowing evolution law:
_sa0 ¼ h0 1� s a
0
ssat
� �a
Rb _cb����
� �
½9�
and the reorientation of the crystal lattice is modeledas follows, by computing the rate of rotation based onEq. [5]:
R��¼ Wc � Ra _caQað ÞR� ½10�
The inclusion of twinning was modeled following theapproach described in Choi et al.[17] using the predom-inant twin reorientation (PTR) scheme, originally devel-oped by Tome et al.[7] For each twin system in eachorientation, the corresponding twin volume fraction iscomputed as follows:
f t ¼ ct=St ½11�
where St is the characteristic twin shear on that twinsystem. The accumulated twin fraction in each orienta-tion is obtained as follows by adding the twin volumefractions over all twin systems:
1510—VOLUME 43A, MAY 2012 METALLURGICAL AND MATERIALS TRANSACTIONS A
f acc ¼ Rt ft ½12�
If the accumulated twin fraction f acc in any orienta-tion exceeds a threshold twin volume fraction f th, asshown in the following equation:
f th ¼ C th1 þ C th
2 f acc ½13�
then that orientation is allowed to reorient to a neworientation given by the twin system that has themaximum volume fraction f t. Under this scheme, thereorientation caused by twinning does not occur untilthe volume fraction exceeds a threshold value of Cth
1 ,and because f acc increases with continued plastic defor-mation, the threshold value also increases with strain.Even though more than one twin system may be activein accommodating the deformation, the PTR modelassumes that reorientation of the crystal is governed bythe dominant twin variant. The reorientation is given bya 180 deg rotation around the twin plane normal.
The simulation procedure described earlier was used tomodel the deformation under asymmetric rolling condi-tions. The resulting deformation substructure was used asinput to a MC method to simulate the static recrystalli-zation during subsequent annealing of the deformedmaterial. In addition to the orientations in the deformedmicrostructure, the MC method requires the storedenergy of deformation as input. The stored energy wascomputed from the deformation model as follows:
H ¼ 2 r2 � r20
� �
=G ½14�
where r and r0 are the effective stress values at the endand start of the deformation, respectively. For orienta-tions that undergo rotation caused by twinning, thevalue of r0 was reset to the current value of r.
The MC simulation technique involves mapping thedeformation structure into a regular cubic lattice whereat each lattice point the local crystallographic orienta-tion and the stored energy of deformation are known.Because the current deformation model does notaccount for shape change caused by deformation, theoutput of the deformation simulations could be readilyused for the MC simulations. In MC simulations, thetotal system energy is defined as follows:
E ¼ 1
2Rn1R
NN1 JðSiSjÞ 1� dSiSj
� �
þ Rn1Hi ½15�
where J is interface energy that depends on the orien-tations Si and Sj on either side of the interface, Hi isthe stored energy at site i and the energies are summedover all the sites and interfaces in the system. Thenucleation model is based on a probability thatdepends on the stored energy of the site. In the currentsimulations, it is assumed that sites with the higheststored energy will have the highest probability fornucleation. All sites that are declared nuclei are reas-signed zero stored energy. The MC technique involvesvisiting the lattice in a random fashion and calculatingthe energy change resulting from an attempted non-conservative flip. The flip is then executed with a prob-ability given by the following equation:
p Si;Sj;DE;T� �
¼exp �Q
RT
� � lclmaxcmax
DE � 0
exp �QRT
� � lclmaxcmax
exp �DERT
� �
DE>0
" #
½16�
where l is the boundary mobility and c is the boundaryenergy that depends on the misorientation. The relativefrequency of flips associated with recrystallization andgrain growth is calculated based on the respective
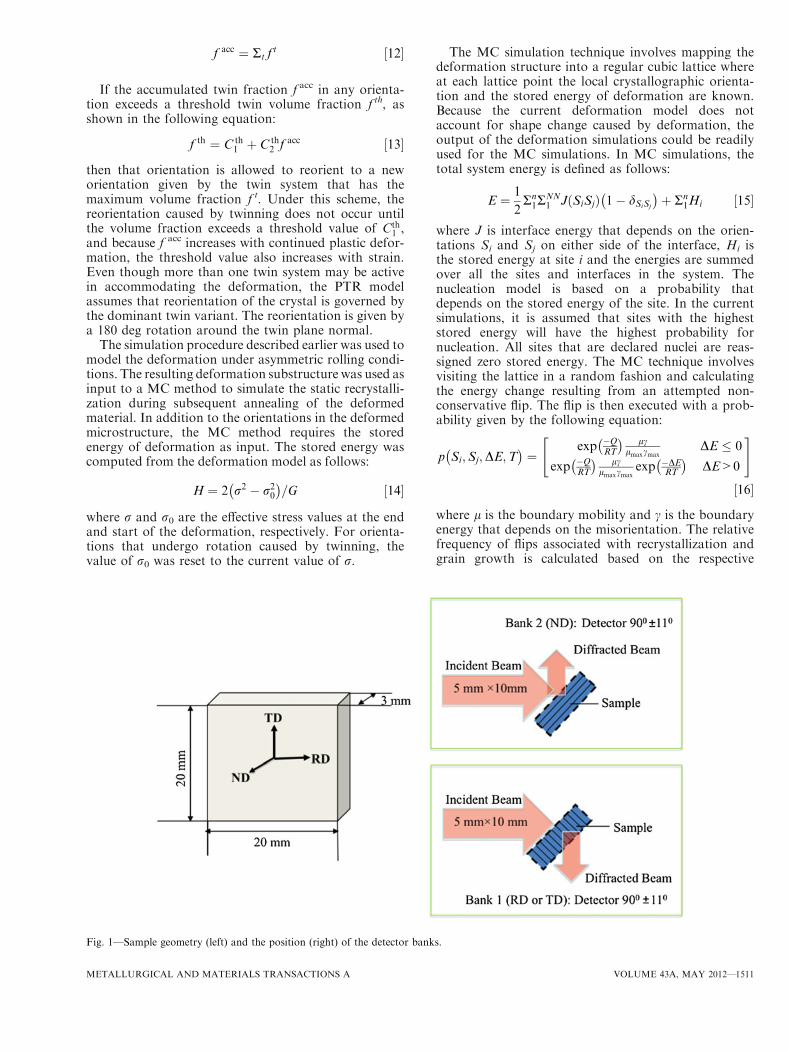
Fig. 1—Sample geometry (left) and the position (right) of the detector banks.
METALLURGICAL AND MATERIALS TRANSACTIONS A VOLUME 43A, MAY 2012—1511
driving forces. Time in MC simulations is expressed interms of the MC step (MCS), which is the timeassociated with one attempted flip for each site in thedomain. It can be related to real time, and the MC sizecan be related to a real size. However, such a correlationwas not performed in this study because the main focuswas on predicting the texture evolution.
III. EXPERIMENTAL PROCEDURE
The model alloy used in the current investigations wasthe commercial alloy AZ31 with a nominal compositionof Mg-3wt pct Al-1wt pct Zn. The as-received materialwas in the form of an extruded plate with a dominantbasal texture (h0001i || Normal Direction, ND). Asym-metric rolling was carried out using rolls of unequal sizerotating with the same rotational speed. The rolldiameters were 75 cm and 225 cm with a roll ratio of3.0. The sample was heated to 408 K (135 �C) in a tubefurnace and rolled immediately (<5 seconds) with therolls initially at ambient temperature. The total defor-mation was a 20 pct reduction in height. One uniquefeature of the present research is the use of neutrondiffraction to follow the texture changes in the sampleduring annealing. The in situ time-of-flight neutronexperiment was carried out using VULCAN,[18,19] theengineering materials diffractometer at the SpallationNeutron Source,[20] Oak Ridge National Laboratory(Oak Ridge, TN). The measurements were made in high-resolution (HR) mode, with the chopper running at30 Hz, with the central wavelength k = 2.4 A and thebandwidth Dk = 2.88 A. The neutron incident beam of
5 9 10 mm reaches the sample positioned with the rollingdirection (RD) (or transverse direction, TD) horizon-tally, with the samples surface at 45� relative to theincident beam. The diffracted intensities were recordedwith two scintillation detectors banks, placed at ±90�diffraction angles, respectively. Therefore, Bank 1records the diffracted intensities for the reflecting planesperpendicular to RD (or TD), and Bank 2 records thereflecting planes perpendicular to ND. The samplemounted inside a vacuum chamber is first measured atRT, and then during the in situ annealing up to 623 K(350 �C), with a heating rate ranging from 30 �C to50 �C/min. To assess the texture evolution and todetermine the texture components, the samples wererotated around the vertical axis before annealing, andduring annealing at maximum temperature (i.e., therotation encompassed tilting angles W in the range from0 deg to 180 deg). The positioning of the sample withrespect to the neutron beam and the location of thedetector banks are shown schematically in Figure 1. Thetilting of the sample is shown schematically in Figure 2.The instrument calibrations were performed with a
vanadium rod and Si powder and diamond powderloaded in a vanadium can. The diffraction data wereanalyzed using the Generalized Structure and AnalysisSoftware (GSAS). The single-peak fittings provided thetemporal variations of the neutron peak intensities andthe peak broadening during in situ annealing. Onesample, AZ31-P3, asymmetrically rolled 20 pct at 408 K(135 �C), with dimensions of 12 mm 9 8 mm 91.43 mm, was first measured at RT for different tiltingangles W in 5� steps. Two samples were subjected to thefollowing identical three-step procedure within the limitsof experimental error: (1) in situ diffraction duringheating from RT up to 623 K (350 �C), (2) the grainorientation measurement during isothermal annealing at623 K (350 �C), and (3) the in situ diffraction duringcooling. The on-heating and on-cooling data wererecorded for the first sample for (1) W = 0 deg andW = 90 deg (which correspond to the RD and NDdirections), and for the second sample for (2)W = 25 deg and W = 115 deg (which correspond to25 deg off RD and ND, respectively). The texturemeasurement for the first sample encompassed a rangeof 0� to 45� in W, whereas a range of 45� to 90� in W wasused for the second sample. A similar approach wasused to monitor another sample mounted with thetransversal direction (TD) in the horizontal plane(W = 0 deg). Additionally, ex situ X-ray diffractionwas used to characterize the textures of the samplesbefore and after annealing.
Fig. 2—Schematic showing the specimen rotation (tilt, W) used inthe neutron experiments.
Table I. Materials Parameters Used for the Deformation Model
Mode System sa0 (MPa) h0 (MPa) ssat (MPa) a
Basal hai {0001}h2-1-10i 25 100 70 1.1Prism hai {10-10}h-12-10i 68 130 210 0.8Pyramidal hai {-10-11}h-12-10i 68 130 210 0.8Pyramidal hc + ai {11-22}h-1-123i 68 130 210 0.8Tension twin {10-12}h-1011i 80 50 100 1.1Compression twin {10-11}h10-1-2i 240 50 300 1.1
1512—VOLUME 43A, MAY 2012 METALLURGICAL AND MATERIALS TRANSACTIONS A
0 5x10² 1x10³ 4x10³ 6x10³ 8x1030.0
0.2
0.4
0.6
0.8
1.0
1.2
Nor
mal
ized
Int
ensi
ty
Time [ s ]
(11.0) at Ψ = 0°
(00.2) at Ψ = 90°
(10.1) at Ψ = 0°
0
50
100
150
200
250
300
350
400
Tem
pera
ture
[ ° C
]
Tem
pera
ture
[ ° C
]
0.0 5.0x10² 1.0x10³ 1x10⁴ 2x10 4 3x10⁴ 4x1040.0
0.2
0.4
0.6
0.8
1.0
1.2
Nor
mal
ized
Int
ensi
ty
Time [ s ]
(11.0) at Ψ = 25
(00.2) at Ψ = 115
(10.1) at Ψ = 25°
°
°
0
50
100
150
200
250
300
350
400
(a) (b)
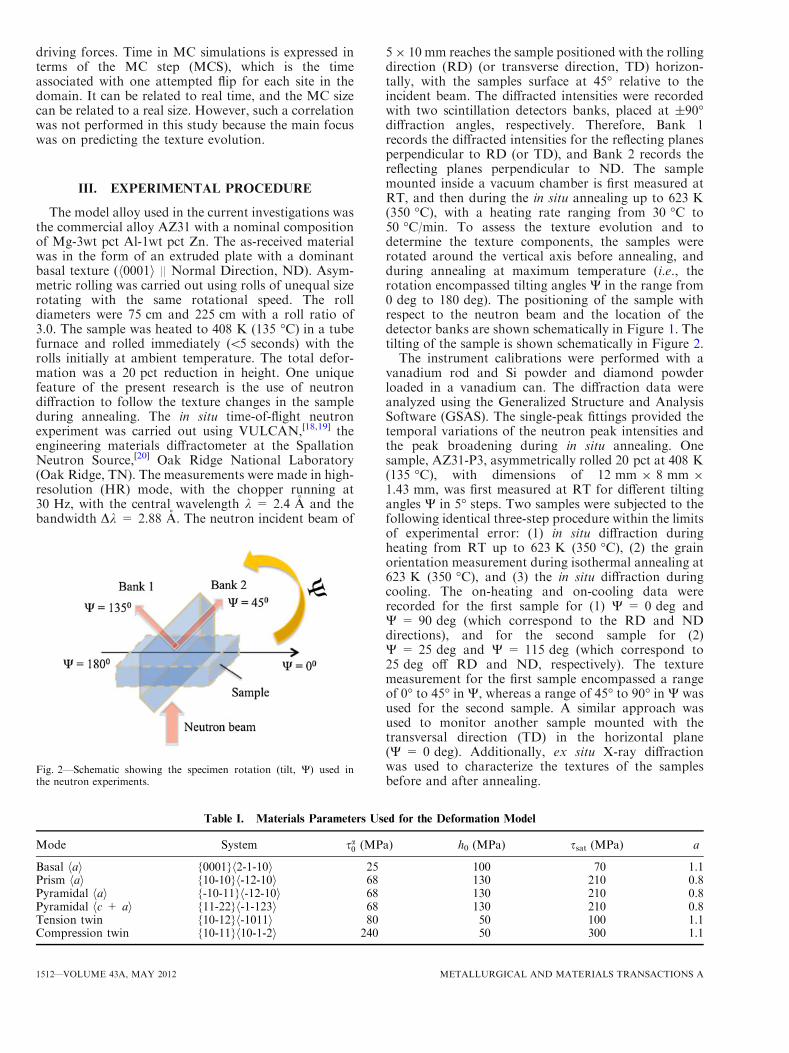
Fig. 3—Variation of integral intensity with heating time (temperature) for tilt angles of W = 0 deg and W = 25 deg (relative to RD) andW = 90 deg and W = 115 deg (relative to ND). The heating profile is superimposed (green line).
0 30 60 90 120 150 1800
1
2
3
4
5
Nor
mal
ized
inte
nsit
y
AZ31-P3:shear rolled
(00.2)
0 30 60 90 120 150 1800.0
0.5
1.0
1.5
2.0
2.5
Nor
mal
ized
inte
nsit
y
350 C RT
AZ31-P3:shear rolled
(10.1)
0 30 60 90 120 150 1800.0
0.5
1.0
1.5
2.0
2.5
3.0
3.5
Nor
mal
ized
inte
nsit
y
Tilt angle, Ψ
Tilt angle, Ψ Tilt angle, Ψ
Tilt angle, Ψ
AZ31-P3:shear rolled
(11.0)
0 30 60 90 120 150 1800.0
0.5
1.0
1.5
2.0
2.5
Nor
mal
ized
inte
nsit
y 350°C RT
350°C RT
350°C RT
AZ31-P3:shear rolled
(10.3)
°
(a) (b)
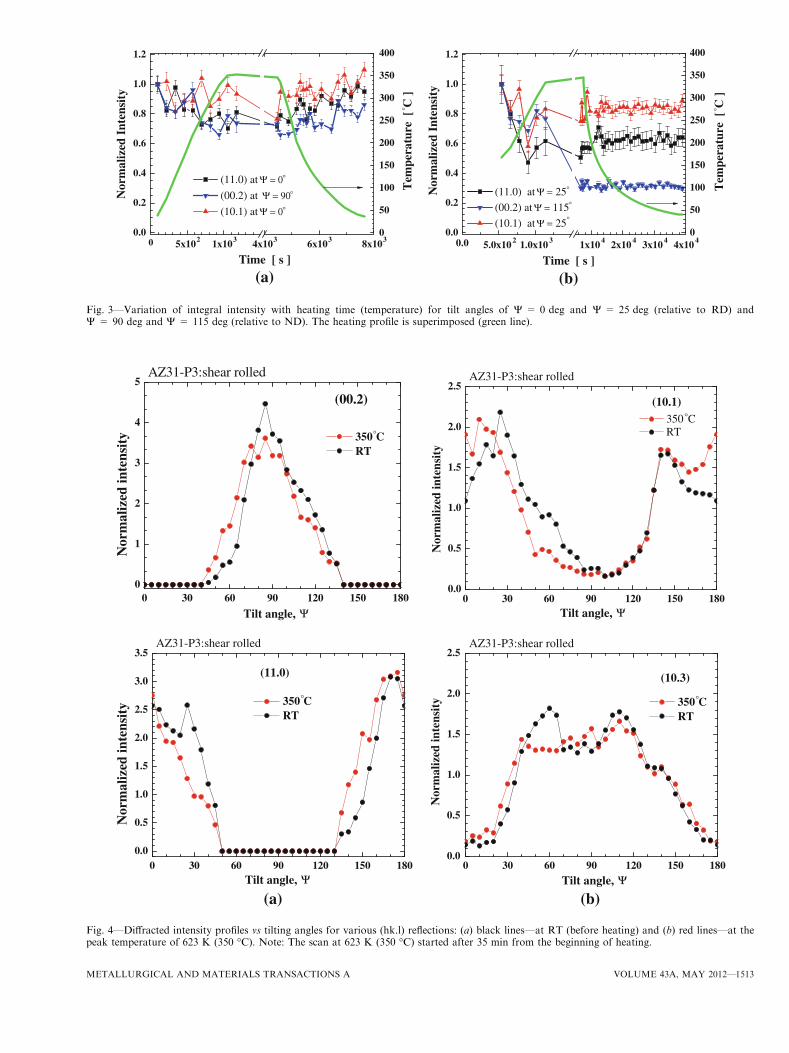
Fig. 4—Diffracted intensity profiles vs tilting angles for various (hk.l) reflections: (a) black lines—at RT (before heating) and (b) red lines—at thepeak temperature of 623 K (350 �C). Note: The scan at 623 K (350 �C) started after 35 min from the beginning of heating.
METALLURGICAL AND MATERIALS TRANSACTIONS A VOLUME 43A, MAY 2012—1513

IV. COMPUTATIONS
The coupled crystal plasticity–MC code was used tomodel the evolution of microstructure and textureduring static recrystallization after deformation typicalof shear rolling. The through-thickness gradients in theactual shear rolling process were neglected, and thedeformation process step was simplified as a plane straincompression + shear deformation path with a totalreduction in thickness of 20 pct. The initial microstruc-ture and texture used in the simulations were closelymatched to the grain morphology and texture in theexperimental sample using a microstructural mappingtechnique. Table I lists the material parameters used forthe simulation of shear rolling, where the values for theslip systems and the tension twin systems were takenfrom Reference 17, whereas the slip system strengthvalues for the compression twin systems were taken tobe proportionately higher than the corresponding valuesfor the tension twins. The values of Cth
1 and Cth2 were
taken to be 0.25 and 0.5, respectively,[17] and the shearmodulus for magnesium was assumed to be 17 GPa.
V. RESULTS
The integral intensity of three diffraction peaks,(0002), 11�20
� �
, and 10�11� �
, during continuous heatingand cooling are shown in Figures 3(a) and (b). Bothplots include the thermal history of the in situ measure-ment (green) that shows a central gap corresponding tothe period of time during which the texture measure-ments were made. For comparison, the integral intensitywas normalized to the initial value for each type ofdiffraction peak. As the initial texture shows a prefer-ential orientation of basal poles along ND, the intensityvariation of the (0002) peak comes from grains close toND direction (W = 90 deg, Figure 3(a)) or 25 deg off(W = 115 deg, Figure 3(b)), whereas the other two
peaks belongs to grains aligned close to RD direction(W = 0 deg, Figure 3(a)) or 25 deg off (W = 25 deg,Figure 3(b)). The intensity changes observed in Fig-ure 3(a) are reversible, as they are mainly induced by thevariation of the Debye–Waller factor with temperature.This behavior was confirmed by the measurements onthe sample aligned with the TD direction in thehorizontal plane. Figure 3(a) shows that only a minorredistribution of the diffracted intensities occurs result-ing from annealing. However, a careful examination ofFigure 3(b) shows that a significant reduction of the(0002) peak occurs at this tilt angle. Figures 4(a)through (d) show a comparison of the diffractedintensity as a function of the specimen tilt in the as-deformed condition and the annealed condition afterreaching a peak temperature of 623 K (350 �C). Becauseno significant change is noted in the peak intensitiesduring the time taken for texture measurements shownin Figure 3, it can be assumed that the data shown inFigure 4 is essentially isochronal. Four diffraction peakswere selected for these plots, including those presentedin Figure 3. A significant asymmetry can be observed inthe initial texture, which is presumably caused byshearing. The asymmetry in the (00.2) intensity contin-ues to exist after recrystallization with a slight shift tothe left, although the peak intensity reduces slightly. Asimilar shift is also observed for (10.1) and (11.0) peaks.The overall texture of the sample in the as-deformed
condition and after the recrystallization anneal at 623 K(350 �C) was measured using X-ray diffraction, and theresults are shown in Figure 5. The X-ray results alsoshow that the (00.2) texture intensity decreases at thecenter and shows a wider spread in the annealedcondition compared with the deformed condition. Asimilar trend is also observed in the other pole figures.The neutron diffraction measurements shown in Fig-ure 4 roughly correspond to a subset of the intensitiesfrom the X-ray pole figures given in Figure 5, along avertical line through the center of the pole figures that
Fig. 5—Deformation and annealing textures for AZ31-P3 obtained using X-ray diffraction.
1514—VOLUME 43A, MAY 2012 METALLURGICAL AND MATERIALS TRANSACTIONS A
corresponds to a 0 deg to 180 deg rotation about theTD, and therefore, they do not show the significantreductions in the intensities along the RD observed inthe X-ray pole figures. However, an overall consistencyexists in the variation of the texture components asmeasured by X-ray diffraction and by neutron diffrac-tion along the RD.
Figure 6 shows the texture in the experimental sampleprior to deformation and the texture in the computa-tional domain obtained by mapping the experimentaltexture. The mapping procedure provides a reasonableagreement between the texture in the experimentalsample prior to asymmetric rolling and the input textureused for the deformation simulations. Orientation imag-ing microscopy of the experimental sample shows fairlyequiaxed grains, and such morphology was also used inthe mapped grain structure. Because the friction condi-tions between the roll and the AZ31 sheet were notknown, the deformation simulations using the crystalplasticity model were carried out using increasing levelsof shear. However, as the shear to compression ratiowas increased beyond 1.0, the deformation texture
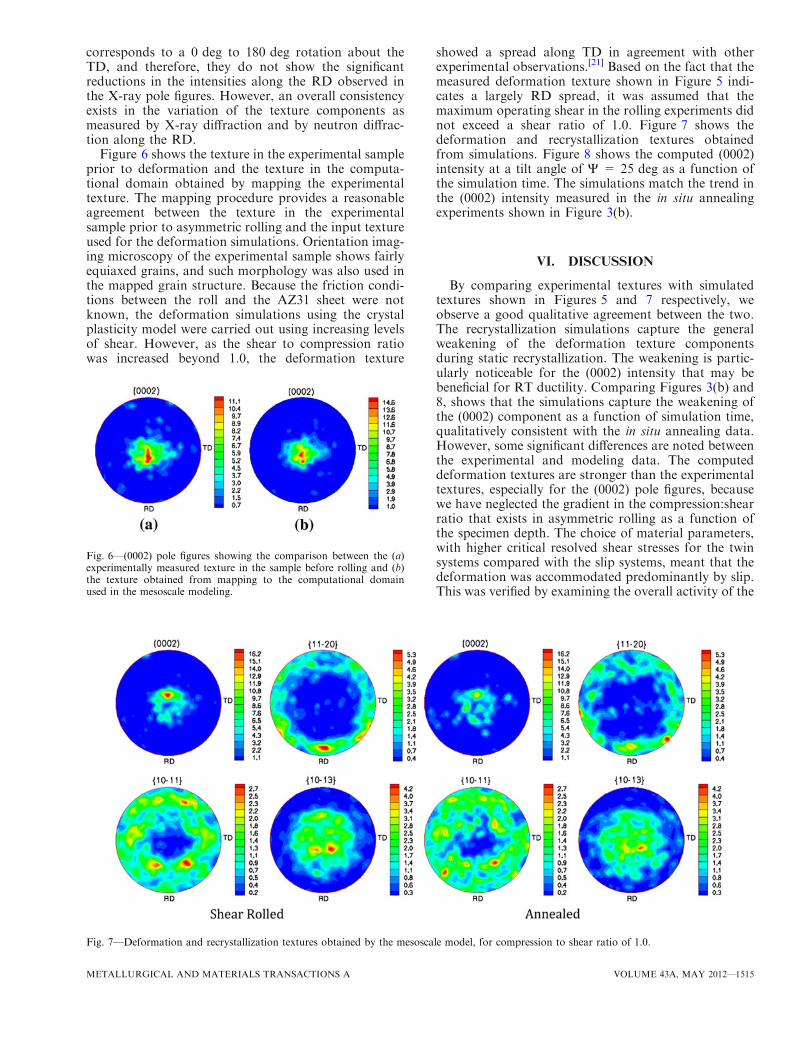
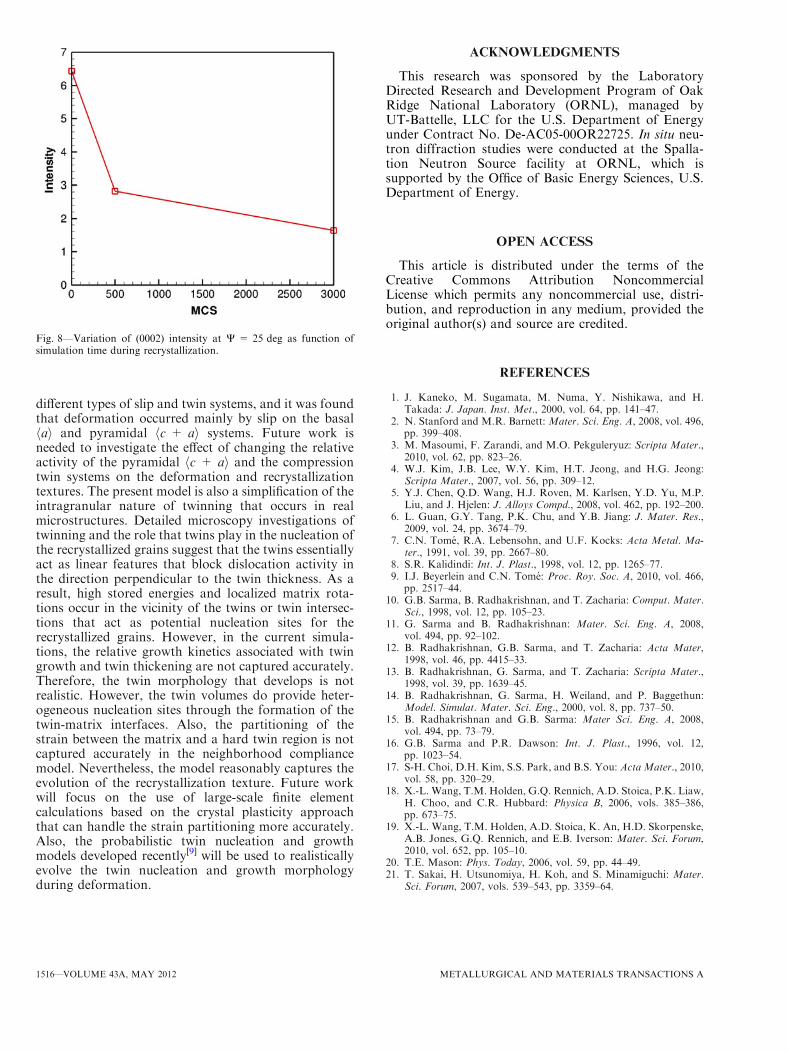
showed a spread along TD in agreement with otherexperimental observations.[21] Based on the fact that themeasured deformation texture shown in Figure 5 indi-cates a largely RD spread, it was assumed that themaximum operating shear in the rolling experiments didnot exceed a shear ratio of 1.0. Figure 7 shows thedeformation and recrystallization textures obtainedfrom simulations. Figure 8 shows the computed (0002)intensity at a tilt angle of W = 25 deg as a function ofthe simulation time. The simulations match the trend inthe (0002) intensity measured in the in situ annealingexperiments shown in Figure 3(b).
VI. DISCUSSION
By comparing experimental textures with simulatedtextures shown in Figures 5 and 7 respectively, weobserve a good qualitative agreement between the two.The recrystallization simulations capture the generalweakening of the deformation texture componentsduring static recrystallization. The weakening is partic-ularly noticeable for the (0002) intensity that may bebeneficial for RT ductility. Comparing Figures 3(b) and8, shows that the simulations capture the weakening ofthe (0002) component as a function of simulation time,qualitatively consistent with the in situ annealing data.However, some significant differences are noted betweenthe experimental and modeling data. The computeddeformation textures are stronger than the experimentaltextures, especially for the (0002) pole figures, becausewe have neglected the gradient in the compression:shearratio that exists in asymmetric rolling as a function ofthe specimen depth. The choice of material parameters,with higher critical resolved shear stresses for the twinsystems compared with the slip systems, meant that thedeformation was accommodated predominantly by slip.This was verified by examining the overall activity of the
Fig. 6—(0002) pole figures showing the comparison between the (a)experimentally measured texture in the sample before rolling and (b)the texture obtained from mapping to the computational domainused in the mesoscale modeling.
Fig. 7—Deformation and recrystallization textures obtained by the mesoscale model, for compression to shear ratio of 1.0.
METALLURGICAL AND MATERIALS TRANSACTIONS A VOLUME 43A, MAY 2012—1515
different types of slip and twin systems, and it was foundthat deformation occurred mainly by slip on the basalhai and pyramidal hc + ai systems. Future work isneeded to investigate the effect of changing the relativeactivity of the pyramidal hc + ai and the compressiontwin systems on the deformation and recrystallizationtextures. The present model is also a simplification of theintragranular nature of twinning that occurs in realmicrostructures. Detailed microscopy investigations oftwinning and the role that twins play in the nucleation ofthe recrystallized grains suggest that the twins essentiallyact as linear features that block dislocation activity inthe direction perpendicular to the twin thickness. As aresult, high stored energies and localized matrix rota-tions occur in the vicinity of the twins or twin intersec-tions that act as potential nucleation sites for therecrystallized grains. However, in the current simula-tions, the relative growth kinetics associated with twingrowth and twin thickening are not captured accurately.Therefore, the twin morphology that develops is notrealistic. However, the twin volumes do provide heter-ogeneous nucleation sites through the formation of thetwin-matrix interfaces. Also, the partitioning of thestrain between the matrix and a hard twin region is notcaptured accurately in the neighborhood compliancemodel. Nevertheless, the model reasonably captures theevolution of the recrystallization texture. Future workwill focus on the use of large-scale finite elementcalculations based on the crystal plasticity approachthat can handle the strain partitioning more accurately.Also, the probabilistic twin nucleation and growthmodels developed recently[9] will be used to realisticallyevolve the twin nucleation and growth morphologyduring deformation.
ACKNOWLEDGMENTS
This research was sponsored by the LaboratoryDirected Research and Development Program of OakRidge National Laboratory (ORNL), managed byUT-Battelle, LLC for the U.S. Department of Energyunder Contract No. De-AC05-00OR22725. In situ neu-tron diffraction studies were conducted at the Spalla-tion Neutron Source facility at ORNL, which issupported by the Office of Basic Energy Sciences, U.S.Department of Energy.
OPEN ACCESS
This article is distributed under the terms of theCreative Commons Attribution NoncommercialLicense which permits any noncommercial use, distri-bution, and reproduction in any medium, provided theoriginal author(s) and source are credited.
REFERENCES
1. J. Kaneko, M. Sugamata, M. Numa, Y. Nishikawa, and H.Takada: J. Japan. Inst. Met., 2000, vol. 64, pp. 141–47.
2. N. Stanford and M.R. Barnett: Mater. Sci. Eng. A, 2008, vol. 496,pp. 399–408.
3. M. Masoumi, F. Zarandi, and M.O. Pekguleryuz: Scripta Mater.,2010, vol. 62, pp. 823–26.
4. W.J. Kim, J.B. Lee, W.Y. Kim, H.T. Jeong, and H.G. Jeong:Scripta Mater., 2007, vol. 56, pp. 309–12.
5. Y.J. Chen, Q.D. Wang, H.J. Roven, M. Karlsen, Y.D. Yu, M.P.Liu, and J. Hjelen: J. Alloys Compd., 2008, vol. 462, pp. 192–200.
6. L. Guan, G.Y. Tang, P.K. Chu, and Y.B. Jiang: J. Mater. Res.,2009, vol. 24, pp. 3674–79.
7. C.N. Tome, R.A. Lebensohn, and U.F. Kocks: Acta Metal. Ma-ter., 1991, vol. 39, pp. 2667–80.
8. S.R. Kalidindi: Int. J. Plast., 1998, vol. 12, pp. 1265–77.9. I.J. Beyerlein and C.N. Tome: Proc. Roy. Soc. A, 2010, vol. 466,
pp. 2517–44.10. G.B. Sarma, B. Radhakrishnan, and T. Zacharia: Comput. Mater.
Sci., 1998, vol. 12, pp. 105–23.11. G. Sarma and B. Radhakrishnan: Mater. Sci. Eng. A, 2008,
vol. 494, pp. 92–102.12. B. Radhakrishnan, G.B. Sarma, and T. Zacharia: Acta Mater,
1998, vol. 46, pp. 4415–33.13. B. Radhakrishnan, G. Sarma, and T. Zacharia: Scripta Mater.,
1998, vol. 39, pp. 1639–45.14. B. Radhakrishnan, G. Sarma, H. Weiland, and P. Baggethun:
Model. Simulat. Mater. Sci. Eng., 2000, vol. 8, pp. 737–50.15. B. Radhakrishnan and G.B. Sarma: Mater Sci. Eng. A, 2008,
vol. 494, pp. 73–79.16. G.B. Sarma and P.R. Dawson: Int. J. Plast., 1996, vol. 12,
pp. 1023–54.17. S-H. Choi, D.H. Kim, S.S. Park, and B.S. You: Acta Mater., 2010,
vol. 58, pp. 320–29.18. X.-L. Wang, T.M. Holden, G.Q. Rennich, A.D. Stoica, P.K. Liaw,
H. Choo, and C.R. Hubbard: Physica B, 2006, vols. 385–386,pp. 673–75.
19. X.-L. Wang, T.M. Holden, A.D. Stoica, K. An, H.D. Skorpenske,A.B. Jones, G.Q. Rennich, and E.B. Iverson: Mater. Sci. Forum,2010, vol. 652, pp. 105–10.
20. T.E. Mason: Phys. Today, 2006, vol. 59, pp. 44–49.21. T. Sakai, H. Utsunomiya, H. Koh, and S. Minamiguchi: Mater.
Sci. Forum, 2007, vols. 539–543, pp. 3359–64.
Fig. 8—Variation of (0002) intensity at W = 25 deg as function ofsimulation time during recrystallization.
1516—VOLUME 43A, MAY 2012 METALLURGICAL AND MATERIALS TRANSACTIONS A