Rectified Brownian transport in corrugated channels: Fractional Brownian motion and Lévy flights
Upload
independentCategory
view
1download
0
Atmosphere 2014, 5, 342-369; doi:10.3390/atmos5020342
atmosphere ISSN 2073-4433
www.mdpi.com/journal/atmosphere
Article
Mercury Plumes in the Global Upper Troposphere Observed during Flights with the CARIBIC Observatory from May 2005 until June 2013
Franz Slemr 1,*, Andreas Weigelt 2, Ralf Ebinghaus 2, Carl Brenninkmeijer 1, Angela Baker 1,
Tanja Schuck 1,†, Armin Rauthe-Schöch 1, Hella Riede 1, Emma Leedham 1, Markus Hermann 3,
Peter van Velthoven 4, David Oram 5, Debbie O’Sullivan 5, ‡, Christoph Dyroff 6, Andreas Zahn 6
and Helmut Ziereis 7
1 Atmospheric Chemistry Division, Max-Planck-Institut für Chemie (MPI), Hahn-Meitner-Weg 1,
D-55128 Mainz, Germany; E-Mails: [email protected] (C.B.);
[email protected] (A.B.); [email protected] (T.S.);
[email protected] (A.R.-S.); [email protected] (H.R.);
[email protected] (E.L.) 2 Institute of Coastal Research, Helmholtz-Zentrum Geesthacht (HZG), Max-Planck-Straße 1,
D-21502 Geesthacht, Germany; E-Mails: [email protected] (A.W.);
[email protected] (R.E.) 3 Leibniz-Institut für Troposphärenforschung (TROPOS), Permoserstrasse 15,
D-04318 Leipzig, Germany; E-Mail: [email protected]. 4 Royal Netherlands Meteorological Institute (KNMI), P.O. Box 201,
NL-3730 AE De Bilt, The Netherlands; E-Mail: [email protected]. 5 National Centre for Atmospheric Science, University of East Anglia (UEA),
Norwich NR4 7TJ, UK; E-Mails: [email protected] (D.O.);
[email protected] (D.O.S.) 6 Institute of Meteorology and Climate Research, Karlsruhe Institute of Technology (KIT),
Hermann-von-Helmholtz-Platz 1, D-76344 Eggenstein-Leopoldshafen, Germany;
E-Mails: [email protected](C.D.); [email protected] (A.Z.) 7 Institut für Physik der Atmosphäre, Deutsches Zentrum für Luft- und Raumfahrt (DLR),
D-82230 Wessling, Germany; E-Mail: [email protected]
† Current Affiliation: NRW State Agency for Nature, Environment and Consumer Protection,
Recklinghausen, Germany ‡ Current Affiliation: Meteorological Office, Exeter, EX1 3PB, UK
* Author to whom correspondence should be addressed; E-Mail: [email protected];
Tel.: +49-8821-52595.
OPEN ACCESS
Atmosphere 2014, 5 343
Received: 24 February 2014; in revised form: 28 April 2014 / Accepted: 30 April 2014 /
Published: 28 May 2014
Abstract: Tropospheric sections of flights with the CARIBIC (Civil Aircraft for Regular
Investigation of the Atmosphere Based on an Instrumented Container) observatory from
May 2005 until June 2013, are investigated for the occurrence of plumes with elevated Hg
concentrations. Additional information on CO, CO2, CH4, NOy, O3, hydrocarbons,
halocarbons, acetone and acetonitrile enable us to attribute the plumes to biomass burning,
urban/industrial sources or a mixture of both. Altogether, 98 pollution plumes with
elevated Hg concentrations and CO mixing ratios were encountered, and the Hg/CO
emission ratios for 49 of them could be calculated. Most of the plumes were found over
East Asia, in the African equatorial region, over South America and over Pakistan and
India. The plumes encountered over equatorial Africa and over South America originate
predominantly from biomass burning, as evidenced by the low Hg/CO emission ratios and
elevated mixing ratios of acetonitrile, CH3Cl and particle concentrations. The backward
trajectories point to the regions around the Rift Valley and the Amazon Basin, with its
outskirts, as the source areas. The plumes encountered over East Asia and over Pakistan
and India are predominantly of urban/industrial origin, sometimes mixed with products of
biomass/biofuel burning. Backward trajectories point mostly to source areas in China and
northern India. The Hg/CO2 and Hg/CH4 emission ratios for several plumes are also
presented and discussed.
Keywords: mercury; emission; air; pollution
1. Introduction
Mercury (Hg) is emitted by natural and anthropogenic processes, and because of its rather long
atmospheric lifetime of one year, it can be transported over long distances [1,2]. After oxidation and
deposition, part of it can be transformed to highly neurotoxic methyl mercury. The latter is then
bio-accumulated in the aquatic food web and may harm both human populations and fauna, which are
dependent on fish [3,4]. Emissions from different natural and anthropogenic processes, such as
volcanic emissions, emission from the oceans, from soils, coal and biomass burning, as well as many
other anthropogenic activities, have been estimated, and spatially and temporally resolved emission
inventories have been calculated from the emission factors obtained in these studies (e.g., [5–15]).
Despite all these efforts, the emission estimates are still quite uncertain, especially those related to
natural sources and anthropogenic emissions in rapidly developing countries in East and South-East
Asia [9,13,16,17]. Thus, more data on mercury emissions are required, and the existing inventories
need to be evaluated by measurements.
Direct measurements of emissions by techniques, such as a mass balance technique or using an
artificially emitted tracer substance [18], are complex and expensive. The mass balance technique
Atmosphere 2014, 5 344
measures the fluxes in and out of a chosen source area and calculates the emissions as a difference
between them. For a middle-sized city, it requires the use of several aircraft equipped with precise
chemical and meteorological instrumentation to resolve small differences of large fluxes.
Alternatively, an artificial tracer, such as SF6, is emitted in an area under investigation and the
emission of the target substance is calculated from the known emission of the artificial tracer and the
correlations of the target substance concentrations with those of the tracer. Both techniques have been
successfully used to determine emissions of CO and NOy of a middle-sized city [18], but they can
hardly be scaled up to larger areas. A determination of emission ratios of two substances from their
concentrations in the plumes even of large areas is experimentally much more amenable [18–20].
Consequently, emission ratios are promising to be the most practicable way to evaluate the consistency
of an emission inventory of one substance with an inventory of another substance [21]. Emission ratios
can also be used to constrain the lesser known emissions of one substance using the better known
emissions of another substance [21,22].
The CARIBIC (Civil Aircraft for Regular Investigation of the Atmosphere Based on an
Instrumented Container) observatory is a long-term project aimed at the monitoring of atmospheric
composition and its changes by using an instrumented freight container flown on-board a passenger
aircraft during intercontinental flights [23]. It started in 1997 and, apart from an interruption between
2002 and 2004, has been operational continuously over more than 15 years. Despite cruising most of
the time at altitudes from 10 to 12 km, plumes of polluted air lifted mostly by convection or warm
conveyor belts [24,25] are frequently encountered in the tropospheric sections of the flights.
Here, we report on plumes with elevated mercury concentrations observed during CARIBIC flights
since May 2005, when a mercury instrument was installed until June 2013. Rich ancillary data on
other gases, such as carbon monoxide (CO), carbon dioxide (CO2), methane (CH4), total reactive
nitrogen (NOy), hydrocarbons, halocarbons and on atmospheric aerosol, enable a detailed
characterization of the plumes, its attribution to the emission processes and, in combination with
backward trajectories, an approximate localization of the emissions. Correlations of Hg with CO, CO2
and CH4 provide Hg/CO, Hg/CO2 and Hg/CH4 emission ratios, which may help to constrain the
estimates of mercury emissions using the CO, CO2 and CH4 emission inventories [21].
2. Experimental Section
Since December 2004, a new CARIBIC measurement container [23] on-board an Airbus 340–600 of
Lufthansa has been flown monthly on transcontinental flights. The corresponding routes (until June 2013)
are shown in Figure 1, and the complete list of flights can be found at www.caribic-atmospheric.com.
Typically, a sequence of 4 consecutive intercontinental flights is executed every month. The modified
freight container (gross weight: 1.5 metric tons) holds 15 automated analysers for the in situ
measurements of mercury concentrations and mixing ratios of CO, O3, NO, NOy, CO2, total (including
cloud droplets) and gaseous water, oxygenated organic compounds and concentrations of fine particles
(three counters for particles with diameters >4 nm, >12 nm and >18 nm, all up to 2 µm), as well as one
optical particle counter for particles with diameters of 130–900 nm. In addition, air and aerosol
samples are taken in flight and subsequently analysed in the laboratory for greenhouse gases,
halocarbons, non-methane hydrocarbons (NMHCs) and particle elemental composition and
Atmosphere 2014, 5 345
morphology, respectively [23]. In May 2010, several instruments were upgraded and new instruments
were added. In the context of this paper, the most important change was the addition of a whole air
sampler with a capacity of 88 samples and of an instrument for continuous measurements of CH4
(Fast Greenhouse Gas Analyzer, Los Gatos Research, [26]). With the new whole air sampler, the
measurement frequency of greenhouse gases [27] and hydrocarbons [28] could be increased from 28 to
116 measurements per flight sequence. Halocarbon measurements (except for CH3Cl, which can be
determined by both hydrocarbon and halocarbon analytical methods) were unaffected, due to the
limited volume of air available for analysis in the new sampler.
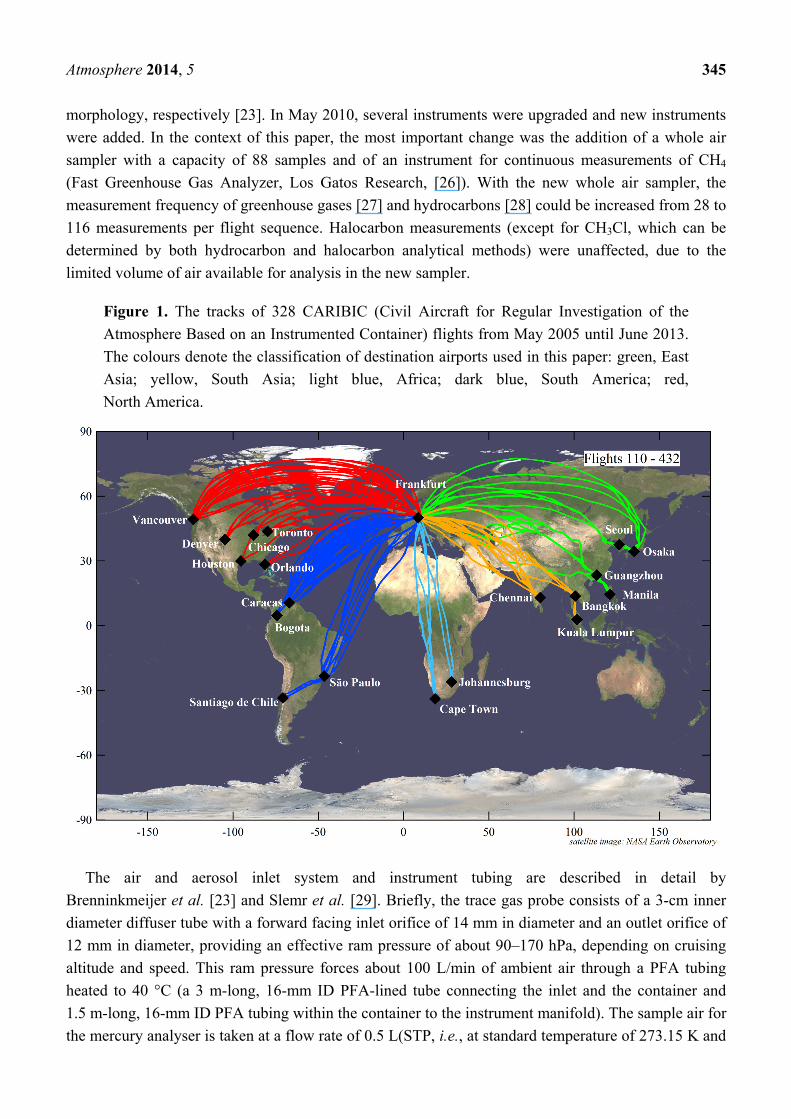
Figure 1. The tracks of 328 CARIBIC (Civil Aircraft for Regular Investigation of the
Atmosphere Based on an Instrumented Container) flights from May 2005 until June 2013.
The colours denote the classification of destination airports used in this paper: green, East
Asia; yellow, South Asia; light blue, Africa; dark blue, South America; red,
North America.
The air and aerosol inlet system and instrument tubing are described in detail by
Brenninkmeijer et al. [23] and Slemr et al. [29]. Briefly, the trace gas probe consists of a 3-cm inner
diameter diffuser tube with a forward facing inlet orifice of 14 mm in diameter and an outlet orifice of
12 mm in diameter, providing an effective ram pressure of about 90–170 hPa, depending on cruising
altitude and speed. This ram pressure forces about 100 L/min of ambient air through a PFA tubing
heated to 40 °C (a 3 m-long, 16-mm ID PFA-lined tube connecting the inlet and the container and
1.5 m-long, 16-mm ID PFA tubing within the container to the instrument manifold). The sample air for
the mercury analyser is taken at a flow rate of 0.5 L(STP, i.e., at standard temperature of 273.15 K and
Atmosphere 2014, 5 346
pressure of 1013.25 hPa)/min from the manifold using 4-mm ID PFA tubing heated by the energy
dissipated in the container to ~30 °C. The arrangement similar to that described by Talbot et al. [30]
was optimized to transmit highly surface reactive HNO3 [31] and can thus be presumed to facilitate the
transfer of gaseous oxidized mercury (GOM), as well [30]. The large flow through the trace gas
diffuser inlet tube of more than 2000 L/min and perpendicular sampling at much smaller flow rates of
about 100 L/min discriminate against particles larger than about one micrometre in diameter (50%
aspiration efficiency [32]). Consequently, all smaller particles and, thus, the major fraction of particle
mass in the upper troposphere will be transported to the manifold in the container.
The mercury instrument, which is based on an automated dual channel, single-amalgamation, cold
vapour atomic fluorescence analyser (Tekran-Analyzer Model 2537 A, Tekran Inc., Toronto, ON,
Canada), is described by Slemr et al. [29]. The instrument features two gold cartridges. While one is
adsorbing mercury during a sampling period, the other is being thermally desorbed using argon as a
carrier gas. Hg is detected using cold vapour atomic fluorescence spectroscopy (CVAFS). The
functions of the cartridges are then interchanged, allowing continuous sampling of the incoming air
stream. A 45-mm diameter PTFE pre-filter (pore size 0.2 µm) protects the sampling cartridges against
contamination by particles that pass through the inlet system. The 0.5 L(STP)/min of air sample, typically
at 200–300 hPa, is compressed to about 500 hPa, needed to operate the instrument with its internal
pump. Extensive laboratory tests of this PTFE diaphragm pump (KNF-Neuberger, Model N89KTDC)
did not show either any contamination of the system with Hg or Hg losses. To avoid the contamination
of the instruments and of the tubing connecting the sampling manifold with the instruments during
ascents and descents in polluted areas near airports, the sampling pumps are activated only at an
ambient pressure below 500 hPa. Consequently, no measurements below an altitude of about 5 km
were made.
Initially, the instrument was operated with a gas mixture of 0.25% CO2 in argon, which also is used
for the operation of the CO instrument. Because the addition of CO2 to argon reduced the sensitivity of
the fluorescence detector by ~35%, the instrument was run initially with a 15-min sampling time
(corresponding to a ~225 km-flying distance) until March 2006 (Flight 145) and with 10 min until
June 2007 (Flight 197). Since August 2007, the CO2 has been removed from the gas mixture using a
tube filled with an X10 molecular sieve. The corresponding sensitivity gain enabled us to reduce the
sampling interval to 5 min (corresponding to a ~75-km flying distance). The instrument is calibrated
after every other month in the laboratory by ~48 h of parallel operation to a well-calibrated identical
instrument. A detection limit of ~0.1 ng·Hg·m−3 and a reproducibility of about 0.05 ng·Hg·m−3 is
achieved at our operating conditions. To improve the detection limit and reproducibility of the
measurements, we returned to 10-min sampling in August 2011 (Flight 349). For this paper, the data
from May 2005 to June 2013, were analysed. All mercury concentrations are reported in ng·Hg·m−3 (STP,
i.e., at 1013.25 hPa and 273.15 K).
Speciation experiments on-board the CARIBIC container, where gaseous oxidized mercury (GOM)
was removed in the instrument using a KCl or soda lime trap upstream of one of the gold cartridges,
showed qualitatively that GOM (essentially Hg2+) is transmitted through the inlet system to the
instrument and will be measured. A demonstration of a quantitative transmission would require
capabilities to prepare GOM test mixtures at high flow rates and to replicate the flight conditions
(i.e., −50 °C, 900 km·h−1), which is beyond the constraints imposed by a commercial airliner.
Atmosphere 2014, 5 347
Temme et al. [33] found the GOM transmission to be quantitative at conditions similar to those in the
upper troposphere, i.e., low temperatures and dry air, which allows us to assume the same for our
system. A definitive verification of this assumption has to wait for an in-flight intercomparison with a
research aircraft with proven speciation capabilities. Newer data on the gas-particle partitioning of
atmospheric Hg2+ [34,35] suggest that particle bound mercury (PBM, also mostly Hg2+) sampled near
the tropopause at temperatures of ~−50 °C will evaporate when warmed up to ~+40 °C during the
transport in the sampling tubing to the instrument. PBM on particles that make it into the trace gas
inlet will thus be most likely also measured. Consequently, the CARIBIC measurements approximate
the total mercury concentration in the troposphere. We note that even if GOM concentrations in the
upper troposphere represent more than 1% or less of total gaseous mercury concentrations typically
found in the boundary layer [36,37], its non-quantitative transmission by our inlet system would not
substantially influence the results presented in this paper.
The plumes with elevated Hg concentrations showed, apart from a few exceptions mentioned in
Section 3.1, also elevated CO and, sometimes, CO2 and CH4 mixing ratios. For these plumes, the
Hg/CO, Hg/CO2 and Hg/CH4 emission ratios were calculated by bivariate least-squares correlations of
Hg with CO, CO2 and CH4 [38], respectively, which take into account the uncertainties in both
variables. For these correlations, the continuously measured CO, CO2 and CH4 were averaged over the
Hg sampling interval. The uncertainties of Hg, CO, CO2 and CH4 measurements were set to
0.05 pg·m−3, 1 ppb, 0.05 ppm and 3 ppb, respectively. The underlying assumptions in the emission
ratio calculations are: (1) that none of the correlated substances are lost during the transport from the
source to the point of encounter by chemical reactions; (2) that the emission ratios are nearly constant
during the observation interval; and (3) that the plume is embedded in a homogeneous air mass, i.e.,
that the Hg concentration and CO, CO2 or CH4 mixing ratios before and after the plume are nearly the
same [20]. Assumption (1) is fulfilled, as the transport times (ranging from a few days to about
one week) are much shorter than the atmospheric lifetime of our target compounds (CO has the
shortest lifetime of ~2 months, with a local lifetime in the tropics being several weeks). Assumptions
(2) and (3) are probably fulfilled for a majority of smaller plumes. The large plumes stretching over
thousands of kilometres north and south of the intertropical convergence zone (ITCZ) during the
flights to South Africa are superimposed on a north-south Hg gradient, which violates Assumption (3).
Sometimes, large overlapping plumes with different sources in different areas are sampled, also violating
the Assumption (2). Consequently, even statistically significant Hg vs. CO, CO2 and CH4 correlations may
sometimes provide biased Hg/CO, Hg/CO2 or Hg/CH4 emission ratios in the case of the African flights.
Meteorological analyses for all CARIBIC flights are provided by KNMI (Royal Netherlands
Meteorological Institute) at http://www.knmi.nl/samenw/CARIBIC. Trajectories were calculated at 3-min
intervals along the flight track for each flight with the KNMI trajectory model, TRAJKS [39], using
data from ECMWF (European Centre for Middle Weather Forecast) data.
3. Results and Discussion
3.1. Overview
Compared to the search for plumes at a ground station [21], the processing of the CARIBIC data is
complicated by the variability of the data over large distances in the upper troposphere and by the
Atmosphere 2014, 5 348
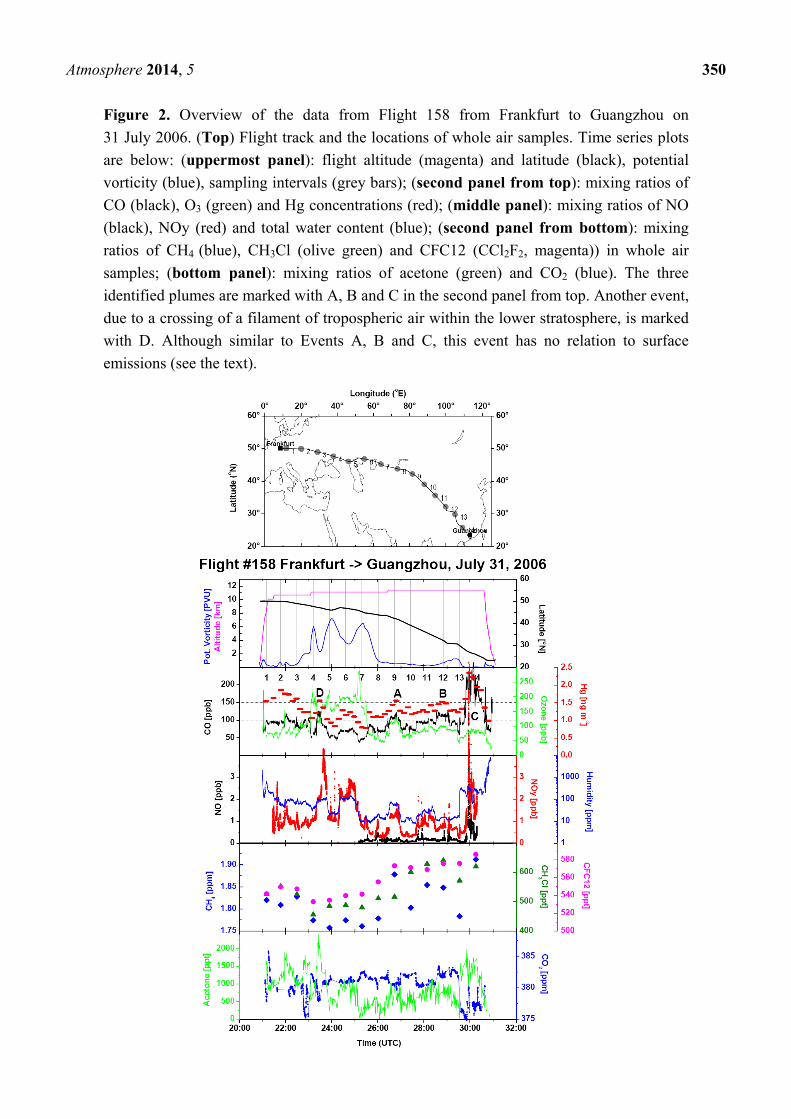
frequent changes of tropospheric and stratospheric air masses. Figure 2 shows an overview of the data
from Flight 158 from Frankfurt to Guangzhou on 31 July and 1 August 2006. The aircraft flew in the
troposphere until ~23:00 UTC and then in the stratosphere until about 1:45 UTC on 1 August.
The stratospheric section is evidenced by the high potential vorticity and O3 mixing ratio, as well as
the low CO mixing ratio shown in the upper two panels of the data time series. In the tropospheric
section after about 1:45 UTC on 1 August 2006, mercury background concentrations vary between
about 1.25 and 1.35 ng·m−3 (the second panel from the top of the data time series). Three events with
elevated Hg concentrations, denoted as A, B and C, with peak Hg concentrations of 1.55, 1.5 and
2.3 ng·m−3 are observed at about 2:40, 4:50 and 6:00 UTC, respectively, on 1 August 2006. All events
are accompanied by elevated CO (the second panel from the top), NOy, H2O (middle panel) and
acetone (bottom panel). We base our approach on the visual inspection of the data overview plots of
each flight for the coincident occurrence of elevated Hg concentrations with elevated CO mixing
ratios. Plumes identified in this way are cross-checked using variations of other tracers for
anthropogenic emissions, such as NOy (middle panel), acetone (bottom panel), CH4 (the second panel
from the bottom), non-methane hydrocarbons (not available for this flight) and halocarbons (the
second panel from the bottom). Humidity and cloud water content (determined as the difference
between total water content and the water vapour mixing ratio) as tracers for convective processes are
also sometimes useful.
An event within the stratospheric section of the flight at ~23:25 UTC (marked as D) has a similar
characteristics as Events A, B and C and can easily be mistaken for a plume. The only pronounced
difference is that the maximum of Hg concentration (and CO, acetone and H2O mixing ratios) in
Event D coincides with dips in potential vorticity and O3 mixing ratios, both at higher levels
characteristic for the lower stratosphere. Such dips in potential vorticity and O3 indicate a crossing of a
filament of tropospheric air in the stratosphere. The variation of all mentioned species during such
crossing results from their strong gradients above the tropopause [29]. Events of this type are thus not
related to surface emissions and have to be eliminated from further consideration. Consequently, only
events embedded in air with a potential vorticity of less than 1.5 PVU (1 PVU = 10−6·m2·K·kg−1·s−1)
and/or less than 150 ppb O3 were considered.
Because we rely mostly on Hg and CO as plume tracers, only those processes that emit Hg and CO,
such as biomass burning, will be detected. This includes also collocated emissions of Hg and CO, CO2
or CH4, which applies for most of the urban and industrial emissions. However, emissions from mining
and smelting, which emit hardly any CO, CO2 or CH4, will not be detected (unless collocated with
other CO, CO2 or CH4 sources), because a suitable specific tracer for these processes, such as SO2, is
not on the otherwise comprehensive list of CARIBIC in situ measurements. Lacking in situ SO2
measurements also prevents the direct detection and identification of volcanic Hg emissions. One such
SO2 plume was detected during the descent to Frankfurt airport on 15 August 2008, using remote SO2
sensing by a nadir looking differential optical absorption system (DOAS) on-board CARIBIC and
remote sensing satellite [40]. Quantitative evaluation of this plume in terms of Hg emission, however,
was not possible, because the DOAS measurement does not provide in situ SO2 concentrations and the
elevated Hg concentrations were documented by only one Hg measurement point. Among the
substances measured in the whole air samples are tracers for marine emissions, such as short-lived
bromine and iodine containing halocarbons, but the low sampling frequency (28 samples taken over
Atmosphere 2014, 5 349
four intercontinental flights) makes them unsuitable as tracers for the detection of the Hg plumes of
marine origin. 222Rn as a tracer for terrestrial Hg emissions [22] is also not being measured on-board
CARIBIC. Consequently, in this study, we can only distinguish between Hg plumes of biomass
burning or urban/industry origin.
The short encounter with the Kasatochi volcano plume (~5 min) in 2008 during the descent to
Frankfurt airport [40] also illustrates some practical limits of our approach. The most severe limitation
is given by the low temporal resolution of the Hg measurements of 5–15 min corresponding
to a ~75–225 km flight distance. Statistically significant Hg vs. CO, CO2 and CH4 correlations require
at least three measurements. Thus, only plumes larger than ~300 km can be captured by our approach,
which also means that many plumes encountered during the short aircraft ascents and descents cannot
be resolved. The CARIBIC measurements start and stop at ~500 hPa to prevent the contamination of
the CARIBIC system by polluted air in the boundary layer near the airports [23]. Consequently,
information for the boundary layer, the most polluted part of the troposphere, is missing in our data
set. In addition, the Hg, CO, CO2 and CH4 data from ascents and descents through quasi-horizontal
layers in the troposphere are likely to violate the assumption of a plume being embedded in a
homogeneous air mass on which the Hg vs. CO, CO2 and CH4 correlations are based.
Although almost all of the Hg plumes were accompanied by elevated CO mixing ratios, seven of
them were observed during flight sections with nearly constant CO mixing ratios. All of these plumes
were encountered over the equatorial Atlantic Ocean between 0° and 15° N during the flights to South
American destinations. They were embedded in background mercury concentrations varying between
~0.95 and 1.3 ng·m−3, and the elevation above the background (ΔHg) varied between ~0.25 and
0.45 ng·m−3. In these events, elevated Hg concentrations were always accompanied by elevated
humidity, frequently also with clouds and elevated NOy, as well as with low O3 mixing ratios;
frequently, only around 30 ppb. Such low O3 mixing ratios are typical for the marine boundary layer
over the equatorial Atlantic Ocean [41]. Backward trajectories reveal contact with the equatorial
Atlantic Ocean surface. Satellite images of cloud cover indicate that these events are due to the
convection of the air masses from the marine boundary layer at the ITCZ. Elevated Hg concentration
in these events encountered in the upper free troposphere can point to emissions of mercury by
ocean [42], but we lack highly resolved tracer data for air from the marine boundary layer to
quantitatively describe them.
Despite these caveats and limitations, 98 encounters with plumes with elevated CO mixing ratios
and simultaneously elevated Hg concentrations were counted during 309 CARIBIC flights with valid
Hg measurements between May 2005 and June 2013. Taking into account the number of flights to the
respective regions listed in Table 1, the probability of plume encounters was highest during the flights
to South Africa with 85% of the flights. The second highest probability of plume occurrence was over
East Asia with 46%, followed by flights to South Asia with 26%, South America with 20% and North
America with 17%. The low frequency of plume encounters over North America is partly due to the
high northern latitude of the flight routes of these flights, which, at usual flight altitudes of
10–12 km, results in a high proportion of stratospheric sections with a potential vorticity >1.5 PVU.
However, the high frequency of plume encounters during the flights to Osaka and Seoul with flight
routes at similarly high northern latitudes shows that this bias alone cannot explain the low frequency
of plume encounters over Europe and North America.
Atmosphere 2014, 5 350
Figure 2. Overview of the data from Flight 158 from Frankfurt to Guangzhou on
31 July 2006. (Top) Flight track and the locations of whole air samples. Time series plots
are below: (uppermost panel): flight altitude (magenta) and latitude (black), potential
vorticity (blue), sampling intervals (grey bars); (second panel from top): mixing ratios of
CO (black), O3 (green) and Hg concentrations (red); (middle panel): mixing ratios of NO
(black), NOy (red) and total water content (blue); (second panel from bottom): mixing
ratios of CH4 (blue), CH3Cl (olive green) and CFC12 (CCl2F2, magenta)) in whole air
samples; (bottom panel): mixing ratios of acetone (green) and CO2 (blue). The three
identified plumes are marked with A, B and C in the second panel from top. Another event,
due to a crossing of a filament of tropospheric air within the lower stratosphere, is marked
with D. Although similar to Events A, B and C, this event has no relation to surface
emissions (see the text).
Atmosphere 2014, 5 351
For 56 plume encounters (out of 98), the Hg vs. CO correlations were statistically significant at a
confidence level of at least 95%. For these correlations, data from the same plume encountered twice
in the vicinity of an airport were combined, e.g., for a plume near Guangzhou encountered during the
forward and return flight to Manila (Flights 203 and 204) or a plume encountered near São Paulo
during Flights 123 (Frankfurt→São Paulo), 124 (São Paulo→Santiago de Chile) and 125 (Santiago de
Chile→São Paulo). Seven extremely high Hg/CO slopes of 12.9–23.7 pg·m−3·ppb−1 were connected
with physically unrealistic negative intercepts and are thus eliminated from the data set, leaving 49
plume encounters with valid Hg/CO slopes. The geographic distribution of these plumes is shown in
Figure 3.
Table 1. Overview of encounters with plumes with elevated Hg concentrations and CO
mixing ratios.
Destination Airport
Number of Flights
Number of Plume
Encounters
Number of Plumes With Significant Hg vs.
CO Correlations
Median and Range of Hg/CO Emission Ratios
(pg·m−3·ppb−1)
South Africa 13 11 4 2.9 (2.2–7.5) East Asia 101 46 31 8.2 (2.3–16.6)
South Asia 57 15 6 7.4 (5.0–10.0) South America 90 18 5 1.3 (1.1–3.3) North America 48 8 2 9.2 (6.9 and 11.4)
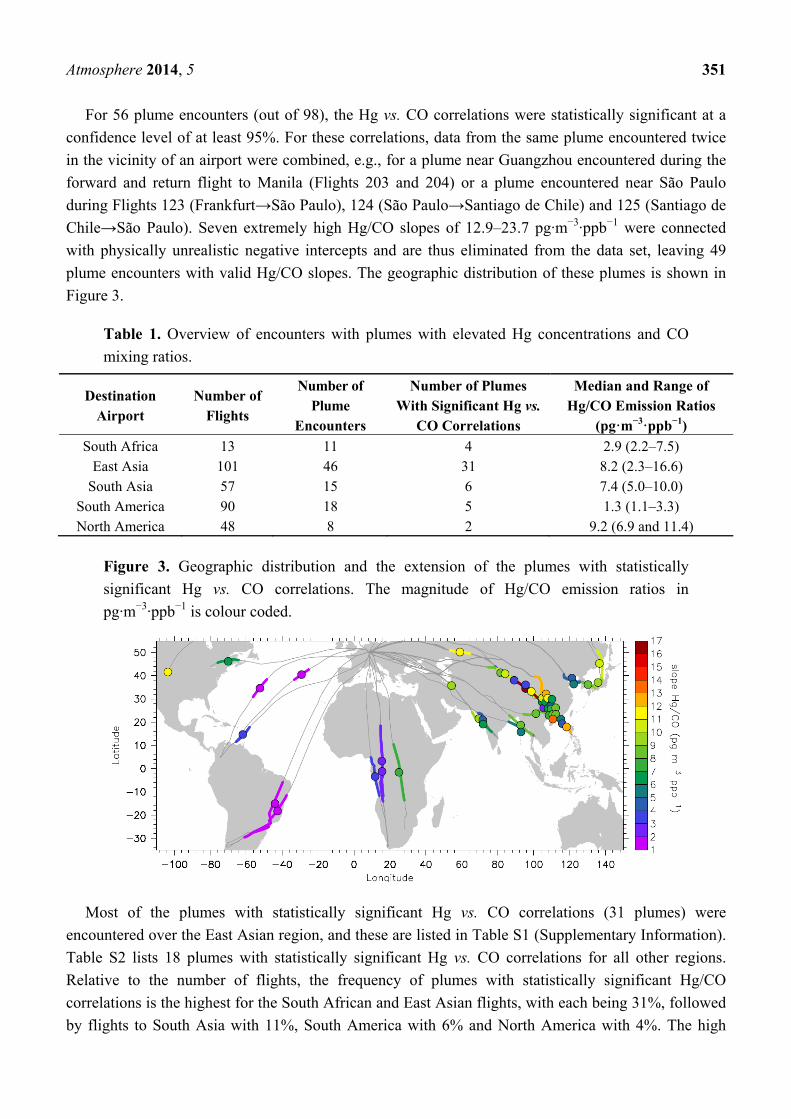
Figure 3. Geographic distribution and the extension of the plumes with statistically
significant Hg vs. CO correlations. The magnitude of Hg/CO emission ratios in
pg·m−3·ppb−1 is colour coded.
Most of the plumes with statistically significant Hg vs. CO correlations (31 plumes) were
encountered over the East Asian region, and these are listed in Table S1 (Supplementary Information).
Table S2 lists 18 plumes with statistically significant Hg vs. CO correlations for all other regions.
Relative to the number of flights, the frequency of plumes with statistically significant Hg/CO
correlations is the highest for the South African and East Asian flights, with each being 31%, followed
by flights to South Asia with 11%, South America with 6% and North America with 4%. The high
Atmosphere 2014, 5 352
occurrence of plumes during the flights to South Africa in which Hg does not correlate with CO is
caused by their large extension over a few thousands of km, changing the Hg and CO background from
north to south hemispheric concentrations and the inhomogeneity of the plumes. This will be discussed
later in Section 3.3.
The colour code of Figure 3 reveals a pronounced difference between the Hg/CO emission ratios in
different regions. The Hg/CO emission ratios for plumes encountered over East Asia range from 2.3 to
16.6 pg·m−3·ppb−1 (median 8.2 pg·m−3·ppb−1) and are similar to those over South Asia, ranging from
5.0 to 10.0 pg·m−3·ppb−1 (median 7.4 pg·m−3·ppb−1). On the contrary, the Hg/CO emission ratios for
plumes observed during the flights to South America and equatorial Africa range from 1.1 to
7.4 pg·m−3·ppb−1, with a median value of 1.8 pg·m−3·ppb−1 (a median of 1.3 pg·m−3·ppb−1 for South
America and 2.9 pg·m−3·ppb−1 for equatorial Africa). These plumes include also two plumes
encountered over the Atlantic Ocean, which, based on backward trajectories, can be attributed to forest
fires in the USA, as will be discussed in Section 3.4. The range and median of Hg/CO emission ratios
observed over South America and equatorial Africa is similar to the one for plumes observed at Cape
Point in South Africa [21]. A compilation of previously published Hg/CO emission ratios reported for
different processes and regions [29] shows that biomass burning is characterized by ratios below
2 pg·m−3·ppb−1 [43], whereas the ratios for urban/industrial emissions tend to be around 6 pg·m−3·ppb−1
and higher. Applying these criteria to the Hg/CO emission ratios shown in Figure 3 thus leads to the
conclusion that the plumes encountered during the flights to South America and equatorial Africa
originate predominantly from biomass burning (see also [44]), whereas the plumes observed over East
Asia, South Asia and North America are of industrial/urban or mixed origin. This preliminary
classification is supported by the detailed discussion in Sections 3.2–3.4.
CO2 emissions are better known than those of CO, and thus, the Hg/CO2 emission ratios have a
potential to provide a more accurate estimate of Hg emissions [21]. Unfortunately, CO2 data were
available for only 69 (out of 98) of the encountered plumes, of which nine were too narrow for
Hg vs. CO2 correlations. Statistically significant correlations of Hg vs. CO2 were only found for the
17 plumes listed in Table S3. These correlations will be discussed in Section 3.5.
Mercury was also found to correlate frequently with methane at Cape Point, which proved to be
useful for constraining the mercury emissions in South Africa [21]. Methane data were available only
for flights since October 2010, and altogether, 26 correlations of Hg vs. CH4 could be calculated, of
which, only the six listed in Table S4 were statistically significant. These will be discussed in
Section 3.6.
3.2. Plumes Encountered during the East Asian Flights
The East Asian plumes were encountered during the flights from Frankfurt to Manila with a
stopover at Guangzhou and during the flights to Osaka and Seoul. Apart from a few plumes over
Central Asia, most of them were encountered within a ~2000-km distance from the airports at
Guangzhou, Osaka and Seoul. Data from one of the flights have already been shown in Figure 2.
The Hg/CO emission ratios were 8.8 ± 1.5, 11.3 ± 2.0 and 7.49 ± 1.0 pg·m−3·ppb−1 for
Events A, B and C, respectively. Air sample analyses (the second panel from the bottom) show high
CH4 in Sample 9 (Event A, sample numbers are marked in the uppermost panel), 11 and 12 (Event B),
Atmosphere 2014, 5 353
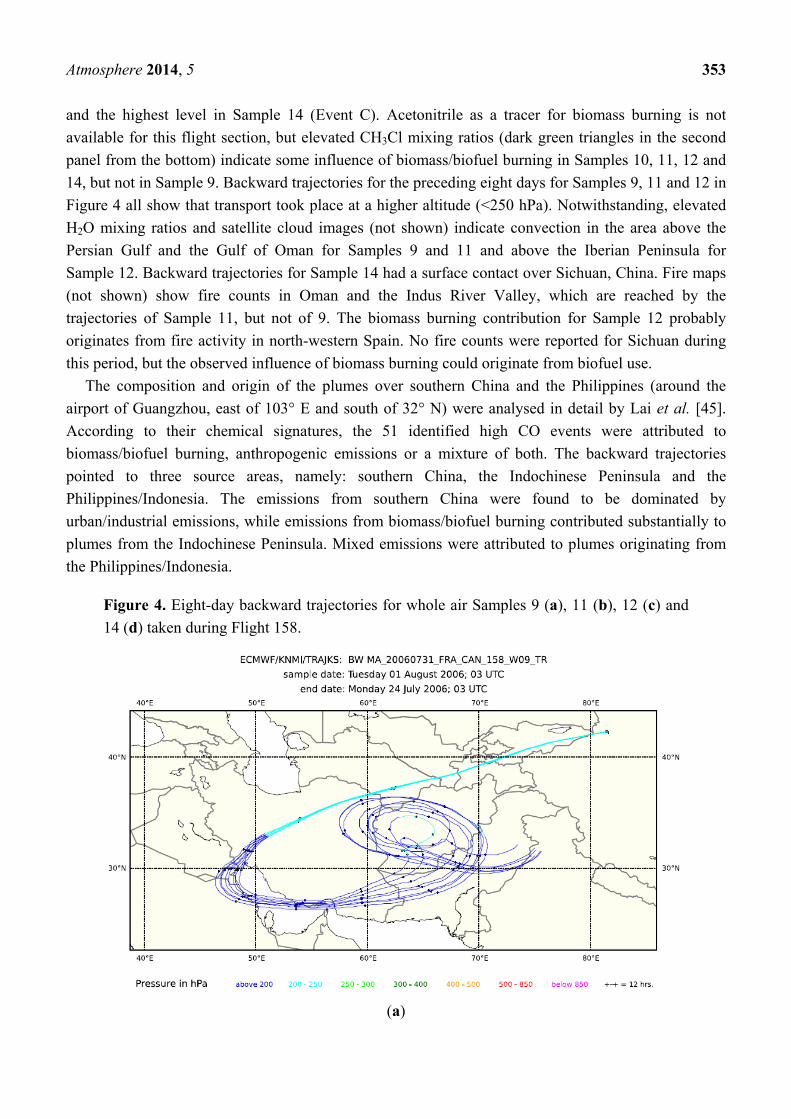
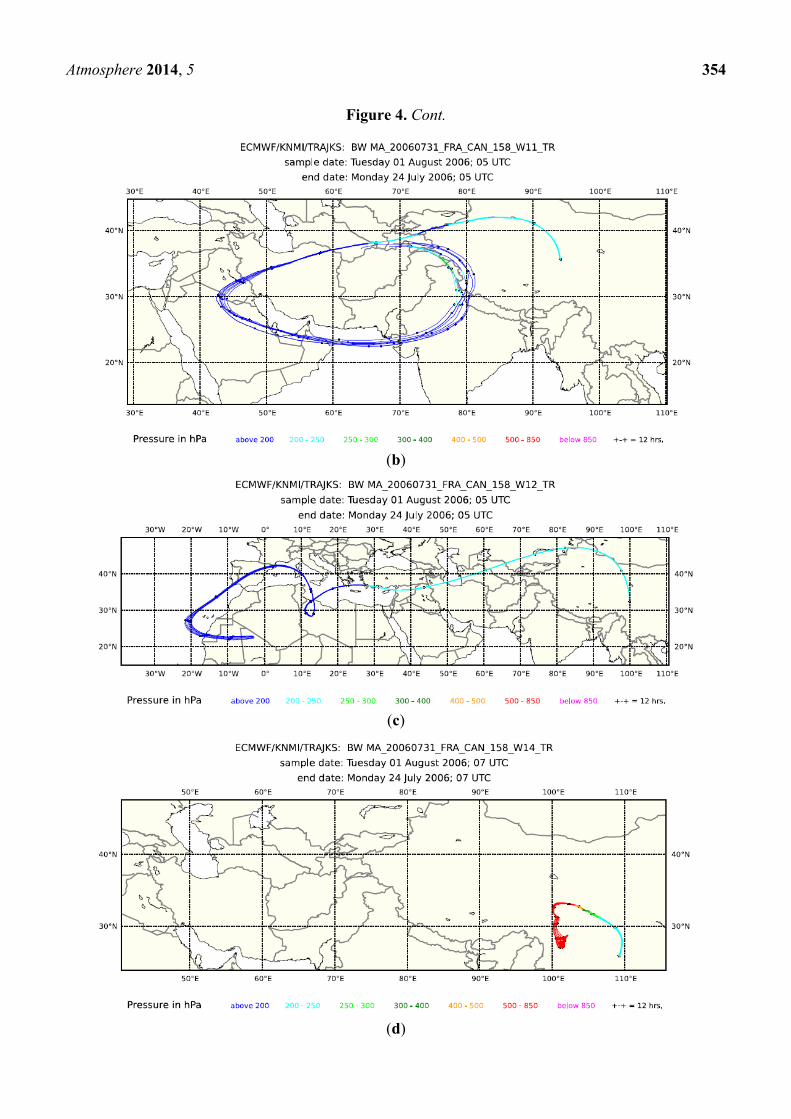
and the highest level in Sample 14 (Event C). Acetonitrile as a tracer for biomass burning is not
available for this flight section, but elevated CH3Cl mixing ratios (dark green triangles in the second
panel from the bottom) indicate some influence of biomass/biofuel burning in Samples 10, 11, 12 and
14, but not in Sample 9. Backward trajectories for the preceding eight days for Samples 9, 11 and 12 in
Figure 4 all show that transport took place at a higher altitude (<250 hPa). Notwithstanding, elevated
H2O mixing ratios and satellite cloud images (not shown) indicate convection in the area above the
Persian Gulf and the Gulf of Oman for Samples 9 and 11 and above the Iberian Peninsula for
Sample 12. Backward trajectories for Sample 14 had a surface contact over Sichuan, China. Fire maps
(not shown) show fire counts in Oman and the Indus River Valley, which are reached by the
trajectories of Sample 11, but not of 9. The biomass burning contribution for Sample 12 probably
originates from fire activity in north-western Spain. No fire counts were reported for Sichuan during
this period, but the observed influence of biomass burning could originate from biofuel use.
The composition and origin of the plumes over southern China and the Philippines (around the
airport of Guangzhou, east of 103° E and south of 32° N) were analysed in detail by Lai et al. [45].
According to their chemical signatures, the 51 identified high CO events were attributed to
biomass/biofuel burning, anthropogenic emissions or a mixture of both. The backward trajectories
pointed to three source areas, namely: southern China, the Indochinese Peninsula and the
Philippines/Indonesia. The emissions from southern China were found to be dominated by
urban/industrial emissions, while emissions from biomass/biofuel burning contributed substantially to
plumes from the Indochinese Peninsula. Mixed emissions were attributed to plumes originating from
the Philippines/Indonesia.
Figure 4. Eight-day backward trajectories for whole air Samples 9 (a), 11 (b), 12 (c) and
14 (d) taken during Flight 158.
(a)
Atmosphere 2014, 5 354
Figure 4. Cont.
(b)
(c)
(d)
Atmosphere 2014, 5 355
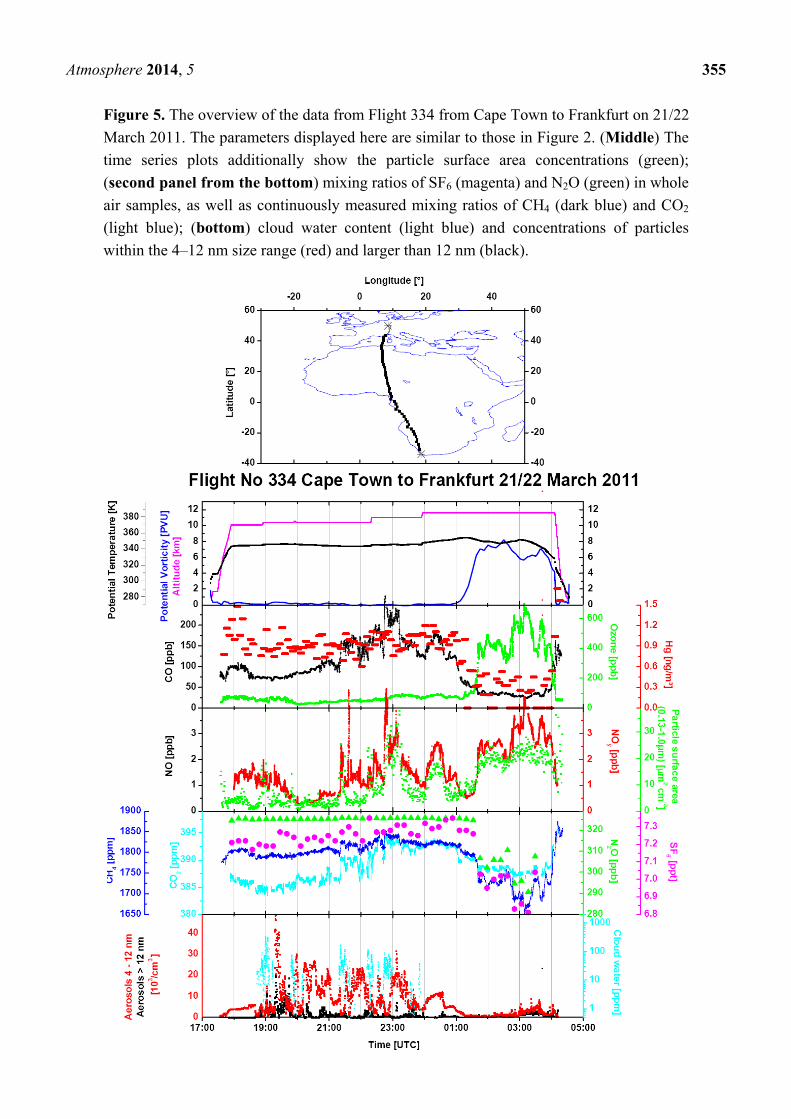
Figure 5. The overview of the data from Flight 334 from Cape Town to Frankfurt on 21/22
March 2011. The parameters displayed here are similar to those in Figure 2. (Middle) The
time series plots additionally show the particle surface area concentrations (green);
(second panel from the bottom) mixing ratios of SF6 (magenta) and N2O (green) in whole
air samples, as well as continuously measured mixing ratios of CH4 (dark blue) and CO2
(light blue); (bottom) cloud water content (light blue) and concentrations of particles
within the 4–12 nm size range (red) and larger than 12 nm (black).
Atmosphere 2014, 5 356
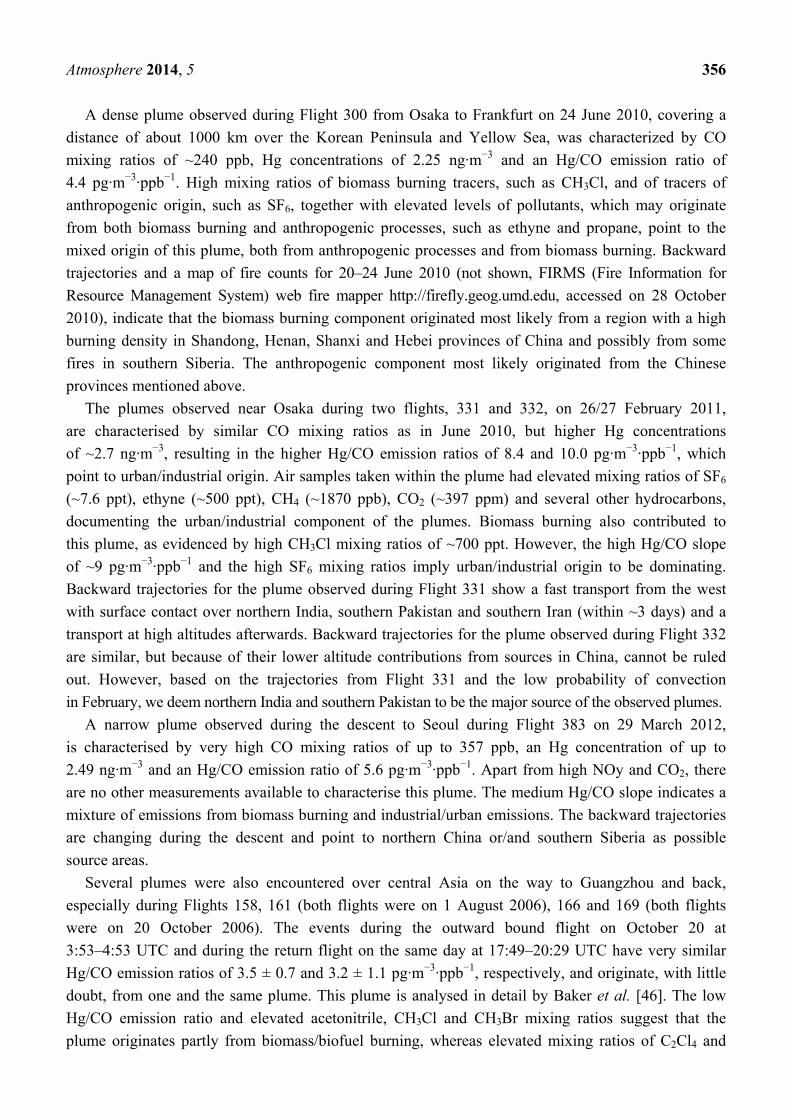
A dense plume observed during Flight 300 from Osaka to Frankfurt on 24 June 2010, covering a
distance of about 1000 km over the Korean Peninsula and Yellow Sea, was characterized by CO
mixing ratios of ~240 ppb, Hg concentrations of 2.25 ng·m−3 and an Hg/CO emission ratio of
4.4 pg·m−3·ppb−1. High mixing ratios of biomass burning tracers, such as CH3Cl, and of tracers of
anthropogenic origin, such as SF6, together with elevated levels of pollutants, which may originate
from both biomass burning and anthropogenic processes, such as ethyne and propane, point to the
mixed origin of this plume, both from anthropogenic processes and from biomass burning. Backward
trajectories and a map of fire counts for 20–24 June 2010 (not shown, FIRMS (Fire Information for
Resource Management System) web fire mapper http://firefly.geog.umd.edu, accessed on 28 October
2010), indicate that the biomass burning component originated most likely from a region with a high
burning density in Shandong, Henan, Shanxi and Hebei provinces of China and possibly from some
fires in southern Siberia. The anthropogenic component most likely originated from the Chinese
provinces mentioned above.
The plumes observed near Osaka during two flights, 331 and 332, on 26/27 February 2011,
are characterised by similar CO mixing ratios as in June 2010, but higher Hg concentrations
of ~2.7 ng·m−3, resulting in the higher Hg/CO emission ratios of 8.4 and 10.0 pg·m−3·ppb−1, which
point to urban/industrial origin. Air samples taken within the plume had elevated mixing ratios of SF6
(~7.6 ppt), ethyne (~500 ppt), CH4 (~1870 ppb), CO2 (~397 ppm) and several other hydrocarbons,
documenting the urban/industrial component of the plumes. Biomass burning also contributed to
this plume, as evidenced by high CH3Cl mixing ratios of ~700 ppt. However, the high Hg/CO slope
of ~9 pg·m−3·ppb−1 and the high SF6 mixing ratios imply urban/industrial origin to be dominating.
Backward trajectories for the plume observed during Flight 331 show a fast transport from the west
with surface contact over northern India, southern Pakistan and southern Iran (within ~3 days) and a
transport at high altitudes afterwards. Backward trajectories for the plume observed during Flight 332
are similar, but because of their lower altitude contributions from sources in China, cannot be ruled
out. However, based on the trajectories from Flight 331 and the low probability of convection
in February, we deem northern India and southern Pakistan to be the major source of the observed plumes.
A narrow plume observed during the descent to Seoul during Flight 383 on 29 March 2012,
is characterised by very high CO mixing ratios of up to 357 ppb, an Hg concentration of up to
2.49 ng·m−3 and an Hg/CO emission ratio of 5.6 pg·m−3·ppb−1. Apart from high NOy and CO2, there
are no other measurements available to characterise this plume. The medium Hg/CO slope indicates a
mixture of emissions from biomass burning and industrial/urban emissions. The backward trajectories
are changing during the descent and point to northern China or/and southern Siberia as possible
source areas.
Several plumes were also encountered over central Asia on the way to Guangzhou and back,
especially during Flights 158, 161 (both flights were on 1 August 2006), 166 and 169 (both flights
were on 20 October 2006). The events during the outward bound flight on October 20 at
3:53–4:53 UTC and during the return flight on the same day at 17:49–20:29 UTC have very similar
Hg/CO emission ratios of 3.5 ± 0.7 and 3.2 ± 1.1 pg·m−3·ppb−1, respectively, and originate, with little
doubt, from one and the same plume. This plume is analysed in detail by Baker et al. [46]. The low
Hg/CO emission ratio and elevated acetonitrile, CH3Cl and CH3Br mixing ratios suggest that the
plume originates partly from biomass/biofuel burning, whereas elevated mixing ratios of C2Cl4 and
Atmosphere 2014, 5 357
toluene, which are used as solvents, indicate anthropogenic contributions. Backward trajectories for
the samples taken in this plume pass over Afghanistan, Pakistan and a region of Northern India, where
extensive fire activity was recorded during 17–29 October 2006 [46]. Another plume with an Hg/CO
emission ratio of 11.2 ± 3.4 pg·m−3·ppb−1 and very high acetone mixing ratios was encountered during
Flight 161 on 1 August 2006, at 22:07–23:07 UTC. No air samples were taken during this event.
Backward trajectories pass at high altitude (<300 hPa) over the Black Sea partly to northern Europe
and partly to the European Mediterranean coast. Elevated H2O mixing ratios and satellite images
indicate some convective activity west of the Black Sea. Extensive fire activity was recorded during
this time for a broad area along the northern coast of the Black Sea and for the Mediterranean coast.
3.3. Plumes over Africa
Data are available for a total of 13 flights en route between Frankfurt and Cape Town or Johannesburg.
As the South African airports were served by Lufthansa Airbus A340-600 aircraft only during the winter
flight schedule, the data cover the months from November to March (March 2009–March 2011)
encompassing the austral summer. Elevated CO mixing ratios over equatorial Africa were encountered
during all flights with peak values varying between ~120 and ~250 ppb, but for only four flights, the
Hg vs. CO correlation was statistically significant. The reasons for such a low yield are
discussed below.
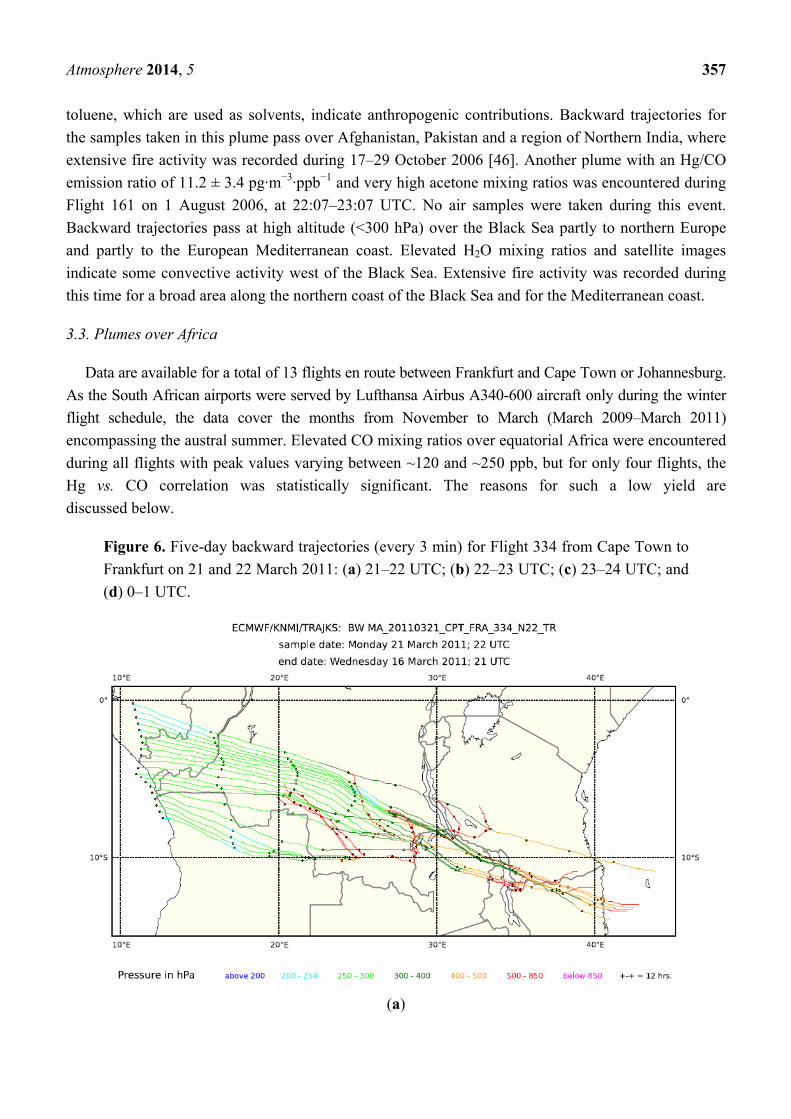
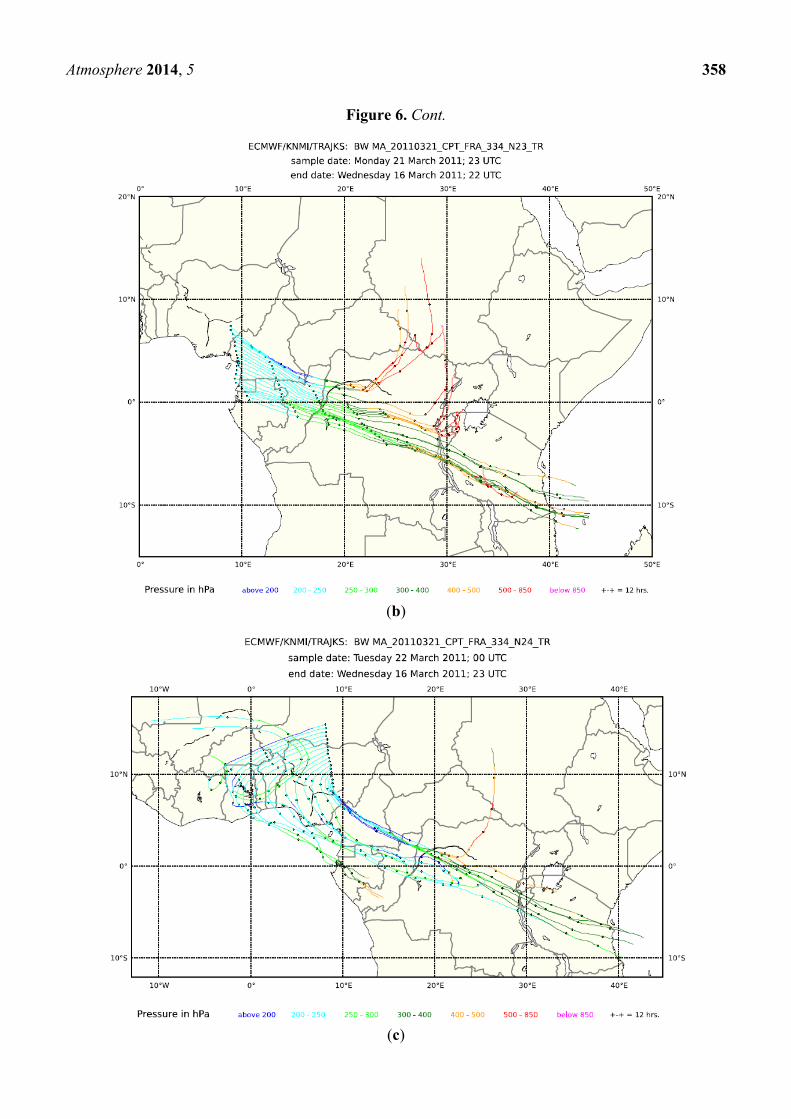
Figure 6. Five-day backward trajectories (every 3 min) for Flight 334 from Cape Town to
Frankfurt on 21 and 22 March 2011: (a) 21–22 UTC; (b) 22–23 UTC; (c) 23–24 UTC; and
(d) 0–1 UTC.
(a)
Atmosphere 2014, 5 358
Figure 6. Cont.
(b)
(c)
Atmosphere 2014, 5 359
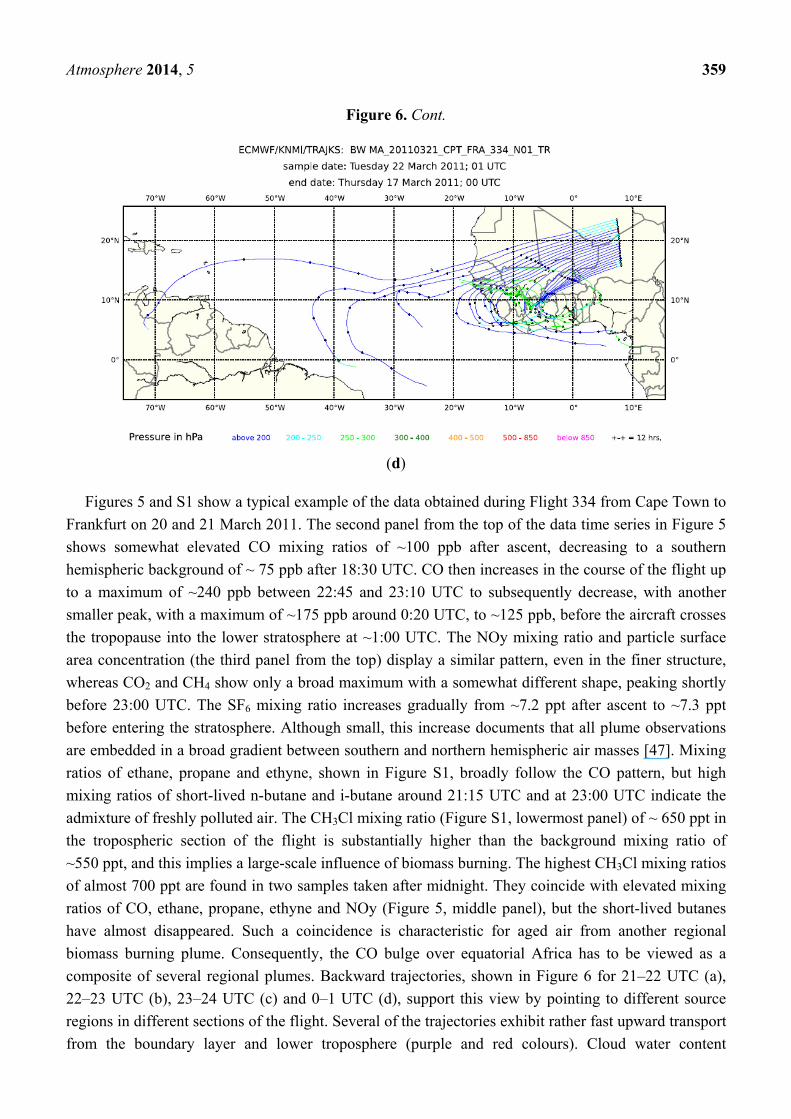
Figure 6. Cont.
(d)
Figures 5 and S1 show a typical example of the data obtained during Flight 334 from Cape Town to
Frankfurt on 20 and 21 March 2011. The second panel from the top of the data time series in Figure 5
shows somewhat elevated CO mixing ratios of ~100 ppb after ascent, decreasing to a southern
hemispheric background of ~ 75 ppb after 18:30 UTC. CO then increases in the course of the flight up
to a maximum of ~240 ppb between 22:45 and 23:10 UTC to subsequently decrease, with another
smaller peak, with a maximum of ~175 ppb around 0:20 UTC, to ~125 ppb, before the aircraft crosses
the tropopause into the lower stratosphere at ~1:00 UTC. The NOy mixing ratio and particle surface
area concentration (the third panel from the top) display a similar pattern, even in the finer structure,
whereas CO2 and CH4 show only a broad maximum with a somewhat different shape, peaking shortly
before 23:00 UTC. The SF6 mixing ratio increases gradually from ~7.2 ppt after ascent to ~7.3 ppt
before entering the stratosphere. Although small, this increase documents that all plume observations
are embedded in a broad gradient between southern and northern hemispheric air masses [47]. Mixing
ratios of ethane, propane and ethyne, shown in Figure S1, broadly follow the CO pattern, but high
mixing ratios of short-lived n-butane and i-butane around 21:15 UTC and at 23:00 UTC indicate the
admixture of freshly polluted air. The CH3Cl mixing ratio (Figure S1, lowermost panel) of ~ 650 ppt in
the tropospheric section of the flight is substantially higher than the background mixing ratio of
~550 ppt, and this implies a large-scale influence of biomass burning. The highest CH3Cl mixing ratios
of almost 700 ppt are found in two samples taken after midnight. They coincide with elevated mixing
ratios of CO, ethane, propane, ethyne and NOy (Figure 5, middle panel), but the short-lived butanes
have almost disappeared. Such a coincidence is characteristic for aged air from another regional
biomass burning plume. Consequently, the CO bulge over equatorial Africa has to be viewed as a
composite of several regional plumes. Backward trajectories, shown in Figure 6 for 21–22 UTC (a),
22–23 UTC (b), 23–24 UTC (c) and 0–1 UTC (d), support this view by pointing to different source
regions in different sections of the flight. Several of the trajectories exhibit rather fast upward transport
from the boundary layer and lower troposphere (purple and red colours). Cloud water content
Atmosphere 2014, 5 360
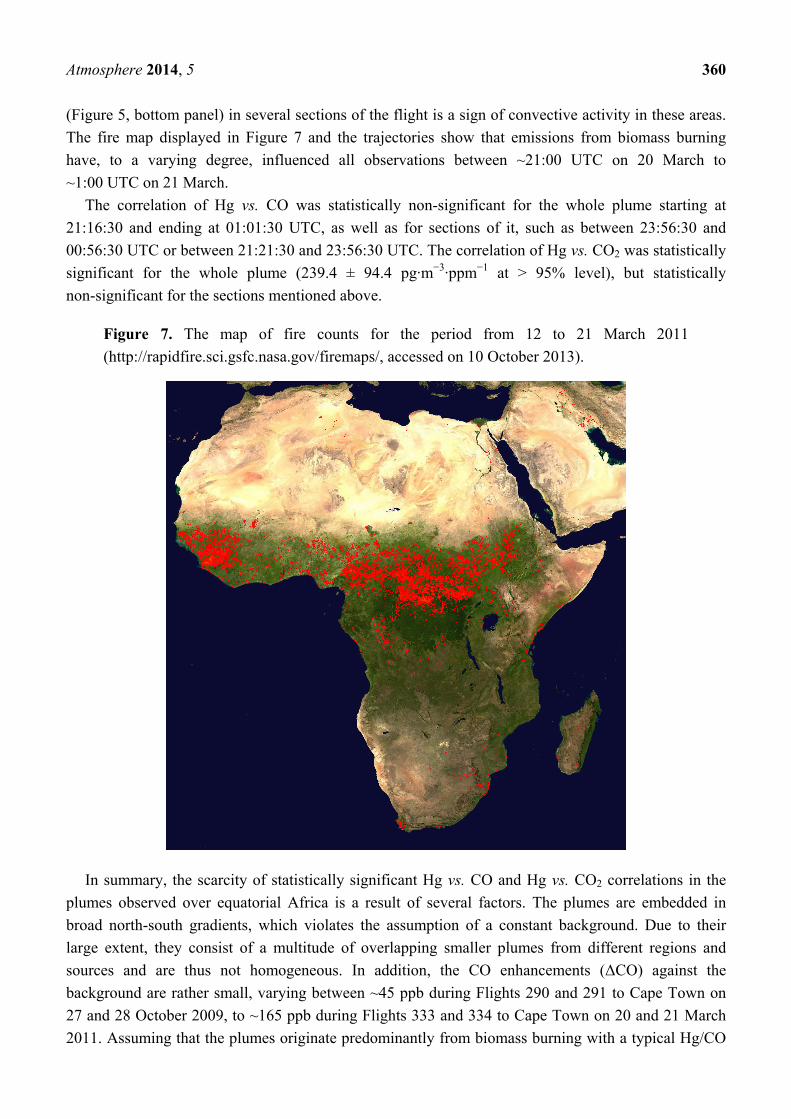
(Figure 5, bottom panel) in several sections of the flight is a sign of convective activity in these areas.
The fire map displayed in Figure 7 and the trajectories show that emissions from biomass burning
have, to a varying degree, influenced all observations between ~21:00 UTC on 20 March to
~1:00 UTC on 21 March.
The correlation of Hg vs. CO was statistically non-significant for the whole plume starting at
21:16:30 and ending at 01:01:30 UTC, as well as for sections of it, such as between 23:56:30 and
00:56:30 UTC or between 21:21:30 and 23:56:30 UTC. The correlation of Hg vs. CO2 was statistically
significant for the whole plume (239.4 ± 94.4 pg·m−3·ppm−1 at > 95% level), but statistically
non-significant for the sections mentioned above.
Figure 7. The map of fire counts for the period from 12 to 21 March 2011
(http://rapidfire.sci.gsfc.nasa.gov/firemaps/, accessed on 10 October 2013).
In summary, the scarcity of statistically significant Hg vs. CO and Hg vs. CO2 correlations in the
plumes observed over equatorial Africa is a result of several factors. The plumes are embedded in
broad north-south gradients, which violates the assumption of a constant background. Due to their
large extent, they consist of a multitude of overlapping smaller plumes from different regions and
sources and are thus not homogeneous. In addition, the CO enhancements (ΔCO) against the
background are rather small, varying between ~45 ppb during Flights 290 and 291 to Cape Town on
27 and 28 October 2009, to ~165 ppb during Flights 333 and 334 to Cape Town on 20 and 21 March
2011. Assuming that the plumes originate predominantly from biomass burning with a typical Hg/CO
Atmosphere 2014, 5 361
emission ratio of 1 pg·m−3·ppb−1, the CO enhancements of this magnitude would produce Hg
enhancements of only 0.045 to 0.165 ng·m−3. Such enhancements are difficult to detect with a
precision of 0.05 ng·m−3 of the mercury measurements, even if the background were constant and the
plumes homogeneous. For all of these reasons, the Hg/CO emission ratios derived from these flights
will be substantially more uncertain than their statistical uncertainty stated in Table S2.
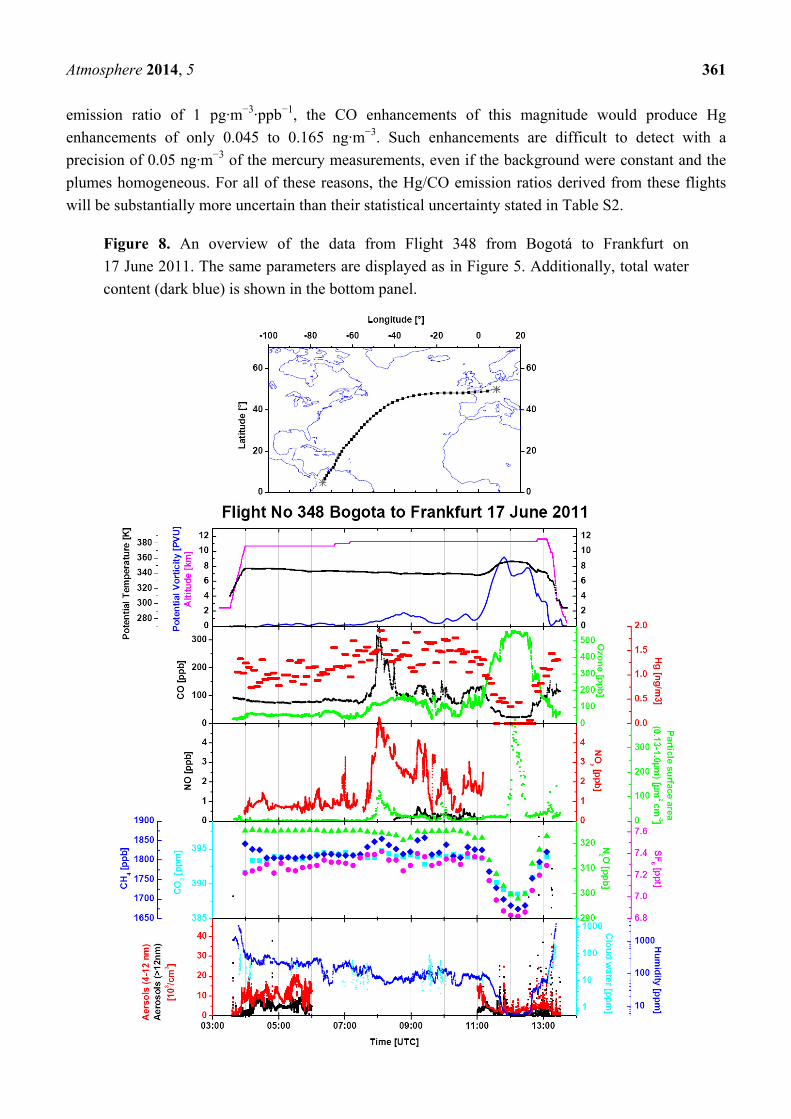
Figure 8. An overview of the data from Flight 348 from Bogotá to Frankfurt on
17 June 2011. The same parameters are displayed as in Figure 5. Additionally, total water
content (dark blue) is shown in the bottom panel.
Atmosphere 2014, 5 362
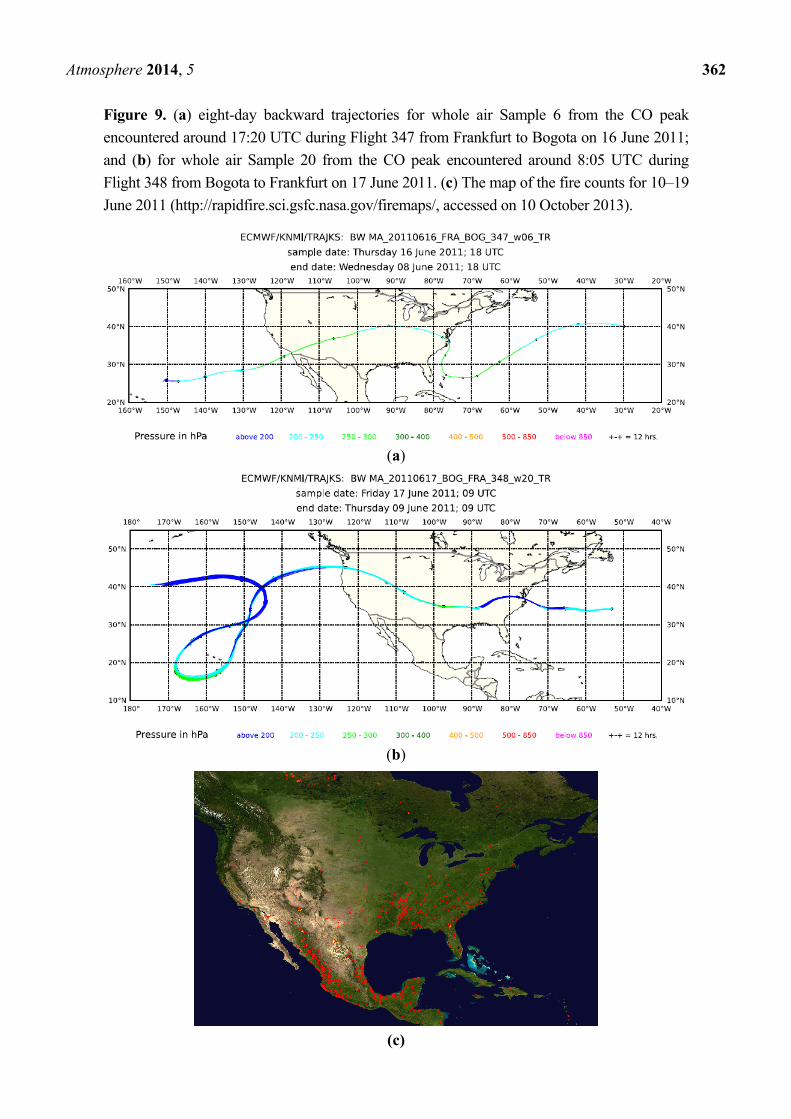
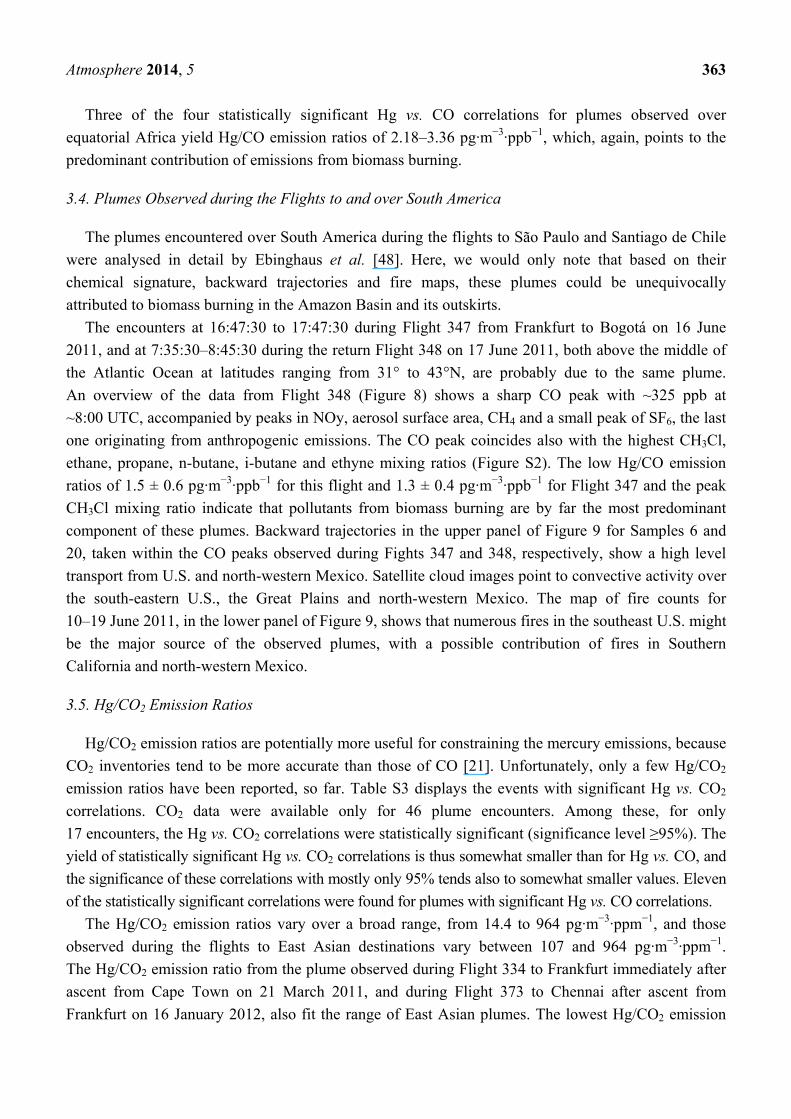
Figure 9. (a) eight-day backward trajectories for whole air Sample 6 from the CO peak
encountered around 17:20 UTC during Flight 347 from Frankfurt to Bogota on 16 June 2011;
and (b) for whole air Sample 20 from the CO peak encountered around 8:05 UTC during
Flight 348 from Bogota to Frankfurt on 17 June 2011. (c) The map of the fire counts for 10–19
June 2011 (http://rapidfire.sci.gsfc.nasa.gov/firemaps/, accessed on 10 October 2013).
(a)
(b)
(c)
Atmosphere 2014, 5 363
Three of the four statistically significant Hg vs. CO correlations for plumes observed over
equatorial Africa yield Hg/CO emission ratios of 2.18–3.36 pg·m−3·ppb−1, which, again, points to the
predominant contribution of emissions from biomass burning.
3.4. Plumes Observed during the Flights to and over South America
The plumes encountered over South America during the flights to São Paulo and Santiago de Chile
were analysed in detail by Ebinghaus et al. [48]. Here, we would only note that based on their
chemical signature, backward trajectories and fire maps, these plumes could be unequivocally
attributed to biomass burning in the Amazon Basin and its outskirts.
The encounters at 16:47:30 to 17:47:30 during Flight 347 from Frankfurt to Bogotá on 16 June
2011, and at 7:35:30–8:45:30 during the return Flight 348 on 17 June 2011, both above the middle of
the Atlantic Ocean at latitudes ranging from 31° to 43°N, are probably due to the same plume.
An overview of the data from Flight 348 (Figure 8) shows a sharp CO peak with ~325 ppb at
~8:00 UTC, accompanied by peaks in NOy, aerosol surface area, CH4 and a small peak of SF6, the last
one originating from anthropogenic emissions. The CO peak coincides also with the highest CH3Cl,
ethane, propane, n-butane, i-butane and ethyne mixing ratios (Figure S2). The low Hg/CO emission
ratios of 1.5 ± 0.6 pg·m−3·ppb−1 for this flight and 1.3 ± 0.4 pg·m−3·ppb−1 for Flight 347 and the peak
CH3Cl mixing ratio indicate that pollutants from biomass burning are by far the most predominant
component of these plumes. Backward trajectories in the upper panel of Figure 9 for Samples 6 and
20, taken within the CO peaks observed during Fights 347 and 348, respectively, show a high level
transport from U.S. and north-western Mexico. Satellite cloud images point to convective activity over
the south-eastern U.S., the Great Plains and north-western Mexico. The map of fire counts for
10–19 June 2011, in the lower panel of Figure 9, shows that numerous fires in the southeast U.S. might
be the major source of the observed plumes, with a possible contribution of fires in Southern
California and north-western Mexico.
3.5. Hg/CO2 Emission Ratios
Hg/CO2 emission ratios are potentially more useful for constraining the mercury emissions, because
CO2 inventories tend to be more accurate than those of CO [21]. Unfortunately, only a few Hg/CO2
emission ratios have been reported, so far. Table S3 displays the events with significant Hg vs. CO2
correlations. CO2 data were available only for 46 plume encounters. Among these, for only
17 encounters, the Hg vs. CO2 correlations were statistically significant (significance level ≥95%). The
yield of statistically significant Hg vs. CO2 correlations is thus somewhat smaller than for Hg vs. CO, and
the significance of these correlations with mostly only 95% tends also to somewhat smaller values. Eleven
of the statistically significant correlations were found for plumes with significant Hg vs. CO correlations.
The Hg/CO2 emission ratios vary over a broad range, from 14.4 to 964 pg·m−3·ppm−1, and those
observed during the flights to East Asian destinations vary between 107 and 964 pg·m−3·ppm−1.
The Hg/CO2 emission ratio from the plume observed during Flight 334 to Frankfurt immediately after
ascent from Cape Town on 21 March 2011, and during Flight 373 to Chennai after ascent from
Frankfurt on 16 January 2012, also fit the range of East Asian plumes. The lowest Hg/CO2 emission
Atmosphere 2014, 5 364
ratios of 14.4 and 21.9 pg·m−3·ppm−1 were both derived from plumes encountered during Flights 329
and 334 over equatorial Africa on 24 February 2011 and 21 March 2011, respectively.
The low Hg/CO2 emission ratios in the plumes of equatorial Africa are comparable to the median of
34.1 pg·m−3·ppm−1 (average: 62.7 ± 80.2 pg·m−3·ppm−1) of emission ratios observed in the plumes
encountered at Cape Point, which, according to their Hg/CO emission ratios, seem to originate
predominantly from biomass burning [21]. The Hg/CO2 emission ratio from the only plume clearly
attributed to biomass burning near Cape Point was somewhat higher with 109 ± 27 pg·m−3·ppm−1 [49],
but this is comparable to 131 ± 53 pg·m−3·ppm−1, observed in the plume from biomass burning
in the south-eastern U.S. in June 2011 (Flights 347 and 348). Based on the coal mercury content of
0.15–0.45 µg·Hg·g−1 and a flue cleaning efficiency for mercury of 50%–90%, Brunke et al. [21]
predicted an Hg/CO2 emission ratio to be within the range of 2–30 pg·m−3·ppm−1. The Hg content in
coal consumed in China varies from 0.027 to 0.369 µg·g−1 [50] and is not much different from that in
South Africa. The flue cleaning efficiency for mercury in China is with up to 57% somewhat lower [50],
but this difference cannot explain the Hg/CO2 emission ratios larger than 100 pg·m−3·ppm−1 observed
over East Asia, Europe and at Cape Point in South Africa [21]. If confirmed by further measurements,
high Hg/CO2 emission ratios would imply a substantial contribution of emissions from other sources
than coal burning.
3.6. Hg/CH4 Emission Ratios
Mercury also frequently correlated with CH4 in the plumes observed at Cape Point, and the
resulting Hg/CH4 emission ratios helped to constrain the mercury emissions in South Africa [21].
Continuously measured CH4 data were available only for 26 plume encounters, and of these, only six
provided a statistically significant Hg vs. CH4 correlation at a confidence level of at least 95%. The
emission ratios listed in Table S4 vary between 4.8 and 41.4 pg·m−3·ppb−1. The only Hg/CH4 emission
ratios available for comparison are derived from observations at Cape Point and are centred in the
range of up to 6 pg·m−3·ppb−1 [21]. The plume encountered during the flight to Cape Town with an
emission ratio of 4.8 pg·m−3·ppb−1 falls into this range. All other plumes in Table S4 were of mixed or
industrial/urban origin, and they have higher Hg/CH4 emission ratios.
4. Conclusions
Over 100 plumes with elevated mercury concentrations were encountered during the tropospheric
sections of the CARIBIC flights from May 2005, until June 2013. In 98 of them, elevated Hg was
accompanied by elevated CO mixing ratios. Several Hg plumes without a simultaneous increase in CO
were all encountered over the equatorial Atlantic Ocean during the flights to South America and were
attributed to the convection of the marine boundary air at the ITCZ. Hg correlated as statistically
significant with CO in more than 50% of the observed plumes and with CO2 in about 30% of the
plumes for which CO2 data were available. Ample ancillary data on the chemical fingerprint of the air
within these plumes and backward trajectories provide additional means to identify the origin and the
type of the source.
Extensive mercury plumes over equatorial Africa were observed during all flights between
Frankfurt and South Africa. These plumes, which extend over thousands of kilometres, are embedded
Atmosphere 2014, 5 365
in north-south gradients of mercury, CO and CO2 and consist of a number of overlapping smaller
plumes. Due to the changing background, the inhomogeneity of the plumes and the low precision of
the Hg measurements, only a few of the plume encounters provided statistically significant Hg vs. CO
correlations. Most plumes were observed over East Asia, and relative to the number of flights to East
Asian destinations, the yield of plumes with statistically significant Hg vs. CO correlations was on par
with the African flights. Lower yields of plume occurrence were found for flights to South America
and to South Asia. Only two plumes were encountered over North America and one over Europe.
The Hg/CO emission ratios derived from these correlations are consistent with the previously
published data compiled by Slemr et al. [29] and have a smaller values of ~1 pg·m−3·ppb−1 for plumes,
which we clearly could attribute to biomass burning using backward trajectories, fire count maps and
the presence of chemical tracers for biomass burning, such as CH3Cl and acetonitrile. Larger values of
~6 pg·m−3·ppb−1 and more were found for most of the other plumes. Backward trajectories and the
presence of man-made tracers, such as C2Cl4 and SF6 in several of these plumes suggest emissions
from urban/industrial sources. Both types of chemical tracers were present in several plumes, with
Hg/CO emission ratios between 1 and 6 pg·m−3·ppb−1, showing their mixed origin.
Many of the plumes were transported over large distances from the area of their origin to the place
of their observation. Backward trajectories point to major source areas in equatorial Africa, East Asia,
South America and South Asia. The emissions from equatorial Africa and South America are clearly
dominated by biomass burning. The East Asian emissions originate from a large area of East Siberia,
Korea, China, the Philippines and the Indochinese Peninsula. They are mostly of urban/industrial
origin with a varying contribution from biomass and biofuel burning. The South Asian emissions
originate mostly from the Indo-Ganges region of northern India. Like the East Asian ones, they are a
mixture of emissions from industrial/urban sources and biomass/biofuel burning. Other mercury source
areas were also identified: the Middle East, a region along the northern perimeter of the Black Sea, the
Mediterranean Sea and the south-western U.S. The Hg/CO emission ratio and the plume fingerprint for
the Middle East region suggests industrial/urban emissions to be dominating. The emissions whose
origin area was located toward the northern coast of the Black Sea and toward the Mediterranean had
both a substantial contribution from biomass burning. Biomass burning was the major component of
the emissions from the south-eastern U.S. during one event. We caution that since only a few plumes
were attributed to each, the Middle East, Europe and the U.S., no firm conclusions can be drawn for
these areas. We note also that the forest fires at northern mid-latitudes occur in summer when
convection processes, which carry them to cruising altitudes, are the most active. Consequently, our
observations for these areas are biased in favour of biomass burning and neglect emissions in other
seasons, such as, e.g., from residential heating in winter.
Only a few Hg/CO2 and Hg/CH4 emission ratios have been reported, so far. The range of the
Hg/CO2 emission ratios from the CARIBIC flights is comparable to the range observed at
Cape Point [21]. The Hg/CO2 emission ratios of 107–964 pg·m−3·ppm−1 observed in the plumes over
East Asia, however, are substantially higher than 2–30 pg·m−3·ppm−1, calculated by Brunke et al. [21]
for coal burning. If confirmed by further measurements, the higher observed than calculated Hg/CO2
emission ratios would imply other substantial Hg sources in addition to coal burning.
Atmosphere 2014, 5 366
Acknowledgments
We would like to thank Lufthansa and all members of the CARIBIC team for their continued effort
to keep running such a complex project. We thank especially Dieter Scharffe, Claus Koeppel and
Stefan Weber for the day-to-day maintenance and operation of the CARIBIC container. Funding from
the European Community within the GMOS (Global Mercury Observation System) project and from
Fraport AG is thankfully acknowledged. We acknowledge the use of FIRMS data and imagery from
the Land Atmosphere Near-real time Capability for EOS (LANCE) system operated by the
NASA/GSFC/Earth Science Data and Information System (ESDIS) with funding provided by
NASA/HQ.
Author Contributions
All authors are members of the CARIBIC team and contributed to the production of the data on
which the paper is based. Franz Slemr calculated the emission ratios, and Peter van Velthoven made
the meteorological analyses for each flight and calculated the backward trajectories. All authors
discussed the results of the manuscript in all stages of its preparation.
Conflicts of Interest
The authors declare no conflict of interest.
References
1. Slemr, F.; Schuster, G.; Seiler, W. Distribution, speciation, and budget of atmospheric mercury.
J. Atmos. Chem. 1985, 3, 407–434.
2. Schroeder, W.H.; Munthe, J. Atmospheric mercury—An overview. Atmos. Environ. 1998, 32,
809–822.
3. Mergler, D.; Anderson, H.A.; Chan, L.H.M.; Mahaffey, K.R.; Murray, M.; Sakamoto; M.;
Stern, A.H. Methyl mercury exposure and health effects in humans: A worldwide concern. Ambio
2007, 36, 3–11.
4. Scheuhammer, A.M.; Meyer, M.W.; Sandheinrich, M.B.; Murray, M.W. Effects of environmental
methylmercury on the health of wild bird, mammals, and fish. Ambio 2007, 36, 12–18.
5. Nriagu, J.O.; Pacyna, J.M. Quantitative assessment of worldwide contamination of air, water and
soils by trace metals. Nature 1988, 333, 134–139.
6. Nriagu, J.O. A global assessment of natural sources of atmospheric trace metals. Nature 1989,
338, 47–49.
7. Pirrone, N.; Keeler, G.J.; Nriagu, O. Regional differences in worldwide emissions of mercury to
the atmosphere. Atmos. Environ. 1996, 30, 2981–2987.
8. Pirrone, N.; Allegrini, I.; Keeler, G.J.; Nriagu, J.O.; Rossmann, R.; Robbins, J.A. Historical
atmospheric mercury emissions and depositions in North America compared to mercury
accumulations in sedimentary records. Atmos. Environ. 1998, 32, 929–940.
Atmosphere 2014, 5 367
9. Pirrone, N.; Cinnirella, S.; Feng, X.; Finkelman, R.B.; Friedli, H.R.; Leaner, J.; Mason, R.;
Mukherjee, A.B.; Stracher, G.; Streets, D.G.; et al. Global mercury emissions to the atmosphere
from anthropogenic and natural sources. Atmos. Chem. Phys. 2010, 10, 5951–5964.
10. Pacyna, E.G.; Pacyna, J.M. Global emission of mercury from anthropogenic sources in 1995.
Water Air Soil Pollut. 2002, 137, 149–165.
11. Pacyna, J.M.; Pacyna, E.G.; Steenhuisen, F.; Wilson, S. Mapping 1995 global anthropogenic
emissions of mercury. Atmos. Environ. 2003, 37, S109–S117.
12. Pacyna, E.G.; Pacyna, J.M.; Steenhuisen, F.; Wilson, S. Global anthropogenic mercury emission
inventory for 2000. Atmos. Environ. 2006, 40, 4048–4063.
13. Pacyna, E.G.; Pacyna, J.M.; Sundseth, K.; Munthe, J.; Kindbom, K.; Wilson, S.; Steenhuisen, F.;
Maxson, P. Global emission of mercury to the atmosphere from anthropogenic sources in 2005
and projections to 2020. Atmos. Environ. 2010, 44, 2487–2499.
14. Streets, D.G.; Hao, J.; Wu, Y.; Jiang, J.; Chan, M.; Tian, H.; Feng, X. Anthropogenic mercury
emissions in China. Atmos. Environ. 2005, 39, 7789–7806.
15. Streets, D.G.; Zhang, Q.; Wu, Y. Projections of global mercury emissions in 2050. Environ. Sci.
Technol. 2009, 43, 2983–2988.
16. Lin, C.-J.; Pongprueksa, P.; Lindberg, S.E.; Pehkonen, S.O.; Byun, D.; Jang, C. Scientific
uncertainties in atmospheric mercury models I: Model science evaluation. Atmos. Environ. 2006,
40, 2911–2928.
17. Lindberg, S.; Bullock, R.; Ebinghaus, R.; Engstrom, D.; Feng, X.; Fitzgerald, W.; Pirrone, N.;
Prestbo, E.; Seigneur, Ch. A synthesis of progress and uncertainties in attributing the sources of
mercury in deposition. Ambio 2007, 36, 19–32.
18. Slemr, F.; Baumbach, G.; Blank, P.; Corsmeier, U.; Fiedler, F.; Friedrich, R.; Habram, M.;
Kalthoff, N.; Klemp., D.; Kühlwein, J.; et al. Evaluation of modeled spatially and temporarily
highly resolved emission inventories of photosmog precursors for the city of Augsburg: The
experiment EVA and its major results. J. Atmos. Chem. 2002, 42, 207–233.
19. Klemp, D.; Mannschreck, K.; Pätz, H.W.; Habram, M.; Matuska, P.; Slemr, F. Determination of
anthropogenic emission ratios in the Augsburg area from concentration ratios: results from
long-term measurements. Atmos. Environ. 2002, 36, S61–S80.
20. Jaffe, D.; Prestbo, E.; Swartzendruber, P.; Weiß-Penzias, P.; Kato, S.; Takami, A.; Hatakeyama, S.;
Kajii, Y. Export of atmospheric mercury from Asia. Atmos. Environ. 2005, 39, 3029–3028.
21. Brunke, E.-G.; Ebinghaus, R.; Kock, H.H.; Labuschagne, C.; Slemr, F. Emissions of mercury
in southern Africa derived from long-term observations at Cape Point, South Africa.
Atmos. Chem. Phys. 2012, 12, 7465–7474.
22. Slemr, F.; Brunke, E.-G.; Whittlestone, S.; Zahorowski, W.; Ebinghaus, R.; Kock, H.H.;
Labuschagne, C. 222Rn-calibrated mercury fluxes from terrestrial surface of southern Africa.
Atmos. Chem. Phys. 2013, 13, 6421–6428.
23. Brenninkmeijer, C.A.M.; Crutzen, P.; Boumard, F.; Dauer, T.; Dix, B.; Ebinghaus, R.; Filippi, D.;
Fischer, H.; Franke, H.; Frieß, U.; et al. Civil aircraft for the regular investigation of the
atmosphere based on an instrumented container: The new CARIBIC system. Atmos. Chem. Phys.
2007, 7, 1–24.
Atmosphere 2014, 5 368
24. Cooper, O.R.; Moody, J.L.; Parrish, D.D.; Trainer, M.; Ryerson, T.B.; Holloway, J.S.; Hübler, G.;
Fehsenfeld, F.C.; Evans, M.J. Trace gas composition of midlatitude cyclones over the western North
Atlantic Ocean: A conceptual model. J. Geophys. Res. 2002, doi:10.1029/2001JD000901.
25. Cooper, O.R.; Moody, J.L.; Parrish, D.D.; Trainer, M.; Holloway, J.S.; Hübler, G.;
Fehsenfeld, F.C.; Stohl, A. Trace gas composition of of midlatitude cyclones over the western
North Atlantic Ocean: A seasonal comparison of O3 and CO. J. Geophys. Res. 2002, 107,
doi:10.1029/2001JD000902.
26. Dyroff, C.; Zahn, A.; Sanati, S.; Christner, E.; Rauthe-Schöch, A.; Schuck, T.J. Tunable diode
laser in-situ CH4 measurements aboard the CARIBIC passenger aircraft: instrument performance
assessment. Atmos. Meas. Tech. Discuss. 2013, 6, 9225–9261.
27. Schuck, T.J.; Brenninkmeijer, C.A.M; Slemr, F.; Xueref-Remy, I.; Zahn, A. Greenhouse gas
analysis of air samples collected onboard CARIBIC passenger aircraft. Atmos. Meas. Tech. 2009,
2, 449–464.
28. Baker, A.K.; Slemr, F.; Brenninkmeijer, C.A.M. Analysis of non-methane hydrocarbons in air
samples collected aboard the CARIBIC passenger aircraft. Atmos. Meas. Tech. 2010, 3, 311–321.
29. Slemr, F.; Ebinghaus, R.; Brenninkmeijer, C.A.M.; Hermann, M.; Kock, H.H.; Martinsson, B.G.;
Schuck, T.; Sprung, D.; van Velthoven, P.; Zahn, A.; et al. Gaseous mercury distribution in the
upper troposphere and lower stratosphere observed onboard the CARIBIC passenger aircraft.
Atmos. Chem. Phys. 2009, 9, 1957–1969.
30. Talbot, R.; Mao, H.; Scheuer, E.; Dibb, J.; Avery, M.; Browell, E.; Sachse, G.; Vay, S.; Blake, D.;
Huey, G.; et al. Factors influencing the large-scale distribution of Hg° in the Mexico City area
and over the North Pacific. Atmos. Chem. Phys. 2008, 8, 2103–2114.
31. Neuman, J.A.; Huey, L.G.; Ryerson, T.B.; Fahey, D.W. Study of inlet materials for sampling
atmospheric nitric acid. Environ. Sci. Technol. 1999, 33, 1133–1136.
32. Baron, P.A.; Willeke K. Aerosol Measurements: Principles Techniques and Applications;
John Wiley and Sons: New York, NY, USA, 2001; pp. 1–1131.
33. Temme, C.; Einax, J.W.; Ebinghaus, R.; Schroeder, W.H. Measurements of atmospheric mercury
species at a coastal site in the Antarctic and over the South Atlantic Ocean during polar summer.
Environ. Sci. Technol. 2003, 37, 22–31.
34. Rutter, A.P.; Schauer, J.J. The effect of temperature on the gas-particle partitioning of reactive
mercury in atmospheric aerosols. Atmos. Environ. 2007, 41, 8647–8657.
35. Amos, H.M.; Jacob, D.J.; Holmes, C.D.; Fisher, J.A.; Wang, Q.; Yantosca, R.M.; Corbitt, E.S.;
Galarneau, E.; Rutter, A.P.; Gustin, M.S.; et al. Gas-particle partitioning of atmospheric Hg(II)
and its effects on global mercury deposition. Atmos. Chem. Phys. 2012, 12, 591–603.
36. Lyman, S.N.; Jaffe, D.A. Formation and fate of oxidized mercury in the upper troposphere and
lower stratosphere. Nat. Geosci. 2012, 5, 114–117.
37. Sprovieri, F.; Pirrone, N.; Ebinghaus, R.; Kock, H.; Dommergue, A: A review of worldwide
atmospheric mercury measurements. Atmos. Chem. Phys. 2010, 10, 8245–8265.
38. Cantrell, C.A. Technical note: Review of methods for linear least-squares fitting of data and
application to atmospheric chemistry problems. Atmos. Chem. Phys. 2008, 8, 5477–5487.
Atmosphere 2014, 5 369
39. Scheele, M.; Siegmund, P.; van Velthoven, P. Sensitivity of trajectories to data resolution and its
dependence on the starting point: In or outside a tropopause fold. Meteorol. Appl. 1996, 3,
267–273.
40. Heue, K.-P.; Brenninkmeijer, C.A.M.; Wagner, T.; Mies, K.; Dix, B.; Frieß, U.; Martinsson, B.G.;
Slemr, F.; van Velthoven, P.F.J. Observations of the 2008 Kasatochi volcanic SO2 plume by
CARIBIC aircraft DOAS and the GOME-2 satellite. Atmos. Chem. Phys. 2010, 10, 4699–4713.
41. Lelieveld, J.; van Aardenne, J.; Fischer, H.; de Reus, M.; Williams, J.; Winkler, P. Increasing
ozone over the Atlantic Ocean. Science 2004, 304, 1483–1487.
42. Kuss, J.; Zülicke, C.; Pohl, C.; Schneider, B. Atlantic mercury emission determined from
continuous analysis of the elemental mercury sea-air concentration difference within transects
between 50°N and 50°S. Glob. Biogeochem. Cy. 2011, doi:10.1029/2010GB003998.
43. Andreae, M.O.; Merlet, P. Emissions of trace gases and aerosols from biomass burning. Global
Biogeochem. Cy. 2001, 15, 955–966.
44. Mühle, J.; Brenninkmeijer, C.A.M.; Rhee, T.S.; Slemr, F.; Oram, D.E.; Penkett, S.A.; Zahn, A.
Biomass burning and fossil fuel signatures in the upper troposphere observed during a CARIBIC
flight from Namibia to Germany. Geophys. Res. Lett. 2002, doi:10.1029/2002GL015764.
45. Lai, S.C.; Baker, A.K.; Schuck, T.J.; Slemr, F.; Brenninkmeijer, C.A.M.; van Velthoven, P.;
Oram, D.E.; Zahn, A.; Ziereis, H. Characterization and source regions of 51 high-CO events
observed during Civil Aircraft for the Regular Investigation of the Atmosphere Based on an
Instrument Container (CARIBIC) flights between south China and the Philippines, 2005–2008.
J. Geophys. Res. 2011, doi:10.1029/2011JD016375.
46. Baker, A.K.; Traud, S.; Brenninkmeijer, C.A.M.; Hoor, P.; Neumaier, M.; Oram, D.E.;
Rauthe-Schöch, A.; Sprung, D.; Schloegl, S.; Slemr, F.; et al. Pollution pattern in the upper
troposphere over Europe/West Asia and Asia observed by CARIBIC. Atmos. Environ. 2014, in press.
47. Maiss, M.; Steele, L.P.; Francey, R.J.; Fraser P.J.; Langenfelds, R.L.; Trivett, N.B.A.; Levin, I.
Sulfur hexafluoride—A powerful new atmospheric tracer. Atmos. Environ. 1996, 30, 1621–1629.
48. Ebinghaus, R.; Slemr, F.; Brenninkmeijer, C.A.M.; van Velthoven, P.; Zahn, A.; Hermann, M.;
O’Sullivan, D.A.; Oram, D.E. Emissions of gaseous mercury from biomass burning in
South America in 2005 observed during CARIBIC flights. Geophys. Res. Lett. 2007,
doi:10.1029/2006GL028866.
49. Brunke, E.-G.; Labuschagne, C.; Slemr, F. Gaseous mercury emissions from a fire in the Cape
Peninsula, South Africa, during January 2000. Geophys. Res. Lett. 2001, 28, 1483–1486.
50. Tian, H.Z.; Wang, Y.; Xue, Z.G.; Cheng, K.; Qu, Y.P.; Chai, F.H.; Hao, J.M.
Trend and characteristics of atmospheric emissions of Hg, As, and Se from coal combustion in
China, 1980–2007. Atmos. Chem. Phys. 2010, 10, 11905–11919.
© 2014 by the authors; licensee MDPI, Basel, Switzerland. This article is an open access article
distributed under the terms and conditions of the Creative Commons Attribution license
(http://creativecommons.org/licenses/by/3.0/).
Copyright © 2022 FDOKUMEN