MEPC 68 INF 24 REV1 The existing shipping fleet CO2 ...
81
https://edocs.imo.org/Final Documents/English/MEPC 68-INF-24-REV-1 (E).docx E MARINE ENVIRONMENT PROTECTION COMMITTEE 68th session Agenda item 4 MEPC 68/INF.24/Rev.1 30 March 2015 ENGLISH ONLY FURTHER TECHNICAL AND OPERATIONAL MEASURES FOR ENHANCING THE ENERGY EFFICIENCY OF INTERNATIONAL SHIPPING The Existing Shipping Fleet's CO2 Efficiency Note by the Secretariat SUMMARY Executive summary: This document provides, in the annex, a study of "The existing shipping fleet's CO2 efficiency" Strategic direction: 7.3 High-level action: 7.3.2 Planned output: No related provisions Action to be taken: Paragraph 3 Related documents: MEPC 59/INF.10; MEPC 67/6 and MEPC 67/20 Introduction 1 MEPC 67 approved the Third IMO GHG Study 2014 (MEPC 67/20, paragraph 6.5.6). Following the approval of the Study, the Secretariat received enquiries from several shipping industry stakeholders as to whether the IMO would be publishing updated data as set out in Table 9.1 "Estimates of CO2 efficiency for cargo ships" in the Second IMO GHG Study 2009 (MEPC 59/INF.10). Having explained that the provision of this data had not been part of the terms of reference for the Third IMO GHG Study 2014, the industry stakeholders indicated that this data had been used to estimate the CO2 emissions from their ships. 2 In response to those industry views, and to utilise the datasets prepared for the Third IMO GHG Study 2014, the Secretariat commissioned, using residue funds donated for the Third IMO GHG Study 2014 and other related research projects, an update of the data for ship CO2 efficiency. The study, prepared by the UCL Energy Institute, is set out in the annex. Action requested of the Committee 3 The Committee is invited to note the information provided. ***
-
Upload
khangminh22 -
Category
Documents
-
view
0 -
download
0
Transcript of MEPC 68 INF 24 REV1 The existing shipping fleet CO2 ...
https://edocs.imo.org/Final Documents/English/MEPC 68-INF-24-REV-1 (E).docx
E
MARINE ENVIRONMENT PROTECTION COMMITTEE 68th session Agenda item 4
MEPC 68/INF.24/Rev.1
30 March 2015 ENGLISH ONLY
FURTHER TECHNICAL AND OPERATIONAL MEASURES FOR ENHANCING THE
ENERGY EFFICIENCY OF INTERNATIONAL SHIPPING
The Existing Shipping Fleet's CO2 Efficiency
Note by the Secretariat
SUMMARY
Executive summary: This document provides, in the annex, a study of "The existing shipping fleet's CO2 efficiency"
Strategic direction: 7.3
High-level action: 7.3.2
Planned output: No related provisions
Action to be taken: Paragraph 3
Related documents: MEPC 59/INF.10; MEPC 67/6 and MEPC 67/20 Introduction 1 MEPC 67 approved the Third IMO GHG Study 2014 (MEPC 67/20, paragraph 6.5.6). Following the approval of the Study, the Secretariat received enquiries from several shipping industry stakeholders as to whether the IMO would be publishing updated data as set out in Table 9.1 "Estimates of CO2 efficiency for cargo ships" in the Second IMO GHG Study 2009 (MEPC 59/INF.10). Having explained that the provision of this data had not been part of the terms of reference for the Third IMO GHG Study 2014, the industry stakeholders indicated that this data had been used to estimate the CO2 emissions from their ships. 2 In response to those industry views, and to utilise the datasets prepared for the Third IMO GHG Study 2014, the Secretariat commissioned, using residue funds donated for the Third IMO GHG Study 2014 and other related research projects, an update of the data for ship CO2 efficiency. The study, prepared by the UCL Energy Institute, is set out in the annex. Action requested of the Committee 3 The Committee is invited to note the information provided.
***

ANNEX
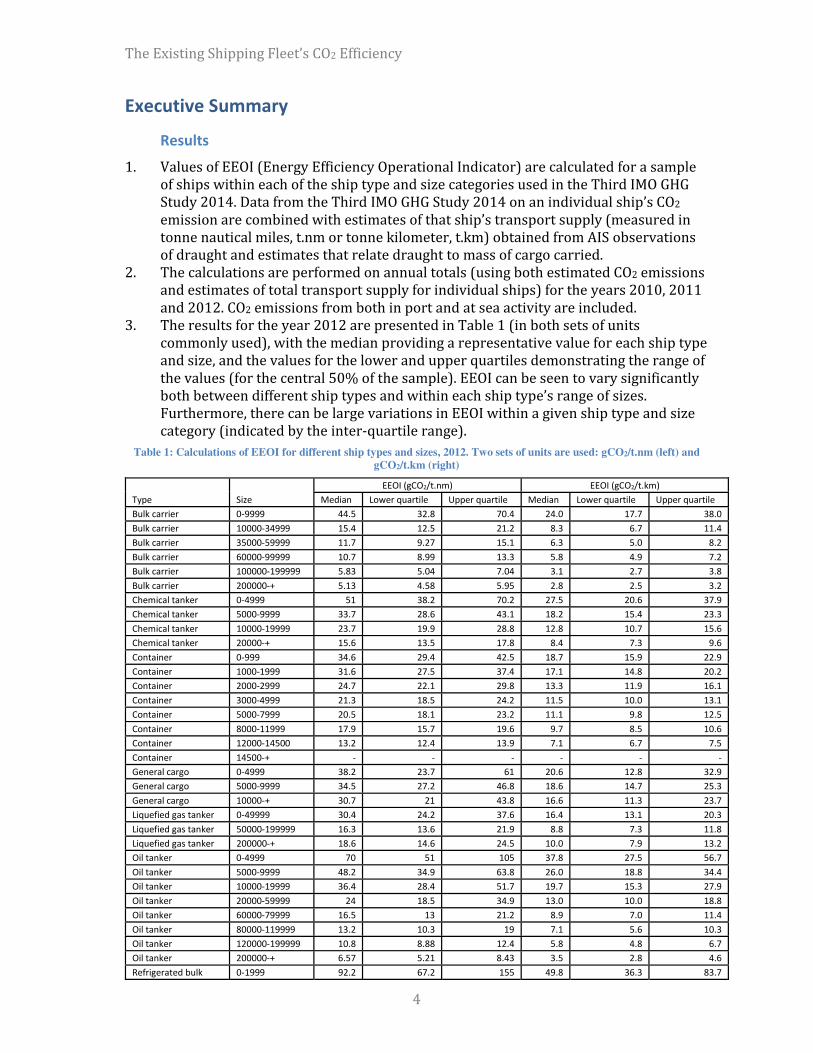
Table 1: Calculations of EEOI for different ship types and sizes, 2012. Two sets of units are used: gCO2/t.nm (left) and gCO2/t.km (right)
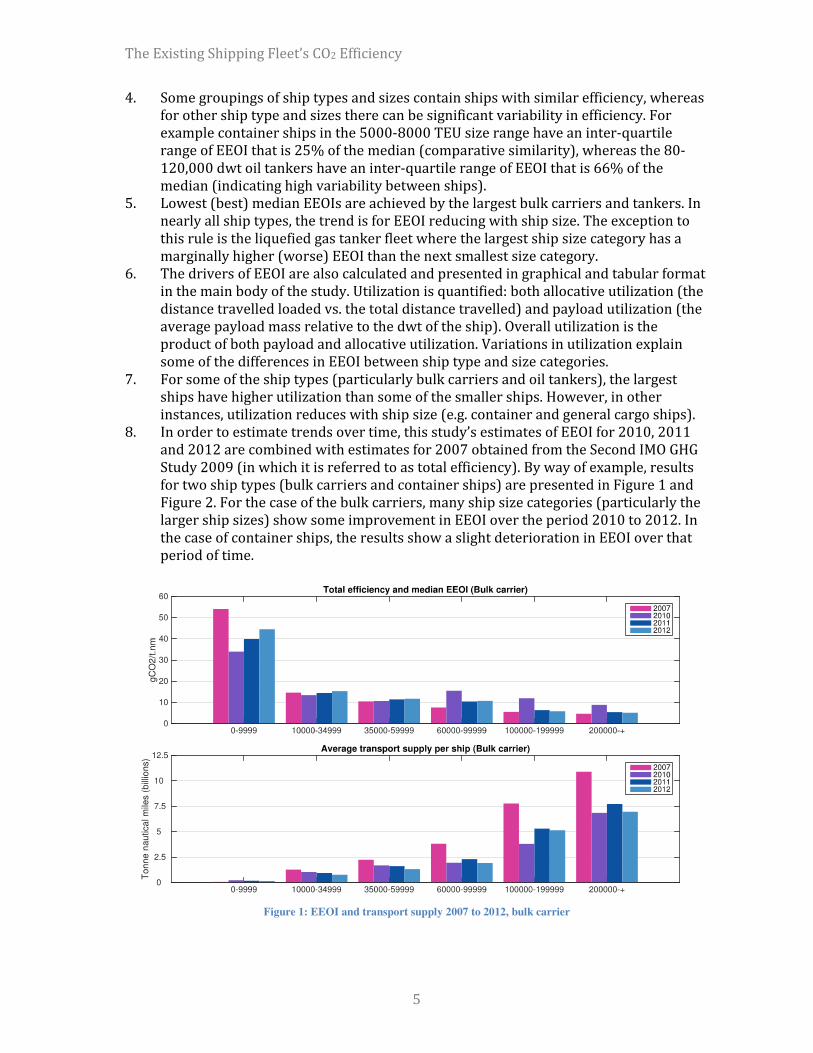
Figure 1: EEOI and transport supply 2007 to 2012, bulk carrier
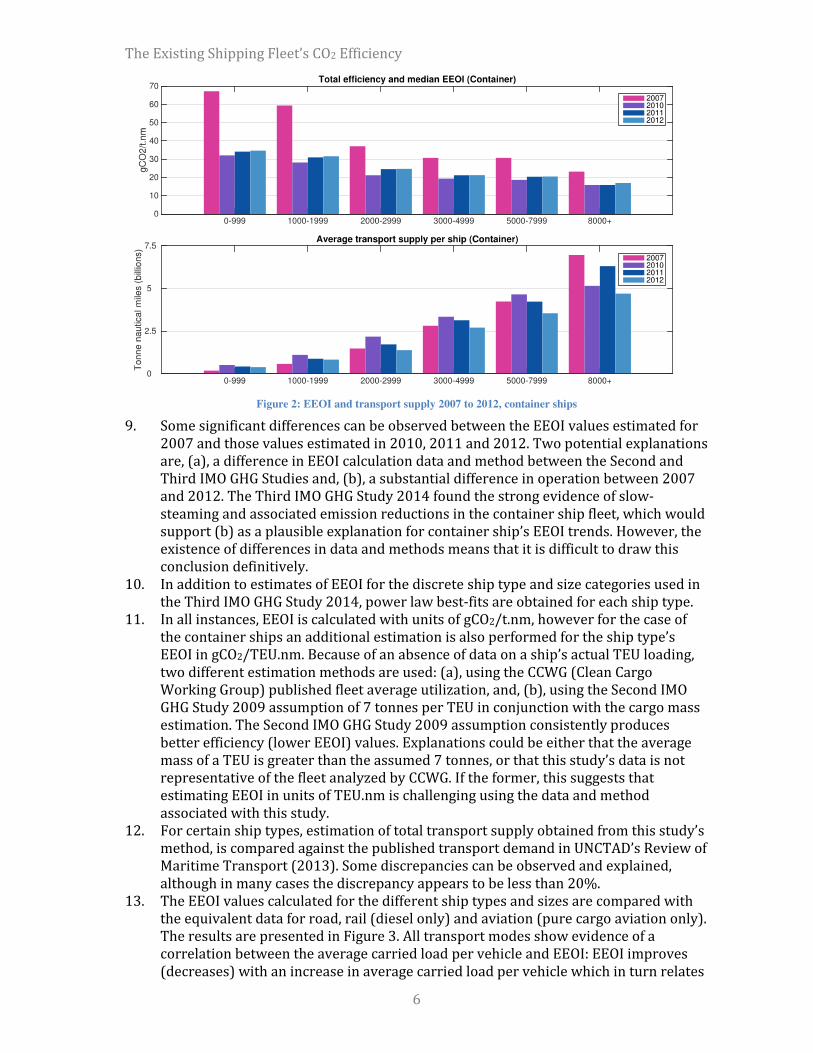
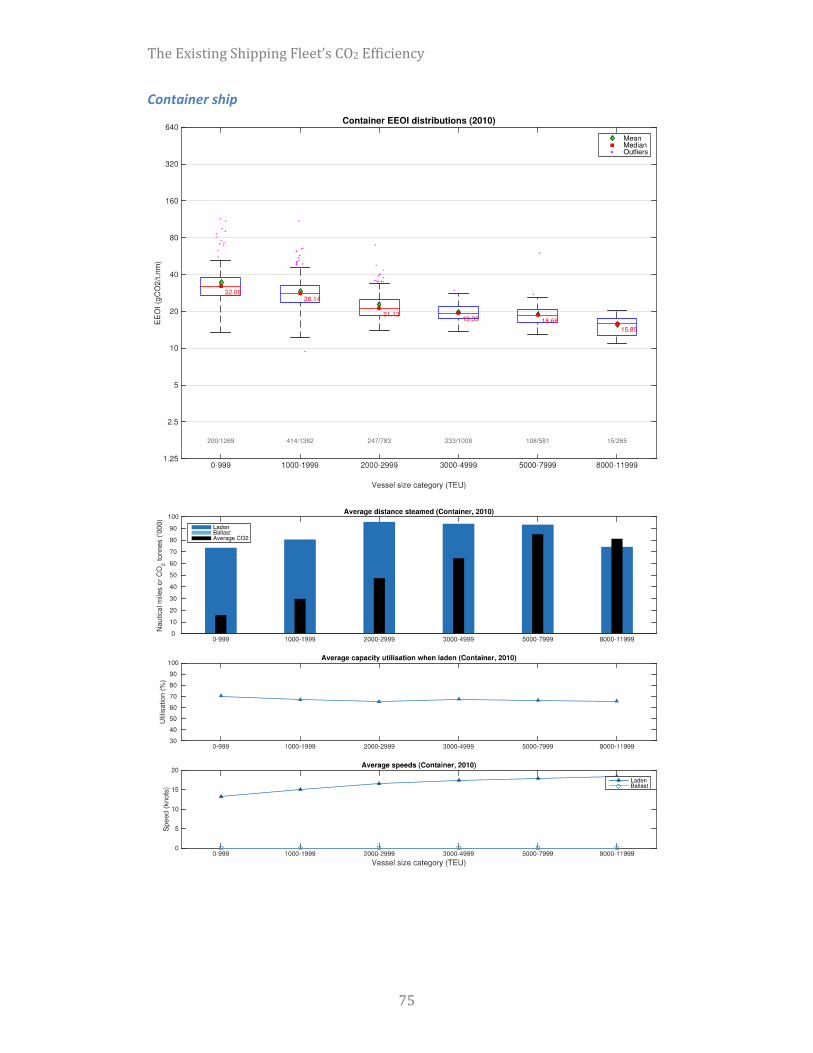
Figure 2: EEOI and transport supply 2007 to 2012, container ships

Figure 3: Comparison of EEOI for different modes of transport
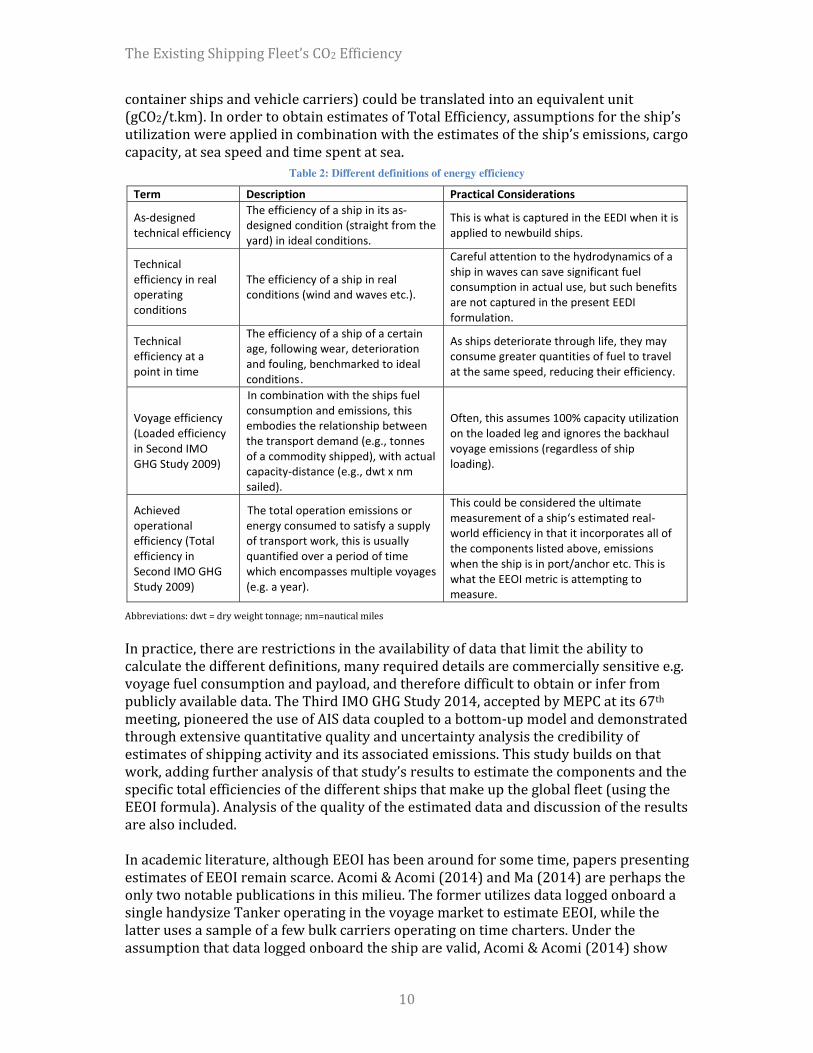
Table 2: Different definitions of energy efficiency
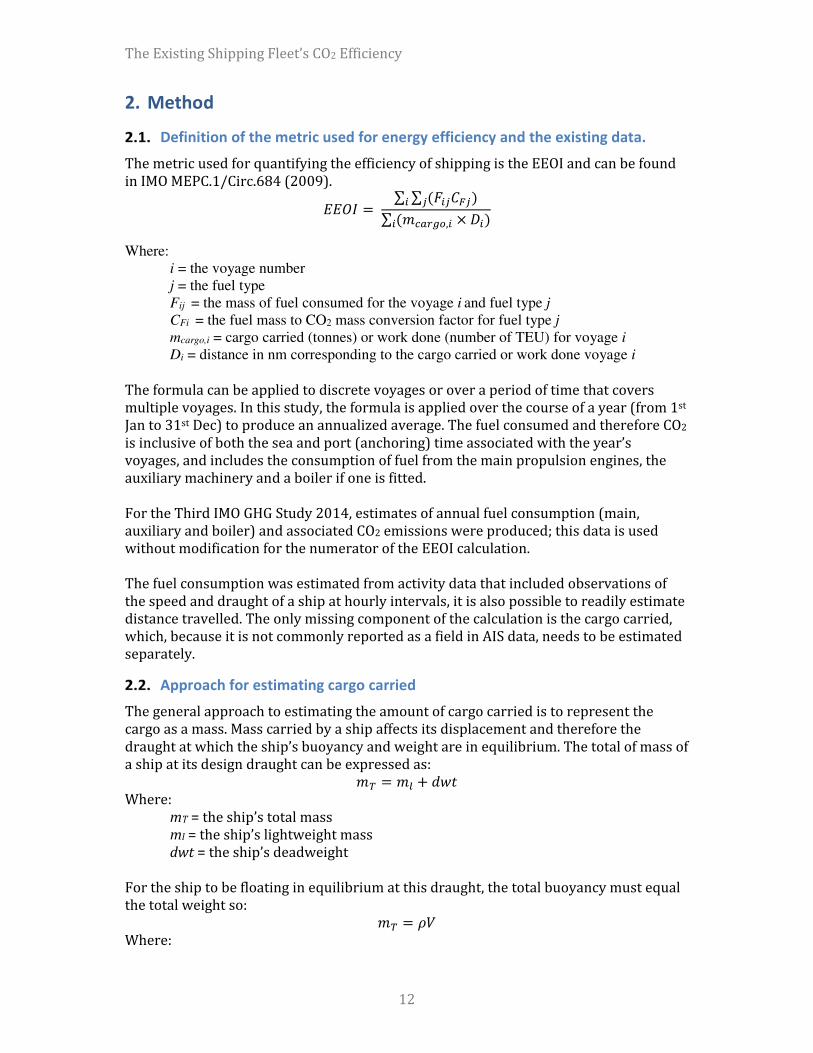
Where: i = the voyage number j = the fuel type Fij = the mass of fuel consumed for the voyage i and fuel type j CFi = the fuel mass to CO2 mass conversion factor for fuel type j mcargo,i = cargo carried (tonnes) or work done (number of TEU) for voyage i
Di = distance in nm corresponding to the cargo carried or work done voyage i
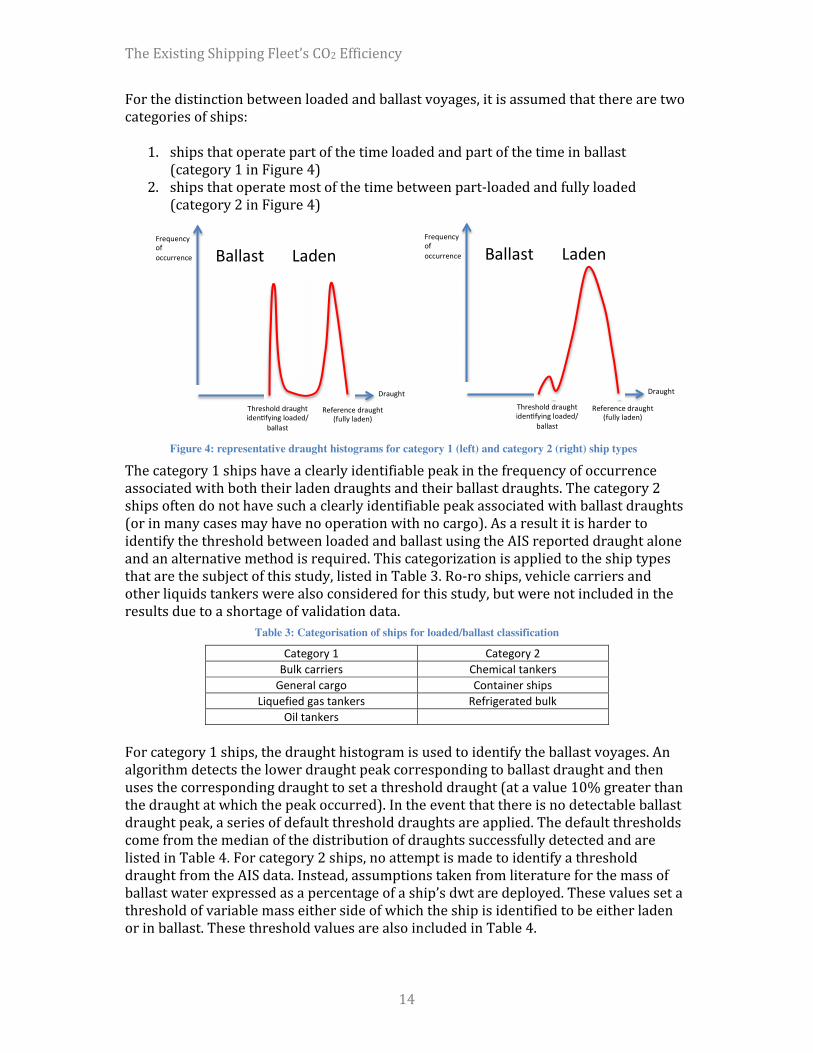
Figure 4: representative draught histograms for category 1 (left) and category 2 (right) ship types
Table 3: Categorisation of ships for loaded/ballast classification
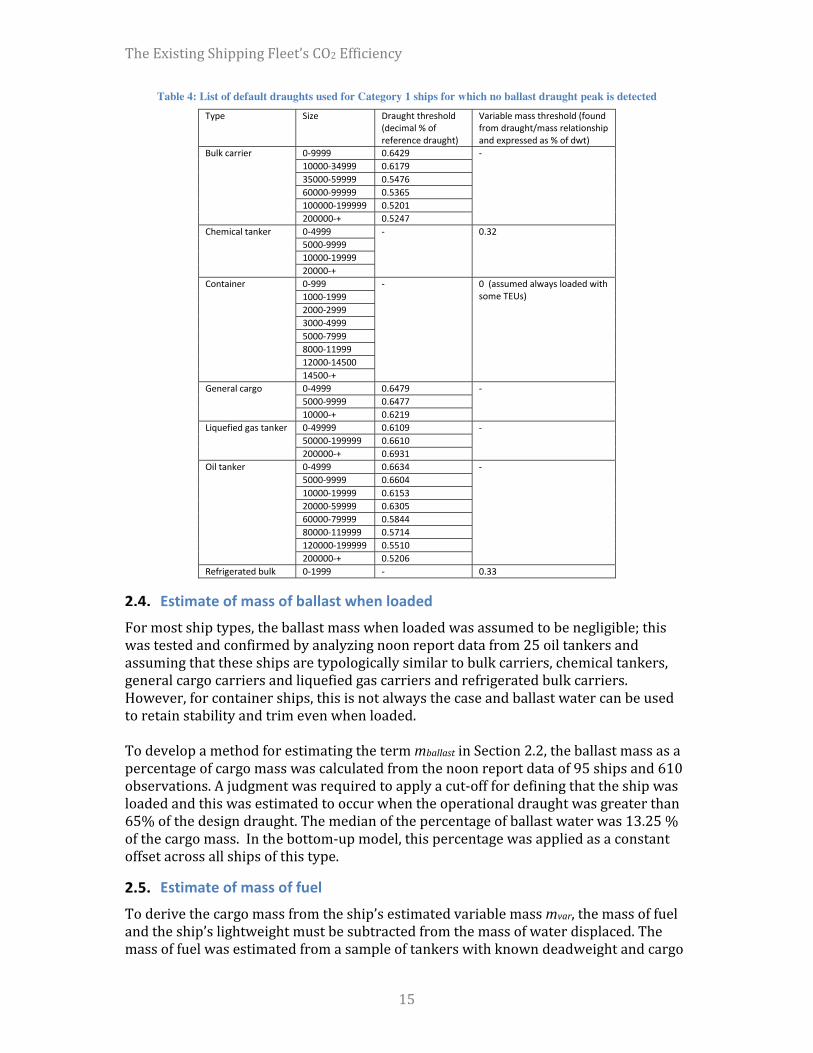
Table 4: List of default draughts used for Category 1 ships for which no ballast draught peak is detected
•
•
•
T
able
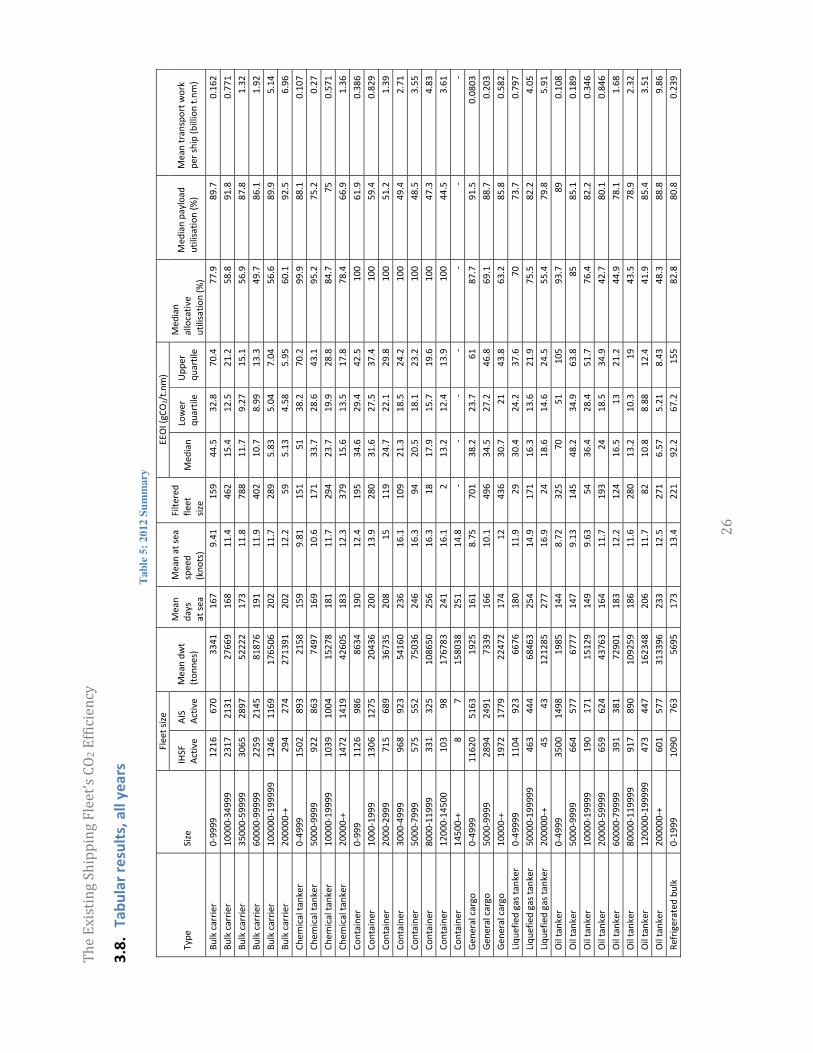
5:
2012
Sum
mar
y
Tab
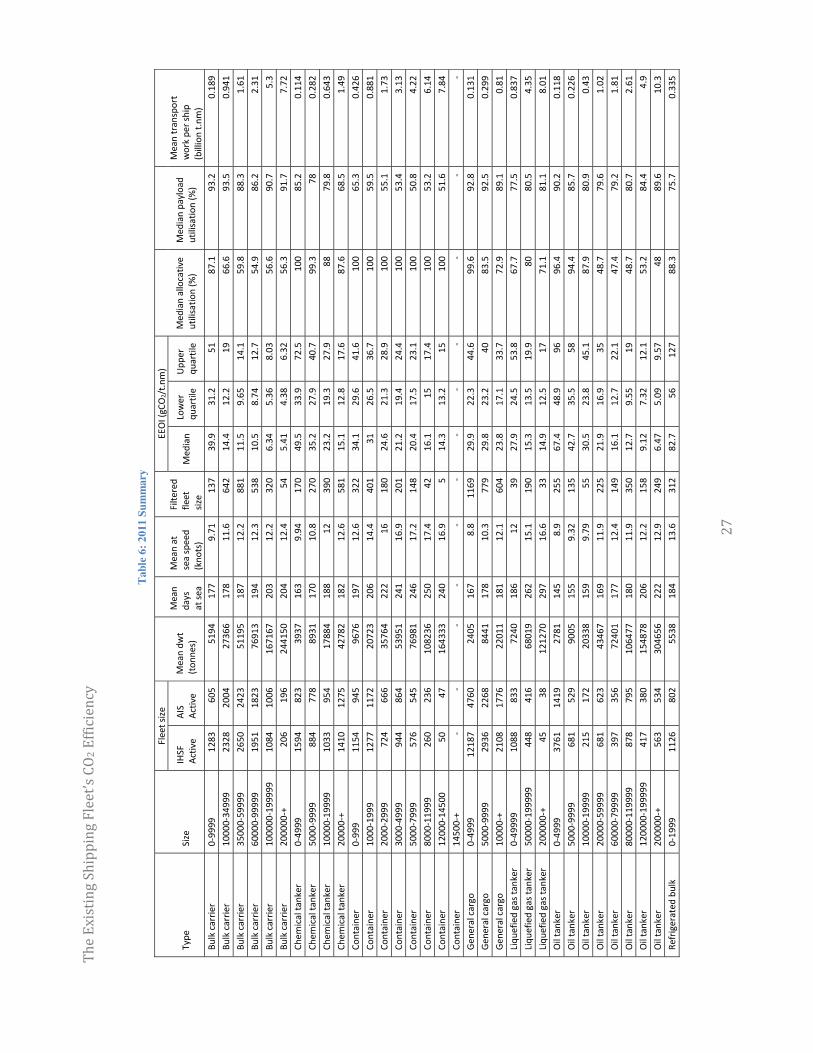
le 6
: 20
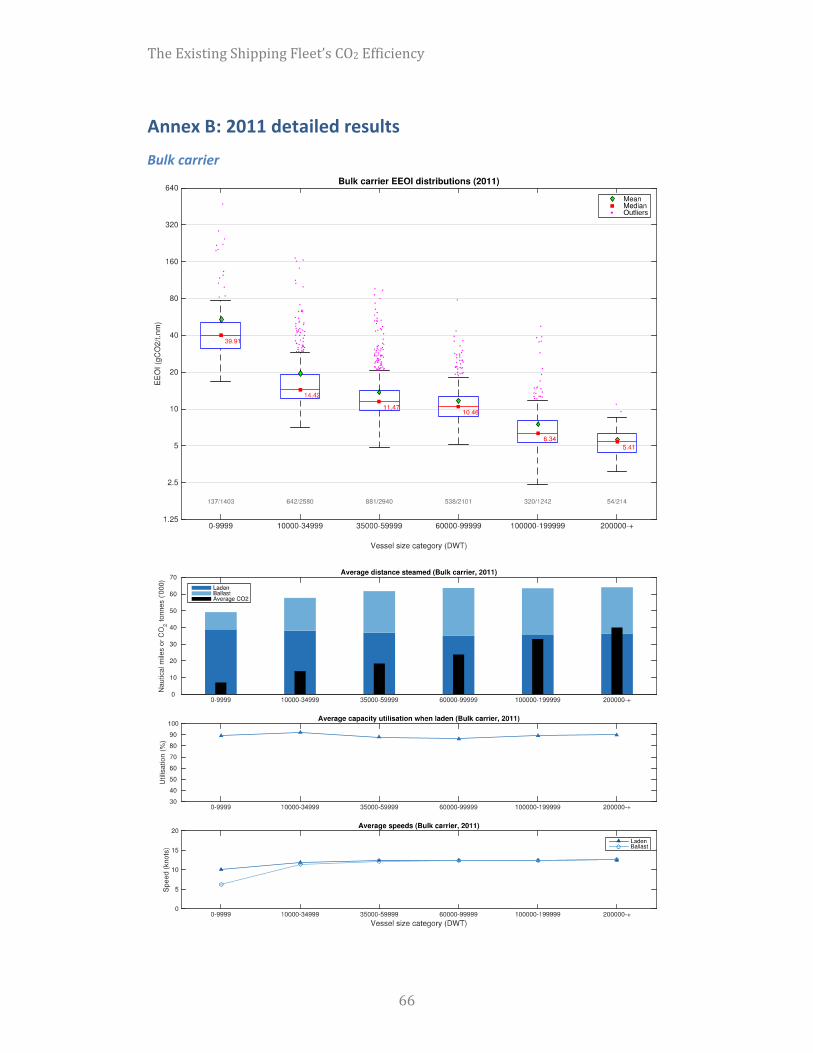
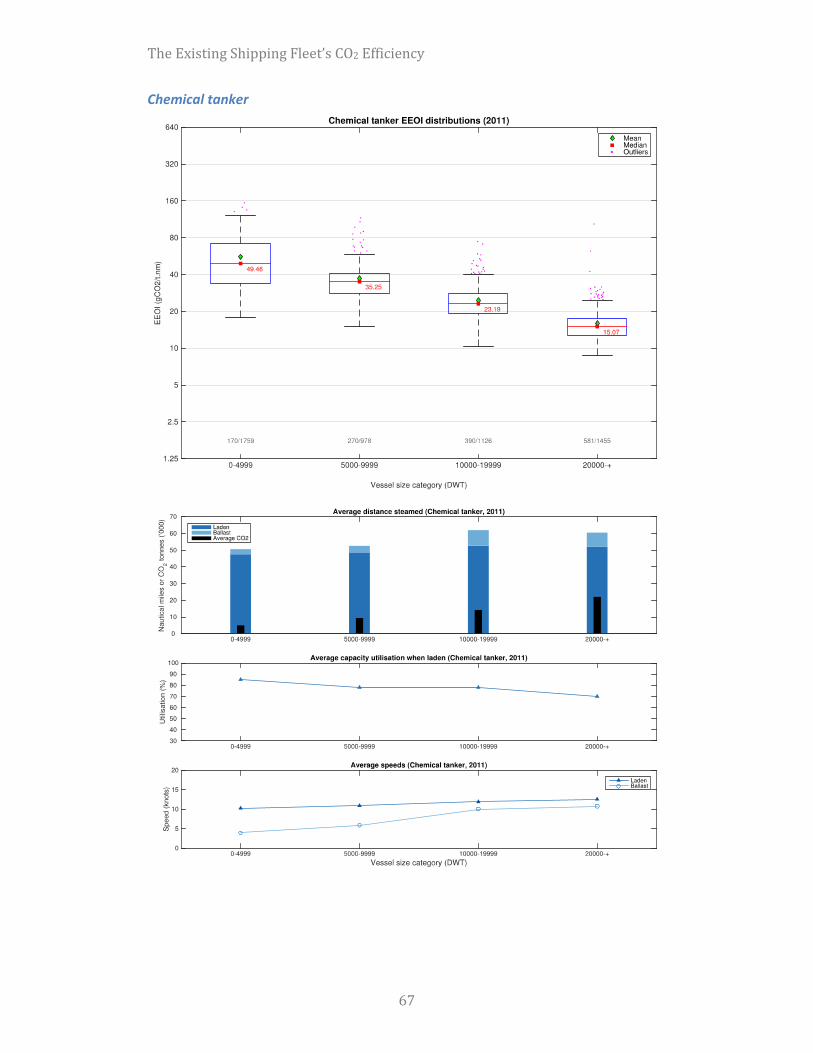
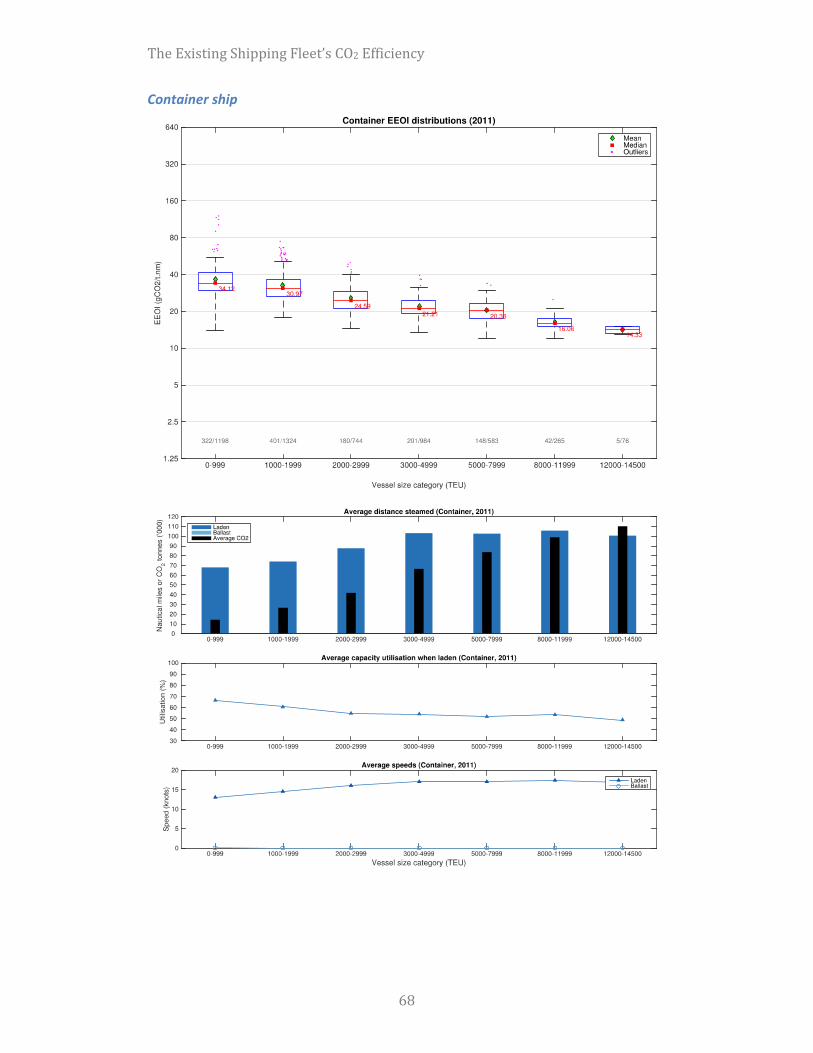
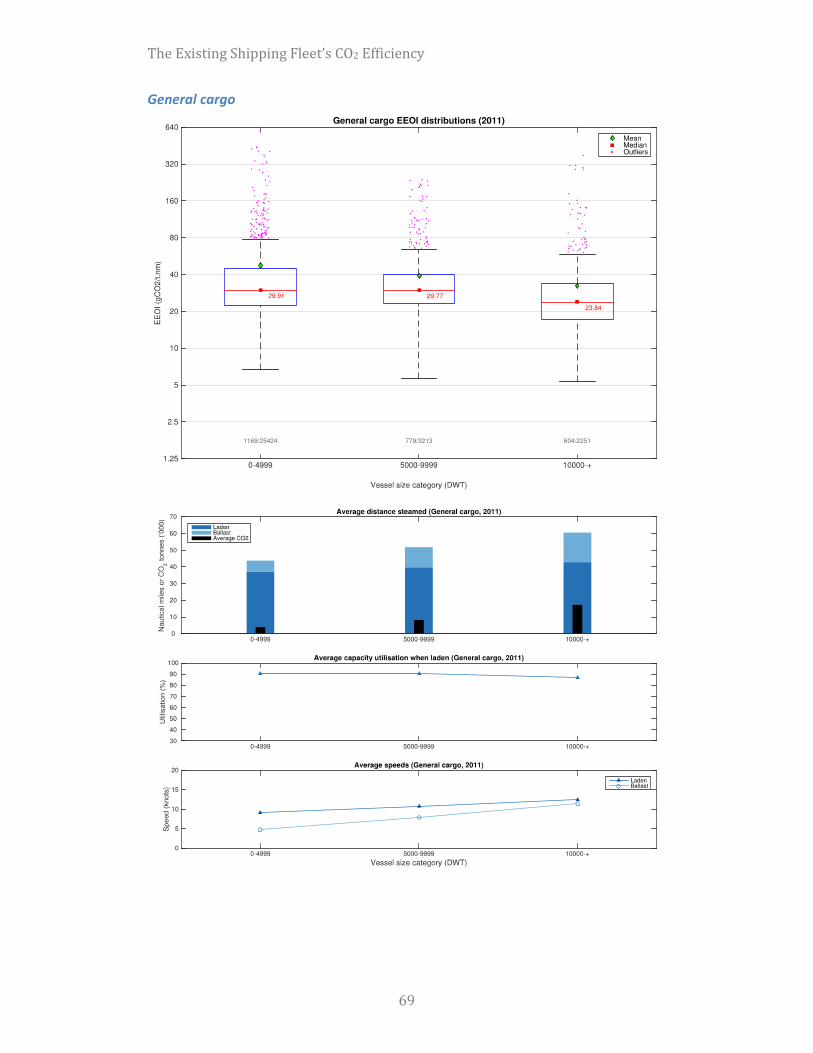
11 S
umm
ary

Tab
le 7
: 20
10 S
umm
ary
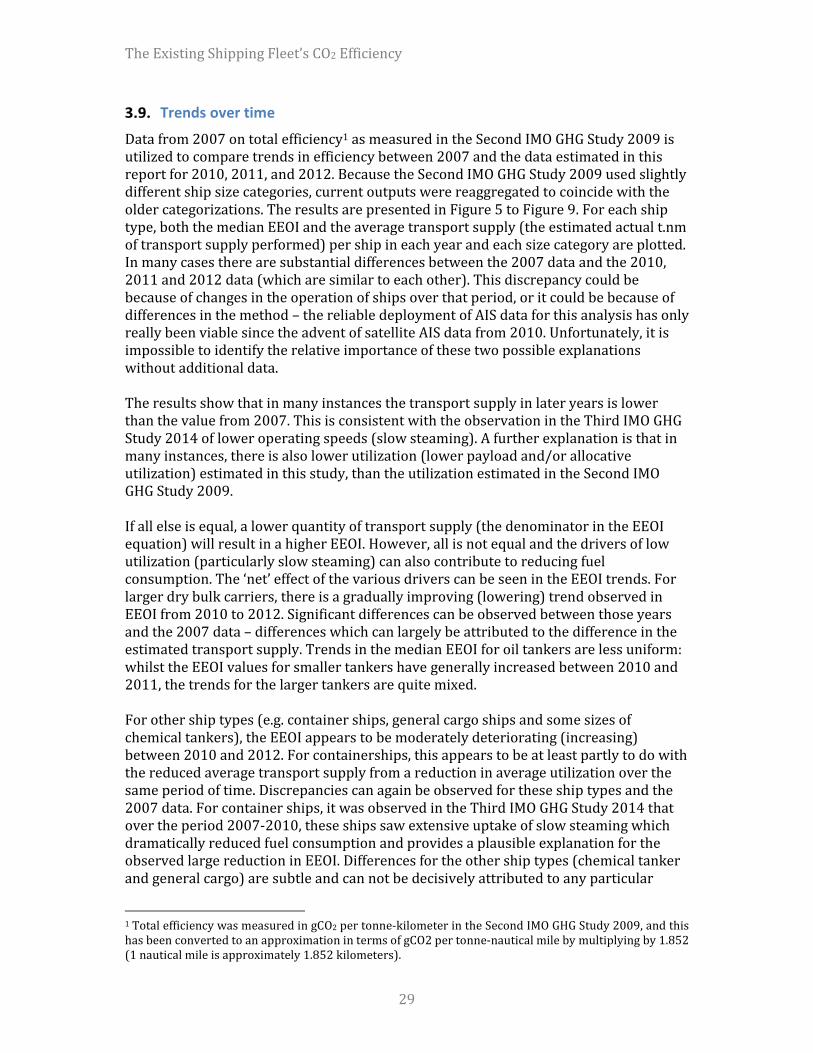
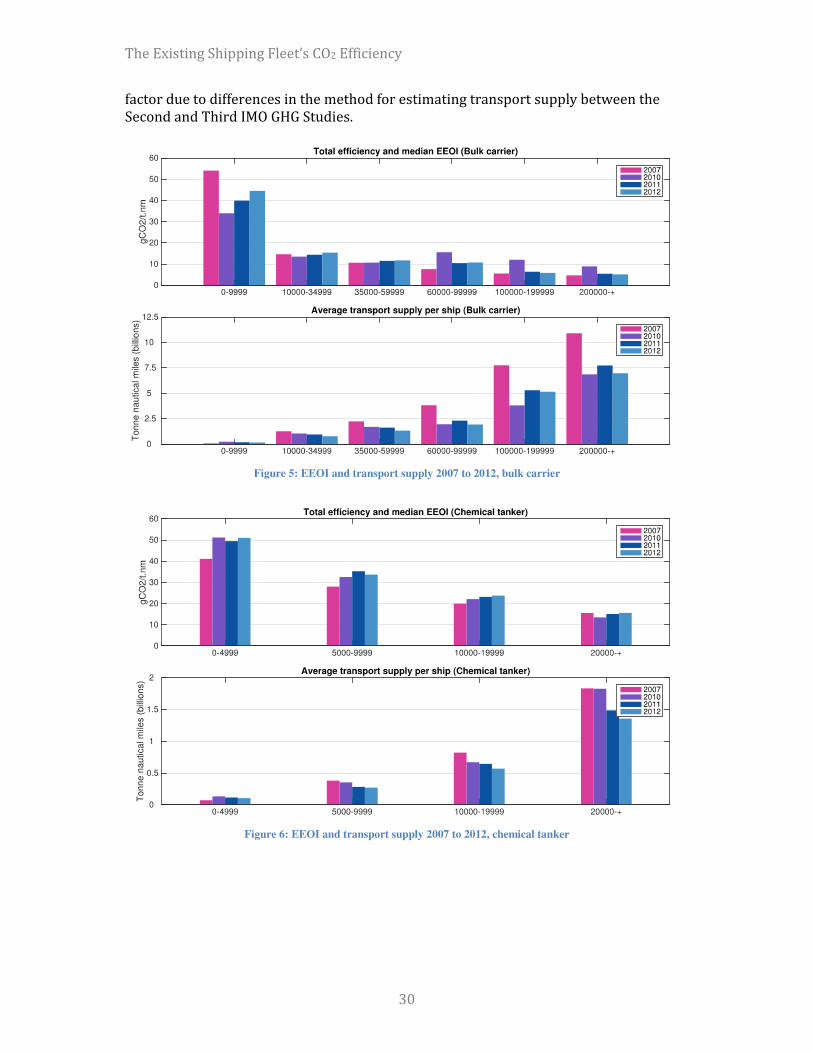
Figure 5: EEOI and transport supply 2007 to 2012, bulk carrier
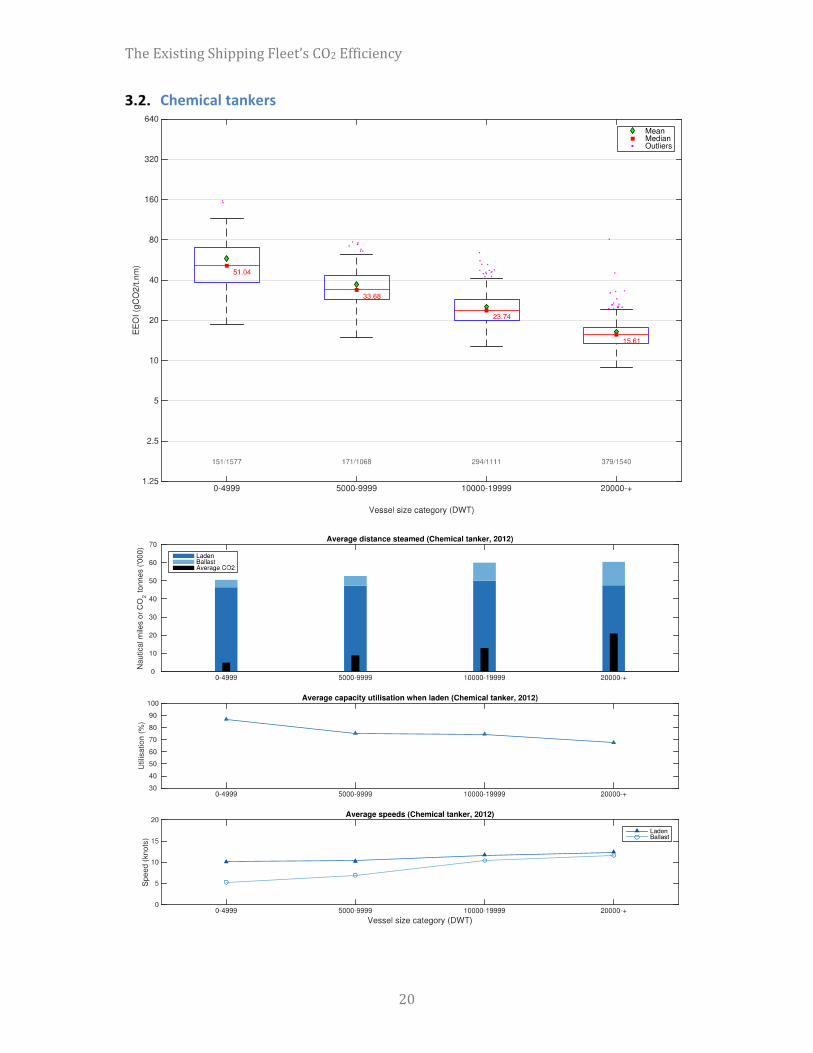
Figure 6: EEOI and transport supply 2007 to 2012, chemical tanker
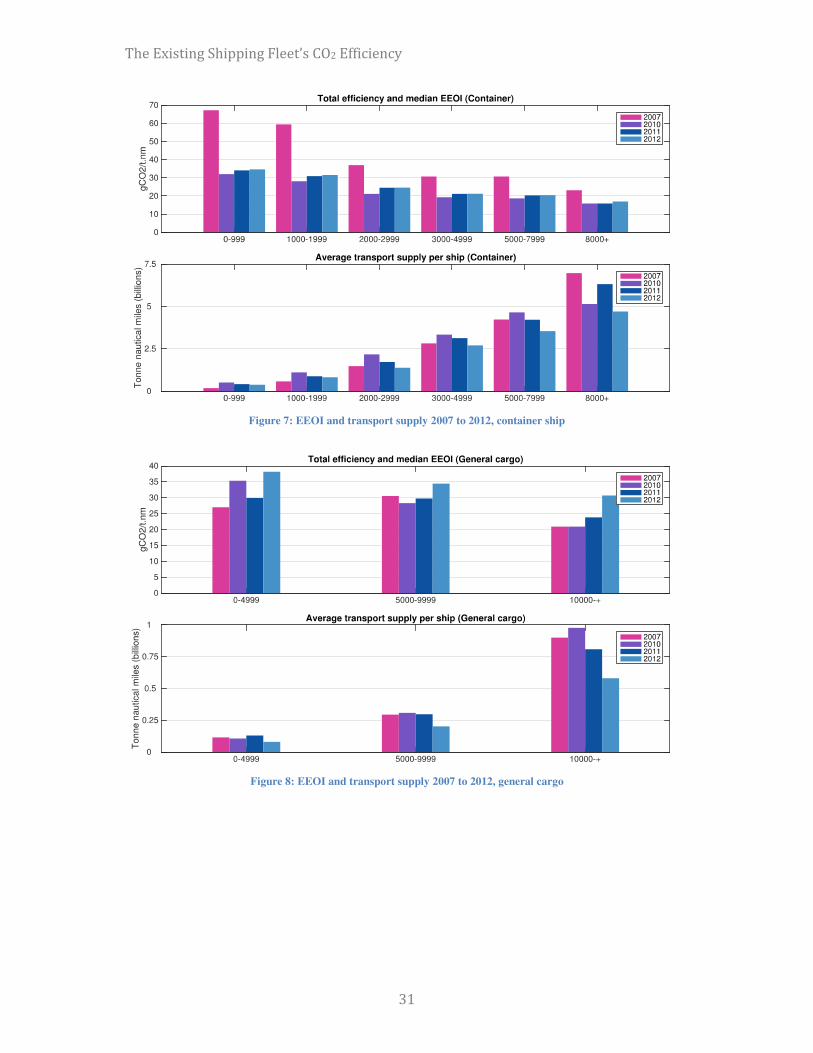
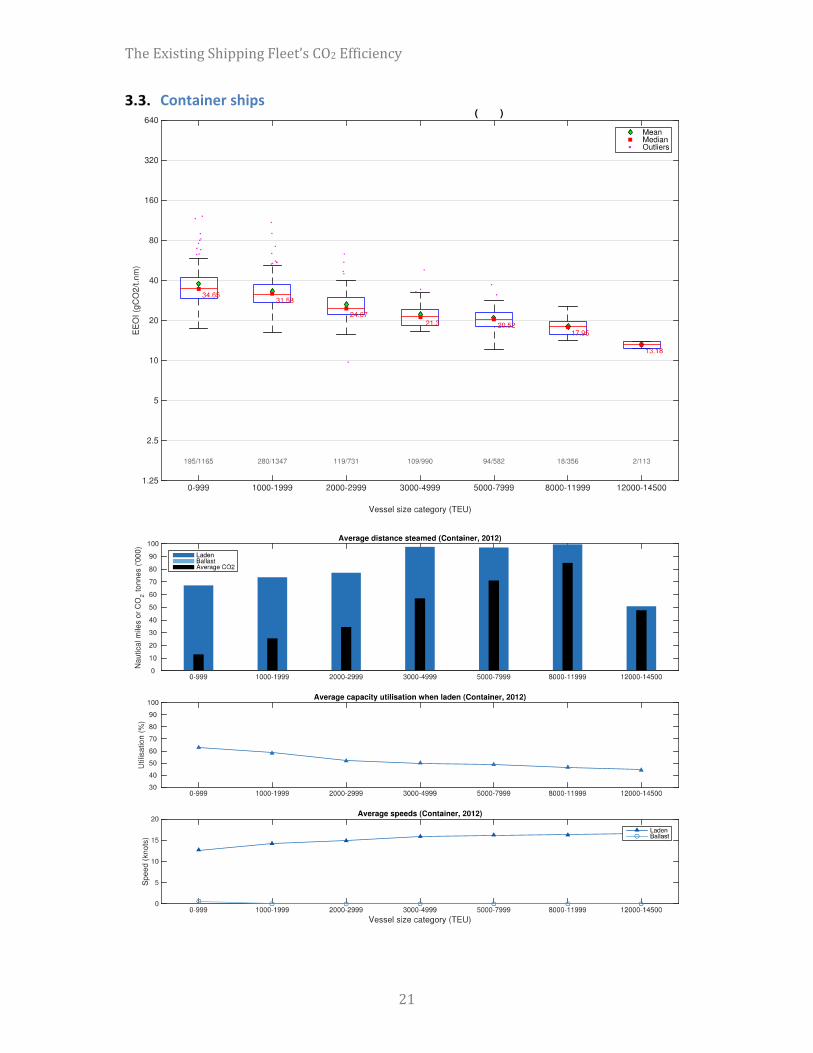
Figure 7: EEOI and transport supply 2007 to 2012, container ship
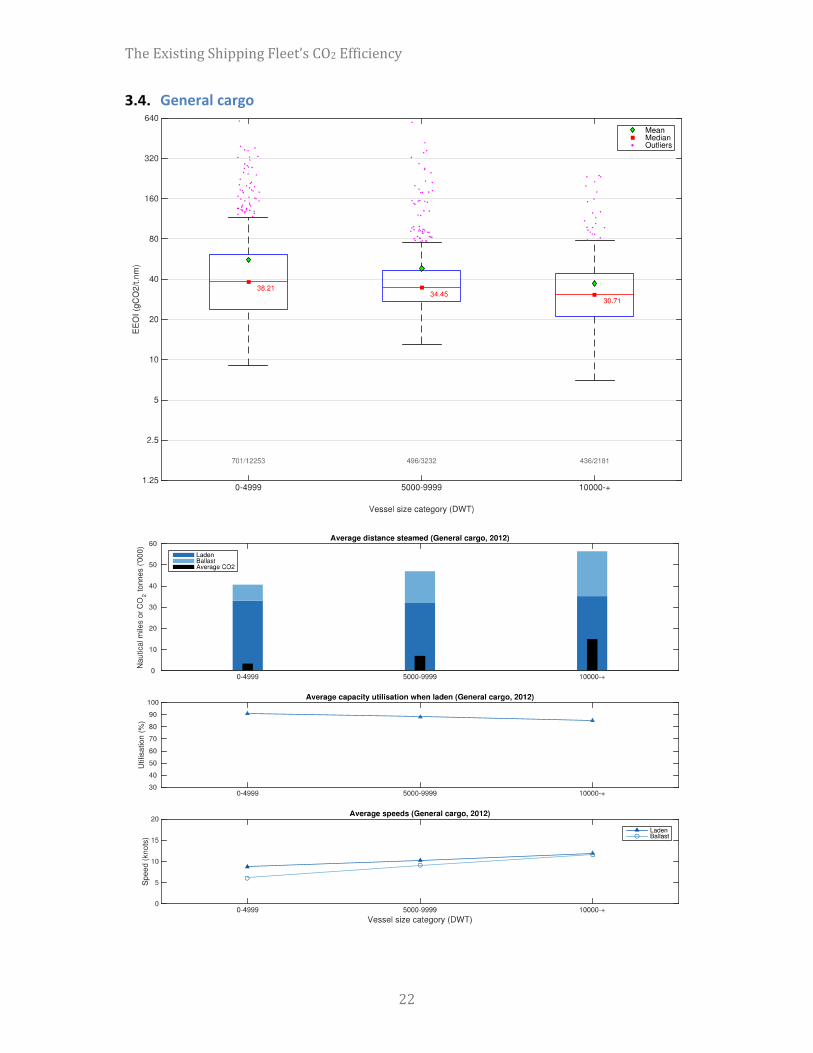
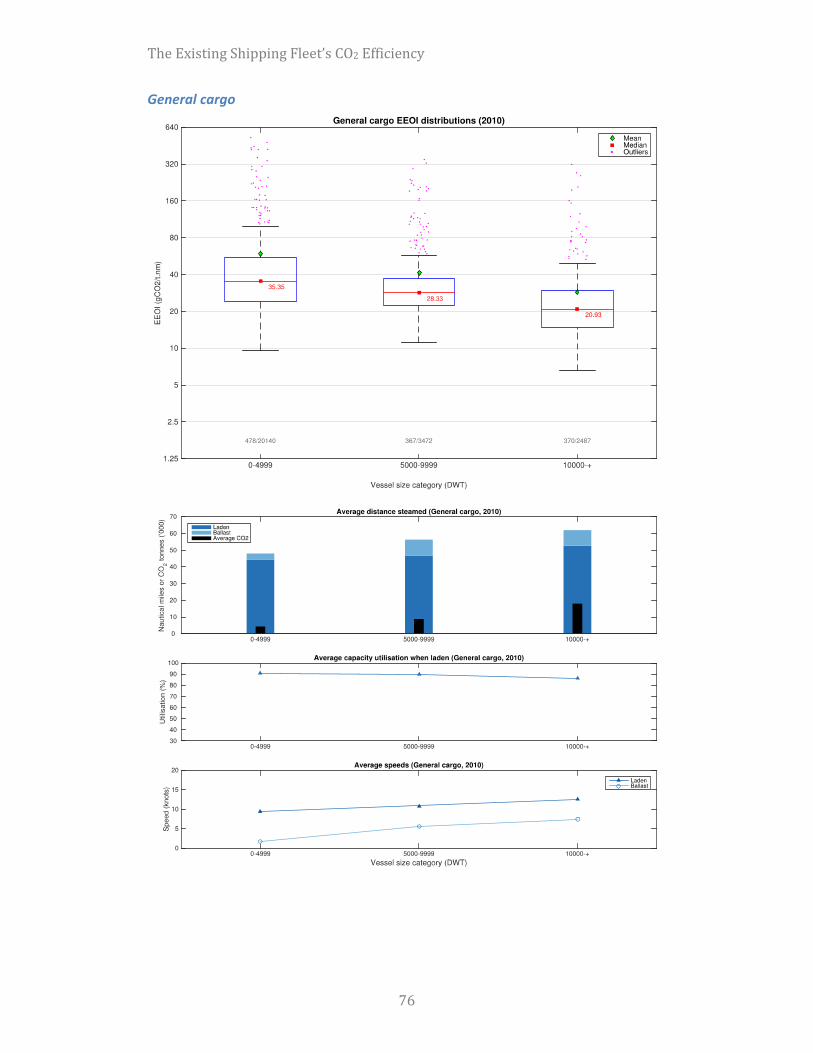
Figure 8: EEOI and transport supply 2007 to 2012, general cargo

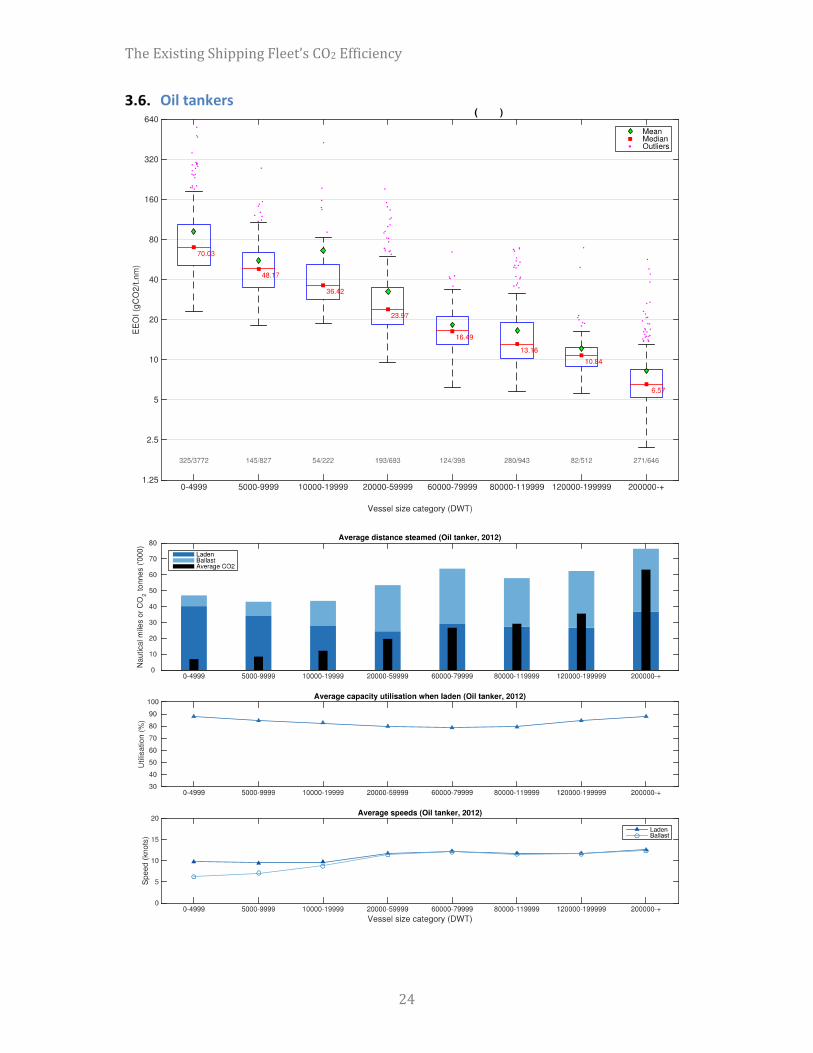
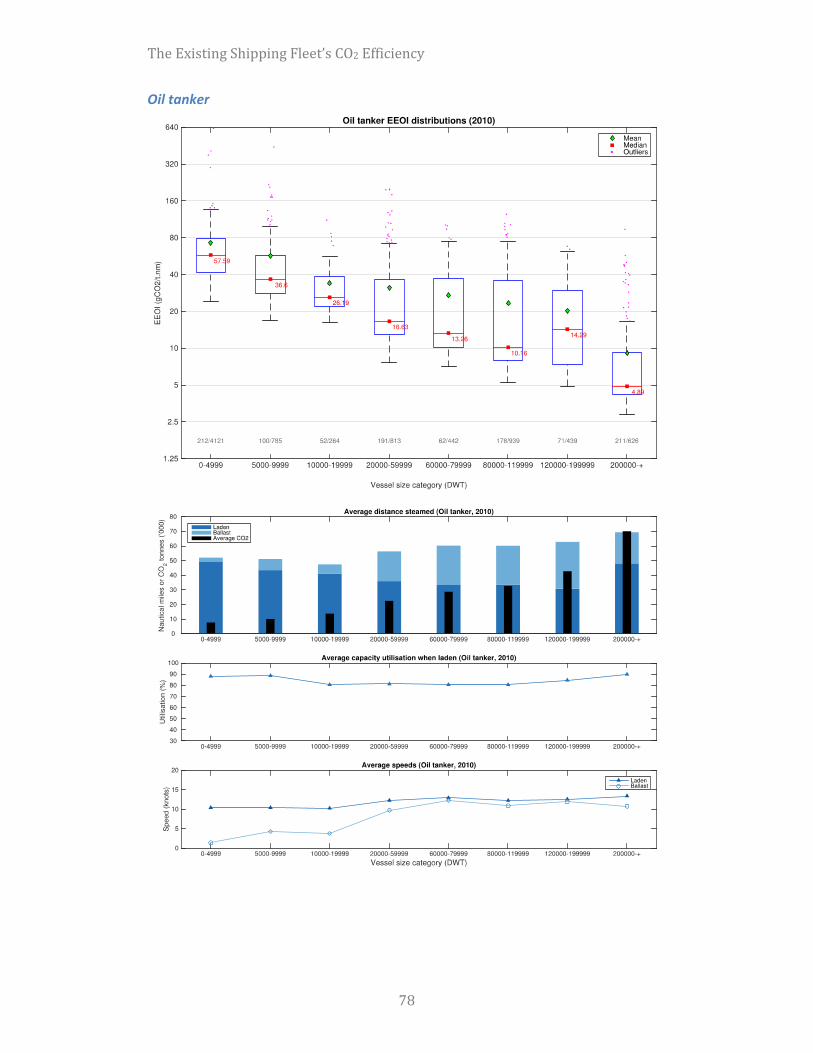
Figure 9: EEOI and transport supply 2007 to 2012, oil tanker
Table 8: Single term power function parameter estimates

Figure 10: EEOI - dwt power law fits, bulk carrier
Figure 11: EEOI - dwt power law fits, chemical tanker
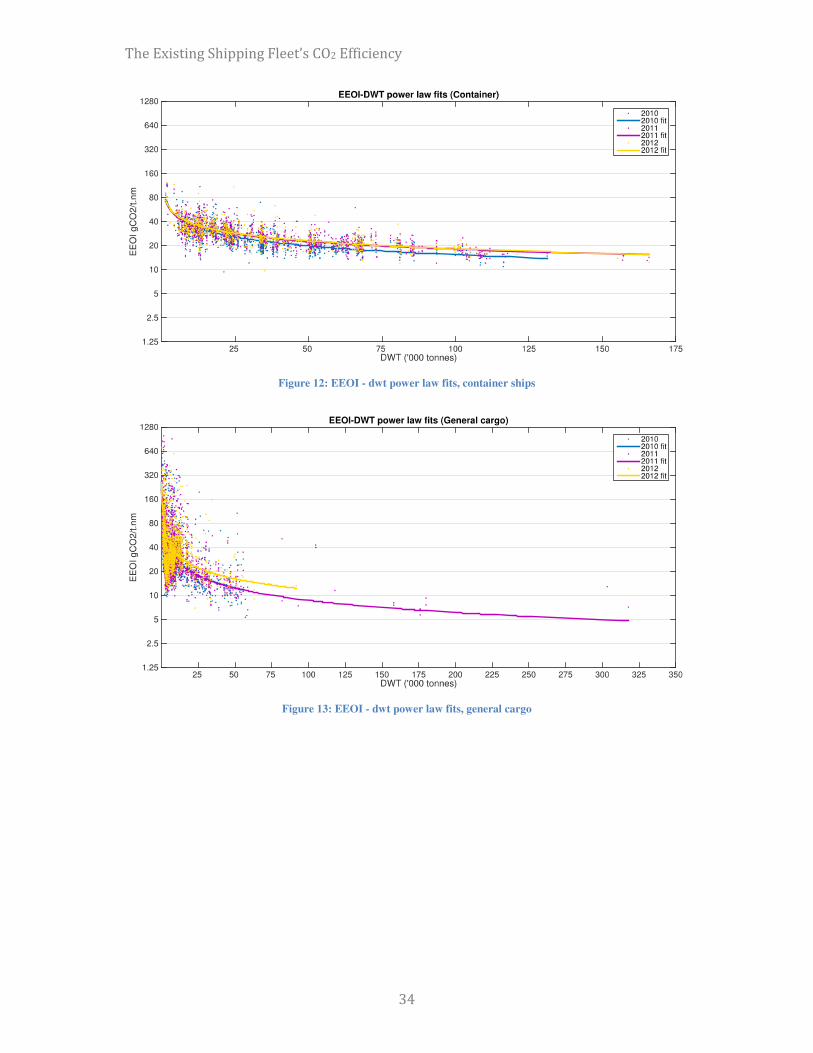
Figure 12: EEOI - dwt power law fits, container ships
Figure 13: EEOI - dwt power law fits, general cargo
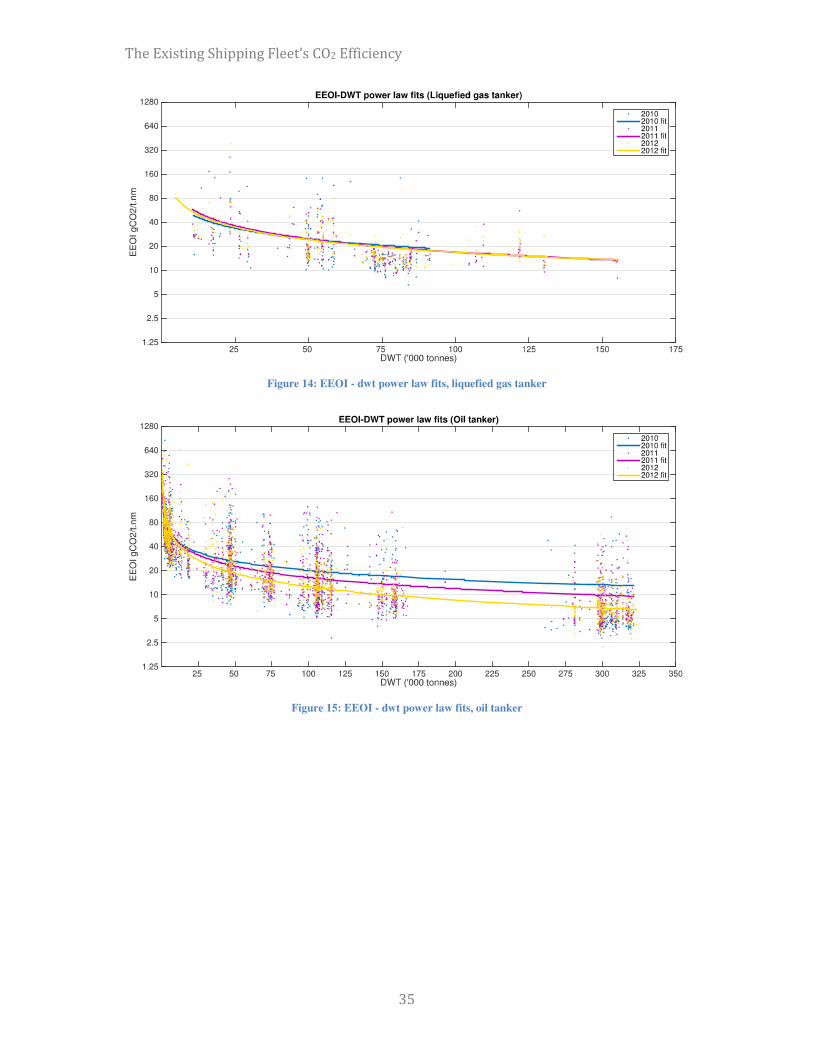
Figure 14: EEOI - dwt power law fits, liquefied gas tanker
Figure 15: EEOI - dwt power law fits, oil tanker
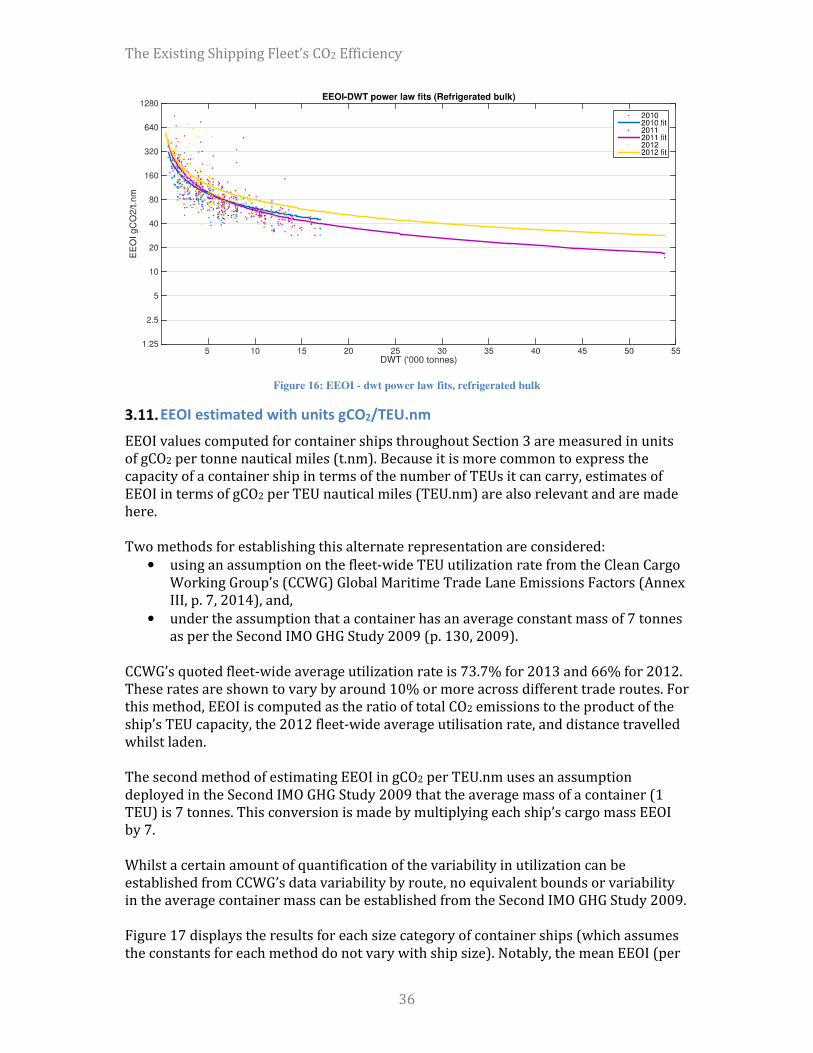
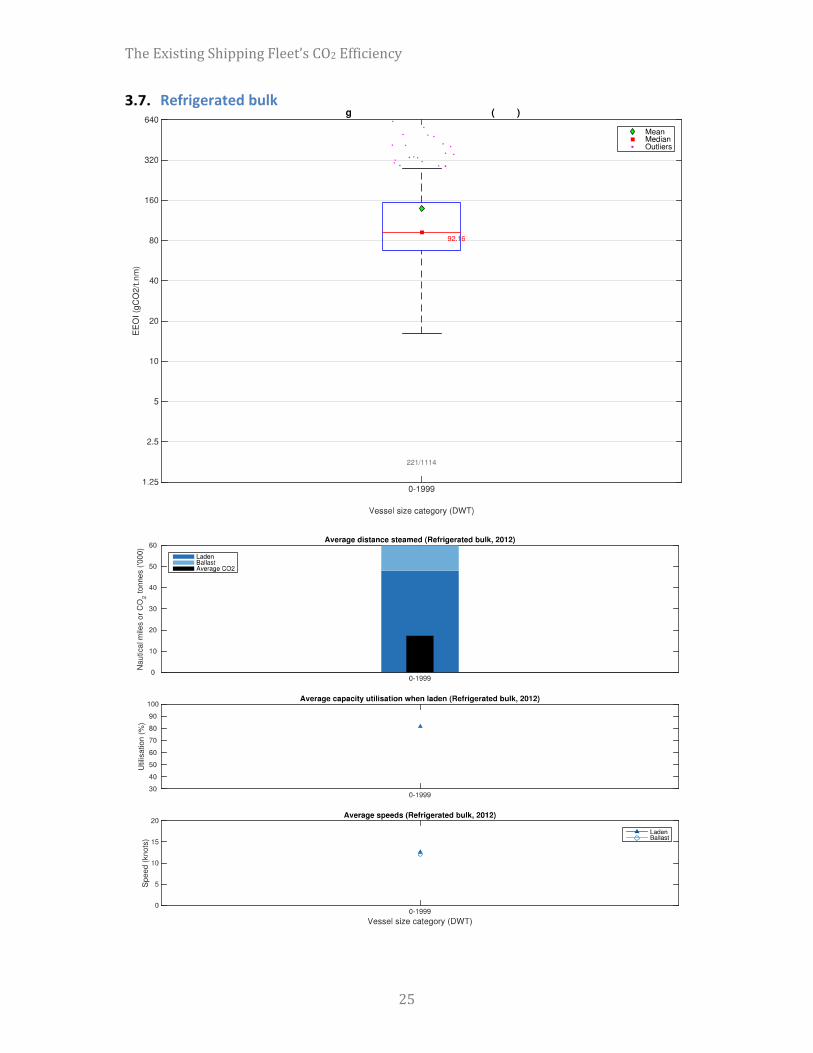
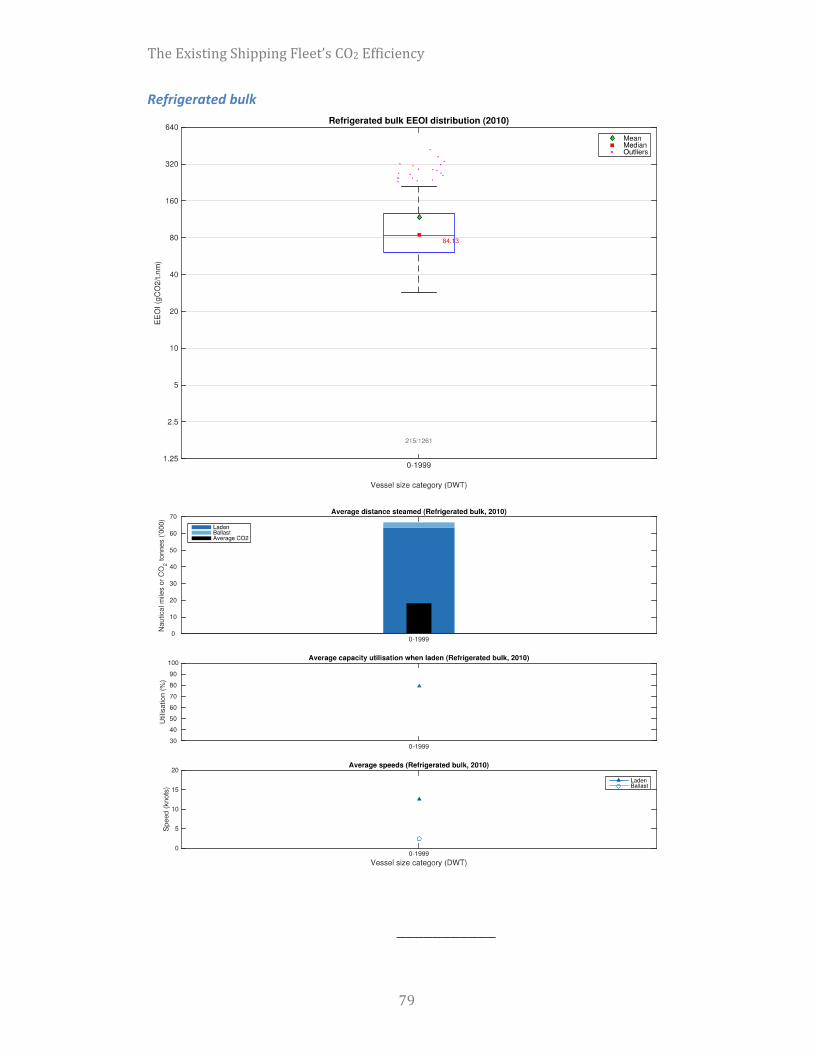
Figure 16: EEOI - dwt power law fits, refrigerated bulk
•
•
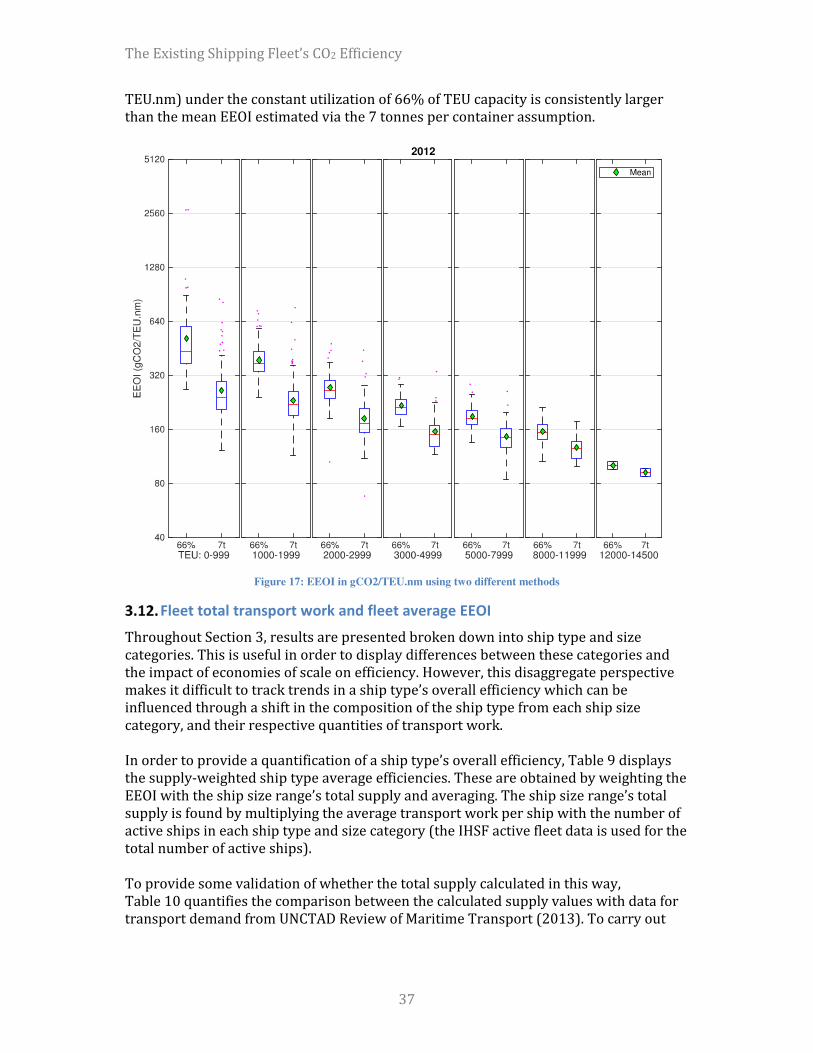
Figure 17: EEOI in gCO2/TEU.nm using two different methods
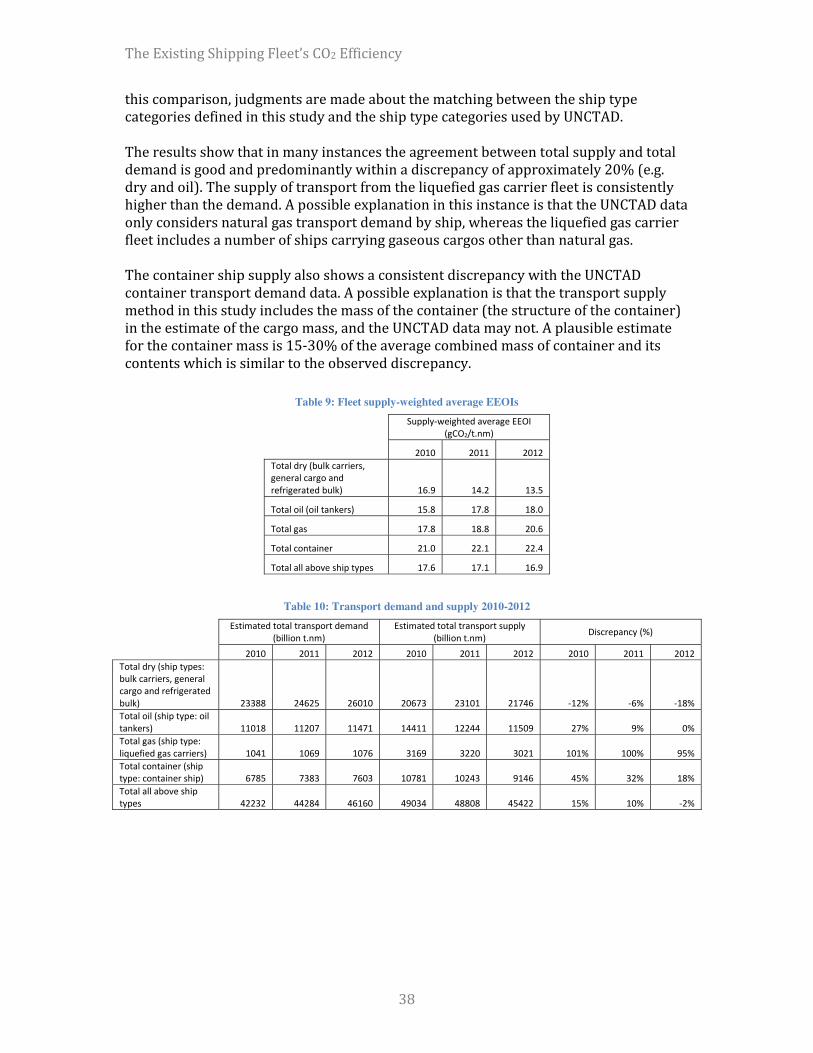
Table 9: Fleet supply-weighted average EEOIs
Table 10: Transport demand and supply 2010-2012
• •
• •
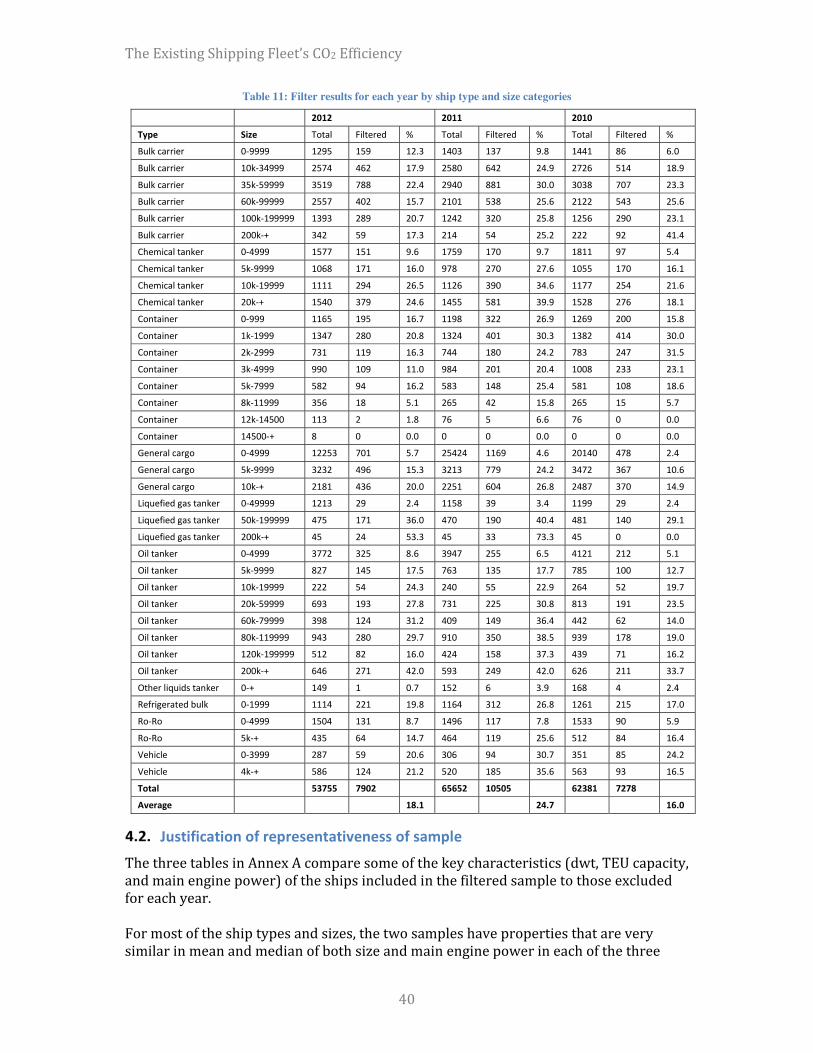
Table 11: Filter results for each year by ship type and size categories
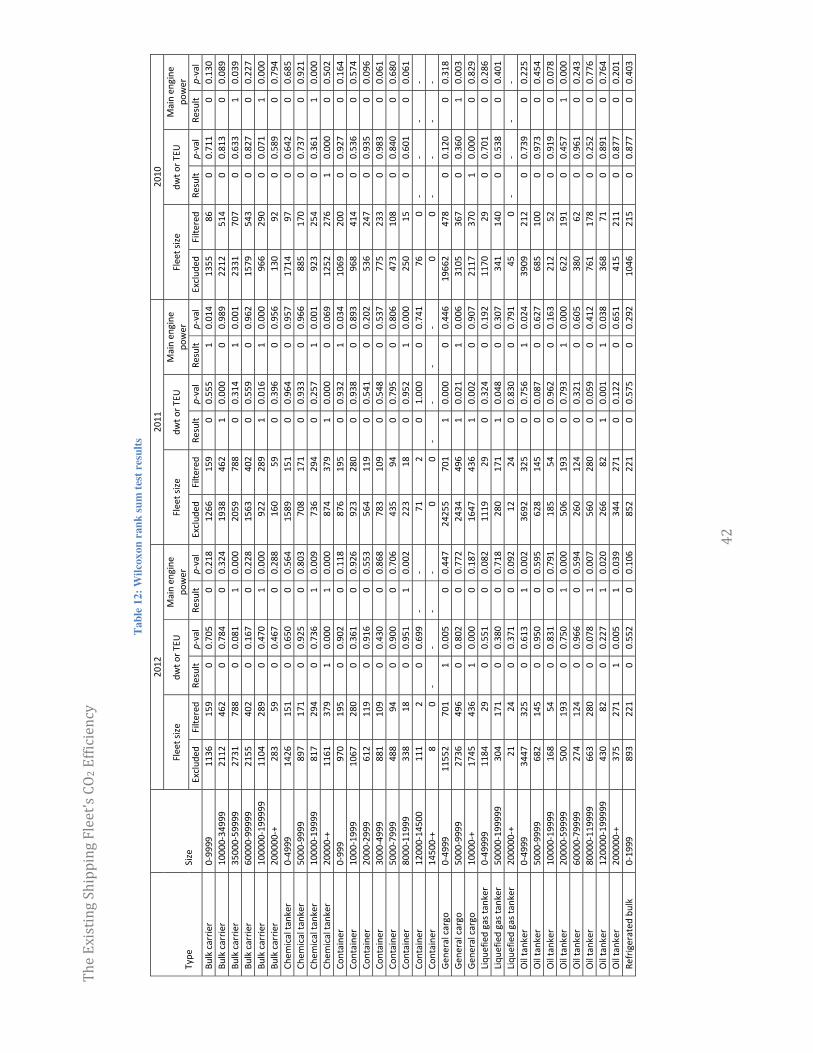
Tab
le 1
2: W
ilcox
on r
ank
sum
tes
t re
sult
s
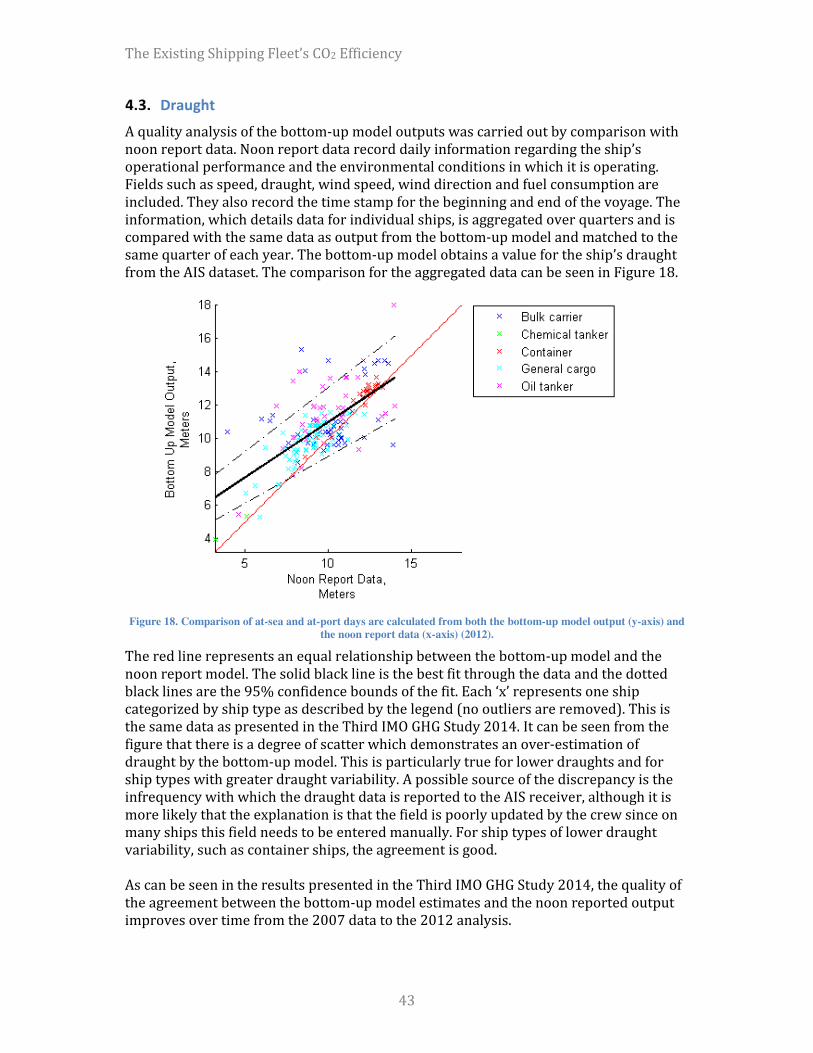
Figure 18. Comparison of at-sea and at-port days are calculated from both the bottom-up model output (y-axis) and the noon report data (x-axis) (2012).
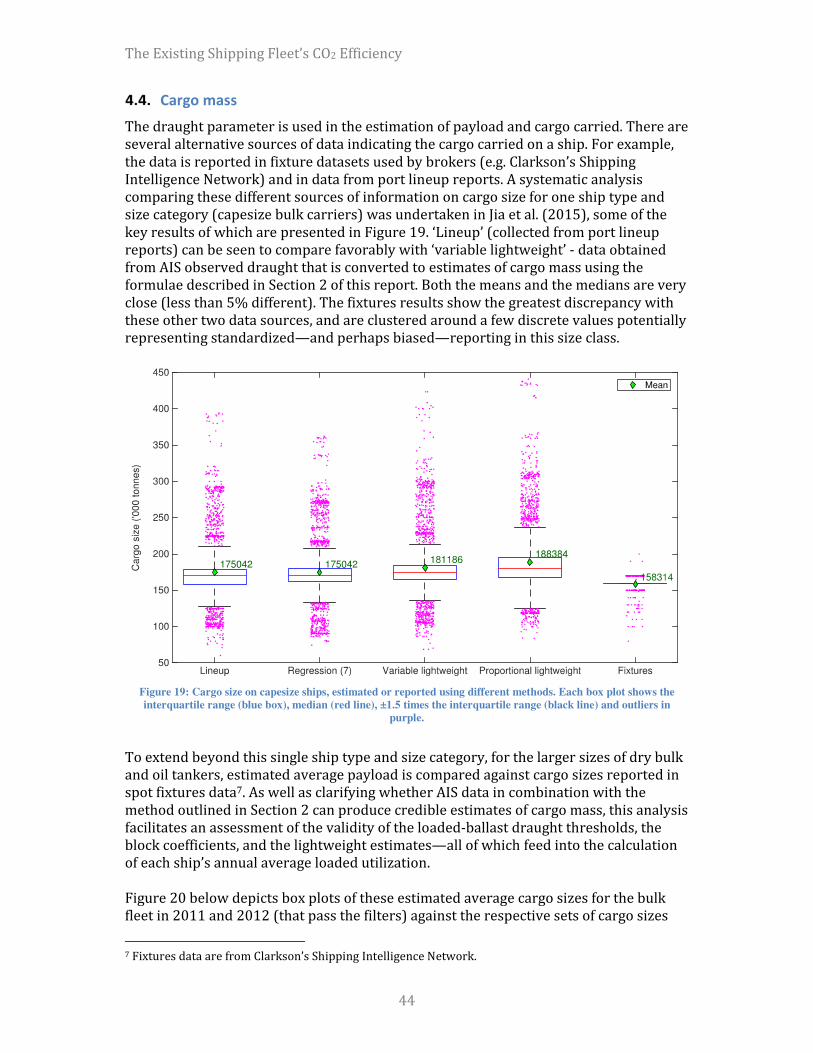
Figure 19: Cargo size on capesize ships, estimated or reported using different methods. Each box plot shows the interquartile range (blue box), median (red line), ±1.5 times the interquartile range (black line) and outliers in
purple.
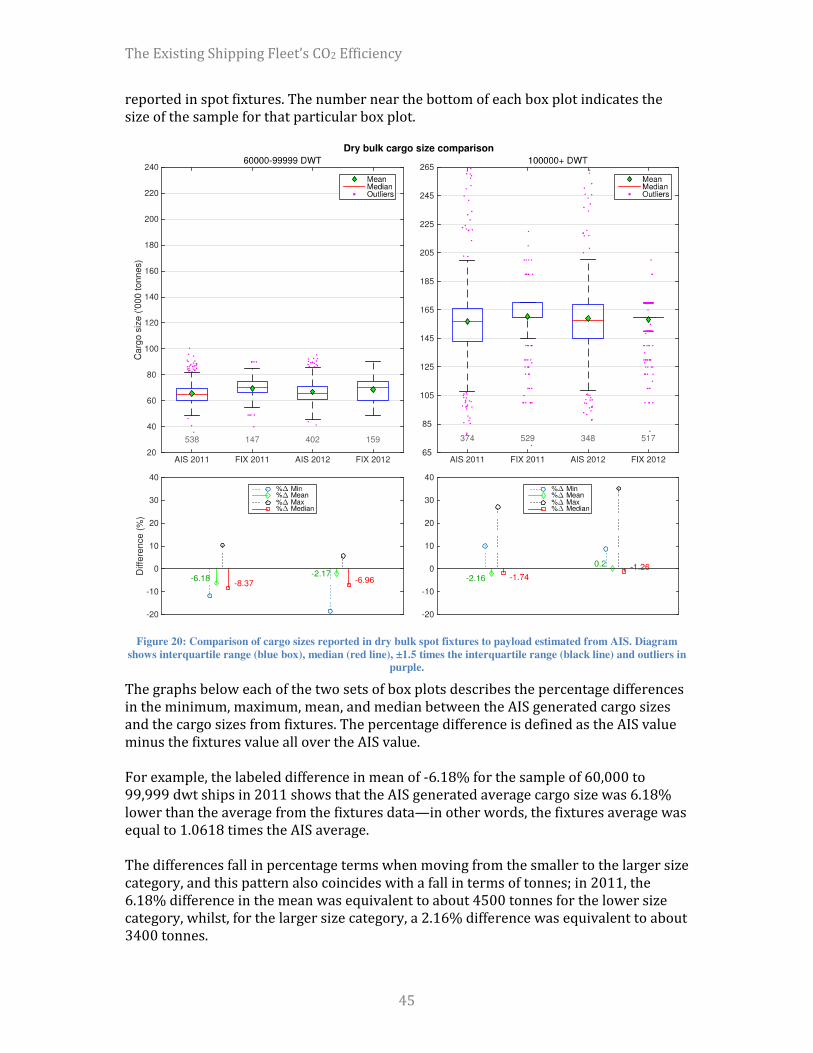
Figure 20: Comparison of cargo sizes reported in dry bulk spot fixtures to payload estimated from AIS. Diagram shows interquartile range (blue box), median (red line), ±1.5 times the interquartile range (black line) and outliers in
purple.
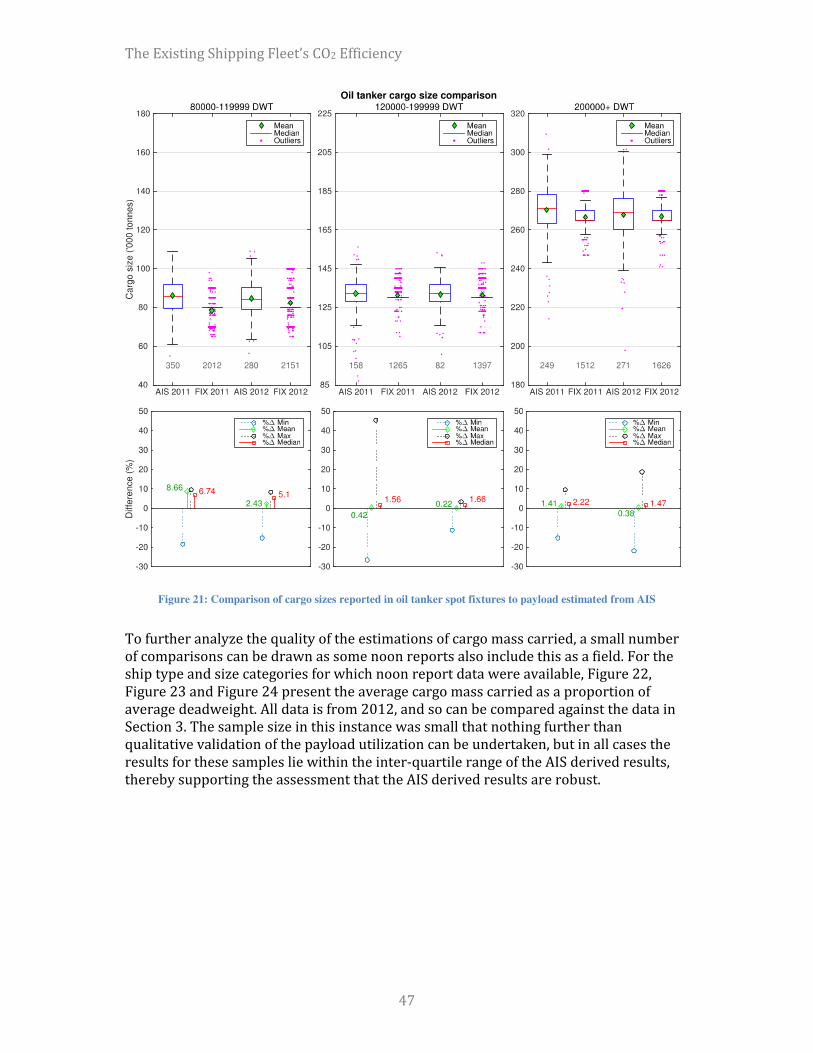
Figure 21: Comparison of cargo sizes reported in oil tanker spot fixtures to payload estimated from AIS
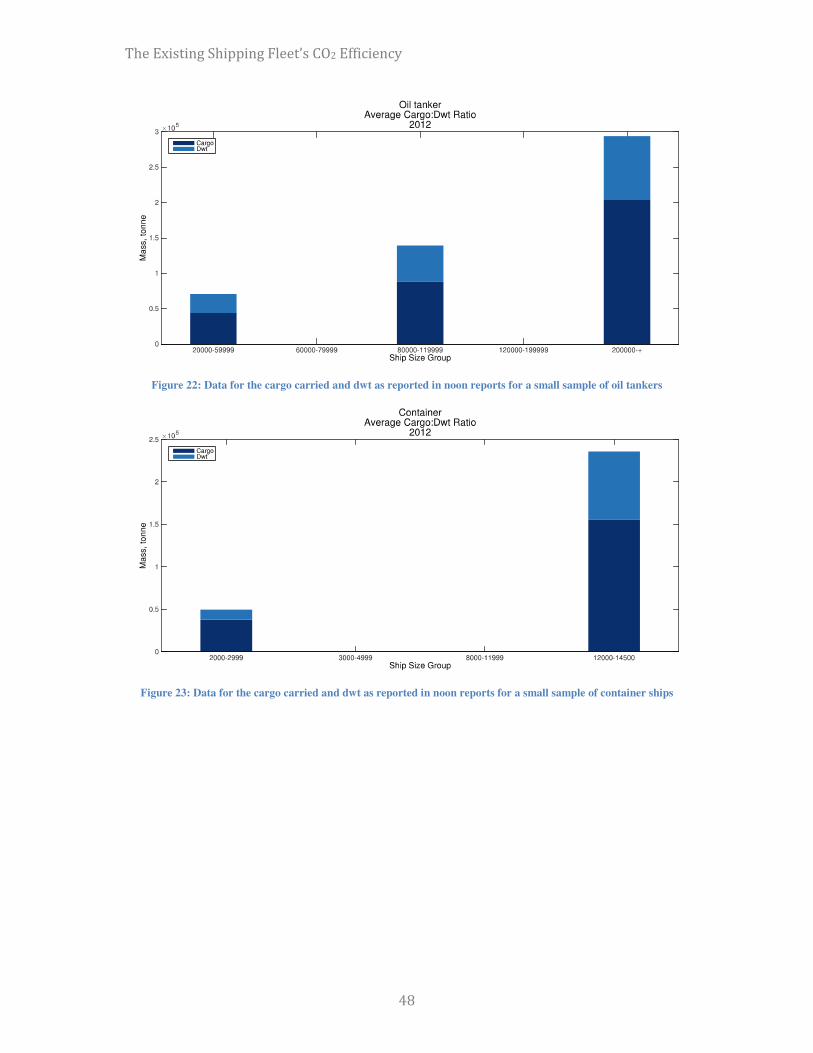
Figure 22: Data for the cargo carried and dwt as reported in noon reports for a small sample of oil tankers
Figure 23: Data for the cargo carried and dwt as reported in noon reports for a small sample of container ships
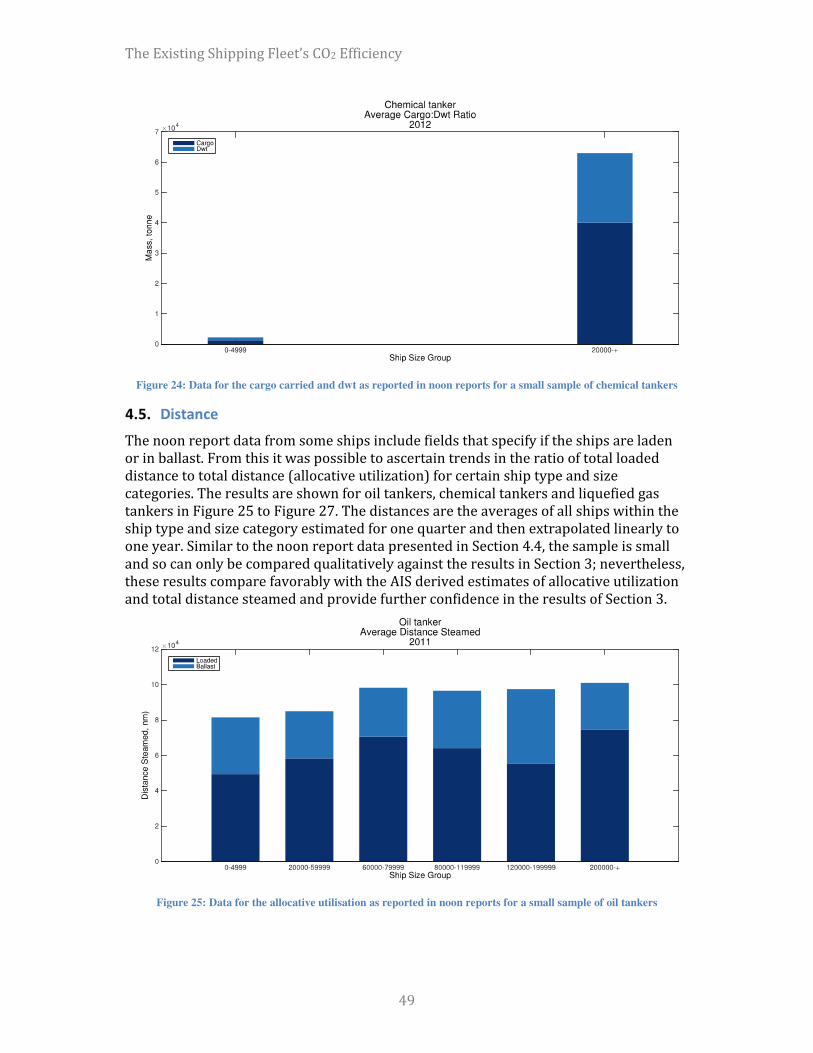
Figure 24: Data for the cargo carried and dwt as reported in noon reports for a small sample of chemical tankers
Figure 25: Data for the allocative utilisation as reported in noon reports for a small sample of oil tankers
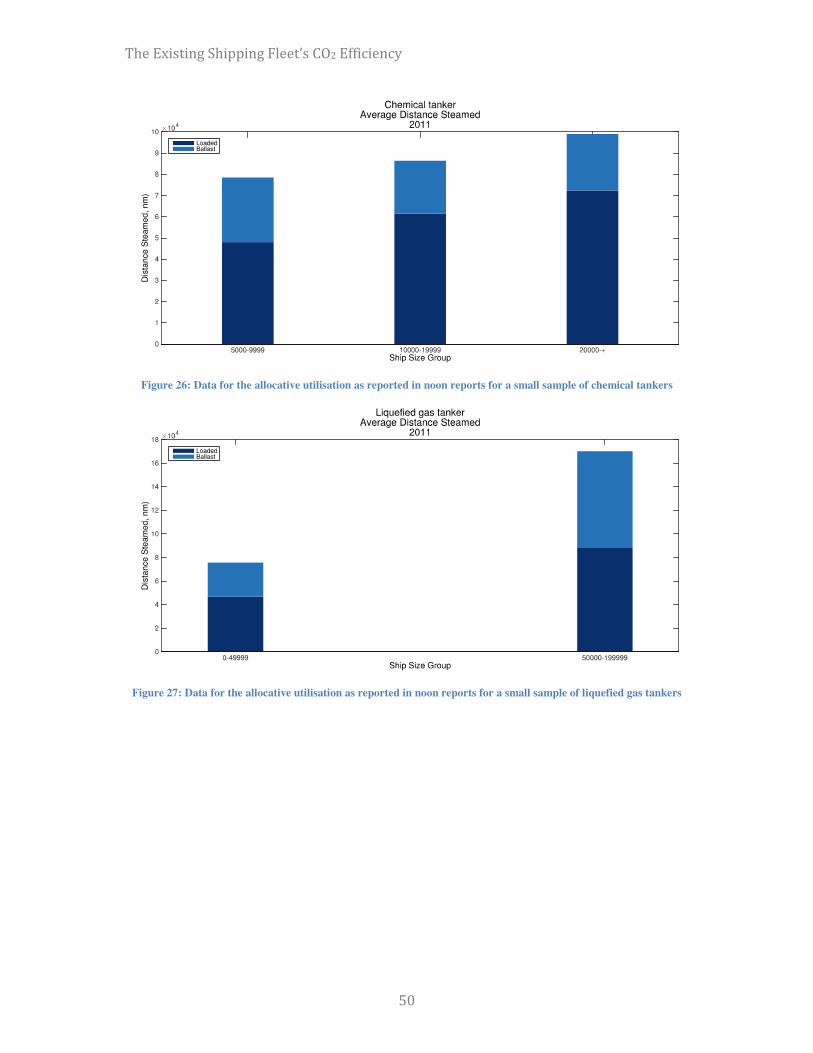
Figure 26: Data for the allocative utilisation as reported in noon reports for a small sample of chemical tankers
Figure 27: Data for the allocative utilisation as reported in noon reports for a small sample of liquefied gas tankers

• • •
o o
• •
o o
•
• •
•
•
Table 13: Variables that influence the emission intensity of transporting freight (Source: using data as described in Section 5.3 or as indicated by footnotes)
•
• •
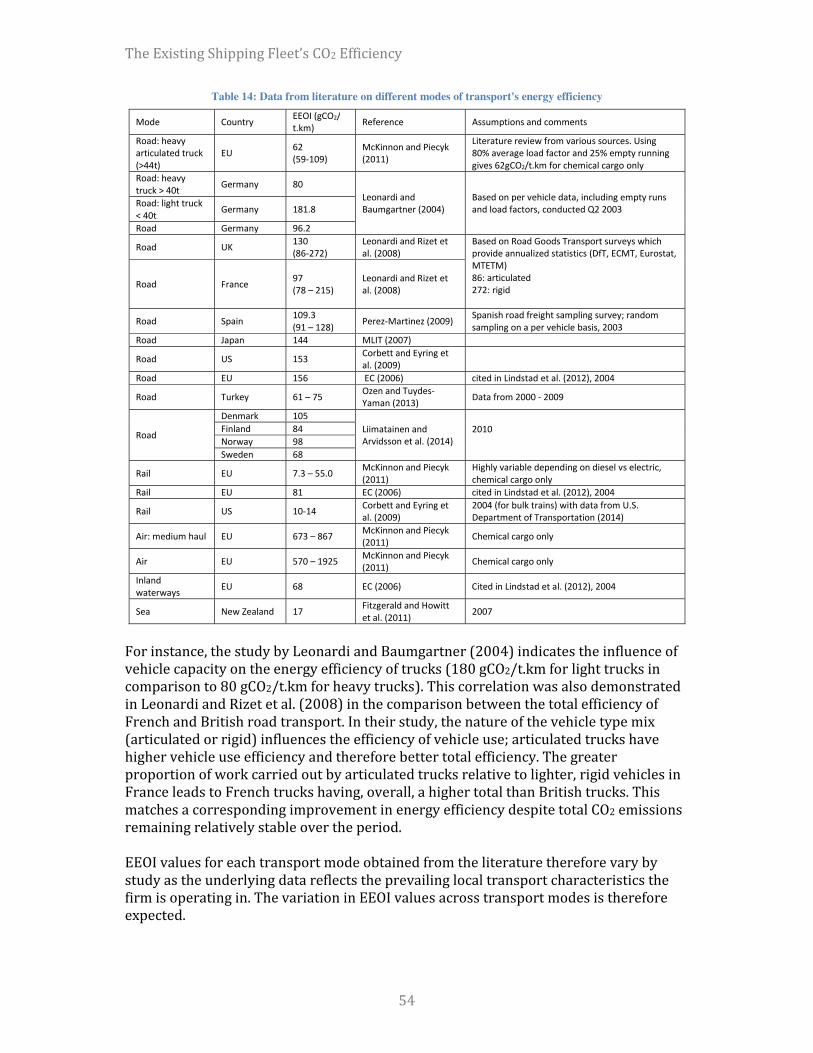
Table 14: Data from literature on different modes of transport's energy efficiency
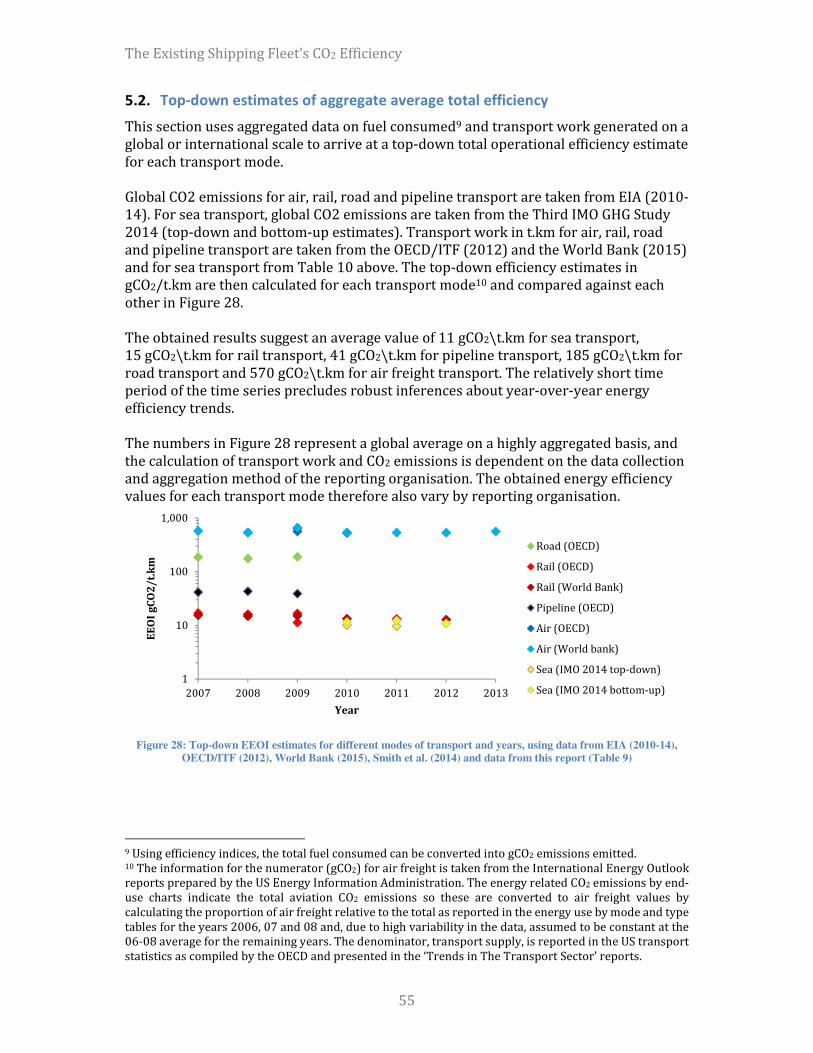
Figure 28: Top-down EEOI estimates for different modes of transport and years, using data from EIA (2010-14), OECD/ITF (2012), World Bank (2015), Smith et al. (2014) and data from this report (Table 9)
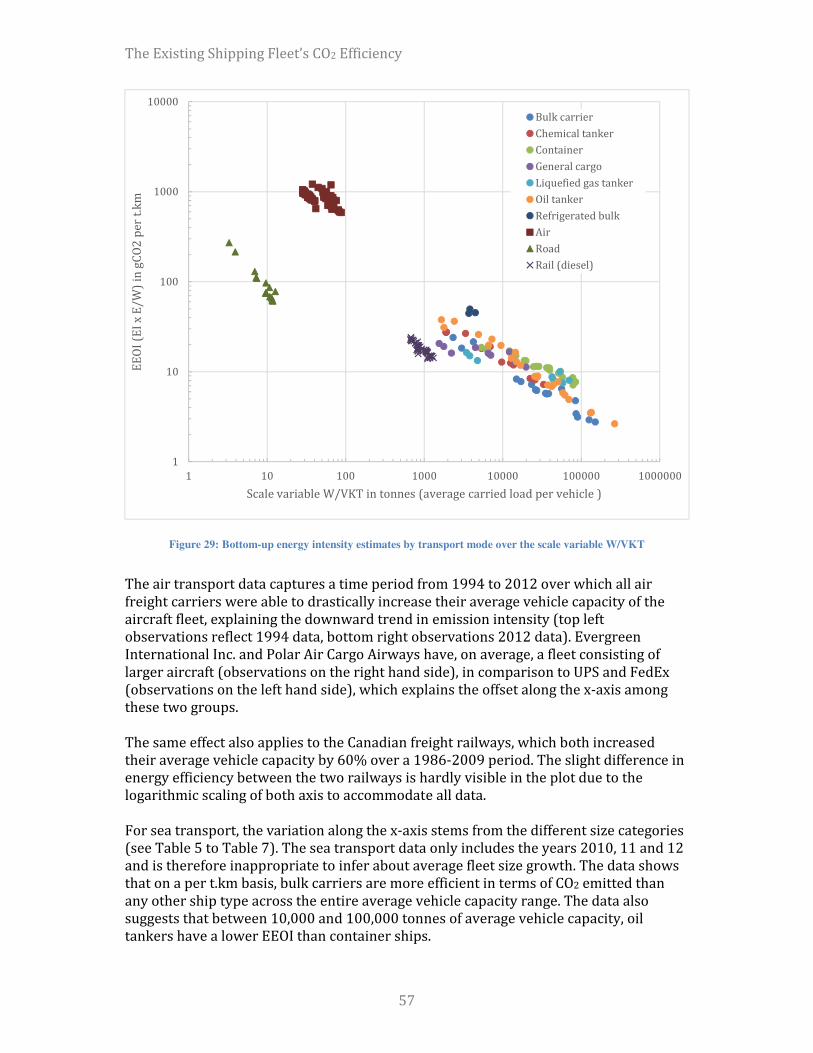
Figure 29: Bottom-up energy intensity estimates by transport mode over the scale variable W/VKT


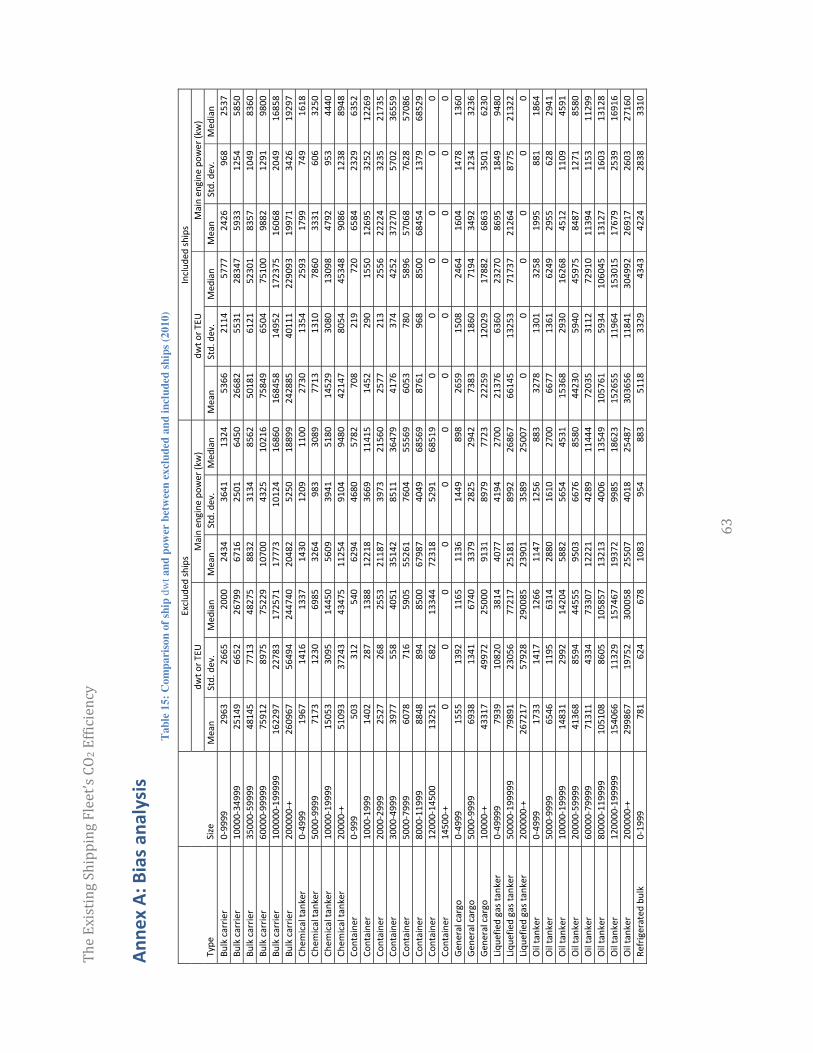
Tab
le 1
5: C
ompa
riso
n of
shi
p dw
t and
pow
er b
etw
een
excl
uded
and
incl
uded
shi
ps (
2010
)
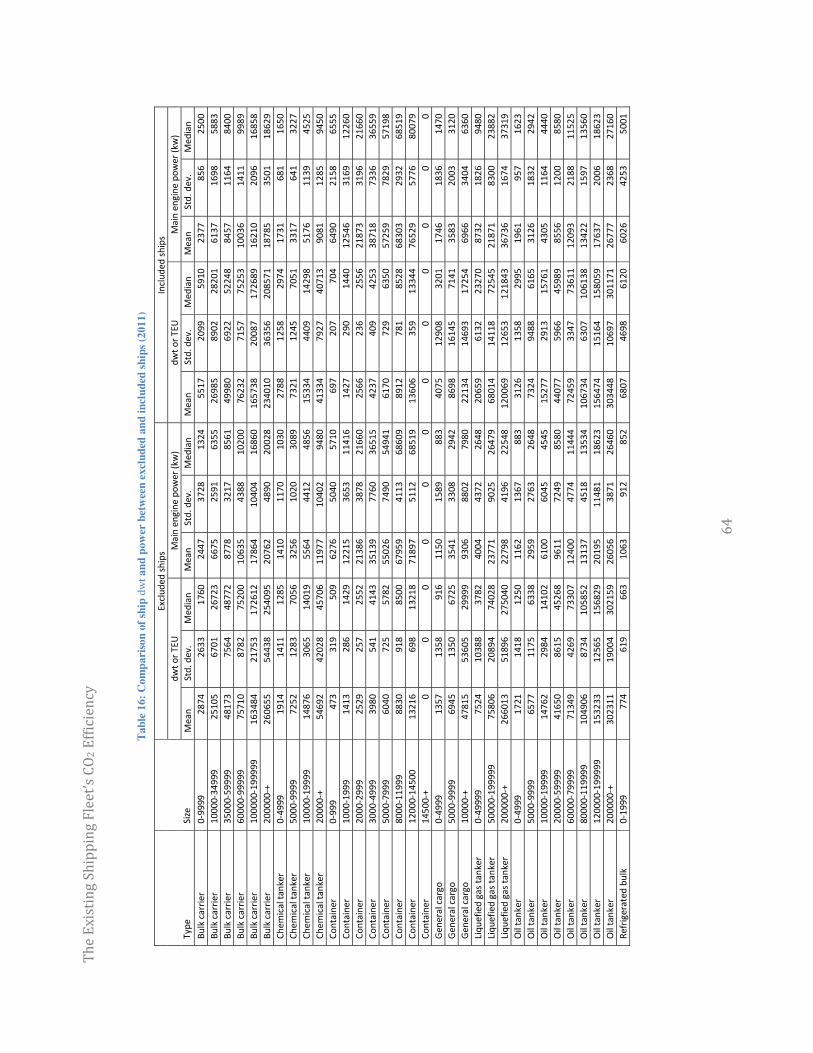
Tab
le 1
6: C
ompa
riso
n of
shi
p dw
t and
pow
er b
etw
een
excl
uded
and
incl
uded
shi
ps (
2011
)
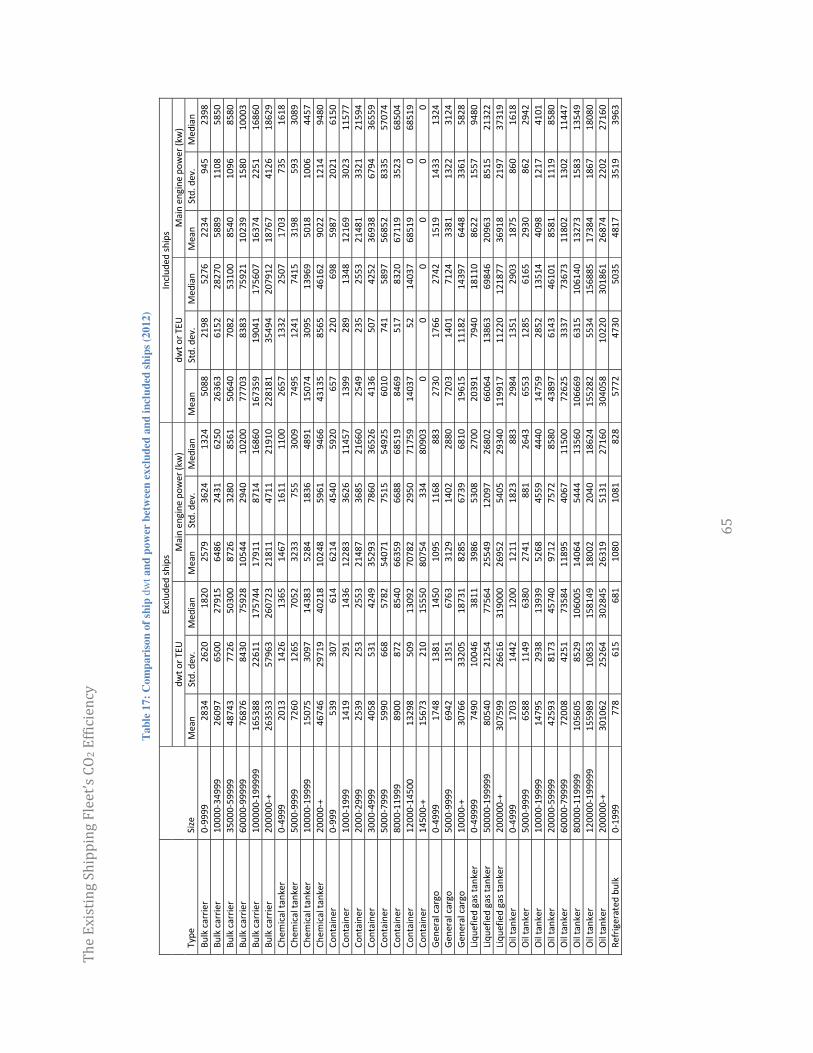
Tab
le 1
7: C
ompa
riso
n of
shi
p dw
t and
pow
er b
etw
een
excl
uded
and
incl
uded
shi
ps (
2012
)


___________