
For Official Use DSTI/CDEP(2016)13/REV1 - OECD
47
For Official Use DSTI/CDEP(2016)13/REV1 Organisation de Coopération et de Développement Économiques Organisation for Economic Co-operation and Development 27-Jan-2017 ___________________________________________________________________________________________ _____________ English - Or. English DIRECTORATE FOR SCIENCE, TECHNOLOGY AND INNOVATION COMMITTEE ON DIGITAL ECONOMY POLICY ENABLING THE NEXT PRODUCTION REVOLUTION (NPR) Chapter 2: Benefits and Challenges of Digitalising Production This chapter examines how new ICT applications –in particular big data analytics, cloud computing and the Internet of Things (IoT) – enable novel production and organisational processes, and business models, mainly in industrial sectors. The chapter focuses on the productivity implications of new ICT applications in early- adopting firms in a number of industries (including automotive and aerospace) but also in traditional sectors such as agriculture. An assessment is provided of policy settings needed to realise the potential productivity and other benefits of digital technologies in production, while mitigating a number of associated risks. The chapter, which was developed under Intermediate Output Result 2.3 of the CDEP PWB for 2015-16, will be published as Chapter 2 of the final OECD report on "Enabling the Next Production revolution (NPR)". This revised chapter includes comments received from delegations by 22 December 2016. As agreed at the CDEP meeting on 16-18 November 2016, the report is now submitted for declassification by written procedure and, if no objections are received, will be deemed declassified by 12 February 2017. Christian Reimsbach-Kounatze, [email protected], +33 1 45 24 16 16 JT03408260 Complete document available on OLIS in its original format This document and any map included herein are without prejudice to the status of or sovereignty over any territory, to the delimitation of international frontiers and boundaries and to the name of any territory, city or area. DSTI/CDEP(2016)13/REV1 For Official Use English - Or. English
-
Upload
khangminh22 -
Category
Documents
-
view
1 -
download
0
Transcript of For Official Use DSTI/CDEP(2016)13/REV1 - OECD
For Official Use DSTI/CDEP(2016)13/REV1 Organisation de Coopération et de Développement Économiques Organisation for Economic Co-operation and Development 27-Jan-2017
___________________________________________________________________________________________
_____________ English - Or. English DIRECTORATE FOR SCIENCE, TECHNOLOGY AND INNOVATION
COMMITTEE ON DIGITAL ECONOMY POLICY
ENABLING THE NEXT PRODUCTION REVOLUTION (NPR)
Chapter 2: Benefits and Challenges of Digitalising Production
This chapter examines how new ICT applications –in particular big data analytics, cloud computing and the
Internet of Things (IoT) – enable novel production and organisational processes, and business models, mainly in
industrial sectors. The chapter focuses on the productivity implications of new ICT applications in early-
adopting firms in a number of industries (including automotive and aerospace) but also in traditional sectors
such as agriculture. An assessment is provided of policy settings needed to realise the potential productivity and
other benefits of digital technologies in production, while mitigating a number of associated risks.
The chapter, which was developed under Intermediate Output Result 2.3 of the CDEP PWB for 2015-16, will be
published as Chapter 2 of the final OECD report on "Enabling the Next Production revolution (NPR)". This
revised chapter includes comments received from delegations by 22 December 2016.
As agreed at the CDEP meeting on 16-18 November 2016, the report is now submitted for declassification by
written procedure and, if no objections are received, will be deemed declassified by 12 February 2017.
Christian Reimsbach-Kounatze, [email protected], +33 1 45 24 16 16
JT03408260
Complete document available on OLIS in its original format
This document and any map included herein are without prejudice to the status of or sovereignty over any territory, to the delimitation of
international frontiers and boundaries and to the name of any territory, city or area.
DS
TI/C
DE
P(2
01
6)1
3/R
EV
1
Fo
r Officia
l Use
En
glish
- Or. E
ng
lish

DSTI/CDEP(2016)13/REV1
2
NOTE BY THE SECRETARIAT
The chapter, which includes comments received from delegations by 22 December 2016, will be
published as Chapter 2 of the final OECD report on “Enabling the Next Production revolution (NPR)”. It
was developed under Intermediate Output Result 2.3 of the CDEP PWB for 2015-16 and built on earlier
work released by the CDEP, including in particular:
OECD (2015b), Data-Driven Innovation: Big Data for Growth and Well-Being, OECD
Publishing, Paris. DOI: http://dx.doi.org/10.1787/9789264229358-en.
OECD (2016a), “The Internet of Things: Seizing the Benefits and Addressing the Challenges”,
OECD Digital Economy Papers, No. 252, OECD Publishing, Paris. DOI:
http://dx.doi.org/10.1787/5jlwvzz8td0n-en
OECD (2016b), “Stimulating digital innovation for growth and inclusiveness: The role of policies
for the successful diffusion of ICT”, OECD Digital Economy Papers, No. 256, OECD Publishing,
Paris. DOI: http://dx.doi.org/10.1787/5jlwqvhg3l31-en
The document should be read in conjunction with the following documents, the last two of which
include earlier versions of this chapter:
Enabling The Next Production Revolution – A Project Update [DSTI/STP(2015)12]
The Next Production Revolution – An Interim Project Report [DSTI/IND/STP/ICCP(2016)1]
Enabling the Next Production Revolution: The Future of Manufacturing and Services – Interim
Report [C/MIN(2016)5]
Action requested:
As agreed at the CDEP meeting on 16-18 November 2016, the report is now submitted for
declassification by written procedure and, if no objections are received, will be deemed
declassified by 12 February 2017. A track-change version of the report is available on the CDEP
Clearspace.
DSTI/CDEP(2016)13/REV1
3
ENABLING THE NEXT PRODUCTION REVOLUTION
CHAPTER 2: BENEFITS AND CHALLENGES OF DIGITALISING PRODUCTION
This chapter examines how new ICT applications – in particular big data analytics, cloud computing and the Internet of Things (IoT) – enable novel production and organisational processes, and business models, mainly in industrial sectors. The chapter focuses on the productivity implications of new ICT applications in early-adopting firms in a number of industries (including automotive and aerospace) but also in traditional sectors such as agriculture. An assessment is provided of policy settings needed to realise the potential productivity and other benefits of digital technologies in production, while mitigating a number of associated risks.
DSTI/CDEP(2016)13/REV1
4
Introduction
1. Digitalisation of the economy and society is progressing rapidly, especially in developed
countries. Today, three out of four inhabitants in the OECD area have access to mobile wireless broadband,
and up to 95% of all businesses are connected to the Internet. Three quarters of businesses have an online
presence and almost as many engage in e-commerce (OECD, 2015a; 2015b).
2. Industrial production is undergoing a transformation driven by the conjunction of the increasing
interconnection of machines, inventories and goods delivered via the Internet of Things (IoT), the
capabilities of software embedded in machines, analysis of the large volumes of digital data (“big data”)
generated by sensors, and the ubiquitous availability of computing power via cloud computing. The
resulting transformation has been described by some as “Industrie 4.0” (Jasperneite, 2012), the “Industrial
Internet” (Bruner, 2013), and “network manufacturing” (Economist Intelligence Unit, 2014). The potential
economic benefits of new digital technologies are large. For example, available estimates suggest that the
IoT could contribute USD 10-15 trillion to global GDP over the next 20 years (Evans and Anninziata,
2012).
3. This chapter examines how the conjunction of new digital technologies – in particular big data
analytics, cloud computing and the IoT - enable more customizable goods and services via new production
and organisational processes, as well as new business models, mainly in industrial sectors. The chapter,
which is based in part on commissioned case study materials, focuses on the productivity implications of
digital technologies in early-adopting firms in a number of industries (including automotive and aerospace)
as well as in traditional sectors such as agriculture. The chapter discusses steps that can also be taken by
traditional firms to successfully transition to digital business models.
4. Policy suggestions are described which address the main challenges in digitalising industrial
production, including: expanding access to data and critical ICT infrastructures and applications;
improving interoperability and supporting the development of standards; using existing frameworks – and
where necessary refining these – to reduce a range of emerging uncertainties (related for instance to
liability in the context of automation and ownership in an environment where intangible assets such as data
can be critical to value creation); reducing risks in connection with digital security and privacy; and
fostering competition in new digital contexts. Underpinning all of the above, the chapter likewise points to
the need to develop the skills required for the next production revolution.
Adopting advanced ICTs in production
5. In manufacturing and agriculture, information and communication technologies (ICTs) are
transforming production, as businesses are using advanced ICTs such as enterprise resource planning
(ERP) and supply chain management (SCM) software to significantly raise productivity.1 And the use of
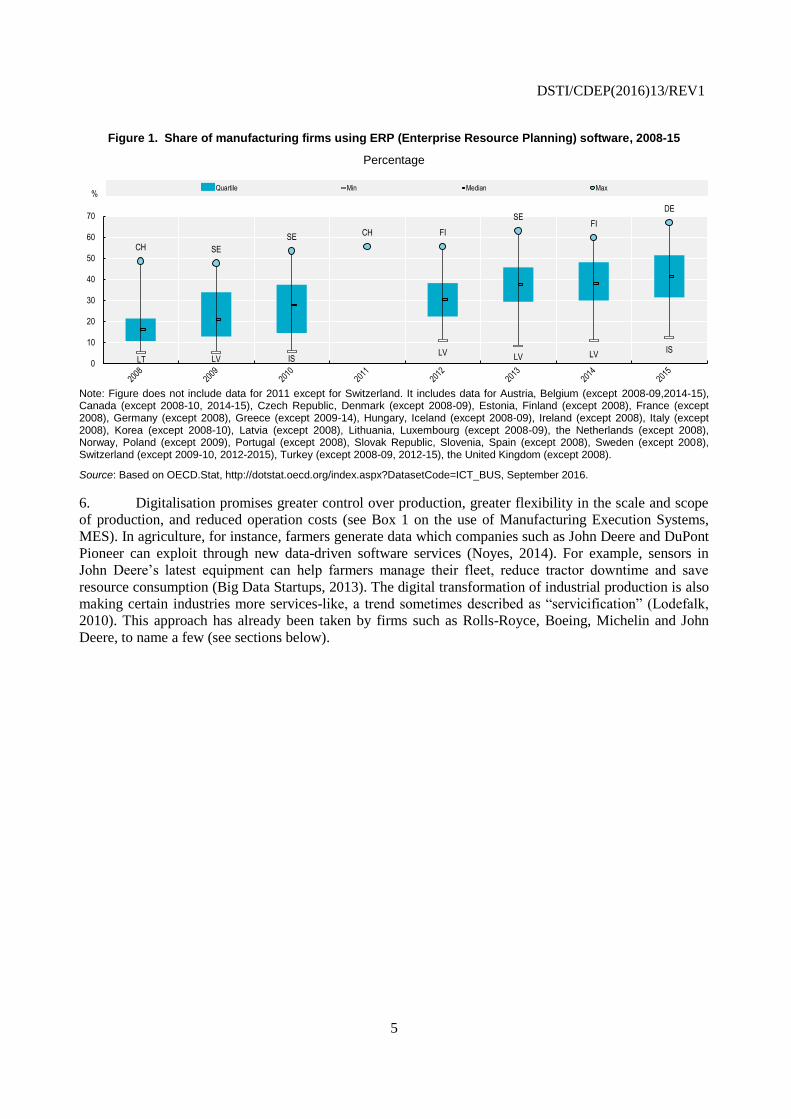
such software is growing rapidly. In 2015, for instance, in the Netherlands, Finland and Sweden, more than
60% of all manufacturing firms used ERP software. By comparison, in 2009, only around 40% of
manufacturing firms used ERP software in the Netherlands and Finland, and 50% did so in Sweden. And in
Germany, already 70% of manufacturers used ERP software in 2015, compared with some 40% in 2009
(Figure 1). In contrast, only 40% of all businesses in these respective countries used ERP software; with
the exception of Germany, where the share was 56% in 2015.
DSTI/CDEP(2016)13/REV1
5
Figure 1. Share of manufacturing firms using ERP (Enterprise Resource Planning) software, 2008-15
Percentage
Note: Figure does not include data for 2011 except for Switzerland. It includes data for Austria, Belgium (except 2008-09,2014-15), Canada (except 2008-10, 2014-15), Czech Republic, Denmark (except 2008-09), Estonia, Finland (except 2008), France (except 2008), Germany (except 2008), Greece (except 2009-14), Hungary, Iceland (except 2008-09), Ireland (except 2008), Italy (except 2008), Korea (except 2008-10), Latvia (except 2008), Lithuania, Luxembourg (except 2008-09), the Netherlands (except 2008), Norway, Poland (except 2009), Portugal (except 2008), Slovak Republic, Slovenia, Spain (except 2008), Sweden (except 2008), Switzerland (except 2009-10, 2012-2015), Turkey (except 2008-09, 2012-15), the United Kingdom (except 2008).
Source: Based on OECD.Stat, http://dotstat.oecd.org/index.aspx?DatasetCode=ICT_BUS, September 2016.
6. Digitalisation promises greater control over production, greater flexibility in the scale and scope
of production, and reduced operation costs (see Box 1 on the use of Manufacturing Execution Systems,
MES). In agriculture, for instance, farmers generate data which companies such as John Deere and DuPont
Pioneer can exploit through new data-driven software services (Noyes, 2014). For example, sensors in
John Deere’s latest equipment can help farmers manage their fleet, reduce tractor downtime and save
resource consumption (Big Data Startups, 2013). The digital transformation of industrial production is also
making certain industries more services-like, a trend sometimes described as “servicification” (Lodefalk,
2010). This approach has already been taken by firms such as Rolls-Royce, Boeing, Michelin and John
Deere, to name a few (see sections below).
LT LV ISLV
LV LVIS
CH SE
SECH FI
SEFI
DE
0
10
20
30
40
50
60
70
%Quartile Min Median Max
DSTI/CDEP(2016)13/REV1
6
Box 1. The potential of Manufacturing Execution Systems (MESs): the case of MPDV Mikrolab GmbH
The enormous competitive pressure under which manufacturing companies stand will continue to grow with the ongoing digitalisation of industrial production. Manufacturing firms must be able to react more flexibly and quickly to unexpected changes in order to use all resources as efficiently as possible. These requirements drive companies to use advanced ICTs - not least to master the ever-growing complexity resulting from increasing product diversity and ever-shorter product life cycles and to provide reliable information, ideally in real-time, to make better short and long-term decisions.
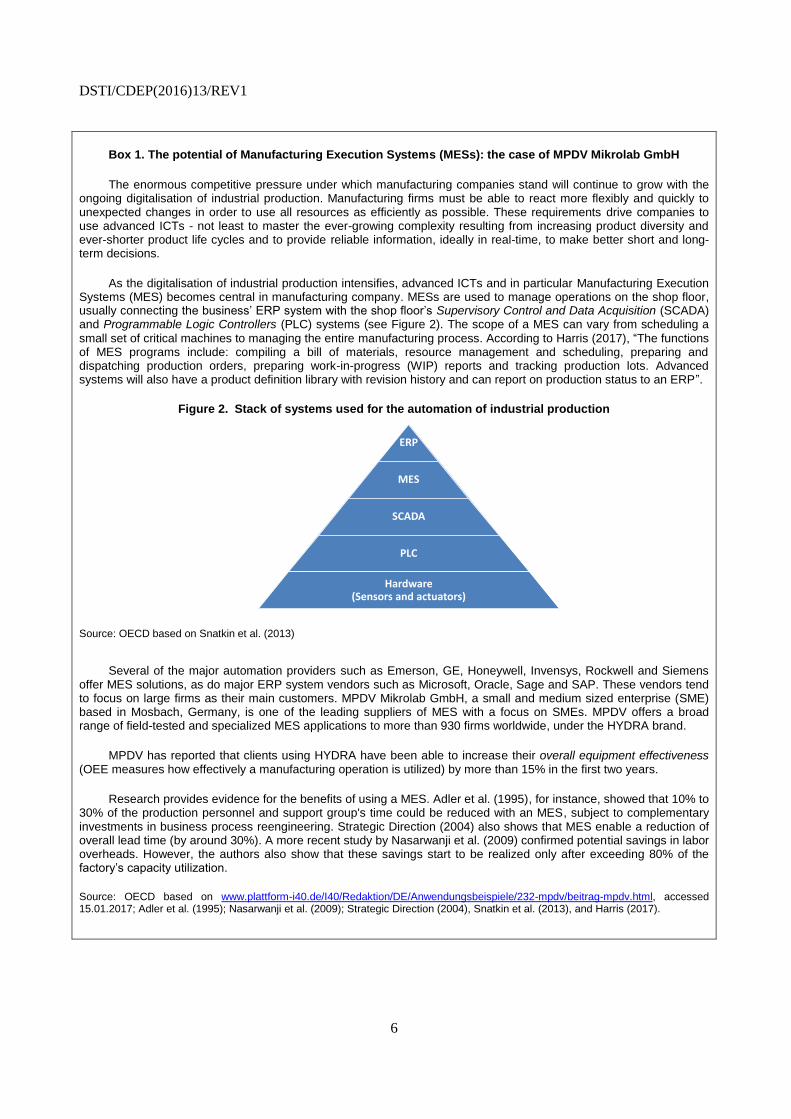
As the digitalisation of industrial production intensifies, advanced ICTs and in particular Manufacturing Execution Systems (MES) becomes central in manufacturing company. MESs are used to manage operations on the shop floor, usually connecting the business’ ERP system with the shop floor’s Supervisory Control and Data Acquisition (SCADA) and Programmable Logic Controllers (PLC) systems (see Figure 2). The scope of a MES can vary from scheduling a
small set of critical machines to managing the entire manufacturing process. According to Harris (2017), “The functions of MES programs include: compiling a bill of materials, resource management and scheduling, preparing and dispatching production orders, preparing work-in-progress (WIP) reports and tracking production lots. Advanced systems will also have a product definition library with revision history and can report on production status to an ERP”.
Figure 2. Stack of systems used for the automation of industrial production
Source: OECD based on Snatkin et al. (2013)
Several of the major automation providers such as Emerson, GE, Honeywell, Invensys, Rockwell and Siemens offer MES solutions, as do major ERP system vendors such as Microsoft, Oracle, Sage and SAP. These vendors tend to focus on large firms as their main customers. MPDV Mikrolab GmbH, a small and medium sized enterprise (SME) based in Mosbach, Germany, is one of the leading suppliers of MES with a focus on SMEs. MPDV offers a broad range of field-tested and specialized MES applications to more than 930 firms worldwide, under the HYDRA brand.
MPDV has reported that clients using HYDRA have been able to increase their overall equipment effectiveness (OEE measures how effectively a manufacturing operation is utilized) by more than 15% in the first two years.
Research provides evidence for the benefits of using a MES. Adler et al. (1995), for instance, showed that 10% to 30% of the production personnel and support group's time could be reduced with an MES, subject to complementary investments in business process reengineering. Strategic Direction (2004) also shows that MES enable a reduction of overall lead time (by around 30%). A more recent study by Nasarwanji et al. (2009) confirmed potential savings in labor overheads. However, the authors also show that these savings start to be realized only after exceeding 80% of the factory’s capacity utilization.
Source: OECD based on www.plattform-i40.de/I40/Redaktion/DE/Anwendungsbeispiele/232-mpdv/beitrag-mpdv.html, accessed 15.01.2017; Adler et al. (1995); Nasarwanji et al. (2009); Strategic Direction (2004), Snatkin et al. (2013), and Harris (2017).
ERP
MES
SCADA
PLC
Hardware (Sensors and actuators)
DSTI/CDEP(2016)13/REV1
7
7. Today the IoT allows manufacturing companies to better monitor the use of their products and
thus to provide customised pay-as-you-go services priced using real-time operational data. Rolls Royce, for
instance, was a pioneer of this approach, when in the 1980s it stopped selling its jet engines alone, and
began selling “power by the hour” – a fixed-cost service package over a fixed term (Binns, 2014).2 Data is
now also used to monitor and analyse the efficiency of products and is increasingly commercialised as part
of new services for existing and potential suppliers and customers. Germany-based Schmitz Cargobull, the
world’s largest truck body and trailer manufacturer, also uses the IoT to monitor the maintenance,
travelling conditions and routes of all its trailers (Chick, Netessine and Huchzermeier, 2014). This helps
Schmitz Cargobull’s customers minimise usage breakdowns. Energy production equipment manufacturers,
as another example, increasingly use sensor data to help their customers optimise contingencies in complex
project planning activities (Chick, Netessine and Huchzermeier, 2014).
8. Quantitative evidence on the economic impact of the digital transformation of industry is limited.
But estimates from Japan suggest that the use of big data and analytics in some divisions of Japanese
manufacturers could lower maintenance costs by almost JPY 5 trillion (corresponding to more than 15% of
sales in 2010). More than JPY 50 billion could also be gained in electricity savings (MIC, 2013). Estimates
for Germany indicate that the use of advanced ICTs in industry could boost productivity by 5% to 8%.
Industrial component manufacturers and automotive companies are expected to achieve the biggest
productivity improvements (Rüßmann et al., 2015). Other estimates suggest that “Industrie 4.0” could
boost value added in Germany’s mechanical, electrical, automotive, chemical, agriculture and ICT sectors
by additional EUR 78 billion (or 15%) by 2025 (BITKOM and Fraunhofer, 2014).3
The confluence of digital technologies drives the transformation of industrial production
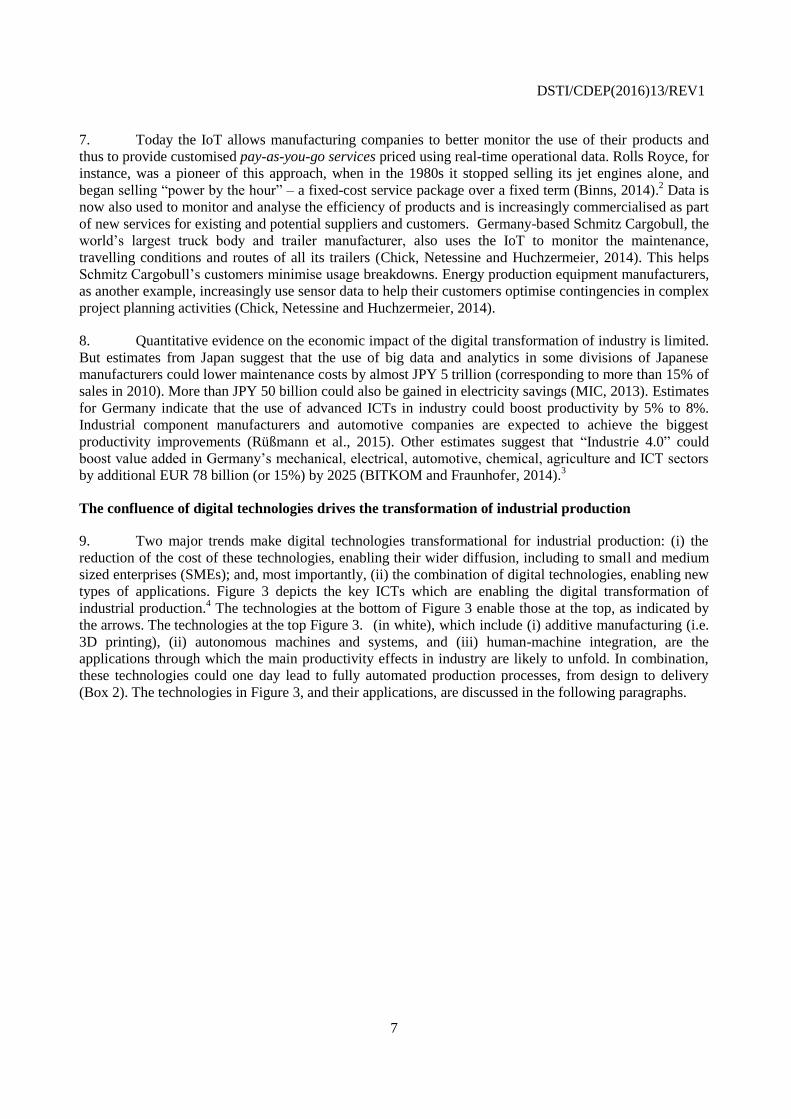
9. Two major trends make digital technologies transformational for industrial production: (i) the
reduction of the cost of these technologies, enabling their wider diffusion, including to small and medium
sized enterprises (SMEs); and, most importantly, (ii) the combination of digital technologies, enabling new
types of applications. Figure 3 depicts the key ICTs which are enabling the digital transformation of
industrial production.4 The technologies at the bottom of Figure 3 enable those at the top, as indicated by
the arrows. The technologies at the top Figure 3. (in white), which include (i) additive manufacturing (i.e.
3D printing), (ii) autonomous machines and systems, and (iii) human-machine integration, are the
applications through which the main productivity effects in industry are likely to unfold. In combination,
these technologies could one day lead to fully automated production processes, from design to delivery
(Box 2). The technologies in Figure 3, and their applications, are discussed in the following paragraphs.
DSTI/CDEP(2016)13/REV1
8
Figure 3. The confluence of key technologies enabling the industrial digital transformation
Box 2. A possible manufacturing process in 2025
In a near future, possibly as early as 2025, manufacturing could become an almost completely autonomous activity. Present-day capabilities suggest that the following hypothetical scenario could be feasible:
A group of designers have created a new device. They show 3D-printed prototypes to potential buyers and, as a result, receive a contract from an overseas retailer. The design, packaging and component list is uploaded to an online marketplace where manufacturers compete for the contracts to create the parts and assemble the device. One contractor wins the contract to assemble the device. This contractor uses cloud-based computer-aided design tools to simulate the design and manufacturing of the device. Machine learning algorithms test which combination of robots and tools is the most efficient in assembling the device. Some components, such as systems-on-a-chip and sensors, can be sourced from existing manufacturers. Others might have to be specifically created. Robotic devices execute mass production of the components.
All the components and the associated data are then sent to the assembly facility. On the assembly line, the robots in the line retool and arrange themselves. Robotic vehicles move the components across the floor to the correct robot workstations and the robots start to assemble the devices. Every time the robots assemble a device, machine learning algorithms in the cloud analyse the data and compare these to the simulations, re-simulating and establishing whether the process still fits the parameters and whether the process can be optimised. The finished product is boxed by a robot, and the box loaded by another robot on a self-driving truck, which takes it to the retailer.
At the retailer, robots unload the truck and place the product in the correct warehouse storage location. When the product is ordered, a smaller delivery robot transports it to customer’s front-door. If sales of the product exceed expectations and orders increase from around the world, the designers might need more production capacity. They again turn to the market, with manufacturers in the regions where the product has been ordered competing to produce larger or smaller batches of the product. The results of the earlier machine learning algorithms are communicated to the successful factories around the world, where different robots assess how to manufacture the product. When a factory is finished producing its order, the robots re-organise and retool for a different product. From the moment the design is finalized, until the product arrives to the customer, no worker has been employed to manufacture the device. Employees monitored the process. However, neither in the plastics molding nor the assembly nor the logistics were humans necessary.
Autonomous machines and
systems
Artificial Intelligence
Cloud computing
Human-Machine
integration
System integration
Internet of Things
Big data
Simulations
Additive manufacturing(3D printing)
DSTI/CDEP(2016)13/REV1
9
Big data analytics are transforming all sectors of the economy including traditional sectors
10. The term ‘big data’ refers to data characterised by their volume, velocity (the speed at which they
are generated, accessed, processed and analysed), variety (such as unstructured and structured data).
However, volume, velocity and variety (the three Vs highlighted as the characteristic of big data) are in
continuous flux, as they describe technical properties that evolve with the state of the art in data storage
and processing. Others have also suggested a fourth V, Value, which is related to the increasing social and
economic value of data (OECD 2013).
11. The use of big data promises to significantly improve products, processes, organisational
methods and markets, a phenomenon referred to as data-driven innovation (DDI) (OECD, 2015b). In
manufacturing, data obtained through sensors are used to monitor and analyse the efficiency of machines
to optimise their operations and to provide after-sale services, including preventive maintenance. The data
are sometimes also used to work with suppliers, and are, in some cases, even commercialised in the form
of new services (for example, to optimise production control). In agriculture, geo-coded maps of fields and
real-time monitoring of every agricultural activity, from seeding to harvesting, are used to raise agricultural
productivity. The same sensor data can then be reused and linked with historical and real-time data on
weather patterns, soil conditions, fertiliser usage and crop features, to optimise and predict agricultural
production. Traditional cultivation methods can be improved and the know-how of skilled farmers
formalised and made widely available.
12. There is still little macro-economic evidence on the effects of DDI, but available firm-level
studies suggest that using DDI raises labour productivity faster than in non-using firms by approximately
5-10% (OECD, 2015b). In the United States, Brynjolfsson, Hitt and Kim (2011) estimate that output and
productivity in firms that adopt data-driven decision making are 5% to 6% higher than what would be
expected given their other investments in, and use of, ICTs. These firms also perform better in terms of
asset utilisation, return on equity and market value. A study of 500 firms in the United Kingdom found that
firms in the top quartile of online data use are 13% more productive than those in the bottom quartile
(Bakhshi, Bravo-Biosca and Mateos-Garcia, 2014). And Barua et al. (2013) suggest that improving data
quality and access by 10% - presenting data more concisely and consistently across platforms and allowing
it to be more easily manipulated - would increase labour productivity by 14% on average, but with
significant cross-industry variations.5 Nevertheless, big data is still mainly used in the ICT sector,
particularly in Internet services firms. According to Tambe (2014), for example, only 30% of Hadoop
investments come from non-ICT sectors, including, in particular, in finance, transportation, utilities, retail,
health care, pharmaceuticals and biotechnology firms. But manufacturing is becoming increasingly data-
intensive (see MGI, 2011).
13. In agriculture, the use of data and analytics (i.e. precision agriculture) provides productivity gains
by optimising the use of agriculture related resources. These include, but are not limited to, savings on
seed, fertilizer and irrigation as well as farmers’ savings in time (see Box 3). Depending on the savings
considered, estimates of the productivity effect vary. One estimate, for instance, suggests that in farming
corn in the United States, precision agriculture could improve yields by five to ten bushels per acre,
increasing profit by around USD 100 per acre (at a time when gross revenue minus non-land costs stood at
about USD 350 per acre) (Noyes, 2014). Extrapolating, one could estimate economic benefits for the
United States from precision agriculture to be around USD 12 billion annually. This represents about 7%
of the total value added of USD 177 billion contributed by farms to the GDP of the United States.6 When
excluding farmers’ savings in time, more modest benefits per acre from precision farming have been
estimated. Schimmelpfennig and Ebel (2016), for instance, presented an estimate of increased profits of
USD 14.50 per acre. A similar study by Prof. Craig Smith of Fort Hays State University, Kansas, focused
on the same sources of increased efficiency from precision agriculture for different size farms.7 This work
focused on precision agriculture’s “automatic row and section control, which uses GPS to prevent excess
DSTI/CDEP(2016)13/REV1
10
application of crop inputs, such as fertilizer and crop protection chemicals.” (John Deere, 2015). Farmers’
cost savings for the corn fields, similar to the large-row-crop farms, evaluated above, were from USD 1 to
USD 15 an acre.
Box 3. Precision agriculture with big data: the case of John Deere
Precision agriculture provides farmers with near real time analysis of key data about their fields. John Deere entered this business, initially with yield mapping and simple variable rate controls, and later with automated guidance technology (AutoTrac™
8). Those early products have since been enhanced by creating automated farm
vehicles that communicate with each other. From the beginning, John Deere built on GPS location data. It then developed initial “wired” capabilities to connect farm machines to each other and to the MyJohnDeere (MJD) Operations Center, which is described by the company as “a set of on-line tools that provides information about a farm, when and where farmers need it.” (Arthur, 2016)
To support vehicles in the field, John Deere developed remote wireless management for farm equipment. It used inter-connected satellite and cellular ground-based communications networks, proprietary radio and Wi-Fi. This helped Deere reduce the time to harvest crops or complete other tasks. For example, its self-propelled, programmable vehicles could plant or harvest about 500 to 600 acres a day when used in groups of two or more vehicles, rather than the usual 100 to 150 acres that a single farmer can do alone. One enhancement Deere introduced for planting was to use its Exact-Emerge planter and AutoTrac to expand the number of acres that could be planted under optimal conditions. With the enhanced planter and tracking system, the number of acres planted could increase from 600 to more than 800 a day. For harvesting, operations would also be much more efficient if the vehicles used incorporated AutoTrac.
Utilizing a combination of sensors and GPS, Deere’s tractors not only drive themselves, they also utilize analytic systems. These systems permit vehicles to do planting, watering and harvesting with accuracies to 2 centimeters (cm). These systems can also communicate with each other. Deere has estimated that it has more than 100 000 connected machines around the world. Tractor cabs also offer Wi-Fi communication with mobile and other on-board sensor systems, as well as other radios for mobile communications with other vehicles. This helps farmers synchronize operations and share data with other farmers.
Using the interconnected devices and smart sensors in this communications network, John Deere combined basic and performance data from its machines with in-field, geo-referenced data to enhance data analytics. Once systems capture these combined data and sent them to Deere’s Ops Center, they are incorporated into a more extensive database that also includes environmental information. Deere can combine information from the farmer with “statistics about all of the environmental conditions that would be helpful to a farmer, such as sun, soil, slope and rainfall data, as well as data on real yields.”
9 This helps farmers identify the sections of their land that are more
productive. John Deere's use of data analytics helps farmers optimize crop yield, because “farmers can use the data to decide what and where each piece of equipment will plant, fertilize, spray and harvest […] for an area as small as one by three meters.” (Jahangir Mohammed, 2014)
In 2011, John Deere cemented its long-term strategy to focus on integrated data-driven products. The new focus also emphasized an increase in research and development (R&D) investments to 5.5 percent of net sales, compared to its competitors’ R&D investments of 4-5 percent. The focus on innovation helped Deere continue the 5 percent compound annual growth rate for employee productivity (measured by sales per employee) achieved over the past 30 years (Deere & Company, 2016). To buttress its capabilities in this area, John Deere also acquired a number of companies that have pioneered precision agriculture, such as Precision Planting (Agweb, 2015), a leading planting technology firm that also supplies hardware and sensors, and Monosem, a France-based planter equipment manufacturer. John Deere is also hiring data scientists to improve its ability to analyze big data. These professionals will: i) identify relevant data, sources and applications; ii) utilize big data mining techniques such as pattern detection, graph analysis, and statistical analyses to “discover hidden insights;”
10iii) implement collection processes as well as
develop infrastructure and frameworks to support analyses; and, iv) use parallel computation languages to implement applications.
Substantial market growth is forecast for John Deere and similar firms offering farmers self-propelled vehicles and precision agriculture systems. Such forecasts predict that the global precision farming market will expand by USD 4.92 billion by 2020. This represents a compound annual growth rate (CAGR) of almost 12% between 2015 and 2020. At the present time, precision farming globally represents a USD 2.8 billion market (Mordor Intelligence, 2016). The US market accounts for roughly USD 1 to 1.2 billion of these sales annually. Using estimates for the large-row-crop farms, corn and soybean farms, where about two-thirds of acreage is subject to precision agriculture, it is conservatively estimated that John Deere’s sales of precision agriculture are about one-quarter of the US market total, or USD 250 million to USD 350 million.
11
DSTI/CDEP(2016)13/REV1
11
Cloud computing enhances the agility, scalability, and interoperability of businesses
14. Cloud computing allows computing resources to be accessed in a flexible on-demand way with
low management effort (OECD, 2014).12
Many high-potential industrial applications, such as autonomous
machines and systems, and complex simulation, are very computationally intensive and therefore require
supercomputers. Cloud computing has played a significant role in increasing the availability and capacity,
and lowering the cost, of highly scalable computing resources, in particular for start-ups and SMEs. This is
because cloud computing services can be easily scaled up or down, be used on-demand, and paid for either
per user or by capacity used. Cloud computing services can take the form of software (Software-as-a-
Service) or be extended to platforms (Platform-as-a-Service) or infrastructure (Infrastructure-as-a-Service),
and may be deployed privately (for exclusive use), publicly (open to the general public), or under a hybrid
format (a mix of the two former arrangements).
15. Businesses mainly adopt cloud computing to i) increase business agility and ii) decrease ICT
investment costs. A survey by the cloud computing technology provider VMware (2011) shows that fifty-
seven per cent of all respondents point to accelerating the execution of projects and improving customer
experience as the most frequent reasons for adopting cloud computing, followed by the ability to rapidly
adapt to market opportunities (56%) and the ability to scale cost (55%). In some countries, such as Austria,
Iceland, the Netherlands and Norway, however, a large majority of businesses still consider that benefits
linked to the reduction of ICT costs are not noticeable, or are limited (OECD, 2015a).
16. In addition, the ubiquity of cloud computing makes it the ideal platform for data sharing across
sites and company boundaries, thereby enabling system integration within organisations (vertical
integration) and between organisations (horizontal integration). Today many businesses compete on how
well they can combine their goods and services. This highlights not only the emerging importance of the
IoT as a platform for integrating physical objects with the Internet (see section below), but also the
importance of the cloud as a platform for service integration. Without a platform that integrates data
collected from aircraft, for instance, a firm such as Boeing would not be able to provide most of its services
today (see Box 4). Boeing would be unable to compete with large players in its industry sector, such as
Airbus, which in fact is making a similar effort, expanding its ability to monitor its aircraft, including the A
380-1000 (Marr, 2015).
17. Within many organisations, silos still exist today, preventing the sharing of data and thereby
creating frictions (cross-organisational) in value chains. According to a survey by the Economist
Intelligence Unit (2012), for instance, almost 60% of companies consider that “organisational silos” are the
biggest impediment to using “big data” for effective decision making. Executives in firms with annual
revenues exceeding USD 10 billion are more likely to cite data silos as a problem (72%) than those in
firms with revenues below USD 500 million (43%).
18. Cloud computing can help to overcome these silos and make organisations more cohesive and
automated by enabling data to be stored and accessed from a common data repository in the “cloud”
(Rüßmann et al., 2015). This requires the interoperability of cloud computing enabled services, for
instance, through accessible application programming interfaces (APIs). However, the lack of appropriate
standards and vendor lock-in due to proprietary solutions can be a barrier to the interoperability of these
services. This makes the lack of appropriate standards and vendor lock-in the most frequently highlighted
barriers to cloud computing adoption besides privacy and security concerns (OECD, 2015a, Chapter 3).
DSTI/CDEP(2016)13/REV1
12
Box 4. System integration via the Cloud: the case of Boeing
Aircraft manufacturers such as Boeing and Airbus face a challenge today as modern commercial aircraft are becoming smart "flying boxes of electronics". These companies need to be able to evaluate and manage systems onboard their aircraft as well as manage electronic controls and monitor physical features, such as wing flaps, in real time. In addition, the manufacturers need to provide support and maintenance information to the airlines that fly their aircraft, making them simple to repair and minimizing time on the ground. To respond to these challenges, aircraft manufacturers integrate their own historical data – data on aircraft performance and maintenance -- with data generated by aircraft and product information from suppliers. To do this, integrated databases are needed to support a wide range of services such as: delivering parts as they are needed (material services); optimizing fleet performance and operations (how entire fleets of different airlines’ planes are managed and operated);
13 giving
access to flight services based upon real-time, in-flight data; and, supporting information services that provide insights into managing any of these services.
Boeing is beginning to provide products that combine a physical good (an aircraft) and digital (data-driven) services. The move to add a series of new services to its product is related to a broader objective to build a capability to manage and control its production and service systems. There are three changes that characterize Boeing’s recent efforts. First, Boeing has employed a combination of big data analytics and the IoT to manage and evaluate its supplier network.
14 Secondly, Boeing has deployed a system of interconnected robots and intelligent
software on the factory floor.15
This complex, interconnected system requires new management skills and also serves as a link to Boeing’s suppliers’ information systems. Thirdly, Boeing has developed software to manage and analyze the many onboard aircraft systems.
By making these changes, Boeing is able to do nearly real-time analysis of sensor information that it receives from planes that are in the air. These analyses support the development of new services for its customers. This is part of Boeing’s move to expand the company’s focus from aircraft to customer services. In its latest model, the Boeing 787, “146,000 data points are continually monitored by on-board systems and automatically transmitted to the ground.” (Boeing, 2013)
The three changes highlighted above required a digital infrastructure to support the exchange and analysis of data. To achieve this, the firm created a service “platform” named Boeing Edge, through which airlines that use Boeing’s planes can access information about the services described above.
In addition, Boeing has put in place a cloud-based computer system, the Digital Aviation Platform, a Platform-as-a-Service (PaaS) that lets application developers build software from components that are hosted on the platform. The interconnection between airlines’ back office systems and the Digital Aviation Platform is enabled by application programming interfaces (APIs). Such back office systems include schedules, billing or “settlements, clearances, record maintenance, regulatory compliance, accounting and IT services. They typically manage information on aircraft maintenance, passengers, and flights (Crabbe, 2013).
Boeing has also created a Database-as-a-Service infrastructure that relies upon Amazon Web Services. This contains over 20 000 databases that describe the parts used throughout planes as well as the instructions for replacing them. These databases are accessible to airlines through a secure connection.
Boeing is also building a Center for Applied Simulation and Analytics (CASA), “to create and develop simulation and analytics technologies” to evaluate the designs and likely performance of both newly conceived and already operating aircraft.
An effect of the enhanced capacity of Boeing to manage and control its systems is its greater power over its suppliers. In 2015, for instance, Boeing influenced mergers of suppliers “by using its power to approve the transfer of its supply contracts from one owner to another. […] Because of such "assignability clauses" that give Boeing the right to deny the transfer of existing contracts to a new firm,” Boeing can “refuse to transfer the contracts to the new owners, giving it a de facto veto over deals.” (Scott, 2015) As data on suppliers’ parts is incorporated into Boeing’s data analytics systems, Boeing can now exercise even greater influence over its engine and parts supplier base as the use of data analytics gives Boeing greater knowledge over its suppliers operations. With this greater information asymmetry comes a significant shift in power away from the suppliers in favour of Boeing.
DSTI/CDEP(2016)13/REV1
13
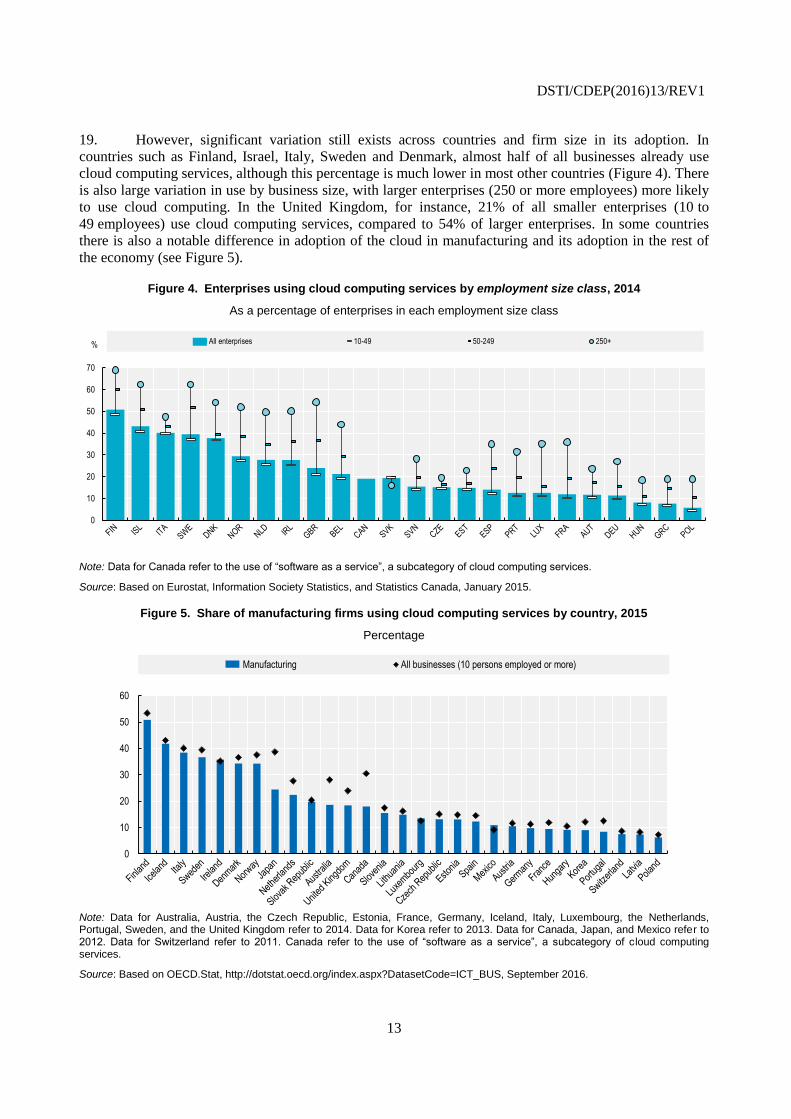
19. However, significant variation still exists across countries and firm size in its adoption. In
countries such as Finland, Israel, Italy, Sweden and Denmark, almost half of all businesses already use
cloud computing services, although this percentage is much lower in most other countries (Figure 4). There
is also large variation in use by business size, with larger enterprises (250 or more employees) more likely
to use cloud computing. In the United Kingdom, for instance, 21% of all smaller enterprises (10 to
49 employees) use cloud computing services, compared to 54% of larger enterprises. In some countries
there is also a notable difference in adoption of the cloud in manufacturing and its adoption in the rest of
the economy (see Figure 5).
Figure 4. Enterprises using cloud computing services by employment size class, 2014
As a percentage of enterprises in each employment size class
Note: Data for Canada refer to the use of “software as a service”, a subcategory of cloud computing services.
Source: Based on Eurostat, Information Society Statistics, and Statistics Canada, January 2015.
Figure 5. Share of manufacturing firms using cloud computing services by country, 2015
Percentage
Note: Data for Australia, Austria, the Czech Republic, Estonia, France, Germany, Iceland, Italy, Luxembourg, the Netherlands, Portugal, Sweden, and the United Kingdom refer to 2014. Data for Korea refer to 2013. Data for Canada, Japan, and Mexico refer to 2012. Data for Switzerland refer to 2011. Canada refer to the use of “software as a service”, a subcategory of c loud computing services.
Source: Based on OECD.Stat, http://dotstat.oecd.org/index.aspx?DatasetCode=ICT_BUS, September 2016.
0
10
20
30
40
50
60
70
% All enterprises 10-49 50-249 250+
0
10
20
30
40
50
60
Manufacturing All businesses (10 persons employed or more)
DSTI/CDEP(2016)13/REV1
14
The Internet of Things (IoT) is a game changer
20. The Internet of Things (IoT) is a term referring to the connection of devices and objects to the
Internet’s network of (public and private) networks. Among the interconnected objects, the IoT also
includes sensors and actuators, which in combination with big data analysis and cloud computing enable
autonomous machines and intelligent systems.
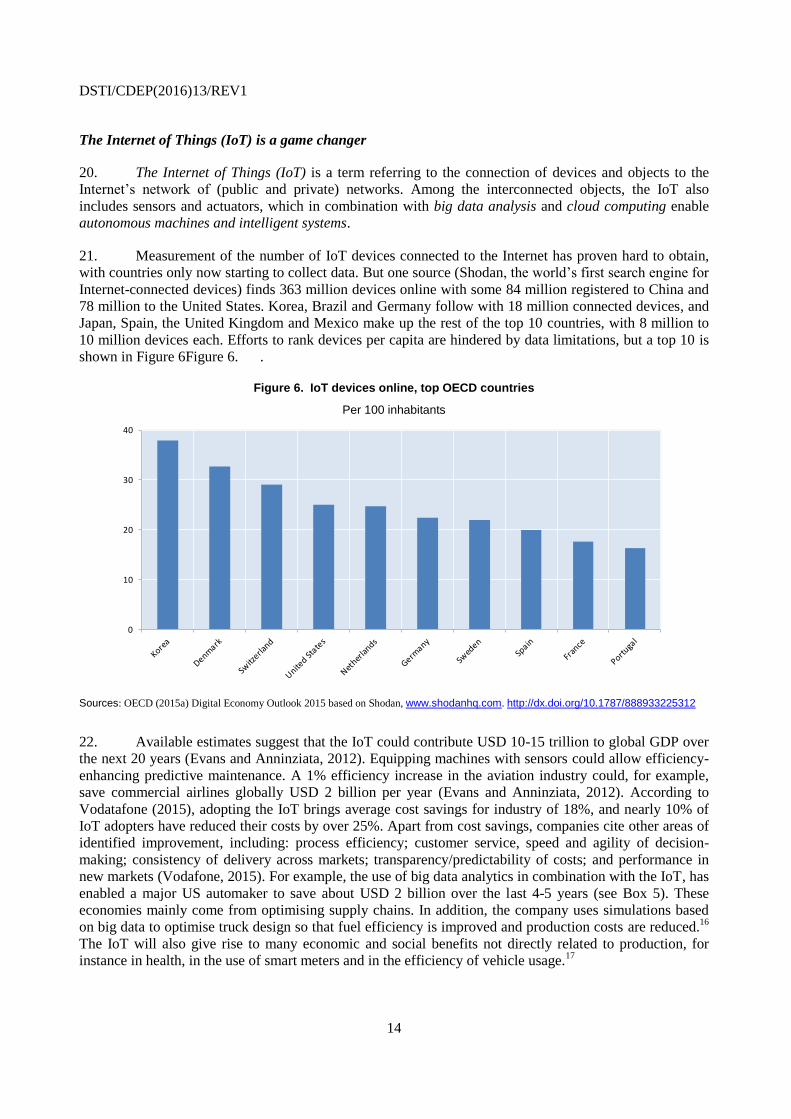
21. Measurement of the number of IoT devices connected to the Internet has proven hard to obtain,
with countries only now starting to collect data. But one source (Shodan, the world’s first search engine for
Internet-connected devices) finds 363 million devices online with some 84 million registered to China and
78 million to the United States. Korea, Brazil and Germany follow with 18 million connected devices, and
Japan, Spain, the United Kingdom and Mexico make up the rest of the top 10 countries, with 8 million to
10 million devices each. Efforts to rank devices per capita are hindered by data limitations, but a top 10 is
shown in Figure 6Figure 6. .
Figure 6. IoT devices online, top OECD countries
Per 100 inhabitants
Sources: OECD (2015a) Digital Economy Outlook 2015 based on Shodan, www.shodanhq.com. http://dx.doi.org/10.1787/888933225312
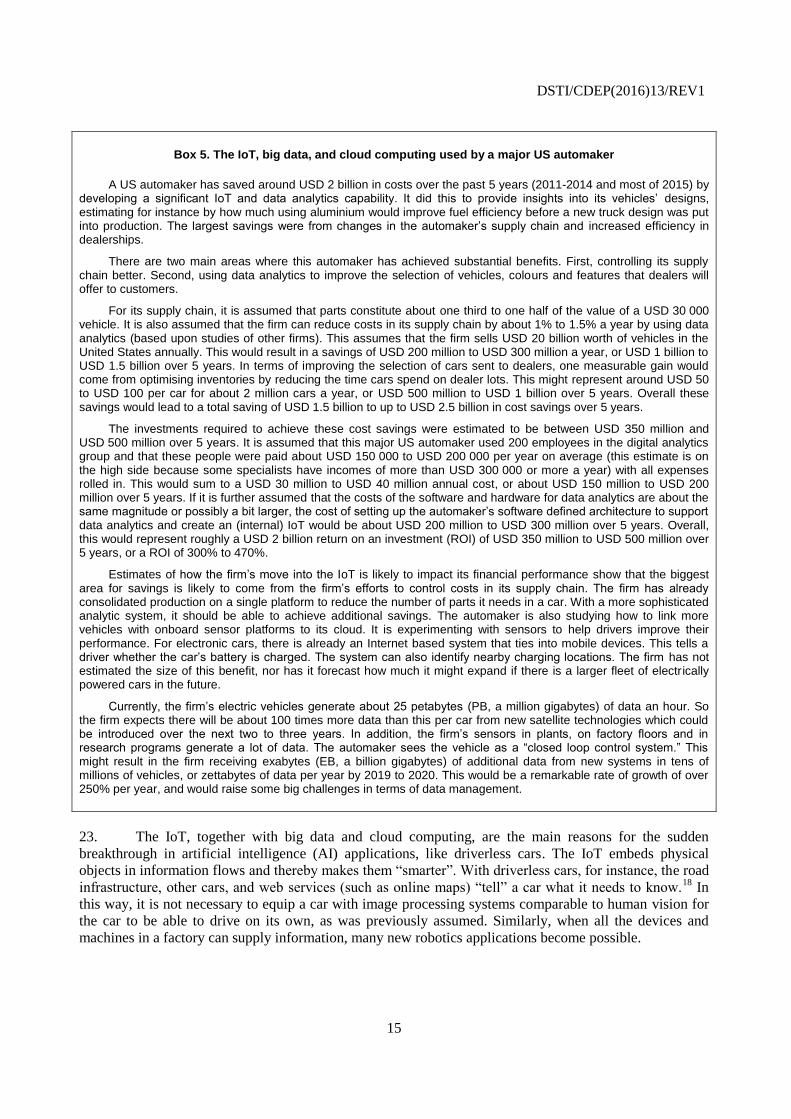
22. Available estimates suggest that the IoT could contribute USD 10-15 trillion to global GDP over
the next 20 years (Evans and Anninziata, 2012). Equipping machines with sensors could allow efficiency-
enhancing predictive maintenance. A 1% efficiency increase in the aviation industry could, for example,
save commercial airlines globally USD 2 billion per year (Evans and Anninziata, 2012). According to
Vodatafone (2015), adopting the IoT brings average cost savings for industry of 18%, and nearly 10% of
IoT adopters have reduced their costs by over 25%. Apart from cost savings, companies cite other areas of
identified improvement, including: process efficiency; customer service, speed and agility of decision-
making; consistency of delivery across markets; transparency/predictability of costs; and performance in
new markets (Vodafone, 2015). For example, the use of big data analytics in combination with the IoT, has
enabled a major US automaker to save about USD 2 billion over the last 4-5 years (see Box 5). These
economies mainly come from optimising supply chains. In addition, the company uses simulations based
on big data to optimise truck design so that fuel efficiency is improved and production costs are reduced.16
The IoT will also give rise to many economic and social benefits not directly related to production, for
instance in health, in the use of smart meters and in the efficiency of vehicle usage.17
0
10
20
30
40Per 100 inhabitants
DSTI/CDEP(2016)13/REV1
15
Box 5. The IoT, big data, and cloud computing used by a major US automaker
A US automaker has saved around USD 2 billion in costs over the past 5 years (2011-2014 and most of 2015) by developing a significant IoT and data analytics capability. It did this to provide insights into its vehicles’ designs, estimating for instance by how much using aluminium would improve fuel efficiency before a new truck design was put into production. The largest savings were from changes in the automaker’s supply chain and increased efficiency in dealerships.
There are two main areas where this automaker has achieved substantial benefits. First, controlling its supply chain better. Second, using data analytics to improve the selection of vehicles, colours and features that dealers will offer to customers.
For its supply chain, it is assumed that parts constitute about one third to one half of the value of a USD 30 000 vehicle. It is also assumed that the firm can reduce costs in its supply chain by about 1% to 1.5% a year by using data analytics (based upon studies of other firms). This assumes that the firm sells USD 20 billion worth of vehicles in the United States annually. This would result in a savings of USD 200 million to USD 300 million a year, or USD 1 billion to USD 1.5 billion over 5 years. In terms of improving the selection of cars sent to dealers, one measurable gain would come from optimising inventories by reducing the time cars spend on dealer lots. This might represent around USD 50 to USD 100 per car for about 2 million cars a year, or USD 500 million to USD 1 billion over 5 years. Overall these savings would lead to a total saving of USD 1.5 billion to up to USD 2.5 billion in cost savings over 5 years.
The investments required to achieve these cost savings were estimated to be between USD 350 million and USD 500 million over 5 years. It is assumed that this major US automaker used 200 employees in the digital analytics group and that these people were paid about USD 150 000 to USD 200 000 per year on average (this estimate is on the high side because some specialists have incomes of more than USD 300 000 or more a year) with all expenses rolled in. This would sum to a USD 30 million to USD 40 million annual cost, or about USD 150 million to USD 200 million over 5 years. If it is further assumed that the costs of the software and hardware for data analytics are about the same magnitude or possibly a bit larger, the cost of setting up the automaker’s software defined architecture to support data analytics and create an (internal) IoT would be about USD 200 million to USD 300 million over 5 years. Overall, this would represent roughly a USD 2 billion return on an investment (ROI) of USD 350 million to USD 500 million over 5 years, or a ROI of 300% to 470%.
Estimates of how the firm’s move into the IoT is likely to impact its financial performance show that the biggest area for savings is likely to come from the firm’s efforts to control costs in its supply chain. The firm has already consolidated production on a single platform to reduce the number of parts it needs in a car. With a more sophisticated analytic system, it should be able to achieve additional savings. The automaker is also studying how to link more vehicles with onboard sensor platforms to its cloud. It is experimenting with sensors to help drivers improve their performance. For electronic cars, there is already an Internet based system that ties into mobile devices. This tells a driver whether the car’s battery is charged. The system can also identify nearby charging locations. The firm has not estimated the size of this benefit, nor has it forecast how much it might expand if there is a larger fleet of electrically powered cars in the future.
Currently, the firm’s electric vehicles generate about 25 petabytes (PB, a million gigabytes) of data an hour. So the firm expects there will be about 100 times more data than this per car from new satellite technologies which could be introduced over the next two to three years. In addition, the firm’s sensors in plants, on factory floors and in research programs generate a lot of data. The automaker sees the vehicle as a “closed loop control system.” This might result in the firm receiving exabytes (EB, a billion gigabytes) of additional data from new systems in tens of millions of vehicles, or zettabytes of data per year by 2019 to 2020. This would be a remarkable rate of growth of over 250% per year, and would raise some big challenges in terms of data management.
23. The IoT, together with big data and cloud computing, are the main reasons for the sudden
breakthrough in artificial intelligence (AI) applications, like driverless cars. The IoT embeds physical
objects in information flows and thereby makes them “smarter”. With driverless cars, for instance, the road
infrastructure, other cars, and web services (such as online maps) “tell” a car what it needs to know.18
In
this way, it is not necessary to equip a car with image processing systems comparable to human vision for
the car to be able to drive on its own, as was previously assumed. Similarly, when all the devices and
machines in a factory can supply information, many new robotics applications become possible.
DSTI/CDEP(2016)13/REV1
16
The digital transformation of production is highly disruptive
24. The use of digital technology often induces the “creative destruction” of established businesses,
markets and value networks. This can be particularly challenging for (traditional) businesses, where the
competitive environment may discourage investments in disruptive innovation in the short run. This is
often the case for two reasons: (i) investments in disruptive innovation can take scarce resources away
from sustaining the most profitable business units (which are needed to compete against current
competition); and, (ii) disruptive innovation is often highly risky given that it may not be profitable in the
short run. Disruptive innovation may require substantial changes in organisational structures, business
processes or even business models that involve sunk costs (that cannot be recovered).19
In addition to
economic factors, these changes may also be hard to implement in light of internal resistance due to the
organisational culture and psychological resistance among management and their employees. Christensen
(1997) refers to this challenge as the innovator’s dilemma, where successful companies put too much
emphasis on current success, and thus fail to innovate in the long run.
25. The fear of change and disruption combined with short-term thinking typically result in
disruptive digital innovation often being introduced by ICT firms, and in particular start-ups (see OECD,
2016). As shown by Criscuolo et al. (2012), new technologies and innovations are often first
commercialised through start-up companies because they can leverage the advantage of starting without
the legacy of an existing business and customer base and thus can create a variety of presumably new
business models. Christensen (1997) also argues, controversially, that disruptive innovations are often not
valued by existing customers at first. As a consequence, incumbents, which tend to be most responsive to
their main customer base, may ignore the markets most susceptible to disruptive innovation, even if the
incumbents invest heavily in research.
26. For traditional businesses this means that they will face a more complex competitive landscape
where they will "be forced to compete simultaneously on multiple fronts and co-operate with competitors"
(Gao et al., 2016).20
The competitors may include ICT firms such as Alphabet (Google) and Apple, which
have competitive advantages in digital technologies and the creation of new business models which could
disrupt established industries. As a consequence, traditional businesses may have to rethink their business
models to stay competitive in the mid- to long run.
New business models are characterised by an emphasis on high value added services
27. As goods become commodities with low profit margins, many manufacturing firms are
developing new complementary services that extend their current business propositions. Rolls-Royce, for
instance, shifted its business from a product, time and service solution to a service model trademarked as
“Power by the Hour” (PBH) (see Box 6). Digitalisation has been a key enabler for this transformation
towards higher value added (complementary) services.
28. Historically, the digital transformation of business models was first enabled by the formalisation
and codification of business related activities, which led to the computerisation of business processes via
software. This has “enabled firms to more rapidly replicate improved business processes throughout an
organisation, thereby not only increasing productivity but also market share and market value”.
Brynjolfsson et al. (2008) have referred to this phenomenon as scaling without mass. Internet firms pushed
the digital transformation to a new level. This enabled them to better scale without mass, when compared
to the rest of the economy. 21
DSTI/CDEP(2016)13/REV1
17
Box 6. The "servicification" of manufacturing: the case of Rolls-Royce's “Power by the Hour”
Rolls-Royce shifted its business from a product, time and service solution to a service model trademarked as “Power by the Hour” (PBH).
22 With PBH, customers pay only for the time they use an engine. Rolls-Royce could have
done this only by being able to collect large amounts of data from the sensor networks it installed on engines.
Rolls-Royce’s service model evolved through three steps. First, it developed ways to use the data from sensor networks to manage its own service operations. Secondly, it enhanced the model by more directly managing the services and support for clients. Thirdly, it was able to make large amounts of data more generic across many different customers, optimizing its entire data ecosystem. This has enabled Rolls-Royce’s service model to become proactive, with the aim of minimizing, or eliminating, disruptions caused to its customers.
23
This new business model changed from a product and sales support to a services business. It insured that Rolls-Royce captured its aftermarket service business rather than permitting third parties to create parts to service its aircraft engines. The new business model also meant that the risks of using an engine were more equitably distributed between the supplier and the customer.
Rolls-Royce started this approach by integrating its customers very closely within its own operations. It began by working closely with American Airlines to create the Total Care solution focusing on the customer’s end-to-end needs. This led to the creation of Ops Centers where Rolls-Royce’s engineers oversee the day-to-day management of a customer’s fleet. In many cases, these Centers were embedded within a customer’s operations, beginning with closely linked operations in the UK defense industry.
24
Rolls-Royce now focusses on “zero based disruption” for its customers. To achieve this, Rolls-Royce does sophisticated modelling of the solutions it offers customers. It does this on a product basis as well as for customer fleets. This shift of focus to prognostics means actively taking data off engines and aggregating the data to understand how the entire fleet works. Rolls-Royce can then aggregate the data across customers to gain an overview of how data is used. In the future, Rolls-Royce will also focus on “dispatch availability,” ensuring that when an aircraft rolls onto a runway, it has the highest chance of taking off without problems originating from its engines.
Rolls-Royce’s new service model provides two ways of improving the firm’s performance:
1. Rolls-Royce can reduce the costs of scheduled repairs by cutting maintenance costs and preventing breakdowns, thereby lengthening the time that an engine can stay on the wing. This increases its service revenues. One of the US national laboratories has estimated that “Predictive maintenance of
assets [can save] up to 12 percent over scheduled repairs, reducing overall maintenance costs up to 30 percent and eliminating breakdowns up to 70 percent.” (Sullivan et al. 2010; cited in Daugherty et al. 2015) If Rolls-Royce’s savings are on this scale, based upon fiscal year 2014 revenues, it could be saving 12% on its cost to provide services. These cost savings might range from USD 400 million to USD 600 million. Rolls-Royce not only extends the expected lifetime of an engine, it also collects additional income from the services to support an engine. It does this by extending the life of an engine from the usual 4 to 6 years to 6 to 8 years. This would permit Rolls-Royce to increase revenues on services for both its civilian and defense aerospace operations. This could mean increasing earnings of service revenues by 15 to 20 percent per year. Based on fiscal year 2014 revenues, this would be an additional USD 1.0 billion to USD 1.35 billion annually. So, the total annual benefit from the new service model could be more than USD 1.4 billion to USD 1.95 billion.
2. Rolls-Royce can provide a form of service assurance to its customers when it provides “dispatch availability” and “Zero based disruption”: By reducing disruptions to its customers’ ability to operate,
Rolls-Royce is adding performance assurance to the usual services it offers through its Ops Centers and Business Centers. However, it is difficult to estimate this type of economic impact stemming from “zero-based disruption".
25
29. The business models of the most successful Internet firms today go beyond the formalisation and
codification of processes via software, and now involve the collection and analysis of large streams of data
(OECD, 2015b). By collecting and analysing “big data”, a large share of which is provided by Internet
users (consumers), Internet companies are able to automate their processes and to experiment with, and
foster, new products and business models at a much faster rate than the rest of industry. Instead of relying
on the (explicit) formulation and codification of business processes, these firms use big data to “train”
artificial intelligence (AI) algorithms to perform more complex business processes without human
DSTI/CDEP(2016)13/REV1
18
intervention. Innovation enabled by AI is now used to transform business processes across the economy.
Thanks to the convergence of ICTs with other technologies (owing in particular to embedded software and
the IoT), the digital transformation has the potential to affect even traditional sectors such as
manufacturing and agriculture.
30. The analysis of successful digital business models suggests that actions that take advantage of the
applications mentioned above can digitally transform traditional businesses. These actions include:
The digitisation of physical assets, which refers to the process of encoding information into
binary digits (i.e. bits) so that it can be processed by computers (OECD, 2015b). This is one of the
most straightforward steps to digitally transform businesses. An early example is the
entertainment and content industry, where books, music, and videos were digitised to be provided
over the Internet. Thanks to the deployment of 3D scanners and 3D printing, digitisation is no
more limited to content, but can now include real-life objects. 3D printing promises, for instance,
to shorten industrial design processes, owing to rapid prototyping, and in some cases raise
productivity by reducing material waste (OECD, 2016f). Boeing, for instance, has already
replaced machining with 3D printing for over 20 000 units of 300 distinct parts (Davidson, 2012).
The “datafication” of business-relevant processes, which refers to data generation, not only
through the digitisation of content, but through the monitoring of activities, including real-world
(offline) activities and phenomena through sensors. “Datafication” is a portmanteau term for
“data” and “quantification” and should not be not be confused with digitisation, which is just the
conversion of analogue source material into a numerical format (OECD, 2015b).26
Datafication is
used by many platforms which monitor the activities of their users. And with the IoT, this
approach is no longer limited to Internet firms. For example, data collected on agricultural
machines, such as those made by Monsanto, John Deere and DuPont Pioneer, are being used as
an important data source for optimising the distribution and genetic modification of crops (GMC)
(see Box 3 and also Box 6).
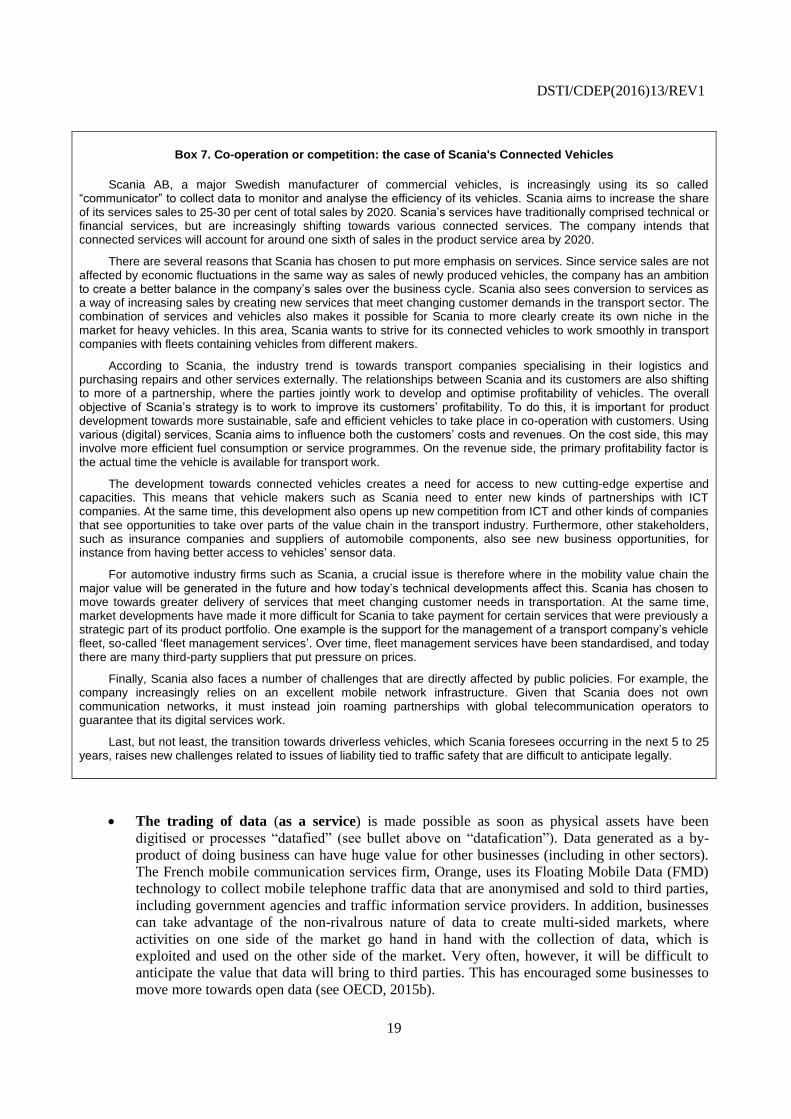
The interconnection of physical objects via the IoT enables product and process innovation.
Scania AB, a major Swedish manufacturer of commercial vehicles, now generates one sixth of its
revenues through new services enabled by the wireless communication built into its vehicles (see
Box 7). This allows the company to transition towards a firm increasingly specialised in logistic,
repair and other services. For instance, with the interconnection of its vehicles, Scania can better
offer fleet management services. The interconnection of physical objects also enables the
generation and analysis of big data, which can be used for the creation of more services. For
instance, Scania offers a set of services to increase driving (and therefore resource) efficiency,
such as data-based coaching drivers.
The codification and automation of business relevant processes via software and AI:
Software has enabled and incentivised businesses to standardise their processes, and where
processes are not central to the business model, to sell the codified processes via software to
other businesses. An example is IBM’s Global Expenses Reporting Solutions, which were
originally developed to automate the company’s internal travel-related reporting. IBM turned the
in-house system into a service, which it has sold globally (Parmar et al., 2014). Another example
is Google’s Gmail. This was originally an in-house email system, before it was announced to the
public as a limited beta release in April 2004 (McCracken, 2014).
DSTI/CDEP(2016)13/REV1
19
Box 7. Co-operation or competition: the case of Scania's Connected Vehicles
Scania AB, a major Swedish manufacturer of commercial vehicles, is increasingly using its so called “communicator” to collect data to monitor and analyse the efficiency of its vehicles. Scania aims to increase the share of its services sales to 25-30 per cent of total sales by 2020. Scania’s services have traditionally comprised technical or financial services, but are increasingly shifting towards various connected services. The company intends that connected services will account for around one sixth of sales in the product service area by 2020.
There are several reasons that Scania has chosen to put more emphasis on services. Since service sales are not affected by economic fluctuations in the same way as sales of newly produced vehicles, the company has an ambition to create a better balance in the company’s sales over the business cycle. Scania also sees conversion to services as a way of increasing sales by creating new services that meet changing customer demands in the transport sector. The combination of services and vehicles also makes it possible for Scania to more clearly create its own niche in the market for heavy vehicles. In this area, Scania wants to strive for its connected vehicles to work smoothly in transport companies with fleets containing vehicles from different makers.
According to Scania, the industry trend is towards transport companies specialising in their logistics and purchasing repairs and other services externally. The relationships between Scania and its customers are also shifting to more of a partnership, where the parties jointly work to develop and optimise profitability of vehicles. The overall objective of Scania’s strategy is to work to improve its customers’ profitability. To do this, it is important for product development towards more sustainable, safe and efficient vehicles to take place in co-operation with customers. Using various (digital) services, Scania aims to influence both the customers’ costs and revenues. On the cost side, this may involve more efficient fuel consumption or service programmes. On the revenue side, the primary profitability factor is the actual time the vehicle is available for transport work.
The development towards connected vehicles creates a need for access to new cutting-edge expertise and capacities. This means that vehicle makers such as Scania need to enter new kinds of partnerships with ICT companies. At the same time, this development also opens up new competition from ICT and other kinds of companies that see opportunities to take over parts of the value chain in the transport industry. Furthermore, other stakeholders, such as insurance companies and suppliers of automobile components, also see new business opportunities, for instance from having better access to vehicles’ sensor data.
For automotive industry firms such as Scania, a crucial issue is therefore where in the mobility value chain the major value will be generated in the future and how today’s technical developments affect this. Scania has chosen to move towards greater delivery of services that meet changing customer needs in transportation. At the same time, market developments have made it more difficult for Scania to take payment for certain services that were previously a strategic part of its product portfolio. One example is the support for the management of a transport company’s vehicle fleet, so-called ‘fleet management services’. Over time, fleet management services have been standardised, and today there are many third-party suppliers that put pressure on prices.
Finally, Scania also faces a number of challenges that are directly affected by public policies. For example, the company increasingly relies on an excellent mobile network infrastructure. Given that Scania does not own communication networks, it must instead join roaming partnerships with global telecommunication operators to guarantee that its digital services work.
Last, but not least, the transition towards driverless vehicles, which Scania foresees occurring in the next 5 to 25 years, raises new challenges related to issues of liability tied to traffic safety that are difficult to anticipate legally.
The trading of data (as a service) is made possible as soon as physical assets have been
digitised or processes “datafied” (see bullet above on “datafication”). Data generated as a by-
product of doing business can have huge value for other businesses (including in other sectors).
The French mobile communication services firm, Orange, uses its Floating Mobile Data (FMD)
technology to collect mobile telephone traffic data that are anonymised and sold to third parties,
including government agencies and traffic information service providers. In addition, businesses
can take advantage of the non-rivalrous nature of data to create multi-sided markets, where
activities on one side of the market go hand in hand with the collection of data, which is
exploited and used on the other side of the market. Very often, however, it will be difficult to
anticipate the value that data will bring to third parties. This has encouraged some businesses to
move more towards open data (see OECD, 2015b).
DSTI/CDEP(2016)13/REV1
20
The (re-)use and linkage of data within and across industries (i.e. data mashups) has become
a business opportunity for firms that play a central role in their supply chain. Walmart and Dell
have successfully integrated data across their supply chains. But as manufacturing becomes
smarter, thanks to the IoT and data analytics, this approach is becoming attractive to
manufacturing companies as well. Sensor data, for instance, can be used to monitor and analyse
the efficiency of products, to optimise operations at a system-wide level, and for after-sale
services, including preventive maintenance operations (see the example of Schmitz Cargobull
discussed earlier).
The competitive landscape is becoming more complex with co-opetition becoming the new default
31. The increasing importance of ICTs such as big data analytics, the IoT, and AI gives companies
that can take advantage of these technologies a significant competitive advantage. ICT firms able to extend
the scope of their businesses to other sectors can have an advantageous starting position. For established
(traditional) buinesses, however, the situation is challenging: they not only need to better understand how
to best use ICTs, they also have to forge new partnerships with ICT firms to gain the necessary technical
capabilities.
32. Some traditional businesses have decided to acquire promising ICT start-ups (for example John
Deere acquiring Precision Planting), while others have started to co-operate with ICT firms, which
however, could rapidly become competitors (see Box 7). This slightly ambiguous relationship between co-
operation and competition has been referred to in the literature as “co-opetition”.
33. The complexity of the competitive landscape can be observed in the automobile industry, where
traditional automotive firms not only compete with their direct competitors, including new entrants such as
Tesla, but increasingly compete with ICT firms such as Apple, Alphabet (Google) and Uber Technologies
(Uber), to name a few. This profound change in the competitive landscape is driven by a number of social
and technological trends. Among these trends, the following three are seen as the most important in the
automobile sector:
The increasing degree to which ICTs, in particular software, are embedded in vehicles: The
cost of developing new vehicles is increasingly dominated by software, with high-end vehicles
relying on millions of lines of computer code. It is estimated that 90% of the new features in cars
have a significant software component (such as improved fuel injection, on-board cameras, safety
systems, etc.). Hybrid and electric vehicles in particular require huge volumes of computer code:
the Chevrolet Volt plug-in hybrid uses about 10 million lines of computer code. A major part of
the development costs for entirely new vehicles is also software-related (while manufacturers
guard the exact figures closely, estimates of around 40% are not uncommon) (OECD, 2015).
The trends towards autonomous (self-driving) vehicles, which mean that software systems
using AI will account for most of the value added in an automobile. Software would
constitute the major part of the development costs (rising to 60% to 80% when including
infotainment27
systems). It is therefore not surprising that firms with strong software capabilities,
in particular in AI, have entered the field of self-driving cars. Google is often perceived as one of
the pioneers, when it started its Self-Driving Car Project in 2009 (although many of the leading
automobile companies have been working on the concept for at least a decade28
). Tesla's recent
firmware update enabling its semi-autonomous "Autopilot" system has also put significant
pressure on incumbents in the automobile market to accelerate the release of products with
comparable features (see for example Toyota Motor announcing it will invest USD 1 billion
through to 2020 to develop self-driving cars).
DSTI/CDEP(2016)13/REV1
21
A possible paradigm shift towards "mobility as a service" which may make car ownership
less attractive. Mobile smartphones and applications (apps), combined with the analysis of big
data, have enabled collective consumption of private durable goods by providing access to excess
capacity of these goods. In the case of cars, many shared mobility services have emerged, ranging
from the rental of private cars (Zipcar), rides (Uber, Lyft, blablacar) and parking spaces
(justpark), to the rental of free floating (Car2go, DriveNow) and station-based cars (Autolib’) and
bikes (Velib’) (OECD, 2015a). A great deal of capital is therefore flowing to these firms. For
example, Apple has recently invested USD 1 billion in Didi Chuxing, a ride-hailing service
competing with Uber in China.
34. All these trends have favoured the market entry of ICT firms in the automobile and mobility
services sector, increasingly through strategic alliances, but also mergers and acquisitions (M&A). A
number of these alliances have focused on the development of autonomous (self-driving) vehicles. For
example, in May 2016 Fiat Chrysler Automobiles and Alphabet, Google's mother company, announced
that they would jointly develop a fleet of 100 self-driving minivans. The following month, BMW
announced that it would team up with Intel and Mobileye to develop a fully automated driving system. In
terms of M&As, GM recently paid USD 1 billion for the acquisition of Cruise Automation, a start-up
specialised in the development of hands-free driving software systems.
35. There have also been an increasing number of collaborations and investments focusing on
mobility as a service. For example, Volkswagen recently invested USD 300 million in an Israeli start-up,
Gett, an Uber rival operating mainly in New York, London, Moscow and Tel Aviv. Similarly, Toyota
Motor invested in Uber Technologies, while GM invested in USD 500 million in Lyft, Uber's top US rival,
which has plans to develop a nationwide on-demand network of self-driving cars. For the platform
providers the objective is often to gain access to fleets of cars, while the car manufacturing companies are
interested in gaining access to the mobility data and analytic capabilities of the platform providers.
36. In light of these collaborative efforts, some observers have noted that automobile manufacturers
may be pushed towards the lower end of the value chain if they lack competencies in software and AI-
enabled services. For instance, when commenting on Apple’s announcement to invest in a car project,
Ewing (2015) concluded that:
“The main risk for car makers is probably not so much that an Apple car would destroy
Mercedes-Benz or BMW the way the iPhone gutted Nokia, the Finnish company that was once
the world’s largest maker of mobile phones. Rather, the risk is that Apple and Google would turn
the carmakers into mere hardware makers — and hog the profit.”
37. That said, the traditional carmakers’ big advantage is still their capacity to manage the
complexity of manufacturing reliable, comfortable vehicles including the management of the supply chain.
And these companies still possess very strong brands. To what extent a newcomer will be able to outsource
the manufacturing process, like Apple outsources the production of the hardware for the iPhone, or to
partner with manufacturing firms, as Google does with Android, is hard to tell. In any case, it will be
crucial for all stakeholders to clearly identify their core business areas and the activities in the value chain
where they can best lever their competitive advantages. The exploitation of existing IPR and data as
“points of control” could turn out to be key to firms' strategies, with important implications for competition
in these markets to be expected (see OECD, 2015b).
DSTI/CDEP(2016)13/REV1
22
Manufacturing and agriculture could be completely automated soon with the few human workers being
integrated in automated processes
38. In manufacturing, robots have traditionally been used mostly where their speed, precision,
dexterity and ability to work in hazardous conditions are valued. Traditional robots, however, could only
operate rapidly in very precisely defined environments. Setting up a robotic plant would take months if not
years. The robots might have sensors on board but most of their movements had to be pre-planned and
programmed, which did not allow for much flexibility in production. For this reason, the production of
consumer electronics is still often done by hand, because the life cycle of consumer electronics and the
time to market is so short that a robotic factory would not be ready to make the current product by the time
the successor should be on the market. However, this is radically changing because of AI. Machines are
becoming more flexible and autonomous and can now perform a wider range of more complex manual
work. Some modern factories, such as the Philips shaver factory in Drachten in the Netherlands, are almost
fully robotic (Markoff, 2012). This particular factory employs only one-tenth of the workforce employed in
Philips’ factory in China that makes the same shavers.
39. In agriculture, autonomous machines are increasingly used. In cattle farming, for instance,
machines milk cows, distribute food and clean stables without any human intervention. The milking robot
from Lely, for instance, autonomously adjusts the feeding and milking process to optimize milk production
for each cow. Some studies have therefore suggested that it is only a matter of time before humans are
removed all together from agricultural farming.
40. A scenario might ensue in which farm enterprises become local caretakers of land, animals and
data. They might monitor operations that are centred at the lower end of the value chain, much like the
current concept of contract farming29
. Food producers, retailers or even end consumers could interact
directly with the network around the farmer, including seed suppliers, smart (autonomous) machines,
veterinarians, etc.. In such a scenario, the job of the farmer would be more like a contractor making sure
that the interactions between the supply and demand sides of the agricultural system work together
properly. In an alternative scenario, farmers could become empowered by the data and intelligence
provided by analytics, tailoring the processes to their knowledge of local and farm-specific idiosyncrasies.
41. As the IoT enables integration of physical systems, it will also foster the integration of living
systems – including plants, animals and humans – within physical systems.30
Such integration may further
empower humans: Augmented reality-based applications, for instance, could provide workers with the
real-time information to improve decision making and work procedures. For example repair instructions
could be displayed directly in workers’ field of sight using augmented reality glasses (Rüßmann et al.,
2015). And by using information available in real time, employees can organise shift scheduling
themselves, as the case of KapaflexCy in Germany shows (see Box 8). That said, examples presented so
far suggest that there are also risks that such integration may lead to a dehumanisation of production. In
highly automated production processes, integration and interaction between humans and autonomous
systems have already emerged in particular for tasks for which human intelligence is still required and no
cost-efficient algorithm exists, making human workers appear rather as servants than users of IoT enabled
systems (see Box 9).
DSTI/CDEP(2016)13/REV1
23
Box 8. Self-organized capacity flexibility for Industrie 4.0: the KapaflexCy research project
To produce highly-customized products, companies must become more dynamic, agile and customer-oriented. This requires maximum flexibility, from technical facilities and personnel. For lean production, the deployment of personnel must be matched as closely as possible to real-world demand. In practice, this process is usually inefficient: team leaders and shift managers coordinate the presence and absence of employees, generally verbally, and sometimes by e-mail.
In the KapaflexCy research project, a number of institutions together developed a self-organized capacity control system (the institutions concerned were Fraunhofer IAO, together with BorgWarner, Bruker Optik, Stuttgart Airport, the Institute for Occupational Safety and Technology Management, Introbest, Kaba, SAP and Trebing & Himstedt). This system allows companies to control their production capacities with the direct involvement of executive employees in a highly flexible, short-term and company-wide manner. Even with fluctuating orders and unstable markets, companies can react more quickly, avoid unproductive times and reduce the cost of capacity control. Employees experience a transparent personnel deployment plan and coordinate their deployment times. The balance between work, family and leisure has been improved, and motivation increased.
Source: OECD based on www.plattform-i40.de/I40/Redaktion/DE/Anwendungsbeispiele/096-kapaflexcy-selbstorganisierte-kapazitaetsflexibilitaet-fuer-die-industrie-4-0/beitrag-kapaflexcy-selbstorganisierte-kapazitaetsflexibilitaet-fuer-die-industrie-4-0.html, accessed 15 January 2017
Box 9. Crowdsourcing of human intelligence tasks: “Human computing”
While computing and automation technologies are steadily improving, humans still do many tasks more effectively than computers, such as identifying objects in a video, and transcribing audio recordings. For such tasks, firms have tended to hire temporary workers. But crowdsourcing a workforce for human intelligence tasks (HITs) is an increasingly used alternative. This process, which gives firms flexibility, is often referred to as “human computing” (because humans are here used solve problems that computers cannot).
Amazon is still the most prominent provider of human computing services over the Internet, since it launched its crowdsourcing marketplace for digital work called Amazon Mechanical Turk (MTurk) in 2005. Requesters advertise small projects that cannot be fully carried out by computers. Worker - called “turkers” - complete those one-time tasks, for sums ranging from as little as USD 0.01 for a short task to USD 100 for more complex jobs. Currently, some 500 000 workers from 190 countries are registered at Amazon MTurk. Especially for people living in developing countries, MTurk and similar services have been highlighted as an economic opportunity. Samasource, a nonprofit organization, provides data-related services to large companies in the United States and Europe. It divides work into small batches and sends these for completion to delivery centres in developing countries (Gino and Staats, 2012).
While they represent job opportunities for some, MTurk and similar services such as Samasource have been criticized by some as a “digital sweatshop”, given that, in the words of one scholar, these services “[circumvent] a range of labor laws and practices, found in most developed countries” (Zittrain, 2009, cited in MIT Technology Review, 2010). So-called ‘micro-workers’ typically earn below average hourly wages (Uddin, 2012; Cushing, 2013; Horton and Chilton, 2010). But a survey of working conditions as perceived by 200 workers on MTurk suggests that the workers believe their chances of being treated fairly are as good or better online as they are offline (MIT Technology Review, 2010; Horton, 2011). However, issues related to worker conditions remain, despite a 2014 petition from MTurk workers to Amazon CEO Jeff Bezos calling for improved conditions (Harris, 2014; Dholakia, 2015).
Source: OECD (2015b)
DSTI/CDEP(2016)13/REV1
24
42. Large warehouses, which have so far been major employers, are an example of such a system.
Many warehouses today use digital technology to direct workers to particular shelves and instruct them on
the items to pick. The worker then scans the barcodes of the items picked and deposited. Workers walk
many kilometres each day.31
Other warehouses use conveyer belts for products. The humans are controlled
by computers. However, in some of the warehouses, the model of working has changed. In these
warehouses the shelves come to the workers, carried by small driving robots such as those manufactured
by Kiva Systems, a company acquired by Amazon after the latter started using Kiva’s robots. Kiva
Systems creates a different type of warehouse, where workers stand still and the shelves are dynamic. The
location of goods is continuously optimised, so that the most popular products are situated on the shelves
that need to travel the shortest distance.32
A laser shows the worker what product needs to be picked and
where it needs to be deposited. The effect is a highly efficient warehouse that needs fewer workers to
handle the same volume of orders.
New policy opportunities and challenges lie ahead
43. Despite its potential benefits, the digitalisation of industrial and agricultural production still falls
short of its potential. There are a number of concurrent reasons for this, as the case of precision farming
technology adoption in the Netherlands shows (see Box 9). This section will discuss the key policy issues
which, if properly addressed, can maximise the benefits of digitalisation.
Box 10. Drivers and challenges in the adoption of precision farming technologies
The concept of precision farming has captured the imagination of industry and policymakers, even if the market for precision farming solutions is still young.
In a survey of Dutch farmers about 55% of respondents indicated that they own tools that support precision farming (University & Research centre, WUR). Most commonly these were GPS-equipped tractors and, to a lesser extent, tools that monitor crops and soil. However, the integration of machine-generated data into business management systems (BMS) is limited. The use of BMS by farmers is primarily driven by existing regulatory and customer requirements regarding food safety. In other words, these tools are mostly used for registration purposes rather than for yielding actual management information. BMS becomes more valuable to farms as they grow in size and require better information processing. About 45% of respondents use collected data for planning fertilization, irrigation and pesticides spraying. However, planning such activities is not generally based on real-time data collected and processed automatically by machines. In other terms, the full potential of the technology is not being exploited.
The ease of use of ICT tools, and farmers’ ICT skills, are the most important factors driving the adoption and use of precision farming technologies. Other influences are farm size, the opportunities for cost reduction, total farm income, land tenure arrangements, access to information (via extension services and service and technology providers), and location (Perpaoli et al., 2013).
Adoption rates for precision farming vary across sub sectors. Various sources suggest that the use of data and data analytics in livestock farming, and in greenhouses, is more advanced than in crop farming. This could be because the former two sectors have shorter production cycles and operate in controllable environments, which makes precision farming solutions and automation more profitable.
Another important enabler of diffusion is the penetration of (mobile) broadband. The European AgriXchange research project concluded that the lack of broadband in many rural areas in Europe is an important barrier to innovations that build on the collection and exchange of data.
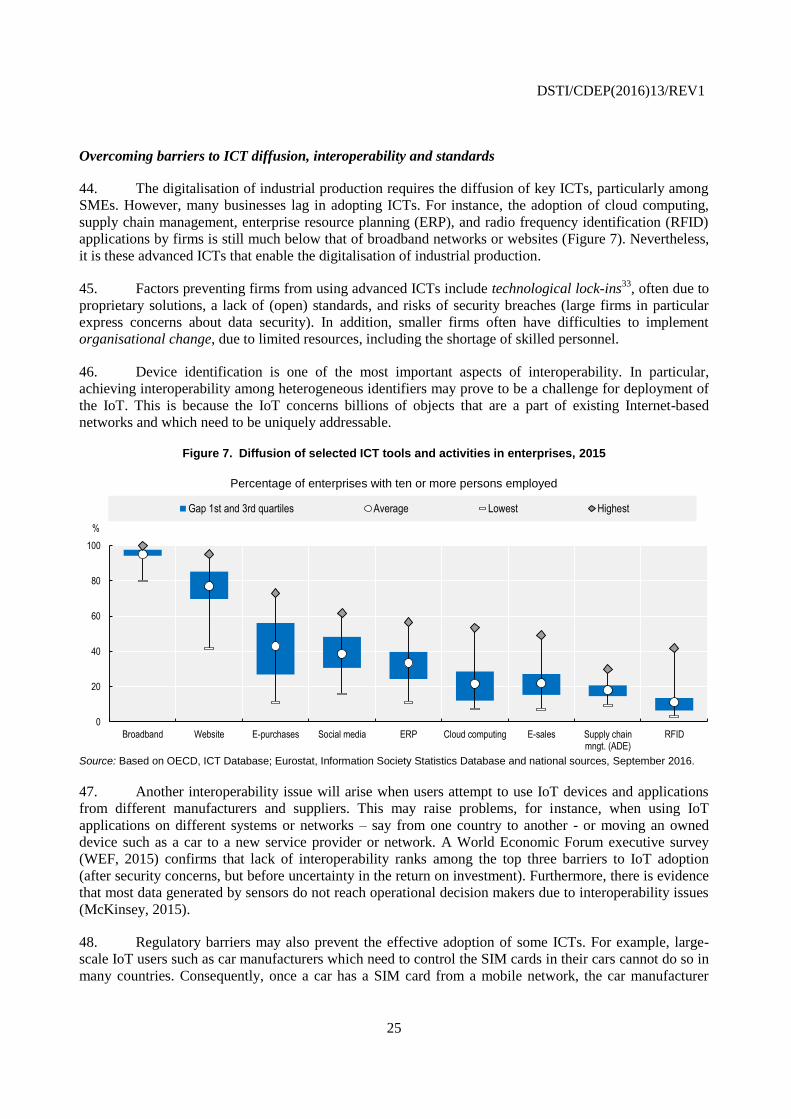
DSTI/CDEP(2016)13/REV1
25
Overcoming barriers to ICT diffusion, interoperability and standards
44. The digitalisation of industrial production requires the diffusion of key ICTs, particularly among
SMEs. However, many businesses lag in adopting ICTs. For instance, the adoption of cloud computing,
supply chain management, enterprise resource planning (ERP), and radio frequency identification (RFID)
applications by firms is still much below that of broadband networks or websites (Figure 7). Nevertheless,
it is these advanced ICTs that enable the digitalisation of industrial production.
45. Factors preventing firms from using advanced ICTs include technological lock-ins33
, often due to
proprietary solutions, a lack of (open) standards, and risks of security breaches (large firms in particular
express concerns about data security). In addition, smaller firms often have difficulties to implement
organisational change, due to limited resources, including the shortage of skilled personnel.
46. Device identification is one of the most important aspects of interoperability. In particular,
achieving interoperability among heterogeneous identifiers may prove to be a challenge for deployment of
the IoT. This is because the IoT concerns billions of objects that are a part of existing Internet-based
networks and which need to be uniquely addressable.
Figure 7. Diffusion of selected ICT tools and activities in enterprises, 2015
Percentage of enterprises with ten or more persons employed
Source: Based on OECD, ICT Database; Eurostat, Information Society Statistics Database and national sources, September 2016.
47. Another interoperability issue will arise when users attempt to use IoT devices and applications
from different manufacturers and suppliers. This may raise problems, for instance, when using IoT
applications on different systems or networks – say from one country to another - or moving an owned
device such as a car to a new service provider or network. A World Economic Forum executive survey
(WEF, 2015) confirms that lack of interoperability ranks among the top three barriers to IoT adoption
(after security concerns, but before uncertainty in the return on investment). Furthermore, there is evidence
that most data generated by sensors do not reach operational decision makers due to interoperability issues
(McKinsey, 2015).
48. Regulatory barriers may also prevent the effective adoption of some ICTs. For example, large-
scale IoT users such as car manufacturers which need to control the SIM cards in their cars cannot do so in
many countries. Consequently, once a car has a SIM card from a mobile network, the car manufacturer
0
20
40
60
80
100
Broadband Website E-purchases Social media ERP Cloud computing E-sales Supply chainmngt. (ADE)
RFID
%
Gap 1st and 3rd quartiles Average Lowest Highest
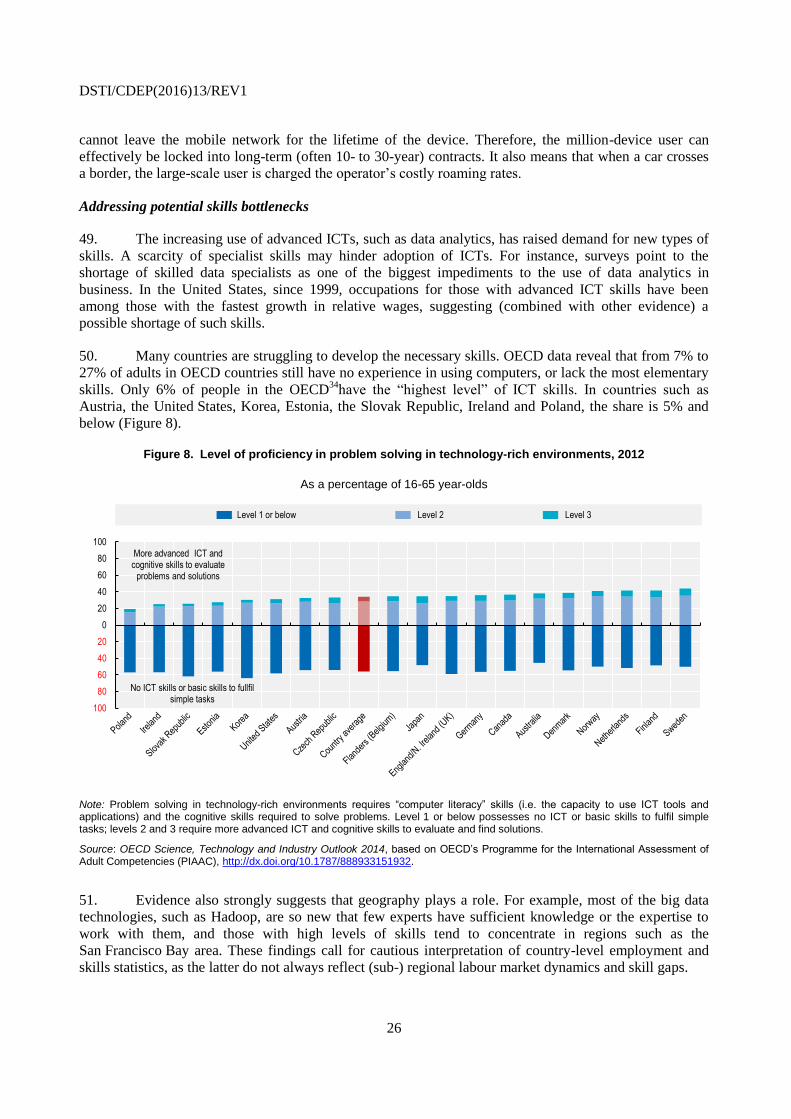
DSTI/CDEP(2016)13/REV1
26
cannot leave the mobile network for the lifetime of the device. Therefore, the million-device user can
effectively be locked into long-term (often 10- to 30-year) contracts. It also means that when a car crosses
a border, the large-scale user is charged the operator’s costly roaming rates.
Addressing potential skills bottlenecks
49. The increasing use of advanced ICTs, such as data analytics, has raised demand for new types of
skills. A scarcity of specialist skills may hinder adoption of ICTs. For instance, surveys point to the
shortage of skilled data specialists as one of the biggest impediments to the use of data analytics in
business. In the United States, since 1999, occupations for those with advanced ICT skills have been
among those with the fastest growth in relative wages, suggesting (combined with other evidence) a
possible shortage of such skills.
50. Many countries are struggling to develop the necessary skills. OECD data reveal that from 7% to
27% of adults in OECD countries still have no experience in using computers, or lack the most elementary
skills. Only 6% of people in the OECD34
have the “highest level” of ICT skills. In countries such as
Austria, the United States, Korea, Estonia, the Slovak Republic, Ireland and Poland, the share is 5% and
below (Figure 8).
Figure 8. Level of proficiency in problem solving in technology-rich environments, 2012
As a percentage of 16-65 year-olds
Note: Problem solving in technology-rich environments requires “computer literacy” skills (i.e. the capacity to use ICT tools and applications) and the cognitive skills required to solve problems. Level 1 or below possesses no ICT or basic skills to fulfil simple tasks; levels 2 and 3 require more advanced ICT and cognitive skills to evaluate and find solutions.
Source: OECD Science, Technology and Industry Outlook 2014, based on OECD’s Programme for the International Assessment of Adult Competencies (PIAAC), http://dx.doi.org/10.1787/888933151932.
51. Evidence also strongly suggests that geography plays a role. For example, most of the big data
technologies, such as Hadoop, are so new that few experts have sufficient knowledge or the expertise to
work with them, and those with high levels of skills tend to concentrate in regions such as the
San Francisco Bay area. These findings call for cautious interpretation of country-level employment and
skills statistics, as the latter do not always reflect (sub-) regional labour market dynamics and skill gaps.
100
80
60
40
20
0
20
40
60
80
100
Level 1 or below Level 2 Level 3
No ICT skills or basic skills to fullfilsimple tasks
More advanced ICT and cognitive skills to evaluate
problems and solutions
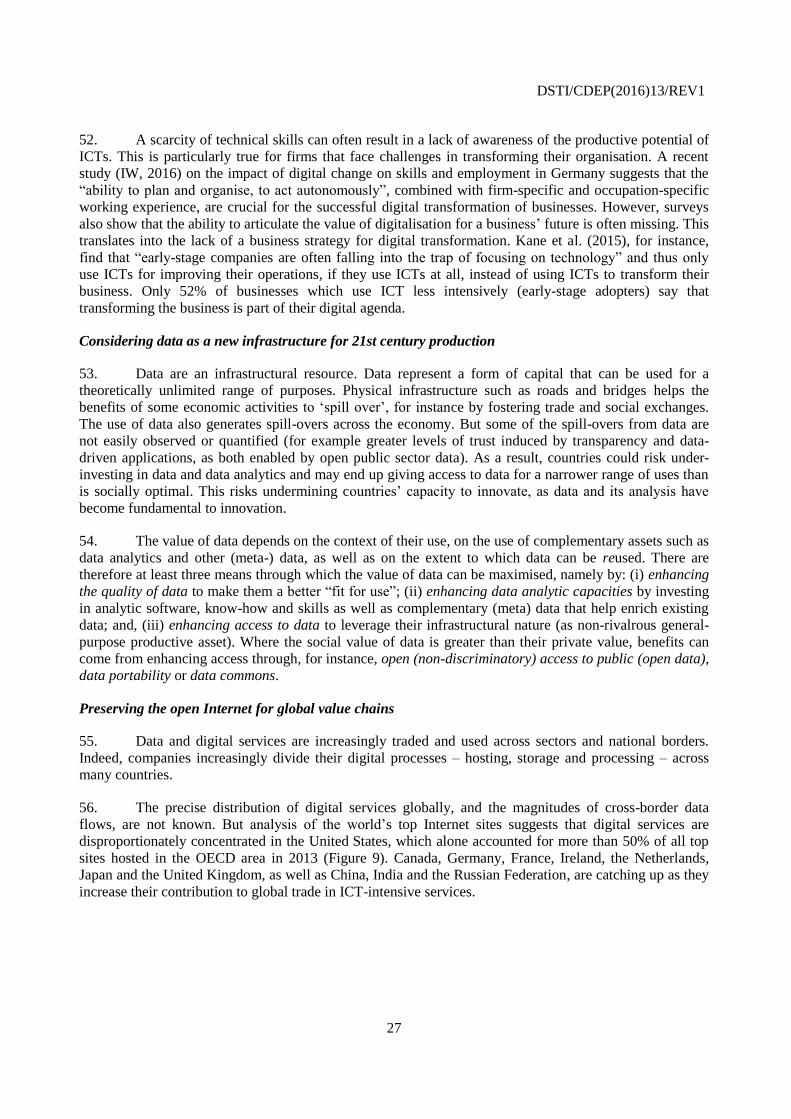
DSTI/CDEP(2016)13/REV1
27
52. A scarcity of technical skills can often result in a lack of awareness of the productive potential of
ICTs. This is particularly true for firms that face challenges in transforming their organisation. A recent
study (IW, 2016) on the impact of digital change on skills and employment in Germany suggests that the
“ability to plan and organise, to act autonomously”, combined with firm-specific and occupation-specific
working experience, are crucial for the successful digital transformation of businesses. However, surveys
also show that the ability to articulate the value of digitalisation for a business’ future is often missing. This
translates into the lack of a business strategy for digital transformation. Kane et al. (2015), for instance,
find that “early-stage companies are often falling into the trap of focusing on technology” and thus only
use ICTs for improving their operations, if they use ICTs at all, instead of using ICTs to transform their
business. Only 52% of businesses which use ICT less intensively (early-stage adopters) say that
transforming the business is part of their digital agenda.
Considering data as a new infrastructure for 21st century production
53. Data are an infrastructural resource. Data represent a form of capital that can be used for a
theoretically unlimited range of purposes. Physical infrastructure such as roads and bridges helps the
benefits of some economic activities to ‘spill over’, for instance by fostering trade and social exchanges.
The use of data also generates spill-overs across the economy. But some of the spill-overs from data are
not easily observed or quantified (for example greater levels of trust induced by transparency and data-
driven applications, as both enabled by open public sector data). As a result, countries could risk under-
investing in data and data analytics and may end up giving access to data for a narrower range of uses than
is socially optimal. This risks undermining countries’ capacity to innovate, as data and its analysis have
become fundamental to innovation.
54. The value of data depends on the context of their use, on the use of complementary assets such as
data analytics and other (meta-) data, as well as on the extent to which data can be reused. There are
therefore at least three means through which the value of data can be maximised, namely by: (i) enhancing
the quality of data to make them a better “fit for use”; (ii) enhancing data analytic capacities by investing
in analytic software, know-how and skills as well as complementary (meta) data that help enrich existing
data; and, (iii) enhancing access to data to leverage their infrastructural nature (as non-rivalrous general-
purpose productive asset). Where the social value of data is greater than their private value, benefits can
come from enhancing access through, for instance, open (non-discriminatory) access to public (open data),
data portability or data commons.
Preserving the open Internet for global value chains
55. Data and digital services are increasingly traded and used across sectors and national borders.
Indeed, companies increasingly divide their digital processes – hosting, storage and processing – across
many countries.
56. The precise distribution of digital services globally, and the magnitudes of cross-border data
flows, are not known. But analysis of the world’s top Internet sites suggests that digital services are
disproportionately concentrated in the United States, which alone accounted for more than 50% of all top
sites hosted in the OECD area in 2013 (Figure 9). Canada, Germany, France, Ireland, the Netherlands,
Japan and the United Kingdom, as well as China, India and the Russian Federation, are catching up as they
increase their contribution to global trade in ICT-intensive services.
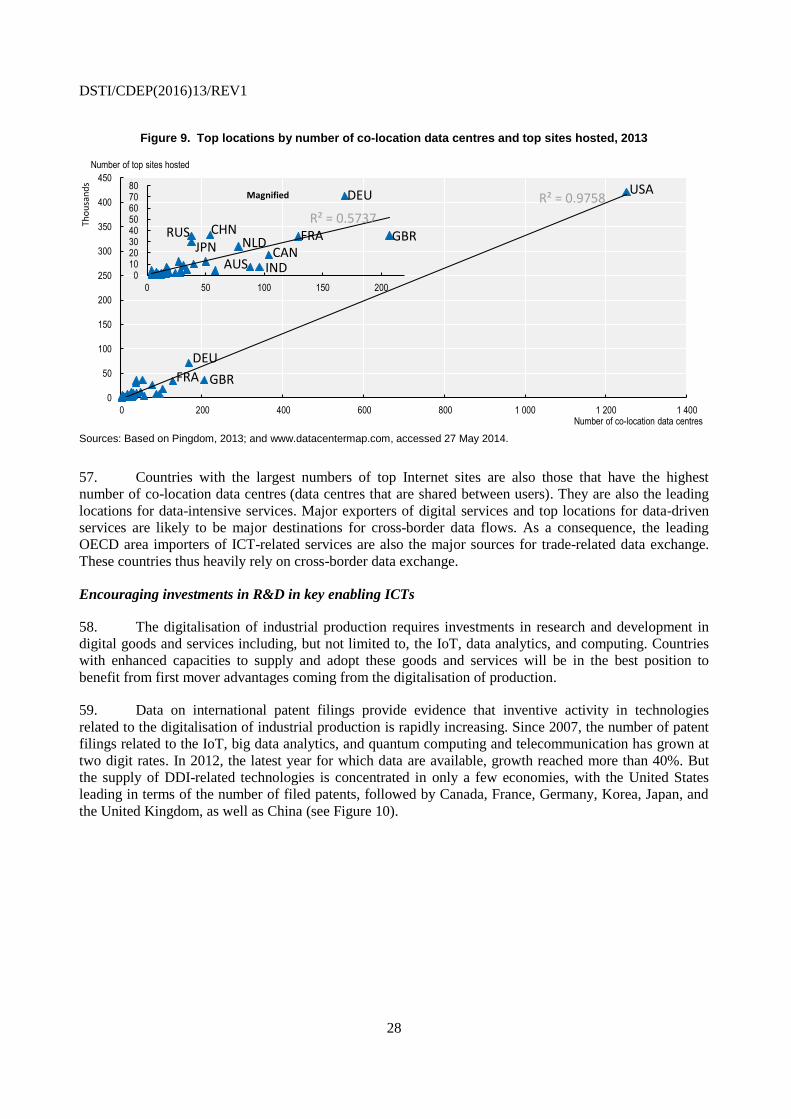
DSTI/CDEP(2016)13/REV1
28
Figure 9. Top locations by number of co-location data centres and top sites hosted, 2013
Sources: Based on Pingdom, 2013; and www.datacentermap.com, accessed 27 May 2014.
57. Countries with the largest numbers of top Internet sites are also those that have the highest
number of co-location data centres (data centres that are shared between users). They are also the leading
locations for data-intensive services. Major exporters of digital services and top locations for data-driven
services are likely to be major destinations for cross-border data flows. As a consequence, the leading
OECD area importers of ICT-related services are also the major sources for trade-related data exchange.
These countries thus heavily rely on cross-border data exchange.
Encouraging investments in R&D in key enabling ICTs
58. The digitalisation of industrial production requires investments in research and development in
digital goods and services including, but not limited to, the IoT, data analytics, and computing. Countries
with enhanced capacities to supply and adopt these goods and services will be in the best position to
benefit from first mover advantages coming from the digitalisation of production.
59. Data on international patent filings provide evidence that inventive activity in technologies
related to the digitalisation of industrial production is rapidly increasing. Since 2007, the number of patent
filings related to the IoT, big data analytics, and quantum computing and telecommunication has grown at
two digit rates. In 2012, the latest year for which data are available, growth reached more than 40%. But
the supply of DDI-related technologies is concentrated in only a few economies, with the United States
leading in terms of the number of filed patents, followed by Canada, France, Germany, Korea, Japan, and
the United Kingdom, as well as China (see Figure 10).
R² = 0.9758
0
50
100
150
200
250
300
350
400
450
0 200 400 600 800 1 000 1 200 1 400
Number of top sites hosted
Tho
usa
nd
s
Number of co-location data centres
USA
GBR
DEU
FRA
DEU
CHN GBRFRAJPN NLD
CANAUS IND
R² = 0.5737
0 10 20 30 40 50 60 70 80
0 50 100 150 200
Magnified
RUS
DSTI/CDEP(2016)13/REV1
29
Figure 10. Top players in IoT, big data and quantum computing technologies, 2005-07 and 2010-12
Share of IP5 patent families filed at USPTO and EPO, selected ICT technologies
Source: OECD Science, Technology and Industry Scoreboard 2015, based on IPO (2014), Eight Great Technologies: the Patent Landscapes and STI Micro-data Lab: Intellectual Property Database, June 2015. 10.1787/sti_scoreboard-2015-graph74-en
Addressing liability, transparency, and ownership issues
60. Data analytics leads to new ways of decision making, through low cost and rapid experiments,
often based on correlations, as well as through the use of artificial intelligence (AI) in autonomous
machines and systems. This can lead to accelerated decision-making and higher productivity.
61. But data-driven and AI-enabled decision-making can also produce mistakes. This might be
because of poor quality data, errors from the inappropriate use of data and analytics, or unexpected changes
in the environment from which data are collected. Recent financial losses caused by unforeseen behaviour
in algorithmic trading systems, such as Knight Capital Group’s loss of USD 440 million in 2012, illustrate
this last point.
62. The risk of erroneous decisions raises questions of how to assign liability between decision-
makers and the providers of data and ICTs. The issue is exacerbated by challenges linked to the concept of
data ownership. In contrast to other intangibles, data typically involve complex assignments of different
rights across different stakeholders. Where data are considered personal, the concept of ownership is
problematic, since most privacy regimes grant explicit control rights to the data subject to the data not
being restricted (see for example the Individual Participation Principle of the OECD Guidelines Governing
the Protection of Privacy and Transborder Flows of Personal Data). For example, data generated from
smart meters are considered personal data when they convey information about individual electricity
consumption, which challenges any exclusive property right the smart meter owner might claim on the
data.
63. As data analytics and AI-enabled applications become more pervasive, users need to be aware of
the limitations of both, or these applications may cause social and economic harm. This is especially true
when the incentives for users of these applications to minimise risks to third parties is low. This can
happen when analysis of personal data primarily benefits the customer of the application user and not the
individuals from whom the data has been collected.
0
5
10
15
20
25
30
35%
Internet of things Big data Quantum computing and telecommunication 2005-07
49
42 50 42
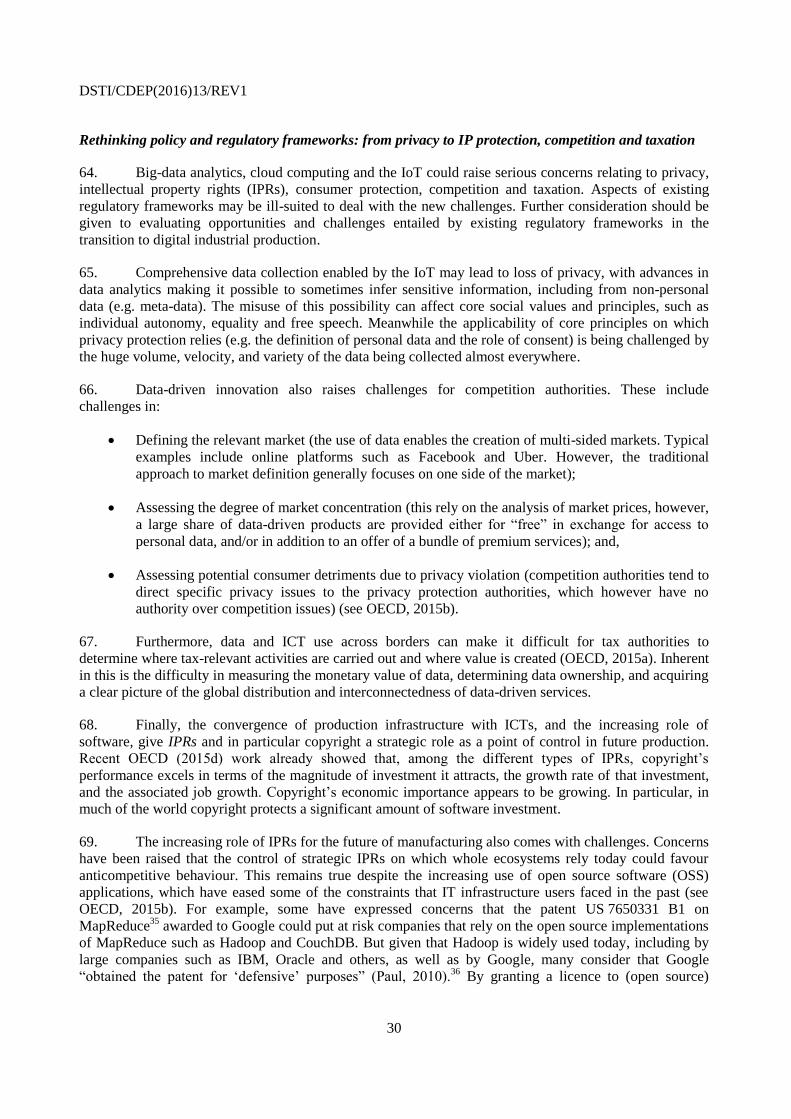
DSTI/CDEP(2016)13/REV1
30
Rethinking policy and regulatory frameworks: from privacy to IP protection, competition and taxation
64. Big-data analytics, cloud computing and the IoT could raise serious concerns relating to privacy,
intellectual property rights (IPRs), consumer protection, competition and taxation. Aspects of existing
regulatory frameworks may be ill-suited to deal with the new challenges. Further consideration should be
given to evaluating opportunities and challenges entailed by existing regulatory frameworks in the
transition to digital industrial production.
65. Comprehensive data collection enabled by the IoT may lead to loss of privacy, with advances in
data analytics making it possible to sometimes infer sensitive information, including from non-personal
data (e.g. meta-data). The misuse of this possibility can affect core social values and principles, such as
individual autonomy, equality and free speech. Meanwhile the applicability of core principles on which
privacy protection relies (e.g. the definition of personal data and the role of consent) is being challenged by
the huge volume, velocity, and variety of the data being collected almost everywhere.
66. Data-driven innovation also raises challenges for competition authorities. These include
challenges in:
Defining the relevant market (the use of data enables the creation of multi-sided markets. Typical
examples include online platforms such as Facebook and Uber. However, the traditional
approach to market definition generally focuses on one side of the market);
Assessing the degree of market concentration (this rely on the analysis of market prices, however,
a large share of data-driven products are provided either for “free” in exchange for access to
personal data, and/or in addition to an offer of a bundle of premium services); and,
Assessing potential consumer detriments due to privacy violation (competition authorities tend to
direct specific privacy issues to the privacy protection authorities, which however have no
authority over competition issues) (see OECD, 2015b).
67. Furthermore, data and ICT use across borders can make it difficult for tax authorities to
determine where tax-relevant activities are carried out and where value is created (OECD, 2015a). Inherent
in this is the difficulty in measuring the monetary value of data, determining data ownership, and acquiring
a clear picture of the global distribution and interconnectedness of data-driven services.
68. Finally, the convergence of production infrastructure with ICTs, and the increasing role of
software, give IPRs and in particular copyright a strategic role as a point of control in future production.
Recent OECD (2015d) work already showed that, among the different types of IPRs, copyright’s
performance excels in terms of the magnitude of investment it attracts, the growth rate of that investment,
and the associated job growth. Copyright’s economic importance appears to be growing. In particular, in
much of the world copyright protects a significant amount of software investment.
69. The increasing role of IPRs for the future of manufacturing also comes with challenges. Concerns
have been raised that the control of strategic IPRs on which whole ecosystems rely today could favour
anticompetitive behaviour. This remains true despite the increasing use of open source software (OSS)
applications, which have eased some of the constraints that IT infrastructure users faced in the past (see
OECD, 2015b). For example, some have expressed concerns that the patent US 7650331 B1 on
MapReduce35
awarded to Google could put at risk companies that rely on the open source implementations
of MapReduce such as Hadoop and CouchDB. But given that Hadoop is widely used today, including by
large companies such as IBM, Oracle and others, as well as by Google, many consider that Google
“obtained the patent for ‘defensive’ purposes” (Paul, 2010).36
By granting a licence to (open source)
DSTI/CDEP(2016)13/REV1
31
Apache Hadoop under the Apache Contributor License Agreement (CLA), Google has officially eased
fears of legal action against the Hadoop and CouchDB projects (Metz, 2010).
70. Another area related to ICT-enabled production systems where IPRs might play a role are
application programming interfaces (APIs). Copyright protection for APIs can help to deter counterfeit
applications. Not only does copyright protection provide incentives for investment and innovation in
applications, it also promotes cybersecurity since counterfeit applications may be used to introduce
malware in production systems. However, some experts have raised concerns that copyrighting APIs could
also adversely affect the creation and adoption of new applications, and that control of IPRs related to APIs
could lead to anticompetitive behaviour.37
Trends towards more closed APIs are therefore raising concerns
among some actors that rely on open APIs for their innovative services.
Policy considerations
71. Based on the discussion in the previous section a number of policy considerations can be derived.
These policy considerations can be clustered around three objectives: (i) promoting investments in ICT and
data, including investments in complementary organisational change; (ii) supporting the development of
skills and competences for the digitalisation of production; and, (iii) addressing emerging risks and
uncertainties, related either to the use of new digital technologies or to inefficiencies in current regulatory
frameworks.
Promoting investments in and use of ICT and data
1. Governments aiming to promote the supply of key ICTs should consider supporting
investments in R&D in enabling technologies such as big data analytics, cloud and high-
performance computing, and the IoT, as well as in security- and privacy-enhancing technologies.
Through its 2014 national digital economy strategy, Canada for instance foresees investments
worth CAD 15 million over three years to support leading-edge research in, and the
commercialisation of, quantum technologies. And France intends to invest EUR 150 million to
support R&D in five technologies identified as strategic: the IoT, super and cloud computing, big
data analytics, and security.
2. Governments should consider using demand-side policies to encourage the investments in
and adoption of key enabling ICTs, especially by SMEs. This can be done through activities
such as awareness raising, training, mentoring and voucher schemes (see Box 11). These
measures should also aim at fostering investments in complementary forms of knowledge-based
capital (KBC), including in particular organisational change (see OECD, 2016b). Demand-side
policies should also be complementary to (existing) ICT supply-side policies (e.g. R&D
programmes and national broadband strategies). In Germany, for example, policies supporting
investments in R&D related to industrial ICT applications, IT security research, microelectronics
and digital services, are complemented with demand-side policies such as awareness raising and
training (for instance through two Big Data Solution Centres established in Berlin and Dresden).
Furthermore, the German government has gathered more than 260 examples of the successful
implementation of ‘Industrie 4.0’ in an interactive online map.38
DSTI/CDEP(2016)13/REV1
32
Box 11. Selected government initiatives promoting ICT adoption by SMEs
Many governments have initiatives to promote ICT adoption by SMEs, some as part of their national digital strategies, others through separate strategies and programmes. These initiatives are often motivated by the recognition that insufficient knowledge and financial resources, but also barriers to organisational change, often inhibit the effective use of ICTs. In particular smaller firms which too often do not have internal IT departments or in-house know-how are affected as they lack the financial resources needed to invest in ICTs or to engage with external ICT services firms. Most initiatives targeting SMEs focus on: (i) awareness raising and training, often with a focus on enhancing ICT-related and sometime also organisational know-how, (ii) financial support, and (iii) social networking.
In Canada, for example, the Business Development Bank of Canada (BDC) realigned its existing support to SMEs in 2011 to focus on ICT adoption. Its support is designed around the following three stages: (i) awareness raising in particular via the provision of eBooks and articles, success stories and testimonials, and free ICT assessment describing a company’s technology situation in relation to other Canadian SMEs; (ii) consideration and engagement through financial support for consulting services to help SMEs tailor ICT solutions to their business, and to address financial challenges more specifically (iii) loans to purchase hardware, software and consulting services (with a budget of CAD 200 million). Interest in and use of these offerings has been stronger than expected. In the first 18 months of the initiative’s existence from October 2011 to May 2013, the BDC SmartTech website had almost 220,000 visitors; the two e-books were downloaded over 10,000 times; and BDC undertook over 35 000 online web assessments, around 900 ICT assessments, and over 300 consulting mandates. In addition, BDC averaged 130 ICT loans per month, but provided nearly 1 800 loans. However, the BDC only serves a small and specific segment of the SME market in Canada, and there are many firms not captured by these offerings who would benefit from increased adoption.
Another example, is the initiative “Mittelstand-Digital” (EN „SMEs digital“) of Germany’s Federal Ministry of Economic Affairs and Energy (Bundesministerium für Wirtschaft und Energie, BMWi) that aims to show SMEs and skilled crafts the importance of using software for business processes and to support these enterprises in digitising their businesses. The initiative builds on three pillars, including:
1. German Mittelstand 4.0 – Digital Production and Work Processes, which aims to support SMEs and skilled crafts in digitalising business processes and deploying “Industrie 4.0” applications via Competence Centres. Among others, focus is put on raising awareness of the opportunities and challenges, enhancing technological and organisational competences, and providing opportunities for demonstrations and testing;
2. Simply intuitive – Usability for SMEs, which aims at providing development and testing support mechanisms for SMEs to increase quality and usability of business and production software in SMEs. This pillar is motivated by the recognition that software for SMEs have mostly ignored aspects of usability, which however have become an important aspect of end-user software; and,
3. eStandards – Standardising Business Processes, Securing Success, which aims at developing a “common language” for SMEs and skilled crafts of different fields of business to enable efficient data exchange. This pillar is motivated by findings that SMEs face considerable initial costs if they want to use and implement e-standards.
The initiative “Mittelstand-Digital” so far shows that trust is important for SMEs. Unbiased, official information produced by the Federal Government has found broad acceptance, while information provided by commercial IT consultants is seen rather sceptically. Creating networks between stakeholders, where entrepreneurs can learn from each other, has helped to create acceptance among SMEs.
In Korea, as another example, 17 creative economy & innovation centers have been created nationwide to promote digital innovation. A significant number of centers focus on digital innovation in production. Local governments and big Korean corporations (e.g. SKT, Hyundai-Kia, GS, Doosan, LG, Samsung and Lotte) are jointly operating the regional centers. The tasks of these centers include: supporting start-ups and SMEs in each specialty area, organizing the partnership or ecological relations between the relevant big corporation and regional enterprises, arranging funds for them to overcome financial difficulties, encouraging managerial and technological innovation and advisory services (called mentoring), promoting communications and cooperative works among participants, and exploring new markets at home and overseas in a concerted manner.
Source: OECD (2016b)
DSTI/CDEP(2016)13/REV1
33
3. Governments should develop an innovation policy mix that encourages investments in data (its collection, curation, reuse and linkage) that have positive spillovers across industries, while
addressing the low appropriation of returns to data sharing. This particularly relevant for data
with social value larger than the private value. To address the appropriation challenge, the
combination of intellectual property rights (IPR), licences and alternative incentive mechanisms
such as data citations, data donation or philanthropy need to be considered further. One example
of where alternative incentive mechanisms have been effective is in science and research.
Researchers wishing to be acknowledged for their work can release data sets through
mechanisms similar to that already in place for citations of academic articles. However, data
citation is still not a widely accepted concept in the academic community.
4. Promoting open standards, including in application programming interfaces (APIs) and
data formats can be key. Standards based on pro-competitive and technologically open
reference models could be promoted to boost the interoperability and the reuse of data and digital
services, and to reduce technological lock-ins, while enhancing competition among service
providers (see OECD, 2015a, Chapter 2). For example, the Information Economy Strategy of the
United Kingdom aims at "ensuring that key building block standards are deployed – to enable
businesses to easily build innovative systems which remain open to further new ideas". The UK
Government is therefore working through ETSI, BSI and other bodies in the standards field, to
bring together a range of stakeholders to align programmes, to build on existing knowledge and
to put the United Kingdom in the best position to influence future standards at an international
level. The German government as another example is promoting standards to ensure interlinking
between traditional industries and the ICT sector. This includes initiatives such as eStandards –
Standardising Business Processes, Securing Success, which aims at developing a “common
language” for SMEs and skilled crafts of different fields of business to enable efficient data
exchange (see Box 10).
Supporting the development of skills and competences for the digitalisation of production
1. National education systems, in collaboration with business and trade unions, need to
support the development of ICT-related skills, starting with basic ICT skills, and including
data specialist skills. Related educational needs extend beyond ICT to include science,
technology, engineering and mathematics (STEM). This calls for measures to: (i) promote digital
literacy in schools; (ii) further develop vocational and on-the-job training; and, (iii) interlock
educational areas, for instance through the establishment of strategic alliances between
universities and businesses as well as interdisciplinary competence centres. Examples include
two Big Data Solution Centres established in Berlin and Dresden in the context of Germany's
national digital economy strategy (Digital Agenda 2014-2017).
2. Technical skills alone are not enough. Technical skills need to be complemented with know-
how in domain-specific issues (including know-how about the whole production process) as well
as "soft skills" such as communication, self-direction, creative thinking and problem solving.
OECD (2016d) shows that demand for such non-technical skills will continue to grow as the
diffusion of digital technologies and new business models changes how work is performed. These
skills are particularly important to address the effects of technologies that are disrupting existing
industries. Those with low skills are more likely to be displaced, so also improving their non-
technical skills will help them adapt to new occupations and new workplaces. Businesses and
their social partners also have important roles to play as illustrated by the best-practice examples
published by the German government on how to implement training and develop qualifications in
companies.39
DSTI/CDEP(2016)13/REV1
34
Addressing emerging risks and uncertainties
1. Governments may need to act if regulatory uncertainties prevent the adoption of ICTs. This
is especially the case if regulations that have been designed for the pre-digitalised world would
inadvertently shield incumbents from new competition that digitalisation could bring, thereby
thwarting digital innovation (see OECD, 2017a). For the IoT, for instance, removing regulatory
barriers to entry into the mobile market would allow the million-device customer, such as some
vehicle manufacturers, to become independent of the mobile network and would strengthen
competition (see OECD, 2016a). To take another example, in the automobile and mobility
services industry, existing taxi regulations may slow the diffusion of mobility services (including
ride sharing) applications, and may require review and reforms to permit app-based ride services
to continue. Similarly, technical solutions for self-driving trucks that are already available cannot
often be deployed because of existing regulatory frameworks.
2. Governments should support a culture of digital risk management, as promoted by the 2015
OECD Recommendation on Digital Security Risk Management for Economic and Social
Prosperity. Otherwise, stakeholders will continue to adopt a traditional security approach that not
only falls short of appropriately protecting assets in the current digital environment, but is also
likely to stifle innovation and growth (see OECD, 2016c). The usual barriers to the adoption of a
culture of digital risk management in businesses, and in particular SMEs, are a lack of know-how
related to digital risk management and the misunderstanding that digital security is a (technical)
IT management issue – it is rather a business management issue. To respond to this challenge,
governments have prioritised awareness raising, training and education on digital risk
management. The French national digital security strategy, for instance, foresees that the French
State Secretariat in charge of Digital Technology, along with the ministries concerned, coordinate
with the support of the National Cybersecurity Agency (ANSSI), the establishment of a
cybersecurity awareness programme for professionals in France.
3. Barriers to Internet openness, legitimate or otherwise, can limit the effects of digitalisation
and may require policy attention. Frequently encountered barriers include technical means
such as IP package filtering, which is used inter alia to optimise the flow of data for specific
purposes, or “data localisation” efforts, either through territorial routing or legal obligations to
locate servers in local markets. The limiting effects of barriers to Internet openness are
particularly severe in economies where deployment of data-driven services is poor due to failures
in ICT infrastructure markets. However, as highlighted in OECD (2016e), openness also presents
challenges, as some actors may take advantage of it when conducting malicious activities.
Barriers to Internet openness coming from business practices or government policies may thus
have a legal basis, such as the protection of privacy and IPRs, as well as a security rationale.
Governments looking to promote trade in digital services in their countries should take the OECD
2011 Council Recommendation on Principles for Internet Policy Making into consideration.
These principles aim to preserve the fundamental openness of the Internet and the free flow of
information.
4. Obstacles to the reuse, sharing and linkage of data should be examined. Obstacles to data
reuse, sharing and linkage take various forms. These include technical barriers, such as
constraints on the machine readability of data across platforms. Legal barriers can also prevent
data reuse, sharing and linkage. For example the “data hostage clauses” found in many terms of
service agreements have sometimes is an example of such legal barriers, in particular when this
"provision may be used to extract additional fees from the customer or to prevent the customer
from moving to another provider" (Becker, 2012).40
Non-discriminatory access to data (or
“access on equal terms”), including data commons or open data, as well as data portability should
DSTI/CDEP(2016)13/REV1
35
be explored to support the production of goods with public and social benefits without requiring
governments or businesses to pick winners (whether users or applications) (see Box 12).
Box 12. Improving agricultural performance with open data: the case of USDA
As farming is becoming increasingly data driven, farmers need data to be competitive. For entry-level farmers, who may not own historical data, the lack of data could thus become a competitive disadvantage.
To address this challenge, the U.S. Department of Agriculture (USDA) has made its data openly available. These include data on food supply, economic demand, and remote sensing that are made available as part of its Agricultural Statistical Service (NASS) and its Economic Research Service (ERS). Many data sets span the past 100 years and are provided through APIs. NASS offers, for instance, a CropScape API that provides direct access to a raster image dataset containing an agriculture-specific land cover classification published annually at the end of the growing season, as well as a VegScape API that provides direct access to a raster image dataset on crop condition vegetation, published on biweekly timescales throughout the year. USDA also provides ERS data on Farm Financial and Crop Production Practices, including data on production practices and costs (such as fertilizer, pesticide, labour, tillage, and seeds) and on financial information for farm businesses, as well as a variety of financial and demographic information (such as age, education, occupation, off-farm income) for farm operators and their households.
To promote the reuse of its data, USDA, in collaboration with Microsoft, initiated the Innovation Challenge, a competition (hackathon) to develop data-driven software applications to explore how climate change could affect the resilience of food systems in the United States. USD 63 000 in prizes were offered for applications that use the USDA data and provide actionable insights to farmers, agricultural businesses, scientists, or consumers across the United States. One winning application, FarmPlenty Local Crop Trends, helps farmers find the best crops by browsing nearby crops, trends, and prices: "Using this information, a farmer can better understand what crops are becoming more popular or unpopular in the region and anticipate changes in prices and demand."
41
5. Coherent data governance frameworks should be developed. Access to data should not
necessarily be free or unregulated: a balance is needed between data openness (and the
consequent social benefits of greater access and reuse of data), and the legitimate concerns of
those whose privacy and IPRs may be negatively affected. This calls for a whole-of-government
approach in the application and enforcement of data governance and IPR frameworks. So far no
commonly agreed data governance framework exists that would support the reuse, sharing and
linkage of data across sectors. Issues that would need to be addressed by such a framework could
include, among others, questions related to accountability, data ownership, data curation and the
repurposed reuse of data. In the context of business-to-business (B2B) transactions, these
questions could potentially be and are often addressed by bilateral contractual arrangements.
However even then standards and best practices are needed to reduce exposure to digital risks in
supply chains.
6. Governments may seek to promote the responsible use of personal data to prevent
violations of privacy. Efforts to promote privacy-enhancing technologies and the empowerment
of individuals through greater transparency of data processing, and through data portability, via
such initiatives as midata (United Kingdom) and MesInfos (France) should be further considered.
Governments may need to increase the effectiveness (i.e. resourcing and technical expertise) of
privacy enforcement authorities. Data protection regulations should aim to offer a high level of
privacy protection and be easily implementable, with the goal of widespread adoption.
7. Governments may need to assess market concentration and competition barriers using up-
to-date definitions of the relevant market and consideration of potential consumer detriments due
to privacy violations. This may also require fostering dialogue between regulatory authorities (in
particular in the area of competition, privacy and consumer protection) as highlighted in OECD
(2015a, Chapter 2).
DSTI/CDEP(2016)13/REV1
36
8. Further thinking is needed on the attribution of responsibility and liability, for
inappropriate decisions, between decision makers and providers of data and data analytics. Governments may have to assess to what extent existing regulation and legislation can address
challenges related to the attribution of responsibility and liability. Multi stakeholder dialogue at
national and international level may help by exchanging best practices and helping to develop
compatible approaches to addressing these challenges.
9. Also needed is careful examination of the appropriateness of fully automated decision
making, transparency requirements and required human intervention in areas where the
potential harm of decisions could be significant. Policymakers should consider that
transparency requirements may need to extend to the processes and algorithms underlying
automated decisions. These transparency requirements may come into tension with existing
intellectual property rights and the processes and algorithms at the core of certain business’
operations. More studies are needed to determine how best to assess the appropriateness of
algorithms without violating existing IPRs.
10. Governments may need to encourage improved measurement to help better assess the
economic value of data, and to prevent base erosion and profit shifting. Such base erosion
and profit shifting occurs through aggressive tax planning by firms seeking to artificially reduce
taxable income or shift profits to low-tax jurisdictions by taking advantage of the intangible
nature of data and with that the ease of moving data across jurisdictions and inconsistencies in the
measurement of data’s economic value (see OECD, 2015a, Chapter 2).
DSTI/CDEP(2016)13/REV1
37
NOTES
1 Advanced ICTs, such as ERP software, are thought to enhance firm competitiveness by synchronizing
internal business processes and by providing real-time data for management decision making, thereby
reducing structural barriers between departments and allowing for greater collaboration and innovation (for
the quantification of the beneficial effects of ERP investments on firm performance see Hitt and Zhou,
2002).
2 Rolls-Royce uses big data to reduce down-time for its engines. Its on-board analytics transmit only data
that deviates from normal. So its employees monitor engines while they are in operation. As a result, they
can intervene to address any issues before they become big problems that might result in a disruption of
service. This approach also supports Rolls’ “power by the hour,” contracts for services. This lets Rolls-
Royce sell engines as a service, not a product (see also Michelin’s “kilometer by the hour” offering).
3 This represents an average annual (year-on-year) growth of 1.7%. This potential arises from the sum of the
expected additional value added for mechanical (EUR 23 billion at an expected y-o-y growth of 2.21%),
electrical (EUR 13 billion, +2.21%), automotive (EUR 15 billion, +1.53%), chemical (EUR 12 billion,
+2.21%), agriculture (EUR 3 billion, 1.17%) and ICT sectors (EUR 14 billion, 1.17%).
4 Figure 3 is highly stylised, and does not show many of the complex relationships and feedback loops
between these technologies
5 However, these estimates can hardly be generalised, for a number of reasons. First, the estimated effects of
DDI vary by sector and are subject to complementary factors such as the availability of skills and
competences, and the availability and quality (i.e. relevance and timeliness) of the data used. More
importantly, these studies often suffer from selection biases. For instance, it is unclear whether the firms
adopting DDI became more productive due to DDI, or whether they were more productive in the first
place. Furthermore, all these studies rarely control for the possibility that some firms may have seen a
reduction in productivity due to DDI, and so may have discontinued their investment in it.
6 This estimate uses Value Added by Industry data from the U.S. Bureau of Economic Analysis. It is part of
the “GDP by industry” data base.
http://www.bea.gov/iTable/iTable.cfm?ReqID=51&step=1#reqid=51&step=51&isuri=1&5114=a&5102=1
7 The Fort Hays State study employed a mathematical estimating tool. It studied 1 445 fields with a total of
135 755 acres in three states.
8 “AutoTrac™ Vision uses a front-mounted camera to see early-season corn, soybeans and cotton at least 4
to 6 inches high.” It helps farmers avoid damaging crops with sprayer wheels even if a planter was
misaligned. John Deere, “AutoTrac™ Vision,”
https://www.deere.com/en_US/products/equipment/ag_management_solutions/guidance/auto-trac-
vision/auto-trac-vision.page
9 See “Turning Yield Potential into Yield Performance,” http://www.farmlink.com/trueharvest/, accessed 3
October 2016.
DSTI/CDEP(2016)13/REV1
38
10
This description is from a job posting by John Deere for a data scientist. It comes from
https://www.glassdoor.com/Job/jobs.htm?suggestCount=0&suggestChosen=false&clickSource=searchBtn
&typed
11 According to a market forecast, this market would include a number of technologies that are integrated
together, essentially guidance systems, remote sensing and Variable Rate Technologies. The largest would
be guidance systems with GPS, GIS and GNSS systems etc. The market forecast finds that various
monitoring and mapping systems would be more important and that software applications, that is, those
applications for crop, farm and weather management, would grow faster during the forecast period. (see
Mordor Intelligence, “Global Precision.”)
12 Cloud computing can be classified into three different service models according to the resources it
provides: infrastructure as a service (IaaS) provides users with managed and scalable raw resources such as
storage and computing resources; platform as a service (PaaS) provides computational resources (full
software stack) via a platform on which applications and services can be developed and hosted; and
software as a service (SaaS) offers applications running on a cloud infrastructure. Sometimes clouds are
also classified into private, public, and hybrid, according to their ownership and management control.
13 While this was previously largely a priority for airlines, Boeing’s access to a wide range of information
about aircraft performance and management via the Internet of Things has given it a significant role in
interpreting real time data and aircraft performance. This changes its economic role with respect to the
airline industry.
14 Boeing implemented a more sophisticated supply chain for its 787 model, but because of problems with
suppliers lost billions in work on the innovative airplane (see Denning, 2013).
15 See Boeing, “Factory for the Future,” August 22, 2013. http://www.boeing.com/features/2013/08/factory-
for-the-future-08-22-13.page (accessed 03 October 2016). See Also, Airbus Group, “Factory of the
Future,” http://www.airbusgroup.com/int/en/story-overview/factory-of-the-future.html# (accessed 03
October 2016).
16 As a result of its simulation, Ford for instance introduced an aluminium chassis that reduced cost and
increased profitability. By some accounts, Ford is making a 50% profit on new F-150 trucks.
17 A report of a stakeholder organisation states that in 2020 benefits of the IoT could be at USD 2 trillion,
whereas USD 1 trillion could be based on cost reductions (e.g. by using smart meters where the estimation
is that already 1.1 billion devices could be used in 2022) and another USD trillion could come from
improved services such as remote monitoring of chronically ill patients. These figures are outnumbered by
an analysis which predicts that for the car industry alone annual global savings of over USD 5.6 trillion
could be achieved by cars based on advanced connectivity technology (semi-autonomous and completely
autonomous cars) (see www.morganstanley.com/articles/autonomous-cars-the-future-is-now, accessed 08
February 2016.
18 Driverless cars such as Google’s driverless cars are based on the collection of data from all the sensors
connected to the car (including video cameras and radar systems), and combines it with data from Google
Maps and Google Street View (for data on landmarks, traffic signs and lights).
19 A firm that invest USD 1 million on a large scale enterprise software installation faces a one-time expense
that cannot be recovered once spent.
20 See http://www.mckinsey.com/industries/high-tech/our-insights/disruptive-trends-that-will-transform-the-
auto-industry, accessed 15 January 2017
DSTI/CDEP(2016)13/REV1
39
21
While Internet firms among the top 250 ICT firms generated on average more than USD 1 million in
annual revenues per employee in 2012 and more than USD 800 000 in 2013, the other top ICT firms
generated around USD 200 000 (IT services firms) to USD 500 000 (software firms) (OECD, 2015b).
22 With Power by the Hour, “Customers and suppliers of mission-critical products, such as semi-conductor
manufacturing equipment, commercial aircraft and military weapon systems, are recognizing that the
acquisition of world-class products is not sufficient, but rather it is necessary to provide superior, cost
effective maintenance and support services throughout the after-sales phase of the customer-supplier
relationship. A major focus of these efforts involves re-designing the contractual and implicit relationships
between customers and suppliers in the service support supply chain.” (Knowledge@Wharton, 2007)
23 See Nick Frank's “Interview with Dave Gordon [of Rolls Royce]” at the International Society of Service
Innovation Professionals, July 2014. https://www.youtube.com/watch?v=Ldsmpd6yMBo accessed 03
October 2016.
24 Ibid.
25 Information on the economic value of “zero-based disruption” is not available. A case study of FANUC’s
zero downtime efforts suggests that it might reduce GM’s downtime and save GM USD 40 million a year
(see Roboglobal, 2016 and Cisco, 2016).
26 As Mayer-Schönberger and Cukier (2013) explain: “To datafy a phenomenon is to put it in a quantified
format so it can be tabulated and analyzed”.
27 Infotainment is a portmanteau for information and entertainment. "Typical tasks that can be performed with
an in-vehicle infotainment system include managing and playing audio content, utilizing navigation for
driving, delivering rear-seat entertainment such as movies, games, social networking, etc., listening to
incoming and sending outgoing SMS text messages, making phone calls, and accessing Internet-enabled or
smartphone-enabled content such as traffic conditions, sports scores and weather forecasts" (Beal, 2016).
28 Daimler is still seen as one of the leading automobile firms in terms of (semi-) autonomous cars. At the
Consumer Electronics Show in Las Vegas in January 2015, Daimler presented its Mercedes F 015, which
drove itself onto the showroom floor.
29 “Contract farming can be defined as agricultural production carried out according to an agreement between
a buyer and farmers, which establishes conditions for the production and marketing of a farm product or
products. Typically, the farmer agrees to provide agreed quantities of a specific agricultural product.” (see
www.fao.org/ag/ags/contract-farming/faq/en/, accessed 15 October 2016).
30 For 2030, it is estimated that 8 billion people and maybe 25 billion active “smart” devices will be
interconnected and interwoven by one single huge information network, leading to the emergence of an
intelligent “superorganism” in which the Internet represents the “global digital nervous system”
(Radermacher and Beyers, 2011; O’Reilly, 2014).
31 For example, workers in Amazon’s warehouses in the United Kingdom are reported to walk between 11
and 24 kilometres per day (O’Connor, 2013).
32 Before the system can function, it has to model the position of all goods in the warehouse and the most
efficient paths and distribution.
33 As Perkins (2003) explains: “Central to the idea of lock-in is that technologies and technological systems
follow specific paths that are difficult and costly to escape. Consequently, they tend to persist for extended
periods, even in the face of competition from potentially superior substitutes. Thus, lock-in is said to
DSTI/CDEP(2016)13/REV1
40
account for the continued use of a range of supposedly inferior technologies, ranging from the QWERTY
keyboard to the internal combustion engine.”
34 In 2013, ICT investment in the OECD area represented 13.5% of total fixed investment or 2.7% of GDP,
with over two thirds of ICT investment being devoted to software and databases.
35 MapReduce is a programming framework for processing large data sets in a distributed fashion presented
in a paper by Dean and Ghemawat (2004). In 2006, the open source implementation of MapReduce, called
Hadoop, emerged. Initially funded by Yahoo, Hadoop is now provided as an open source solution (under
the Apache License) and has become the engine behind many of today’s big data processing platforms.
Beside Yahoo, Hadoop is ushering in many data-driven goods and services offered by Internet firms such
as Amazon, eBay, Facebook, and LinkedIn.
36 As Paul (2010) explains: “Many companies in technical fields attempt to collect as many broad patents as
they can so that they will have ammunition with which to retaliate when they are faced with patent
infringement lawsuits.” For more on IP strategies (see OECD, 2015d).
37 The debate on the ability of legal entities to copyright APIs has gained significant momentum after a recent
petition by the Electronic Frontier Foundation (EFF, 2014) to the United States Supreme Court in
November 2014 (see Brief of Amici Curiae Computer Scientists in Support of Petitioner, Google Inc. v
Oracle America, Inc., Supreme Court of the United States, No. 14-410, November 7, 2014). The petition
follows a court finding earlier in May 2012 that Google had infringed on Oracle’s copyright on Java APIs
in Android, “but the jury could not agree on whether it constituted fair use” (Duckett, 2014).
38 See www.plattform-i40.de/I40/Navigation/DE/In-der-Praxis/Karte/karte.html, accessed 16 January 2017.
39 See www.plattform-i40.de/I40/Redaktion/DE/Downloads/Publikation/digitale-transformation-im-betrieb-
aus-und-weiterbildung.pdf, accessed 16 January 2017.
40 As Becker (2012) explains: “Data hostage clauses are employed when a contract between a cloud provider
and customer is improperly terminated by the customer in order to allow the cloud provider to hold on to a
customer’s data until the customer has paid a termination fee or compensated the cloud provider for lost
business through liquidated damages. In some cases, however, this data hostage provision may be used to
extract additional fees from the customer or to prevent the customer from moving to another provider.”
41 See http://devpost.com/software/farmplenty-local-crop-trends, accessed 15 January 2017
DSTI/CDEP(2016)13/REV1
41
REFERENCES
Adler, D., J. Herkamp, D. Henricks and R. Moss, “Does a manufacturing execution system reduce
the cost of production for bulk pharmaceuticals?,” ISA Transactions, vol. 34, issue 4, Dec. 1995, pp.
343–347.
Agweb (2015), “John Deere to Purchase Precision Planting,” Agweb, November 4, 2015.
http://www.agweb.com/article/john-deere-to-purchase-precision-planting-naa-agwebcom-editors/
Amazon (2014a), Amazon Mechanical Turk FAQs,
http://aws.amazon.com/mturk/faqs/#Can_international_Requesters_use_Amazon_Mechanical_Turk
_to_get_tasks_completed, accessed 17 December 2014.
Amazon (2014b), Worker Web Site FAQs,
https://www.mturk.com/mturk/help?helpPage=worker#how_paid, accessed 17 December 2014.
Arthur, L. (2016), “Getting the Right Team on the Field: Creating an Advantage by Connecting People,
Equipment, Technology, and Insights,” John Deere presentations,
https://infoag.org/presentations/2215.pdf
Bakhshi, H., A. Bravo-Biosca, and J. Mateos-Garcia, (2014), “Inside the datavores: Estimating the effect
of data and online analytics on firm performance”, Nesta, March,
www.nesta.org.uk/sites/default/files/inside_the_datavores_technical_report.pdf, accessed 13 May
2015.
Bakhshi, H. and J. Mateos-Garcia (2012), “Rise of the datavores: How UK businesses analyse and use
online data”, Nesta, November, www.nesta.org.uk/sites/default/files/rise_of_the_datavores.pdf,
accessed 13 May 2015.
Barua, A., D. Mani, R. Mukherjee (2013), „Impacts of effective data on business innovation and growth”,
Chapter Two of a three-part study, University of Texas at Austin,
www.businesswire.com/news/home/20100927005388/en/Sybase-University-Texas-Study-Reveals-
Incremental-Improvement, accessed 20 May 2015.
Beal, V. (2016), "In-Vehicle Infotainment (IVI)", Webopedia, www.webopedia.com/TERM/I/in-vehicle-
infotainment-ivi.html, accessed 15 October 2016.
Becker, M. B. (2012), “Interoperability Case Study: Cloud Computing”, The Berkman Center for Internet
& Society Research Publication Series, Research Publication No. 2012-11, April 2012, available at:
http://papers.ssrn.com/sol3/papers.cfm?abstract_id=2046987.
Big Data Startups (2013), “Walmart is making big data part of its DNA”, www.bigdata-
startups.com/BigData-startup/walmart-making-big-data-part-dna/, accessed 22 August 2014.
BITKOM and Fraunhofer (2014), “Industrie 4.0 – Volkswirtschaftliches Potenzial für Deutschland”,
www.bitkom.org/files/documents/Studie_Industrie_4.0.pdf, accessed 15 June 2015.
DSTI/CDEP(2016)13/REV1
42
Boeing (2013), “24/7 Customer Support,”, July, http://www.boeing.com/features/2013/07/bca-24-7-
customer-sppt-07-30-13.page
Bruner, J. (2013), “Defining the industrial Internet” O'Reilly Radar, 11 January,
http://radar.oreilly.com/2013/01/defining-the-industrial-internet.html.
Brynjolfsson, E., L.M. Hitt and H.H. Kim (2011), “Strength in Numbers: How Does Data-Driven
Decisionmaking Affect Firm Performance?”, Social Science Research Network (SSRN), 22 April,
http://papers.ssrn.com/sol3/papers.cfm?abstract_id=1819486.
Chick, S., S. Netessine and A. Huchzermeier (2014), “When big data meets manufacturing”, Knowledge,
INSEAD, 16 April, http://knowledge.insead.edu/operations-management/when-big-data-meets-
manufacturing-3297, accessed 15 May 2015.
Cisco (2016), “Digital Transformation with the Internet of Everything”, 100 Customer Stories
http://www.cisco.com/c/dam/m/en_us/ioe/digital-transformation-stories/digital-transformation-with-
the-internet-of-everything.pdf.
Crabbe, J. (2013), “Cutting Edge IT at Boeing: Transforming Commercial Aviation using WS02,”
WSO2Con US 2013. http://wso2.com/blogs/thesource/2014/02/wso2con-insights-how-boeing-
transformed-commercial-aviation-using-wso2/
Cushing, E. (2013), “Amazon Mechanical Turk: The digital sweatshop”, UTNE, January/February,
www.utne.com/science-and-technology/amazon-mechanical-turk-zm0z13jfzlin.aspx, accessed 25
May 2015.
Daugherty, P. , Prith Banerjee, Walid Negm and Allan E. Alter (2015), “Driving Unconventional Growth
through the Industrial Internet of Things,” Accenture Technology, https://www.accenture.com/us-
en/labs-insight-industrial-internet-of-things
Dean, J. and S. Ghemawat (2004), “MapReduce: Simplified data processing on large clusters”, in Sixth
Symposium on Operating System Design and Implementation (OSDI’04), December, San Francisco,
http://research.google.com/archive/mapreduce.html, accessed 12 June 2015.
Deere & Company (2016), “John Deere: Committed to Those Linked to the Land: Investor Presentation,”
March / April 2016, pp. 11-12.
Denning, S. (2013), “What went wrong at Boeing?” Forbes blog,
http://www.forbes.com/sites/stevedenning/2013/01/21/what-went-wrong-at-
boeing/#2715e4857a0b77270ce75aad
Dholakia, U. (2015), "My Experience as an Amazon Mechanical Turk (MTurk) Worker", LinkedIn Pulse,
20 July, www.linkedin.com/pulse/my-experience-amazon-mechanical-turk-mturk-worker-utpal-
dholakia.
Duckett, C. (2014), “Computing experts call for repeal of copyrightable API decision”, ZDnet,
10 November, www.zdnet.com/computing-experts-call-for-repeal-of-copyrightable-api-decision-
7000035590/.
Economist Intelligence Unit (2014), “Networked manufacturing: The digital future”, Economist
Intelligence Unit sponsored by Siemens, 7 July, www.economistinsights.com/technology-
innovation/analysis/networked-manufacturing.
DSTI/CDEP(2016)13/REV1
43
Economist Intelligence Unit (2012), “The deciding factor: big data & decision making”, Economist
Intelligence Unit commissioned by Capgemini, 4 June, www.capgemini.com/insights-and-
resources/by-publication/the-deciding-factor-big-data-decision-making/.
Evans, P. C. and M. Anninziata (2012), “Industrial Internet: Pushing the Boundaries of Minds and
Machines”, General Electrics, 26 November, www.ge.com/docs/chapters/Industrial_Internet.pdf.
Ewing, J. (2015), " Apple and Google Create a Buzz at Frankfurt Motor Show", New York Times, 17
September, www.nytimes.com/2015/09/18/automobiles/apples-auto-inroads-create-a-buzz-at-
frankfurt-motor-show.html.
Gao, P. H.-W. Kaas, D. Mohr, D. Wee (2016), " Disruptive trends that will transform the auto industry",
McKinsey&Company, January, www.mckinsey.com/industries/high-tech/our-insights/disruptive-
trends-that-will-transform-the-auto-industry.
Gino, F. and B.R. Staats (2012), “Samasource: Give work, not aid”, Harvard Business School NOM Unit
Case No. 912-011; UNC Kenan-Flagler Research Paper No. 2013-12, 22 February 2012,
http://ssrn.com/abstract=2014220, accessed 26 May 2015.
Grassi Matthew J. and Paul Schrimpf (2015), “Deere, Precision Planting Deal: 7 Things We Learned,”
PrecisionAg, November 3, http://www.precisionag.com/technology/equipment/deere-precision-
planting-deal-7-things-we-learned/
Harris, D. (2017), “Compare Manufacturing Execution Systems (MES): Buyer's Guide”, 14 January,
www.softwareadvice.com/manufacturing/execution-systems-comparison/.
Harris, M. (2014), "Amazon's Mechanical Turk workers protest: 'I am a human being, not an algorithm'",
The Guardian, 3 December, www.theguardian.com/technology/2014/dec/03/amazon-mechanical-
turk-workers-protest-jeff-bezos.
Hitt, L, and Xiaoge Zhou. (2002). “Investment in Enterprise Resource Planning: Business Impact and
Productivity Measures.” Journal of Management Information Systems 19 (1): 71–98.
Horton, J.J. (2011), “The condition of the Turking class: Are online employers fair and honest?”,
Economics Letters, Vol. 111, pp. 10-12,
http://econpapers.repec.org/article/eeeecolet/v_3a111_3ay_3a2011_3ai_3a1_3ap_3a10-12.htm,
accessed 26 May 2015.
Horton, J.J. and L.B. Chilton (2010), “The labor economics of paid crowdsourcing”, Proceedings of the
11th ACM Conference on Electronic Commerce, pp. 209-18.
Ipeirotis, P. (2013), “Mechanical Turk account verification: Why Amazon disables so many accounts”,
Blog post, 28 June, www.behind-the-enemy-lines.com/2013/06/mechanical-turk-account-
verification.html.
Ipeirotis, P. (2010), “Demographics of Mechanical Turk”, working paper, h
www.researchgate.net/profile/Panos_Ipeirotis/publication/228140347_Demographics_of_Mechanica
l_Turk/links/00b7d51b0945c43fb5000000.pdf, accessed 7 December 2014.
Jahangir Mohammed, J. (2014), “Surprise: Agriculture is doing more with IoT Innovation than most other
industries,” http://venturebeat.com/2014/12/07/surprise-agriculture-is-doing-more-with-iot-
innovation-than-most-other-industries/.
DSTI/CDEP(2016)13/REV1
44
Jasperneite, J. (2012), “Was hinter Begriffen wie Industrie 4.0 steckt”, computer-automation.de, 19
December, www.computer-automation.de/steuerungsebene/steuern-regeln/artikel/93559/0/.
John Deere (2015), “The Payoff from Precision Agriculture,” https://johndeerejournal.com/2015/08/the-
payoff-from-precision-agriculture/, accessed 3 October 2016.
Knowledge@Wharton (2007), “‘Power by the Hour’: Can Paying Only for Performance Redefine How
Products Are Sold and Serviced?” Wharton School, University of Pennsylvania, 21 February,
http://knowledge.wharton.upenn.edu/article/power-by-the-hour-can-paying-only-for-performance-
redefine-how-products-are-sold-and-serviced/
Lodefalk, M. (2010), “Servicification of manufacturing - Evidence from Swedish firm and enterprise group
level data”, Working Papers No. 2010:3, Örebro University, School of Business,
http://ideas.repec.org/p/hhs/oruesi/2010_003.html.
Markoff, J. (2012), “Skilled Work, Without the Worker”, The iEconomy, Part 6: Artificial Competence,
New York Times, 18 August.
Marr, B. (2015), “That’s Data Science: Airbus Puts 10,000 Sensors in Every Single Wing!” April 15, 2015.
http://www.datasciencecentral.com/profiles/blogs/that-s-data-science-airbus-puts-10-000-sensors-in-
every-single
McKinsey Global Institute [MGI] (2015), “The Internet of Things: Mapping the value beyond the hype”,
McKinsey & Company, Jun 2015,
www.mckinsey.com/insights/business_technology/the_internet_of_things_the_value_of_digitizing_t
he_physical_world.
MGI (2011), “Big data: The next frontier for innovation, competition and productivity”, McKinsey &
Company, June,
www.mckinsey.com/~/media/McKinsey/dotcom/Insights%20and%20pubs/MGI/Research/Technolog
y%20and%20Innovation/Big%20Data/MGI_big_data_full_report.ashx, accessed 15 June 2013.
Mordor Intelligence (2016), “Global Precision Farming Market- By Technology, Application and
Geography Market Shares, Forecasts and Trends (2015 – 2020),” March.
http://www.mordorintelligence.com/industry-reports/precision-farming-
market?gclid=Cj0KEQjw7LS6BRDo2Iz23au25OQBEiQAQa6hwK_VYHWSIw7Z_WCx8TEd8lU
OfqO3T5xJnApB-f49fokaAh_28P8HAQ.
MIC (2013), “Information and Communications in Japan”, White Paper, Ministry of Internal Affairs and
Communications, Japan.
MIT Technology Review (2010), “The truth about digital sweat shops”, 12 January,
www.technologyreview.com/view/417082/the-truth-about-digital-sweat-shops/.
Nasarwanji, A., D. Pearce, P. Khoudian, R. Worcester (2009), “The Impact of Manufacturing Execution
Systems on Labor Overheads”, Proceedings of the World Congress on Engineering 2009 Vol I,
WCE 2009, July 1 - 3, 2009, London, U.K.,
www.iaeng.org/publication/WCE2009/WCE2009_pp734-737.pdf.
Noyes, K. (2014), “Cropping up on every farm: Big data technology”, Fortune, 30 May,
http://fortune.com/2014/05/30/cropping-up-on-every-farm-big-data-technology/.
DSTI/CDEP(2016)13/REV1
45
O’Connor, S. (2013), “Amazon unpacked”, FT Magazine, 8 February, www.ft.com/intl/cms/s/2/ed6a985c-
70bd-11e2-85d0-00144feab49a.html#slide0, accessed 24 March 2015.
O’Reilly, T. (2014), “IoTH: The Internet of things and humans”, O’Reilly Radar, 16 April,
http://radar.oreilly.com/2014/04/ioth-the-internet-of-things-and-humans.html.
OECD (2017a), "Key Issues for Digital Transformation in the G20", Report prepared for a joint G20
German Presidency/OECD conference.
OECD (2016a), "The Internet of Things: Seizing the Benefits and Addressing the Challenges", OECD
Digital Economy Papers, No. 252, OECD Publishing, Paris.
DOI: http://dx.doi.org/10.1787/5jlwvzz8td0n-en
OECD (2016b), "Stimulating digital innovation for growth and inclusiveness: The role of policies for the
successful diffusion of ICT", OECD Digital Economy Papers, No. 256, OECD Publishing, Paris.
DOI: http://dx.doi.org/10.1787/5jlwqvhg3l31-en
OECD (2016c), "Managing Digital Security and Privacy Risk", OECD Digital Economy Papers, No. 254,
OECD Publishing, Paris.
DOI: http://dx.doi.org/10.1787/5jlwt49ccklt-en
OECD (2016d), "New Skills for the Digital Economy", OECD Digital Economy Papers, No. 258, OECD
Publishing, Paris.
DOI: http://dx.doi.org/10.1787/5jlwnkm2fc9x-en
OECD (2016e), "Economic and Social Benefits of Internet Openness", OECD Digital Economy Papers,
No. 257, OECD Publishing, Paris.
DOI: http://dx.doi.org/10.1787/5jlwqf2r97g5-en
OECD (2015a), Digital Economy Outlook 2015, OECD Publishing, Paris,
http://dx.doi.org/10.1787/9789264232440-en.
OECD (2015b), Data-Driven Innovation: Big Data for Growth and Well-Being, OECD Publishing, Paris.
DOI: http://dx.doi.org/10.1787/9789264229358-en.
OECD (2015c), OECD Science, Technology and Industry Scoreboard 2015: Innovation for growth and
society, OECD Publishing, Paris. DOI: http://dx.doi.org/10.1787/sti_scoreboard-2015-en.
OECD (2015d), Inquiries into Intellectual Property’s Economic Impact, OECD Publishing, Paris,
www.oecd.org/sti/ieconomy/intellectual-property-economic-impact.htm.
OECD (2014), “Cloud computing: The concept, impacts and the role of government policy”, OECD
Digital Economy Papers, No. 240, OECD Publishing, Paris, http://dx.doi.org/10.1787/5jxzf4lcc7f5-
en.
OECD (2013), “Exploring Data-Driven Innovation as a New Source Of Growth: Mapping the Policy
Issues Raised by ‘Big Data’”, OECD Digital Economy Papers, No. 222, OECD Publishing.
doi: 10.1787/5k47zw3fcp43-en.
Paul, R. (2010), “Google’s MapReduce patent: What does it mean for Hadoop?”, Arstechnica.com,
20 January, http://arstechnica.com/information-technology/2010/01/googles-mapreduce-patent-
what-does-it-mean-for-hadoop/, accessed 24 May 2015.
DSTI/CDEP(2016)13/REV1
46
Perkins, R. (2003), “Technological ‘lock-in’”, International Society for Ecological Economics, Internet
Encyclopaedia of Ecological Economics, available at: www.isecoeco.org/pdf/techlkin.pdf.
Radermacher, F.J. and B. Beyers (2007), Welt mit Zukunft – Überleben im 21. Jahrhundert [World with a
future – Surviving in the 21st century], Murmann Verlag, Hamburg (2nd edition of “Welt mit
Zukunft – Die Ökosoziale Perspektive, 2001).
Roboglobal (2016), “Big data, the cloud and . . . FANUC and Kuka?” Robo Global’s Robo News, June 17.
http://roboglobal.com/big-data-the-cloud-and-fanuc-and-kuka.
Ross, J. et al. (2010), “Who are the crowdworkers? – Shifting demographics in Amazon Mechanical Turk”,
CHI EA 2010, pp. 2863-72, www.international.ucla.edu/media/files/SocialCode-2009-
01.pdf?AspxAutoDetectCookieSupport=1, accessed 15 May 2015.
Rüßmann, M. M. Lorenz, P. Gerbert, M. Waldner, J. Justus, P. Engel, and M. Harnisch (2015), “Industry
4.0: The Future of Productivity and Growth in Manufacturing Industries”, Boston Consulting Group
[BCG], April,
www.bcgperspectives.com/content/articles/engineered_products_project_business_industry_40_futu
re_productivity_growth_manufacturing_industries/, accessed 08 February 2016.
Schimmelpfennig D. and R. Ebel, “Sequential Adoption and Cost Savings from Precision Agriculture,”
Journal of Agricultural and Resource Economics, volume 41(1):97–115.
http://papers.ssrn.com/sol3/papers.cfm?abstract_id=2714959 Tambe, P. (2014), “Big data
investment, skills, and firm value”, Management Science, forthcoming,
http://ssrn.com/abstract=2294077, accessed 10 June 2015.
Scott, A. (2015), “INSIGHT-Boeing uses its clout to control supplier consolidation,” Reuters, August 30,.
http://www.cnbc.com/2015/08/30/reuters-america-insight-boeing-uses-its-clout-to-control-supplier-
consolidation.html
Snatkin, A., K. Karjust, J. Majak, T. Aruväli and T. Eiskop (2013), “Real time production monitoring
system in SME”, Estonian Journal of Engineering, 19, 1, 62–75 doi: 10.3176/eng.2013.1.06
Strategic Direction (2004), “Meeting the manufacturing challenge: Performance advantage of MES”,
Strategic Direction, Vol. 20, Iss. 11, pp. 28 – 30. http://dx.doi.org/10.1108/02580540410567265.
Sullivan, G. P. , R. Pugh, A. P. Melendez and W. D. Hunt (2010), “Operations & Maintenance Best
Practices: A Guide to Achieving Operational Efficiency, Release 3.0,” Pacific Northwest National
Laboratory, U.S. Department of Energy, August.
Techlist (2014), “50,000 MTurk workers who have performed techlist HITs”,
http://techlist.com/mturk/global-mturk-worker-map.php, accessed 15 May 2015.
Turing, A.M. (1950), “Computing machinery and intelligence”, Mind, pp. 433-60.
Uddin, Z. (2012), “The dystopian digital sweatshop that makes the Internet run”, AlterNet, 11 September,
www.alternet.org/labor/dystopian-digital-sweatshop-makes-internet-run.
VMware (2011), “Business agility and the true economics of cloud computing”, business white paper,
www.vmware.com/files/pdf/accelerate/VMware_Business_Agility_and_the_True_Economics_of_C
loud_Computing_White_Paper.pdf.

DSTI/CDEP(2016)13/REV1
47
Vodafone (2015), “M2M Barometer 2015 report”, Vodafone, http://m2m-
mktg.vodafone.com/barometer2015.
WEF (2015), “Industrial Internet of Things: Unleashing the Potential of connected Products and Services”,
WEF Industry Agenda, January 2015,
http://www3.weforum.org/docs/WEFUSA_IndustrialInternet_Report2015.pdf.
Zittrain, J. (2009), “The Internet creates a new kind of sweatshop”, Newsweek, 12 August,
www.newsweek.com/internet-creates-new-kind-sweatshop-75751, accessed 15 May 2015