Membrane Organization at Low Cholesterol Concentrations: A Study Using...
12
Membrane Organization at Low Cholesterol Concentrations: A Study Using 7-Nitrobenz-2-oxa-1,3-diazol-4-yl-Labeled Cholesterol ² Sushmita Mukherjee ‡ and Amitabha Chattopadhyay* Centre for Cellular & Molecular Biology, Uppal Road, Hyderabad 500 007, India ReceiVed August 17, 1995; ReVised Manuscript ReceiVed NoVember 27, 1995 X ABSTRACT: Cholesterol is most often found distributed nonrandomly in the plane of the bilayer, giving rise to cholesterol-rich and -poor domains. Many of these domains are thought to be crucial for the maintenance of membrane structure and function. However, such well-characterized domains generally occur in the membranes that contain relatively large amounts of cholesterol. Cholesterol organization in membranes containing very low amounts of cholesterol has not been investigated extensively. Recent evidence from differential-scanning calorimetric studies suggests that cholesterol may not form uniform monodisperse solutions, as assumed earlier, in the membranes even at very low concentrations. Fluorescent cholesterol analogues, when chosen carefully, offer a powerful approach for studying the distribution and organization of cholesterol in membranes at low concentrations. In this paper, we have studied the organization of cholesterol in membranes at very low concentrations (up to 5 mol % of the total lipid) using a fluorescent cholesterol analogue (NBD-cholesterol) which is labeled with the 7-nitrobenz-2-oxa- 1,3-diazol-4-yl (NBD) group at the flexible acyl chain, without any alteration in the structural features necessary for proper membrane incorporation. Our results show that NBD-cholesterol exhibits local organization even at very low concentrations. This is consistent with the recently suggested model of cholesterol organization in membranes at low concentrations, involving the formation of transbilayer, tail-to-tail dimers [Harris, J. S., Epps, D. E., Davio, S. R., & Kezdy, F. J. (1995) Biochemistry 34, 3851- 3857]. The implications of such local cholesterol organization in membranes that have very low cholesterol content in ViVo, such as the endoplasmic reticulum and the inner mitochondrial membrane, open up interesting possibilities. The fluid mosaic model for biological membranes defines the membrane as an oriented, two-dimensional, viscous solution of proteins and lipids in instantaneous thermody- namic equilibrium (Singer & Nicolson, 1972). Although the basic tenets of this model have stood the test of time, one of its implicit assumptions, that the lipid molecules merely provide the milieu for the membrane proteins and that they are distributed uniformly throughout the bilayer, has been found to be not quite true. In fact, current evidence points out that both transverse and lateral regionalization, which can be described in terms of micro- and macrodomains, are common features of many biological membranes (Curtain et al., 1988; Edidin, 1992; Tocanne, 1992; Glaser, 1993; Jacobson et al., 1995). Cholesterol is one of the membrane components that is found, more often than not, distributed nonrandomly in structural and kinetic domains or pools in both biological and model membranes (Yeagle, 1985; Gennis, 1989; Schroed- er et al., 1991; Liscum & Underwood, 1995). The reason for this lies in the rather unusual chemical structure of cholesterol that can by no means be considered a representa- tive component of the “bulk” membrane (see Figure 1). The unusual shape of cholesterol also causes a phase separation in membranes at relatively high concentrations, resulting in the formation of cholesterol-rich and -poor domains that are structurally and compositionally so distinct that they can be observed histochemically and isolated physically from epi- thelial cell plasma membranes (Schroeder et al., 1991). Although a large body of literature exists about the behavior of cholesterol in model membranes at relatively high cholesterol concentrations, very little is known about its organization in the membrane when the cholesterol ² This work was supported by the Council of Scientific and Industrial Research, Government of India. S.M. thanks the University Grants Commission for the award of Senior Research Fellowship. The Photon Technology International LS-100 luminescence spectrophotometer used in this study was purchased from a grant awarded by the Department of Science and Technology, Government of India. * Address correspondence to this author. Telephone: +91-40- 672241. Fax: +91-40-671195. E-mail: [email protected]. ‡ Present address: Room 15-420, Department of Pathology, College of Physicians and Surgeons, Columbia University, 630 West 168th Street, New York, NY 10032. X Abstract published in AdVance ACS Abstracts, January 1, 1996. FIGURE 1: Chemical structure of NBD-cholesterol. The structure of cholesterol is shown in the inset for comparison. 1311 Biochemistry 1996, 35, 1311-1322 0006-2960/96/0435-1311$12.00/0 © 1996 American Chemical Society
Transcript of Membrane Organization at Low Cholesterol Concentrations: A Study Using...
Membrane Organization at Low Cholesterol Concentrations: A Study Using7-Nitrobenz-2-oxa-1,3-diazol-4-yl-Labeled Cholesterol†
Sushmita Mukherjee‡ and Amitabha Chattopadhyay*
Centre for Cellular & Molecular Biology, Uppal Road, Hyderabad 500 007, India
ReceiVed August 17, 1995; ReVised Manuscript ReceiVed NoVember 27, 1995X
ABSTRACT: Cholesterol is most often found distributed nonrandomly in the plane of the bilayer, givingrise to cholesterol-rich and -poor domains. Many of these domains are thought to be crucial for themaintenance of membrane structure and function. However, such well-characterized domains generallyoccur in the membranes that contain relatively large amounts of cholesterol. Cholesterol organization inmembranes containing very low amounts of cholesterol has not been investigated extensively. Recentevidence from differential-scanning calorimetric studies suggests that cholesterol may not form uniformmonodisperse solutions, as assumed earlier, in the membranes even at very low concentrations. Fluorescentcholesterol analogues, when chosen carefully, offer a powerful approach for studying the distribution andorganization of cholesterol in membranes at low concentrations. In this paper, we have studied theorganization of cholesterol in membranes at very low concentrations (up to 5 mol % of the total lipid)using a fluorescent cholesterol analogue (NBD-cholesterol) which is labeled with the 7-nitrobenz-2-oxa-1,3-diazol-4-yl (NBD) group at the flexible acyl chain, without any alteration in the structural featuresnecessary for proper membrane incorporation. Our results show that NBD-cholesterol exhibits localorganization even at very low concentrations. This is consistent with the recently suggested model ofcholesterol organization in membranes at low concentrations, involving the formation of transbilayer,tail-to-tail dimers [Harris, J. S., Epps, D. E., Davio, S. R., & Kezdy, F. J. (1995)Biochemistry 34, 3851-3857]. The implications of such local cholesterol organization in membranes that have very low cholesterolcontent in ViVo, such as the endoplasmic reticulum and the inner mitochondrial membrane, open upinteresting possibilities.
The fluid mosaic model for biological membranes definesthe membrane as an oriented, two-dimensional, viscoussolution of proteins and lipids in instantaneous thermody-namic equilibrium (Singer & Nicolson, 1972). Although thebasic tenets of this model have stood the test of time, one ofits implicit assumptions, that the lipid molecules merelyprovide the milieu for the membrane proteins and that theyare distributed uniformly throughout the bilayer, has beenfound to be not quite true. In fact, current evidence pointsout that both transverse and lateral regionalization, whichcan be described in terms of micro- and macrodomains, arecommon features of many biological membranes (Curtainet al., 1988; Edidin, 1992; Tocanne, 1992; Glaser, 1993;Jacobsonet al., 1995).Cholesterol is one of the membrane components that is
found, more often than not, distributed nonrandomly instructural and kinetic domains or pools in both biologicaland model membranes (Yeagle, 1985; Gennis, 1989; Schroed-
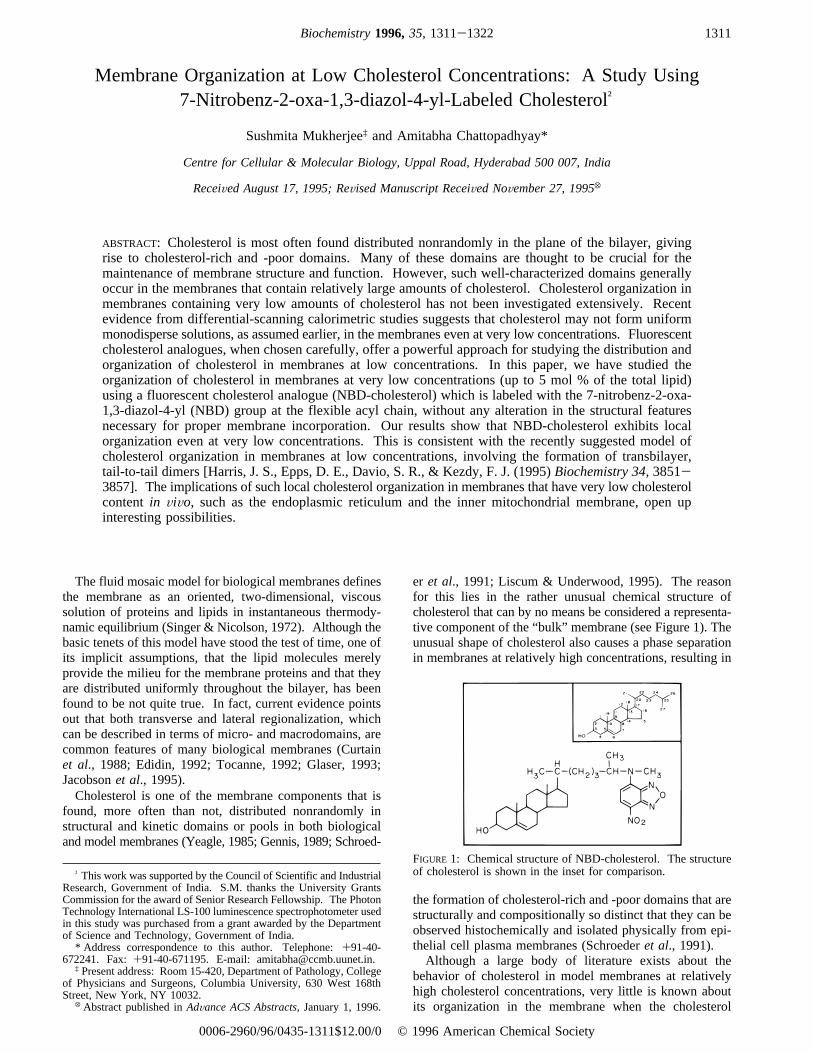
er et al., 1991; Liscum & Underwood, 1995). The reasonfor this lies in the rather unusual chemical structure ofcholesterol that can by no means be considered a representa-tive component of the “bulk” membrane (see Figure 1). Theunusual shape of cholesterol also causes a phase separationin membranes at relatively high concentrations, resulting in
the formation of cholesterol-rich and -poor domains that arestructurally and compositionally so distinct that they can beobserved histochemically and isolated physically from epi-thelial cell plasma membranes (Schroederet al., 1991).Although a large body of literature exists about the
behavior of cholesterol in model membranes at relativelyhigh cholesterol concentrations, very little is known aboutits organization in the membrane when the cholesterol
† This work was supported by the Council of Scientific and IndustrialResearch, Government of India. S.M. thanks the University GrantsCommission for the award of Senior Research Fellowship. The PhotonTechnology International LS-100 luminescence spectrophotometer usedin this study was purchased from a grant awarded by the Departmentof Science and Technology, Government of India.* Address correspondence to this author. Telephone:+91-40-
672241. Fax:+91-40-671195. E-mail: [email protected].‡ Present address: Room 15-420, Department of Pathology, College
of Physicians and Surgeons, Columbia University, 630 West 168thStreet, New York, NY 10032.
X Abstract published inAdVance ACS Abstracts,January 1, 1996.
FIGURE 1: Chemical structure of NBD-cholesterol. The structureof cholesterol is shown in the inset for comparison.
1311Biochemistry1996,35, 1311-1322
0006-2960/96/0435-1311$12.00/0 © 1996 American Chemical Society
+ +
+ +
content is very low (<5 mol %). It has been assumed thatcholesterol is distributed uniformly in the bilayer at theseconcentrations, although the evidence for it is quite tenuous(Estepet al., 1978; Vist & Davis, 1990; McMullenet al.,1993).Very few techniques exist that can detect the intrinsic
properties of cholesterol-induced structures in membranes.Techniques such as differential-scanning calorimetry andelectron microscopy provide only bulk and static information.Further,1H and 13C NMR spectra of cholesterol in mem-branes are generally too broad to obtain much meaningfulinformation (Schroeder, 1984). The use of fluorescent sterolsthus constitutes a powerful approach for studying cholesterolbehavior in membranes due to their high sensitivity, timeresolution, and multiplicity of measurable parameters. Oneclass of probes commonly used for such studies is sterolsthat are chemically linked to extrinsic fluorophores (Schroed-er, 1984). The advantage of this class of probes is that onehas a choice of the fluorescent label to be used, and thus,specific probes with appropriate properties can be designedfor specific applications.One of the extrinsic fluorescent moieties that has been
widely used for biophysical, biochemical, as well as cellbiological applications is the 7-nitrobenz-2-oxa-1,3-diazol-4-yl (NBD)1 group [for a review, see Chattopadhyay (1990)].This compound possesses some of the most desirableproperties for serving as an excellent probe for bothspectroscopic as well as microscopic applications (Kobayashi& Pagano, 1988; Paganoet al., 1989). It is very weaklyfluorescent in water. Upon transfer to a hydrophobicmedium such as membranes, it fluoresces brightly in thevisible range (Lin & Struve, 1991; Fery-Forgueset al., 1993;Mukherjee et al., 1994) and shows a large degree ofenvironmental sensitivity (Chattopadhyay & London, 1988;Rajarathnamet al., 1989; Chattopadhyay, 1991; Chatto-padhyay & Mukherjee, 1993; Fery-Forgueset al., 1993;Mukherjeeet al., 1994). It is relatively photostable, andlipids labeled with this group mimic endogenous lipids instudies of intracellular lipid transport (Lipsky & Pagano,1983, 1985; Pagano & Sleight, 1985; van Meeret al., 1987;Pagano & Martin, 1988; Koval & Pagano, 1990; Ting &Pagano, 1990).Two principal types of NBD-labeled steroids have been
synthesized and used in membrane studies. In one of these,the NBD group is esterified to the 3â-OH of cholesterolViaa relatively long hydrophilic spacer (Randoet al., 1982).The features that have been found to be necessary for abiologically active cholesterol analogue are an intact alicyclicchain, a free 3â-OH, a planar∆5(6) double bond, angularmethyl groups, and a branched seven-carbon alkyl chain atthe 17â-position (see Figure 1) (Schroeder, 1984; Ranadive& Lala, 1987). The 3â-OH-labeled analogue of cholesterolis thus expected to show serious discrepancies with choles-terol since the 3â-OH here is esterified to the NBD group,and consequently, the molecule has to anchor to themembrane rather unusuallyVia its NBD group. The otherclass of cholesterol analogues constitute those where the
NBD group is covalently attached to the branched alkyl chainof cholesterol (Craiget al., 1981). In this derivative, theNBD group is attached to carbon position 22 of thecholesterol moiety. It thus almost completely eliminates theseven-membered alkyl chain at the 17â-position of nativecholesterol that has been found to be important for cholesterolfunction. In fact, previous studies suggest that the alkyl sidechain of cholesterol is quite rigid up to the carbon 23 position(Oldfield et al., 1978) and that the addition of a polar groupat carbon 22 of cholesterol which alters the configuration ofthe side chain severely affects its interaction with the bilayer(Vincent & Gallay, 1983). Another related study has shownthat a carbon chain length of at least four to five carbons atthe 17â-position is necessary for the optimal activity ofcertain antibiotics that are known to interact with cholesterol(Nakamuraet al., 1980). This NBD-labeled cholesterolderivative was found to be 40% as effective as cholesterolas a substrate for lecithin-cholesterol acyltransferase andabout 2 times more efficient in suppressing the action of3-hydroxy-3-methylglutaryl coenzyme A reductase (Craigetal., 1981). The above derivative of cholesterol has also beenvery recently analyzed with regard to its partitioning proper-ties into lateral phases of pure and mixed cholesterol/phospholipid monolayers (Slotte, 1995; Slotte & Mattjus,1995). It was found that this compound did not mimiccholesterol in either pure or mixed monolayers and wasexcluded from lateral phases with high packing densities inboth cases.
The NBD-cholesterol used by us (see Figure 1) differsfrom all the analogues discussed above. It is expected tomimic native cholesterol better than any of the aboveanalogues since it fulfills all the criteria for an idealcholesterol analogue, with a free 3â-OH, and the NBD groupattached at the end of the branched alkyl chain, leaving mostof the chain intact. A detailed characterization of thespectroscopic and ionization properties as well as the specificlocation of this molecule in membranes has previously beencarried out by one of us (Chattopadhyay & London, 1987,1988). In model membrane systems, the NBD group of thismolecule has been found to be localized deep in thehydrocarbon region of the membrane, approximately 5-6Å from the center of the bilayer (Chattopadhyay & London,1987). Unlike the NBD-labeled phospholipids, the NBDgroup in NBD-cholesterol does not loop back to themembrane interface in spite of its polar nature, probably dueto the stereochemical rigidity of the sterol ring (Chatto-padhyay, 1990). This unique orientation of NBD-cholesteroloffers a convenient handle for localization of a polar andpotentially reactive group deep inside the membrane. In fact,the unique position of this probe in the membrane has beenexploited in an energy transfer study of the spatial relation-ships of specific sites on chloroplast coupling factor to thebilayer surface in reconstituted vesicles (Mitra & Hammes,1990).
In this paper, we have utilized NBD-cholesterol as acholesterol analogue to study the distribution and organiza-tion of this rather unique molecule in the membrane at lowconcentrations. Our results show that NBD-cholesterolexhibits local organization in the membrane even at verylow concentrations and may in fact form transbilayer, tail-to-tail dimers. These results are in agreement with the recentobservations from differential-scanning calorimetric studiesusing the DPPC/cholesterol system at comparable cholesterolconcentrations (Harriset al., 1995).
1 Abbreviations: DPPC, dipalmitoyl-sn-glycero-3-phosphocholine;GPI, glycosylphosphatidylinositol; NBD, 7-nitrobenz-2-oxa-1,3-diazol-4-yl; NBD-cholesterol, 25-[N-[(7-nitrobenz-2-oxa-1,3-diazol-4-yl)-methyl]amino]-27-norcholesterol; NMR, nuclear magnetic resonance;PC, phosphatidylcholine; POPC, 1-palmitoyl-2-oleoyl-sn-glycero-3-phosphocholine; TLC, thin layer chromatography; ULV, unilamellarvesicle.
1312 Biochemistry, Vol. 35, No. 4, 1996 Mukherjee and Chattopadhyay
+ +
+ +
MATERIALS AND METHODS
Materials. DPPC and cholesterol were obtained fromSigma Chemical Co. (St. Louis, MO). NBD-cholesterol wasfrom Molecular Probes (Eugene, OR). DPPC was checkedfor purity by TLC on silica gel plates in chloroform/methanol/water (65:35:5, v/v/v) and was found to give onespot with a phosphate-sensitive spray and on subsequentcharring (Dittmer & Lester, 1964). TLC of NBD-cholesterolwas done using the same solvents but in a slightly differentproportion (65:35:4, v/v/v), and it was found to be pure whendetected by its color or fluorescence. Lipid concentrationwas determined by phosphate assay subsequent to totaldigestion by perchloric acid (McClare, 1971). Solvents usedwere of spectroscopic grade. Water was purified through aMillipore (Bedford, MA) Milli-Q system and used through-out.Preparation of Liposomes. All experiments involving
absorption and steady state fluorescence were done usingunilamellar vesicles (ULV) of DPPC containing 0.1-2.0%(mol/mol) NBD-cholesterol prepared by the ethanol injec-tion method (Batzri & Korn, 1973; Kremeret al., 1977).For this, 640 nmol of DPPC and 0.64-12.8 nmol of NBD-cholesterol were taken together in methanol, a few drops ofchloroform were added and mixed well, and the sampleswere dried under a stream of nitrogen while being warmedgently (∼35 °C). After the lipids were dried further undera high vacuum for at least 3 h, they were dissolved in ethanol,to give a final concentration of about 40 mM lipid in ethanol.This ethanolic lipid solution was then injected into 10 mMsodium phosphate, 150 mM sodium chloride, and pH 7.1buffer while vortexing to give a final concentration of 0.43mM lipid in the buffer. The buffer was always maintainedat a temperature higher than the phase transition temperatureof DPPC (i.e., >41 °C) while the injections were made. Inexperiments where cholesterol was required, it was addedfrom a methanolic stock solution along with DPPC andNBD-cholesterol in the organic phase, and all three com-ponents were dried together and injected together as ethanolicsolutions. Background samples were prepared the same wayexcept that the probes were omitted. For experiments inwhich fluorescence lifetimes were measured, ULVs wereprepared as described above, except that the concentrationsof both the lipid and the probe were doubled in order toimprove signal to noise ratio, while their relative concentra-tions were the same as those used for steady state experi-ments. All experiments in gel phase membranes were doneat 23 °C. Experiments involving fluid phase membraneswere performed at 54°C.Measurement of Absorption Spectra. The absorption
spectra were obtained using a Hitachi U-2000 UV-visibleabsorption spectrophotometer. Quartz cuvettes with a pathlength of 1 cm were used. Background samples without thefluorophore were used for base line corrections.Steady State Fluorescence Measurements. Steady state
fluorescence measurements were performed with a HitachiF-4010 spectrofluorometer using 1 cm path length quartzcuvettes. Excitation and emission slits with a nominal band-pass of 5 nm were used for all experiments. Backgroundintensities of samples in which NBD-cholesterol was omittedwere subtracted from each sample spectrum to cancel outany contribution due to the solvent Raman peak and otherscattering artifacts. All experiments were done with multiple
sets of samples, and average values of fluorescence andpolarization are shown in the figures. Fluorescence polariza-tion measurements were performed using a Hitachi polariza-tion accessory. Polarization values were calculated from theequation (Chen & Bowman, 1965)
whereIVV andIVH are the measured fluorescence intensitieswith the excitation polarizer vertically oriented and theemission polarizer vertically and horizontally oriented,respectively.G is the grating correction factor and is equalto IHV/IHH. In significantly absorbing samples, the inner filtereffect was corrected for by using the following equation(Lakowicz, 1983):
whereAex and Aem are the measured absorbances of thesample at the excitation and emission wavelength, respec-tively.Time-ResolVed Fluorescence Measurements. Fluorescence
lifetimes were calculated from time-resolved fluorescenceintensity decays using a Photon Technology International(London, Western Ontario, Canada) LS-100 luminescencespectrophotometer in the time-correlated single photon-counting mode. This machine uses a thyratron-gated nano-second flash lamp filled with nitrogen as the plasma gas (17( 1 in. of mercury vacuum) and is run at 22-25 kHz. Lampprofiles were measured at the excitation wavelength usingLudox as the scatterer. To optimize the signal to noise ratio,5000 photon counts were collected in the peak channel. Theexcitation wavelength used was 337 nm which correspondsto a peak in the spectral output of the nitrogen flash lamp.Emission wavelength was set at 522 or 539 nm. Allexperiments were performed using excitation and emissionslits with a nominal band-pass of 2 nm. The sample andthe scatterer were alternated after every 10% acquisition toensure compensation for shape and timing drifts occurringduring the period of data collection. The data stored in amultichannel analyzer were routinely transferred to an IBMpersonal computer for analysis. Intensity decay curves soobtained were fitted as a sum of exponential terms:
whereRi is a preexponential factor representing the fractionalcontribution to the time-resolved decay of the componentwith a lifetime τi. The decay parameters were recoveredusing a nonlinear least squares iterative fitting procedurebased on the Marquardt algorithm (Bevington, 1969). Theprogram also includes statistical and plotting subroutinepackages (O’Connor & Phillips, 1984). The goodness ofthe fit of a given set of observed data and the chosen functionwas evaluated by the reducedø2 ratio, the weighted residuals(Lampertet al., 1983), and the autocorrelation function ofthe weighted residuals (Grinvald & Steinberg, 1974). A fitwas considered acceptable when plots of the weightedresiduals and the autocorrelation function showed randomdeviation about zero with a minimumø2 value (not morethan 1.4). Mean (average) lifetimes⟨τ⟩ for biexponentialdecays of fluorescence were calculated from the decay times
P)IVV - GIVHIVV + GIVH
(1)
Fcorrect) Fapparent× 10(Aex+Aem)/2 (2)
F(t) ) ∑i
Ri exp(-t/τi) (3)
Membrane Organization at Low Cholesterol Concentrations Biochemistry, Vol. 35, No. 4, 19961313
+ +
+ +
and preexponential factors using the following equation(Lakowicz, 1983):
Global Analysis of Lifetimes. The primary goal of thenonlinear least squares (discrete) analysis of fluorescenceintensity decays discussed above is to obtain an accurate andunbiased representation of a single fluorescence decay curvein terms of a set of parameters (i.e., Ri, τi). However, thismethod of analysis does not take advantage of the intrinsicrelations that may exist between the individual decay curvesobtained for the same system under different conditions. Acondition in this context refers to temperature, pressure,solvent composition, ionic strength, pH, excitation/emissionwavelength, or any other independent variable which canbe experimentally manipulated. This advantage can bederived if multiple fluorescence decay curves, acquired underdifferent conditions, are simultaneously analyzed. This isknown as the global analysis in which the simultaneousanalyses of multiple decay curves are carried out in termsof internally consistent sets of fitting parameters (Knutsonet al., 1983; Beechem, 1989, 1992; Beechemet al., 1991).Global analysis thus turns out to be very useful for theprediction of the manner in which the parameters recoveredfrom a set of separate fluorescence decays vary as a functionof an independent variable and helps distinguish betweenmodels proposed to describe a system.In this paper, we have obtained fluorescence decays as a
function of probe concentration at two different monitoringwavelengths. The physical model under investigation is onewhere the population of fluorophores centered at one of themonitoring wavelengths (namely, 539 nm) represents apopulation of interacting fluorophores, as against the uni-formly distributed population centered at 522 nm. The globalanalysis, in this case, thus assumes that the lifetimes arelinked among the data files (i.e., the lifetimes for any givencomponent are the same for all decays) but the correspondingpreexponentials are free to vary. This is accomplished byusing a matrix mapping of the fitting parameters in whichthe preexponentials are unique for each decay curve whilethe lifetimes are mapped out to the same value for eachdecay. All data files are simultaneously analyzed by the leastsquares data analysis method using the Marquardt algorithm(as described above) utilizing the map to substitute param-eters appropriately while minimizing the globalø2. Theprogram used for the global analysis was obtained fromPhoton Technology International (London, Western Ontario,Canada).
RESULTS
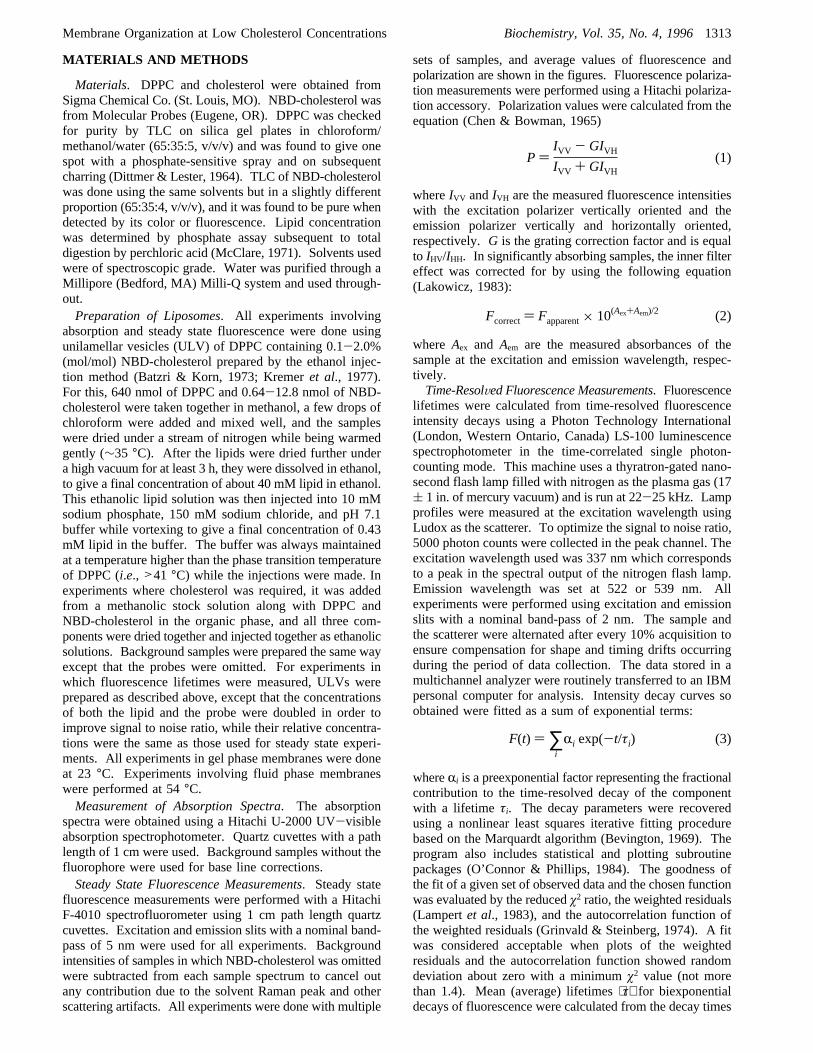
Figure 2 shows the fluorescence emission spectra of NBD-cholesterol in different concentrations in unilamellar vesiclesof DPPC in gel and fluid phases. The spectra are quitesmooth and homogeneous in both gel and fluid phases whenthe NBD-cholesterol concentration is extremely low (0.1 mol% of the total lipid), with the maximum of fluorescenceemission around 522 nm in both cases. As the NBD-cholesterol concentration increases, the shape of the fluo-rescence emission spectrum starts differing between the geland the fluid phase membranes. Whereas the spectrum
remains quite smooth with the maximum of emissionconstant at 522 nm in the fluid phase membranes till thehighest probe concentration investigated (i.e., 2 mol %)(Figure 2b), the spectra start showing deviations in the gelphase with increasing NBD-cholesterol concentration (Figure2a). A new peak centered around 539 nm appears in thesecases so that the spectra become broad and inhomogeneous,and at 2 mol % of the probe, the maximum of emission isclearly shifted from 522 nm and is centered at 539 nm. Weargued that the inhomogeneity, and the resultant deviationsobserved in the gel phase spectra, could arise from twodifferent populations of fluorophores. The population whosefluorescence is centered at 522 nm and is observed at lowprobe concentrations could represent a component of thefluorophores that are uniformly distributed throughout thebilayer. On the other hand, the new population arising onlyat relatively high probe concentrations and exclusively inthe gel phase represents a population of fluorophores thatare close enough in the membrane to be able to interact witheach other during their excited state lifetimes. It is notsurprising that such a phase separation is observed only inthe gel phase in the concentration range investigated, sincecholesterol has recently been shown to be completelyimmiscible in the highly ordered gel phase (Harriset al.,1995).The above results are represented more quantitatively in
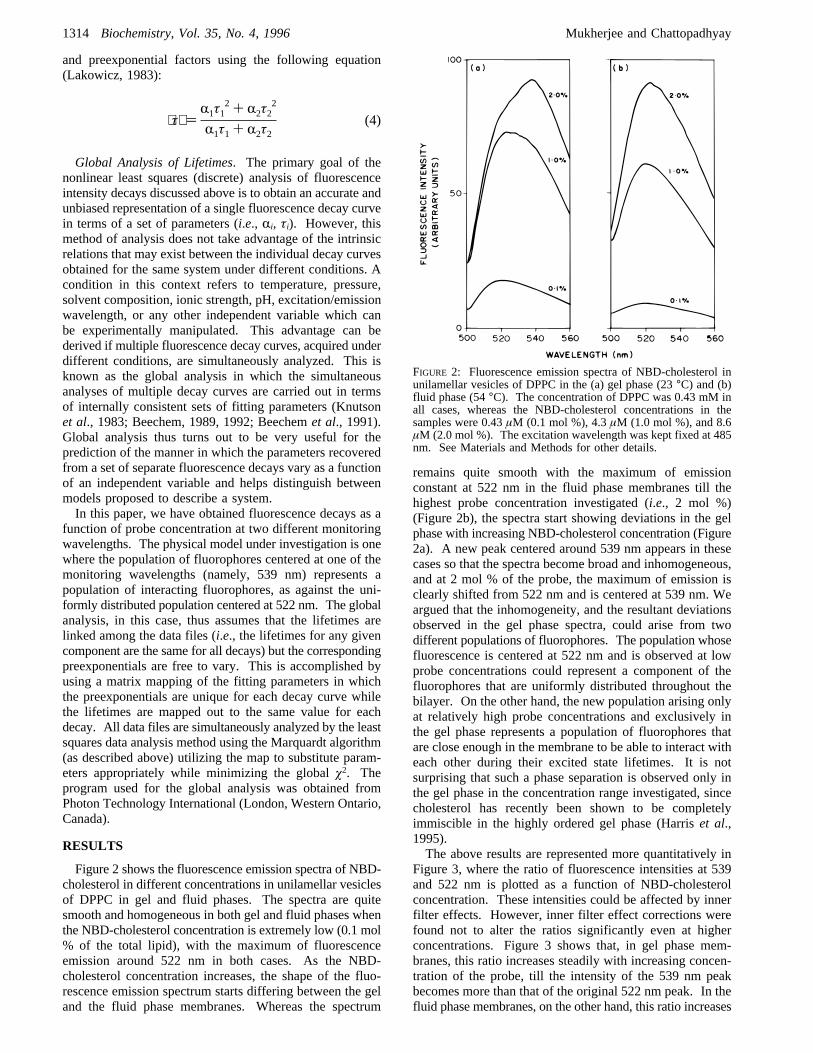
Figure 3, where the ratio of fluorescence intensities at 539and 522 nm is plotted as a function of NBD-cholesterolconcentration. These intensities could be affected by innerfilter effects. However, inner filter effect corrections werefound not to alter the ratios significantly even at higherconcentrations. Figure 3 shows that, in gel phase mem-branes, this ratio increases steadily with increasing concen-tration of the probe, till the intensity of the 539 nm peakbecomes more than that of the original 522 nm peak. In thefluid phase membranes, on the other hand, this ratio increases
⟨τ⟩ )R1τ1
2 + R2τ22
R1τ1 + R2τ2(4)
FIGURE 2: Fluorescence emission spectra of NBD-cholesterol inunilamellar vesicles of DPPC in the (a) gel phase (23°C) and (b)fluid phase (54°C). The concentration of DPPC was 0.43 mM inall cases, whereas the NBD-cholesterol concentrations in thesamples were 0.43µM (0.1 mol %), 4.3µM (1.0 mol %), and 8.6µM (2.0 mol %). The excitation wavelength was kept fixed at 485nm. See Materials and Methods for other details.
1314 Biochemistry, Vol. 35, No. 4, 1996 Mukherjee and Chattopadhyay
+ +
+ +
only slightly in this concentration range. It is interesting tonote here that, at very low NBD-cholesterol concentrations,this ratio is very similar in both gel and fluid phasemembranes. This observation may be interpreted as ad-ditional evidence that the population at 522 nm is the oneconsisting of freely distributed fluorophores, since theirconcentration at this stage is too low to exhibit anyappreciable interprobe interaction in either physical state ofthe membrane.The specific association of the NBD-cholesterol molecules
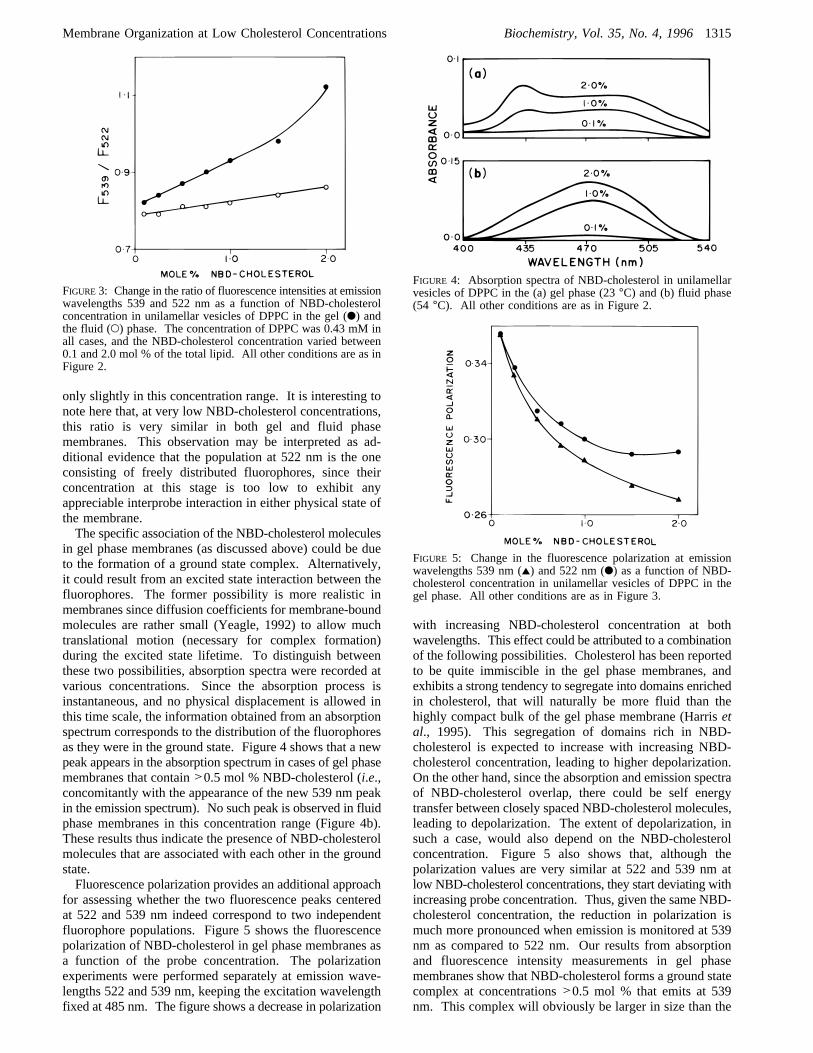
in gel phase membranes (as discussed above) could be dueto the formation of a ground state complex. Alternatively,it could result from an excited state interaction between thefluorophores. The former possibility is more realistic inmembranes since diffusion coefficients for membrane-boundmolecules are rather small (Yeagle, 1992) to allow muchtranslational motion (necessary for complex formation)during the excited state lifetime. To distinguish betweenthese two possibilities, absorption spectra were recorded atvarious concentrations. Since the absorption process isinstantaneous, and no physical displacement is allowed inthis time scale, the information obtained from an absorptionspectrum corresponds to the distribution of the fluorophoresas they were in the ground state. Figure 4 shows that a newpeak appears in the absorption spectrum in cases of gel phasemembranes that contain>0.5 mol % NBD-cholesterol (i.e.,concomitantly with the appearance of the new 539 nm peakin the emission spectrum). No such peak is observed in fluidphase membranes in this concentration range (Figure 4b).These results thus indicate the presence of NBD-cholesterolmolecules that are associated with each other in the groundstate.Fluorescence polarization provides an additional approach
for assessing whether the two fluorescence peaks centeredat 522 and 539 nm indeed correspond to two independentfluorophore populations. Figure 5 shows the fluorescencepolarization of NBD-cholesterol in gel phase membranes asa function of the probe concentration. The polarizationexperiments were performed separately at emission wave-lengths 522 and 539 nm, keeping the excitation wavelengthfixed at 485 nm. The figure shows a decrease in polarization
with increasing NBD-cholesterol concentration at bothwavelengths. This effect could be attributed to a combinationof the following possibilities. Cholesterol has been reportedto be quite immiscible in the gel phase membranes, andexhibits a strong tendency to segregate into domains enrichedin cholesterol, that will naturally be more fluid than thehighly compact bulk of the gel phase membrane (Harrisetal., 1995). This segregation of domains rich in NBD-cholesterol is expected to increase with increasing NBD-cholesterol concentration, leading to higher depolarization.On the other hand, since the absorption and emission spectraof NBD-cholesterol overlap, there could be self energytransfer between closely spaced NBD-cholesterol molecules,leading to depolarization. The extent of depolarization, insuch a case, would also depend on the NBD-cholesterolconcentration. Figure 5 also shows that, although thepolarization values are very similar at 522 and 539 nm atlow NBD-cholesterol concentrations, they start deviating withincreasing probe concentration. Thus, given the same NBD-cholesterol concentration, the reduction in polarization ismuch more pronounced when emission is monitored at 539nm as compared to 522 nm. Our results from absorptionand fluorescence intensity measurements in gel phasemembranes show that NBD-cholesterol forms a ground statecomplex at concentrations>0.5 mol % that emits at 539nm. This complex will obviously be larger in size than the
FIGURE3: Change in the ratio of fluorescence intensities at emissionwavelengths 539 and 522 nm as a function of NBD-cholesterolconcentration in unilamellar vesicles of DPPC in the gel (b) andthe fluid (O) phase. The concentration of DPPC was 0.43 mM inall cases, and the NBD-cholesterol concentration varied between0.1 and 2.0 mol % of the total lipid. All other conditions are as inFigure 2.
FIGURE 4: Absorption spectra of NBD-cholesterol in unilamellarvesicles of DPPC in the (a) gel phase (23°C) and (b) fluid phase(54 °C). All other conditions are as in Figure 2.
FIGURE 5: Change in the fluorescence polarization at emissionwavelengths 539 nm (2) and 522 nm (b) as a function of NBD-cholesterol concentration in unilamellar vesicles of DPPC in thegel phase. All other conditions are as in Figure 3.
Membrane Organization at Low Cholesterol Concentrations Biochemistry, Vol. 35, No. 4, 19961315
+ +
+ +
freely distributed monomer that emits at 522 nm. Since thefluidization of gel phase membranes by cholesterol is a directconsequence of its inability to fit in the highly ordered matrix,the relatively large complex is thus expected to fit in the gelphase matrix even more poorly, resulting in greater fluidiza-tion of the membrane in its immediate vicinity. Such abehavior is reflected in the enhanced decrease in polarizationat 539 nm compared to 522 nm. Additionally, the formationof a complex would also enhance the extent of depolarizationresulting from energy transfer between NBD-cholesterolmolecules. In such an event, the extent of depolarizationobserved at 522 nm would reflect the efficiency of energytransfer due to the statistical probability of two NBD-cholesterol monomers coming within the energy transferrange in the plane of the membrane during the fluorescencelifetime of the NBD group. The enhancement of depolar-ization observed at 539 nm at a given concentration of NBD-cholesterol relative to the corresponding value at 522 nmwould then reflect the increase in the efficiency of energytransfer due to the specific interactions between the NBD-cholesterol monomers that bring them close together in space.
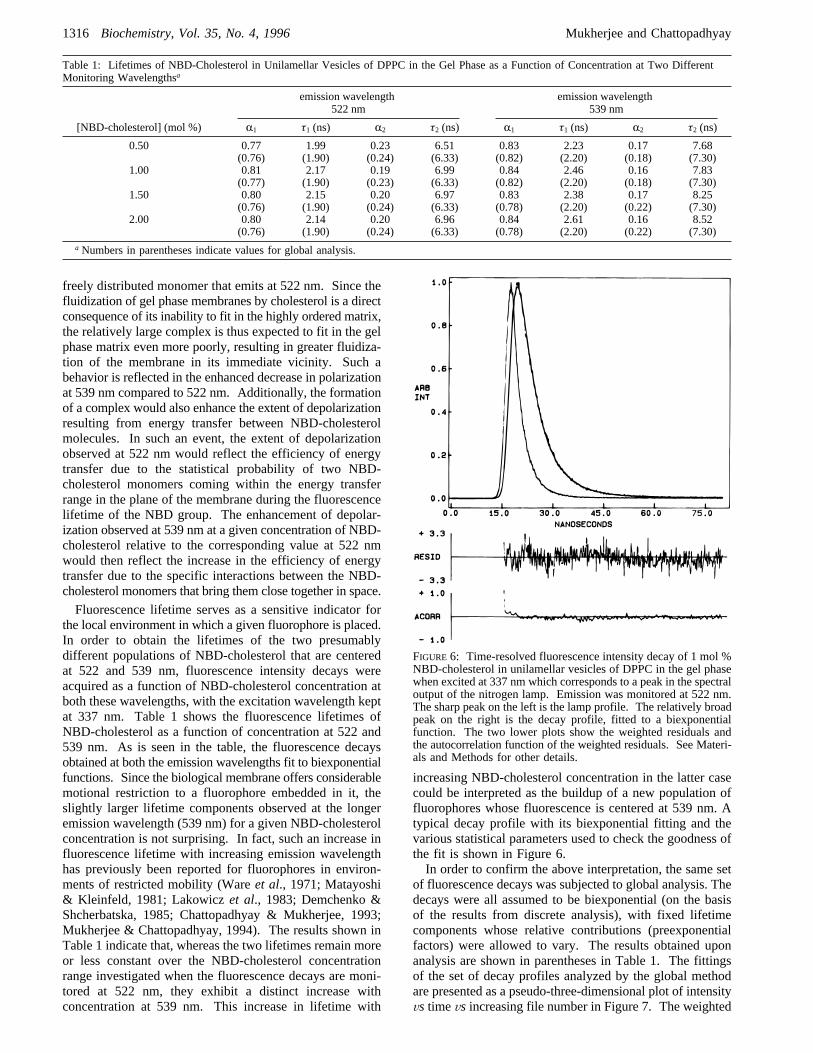
Fluorescence lifetime serves as a sensitive indicator forthe local environment in which a given fluorophore is placed.In order to obtain the lifetimes of the two presumablydifferent populations of NBD-cholesterol that are centeredat 522 and 539 nm, fluorescence intensity decays wereacquired as a function of NBD-cholesterol concentration atboth these wavelengths, with the excitation wavelength keptat 337 nm. Table 1 shows the fluorescence lifetimes ofNBD-cholesterol as a function of concentration at 522 and539 nm. As is seen in the table, the fluorescence decaysobtained at both the emission wavelengths fit to biexponentialfunctions. Since the biological membrane offers considerablemotional restriction to a fluorophore embedded in it, theslightly larger lifetime components observed at the longeremission wavelength (539 nm) for a given NBD-cholesterolconcentration is not surprising. In fact, such an increase influorescence lifetime with increasing emission wavelengthhas previously been reported for fluorophores in environ-ments of restricted mobility (Wareet al., 1971; Matayoshi& Kleinfeld, 1981; Lakowiczet al., 1983; Demchenko &Shcherbatska, 1985; Chattopadhyay & Mukherjee, 1993;Mukherjee & Chattopadhyay, 1994). The results shown inTable 1 indicate that, whereas the two lifetimes remain moreor less constant over the NBD-cholesterol concentrationrange investigated when the fluorescence decays are moni-tored at 522 nm, they exhibit a distinct increase withconcentration at 539 nm. This increase in lifetime with
increasing NBD-cholesterol concentration in the latter casecould be interpreted as the buildup of a new population offluorophores whose fluorescence is centered at 539 nm. Atypical decay profile with its biexponential fitting and thevarious statistical parameters used to check the goodness ofthe fit is shown in Figure 6.In order to confirm the above interpretation, the same set
of fluorescence decays was subjected to global analysis. Thedecays were all assumed to be biexponential (on the basisof the results from discrete analysis), with fixed lifetimecomponents whose relative contributions (preexponentialfactors) were allowed to vary. The results obtained uponanalysis are shown in parentheses in Table 1. The fittingsof the set of decay profiles analyzed by the global methodare presented as a pseudo-three-dimensional plot of intensityVs timeVs increasing file number in Figure 7. The weighted
Table 1: Lifetimes of NBD-Cholesterol in Unilamellar Vesicles of DPPC in the Gel Phase as a Function of Concentration at Two DifferentMonitoring Wavelengthsa
emission wavelength522 nm
emission wavelength539 nm
[NBD-cholesterol] (mol %) R1 τ1 (ns) R2 τ2 (ns) R1 τ1 (ns) R2 τ2 (ns)
0.50 0.77 1.99 0.23 6.51 0.83 2.23 0.17 7.68(0.76) (1.90) (0.24) (6.33) (0.82) (2.20) (0.18) (7.30)
1.00 0.81 2.17 0.19 6.99 0.84 2.46 0.16 7.83(0.77) (1.90) (0.23) (6.33) (0.82) (2.20) (0.18) (7.30)
1.50 0.80 2.15 0.20 6.97 0.83 2.38 0.17 8.25(0.76) (1.90) (0.24) (6.33) (0.78) (2.20) (0.22) (7.30)
2.00 0.80 2.14 0.20 6.96 0.84 2.61 0.16 8.52(0.76) (1.90) (0.24) (6.33) (0.78) (2.20) (0.22) (7.30)
aNumbers in parentheses indicate values for global analysis.
FIGURE 6: Time-resolved fluorescence intensity decay of 1 mol %NBD-cholesterol in unilamellar vesicles of DPPC in the gel phasewhen excited at 337 nm which corresponds to a peak in the spectraloutput of the nitrogen lamp. Emission was monitored at 522 nm.The sharp peak on the left is the lamp profile. The relatively broadpeak on the right is the decay profile, fitted to a biexponentialfunction. The two lower plots show the weighted residuals andthe autocorrelation function of the weighted residuals. See Materi-als and Methods for other details.
1316 Biochemistry, Vol. 35, No. 4, 1996 Mukherjee and Chattopadhyay
+ +
+ +

residuals corresponding to each of these fittings are alsoshown. The global normalizedø2 values obtained were 1.17and 1.14 for the data sets at emission wavelengths 522 and539 nm, respectively.The mean lifetimes, calculated using eq 4, are plotted in
Figure 8 for both discrete and global analysis. This figureshows that the mean lifetimes do not exhibit any appreciablechange with increasing NBD-cholesterol concentration at 522nm in the concentration range investigated, irrespective ofthe method of analysis (discrete or global). On the otherhand, an increase is observed at 539 nm, again reflectingthe buildup of a new, presumably interacting population offluorophores whose fluorescence is centered at 539 nm, andhas a different fluorescence lifetime.All the above results thus indicate that the NBD groups
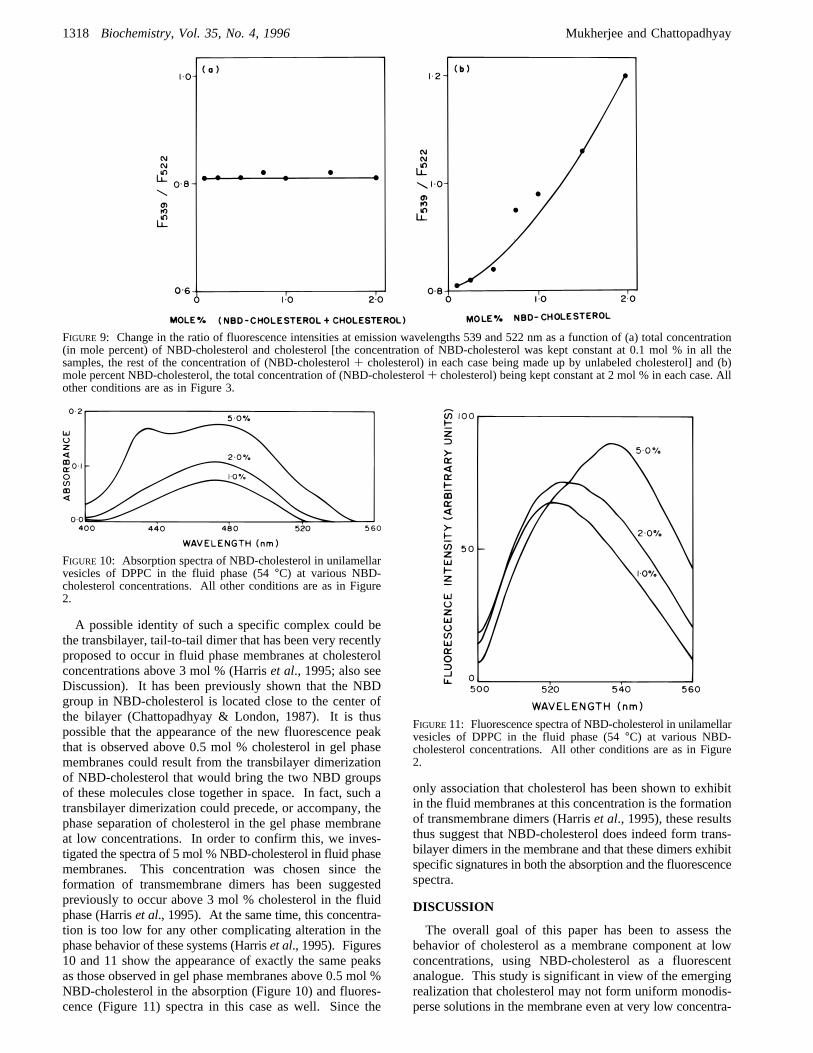
in NBD-cholesterol are close enough in gel phase membranesat concentrations greater than 0.5 mol % to be able to interactwith each other. To gain further insight into the origin ofthis effect, we investigated whether it was due to theformation of a specific complex with a unique geometry orwhether it was a result of nonspecific aggregation (or phaseseparation) alone. Two sets of experiments were designedto address this issue. In the first set, ULVs were preparedcontaining DPPC, 0.1 mol % NBD-cholesterol, and variableamounts of unlabeled cholesterol (0-1.9 mol %) so that thetotal concentration of “cholesterol-like species” (i.e., NBD-cholesterol+ cholesterol) varies between 0.1 and 2.0 mol% of the total lipid. The logic used was that, if the
interaction observed among NBD-cholesterol molecules wasdue to an increase in its local concentration (phase separation)alone, then such effects should also be observed with purecholesterol since cholesterol has been shown to be completelyimmiscible in the gel phase and to exist as separate soliddomains even at very low concentrations (Harriset al., 1995).In such a case, the NBD-cholesterol would act merely as areporter of cholesterol phase separation, and this would bereflected in a gradual increase in the ratio of the fluorescenceintensities at 539 and 522 nm, due to a higher probability ofthe NBD groups being statistically placed close together inthe cholesterol-enriched phase. Figure 9a shows that this isnot the case and that NBD-cholesterol, as judged by itsfluorescence behavior, is unable to sense the presence ofadditional cholesterol in the membrane. This points out theformation of a specific complex where the NBD groups ofNBD-cholesterol are oriented in a specific geometry relativeto each other rather than phase separation alone.In a variation of the above experiment, unilamellar vesicles
of DPPC were prepared containing a total of 2.0 mol %cholesterol-like species (NBD-cholesterol+ cholesterol). Ineach successive sample, however, the concentration of NBD-cholesterol was gradually increased (from 0.1 to 2.0 mol %),and the concentration of cholesterol was correspondinglyreduced (from 1.9 to 0 mol %), keeping the total concentra-tion of (NBD-cholesterol+ cholesterol) fixed at 2 mol %.In this case, it was expected that, if NBD-cholesterol werereporting cholesterol phase separation, then all these samplesshould behave identically. Figure 9b shows that this is notthe case, and again, the interaction of NBD-cholesterolmoieties with each other seemed to be independent of theamount of cholesterol added. The behavior of NBD-cholesterol in gel phase membranes, as reflected by theappearance of a new fluorescence peak at 539 nm, thusappears to be independent of the amount of cholesterol added(see Figure 3 for comparison). Both of the above experi-ments suggest that the tendency of NBD-cholesterols tointeract with each other in gel phase membranes at concen-trations above 0.5 mol % involves the formation of a specificcomplex, with a unique orientation of the NBD groupsrelative to each other.
FIGURE7: Global fittings and the corresponding weighted residualsof the set of decay profiles of NBD-cholesterol at emissionwavelengths 522 nm (a and b) and 539 nm (c and d) as a functionof NBD-cholesterol concentration in unilamellar vesicles of DPPCin the gel phase. All other conditions are as in Figure 3, exceptthat both the lipid and the probe concentrations were doubled.
FIGURE 8: Change in the mean fluorescence lifetimes of NBD-cholesterol at emission wavelengths 522 and 539 nm as a functionof NBD-cholesterol concentration in unilamellar vesicles of DPPCin the gel phase. The fluorescence intensity decays have beensubjected to both discrete analysis [emission wavelength 522 nm(b) and 539 nm (2)] and global analysis [emission wavelength522 nm (O) and 539 nm (4)]. All other conditions are as in Figure7.
Membrane Organization at Low Cholesterol Concentrations Biochemistry, Vol. 35, No. 4, 19961317
+ +
+ +
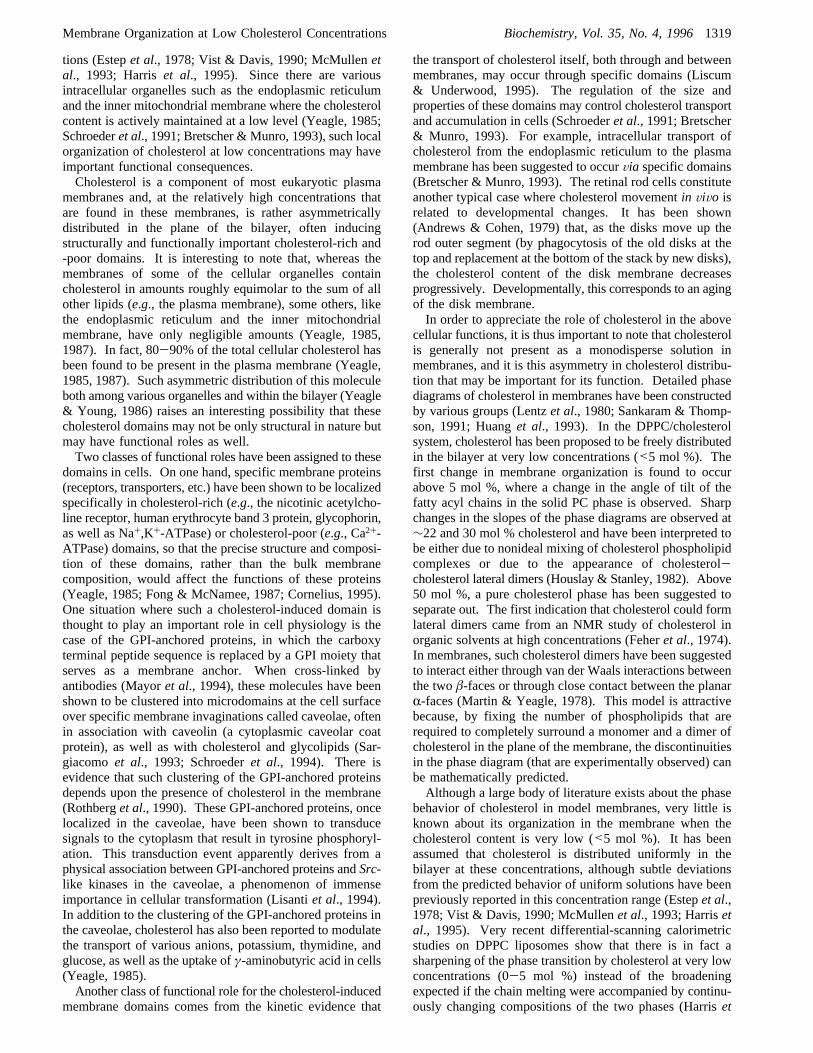
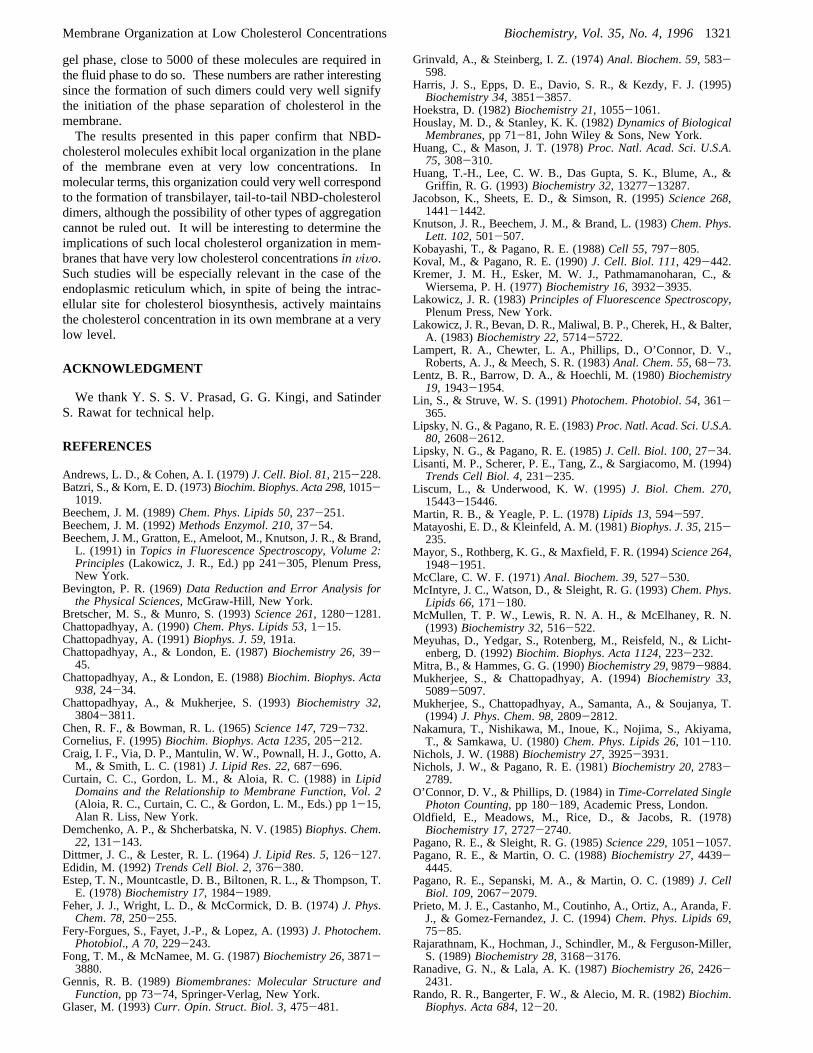
A possible identity of such a specific complex could bethe transbilayer, tail-to-tail dimer that has been very recentlyproposed to occur in fluid phase membranes at cholesterolconcentrations above 3 mol % (Harriset al., 1995; also seeDiscussion). It has been previously shown that the NBDgroup in NBD-cholesterol is located close to the center ofthe bilayer (Chattopadhyay & London, 1987). It is thuspossible that the appearance of the new fluorescence peakthat is observed above 0.5 mol % cholesterol in gel phasemembranes could result from the transbilayer dimerizationof NBD-cholesterol that would bring the two NBD groupsof these molecules close together in space. In fact, such atransbilayer dimerization could precede, or accompany, thephase separation of cholesterol in the gel phase membraneat low concentrations. In order to confirm this, we inves-tigated the spectra of 5 mol % NBD-cholesterol in fluid phasemembranes. This concentration was chosen since theformation of transmembrane dimers has been suggestedpreviously to occur above 3 mol % cholesterol in the fluidphase (Harriset al., 1995). At the same time, this concentra-tion is too low for any other complicating alteration in thephase behavior of these systems (Harriset al., 1995). Figures10 and 11 show the appearance of exactly the same peaksas those observed in gel phase membranes above 0.5 mol %NBD-cholesterol in the absorption (Figure 10) and fluores-cence (Figure 11) spectra in this case as well. Since the
only association that cholesterol has been shown to exhibitin the fluid membranes at this concentration is the formationof transmembrane dimers (Harriset al., 1995), these resultsthus suggest that NBD-cholesterol does indeed form trans-bilayer dimers in the membrane and that these dimers exhibitspecific signatures in both the absorption and the fluorescencespectra.
DISCUSSION
The overall goal of this paper has been to assess thebehavior of cholesterol as a membrane component at lowconcentrations, using NBD-cholesterol as a fluorescentanalogue. This study is significant in view of the emergingrealization that cholesterol may not form uniform monodis-perse solutions in the membrane even at very low concentra-
FIGURE 9: Change in the ratio of fluorescence intensities at emission wavelengths 539 and 522 nm as a function of (a) total concentration(in mole percent) of NBD-cholesterol and cholesterol [the concentration of NBD-cholesterol was kept constant at 0.1 mol % in all thesamples, the rest of the concentration of (NBD-cholesterol+ cholesterol) in each case being made up by unlabeled cholesterol] and (b)mole percent NBD-cholesterol, the total concentration of (NBD-cholesterol+ cholesterol) being kept constant at 2 mol % in each case. Allother conditions are as in Figure 3.
FIGURE 10: Absorption spectra of NBD-cholesterol in unilamellarvesicles of DPPC in the fluid phase (54°C) at various NBD-cholesterol concentrations. All other conditions are as in Figure2.
FIGURE11: Fluorescence spectra of NBD-cholesterol in unilamellarvesicles of DPPC in the fluid phase (54°C) at various NBD-cholesterol concentrations. All other conditions are as in Figure2.
1318 Biochemistry, Vol. 35, No. 4, 1996 Mukherjee and Chattopadhyay
+ +
+ +
tions (Estepet al., 1978; Vist & Davis, 1990; McMullenetal., 1993; Harriset al., 1995). Since there are variousintracellular organelles such as the endoplasmic reticulumand the inner mitochondrial membrane where the cholesterolcontent is actively maintained at a low level (Yeagle, 1985;Schroederet al., 1991; Bretscher & Munro, 1993), such localorganization of cholesterol at low concentrations may haveimportant functional consequences.Cholesterol is a component of most eukaryotic plasma
membranes and, at the relatively high concentrations thatare found in these membranes, is rather asymmetricallydistributed in the plane of the bilayer, often inducingstructurally and functionally important cholesterol-rich and-poor domains. It is interesting to note that, whereas themembranes of some of the cellular organelles containcholesterol in amounts roughly equimolar to the sum of allother lipids (e.g., the plasma membrane), some others, likethe endoplasmic reticulum and the inner mitochondrialmembrane, have only negligible amounts (Yeagle, 1985,1987). In fact, 80-90% of the total cellular cholesterol hasbeen found to be present in the plasma membrane (Yeagle,1985, 1987). Such asymmetric distribution of this moleculeboth among various organelles and within the bilayer (Yeagle& Young, 1986) raises an interesting possibility that thesecholesterol domains may not be only structural in nature butmay have functional roles as well.Two classes of functional roles have been assigned to these
domains in cells. On one hand, specific membrane proteins(receptors, transporters, etc.) have been shown to be localizedspecifically in cholesterol-rich (e.g., the nicotinic acetylcho-line receptor, human erythrocyte band 3 protein, glycophorin,as well as Na+,K+-ATPase) or cholesterol-poor (e.g., Ca2+-ATPase) domains, so that the precise structure and composi-tion of these domains, rather than the bulk membranecomposition, would affect the functions of these proteins(Yeagle, 1985; Fong & McNamee, 1987; Cornelius, 1995).One situation where such a cholesterol-induced domain isthought to play an important role in cell physiology is thecase of the GPI-anchored proteins, in which the carboxyterminal peptide sequence is replaced by a GPI moiety thatserves as a membrane anchor. When cross-linked byantibodies (Mayoret al., 1994), these molecules have beenshown to be clustered into microdomains at the cell surfaceover specific membrane invaginations called caveolae, oftenin association with caveolin (a cytoplasmic caveolar coatprotein), as well as with cholesterol and glycolipids (Sar-giacomoet al., 1993; Schroederet al., 1994). There isevidence that such clustering of the GPI-anchored proteinsdepends upon the presence of cholesterol in the membrane(Rothberget al., 1990). These GPI-anchored proteins, oncelocalized in the caveolae, have been shown to transducesignals to the cytoplasm that result in tyrosine phosphoryl-ation. This transduction event apparently derives from aphysical association between GPI-anchored proteins andSrc-like kinases in the caveolae, a phenomenon of immenseimportance in cellular transformation (Lisantiet al., 1994).In addition to the clustering of the GPI-anchored proteins inthe caveolae, cholesterol has also been reported to modulatethe transport of various anions, potassium, thymidine, andglucose, as well as the uptake ofγ-aminobutyric acid in cells(Yeagle, 1985).Another class of functional role for the cholesterol-induced
membrane domains comes from the kinetic evidence that
the transport of cholesterol itself, both through and betweenmembranes, may occur through specific domains (Liscum& Underwood, 1995). The regulation of the size andproperties of these domains may control cholesterol transportand accumulation in cells (Schroederet al., 1991; Bretscher& Munro, 1993). For example, intracellular transport ofcholesterol from the endoplasmic reticulum to the plasmamembrane has been suggested to occurVia specific domains(Bretscher & Munro, 1993). The retinal rod cells constituteanother typical case where cholesterol movementin ViVo isrelated to developmental changes. It has been shown(Andrews & Cohen, 1979) that, as the disks move up therod outer segment (by phagocytosis of the old disks at thetop and replacement at the bottom of the stack by new disks),the cholesterol content of the disk membrane decreasesprogressively. Developmentally, this corresponds to an agingof the disk membrane.In order to appreciate the role of cholesterol in the above
cellular functions, it is thus important to note that cholesterolis generally not present as a monodisperse solution inmembranes, and it is this asymmetry in cholesterol distribu-tion that may be important for its function. Detailed phasediagrams of cholesterol in membranes have been constructedby various groups (Lentzet al., 1980; Sankaram & Thomp-son, 1991; Huanget al., 1993). In the DPPC/cholesterolsystem, cholesterol has been proposed to be freely distributedin the bilayer at very low concentrations (<5 mol %). Thefirst change in membrane organization is found to occurabove 5 mol %, where a change in the angle of tilt of thefatty acyl chains in the solid PC phase is observed. Sharpchanges in the slopes of the phase diagrams are observed at∼22 and 30 mol % cholesterol and have been interpreted tobe either due to nonideal mixing of cholesterol phospholipidcomplexes or due to the appearance of cholesterol-cholesterol lateral dimers (Houslay & Stanley, 1982). Above50 mol %, a pure cholesterol phase has been suggested toseparate out. The first indication that cholesterol could formlateral dimers came from an NMR study of cholesterol inorganic solvents at high concentrations (Feheret al., 1974).In membranes, such cholesterol dimers have been suggestedto interact either through van der Waals interactions betweenthe twoâ-faces or through close contact between the planarR-faces (Martin & Yeagle, 1978). This model is attractivebecause, by fixing the number of phospholipids that arerequired to completely surround a monomer and a dimer ofcholesterol in the plane of the membrane, the discontinuitiesin the phase diagram (that are experimentally observed) canbe mathematically predicted.Although a large body of literature exists about the phase
behavior of cholesterol in model membranes, very little isknown about its organization in the membrane when thecholesterol content is very low (<5 mol %). It has beenassumed that cholesterol is distributed uniformly in thebilayer at these concentrations, although subtle deviationsfrom the predicted behavior of uniform solutions have beenpreviously reported in this concentration range (Estepet al.,1978; Vist & Davis, 1990; McMullenet al., 1993; Harrisetal., 1995). Very recent differential-scanning calorimetricstudies on DPPC liposomes show that there is in fact asharpening of the phase transition by cholesterol at very lowconcentrations (0-5 mol %) instead of the broadeningexpected if the chain melting were accompanied by continu-ously changing compositions of the two phases (Harriset
Membrane Organization at Low Cholesterol Concentrations Biochemistry, Vol. 35, No. 4, 19961319
+ +
+ +

al., 1995). Further analysis of these results shows that,whereas cholesterol is completely immiscible in the gel phasemembrane and exists as separate solid domains, it formsmonodisperse solutions below 2 mol % in the fluid phase.However, above a concentration of 3 mol %, the cholesterolmolecules have been shown to exist as transbilayer, tail-to-tail dimers. This is different from the lateral dimerizationthat has been proposed to occur at relatively high concentra-tions due to interaction of the sterol rings. The rather deeplocalization of cholesterol that will be required for thetransbilayer dimer formation has been previously proposed(Sankaram & Thompson, 1990, 1991). The above resultssuggest that the cholesterol molecules are not distributedrandomly in the plane of the bilayer even at relatively lowconcentrations.Fluorescent cholesterol analogues offer one of the very
few experimental handles available for studying the distribu-tion and dynamics of cholesterol in membranes. The NBDmoiety represents one such fluorescence probe that has foundwide application in various branches of biology (Chatto-padhyay, 1990). In this paper, we have discussed thebehavior of the NBD-labeled cholesterol analogue where theNBD group is covalently attached to the flexible hydrocarbontail of cholesterol, keeping all the structural features forproper membrane incorporation of the cholesterol moleculeintact. Our results show that NBD-cholesterol forms amonodisperse solution in the gel phase membranes only atvery low concentrations (up to∼0.5 mol % NBD-cholesterol). Above this concentration, these molecules seemto specifically interact with each other, giving rise todeviations in their fluorescence behavior, which may beinterpreted as an altered local environment experienced bythe interacting fraction of the population. No such deviationsare observed in fluid membranes in this concentration rangeof NBD-cholesterol (0-2 mol %).It has been previously shown that the NBD group in NBD-
cholesterol is located close to the center of the bilayer(Chattopadhyay & London, 1987). Since the NBD label inNBD-cholesterol is placed at the end of the flexiblehydrocarbon chain of cholesterol [i.e., the same parts of themolecule which interact with each other near the center ofthe bilayer to form the transbilayer, tail-to-tail dimer thathas been suggested to occur at very low cholesterolconcentrations (Harriset al., 1995)], such dimerization ofNBD-cholesterol will be favorable (see Figure 12). Thiswould bring the two NBD groups of the interacting moleculesclose together in space, thereby imparting to them the uniqueabsorption and fluorescence properties.Concentration dependent self-quenching of the NBD group
is quite well-characterized (Nichols & Pagano, 1981; McIn-
tyreet al., 1993; Prietoet al., 1994) and constitutes the basisof a large number of assays in membrane biology, such asthe phase separation of lipids (Hoekstra, 1982; Wieneretal., 1985), phospholipid transfer between mixed micelles(Nichols, 1988), and phospholipase A2 activity (Meyuhsetal., 1992). However, what we observe in this paper is notnonspecific quenching of fluorescence. Rather, we find thegradual appearance of a new population of fluorophores witha different emission maximum and fluorescence lifetime withincreasing concentration of NBD-cholesterol in the gel phase(Figures 2, 3, 5, and 8). We interpret this to be due to aspecific geometry of the NBD groups in the transbilayerdimer. Further, self-quenching occurring merely due to anincrease in the local concentration of the fluorophore wouldnot be expected to affect the absorption spectrum of thefluorophore, since in this case, the fluorophores absorb asusual but are deactivated preferentiallyVia nonradiativepathways. In this paper, we report the appearance of a newpeak in the absorption spectra concomitantly with thealteration in the fluorescence spectra (Figure 4). Thisstrongly argues for the formation of a specific ground statecomplex at these concentrations, and not nonspecific ag-gregation.It is interesting to note that the spectral signatures observed
in the gel phase membranes above 0.5 mol % NBD-cholesterol also appear in the fluid phase at 5 mol % NBD-cholesterol. This is in excellent agreement with the obser-vations of Harriset al. (1995) of the formation of transbilayercholesterol dimers in fluid phase membranes at low con-centrations (>3 mol %). This reinforces our proposal ofthe formation of transbilayer NBD-cholesterol dimers at lowconcentrations in both gel and fluid phases. This alsoexplains the deviations in the fluorescence behavior beingexhibited exclusively by the labeled cholesterol, and not bypure cholesterol. All our results thus point out that NBD-cholesterol forms transbilayer dimers in membranes at lowconcentrations and that these dimers exhibit specific signa-tures in both the absorption and the fluorescence spectra.We propose that the formation of such transmembrane dimerscould constitute the first step in the ultimate separation of apure cholesterol domain in gel phase membranes at lowconcentrations. One factor that could contribute to thestability of such dimers is aromatic-aromatic interactionbetween the NBD rings.If such transbilayer dimers are indeed present in the
membrane, it will be of interest to find out the minimumnumber of NBD-cholesterol molecules that will be requiredper vesicle to form these dimers. The “molecular weight”of DPPC ULVs prepared by the ethanol injection method,when the concentration of DPPC in ethanol is∼40 mM, hasbeen previously determined to be 7.14× 10⁷ g mol-1
(Kremeret al., 1977). Given the molecular weight of theDPPC monomer to be 734 g mol-1, the total number of lipidsthat constitute each of these ULVs will be∼105 (Huang &Mason, 1978). Assuming that the NBD-cholesterol mol-ecules are uniformly distributed between vesicles, eachvesicle, on the average, will have∼100 NBD-cholesterolmolecules for samples containing 0.1 mol % NBD-cholesterol. For 1.0 mol % NBD-cholesterol samples, thecorresponding number will be∼1000. Our results thusindicate that, whereas a total of more than 500 NBD-cholesterol molecules per vesicle (composed of∼105 DPPCmolecules) is required to give rise to dimer formation in the
FIGURE 12: Schematic diagram of the DPPC bilayer showing thetransbilayer dimers of NBD-cholesterol. The transbilayer tail-to-tail dimer of cholesterol proposed by Harriset al. (1995) is alsoshown for comparison.
1320 Biochemistry, Vol. 35, No. 4, 1996 Mukherjee and Chattopadhyay
+ +
+ +
gel phase, close to 5000 of these molecules are required inthe fluid phase to do so. These numbers are rather interestingsince the formation of such dimers could very well signifythe initiation of the phase separation of cholesterol in themembrane.The results presented in this paper confirm that NBD-
cholesterol molecules exhibit local organization in the planeof the membrane even at very low concentrations. Inmolecular terms, this organization could very well correspondto the formation of transbilayer, tail-to-tail NBD-cholesteroldimers, although the possibility of other types of aggregationcannot be ruled out. It will be interesting to determine theimplications of such local cholesterol organization in mem-branes that have very low cholesterol concentrationsin ViVo.Such studies will be especially relevant in the case of theendoplasmic reticulum which, in spite of being the intrac-ellular site for cholesterol biosynthesis, actively maintainsthe cholesterol concentration in its own membrane at a verylow level.
ACKNOWLEDGMENT
We thank Y. S. S. V. Prasad, G. G. Kingi, and SatinderS. Rawat for technical help.
REFERENCES
Andrews, L. D., & Cohen, A. I. (1979)J. Cell. Biol. 81, 215-228.Batzri, S., & Korn, E. D. (1973)Biochim.Biophys.Acta 298, 1015-1019.
Beechem, J. M. (1989)Chem. Phys. Lipids 50, 237-251.Beechem, J. M. (1992)Methods Enzymol. 210, 37-54.Beechem, J. M., Gratton, E., Ameloot, M., Knutson, J. R., & Brand,L. (1991) inTopics in Fluorescence Spectroscopy, Volume 2:Principles (Lakowicz, J. R., Ed.) pp 241-305, Plenum Press,New York.
Bevington, P. R. (1969)Data Reduction and Error Analysis forthe Physical Sciences, McGraw-Hill, New York.
Bretscher, M. S., & Munro, S. (1993)Science 261, 1280-1281.Chattopadhyay, A. (1990)Chem. Phys. Lipids 53, 1-15.Chattopadhyay, A. (1991)Biophys. J. 59, 191a.Chattopadhyay, A., & London, E. (1987)Biochemistry 26, 39-45.
Chattopadhyay, A., & London, E. (1988)Biochim. Biophys. Acta938, 24-34.
Chattopadhyay, A., & Mukherjee, S. (1993)Biochemistry 32,3804-3811.
Chen, R. F., & Bowman, R. L. (1965)Science 147, 729-732.Cornelius, F. (1995)Biochim. Biophys. Acta 1235, 205-212.Craig, I. F., Via, D. P., Mantulin, W. W., Pownall, H. J., Gotto, A.M., & Smith, L. C. (1981)J. Lipid Res. 22, 687-696.
Curtain, C. C., Gordon, L. M., & Aloia, R. C. (1988) inLipidDomains and the Relationship to Membrane Function, Vol. 2(Aloia, R. C., Curtain, C. C., & Gordon, L. M., Eds.) pp 1-15,Alan R. Liss, New York.
Demchenko, A. P., & Shcherbatska, N. V. (1985)Biophys. Chem.22, 131-143.
Dittmer, J. C., & Lester, R. L. (1964)J. Lipid Res. 5, 126-127.Edidin, M. (1992)Trends Cell Biol. 2, 376-380.Estep, T. N., Mountcastle, D. B., Biltonen, R. L., & Thompson, T.E. (1978)Biochemistry 17, 1984-1989.
Feher, J. J., Wright, L. D., & McCormick, D. B. (1974)J. Phys.Chem. 78, 250-255.
Fery-Forgues, S., Fayet, J.-P., & Lopez, A. (1993)J. Photochem.Photobiol., A 70, 229-243.
Fong, T. M., & McNamee, M. G. (1987)Biochemistry 26, 3871-3880.
Gennis, R. B. (1989)Biomembranes: Molecular Structure andFunction, pp 73-74, Springer-Verlag, New York.
Glaser, M. (1993)Curr. Opin. Struct. Biol. 3, 475-481.
Grinvald, A., & Steinberg, I. Z. (1974)Anal. Biochem. 59, 583-598.
Harris, J. S., Epps, D. E., Davio, S. R., & Kezdy, F. J. (1995)Biochemistry 34, 3851-3857.
Hoekstra, D. (1982)Biochemistry 21, 1055-1061.Houslay, M. D., & Stanley, K. K. (1982)Dynamics of BiologicalMembranes, pp 71-81, John Wiley & Sons, New York.
Huang, C., & Mason, J. T. (1978)Proc. Natl. Acad. Sci. U.S.A.75, 308-310.
Huang, T.-H., Lee, C. W. B., Das Gupta, S. K., Blume, A., &Griffin, R. G. (1993)Biochemistry 32, 13277-13287.
Jacobson, K., Sheets, E. D., & Simson, R. (1995)Science 268,1441-1442.
Knutson, J. R., Beechem, J. M., & Brand, L. (1983)Chem. Phys.Lett. 102, 501-507.
Kobayashi, T., & Pagano, R. E. (1988)Cell 55, 797-805.Koval, M., & Pagano, R. E. (1990)J. Cell. Biol. 111, 429-442.Kremer, J. M. H., Esker, M. W. J., Pathmamanoharan, C., &Wiersema, P. H. (1977)Biochemistry 16, 3932-3935.
Lakowicz, J. R. (1983)Principles of Fluorescence Spectroscopy,Plenum Press, New York.
Lakowicz, J. R., Bevan, D. R., Maliwal, B. P., Cherek, H., & Balter,A. (1983)Biochemistry 22, 5714-5722.
Lampert, R. A., Chewter, L. A., Phillips, D., O’Connor, D. V.,Roberts, A. J., & Meech, S. R. (1983)Anal. Chem. 55, 68-73.
Lentz, B. R., Barrow, D. A., & Hoechli, M. (1980)Biochemistry19, 1943-1954.
Lin, S., & Struve, W. S. (1991)Photochem. Photobiol. 54, 361-365.
Lipsky, N. G., & Pagano, R. E. (1983)Proc.Natl. Acad. Sci.U.S.A.80, 2608-2612.
Lipsky, N. G., & Pagano, R. E. (1985)J. Cell. Biol. 100, 27-34.Lisanti, M. P., Scherer, P. E., Tang, Z., & Sargiacomo, M. (1994)Trends Cell Biol. 4, 231-235.
Liscum, L., & Underwood, K. W. (1995)J. Biol. Chem. 270,15443-15446.
Martin, R. B., & Yeagle, P. L. (1978)Lipids 13, 594-597.Matayoshi, E. D., & Kleinfeld, A. M. (1981)Biophys. J. 35, 215-235.
Mayor, S., Rothberg, K. G., & Maxfield, F. R. (1994)Science 264,1948-1951.
McClare, C. W. F. (1971)Anal. Biochem. 39, 527-530.McIntyre, J. C., Watson, D., & Sleight, R. G. (1993)Chem. Phys.Lipids 66, 171-180.
McMullen, T. P. W., Lewis, R. N. A. H., & McElhaney, R. N.(1993)Biochemistry 32, 516-522.
Meyuhas, D., Yedgar, S., Rotenberg, M., Reisfeld, N., & Licht-enberg, D. (1992)Biochim. Biophys. Acta 1124, 223-232.
Mitra, B., & Hammes, G. G. (1990)Biochemistry 29, 9879-9884.Mukherjee, S., & Chattopadhyay, A. (1994)Biochemistry 33,5089-5097.
Mukherjee, S., Chattopadhyay, A., Samanta, A., & Soujanya, T.(1994)J. Phys. Chem. 98, 2809-2812.
Nakamura, T., Nishikawa, M., Inoue, K., Nojima, S., Akiyama,T., & Samkawa, U. (1980)Chem. Phys. Lipids 26, 101-110.
Nichols, J. W. (1988)Biochemistry 27, 3925-3931.Nichols, J. W., & Pagano, R. E. (1981)Biochemistry 20, 2783-2789.
O’Connor, D. V., & Phillips, D. (1984) inTime-Correlated SinglePhoton Counting, pp 180-189, Academic Press, London.
Oldfield, E., Meadows, M., Rice, D., & Jacobs, R. (1978)Biochemistry 17, 2727-2740.
Pagano, R. E., & Sleight, R. G. (1985)Science 229, 1051-1057.Pagano, R. E., & Martin, O. C. (1988)Biochemistry 27, 4439-4445.
Pagano, R. E., Sepanski, M. A., & Martin, O. C. (1989)J. CellBiol. 109, 2067-2079.
Prieto, M. J. E., Castanho, M., Coutinho, A., Ortiz, A., Aranda, F.J., & Gomez-Fernandez, J. C. (1994)Chem. Phys. Lipids 69,75-85.
Rajarathnam, K., Hochman, J., Schindler, M., & Ferguson-Miller,S. (1989)Biochemistry 28, 3168-3176.
Ranadive, G. N., & Lala, A. K. (1987)Biochemistry 26, 2426-2431.
Rando, R. R., Bangerter, F. W., & Alecio, M. R. (1982)Biochim.Biophys. Acta 684, 12-20.
Membrane Organization at Low Cholesterol Concentrations Biochemistry, Vol. 35, No. 4, 19961321
+ +
+ +
Rothberg, K. G., Ying, Y.-S., Kamen, B. A., & Anderson, R. G.W. (1990)J. Cell Biol. 111, 2931-2938.
Sankaram, M. B., & Thompson, T. E. (1990)Biochemistry 29,10676-10684.
Sankaram, M. B., & Thompson, T. E. (1991)Proc. Natl. Acad.Sci. U.S.A. 88, 8686-8690.
Sargiacomo, M., Sudol, M., Tang, Z., & Lisanti, M. P. (1993)J.Cell. Biol. 122, 789-807.
Schroeder, F. (1984)Prog. Lipid Res. 23, 97-113.Schroeder, F., Jefferson, J. R., Kier, A. B., Knittel, J., Scallen, T.J., Wood, W. G., & Hapala, I. (1991)Proc. Soc. Exp. Biol.Med.196, 235-252.
Schroeder, R., London, E., & Brown, D. (1994)Proc. Natl. Acad.Sci. U.S.A. 91, 12130-12134.
Singer, S. J., & Nicolson, G. L. (1972)Science 175, 720-731.Slotte, J. P. (1995)Biochim. Biophys. Acta 1235, 419-427.Slotte, J. P., & Mattjus, P. (1995)Biochim. Biophys. Acta 1254,22-29.
Ting, A. E., & Pagano, R. E. (1990)J. Biol. Chem. 265, 5337-5340.
Tocanne, J. F. (1992)Comments Mol. Cell. Biophys. 8, 53-72.Van Meer, G., Stelzer, E. H. K., Wijnaendts-van-Resandt, R. W.,& Simons, K. (1987)J. Cell Biol. 105, 1623-1635.
Vincent, M., & Gallay, J. (1983)Biochem. Biophys. Res. Commun.113, 799-810.
Vist, M. R., & Davis, J. H. (1990)Biochemistry 29, 451-464.Ware, W. R., Lee, S. K., Brant, G. J., & Chow, P. P. (1971)J.Chem. Phys. 54, 4729-4737.
Wiener, J. R., Pal, R., Barenholz, Y., & Wagner, R. R. (1985)Biochemistry 24, 7651-7658.
Yeagle, P. L. (1985)Biochim. Biophys. Acta 822, 267-287.Yeagle, P. (1987)The Membranes of Cells, pp 120-138, AcademicPress, Orlando, FL.
Yeagle, P. (1992) inThe Structure of Biological Membranes(Yeagle, P., Ed.) pp 157-174, CRC Press, Boca Raton, FL.
Yeagle, P. L., & Young, J. E. (1986)J. Biol. Chem. 261,8175-8181.
BI951953Q
1322 Biochemistry, Vol. 35, No. 4, 1996 Mukherjee and Chattopadhyay
+ +
+ +