
Meditation XVII Written in 1624 ADAPTING BUILDINGS AND CITIES FOR CLIMATE CHANGE
379
Transcript of Meditation XVII Written in 1624 ADAPTING BUILDINGS AND CITIES FOR CLIMATE CHANGE

ADAPTING BUILDINGS AND CITIES FOR CLIMATE CHANGE
Roaf_FM.qxd 29/10/04 7:06 PM Page i

This book is dedicated tothe late Graeme Robertson
No man is an island, entire of itself…any man’s death diminishes me,
because I am involved in mankind;and therefore never send to know for whom the bell tolls;
it tolls for thee.
John DonneMeditation XVIIWritten in 1624
Roaf_FM.qxd 29/10/04 7:06 PM Page ii

ADAPTING BUILDINGS ANDCITIES FOR CLIMATECHANGEA 21st century survival guide
Sue Roaf
David Crichton and Fergus Nicol
AMSTERDAM ● BOSTON ● HEIDELBERG ● LONDON ● NEW YORK ● OXFORDPARIS ● SAN DIEGO ● SAN FRANCISCO ● SINGAPORE ● SYDNEY ● TOKYO
Architectural Press is an imprint of Elsevier
Roaf_FM.qxd 29/10/04 7:06 PM Page iii

Architectural PressAn imprint of ElsevierLinacre House, Jordan Hill, Oxford OX2 8DP30 Corporate Drive, Burlington MA 01803
First published 2005
Copyright © 2005, Sue Roaf. All rights reserved
The right of Sue Roaf to be identified as the author of this workhas been asserted in accordance with the Copyright, Designs andPatents Act 1988
No part of this publication may be reproduced in any material form (includingphotocopying or storing in any medium by electronic means and whetheror not transiently or incidentally to some other use of this publication) withoutthe written permission of the copyright holder except in accordance with theprovisions of the Copyright, Designs and Patents Act 1988 or under the terms ofa licence issued by the Copyright Licensing Agency Ltd, 90 Tottenham Court Road,London, England W1T 4LP. Applications for the copyright holder’s writtenpermission to reproduce any part of this publication should be addressedto the publisher
Permissions may be sought directly from Elsevier’s Science and Technology RightsDepartment in Oxford, UK: phone: (�44) (0) 1865 843830; fax: (�44) (0) 1865 853333;e-mail: [email protected]. You may also complete your request on-line via theElsevier homepage (www.elsevier.com), by selecting ‘Customer Support’and then ‘Obtaining Permissions’
Every effort has been made to contact owners of copyright material; however, the authorswould be glad to hear from any copyright owners of material produced in this bookwhose copyright has unwittingly been infringed.
British Library Cataloguing in Publication DataA catalogue record for this book is available from the British Library
Library of Congress Cataloguing in Publication DataA catalogue record for this book is available from the Library of Congress
ISBN 0 7506 5911 4
For information on all Architectural Press publicationsvisit our website at www.architecturalpress.com
Typeset by Newgen Imaging Systems (P) Ltd., Chennai, IndiaPrinted and bound in Italy
Roaf_FM.qxd 29/10/04 7:06 PM Page iv

CONTENTS
Preface vii
Acknowledgements x
About the authors xi
1 Climate change: the battle begins 1
2 The evolution of buildings 33
3 Risk, scenarios and insurance 63
4 How hot will it get? 83
5 Safe and warm; effect of climate change on thermal comfort and health 110
6 How wet will it get? 154
7 Windstorms 177
8 Sea level rises 190
9 Vulnerability, exposure and migration 206
10 Air conditioning – the ultimate solution? 217
11 Tall buildings 240
12 The fossil fuel crisis 269
13 Fuel security: when will the lights go out? 289
14 The players 304
15 The battle continues 342
Index 353
Roaf_FM.qxd 29/10/04 7:06 PM Page v

Roaf_FM.qxd 29/10/04 7:06 PM Page vi
PREFACE
This is a book I have been thinking about writing for over 25 years.Every study I have worked on, in those intervening years, has beena stepping-stone towards this publication on the future of architec-ture. That journey started in the far distant past, in the ancient vil-lages and cities of Iraq, the cradle of civilization where, throughseven years of excavation, we touched the lives of those peoplewho ate from the pots, played with the toys, drove the chariotsand built the buildings that we uncovered, not decades or centuries,but millennia ago, on the once fertile plains, once again scarred bywar. The path to this book passed through nomad tents on tribalroads, and across vast deserts where families, using little moreenergy than twigs to cook on, lived in comfort, and in some casesluxury, in the extreme climates of what we would see only as bar-ren lands.
Climate in those regions, on the fringes of agriculture, has alwaysbeen about survival, but the study that first alerted me to the scaleof the potential impacts of climate change on our lives in the moretemperate lands was one, not on buildings in hot deserts, but onthe ice-houses of Britain. Writing on their history in the 1980s, itbecame obvious that this ancient technology, forgotten behind themiracle of refrigeration, had become climatically obsolete as theworld warmed, and that even very small changes in global tem-peratures, fractions of a degree, could be responsible for the demiseof a great international industry, if those changes cross a criticalthermal threshold, such as the temperature at which ice melts.
The image below shows how central to our very survival thesimple substance ice is, and what a key role it is playing in there-ordering of global climates, oceans and landscapes.
By the late 1980s the growing global problems of ozone deple-tion and climate change were beginning to be talked of more often.My concern was growing at the unfairness of the reality – thatpeople in the developing countries are already dying in large num-bers because of climate change, whilst it is those in the West
Roaf_FM.qxd 29/10/04 7:06 PM Page vii

viii Preface
who are generating the carbon dioxide emissions that are warm-ing the world.
The desire to show that it need not be like this led to the build-ing of the first photovoltaic home in Oxford, in which my familystill comfortably resides. This simple building emits only a few hun-dred kilograms of CO2 a year instead of five or six thousand andis more comfortable than a highly polluting one. We cut down ourgreenhouse gas emissions to less than 10% of typical emissionswith no loss of quality of life. So why isn’t everyone doing it? Whyare architects building ‘glass houses’ and windowless plywood‘blobs’ instead of the types of solid, resilient, buildings that offerus some hope for survival in the coming decades?
It beats me! But what I do know is that the road that many ofus have followed from the Energy Crisis of the 1970s through thegrowing issues of climate change, fossil fuel depletion and sus-tainability has led us towards a present, and a future, that is verydifferent from anything that has been before. One can see whymany people want to avoid thinking about it – a future where theissue is increasingly not about comfortable concepts like ‘sustain-ability’, but about the harsher realities of designing for ‘survival’.
If only the global community had acted more firmly in the 1970swhen they saw the challenges ahead perhaps we would not nowbe facing the predicaments around us! The unavoidable truth isthat it has been left to our generation alone, of all those that have
1.Map of the world showing in red those areas that would be inundated if all the ice caps melted, causing a rise in globalsea levels of up to 100 m. (Source: Laurence Williams, An End to Global Warming, 2002, Pergamon; reproduced withpermission)
Roaf_FM.qxd 29/10/04 7:06 PM Page viii

Preface ix
come before, to face the awesome challenge of redesigning theworld to accommodate the new forces of the late fossil fuel age,of dark cities, a world of slowing economic growth, of climatechange and an exploding global population.
It is the scale of the catastrophic changing of circumstances aroundus that makes it difficult to grasp at any heart to the problem. Weare still only equipped with the old ways of thinking, that showedus an illusion of a clear path ahead. But many of us who, for years,have been watching, and working so diligently to get a handle oncontrolling the impacts of late-20th-century development have beensurprised by how wrong we got it. We have only been scratchingthe surface of the problem. In what we once saw as the manage-able game of sustainable development, our eyes have been so faroff the ball that what follows in this book may be unbelievable, orunpalatable, to many readers. Very few people – remarkable amongthem being my co-authors David Crichton and Fergus Nicol and thepioneering thinker Edward Mazria1 – have been able to see beyondthe ‘business as usual’ carrot that draws us, blinkered, on our way.
Few have questioned the horizons, or understood that what weonce saw as a single, efficient, road forward to a clean, bright,future has now widened out into a quagmire of complex interre-lated forces that urgently require us to think outside the envelopeof our own buildings, and above all, to open windows, to embracea new age of architecture, planning and politics of development.We can make a difference, we can leave a world fit for our chil-dren and grandchildren, but the task is urgent and the task is huge.
Can it be that for decades we have been looking for the warn-ings in all the wrong places? Because the one thing that is increas-ingly clear is that the writing is now on the landscape, and thewall.
Sue Roaf
NOTE
1 See http://www.metropolismag.com/html/content_1003/glo/index.html.
Roaf_FM.qxd 29/10/04 7:06 PM Page ix

ACKNOWLEDGEMENTS
My heartfelt thanks go to my co-authors David Crichton and FergusNicol, both of them visionaries in their fields. Also to those whohave so generously contributed to the contents of the book – JanetRudge, Sari Kovats, Fiona Mullins, Aubrey Meyer, Colin Campbell –and all of those who have helped in preparing the contents of thisbook through thought, word or deed.
For wonderful illustrations I would like to thank: UKCIP, LaurenceWilliams, Richenda Connell, Jacquelyn Harman, Adrian Arbib, MarkLynas, Paul Eugene Camp, Aubrey Meyer, Claire Palmer, FergusNicol, Jane Matthews, Gavin Kenny, Mary Hancock, David Crichton,Edward Mazria, Rob Wilby, Isaac Meir, Charles Knevitt, Bryan Lynas,Tim Helweg, Rodrigo Leal, John Mardaljevic, Bill Hughes, ColinCampbell, Louis Hellman, Steve Sharples, Cliff Wassman, JanetRudge, Sari Kovats, Russell C. Schnell, Mark Watham, AlexHollingsworth, Rosanna Salbashian, Bill Bordass, Catherine Streater,David Infield, Emma Perry and Frances Bergmann.
For helping to make the book happen at Architectural Press Ithank: Alison Yates, Catharine Steers, Elaine Leek and MargaretDenley.
We are deeply grateful to the following sponsors for making itpossible to have this book in colour – their support has meant agreat deal to us. Thank you:
The Ecology Building SocietyFriends of the Earth
It should be noted that the particular views expressed in this bookare solely those of the authors.
Roaf_FM.qxd 30/10/04 12:17 PM Page x

ABOUT THE AUTHORS
Professor Susan Roaf, BA Hons, AADipl, PhD, ARB,FRSA, WCCA, Fellow of the Schumacher Society,Freeman of the City of London
Educated at the University of Manchester, the ArchitecturalAssociation and Oxford Polytechnic, Professor Roaf completed aDoctorate on the Windcatchers of Yazd, in 1989 after some tenyears spent in the Middle East, living in the Desert city of Yazd,with the Beiranvand Tribe in Luristan and excavating for 7 yearsin Iraq with her husband. Her first book was on the ice-houses ofBritain, followed by books on energy efficient buildings, ecohousedesign, benchmarks for sustainable buildings, and climate change.She is currently a Professor of Architecture at Oxford BrookesUniversity and is engaged in research and teaching on subjects asdiverse as photovoltaics in buildings to eco-tourism in the NorthWest Frontier Province of Pakistan and the technologies of theancient world. She is a Liberal Democrat Councillor for WolvercoteWard in Oxford.
Professor David Crichton, MA, FCII, Chartered Insurance Practitioner
David has many years’ experience in underwriting and claims at senior management level in the insurance industry and is a Fellowof the Chartered Insurance Institute. He now works as a researchconsultant for insurers on climate change impacts and is a VisitingProfessor at the Benfield Hazard Research Centre at UniversityCollege London and also at Middlesex University Flood HazardResearch Centre. He is an Honorary Research Fellow at the Universityof Dundee. He has spoken at insurance and climate change con-ferences in four continents and has worked with the UN and NATO,as well as with many governments. He is based in Scotland wherehe has advised more than 20 local authority planning and building
Roaf_FM.qxd 29/10/04 7:06 PM Page xi

xii About the authors
control departments on flood insurance issues and he is a memberof the Research Committee of the Scottish Building StandardsAdvisory Committee.
Affiliations:
Benfield Hazard Research Centre, University College LondonThis is the largest natural hazard academic research centre inEurope, with specialists in all forms of natural disasters. Some ofDavid’s recent publications on flood insurance in Britain can bedownloaded free from their website at www.benfieldhrc.org.
Middlesex University Flood Hazard Research Centre, LondonThis is the largest flood hazard research centre in the UK.
University of DundeeThis is arguably the leading centre of expertise in hydrology andflooding in Scotland and has close links with the insurance industry.It is the home of the British Hydrological Society flood events data-base and the home of the UK National Flood Insurance ClaimsDatabase.
Professor Fergus Nicol, BSc
In the sixties and early seventies Fergus Nicol researched build-ing physics and human thermal comfort at the Building ResearchEstablishment and the Human Physiology Unit of the MedicalResearch Council. He also taught in the Schools of Architectureat the University of Science and Technology in Kumasi Ghana andthe Architectural Association in London. After a period at Bookmarksbookshop he returned to teaching and research in 1992.
Fergus is best known for his work in the science of human ther-mal comfort where he has developed, with Professor MichaelHumphreys, the ‘adaptive’ approach to thermal comfort. He hasrun a number of projects over the last 10 years funded by theEPSRC and other funding agencies including the DETR, the DfIDand a major EU project Smart Controls and Thermal Comfort(SCATS). He works at Oxford Brookes and London MetropolitanUniversities. At both Fergus was responsible for developing multi-disciplinary Masters courses in energy efficient and sustainablebuildings. Fergus was recently awarded professorships by both uni-versities and is Deputy Director of the Low Energy ArchitectureResearch Unit (LEARN) in the London Metropolitan University.
Fergus is a founder member of the UK thermal comfort InterestGroup and is a member of UK and European consultative com-mittees providing advice on comfort issues in building ventilation,
Roaf_FM.qxd 29/10/04 7:06 PM Page xii

About the authors xiii
and, with Michael Humphreys, is rewriting the new CIBSE Guide Asection on thermal comfort. He was responsible for the interna-tional conference ‘Moving comfort standards into the 21st Century’in Windsor, UK in April 2001 attended by most of the internationalexperts in thermal comfort and thermal comfort standards. InOctober 2002 he co-chaired a conference in Jakarta, Indonesia enti-tled ‘Building research and the sustainability of the built environ-ment in the Tropics’.
Roaf_FM.qxd 29/10/04 7:06 PM Page xiii

Roaf_FM.qxd 29/10/04 7:06 PM Page xiv
WAR IS ALREADY UPON US
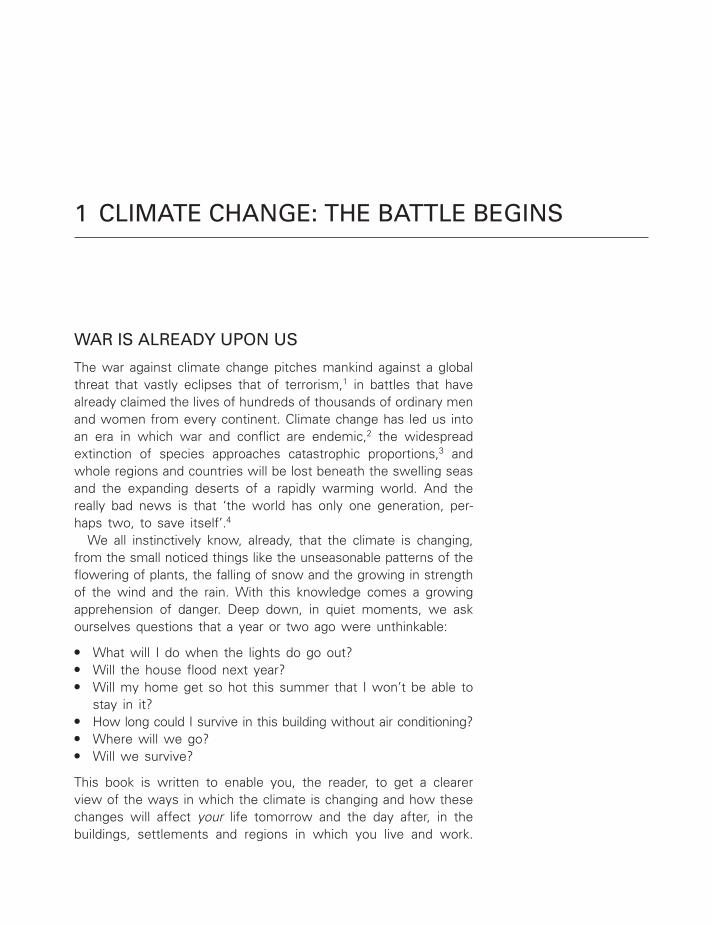
The war against climate change pitches mankind against a globalthreat that vastly eclipses that of terrorism,1 in battles that havealready claimed the lives of hundreds of thousands of ordinary menand women from every continent. Climate change has led us intoan era in which war and conflict are endemic,2 the widespreadextinction of species approaches catastrophic proportions,3 andwhole regions and countries will be lost beneath the swelling seasand the expanding deserts of a rapidly warming world. And thereally bad news is that ‘the world has only one generation, per-haps two, to save itself’.4
We all instinctively know, already, that the climate is changing,from the small noticed things like the unseasonable patterns of theflowering of plants, the falling of snow and the growing in strengthof the wind and the rain. With this knowledge comes a growingapprehension of danger. Deep down, in quiet moments, we askourselves questions that a year or two ago were unthinkable:
● What will I do when the lights do go out?● Will the house flood next year?● Will my home get so hot this summer that I won’t be able to
stay in it?● How long could I survive in this building without air conditioning?● Where will we go?● Will we survive?
This book is written to enable you, the reader, to get a clearerview of the ways in which the climate is changing and how thesechanges will affect your life tomorrow and the day after, in thebuildings, settlements and regions in which you live and work.
1 CLIMATE CHANGE: THE BATTLE BEGINS
Roaf_Ch01.qxd 29/10/04 6:29 PM Page 1

Only by emotionally registering, by consciously taking on board,the scale of the impending global disaster ahead will any of usfind the strength to act in time to avert the worst of its impacts.
But not only do we have to act fast, we also have to act together.Actions will only be effective if we, all, act together because eachof us is ‘involved’ in the fate of all mankind through the commonair that we breathe and the climate we occupy.
As you will see throughout this book, people can apparently be‘familiar’ with the excellent science of climate change, and ‘know’intellectually the problems that exists, but still fail to engage withthem, or act upon that knowledge. We know now that many ofthe gases we emit from the burning of fossil fuels are altering theclimate. Every schoolchild learns, or should learn, how these gasesare building up in the upper atmosphere to form an increasinglydense layer that allows solar radiation into the Earth’s atmosphere,but as this layer gets denser, it prevents more and more heat fromradiating back out into space so warming the lower atmosphereand changing our climate.6
The evidence for climate change is growing more alarming eachyear. The exceptionally hot summer of 2003 warned experts thatthe pace of this warming is faster than previously envisaged in theirworst case scenarios.7 Yet rather than acting to reduce emissions,many apparently well-meaning and well-informed people appear toact wilfully to make the situation worse in communal acts of ‘denial’,and nowhere more so than in the built environment. Buildings areresponsible for producing over half of all climate change emissions,but year on year, ‘modern’ buildings become more and more energy-profligate and damaging to all our children’s future. Climate changeis personal. ‘They’ are harming ‘our’ grandchildren.
In London, for instance, where more is known about the urbanimpacts of climate change than for almost any other city in theworld, Labour politicians have heavily promoted the huge
1.1.Scientists have established thatclimate change is reallyhappening and can, to an extent,model future climates. Here wesee the change in the annualaverage (a) temperature and(b) precipitation, predicted for the2080s period, relative to1961–90, for one climate model,the HadCM3 ensemble-averageunder an A2 forcing scenario.(Source: UKCIP02 ScientificReport,5 p. 19)
2 Adapting Buildings and Cities for Climate Change
(b)(a)
Temperatureanomaly °C
50 40 30 20 10 0 –10–20–30–40–50
Precipitationanomalypercentage
109876543210
Roaf_Ch01.qxd 29/10/04 6:29 PM Page 2

Climate change: the battle begins 3
Outer space
Atmosphere
The Earth
Sunlight passes throughthe greenhouse gasesand warms everythingon Earth
The Earth warms upand gives out heat.Some passes through thegreenhouse gasesbut some is trapped insidewarming up the Earth
Greenhouse gases
(a)
(b) The plants and soilwarm up and giveout heat. Some passesthrough the glass butsome is trapped inside,warming up the greenhouse
Sunlight passesthrough the glassand warms the plants
Greenhouseglass
1.2.The basics of climate change are taught in all British schools and such images of how the greenhouse effect (b) works inrelation to the global atmosphere (a) are very familiar to children by the age or 7 or 8. (Source:http://www.defra.gov.uk/environment/climatechange/schools/12-16/info/cause.htm)
Roaf_Ch01.qxd 29/10/04 6:29 PM Page 3

1.4.Graph showing the relativelylarge impacts of buildings in thedeveloped world in terms of theiremissions of climate changegreenhouse gases. (Source: MAX Fordham and Partners)
1.3.In the middle of the 20th century more and more of the world’s rapidly growing population bought cars and heated andcooled their buildings, resulting in a rapid increase in concentrations (parts per million/billion by volume) of the majorgreenhouse gases in the global atmosphere: carbon dioxide (CO2), nitrous oxide (N2O), methane (CH4) and CFC11.(Source: Houghton J.T., Jenkins, G.J., Ephraums, J.J (eds) (1990) Climate Change: The IPCC Scientific Assessment.Cambridge: Cambridge University Press, p. xvi)
4 Adapting Buildings and Cities for Climate Change
1750260
280
300
320
CO
2 co
nce
ntr
atio
n (
pp
mv)
340
360
1800 1850
Carbon dioxide
Year1900 1950 2000
1750280
290
300
N2O
co
nce
ntr
atio
n (
pp
bv)
310
1800 1850
Nitrous oxide
Year1900 1950 2000
1750600
800
1000
1200
1400
CH
4 co
nce
ntr
atio
n (
pp
bv)
1600
1800
1800 1850
Methane
Year1900 1950 2000
17500.0
0.1
0.2
CFC
11 c
on
cen
trat
ion
(p
pb
v)
0.3
1800 1850
CFC11
Year1900 1950 2000
Proportions of fossil fuel usein developed economies
Buildings50%
Transport25%
Industry25%
Courtesy Max Fordham MFP
Roaf_Ch01.qxd 29/10/04 6:29 PM Page 4
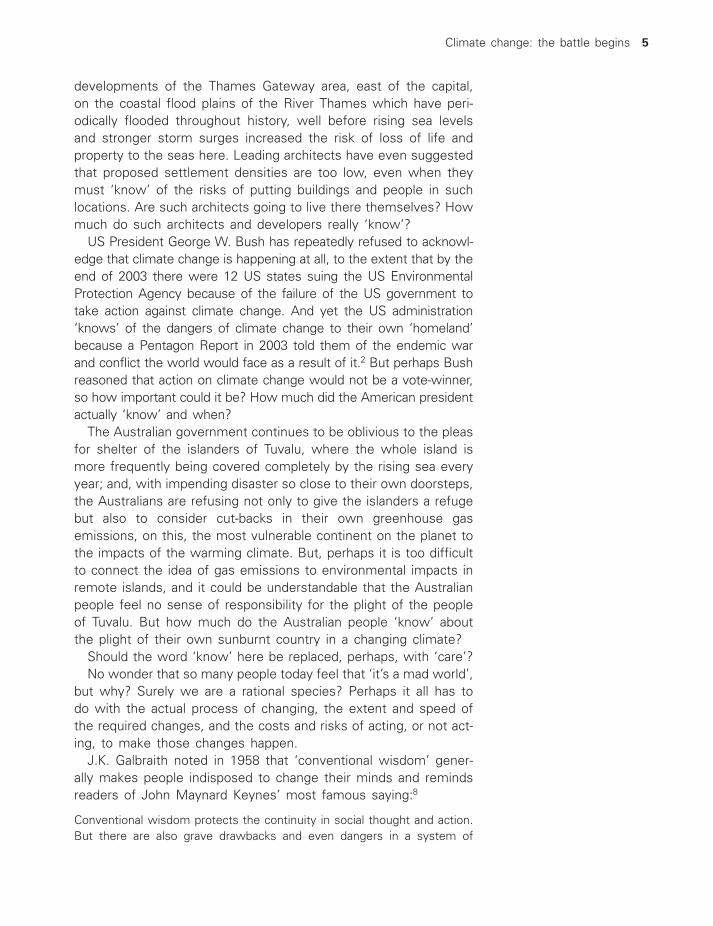
developments of the Thames Gateway area, east of the capital,on the coastal flood plains of the River Thames which have peri-odically flooded throughout history, well before rising sea levelsand stronger storm surges increased the risk of loss of life andproperty to the seas here. Leading architects have even suggestedthat proposed settlement densities are too low, even when theymust ‘know’ of the risks of putting buildings and people in suchlocations. Are such architects going to live there themselves? Howmuch do such architects and developers really ‘know’?
US President George W. Bush has repeatedly refused to acknowl-edge that climate change is happening at all, to the extent that by theend of 2003 there were 12 US states suing the US EnvironmentalProtection Agency because of the failure of the US government totake action against climate change. And yet the US administration‘knows’ of the dangers of climate change to their own ‘homeland’because a Pentagon Report in 2003 told them of the endemic warand conflict the world would face as a result of it.2 But perhaps Bushreasoned that action on climate change would not be a vote-winner,so how important could it be? How much did the American presidentactually ‘know’ and when?
The Australian government continues to be oblivious to the pleasfor shelter of the islanders of Tuvalu, where the whole island ismore frequently being covered completely by the rising sea everyyear; and, with impending disaster so close to their own doorsteps,the Australians are refusing not only to give the islanders a refugebut also to consider cut-backs in their own greenhouse gasemissions, on this, the most vulnerable continent on the planet tothe impacts of the warming climate. But, perhaps it is too difficultto connect the idea of gas emissions to environmental impacts inremote islands, and it could be understandable that the Australianpeople feel no sense of responsibility for the plight of the peopleof Tuvalu. But how much do the Australian people ‘know’ aboutthe plight of their own sunburnt country in a changing climate?
Should the word ‘know’ here be replaced, perhaps, with ‘care’?No wonder that so many people today feel that ‘it’s a mad world’,
but why? Surely we are a rational species? Perhaps it all has todo with the actual process of changing, the extent and speed ofthe required changes, and the costs and risks of acting, or not act-ing, to make those changes happen.
J.K. Galbraith noted in 1958 that ‘conventional wisdom’ gener-ally makes people indisposed to change their minds and remindsreaders of John Maynard Keynes’ most famous saying:8
Conventional wisdom protects the continuity in social thought and action.But there are also grave drawbacks and even dangers in a system of
Climate change: the battle begins 5
Roaf_Ch01.qxd 29/10/04 6:29 PM Page 5

thought which by its very nature and design avoids accommodation tocircumstances until change is dramatically forced upon it . . . the rule ofideas is only powerful in a world that does not change. Ideas are inherentlyconservative. They yield not to attack of other ideas but to the massiveonslaught of circumstances with which they cannot contend.
We are faced now with the massive onslaught of the circum-stances of climate change. This book describes some of those cir-cumstances in relation to buildings, settlements and lifestyles ofthis, and future decades. As you read on it will become clearerhow very difficult, if not impossible, we will find it to contend withthe impacts of climate change, to meet head on the challengesof changing ‘social thought and action’, and to re-direct the super-tanker of conventional wisdom.
That is why you, the reader, are important, and why this bookhas been written to make you ‘disposed to change your mind’,and in turn change the minds of those in your circle of influence,and those in theirs, and so on until the ripple grows to be a tidalwave of change in the attitudes of our society. And though noneof us wants it, and we may wish that we lived in different times,it is the responsibility of each and every one of our generation,and ours alone in the whole history of human kind, to take uparms in this battle for our very survival.
But why has it taken us so long to act? The Climate War isalready upon us. How did it come to this?
THE ENEMY WAS SIGHTED LONG AGO
The possibility that the climate could be changing was first identi-fied as far back as the 1960s, and the battle against climate change,and its main contributory gas, CO2, began.
Physical measurements of global CO2 emissions have been takensince the 1950s.9 The Mauna Loa atmospheric CO2 measurementsconstitute the longest continuous record of atmospheric CO2 con-centrations available in the world. The Mauna Loa site, on theisland of Hawaii, is considered one of the most favourable locationsfor measuring undisturbed air because possible local influences ofvegetation or human activities on atmospheric CO2 concentrationsare minimal and any influences from volcanic vents may be excludedfrom the records.
The methods and equipment used to obtain these measure-ments have remained essentially unchanged during the 50-yearmonitoring programme. Because of the favourable site location,continuous monitoring, and careful selection and scrutiny of thedata, the Mauna Loa record is considered to be a precise recordand a reliable indicator of the regional trend in the concentrations
6 Adapting Buildings and Cities for Climate Change
Roaf_Ch01.qxd 29/10/04 6:29 PM Page 6

of atmospheric CO2 in the middle layers of the troposphere. Therecord shows an 18% increase in the mean annual concentration,from 315.98 parts per million by volume (ppmv) of dry air in 1959to 372.95 ppmv in 2002. The 1997–98 increase in the annual growthrate of 2.87 ppmv represents the largest single yearly jump sincethe Mauna Loa record began in 1958.
Such data are used to inform and validate the computer mod-els of the climate10 which have been used to depict and predictformer, current and future climates right down to a resolution offifty, and now even five, kilometre squares.11 Such models haveprovided sufficiently credible evidence, where, for instance, pre-dicted temperatures resemble closely temperatures experienced,for the virtually universal consensus amongst internationallyrespected scientists and meteorologists that increasing atmosphericconcentrations of carbon dioxide, and other gases, with significantabsorptivity in the far infra-red, ‘the greenhouse gases’, have alreadyled to significant changes in the climate of the world with far-reaching implications for everyone on this planet.12
It was the scientists who charted, and modelled, the first man-ifestations of the enemy that threatens our species, but issuessuch as the changing climate, the loss of biodiversity, terrestrialand atmospheric pollution, and resource depletion, are only thestandards of the enemy, caught flying in the wind. What the intel-lectuals, economists and politicians did was to identify the realenemy in our ecosystem – ourselves.
THE WARNING IS SOUNDED
The global environmental trumpet was sounded for the first time,warning of the enormity of the problems we face, at the first generalmeeting of the Club of Rome in 1970. The meeting was convened
1.5.The Mauna Loa carbon dioxiderecord, 1958–2002. (Source:Climate Monitoring andDiagnostics Laboratory of the USNational Oceanic andAtmospheric Administration,Mauna Loa, Hawaii)
Climate change: the battle begins 7
380
370
350
360
340
330
320
3101955 1960 1965 1970 1975 1980 1985 1990 1995 2000
CO
2 co
nce
ntr
atio
n (p
pm
v)
Year
Roaf_Ch01.qxd 29/10/04 6:29 PM Page 7
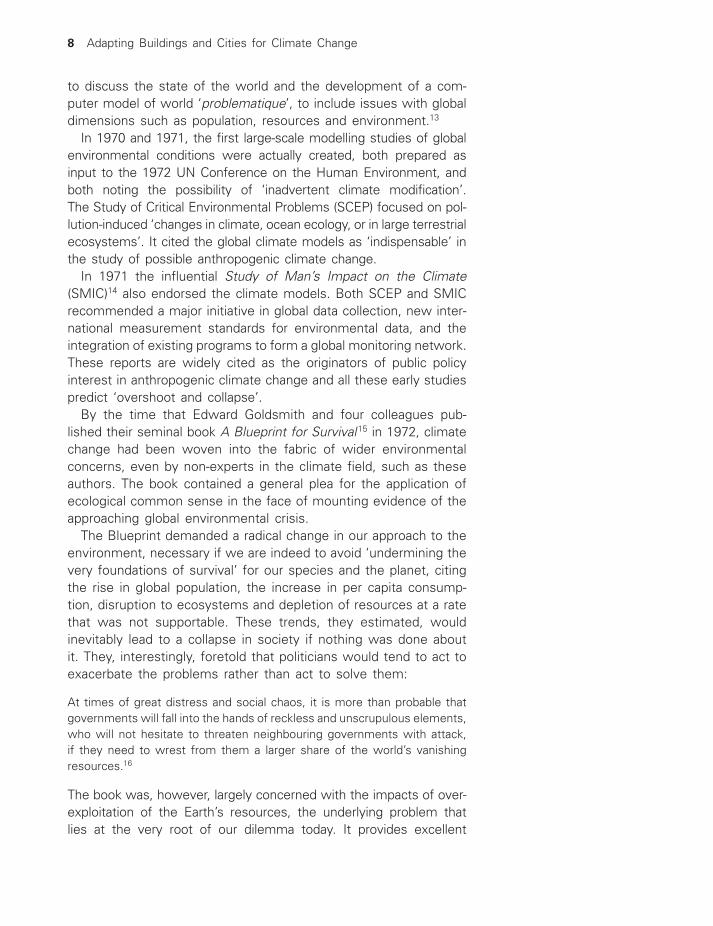
to discuss the state of the world and the development of a com-puter model of world ‘problematique’, to include issues with globaldimensions such as population, resources and environment.13
In 1970 and 1971, the first large-scale modelling studies of globalenvironmental conditions were actually created, both prepared asinput to the 1972 UN Conference on the Human Environment, andboth noting the possibility of ‘inadvertent climate modification’.The Study of Critical Environmental Problems (SCEP) focused on pol-lution-induced ‘changes in climate, ocean ecology, or in large terrestrialecosystems’. It cited the global climate models as ‘indispensable’ inthe study of possible anthropogenic climate change.
In 1971 the influential Study of Man’s Impact on the Climate(SMIC)14 also endorsed the climate models. Both SCEP and SMICrecommended a major initiative in global data collection, new inter-national measurement standards for environmental data, and theintegration of existing programs to form a global monitoring network.These reports are widely cited as the originators of public policyinterest in anthropogenic climate change and all these early studiespredict ‘overshoot and collapse’.
By the time that Edward Goldsmith and four colleagues pub-lished their seminal book A Blueprint for Survival15 in 1972, climatechange had been woven into the fabric of wider environmentalconcerns, even by non-experts in the climate field, such as theseauthors. The book contained a general plea for the application ofecological common sense in the face of mounting evidence of theapproaching global environmental crisis.
The Blueprint demanded a radical change in our approach to theenvironment, necessary if we are indeed to avoid ‘undermining thevery foundations of survival’ for our species and the planet, citingthe rise in global population, the increase in per capita consump-tion, disruption to ecosystems and depletion of resources at a ratethat was not supportable. These trends, they estimated, wouldinevitably lead to a collapse in society if nothing was done aboutit. They, interestingly, foretold that politicians would tend to act toexacerbate the problems rather than act to solve them:
At times of great distress and social chaos, it is more than probable thatgovernments will fall into the hands of reckless and unscrupulous elements,who will not hesitate to threaten neighbouring governments with attack,if they need to wrest from them a larger share of the world’s vanishingresources.16
The book was, however, largely concerned with the impacts of over-exploitation of the Earth’s resources, the underlying problem thatlies at the very root of our dilemma today. It provides excellent
8 Adapting Buildings and Cities for Climate Change
Roaf_Ch01.qxd 29/10/04 6:29 PM Page 8

benchmarks against which we can measure the extent to which ourspecies has effectively degraded the natural capital of our planetand polluted its ecosystems. But the authors also mention, in acouple of paragraphs, the potential for CO2 emissions to lead tosignificant climate change:
The CO2 content of the atmosphere is increasing at a rate of 0.2 per centper year since 1958. One can project, on the basis of these trends, an18 per cent increase by the year 2000, i.e. from 320 ppmm to 379 ppmm.SCEP considers that this might increase temperature of the earth by0.5 °C. A doubling of CO2 might increase mean annual surface tempera-tures by 2 °C.
They were subsequently proved to be very close to the actualrecorded warming between 1947 and 1997 of between 0.25 and0.5 °C.
In the early 1970s, several other large-scale atmospheric issuescame to the attention of the general public. Notable among thesewere acid rain, upper-atmospheric pollution problems raised bysupersonic transport and stratospheric ozone depletion. What is sodifficult to grapple with is the issue of who exactly is the invisi-ble enemy in this war, where are they, who owns the problemand how does one fight against air?
FIRST ENCOUNTERS
While the scientists of the world have long been wrestling withthe theoretical problem of climate change and resource depletion,for the general public the first of the ‘environmental shocks’ thatbrought home the reality that the 20th century dreams of infinitecheap energy and limitless resources were unrealistic was theEnergy Crisis of the mid-1970s. With it came the dawning real-ization that oil, the magic energy source from which the wealthand enjoyment of nations was built, of which every barrel can dothe same ‘work’ as 540 man hours of effort,17 would one day runout. Futurologists then claimed we only had 30 years of oil left, aprediction that has proved to be, perhaps, less than half right, butglobally, people started counting the barrels, and comparing themto the available reserves, and understandably, investing in renew-able energy programmes.
The first public blow had been struck; mankind was perceivedto be vulnerable and, by now, officially engaged in a battle, notagainst the air, but against their own fossil fuel dependency andtime, two equally powerful adversaries. And the richest nations,ironically, became the most vulnerable.
Climate change: the battle begins 9
Roaf_Ch01.qxd 29/10/04 6:29 PM Page 9

THE WEAPONS ARE HONED
In 1971 SMIC had recommended that a major initiative in global datacollection, new international measurement standards for environ-mental data, and the integration of existing programs to form a globalmonitoring network should be developed. The ozone challengeprovided the perfect opportunity to see how effectively mankind,communally, could respond to what appeared to be a rapidlydeveloping, global, catastrophe.
Ground-based measurements of ozone were first started in 1956,at Halley Bay, Antarctica. Satellite measurements of ozone startedin the early 1970s, but the first comprehensive worldwide meas-urements started in 1978 with the Nimbus-7 satellite. In additionto the physical measurements, in 1974 M.J. Molina and F.S.Rowland published a laboratory study18 demonstrating the abilityof CFCs to catalytically break down ozone in the presence of highfrequency UV light. Further studies estimated that the ozone layerwould be depleted by CFCs by about 7% within 60 years.
Based on the recommendations of such studies, the UnitedStates banned CFCs in aerosol sprays in 1978, showing a level ofreal leadership at this stage, that spoke of the courage of the thenUS administration. Slowly, various nations agreed to ban CFCs inaerosols but industry fought the banning of valuable CFCs in otherapplications. A large shock was needed to motivate the world toget serious about phasing out CFCs and that shock came in a 1985field study by Farman, Gardiner and Shanklin19 that summarizeddata that had been collected by the British Antarctic Survey show-ing that ozone levels had dropped to 10% below the normal Januarylevels for Antarctica.
The severity, and rate, of the global ozone depletion spurred theUnited Nations to sponsor a resolution called the Montreal Protocolthat was originally signed in 1987, based on negotiations startedbetween European-Scandinavian countries and the United Statesover CFCs in aerosol sprays in 1983. The protocol went througha series of revisions, each one named after the city where therevision committee met, as new information from science andindustry has become available. The meeting in Copenhagen inNovember 1992 laid down the most stringent phase-out scheduleof CFCs for the world to date; and was signed by over 100 nationsrepresenting 95% of the world’s current CFC consumption. Tradesanctions on CFCs, halocarbons and products containing them,were imposed as of April 1993 on nations not signing the proto-col, and in May 1993 this ban was extended to the export of halo-carbon solvents such as methyl chloride and carbon tetrachloride.This protocol laid out a schedule for the phase-out of CFCs and
10 Adapting Buildings and Cities for Climate Change
Roaf_Ch01.qxd 29/10/04 6:30 PM Page 10

related halocarbons by the year 2030. An additional impact of theprotocol was to mandate the sharing of technology between coun-tries in order to speed the replacement and recycling of CFCs.
In 1988, Sweden was the first country to legislate the completephase-out of CFCs, with a scheduled phase-out in all new goodsby 1994. In March 1989 environmental ministers of the EECannounced a total phase-out of CFCs in Europe by the year 2000.20
What the ozone problem demonstrated, to the world, is that whenfaced with a challenge as large as that of the stratospheric ozoneproblem, the global community has the science, the strategy, thewill and the fiscal, legal and statutory mechanisms to contain thatproblem. It provided a precedent study for the larger challenge ofcontaining climate change. It does offer some hope that we canact communally, to maximize our chances of survival.
On 5 August 2003, ozone values over Antarctica21 were alreadybelow 200 DU or Dobson Units,22 with an ozone hole affectingmost of the continent, showing an unprecedented spread of thehole. Temperatures in the ozone layer were low enough for polarstratospheric clouds to have formed over the continent, furtherdeepening the hole.
THE COUNCIL OF WAR MEETS23
By the mid 1980s, the simulated predictions of the scientists onthe warming climate began to demonstrate a close approximationto what was actually happening in the measured record, with clearevidence of increasing temperatures and the frequency and inten-sity of extreme weather events. The sheer scale of the problemshumanity, and the planet, might face if, indeed, the climate waschanging more than its natural variability would allow, began tomanifest themselves, in the dollars spent in insurance payouts on
1.6.Related number of insuranceloss events and related fatalitiesby event types and numberof fatalities in 2001. (Source:Munich Re, Topics: AnnualReview of Natural Catastrophes2001; for the 2002 review see:http://www.munichre.com/pdf/topics_2002_e.pdf) Such figuresunderestimate climate-relateddeaths, as reported by othersources.
Climate change: the battle begins 11
Number of loss events Number of fatalities
Other20%
Earthquake12%
Earthquake64%
Flood32%
Flood19%
Windstorm36%
Windstorm8%
Other9%
Roaf_Ch01.qxd 29/10/04 6:30 PM Page 11
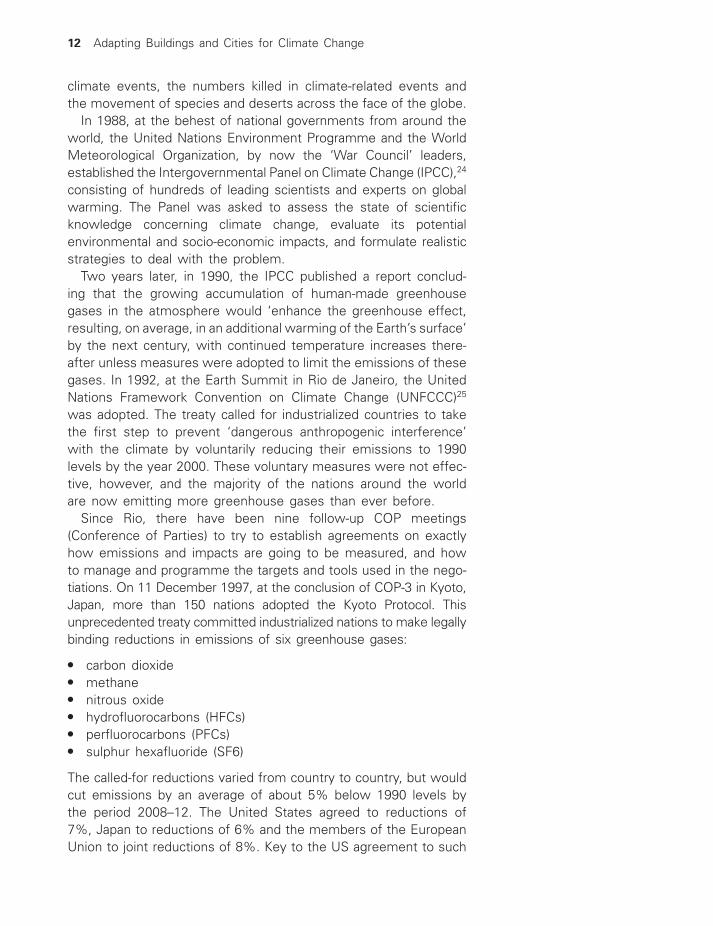
climate events, the numbers killed in climate-related events andthe movement of species and deserts across the face of the globe.
In 1988, at the behest of national governments from around theworld, the United Nations Environment Programme and the WorldMeteorological Organization, by now the ‘War Council’ leaders,established the Intergovernmental Panel on Climate Change (IPCC),24
consisting of hundreds of leading scientists and experts on globalwarming. The Panel was asked to assess the state of scientificknowledge concerning climate change, evaluate its potentialenvironmental and socio-economic impacts, and formulate realisticstrategies to deal with the problem.
Two years later, in 1990, the IPCC published a report conclud-ing that the growing accumulation of human-made greenhousegases in the atmosphere would ‘enhance the greenhouse effect,resulting, on average, in an additional warming of the Earth’s surface’by the next century, with continued temperature increases there-after unless measures were adopted to limit the emissions of thesegases. In 1992, at the Earth Summit in Rio de Janeiro, the UnitedNations Framework Convention on Climate Change (UNFCCC)25
was adopted. The treaty called for industrialized countries to takethe first step to prevent ‘dangerous anthropogenic interference’with the climate by voluntarily reducing their emissions to 1990levels by the year 2000. These voluntary measures were not effec-tive, however, and the majority of the nations around the worldare now emitting more greenhouse gases than ever before.
Since Rio, there have been nine follow-up COP meetings(Conference of Parties) to try to establish agreements on exactlyhow emissions and impacts are going to be measured, and howto manage and programme the targets and tools used in the nego-tiations. On 11 December 1997, at the conclusion of COP-3 in Kyoto,Japan, more than 150 nations adopted the Kyoto Protocol. Thisunprecedented treaty committed industrialized nations to make legallybinding reductions in emissions of six greenhouse gases:
● carbon dioxide● methane● nitrous oxide● hydrofluorocarbons (HFCs)● perfluorocarbons (PFCs)● sulphur hexafluoride (SF6)
The called-for reductions varied from country to country, but wouldcut emissions by an average of about 5% below 1990 levels bythe period 2008–12. The United States agreed to reductions of7%, Japan to reductions of 6% and the members of the EuropeanUnion to joint reductions of 8%. Key to the US agreement to such
12 Adapting Buildings and Cities for Climate Change
Roaf_Ch01.qxd 29/10/04 6:30 PM Page 12
a relatively ambitious target was a concurrent agreement that asystem of emissions trading among industrialized countries beestablished, by which nations with binding limits could buy andsell, among themselves, the right to release greenhouse gases.
Much has happened since then, but by 12 August 2003, 84Parties had signed, including Canada, and 113 Parties have ratifiedor acceded to the Kyoto Protocol.26 In December 2003, COP9 washeld in Milan, to discuss the tricky issue of carbon sinks andemissions trading, and how to incorporate them in the globaltargets for the Protocol, an increasingly central issue as many coun-tries attempt to avoid the need to make deep cuts in their own
Climate change: the battle begins 13
Box 1.1 Carbon trading (by Fiona Mullins)
The United Nations Framework Convention on Climate Change(UNFCCC),i the Kyoto Protocol and emerging greenhouse gasemissions trading schemes are based on calculations of tonnages ofeach greenhouse gas (CO2, CH4, N2O, HFCs, PFCs, SF6). Nationalgreenhouse gas inventories of emissions are calculated and reportedfor UNFCCC compliance (and for future compliance with the KyotoProtocol if it enters into force). The inventories are reported both inthe tonnages of the actual gases (CO2, CH4, N2O, HFCs, PFCs, SF6)and also aggregated as a total CO2 equivalent number. Each metrictonne of non-CO2 gas is converted to CO2 equivalents using a globalwarming potential number.
Greenhouse gas quantities are normally expressed in CO2
equivalent units (CO2e). Because each gas has a different impact onglobal warming, each non CO2 gas is multiplied by a Global WarmingPotential (GWP) which reflects its impact relative to CO2. The inputdata to this calculation are the tonnages emitted of each greenhousegas, but the totals are reported in tonnes of CO2 equivalent. Forexample each tonne of CH4 is equivalent to 21 times a tonne of CO2
because that is the standard metric used to approximate the effect ofa tonne of CH4 in the atmosphere compared to a tonne of CO2 over a100 year timeframe.
Emissions trading schemes for greenhouse gases use this samecalculation methodology. For the UK emissions trading scheme, allgreenhouse gases are potentially included, with some companiesbringing N2O and HFCs into the scheme as well as CO2. The non-CO2
units are translated into CO2 equivalents for reporting and compliancepurposes. For the EU emissions trading scheme, only CO2 emissionsare included in the first phase (2005–08) so the only relevant unit ismetric tonnes of CO2. Other gases may be added later as monitoringof them improves.
i See http://unfccc.int/index.html.
Roaf_Ch01.qxd 29/10/04 6:30 PM Page 13
greenhouse gas emission inventories by investing in cheap ‘carbonsinks’ abroad.
AGENDA 21: THE ARMY IS FORMED
The world has responded to the global environmental challengesit faces diligently, it has put the necessary science and intelligencein place to understand the problem and it has developed theprogrammes to tackle the identified challenges. It has also builtup the armies needed to fight the war with an implementationframework designed to effect the necessary changes and, impor-tantly, to build the capacity individuals and communities around theworld need to make sure those changes happen. This processstarted at Rio.
In 1992, the Earth Summit in Rio de Janeiro, properly titled the‘United Nations Conference of Development and the Environment’,was profoundly influential. Twenty years after the first global envi-ronmental conference in 1972 in Sweden, the United Nations soughtto help governments rethink economic development and find waysto halt the destruction of irreplaceable natural resources and pollu-tion of the planet.27 One hundred and eight heads of state wererepresented and the documents it produced included the RioDeclaration on Environment and Development, Agenda 21, theFramework Convention on Climate Change, and the Convention onBiological Diversity. Although these documents have not all achieveduniversal ratification, they have served as blueprints for the imple-mentation of important sustainable development initiatives.
The Summit’s message – that nothing less than a transforma-tion of our attitudes and behaviour would bring about the neces-sary changes (harking back to Goldsmith’s Blueprint of 1972) – wastransmitted by almost 10 000 on-site journalists and heard by mil-lions around the world. The message reflected the complexity ofthe problems faced. Governments recognized the need to redirectinternational and national programmes and policies, in light of a‘grand survival plan’ to ensure that all economic decisions fullytook into account the environmental impacts of their actions, estab-lishing for the first time in the context of international law, accept-ance of ‘the polluter pays principal’. The Rio Declaration set forth27 universally applicable principles of sustainable developmentwithin which important themes were:
● Patterns of production: particularly the production of toxic com-ponents, such as lead in gasoline, or poisonous waste, manyof which are major contributors to greenhouse gas emissions.
● Alternative sources of energy: to replace the use of fossil fuelswhich are linked to global climate change.
14 Adapting Buildings and Cities for Climate Change
Roaf_Ch01.qxd 29/10/04 6:30 PM Page 14

● A new reliance on public transportation systems: emphasizedin order to reduce vehicle emissions, congestion in cities andthe health problems caused by polluted air and smog. Transportemissions are a major contributor to greenhouse gas emissions.
● The growing scarcity of water: a major issue which is linkedto a warmer climate as well as to increasing population andpollution.
The two-week Earth Summit in Rio was the climax of a sophis-ticated process, begun in December 1989, of planning, educationand negotiations among all member states of the United Nations,leading to the adoption of Agenda 21, a wide-ranging blueprint foraction to achieve sustainable development worldwide. AlthoughAgenda 21 had been weakened by compromise and negotiation,it was still the most comprehensive and potentially effectiveprogramme of action ever sanctioned by the internationalcommunity.
Much of the success of Agenda 21 has been derived from thetraining on environmental issues, instilled within its delivery, to thearmy of workers it has enlisted in the war on environmental degra-dation and climate change, from local council employees to headsof state. These forces have been armed, through the Agenda 21process, with the units and measures, tools and methods, indica-tors and benchmarks that enable the most ordinary of people tobe part of the most extraordinary monitoring project ever seen,the measuring of the rates and extent of the degradation of theplanet on which we depend for our very survival. For, only bymeasuring the rates and extent of that degradation has it beenpossible to understand the risks we actually do face, and developstrategies to mitigate and avert them.
If one, simplistically, thinks of the climate change issue interms of a war, then in overall command is the UN and its related
1.7.Total UK delivered energyconsumption by sector (left ) andcarbon emissions from buildingby source (right ). (Source: Pout,C.H., MacKenzie, F. and Bettle, R.(2002) Carbon Dioxide Emissionfrom Non-domestic Buildings:2000 and Beyond. Watford:Building Research Establishmentand Department for Environment,Food and Rural Affairs, p.10)
Climate change: the battle begins 15
Domestic29%Transport
35%
Agriculture1%
Industrialprocess
18%
Industrialbuildings
4%
Commercialand public
sector13%
Spaceheating
60%
Waterheating
23%
Lights andappliances
12%Cooking
5%
Roaf_Ch01.qxd 29/10/04 6:30 PM Page 15

organizations. Beneath it are the services represented by globaltreaties, gathered under banners such as Climate Change, Health,Poverty and Biodiversity, within which the laws, regulations andguidelines targeted at specific aspects of the global problem aredeveloped. The IPCC and the WHO (World Health Organization)are definitely embedded in the Intelligence Unit at HQ, whileAgenda 21 is responsible for the marshalling and training of themassed ranks of the forces. Nations act rather like battalion lead-ers commanding significant forces, under sectoral units such astransport, the environment and education. It is perhaps possibleto compare other big players such as the World Trade Organizationto parallel armies, acting, or not as the case may be, alongsidethe UN in its fight against climate change.
Within any army there are rogue commanders and infiltrators ofthe opposing forces who, for reasons of ignorance, convenience,malice or personal profit, attempt to impede the progress of theforces,28 but no doubt, as the risks escalate, any restraint withwhich such counter forces are dealt will decrease as the glovescome off. Internal fighting will break out and the obvious growingtensions between lobby groups will flare up. A case in point arethe interests of the mining and agricultural sectors of Australiawhere the dominant coal industry has been able to protect theirgroup interests, the selling of coal, against the weaker farmers’lobby who stand to lose everything as the great ‘sunburnt country’gets browner.
Similarly, in the United States the oil lobby funds much gov-ernment thinking on environmental issues while the farmers of theMid-West who are slowly losing their lands to the droughts, floodsand hurricanes, currently find it less easy to get a fair hearing atthe top table in Washington. It is now happening that such minori-ties are turning to the law for recompense, just as those who wereharmed by the knowing and malicious actions of the tobacco baronsand the asbestos industry have recently won such major classactions in America.29 It is certainly the case that in many placeson the earth the water wars between nations and interest groupshave begun, and the parties are also resorting to law to get jus-tice in the face of environmental disputes.30
THE BATTLE RAGES
The battle, on many fronts, is getting more and more heated asthe climate warms. The world is hotter now than it has been atany time in the past 2000 years. A recent study reconstructing theEarth’s climate over the past 200 years has shown that at no timehas it been warmer than the present and that from 1980 onwards
16 Adapting Buildings and Cities for Climate Change
Roaf_Ch01.qxd 29/10/04 6:30 PM Page 16

is clearly the warmest period in the past 200 years,31 with 2003becoming the third hottest year on record.
The increase in the climate change impact on the economy iswell reflected in the magnitude and related costs for extreme cli-mate events – up to 80% of all payouts by value – to the internationalinsurance industry.32
In July 2003 Sir John Houghton, former Chairman of theInternational Panel on Climate Change, warned the British public,
1.8.Reconstructed globaltemperature anomaly (based on1961–90 instrumental referenceperiod), adapted from Mann andJones31)
1.9.Payouts by the insuranceindustry for natural disasters bygeographical region. (Source:Munich Re, Topics: AnnualReview of Natural Catastrophes2001, see: http://www.munichre.com/pdf/topics_2002_e.pdf)
Climate change: the battle begins 17
Tem
per
atu
re
ano
mal
y °C
0.4
0.2
0
–0.2
–0.4
–0.6
Globe
200 400 600 800 1000 1200 1400 1600 1800 2000Year
InstrumentalReconstructed
Europe19%
Europe7%
Europe4%
Europe1%Africa
8%
Africa1%
Africa0%
Africa6%
America25%
America52%
America79%
America7%
Asia39%
Asia86%
Asia39%
Asia16%
Australia/Oceania
9%
Australia/Oceania
1%
Australia/Oceania
1%
Australia/Oceania
0%
Economic losses
Number of loss events Number of fatalities
Insured losses
Roaf_Ch01.qxd 29/10/04 6:30 PM Page 17

in an article in the Guardian newspaper, that global warming wasnow a real Weapon of Mass Destruction,33 wielded by man himself:
The World Meteorological Organisation warned in July 2003 that extremeweather events already seemed to be becoming more frequent as a result[of global warming]. The US mainland was struck by 562 tornados in May(which incidentally saw the highest land temperatures globally since recordsbegan in 1880), killing 41 people. The developing world is the hardest hit:extremes of climate tend to be more intense at low latitudes and poorercountries are less able to cope with disasters. Pre-monsoon temperaturesin India reached a blistering 49 °C (120 °F)–50 °C (9 °F) above normal. Oncethis killer heat wave began to abate 1500 people were dead. While nonecan ascribe a single weather event to climate change with any degree ofscientific certainty, higher maximum temperatures are one of the mostpredictable impacts of accelerated global warming ...
TARGET LOCK-ON IS PROVING DIFFICULT
It is unlikely that the Kyoto Protocol’s target of cutting the devel-oped world’s emissions by 5% from their 1990 levels by 2012 willbe met. COP9 delegates in Milan in December 2003 were informedthat, according to the latest projections, rather than approachingthe target of 5% reductions by 2010 the greenhouse gas emis-sions from industrialized nations could have risen 17% by 2010compared with 1990.34
The main policy item on the agenda in Milan was how theProtocol accounts for forestry. The Protocol’s Clean DevelopmentMechanism allows developed nations to invest in clean technolo-gies in developing countries and offset the resulting emissionsreductions against their own targets.
Countries are still arguing over the criteria for including forestryprojects in this equation, and how to measure their effects. Manynon-governmental organizations are uneasy about the importanceof ‘carbon sinks’ in the overall balance, because it is an increas-ingly widely held belief that trees are temporary, and should notbe on a par with reduced emissions; that there is no long-term wayof guaranteeing that carbon stays locked up in a tree and sink proj-ects are not a viable alternative to emission cuts,35 regardless ofthe obvious convenience of being able to sponsor cheap plantingprojects at home and in the developing world rather than tacklingthe very pressing problems of how to reduce emissions at home.Wealth has always been traditionally associated with high energyconsumption: the wealthier a country the more they consume.
In December 2003 the European Commission announced that 13of the 15 EU member countries were not on target to meet their1997 Kyoto emissions reductions targets of 8% on 1990 levels by
18 Adapting Buildings and Cities for Climate Change
Roaf_Ch01.qxd 29/10/04 6:30 PM Page 18

2010. Only Sweden (by 3.3%) and Britain (by 1.4%) are set to meetthe targets. As a whole the EU would only reduce the emissionsby 0.5% with existing policies. Spain will undershoot the targetby 33.3% and Ireland by 26.8%. Carbon dioxide emissions fromcars and trucks in Europe were the main culprit and continued torise.36 The United States continues to stonewall. Russia has beensitting on the fence, and if they failed to ratify the convention, itwould have failed to become valid.
The Kyoto targets appear to have got bogged down in, at times,obstructive, negotiations that are effectively reducing their poten-tial value in controlling climate change. As the impacts of the warm-ing world, manifested in continued rise in extreme weather events,become increasingly apparent, more attention is being given to apotentially more radical approach to carbon emission reductions,that of ‘Contraction and Convergence’ (C&C), which has recently
1.10.Total and per capita energyconsumption 1995 by region.(Source: http://www.unep.org/geo2000/english/figures.htm)
Climate change: the battle begins 19
350
300
250
200
150
100
50
0
350
300
250
200
150
100
50
0
En
erg
y co
nsu
mp
tio
n p
er c
apit
a (G
j)344.90
Energy consumption per capita (Gj)Total energy consumption (Pj)
60.97
8.5112.1528.56
92.41
131.89114.14
41.7619.85
101.68 99.89
8.31
World
Africa
Asia an
d
the P
acifi
c
Europe a
nd
Centra
l Asia
Latin
Am
erica
and th
e
Carib
bean North
Amer
ica
Wes
t Asia
To
tal e
ner
gy
con
sum
pti
on
(P
j)
342.91U
S$1
990
25 000
20 000
15 000
10 000
5 000
01975 1980 1985 1990 1995
North America
Europe andCentral Asia
West Asia
Latin America andthe Caribbean
Asia and the Pacific
Africa
World
1.11.Gross Domestic Product percapita 1995 by region. One ofthe problems faced is that thewealth of nations is directlyrelated to their emissions in thetradition analyses of the trendsin the 20th century economy.This will change radically withthe new predicted cleaneconomies of the 21st centuryin which high emissions percapita will be a sign of poverty.(Source: http://www.unep.org/geo2000/english/figures.htm)
Roaf_Ch01.qxd 29/10/04 6:30 PM Page 19

been described as looking increasingly like ‘the only game in town’.37
C&C is all about reducing the total global output of greenhousegases, while gradually reducing national emissions to targets basedon population. It would mean cutting total global emissions froman average of one tonne of carbon per person to 0.3 tonnes perperson over time, and it has the potential to smooth over the polit-ical and economic cracks that are threatening to tear down theKyoto Protocol.
The convergence figures represent what it is estimated to bethe carbon emissions reductions needed to stabilize climate change.The discrepancy between the reality of what we emit and what
1.12.CO2 emissions per capita for thedifferent regions of the world in1975 and 1995 demonstratinghow large the gap is betweendifferent countries and the scaleof the challenges we face intrying to establish protocols forthe equitable emissions ofcarbon dioxide. (Source: http://www.unep.org/geo2000/english/figures.htm)
20 Adapting Buildings and Cities for Climate Change
Box 1.2 Ratification of the Kyoto Protocol
To enter into force, the Protocol must be ratified by 55 Parties to theUNFCCC, including Annex I Parties representing at least 55% of thetotal carbon dioxide emissions for 1990(http://unfccc.int/resource/docs/convkp/kpeng.html). As ofNovember 2003, 120 Parties had signed the Kyoto Protocol and 84had either ratified or acceded to the Protocol, collectivelyrepresenting a commitment to a 44.2% reduction in global carbondioxide emissions; 10.8% shy of the level required for the Protocolto take effect. The United States signed the Protocol on 11December 1997 but has failed to ratify it. The US nationalcommitment alone would account for a 36.1% reduction in globalcarbon dioxide emissions.i
i For the latest details of who is in and who is out of Kyoto see http://unfccc.int/resource/kpstats.pdf and http://unfccc.int/resource/kpthermo.html.
2.03
19.11 19.93
8.787.93
4.88
7.35
2.551.27
2.230.941.24
1975 1995
North A
mer
ica
Europe a
nd
Centra
l Asia
Wes
t Asia
Latin
Am
erica
and
the C
arib
bean
Asia an
d
the P
acifi
cAfri
ca
201816
1214
1086420
To
nn
es/y
ear
Roaf_Ch01.qxd 29/10/04 6:30 PM Page 20

is required is being faced up to by some governments and theEU. On 12 August 2003 the European Commission unveiled toughproposals to cut emissions of particular potent greenhouse gasesby a quarter before 2010, in the fight against global warming.38
A start at least.
Climate change: the battle begins 21
Box 1.3 Contraction and convergence (by Aubrey Meyer)
ESSENTIAL PROPOSITION OF C&C
The C&C modeli formalizes the objective and principles of theUNFCCC. It first proposes a reviewable global greenhouse gas (ghg)emissions ‘contraction budget’ targeted at a safe and stable futurelevel for atmospheric ghg concentrations.
The internationally tradable shares in this budget are then agreedon the basis of ‘convergence’ from now, where shares are broadlyproportional to income, to a target date in the budget timeline, afterwhich they remain proportional to an agreed base year of globalpopulation. Recognizing that the bigger the budget, the greater therisks, and that decarbonization is further enhanced if revenue fromemission trading is re-invested in zero emissions techniques. Thisreduces the randomness that has dogged negotiations since 1992over future emissions commitments/entitlements, as it resolves theconflict between the GDP-led approaches and those emphasizingresponsibility for the historic build-up of atmospheric concentrations.
8GT
6GT
4GT
2GT
0GT
FSU
USA
OECD less USA
Rest of World
India
China
Tonnes Carbon Per Capita
ChinaRest of World
India
FSUOECD less USA
USA 6543210
Gig
ato
nn
es C
arb
on
1800 1900 2000 2030 2100 2200
Source: GCI 2003
1.13.Global (6 regions as shown) carbon ‘contraction’ 2000–2100 for 450 ppmvatmospheric concentration with ‘convergence’ to equal per capita shares globallyby 2030. (Source: Aubrey Meyer; see C&C demonstration athttp://www.gci.org.uk/images/ CC_Demo(pc).exe and see C&C imagery at:http://www.gci.org.uk/images/C&C_Bubbles.pdf)
Roaf_Ch01.qxd 29/10/04 6:30 PM Page 21

22 Adapting Buildings and Cities for Climate Change
CONTRACTION
On the basis of precaution, and guided by the scientific advice of theIPCC, all governments or regional groupings of governments jointlyand severally agree to observe such an atmospheric target. With thisit is possible to calculate the total diminishing amount of greenhousegases that the world can emit for each year in the coming century.Whatever the rate chosen, C&C views this event as a whole as‘Contraction’.ii
CONVERGENCE
On the basis of equity, convergence means that each year’s ration ofthis global emissions budget can be shared so that each country, orgroup of countries, progressively converges on the same allocationper inhabitant by an agreed date, for example by 2030. Thisrecognizes the principle of globally equal rights per capita to the‘global commons’ of the atmosphere, but achieved by smoothtransition.iii Where countries or groups do have a diversity of naturalendowments, C&C acknowledges this too by embracing, forexample, the European Union, which operates as a unit atthe international level whilst creating its own convergencearrangements.
EMISSIONS PERMIT TRADING
Only emissions in excess of the total of permits created under C&Care not permitted (‘hot-air’). Countries unable to manage within theiragreed shares would, subject to the above and appropriate rules, beable to buy the unused parts of the allocations of other countries orregions. Sales of unused allocations would give low per capitaemitting countries the income to fund sustainable development inzero-emission ways. High per capita emitting countries gain amechanism to mitigate the premature retirement of their carboncapital stock whilst also benefiting from the export markets forrenewable technologies this restructuring would create. All countriestherefore benefit from more rapidly avoided global damages.
SUSTAINABLE GROWTH
Climate change increasingly augurs potentially catastrophic losses.C&C mitigates this by integrating the key features of globaldiplomacy and development necessary for long-term prosperity andsecurity. C&C synthesizes the objective and principles of theUNFCCC in a constitutional rather than a stochastic manner, so thatthe necessary foundation for the transition to a new growth andprosperity is specifically guided by this agreement to the zero carbonenergy technologies that make this prosperity with securitypossible.
Roaf_Ch01.qxd 29/10/04 6:30 PM Page 22

1.14.C&C diagrams demonstratingthe required emissionsmodification to stabilize theglobal carbon dioxideconcentrations at (a) 350 ppmby 2020; (b) 450 ppm by 2030;and (c) 550 ppm by 2040.(Source: Aubrey Meyer)
4
8
1860 1880 1900 1920 1940 1960 1980 2000 2020 2040 2060 2080 2100 2120 2140 Gig
ato
nn
es C
arb
on
Gro
ssto
nn
es c
arb
on
per
cap
ita
0
2
4
6USA Per Capita
(b)
Annex 1 (non-OECD) Per CapitaOECD minus USA Per CapitaCHINA Per CapitaRest of World Per CapitaINDIA Per Capita
GLOBAL CO2 ‘CONTRACTION’ for 450 ppmv with6 Region Linear ‘CONVERGENCE’
from Status Quo in 2000 to Equal Per Capita by 2030
Gig
ato
nn
es C
arb
on
Gro
ssto
nn
es c
arb
on
per
cap
ita
(a)
4
8
1860 1880 1900 1920 1940 1960 1980 2000 2020 2040 2060 2080 2100 2120 2140
Rest of WorldINDIACHINAAnnex 1 (non-OECD)OECD minus USAUNITED STATES
0
2
4
6
USA Per CapitaAnnex 1 (non-OECD) Per CapitaOECD minus USA Per CapitaCHINA Per CapitaRest of World Per CapitaINDIA Per Capita
GLOBAL CO2 ‘CONTRACTION’ for 350 ppmv with6 Region Linear ‘CONVERGENCE’
from Status Quo in 2000 to Equal Per Capita by 2020
Rest of WorldINDIACHINAAnnex 1 (non-OECD)OECD minus USAUNITED STATES
(c)
Rest of WorldINDIACHINAAnnex 1 (non-OECD)OECD minus USAUNITED STATES
4
8
1860 1880 1900 1920 1940 1960 1980 2000 2020 2040 2060 2080 2100 2120 2140
0
2
4
6USA Per CapitaAnnex 1 (non-OECD) Per CapitaOECD minus USA Per CapitaCHINA Per CapitaRest of World Per CapitaINDIA Per Capita
GLOBAL CO2 ‘CONTRACTION’ for 550 ppmv with6 Region Linear ‘CONVERGENCE’
from Status Quo in 2000 to Equal Per Capita by 2040
Gig
ato
nn
es C
arb
on
Gro
ssto
nn
es c
arb
on
per
cap
ita
Roaf_Ch01.qxd 29/10/04 6:30 PM Page 23

FIGHTING IN THE RANKS
Resistance to changing our own ways of life is enormous and isfought on many fronts. One of President George W. Bush’s firstactions when he came to power was to withdraw the United Statesfrom the Kyoto treaty. Despite the States being one of the mostvulnerable continents to extreme weather damage, the issues ofglobal warming have been, by and large, presented to the Americanpeople as ‘not an issue’. In October 2003 the US Senate rejecteda plan, by 55 votes to 43, to curb carbon dioxide emissions fromindustry. The Bill, sponsored by John McCain (Republican) and JoeLiberman (Democrat), would have required industrial plants, notvehicles, to cut back emissions of carbon dioxide and other green-house gas emissions to 2000 levels by 2010. Larry Craig, the Idahosenator, said there was no need for a ‘massive new regulatoryprocess’ for industrial carbon dioxide. ‘It is not a pollutant. It doesnot represent a direct threat to public health.’ The White Houseopposes the Bill as it requires ‘deep cuts in fossil fuel use’ to meetan ‘arbitrary goal’, and would drive up energy bills and pumpprices.39
The growing gulf between European and American policiestowards the environment was highlighted when Margot Wallstrom,the EU Environment Commissioner, while on a visit to London inlate October 2003 and without provocation lambasted theAmericans for pressuring Russia not to sign the Kyoto Protocol,the US Marine Administration for sending polluted boats to theUK to be broken up and US companies involved in GM crops fortrying to lie to the European consumer. The Natural ResourcesDefence Council (NRDC), a leading US environmental organizationcounted more than 100 anti-environment actions taken by the US
24 Adapting Buildings and Cities for Climate Change
i CCOptions will calculate any rates of contraction and convergence for allcountries’ CO2.
ii The example chosen shows global CO2 emissions reduced to 40% of1990 output value by 2100 giving a stable atmospheric concentration of 450parts per million of CO2 by 2100. Other contraction ‘shapes’ are possible forthe same concentration outcome. Different rates of contraction are possibleleading to different concentration outcomes but damages from climatechange increase proportional to delay.
iii The example shows global pre-distribution of contraction through linearconvergence so shares are proportional to international populations by 2050with figures for population growth frozen from 2050 forwards. Different ratesof convergence are possible and different dates of freezing population arepossible. Both of these affect the pre-distribution of the tradable emissionsentitlements.
Roaf_Ch01.qxd 29/10/04 6:30 PM Page 24

government in 2002 alone. A number of reasons for this have beensuggested, including:40
● The US voter is typically not concerned about environmentalissues (and is very ill informed about them).
● Right wing lobbies, such as industry associations and ideolog-ical think-tanks, play a significant role in influencing policy, greaterthan in Europe.
● The gulf between the United States and the EU on these mat-ters has widened even further as a result of the current USadministration downgrading transatlantic relationships and con-sequentially devaluing ‘European’ concerns.
The United States, which has known, in depth, about the prob-lems and science of climate change for over 40 years and wasthe first nation in the world to sign the 1992 United Nation ClimateChange Convention, has, with its blocking tactics over Kyoto,managed to prevent the world from ‘locking-on’ to clear and achiev-able targets that may provide the direct strike at the problem weneed to survive, and meanwhile the problem grows in strengthdaily.
IS THE BATTLE LOST ALREADY?
What is clear now is that this war is the great war of our time,and perhaps of all time. We must act firmly and effectively inthe face of the incontrovertible evidence41 before us to fight it.
1.15.The number of climate-relateddisasters experienced percontinent 1993–97. (Source:http://www.unep.org/geo2000/english/figures.htm)
Climate change: the battle begins 25
Numbers of disasters
Sub-Saharan AfricaSouth Asia
Southeast Asia
East Asia
South America
North AmericaRest of Europe
Central AmericaEuropean Union
OceaniaCaribbean
North AfricaCentral Asia
West Asia
0
40
80
120
160
Roaf_Ch01.qxd 29/10/04 6:30 PM Page 25

We cannot trust to governments alone, or corporations, or councilsto do what is necessary. There is no magic technical or surgicalsolution in this old-fashioned war. There is a crucial role in thefront line of this battle for every man, woman and child on theplanet.42
There are some basic rules in this war. Rule number one is that:From those who have the most, the most must be expected.Equality and proportionality are the two key guiding principals thatwill help us survive through the 21st century. And because build-ings use more energy than any other single sector in the devel-oped world, then it is from the building sector that the greatestcuts have been predicted as possible, and must be forthcoming.They use more energy than any other sector – they must makethe biggest cuts.
This book shows that it may be possible to effect the ‘radicalchange in our approach to the environment’ called for by Goldsmithin 1972 and the authors of Agenda 21, 20 years later. These changeswill cost real money, and cause real pain, but any war does. ByMarch 2004 over 110 billion dollars have already been spent bythe United States alone on invading the single country of Iraq.43
How much are we willing to spend on saving the world? It ismoney we have to spend, and pain we have to shoulder, becauseit is increasingly looking as if radical change, like contraction andconvergence, is ‘the only game in town’, if we intend to surviveon this planet.
So how long do we have to wait for answers to the key ques-tions of the next two decades of the 21st century:
● Will that radical change happen?● Can we adapt our buildings and cities to survive through the
21st century?● Are we already too late?
NOTES AND REFERENCES
1 In January 2004 Sir David King, the Chief Scientific Adviser tothe UK Prime Minister, made an address to the House ofLords in which he clearly stated that climate change was nowa greater threat to humanity than terrorism. See http://news.bbc.co.uk/1/hi/sci/tech/3381425.stm.
2 On 22 February 2004 Mark Townsend and Paul Harris of theObserver published an article, on page 3, on a secret reportproduced by eminent scientists for the Pentagon which madechilling reading and warned of the very imminent threat of cli-mate change that would ensure that ‘disruption and conflict
26 Adapting Buildings and Cities for Climate Change
Roaf_Ch01.qxd 29/10/04 6:30 PM Page 26

will be endemic features of life’. See http://observer.guardian.co.uk/international/story/0,6903,1153514,00.html.
3 A British study covering 40 years of comprehensive evidencereported that butterflies, birds and plants are in decline foraround 70%, 54% and 28% of species respectively. The study,published in the US journal Science on 19 March 2004, wassaid by Jeremy Thomas of the UK Natural EnvironmentResearch Council to add ‘enormous strength to the hypothe-sis that the world is approaching its sixth major extinctionevent’. He pointed out that the other events were cosmic,coming from outer space, while this event appears to comefrom within, from our own species that ‘through its over-exploitation and its wastes, it eats, destroys, or poisons theothers’. See Tim Radford’s article on ‘The Decline of Species’,on page 1 of the Guardian, 19 March 2004.
4 Worldwatch Institute, State of the World Report 2003, seehttp://www.worldwatch.org/pubs/sow/2003/.
5 Hulme, M., Jenkins, G., Lu, X., Turnpenny, J., Mitchell, T., Jones,R., Lowe, J., Murphy, J., Hassell, D., Boorman, P., McDonald,R. and Hill, S. (2002) Climate Change Scenarios for the UnitedKingdom: The UKCIP02 Scientific Report, Appendix 2 publishedin conjunction with UKCIP, the Hadley Centre and the ClimateResearch Unit in the School of Environmental Science at theUniversity of East Anglia, by the Tyndall Centre, Norwich.
6 For a full introduction into the process of climate change seehttp://climatechange.unep.net/.
7 For the global weather warning that extreme weather eventsare on the increase from the Secretary of the WorldMeteorological Organization on 3 July 2003, see http://www.unic.org.in/News/2003/pr/pr111.html and http://www.guardian.co.uk/comment/story/o,3604,1007042,00.html.
8 Galbraith, J.K. (1999) The Affluent Society (1st edition 1958).Canada: Penguin Books, p. 17.
9 For more information see the Mauna Loa Solar Observatorysite on mlso.hao.ucar.edu/. Another good site is http://cdiac.esd.ornl.gov/trends/co2/sio-mlo.htm.
10 As early as 1965, three groups, all in the United States, hadestablished ongoing efforts in general circulation modelling ofthe climate: Geophysical Fluid Dynamics Laboratory; UCLADepartment of Meteorology; National Center for AtmosphericResearch. Among the important Climate Circulation Modellinggroups established in 1965–75, two were in the United States,a country that has been aware, longer than any other, of the
Climate change: the battle begins 27
Roaf_Ch01.qxd 29/10/04 6:30 PM Page 27

significance of climate change. These three were the RANDCorporation (Santa Monica, CA); Goddard Institute for SpaceStudies (New York, NY); and the Australian NumericalMeteorological Research Centre (Melbourne, Australia). For afuller history of climate modelling see: http://www.aip.org/history/sloan/gcm/1965_75.html.
11 The current climate models, building on the works of suchearlier researchers, now use the commonly accepted ‘generalcirculation models’ (GCMs) or AGCMs (‘atmospheric generalcirculation models’). These are complex models of the Earth’satmosphere and are time-consuming and expensive to run,usually funded by national governments. Early GCM scenarioswere based on a doubling of the pre-industrial equivalent CO2
concentration in the atmosphere. The models were run untila new equilibrium state was reached corresponding to thisincreased concentration of CO2.
In the 1990s GCMs began to incorporated sub-models ofthe oceans, variously referred to as ‘coupled ocean-atmos-phere models’ or CGCMs. Because the dynamics of climatechange is dominated by the effect of the oceans, these mod-els allow transient (time-dependent) simulations of the futureclimate to be made. Year on year these models are becom-ing more sophisticated and can now incorporate the impactsof aerosols in the atmosphere, and climate feed-back, to aresolution of fifty, down to even five, kilometre squares. Foran explanation of the models used recently by the UK ClimateImpacts programme see http://www.ukcip.org.uk/scenarios/pdfs/UKCIP02TechRep/Cover.pdf.
12 http://www.ipcc.ch/.
13 Meadows, D.H. (1972) The Limits to Growth; A Report for theClub of Rome’s Project on the Predicament of Mankind.London: St Martins Press.
14 Washington, W.W. (1971) Study of Man’s Impact on the Climate(SMIC). Cambridge, MA: MIT Press.
15 Goldsmith, E., Allen, R., Allenby, M., Davull, J. and Lawrence, S.(1972) A Blueprint for Survival. London: Tom Stacy.
16 Goldsmith et al., A Blueprint for Survival, p. 27.
17 Roaf, S. (2004) Closing the Loop. London: RIBA Publications.
18 Molina, M.J. and Rowland, F.S. (1974) Stratospheric sink forchlorofluoromethanes-chlorine atom catalysed destruction ofozone. Nature, 249, 810.
19 Farman, J., Gardiner, B. and Shanklin, J. (1985) Large lossesof total ozone in Antarctica reveal seasonal ClOx/NOx interac-tion. Nature, 315, 207–10.
28 Adapting Buildings and Cities for Climate Change
Roaf_Ch01.qxd 29/10/04 6:30 PM Page 28

20 https://www.nas.nasa.gov/About/Education/Ozone/history.html.
21 http://www.theozonehole.com/ozonehole2003.htm.
22 The Dobson Unit: one Dobson Unit (DU) is defined to be0.01 mm thickness at STP (standard temperature and pres-sure). Ozone layer thickness is expressed in terms of DobsonUnits, which measure what its physical thickness would be ifcompressed in the earth’s atmosphere. In those terms, it isvery thin indeed. A normal range is 300–500 Dobson Units,which translates to an eighth of an inch – two stacked pennycoins. In space, it is best not to envision the ozone layer asa distinct, measurable band. Instead, think of it in terms ofparts per million concentrations in the stratosphere (the layer6 to 30 miles above the Earth’s surface). Such units, meas-urements, the targets they enable us to set are the basicweapons of our war on climate change. The unit is namedafter G.M.B. Dobson, one of the first scientists to investigateatmospheric ozone.
This DU description was written by The Ozone HoleOrganization and ‘A Riddle inside a Conundrum within a Parablesurrounded by an Enigma, and Up A Tree Again Productions’.For full details of their research, Dobson Units and currentmaps of the ozone hole see: http://www.theozonehole.com).
23 This section was written using some parts of the article byLeonie Haimson in Grist magazine on the Agenda 21 summit.See http://www.gristmagazine.com/heatbeat/inshorta.asp.
24 For a complete explanation of the processes of climate changeand the related publications of the International Panel onClimate Change, modelling techniques and legislation seewww.ipcc.ch/ and for a potted and well informed history seehttp://www.doc.mmu.ac.uk/aric/eae/Global_Warming/global_warming.html.
25 For a full state of play on the climate conventions seehttp://unfccc.int/index.html.
26 For a full list of parties signed up to the treaty seehttp://unfccc.int/resource/convkp.html.
27 http://www.un.org/esa/sustdev/documents/agenda21/index.htm. For a full list of the current Agenda 21 ActionProgrammes see http://www.unep.org/Documents/Default.asp?DocumentID=52.
28 See the very interesting website for The European BusinessCouncil for a Sustainable Energy Future on http://www.e5.orgfor a run-down of the COP9 awards in Milan. There was somevery hard horse trading at COP9 as governments sought todefend the interests of their own voters. See, for instance, a
Climate change: the battle begins 29
Roaf_Ch01.qxd 29/10/04 6:30 PM Page 29

run-down of the ‘Fossil-of-the-day Award’, awarded during theCOP9 talks, given each day to countries that block progressat the United Nations Climate Change Negotiations. SaudiArabia, the United States, Canada, Australia and New Zealandall figure in these awards with the US, a country that has noteven signed up to the treaty, winning hands down. The cur-rent concern is that Russia will not sign the Treaty, but isthought to be using the negotiations as a lever to improve itsposition in negotiations on parallel international agreements. Seehttp://www.e5.org/modules.php?op=modload&name=News&file=article&sid=408.
29 A report compiled in 2002 by international law firm Baker andMcKenzie warned that people are increasingly looking to layblame for climate change costs and impacts and the main pos-sible legal actions are either of a government suing a gov-ernment, or an individual or an environmental organization suinga company for failing to do something, or alternatively, as weare now seeing in the United States, for governments or indi-viduals suing the regulatory authorities for failing to deal withgreenhouse emissions (http://www.abc.net.au/am/content/2003/s979176.htm). The cases in the United States involve agroup of environmental groups, joined by three American cities,suing the US export credit agencies for funding fossil fuel proj-ects. Another group is suing the Environmental ProtectionAgency for a lack of action. Ironically it may be those com-panies who have publicly taken an anti-climate change linethat are most vulnerable because their actions may be provedto have been in bad faith. For a good discussion on this trendsee http://www.legalaffairs.org/issues/September-October-2002/review_appelbaum_sepoct2002.html. For a range of relatedissues raised see also http://earthscience.surfwax.com/files/Global_Warming.html and http://www.iisd.ca/climate-l/Climate-L_News_17.html.
30 People have long talked of the impending ‘water wars’, cov-ered in Chapter 6 of this book, but they are already happen-ing. Civil unrest within countries, and between countries anddifferent interest groups on the subject of water is an alreadychronic problem in many part of the world, and long chroni-cled. See, for instance, Gleick, P. (ed.) (1993) Water in Crisis:A Guide to the World’s Freshwater Resources. Oxford: OxfordUniversity Press.
31 Mann, M.E. and Jones, P.D. (2003) Global surface tempera-tures over the past two millennia. Geophysical ResearchLetters, 30: 10.1029/2003GL017814.
30 Adapting Buildings and Cities for Climate Change
Roaf_Ch01.qxd 29/10/04 6:30 PM Page 30

32 http://www.zoca.com/swallowtail/articles/climate.html.
33 Michael Meacher, Guardian, 28 July 2003, p. 14.
34 http://unfccc.int/cop9/index.html.
35 http://www.nature.com/nsu/031124/031124-14.html. See alsonote 29 above and the concerns about trading in ‘bad faith’.
36 Guardian, 3 December 2003, p. 13.
37 For full details of C&C see the excellent website of the GlobalCommons Institute on http://www.gci.org.uk/contconv/cc.html.
38 Guardian, 12 August 2003, p. 3.
39 Guardian, 31 October 2003, p. 16.
40 Guardian, 31 October 2003, p. 16.
41 The need to be sceptical about the sceptics is clear from highprofile examples such as that of Bjorn Lomborg, who in hisbook The Sceptical Environmentalist (Cambridge UniversityPress, 2001), wrote what was perhaps the most thorough attemptto date at debunking concerns of environmentalists, butwas robustly lambasted by the academic establishment. Seehttp://www.gristmagazine.com/books/lomborg121201.asp,http://www.mylinkspage.com/lomborg.html). There also exists,predominantly in the United States but elsewhere also, includingthe UK, an ostensibly un-venal array of ‘greenhouse sceptics’who derive much of their funding from the fossil fuel industryand make it their business to energetically refute the scienceof climate change. A quick trawl through an Internet searchengine will demonstrate how effective they are in getting theirmessages across, although their writings are often taken withmore than a pinch of salt by many respected scientists, as isnoted on such websites as http://www.kwikpower.com/AREAS/GC/gc04.htm, which mentions a number of such ‘sceptics’funded by the ExxonMobil Corporation, including Fred Singer,Patrick Michaels, Robert Balling and Sherwood Idso.
42 This need for everyone to engage in the battle against climatechange was clearly stated by UN Secretary-General Kofi Annanwhen delivering the commencement address to the FletcherSchool of Law and Diplomacy in Medford, Massachusetts, USA,on 21 May 2003. Annan noted that the United States, whichproduced the most greenhouse gases largely because it wasthe world’s most successful economy, must ‘join in reducingemissions and in the broader quest for energy efficiency andconservation’. Warning of the ‘very real danger’ that gains incombating climate change could be lost, he painted a pictureof melting polar icecaps threatening coastal areas, extreme
Climate change: the battle begins 31
Roaf_Ch01.qxd 29/10/04 6:30 PM Page 31

weather causing billion-dollar calamities, and a ‘warmer andwetter’ world in which infectious diseases spread more eas-ily. ‘This is not some distant, worst-case scenario’, he cau-tioned. ‘It is tomorrow’s forecast.’ Looking on the positive side,Mr Annan said the battle against climate change could providean opportunity to reinvigorate the fight against poverty, inspirechanges in corporate and consumer habits, and ‘shape global-ization so that the environment does not become one of itsprime casualties’. ‘Today, though we have the human and ma-terial resources to win the fight against climate change, thetime for a well-planned transition to sustainable development isrunning out’, Mr Annan told the Fletcher School graduates, adding‘unless, that is, you do your part’. http://www.solcomhouse.com/annan.htm.
43 See http://costofwar.com/ for an ongoing running total of thecosts of the Iraq war to the USA.
32 Adapting Buildings and Cities for Climate Change
Roaf_Ch01.qxd 29/10/04 6:30 PM Page 32

Buildings are our third skin. As our ancestors moved north fromthe steppes of temperate Africa, hundreds of thousands of yearsago, not only did they have to don warmer clothes but they alsohad to build stronger buildings that would protect them from theheat of the deserts and the cold of the northern climes.
2 THE EVOLUTION OF BUILDINGS
2.1.Vernacular buildings have evolvedover time to make the best useof local materials and conditionsto provide adequate, and oftenluxurious, shelter for populationsinhabiting even the mostextreme climates of the world.(Source: Sue Roaf, digitallyproduced by Claire Palmer)
Roaf_Ch02.qxd 29/10/04 6:31 PM Page 33

The result of this great migration of mankind is an extraordinarydiversity of dwellings, built of local materials and shaped to suitlocal climates, landscapes, and societies.
What did not change, on those migrations, is the underlyinghuman metabolism. People in every society have the samephysiology and core temperature of around 37.5 °C, and the sameadaptive mechanisms to keep their bodies at this core temperaturein even the most extreme climates. What did change were theskins, body forms and behaviour of moving tribes. In hot climatespeople evolved with darker skins that could regulate the produc-tion of vitamin D in high levels of ultra-violet (UV) light. In the northlands with lower levels of UV in the incoming radiation populationsselectively developed lighter skin, hair and eye colours.1 Body formsalso changed over time as local populations grew taller and thinnerin hot climates, with high surface area : body volume ratios so theycould lose heat rapidly in the higher temperatures. In cold climatesshorter, fatter people had a lower surface : volume ratio so theycould conserve heat more easily.
But in order to survive in temperatures from over 50 °C in thelower attitudes to �50 °C below freezing in the Arctic Circle otherfactors had to come into play including:
● the wearing of more or less, thinner and thicker, clothes (thesecond skin);
● the design of buildings (the third skin);● behavioural adaptations, like changing posture, activity levels
and choosing the most comfortable space to occupy, by mov-ing around rooms and buildings and landscapes; and then ofcourse the use of energy from the burning of fossil fuels orthe careful use of stored energy in heat or cold stores.
Until recent decades the only energy available to most families inmost societies was what they could find, mine, collect and carryhome, be it dung, coal, wood, peat, water or ice. These storedsources of energy provided, either passively, or actively through
2.2.The traditional three-wayinteraction between climate,people and buildings that dictatesour energy needs. (Source:Fergus Nicol)
34 Adapting Buildings and Cities for Climate Change
BuildingsClimate
Culture andpreferences arepartlydetermined byclimate
People controlbuildings to suitthemselves in
climatic context
Building ameliorates climate within traditionally occupied settlementsto suit occupants and provide comfort within cultural norms
Energy use isinfluenced by
climatic, social,economic and
cultural context
People
Roaf_Ch02.qxd 29/10/04 6:31 PM Page 34

burning, the extra heating, or cooling, of occupied spaces thatenabled settlements to be built in ever-more extreme climates.Added to the survival challenges that the increasingly extreme cli-mate posed was the fact that it changed. The climate always haschanged.
The last Ice Age occurred only just over ten thousand years ago,when the global temperature was around three degrees centigradecolder than today. Three degrees seems like a very small change,to have such dramatic consequences on the global climate. Afterall, northern Europe, was largely covered by ice caps then, andhumans mostly lived in the lower temperate and equatorial regionsof the world, in caves or in transient shelters that have left noarchaeological record.
The earliest excavated settlements with buildings were built afterthis last Ice Age, and were found in the Zagros mountains in Luristan,
The evolution of buildings 35
800.000 600.000Years before present
400.000 200.000
Last ice agePrevious ice ages
(a)
Tem
per
atu
re c
han
ge
(°C
)
10.000 8.000Years before present
6.000 4.000 2.000 0
Littleiceage
Holocene maximum(b)
Tem
per
atu
re c
han
ge
(°C
)
1000 AD 1500 AD 1900 ADYears before present
Little ice age
Medievalwarm period
(c)
Tem
per
atu
re c
han
ge
(°C
)
2.3.Schematic diagrams of globaltemperature variations over thelast (a) 1 000 000, (b) 10 000 and(c) 1000 years. (Source:Houghton J.T., Jenkins, G.J., Ephraums, J.J (eds) (1990)Climate Change: The IPCCScientific Assessment.Cambridge: Cambridge UniversityPress, p. 202)
Roaf_Ch02.qxd 29/10/04 6:31 PM Page 35

Western Iran, where at Gange Dareh, a settlement of small, ovalmud brick houses was carbon dated to around 7200 BC.
Since then, great cities and civilizations have risen and fallen onmany continents, leaving little trace of their original glory, invisiblebeneath the feet of passing generations.2 All of these great civi-lizations were affected by the changing climates, and some, likethe Mayans, may have disappeared because of years of droughts,or floods, in their heartlands.
A widespread strategy for surviving in extreme climates is tomove to different areas at times of the year when they are com-fortable, and leave them when they are not – to migrate.
SEASONAL MIGRATION – NOMADS
The basic reason for having buildings at all is to provide shelteragainst the climate. It is extraordinary how little of a building cansuffice to provide adequate shelter in even the most arduous ofclimates. The tent, for instance, is used to house people from thedeserts of Saudi Arabia to the tundra regions of the Arctic Circle.In fact most areas in these regions are uninhabitable – cold or hot –at particular times of the year when the tribes are elsewhere.Nomadic peoples often occupy peripheral lands that would nottraditionally support communities all year around. Their secret isto travel in search of the heat, coolth and food they require tosurvive, a strategy also employed by the British upper classeswho spent the summer in the country and the winter in towns inthe 18th and 19th centuries, and in the early 20th century, wintersin Nice or Capri.
36 Adapting Buildings and Cities for Climate Change
20 000
–5
–4
–3
–2
–1
0
1
Tem
per
atu
re c
han
ge
(°C
)
2
3
4
5
10 000 2000 1000
Number of years before present (quasi-log scale)
300 100 Now +100
End oflast
ice ageYounger
dryas
Holoceneoptimum Medieval
warm Little ice agein Europe(15th–18thcenturies)
1940 21stcentury:
very rapidrise
Vikings inGreenland
Mesopotamiaflourishes
Average temperature over past10 000 years = 15°C
Agricultureemerges
IPCC (2001) forecast:+2–3 °C, with band
of uncertainty
2.4.Human societies have had longexperience of naturally occurringclimatic vicissitudes. The ancientEgyptians, Mesopotamians,Mayans and Europeanpopulations (during the fourcenturies of the Little Ice Age)were all affected by nature’sgreat climatic cycles. Moreacutely, disasters and diseaseoutbreaks have occurred, often inresponse to the extremes ofregional climatic cycles, such asthe El Niño Southern Oscillationcycle. (Source: http://www.who.int/globalchange/climate/summary/en/)
Roaf_Ch02.qxd 29/10/04 6:31 PM Page 36
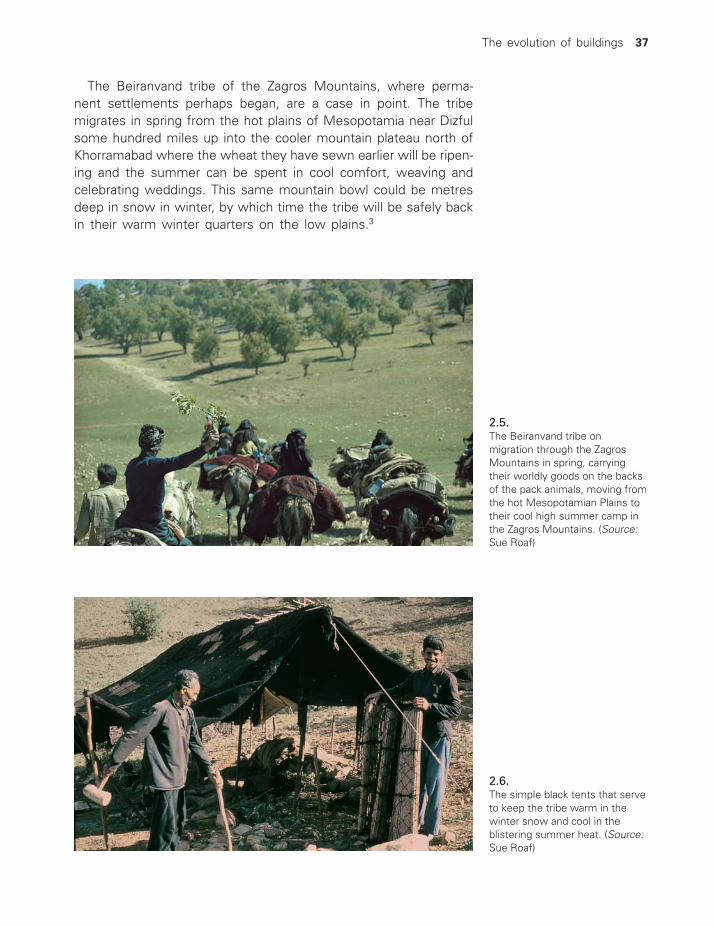
The Beiranvand tribe of the Zagros Mountains, where perma-nent settlements perhaps began, are a case in point. The tribemigrates in spring from the hot plains of Mesopotamia near Dizfulsome hundred miles up into the cooler mountain plateau north ofKhorramabad where the wheat they have sewn earlier will be ripen-ing and the summer can be spent in cool comfort, weaving andcelebrating weddings. This same mountain bowl could be metresdeep in snow in winter, by which time the tribe will be safely backin their warm winter quarters on the low plains.3
The evolution of buildings 37
2.5.The Beiranvand tribe onmigration through the ZagrosMountains in spring, carryingtheir worldly goods on the backsof the pack animals, moving fromthe hot Mesopotamian Plains totheir cool high summer camp inthe Zagros Mountains. (Source:Sue Roaf)
2.6.The simple black tents that serveto keep the tribe warm in thewinter snow and cool in theblistering summer heat. (Source:Sue Roaf)
Roaf_Ch02.qxd 29/10/04 6:31 PM Page 37

The tent, or ‘third skin’, that divides the tribe from the elementsis woven from black goat’s wool. With the additional help of theclothes worn, quilted blankets and a small fire, the tent will beoccupied in temperatures that range from below zero and up tothe high forties centigrade. One tribal leader boasted that theirtribe had a wonderful life because they were warm in winter andcool in summer when they drank iced water from their springs,while the town dwellers were cold in winter and hot in summerwhen they drank only warm water, which offered little or no relieffrom the heat.
In colder regions such as Mongolia or Central Asia, the Yurt orthe Gher are tents made of much thicker materials, of beatensheep’s or goat’s wool felt that is better able to withstand the bit-ing wind and driving snow of those regions. The Sani live in ani-mal skin tents. The form of their tents is also more compact,minimizing the surface area of the tent and so reducing heat lossfrom it. In colder regions tribal people also rely more on their sec-ond skin, clothes, for the extra warmth they need in winter. TheSani people of the Arctic not only occupy relatively small dwellings,rather of the proportion of the ice-built igloo, in which there is sim-ply less air to heat, but like the Inuit, they wear full skin body suitslined with fur, even in the tent at night in mid-winter.4
38 Adapting Buildings and Cities for Climate Change
2.7.Diagram showing estimatedtemperatures inside and outsidethe Beiranvand tents at differentmonths, in the different locations,on the two hundred mile annualmigration along the ‘il rah’, thetribal road. (Source: Sue Roaf,digitalized by Claire Palmer)
Roaf_Ch02.qxd 29/10/04 6:31 PM Page 38

The form of a tent is also eminently adaptable so that it can beclosed down in winter to provide a snug, smaller, more windproofenvironment while in summer it can be expanded to provide littlemore than a well-ventilated shade awning. With tents, the actualform of the tent, the material and performance of its constructionand the way in which it is used and adapted over a year are allindicators of the extent to which the people in a season and aregion need to increase or decrease the difference between theindoor and outdoor climate. The more extreme the climate, thebetter the tent must be at keeping it out.
Adapting to new ecological niches in times of threat
The Beiranvand tribe has, over the past 70 years or so, been diver-sifying into a range of new ‘ecological niches’, as part of the settledpopulations of villages, towns and cities. This is part of a tribal strat-egy for survival in the face of a range of major changes in their habi-tat and society,5 including those wrought by climate change and war.
INTRA-MURAL MIGRATION BY SETTLEDPOPULATIONS
In permanent settlements people do not have the choice to moveto more comfortable climates, but they can practise a different formof migration, as they move around their own homes. Not far fromLuristan, in the great desert cities of central Iran such as Yazd, aresome of the most sophisticated of all the passively designed homesin the world. An important element of the way the local populationscould adapt to the extremely hot summer climate, and extremelycold winter climate, is to migrate, intra-murally, within the four wallsof the dwelling.
Annually, the family migrates horizontally around a courtyard. Inwinter the family will spend most of the day and night in a south-facing glazed winter room overlooking a warm sheltered courtyard.In summer, the living room shifts to the north-facing end of thecourt where no direct sunlight enters the living areas during theday and cross ventilation may be provided by a windcatcher acrossthe high shaded summer room.
Buildings are climatically coupled to the earth and the air
Diurnally the family migrates from the deep cool basements, wherethey eat and rest in the hot afternoon. In the mornings and theevenings they sit in the fresh shaded courtyard and at night theyclimb onto the roof to sleep beneath the stars.6
The evolution of buildings 39
Roaf_Ch02.qxd 29/10/04 6:31 PM Page 39

40 Adapting Buildings and Cities for Climate Change
(a)
(b)
2.8.(a) Axonometric showing the variation in temperatures around a Yazdi house, Iran, demonstrating the advantages of intra-mural migration in achieving a comfortable indoor environment on a hot summer afternoon. 1. Roof, where the familysleeps at night; 2. talar – summer room; 3. basement room with pool for summer afternoons; 4. windcatcher; 5. hotwest-facing wall with no rooms; 6. living room; 7. guest courtyard; 8. store; 9. well; 10. water tank; 11. kitchen; 12. stable; 13. ganat – underground canal; 14. trellis; 15. garden pond; 16. deep basement for mid-summer afternoons.(Source: Sue Roaf in Living with the Desert 7) (b) Windcatchers on the skyline of Yazd. (Source: Sue Roaf)
Roaf_Ch02.qxd 29/10/04 6:31 PM Page 40

The rooms on the roof are much more closely coupled to thefluctuating temperatures of the sky while those sunk into the groundare coupled in temperature to the stable earth temperature, witha far lower rate of change, responding to the changes in seasonalmean temperatures rather than the minute to minute temperaturechanges that can be experienced in the open rooms of the roof ofthe Havelli in India, for example (Figure 2.10).
Some basements in traditional Asian houses can be as much as9 m below ground level, providing a stable cool climate even whentemperatures soar above 50 °C in heat waves. Some believe thatas the temperature changes our best means of survival in extremeclimates will be to migrate further and further underground asthe challenge of controlling high energy use in hot climates beginsto bite.8
HEATING AND COOLING BUILDINGS PASSIVELY
The mud brick houses of Yazd, some of which are over 600 yearsold, have on their roofs a very obvious sign of their great skills at
The evolution of buildings 41
2.9.The 9 m deep double basement of the Sethi House in Peshawar, North West Frontier Province, Pakistan, showing thenarrow ventilation shaft in the rear wall to stimulate ventilation of the space. (Source: Drawn by student on the Masterscourse in Sustainable Building, Oxford Brookes University)
Roaf_Ch02.qxd 29/10/04 6:31 PM Page 41

climatic design, in the form of the windcatchers that crown manyof their settlements. In the densely inhabited towns and villagesof this desert region these towers reach up above the roofs ofbuildings to catch the faster flowing upper air stream and channelit down to ventilate and cool the rooms below and their occupants.This they do, not only convectively by passing cooler air over theskins of building occupants, but also using radiant coolth. By tak-ing the cold night air, and passing it over the heavy mud-brick wallsof the rooms below, the warmth collected in those walls duringthe day is drawn out and dumped back to the sky, making therooms below the windcatcher cooler during the day than the outdoorair temperature. In winter the free energy of the sun enters throughthe glass in the french doors of the south-facing winter room andis trapped inside, unable to escape the closed space, and this heatis stored in the massive mud-brick walls of the room, that re-radi-ate this free heat back into the room all through the night pro-viding a remarkably steady indoor temperature. This collecting,storing and dumping of energy, heat, by the structure of the build-ing itself is done ‘passively’ requiring no ‘active’ input of energyby building users at all.
TRANSPORTING STORED ENERGY – ICE-HOUSES
If it became too hot in summer, even in the basement in Yazd,then a boy could be sent out to get the family an ice-cream oriced sherbet, made with ice from one of the great ice-houses ofthe city. Just as heat and coolth is stored in the earth and the fab-ric of buildings, so it can be stored in ice, for years. A very wellkept secret today is that, since the dawn of recorded history, we
42 Adapting Buildings and Cities for Climate Change
Increasing time lagIn
crea
sin
g t
ime
lag
2.10.The time required for indoorroom temperatures to respond tooutdoor temperature changesvaries enormously according tothe extent to which the room iscoupled to the earth or the skytemperature. (Source: JaneMatthews)
Roaf_Ch02.qxd 29/10/04 6:31 PM Page 42

have been able to store the cold of the winter months to re-useit in the heat of summer in the form of ice. Our forefathers cooledtheir drinks, food, brows and rooms, by cutting the ice off pondsand rivers, or scraping it from mountain sides, in winter and stor-ing it in underground ice-houses through the spring. The ice-houseswere opened on the ‘salad days’ of summer to provide ice for thekitchen, the invalid, the ambassador’s salon, the greenhouse andthe dining table.7
Let them unseal the ice of Qatara. The Goddess, you and [your sister]Belassunna drink regularly, and make sure the ice is guarded9
wrote a provincial Governor of Northern Assyria in a letter to hiswife, Iltani, in 1800 BC. This, the first written record we have ofthe storage of ice in an ice-house, comes to us from nearly fourthousand years ago from the Plains of Northern Iraq.
Ice-houses were built on every continent on the planet, exceptAustralia, and were used extensively by the Greeks, Romans, Chineseand even the Latin Americans. Ice was cut from the Andes andlowered on ropes by Indians who then transported it some 90 mileson mule back at a brisk trot (where roads permitted) to Lima, a citythat used between 50–55 cwt a day (a hundredweight being about2.5 metric tonnes). Tschudi, travelling in 184010 claimed that thetrade was so important that its interruption might ‘excite popularferment’ and consequently ‘in all revolutions’ care was taken toavoid commandeering the mules used in the transport of ice.
Right up until the 1980s there are reports of natural ice beingstored in winter for use in the ‘salad days’ of summer. Ice pits inthe Kurdish mountains of Northern Mesopotamia were still beingfilled in the 1980s, apparently because certain local tribal chiefsprefer to drink their Johnny Walker Black Label whisky with natu-ral ice as it was said to improve its taste. If only the British troopsin Iraq had known they might have been able to fly in Kurdish iceto cool their tents and the citizens of Basra in the scorching sum-mer of 2003 when the inhabitants of that beleaguered city had noelectricity to cool their homes in temperatures over 50 °C, and riot-ing broke out in the streets, demonstrating, again, the politicalimportance of coolth.
Perhaps we will see a re-emergence of the global ice trade, oneof the most remarkable in history, which resulted, in large part,from the simple invention in 1827 on Lake Wenham near Boston,Massachusetts, of the ice-plough by Nathaniel Wyeth. The ploughwas drawn behind horses and enabled large quantities of blocksof clear, pure ice to be cut from the lakes, stored in huge above-ground ice-sheds and then transported by train to the coast wherethey were loaded onto wooden sailing barques and transported to
The evolution of buildings 43
Roaf_Ch02.qxd 29/10/04 6:31 PM Page 43

Latin American, Europe, India and as far as China, where iceallegedly was sold for the price of its weight in silver.
Imported ice became most popular in Britain in the 1840s andthe last delivery of imported ice to the Royal ice-houses was aslate as 1936. Originally from Lake Wenham, this ‘arctic crystal’was widely used in Britain where those selling it boasted that theycould get a delivery of Wenham ice to any house in Britain within24 hours. It was gradually replaced by ‘Wenham’ ice from Norway,from where over 300 000 tons a year were imported by the 1890s.The reason why it was preferred to British ice was that it was
2.11.Diagrams showing a range ofdifferent ice plans and sections inBritain. (Source: Beamon andRoaf,7 p. 57)
44 Adapting Buildings and Cities for Climate Change
Roaf_Ch02.qxd 29/10/04 6:31 PM Page 44
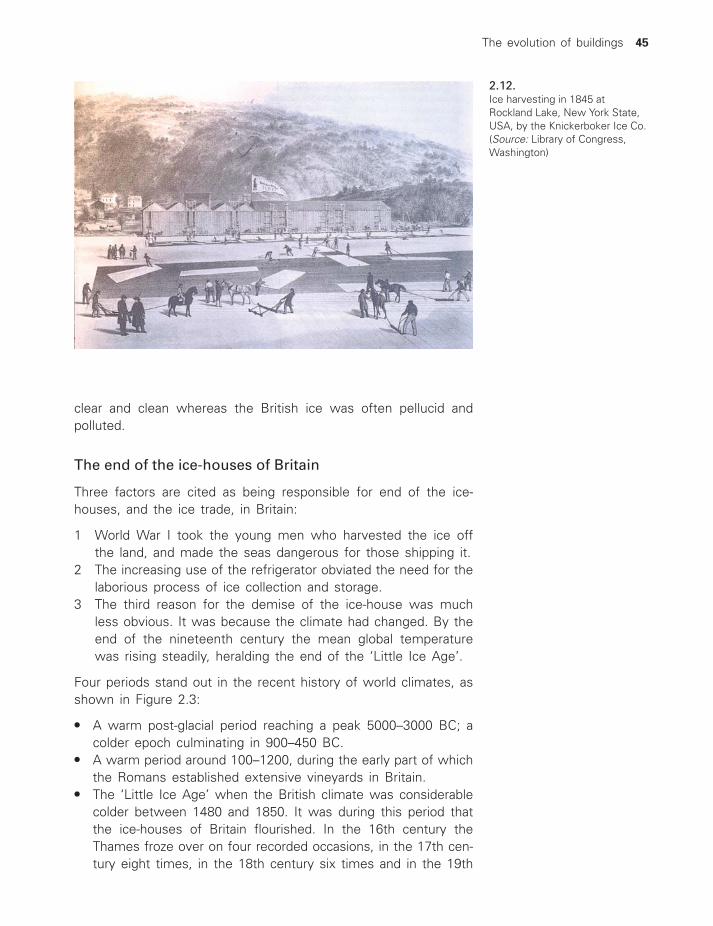
clear and clean whereas the British ice was often pellucid andpolluted.
The end of the ice-houses of Britain
Three factors are cited as being responsible for end of the ice-houses, and the ice trade, in Britain:
1 World War I took the young men who harvested the ice offthe land, and made the seas dangerous for those shipping it.
2 The increasing use of the refrigerator obviated the need for thelaborious process of ice collection and storage.
3 The third reason for the demise of the ice-house was muchless obvious. It was because the climate had changed. By theend of the nineteenth century the mean global temperaturewas rising steadily, heralding the end of the ‘Little Ice Age’.
Four periods stand out in the recent history of world climates, asshown in Figure 2.3:
● A warm post-glacial period reaching a peak 5000–3000 BC; acolder epoch culminating in 900–450 BC.
● A warm period around 100–1200, during the early part of whichthe Romans established extensive vineyards in Britain.
● The ‘Little Ice Age’ when the British climate was considerablecolder between 1480 and 1850. It was during this period thatthe ice-houses of Britain flourished. In the 16th century theThames froze over on four recorded occasions, in the 17th cen-tury eight times, in the 18th century six times and in the 19th
2.12.Ice harvesting in 1845 atRockland Lake, New York State,USA, by the Knickerboker Ice Co.(Source: Library of Congress,Washington)
The evolution of buildings 45
Roaf_Ch02.qxd 29/10/04 6:32 PM Page 45

century four times. The last great freeze in Britain was 1878–79,when the Thames and other rivers froze over twice, much tothe delight of many as the freezing of the river heralded thegreat ice fairs where bonfires were light on the river and theGentlemen of Berwick on Tweed would traditionally celebrateby dining in a great tent on the river.
● The current warm period in which the global temperature hasbeen increasing since around 1870.
The significant thermal factor for the ice-house was that althoughthe mean increase in global temperature was relatively small, onlyc.0.6 °C between 1860 and 1990, this increase in temperaturemeant that there were no longer, over time, sufficient cold wintersin Britain to regularly stock its ice-houses. So the key factor herefor a particular ‘thermal’ technology is not how much warmer itgets, but whether the increase in temperature experienced crossesa critical threshold of performance for that particular technology.
THE IMPORTANCE OF THERMAL THRESHOLDSFOR THE SURVIVAL OF THERMALTECHNOLOGIES
Because of climate change, the ice-house is now a climatically obso-lete technology in Britain. Is this important lesson applicable to otherforms of traditional buildings and technologies? What happens toa traditional house type that becomes climatically ‘obsolete’?
Let us investigate this a little further, because if thermal thresh-olds are important in the performance of, for instance, housing,will a warming climate in already extremely hot regions push indoortemperatures over thresholds of acceptability, and if so, what willbe the consequences of that?
We saw this in Basra in the summer of 2003 when the build-ings were too hot to occupy and riots broke out. We saw this inthe summer of 2003 in France when some 15 000 people diedunnecessarily because their buildings could no longer provide ade-quate protection from the summer heat, and an angry public causedthe resignation of at least one minister in the government. Whathappens if whole regions become regularly too hot to occupy?
Windcatchers – a litmus paper technology
The windcatchers’ function is to passively provide comfort inextremely hot desert regions. Many different forms of windcatcherare found in the Middle East. They work basically in three ways:
1 They ventilate basements to remove smells from a heavilyused area with few or no windows. In Baghdad where the air
46 Adapting Buildings and Cities for Climate Change
Roaf_Ch02.qxd 29/10/04 6:32 PM Page 46

temperature in summer gets up to 50 °C and is too hot to pro-vide ‘cooling’, windcatchers provide a source of conditioned,fresh air by passing it through high narrow shafts before enter-ing the basement.
2 They cool people by convective cooling where the air temper-ature is below skin temperature at around 35 °C, and evapo-rative cooling at higher temperatures where the humidity is nottoo high.
3 They cool the internal structure of the house, the walls andfloors at night removing heat from the building, making it coolerinternally during the day.
In the Yazd region, studied in the 1970s, the air temperatures onsummer afternoons were over 45 °C outside and 38 °C in theground floor rooms. Being downwind of orchards, groves andfields can reduce the mean outdoor air temperature by two to fivedegrees centigrade, and the towers here faced into the wind.Where the house was at the edge of the hot open desert thewindcatchers faced away from the unpleasant wind and wereused to draw the cooler air from the courtyard with its trees andplanting through the summer rooms to exhaust it from the top ofthe tower. Small changes in the design of the building can havea large impact on its occupiability, even though only small tem-perature differences have resulted from the changes. This isbecause these change cross a critical threshold of performance forthe occupants.
Below skin temperature (c.32–35 °C) a person can be cooled byconvection; above it, they cannot because the ambient air is thenheating the body not cooling it. Above this temperature the bodycan only be cooled by evaporation of sweat off the skin, which iswhy hot dry climates are more comfortable than hot wet onesbecause it is easy to lose moisture to the air when it is not sat-urated. So skin temperature represents a critical temperature range,or threshold.
Many of the villages of the Dasht-e-Kavir, the Great Central Desert,have no cool basements to resort to on the hottest afternoonsand measured summer living room temperatures were up above40 °C in the 1970s, the upper end of physiological limits of sur-vivability in this region.
With climate change, even relatively small increases in meanglobal or regional temperatures will push absolute maximum tem-peratures indoors up towards 50 °C, and over the thermal thresh-old of habitable room temperatures. People will die, even thoseadapted to living in very high ambient temperatures.
If we look at the predicted mean global temperature increasesover the next fifty to a hundred years we can see predicted mean
The evolution of buildings 47
Roaf_Ch02.qxd 29/10/04 6:32 PM Page 47

regional temperature increases in Central Iran reaching 4–8 °C. Inthis case one would be tempted to postulate that the traditionalhouses of the region will cease to be occupiable at all without airconditioning. Such rural populations cannot afford air conditioning,and will have only one option, to migrate to other habitats, thatis, to change their ecological niches, to areas where either:
1 they do not need air conditioning to survive, or2 they can work to earn enough money to afford the air condi-
tioning they need to survive.
BUT BUILDINGS CAN EVOLVE: A CASE STUDY OF NAPLES
But surely buildings can be made to perform better passively insuch a way that will enable people to stay in their regions evenif it does get hotter? We looked for the answer to this questionin the buildings of the Naples region, looking at the evolution ofbuildings over two millennia to see if they really did evolve to per-form better in the bay area, famous for its architecture.11
The Mediterranean, like the Gulf, is a region that will be badlyaffected by climate change (see Chapter 10, Figure 10.4, whichshows areas of Greece, Italy and Spain particularly affected byincreases in summer temperatures by 2050). For this reason we investigated the palette of environmental strategies used incooling a range of buildings through time in the region of Naples.
48 Adapting Buildings and Cities for Climate Change
2.13.From the melting mountains ofEurope to the shores of the risingseas climate change will requireus to adapt our buildings.(Source: Associated Press)
Roaf_Ch02.qxd 29/10/04 6:32 PM Page 48
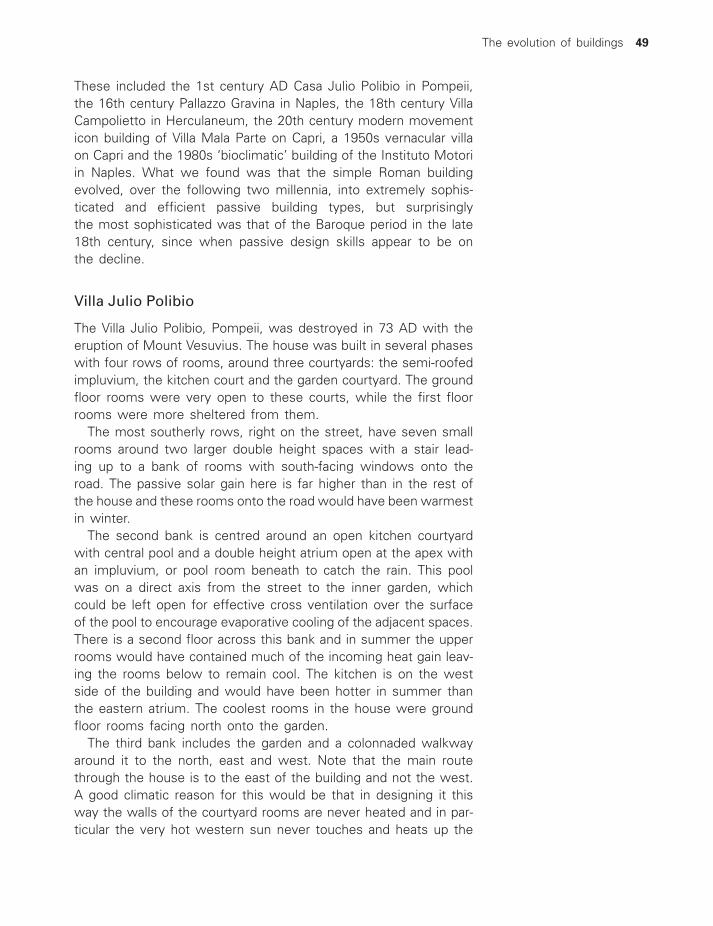
These included the 1st century AD Casa Julio Polibio in Pompeii,the 16th century Pallazzo Gravina in Naples, the 18th century VillaCampolietto in Herculaneum, the 20th century modern movementicon building of Villa Mala Parte on Capri, a 1950s vernacular villaon Capri and the 1980s ‘bioclimatic’ building of the Instituto Motoriin Naples. What we found was that the simple Roman buildingevolved, over the following two millennia, into extremely sophis-ticated and efficient passive building types, but surprisingly the most sophisticated was that of the Baroque period in the late18th century, since when passive design skills appear to be onthe decline.
Villa Julio Polibio
The Villa Julio Polibio, Pompeii, was destroyed in 73 AD with theeruption of Mount Vesuvius. The house was built in several phaseswith four rows of rooms, around three courtyards: the semi-roofedimpluvium, the kitchen court and the garden courtyard. The groundfloor rooms were very open to these courts, while the first floorrooms were more sheltered from them.
The most southerly rows, right on the street, have seven smallrooms around two larger double height spaces with a stair lead-ing up to a bank of rooms with south-facing windows onto theroad. The passive solar gain here is far higher than in the rest ofthe house and these rooms onto the road would have been warmestin winter.
The second bank is centred around an open kitchen courtyardwith central pool and a double height atrium open at the apex withan impluvium, or pool room beneath to catch the rain. This poolwas on a direct axis from the street to the inner garden, whichcould be left open for effective cross ventilation over the surfaceof the pool to encourage evaporative cooling of the adjacent spaces.There is a second floor across this bank and in summer the upperrooms would have contained much of the incoming heat gain leav-ing the rooms below to remain cool. The kitchen is on the westside of the building and would have been hotter in summer thanthe eastern atrium. The coolest rooms in the house were groundfloor rooms facing north onto the garden.
The third bank includes the garden and a colonnaded walkwayaround it to the north, east and west. Note that the main routethrough the house is to the east of the building and not the west.A good climatic reason for this would be that in designing it thisway the walls of the courtyard rooms are never heated and in par-ticular the very hot western sun never touches and heats up the
The evolution of buildings 49
Roaf_Ch02.qxd 29/10/04 6:32 PM Page 49

2.14.View (a), plan (b) and temperaturereadings taken in March 1996 (c)for the Villa Julio Polibio inPompeii. (Source: Sue Roaf andMary Hancock)
50 Adapting Buildings and Cities for Climate Change
5
4
2
1
3
1 Impluvium2 Compluvium3 Culina4 Peristylum5 diaetae
via dell ab
bo
nd
nn
za
Plan of Villa Julio Polibio, Pompeii
22–MarTime
House Julio Polibio, Pompeii, Temperature measurements March 1996
21–Mar0
2
4
6
8
10
12
14
16
18
Tem
per
atu
re, °
C
23–Mar
Kitchen court
Pomp 1, Diaetae, livingroom overlooking garden
Pomp 3, Impluvium, largerrainwater collection area
Pomp 2, peristylum (garden)Pompeii 4, front room, first floor
(a)
(b)
(c)
Roaf_Ch02.qxd 29/10/04 6:32 PM Page 50

eastern wall. Plants may not have survived so well on an easternwall as the western wall due to the additional heat contained inthe afternoon sun. The garden was well planted with six trees,including a fig, and a row of ornamental bushes against the westwall. The trees would have almost entirely shaded the courtyardlending coolth to the house.
The openness of the ground floor rooms and the high thermalmass of the thick masonry walls would keep the temperature inmany of the rooms at the mean temperature between maximumand minimum external air temperature. In the very hottest timesof the year they may well have splashed water on the floors ofthe more open spaces to cool them evaporatively and retreatedinto a ground floor north-facing room and closed the door or hungcurtains up to keep out the heat of the daytime air temperatureswhile they took their afternoon nap. It is probable that the familymigrated around the house using different rooms at different timesof year and day to select the optimum temperatures available inthe house. Human behaviour plays a large part in adapting build-ings to make them comfortable throughout the year. It should benoted that in every room there was typically found a single smallclay or brass oil lamp showing that lighting levels after dark werevery low. It suggests that the custom was for many to go to bedwhen it got dark. Only in the shrine, atrium and the north-easterlyliving room was there more than one lamp.
Pallazzo Gravina
Pallazzo Gravina is a courtyard-style renaissance palace dating tothe mid 17th century with introverted planning. In the building theresident family were separated from their servants in a system ofcomplex vertical and horizontal planning in which three zones canbe identified.
The double-height ground floor includes stables, guards and stor-age rooms and steps down to cellars. The colonnaded walkwaylends shade to the lower walls of the building and floor of partof the court. A single tree in the court harks back to former gar-dens. The piano nobile, or first floor, is where the family had itsliving and dining areas and bedrooms and its grandeur is empha-sized in the elevations. The second floor housed the staff andmore family and the top floor housed store rooms and servantslinked to the ground floor by a separate stairwell not used by thefamily.
The whole building is constructed of tufa, or volcanic stone, whichis highly aerated and provides excellent insulation and thermal mass.There are five key climatic strategies used in the building. Massive
The evolution of buildings 51
Roaf_Ch02.qxd 29/10/04 6:32 PM Page 51

52 Adapting Buildings and Cities for Climate Change
walls create inter-seasonal heat and coolth stores. Windowed gal-leria provide a thermal buffer for the family living rooms from thedirect penetration of sun and hot air when closed in mid-summerinto the family living room complexes but enabled them to be noc-turnally ventilated. Windows were carefully sized to prevent exces-sive solar gain. A complex ventilation system dependent on twostack systems in the staircases created the churn to drive crossventilation in the interconnected chambers, particularly in the mainnorth-facing summer rooms on the south of the building facing thestreet. In winter the double-depth winter living rooms are not soconnected. The stack would have drawn cool air from the colon-naded and planted courtyard below during the day being driven bytemperature difference up through the stack and at night this churnwould have been enhanced by the warmer air rising from the court-yard floor.
Villa Campolietto
Started in 1755 by Mario Gioffredo this extraordinary building wasfinished in 1775 by Luigi Vanvitelli and his son Carlo. This VitruvianBaroque villa in Herculaneum is laid out in a square with the fourcorner blocks of apartments divided on the piano nobile, on thethird floor, by a huge cross axis of double-height rooms capped bya large raised rotunda in the centre with windows on four sidescreating a venturi tower. Beneath the ground floor are two furtherbasement levels including water cisterns and an ice storage room.
2.15.View of the Pallazzo Gravina.(Source: Sue Roaf)
Roaf_Ch02.qxd 29/10/04 6:33 PM Page 52

The evolution of buildings 53
2.16.Villa Campolietto. (a) View and (b)internal temperature readingstaken in March 1996. (Source:Sue Roaf and Mary Hancock)
(a)
(b)
Time
Tem
per
atu
re °
C
8
10
12
14
16
18
20
22
24
00.00
19M
ARCH 6 12 18
00.00
20 M
arch 6 12 18
00.00
21 M
arch 6 12 18
00.00
22 M
arch 6 12 18
00.00
23 M
arch 6 12 18
00.00
24 M
arch
External Campolieto
Campolieto basement
Campolieto ground floor
Campolieto topfloor
This villa has far larger windows than the previous buildings andthe family quarters include south-, west- and north-facing living anddining rooms and bedrooms on the north of the building. The wallsare massive, providing inter-seasonal heat and coolth storage capac-ity, with a plastered tufa construction. Daylight levels are high inthe living areas and for summer cooling the ventilation systemwould have created perfect thermal comfort. The house is
Roaf_Ch02.qxd 29/10/04 6:33 PM Page 53

54 Adapting Buildings and Cities for Climate Change
situated some half a mile from the sea on a flank of Mount Vesuviusin an elevated position to catch the cool on-shore winds.
The genius of this building is its ventilation systems. In warmweather the whole building could be opened up to catch the wind.In very hot weather the external doors and windows could be shutand the venturi tower of the rotunda above the stairway woulddraw cooler air up from the basements through the transverseventilation system. In extreme heat ice from the ice store couldhave been brought up in boxes to cool individual rooms. In con-ditions of dire heat basements living areas would have remainedcool but we have evidence now of their use in summer. It shouldalso be noted that the gardens have been landscaped to enhancecoolth with the use of shade, ponds, fountains and a sunken dategrove.
Each corner block has its own independent cross, transverseand stack-driven systems based around vertical stairways with ven-turi towers above each. These operate independently of the mainrooms of the piano nobile of which the three main rooms, thedrawing room, the dining room and the music room, have double-height ceilings with a buffer void above to prevent direct pene-tration of heat into them via the roof. The villa also includes ahidden system of ducts, vents and grills drawing cool air into roomsand expelling warm air from them. The success of the ventilationis that the shore-side location precluded the need for lateral buffer-ing of spaces against the heat, as we found in the previous twobuildings. This strongly suggests the movement around the build-ing at different times of day. The southerly drawing room wouldprobably not have been used in mid afternoon on the hottest daysbut could have been cooled in early evening by opening it to seabreezes.
The importance of thermal mass, or heavy-weight materials inbuildings, increases in ‘passive cooling systems’, in which the designof the building itself, rather than the machines in it, are used tocreate acceptable internal climates. In a well-designed, heavy-weightbuilding the indoor temperature can track the mean of the outdoormaximum and minimum air temperatures, levelling the diurnal, andeven the monthly, swings in temperature to provide safer indoorclimates in extreme weather.12
Villa Mala Parte
Built in the 1930s on a rock jutting out into the sea from the south-ern coast of Capri Island, this building is vertically zoned. The groundfloor comprises kitchens and store rooms. The first floor has
Roaf_Ch02.qxd 29/10/04 6:33 PM Page 54
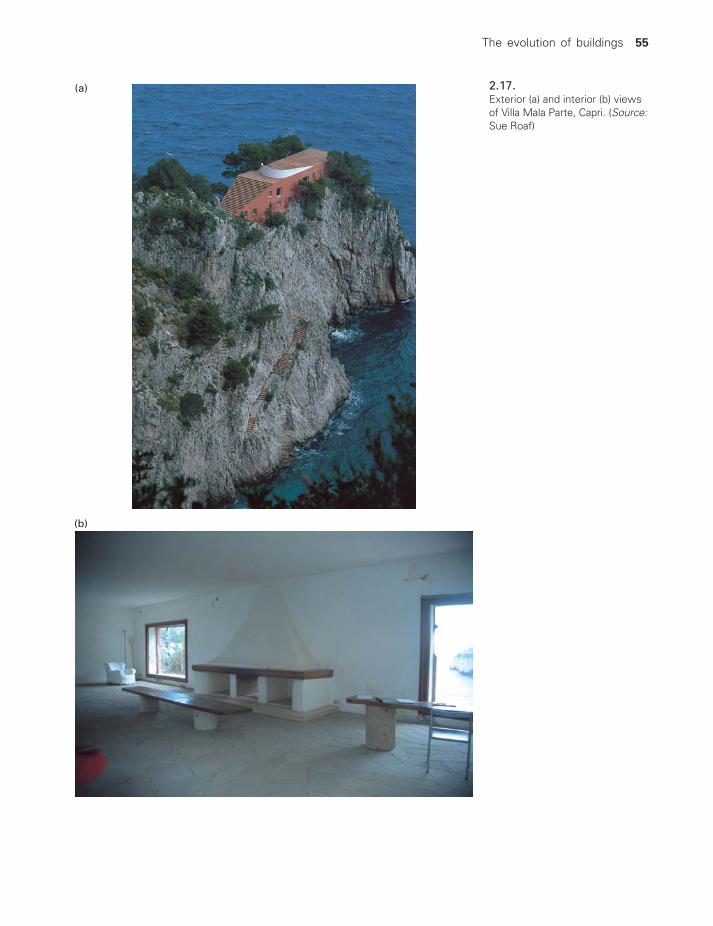
The evolution of buildings 55
2.17.Exterior (a) and interior (b) viewsof Villa Mala Parte, Capri. (Source:Sue Roaf)
(a)
(b)
Roaf_Ch02.qxd 29/10/04 6:33 PM Page 55

bedrooms and servants’ quarters and the second floor houses theliving and dining rooms and the main living apartment. The con-struction is fairly massive, with 600 mm wide walls of brick. Theroof is of uninsulated concrete so potentially forming a heat source.In the lower rooms the central corridor restricts the effectivenessof the cross ventilation and the rooms have limited window open-ings so preventing excessive solar gain. These remain cool. Theupper floor has large unshaded areas of glass windows, which leadto high solar gain levels in summer. They slide open to providedirect cross ventilation but not easily and the very exposed sitemeans that winds can get very strong around the house. This meansthat on sunny afternoons with a strong cold wind the comfort lev-els of occupants on this floor would be interesting to record. Highlevel open vents just under the concrete ceiling were designed,presumably, to remove heat from and ventilate the room in suchconditions. In fact the building owner’s favourite room was the firstfloor east-facing study with a Kakkleoven for winter warmth andhe preferred a first floor bedroom to sleeping in the main bedroomapartment. The windows whistle apparently.
Villa Ranzo
Built by the Ranzo family in the mid 1950, this is a typical neo-vernacular villa on Capri. It is located on the cool side of Capriin the shade of the central landmass so in summer it is cool butin winter the building becomes very cold. The basement roomsare stores and servants’ quarters, the first floor the living andkitchen area and the top floor has five bedrooms and four bath-rooms. Direct cross ventilation and lateral ventilation via windowsand french doors is used in all main rooms and on the west-facing walls a veranda at first floor shades ground floor rooms.The walls are of massive stone and render construction, and theroof is of concrete. The stairwell provides an effective stack moving air between floors.
Instituto Motori
Completed in 1992 the modern headquarters of this research insti-tute is a well-publicized modern bioclimatic building. Covering over6900 m2 and housing a range of functions including offices, library,conference hall, café, museum and laboratories, the building isrectangular on a northeast to southwest axis. The basement levelhas a store and conference hall, and the first, second and thirdfloors consist of offices and laboratories opening off a central hallopen in the centre for three floors and above which is the museum
56 Adapting Buildings and Cities for Climate Change
Roaf_Ch02.qxd 29/10/04 6:33 PM Page 56

The evolution of buildings 57
2.18.View of Villa Ranzo, Capri.(Source: Sue Roaf)
2.19.View of Instituto Motori, Naples.(Source: Sue Roaf)
Roaf_Ch02.qxd 29/10/04 6:34 PM Page 57

on the roof. The flanking offices block off light from the centralcirculation zone and we found all labs and offices typically had theirdoors shut. The windows of the building are ‘smart’, being reversibleso that the timber louvres can be put on the outside of the build-ing, but many were broken and their ventilation value in a closedoffice was limited. The lightweight structure holds little thermalstorage potential and provides poor insulation against the heat andcold. All thermal storage capacity would be held in the concretefloors, which were fairly universally carpeted, so reducing theireffectiveness. There are no thermal buffering zones against the heat either horizontally or vertically and no apparent zoning ofactivities according to location in the building in relation to its microclimate.
Buildings of Naples: summary
Table 2.1 demonstrates that, despite the best intentions of thedesigners, the modern ‘bioclimatic’ building has the fewest adap-tive passive opportunities for modifying indoor climate, followedby the Modern Movement icon building of the Villa Mala Parte.The traditional buildings employed a wide range of effective adap-tive strategies to raise or lower indoor temperatures without usingfossil fuel energy. The temperature graphs in Figures 2.14 and 2.16show that while the indoor climate in the Roman house trackedthe outdoor climate, in the Rococo Baroque Villa of Campoliettobuilt in the 18th century the indoor climate, using a wide range ofpassive techniques, could, in places, be de-coupled from the out-door climate, potentially providing a cool environment even in thescorching heat of the future.
All new office buildings in the Naples region are now air-condi-tioned in a climate that was once considered ‘perfect’. Air-condi-tioned buildings traditionally have only two adaptive opportunitiesto ameliorate the heat: (a) shut the internal blinds (the heat isalready in the building and cannot escape once the radiation hasentered through the glass) and (b) adjust the air conditioning.
THE ADAPTABILITY OF BUILDINGS
How much of a challenge will climate change be to us? Surelywe can adapt to the changes ahead with better buildings andtechnologies?
That humans are adaptable we know. They have settled in flimsytents from the ice lands of the Arctic to the sand lands of theEquator. They can live without machines in climates from 50 °Cbelow to 50 °C above freezing point.
58 Adapting Buildings and Cities for Climate Change
Roaf_Ch02.qxd 29/10/04 6:34 PM Page 58

The evolution of buildings 59
Table 2.1. Range of adaptive opportunities available to buildingusers to ameliorate their own internal climate using passive andactive systems
DESIGN STRATEGY 1 2 3 4 5 6
Cold site 1Cool site 1Solar orientation 1 1 1Sea breezes 1 1 1Summer use only 1 1Morning/afternoon use 1 1 1 1Summer/winter rooms 1 1 1Horizontal buffer zones 1 1 1 1Vertical buffer zones 1 1 1Verandahs/colonnades 1 1 1 1Planting 1 1 1 1Pools/evaporation 1 1Earth Sheltering 1 1 1 1 1Thermal mass 1 1 1 1 1Interseasonal storage 1 1 1Basement coolth use 1 1 1 1Hypercausts 1Shaded from West sun 1 1Cross ventilation 1 1 1 1Stack cooling 1 1Lateral ventilation 1 1 1 1Venturi ventilation 1Ventilation ducts 1 1Door ventilation control 1 1 1 1Stack warming 1 1 1Insulated roof 1 1False ceiling insulation 1 1External shade 1 1 1High rooms 1 1 1 1Small windows 1 1 1Smart windows 1Shutters 1 1Low energy lighting 1 1 1 1Rainwater storage 1 1 1 1 1Ice for cooling 1
20 20 27 6 19 9
LIST OF THE PASSIVE STRATEGIES1 – Pompeii, 2 – Gravina, 3 – Campolietto,4 – Mala Parte, 5 – Ranzo, 6 – Motori.
Source: Roaf, S. and Handcock, M. (1998) Future-proofing buildings againstclimate change using traditional buildings technologies in the Mediterraneanregion. Proceedings of the Eurosolar Conference, PortoRos, Slovenia.
Roaf_Ch02.qxd 29/10/04 6:34 PM Page 59

That buildings are adaptable we also know, and that people canlive in the same tent, perhaps not comfortably, at the extremesis sure. But there is a fixed range of temperatures within whicha building type will give adequate protection in extreme weather,flanked by thermal thresholds beyond which survival in them maynot be assured. We also know that with clever design, buildingtypes can be modified and improved in one area to be safe in asignificantly wider range of temperatures, as we saw in the Romanand the Baroque buildings of Naples. But there are climate thresh-olds beyond which buildings cease to be safe to occupy, withthe vulnerability of the occupant depending on the form and fab-ric of the buildings, and the degree of its exposure to extremeclimates.
The risk of not surviving in a particular building type and regionwill be largely dependent on the nature of that building and onhow much the climate changes. Both are crucial in the challengeof designing buildings today in which people can be comfortablein 50 years’ time.
NOTES AND REFERENCES
1 For a good simple outline of adaptive human responsessee http://www.bio.usyd.edu.au/summer/Human/HA_lectures/HA_lect/LECTURE2.pdf.
2 For a good source book on the evolution of the early settle-ments and empires in Mesopotamia, the cradle of civilization,see Roaf, M. (1990) Cultural Atlas of Mesopotamia. Oxford:Andromeda.
3 Roaf, S. (1979) A Study of the Architecture of the Black Tentsof the Lurs. Technical Thesis for the Architectural AssociationPart II exam.
4 For the best book available on the vernacular buildings, seeOliver, Paul (ed.) (1997) Encyclopaedia of VernacularArchitecture of the World, in 3 volumes. Cambridge: CambridgeUniversity Press.
5 Black-Michaud, J. (1986) Sheep and Land. The Economics ofPower in a Tribal Society. Cambridge: Cambridge UniversityPress and Paris: Maison des Sciences de l’Homme.
6 Roaf, S. (1989) The Windcatchers of Yazd. PhD thesis, OxfordPolytechnic. For a further outline of the processes involvedsee Roaf, S., Fuentes, M. and Thomas, S. (2003) Ecohouse2:A Design Guide. Oxford: Architectural Press.
7 For a complete history of the ice-houses and ice trade of theworld see Beamon, S. and Roaf, S. (1990) The Ice-Houses
60 Adapting Buildings and Cities for Climate Change
Roaf_Ch02.qxd 29/10/04 6:34 PM Page 60

of Britain. London: Routledge; and for the desert buildings ofthe Central Persian Desert see Beazley, E. and Harverson, M.(eds) (1982) Living with the Desert. Warminster: Aris andPhilips.
8 Two excellent papers that touch on this challenge for Kuwait are:Al-Temeemi, A. and Harris, D. (2004) A guideline for assessingthe suitability of earth-sheltered mass-housing in hot-arid cli-mates. Energy and Buildings, 36, pp. 251–60; and Al-Mumin,A., Khattab, O. and Sridhar, G. (2003) Occupants’ behavior andactivity patterns influencing the energy consumption in theKuwaiti residences. Energy and Buildings, 35, pp. 549–59.
9 Page, S. (1969) Ice, offerings and deities in the Old Babyloniantexts from Tell el-Rimah, Actes de la XV11e. Rencontred’Assylriologie. Brussels, p. 181.
10 Tschudi, J.J. (1847) Travels in Peru during the years 1838–1842.London, pp. 136–7.
11 Roaf, S., Haves, P. and Orr, J. (1998) Climate change and pas-sive cooling in Europe. Proceedings of PLEA Conference.Lisbon: James & James Science, pp. 463–6.
12 Baruch Givoni, the doyen of passive design, presents thresh-olds for the operation of different types of such passive cool-ing systems.
For the following ventilation strategies:
comfort ventilation: ventilation to produce immediatehuman comfort, mainly during the daynocturnal convective cooling: ventilation to cool thethermal mass of building during the night in order toimprove comfort during the day
the threshold value of the maximum ambient air temperaturefor the viability of comfort ventilation he gives as 28–32 °C atindoor air speeds of 1.5–2.0 m/s, depending on the comfortrequirements. This is based on the observation that the indoorair temperature approaches the outdoor air temperature asthe ventilation rate increases. For comparison, the upper limitof the extended ASHRAE comfort zone (see Chapter 5) is28 °C at 0.8 m/s air speed. In offices, or similar environments,a combination of higher internal loads and restrictive expec-tations concerning dress would produce a reduction in thethreshold that depends on the particular situation but whichmay amount to several degrees centigrade. Givoni’s rule ofthumb for nocturnal convective cooling is that the indoor max-imum temperature is less than the outdoor maximum
The evolution of buildings 61
Roaf_Ch02.qxd 29/10/04 6:34 PM Page 61

temperature by nearly half the diurnal range in outdoor tem-perature, providing the envelope and internal gains are mod-est and the thermal capacity is high. Nocturnal convectivecooling is applicable if the maximum ambient temperature istoo high for comfort ventilation and the diurnal range is suf-ficiently large to bring the indoor maximum temperature downinto the comfort range. For example, if the minimum outdoortemperature is 24 °C, the threshold value of the maximumoutdoor temperature is 40 °C if the indoor temperature is notto exceed 32 °C. If building occupants retreat to a deep base-ment they can occupy a temperature that may be closer tothe mean of the annual mean maximum and minimum tem-peratures providing an even safer temperature in extremeweather.
The indoor temperatures in passive buildings are then deter-mined primarily by the outdoor temperatures, the form andfabric of the building and the way it is used, and it is possi-ble, therefore, to define threshold values for the outdoor tem-peratures, in relation to what passive systems would beeffective in current and future climates for different regions.In buildings where the loads are significant compared to theheat that can be stored in the thermal mass with the avail-able temperature swings, the threshold for viability dependson the loads and the effective thermal mass as well as theoutdoor temperatures and may require complex, validated,simulation to predict performance in a range of climates.
See Givoni, B. (1991) Performance and applicability of pas-sive and low-energy cooling systems. Energy and Buildings,17: 177–99 and a range of his other books on the subject.The importance of the ‘adaptation’ of local populations in suchcalculations is clarified in Chapter 5 of this present text.
62 Adapting Buildings and Cities for Climate Change
Roaf_Ch02.qxd 29/10/04 6:34 PM Page 62

INTRODUCTION
All of us are placed at risk by climate change. Some of us are atmore risk than others, and for some that risk will prove cata-strophic. It is fundamentally important to understand the extent ofthe risk in order to be able to future-proof the lives of individualsagainst that risk in the face of the changes ahead.1
Risk, we believe, is composed of three elements:
1 The vulnerability of the person to a risk was dealt with inChapter 2, where we looked at the idea that the design andfabric of buildings, and the habits of their occupants, enableslocal populations to survive in a range of diurnal, seasonal orextreme climatic events. But we saw too that people in tradi-tional buildings have the capability of adapting only so far, afterwhich their very survival is threatened. These limits to the adap-tational opportunities people have, to some extent define thevulnerability of those people in that place to climate change.For those who live in settlements on the edge of hot deserts,in ‘modern’ houses with thin walls and roofs, large windows,dependent on air conditioning, they are infinitely more vulnerable
3 RISK, SCENARIOS AND INSURANCE
3.1.The risk triangle. (Source:Crichton, D.C. (2001) in TheImplications of Climate Changefor the Insurance Industry, ed.Dr J. Salt, Building ResearchEstablishment, UK. © D.C.Crichton 2001)
Haz
ard
Vulnerability
Exposure
Risk
Roaf_Ch03.qxd 29/10/04 6:40 PM Page 63

to changes in climate than those in traditional, thick-walledhouses with shading and deep basements.
2 The idea of the exposure of a person deals with the thirdelement in the triangle of symbiosis that ties man to his ecosys-tem, the climate. The degree to which any population will beexposed to the exigencies of climate change is related to theirgeographical location in relation to latitude, land masses andthe patterns of climate change. Some areas of the world willexperience far faster and more extreme warming, in particularin the high latitudes of the Northern hemisphere and towardsthe centres of land masses in areas with ‘continental’ climates.To date the ‘exposure’ of Britain to swings of temperature hasbeen damped by its island status. The climate of the UK isstrongly influenced by the great sea mass and currents of theAtlantic ocean. On the other hand, through its location on theedge of that ocean, the UK is one of the windiest countries inEurope and more exposed than most to storms. Those in Alaska,whose homes are on the melting tundra, and who face someof the most rapid predicted increases in temperature globally,are infinitely more ‘exposed’ to the risks of large-scaletemperature increases than most, regardless of how muchchange their homes can accommodate.
3 The nature of the hazard is perhaps what will do for many ofus in the long run. Hazard is a term that is typically describedin terms of the size of the risk and the frequency with whichit is experienced. How extreme the climate becomes, and howoften will it be extreme are significant. If a river floods homesonce in a century then those homes are under considerably lessrisk than homes that flood every year or two. It is on these twomeasures of hazard that the insurance industry largely bases itsinsurance premiums.2 This can be illustrated with a case study.In 1999 Britain experienced one of the strongest storms in recenthistory. The ‘Braer’ depression ranged across Scotland for almostthree weeks, reaching UK record-breaking lows of 915 millibars(the lowest pressure ever recorded in Europe is 912 millibarsand hurricane Andrew that cost the United States 30 billion dol-lars in 1992 only reached 924 millibars). And yet its cost to theBritish insurance industry was (relatively) negligible, despite thestrength of its hazard, for two reasons. First, it tracked acrossScotland only, missing most of England, so the exposure of theBritish Isles to it was relatively low. Secondly, in Scotland build-ing standards are higher than in England. Roofs still have tohave sarking beneath the roof finishes and are more firmly con-structed than required under English regulations so reducing thevulnerability of individual buildings exposed to the storm.
64 Adapting Buildings and Cities for Climate Change
Roaf_Ch03.qxd 29/10/04 6:40 PM Page 64

It is, however, important to understand all aspects of the risks weface if we are to act effectively to reduce those risks over time.
RISK AND IMPACT
Risks ultimately either do, or do not, translate into damage to anindividual, institution, a landscape, country or the planet. Risk isthe potential for that damage to occur. The damage may take theform of a wide range of impacts and in chapters within this bookon how hot, wet and windy it will get, respectively, and the dis-cussion on the insurance industry below, we will look at not onlyhow much change we are faced with from the climate but alsoexplore the idea of how vulnerable and exposed different peoples,settlements and buildings have been to such climate hazards inthe past, to give an idea of how we may be affected by them inthe future. Everything is connected in our world, so climate impactson a landscape will affect, for instance, the insurance industry thatin turn impacts on regional development and the future of build-ings and cities in such regions. Our understanding of future riskis still informed by past experience of related impacts.
Impact can be calculated thus:
(possible) Hazard � Vulnerability � Exposure � (possible) Impact
SCENARIO PLANNING
Traditionally people measured risk by applying to particular situa-tions the lessons learnt through past experience. Historic eventsprovided adequate experience against which to evaluate futurerisk. We now believe from the climate models, touched on inChapter 1, that if current trends continue, the future climate will bevery different from that today. But those future trends will beinfluenced by the actions taken by us today, because much ofthe increase in global temperatures is known to be strongly drivenby ‘anthropogenic’, or man-made, emissions of climate changegases.
If we are to model future climates we must include the poten-tial influences of our own actions on the trends. The way this iscurrently done is by using scenarios of what the future may belike, extrapolated from trends in the current climate and social andeconomic activity. Against these we can measure the potentialcosts and benefits in the future of continuing with our ‘businessas usual’ approach, or modifying our behaviour.3
Scenario planning involves looking at a range of alternative futures,using projections of current trends, and applying different bound-ary conditions and strategies to case studies. Brainstorming and
Risk, scenarios and insurance 65
Roaf_Ch03.qxd 29/10/04 6:40 PM Page 65

‘think-tank’ techniques are often used to identify ‘stepping stones’and ‘tripwires’, ways in which strategies might fail, and what arethe key drivers for change.
Contrasting scenarios can then be ‘scripted’ and tested out ondecision-makers to help them develop more effective policieswith which to minimize the impacts of current decisions on futuresocieties.
Scenarios are plausible descriptions of how things may changein the future, built to reflect what is possible, not what is preferred,desirable or undesirable. They are meant to be politically and morallyneutral constructs.
The quality of life of future societies in, and around, buildingsdepends very much on the quality of the decisions we make aboutthe choice of location and technologies for buildings, the form andfabric of the built environment and the lifestyles we adopt in them.The buildings we will live in, in 20 or 50 years’ time, will be, byand large, those we occupy or are building today4 and so our choices,today, must be based on such descriptions of a probable future,because they are the best chance we have of designing buildingsthat go some way, at least, towards being appropriate for the rapidly changing world.
Three of the most influential scenario sets in Britain are those of theUK Foresight Programme, the Royal Commission on EnvironmentalPollution and the UK Climate Impacts Programme (UKCIP). For adetailed outline of how these scenarios were derived see the com-panion website: http://books.elsevier.com/companions/0750659114.
Foresight scenarios
The UK Foresight Programme began in 1993, drawing on the exper-tise of thousands of people from the UK’s leading businesses, uni-versities, government and other institutions.5 It was designed toidentify technical opportunities and social drivers in a changingworld and has helped to shape research priorities both in the pri-vate and public sector. Thus, for example, it is now standard prac-tice for research organizations seeking funding from UK Governmentto be requested to identify how their research will fit in with the‘Foresight Scenarios’. In addition, it is known that the UK govern-ment Cabinet Office makes use of the Foresight Scenario method-ology in formulating strategies and policies.
The scenarios are only two-dimensional, that is they consideronly two dimensions of change, namely social values and gover-nance systems. These scenarios were very important in buildingup a range of possible social and economic descriptions of thefuture that might arise if certain decisions were taken today and
66 Adapting Buildings and Cities for Climate Change
Roaf_Ch03.qxd 29/10/04 6:40 PM Page 66

these scenarios have been widely used as the basis for other morecomplex scenarios.
RCEP 2000
The Royal Commission Report on Environmental Pollution (RCEP),6
published in June 2000, has proved to be one of the most influ-ential of all scenario sets for the built environment. The report sug-gested what appeared to be, then, deep cuts necessary in emissionsfrom buildings of 60% by 2050 and 80% by 2100, to contain cli-mate change. These dramatic cuts, only four years down the roadfrom publication, are now taken for granted and used as target val-ues in government emissions reductions programmes. The RCEPscenarios introduce issues of what energy sources are used andthe impacts of related choices on future climates.
Risk, scenarios and insurance 67
3.2.Scenarios are essential for risk analysis, where they are used to define the problem and then for the assessment of itsassociated risks. For every major decision a detailed risk analysis that takes into account the impact on, and from, climatechange will be increasingly a requirement. This proposed model for such an analysis is based on the UKCIP report onClimate Adaptation, Risk Uncertainty and Decision-Making. (Source: Willows, R.I. and Connell, R.K. (eds) (2003) UKCIPTechnical Report. Oxford: UKCIP)
Identify problemand objectives
1
Establish decision-making criteria
receptors, exposure units andrisk assessment endpoints
2
Assess risk3
Appraiseoptions
5
Implementdecision
No
YesProblemdefined
correctly?Criteria met?
No
Yes
7
Make decision6
Identifyoptions
4
Monitor8
Roaf_Ch03.qxd 29/10/04 6:40 PM Page 67

The UKCIP02 scenarios: background
These are the scenarios on which are based the following descrip-tions of future climates in the UK. The UKCIP02 scenarios buildon the work of previous scenarios published by UKCIP in 1998,and have been updated to take into account:
● A series of climate modelling experiments completed by theHadley Centre using their most recently developed models forthe UK climate covering four alternative future climates, basedon social and economic scenarios, labelled:– Low Emissions– Medium Low Emissions– Medium High Emissions– High Emissions
● New global emissions scenarios published in 2000 by the IPCC(International Panel on Climate Change).
The UKCIP scenarios provide detailed information on future climatesin Britain in relation to different geographical locations in the UK,extremes of weather and rises in sea level. What is presentedbelow are just the headlines of the important UKCIP SummaryReport, that fronts a vast amount of scientific research, and thou-sands of simulation runs, carried out in the UK and abroad in thiscomplex field of trying to predict the future climate.
There is a difference between a climate scenario and a climatechange scenario. The former describe possible future climates ratherthan changes in climate. Climate scenarios usually combine obser-vations about present day climate with estimates of the change inclimates, typically using the results from global or regional climatemodel experiments.
Many of the future changes that will happen over the next 30–40 years have already been determined by historic emissionsand because of the inertia in the climate system. We thereforehave to adapt to some degree of climate change however muchfuture emissions are reduced.
68 Adapting Buildings and Cities for Climate Change
CO
2 co
nce
ntr
atio
n
Year AD
260
280
300
320
340
360
380
260
280
300
320
340
360
380
800 1000 1200 1400 1600 1800 2000
3.3.Increasing historic concentrations(parts per million) of carbondioxide in the global atmosphere.The line thickness indicatesuncertainty in the concentrations.(Source: IPCC, from UKCIP02Briefing Report, summary, p. 5)
Roaf_Ch03.qxd 29/10/04 6:40 PM Page 68

The climate of the second half of the 21st century, and beyond,will be increasingly influenced by the volume of the greenhousegases emitted by human society over the coming decades. By the2080s, the UKCIP02 scenarios suggest that the atmospheric car-bon dioxide concentrations may be between 525 parts per million(ppm) and 810 ppm, as shown in Table 3.1.
In the 1961–90 record, the concentration of carbon dioxide of334 ppm was significantly greater than the pre-industrial concen-tration of 280 ppm and by 2000 the atmospheric concentrationsof carbon dioxide had reached around 370 ppm. Even if globalemissions fall again below today’s level, as assumed in the UKCIP02Low Emissions scenario, the future rate of global warming overthe present century may be about four times that experienced dur-ing the 20th century. If the emissions rate increases to approxi-mately four times today’s level, the High Emissions scenario, thefuture warming rate may be about eight times that experiencedduring the 20th century and such a change in climate will beextremely difficult to adapt to, and will have huge impacts on everyperson, building, settlement, society and country in the world.
How seriously should we take such predictions?
Temperate Britain has perhaps less to fear than many other coun-tries with more continental climates, while the future scenarios forthe USA and Australia,7 two heavily energy-dependent continents,show a much bleaker picture. There is a vast amount of emerg-ing knowledge on future climates freely available on the Internet8
and many reputable institutions in countries around the world areworking to help develop strategies with which to fight for thefuture.
We should take such climate change predictions very seriouslyindeed, and particularly because fears have been expressed that
Risk, scenarios and insurance 69
Table 3.1. Changes in global temperature (�C) and atmospheric carbon dioxide concentration(parts per million or ppm) for the 2080s period (2071–2100 average) for the four UKCIPscenarios. The carbon dioxide concentration in 2001 was about 370 ppm
SRES emissions UKCIP02 climate Increase in Atmospheric CO2
scenario change scenario global concentration (ppm)temperature ( �C)
B1 Low Emissions 2.0 525B2 Medium Low Emissions 2.3 562A2 Medium High Emissions 3.3 715A1Fl High Emissions 3.9 810
Source: UKCIP02 Briefing Report ,3 p. 6
Roaf_Ch03.qxd 29/10/04 6:40 PM Page 69

the hot summer of 2003, the hottest on record for Europe, is asign that not only is climate change speeding up but ‘the parch-ing heat experience [in the summer of 2003] could be consistentwith a worst-case scenario [of global warming] that no one wantsto be true’. These are the words of Professor John Schnellnhuber,former scientific adviser to the German government and currenthead of the Tyndall Centre. He added: ‘What we are seeing isabsolutely unusual. We know that global warming is proceedingapace, but most of us were thinking that in 20–30 years time wewould see hot spells [like this]. But it is happening now.’9
THE INSURANCE INDUSTRY
One group that is taking climate change very seriously indeed isthe insurance industry, and their deliberations and decisions overthe coming years could put millions, who can no longer getinsurance for their homes, at the greatest economic risk of theirlives.
If the huge (US$1.5 trillion per year) fossil fuel industry is the only indus-trial lobby that actively engages in the climate battle, it is likely to prevailand progress in addressing the global climate dilemma will continue to stall.Few industries are capable of doing battle with the likes of the fossil fuellobby. But the insurance industry is. On a worldwide basis, the two are ofroughly comparable size – and potential political clout.10
As new risks emerge, insurance cover is either provided for themat increased premiums or excluded from existing policies, and thenumber of uninsurable buildings increases. Insurers in the USA
70 Adapting Buildings and Cities for Climate Change
0
5
10
15
20
Glo
bal
car
bo
em
issi
on
s (G
t/yr
)
25
30
40
35
0
5
10
15
20
25
30
40
35
2000 2020 2040 2060 2080 2100
A2
B2
B1
A1Fl
3.4.Global carbon emissions from2000 to 2100 for the four chosenSRES emissions scenarios withobserved data to 2000. (Source:UKCIP02 Briefing Report, p. 6)
Roaf_Ch03.qxd 29/10/04 6:40 PM Page 70

now typically require building owners to take out special policiesto cover the mould threat, described as the ‘new asbestos’ issuefor the industry. Although the UK and Australia have not followedthe United States in mould exclusion clauses yet, they may welldo so over time.11 Risks in the environment escalate because ofchanging conditions, building types and materials, chemicals, bio-logical threats and even trends in agriculture.12
The insurance industry itself is now at risk in this rapidly chang-ing risk environment. In 2003 the global insurance industry paidout more money over the year than ever before in history, andmade record profits! This is because premiums have been risingrapidly and across the board to pre-empt catastrophic payouts thatmay actually bring the industry to its knees. The fear is that ifallowance is made for a £15 billion event, from a terrorist or climate-related event, a £25 billion event will occur. The value ofthe buildings at the World Trade Center was $1.5 billion a towerbut the total costs of the event it is thought will eventually reach$50 billion. The cost of London flooding has been put anywherebetween £30 and £80 billion.
The year 2003 was the worst on record for payouts from theindustry. Munich Re’s annual bulletin13 was a sobering analysis ofnatural catastrophes in 2003 and concluded that economic andinsured losses continue to increase at a high level. The year 2003was marked by a series of severe natural hazard events, with thenumber of fatalities far exceeding the long-term average. It rein-forced the fact that in view of the deteriorating risk situation, theinsurance industry must continue to act rigorously – for example,by agreeing on limits of liability and risk-adequate premiums.
Highlights of the bulletin included:
● More than 50 000 people were killed in natural catastrophesworldwide, almost five times as many as in the previous year(11 000); such a high number of victims has only been recordedfour times since 1980. The heat wave in Europe and the earth-quake in Iran each claimed more than 20 000 lives.
● The number of natural catastrophes recorded in 2003 was around700 and thus at the same level as in the previous year.
● Economic losses rose to over $60 billion (2002: $55 billion).These were mainly the result of tornadoes, heat waves and for-est fires – but also severe floods in Asia and Europe.
● Insured losses increased to about $15 billion (previous year:$11.5 billion). The series of tornadoes in the Midwest of theUnited States in May alone cost insurers more than $3 billion.
The year 2003 was marked not only by natural catastrophes but also by other remarkable events: the power outages in the
Risk, scenarios and insurance 71
Roaf_Ch03.qxd 29/10/04 6:40 PM Page 71

United States, the United Kingdom, Denmark and Italy, for example;total losses involving two satellites; numerous terrorist attacks; amajor leak of poison gas in China shortly before the end of the year.
72 Adapting Buildings and Cities for Climate Change
Windstorms:
● Hailstorms hit the US MidWest in April and May: cost insuredlosses of $5 billion.
● Tornadoes in May in the United States cost over $3 billion (one ofthe ten most costly storms in insurance history).
● Hurricane Isabel, in the second half of September, swept over theUS East Coast and devastated more than 360 000 homes with aneconomic loss of around $5 billion, of which $1.7 billion was insured.
● Europe suffered comparatively little damage from windstorms,with economic losses of around $1 billion and insured losses of$300 million.
Heat waves:
● Germany alone recorded temperatures from June to Augustcorresponding to a 450-year event in climatological terms.Predictions are that if the atmosphere continues to warm upunchecked, such a heat wave could become a mere twenty-yearevent by 2020 in large areas of western and central Europe andlarge parts of the western Mediterranean region.
● Costs: approx. $13 billion, an extremely large amount, but theburden imposed on insurers by, for example, drought-relatedlosses is relatively small because reduced yields in theagricultural sector as a result of dry weather are mostly not yetcovered for insurance within the European Union.
Wild fires:
● In Australia, southwest Europe, Canada and the United Statesfires swept through whole region. In October and Novemberalone, thousands of homes fell victim to the flames in California.
● Costs: $2 billion for the insurance industry, representing almost60% of the economic losses.
Floods:
● In China, the swollen waters of the Huai and Yangtze flooded650 000 homes and caused an economic loss of almost $8 billion.
● Southern France was under water in many parts at the beginningof December, when numerous rivers, including the Rhône,flooded their banks after extreme rainfall.
● Costs: insured losses $1 billion and economic losses of around$1.5 billion.
Box 3.1 2003 Insurance Industry Payouts Related to Climate
Roaf_Ch03.qxd 29/10/04 6:40 PM Page 72
However, the extent of the losses caused by these events wasmuch smaller than that caused by the natural catastrophes andthey claimed fewer lives. Munich Re found that while windstormsand severe weather in 2003 accounted for only about a third ofthe approximately 700 events recorded, they were responsible for75% of all the insured losses caused by natural catastrophes.
Insurance companies, virtually without exception, are convincedthat the increasingly severe weather-related events are linked tochanges in climate generating new types of weather risks and threat-ening greater losses. The insurance industry is preparing itself forincreasing risks and losses, but the call is now for ‘above all, trans-parency and a limitation of the risks’. This is not an easy prospect,as it does not just mean putting up premiums and making moreprofits but also, for instance, informing one home or office blockowner in London that they will flood if the Thames Barrier overtops,while the one at the other end of the street will not. Today theyare both charged the same rate to insure their office or house, asthe risks are spread across the portfolio. Building owners are notinformed that they are vulnerable to such events, or for instancedam breakage, or increasingly to litigation from building owners andoccupiers on properties that become too uncomfortable in hotweather. The impact on property prices and insurability, when suchinformation does become available in an increasingly ‘transparent’market place, could be profound.
The insurance industry – viability
The insurance industry has the skills to provide the assessment, quan-tification and mapping of risks, prompt disaster recovery, fraud control,avoidance of duplicate administration and the access to internationalfinancial resources. It can thus contribute considerably to an efficientrisk management system. The insurance industry also provides strongfinancial incentives for loss prevention and mitigation to their clients andthe public, for example by means of deductibles. (United NationsEnvironment Programme Insurance Industry Initiative paper on the KyotoProtocol)14
The concerns of many insurers are not just about the uncertaintiesaround the increase in the frequency and severity of storms andfloods which could cause problems, but also the implications ofchanging responses and attitudes of governments and corporateclients. The activities of pressure groups and concerns of individualconsumers are also very important and will increasingly affect insur-ers’ strategies.
For many years insurers have accepted risks with surprisinglylimited information about the natural hazards that impact so much
Risk, scenarios and insurance 73
Roaf_Ch03.qxd 29/10/04 6:40 PM Page 73

on their claims costs. Increases in the frequency and severity ofnatural disasters and concerns about the effects of climate changeare resulting in a new and healthy dialogue developing betweenthe research community and the insurance industry.
In 1994, a study group set up by the Society of Fellows of theChartered Insurance Institute published a very significant report enti-tled ‘The Impact of Changing Weather Patterns on PropertyInsurance’. For the first time, there was a comprehensive analysisof the potential effects of climate change on the UK insurance indus-try. This study was followed by an update of that report in 200115
and by a range of widely available reports from different perspec-tives.16 These reports raised questions about whether insurers wouldbe able to continue to provide flood cover in the UK in the light ofclimate change.
Flood is not the only issue, of course; other perils could causeproblems for insurers. In particular, buildings will be vulnerable tostorm and subsidence damage and damage caused by driving rain,and research by the Building Research Establishment using insur-ance claims data has resulted in recommendations that buildingstandards should be reviewed in the light of climate changeimpacts.17 Both the Office of the Deputy Prime Minister (ODPM)and the Scottish Executive need to urgently consider and imple-ment changes to building standards as a result.
In June 2000 the Royal Commission Report on EnvironmentalPollution was published18 shortly followed by the World DisastersReport 2000 from the International Federation of Red Cross andRed Crescent Societies. Both these reports have re-emphasizedthe need for action to mitigate climate change and to adapt to itsimpacts, and will put renewed pressure on governments and insur-ers to take firm action.
How big is the problem? Average annual insured losses fromglobal natural disasters have increased from $0.6 billion in the 1960sto $9.8 billion in the 1990s (all at 1998 values).19 Such increases inthe costs of natural disasters are not necessarily due to climatechange. As Munich Re point out, they are due to a combination offactors such as population growth, rising standards of living, con-centration of population in urban areas, settlement in hazardousareas, vulnerability of modern societies and technologies, as wellas changes in climate and environment. The point is that in thefuture, climate change is likely to accelerate the rate of increase inthe losses.
Of all the causes listed above, the future impacts of climatechange are the hardest to predict. It seems clear now that globalmean temperatures are rising and that sea levels will continue torise, but how will this affect claims experienced? In the UK the
74 Adapting Buildings and Cities for Climate Change
Roaf_Ch03.qxd 29/10/04 6:40 PM Page 74

experts predict that there will be more droughts and subsidence,but also more coastal flooding in the Southeast and more river anddrainage flooding everywhere. While it is not yet clear if there willbe more frequent and more severe storms, there is increasing evi-dence to suggest that storm tracks will move south. This will meanmore severe storms in the south of England where constructionstandards are lower than in the north, where storms have tradi-tionally been more frequent. This will lead to higher damage levelsand claims problems for insurers.20
In the past, historic claims experienced were a good measurefor predicting future risk. The increases in numbers and costs ofnatural disasters indicate the need for a new approach to under-writing. Insurers are therefore investing heavily in geographic infor-mation systems, detailed databases, and sophisticated modellingtechniques to fine tune their underwriting.
In addition to traditional risk management skills, insurers willincreasingly find the need to work with academia and government,and this process has already started. Insurers are uniquely placedto contribute to society’s efforts to reduce the impact of natural
Risk, scenarios and insurance 75
3.5.Imagine being in a metal car with the windows shut on a hot day, with no airconditioning and not being able to park in the shade! Edward Mazria’s diagram showshow passive solar heating works as well as the greenhouse effect, because, as withglass, the re-radiated heat cannot pass back out through the upper atmosphere whichis why the world is warming. Being stuck in a glass and steel building with no openingwindows would be rather like that when the electricity fails – impossible to occupy.And yet insurers demand the same premiums for such offices as they would for low,naturally ventilated, well-shaded buildings, if they are in the same post code area.As the world warms anomalies like this in premiums will be questioned. (Source:Edward Mazria (1979) The Passive Solar Energy Book. Emmaus, PA: Rodale Press)
Roaf_Ch03.qxd 29/10/04 6:40 PM Page 75

disasters, but they will have to learn new skills if their contribu-tion is to be effective. Insurers will need to continue to work toimprove their understanding of science and the built environment.They need to measure and manage their exposures, and reducethe vulnerability of the assets they insure if they are to be able tocontinue to write business at the premium levels people are pre-pared to pay. The issue of availability and affordability of insurancewill become much more important, with possible threats of gov-ernment intervention should an ‘insurance underclass’ develop.
If the climate is changing as rapidly as some of the latest sce-narios suggest, it could present one of the biggest potential threatsfaced by insurers over the next 20 years and beyond. It could alsopresent some of the biggest opportunities. Not just new businessopportunities, but opportunities for a new spirit of dialogue andcooperation between insurers, governments and the researchcommunity.
As public concern about greenhouse gas emissions and pollut-ing industries increases, so insurers can expect pressure groups todemand that insurers use their power in the stock market to influ-ence the policies of the companies they invest in. After all, theinsurance industry, especially its pension funds business, controlssome 30% of all the stocks and equities in the world’s stockexchanges. The United Nations Environment Programme’s InsuranceIndustry Initiative is an imaginative way for insurers around theworld to work together and to demonstrate their commitment tocorporate responsibility.
The UK is changing rapidly and over the next 20 years there willbe major demographic, social and economic changes. Governmentand business are increasingly turning to scenario planning to developtheir long-term strategies.
The insurer can reduce the risk of flood claims by reducing thenumber of flood plain properties it insures. It is estimated that inEngland and Wales, there are some 1.3 million homes in floodplains. This is not surprising, given the tendency to want to buildnear river crossings, or along transport corridors, such as river val-leys. What should be of great concern to insurers is that this num-ber is still increasing, despite improved knowledge of the hazard.The reason lies in the way the planning systems operate.
The UK Environment Transport and Regional Affairs SelectCommittee on Climate Change, in their report published in March2000, stated that ‘there is evidence that climate change concernshave not been fully incorporated into current planning practices’(section 8.8) and further stated:
We urge the Government to continue researching the impacts of climatechange and to use this to develop a strategy for adaptation. We note the
76 Adapting Buildings and Cities for Climate Change
Roaf_Ch03.qxd 29/10/04 6:40 PM Page 76

start made on this in the Draft Programme. If future costs are to beminimized, it is critical that changes are made in some policy areas, forexample land use planning in coastal areas and flood plains.
Managing risk
To reduce the risk, it is only necessary to reduce one of the sidesof the risk triangle (Figure 3.1), but it is obviously better to try toreduce all three. Dr A. Dlugolecki has developed what he callsan ‘Integrated Property Damage System’21 in which he shows thatas the risk increases, insurers move from a ‘passive system’ ofsimply paying for the damage. First, they progress to a ‘reactive’system and then evolve into a ‘planning’ system. In other words,as the risk increases, insurers begin to act collectively to feed backinformation to the other components of the economic system, andif the risk becomes severe enough, insurers will insist on riskmitigation or will reduce their exposure.
There are clear signs that the UK market is beginning to movefrom a passive system to a reactive system, with UK insurers start-ing to work together to collect information and commission research.In the United States, however, largely as a result of Hurricane Andrew
Risk, scenarios and insurance 77
3.6.The Pompidou Centre in Paris was designed by Renzo Piano, Richard Rogers andGianfranco Franchini for a design competition in 1970. Construction started in 1972,cost 993 million francs, and the building was opened in 1977. Nineteen years later in1996 the building closed for four years for a total refurbishment, for which the finalbill was a further 576 million francs (one pound sterling is worth 9.44 francs at early2004 exchange rates) (see: www.centrepompidou.fr). Offices pay the sameinsurance premiums regardless of their day to day maintenance or long-termrefurbishment requirements. (Source: Sue Roaf)
Roaf_Ch03.qxd 29/10/04 6:40 PM Page 77
in 1992, the industry is already beginning to move into a ‘planning’system.
Not all risks are insurable, of course, and risk aversion is one ofthe main driving forces for disaster mitigation, and one of the mainhindrances for investment.22 If insurers are not prepared to acceptthe risk of, say, a new factory to be built in a flood plain, then thedeveloper is unlikely to proceed.
Will the insurance industry be able to weather the storms ahead?Will it have enough capacity for the claims costs that could arise?The answer is almost certainly ‘yes’, at least for the time being.If anything, the insurance industry has recently been suffering fromtoo much capacity, and during the late 1990s this kept premiumslow; not only insurers but reinsurers were cutting premiums forsome years. This was happening around the world; premium rateswere going down while exposure values were going up. This isnothing new for insurers who are used to ‘the underwriting cycle’ –in times of profit, capital is attracted into the industry, capacityincreases and, according to the laws of supply and demand, pricefalls until losses result in a reduction of capacity as weaker insur-ers drop out. The influx of capital was restricted to some extentby the barriers to entry in the insurance industry created by reg-ulations such as the need for government authorization and a goodsolvency margin.
There are four major differences now:
1 There has been a general move towards deregulation of rates,especially in Japan and continental Europe, which has led tostrong price competition.
2 The growth of the securitization market in the 1990s makes iteasier for capital to flow into the market if the returns are goodenough. This means that as soon as premiums start to rise,capital immediately starts flowing into insurance bonds, thusdriving premiums down again.
3 Previous cycles have been against the background of continuousgrowth in demand for insurance as society becomes wealthier.In the 1990s, multinational corporations have increasingly decidednot to insure at all because for them it is just ‘pound swapping’over time, and the exchange rate is not favourable.
4 Last, but certainly not least, in the past, strong insurers couldride out bad times by realizing capital gains on investments,thanks to a healthy stock market. The stock market is anythingbut healthy at present, and there is no longer the cushion ofinvestment profits.
Catastrophes are normally good for insurance business; they resultin increased demand for insurance and make it easier for insurers
78 Adapting Buildings and Cities for Climate Change
Roaf_Ch03.qxd 29/10/04 6:40 PM Page 78

to carry rate increases. Capacity has not been a problem right upto quite recently. The market was confident even in 1999 that thecombination of another Northridge earthquake, another HurricaneAndrew and another 1987 style stock market crash would still notwipe out over-capacity in the industry.23 Since then we have hadthe terrorism attack on the World Trade Center and confidence hastaken a nosedive.
CONCLUSIONS
It is certainly clear that a new era of insurance is starting. In animportant paper published by the Royal Geographical Society,Professor Clark has pointed out that insurance can have an impor-tant role to play in managing flood risks.24 It offers much neededsupport to accelerate economic and social recovery following adisaster, but with pricing policies or restrictions on availability of cover,could discourage new development in flood plains. As insurersobtain access to better data, so the uncertainty of the identifica-tion of high hazard areas reduces and these areas become lessinsurable. Clark supports a closer relationship between insurers andplanners, and refers favourably to the Scottish planning systemwhere an insurance expert is consulted by the planning authoritieson land use strategies.
In the long run, the price of insurance should reflect the degreeof risk. If insurers are unsuccessful in managing risk through con-trolling exposure and vulnerability, rising hazard will mean increasedrisk, which means increased pricing or less cover. At a micro level,insurers will become increasingly selective, using GIS technologyand stiffer price discrimination based on differences in exposure andvulnerability. For example: lower ‘premium’ incentives for buildingsbuilt to higher standards and inspected at each stage of construc-tion; higher premiums for buildings that are more vulnerable to ter-rorist attack being ‘target’ buildings by dint of their form, locationor construction; higher premiums for climate-vulnerable buildings thatare more exposed to wind, flood and excessive heat gain from solarradiation, such as those that rise above the urban ‘canopy’ of a city,are located on the flood plain or that are over-glazed.
The irregularity of extreme events makes it hard to assess theprobability of loss for any one year, and if the frequency is chang-ing then traditional actuarial methods may be of little help. In sucha situation, there will be pressures for a conservative approach tounderwriting; the ‘when in doubt, throw it out’ syndrome will becomemore common for high hazard, high exposure or high vulnerabilitycases. On the other hand, if the industry takes this approach toofar, there will be social and political pressures and the ultimatethreat of nationalization. The behaviour of the insurance industry
Risk, scenarios and insurance 79
Roaf_Ch03.qxd 29/10/04 6:40 PM Page 79

over the coming years will provide a litmus paper for us all, of therate of growth of the climate change hazard.
We are all at risk from the impacts of the changing climate. Ourvulnerability to it will depend on the infrastructure of our lives, thebuildings we live in and the investments we make. Our exposureto that risk will depend on where that infrastructure is in relation tothe hazards perpetrated on us by the changing climate. In order tojudiciously plan to minimize risk to ourselves we need to know moreabout the scale of the climate hazard that may affect us, and it isthose hazards that are explained in the following chapters.
NOTES AND REFERENCES
1 There are many different definitions of what risk is and for afuller discussion of climate change and risk see http://www.ukcip.org.uk/risk_uncert/main_risk_uncert.htm/.
2 See Crichton, D.C. (2001) The Implications of Climate Changefor the Insurance Industry (ed. J. Salt). Watford: BuildingResearch Establishment.
3 For a full outline of the UK Climate Impacts Programme (UKCIP)work on current and future climates see http://www.ukcip.org.uk/publications/pub.html including: Hulme, M.J., Turnpenny,J. and Jenkins, G. (2002) Climate Change Scenarios for theUnited Kingdom: The UKCIP02 Briefing Report. Published inconjunction with UKCIP, the Hadley Centre and the ClimateResearch Unit in the School of Environmental Science at theUniversity of East Anglia, by the Tyndall Centre, Norwich; Hulme,M., Jenkins, G., Lu, X., Turnpenny, J., Mitchell, T., Jones, R.,Lowe, J., Murphy, J., Hassell, D., Boorman, P., McDonald, R.and Hill, S. (2002) Climate Change Scenarios for the UnitedKingdom: The UKCIP02 Scientific Report, Appendix 2 publishedin conjunction with UKCIP, the Hadley Centre and the ClimateResearch Unit in the School of Environmental Science at theUniversity of East Anglia, by the Tyndall Centre, Norwich.
For information concerning local climate impacts contact theHadley Centre on www.meto.gov.uk/research/hadleycentre orfor detailed information on flood risks contact The EnvironmentAgency on http://www.environment-agency.gov.uk/contactus/?lang � _e. For data sets for future climates for use in build-ing performance simulations, contact the Chartered Instituteof Building Service Engineers and ask to be put in contactwith their climate data group or via: http://www.cibse.org.
4 http://www.ukcip.org.uk/scenarios/index.html.
5 Details of Foresight can be obtained from http://www.foresight.gov.uk/.
80 Adapting Buildings and Cities for Climate Change
Roaf_Ch03.qxd 29/10/04 6:40 PM Page 80

6 RCEP (2000) Energy – the Changing Climate: Summary of theRoyal Commission on Environmental Pollution’s Report.London: HMSO. A full copy of the report can be downloadedfrom: http://www.rcep.org.uk/energy.html.
7 See http://www.cru.uea.ac.uk/~mikeh/research/usa.pdf and http://www.cru.uea.ac.uk/~mikeh/research/australia.pdf, respectively.
8 Good starting points for researching future climates are thesites of the International Panel on Climate Change (IPCC) onhttp://www.ipcc.ch/ and related sites: ftp://ftp.ecn.nl/pub/bs/OpenProcess/gridded_emissions/ and http://sres.ciesin.org/ andhttp://www.grida.no/climate/ipcc/emission/index.htm. For a fulloutline of the limits to future emissions set under InternationalTreaties see the site of the United Nations Framework Conventionon Climate Change since its inception: http://unfccc.int/. The UKgovernment climate change research is co-ordinated by theHadley Centre on: www.meto.gov.uk/research/hadleycentre.A full UK greenhouse gas inventory 1990–2000 is available at:www.aeat.co.uk/netcen/airqual/reports/ghg/ghg3.html. And anexcellent introductory site is that of the Climate Research Unitof the University of East Anglia on: http://www.cru.uea.ac.uk/.
9 http://www.greenpeace.org.au/features/features_details.html?site_id�45&news_id�1147.
10 www.aag.org/HDGC/www/hazards/supporting/supmat2-4.doc.
11 http://www.aar.com.au/pubs/prod/recall2mar03.htm#Insur.
12 Guardian, 8 October 2003, p. 6.
13 http://www.munichre.com.
14 Knoepfel, I., Salt, J. Bode, A. and Jacobi, W. (1999) The KyotoProtocol and Beyond: Potential Implications for the InsuranceIndustry. UNEP Insurance Industry Initiative for the Environment.
15 Dlugolecki, A., Agnew, M., Cooper, M., Crichton, D., Kelly, N.,Loster, T., Radevsky, R., Salt, J., Viner, D., Walden, J. and Walker,T. (2001) Climate Change and Insurance. London: CharteredInsurance Institute Research Report (available on www.cii.co.uk).
16 See Crichton, D. (2003) Flood Risk and Insurance in Englandand Wales: Are There Lessons to be Learnt from Scotland?Technical Paper Number 1, Benfield Hazard Research Centre,University College London. A range of other papers is availablefor free downloading from: www.benfieldhrc.org/SiteRoot/activities/tech_papers/flood_report.pdf. See also RICS WorkingParty (2001) Flooding: Issues of Concern to Chartered Surveyors.London: RICS.
17 See Building Research Establishment (BRE) (2003) Assessmentof the Cost and Effect on Future Claims of Installing Flood
Risk, scenarios and insurance 81
Roaf_Ch03.qxd 29/10/04 6:40 PM Page 81

Damage Resistant Measures. Commissioned and published bythe Association of British Insurers, London, May 2003. Availablefrom http://www.abi.org.uk/Display/File/78/Flood_Resistance_report.pdf. See also Scottish Executive (2002) ImprovingBuilding Standards: Proposals. Edinburgh: Scottish Executive(available from www.scotland.gov.uk).
18 http://www.rcep.org.uk/energy.html.
19 http://www.munichre.com. See Munich Re, Topics 2000,Published January 2000.
20 See Crichton, D. (1998) Flood Appraisal Groups, NPPG 7, andInsurance, in Faichney, D. and Cranston, M. (eds), Proceedingsof the ‘Flood Issues in Scotland’ Seminar held in Perth inDecember 1998. Scottish Environment Protection Agency,Stirling, Scotland, pp. 37–40; and see Crichton, D. (1999) UKClimate Change Programme. UK Insurance Industry. Minutes ofEvidence to the Select Committee on Environment, Transportand Regional Affairs. 25 March 1999 (http://www.publications.parliament.uk/pa/cm199899/cmselect/cmenvtra/171/9832410.htm); also Davis, I., personal communication; and Crichton, D.(2003). ‘Floods, who should pay? Lessons for Central Europe.’Proceedings of a conference on 7 March 2003 on EuropeanFlood Risk, Benfield Greig Hazard Research Centre at UniversityCollege London.
21 Dlugolecki, A. (1998) ‘Overview of Insurance System re ExtremeEvents’, paper presented at the IPCC Workshop in Toronto,Canada, April/May 1998.
22 Kok, M., Vrijling, J., Van Gelder, P. and Vogelsang, M. (2002) Riskof flooding and insurance in The Netherlands, in Flood Defence2002 (Proceedings of the 2nd International Symposium on FloodDefence), eds Baosheng Wu et al. New York: Science Press.
23 The Economist, 16 January 1999.
24 Clark, M. (1998) Flood Insurance as a Management Strategy forUK Coastal Resilience, The Geographical Journal, 164, no 3,pp. 333–43.
82 Adapting Buildings and Cities for Climate Change
Roaf_Ch03.qxd 29/10/04 6:40 PM Page 82

On 16 December 2003 the World Meteorological Office in Genevaissued a press release stating that 2003 was the third warmest yearon record globally.1 The warmest year on record remains 1998, whenthe global surface temperature hit �0.55 �C (�0.99 �F) above the1961–90 annual average. The second warmest year was 2002, whenthe global surface temperature was �0.48 �C (�0.864 �F) above the1961–90 baseline. The global surface temperature for 2003 wasaround �0.45 �C (�0.81 �F) above the 1961–90 annual average.
The press release catalogued a wide range of climate events thatare related to this warming world. It highlighted the fact that Europeexperienced the hottest summer on record during June, July andAugust 2003, when temperatures across parts of Europe were consis-tently 5 �C (9 �F) warmer than average for several months. Nation-wide seasonal temperatures were warmest on record in Germany,Switzerland, France and Spain. At many European locations, tem-peratures rose above 40 �C (104 �F).
In France, Italy, The Netherlands, Portugal, the United Kingdomand Spain, over 30 000 additional deaths were attributed to the heat.The death toll in England and Wales caused by record temperaturesin August was as high as 900.2 The death toll in France from the August 2003 two week heat wave was estimated at 11 435more people than usual in late August,3 but rose to over 15 000 inlater counts. The subject of why people die at high and low tem-peratures is covered in depth in the following chapter on thermalcomfort.
But heat has many strange health impacts, and perhaps thestrangest victim of the 2003 heat wave was the Manchester solic-itor who drove 250 miles from London to his home with his airconditioning on maximum and directed at his midge-bitten foot.After his toes went numb and one started to go black a doctor
4 HOW HOT WILL IT GET?
Roaf_Ch04.qxd 29/10/04 6:41 PM Page 83

diagnosed frost bite.4 Death by air conditioning has been recordedbefore for an aboriginal woman in Queensland who was hospi-talized in a ward with air conditioning and went into cold shockbecause she could not physiologically cope with the relatively lowtemperatures in the ward. At the other end of such ‘cooling’ sys-tems people have also been known to faint when passing theoutlets of air conditioning systems on a street in the heat.
HOW HOT WILL IT GET IN TEMPERATE BRITAIN?
According to publications by the UK Climate Impacts Programme(UKCIP) average annual temperatures across the UK may risebetween 2 and 3.5 �C by the 2080s, depending on the scenario.In general there will be greater warming in the Southeast than theNorthwest and there may be more warming in summer and autumnthan in winter and spring, a prediction that seems to have beenleant credence by the hot summer and warm autumn of 2003.5
Under the High Emissions scenario, the Southeast may be up toan astonishing 5 �C warmer in the summer by the 2080s. During thelast Ice Age, only 10 000 years ago, temperatures were only justover 3 �C colder than today so who knows what such predictions for
84 Adapting Buildings and Cities for Climate Change
Temperature anomaly (°C)
–10 –5 0 5 10
4.1.Image showing the differences indaytime land surfacetemperatures between July 2001and July 2003 compiled by datacollected by the ModerateResolution ImagingSpectroradiometer (MODIS) onNASA’s Terra satellite.(Source: Reto Stockli and RobertSimmon, NASA EarthObservatory Team, based upondata provided by the MODISLand Science team)
Roaf_Ch04.qxd 29/10/04 6:41 PM Page 84

4.2.Changes in average annual,winter and summer temperaturefor the 2020s, 2050s and 2080sfor the Low Emissions and HighEmissions scenarios showingthat the Southeast of England willget very hot indeed by 2080under Low and High scenarios.(Source: UKCIP02 ClimateChange Scenarios, funded byDEFRA, produced by Tyndall andHadley Centres for UKCIP)For a review of how suchscenarios are developed seehttp://books.elsevier.com/companions/0750659114.
How hot will it get? 85
9W 6W 3W2020s
3E0 9W 6W 3W2050s
3E0 9W 6W 3W2080s
3E
60N Meantemperature
change57N
54N
51N
60N
57N
54N
51N
60N
57N
54N
51N4.5
4
3.5
3
2.5
2
1.5
0.5
1
60NAnnual
Winter
Summer
57N
54N
51N
60N
deg C
57N
54N
51N
60N
57N
54N
51N
60N
57N
54N
51N
60N
57N
54N
51N
60N
57N
54N
51N
60N
57N
54N
51N
60N
57NHighemissions
Lowemissions
Highemissions
Changes withinnatural variability
Lowemissions
Highemissions
Lowemissions
54N
51N
60N
57N
54N
51N
0
9W 6W 3W 3E0 9W 6W 3W 3E0 9W 6W 3W 3E09W 6W 3W 3E0 9W 6W 3W 3E0 9W 6W 3W 3E0
9W 6W 3W 3E0 9W 6W 3W 3E0 9W 6W 3W 3E09W 6W 3W 3E0 9W 6W 3W 3E0 9W 6W 3W 3E0
9W 6W 3W 3E0 9W 6W 3W 3E0 9W 6W 3W 3E0
future climates hold in store for our children and grandchildren interms of actual climate extremes.
These are average figures and the mean maximum temperatureswill be far higher. Figure 4.3 shows four different localities, repre-senting four different climatic regions in the UK, and the graphs
Roaf_Ch04.qxd 29/10/04 6:41 PM Page 85

show that on any given day, the daily maximum temperature willexceed a certain value. For example, the Berkshire graph shows that,under the Medium High Emissions scenario, there is around a 5%probability that, in the 2080s, the area will experience a summermaximum temperature of above 35 �C and a 1% probability that itwill go over 40 �C. These maximum temperatures are simulated by
86 Adapting Buildings and Cities for Climate Change
4.3.The probability of a given daily maximum temperature in summer (dashed ) and winter (solid ) being exceeded on anygiven day. Dark grey � present climate; red � the Medium High Emissions scenario for the 2080s. This shows that inBerkshire even temperatures of 40 �C may be exceeded by 2080 under the Medium High scenario. (Source: UKCIP02Climate Change Scenarios, funded by DEFRA, produced by Tyndall and Hadley Centres for UKCIP)
100
10
10
Pro
bab
ility
(%
)
20Daily maximum temperature (deg C)
30 40
10 20 30 40
1
100
10
1
County Down
100
10
10
Pro
bab
ility
(%
)
20Daily maximum temperature (deg C)
30 40
10 20 30 40
1
100
10
1
Inverness-shire
100
10
10
Pro
bab
ility
(%
)
20
Daily maximum temperature (deg C)
30 40
10 20 30 40
1
100
10
1
Pembrokeshire
100
10
10P
rob
abili
ty (
%)20
Daily maximum temperature (deg C)
30 40
10 20 30 40
1
100
10
1
Berkshire
Roaf_Ch04.qxd 29/10/04 6:41 PM Page 86

the model for areas of 50 � 50 km in size. They are again lower thantemperatures that would be actually measured at a specific site.
The frequency of extreme hot spells will also increase, as shownin Table 4.1.
One clear pattern that has emerged is that the temperatures atnight over many land areas are increasing at about twice the rateof daytime temperatures, and as one reads through this book manydesigners will be flagging design-related issues. So, for example,warmer nights means that special care will have to be given to theenvironmental conditions in bedrooms. Another design problemrelates to west-facing rooms with windows facing the low west-ern sun when the ambient temperatures are at their highest in theafternoon so combining incoming sum with higher air temperatures.
A further consideration, that will considerably worsen future cli-mates, particularly in London, is that of the Urban Heat Islandeffect6 that makes the centres of heavily built-up areas warmerthan their hinterlands. Heat Islands are very much influenced by:
● The amount of building there is in a neighbourhood. This influ-ences how much heat they can store in a day, week, monthor season. It represents the thermal capacity of the area, ratherlike having more bricks in a storage radiator.
● How good a heat exchanger individual buildings are. Buildingslike the Barbican development in London make perfect exchang-ers, sticking up into the air with lots of fins and concrete bal-conies to absorb heat and lose it.
● The absorbtivity or reflectivity of buildings, which influenceshow much heat they take in and how much they reflect backto the sky or the building opposite.
● The streetscape and how easy it is to dissipate the heat fromthe city by wind. If all the streets are linked to roads that channel
How hot will it get? 87
Table 4.1. More and more years will be extremely hot over time.The table shows the percentage of years experiencing variousextreme seasonal anomalies across central England and Wales forthe Medium High Emissions scenario, with the anomalies shownrelative to the average 1961–90 climate
Anomaly 2020s 2050s 2080s
Mean temperatureA hot ‘1995-type’ August 3.4 �C warmer 1 20 63A warm ‘1999-type’ year 1.2 �C warmer 28 73 100
PrecipitationA dry ‘1995-type’ summer 37% drier 10 29 50A wet ‘1994/95-type’ winter 66% wetter 1 3 7
Source: UKCIP02 Briefing Report,5 p. 10
Roaf_Ch04.qxd 29/10/04 6:41 PM Page 87

the constant sea breezes, as in Naples, then heat can be regu-larly flushed out of the city. If the main streets impede the nat-ural flows of air, then heat will be trapped in the city.
● How densely the area is populated. More people, each pro-ducing around 50 to 100 watts of heat, also means moremachines and cars that give out heat.
The increases in temperature vary from region to region, but incities such as Athens it can be between 8 and 13 �C warmer insidethan outside the city. For London, in the centre of the city it canbe as much as 8 �C warmer than the surrounding countryside.The Heat Island is highly changeable, most pronounced at nightand weakening with increasing wind speed and distance from thecity centre; the location of the thermal maximum of the Heat Islandshifts with slight changes in wind direction. The number of nightswith intense Heat Islands (greater than 4 �C warmer than the sur-rounding countryside) has been climbing steadily since the 1950s.
The Heat Island effect may be influenced by the amount of cloudin the sky and simulations suggest large decreases in summercloud cover over the whole of the UK, but especially in the south.Reductions in cloud cover under the Low Emissions scenarios arearound 10% by 2080, but as large as 25% or more under the HighEmissions scenarios, which will make solar energy technologiesmore viable but also may exacerbate the Heat Island effect.
Cloud cover increases slightly in winter, by no more that 2–3%,over the whole country. Autumn and spring become sunnier, par-ticularly in the Southeast. In summer, solar radiation increases by10, 20 and even 30 Wm�2 over southern England, consistent withrainfall predictions and the increase in the predicted diurnal range
88 Adapting Buildings and Cities for Climate Change
1030
2
4
6
8
10
12
14
16
°C
104 105
Population
Max
imu
m h
eat
isla
nd
inte
nsi
ty
106 107
Othercountries
America
Europe
4.4.Comparison of the strength ofthe Heat Island effect betweenAmerican and European citiesshowing that the high rise, highlyserviced buildings of NorthAmerica generate significantlyhigher Heat Island temperaturesthan lower denser Europeancities. (Source: Littlefair, P. et al.(2000) Solar access, passivecooling and microclimate in thecity: the Polis Project. ACTESProceedings, Lyon, France, pp. 983–8)
Roaf_Ch04.qxd 29/10/04 6:41 PM Page 88

of the temperature. This was apparent in the summer of 2003where the mean Central England Temperature (CET) was 17.3 �Cover the summer, making it the fourth warmest summer periodon record. But the record for the highest maximum temperatureever recorded in the UK was broken on 10 August 2003 when38.5 �C (over 100 �F) was recorded at Brogdale, near Favershamin Kent. The CET between March and August was also the warmestMarch to August ever on record, at 1.73 �C above the long-termaverage.
Nights will warm more than days during the winter, and dayswarm more than nights during summer. It will stay warmer longerin summer, with up to 3–4 �C night time warming experienced,with a temperature that would now occur at 7.00 pm occurring at11.00 pm under the High Emissions scenario.
The temperature of the Heat Island experienced in London willalso be influenced by wind speeds, a factor that is influenced bypressure gradients across the country. The largest average windspeeds predicted, in the London’s Warming Technical Report, occuralong the coast, where between 4% and 10% increases in theaverage may be experienced in winter, but with smaller increasesin summer. This is one of the more difficult factors to predict usingcurrent models.
WHAT WILL THE EFFECT OF THIS BE?
The wide range of impacts outlined below is to give you an indi-cation of the variety and the extent of the influence of climatechange on the lives of individuals in their own homes, around theworld. Many of the issues raised link to points in other chaptersand demonstrate the interconnectivity of the buildings we live in,the metabolism of the planet at large and the social, political andeconomic environments we inhabit.
How hot will it get? 89
Max
inte
nsi
ty (
ten
ths
°C) 1961–1990
2050s2080s
50
55
60
65
70
75
80
85
90
Jan Feb Mar Apr May Jun Jul Aug Sep Oct Nov Dec
4.5.The Heat Island effect in London,showing that the increase innight time temperature exceedsthat in the day. (Source: R.L.Wilby, The Environment Agency)
Roaf_Ch04.qxd 29/10/04 6:41 PM Page 89

Heat discomfort can interrupt work
Although Britain was not the most exposed country in Europe tothe August 2003 heat wave, time is money, and even in temper-ate London businesses will have to increasingly look to reducetheir vulnerability to high temperatures in the workplace if suchsummers become commonplace. Offices that are vulnerable tohigh temperatures, such as highly glazed buildings, suffered verybadly in the heat wave of August 2003 and the Trade UnionCongress (TUC), in response to wide-scale 2003 heat discomfort,called for legal maximum temperatures for workplaces.
Current legislation sets a minimum temperature below which noone should have to work, at 16 �C or, where severe physical workis required, 13 �C. The TUC suggested a maximum working tem-perature of 30 �C, or 27 �C for those doing strenuous work. In Londonin 2003, even in more traditional offices temperatures were exceed-ing these limits. It was also suggested that more breaks and a morerelaxed dress code would help considerably. Chapter 5 argues thathumans actually adapt to a far wider range of temperatures in warmercountries and so over time these limits will widen.
One employment lawyer suggested that employers should thinktwice before sacking staff who walk out of their workplace becauseof the heat, as they may find themselves accused of unfair dis-missal. Workers can protect their work conditions by local negoti-ation covering the provision of air-cooling systems, shading forwindows and an adequate supply of drinkable water.7
Problems of poor internal climates are exacerbated by poor climatic design of buildings and their services. This was emphasizedby all the staff of the refurbished HM Treasury building in London(July 2003), who were sent home after lunch because the buildingwas simply too hot to occupy. It is unclear if this was the fault ofthe designer of the refurbishment, the service engineers or the con-struction firm that did not properly commission the air conditioningsystem, but as temperatures increase designers will have to learnhow to design and manage to avoid such over-heating.8 The needto put the building occupiers back into the equation of what makesan adequate building has made people more interested in the processof post occupancy evaluation of building performance to ensure thatlessons are properly learnt from such failures.9
Heat and health
A study by scientists at the World Health Organization in 2003,found that 160 000 people die every year from side-effects of globalwarming, such as increased rates of death resulting from a rangeof causes from malaria to malnutrition, predicting that the number
90 Adapting Buildings and Cities for Climate Change
Roaf_Ch04.qxd 29/10/04 6:41 PM Page 90

would double by 2020. Diseases spread by animals such as ratsand insects are more common in warmer climates and issues suchas the increasing scarcity of clean water with hotter dryer climateswill also play a major part in increasing deaths from illness andmalnutrition. In addition, the combination of increasing warmth andmore standing water resulting from storms creates conditions con-ducive to epidemics, such as those of malaria, by providing breed-ing grounds for the insects and speeding up the life cycle as aresult of the warmer conditions.10
Climate change will introduce three different types of healthimpact:
● Direct impacts through death and injury from heat waves,storms, floods and drought.
● Indirect impacts through the occurrence of health conditionsexacerbated by changing weather conditions, e.g. respiratorydiseases exacerbated by atmospheric pollution, or ensuing out-breaks of disease, such as typhoid, cholera etc., related to cli-mate events such as floods etc.
● Migratory impacts resulting from the movement of sourcesof infection resulting from the diaspora of diseases via variouscarriers with warming climates, e.g. malaria and trypanosoma.
The direct health impacts of climate change we see all around uson a regular basis, including deaths resulting from fires, floods anddrought.
Heat and cold stress are the main direct causes of death fromextremes of temperature and they are dealt with in Chapter 5 onthe human thermal response and Chapter 13 on energy and fuelsecurity issues.
The importance of shade for health
We can also see indirect impacts around us in the news as thechanging climate begins to impact on our lives and deaths. Theincreasing strength of solar radiation is also affecting even ‘rainy’Britain. In September 2003 the UK government issued a warningto local authorities to remove sunbeds from every leisure centrein the country amid accusations that they are profiting from treat-ments that endanger the health of the public. Members of theChartered Institute of Environmental Health, many of whom workfor local councils, raised the alarm because they believe thatsunbeds are contributing to the rise of the incidence of skin can-cer. Research published by the Journal of the National CancerInstitute in 2002 shows a strong link between tanning lamps andskin cancer. They called, in their 2003 annual conference, for theinclusion of ‘shade provision’ to become a requirement for all big
How hot will it get? 91
Roaf_Ch04.qxd 29/10/04 6:41 PM Page 91

planning developments. School playgrounds would be required toprovide children and teachers with shaded areas.11
Surprisingly, skin cancer is actually a major problem in the UKand exposure to ultra-violet rays and direct strong sunlight increasesthe risk of contracting skin cancer, by damaging the immune sys-tem and causing premature ageing of the skin. Skin cancer is nowthe second most common form of cancer in the UK. There are40 000 cases a year and the number of new cases annually roseby more than 90% in the 15 years between 1974 and 1989. Three-quarters of these result from malignant melanoma. Most skin can-cers are not life-threatening but must be promptly removedsurgically to avoid serious problems.
There are no published statistics available on how manymelanomas are linked to travel abroad, tanning lamps or are con-tracted due to exposure to the sun in the UK. Here again the com-bination of factors may place a crucial part, for instance holidaysin Spain, tanning at the health club, gardening in summer and over-exposure to direct sun in the workplace. In highly glazed buildingscare should be taken to ensure staff are not sitting in direct sunduring their working day.
Insect infestations impact on our buildings
Insect populations can explode in certain conditions, including par-ticular temperature bands. The smallest of animals can cause severeimpacts. When such infestations strike they spread very rapidly;when sudden oak death spread from Oregon and California toBritain, it spread to more than 280 sites within months in England.12
The same is true of moulds and fungi, which can have a devas-tating effect on people and buildings, as can termites, spreadingnorth from Devon even now with the warming weather, and mos-quitoes that are now found in parts of Kent. So such infestationsmay well affect our health, timber sources and the structures ofour buildings.
The SARS effect
It is the often combination of conditions that really makes for greatepidemics, as many found out on the troop ships in the First andSecond World Wars when thousands of weak and injured soldierswere crowded together in hot ships providing ideal breeding groundsfor a range of potent killers ranging from typhoid and cholera tothe impressively lethal stomach bugs.
In late October 2003, 430 people were stuck down with a chronicstomach complaint caused by the norovirus, or Norwalk-like virus
92 Adapting Buildings and Cities for Climate Change
Roaf_Ch04.qxd 29/10/04 6:41 PM Page 92

(NLV), on the cruise ship Aurora carrying 18 000 passengers and800 crew. There was talk at that time of a £2.5 million claim againstP&O, who operated the ocean liner, by some 250 of the infectedpassengers. Greece refused to let the liner dock in their watersto take onboard provisions and medical assistance. NLV is the mostcommon cause of stomach complaints in the UK, where 600 000to 1 million people suffer from it every year, particularly in schoolsand hospitals and where people are confined in close quarters.Similar viruses have disrupted other cruises.
Similarly, the incidences of Severe Acute Respiratory Syndrome(SARS), caught first from chickens, were concentrated in areas ofhigh density occupation, in hotels and high rise housing estates inHong Kong. SARS is caused by a coronavirus, a relative of thecommon cold, and was responsible for over 400 infections and200 deaths in Southeast Asia and Canada in 2003. It spreads veryrapidly and across large distances thanks to air travel, and is thoughtto spread primarily on droplets of water, through coughing andsneezing. Evidence from a large cluster of cases on a single hous-ing estate in Hong Kong suggests that it can be spread in build-ings, and in outdoor locations. Prevention measures for itstransmission included the wearing of face masks and the thoroughwashing of hands.13 With both the norovirus and the coronavirusthe higher density of a population in one area will significantlyincrease the risks of infection of that population in that area.
The outbreak of SARS had a major impact on eastern marketsin 2002. Economists cut the GDP forecast for Hong Kong aloneby 2.5% in the wake of the outbreak,14 while some estimate thatthe total costs may rise into billions rather than millions of dollarsas travellers simply did not want to visit the infected regions. Travelinsurers placed an exclusion zone on policies covering Canada,Hong Kong and China and warned people they would not be covered if they caught the infection.15
Such outbreaks, on land or sea, demonstrate the potentially huge and growing risks to life and economic welfare arising fromdensely populated buildings and cities, in combination with risingtemperatures.
Air pollution
Air pollution is already a growing health problem in many cities,including London, largely because of rising traffic levels, and willget worse in large urban areas under conditions of climate change.Recent studies show that relatively small rises in urban air pollu-tion can trigger an increased number of potentially fatal heart attacksin people with vulnerable arteries.
How hot will it get? 93
Roaf_Ch04.qxd 29/10/04 6:41 PM Page 93

During heat waves air quality reduces, and on 7 August 2003the UK government issued an official heath warning to asthmat-ics and the elderly, stating that air pollution in London had risento the highest level for a decade as record temperatures wererecorded in the capital. Air-quality monitors in Enfield recorded pol-lution levels of 131 parts per billion (ppb), almost three times thesafe limit set by the World Health Organization, as temperaturessoared over 35 �C.
Air quality in the UK in 2003 was the worst ever recorded, withthe worst place in Britain for air pollution being a stretch of London’sMarylebone Road, between Baker Street station and the MadameTussaud’s exhibition, which exceeded pollution guideline levels 48times in the first three months of 2003 and 11 times in 2002.16
Ozone levels also soared to 80–100 ppb in London at that time,while the highest levels ever recorded in Britain were 250 ppb inHarwell, Oxfordshire in 1976 before strict EU laws restricting vehi-cle emissions were introduced.17 However, there has been a grad-ual rise in the background levels of ozone in Europe since 1940.Government studies show that around 1600 people with breath-lessness problems die prematurely every year due to high levelsof air pollution and a further 1500, mostly asthma suffers, areadmitted to hospital because their symptoms become worse dur-ing periods of poor air quality.18
An increasingly significant factor in the past few years, particu-larly in Southeast Asia, has been the contribution to urban air pol-lution of smoke from large fires experienced in countries aroundthe globe, exacerbated by heat wave conditions.
Predicted future increases in the number and intensity of hot anti-cyclonic weather events in summer will favour the creation of moretemperature inversions trapping pollutants in the near-surface layerof the atmosphere. It is estimated that a 1 degree centigrade risein summer air temperatures will result in a 14% increase in surfaceozone concentrations in London.19
But the warming cocktail of atmospheric pollutants is being –incredibly – added to by the decisions of politicians who seem hellbent on worsening the already severe pollution problems we face.In August 2003, it was announced that, in the drive to meet theever-increasing demand in America for energy, around 50% of whichgoes to power buildings, the Bush Administration plans to open ahuge loophole in America’s air pollution laws allowing an estimated17 000 outdated power stations and factories to increase their car-bon emissions with immunity. Critics of the draft regulations unveiledby the US Environmental Protection Agency claimed they amountedto the death knell for the Clean Air Act, the centrepiece of USEnvironmental Regulations. The proposed new Regulations were
94 Adapting Buildings and Cities for Climate Change
Roaf_Ch04.qxd 29/10/04 6:41 PM Page 94

being challenged by 13 states, including New York, but if adoptedwould provide a multi-million dollar victory for US energy corpora-tions. Many of the objectors are particularly concerned about thehealth impacts of this loophole on the cities and populations in thevicinity of such plants.20
In Britain the Labour government has been very open about itsdesire to promote the interest of the aviation industry, with well-publicized plans for three major new airport developments overthe next decade, at the expense of the well-being of ordinary cit-izens, particularly in Southeast England.21 Cheap air travel has abread and circuses ring to it that appeals to politicians seeking re-election, but all political parties have possibly underestimated theintelligence of the local voters and their levels of knowledge onthe issues involved. A major concern of people who live near run-ways, after noise, are the serious health consequences of poor airquality resulting from increased plane activity overhead.
Passenger flights emit more than 8 million tonnes of carbondioxide every year in the UK, so playing a major part in climatechange. This figure is predicted to rise to 19 million tonnes by2030 if the airline industries are not checked, and ways to do thiswere the subject of a major review by the Department of Transportin 2003/4.22
Fuels burnt in aviation have a wide range of toxic emissions thatdirectly effect human health. Aviation emissions include nitrogenoxide, hydrocarbons, sulphur dioxide, naphthalene, benzene (a knowncarcinogen), formaldehyde (a suspected carcinogen) and dust parti-cles that harm human health and contribute to global warming. This‘poison circle’ can extend for 6 miles around a single runway andrun 20 miles downwind. Studies have linked airport pollution to can-cer, asthma, liver damage, lung disease, lymphoma, depression,myeloid leukaemia, and tumours.
The size of this problem is emphasized by the fact that today70% of US residents live within 20 miles of a major airport. In theUK the figures for people living within 30 miles of the four Londonairports must be fairly similar. Aircraft pollution has been implicatedin higher rates of child mortality, premature deaths and cancerdeaths in a number of reputable studies.23
In the UK air pollution, including that from aircraft and the sur-face traffic pollution associated with airports, is estimated to killup to 24 000 people every year and requires medical treatment forthousands more. The health costs of air pollution from the UK avi-ation sector are estimated at more than £1.3 billion a year.24 Aswith vehicular air pollution, the impacts of this pollution will beaccelerated with the higher temperatures that are associated withglobal warming. The traditional view that aviation is a ‘sacred cow’
How hot will it get? 95
Roaf_Ch04.qxd 29/10/04 6:41 PM Page 95

and should not be restricted by legislation because it may slowdown global economies, is now being questioned, as is the needfor more and more airports and air travel, which seems depend-ent also on oil prices remaining at their current costs.
What is sure is that increasingly warm summers will affect theair quality and in turn the quality of life of millions of citizens inBritain as the weather becomes hotter. Some engineers argue thatissues of air quality from transport, industrial and acid rain pollutionare a good reason to use air conditioning in buildings, but the mostdamaging of the fine particulates in air pollution are too small to beremoved by air conditioning filters, so invalidating this solution (moreof which in Chapter 10 on air conditioning).
Those who are interested in locating sources of air pollution inrelation to a particular site in the UK can enter a postcode on the‘What’s in your backyard’ feature on the Your Environment pageof the Environment Agency website; it will also show where pol-lution is being emitted from industrial sites and landfill sites.25
Waste
Increasing temperatures all year round will affect many aspects ofour lives. For instance, building, office, household and industrialwaste may increasingly become an issue with climate because of:
● greater outdoor odour problems associated with waste disposaldue to higher summer temperatures, and
● waste containment problems associated with heavy rains andfloods.
Possible need for more frequent waste collection in certain areasdue to high summer temperatures and more protection of, andcare in selection of, landfill sites may be necessary.
Two hundred thousand homes are close to landfill sites and werethought to be worth, on average £5,500 less because of the nui-sance caused by dust, noise, small vermin and water and air pol-lution caused by the neighbouring rubbish dumps. In the firstcomprehensive study of the effect of landfill sites on house pricesit was found that Scottish homes lost a staggering 41% of theirvalue if they were within a quarter of a mile of a site, while in theEast Midlands only a 10% reduction within a quarter of a mile and8.75% reduction within half a mile were recorded.26
Noise
With climate change, a wide range of physical and social adaptations in the population may well affect noise issues in cities.For example, with warmer outdoor temperatures, the growth of
96 Adapting Buildings and Cities for Climate Change
Roaf_Ch04.qxd 29/10/04 6:41 PM Page 96

the ‘café society’ may well increase street activity at all times ofyear in the streets of cities, and sensible pre-planning of openair eating facilities in relation to residential areas is necessary asthe warmer evenings may well pre-date the adaptation of popu-lations to higher street noise levels. Thought should also be givento the greater need to open windows in warmer weather andthe need to ensure that the noise and pollution impacts of streetlife and traffic noise do not encourage a move to the climatically unnecessary air conditioning of buildings. The increased need fortraffic-free zones in open restaurant areas of a city may becomea feature of future inner city planning strategies, to ensure thatlocal office buildings can be naturally ventilated without exces-sive noise levels. So noise and pollution should be increasinglyincluded as key concerns for urban designers and local councilsalike. Even fashionable buildings on sites with high noise and traf-fic pollution levels are problems, like the £13 million HammersmithArk building. It is two decades old, very elegant, with low rentsof £32 a square foot, but because of its noisy location on a traf-fic island, it has proved over those years virtually impossible torent out.27
Fires
Fire hazards are significantly increased with hotter dry seasons,that add to the frequency, and the intensity, of bush and forestfires, creating a greater hazard to life, limb and property. Such firesoccur generally in association with extreme dry periods, and strongwinds, as was the case with the Great Fire of London in 1666.28
Every month from November 1665 to September 1666 was dry. By August1666, the River Thames at Oxford was reduced to a ‘trickle’. The drynessextended to Scotland, at least from May to mid-July. The drought over thesetwo months is noteworthy because it preceded the Great Fire of London,and apparently the east wind, which prevailed during that period, had driedthe wooden houses of London until they were like tinder. When the firestarted on 12 September, the east wind drove the flames before it, caus-ing great problems with fire fighting and helping the fire to spread rapidly,causing smoke from the fire to reach as far as Oxford.
The prevailing weather was noted as ‘hot & dry’, and on thefirst day of the fire John Evelyn noted in his diary, a ‘Fierce’ east-ern wind in a very dry season. It is not clear though whether thewind was caused by the fire, or was there anyway. However,Evelyn did note that there had been a ‘long set of fair and warmweather’. On 14 September Evelyn noted: ‘The eastern wind stillmore impetuously driving the flames forward.’ On the 15th, henoted that the wind was ‘abating’, but this may have been due to
How hot will it get? 97
Roaf_Ch04.qxd 29/10/04 6:41 PM Page 97

the fire burning itself out. In any case, this was effectively the endof the Great Fire, and when the rains came on the 19th the firewas quenched and a rainy autumn followed, although Evelynclaimed that smoke could still be seen rising out of the odd base-ment six months after it ended.
In 2003 alone a number of catastrophic fires occurred aroundthe world, even in Britain:
● April, 2003: In Huddersfield, UK, hundreds of hectares of NationalTrust moorland were left charred by fires that swept throughthe tinder dry hills near the city.29
● July and August 2003: In Portugal, a national disaster wasdeclared as more than 2300 fire fighters tackled 72 blazes acrossthe country.30
● August, 2003: In Canada, 30 000 people had to flee theircommunities in the Okanagan Mountain Forest Fire, 185 mileseast of Vancouver, which had 100 m high flames moving at30 m a minute across the countryside, leaving at least 200homes as smouldering rubble in its wake. The fire began to‘crown’, moving rapidly from tree top to tree top, and was seento leap from building to building, some of which exploded inthe intense heat. The fire started on 16 August with a lightningstrike in the mountains.31
● September 2003: On the French Riviera, huge forest firesdestroyed over 1000 hectares of woods, following two devas-tating blazes in July that killed four people, including two Britons,and destroyed more than 18 000 hectares of pine and oak.32
● October 2003: The final death toll in the southern Californian firesof October 2003 rose to over 22, including some of the 12 000fire fighters who battled with the blazes. Estimated damage fromthe fires, covering over 275 hectares and destroying nearly 3000homes, could top £1.17 billion. Large fires also raged at the sametime in the south of Denver and near Jamestown, Colorado.33
The issue of what materials buildings are made of is an importantone. In countries such as the United States and Australia, wherebuildings are typically constructed of timber, or timber-based com-ponents, not only is more of the building destroyed during a fire,and the strong winds associated with it, but such buildings addfuel to the fire and intensify the event. Europe is extremely fortu-nate to have traditional building industries in which buildings havebeen largely constructed of heavy masonry and are less vulnerableto the catastrophic devastation experienced in many bush and for-est fires, where whole suburbs can ignite in fireballs as the timberhouses literally explode with the heat. In Britain, the medieval citieswere to a far larger extent made of timber-framed construction,
98 Adapting Buildings and Cities for Climate Change
Roaf_Ch04.qxd 29/10/04 6:41 PM Page 98
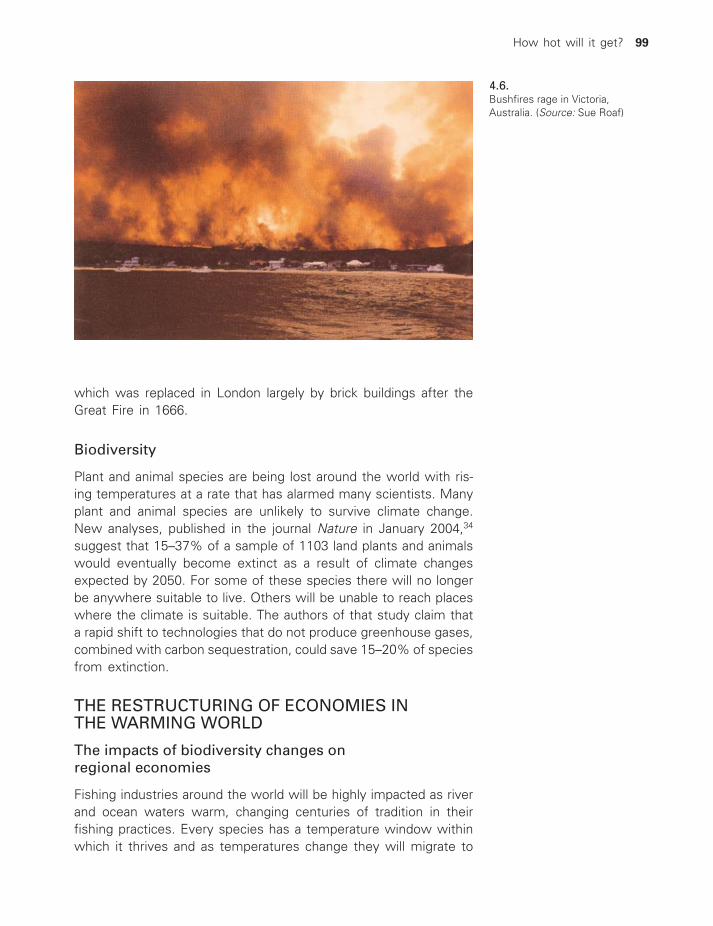
which was replaced in London largely by brick buildings after theGreat Fire in 1666.
Biodiversity
Plant and animal species are being lost around the world with ris-ing temperatures at a rate that has alarmed many scientists. Manyplant and animal species are unlikely to survive climate change.New analyses, published in the journal Nature in January 2004,34
suggest that 15–37% of a sample of 1103 land plants and animalswould eventually become extinct as a result of climate changesexpected by 2050. For some of these species there will no longerbe anywhere suitable to live. Others will be unable to reach placeswhere the climate is suitable. The authors of that study claim thata rapid shift to technologies that do not produce greenhouse gases,combined with carbon sequestration, could save 15–20% of speciesfrom extinction.
THE RESTRUCTURING OF ECONOMIES INTHE WARMING WORLD
The impacts of biodiversity changes onregional economies
Fishing industries around the world will be highly impacted as riverand ocean waters warm, changing centuries of tradition in theirfishing practices. Every species has a temperature window withinwhich it thrives and as temperatures change they will migrate to
How hot will it get? 99
4.6.Bushfires rage in Victoria,Australia. (Source: Sue Roaf)
Roaf_Ch04.qxd 29/10/04 6:41 PM Page 99

occupy their ‘survival’ temperatures. An extra 1 �C in temperaturepushed haddock, cod, plaice and lemon sole 200–400 miles north,according to the World Wildlife Fund. There have been more fre-quent sightings of species such as Hammerhead sharks, triggerfish, sun fish and even red mullet, cuttlefish and black bream inthe waters of the Isle of Man. Fishermen in Cornwall may haveto start breeding lobsters in captivity to prevent them from beingeaten by triggerfish when very young. Scuba divers regularly findoctopi along the south coast and Japanese oysters have also startedbreeding in British waters. These trends may well affect the eco-nomic welfare of the fishermen of Britain and the communitiesthey support.35
Even more catastrophic is what is predicted will happen to thecoral reefs of the world. More than 100 million people around theworld depend on reefs for their livelihoods. Corals are very tem-perature-sensitive and are dying over large areas as ocean waterswarm. In the El Niño year of 1998 unusually high temperatures inthe India Ocean killed more than 90% of the corals on shallowIndian Ocean reefs and future high temperatures could finish thereefs off completely. Sixteen per cent of all coral reefs globallywere calculated to have been destroyed but the worst affectedwere those in the Indian Ocean. The corals that died were up to100 years old and would take centuries to recover if sea temper-atures stabilized at the current levels. It is predicted that the highertemperatures may be reached every 5 years now and for the lat-itudes 10 to 15 degrees south, by 2020 all corals species may wellbe extinct.36
The economic costs of such extinctions are enormous. To com-bat such devastation legislation has just been introduced to maketwo-thirds of the Great Barrier Reef, off the east coast of Australia,into a protected area under conservation plans announced by theAustralian government in December 2002, forming the largest net-work of protected marine areas in the world. Strong opposition wasbrought by the Queensland fishing industry where it was estimatedthat 250 jobs would be lost. Fishing on the reef generates onlyaround £46 million while tourism in the region is worth £1.7 billion.
In May 2003, Hamdallah Zedan, Secretary to the Convention onBiological Diversity,37 ratified by 187 Nations, said that at the EarthSummit at Johannesburg it had been recognized that our healthand our lives depend on biodiversity and that:
The millions of species on earth have evolved complex interactions thatallow for their mutual survival. Man has disrupted this at such a rate thatnature can no longer adapt. Scientists agree that the incidences of plaguesand pandemics will increase as we battle to find ways of controlling thesehuman health challenges.
100 Adapting Buildings and Cities for Climate Change
Roaf_Ch04.qxd 29/10/04 6:41 PM Page 100

Wolves at the gates of the city?
But animals are very ingenious, and even as one ecological nichecloses, another may open up. The significance of a range of fac-tors may influence how animals behave in a changing climate.Already we have the phenomenon of wild animals becomingadapted to live in cities, as was clearly outlined in David Baron’sbook on ‘the beast in the garden’.38 He cites cases of bears mov-ing into New Jersey suburbs, raccoons in Los Angeles and in theUK the urban fox is a common occurrence. The animals are drawnto feed off rubbish bins, a particular problem in the States, where,because of ‘urban sprawl’, the suburbs are moving into what waswilderness. Animal numbers have risen owing to restrictive lawsin some states on the hunting and trapping of a range of largeranimals, for instance lynx, bobcats, bears, beavers, foxes, wolvesand cougars. There are black bears in the suburbs of Boston forthe first time in 200 years and in New Jersey they have multipliedto over an estimated 3300. In December 2003 New Jersey author-ized its first bear hunt in 33 years. Coyotes are multiplying too,and their cheek was demonstrated when one ran into the federalbuilding in Seattle, through reception and into the lift! They rou-tinely eat cats and dogs. In Florida the alligator population is grow-ing at an unprecedented rate, helped by people buying up largeplots and embracing the wilderness life and feeding the animals.David Baron maintains that the United States (and humans in gen-eral, the most pervasive species of all) is engaged in a grand andlargely unintentional experiment. The ‘range’, on which Americans
How hot will it get? 101
Tropic of Cancer
Tropic of Capricorn
Equator
20˚C is otherm
20˚C isotherm
Heat equator
4.7.Deserts of the world covered 22% of the world’s landmass in 1970, and in 2000 this had risen to 33%. (Source: Isaac Meir)
Roaf_Ch04.qxd 29/10/04 6:41 PM Page 101
were once so happy to be ‘at home’, has moved from the plainsto the car park at the Mall and shows no sign of withdrawing backto the plains and the mountains.39
The death of mountain communities?
As jobs go, so too do the communities they supported. Globalwarming is already affecting many mountain communities as win-ter sports are pushed higher and higher up. Fifteen years ago itwas possible to guarantee good skiing over Christmas in the Alps,even in the lower resorts. Today this can only be done for sitesover 1750 metres or higher, and even then this is not certain.Many ski resorts at lower altitudes face bankruptcy, and increas-ing environmental impacts are recorded as there is more and morepressure put on providing services at higher altitudes.
A research group from the University of Zurich looked at the sit-uation in relation to predicted future climates and concluded thatwhile today 85% of the 230 resorts in Switzerland are ‘snow reli-able’ (if seven out of ten winters had at least 30–50 cm of snowon at least 100 days between 1 December and 15 August), by2030 to 2050 this would drop to 63%. If the snow line rises from1200 to 1800 m one in four resorts in many areas would face ruin,with losses of £925 million a year.
In Austria the snowline is expected to rise 200–300 m by2030–2050, making many resorts in the central and eastern partslose their winter industry and in Italy only resorts above 1500 meterscan expect reliable falls of snow, that is around half of the wintersports villages. Many such villages are facing major problems already.Many German resorts are also at low altitudes. In Australia anincrease of 0.60 �C would hit four of the nine ski resorts and a risein global temperatures of 3.4 �C, predicted under some scenarios,by 2070 would mean no Australian resort could operate at a profit.
Even the summer climbing industry in the Alps is suffering. Forthe first time since records began in 1786, the summer 2003 heatwave made the Matterhorn too dangerous to climb. The mountainwas closed in August 2003, with its naked slopes covered withheaps of rubble and screed. Two climbers died just trying to getto the restaurant at the start of the climbing routes. The perma-frost that holds the mountain peaks together had melted to a depthof 7 feet, making ski lifts and cable cars unstable. The problemsbecame apparent in July 2003, when an enormous rock avalanchehurtled down the mountain’s east face, and within two hoursanother rocked the north face. More than 70 climbers had to behauled from the mountain, one of the biggest mountaineering res-cues in history. The mountain had actually begun to fall apart under
102 Adapting Buildings and Cities for Climate Change
Roaf_Ch04.qxd 29/10/04 6:41 PM Page 102

their feet. Ice as it warms, but before it melts, may actually bemore unstable than when it is turning to water. There is a grow-ing realization that there is going to be a lot more of this type ofdevastation in mountainous regions as the foundations of the moun-tains, and their ski lifts and cable cars, become unstable.40
Agriculture
Crop belts are moving north, and many English farmers are alreadygrowing maize and sunflowers. But high temperatures are also athreat to some forms of farming, as they have resulted in higherthan normal deaths at poultry farms that were ill-prepared for heatwaves.
The changing climate will alter the face of farming over the planetand agricultural issues, particularly devastating for countries thatare suffering from the impacts of creeping deserts as the climatewarms, figured largely in the negotiations at Kyoto.41
There may also be many benefits for a fortunate country suchas the UK as the climate warms. One is the increased productionof British wine; in the Campsie Hills, near Glasgow, the Cumbernauldvineyard is thriving and, banking on a good dose of global warm-ing in the area, locals eagerly await the advent of Scottish winemade from Caledonia grapes. Some claim that if the Champagneregion of France now overheats and will have to return to makingmore traditional Bordeaux types of wine, southern England couldbecome the home of sparkling wine.
The geography of wine is set to change dramatically with climatechange and those who will suffer worst will be the growers ofsouthern France and Italy who may have to move their grapes tohigher elevations or change their grape stock plants. In Scotlandgrapes such as Muller-Thurgau and Bacchus may do well, while inthe southern areas Pinot Noir and Chardonnay grapes may thrivebest in the warming climate. Vine growers will have to be veryadaptable to survive what climate change is throwing at them.
The growing season for grapes is also extending, with an excep-tionally early harvest in 2003. The last time the grape harvest camein so early in France was in 1893, when picking began on 25 August.In Beaujolais it started on 10 August 2003.42 The yield from thisdry year is predicted to be sweeter, drier, less of it and with asuperb flavour.
But there are problems for agriculture too. Warmer winters havealso allowed aphids to survive in much larger numbers which isforcing growers to spray crops earlier and a new range of insects,wasps and spiders have invaded Britain from across the EnglishChannel.
How hot will it get? 103
Roaf_Ch04.qxd 29/10/04 6:41 PM Page 103

Gardening
Plants, like humans and other animals, are being influenced by thechanging climate. In even the hottest and driest places on theEarth the garden has always been an important climatic designfeature, to enhance the enjoyment of life, through the richness ofcolour and texture, perfumes and appearance, but also a very effec-tive way of providing cooling. The earliest dynasties of Mesopotamiawere renowned for their gardens. The Garden of Eden was placedby historians at the confluence of the Tigris and the Euphrates andthe poetry of the Sumerians, living over five thousand years agoin that region, lyrically details the beauty of the trees, and plantsand flowers enjoyed at the time. Most have also heard of theHanging Gardens of Babylon and many will have read the richpoetry of the Persians, singing tributes to the beauty of the gar-dens and their contents with ponds and streams set, in an orderedfashion, in the great walled domains and parks.43
On such a great tradition of gardening were built the Romangardens, as one can see today in Pompeii, where many have beenreconstructed from the archaeological evidence garnered from theuncovered city. Vines and fruit trees, woods and flowers and herbsflourish, still reflecting the wall paintings around the houses.44
The secret of the success of gardening in some of the hottestplaces on Earth was to create a micro-climate fed by very selec-tive watering systems and strategies and protected from the bar-ren deserts beyond by high walls that kept out the hot winds andsun and contained the moister micro-climate within: Cold and moistair sinks, and many such gardens contain sunken sections, oftencovered by a canopy of trees to reduce evaporative transpirationrates and contain the coolth. Perhaps the greatest achievement ofany urban gardeners is in the Chinese Desert Oasis city of Turfan,where the main crop of the town, grapes, is also used as an airconditioning system for the whole city where all the pavementsand courtyards of houses in the old city are planted with vinesthat keep out the sun and provide a luxurious micro-climate beneaththe vines. Other strategies for gardening in deserts include theplanting of only drought-tolerant species,45 and of minimizing thewater loss rates by very careful diurnal and seasonal strategies forplanting, watering and harvesting species.46
Just as we will rely increasingly on imported wisdom on appro-priate building technologies as the climate warms, as traditionalapproaches to gardening cease to be viable in future climates, withdryer and hotter summers and frost-free winters, many of thelower latitude approaches to garden design and upkeep will haveto be incorporated into our strategies for maintaining gardens. Many
104 Adapting Buildings and Cities for Climate Change
Roaf_Ch04.qxd 29/10/04 6:41 PM Page 104

of the species in British gardens today may have to be replacedin the future by more drought-tolerant plants.47
CONCLUSIONS
Every aspect of the way we live will be affected by climate change.The regions and settlements we live in, the air we breathe, thefood we eat, our jobs, our holidays and the buildings we live in.There are a wide range of design challenges we face to accom-modate such rapid changes. But one concern must cross our ownminds as we see the rate and extent of the warming and notethe extent of the changes that may well be wrought on the land-scapes and on other species, and that is: Will we ourselves staycomfortable, safe and ultimately survive in the changing climate?
This question is addressed in Chapter 5.
NOTES AND REFERENCES
1 http://www.wmo.ch/web/Press/Press.html.
2 Guardian, 27 September 2003, p. 1.
3 Guardian, 30 August 2003, p. 19.
4 Guardian, 12 August 2003, p. 3.
5 For all related UKCIP reports see http://www.ukcip.org.uk/publications/pub.html, including: Hulme, M. et al. (2002) ClimateChange Scenarios for the United Kingdom: The UKCIP02 Briefing
How hot will it get? 105
4.8.In the summer of 2003 theAmerican Mid-West sufferedfrom an all time record number oftornadoes, indicating a trend inthe increasing frequency ofstorm events in the region. Thefrequency and intensity of stormsincrease as land masses heat up.(Source: Extreme ClimateCalendar)
Roaf_Ch04.qxd 29/10/04 6:41 PM Page 105
Report, published in conjunction with UKCIP, the Hadley Centreand the Climate Research Unit in the School of EnvironmentalScience at the University of East Anglia, by the Tyndall Centre,Norwich; Hulme, M. et al. (2002) Climate Change Scenarios forthe United Kingdom: The UKCIP02 Scientific Report, Appendix2, published in conjunction with UKCIP, the Hadley Centre andthe Climate Research Unit in the School of EnvironmentalScience at the University of East Anglia, by the Tyndall Centre,Norwich.
6 There is an increasing amount of work done on the Heat Islandeffect. Some good references for those interested to startwith are: Graves, H., Watkins, R., Westbury, P. and Littlefair,P. (2001) Cooling Buildings in London. BR 431. London: CRCLtd. (see http://www.brebookshop.com); Oke, T.R. (1997)Urban climates and global environmental change, in Thompson,R.D. and Perry, A.H. (eds), Applied Climatology: Principles andPractice. London: Routledge, pp. 273–87; and see alsoLondon’s Warming: The Impacts of Climate Change on London,Technical Report, published by the London Climate ChangePartnership in November 2003 and available in pdf form, fromthe UKCIP website on http://www.ukcip.org.uk/publications/pub.html.
7 Guardian, Jobs and Money, 9 August 2003, p. 17.
8 Guardian, 9 August 2003. For more information on the buildingdesign see http://www.betterpublicbuildings.gov.uk/hm_treas-ury.html.
9 Roaf, S. (2004) Closing the Loop: Benchmarks for SustainableBuildings. London: RIBA Publications.
10 http://www.who.int/globalchange/climate/summary/en/ Seealso http://www.ukcip.org.uk/publications/pub.html for a pdfversion of: Department of Health (2001) Health Effects ofClimate Change in the UK: An expert review for comment.Leicester: Institute for Environment and Health.
11 There are many concerns about the impact of radiation on theskin, and for a discussion on the subject see http://www.biol.sc.edu/~elygen/Andrea%20Stanley.htm. The World HealthOrganization sees the establishment of a sun protection pro-gramme as a high priority as the young are most vulnerableto skin damage from the sun. See http://www.who.int/uv/publications/en/sunprotschools.pdf.
12 Guardian, 29 October 2003, p. 9.
13 Guardian, 21 April 2003, p. 3.
14 Independent on Sunday, 27 April 2003, p. 11.
106 Adapting Buildings and Cities for Climate Change
Roaf_Ch04.qxd 29/10/04 6:41 PM Page 106

15 Guardian, 25 April 2003, p. 19.16 Independent on Sunday, 27 April 2003, p. 27.17 Guardian, 19 April 2003, p. 3.18 Independent, 8 August 2003, p. 5.19 London’s Warming, The London Climate Change Impacts study,
2002, p. 63 (www.ukcip.org.uk/London/main_London.htm); andparticularly badly affected are cities in basin locations such asSheffield and, surprisingly, Sydney, Australia.
20 Guardian, 23 August 2003, p. 1.21 The UK Government in its White Paper on air transport made
a range of recommendations to increase the capacity of UKairports including that two new runways should be built, thefirst at Stansted airport by 2012 with a second extra runwayat Heathrow airport by 2020, providing ‘stringent environmentallimits’ can be met. The paper rules out additional runways atStansted, Gatwick and Luton and an airport at Cliffe. Newrunways and/or terminal capacity at Bristol, Birmingham,Edinburgh, Glasgow, Belfast, Cardiff, Manchester, LiverpoolJohn Lennon, Leeds, Bradford and Newcastle airports.
The White Paper contains no evidence that the ‘external’health impacts of such decisions have been taken into accountduring the decisions, as many had hoped for; see http://www.dft.gov.uk/aviation/whitepaper/.
It should be noted that a range of simple strategies couldbe employed to reduce the unsustainably high levels of airpollution resulting from aviation:● Taxiing by using two engines instead of four would reduce
hydrocarbon emissions by 80% and carbon monoxide emis-sions by nearly 70%.
● Hyrdrocarbon and other emissions could be further cut bytowing aircraft to and from terminals, using fuel vapor recov-ery procedures, and modifying jet fuel itself (which couldreduce nitrogen oxide particulate emissions by 30%).
● Flying 6000 ft lower than their present cruising altitude, airlinescould cut the damage caused by vapour trails by 47% – althoughthey would burn 6% more fuel.
● Air traffic control stratagems could cut emissions by a further 10% if planes no longer had to fly ‘zig-zag’ patternsand were able to avoid queuing for take-off and landing slots(http://www.guardian.co.uk/uk_news/story/0,3604,1098385,0.html).
22 Observer, 14 December 2003, p. 4.23 http://www.earthisland.org/eijournal/new_articles.cfm?
articleID�72&journalID�43.
How hot will it get? 107
Roaf_Ch04.qxd 29/10/04 6:41 PM Page 107

24 http://www.greenparty.org.uk/reports/2001/aviation/aviation-downsides.htm.
25 http://216.31.193.171/asp/1_introduction.asp.
26 Guardian, 22 February 2003, p. 10 and Guardian, 13 May 2003,p. 15.
27 Evening Standard, 19 March 2003, p. 20.
28 There are a number of excellent books on the Great Fire. SeeH. Clout (ed.) (1999) The Times History of London. London:Times Books; Berresford Ellis, P. (1986) The Great Fire ofLondon: An Illustrated Account. London: The New EnglishLibrary; Porter, S. (1996) The Great Fire of London.Gloucestershire: Sutton Publishing; and for full accounts of thecontemporary diary entries of Samuel Pepys and John Evelynsee: http://www.pepys.info/fire.html.
29 Guardian, 15 April 2003, p. 7; see also Guardian, 27 April 2003,p. 9.
30 Guardian, 5 August 2003, p. 3.
31 Independent, 25 August 2003, p. 10.
32 Guardian, 1 September 2003, p. 16.
33 Guardian, 31 October 2003, p. 16.
34 http://www.nature.com/nature/links/040108/040108-1.html.
35 Guardian, 27 August 2003, p. 10.
36 Sheppard, C. (2003) Coral grief. Nature, 18 September. For afull text of this paper see: http://www.nature.com/nature/links/030918/030918-8.html.
37 See www.biodiv.org.
38 Baron, D. (2003) The Beast in the Garden: A Modern Parableof Man and Nature. W.W. Norton and Company, New York.
39 Guardian, 3 December 2003, p. 3. For more on this issue see:www.unep.org.
40 http://www.int-res.com/abstracts/cr/v20/n3/p253-257.html and forthe melting Matterhorn story see http://observer.guardian.co.uk/international/story/0,6903,1001674,00.html.
41 http://www.fao.org/NEWS/1997/971201-e.htm. This site out-lines some of the concerns recorded at Kyoto. For an excellent site on the impacts of desertification see: http://www.grida.no/climate/ipcc/regional/166.htm.
42 Guardian, 17 August 2003, p. 20.
43 Wilber, D.N. (1979) Persian Gardens and Garden Pavilions, 2ndedition (1st published 1962). Washington: Dumbarton Oaks.
108 Adapting Buildings and Cities for Climate Change
Roaf_Ch04.qxd 29/10/04 6:41 PM Page 108

44 Macdougall, E.B. and Jashmemski, W.F. (1981) Ancient RomanGardens. Washington: Dumbarton Oaks.
45 Cochrane Ali, T. and Brown, J. (1978) Landscape Design forthe Middle East. London: RIBA Publications.
46 Roaf, S. (1982) Landscape Gardening Handbook for Iraq, unpub-lished textbook prepared for students in the School ofArchitecture, Mustanseriyeh University, Baghdad.
47 Bisgrove, R. and Hadley, P. (2002) Gardening in the GlobalGreenhouse: The Impacts of Climate Change on Gardens inthe UK. Technical Report, published by the UK Climate ImpactsProgramme, Oxford (see www.ukcip.org.uk).
How hot will it get? 109
Roaf_Ch04.qxd 29/10/04 6:41 PM Page 109

We share with other mammals the mechanisms of temperature regulation –shivering, sweating and changing the distribution of blood between the body’speripheral circulation and the deeper organs. But we also use clothing andshelter and burn fuel to warm and cool us. The use of these cultural mecha-nisms to control our temperature has made it possible for our species tosurvive in almost all climates, but it has also created new kinds of vulnera-bility. Our body temperature now depends on the price of clothing or fuel,whether we control our own furnaces or have them set by landlords, whetherwe work indoors or outdoors, our freedom to avoid or leave places withstressful temperature regimes ... Thus our temperature regime is not asimple consequence of thermal needs but rather a product of social andeconomic conditions. (R. Levins and R. Lewontin, The Dialectical Biologist1)
INTRODUCTION
This chapter deals with the effects of indoor climate on the com-fort and health of building occupants and how this might be alteredby climate change. The occupants of any building will respond tothe thermal environment at three levels:
● Through unconscious physiological changes – sweating, shiver-ing, muscle tension and changes in the blood flow (more infor-mation on thermal physiology is in Box 5.4, page 141).
● Through behavioural responses – consciously through the addi-tion or removal of clothing, or semi-consciously such as changesin posture or moving to a more comfortable spot.
● Using the controls afforded by the building they occupy, some of them without the use of energy – opening windows, drawing
5 SAFE AND WARM; EFFECT OF CLIMATECHANGE ON THERMAL COMFORT AND HEALTH
Fergus Nicol, Janet Rudge and Sari Kovats
Roaf_Ch05.qxd 29/10/04 6:42 PM Page 110

curtains or blinds – others where mechanical building controlsare used – fans, heaters or air conditioning.
This chapter starts by looking at the comfort issues: what constitutesa comfortable environment and how we can future-proof buildingsagainst climate change. The chapter then considers the problemsrelated to thermal health in relation to climate change. Climate changeis generally characterized as ‘warming’ and an increase in heat wavesand their associated impacts might be expected, such as those expe-rienced during the heat wave in Europe during August 2003. Climatemodels also suggest that an increasingly cold climate in WesternEurope may occur, but in a much longer time frame. We look at theeffect this may have in increasing the excess winter illness and evendeaths, which are already a feature of health in parts of the world.
THERMAL COMFORT
The role of comfort
There are three reasons why thermal comfort is important to thedesign of buildings:
● Comfort (and particularly thermal comfort) is an important aspectof user satisfaction.
● The temperature which people try to achieve in their house isan important factor in deciding the amount of energy it will use.
● If a building fails to be comfortable, then the occupants willtake actions to make themselves comfortable. These actionswill usually involve the use of energy – possibly destroying acarefully constructed low-energy strategy.
The heat balance
In order to stay healthy, we have to keep our internal body tem-perature at an almost constant 37 �C. In order to ensure a con-stant body temperature the heat produced by the body must, overtime, be balanced by the sum total of the heat lost from it. Theheat produced (the metabolic rate – generally measured in wattsper square metre (Wm�2) of body surface area) is related to a per-son’s activity – the more active the more heat. There are essen-tially four avenues of heat loss:
● Convection – heat loss to (or gain from) the air. This dependson the temperature of the air and on the air velocity next to thebody surface (skin or clothes) (see also Box 5.1 on page 139).
● Radiation – heat loss direct to (or gain from) surrounding surfaces.This depends on the temperature of the surrounding surfaces(the radiant temperature) (see also Box 5.2 on page 140).
Safe and warm; effect of climate change on thermal comfort and health 111
Roaf_Ch05.qxd 29/10/04 6:42 PM Page 111

● Conduction – heat loss (or gain) direct to surfaces in contactwith the body which depends on temperature of the surface.In most cases this is a small contribution to heat loss.
● Evaporation – heat loss due to the evaporation of skin mois-ture. Depends on the amount of water in the air (humidity) andthe air velocity next to the body (see also Box 5.3 on page 141).
Heat is also exchanged from the lungs during breathing, this lossis partly convective and party evaporative. The mathematical expres-sion for the balance between heat production and heat loss is oneway of calculating the thermal conditions to provide in a building.This is the Heat Balance approach to setting thermal conditions.The basic equation for heat balance is:
M � W � Ev � Ra � K � Co � Re � S (Wm�2) (1)
Where M � rate of metabolic heat productionW � energy used in doing mechanical workEv � Heat loss by evaporation from the skinRa � Heat loss through radiation
K � Heat loss by conduction (generally negligible)Co � Heat loss by convectionRe � Heat loss by respiration (convective and evaporative)
S � Heat stored in the body (� 0 over time)More detail of the physical processes underlying thermal comfortis given in the appropriate boxes, which touch briefly on the mainpoints. Don McIntyre’s excellent book Indoor Climate,2 or KenParsons’ Human Thermal Environments3 are good starting pointsfor those who want to know more.
Because of the importance of keeping the internal body tem-perature constant the body has a number of ways of controllingthe rate at which heat leaves the body. These actions are referredto as thermoregulation. Such responses as changes of blood sup-ply to the skin to increase or reduce heat loss, or in more extremecases, sweating in hot conditions or shivering in the cold. See Box5.4 on page 141 for more detail on thermoregulation.
Thermal comfort is a psychological phenomenon defined by theAmerican Society of Heating, Refrigeration and Air conditioningEngineers (ASHRAE) as ‘That state of mind which expressessatisfaction with the thermal environment [emphasis added]’. Thispsychological phenomenon is often taken to be a response to thephysical environment and the physiological state of the body, butis almost certainly affected by the attitude of the person to theirsurroundings and their experience of thermal environment as wellas its current state. (See Box 5.5 on page 142 for more detail onpsychophysics.)
Conscious (‘behavioural’) thermoregulation is generally triggeredby thermal discomfort. Discomfort is usually the result of a change
112 Adapting Buildings and Cities for Climate Change
Roaf_Ch05.qxd 29/10/04 6:42 PM Page 112

Safe and warm; effect of climate change on thermal comfort and health 113
in the core temperature coupled with information from the thermalsense at the skin that the body risks continued thermal imbalance(e.g. a draught in a cold room). Generally a situation that is movingin a direction to restore thermal balance is considered pleasurable(e.g. a cool breeze on a hot day). Thermal sensation is thereforepart of a feedback system to maintain thermal equilibrium, so thata comfortable environment is one where occupants can maintainthermal balance as a dynamic equilibrium. An uncomfortable envi-ronment is one in which we cannot prevent discomfort. See belowfor more information on these behavioural actions.
The complexity of the thermoregulatory processes and theirdynamic nature has made them difficult to characterize mathe-matically. Steady-state formulations for thermal comfort such asthat of Fanger4 have been found to underestimate the extent towhich people will naturally adapt to changes in the environment,particularly in variable conditions.5,6
Adaptive behaviour as a way of looking at comfort
Field studies and rational indicesOne method that has been widely used to investigate the condi-tions we find comfortable is the field study. This takes a group ofsubjects who are going about their normal everyday lives and asksthem how hot they feel on a scale, such as those shown in Table 5.1(i.e., their ‘comfort vote’). At the same time, the physical envi-ronment (temperature, humidity, air movement) is measured. Overa period of time the way in which the subjective responses changecan be related to these measured physical conditions.
Table 5.1. Seven point ASHRAE and Bedford scales of thermalsensation. The �3 to �3 scale is generally used for mathematicalevaluation of comfort in indices such as Fanger’s Predicted MeanVote (PMV), the 1 to 7 scale is used in survey work, to avoidconfusion
ASHRAE Numerical equivalent Bedford descriptive descriptive scale scale
Hot �3 7 Much too hotWarm �2 6 Too hotSlightly warm �1 5 Comfortably warmNeutral 0 4 Comfortable, neither
warm nor coolSlightly cool �1 3 Comfortable and coolCool �2 2 Too coldCold �3 1 Much too cold
Roaf_Ch05.qxd 29/10/04 6:42 PM Page 113

114 Adapting Buildings and Cities for Climate Change
5.1.A wide range of comfort studiesshows that the mean comfortvote is little affected by the meanindoor temperature. Each pointrepresents the mean from acomplete study
Mean temperature T °C
–3
–2
–1
015 20 25 30 35 40
Mea
n c
om
fort
vo
te C
1
2
3
Figure 5.1 shows the mean comfort vote of subjects from a num-ber of field surveys plotted against the mean temperature recorded.The rate of change of comfort vote with temperature is much lowerfrom one survey to another than it is within any particular survey.
The reasons for this observation from field surveys have beenthe subject of considerable speculation and research, most of whichhas concentrated on the context in which field surveys are con-ducted. Nicol and Humphreys suggested, in 1973,7 that this effectcould be the result of a feedback between the thermal sensationof subjects and their behaviour and that they consequently ‘adapted’to the climatic conditions in which the field study was conducted.
Unlike laboratory experiments, field studies include the effectsof all the behaviours of normal subjects during their everyday lives.Some of the behavioural actions are concerned with the thermalenvironment, and will therefore affect the relationship betweenthermal comfort and the environment. The adaptive approach seeksto explain the differences between the field measurements andthose obtained in the laboratory by looking at the cumulative effectof behaviour in this relationship.
People and indoor climateThe corollary of the effect shown in Figure 5.1 is that in field sur-veys the temperature that people find comfortable (the ‘comforttemperature’) is closely related with the mean temperature meas-ured. This was found to be the case in surveys conducted over awide range of indoor climates, shown in Figure 5.2.8 The strongrelationship between the comfort temperature and the mean tem-parature measured during the survey is clear.
As an example of how effectively adaptive actions can be usedto achieve comfort, Figure 5.3 shows the actual proportion of sub-jects comfortable among office workers in Pakistan at differentindoor temperatures. The data were collected over a period of ayear so the comfort temperature was continually changing, as was
Roaf_Ch05.qxd 29/10/04 6:42 PM Page 114

Safe and warm; effect of climate change on thermal comfort and health 115
5.2.The variation of comforttemperature with mean indoortemperature from surveysthroughout the world. (Source:data presented in Humphreys,19768)
10 1515
20
25
30
Co
mfo
rt t
emp
erat
ure
35
20 25
Mean temperature
30 35 40
5.3.Pakistan: the proportion of office workers who were comfortable at different indoor temperatures. Each point on thegraph represents the results of one survey of about 20–25 people in a single office. It will be noticed that on manyoccasions the subjects recorded no discomfort. With a continually changing indoor temperature and comforttemperature Pakistani buildings were found comfortable at temperatures ranging between 20 and 30 �C with no coolingapart from fans. (Source: Nicol et al., 19999)
120%
10%20%30%40%50%60%70%80%90%
Pro
po
rtio
n o
f su
bje
cts
com
fort
able 100%
14 16 18 20 22 24 26Mean indoor temperature °C
28 30 32 34 36 38
the indoor temperature.9 The major methods these workers hadto control their comfort were changing their clothing and using airmovement, fans being universally available in Pakistani offices. Thecurve shows the mean probability of comfort calculated using pro-bit regression. Each point represents the proportion comfortablein a particular city in a particular month. Note that little discomfortis recorded at indoor temperatures between 20 and 30 �C.
Adaptive actionsInterest in the phenomenon outlined above has led to the devel-opment of the so-called adaptive approach to thermal comfortwhich attributes the effect to an accumulation of behaviours orother factors which, taken together, are used to ensure comfort.
Roaf_Ch05.qxd 29/10/04 6:42 PM Page 115
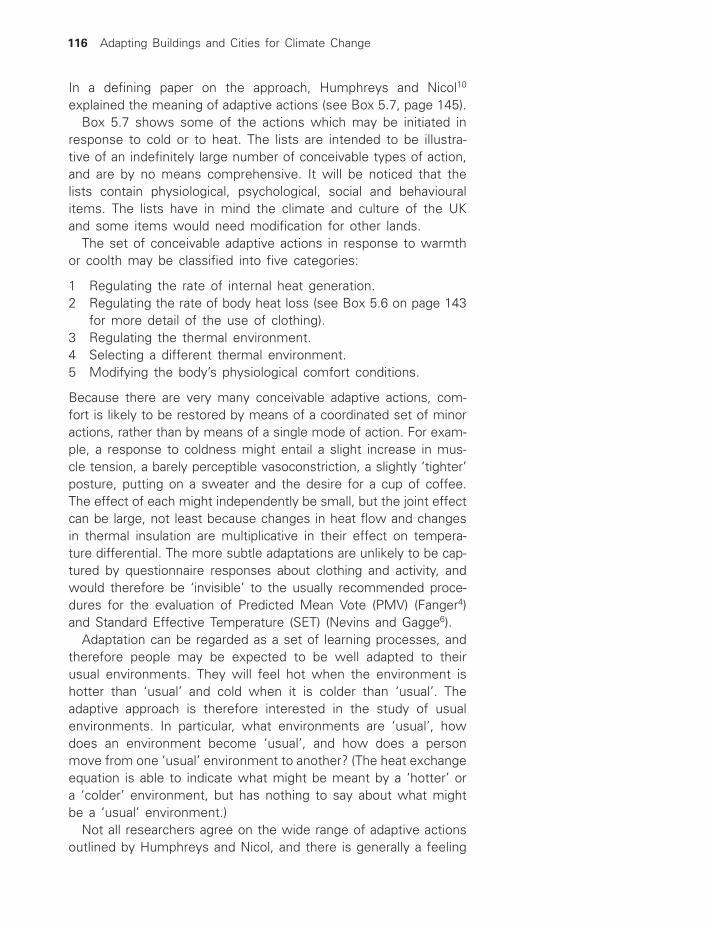
116 Adapting Buildings and Cities for Climate Change
In a defining paper on the approach, Humphreys and Nicol10
explained the meaning of adaptive actions (see Box 5.7, page 145).Box 5.7 shows some of the actions which may be initiated in
response to cold or to heat. The lists are intended to be illustra-tive of an indefinitely large number of conceivable types of action,and are by no means comprehensive. It will be noticed that thelists contain physiological, psychological, social and behaviouralitems. The lists have in mind the climate and culture of the UKand some items would need modification for other lands.
The set of conceivable adaptive actions in response to warmthor coolth may be classified into five categories:
1 Regulating the rate of internal heat generation.2 Regulating the rate of body heat loss (see Box 5.6 on page 143
for more detail of the use of clothing).3 Regulating the thermal environment.4 Selecting a different thermal environment.5 Modifying the body’s physiological comfort conditions.
Because there are very many conceivable adaptive actions, com-fort is likely to be restored by means of a coordinated set of minoractions, rather than by means of a single mode of action. For exam-ple, a response to coldness might entail a slight increase in mus-cle tension, a barely perceptible vasoconstriction, a slightly ‘tighter’posture, putting on a sweater and the desire for a cup of coffee.The effect of each might independently be small, but the joint effectcan be large, not least because changes in heat flow and changesin thermal insulation are multiplicative in their effect on tempera-ture differential. The more subtle adaptations are unlikely to be cap-tured by questionnaire responses about clothing and activity, andwould therefore be ‘invisible’ to the usually recommended proce-dures for the evaluation of Predicted Mean Vote (PMV) (Fanger4)and Standard Effective Temperature (SET) (Nevins and Gagge6).
Adaptation can be regarded as a set of learning processes, andtherefore people may be expected to be well adapted to theirusual environments. They will feel hot when the environment ishotter than ‘usual’ and cold when it is colder than ‘usual’. Theadaptive approach is therefore interested in the study of usualenvironments. In particular, what environments are ‘usual’, howdoes an environment become ‘usual’, and how does a personmove from one ‘usual’ environment to another? (The heat exchangeequation is able to indicate what might be meant by a ‘hotter’ ora ‘colder’ environment, but has nothing to say about what mightbe a ‘usual’ environment.)
Not all researchers agree on the wide range of adaptive actionsoutlined by Humphreys and Nicol, and there is generally a feeling
Roaf_Ch05.qxd 29/10/04 6:42 PM Page 116

Safe and warm; effect of climate change on thermal comfort and health 117
that adaptation is concerned with behavioural, more or less con-scious actions.
The adaptive principleThe fundamental assumption of the adaptive approach is expressedby the adaptive principle: If a change occurs such as to producediscomfort, people react in ways which tend to restore their com-fort. This principle applies to field surveys conducted in a widerange of environments and thus legitimizes meta-analyses of com-fort surveys such as those of Humphreys,11 Auliciems and deDear,12
and deDear and Brager.6 These meta-analyses have been used togeneralize from the results of a number of individual thermal comfortsurveys.
By linking people’s actions to comfort the adaptive principle linksthe comfort temperature to the context in which subjects findthemselves. The comfort temperature is a result of the interactionbetween the subjects and the building or other environment theyare occupying. The options for people to react will reflect theirsituation: those with more opportunities to adapt themselves tothe environment or the environment to their own requirementswill be less likely to suffer discomfort.
The prime contextual variable is the climate. Climate is an over-arching influence on the culture and thermal attitudes of any groupof people and on the design of the buildings they inhabit. Whilstthe basic mechanisms of the human relationship with the thermalenvironment may not change with climate, there are a number ofdetailed ways in which people are influenced by the climate theylive in and these play a cumulative part in their response to theindoor climate. The second major context of nearly all comfortsurveys has been a building, and the nature of the building andits services plays a part in defining the results from the survey.The third context is time. In a variable environment such as willoccur in most buildings occupants will respond to changes in theenvironment. They will do this by taking actions to suit the environ-ment to their liking or by changing themselves (for instance byposture or clothing) to suit the environment. This implies thatthe comfort temperature is continually changing. The extent ofthese changes and the rate at which they occur is an importantconsideration if the conditions for comfort are to be properlyspecified.
The relationship with outdoor climateHumphreys (1978)11 took the indoor comfort temperature deter-mined in a number of surveys conducted world-wide and plotted
Roaf_Ch05.qxd 29/10/04 6:42 PM Page 117

118 Adapting Buildings and Cities for Climate Change
them against the outdoor monthly mean temperature at the timeof the survey. The results are shown in Figure 5.4. He found aclear division between people in buildings that were free-running(neither heated nor cooled) at the time of the survey and those inbuildings that were climatized (heated or cooled) at the time of thesurvey. The relationship for the free-running buildings was closelylinear. For climatized buildings the relationship is more complex.
The feedback mechanisms create order in the relationship betweenindoor climate and comfort temperature. In a free-running buildingthe indoor climate is linked by the building to outdoor conditions.When the building is being climatized the relationship changes,because the indoor climate is decoupled from that outdoors.
People in buildings: adaptive opportunitiesBuildings differ in a number of ways: in addition to their individ-ual physical form, they differ in their services; in what sort of heat-ing or cooling system is provided and whether it is used; in thepossibilities they offer for occupants to control their environmentand in the policies of management about whether there is a dresscode and so on.
There are other aspects of building services which affect thecomfort of occupants. Leaman and Bordass14 have demonstratedthat there is more ‘forgiveness’ of buildings in which occupantshave more access to building controls. By forgiveness they mean
5.4.The change in comfort temperature with monthly mean outdoor temperature. Each point represents the mean value forone survey (this graph is from Humphreys, 197811). The buildings are divided between those that are climatized at thetime of the survey and those that are free-running. Subsequent analysis of the ASHRAE database of comfort surveys13
showed similar results.
Heated or cooled buildings Free-running buildings, line A
B
–24 –20–22 –18 –16 –14 –12 –10 –8 –6 –4 –2 0 2 4 6
30
28
26
24
22
20
18
16
14
128 10
Monthly mean outdoor temperature °C
12 14 16 18 20 22 24 26
A
Tn = To
28 30 32 34
Neu
tral
or
com
fort
tem
per
atu
re °
C
Roaf_Ch05.qxd 29/10/04 6:42 PM Page 118
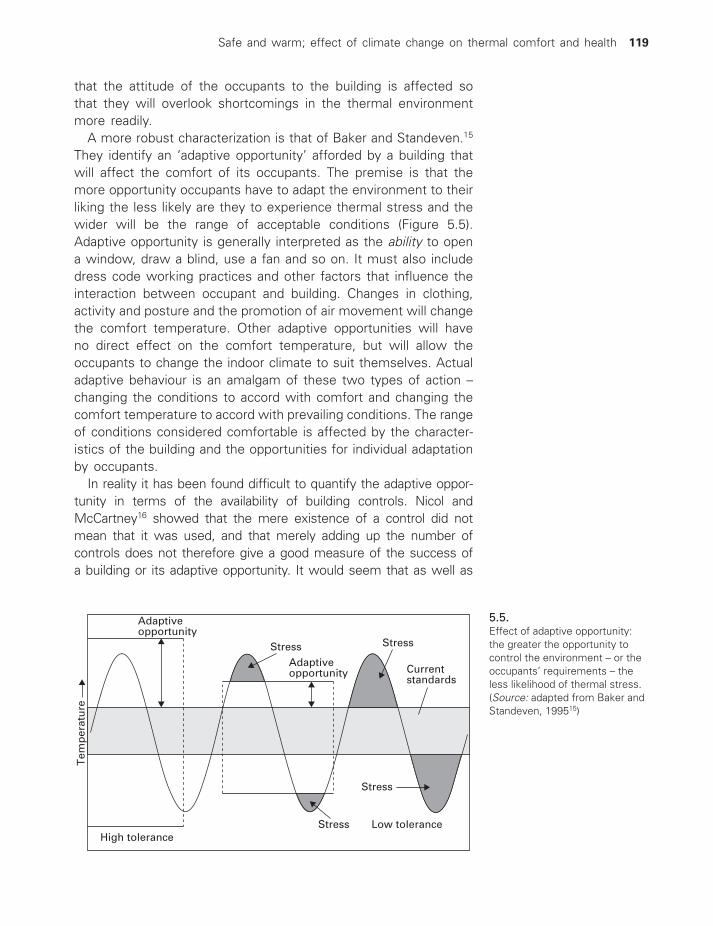
Safe and warm; effect of climate change on thermal comfort and health 119
5.5.Effect of adaptive opportunity:the greater the opportunity tocontrol the environment – or theoccupants’ requirements – theless likelihood of thermal stress.(Source: adapted from Baker andStandeven, 199515)
Low toleranceStressHigh tolerance
Stress
StressStress
Currentstandards
Adaptiveopportunity
Adaptiveopportunity
Tem
per
atu
rethat the attitude of the occupants to the building is affected sothat they will overlook shortcomings in the thermal environmentmore readily.
A more robust characterization is that of Baker and Standeven.15
They identify an ‘adaptive opportunity’ afforded by a building thatwill affect the comfort of its occupants. The premise is that themore opportunity occupants have to adapt the environment to theirliking the less likely are they to experience thermal stress and thewider will be the range of acceptable conditions (Figure 5.5).Adaptive opportunity is generally interpreted as the ability to opena window, draw a blind, use a fan and so on. It must also includedress code working practices and other factors that influence theinteraction between occupant and building. Changes in clothing,activity and posture and the promotion of air movement will changethe comfort temperature. Other adaptive opportunities will haveno direct effect on the comfort temperature, but will allow theoccupants to change the indoor climate to suit themselves. Actualadaptive behaviour is an amalgam of these two types of action –changing the conditions to accord with comfort and changing thecomfort temperature to accord with prevailing conditions. The rangeof conditions considered comfortable is affected by the character-istics of the building and the opportunities for individual adaptationby occupants.
In reality it has been found difficult to quantify the adaptive oppor-tunity in terms of the availability of building controls. Nicol andMcCartney16 showed that the mere existence of a control did notmean that it was used, and that merely adding up the number ofcontrols does not therefore give a good measure of the success ofa building or its adaptive opportunity. It would seem that as well as
Roaf_Ch05.qxd 29/10/04 6:42 PM Page 119
120 Adapting Buildings and Cities for Climate Change
the existence of a control a judgement is needed as to whether itis useful in the particular circumstances. For example, solar shadingmay be useless on one face of a building, but essential on another.In addition the perceived usefulness of a particular control will changefrom time to time depending on conditions.17
Time as a factor in the specification of comfort temperaturesWhen people take actions in response to a thermal environmentthat is causing discomfort these actions take time to accomplish.There are a number of actions that can be taken: some, like open-ing a window, take little time, while others, such as the changeof fashion from winter to summer clothes, take longer. The changeis fast enough to keep up with the fluctuations in the weatherfrom season to season but not always quick enough to accountfor all the changes in the weather.18 In his comparison betweenoutdoor temperature and the comfort temperature indoors (seeFigure 5.4), Humphreys (1978)11 used records of the monthly meanof the outdoor air temperature as the defining variable. deDearand Brager6 use the mean of outdoor effective temperature with-out defining the period over which it has been measured. Theweather can change dramatically within a month and both peopleand the buildings they inhabit change at a rate that will not bereflected by a monthly estimate. Box 5.8 on page 146 suggestsa way in which the effects of time can be included in the modelof comfort and adaptation.
An adaptive case study – avoiding discomfort inPakistan and Europe
In the past countries have been assumed to take a path of increas-ing technological sophistication. In the response to climate changeit may be necessary to relearn skills that have fallen into disuse.As fuel prices increase, the ability to adapt to our surroundings islikely to be one of those skills.
A number of studies have been made of thermal comfort inPakistan,9 and of the use people make of the thermal controls thatare available. Pakistan is a country where the incidence of air con-ditioning is low, and where a wide range of temperature is found,not only outside but also inside buildings. This is partly becausethe ‘level of technology’ is less developed in Pakistan, but cruciallyit is because the price of fuel is relatively much greater becauseof the exchange rate for the Rupee against the dollar. Even for relatively well-off Pakistanis the cost of running the air conditioningcan be prohibitive.
Roaf_Ch05.qxd 29/10/04 6:42 PM Page 120

Safe and warm; effect of climate change on thermal comfort and health 121
Five cities were identified in different climatic areas of the coun-try and a study was conducted of office workers who were goingabout their normal work routine. Surveys of about 100 workerswere made in each of the cities on a monthly basis for a periodof one year. In addition to subjective responses from the subjectson the Bedford scale (Table 5.1) they were also asked for theirpreference for a warmer or cooler environment and an estimateof the moisture of their skin. Details were collected of the cloth-ing they were wearing, of their activity and of their use of build-ing controls (windows, fans, lights and heaters). Measurementswere made of the globe temperature, the air temperature, thehumidity and the air velocity. Outdoor temperatures were collectedfrom local meteorological stations.
From these measurements it is possible, among other things, torelate the extent to which different adaptive actions are taken bythe subjects at different temperatures. Two types of adaptive actionsare investigated: those that change the comfort temperature of thesubject and those that seek to change the environment to suit thesubject. Examples of the former are the use of clothing and meta-bolic rate, and the changes in these are illustrated in Figure 5.6.Also shown are the changes in air velocity and skin moisture.Changes in air velocity will be caused by the use of fans (whichare found in all Pakistani offices) and to a lesser extent the open-ing of windows, but it will have the effect of increasing the tem-perature which occupants find comfortable. Skin moisture onlyserves to illustrate the physiological state of the subjects. A graphof discomfort at different values of the indoor temperature at thetime of the survey is given in Figure 5.3 above. There is clearly lit-tle discomfort between 20 and 30 �C. Most of the changes in cloth-ing and air movement occur in the same range of temperatures.
5.6.Use of adaptive actions to suitthe subject comfort temperatureto the environment in Pakistan.(Source: Fergus Nicol)
Clo
thin
g in
sula
tio
n (
clo
) an
dai
r ve
loci
ty a
v (m
s–1)
0
0.2
0.4
0.6
0.8
1
1.2
1.4
0
0.2
0.4
0.6
0.8
1.2
1
1.41.6
10 15 20 25 30 35 40
Met
abo
lic r
ate
(met
) an
d s
kin
mo
istu
re
clo av met moist
Mean globe temperature °C
Roaf_Ch05.qxd 29/10/04 6:42 PM Page 121

122 Adapting Buildings and Cities for Climate Change
5.7.Use of various controls to suit theenvironment to the subject inPakistan. (Source: Fergus Nicol)
100
80
60
40
20
0
Pro
po
rtio
n o
f o
ffic
es u
sin
g c
on
tro
l (%
)
10 15 20 25 30 35 40
lightsWindows HeatersFans
Mean globe temperature (°C)
Adaptive actions to change indoor conditions (Pakistan)
A similar pattern occurs in the use of building controls (Figure 5.7).The use of heating ceases when the indoor temperature exceeds20 �C and fans are all running when the temperature reaches 30 �C.Windows are more likely to be opened as the temperature rises,though at temperatures above 35 �C they are likely to be heatingrather than cooling the office and there is some evidence that fewersubjects are opening them at these high temperatures. Lighting ishardly affected by temperature – the use of blinds (which was notrecorded) is often to exclude the solar heat and glare at high tem-peratures. Indoor temperatures are constrained to an ‘acceptablezone’ of 20–32 �C for about 70% of the time (Figure 5.8).
5.8.Distribution of indoortemperatures in Pakistanibuildings. Temperatures arelargely constrained to the rangeof 20–32 �C. The curve shows anormal distribution with the samemean and standard deviation.(Source: Fergus Nicol)
0
200
800
400
600
1000
10.0 14.0 18.0 22.0 26.0 30.0 34.0 38.0 42.0 46.012.0 16.0 20.0 24.0 28.0 32.0 36.0 40.0 44.0 48.0
Std. Dev = 6.38Mean = 26.6N = 7105.00
Roaf_Ch05.qxd 29/10/04 6:42 PM Page 122

Safe and warm; effect of climate change on thermal comfort and health 123
5.9.Use of adaptive actions to suitthe subject comfort temperatureto the environment in Europe.(Source: Fergus Nicol)
18 20 22 24 26 28 300
0.2
0.4
0.6
0.8
1
1.2
Clo
thin
g in
sula
tio
n (
clo
) an
d a
irve
loci
ty a
v (m
s–1)
1.6
1.5
1.4
1.3
1.2
1.1
1
0.9
0.8
Met
abo
lic r
ate
(met
)
cloav met
Mean globe temperature (°C)
Adaptive actions to change comfort temperature
5.10.Use of various controls to suit theindoor environment to thesubject in free-running buildingsin Europe. (Source: Fergus Nicol)
100
80
60
40
20
018 20 22 24 26 28 30
Pro
po
rtio
n o
f o
ffic
es u
sin
g c
on
tro
l (%
)
Adaptive actions to change indoor conditions (Europe, Free-running)
lightswindows blinds fans
Mean globe temperature (°C)
A similar analysis of the results from the SCATS survey19 is shownin Figures 5.9 to 5.11. The results given apply only to buildingswhich were free-running at the time of the survey: many of thebuildings were air-conditioned and so the temperature of the build-ing was not in the control of the occupants. Figure 5.11 suggeststhat there is more discomfort in European buildings but a range ofindoor temperature from 19 to 27 �C probably gives rise to littleincrease in discomfort. Figure 5.12 shows that the indoor temper-ature remains within these limits for over 80% of the time. Againmuch of the adaptive action takes place between these limits. Thereason for the greater dissatisfaction in Europe is not clear, but
Roaf_Ch05.qxd 29/10/04 6:42 PM Page 123

124 Adapting Buildings and Cities for Climate Change
there are a number of possible reasons, one being the internationalnature of the European survey population, another the more con-strained workforce in Pakistan, where unemployment is high.
HEALTH EFFECTS OF HEAT AND COLD
In the UK it has long been recognized that there are more deathsin winter than in summer. The causes of this excess winter mor-tality and the parallel increase in winter illness have been the sub-ject of a great deal of research in recent years and we report onthis below. The impact of hot weather on human health has gainedimportance due to the threat of global climate change, and the
5.11.Proportion of European subjectscomfortable at differenttemperatures in free-runningbuildings. Separating thecountries gives a higher level ofcomfort, but over a narrowerband of temperatures. (Source:Fergus Nicol)
100
60
80
40
20
018 20 22 24 26 28 30P
rop
ort
ion
of
sub
ject
s co
mfo
rtab
le (
%)
Mean globe temperature °C
Free-running buildings in Europe
5.12.Distribution of indoortemperatures in Europeanbuildings: the temperatures fitthe range of comforttemperatures, falling mostlybetween 19 and 27 �C. (Source:Fergus Nicol)
0
100
200
300
Std. Dev = 2.54Mean = 24.70N = 1421.00
14.0016.00
18.0020.00
22.0024.00
26.0028.00
30.0032.00
Roaf_Ch05.qxd 29/10/04 6:42 PM Page 124

Safe and warm; effect of climate change on thermal comfort and health 125
major heat wave event that occurred throughout Europe in 2003,affecting France, Spain, Portugal and other countries in WesternEurope. France was most affected and more than 10 000 excessdeaths occurred during the heat wave.80
Physiological effects of cold
Most cold-related deaths in the UK appear to be associated withchest and heart illnesses. Between 1992 and 1999, annual numbersof excess winter deaths ranged from 23 000 to 45 000 in England,81
depending partly on the severity of the winter. Cardiovascular andrespiratory diseases are the predominant causes of such deaths inthe UK, despite a persisting, widespread assumption that hypother-mia (cooling of the body core) is largely responsible.20 A strongrelationship has been shown between changes in external temper-ature and numbers of deaths from these two major causes.21 Curwen22
estimated that a third were attributable to respiratory disease andmore than a half to cardiovascular disease (mainly heart attacks andstrokes). According to Collins,23 although numerically more deathsare ascribed to circulatory (cardiovascular) disease, the greatest pro-portional effect of winter temperatures is on deaths from respiratorydisease. Keatinge and Donaldson24 refer to the time lapses observedbetween temperature drops and peaks in numbers of deaths, whichclearly vary according to the diagnosed cause of death, such thatthere is a lapse of up to three days for coronary thrombosis and 12days for respiratory disease. These indicate that the greater part ofthe seasonal influence is probably due to the direct effect of coldrather than other, indirect, factors, such as reduced vitamin C in thewinter diet, for example. As Khaw observes, there are
seasonal changes in environmental and other factors such as air pollution,sunlight exposure, influenza incidence, and diet [that] have variously beenimplicated in seasonal changes in mortality.25
However, she concludes that temperature is the leading candidate.Collins recently reviewed the long-known association between
cold ambient temperatures and respiratory illnesses with referenceto the physiological and epidemiological evidence.23 Although moststudies have focused on damp and mouldy living conditions ratherthan cold house temperatures, here he concentrates on cold indoorconditions, how these relate to dampness and mould and, conse-quently, with allergic response respiratory conditions. As Collinsdemonstrates, the effects of ambient temperature on physiologicalfunction can be explained in terms of pathology. These effectsinclude asthma attacks, which can be triggered by breathing incold air, reduced resistance to respiratory infection, and wheeze in
Roaf_Ch05.qxd 29/10/04 6:42 PM Page 125

126 Adapting Buildings and Cities for Climate Change
children associated with dampness and condensation on cold sur-faces, which produces allergenic mould growth. However, it is muchharder to demonstrate these effects at the population level, due tothe difficulties of obtaining accurate exposure details, measures ofenvironmental factors or determining individual susceptibilities.
Evidence for a relationship between temperature and cardio-vascular mortality includes, for example, findings on seasonal vari-ation in blood pressure, which is related independently to bothindoor and outdoor temperature, indoor temperature having thestronger impact.25 If blood pressure is raised, as in response tocold, circulatory conditions can be affected. Collins concludes thatit is methodologically very difficult to show a definitive link betweenhome temperatures and specific health outcomes, but that bothindoor and outdoor cold temperatures can exacerbate respiratoryillnesses in the presence of respiratory pathogens.26
Physiological effects of heat
Healthy persons have efficient heat regulatory mechanisms whichcope with increases in temperature up to a particular threshold.The body can increase radiant, convective and evaporative heatloss by vasodilatation (enlargement of blood vessels in the skin)and perspiration (Kilbourne27). Heat can increase blood viscosity.Healthy volunteers (n � 8) exposed to 41 �C for 6 hours experi-enced elevated platelet counts and increased blood viscosity(Keatinge et al.27). Severe perspiration can also lead to a reductionin plasma volume. Increased blood viscosity is considered a plau-sible physiological mechanism by which heat stress can lead toarterial thrombosis that can further lead to a heart attack or stroke.However, the effect of heat on blood viscosity is less well under-stood than that of cold.
The increased sweat production in the heat can lead to two typesof problems: (i) dehydration and (ii) hyponatremia (caused by drinkinglarge quantities of water with low salt concentrations). A significantproportion of heat stroke cases are due to exercise in hot weatherin young healthy people, so-called ‘exertional heat stress’.28,29 For lessfit subjects, heat illnesses can occur at low levels of activity, or evenin the absence of exercise. Low fitness levels lead to a low cardio-vascular reserve and thus to low heat tolerance.30
Climate and issues of public health
Excess winter mortalityExcess winter mortality is a particular problem in Britain, where itis thought to be associated with poorly insulated houses, in which
Roaf_Ch05.qxd 29/10/04 6:42 PM Page 126

Safe and warm; effect of climate change on thermal comfort and health 127
internal temperatures track the external temperature, providing lit-tle protection against the cold, and where occupants cannot affordto adequately heat such homes to safe temperatures. Such a com-bination of circumstances, i.e. energy inefficient homes and lowhousehold incomes, is known as fuel poverty.
Excess winter mortality is measured as the number of deathsto occur during the winter months (December to March) in excessof the average for the rest of the year. Alternatively, it is meas-ured as a ratio of these figures. This phenomenon is evident in allbut equatorial climates and is apparently associated with low tem-peratures, or the relative seasonal fall in temperature. As Wilkinsonet al.31 point out, it is a linear relationship and not simply a stepincrease in the winter period showing an effect of just the verycoldest days, although escalating numbers may reach head-lines during cold snaps. Typically, the UK suffers up to three timesthe ratio of excess winter deaths compared with countries suchas Sweden or Germany, where winters are colder but homes arewarmer and better insulated. For every 1 �C fall in temperaturebelow 20 �C, mortality increases by between 1 and 2% in the UK.32
British householders appear to be less well protected from thecold in their homes than their continental neighbours, althoughthere is some debate over the comparative effect of outdoor andindoor temperatures on excess winter mortality. Curwen33 andBoardman34 have shown it to be inversely correlated with outdoortemperatures in Britain, but international differences in seasonal
5.13.The elderly are some of the mostvulnerable in society to extremesof heat and cold. (Source: theHelp the Aged British Gaspartnership)
Roaf_Ch05.qxd 29/10/04 6:42 PM Page 127

128 Adapting Buildings and Cities for Climate Change
mortality do not reflect a similar association in accordance withnational differences in absolute external temperature levels.35
Boardman concludes that the closer relationship between outdoorand indoor temperatures in Britain, because of deficiencies in thebuilding fabric, is key to the higher numbers of excess winter deathscompared with many other countries. The Eurowinter Group in 199776
showed that in some European countries with milder winters, indoortemperatures were lower at given outdoor temperatures and bedrooms were less often heated than where cold winters werenormally experienced. At the same time, other protective measuresagainst the cold were less prevalent, such as clothing and outdooractivity, which the Eurowinter study also associated with higher winter mortality.
Seasonal patterns of mortality have changed as public health meas-ures, or improved medical care, help to reduce summer epidemicsof infection, particularly among infants. As further socio-economicchanges take place, the ratio of winter over summer deaths falls offover time, or ‘de-seasonality’ follows seasonality.36 Both seasonalityand subsequent de-seasonality have developed later in England andWales than in certain countries with colder winters.
The use of central heating seems to reduce the incidence ofwinter deaths. Sakamoto-Momiyama37 suggested that the increaseduse of central heating in homes is the main reason for the appear-ance of de-seasonality in many developed countries althoughHenwood38 describes the direct evidence as inconclusive. In Britain,where central heating ownership spread later than in countries withvery cold winters such as Canada, Norway and Sweden, the pattern of de-seasonality was shown to have followed behind thosecountries. As Boardman has noted,35 excess winter mortality ishigher in Britain than in these and other countries, like France andDenmark, with more similar winter temperatures to the UK.
Khaw25 observes that outdoor temperatures are most used inmortality analyses, but that outdoor temperature may be a markerfor indoor temperature exposure, because of their close relation-ship. Indoor temperatures have been observed by some to havean impact, but are not strongly related to latitude:
Scandinavian countries (which tend to have indoor heating and buildinginsulation) have less seasonal variation in mortality than more southerncountries such as Portugal and Israel where central heating is not wide-spread and indoor temperatures may vary more in line with outdoor tem-peratures throughout the year.25
The ability to pay to run the central heating, once it is in the build-ing, would obviously be key to the resultant indoor temperatureand its effect on health.
Roaf_Ch05.qxd 29/10/04 6:42 PM Page 128

Safe and warm; effect of climate change on thermal comfort and health 129
Heat wave events and mortalityEpisodes of extreme hot weather have a greater impact on mortality than the number of deaths reported as due to classicalheat illness. Short-term peaks in mortality are associated with heatwaves. Lower than expected mortality can be seen following heat wave events, indicating that some of the mortality during theheat wave is attributable to deaths brought forward by a matterof days or weeks (short term mortality displacement). A study ofa heat wave in Belgium calculated that 15% of the excess mor-tality was due to deaths brought forward, based on a deficit indeaths in the elderly following the heat wave.39 A study of ‘heatwave’ episodes in the Netherlands, using the official weather serv-ice definition, estimated excess mortality was in the range of 5–15%for different cause and age groups. The excess was always greaterin mortality in the elderly, and from respiratory disease.40
Some heat wave events are very severe and can be considereda natural disaster if public services are overwhelmed. The heatwave in July 1987 in Greece was associated with 2000 excessdeaths.41 In France, in 2003, the mortuary service and hospitalswere unable to cope with the excess.
The mortality impacts of heat wave events have been estimatedusing episode analyses. Attributable mortality is estimated bysubtracting the ‘expected’ mortality from the observed mortalityduring a pre-defined period. The expected mortality is calculatedusing a variety of measures, including moving averages, and aver-ages from similar time periods in previous years. Estimates aretherefore very sensitive to the method used to estimate the‘expected’ mortality.42
A further difficulty is the lack of standard definition of a heatwave. Many countries do not have local definitions, and it hasproved difficult to identify a relative definition for international com-parisons. The same temperatures can have different impactsdepending on the duration of the event, or the time in the sea-son. Heat waves early in the summer (June/July) are associatedwith greater impacts on mortality than heat waves of comparableor hotter temperatures in the same population in subsequentmonths.43,44
Vulnerable groups
Vulnerability to coldFuel poverty particularly affects the elderly. It is defined as theinability to afford sufficient warmth because of the inefficiency ofthe building. Older people are especially vulnerable to adversehealth effects of cold living conditions. Yet, in the UK, they are
Roaf_Ch05.qxd 29/10/04 6:42 PM Page 129

130 Adapting Buildings and Cities for Climate Change
often least able to afford sufficient heating and are most likely tolive in poorly insulated housing with inefficient heating systems.High numbers of excess winter deaths among those aged over 65are associated with these factors.
There are known physiological effects of cold on the older population.Pensioners are likely to spend more time at home than others, inwhich case they are more susceptible to poor thermal conditions,where they occur. The British Geriatrics Society recommends 21 �Cas a suitable indoor temperature for older people.45 Collins46 has alsoidentified benchmark indoor temperatures for maintaining health:between 18 and 24 �C, there is no risk to healthy, sedentary people;below 16 �C resistance to respiratory infections may be affected;below 12 �C there is increased risk of cardiovascular events, due toraised blood pressure. Hypothermia, or cooling of the body core, iscaused by prolonged cold and the risk of this increases below 5 �C.45
Older people are most at risk because they are generally less mobilethan others and, additionally, because with age the body’s ther-moregulatory system may deteriorate, which affects awareness oftemperature extremes. This means that they may not take appropri-ate avoiding action when the temperature drops. Circulatory diseaseis exacerbated by ‘cold stress’, which results from fluctuations in tem-perature47 and can arise from moving between warm and cold rooms.However, moving from a cold dwelling to the cold outside producesgreater cardiovascular strain than going out from a warm house.48
Other groups vulnerable to cold-related illness are the very youngand the chronically sick. Children are particularly subject to ‘wheeze’in damp conditions, which often occur together with cold. Furthercold effects are that low temperatures slow reflexes and affectcoordination, especially among older people, and can therefore bethe cause of accidents in the home. Apart from the recognizedphysical effects of cold housing on health, mental health problemscan also arise from the compounded stress of living in debilitatingcold and damp conditions.
Increasing ownership of central heating has been linked with thedeclining numbers of excess winter deaths over recent decades,but it has also been suggested that the spread of central heatingmay not have benefited the most vulnerable groups.49 After all,central heating ownership does not guarantee that its use can beafforded by householders. Recent research suggests that increasedvulnerability to winter death from cardiovascular disease is linkedto indoor temperature and thermal efficiency of housing.50 Otherwork has shown an association between the lack of central heat-ing and higher risk of dying in winter but identifies the need toexplore further the influence of socio-economic factors and othermeasures of housing quality.51 Fuel-poor groups in Britain appear
Roaf_Ch05.qxd 29/10/04 6:42 PM Page 130

Safe and warm; effect of climate change on thermal comfort and health 131
to be far more vulnerable to dying from cold in winter than thosewho can afford to heat their houses properly.
Vulnerability to heatThere are many physiological factors that impair temperature reg-ulation and so can be predisposing factors for clinical heat illness:52
● Dehydration due to reduced food and liquid uptake or intestinalproblems.
● Use of diuretics or alcohol abuse.● Use of other drugs affecting the system: stimulants, beta-blockers,
anticholinergics, digitalis, barbiturates, especially combined withhypertension, age, fever, recent infections or skin burns.
● Previous heat illness, low fitness, adiposity, fatigue, sleep dep-rivation, long term high level exercise, and protective clothing.
Age and illness are strong predictors of heat-related illness, as agehighly correlates with increasing illness, disability, use of medicationand reduced cardiovascular fitness.
Both individual- and population-level studies provide strong andconsistent evidence that age is a risk factor for heat- and cold-related mortality. Studies vary, however, at the age at which thevulnerability is shown to increase. Most population-base time seriesstudies show an effect in adult age groups53 but the effect is largerin over-65s compared to other ages. The elderly in institutions,such as residential care homes, may be vulnerable to heat-relatedillness and death.54 An almost two-fold increase in mortality ratewas reported in geriatric hospital inpatients (but not other inpa-tients) during the 1976 heat wave in the UK.55
There is currently little evidence for heat effects on mortality inyoung age groups (under 15 years) in European populations, asthe baseline mortality in this age group is very low. There is anec-dotal evidence of heat deaths caused by children being left in carson hot days. Children are more prone to dehydration due to thehigher volume of fluid in their bodies compared to an adult. Hospitaladmissions in children increase on sunny days.56
Epidemiological studies have identified several socio-economicrisk factors for heat-related mortality:57
● Living alone, or not leaving the house at least once per day.● Housing (e.g. building type, which floor).● Presence and use of air conditioning in the home or residential
institution.
Case control studies following the 199558 and 199959 heat wavesin Chicago both found that the strongest risk factor for dying in aheat wave was living alone.
Roaf_Ch05.qxd 29/10/04 6:42 PM Page 131

132 Adapting Buildings and Cities for Climate Change
Impacts of heat waves are greater in urban than in rural popu-lations. Such populations differ in their basic vulnerability to heat(underlying rates of cardiorespiratory disease) and in their expo-sures (different types of housing, and higher temperatures causedby the urban heat island effect).60,61 Mapping of heat wave deathsin St Louis (1966) found the highest rates in inner city areas wherepopulation density was higher, open spaces were fewer, and wheresocio-economic status was lower than in surrounding areas.62,63
Individuals are more vulnerable to heat stress if they are in poorlydesigned housing, with no access to air conditioning or cooler build-ings. These risk factors are more likely to be present in urban thanrural areas. During a heat wave, mortality impacts are greater incities than in the surrounding areas or in the country as a whole.This has been shown in the UK in 1995,64 in Greece in 1987,65
and in 1980 in Missouri, USA.66 However, this does not mean thatrural populations are not affected by heat waves.67 In developingcountries, rural populations may be significantly more vulnerabledue to inadequate housing, and lack of access to clean water.
It has proved difficult to demonstrate clear socio-economic gradients for heat-related mortality.66,68 As with winter mortality, vul-nerability may be more closely linked to social activity and housingtypes which are not directly correlated with socio-economic status.Smoyer is therefore correct in concluding that relatively little is knownabout the types of places where risk from heat waves is high.69
The temperature and mortality relationship
The relationship between daily mortality and temperature is generally U-shaped in European populations. That is, there is a
5.14.Relationship betweentemperature and daily mortality,Greater London, 1991–96.(Source: Sari Kovats)
0 5 10 15 20 25 30
100
150
200
250
300
To
tal m
ort
alit
y
Temperature (°C)
Roaf_Ch05.qxd 29/10/04 6:42 PM Page 132

Safe and warm; effect of climate change on thermal comfort and health 133
Table 5.2. Temperature relationships with mortality, for selected causes
Population % change per 1 �C increase above Cut point Lag Referencecut point (�C) (day)
All Causes CVD Resp.
Oslo, Norway 0.7 (�0.2, 1.5) 0.8 (�0.4, 0.2) 4.7 (2.2, 7.1) 10 7 Nafstad et al.London, UK 1.3 (1.0, 1.2) 18 0–1 Pattenden et al.Netherlands 1.2 1.1 3.1 16.5 1–2 Kunst et al.Ljubljana, 2.2 (1.1, 3.4) 17 0–2 McMichael et al.Slovenia
Sofia, 2.2 (1.6, 2.9) 18 0–1 Pattenden et al.Bulgaria
Bucharest, 2.8 (2.0, 3.5) 22 0–2Romania
Madrid, 1.0 20.3 1 Alberdi et al.Spain
Valencia, 3.6 (1.2, 6.0) 2.3 5.7 24 1–2 Ballester et al.Spain (�1.5, 4.5) (�2.9, 8.2)
Barcelona, 4.0 (IHD) 25 Saez et al.Spain
Sources:Alberdi, J.C., Diaz, J., Montero Rubio, J.C. and Miron Perez, I.J. (1998) Daily mortality in Madrid community,1986–1992: relationship with meteorological variables. Eur J Epidemiol, 14, pp. 571–8.Ballester, D.F., Corella, D., Perez-Hoyos, S., Saez, M. and Hervas, A. (1997) Mortality as a function of temperature.A study in Valencia, Spain, 1991–93. International Journal of Epidemiology, 26, pp. 551–61.Kunst, A.E., Looman, C.W. and Mackenbach, J.P. (1993) Outdoor air temperature and mortality in the Netherlands:a time series analysis. American Journal of Epidemiology, 137, pp. 331–41.Nafstad, P., Skrondal, A. and Bjertness, E. (2001) Mortality and temperature in Oslo, Norway, 1990–95. EuropeanJournal of Epidemiology, 17, pp. 621–7.Pattenden, S., Nikiforov, B. and Armstrong, B. (2003) Mortality and temperature in Sofia and London. Journal ofEpidemiology and Community Health, 57, pp. 628–33.Saez, M., Sunyer, J., Castellsague, J., Murillo, C. and Anto, J.M. (1995) Relationship between weather temperatureand mortality: a time series analysis approach in Barcelona. International Journal of Epidemiology, 24, pp. 576–82.
temperature value or range where mortality is lowest, and belowthis temperature mortality increases (cold effects) and above this‘comfort zone’ mortality also increases (heat effects). The majorityof studies report a linear relationship above and below a minimummortality temperature (or range of temperatures (Figure 5.14)).70
Table 5.2 lists the heat slopes for mortality for selected cause groupsin European cities or countries. The effect of temperature on mor-tality is greater for respiratory and cardiovascular disease than forother causes of death. The warmer the climate, the higher the cutpoint temperature (though it should be noted that the slope willdepend on the choice of cut point).
Roaf_Ch05.qxd 29/10/04 6:42 PM Page 133
134 Adapting Buildings and Cities for Climate Change
In the assessment of the short-term effects of extreme episodes(usually extreme weather or high air pollutant exposures) there isthe methodological problem of quantifying mortality displacement,or ‘harvesting’. A proportion of the ‘acute’ effect on mortality maybe due to the hastening of death in already ill persons by a fewdays or weeks.
Stressful weather and high levels of air pollutants have independ-ent adverse effects on daily mortality. Few studies have successfullydifferentiated weather-induced and pollution-induced daily mortality.In studies of heat-related mortality, it can be difficult to separate theeffects of exposure to air pollution because it is associated both withdaily variations in temperature (exposure) and with daily variations inmortality (outcome). There is some evidence of a physiologicalsynergistic effect between temperature and pollutants.71,72
Adaptation: current knowledge
The capacity of humans to adapt to varied climates and environ-ments is considerable. Physiological and behavioural differencesbetween cultures have developed over many millennia as a conse-quence of exposure to vastly different climatic regimes. The designof vernacular buildings is also sensitive to climate, using a numberof techniques to suit the building to the climate, and providing appro-priate passive cooling techniques. In many areas the appropriate useof buildings is determined by the local culture. An instance in hotclimates is the internal migration from one time of day to another,or from one season to another, between parts of the house thatprovide more comfortable (less stressful) indoor climates.
Human beings undergo physiological adaptation to warmer cli-mates. Many studies have illustrated this for people moving to hot-ter countries, and particularly for soldiers or sports persons. Thephysiological adaptation can take place over a matter of days orweeks. The body responds by increasing the output of sweat andimprovement in cardiovascular stability upon heat exposure. Bothresponses lead to reduced thermal and cardiovascular strain. Therate at which infrastructural changes will take place in responseto climate change is likely to be much slower, however.
Buildings as modifiers of temperature
British homes are often poorly built to withstand the cold. TheEnergy Report for the 1996 English House Condition Survey73 foundthat 38% of homes failed to reach the minimum standard neededto safeguard health, according to Collins’ benchmark temperaturethresholds. In typical winter conditions, over 10% of all homes inEngland have a living room temperature below 16 �C. When the
Roaf_Ch05.qxd 29/10/04 6:42 PM Page 134

Safe and warm; effect of climate change on thermal comfort and health 135
outside temperature is below freezing, this increases to nearly 18%of all homes, including almost 4% with rooms below 12 �C.74 Thegovernment now acknowledges the link between cold homes andpoor health, while the Department of Health recognizes that fuelpoverty contributes to inequalities in health status.
Boardman demonstrated the relatively poor domestic buildingstandards required in the UK compared with elsewhere, despiteregular increases in demands of regulations concerning insulationand energy efficiency since 1974.35 The lack of effective insula-tion is commonplace and many homes in Britain built before theFirst World War are separated from the elements by a wall onlyone brick thick. The housing stock is notoriously ‘leaky’, harkingback to an era when homes were heated with open fires thatrequired a good draught to burn well. Air infiltration is rife evenin modern homes due to a number of influences, including poordesign, methods of construction and quality of workmanship.75
Boardman describes the problems of heat loss from British hous-ing due to high ventilation rates and the consequent difficultiesthat arise in attempting to effectively draught-proof olderdwellings.
In the rest of Europe the picture is very varied. The EurowinterStudy was a large-scale epidemiological study designed to considerthe effect of winter climate and protective behaviour on excesswinter mortality.76 Indoor temperatures were measured acrossregions and cities in a number of European countries, includingFinland, The Netherlands, Germany, England, Italy and Greece.These were taken as one-off readings simultaneously with theadministration of questionnaires, which were used to survey heat-ing use, clothing and outdoor excursion behaviour. Among theauthors’ conclusions were that:
striking differences indoors were higher living room temperatures andmore frequent bedroom heating in the colder countries, all at a given levelof outdoor cold.76
England was found to be nearer the ‘warmer’ end of the scale interms of the average outdoor winter temperature (calculated fromOctober to March) and with respect to this conclusion. This wasnot the case, however, when it was judged by the number of daysin the year when the mean daily temperature falls below 18 �C,which indicates the misleading nature of an ‘average’ temperaturewhen comparing climates.
Consideration of average indoor temperature levels alone, withno reference to daily or other variations, allows no acknowledge-ment of the possible effect on comfort or health of a changeableclimate, such as prevails in the UK. Arguments have been made
Roaf_Ch05.qxd 29/10/04 6:42 PM Page 135

136 Adapting Buildings and Cities for Climate Change
previously of the health effects of temperature changeability, basedon a body of health evidence.77 The fact that temperatures arechangeable means that ‘mild’ averages disguise the extremes expe-rienced, which, if buildings are energy-inefficient, will be translatedinto similar indoor conditions. Even so, the Eurowinter Study addsto the accumulation of evidence that indoor temperatures varyacross Europe and that in countries with ‘mild’ winters, buildingstend to offer less protection against the cold than where the win-ter climate is more extreme.
It is evident that the effect of climate on people and their healthis modified – to varying degrees – by the buildings they occupy.In countries with more predictably extreme climates, buildings aregenerally better equipped to cope with extreme temperatures thanthose where long periods of cold or heat are not the norm. Thus,insulation and energy efficiency is given higher priority in buildingregulations for countries like Germany and in Scandinavia. At thesame time, it may be that buildings in such countries are tradi-tionally designed to cope with the most uncomfortable seasonalconditions usually experienced, but at the expense of differentcomfort features required over shorter periods at other times ofthe year. This would explain the lack of central heating in SouthernEuropean countries, where summer conditions are viewed as thepriority but indoor temperatures are found to be low during therelatively brief winter season.
In the temperate climate of the UK, where extreme weatherconditions are not normally experienced, space and prevention ofdamp has generally taken priority over insulation in terms of build-ing regulations. It appears that much of the housing stock is poorlyinsulated and leaky, with inefficient heating systems, so that indoortemperatures closely follow outdoor temperatures, particularly ifthe occupants are on low incomes and unable to afford sufficientheating for these homes that are hard to heat. Cold and dampconditions frequently occur together, especially where dampnessis due to condensation. This occurs on cold surfaces, caused bypoorly insulated fabric and lack of sufficient heating or appropriateventilation.
Buildings that have poor insulation characteristics, or are light-weight, with low thermal capacity, will be as likely to produceuncomfortable indoor temperatures during hot summers as muchas in cold winters. If ventilation possibilities through windows arelimited, the potential for night cooling during hot weather wouldalso be restricted. It is not likely, therefore, that buildings which,at present, are not well designed to cope with cool winters, willbe more able to produce comfortable conditions during the poten-tially more frequent hot summers.
Roaf_Ch05.qxd 29/10/04 6:42 PM Page 136

Safe and warm; effect of climate change on thermal comfort and health 137
Health education and warning systems
Education to advise people of appropriate behaviour during hotweather is an essential component of heat-death prevention. Manygovernments in Europe have issued advice on how to avoid heat-related illness. However, there is evidence that perception of ambi-ent temperature is poorer in the elderly.78 Therefore, an individualmay not recognize that they need to change their behaviour. Further,an understanding of human behaviour during heat events is neededbefore the most appropriate messages can be developed andtargeted. There is a lack of qualitative research on behaviouralresponses to heat waves and heat wave warnings.
There have been several campaigns at getting people to bewarmer in winter. Searches of the published literature found nostudies of the effectiveness of heat- or cold-awareness campaigns.Passive warnings for poor air quality, for example, are also largelyignored. The following components are required for an effectiveheat-health warning system:82
● Sufficiently reliable heat wave forecasts for the population ofinterest.
● Robust understanding in the cause-effect relationships betweenthermal environment and health.
● Effective response measures to implement within the windowof lead time provided by the warning.
● The community in question must be able to provide the neededinfrastructure.
A range of methods is used in order to identify situations thatadversely affect human health.79
Heat early warning systems when accompanied by specific healthinterventions are generally considered to be effective in reducingdeaths during a heat wave.
In the longer term, local authorities and building professionalsrequire education to appreciate the part better building design canplay in enabling buildings to remain cool in hot weather. Thisincludes the use of tried and tested techniques as well as theincorporation of modern technological approaches. Schools of archi-tecture and engineering have a responsibility to ensure that suchconsiderations are an essential element in their curricula.
Implications of climate change on buildings and health in the UK
If the likelihood is that winters will be warmer and wetter, whilesummers will be hotter and drier, then it may be anticipated that
Roaf_Ch05.qxd 29/10/04 6:42 PM Page 137
138 Adapting Buildings and Cities for Climate Change
the relative seasonal temperature differences would not be muchaltered from those experienced currently. In fact, they could beeven greater. It is therefore possible that seasonal mortality varia-tions would still feature in the UK, as they do already in most cli-mates. Although seasonal averages may be warmer, there couldbe more extreme temperatures and greater variability within sea-sons, which is also known to have health implications.
Wet buildings are harder to heat. Warmer, wetter winters wouldevidently present less of a threat in terms of cold temperaturesand research to date has not found a relationship between rainfalland excess winter mortality. However, damp reduces the insulat-ing effect of building fabric so, where buildings already have poorinsulating qualities, these will be reduced further still by increasedrainfall and become more frequently difficult to heat comfortablyand affordably. The likelihood of condensation occurrence may alsobe increased, with possible implications for mould growth andconsequent health problems.
CONCLUSIONS
The implications of climate change for comfort and health havebeen presented. In the case of comfort, building occupants will beincreasingly dependent on the opportunities which the social andphysical character of the building offer them to adapt to the changes.The effectiveness of these will depend on the ability of occupantsto change their behaviour and attitude to the building as the changesoccur.
The adaptive principle tells us that people will change them-selves and their environment to achieve comfort, but this alsoassumes that their behaviour is appropriate in the changed cir-cumstances. The tendency to open windows in hot weather, forinstance, is only helpful if this has the effect of cooling the build-ing; if the weather outside is very hot this may make things worse.
The temperature at which there is an increased risk of illnessdue to heat depends on the normal outdoor conditions. This suggeststhat similar cultural considerations apply to health as to comfort.Countries with a cold climate, such as Scandinavia, have learnedto insulate their buildings against the cold. Likewise behaviour inhot climates is more appropriate to the heat. Some of this is relatedto learning appropriate behaviour (for instance by drinking morewater) and some of it is in the provision of appropriate buildings,such as those that take advantage of thermal mass to reduce indoortemperature variability in temperate or desert climates.
For architects there are important lessons to be learned fromthe scientific analysis of buildings, and in the light of this the study
Roaf_Ch05.qxd 29/10/04 6:42 PM Page 138

Safe and warm; effect of climate change on thermal comfort and health 139
of local vernacular buildings. For national and local authorities thestudy of buildings and the understanding of the effects of weatherpatterns in existing climates can give important clues for the pro-vision of warnings and help to communities struggling with unex-pected conditions.
The wrong conclusions can also follow – for instance an over-reliance on the provision of mechanical systems to alleviate themore extreme conditions. These can add to the problem of cli-mate change through the excessive use of fossil fuel energy. It isalso becoming increasingly clear that the assumption that energyis always available can be misleading when extreme weather putsa strain on energy utilities.
For buildings to provide a safe and comfortable environment inthe future they should:
● Provide the means for occupants to regulate the indoor climate.● Avoid the use of mechanical cooling where possible.● Avoid the need for large amounts of energy to provide com-
fortable interiors.
In addition there is a need for:
● Education of building professionals on how to design buildingsthat meet these needs.
● Education of the public on the ways to avoid heat stress andcold stress in ways that require little energy use.
● The instigation of mechanisms for warning the public and theauthorities when dangerous weather episodes are expected.
We are surrounded by air. When the temperature of the air is lowerthan skin temperature then we will lose heat from the body byconvection. When air temperature is above skin temperature we willgain heat. In cool still conditions air heated by the body will becomebuoyant when the body heats it. It will then rise up and form a‘plume’ above the head and then disperse. Any movement of the airwill add to the cooling by helping to strip the warmed air from thebody at a greater rate, effectively cooling the air in contact with thebody. Air movement is counted relative to the body surface so, forinstance, walking will add to the effective air movement. Turbulencein the air stream can also have an effect helping to increase thecooling effect of air movement.
These effects occur whether or not the body is clothed. Whereclothing is worn the cooling effect of convection occurs at the clothingsurface so instead of the skin temperature it is the temperature of thesurface of the clothes which effects the rate of loss of heat.
Box 5.1 Heat loss by convection
Roaf_Ch05.qxd 29/10/04 6:42 PM Page 139

140 Adapting Buildings and Cities for Climate Change
By insulating the skin the rate of heat loss is reduced. Air movementcan also have some impact on the effectiveness of clothing as aninsulator: a permeable material allowing the cool air to penetrate furtherand reduce the garment’s effectiveness.
Where the air in contact with the body is hotter than skintemperature all these effects act in the opposite direction to heatthe body.
In summary: the cooling (or heating) effect of the air depends onthe difference between air temperature and skin (or clothing surface)temperature and on the air movement. The effect of air movement isgenerally considered to be roughly proportional to the square root ofthe air velocity.
Box 5.2 Heat loss by radiation
All bodies emit heat at their surface at a rate that is proportional to thefourth power of their absolute temperature (absolute temperature isequal to the centigrade temperature plus 273). At the same timesurrounding surfaces are radiating to the body in a similar fashion. Sothe body loses heat if the surroundings are colder and gains heat ifthey are hotter. If the surroundings were all at one temperature thesituation would be relatively simple. But of course they are not, in anyreal situation there will be cold windows or hot ceilings, radiators andeven the sun. There is not space here to go too far into the details ofradiant energy exchange.
The full picture integrates the effect of every part of thesurrounding surfaces with every part of the body. The usualsimplification is to talk in terms of the ‘mean radiant temperature’.This is the temperature of a sphere which would exchange no netradiation with the surroundings. The notion of the mean radianttemperature is very useful. It can be used to assess the cooling orheating effect of the environment.
In a real situation the radiant temperature will vary from point topoint in a room and the size of the human body means that it willeven vary from point to point on the body. In general a roughestimate of radiant temperature such as the average temperature ofthe room surfaces is all that can be achieved. The effect of any largesurface with a different temperature needs to be taken into accountespecially as people notice radiant asymmetry (often interpreting it asa ‘draught’ in the case of a cold surface).
There is only a relatively small temperature range in mostbuildings. The fourth power law for radiant heat exchange cantherefore be approximated so that the radiant heat loss is roughlyproportional to the temperature difference between the clothingsurface and the radiant temperature.
Roaf_Ch05.qxd 29/10/04 6:42 PM Page 140

Safe and warm; effect of climate change on thermal comfort and health 141
Box 5.3 Heat loss by evaporation
When water evaporates it extracts a quantity of heat (the latent heatof evaporation) from its surroundings. The evaporation of water fromthe surface of the skin means much of the latent heat is extractedfrom the skin and cools it. This cooling effect is very powerful (theevaporation of 1 g/minute is equivalent to 41 W) and is used by thebody for cooling when we sweat. It is not the sweating that cools usbut the evaporation of sweat from the skin.
After the sweat has been evaporated it must move away from theskin if it is to be successful, in order that more evaporation can occur.The driving force for evaporation is the gradient of the water vapourpressure near the skin surface. The water vapour pressure is thatpart of the total pressure of the air that is caused by the molecules ofwater in it. The hotter the air, the more water it is capable of carrying.The maximum driving force is the difference between the vapourpressure at skin temperature and the vapour pressure in the air as awhole.
The heat lost by evaporation from the skin is usually caused by the amount of sweat produced and not the maximum that can be evaporated (this would require the body to be totally wet with sweat). So the sweat glands and not the physical conditionsusually govern the heat loss by evaporation. Air movement tends toincrease evaporation in much the same way as it increasesconvection. So the water vapour pressure in the atmosphere and the square root of the air velocity decides the possible heat loss by evaporation.
Box 5.4 Thermal physiology: metabolic heat and the control ofdeep body temperature
We produce energy by ‘burning’ food to produce the energy we need to live. Most of this energy takes the form of heat. The body produces this ‘metabolic heat’ all the time: more isproduced when we are active and the more active we are the more heat is produced (see Table 5.3). Heat is transported around the body by the blood. The organs of the body, and particularly thebrain, must stay at about 37 �C. The body has mechanisms forcontrolling the deep body (or core) temperature. If our braintemperature exceeds acceptable limits, the body reacts to restoreheat balance.
Roaf_Ch05.qxd 29/10/04 6:42 PM Page 141

142 Adapting Buildings and Cities for Climate Change
Table 5.3. Metabolic rate for selected activities
Activity Wm�2 Met
Reclining 46 0.8Seated, relaxed 58 1.0Sedentary activity (office, dwelling 70 1.2school, laboratory)
Standing, light activity (shopping,laboratory, light industry) 93 1.6
Standing, medium activity (shop assistant,domestic work, machine work) 116 2.0
Walking on level: 110 1.92 km/h 140 2.43 km/h 165 2.84 km/h 200 3.4
Source: International Standard 7730. Moderate Thermal Environments:Determination of PMV and PPD Indices and Specification of theConditions for Thermal Comfort. International Organisation forStandardisation, Geneva, 1994
A drop in core temperature causes vasoconstriction: bloodcirculation to the surface of the body is reduced, and the temperatureof the skin drops cutting the heat loss. A further drop in coretemperature leads to increased tension in the muscles and thenshivering to increase metabolic heat. A rise in core temperaturecauses vasodilatation: the blood supply to the periphery is increased,increasing skin temperature and heat loss to the surroundings. Afurther increase causes sweating to increase heat loss byevaporation.
Box 5.5 Psychophysics: how we feel about the environment
The physiological actions described in Box 5.4 are augmented by thethermal sense in the skin. This adds information about the skintemperature, warning of conditions that might pose a danger. Thereare two types of skin temperature sensors, one concerned mostlywith heat and the other with cold. Our impression of the warmth orcold of our environment arises in part from the skin sensors. It isintegrated with the core temperature so that the sensation may bepleasing if the overall effect is likely to restore thermal equilibriumand unpleasant if it works against it. Thus a cold skin sensation willbe pleasant when the body is overheated, unpleasant if the core isalready cold. The sensation from any particular part of the body willdepend on time, location and clothing as well as the temperature ofthe surroundings.
Roaf_Ch05.qxd 29/10/04 6:42 PM Page 142

Safe and warm; effect of climate change on thermal comfort and health 143
Psychophysics is the study of the relation between the sensationswe experience and the stimuli we receive from the physical world.The relationship between thermal sensation and the thermalenvironment is hard to model. Psychophysical experiments haveconcentrated on more defined relationships such as the warmth andcold of surfaces when they are touched. Nevertheless the thinkingbehind field studies of thermal comfort has been to relate thermalsensation to the stimuli of the thermal environment.
The comfort vote is a method of trying to assign numbers to ourthermal sensation. However an ability to say how we feel does notimply a one-to-one relationship between thermal comfort and thephysical conditions that cause it. The pleasure given by a thermalstimulus depends not only on the physiological conditions at the timethe stimulus is received but also on the social and other conditionsprevailing and on the recent thermal experiences of the personconcerned. So a particular stimulus can give rise to a range ofsensations. We cannot say that a set of conditions will give rise to aparticular sensation, only that there is a probability that it will.
Box 5.6 Clothing
Clothing plays a major role in enabling man to survive outside thetropics. Clothing is of particular importance to the adaptive model ofthermal comfort. In the physical model of the heat transfer theclothing is assumed to be a uniform layer of insulation between thebody and the environment with a single surface temperature. Quiteclearly this is an approximate treatment, since the clothing isanything but uniform. The face in particular is generally unprotectedand the actual clothing insulation varies from place to place on thebody according to the nature of the clothing ensemble. In practice,however, the assumption appears to work quite well, and the overallinsulation of the clothing can be expressed as the sum of thecontributions from the individual items of clothing being worn, as ifthey were each spread over the whole of the body surface. In thiscontext the layers of air trapped between multiple layers of clothingand between the clothing and the skin are counted as part of theensemble.
The insulation of the clothing is generally expressed in ‘clo units’where 1 clo � 0.155 m2 kW�1. Tables of clo values for typicalensembles, and for individual clothing items, are given in Table 5.4.There is always a big problem with such descriptive tables: they areculturally defined and a thick suit in one climate might be countedrather thin in another. In addition to acting as insulation against thetransfer of dry heat, the clothing has an effect on the heat loss by
Roaf_Ch05.qxd 29/10/04 6:42 PM Page 143

144 Adapting Buildings and Cities for Climate Change
evaporation. It affects evaporative cooling by introducing extraresistance to water vapour depending on its permeability to moistureand it can absorb excess moisture next to the skin. The absorbedmoisture is then evaporated from the clothing and not from the skin,so it is not so effective in cooling the skin.
Table 5.4. Clothing insulation for selected garments
Garment Icl (clo) Garment Icl (clo)
UnderwearPanties 0.03Underpants with long legs 0.10
Singlet 0.04T-Shirt 0.09Shirt with long sleeves 0.12
Panties and bra 0.03
TrousersShorts 0.06Light-weight 0.20Normal 0.25Flannel 0.28
SweatersSleeveless vest 0.12Thin sweater 0.20Sweater 0.28Thick sweater 0.35
High-insulative, fibre pelt
Boiler suit 0.90Trousers 0.35Jacket 0.40Vest 0.20
SocksSocks 0.02Thick, ankle socks 0.05Thick, long socks 0.10Nylon stockings 0.03
Source: International Standard 7730. Moderate Thermal Environments:Determination of PMV and PPD Indices and Specification of theConditions for Thermal Comfort. International Organisation forStandardisation, Geneva, 1994
Shirts – blousesShort sleeves 0.15Light-weight, long sleeves 0.20
Normal, long sleeves 0.25Flannel shirt, long sleeves 0.30
Light-weight blouse, long sleeves 0.15
Dresses – skirtsLight skirts (summer) 0.15Heavy skirt (winter) 0.25Light dress, short sleeves 0.20
Winter dress, long sleeves 0.40
Boiler suit 0.55
JacketsLight summer jacket 0.25Jacket 0.35Smock 0.30
Outdoor clothingCoat 0.60Down coat 0.55Parka 0.70Fibre-pelt overalls 0.55
Shoes and glovesShoes (thin soled) 0.02Shoes (thick soled) 0.04Boots 0.10Gloves 0.05
Roaf_Ch05.qxd 29/10/04 6:42 PM Page 144

Safe and warm; effect of climate change on thermal comfort and health 145
The way clothing works is often more complex than suggested. Insome hot dry climates, for instance, the inhabitants wear loose,multiple layered clothing to keep the high environmental temperaturesaway from the skin, whilst allowing heat loss by evaporation when dryair is pumped through the clothing as the body moves. Anothercomplication in dealing with clothing is that its function is not purelythermal. Our social as well as our thermal needs determine the waywe clothe ourselves. Wearing a jacket open or closed can make asignificant difference to its thermal characteristics. Chair upholsterymay add as much as 0.2–0.4 clo to the standard methods forestimating clothing insulation. The need to specify the value of theclothing insulation and permeability is a source of considerableuncertainty in the heat balance model of human heat exchange.
Box 5.7 Examples of adaptive actions
Some conceivable actions in response to cold:
● Vasoconstriction (reduces blood flow to the surface tissues)● Increasing muscle tension and shivering (generates more heat in
the muscles)● Curling up or cuddling up (reducing the surface area available for
heat loss)● Increasing the level of activity (generates body heat)● Adding clothing (reduces the rate of heat loss per unit area)● Turning up the thermostat or lighting a fire (usually raises the room
temperature)● Finding a warmer spot in the house or going to bed (select a
warmer environment)● Visiting a friend or going to the library (hoping for a warmer
environment)● Complaining to the management (hoping someone else will raise
the temperature)● Insulating the loft or the wall cavities (hoping to raise the indoor
temperatures)● Improving the windows and doors (to raise temperatures/reduce
draughts)● Building a new house (planning to have a warmer room
temperature)● Emigrating (seeking a warmer place long-term)● Acclimatizing (letting body and mind become more resistant to
cold stress)
Some conceivable actions in response to heat:
● Vasodilatation (increases blood flow to surface tissues)● Sweating (evaporative cooling)
Roaf_Ch05.qxd 29/10/04 6:42 PM Page 145
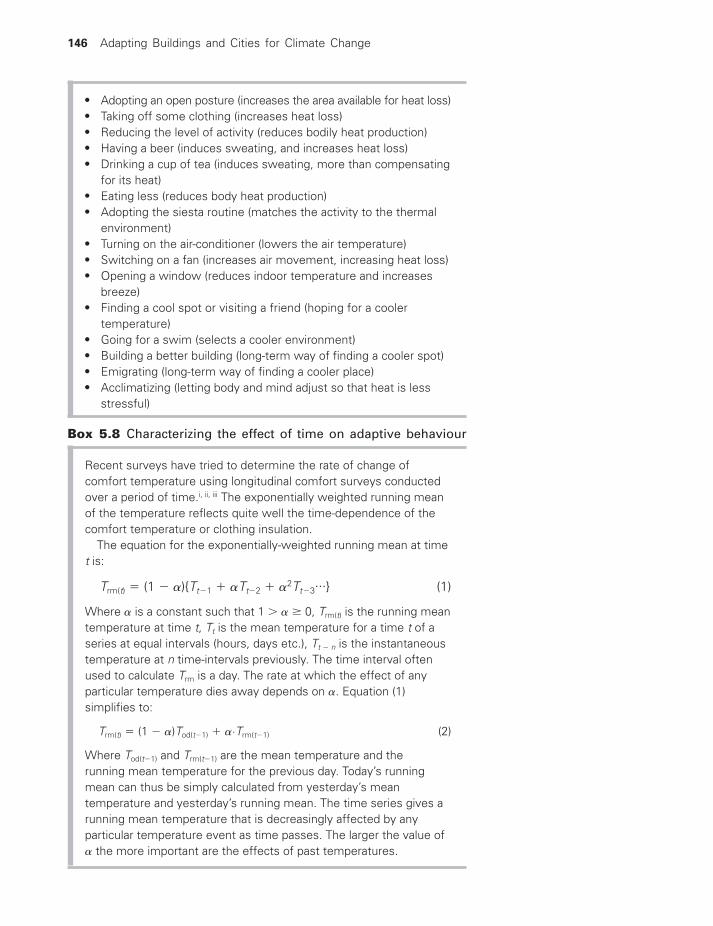
146 Adapting Buildings and Cities for Climate Change
Box 5.8 Characterizing the effect of time on adaptive behaviour
Recent surveys have tried to determine the rate of change ofcomfort temperature using longitudinal comfort surveys conductedover a period of time.i, ii, iii The exponentially weighted running meanof the temperature reflects quite well the time-dependence of thecomfort temperature or clothing insulation.
The equation for the exponentially-weighted running mean at timet is:
Trm(t) � (1 � �){Tt�1 � �Tt�2 � �2Tt�3...} (1)
Where � is a constant such that 1 � � � 0, Trm(t) is the running meantemperature at time t, Tt is the mean temperature for a time t of aseries at equal intervals (hours, days etc.), Tt � n is the instantaneoustemperature at n time-intervals previously. The time interval oftenused to calculate Trm is a day. The rate at which the effect of anyparticular temperature dies away depends on �. Equation (1)simplifies to:
Trm(t) � (1 � �)Tod(t�1) � �·Trm(t�1) (2)
Where Tod(t�1) and Trm(t�1) are the mean temperature and therunning mean temperature for the previous day. Today’s runningmean can thus be simply calculated from yesterday’s meantemperature and yesterday’s running mean. The time series gives arunning mean temperature that is decreasingly affected by anyparticular temperature event as time passes. The larger the value of� the more important are the effects of past temperatures.
● Adopting an open posture (increases the area available for heat loss)● Taking off some clothing (increases heat loss)● Reducing the level of activity (reduces bodily heat production)● Having a beer (induces sweating, and increases heat loss)● Drinking a cup of tea (induces sweating, more than compensating
for its heat)● Eating less (reduces body heat production)● Adopting the siesta routine (matches the activity to the thermal
environment)● Turning on the air-conditioner (lowers the air temperature)● Switching on a fan (increases air movement, increasing heat loss)● Opening a window (reduces indoor temperature and increases
breeze)● Finding a cool spot or visiting a friend (hoping for a cooler
temperature)● Going for a swim (selects a cooler environment)● Building a better building (long-term way of finding a cooler spot)● Emigrating (long-term way of finding a cooler place)● Acclimatizing (letting body and mind adjust so that heat is less
stressful)
Roaf_Ch05.qxd 29/10/04 6:42 PM Page 146

Safe and warm; effect of climate change on thermal comfort and health 147
The aim is then to find the value of � which gives the bestcorrelation of outdoor running mean with the comfort temperature.The correlation of outdoor running mean temperature with comforttemperature rises gradually until � reaches about 0.8 and then startsto decrease. This suggests that though the peak in the correlationwith comfort temperature is small, there is a real effect. Thecorrelation with daily mean outdoor temperature Tod (� � 0) and withthe monthly mean of outdoor temperature (� � 0.95) are both lessthan the correlation with Trm where � � 0.8. A similar effect has beenfound to apply to clothing insulation.ii, iii
i McCartney, K.J and Nicol, J.F. (2002) Developing an adaptive controlalgorithm for Europe: Results of the SCATs project. Energy and Buildings, 34 (6),pp. 623–35.
ii Morgan, C.A., deDear, R. and Brager, G. (2002) Climate clothing andadaptation in the built environment. Indoor Air 2002: Proceedings of the 9thInternational Conference on Indoor Air Quality and Climate (ed. H. Levin), IndoorAir 2002, Santa Cruz, USA, vol. 5, pp. 98–103.
iii Nicol, F. and Raja, I. (1996) Thermal Comfort, Time and Posture: ExploratoryStudies in the Nature of Adaptive Thermal Comfort. School of Architecture,Oxford Brookes University.
NOTES AND REFERENCES
1 Levins, R. and Lewontin, R. (1985) The Dialectical Biologist.Cambridge, MA: Harvard University Press.
2 McIntyre, D.A. (1980) Indoor Climate. Applied Science Publishers.
3 Parsons, K.C. (2003) Human Thermal Environments, 2nd edn.Oxford: Blackwell Scientific.
4 Fanger, P.O. (1970) Thermal Comfort. Copenhagen: DanishTechnical Press.
5 Humphreys, M.A. (1992) Thermal comfort in the context ofenergy conservation. In S. Roaf and M. Hancock (eds), EnergyEfficient Buildings. Oxford: Blackwell Scientific.
6 deDear, R.J. and Brager, G.S. (1998) Developing an adaptivemodel of thermal comfort and preference. ASHRAE Transactions,104 (1), 145–67. See also ASHRAE Standard 55 (2004) Thermalenvironment conditions for human occupancy, American Societyof Heating Refrigeration and Air conditioning Engineers, Atlanta,Georgia, USA; and Nevins, R. and P. Gagge (1972) The newASHRAE comfort chart. ASHRAE Journal, 14, 41–3.
7 Nicol, J.F. and Humphreys, M.A. (1973) Thermal comfort as partof a self-regulating system. Building Research and Practice (JCIB), 6 (3), 191–7.
Roaf_Ch05.qxd 29/10/04 6:42 PM Page 147

148 Adapting Buildings and Cities for Climate Change
8 Humphreys, M.A. (1976) Field studies of thermal comfort com-pared and applied. Journal of the Institute of Heating andVentilating Engineers, 44, 5–27.
9 Nicol, J.F., Raja, I., Allaudin, A. and Jamy, G.N. (1999) Climaticvariations in comfort temperatures: the Pakistan projects.Energy and Buildings, 30, 261–79.
10 Humphreys, M.A. and Nicol, J.F. (1998) Understanding theadaptive approach to thermal comfort. ASHRAE Technical DataBulletin: Field Studies of Thermal Comfort and Adaptation, 14,1–14.
11 See both: Humphreys, M.A. (1976) Field studies of thermalcomfort compared and applied. Journal of Heating andVentilating Engineers, 44, 5–27, and: Humphreys, M.A. (1978)Outdoor temperatures and comfort indoors. Building Researchand Practice (J CIB), 6 (2), 92–105.
12 Auliciems, A. and deDear, R. (1986) Air conditioning in AustraliaI: human thermal factors. Architectural Science Review, 29,67–75.
13 Humphreys, M.A. and Nicol, J.F. (2000) Outdoor temperatureand indoor thermal comfort: raising the precision of the rela-tionship for the 1998 ASHRAE database of field studies.ASHRAE Transactions, 206 (2), 485–92.
14 Leaman, A.J. and Bordass, W.T. (1997) Productivity in build-ings: the ‘killer’ variables. Workplace Comfort Forum. London.
15 Baker, N.V. and Standeven, M.A. (1995) A behavioural approachto thermal comfort assessment in naturally ventilated buildings.Proceedings CIBSE National Conference. Eastbourne, publishedby the Chartered Institute of Building Service Engineers,London, pp. 76–84.
16 Nicol, J.F. and McCartney, K.J. (1999) Assessing adaptive oppor-tunities in buildings. Proceedings of the CIBSE NationalConference, published by the Chartered Institute of BuildingService Engineers, London, pp. 219–29.
17 Nicol, J.F. and Kessler, M.R.B. (1998) Perception of comfortin relation to weather and adaptive opportunities. ASHRAETransactions, 104 (1), 1005–17.
18 Nicol, J.F. (2000) Time and thermal comfort, evidence from thefield renewables: the energy for the 21st century, Proceedingsof the Fourth World Renewable Energy Congress, Brighton,edited by A. Sayigh, part 1. Oxford: Pergamon Press, pp. 477–82.
19 McCartney, K.J. and Nicol, J.F. (2002) Developing an adaptivealgorithm for Europe: results of the SCAT’s project. Energyand Buildings, 34 (6), pp. 623–35.
Roaf_Ch05.qxd 29/10/04 6:42 PM Page 148

Safe and warm; effect of climate change on thermal comfort and health 149
20 Keatinge W.R. and Donaldson, G.C. (2000) Cold weather, coldhomes and winter mortality. In J. Rudge and F. Nicol (eds),Cutting the Cost of Cold. Affordable Warmth for HealthierHomes. London: E&FN Spon, p. 17; see also Keatinge, W.R.,Donaldson, G.C., Cordioli, E., Martinelli, M., Kunst, A.E.,Mackenbach, J.P., Nayha, S. and Vuori, I. (2000) Heat-relatedmortality in warm and cold regions of Europe: an observationalstudy. British Medical Journal, 321, 670–3.
21 Bull, G.M. and Morton, J. (1978) Environment, temperatureand death rates. Age and Ageing, 7, 210–21.
22 Curwen, M. (1991) Excess winter mortality: a British phe-nomenon? Health Trends, 22, 169–75.
23 Collins, K.J. (2000) Cold, cold housing and respiratory illnesses.In J. Rudge and F. Nicol (eds), Cutting the Cost of Cold.Affordable Warmth for Healthier Homes. London: E&FN Spon,p. 45.
24 Keatinge, W.R. and Donaldson, G.C. (2000) Cold weather, coldhomes and winter mortality, p. 18.
25 Khaw, K.T. (1995) Temperature and cardiovascular mortality.The Lancet, 345, 337–8.
26 Collins, K.J. (2000) Cold, cold housing and respiratory illnesses,p. 46. See reference 23.
27 Kilbourne, E.M. (1992) Illness due to thermal extremes. InJ.M. Last and R.B. Wallace (eds), Public Health and PreventativeMedicine. Norwalk, CT: Appleton Lang, pp. 491–501; Keatinge,W.R., Coleshaw, S.R., Easton, J.C., Cotter, F., Mattock, M.B.and Chelliah, R. (1986) Increased platelet and red cell counts,blood viscosity, and plasma cholesterol levels during heatstress, and mortality from coronary and cerebral thrombosis:Am. J. Med., 81, 795–800.
28 Epstein, Y., Shani, Y., Moran, D.S. and Shapiro, Y. (2000) Exertionalheat stroke – the prevention of a medical emergency. Journalof Basic Clinical Physiology and Pharmacology, 11, 395–401.
29 Fonseka, M.M. (1999) Heat stroke in young adults. CeylonMedical Journal, 44, 184.
30 Havenith, G., Inoue, Y., Luttikholt, V. and Kenney, W.L. (1995)Age predicts cardiovascular, but not thermoregulatory,responses to humid heat stress. European Journal of AppliedPhysiology, 70, 88–96.
31 Wilkinson, P., Landon, M. and Stevenson, S. (2000) Housingand winter death: epidemiological evidence. In J. Rudge andF. Nicol (eds), Cutting the Cost of Cold. Affordable Warmthfor Healthier Homes. London: E&FN Spon, p. 27.
Roaf_Ch05.qxd 29/10/04 6:42 PM Page 149

150 Adapting Buildings and Cities for Climate Change
32 Help the Aged (2001) Addressing Excess Winter Deaths: TheCauses and Solutions. London: Help the Aged.
33 Curwen, M. (1981) Trends in Respiratory Mortality, 1951–75England and Wales. OPCS, DHI, no. 7. London: HMSO.
34 Boardman, B. (1986) Seasonal mortality and cold homes. InUnhealthy Housing Conference, Institution of EnvironmentalHealth Officers and Legal Research Institute, University ofWarwick, 14–16 December.
35 Boardman, B. (1991) Fuel Poverty: From Cold Homes toAffordable Warmth. London: Belhaven Press.
36 Rudge, J. (1994) Coal Fires, Fresh Air and the Hardy British.MSc thesis, London: University of East London.
37 Sakamoto-Momiyama, M. (1977) Seasonality in HumanMortality. Tokyo: University of Tokyo Press.
38 Henwood, M. (1997) Fuel Poverty, Energy Efficiency andHealth: A Report to Eaga CT. Keswick: Eaga Charitable Trust,p. 29.
39 Sartor, F., Snacken, R., Demuth, C. and Walckiers, D. (1995)Temperature, ambient ozone levels and mortality during sum-mer, 1994. Belgium: Environmental Research, 70, 105–13.
40 Huynen, M., Martens, P., Schram, D., Weijenberg, M. andKunst, A.E. (2001) The impact of heat waves and cold spellson mortality rates in the Dutch population. Environmental HealthPerspectives, 109, 463–70.
41 Katsouyanni, K., Trichopoulos, D., Zavitsanos, X. and Touloumi,G. (1988) The 1987 Athens heatwave. Letter in The Lancet,ii, 573.
42 Whitman, S., Good, G., Donoghue, E.R., Benbow, N., Shou,W. and Mou, S. (1997) Mortality in Chicago attributed to theJuly 1995 heat wave. American Journal of Public Health, 87,1515–18.
43 Hajat, S., Kovats, R.S., Atkinson, R.W. and Haines, A. (2002)Impact of hot temperatures on death in London: a time seriesapproach. Journal of Epidemiology and Community Health, 56,367–72.
44 Skinner, C.J. and Kuleshov, Y.A. (2001) Association betweenthermal stress and elderly mortality in Sydney – a comparisonof thermal sensation indices. Proceedings of the 2001 WindsorConference on Thermal Comfort, Cumberland Lodge, publishedby the Thermal Comfort Unit, Oxford Brookes University,Oxford, pp. 262–72.
45 Lowry, S. (1991) Housing and Health. London: BMJ Books.
Roaf_Ch05.qxd 29/10/04 6:42 PM Page 150

Safe and warm; effect of climate change on thermal comfort and health 151
46 Collins K.J. (1986) Low indoor temperatures and morbidity inthe elderly. British Journal of Hospital Medicine, 38 (6), 506–14.
47 Enquselassie, F., Dobson, A.J., Alexander, T.M. and Steele P.L.(1993) Seasons, temperature and coronary disease.International Journal of Epidemiology, 22 (4), 632–6.
48 Goodwin, J. (2000) Cold stress, circulatory illness and the eld-erly. In J. Rudge and F. Nicol (eds), Cutting the Cost of Cold.Affordable Warmth for Healthier Homes. London: E&FN Spon.
49 Raw, G. and Hamilton, R. (1995) Building Regulation and Health.Garston, Watford: Building Research Establishment.
50 Wilkinson, P., Landon, M. and Stevenson, S. (2000) Housingand winter death: epidemiological evidence. In J. Rudge andF. Nicol (eds), Cutting the Cost of Cold. Affordable Warmthfor Healthier Homes. London: E&FN Spon.
51 Aylin, P., Morris, S., Wakefield, J., Grossinho, A., Jarup, L. andElliott, P. (2001) Temperature, housing, deprivation and theirrelationship to excess winter mortality in Great Britain1986–1996. International Journal of Epidemiology, 30, 1100–8.
52 Kilbourne, E.M (1992) Illness due to thermal extremes. In J.M.Last and R.B. Wallace (eds), Public Health and PreventativeMedicine. Norwalk, CT: Appleton Lang, pp. 491–501.
53 Sierra Pajares Ortiz, M., Diaz Jemenez, J., Montero Robin, J.,Alberdi, J. and Miron Perez, I. (1997) Daily mortality in theMadrid community during 1986–91 for the group between 45and 64 years of age: its relationship to air temperature, in theSpanish Review of Public Health. Review Espania Salud Publica,71, 149–60.
54 Faunt, J.D, Wilkinson, T.J., Aplin, P., Henschke, P., Webb, M.and Penhall, R.K. (1995) The effete in the heat: heat-relatedhospital presentations during a ten day heat wave. Australianand New Zealand Journal of Medicine, 25, 117–20.
55 Lye, M. and Kamal, A. (1977) Effects of a heatwave on mortality-rates in elderly inpatients. The Lancet, i, 529–31.
56 Christoffel, K.K. (1985) Effect of season and weather on pedi-atric emergency department use. American Journal ofEmergency Medicine, 3, 327–30.
57 Kilbourne, E.M. (1989) Heat waves. In M.B. Gregg (ed.), ThePublic Health Consequences of Disasters. Atlanta, GA: USDepartment of Health and Human Services, Centers for DiseaseControl, pp. 51–61.
58 Semenza, J.C., Rubin, C.H., Falter, K.H., Selanikio, J.D.,Flanders, W.D., Howe, H.L. and Wilhelm, J. (1996) Heat-related
Roaf_Ch05.qxd 29/10/04 6:42 PM Page 151

152 Adapting Buildings and Cities for Climate Change
deaths during the July 1995 heat wave in Chicago. New EnglandJournal of Medicine, 335, 84–90.
59 Naughton, M.P., Henderson, A., Mirabelli, M., Kaiser, R.,Wilhelm, J., Kieszak, S., Rubin, C. and McGeehin, M. (2002)Heat related mortality during a 1999 heatwave in Chicago.American Journal of Preventative Medicine, 22, 221–7.
60 Clarke, J.F. (1972) Some effects of the urban structure on heatmortality. Environmental Research, 5, 93–104.
61 Oke, T.R. (1997) Urban climates and global environmentalchange. In R. Thompson and A. Perry (eds), Applied Climatology:Principles and Practice. London: Routledge, pp. 273–87.
62 Henschel, A., Burton, L., Margolies, L. and Smith. J. (1969)An analysis of the heat deaths in St Louis during July 1966.American Journal of Public Health, 59, 2232–42.
63 Schuman, S.H. (1972) Patterns of urban heatwave deaths andimplications for prevention: data from New York and St Louisduring July 1966. Environmental Research, 5, 59–75.
64 Rooney, C., McMichael, A.J., Kovats, R.S. and Coleman, M.(1998) Excess mortality in England and Wales, and in GreaterLondon, during the 1995 heatwave. Journal of Epidemiologyand Community Health, 52, 482–6.
65 Katsouyanni, K., Trichopoulos, D., Zavitsanos, X. and Touloumi,G. (1988) The 1987 Athens heatwave letter. The Lancet, ii, 573.
66 Jones, T.S., Liang, A., Kilbourne, E., Griffin, M., Patriarca, P.,Wassilak, S., Mullan, R., Herrick, R., Donnell Jr, H., Choi, K.and Thacker, S. (1982) Morbidity and mortality associated withthe July 1980 heat wave in St Louis and Kansas City. Journalof the American Medical Association, 247, 3327–31.
67 Sheridan, S. (2003) Heat, mortality and level of urbanization.Climate Research, 24, pp. 255–65.
68 Hales, S., Kjellstrom, T., Salmond, C., Town, G. and Woodward, A.(2000) Daily mortality in Christchurch New Zealand in relationto weather and air pollution. Australian and New Zealand Journalof Public Health, 24, 89–91.
69 Smoyer, K.E. (1998) Putting risk in its place: methodologicalconsiderations for investigating extreme event health risks.Social Science and Medicine, 47, 1809–24.
70 Kunst, A., Looman, C. and Mackenbach, J. (1993) Outdoorair temperature and mortality in the Netherlands: a timeseries analysis. American Journal of Epidemiology, 137,331–41.
Roaf_Ch05.qxd 29/10/04 6:42 PM Page 152

Safe and warm; effect of climate change on thermal comfort and health 153
71 Katsouyanni, K., Pantazopoulu, A., Touloumi, G., Tselepidaki, I.,Moustris, K., Asimakopoulos, D., Poulopoulou, G. andTrichopoulos, D. (1993) Evidence of interaction between airpollution and high temperatures in the causation of excessmortality. Archives of Environmental Health, 48, 235–42.
72 Shumway, R., Azari, A. and Pawitan, Y. (1988) Modelling mor-tality fluctuations in Los Angeles as functions of pollution andweather effects. Environmental Research, 45, 224–41.
73 DETR (2000) English House Condition Survey 1996, EnergyReport. Published by the Stationery Office, London.
74 Moore, R. (2001) Personal communication.
75 Nevrala, D. (1979) The effect of insulation, mode of operationand air leakage on the energy demand of dwellings in the UK.Ventilation of Domestic Buildings. Published by British Gas,London.
76 Eurowinter Group: Keatinge, W., Donaldson, G., Bucher, K.,Cordioli, E., Dardanoni, L., Jendritzky, K., Katsouyanni, K., Kunst, A.,Mackenbach, J., Martinelli, M., McDonald, C., Nayha, S. andVuori, I. (1997) Cold exposure and winter mortality fromischaemic heart disease, cerebrovascular disease, respiratorydisease, and all causes in warm and cold regions of Europe.The Lancet, 349, 1341–6.
77 Rudge, J. (1996) British weather: conversation topic or seri-ous health risk? Int. Journal of Biometeorology, 39, 151–5.
78 Collins, K., Exton-Smith, A. and Dore, C. (1981) Urbanhypothermia: preferred temperature and thermal perception inold age. British Medical Journal, 282, 175–7.
79 Koppe, C., Jendritzky, G., Kovats, R. and Menne, B. (2003)Heatwaves: Impacts and Responses. WHO, Copenhagen.
80 Kovats, S., Wolf, T. and Menne, B. (2004) Heatwave of August2003 in Europe: provisional estimates of the impact on mor-tality. Euroserveillance Weekly, 8 (11), 11 March 2004.
81 House of Commons Hansard, 20 December 1999, Column436; http://www.parliament.the-stationery-office.co.uk/pa/cm199900/cmhansrd/vo991220/text/91220w33.htm#91220w33.html_spnew4.
82 Auger, N., Kosatsky, T. (2002) Chaleur accablante: Mise à jourde la littérature concernant les Impacts de santé publique etproposition de mesures d’adaptation. Montréal, Régie régionalede la santé et des services sociaux de Québec, Direction dela santé publique.
Roaf_Ch05.qxd 29/10/04 6:42 PM Page 153

Water is the most fundamental building block of life itself and aswe approach the years of the water wars an excess, or lack, ofwater may present the greatest hazards we face in building durablesettlements in the future, even in ‘rainy’ Britain.
PRECIPITATION TRENDS IN BRITAIN
Britain is fortunate in its verdant landscapes and its future pre-dicted climates. While the changes to predicted precipitation overthe next decades appear to be severe for us, they are survivable,with prudent and judicious management.
Winter precipitation in the UK is predicted to increase for all peri-ods and for all climate change scenarios. By the 2080s, this increaseranges from between 10% and 20% for the Low Emissionsscenario (depending on region) to between 15% and 35% for theHigh Emissions scenario. Conversely the summer pattern is reversedand almost the whole of the UK may become drier, with a decreasein rainfall for the Low Emissions scenario of up to 35%, and forthe High Emissions scenario of a staggering 50% or more. Thehighest changes in precipitation in both winter and summer arepredicted for eastern and southern parts of England, while changesare smallest in the northwest of Scotland.1 What we are lookingat here is the increasing risk of summer droughts and winter flooding.
Annual average precipitation changes across the UK maydecrease slightly by between 0% and 15% by the 2080s, althoughthere are likely to be large regional and seasonal differences in thechanges.
It should be noted that these are averages. If one were to takeextreme events into account, according to an analysis published inNature2 in 2002, there is a consensus in the results from all the19 major climate change models around the world that the chances
6 HOW WET WILL IT GET?
Roaf_Ch06.qxd 29/10/04 6:43 PM Page 154

of a very wet winter in Britain could increase fivefold by the endof the century. This means that flood events are likely to show adramatic increase in frequency, and this has been reflected in thework being undertaken under the Foresight scenarios initiative inBritain (see the section on scenarios on the website: http://books.elsevier.com/companions/0750659114).
Rainfall is likely to also become more intense. Figure 6.1 showsthat in both winter and summer the patterns of rainfall will changeenormously, except perhaps for northwest Scotland. The figureshows there is over a 50% probability that more or less intenserainfall will be experienced in a given year and season for the dif-ferent regions of the country. So for the southeast in particular, inwinter, there will be much more rain, falling more intensely, lead-ing inevitably to much higher flood risks for the region.
Snowfall amounts will decrease significantly through the UK, per-haps by between 30% and 90% by the 2080s. There will be lesssnow over the whole UK and for all scenarios, with the largest per-centage reductions, up to 90% or more by the 2080s for the HighEmissions scenario, around the coast and in the English lowlands.In relative terms the Scottish Highlands will experience the small-est reductions, but even here total snowfall by the 2080s mightdecrease by 60% or more relative to present-day totals. Some areasof the UK are increasingly likely to experience quite long runs ofsnowless winters.
Humidity
As the climate warms, the specific humidity, the absolute amountof moisture in the atmosphere, will increase through the year, althoughthe relative humidity may decrease, especially in the summer. Cloudcover in summer and autumn may decrease, especially in the south.Summer sunshine and solar radiation may correspondingly increase.
SEASONAL CHANGES
By the 2050s, typical spring temperatures may occur between oneand three weeks earlier than at present (this statement relates tothe means for the 1990s rather than 2003 which was alreadyexceptional) and the onset of present winter temperatures may bedelayed between one and three weeks. This is likely to lead to alengthening of the growing season for plants.
The heating and cooling requirements of buildings will alsochange, with less energy being needed to heat buildings in the
How wet will it get? 155
Roaf_Ch06.qxd 29/10/04 6:43 PM Page 155
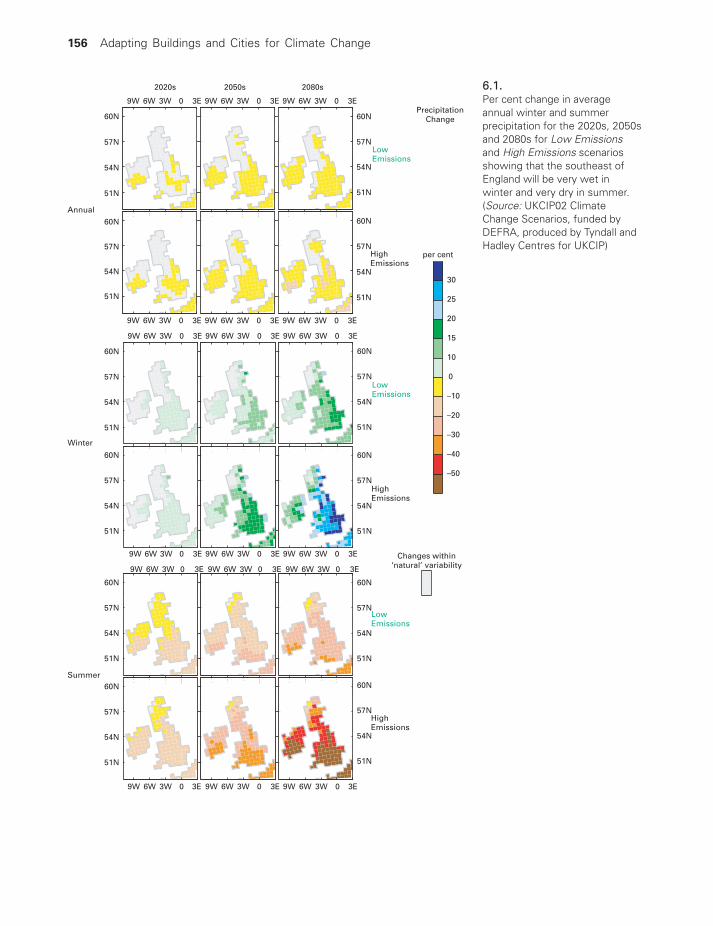
6.1.Per cent change in averageannual winter and summerprecipitation for the 2020s, 2050sand 2080s for Low Emissionsand High Emissions scenariosshowing that the southeast ofEngland will be very wet inwinter and very dry in summer.(Source: UKCIP02 ClimateChange Scenarios, funded byDEFRA, produced by Tyndall andHadley Centres for UKCIP)
156 Adapting Buildings and Cities for Climate Change
per cent
–50
–40
–30
–20
–10
0
10
15
20
25
30
9W 6W 3W 0 3E
51N
54N
57N
60N
2020s
9W 6W 3W 0 3E
2050s
9W 6W 3W 0 3E
51N
54N
57N
60N
2080s
9W 6W 3W 0 3E
51N
54N
57N
60N
9W 6W 3W 0 3E 9W 6W 3W 0 3E
51N
54N
57N
60N
9W 6W 3W 0 3E
51N
54N
57N
60N
9W 6W 3W 0 3E 9W 6W 3W 0 3E
51N
54N
57N
60N
9W 6W 3W 0 3E
51N
54N
57N
60N
9W 6W 3W 0 3E 9W 6W 3W 0 3E
51N
54N
57N
60N
9W 6W 3W 0 3E
51N
54N
57N
60N
9W 6W 3W 0 3E 9W 6W 3W 0 3E
51N
54N
57N
60N
9W 6W 3W 0 3E
51N
54N
57N
60N
9W 6W 3W 0 3E 9W 6W 3W 0 3E
51N
54N
57N
60N
LowEmissions
HighEmissions
Annual
LowEmissions
HighEmissions
Winter
LowEmissions
HighEmissions
Summer
Changes within‘natural’ variability
PrecipitationChange
Roaf_Ch06.qxd 29/10/04 6:43 PM Page 156

6.2.Percentage change in the 2080sin the maximum dailyprecipitation amount which has a50% chance of occurring in agiven year, showing that drysummer weather in the south ofEngland and Ireland will be aproblem by the 2080s. (Source:UKCIP02 Climate ChangeScenarios, funded by DEFRA,produced by Tyndall and HadleyCentres for UKCIP)
How wet will it get? 157
6.3.Percentage change in averagewinter snowfall amount in the2080s showing that WhiteChristmases will be a thing of thepast in most places by the 2080s.(Source: UKCIP02 ClimateChange Scenarios, funded byDEFRA, produced by Tyndall andHadley Centres for UKCIP)
9W 6W 3W 0 3E
51N
54N
57N
60N
LO EM
Annual9W 6W 3W 0 3E
Winter9W 6W 3W 0 3E
51N
54N
57N
60N
Summer
51N
54N
57N
60N
M-L EM
51N
54N
57N
60N
51N
54N
57N
60N
M-H EM
51N
54N
57N
60N
9W 6W 3W 0 3E
51N
54N
57N
60N
HI EM
9W 6W 3W 0 3E 9W 6W 3W 0 3E
51N
54N
57N
60N
percent
–40
–30
–20
–10
–5
0
5
10
15
20
25
(2080s)Changes within
‘natural’ variabilityAverage winter snowfall change (per cent)
–10–20–30–40–50–60–70–80–90
High Emissions
60N
57N
54N
51N
3E03W6W9W
3E03W6W9WM-H Emissions
3E03W6W9W
3E03W6W9WM-L Emissions
3E03W6W9W
3E03W6W9WLow Emissions
60N
57N
54N
51N
3E03W6W9W
3E03W6W9W
Roaf_Ch06.qxd 29/10/04 6:43 PM Page 157

UK through the winter and more energy needed to cool buildings,particularly ones that are poorly designed for the climate.
CHANGES IN WEATHER EXTREMES
High summer temperatures will become more frequent and verycold winters will become increasingly rare. A very hot August, suchas experienced in 1995, and the record breaking summer of 2003,with average temperatures many degrees above ‘normal’, mayoccur as often as once in five years by the 2050s and three yearsout of five by the 2080s for the Medium High Emissions scenario.Even for the Low Emissions scenario about two summers in threemay be as hot as, or hotter than 1995 by the 2080s, or even per-haps than 2003. The Southeast of England is predicted to become50–60% drier in hot summers.
One consequence of the drier summer climate will be that sum-mer soil moisture by the 2050s may be reduced by about 30%over parts of England for the High Emissions scenario and by 40%or more by the 2080s. This has obvious implications for soil shrink-age and related building damage. This will be further exacerbatedby significant regional differences in rainfall and the southeast ofEngland, where the clay soils are particularly susceptible to shrink-age and will be badly affected.
Drought could even increase the flooding risk: in Amsterdam insummer 2003 the drought conditions weakened a raised river embank-ment so much that it gave way, causing localized flooding. In Shetlandin summer 2003, prolonged drought conditions weakened the peatcovering a hillside, and when there was a heavy shower of rain itresulted in a peat slide which engulfed several houses.
Extreme winter precipitation will become more frequent and bythe 2080s daily precipitation intensities that are experienced onceevery two years on average may become up to 30% heavier, andthat means the increasing likelihood of flooding, and increasedseverity of flooding.
Very dry summers, like 1995, may occur in half the years by2080, while very wet winters may occur on average almost onea decade for the Medium High Emissions scenarios. The combi-nation of hot and dry conditions in summer will also become morecommon and by the 2080s virtually every summer over Englandand Wales, whether for the Low Emissions or High Emissions sce-nario, may be warmer and drier than the summer of 2001.
A number of basic precautions need to be taken for individualbuildings to protect them from very wet or dry spells. For periodsof heavy rainfall wide storm gutters should be provided, walls, andespecially their feet, should be protected from driving rain and
158 Adapting Buildings and Cities for Climate Change
Roaf_Ch06.qxd 29/10/04 6:43 PM Page 158
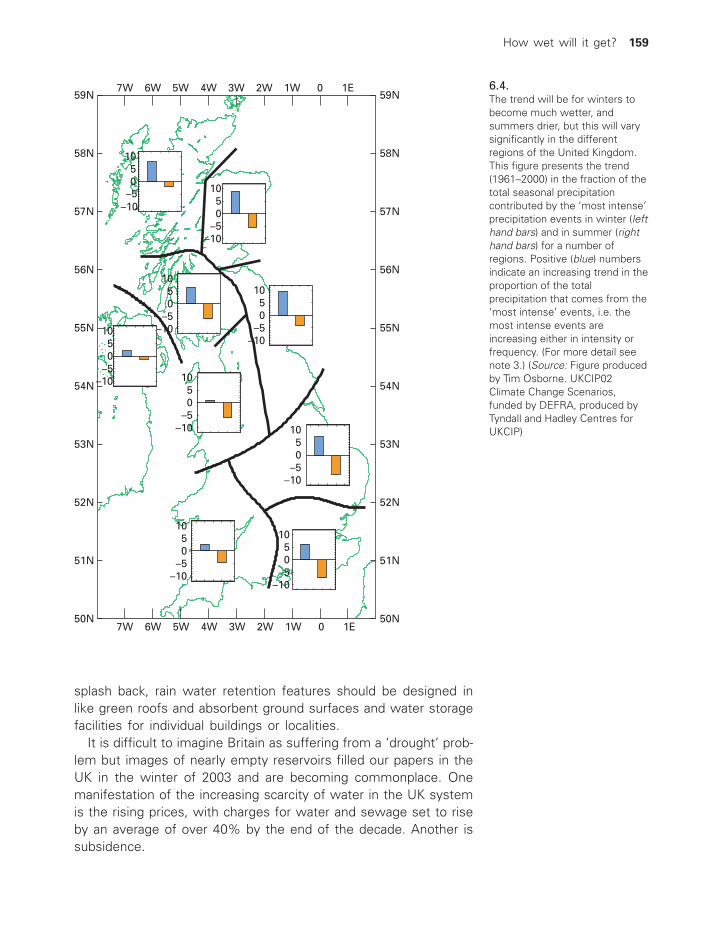
splash back, rain water retention features should be designed inlike green roofs and absorbent ground surfaces and water storagefacilities for individual buildings or localities.
It is difficult to imagine Britain as suffering from a ‘drought’ prob-lem but images of nearly empty reservoirs filled our papers in theUK in the winter of 2003 and are becoming commonplace. Onemanifestation of the increasing scarcity of water in the UK systemis the rising prices, with charges for water and sewage set to riseby an average of over 40% by the end of the decade. Another issubsidence.
6.4.The trend will be for winters tobecome much wetter, andsummers drier, but this will varysignificantly in the differentregions of the United Kingdom.This figure presents the trend(1961–2000) in the fraction of thetotal seasonal precipitationcontributed by the ‘most intense’precipitation events in winter (lefthand bars) and in summer (righthand bars) for a number ofregions. Positive (blue) numbersindicate an increasing trend in theproportion of the totalprecipitation that comes from the‘most intense’ events, i.e. themost intense events areincreasing either in intensity orfrequency. (For more detail seenote 3.) (Source: Figure producedby Tim Osborne. UKCIP02Climate Change Scenarios,funded by DEFRA, produced byTyndall and Hadley Centres forUKCIP)
How wet will it get? 159
50N
51N
52N
53N
54N
55N
56N
57N
58N
59N
50N
51N
52N
53N
54N
55N
56N
57N
58N
59N7W 6W 5W 4W 3W 2W 1W 0 1E
7W 6W 5W 4W 3W 2W 1W 0 1E
–10
05
10
–5
–10–505
10
–10–505
10
–10–505
10
–10–505
10–10–505
10
–10–505
10
–10–505
10
–10–505
10
Roaf_Ch06.qxd 29/10/04 6:43 PM Page 159

SUBSIDENCE
While the actions of planners in allowing development in flood plainsare a concern, perhaps an even bigger concern is the outlook forfuture subsidence exposures. Subsidence claims currently cost insur-ers an average of £1 million per day, and this is likely to increase.At least planners frequently consult with the Environment Agencyabout flood risks, but there is no obligation on them to consult withthe British Geological Survey (BGS) about subsidence risks. Not onlyis there the issue of increasing droughts due to climate change caus-ing subsidence on shrinkable clay soils, there are also issues ofbuilding on unsuitable ground. There are planning policy guidelinesfor unstable land (PPG14) and contaminated land (PPG23A), but oftenthe ground conditions stem from very old workings where only BGS,with their huge archive of 640 000 borehole samples, are aware ofproblems. The 1991 Building Regulations under the 1984 BuildingAct focus on the structure, not the site, and the only regulationsrelating to the site are those dealing with Radon gas (BR211).
The government has said that to save using too much agricul-tural land, 60% of the 3.8 million projected new houses will haveto be built on ‘brownfield sites’. Many of these sites will containmade up ground, landfill, old mine workings and contamination.While the government has indicated that assistance may be avail-able to remediate some sites for housing, many authorities are toosmall to have the expertise or the finance to obtain the informa-tion needed about the site. If the planners do not know of theproblems and do not ask about them, then adequate remediationwill not take place, and the planning policy guidelines will not beapplied. The issue of increasing subsidence risk caused by climatechange-induced droughts has already been outlined in this study;this risk would be greatly compounded if there are many morehouses built on unsuitable ground. This could create major prob-lems for insurers, and there is a very real danger that irresponsi-ble local authorities may earn such a bad reputation for this thatall new housing in their area might become an unacceptably highrisk for subsidence cover.
The potential scale of this problem was outlined in October 2003,when the city of Shanghai announced that the land of the city wassubsiding at a rate of 2.5 cm a year because so many new towerblocks were being built and so much water was being pumpedfrom the underground reserves to provide drinking water for theexploding population of over 20 million people. These problemsmay be significantly increased with changing rainfall patterns.4
In the UK an indication of the growing problem was given in thelong hot summer of 2003, when the Direct Line Insurance company
160 Adapting Buildings and Cities for Climate Change
Roaf_Ch06.qxd 29/10/04 6:43 PM Page 160

stated that, owing to the six dry months experienced in the southand east of the country, they saw increases in subsidence claimsof 38% in June and 15% in July compared to the same periodsin 2002.5
These are some of the problems faced by the UK. How muchworse for those countries of the world where there is already achronic water shortage, causing civil unrest and threatening war!
CIVIL UNREST
Civil unrest because of water is a growing problem in many coun-tries, as the following examples confirm.
In Spain there have been a number of bitter demonstrations overthe diversion of a staggering 30% of the waters of the river Ebroin the northeast of the country through a new canal to the parchedsoutheastern provinces of Murcia, Valencia and Andalucia wherethe great tourism centres of the Costa del Sol are based. Six damshave flooded the unique wildlife habitats in the north and the flat-land habitats of the Ebro delta are disappearing at an alarming rate.Over 80% of the total Spanish budget for environmental projectshas recently been channelled into the canal scheme, which isdesigned to take water from what is seen as the poorer provincesto fill the swimming pools of the rich in the south.6 One of themain problems with the project, objectors claim, is that the cal-culations of river flows were done based on historic climates fromthe middle of the last century, while conditions in the 21st cen-tury will be very different, leading to potentially catastrophic con-sequences for the future of the whole of eastern Spain.
The fact that water shortages can lead to local environmentalcrime waves was highlighted by the strange case of stealing waterin Australia during a drought of 2003. Robbers used a range ofequipment, including earth movers, to steal water in over 146reported cases, often from neighbouring dams and billabongs. Oneof the advantages of stealing water from neighbours is that it getsaround the draconian Australian water laws that put very strict con-ditions on the drilling of bore holes or taking water from rivers, sothe law may, as here, encourage environmental crime. Statisticsin Australia suggest that some 40 000 jobs have already been lostbecause of the 2003 drought and it is expected to cost the coun-try over £1.3 billion in that year alone.
WATER WARS
When incidents occur within national boundaries the unrest is dealtwith by law. When the incidents involve two countries then that
How wet will it get? 161
Roaf_Ch06.qxd 29/10/04 6:43 PM Page 161

may trigger a war. The global Water Wars have long been pre-dicted and there are a number of flash points for such conflictsaround the world from the Mekong to the Rhône.
One high profile region where chronic water shortages combinewith political instability is around the River Jordan. Despite a far-sighted programme to bring Jordanian, Palestinian and Israelihydrologists together to improve water quality in the river, andmanage water demand and supply in the region, water availabilitywill inevitably remain a flash point, particularly as populations inthe regions continue to grow rapidly and rainfall can be virtuallynon-existent during periods of drought and, under conditions ofdrier summers with climate change. One hope lies in the devel-opment of desalinating technology, such as already supplies muchof the water for the city of Eilat, with its population of 56 000people, and the 80% of the water requirements of the Kibbutzimof the Negev desert7 adjacent to the Dead Sea that has alreadydropped a massive 17 metres since 1975 according to the TimesAtlas of the World.
On an even larger scale, the Aral Sea has been described as theworst environmental disaster in the world and it is predicted thatwithin ten years it will be the cause of armed conflict. The salineinland sea, divided between the former Soviet Republics ofKazakhstan and Uzbekistan, has been drying up for the past 25 yearssince the former USSR began a vast irrigation scheme drawing waterfrom its two tributary rivers to grow cotton and rice in the desert.The irrigated area expanded from 6 million hectares in the 1960s to8 million hectares and the sea began to shrink. It is now reducedto three separate parts and is still evaporating. The shore-line has
162 Adapting Buildings and Cities for Climate Change
6.5.Droughts are increasinglythreatening not only agriculturebut also the availability of waterfrom ground and surfacesources. It is settlements on theland between the desert and thesown that will dry first, and thosewhere ground water pumpinghas caused a sudden dropping ofthe water table, as in the villagesaround the central Persian desert.(Source: Sue Roaf)
Roaf_Ch06.qxd 29/10/04 6:44 PM Page 162

receded on average by 250 kilometres and the salinity has increaseddramatically, making the water a viscous salt paste in many parts,containing pesticides and minerals. High levels of liver and kidneycancer around the sea have become commonplace. Although anaction plan has been introduced there seems to be little agreementbetween the five countries that border the lake on how to moveforward and a proposed dam to the north of the sea, to be built byKazakhstan, may prove the final straw that leads to an inevitablewater war in the region.8
Again and again such examples can be shown, as in the constantstruggle between Turkey, Syria and Iraq over the waters of the Tigrisand Euphrates rivers. India plans to divert large quantities of waterfrom major rivers, including the Ganges and Brahmaputra, threat-ening the livelihoods of more than 100 million people downstreamin Bangladesh. The ambitious plans to link major rivers flowing fromthe Himalayas and divert them south through drought-prone areasare still on the drawing board but so concerned is Bangladesh thatthey are considering appealing to the United Nations to redraft inter-national law on water sharing. The project is vast and projected tocost between £44 and £125 billion and will take at least 14 yearsto complete. If the project goes ahead Bangladesh may have tobuild a huge network of canals to irrigate the farmlands now wateredby the Brahmaputra but they claim the whole scheme would havecatastrophic effects on their country. Another water war brewingperhaps?9
BORE HOLE WATER
One of the problems with bore hole drilling is that it leads to areduction in the resource. Groundwater is the main supply for morethan 2 billion people in the world and is diminishing almost every-where. Beneath Mexico City the water table has fallen on aver-age 2 m and in the American Mid-West water tables have fallen3 m in a decade and 30 m in some places. So much has beenpumped from beneath Florida that in some places the aquifers areat risk from being flooded by sea water. Twelve cities of morethan 10 million people rely on underground water reserves, includ-ing Shanghai, Bangkok, London and Calcutta. Water is used forthe rapidly growing global population, in industry and agriculture.It takes 1000 tonnes of water to grow a tonne of wheat, 2000tonnes to grow a tonne of rice, and small farmers in many regionswill be the first to suffer as aquifers dry up. The estimated per-centages of populations dependent on groundwater for differentregions includes 75% in Europe, 32% in Asia Pacific, 29% forCentral and South America and 32% for the world on average.10
How wet will it get? 163
Roaf_Ch06.qxd 29/10/04 6:44 PM Page 163

WHO OWNS THE WATER?
Here we have the problem of who owns the water in the ground,a question rather like who owns the air? One thing is for sure –that it is not Coca-Cola. In Kochi, India, in December the local ‘Davids’,in the form of a group of villagers, took the ‘Goliath’ of the majorsoft drinks corporation Hindustan Coca-Cola Beverages, to the KeralaHigh Court to direct it to stop drawing groundwater for use in itsbottling plant at Plachimedu in the Palakaad district. David won, andthe court directed the local council and the state government toensure that the plant does not extract groundwater after a speci-fied time. The court decreed that the groundwater beneath land isnot owned by the landowner. Normally, every landowner can drawa ‘reasonable’ amount of groundwater which is necessary for theirdomestic and agricultural requirements. But here, 510 kilolitres ofwater was extracted per day, converted to products and transportedout of the state, thus breaking the ‘natural water cycle’, and caus-ing the drying up of village fields for miles around the plant. Extractionof the groundwater, even up to the admitted limit by the company,was illegal, the court held. The company had no legal right to extractthis much natural wealth and the Panchayat and the governmentwere bound to prevent it. The court held that the groundwaterbelongs to the general public and the company had no right to claima huge share of it. The government also has no power to allow aprivate party to extract such a huge quantity of groundwater, theresult of which could be drying up of water tables. So let the buyerbeware for high water use industries in the future.11
The Coca-Cola case is an issue of the over-exploitation of thecapacity of the environment to provide enough water to sustainboth soft drink production at the required level, while supportingthe expectations of the traditional local community. This basic cal-culation of capacity should have been done and reviewed at theplanning stage of the factory development.
WHO OWNS THE WATER PROBLEM?
There are two issues here:
● The first is unsustainable development – the project exceedingthe environmental capacity of the area to support it. This should,from what we have seen in the Coca-Cola case above, be doneusing calculations of current water resources, under future cli-mate scenarios, to evaluate the reducing capacity of the envi-ronment to support too great a demand on it. The capacitycalculations should be produced at the planning stage as partof the sustainability statement of a project and the decisions
164 Adapting Buildings and Cities for Climate Change
Roaf_Ch06.qxd 29/10/04 6:44 PM Page 164

to reject plants like that at Kochi taken before too great a lossis incurred.
● The second issue is that clear laws should exist on the appor-tioning of the available water to ensure that the basic humanright to clean water is maintained for as long as is humanlypossible.12
But these issues are pertinent even here in Britain, where thegovernment should be asked questions like:
● Was the chronic water shortage in the Southeast, now and inthe future, taken into account when permission was given tobuild the Thames Gateway development, east of London, with200 000 new homes?
● What are the extra infrastructural costs of placing those newhomes in the Southeast, where new dams and water plantshave to be built to cope with the increase, as opposed to theNorthwest where there will be more water in summer, and thelong term costs will be lower for the ordinary householder andwho pays for them?
● Does the ordinary householder agree to pay the increase waterbill costs so that those extra 200 000 can live in the ThamesGateway?
● How has the serious problem of more homes exacerbatingsummer droughts in the Southeast been dealt with in theplanning process?
● Will farmers who have less and less water available to them,and who are already suffering from drought stress in arablecrops, with irrigation water having to be saved for higher value vegetable and salad crops,13 be able to claim compensationfrom the politicians who unwisely approved developmentsthat exceeded that capacity of the regional environment tosupport them?
FLOODING IN BRITAIN
Flooding is an increasingly chronic problem globally. In the UK itis predicted to significantly increase due to:
● Increased winter rainfall.● Higher sea levels, in conjunction with higher wave heights and
bigger storm surges.● More intense and frequent winter storms. It is difficult to predict
storm incidence and while the Hadley Centre model predictsan increase, a number of other models do not. It is safe to saythat storms will be wetter, however.
How wet will it get? 165
Roaf_Ch06.qxd 29/10/04 6:44 PM Page 165
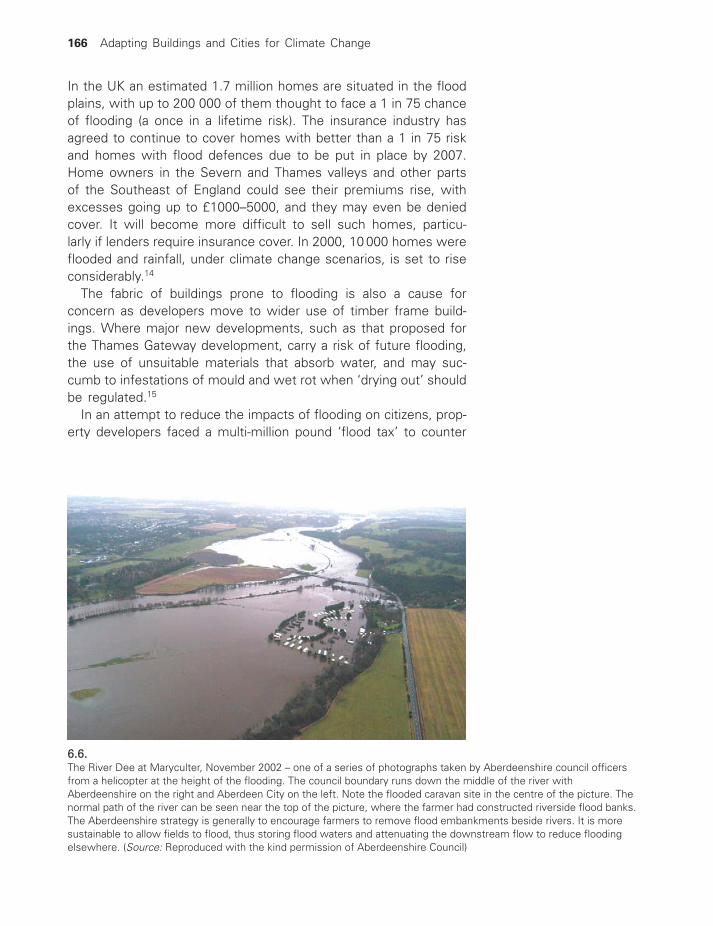
In the UK an estimated 1.7 million homes are situated in the floodplains, with up to 200 000 of them thought to face a 1 in 75 chanceof flooding (a once in a lifetime risk). The insurance industry hasagreed to continue to cover homes with better than a 1 in 75 riskand homes with flood defences due to be put in place by 2007.Home owners in the Severn and Thames valleys and other partsof the Southeast of England could see their premiums rise, withexcesses going up to £1000–5000, and they may even be deniedcover. It will become more difficult to sell such homes, particu-larly if lenders require insurance cover. In 2000, 10 000 homes wereflooded and rainfall, under climate change scenarios, is set to riseconsiderably.14
The fabric of buildings prone to flooding is also a cause forconcern as developers move to wider use of timber frame build-ings. Where major new developments, such as that proposed forthe Thames Gateway development, carry a risk of future flooding,the use of unsuitable materials that absorb water, and may suc-cumb to infestations of mould and wet rot when ‘drying out’ shouldbe regulated.15
In an attempt to reduce the impacts of flooding on citizens, prop-erty developers faced a multi-million pound ‘flood tax’ to counter
6.6.The River Dee at Maryculter, November 2002 – one of a series of photographs taken by Aberdeenshire council officersfrom a helicopter at the height of the flooding. The council boundary runs down the middle of the river withAberdeenshire on the right and Aberdeen City on the left. Note the flooded caravan site in the centre of the picture. Thenormal path of the river can be seen near the top of the picture, where the farmer had constructed riverside flood banks.The Aberdeenshire strategy is generally to encourage farmers to remove flood embankments beside rivers. It is moresustainable to allow fields to flood, thus storing flood waters and attenuating the downstream flow to reduce floodingelsewhere. (Source: Reproduced with the kind permission of Aberdeenshire Council)
166 Adapting Buildings and Cities for Climate Change
Roaf_Ch06.qxd 29/10/04 6:44 PM Page 166

the spiralling costs of climate change. A DEFRA (Department ofEnvironment, Food and Rural Affairs) report in January 2003 rec-ommended that developers who build on the flood plain shouldbe made to pay a one-off fee to help raise over £20 million to con-struct coastal and river defence systems. Spending on flood pro-tection will rise from £411 million in 2002 to £564 million by 2005although this falls far short of the investment required to protectpeople in areas vulnerable to flooding from the increased risks theyface due to climate change. Environmental groups at that timeobjected to the conclusions of the report, which they said wasactually encouraging development on flood plains while theHousebuilder’s Federation warned that the proposed charges wouldexacerbate housing shortages by pushing up the market prices ofhomes.16 The tax, of course, was not introduced.
Another major problem that may also result from flooding is thecontamination of land. A key feature of many pollutants is that theyare more likely to move in wet, than in dry soil. Many sites onflood plains with a history of soil toxicity may become more toxicif the soil is flooded. In this case, even if a portion of the topsoilhas been removed and replaced, if regularly flooded, pollutants mayleach through the new topsoil towards the surface. So the worstconditions are provided by a combination of contaminated land andregularly inundated sites, highlighting the problems of containingcontamination from industrial sites on flood plains.
A major concern in Britain, prone as it is to flooding, continuesto be that of new developments in flood plains being permittedregardless of the impacts they will have in increasing flood risks inadjacent areas. A number of problems heighten risks of flooding
6.7.Not only are settlementsvulnerable to river and coastalflooding but also transport routes,agriculture and health from thespread of pollution and sewage.The scale of the problem ishinted at by this view of the RiverSevern in flood. (Source:R.L. Wilby, Environment Agency)
How wet will it get? 167
Roaf_Ch06.qxd 29/10/04 6:44 PM Page 167

resulting from these new developments: one is that many planningofficers and members of committees on local councils simply donot understand the issues involved because they are not presentedwith adequately explained information; a second is that the method-ologies for evaluating the knock-on risks for local communities ofsuch decisions are not available to them; and thirdly human natureis such that it is often more convenient for people to bury theirhead in the sand and ignore such real problems, perhaps due to alack of imagination in many.
Even the ‘experts’ do not agree on how to correctly calculateflood-related impacts, as is evidenced by a bitter battle being foughtover a series of new developments by Kohn Pederson Fox, RMJMand Nicholas Grimshaw & Partners on the banks of the River Clydein Scotland. The project requires the filling in of some dock basins,which it is claimed will increase the risks of major flooding inGlasgow, according to a report by Clyde Heritage Trust. The reportconcludes that Glasgow may be at risk of floods similar to thosethat caused extensive damage in Prague and Dresden in 2002. Allof the riverside developments cumulatively add to the narrowingof the river, which reduces its flood water storage capacity push-ing water elsewhere in the city. The Clyde Heritage trust alsodemanded a comprehensive and robust flood plan to be integratedinto the overall redevelopment of the city, similar to the constructionof the Thames Barrier in 1984.17
The developers and experts disagree with the findings of thisReport and the battle rages. But there is an ethical issue here: onwhat side does one come down, on the precautionary side thatwould tend to hold off from committing to a project that may havecatastrophic impacts for the surrounding communities, or on theside of increasing the value of the whole area through fashionabledevelopment? Two groups of people will have to suffer any disas-trous consequences from such developments: the local council-tax payers and those whose buildings would lose their value ifflooded. It would appear that there is a moral onus on ensuringthat both groups properly understand the calculations on each sideof the argument so they can best decide on their own future.Developers have no vested interest in the long-term well-being ofthe community in the area but the insurers of those propertieswill, however, be involved in the future of such developments, andthat is why their take on such developments is crucial.
Urban flooding is on the increase around the world, as citiesexpand and water-absorbent fields and forests give way to imper-vious roads, buildings and car parks. Torrential rains can lead to flashflooding with devastating consequences and the phenomenon of
168 Adapting Buildings and Cities for Climate Change
Roaf_Ch06.qxd 29/10/04 6:44 PM Page 168

urban flooding is becoming a problem in cities that for centurieshave been untouched by it previously.18 This is largely due not onlyto more hard surfaces, but also to the continuing practice of build-ing on the flood plain and the increasing intensity of rainfall withclimate change. Failing storm water and sewage infrastructure isalso a problem in the UK and many councils now employ SUDS,‘Sustainable Urban Drainage Systems’, to reduce the risk of urbanflooding, although it should be noted that these do not work onflood plains where there is nowhere for the water to go, as anywater ‘sinks’ are often already below the water table during floodevents. A key problem with urban flooding is also the speed ofrun-off and the ‘flash flood’ effect that catches people unawareand is responsible for many of the drowning deaths associatedwith floods as people try to escape in their cars down floodingroads. For an excellent bibliography on the subject see the Readinglist on the subject of flooding provided by David Crichton on thecompanion website http://books.elsevier.com/companions/0750659114.
Rising sea levels
The problem of flooding in the southeast of England is made worseby the fact that the land mass is sinking in the region and by thefact that relatively large areas in the Southeast are already proneto coastal and riverine flooding. Many regions of the world sharethis problem.
Worldwide, approximately 400 million people live within 20 m ofsea level and within 20 km of a coast, worldwide, around 23%.However, this figure is difficult to calculate properly from existingdata. Eleven of the world’s largest cities are on the coast and inthe United State a staggering 53% of the population live near thecoast and may therefore be vulnerable to surges in sea levels.19
Venice is one of the many cities that face the same problem asLondon, that as sea levels rise the city itself is sinking on its allu-vial soils. In 1900 the central area of Venice around St Mark’sSquare flooded around ten times a year. Today it is closer to 100times a year and over the century Venice has actually sunk byaround 20 cm. If scientists are right and sea levels will rise between40–60 cm over the next century and the city continues to sink atthe same rate then the eventual inundation of the city is inevitableand will, it is predicted, be uninhabitable by 2100.20 Many are scep-tical that the proposed barrier around the lagoons of the city willever materialize, not least because of its cost, which is put in thebillions rather than millions.
How wet will it get? 169
Roaf_Ch06.qxd 29/10/04 6:44 PM Page 169
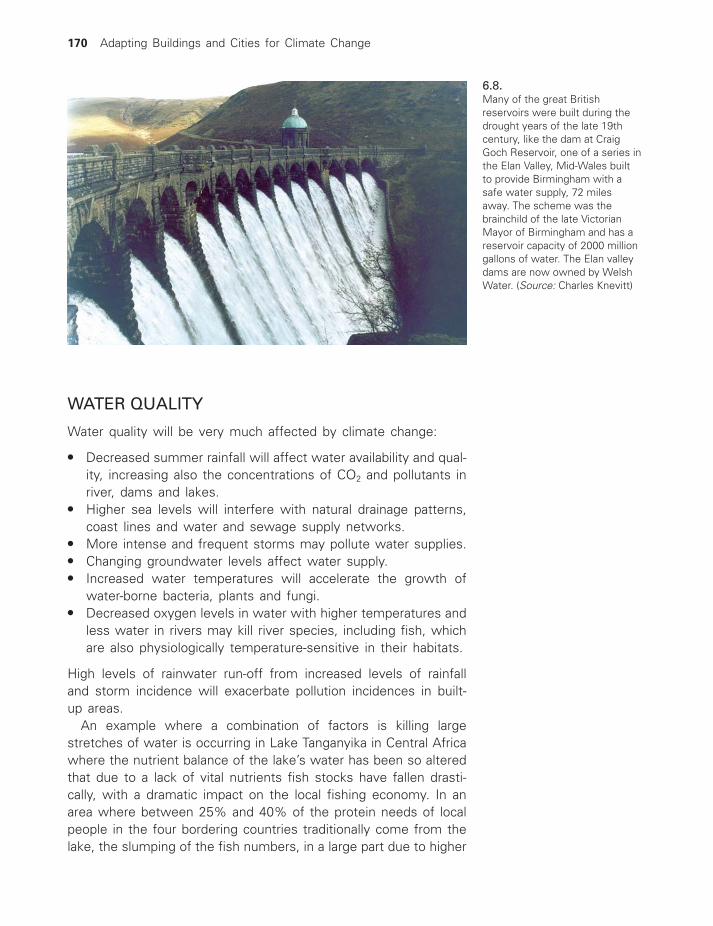
WATER QUALITY
Water quality will be very much affected by climate change:
● Decreased summer rainfall will affect water availability and qual-ity, increasing also the concentrations of CO2 and pollutants inriver, dams and lakes.
● Higher sea levels will interfere with natural drainage patterns,coast lines and water and sewage supply networks.
● More intense and frequent storms may pollute water supplies.● Changing groundwater levels affect water supply.● Increased water temperatures will accelerate the growth of
water-borne bacteria, plants and fungi.● Decreased oxygen levels in water with higher temperatures and
less water in rivers may kill river species, including fish, whichare also physiologically temperature-sensitive in their habitats.
High levels of rainwater run-off from increased levels of rainfalland storm incidence will exacerbate pollution incidences in built-up areas.
An example where a combination of factors is killing largestretches of water is occurring in Lake Tanganyika in Central Africawhere the nutrient balance of the lake’s water has been so alteredthat due to a lack of vital nutrients fish stocks have fallen drasti-cally, with a dramatic impact on the local fishing economy. In anarea where between 25% and 40% of the protein needs of localpeople in the four bordering countries traditionally come from thelake, the slumping of the fish numbers, in a large part due to higher
6.8.Many of the great Britishreservoirs were built during thedrought years of the late 19thcentury, like the dam at CraigGoch Reservoir, one of a series inthe Elan Valley, Mid-Wales builtto provide Birmingham with asafe water supply, 72 milesaway. The scheme was thebrainchild of the late VictorianMayor of Birmingham and has areservoir capacity of 2000 milliongallons of water. The Elan valleydams are now owned by WelshWater. (Source: Charles Knevitt)
170 Adapting Buildings and Cities for Climate Change
Roaf_Ch06.qxd 29/10/04 6:44 PM Page 170

water temperatures and changing wind patterns, will have a cata-strophic effect on local populations.21
DAMS AND RESERVOIRS
Levels of precipitation, and periods of droughts and rain have directimpacts on the infrastructure of our water catchment, storage andsupply systems. Climate change may well prove a real threat tothe integrity of such systems.
There is, for instance, a very real and hidden problem in manycountries of the over-topping of dams, reservoirs and canals. On2 November 1925 there was a blow-out of the lower section of aportion of the Eigiau dam in the Conwy valley in North Wales. Thewater scoured a channel 70 feet wide and 10 feet deep, as 50million cubic feet of water surged down to the Coedty reservoirbelow. The reservoir was nearly full at the time and the spillwayhad to cope with a surplus discharge well in excess of its designedcapacity. The dam was overtopped, washing away the embank-ment, and the core collapsed. There was an almost instant releaseof 70 million gallons of water. A wall of water, mud, rock and con-crete hit the village of Dolgarrog at 9.15pm that Monday evening.
Fortunately many of the villagers were attending a film show atthe village Assembly Hall, out of the path of the flood, and 200workers were working late in the nearby aluminium factory, other-wise more lives would have been lost. As it was, ten adults andsix children were killed and many houses were destroyed.22
Huge boulders, the size of houses, can still be seen in the vil-lage. It later transpired that the general manager and board of direc-tors of the company which owned the dams knew that there weredefects in them from the beginning, but chose to keep the factssecret. No one was ever held to account, and two of the streetsin the rebuilt village were named after directors of the company.23
It should be emphasized that no lives have been lost in the UKfrom dam failure since the Dolgarrog disaster in 1925, however fail-ures do occur around the world. In 1959 the Malpasset dam inFrance failed resulting in the deaths of 421 people, and in 1963the overtopping of the Vaiont dam in Italy caused by a landslidecaused 1189 deaths, even though the dam itself remained intact.In 1972 a dam in West Virginia, USA, failed causing 125 deaths.Modern dams and reservoirs are designed and built to very highstandards in Britain, but in the future, the safety margins will increas-ingly be eroded by climate change. So far as current safety stan-dards are concerned the main concern is the secrecy surroundingthe condition of dams and raised embankments. There are alsoconcerns about the secrecy surrounding dam break inundation maps,
How wet will it get? 171
Roaf_Ch06.qxd 29/10/04 6:44 PM Page 171

and the lack of preparedness of the emergency services in dealingwith a catastrophic failure.
The information in the public domain is enough to illustrate thescale of the issue.24 The Reservoirs Act, 1975, applies to all reser-voirs holding or capable of holding more than 25 000 cubic metresof water. There are over 2500 such reservoirs in the UK, of which530 are large enough to be included in the World Register of LargeDams. Owners of dams covered by the Act are obliged by law tohave them inspected every ten years by a civil engineer from aspecial panel, but the law does not specify the details of the inspec-tion nor that the results should be published. In practice, the thor-oughness of the inspection depends almost entirely on how muchthe dam owner is prepared to pay, and the author is not aware ofany case where the results have been published, or even givento local authority emergency planning officers or the emergencyservices. Dam owners also refuse to issue dam break flood inun-dation maps. This could mean, and indeed this has happened, thatplanning officers for the local authority might grant planning per-mission for new housing developments within the area which wouldbe flooded if the dam failed, simply because they did not knowthat the area was within the danger zone.
By contrast, in France, everyone living in areas at risk from dambreak is fully aware of the fact, and these areas are subject to fre-quent evacuation exercises. Informal comments from engineerswould seem to indicate that they believe the British are more likelythan the French to panic if they were given such information.
Climate change could well lead to an increased risk of failure ofBritish dams, some of which are more than 200 years old. Failurecan be caused by many factors – for example, climate changecould lead to subsidence of the dam foundations, landslip into thereservoir, or overtopping due to heavy rainfall.
Around half of the 2500 large UK dams have earth embank-ments, most of them constructed before heavy soil compactionequipment was available. Little is known about the content of suchembankments, especially the core, or the extent of internal set-tlement or disturbance, for example from rabbit burrows.
Droughts could lead to cracking of the embankment wall, andclimate change will lead to more droughts in the summer, followedby more rain in the autumn. This could impose additional loads,which were not considered when the reservoir was planned. Therecould also be additional loadings from increased snowfall in uplandareas, followed by rapid snowmelt due to rainfall. Higher wind-speeds over the reservoir surface could cause more frequent over-topping, leading to erosion of earth embankments unless suitablyprotected.
172 Adapting Buildings and Cities for Climate Change
Roaf_Ch06.qxd 29/10/04 6:44 PM Page 172

Other possible causes of failure include vandalism of valves, pipework or controls, terrorism, or aircraft crash. Many dams are in ornear urban areas, for example there is a large reservoir in Brentin London which is very close to housing and aircraft flight paths.Most UK dams are over 100 years old. A detailed record is keptof defects in dams but this is not published. The reasons for thesecrecy surrounding the condition of the nation’s dams is not clear,but prudent insurance underwriters are always inclined to assumethe worst when information is withheld. The record of dam safetyin the UK has been excellent since 1925, but climate change fearsmight cause some underwriters to reassess the situation. It wouldseem quite likely that there are people living and working withinthe danger zone of large dams in the UK. In the United States,where information is more readily available, it is known that thereare more than 2000 communities that have been identified as beingat risk from dams that are believed to be unsafe.
Growing population and wealth, especially in the Southeast ofEngland, will lead to greater demand for water, while supply willbe reduced by summer droughts. Demand management controlssuch as water meters can only have a limited effect and ground-water abstraction is near its limit. It is therefore likely that moredams will need to be built, and in Southeast England these arelikely to be near urban areas. Meanwhile, in 2000, government intro-duced a research programme for dams, with some of the surveywork subcontracted to the Transport Research Laboratory becauseof their expertise in checking earth embankments.
More dams are likely to be built because of climate change, eitherretention dams as part of flood alleviation measures, or reservoirsfor hydro power (in response to the moves away from fossil fuelpower generation) or water supply (in response to increasing sum-mer droughts).
Meantime, so long as dam condition reports and inundation mapsremain secret, insurance companies may be increasingly likely toassume that properties near to reservoirs may be at risk of flood-ing from a breach, particularly in the case of older earth embank-ments, or concrete dams constructed more than fifty years ago.
CANALS AND WATERWAYS
British Waterways owns and manages over 540 km of navigablerivers and 2600 km of canals which in turn interact with the majorriver basins and land drainage systems of the UK.25 Most of thecanals were constructed more than 200 years ago, and are very vul-nerable to flood events. Often the waterways cross different catch-ments and can thus transfer flows from one catchment to another.
How wet will it get? 173
Roaf_Ch06.qxd 29/10/04 6:44 PM Page 173

British Waterways also own and manage 89 reservoirs in the UK,some of which are managed entirely for flood storage. Canals areusually ‘still’ waters, and do not clean themselves as with flowingrivers, so pollution is a particular problem, for example from sewageback-up from drains, and one that is exacerbated in hot summers.
Canals generally operate with only 300 mm of freeboard, andthere are over 650 km of embankments to be maintained.Overtopping of embankments, especially those over 200 years old,can lead to failure, which could have a catastrophic impact,especially in urban areas.
British Waterways is very aware of the risk and has a system ofsluices, weirs, pumps and floodgates to control the flow into canals.They have a thorough system of emergency procedures that haveworked well so far, but climate change, with the predicted increas-ingly intense periods of rainfall, is going to impose a major challenge to our 200-year old network of canals, and this challengedoes not yet seem to be fully recognized by government.
The levels of rain and snowfall in many regions have a wide-ranging effect on our built environment and have the potential tocreate significant hazards for homes and settlements in everyregion. The drive to reduce exposure to those hazards may increas-ingly influence the location of populations in the future, just asmajor steps need to be taken to reduce the vulnerability of indi-vidual buildings to those hazards, around the world.
What is impossible to do, however, is to move away from thetrack of a storm.
NOTES AND REFERENCES
1 Hulme, M., Turnpenny, J. and Jenkins, G. (2002) ClimateChange Scenarios for the United Kingdom: The UKCIP02Briefing Report. Tyndall Centre for Climate Change Research,School of Environmental Sciences, University of East Anglia,Norwich, UK. Available in pdf format on: http://www.ukcip.org.uk/publications/pub.html.
2 Palmer, T.N. and Rälsänen, J. (2002) Quantifying the risk ofextreme seasonal precipitation events in a changing climate.Nature, 415, 512–14.
3 The lower boundary to the class of ‘most intense’ events isdefined (separately for each season and region) by an amount(mm) calculated from the 1961–90 period, namely the dailyprecipitation exceeded on a minimally sufficient number ofdays necessary to account for precisely 10% of the seasonalprecipitation.
174 Adapting Buildings and Cities for Climate Change
Roaf_Ch06.qxd 29/10/04 6:44 PM Page 174

4 Guardian, 6 December 2003, p. 21.
5 Observer, Cash, 31 August 2003, p. 5.
6 Guardian, Society, 27 November 2002, pp. 8 and 9.
7 Guardian, 14 November 2002, p. 25.
8 Guardian, 29 October 2003, p. 13.
9 Guardian, 24 July 2003, p. 15.
10 http://www.unep.org/Documents/Default.asp?DocumentID�
321&ArticleID�4026.
11 http://timesofindia.indiatimes.com/articleshow/362916.cms.
12 ‘The human right to water entitles everyone to sufficient,affordable, physically accessible, safe and acceptable waterfor personal and domestic uses’, states the Committee doc-ument. ‘While uses vary between cultures, an adequateamount of safe water is necessary to prevent death fromdehydration, to reduce the risk of water-related disease andto provide for consumption, cooking, personal and domestichygienic requirements’, http://www.globalpolicy.org/socecon/ffd/gpg/2002/1127water.htm, see also the Indigenous PeoplesKyoto Water Declaration, from the Third World Water Forum,Kyoto, Japan, March 2003, http://www.treatycouncil.org/new_page_52112111.htm.
13 Guardian, 27 August 2003, p. 10.
14 Observer, Cash, 12 October 2003, p. 11.
15 The Environment Agency’s ‘What’s in your backyard’ featureon the Your Environment page of its website shows the floodrisk in Britain at any particular post code at http://216.31.193.171/asp/1_introduction.asp. The Environment Agency service onlyapplies to England and Wales, but there is a commercial web-site that provides a free postcode search facility for the wholeof Britain. It can be found at: www.home-envirosearch.com.
16 Observer, 5 January 2003, p. 2.
17 Building Design, 13 September 2002, p. 2.
18 Roaf, S. (2004) Closing the Loop: Benchmarks for SustainableBuildings. London: RIBA Publications, ch. 19, ‘Flooding’. OnSUDS in particular see: North East Scotland Flood AppraisalGroup (2002) Drainage Impact Assessment: Guidance forDevelopers and Regulators. Stonehaven: AberdeenshireCouncil. Available from Aberdeenshire Council, telephone 01569768300, ask for Ms Hilary McBean or email: [email protected] (due to go on their website shortly). Keepan eye out for Floods and SUDS: A Guidance Note for Local
How wet will it get? 175
Roaf_Ch06.qxd 29/10/04 6:44 PM Page 175

Authorities on SUDS Issues by David Crichton, not yet pub-lished, but available free by email from [email protected] also two important new websites: Foresight Flood andCoastal Defence Report, launched on 22 April 2004, looks30–100 years ahead and uses the UKCIP02 Climate ChangeScenarios and Foresight Future socio-economic scenarios. Itoutlines the possible risks for the UK from flooding and coastalerosion, and highlights the decisions that need to be made toprotect people, homes, businesses and the environment in thefuture. In each scenario, if flood management policies remainunchanged, the risk of flooding increases significantly, and thedamage could be very costly. Under the most extreme sce-nario, annual cost of damages could increase 20-fold from thecurrent level. Copies of the report can be downloaded fromhttp://www.foresight.gov.uk/fcd.html. Also Flooding andInsurance – Information and Advice from ABI. The Associationof British Insurers has developed a dedicated Web page as agateway to information on flooding and insurance issues, includ-ing details of ABI’s views and reports, and a flood resiliencefact sheet with information for householders on how they canreduce flood damage. Visit www.abi.org.uk/flooding.
19 http://www.giss.nasa.gov/research/intro/gornitz_04/.
20 Guardian, G2, 18 September 2003, p. 3.
21 Independent, 14 August 2003, p. 11.
22 Thomas, D. (1997) Hydro Electricity in North West Wales.Llanrwst: National Power plc.
23 Draper, C. (2002) Walks in the Conwy Valley. Llanrwst: GwasgCarreg Gwalch.
24 See: The Babtie Group and the Centre for Ecology and Hydrology(2002) Climate Change Impacts on the Safety of BritishReservoirs, Report commissioned by the Department of theEnvironment, Transport and the Regions (DETR) now DEFRA,through their reservoir safety research programme (unpub-lished) and Hughes, A., Hewlett, H., Samuels, P., Morris, M.,Sayers, P., Moffat, I., Harding, A. and Tedd, P. (2000) RiskManagement for UK Reservoirs. Construction Industry Researchand Information Association (CIRIA) Research project reportC542. London.
25 Much of this section is based on the following paper: Sim, S.,Morgan, L. and Leftley, D. (British Waterways) (2002) BritishWaterways’ role in flood mitigation and emergency response.Municipal Engineer, 151, 305–11.
176 Adapting Buildings and Cities for Climate Change
Roaf_Ch06.qxd 29/10/04 6:44 PM Page 176

THE DESTRUCTIVE POWER OF WIND
Of all the hazards that the climate can throw at us, none equalsthe power of an angry storm. Despite the fact that there is muchgreater uncertainty about future changes in wind speed and direc-tion, recent studies have demonstrated that the UK is becomingwindier and storm incidents are increasing. This reflects a patternthroughout the world, in which hurricanes and storms are not onlyincreasing in number and intensity but storm seasons are extend-ing into months where storms were previously unrecorded.
According to the reinsurance company Munich Re, between 1980and 2002, world wide more than a third of all natural disasters werecaused by windstorms. It also accounted for a third of all fatalitiesand economic losses from natural disasters. ‘The evidence points
7 WINDSTORMS
7.1.Wind damage is responsible forthe largest payouts from theinsurance industry in Britain andglobally. A cause for furtherconcern is that for the first timein recorded history a tropicalhurricane arose in December inthe Caribbean in 2003, indicatingan unprecedented lengthening ofthe storm season for theAmericas. (Source: Sue Roaf)
Roaf_Ch07.qxd 29/10/04 6:45 PM Page 177

to critical extreme wind speeds and precipitation being exceededwith increasing frequency, so that for this reason alone there willinevitably be a stark increase in the loss burdens as well.’1
Munich Re also calculates that out of the 37 natural disasters cost-ing insurers more than one billion US dollars in the 1980s and 1990s,only two were earthquakes and the rest were due to atmosphericextremes, mainly windstorm. Indeed, 27 of the 37 such natural disas-ters occurred in the 1990s, showing a dramatic increase in costs.
A windstorm provided the most obvious example of the impor-tance of using resilient construction techniques. The great Britishstorm of October 1987 caused £1400 million of damage claims forinsurers. The storms in January and February 1990 cost insurers£2500 million. Yet these storms were not particularly severe, com-pared with the Braer storm in 1993.
The Braer storm was probably the most severe storm to hit Britainin the past 300 years.2 It lasted continuously for 22 days (17 ofwhich were at severe storm force 12 or higher) with an atmosphericpressure at a record-breaking low of 915 mb, the equivalent of acategory 5 hurricane (Hurricane Andrew in the United States in 1992was only a category 4, with an atmospheric pressure of 924 mb,but caused US$30 billion damage). By comparison, the October 1987UK storm was trivial: it lasted only 24 hours, with atmospheric pres-sure only down to 960 mb. Yet the damage from the Braer storm,apart from the damage to the ship after which the storm was named,was negligible to the insurance industry.
One of the reasons for this is resilient construction. It has beencalculated that the damage caused by Hurricane Andrew wouldhave been reduced by 40% if buildings had been constructed tocurrent building codes.3 The Braer storm mainly affected theShetland Islands, where traditional Scottish or Scandinavian designsare used, and all the building companies are local. As a result,almost all the buildings are constructed of thick stone walls andWelsh slated roofs, with sarking boards.
The use of sarking boards has two major advantages. First, ifthe roofing tiles or slates are blown away, there is a secondarycovering underneath to prevent the wind from entering the loft.Secondly, the smooth surface of sarking boards means that eachtile or slate has to be individually nailed in place or it will fall offduring construction. Without sarking boards, tiles can simply behooked onto battens and will stay in place without nailing, so theabsence of fixings is not noticed until the wind blows. Unfortunately,sarking boards are rarely used now, at least in England and Wales,yet the cost of using them during construction is relatively low.
During 1997 and 1998, the Department of Environment, Transportand the Regions, and The Scottish Office, funded a project with
178 Adapting Buildings and Cities for Climate Change
Roaf_Ch07.qxd 29/10/04 6:45 PM Page 178

the Building Research Establishment in Scotland to review theimpacts of climate change on the construction industry and onbuilding standards.4 The report highlighted the need for the designand planning of new buildings to change to ‘future proof’ new con-struction, and that failure to adapt existing buildings to cope withfuture climate would result in increased maintenance and repair costs,and inevitable increases in insurance premiums. Further research andimpact assessments were required. Unfortunately little has beendone since then.
Perhaps this is because of the widely held perception that olderbuildings are more vulnerable to storm damage than new ones,especially if they have not been well maintained. The BuildingResearch Establishment was stating this as recently as 2003, buthow much of this is fact and how much is assumption? DavidCrichton was only able to find one UK research project based onthe large insurance industry database of storm damage cases, andthis shows that the perceptions may be wrong. Research for theLoss Prevention Council (now part of the Building ResearchEstablishment) in 1998 shows that:
● Poor maintenance is not a major factor.● It is not old buildings that are vulnerable, but new ones, espe-
cially those built after 1971.
There is a desperate need to carry out further research into this,using insurance claims data. Before the days of building standards,local builders tended to ‘over engineer’ buildings, in the light oflocal knowledge. They also used local stone and timber, plus heavyWelsh slate. Now with building codes, the construction industrybuilds to the code, which only has a 10% cushion for extremeevents. This could explain why older buildings that have alreadysurvived many storms are likely to be more resilient than brandnew buildings built to the standards set out by codes but no higher.
Work at the University of Aberdeen, part supervised by DavidCrichton and funded by the Loss Prevention Council, involved adetailed impact assessment of the vulnerability of different typesof buildings to windstorm. Using insurance claims data, theresearch5 indicates that modern housing may even be more vul-nerable, particularly housing built after 1971. One reason for thiscould be the introduction of prefabricated rafters around this time.Originally rafters were installed without cross bracing, and if sub-jected to sideways pressure, could collapse like a set of dominoes,bringing down the gable wall. It is interesting to note that afterthe October 1987 storm, a study6 found that between 60% and80% (depending on area) of houses damaged had roofing dam-age, and ‘an unusually high proportion of gables had both leaves
Windstorms 179
Roaf_Ch07.qxd 29/10/04 6:45 PM Page 179

of masonry sucked out’. In recent years the insurance industryaround the world has suffered from mounting losses from winddamage. In the United States, it has been found that the majorityof damage has occurred in conditions where the mean recurrenceinterval was less than 50 years.7 There has subsequently been awhole programme of measures from the US insurance industry toreduce vulnerability of buildings to windstorm.
In a supplement to the Aberdeen study mentioned above, in theUK, damage was found from wind speeds that had a recurrenceinterval as low as three or four years in the case of modern build-ings. So far the insurance industry has left it to local governmentto ensure proper construction through the adoption and enforce-ment of appropriate building codes. If the findings of the Aberdeenstudy are representative – and more work is clearly needed toestablish if this is the case – this would indicate that building codesand enforcement may already be inadequate in the UK. Unlessmajor changes are made to the Building Regulations to make build-ings more resilient to windstorm (and this is very unlikely in theshort term), then insurers will have to be more selective in theirpricing. They can do this using their detailed data on designs andtypes of building stock, combined with very sophisticated wind-storm models.
Windstorm modelling by insurers has improved significantly inthe past decade. The latest techniques now model the geostrophicwind first, that is the wind at an altitude where it is not affectedby surface roughness factors, and then vary the model for localconditions where gusts are affected by the topography and thenature of the buildings. This work is being undertaken by a num-ber of reinsurers, insurers and reinsurance brokers independently.However, the job is so large that there really is a need for somecentral expert body, with access to large scale computing power,to provide definitive answers on behalf of the whole insurance andconstruction industry.
INSURANCE AS A TOOL TO IMPROVERESILIENCE
The built environment will have to become more resilient to natu-ral hazards. As shown above, research has indicated that UK build-ing stock in some areas is particularly vulnerable to windstorm, forexample. Insurers could potentially have an important role, usingpremium incentives and other means, to help to raise standardsof construction and inspection of new buildings, and retrofittingolder ones. To target these efforts, more data is needed aboutwhat happens in a flood or windstorm.
180 Adapting Buildings and Cities for Climate Change
Roaf_Ch07.qxd 29/10/04 6:45 PM Page 180

At present, when an insurance customer reports storm damage,insurers capture just enough information to enable them to dealwith the claim. It would be much more far-sighted to start to cap-ture additional information about the local wind conditions and thereason for the failure of the structure. A database of even just afew thousands of such claims could be of value to the engineersreviewing building standards. In the UK in 1987, the industry had1 million storm claims, in 1990 it had 3 million. If details of eachof these claims had been captured along with local wind speeds,insurers would be in a much better position now to understandwhat needs to be done to improve building resilience to storm dam-age. When the next major storm happens insurers would be nobetter placed to capture such information than they were in 1990.
WHEN THE EXTREME STORM HITS
Getting out
Many have lost their lives because, when a storm hits, they sim-ply could not get out of buildings in time. One of the most vulner-able of all building types to storm dangers is, surprisingly, themost ‘modern’ type: the thin, tight-skinned, air-conditioned build-ing with no opening windows and no escape route onto the roof.If such buildings are located on a flood plain where there is anyrisk of water rising to block the only doors on the ground floor,then people have no way out. If the air conditioning then fails, ifthere is, for instance, a blackout or the plant room is in a floodedbasement, and there is little breathable air in the building (this hap-pened in New York during the August 2003 blackout), then thingsbecome critical. If you add to this situation exposure to pollutants,perhaps a broken sewage mains or gas pipes damaged in the base-ment as furniture is banged against it by flood water, or similarlybroken toxin containers, then that building may be a death trap,in which, unless occupants are willing and able to smash a glasscladding panel (virtually impossible with some modern ‘bomb proof’glasses) they could well die. Risk assessments encompassing suchlikelihoods should be done for all buildings of this type.
Another problem, that has caused deaths during the flooding asso-ciated with wind storms is the location of the means of escapeunderground, in a car park or an exit route or a subway, as theseflood first and trap occupants within a building – or kill them on theirway out. During floods in Huston, Texas in 2001 a secretary wastravelling down in a lift when a power blackout occurred, and as isstandard in many lift programmes, the lift lowered her gently to thebasement, which was full of water and she drowned.8 The adviceis, during floods and storms, as in fire, do not use the lifts.
Windstorms 181
Roaf_Ch07.qxd 29/10/04 6:45 PM Page 181

Also, buildings on flood plains must be increasingly closely regu-lated. Experience has shown that it should be compulsory for bun-galows to have escape routes, with accessible windows fitted intheir roofs to enable occupants to clamber onto the roof in thecase of a rapid inundation of their homes.
People in ordinary buildings can also be very vulnerable to storms.This was shown in December 2003 when five people died in atorrential rain storm with 90 mph winds in the south of France ina region that had suffered catastrophic floods the winter before.One elderly man was found drowned in his basement flat whileothers were killed as their cars were washed off roads. Some 8000people were evacuated from their homes, roads and railway lineswere closed. Flood waters caused two buildings to collapse inMarseille, where 47 people were evacuated to a local sports centre.In Lyon 200 people spent the night in a gymnasium after theirtrain was cancelled. ASN, the National Nuclear Authority, closedfour Rhône valley nuclear reactors because of the storm, as a pre-caution, showing again, as during the drought of August 2003, thevulnerability of this technology to extreme weather events. Floodsalso disabled a water purification plant in the Haute-Loire regionleaving 4000 without drinking water.9 These events give a taste ofthe range of impacts that can accrue from a bad storm. A detailedreport on the causes of the event, requested by President Chirac,cited global warming as a cause. Chirac ordered that solutions tothe problem of flooding be found that would reduce the scale ofthe impacts in future years.
Floods, logging and landslides
Every year 90 000 square kilometres of forest are being lost dueto logging, the equivalent area of the British Isles according to theTimes Atlas of the World, for use in industry, commerce and forcooking and heating. During wind and rain storms, the slopesexposed by logging are washed away, and then major landslipsoccur that, in recent years, have been claiming increasing numbersof lives around the world.
For instance, when Hurricane Mitch hit land in 1998, the high-est numbers of casualties were caused by landslides, a direct resultof logging. Officials estimated about 7000 had died in the region.The greatest losses were reported in Honduras, where an estimated5000 people died and 600 000 – 10% of the population – wereforced to flee their homes after the storm as floods and landslideserased from the map many villages and households as well aswhole neighbourhoods of cities. In neighbouring Nicaragua, thedeath toll was also high. Official preliminary figures showed 1330
182 Adapting Buildings and Cities for Climate Change
Roaf_Ch07.qxd 29/10/04 6:45 PM Page 182

dead and 1903 missing nationwide. As many as 1500 people mayhave died in mudslides when the crater lake of the Casitas Volcanocollapsed, sending a wall of mud and debris onto villages below.10
In November 2003 a staggering 72 people were killed by a flashflood that washed through a tourist resort on the island of Sumatra,Indonesia, sparked off by several days of heavy rain in the LeuserNational Park. The river Bohorok overflowed its banks washingaway many of the flimsy buildings of the area and leaving onlyaround 10% standing. Officials claimed that the flood was causedby ‘massive logging’ in the Leuser National Park, a widespreadproblem in many regions of the world,11 including, in recent years,Spain, Italy, France and Switzerland. Hence maintenance andreplanting of forests may be one way of saving lives during storms.
EVACUATION
In his excellent book Florida’s Hurricane History, Jay Barnes, for-mer Director of the American National Hurricane Center in Florida,described his concerns about the increasing population of the Stateand the decreasing ability of people to be evacuated from it in thecase of a major hurricane.12
Even though Florida has been battered by hurricanes many timesover the years, most Florida residents today have not experienceda major hurricane. Barnes sums up his concern:13
Certainly Andrew in 1992 was a tremendous wake-up call for South Florida.The Panhandle had Eloise in 1975 and most recently Opal in 1995, butthe peninsula itself has been spared during the last twenty-five years. Aswe look back at Florida’s hurricane history, we find a flurry of activity inthe late 1920s, 1930s, and 1940s. There was the powerful 1926 hurri-cane in Miami, the 1928 storm that killed many people at Lake Okeechobee,and the fierce Labor Day storm of 1935 that swept across the FloridaKeys. Then a series of major hurricanes rolled through the Florida Peninsulain the 1940s. From 1941 to 1950, eleven hurricanes struck, seven ofwhich were category 3 or greater. Of course, most of them didn’t havenames. Few people talk about them anymore, largely because most Floridaresidents weren’t around back then. Some have been forgotten and areno longer part of Florida’s ‘hurricane culture.’
Florida has always been vulnerable to hurricanes, but the explosivegrowth that has occurred in the past few decades has made the coastalareas even more precarious. The population has more than doubled in thepast 40 years, and in many communities, it has been that long since thelast significant hurricane. Many coastal areas are especially vulnerablebecause of their unique evacuation problems. In the Keys, for example,only one highway offers escape for many thousands of residents. The1935 hurricane, which moved through the central Keys on Labor Day, illus-trates the evacuation dilemma. As it approached Andros Island in the
Windstorms 183
Roaf_Ch07.qxd 29/10/04 6:45 PM Page 183

Bahamas it was a category 1 storm. It took just over 40 hours to becomea category 5 storm and was the strongest ever to hit the United States.Today, the time required for evacuation of the Keys is more than 24 hours,and evacuation times for the southeastern and southwestern countiesmay exceed 40 hours. For many of these areas, the lead time requiredis too great and the population too large for the highway system to handleall of the traffic.
What I fear most is a scenario similar to what happened in 1935 – astorm that approaches Florida as a minimal hurricane, then explodes inintensity as it accelerates toward the coast. Andrew and Opal were some-what like that, although fortunately Opal weakened before it came ashore.If a rapidly intensifying hurricane strikes an area that has a long evacua-tion time, thousands of residents could be caught in the storm’s path,where they might be trapped in their cars or forced to remain in inade-quate shelters. This is the nightmare that hurricane forecasters live with.
Unfortunately hurricanes are increasing in intensity and severityright along the Eastern seaboard of North America and this fearhas yet to be tested.14
Is there time to make it?
When Jay Barnes joined the National Hurricane Center staff, theaverage forecast error in a 24-hour period was 120 nautical miles,
184 Adapting Buildings and Cities for Climate Change
7.2.The Royal Palm Park in downtown Miami was littered with boats and debris after the September hurricane of 1926.(Source: Photo courtesy of Special Collections Department, University of South Florida Library, Tampa Campus)
Roaf_Ch07.qxd 29/10/04 6:46 PM Page 184

and when he left 25 years later it was only down to about 110 miles.During this time, the population of Florida’s coastal areas was explod-ing. The increase in population has far exceeded any small improve-ment we have made in our ability to forecast hurricanes. Jay considersit unlikely that there will be any major breakthrough in the forecast-ing of hurricanes in the future. The atmosphere is too complex toallow the kind of precision forecasts that people who live on thecoast today need.
A similar lack of precision in forecasting was a hallmark of theGreat 1987 storm when forecaster Michael Fish famously said thatthere was no hurricane coming on the 6pm news before the rapidlydeveloping storm struck early next morning. Here the unpredictabil-ity, as in Florida, becomes a factor in how many do, or could, die.
The basic reason for this is that it is still too difficult to forecastthe weather accurately:15
We must remember, too, that the mathematical models used in numeri-cal weather forecasting, though remarkably successful, can never fullyrepresent the complexity of the real atmosphere. And complete observa-tional coverage of the atmosphere over the oceans west and south ofthe British Isles will probably never be achieved.
The question here is will people be given enough warning time toevacuate an area. In some cases, the answer is no.
Windstorms 185
Roaf_Ch07.qxd 29/10/04 6:46 PM Page 185

Evacuation plans
Whom to contact in emergenciesMany buildings and communities at times of flood do get cut offfrom their escape routes by the rapidly rising water and need toknow an emergency number to call, such as the British service‘Floodline’ – the Environment Agency Emergency hotline.16 Anadded risk factor, however, is that if an electricity blackout occursmobile phone systems can also go down and this should be factored in to escape plans.
Where to goAnother factor to consider is that people have to know where theycan go to be safe. They should be told in advance that at timesof flood, fire, heat and storms that a safe centre has been estab-lished at a particular location that has links with the emergencyand health services, perhaps heating or cooling, dry clothes, bed-ding and food. Every community should have an emergency cen-tre identified, where access is possible without electric swipe cardsor locking systems, and everyone should know who is in charge.
Evacuation strategies for urban neighbourhoodsThe problem in cities is that there are so many people to evacuate,at times of crisis, that sheer numbers becomes the problem, par-ticularly when urban neighbourhoods are already overcrowded. InLondon it may be possible to cope with 300 extra commuters everymorning at rush hour on the existing tube system, but if the localpopulation increases by perhaps 2000, or even 10 000 people froma couple of new tower blocks on a street (100–200 people a flooron 50 floors), then transport services may not cope with them evenwithout an emergency. This problem was seen in the World TradeCenter, where the capacity population of the Twin Towers was around20 000 people, and although less than half full, there was a signif-icant problem with getting the people away from the towers, oneof which collapsed within three-quarters of an hour.
There is currently planned in Shanghai a super scraper called theBionic Tower that is designed to house 100 000 people. This is acity prone to floods and typhoons, sitting as it does at the tip ofthe Yangtze river, and as its mayor has admitted, it is badly pre-pared for any such emergencies17 and could be struck by wide-spread flooding at any time, although it is hoped that the ThreeGorges Dam upstream will significantly reduce the risk to thisburgeoning city from fluvial flooding in the future.
Overpopulation problems result in ‘funnelling’ effects, for instanceof multiple commuters from district lines converging on single
186 Adapting Buildings and Cities for Climate Change
Roaf_Ch07.qxd 29/10/04 6:46 PM Page 186

stretches of line at particular hours of the day/week causing grid-lock. It is the ‘surge’ of moving people that debilitates systems ofmovement around a city, and before any new buildings are con-structed in a city a very detailed study of the ‘carrying capacity’of a city, and calculations of the optimal evacuation strategies forevery locality, should be undertaken.
The problem is that not only are there too many people in oneplace but that the routes into and out of the city are dysfunctional.The mathematician Nickos Salingaros outlined how such movementsystems work in his paper on ‘urban webs’.18 Salingaros outlinedstructural principles for urban form. The processes that generatethe ‘urban web’ involve nodes, connections and the principles ofhierarchy. Among the theoretical results derived from his work wasa pattern of ‘multiple connectivity’, in which a city needs to havea variety of ‘connections’ so that people have a range of alterna-tive routes through the city to avoid the problem of bottlenecks.
He investigated the city in terms of the types of uses the build-ings are put to in the different areas of the city and a key risk fac-tor he identified is that areas of the city become dominated by‘monofunctionality’, a prime example being that of the single use‘megatower’, or skyscraper. Not only do these create a ‘mathe-matical singularity’ where one or more quantities become extremelylarge or infinite, so detracting from the quality of the streetscapeand city, but because such towers do, en masse, one thing only,as a result their occupants will behave en masse, needing to beevacuated all at the same time, if at all.
We have also learnt much from 9/11. The idea that any buildingcould be evacuated three floors at a time (the principal on whichbuilding evacuation strategies for large buildings are now designed),after 9/11 is ludicrous. As soon as an emergency happens (like theblackouts of August 2003) everybody thinks it may be another 9/11and gets out of the building straight away, regardless of what issaid on the loud speaker system because, after 9/11, no one hasfaith in what they say on loud speakers. Also many building evacu-ation strategies are based on having ‘pressurized’ staircases, thatin reality do not work once three or four doors onto that staircaseare opened, and would not work once the energy in the buildingsfails. This is an apparently clever idea that has to be rethought.
On a street, large monofunctional buildings drown out any ofthe human outflows from adjacent buildings in a district, whenevacuation of an area is necessary, because of the sheer force oftheir outflow, rather as a gas or liquid would behave under thelaws of fluid dynamics. Other people emerging from smaller adja-cent buildings would need to find a quiet space in the slipstreamof the dominant flow to hang onto, in order to have the chance
Windstorms 187
Roaf_Ch07.qxd 29/10/04 6:46 PM Page 187

of being carried away from the event. Put several such towerstogether and basically no one will get out safely because of theconfusion, or turbulence, created at the meeting of major flows.Certainly the occupants of any smaller building between themwould have to fight hard (so retarding the outflow of the majorbuilding) to have a chance of escape at all. So it is the nature ofthe interactions of people outflows from adjacent buildings (deter-mined by mathematics), during periods of evacuation, as well asthe simple numbers versus route ways calculations (determinedby mathematics) that will determine who escapes from an area,as well as the fighting abilities of the evacuees. More men thanwomen would probably escape, because they are stronger and theurge to survive is deep, so to some extent this could be mod-elled; but then British men may, perhaps, be more chivalrous, sothis also would have to be factored into the equation.
In answer to a question from a major employer in a city on whetherpeople will get out of the organization’s building safely, many issueswill have to be factored into the response including:
● What is the carrying capacity of the existing routes and trans-port systems in the city?
● What are they escaping from, e.g. floods, fire, bombs, exces-sively hot indoor temperatures etc.?
● Are their escape routes likely to be blocked?● How long is the warning time they will get?● What are the adjacent buildings like?● Who are the people who want to escape?● What is the use pattern of the building?● Where will they go?● Do they know where to go and how to get there?
Such planning is essential, not only for employees who want tosurvive, but for councils and businesses who need to demonstratethey have behaved responsibly in the face of risk, for insurancecompanies who need to know they are containing the risk theycover and for the government which needs to contain the grow-ing risks of climate change, and terrorism.
The stakes are high. For instance, in the case of London, recentestimates suggest that if a tidal surge comes over the top of theThames Barrier, the cost would be in the region of £30 billion, or2% of UK GDP.19 What would be the cost of paying for loss oflife resulting from what could have been predicted by proper plan-ning? Where does the legal buck stop in such an event?
Due to the increasing unpredictability of global storm tracks, nonew, or existing, development or neighbourhood should now bewithout a strategy for dealing with the eventuality of encounteringan extreme windstorm, no matter where in the world they are built.
188 Adapting Buildings and Cities for Climate Change
Roaf_Ch07.qxd 29/10/04 6:46 PM Page 188

NOTES AND REFERENCES
1 See http://www.munichre.com/pdf/TOPICSgeo_2003_e.pdf.
2 Stirling, R. (1997) The Weather of Britain. London: Giles de laMare.
3 http://www.ibhs.org/publications/view.asp?id�455.
4 Garvin, S.L., Phillipson, M.C., Sanders, C.H., Hayles, C.S. andDow, G.T. (1998) Impact of Climate Change on Building. EastKilbride: Building Research Establishment.
5 Mootoosamy, V.K.S. and Baker, M.J. (1998) Wind Damage toBuildings in the United Kingdom. University of Aberdeen,Department of Engineering. Published by the Loss PreventionCouncil, Paper LPR 8: 1998, Watford.
6 Buller, P.S.J. (1988) The October Gale of 1987: Damage toBuildings and Structures in the South-East of England. Watford:Building Research Establishment.
7 Sparks, Peter (1990) Defending Against the Wind. Paper pre-sented at the National Committee on Property Insurance AnnualForum, Boston, MA, December 1990.
8 Guardian, 4 November 2003, p. 16.
9 Guardian, 24 September 2001.
10 http://www.turkishdailynews.com/old_editions/11_04_98/for2.htm.
11 Guardian, 4 December 2003, p. 19.
12 Barnes, J. (2003) Florida’s Hurricane History. Chapel Hill, NC:University of North Carolina Press (first edition 1998).
13 http://www.ibiblio.org/uncpress/hurricanes/fl_foreword.html.
14 Goldenberg, S.B., Landsea, C.W., Mestas-Nunez, A.M. andGray, W.M. (2001) The recent increase in Atlantic hurricaneactivity: causes and implications. Science, 293, 20 July.
15 http://www.met-office.gov.uk/education/historic/1987.html.
16 See www.environment-agency.gov.uk/floodwarning; the BritishFloodline is on 0845 988 1188.
17 http://www.china.org.cn/english/12537.htm.
18 Salingaros, N. (1998) Theory of the urban web. Journal of UrbanDesign, 3, 53–71. For the full paper see http://www.math.utsa.edu/sphere/salingar/urbanweb.html. © Taylor & Francis Limited.See also Kunstler, J.H. and Salingaros, N. (2001) The end of tallbuildings, on http://www.peoplesgeography.org/ tall.html.
19 Guardian, 9 January 2004, p. 11.
Windstorms 189
Roaf_Ch07.qxd 29/10/04 6:46 PM Page 189

Since the end of the last Ice Age, some 18 000 years ago, sea levelhas risen by over 120 m. On average, sea levels may have risen ata rate of 0.1–0.2 mm per year over the past 3000 years globally,but in the 20th century this increased to 1–2 mm per year.
In 1995, 2.2 billion people lived within 100 km of a coastline,nearly 39% of the world’s populations, and many of these peoplewill be directly affected by rising sea levels in three ways:
● As seas rise many areas of the coast will be inundated.● With increasingly severe and frequent storms and wave dam-
age, shoreline retreat will be accelerated.● Catastrophic flooding events may be caused by a combination
of climate events such as heavy flooding, high tides, windstormsin combination with higher seas.
This issue of how much of a low-lying shoreline retreats withincreases in sea levels is a complex one and depends very muchon the behaviour of incoming currents, wave patterns, the struc-ture, materials and form of the shoreline, and wave heights in thatarea and the care with which the coastline is managed.1
While sea level is predicted to rise almost everywhere, there isconsiderable spatial variation; in some regions the rise is close tozero, while others experience as much as twice the global aver-age value. The predicted patterns show large increases in sea levelin parts of the north Pacific and to the west of Greenland. Confidencein the regional sea level rise predictions, that indicate global rises ofbetween 30 and 80 cm by 2100, is not as great as for tempera-ture predictions.2
As the world warms, it is predicted that global average sea levels may rise by between 7 and 36 cm by the 2050s, by between9 and 69 cm by the 2080s and 30–80 cm by 2100. The majority ofthis change will occur due to the expansion of the warmer oceanwater. The UKCIP team does not consider it likely that the melting
8 SEA LEVEL RISES
Roaf_Ch08.qxd 29/10/04 6:48 PM Page 190

8.1.Computer models of what(a) Europe and (b) North Americamay look like if the global icereserves melted raising the sealevels by 100 m. (Source:Laurence O. Williams (2002)An End to Global Warming.Pergamon, reproduced withpermission)
Sea level rises 191
(a)
(b)
Roaf_Ch08.qxd 29/10/04 6:48 PM Page 191

8.3.One of the most dangerous areasof sea around the British Isles isthat between Southeast Englandand France, where the extremewater height is higher than in anyother stretch of British waters.The figure shows the change, bythe 2080s, in the height (metres)of the extreme sea level that hasa 2% chance of occurring in anygiven year for the Medium HighEmissions scenario, with the mid-range estimate of 30 cm globalsea level rise. (Source: UKCIP02Climate Change Scenarios,funded by DEFRA, produced byTyndall and Hadley Centres forUKCIP)
of the West Antarctic ice sheet will contribute much to sea levelrises in the 21st century, although its impact, if it does melt, wouldbe catastrophic in the 22nd century, making sea levels rise as muchas 70 m. Indeed, the Antarctic, by acting as a storage area for snow-fall, will continue to help to mitigate rising sea levels for manydecades to come.3
The temperatures of UK coastal waters are increasing, althoughnot as rapidly as temperatures over the land, with again the great-est warming in the south. Offshore waters in the English Channelmay warm in summer by between 2 �C and 4 �C by the 2080s.4
The relative sea level will continue to rise around most of theUK shoreline, with the rate depending on the scenario and the
192 Adapting Buildings and Cities for Climate Change
6
7
8
9
10
11
9.5
10.0
10.5
11.0
11.5
12.5
20001900180017001600An
nu
al c
entr
al E
ng
lan
d t
emp
erat
ure
(°C
) An
nu
al UK
sea surface tem
peratu
re (°C)
8.2.As the global climate warms sothe seas of the world warm too.This is reflected in this graphshowing the warming of theclimate in central England (red)and the surrounding UK coastalwaters (blue). The deviationshere are relative to the 1961–90average, and not the differentscale for each. (Source: UKCIP02Climate Change Scenarios,funded by DEFRA, produced byTyndall and Hadley Centres forUKCIP)
60N
50N
10W 10E0
0 0.2 0.4 0.6 0.8 1 1.2 1.4
55N
Roaf_Ch08.qxd 29/10/04 6:48 PM Page 192

region. This is because some parts of the UK land mass are actu-ally rising, in the northwest of Scotland for instance, while otherareas like Southeast England are sinking relative to sea levels. Thisis due to isostatic rebound in Scotland as the land recovers fromthe weight of the glaciers of the last Ice Age, leading to a lower-ing of land in the south due to ‘tilting’ of the tectonic plate. Bythe 2080s, and depending on the scenario, sea levels may bebetween 2 and 58 cm above the current level in western Scotlandand between 26 and 86 cm above the current level in SoutheastEngland.
Extreme sea levels, occurring though combinations of high tides,sea level rise and changes in winds, will be experienced more fre-quently in many coastal locations. For some English east coastlocations, for example, a water level that at present has a 2%probability of occurring in any given year, may have an annual occur-rence probability of 33% by the 2080s for the Medium HighEmissions scenario. Sea level rises may also lead to deeper water
Sea level rises 193
Table 8.1. The historic rates of vertical land movement and theestimated net change in sea level by the 2080s using the low endof the Low Emissions scenario (9 cm global sea level rise) and thehigh end of the High Emissions scenario (69 cm rise)
Vertical land Sea level change 2080s (cm)change (mm/yr) relative to 1961–90
Low High emissions emissions
NE Scotland �0.7 1 61SE Scotland �0.8 0 60NE England �0.3 6 66Yorkshire �0.5 15 75East Midlands �1.0 20 80Eastern England �1.2 22 82London �1.5 26 86SE England �0.9 19 79SW England �0.6 16 76Wales �0.2 11 71Northern Ireland n/a 9* 69*NW England �0.2 7 67SW Scotland �1.0 �2 58NW Scotland �0.9 �1 59Orkney & Shetland n/a 9* 69*Global-average n/a 9* 69*
*These estimates in the sea-level change exclude the vertical land changes.Source: UKCIP02 Climate Change Scenarios, funded by DEFRA, produced byTyndall and Hadley Centres for UKCIP.
Roaf_Ch08.qxd 29/10/04 6:48 PM Page 193

in the near-shore zone allowing waves greater energy to reach theshore line, so significantly increasing storm damage to shore lines.
Even if greenhouse gases in the atmosphere are stabilized, fur-ther substantial increases in sea level over many centuries remaininescapable due to the extremely slow response of the oceans toair temperature.
The question has been raised in the media of the effect of climatechange on the ‘Gulf Stream’, one of the three main ocean conveyors,the great currents that drive the seas – the Atlantic, the Pacific andthe Indian Ocean, known also as the ‘thermohaline’ loops.
The ability of the oceans to convey heat is dependent on thesalinity of the water. If the oceans become more saline, they becomemore efficient in transporting warm water from the equatorial regions
8.4.Estimate of the present (lateHolocene) rates of relative landchanges (mm/yr). Positive valuesindicate relative land uplift,negative values are relative landsubsidence. Contours have beendrawn by eye. The effects ofsediment consolidation are notincluded. (Source: UKCIP02Climate Change Scenarios,funded by DEFRA, produced byTyndall and Hadley Centres forUKCIP, and Ian Shennan, 1989)
194 Adapting Buildings and Cities for Climate Change
100km0
<0.5
<1.6
<1.9<1.5
<1.0
<1.0
<0.0
–0.5
–1.0
–1.0
–1.5–1.9
–0.7 to –0.9
–0.2to
–0.5–0.1 to
–1.4
–2.0–0.7 to
–0.1
1.0
0.5
0.0
0.3
0.1
≈0.0
≈0.0
<2.0
<1.8
>0.50.5
N
Roaf_Ch08.qxd 29/10/04 6:48 PM Page 194
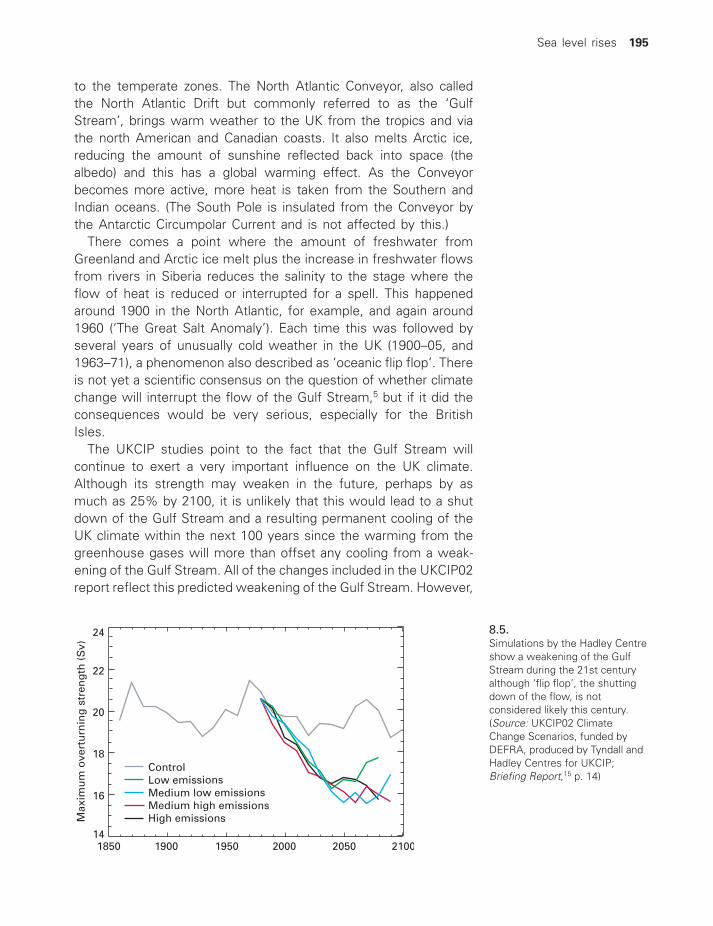
to the temperate zones. The North Atlantic Conveyor, also calledthe North Atlantic Drift but commonly referred to as the ‘GulfStream’, brings warm weather to the UK from the tropics and viathe north American and Canadian coasts. It also melts Arctic ice,reducing the amount of sunshine reflected back into space (thealbedo) and this has a global warming effect. As the Conveyorbecomes more active, more heat is taken from the Southern andIndian oceans. (The South Pole is insulated from the Conveyor bythe Antarctic Circumpolar Current and is not affected by this.)
There comes a point where the amount of freshwater fromGreenland and Arctic ice melt plus the increase in freshwater flowsfrom rivers in Siberia reduces the salinity to the stage where theflow of heat is reduced or interrupted for a spell. This happenedaround 1900 in the North Atlantic, for example, and again around1960 (‘The Great Salt Anomaly’). Each time this was followed byseveral years of unusually cold weather in the UK (1900–05, and1963–71), a phenomenon also described as ‘oceanic flip flop’. Thereis not yet a scientific consensus on the question of whether climatechange will interrupt the flow of the Gulf Stream,5 but if it did theconsequences would be very serious, especially for the BritishIsles.
The UKCIP studies point to the fact that the Gulf Stream willcontinue to exert a very important influence on the UK climate.Although its strength may weaken in the future, perhaps by asmuch as 25% by 2100, it is unlikely that this would lead to a shutdown of the Gulf Stream and a resulting permanent cooling of theUK climate within the next 100 years since the warming from thegreenhouse gases will more than offset any cooling from a weak-ening of the Gulf Stream. All of the changes included in the UKCIP02report reflect this predicted weakening of the Gulf Stream. However,
8.5.Simulations by the Hadley Centreshow a weakening of the GulfStream during the 21st centuryalthough ‘flip flop’, the shuttingdown of the flow, is notconsidered likely this century.(Source: UKCIP02 ClimateChange Scenarios, funded byDEFRA, produced by Tyndall andHadley Centres for UKCIP;Briefing Report,15 p. 14)
Sea level rises 195
2100205020001950185014
16
18
20
22
24
1900
Max
imu
m o
vert
urn
ing
str
eng
th (
Sv)
ControlLow emissionsMedium low emissionsMedium high emissionsHigh emissions
Roaf_Ch08.qxd 29/10/04 6:48 PM Page 195

not enough is known about the factors that control ocean circula-tions to be completely confident about this prediction, especiallyin the longer term.
WHAT MAKES SEA LEVELS RISE?
Sea level changes are caused by:
● The thermal expansion of the oceans.● The melting of glaciers.● Changes to the major Greenland and Antarctic ice sheets.
The thermal expansion of the oceans
As the temperature of the waters in the oceans rises and the seasbecome less dense, they expand and will spread, occupying moresurface area on the planet causing inundation of low lying areas.Increased temperature will accelerate the rate of sea level rise.Since the end of the last Ice Age, 18 000 years ago, sea level hasrisen by over 120 m.
The melting of the glaciers
This is occurring at an alarming rate with glaciers, on five majorcontinents disappearing rapidly. The ice cap on Mount Kilimanjaromay be gone in 20 years and the summer of 2003 saw meltingof the perma-frost levels in many parts of the Alps destabilizingmountain slopes and closing off the Matterhorn to visitors for thefirst time in its history. Temperature changes are already causing90% of the world’s glaciers to retreat and some to disappear com-pletely, with potentially catastrophic consequences for commun-ities that rely on melt water for irrigation, hydroelectric power anddrinking water, and also communities affected by sea level rises.
In the Alps, where summer temperatures have risen by 2.1 �Csince the 1970s, summer flows in glacier-fed rivers have doubled,enabling hydroelectric dams to remain full and power stations to gen-erate at maximum capacity, helping to take up the load slack fromthe nuclear power stations that, due to low river flow elsewhere,could not generate at full capacity during the heat wave of 2003 inEurope. So there are many other knock-on effects from such melts.
In the longer term many glaciers will only survive at the high-est altitudes. Only Scandinavian and Alaskan glaciers are not reced-ing, and in some cases are increasing due to increased snowfalllocally, another side effect of climate change.
Another problem is that due to the higher atmospheric pressureexperienced in the Alps there is now less snowfall there resulting
196 Adapting Buildings and Cities for Climate Change
Roaf_Ch08.qxd 29/10/04 6:48 PM Page 196

in glaciers not being replenished as before. Scandinavia, by contrast,is in the path of the changed track of the Atlantic depressions, asis Britain, resulting in extra rainfall in these countries. In other regionsof the world the picture is much worse; the glaciers of Central Asiaare disappearing at a rapid rate threatening severe future drinkingwater deficits in countries such as Kazakhstan as the river run-offis reduced. A further problem is the mounds of rubble left behindthem, in which meltwater accumulates in dams that could burst andcause catastrophic flooding to settlements downstream.
Changes to the major Greenland, Arctic and Antarctic ice
At very high northern latitudes, in and around the Arctic sea, iceloss will be dramatic although in the southern oceans aroundAntarctica that rate of ice loss will be slower. The maximum melt
Sea level rises 197
(a) (b)
8.6.(a) When Mark Lynas’s father photographed this fan-shaped glacier in the Jacabamba valley in the eastern CordilleraBlanca in Peru in 1980 he little thought that his son would revisit it 20 years later to find that it had completelydisappeared (b). Note the severe thinning of the ice field on the skyline above the lake. (Source: (a) Bryan Lynas; (b) TimHelweg-Larsen in Mark Lynas (2004) High Tide: News from a Warming World, Flamingo)
Roaf_Ch08.qxd 29/10/04 6:49 PM Page 197
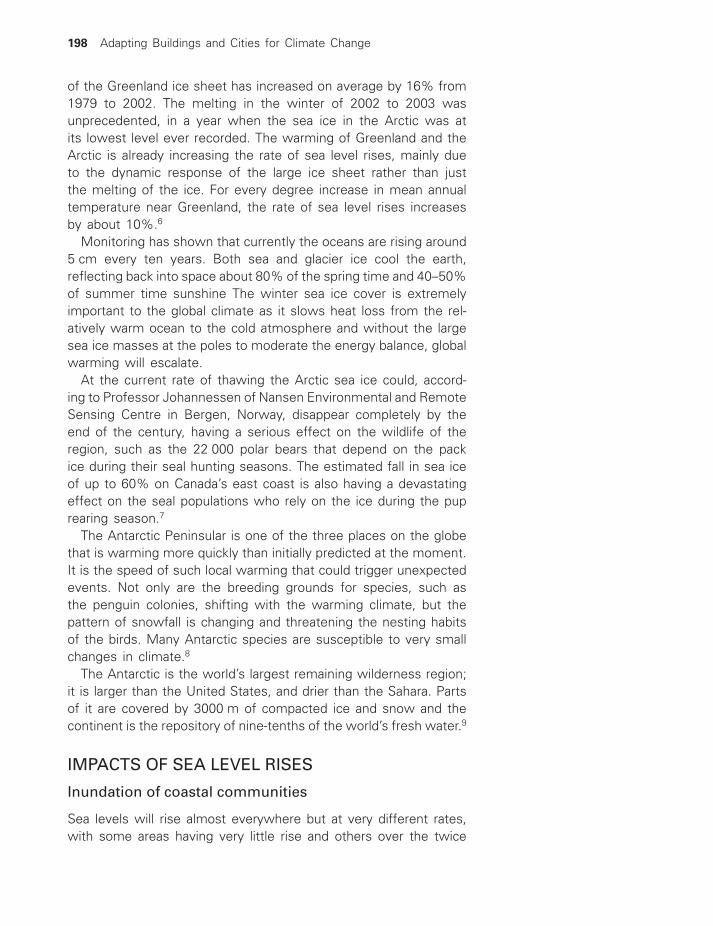
of the Greenland ice sheet has increased on average by 16% from1979 to 2002. The melting in the winter of 2002 to 2003 wasunprecedented, in a year when the sea ice in the Arctic was atits lowest level ever recorded. The warming of Greenland and theArctic is already increasing the rate of sea level rises, mainly dueto the dynamic response of the large ice sheet rather than justthe melting of the ice. For every degree increase in mean annualtemperature near Greenland, the rate of sea level rises increasesby about 10%.6
Monitoring has shown that currently the oceans are rising around5 cm every ten years. Both sea and glacier ice cool the earth,reflecting back into space about 80% of the spring time and 40–50%of summer time sunshine The winter sea ice cover is extremelyimportant to the global climate as it slows heat loss from the rel-atively warm ocean to the cold atmosphere and without the largesea ice masses at the poles to moderate the energy balance, globalwarming will escalate.
At the current rate of thawing the Arctic sea ice could, accord-ing to Professor Johannessen of Nansen Environmental and RemoteSensing Centre in Bergen, Norway, disappear completely by theend of the century, having a serious effect on the wildlife of theregion, such as the 22 000 polar bears that depend on the packice during their seal hunting seasons. The estimated fall in sea iceof up to 60% on Canada’s east coast is also having a devastatingeffect on the seal populations who rely on the ice during the puprearing season.7
The Antarctic Peninsular is one of the three places on the globethat is warming more quickly than initially predicted at the moment.It is the speed of such local warming that could trigger unexpectedevents. Not only are the breeding grounds for species, such asthe penguin colonies, shifting with the warming climate, but thepattern of snowfall is changing and threatening the nesting habitsof the birds. Many Antarctic species are susceptible to very smallchanges in climate.8
The Antarctic is the world’s largest remaining wilderness region;it is larger than the United States, and drier than the Sahara. Partsof it are covered by 3000 m of compacted ice and snow and thecontinent is the repository of nine-tenths of the world’s fresh water.9
IMPACTS OF SEA LEVEL RISES
Inundation of coastal communities
Sea levels will rise almost everywhere but at very different rates,with some areas having very little rise and others over the twice
198 Adapting Buildings and Cities for Climate Change
Roaf_Ch08.qxd 29/10/04 6:49 PM Page 198

the global average rises. The predicted patterns show large increasesin sea level in parts of the north Pacific.2
Many islands around the world will disappear as sea levels rise.Tuvalu may have the first large inhabited island to be lost forever.It comprises nine coral atolls located between Australia and Hawaii.Their highest point is 5 meters (15 feet) above seal level. As sealevel has risen, Tuvalu has experienced lowland flooding. Salt waterintrusion is adversely affecting drinking water and food production.
8.7.Arctic perennial sea ice has beendecreasing at a rate of 9% perdecade. The first image (a)shows the minimum sea iceconcentration for the year 1979,and the second image (b) showsthe minimum sea iceconcentration in 2003. The dataused to create these imageswere collected by the DefenseMeteorological Satellite Program(DMSP) Special SensorMicrowave Imager (SSMI).(Source: NASA andhttp://www.gsfc.nasa.gov/gsfc/earth/pictures/2003/1023esuice/STILLsea79.jpg)
Sea level rises 199
(a)
(b)
Roaf_Ch08.qxd 29/10/04 6:49 PM Page 199

Tuvalu’s leaders predict that the nation will be submerged in 50years, but this may be very optimistic as much of the island isalready covered by water at regular intervals during the year. InMarch 2002 the country’s prime minister appealed to Australia andNew Zealand to provide homes for his people if his country iswashed away, but the plight of this nation is being ignored.10
Other threatened island nations include the Cook Islands and theMarshall Islands. During the past decade, the island of Majuro(Marshall Islands) has lost up to 20 per cent of its beachfront.
In addition to island nations, low-lying coastal countries are threat-ened by rising sea level. A 1 m rise in sea level, inevitable undercurrent CO2 emissions scenarios, would inundate half of Bangladesh’srice land and flood large areas of rice-growing nations such asVietnam, China, India and Thailand. There are areas of large-scalepopulation particularly vulnerable to sea level rise in the Philippines,Indonesia and Egypt.
The eastern coastline of the United States is also extremely vul-nerable to coastal erosion, with shorelines retreating rapidly in someregions, resulting in the narrowing of beaches and washing out ofvacation houses, exacerbated by the more frequent and intensehurricanes along the eastern seaboard.
Coastal flooding in the UK
In Britain the impacts of the combination of sea level rises andstormier weather are set to take a high toll. Much of the Britishcoastline will experience rising seas and stormier weather, and
8.8.Woman carrying a bowl of foodthrough the flood waters in thecentre of Funafuti atoll of theSouth Pacific to a gathering in thenearby community centre. Thetidal floods, brought on by risingsea levels, were up to a footdeep in places. (Source: MarkLynas (2004) High Tide: Newsfrom a Warming World,Flamingo)
200 Adapting Buildings and Cities for Climate Change
Roaf_Ch08.qxd 29/10/04 6:49 PM Page 200

amongst others, the National Trust, which owns 600 miles of coast-line, is engaged in a ‘managed retreat’ from threatened coastlines.A number of its key sites will be threatened; seaside propertiesin the picturesque villages like Porthleven, Mullion, Birling Gap andBrownsea, as well as major sites like Lindisfarne Castle and StMichael’s Mount, are at risk.11
Settlements have evolved with defences designed to cope withhistoric sea levels and extreme heights of flood or storm surges.It is the surge height of a river or ocean wave that causes themost damage and over-tops defences, and this height will be raisedabove previous historic levels, exacerbated by sea level rises andmore intense storms. The risk of London flooding is increasingyear on year. The Thames Barrier, built at a cost of £50 million in1984 to protect the capital from tidal surges until 2030, is clearlynot going to be able to protect London from a flood like that of1953 by then.12
This area of Southeast England has suffered throughout recordedhistory from catastrophic inundations, and London is particularly
Sea level rises 201
ANGLIAN REGION
THAMES REGIONBARKING BARRIER
CANVEY ISLAND
FOBBING HORSEBARRIER
Grays
Tilbury
Gravesend
BENFLEETBARRIER
EAST HAVENBARRIER
SHOE BURYNESS
SHEERNESS
DARTFORD BARRIER
KEY
Downstream limit of strategy
EA Regional Boundary
5 m ContourGLA Boundary
SOUTHERN REGION
THAMES BARRIER
TEDDINGTON WEIR(TIDAL LIMIT)
8.9.The historic flood plain of the lower Thames Estuary showing the areas that have historically flooded during periods oftidal surges. (Source: Environment Agency)
Roaf_Ch08.qxd 29/10/04 6:49 PM Page 201

vulnerable, being sited on the conjunction of the mouth of theflood-prone Thames river valley and the end of a storm surge-proneestuary (see Box 8.1).
202 Adapting Buildings and Cities for Climate Change
Box 8.1 Some examples of fatal floods in London’s historyi
1236 – Floods caused by a high storm surge tide in Novemberdrowned many people and a great number of cattle in the Woolwicharea.1242 – Heavy rain and thunderstorms on 19 November and on manydays thereafter; the Thames flooded at Westminster and Lambeth.1663 – A flood, driven by gales and produced by a high tide that wassaid not to have been exceeded for more than 200 years submergedWhitehall.1703 – November: The Great Storm. The tidal flood affecting theThames on 30 November was associated with this storm, though thetidal storm surge for this event was more significant on the Severnand along the Dutch coast. Twelve warships with 1300 men on boardwere lost in sight of land, Eddystone lighthouse was destroyed andpractically all shipping in the Thames was destroyed or damaged. InLondon alone 22 people were drowned, 21 people were killed and200 injured by falling and flying debris. It was estimated that 8000people lost their lives in the floods caused by the storm in the riversThames and Severn and in Holland. The damage due to the storm andflood in London alone was estimated then to be £2 million.1809 – January: A flood occurred, which may have been tidal in thelower reaches of the Thames, and carried away bridges at Eton,Deptford and Lewisham. Flooding was noted at Windsor.1953 – 31 January to 1 February: The North Sea Storm Surge.A northerly severe gale/violent storm (mean speeds up to70 knots/80 mph, with gusts in exposed areas in excess of100 knots/115 mph) developed as a depression deepened as it movedeast-northeast just to the north of Scotland. Then on the 31 January,still deepening, it turned and accelerated southeastwards across theNorth Sea, making landfall in the Elbe–Weser estuary in northwestGermany late in the evening. As a result of the storm, the ferryPrincess Victoria foundered during a crossing of the Irish Sea, with theloss of 132 lives. Much damage (loss of timber) was done toafforested areas in Scotland too. The major well-known effect of thisstorm was due to a combination of events, which brought tragedy tomany living in low-lying areas on either side of the southern NorthSea. The rapidly reducing pressure allowed a rise in water level; asharp recovery (or rise) in pressure to the west of Ireland tightenedthe gradient on the western flank of the low pressure area; the stateof the tide (spring/full-moon) and of course the driving of hugequantities of water towards the narrower southern portion of the
Roaf_Ch08.qxd 29/10/04 6:49 PM Page 202

In light of such an historic record of flooding and given that thisarea of Britain will see the great rises in sea levels it is easy tounderstand why so many people are concerned over the plans forthe Thames Gateway project for 200 000 homes to the east ofLondon. The development, it is hoped, will provide 300 000 jobsin an area that already has no job shortages and one that is proneto serious flooding and contains some of Britain’s most valuablewildlife sites, 42 of them Sites of Special Scientific Interest. Itreaches some 40 miles on each side of the Thames east of Londonand as planned will be one of the biggest construction projectsBritain has seen since the post-war boom, with a proposed newairport at Cliffe, a deep-water port at Shellhaven and a secondbridge across the lower Thames landing on the south side of theriver at Higham Marshes in the EU Special Protection Area.13
The Association of British Insurers (ABI), who had not been con-sulted during the planning stages, were so concerned about theproposed location and the use of lightweight innovative construc-tion methods such as timber and steel frame housing, which hasproved to be high risk for insurers in the past, that they had notguaranteed to provide mortgages or house insurance for a singledwelling before plans were passed for the development. In a spec-tacular example of the lack of joined-up thinking the ABI wererequiring that a substantial flood defence be placed around thewhole development, possibly a double bund structure. This wouldinevitably push up flood water levels in the Thames Estuary soflooding other settlements on its coast and possibly, in conjunc-tion with a storm surge and raised sea levels, push water over
Sea level rises 203
North Sea gave rise to severe inundation of coastal areas in England(from the Humber estuary in the north to the Thames Estuary and eastKent coast in the south), Belgium and the Netherlands, with much lossof life. The situation was not helped due to the fact that the rivers werefull, attempting to discharge greater-than-average quantities of winterrain-water against the wind-driven surge. The UK Storm Tide WarningService was inaugurated after these floods,ii though the Dutch had hada similar service since the early part of the 20th century.
i From the excellent site: http://www.booty.demon.co.uk/climate/wxevents.htm).
ii The UK Storm Tide Warning Service can be contacted via the EnvironmentAgency General Enquiry line: 0845 9333111; Floodline on 0845 9881188 givesinformation on all types of coastal and riverine flooding. For specific enquiriesemail the EA on [email protected]).
Roaf_Ch08.qxd 29/10/04 6:49 PM Page 203

the Thames Barrier so flooding London. The Thames is the bestdefended river in the UK, with protection to a design standard ofthe 1000 year return period event. In The Netherlands they designfor a 10 000–20 000 year event. Perhaps London should do thesame. Planners are also concerned that there is only one road inand out of the heart of the Thames Gateway development andnot only will this lead to congestion but it also means that in theevent of an emergency, evacuation of the region would be slowat best, and at worst be halted by a single road accident.
While confidence in the regional sea level rise predictions is notas great as for temperature,14 there is sufficient evidence for peo-ple to make informed and sensible decisions about where, andwhere not, to develop ‘sustainable’ communities. Perhaps the Frenchword here is better. They use ‘durable’, meaning that they will last.
For instance, in choosing lightweight steel or timber innovativebuilding types the ABI are worried that houses in the ThamesGateway development are too vulnerable to damage in the eventof a flood, and that they are, being located in this flood zone, tooexposed to the hazard of flooding. Increasingly planning for ‘sus-tainability’ will require that the exposure of new developments tosuch hazards be minimized and this may well mean far tighter plan-ning controls on who lives or works on flood plains, or ultimatelymoving people to those areas of the country that will not flood andare capable of being evacuated rapidly and safely if they do. Wemay then see, over the next decades, the migration of populationsto less climatically exposed regions of the British Isles.
NOTES AND REFERENCES
1 For a map of where these people live see: http://earthtrends.wri.org/text/POP/maps/196.htm and for a detailed discussion ofthe impacts of shoreline management see: http://www.survas.mdx.ac.uk/pdfs/3mizutan.pdf.
2 See: http://www.metoffice.gov.uk/research/hadleycentre/pubs/brochures/B2000/predictions.html.
3 Guardian, 4 September 2003, p. 15.
4 Hulme, M., Jenkins, G., Lu, X., Turnpenny, J., Mitchell, T.,Jones, R., Lowe, J., Murphy, J., Hassell, D., Boorman, P.,McDonald, R. and Hill, S. (2002) Climate Change Scenarios forthe United Kingdom: The UKCIP02 Scientific Report, Appendix2 published in conjunction with UKCIP, the Hadley Centre andthe Climate Research Unit in the School of EnvironmentalScience at the University of East Anglia, by the Tyndall Centre,Norwich. http://www.ukcip.org.uk/publications/pub.html.
204 Adapting Buildings and Cities for Climate Change
Roaf_Ch08.qxd 29/10/04 6:49 PM Page 204

5 For a fuller discussion of this phenomenon and related argu-ments see Crichton, D. (2001) The Implications of ClimateChange for the Insurance Industry: An Update and the Outlookto 2020. Garston, Watford: Building Research Establishment.See http://www.brebookshop.com. See also for a concisewebsite on the subject: http://www.doc.mmu.ac.uk/aric/eae/Climate/Older/Gulf_Stream.html.
6 Guardian, 11 January 2003, p. 9, quoting the work of ProfessorKonrad Steffan, a geographer at Colorado State University.
7 Independent, 10 March 2003, p. 5.
8 Guardian, 9 September 2003, p. 9.
9 http://www.antarctica.ac.uk/About_Antarctica/Ice/index.html.
10 For an excellent description of the current state of flooding inTuvalu and a fascinating first-hand description of a wide rangeof climate change impacts around the world see Lynas, Mark(2004) High Tide: News from a Warming World. Flamingo.
11 http://www.nationaltrust.org.uk/coastline/save/coastal_erosion.html.
12 Observer, 22 December 2003, p. 5.
13 Guardian, Society, 12 March 2003, p. 8.
14 see http://www.metoffice.gov.uk/research/hadleycentre/pubs/brochures/B2000/predictions.html.
15 Hulme, M.J., Turnpenny, J. and Jenkins, G. (2002) ClimateChange Scenarios for the United Kingdom: The UKCIP02Briefing Report. Published in conjunction with UKCIP, theHadley Centre and the Climate Research Unit in the Schoolof Environmental Science at the University of East Anglia, bythe Tyndall Centre, Norwich.
Sea level rises 205
Roaf_Ch08.qxd 29/10/04 6:49 PM Page 205

MIGRATION
Definition (http://www.hyperdictionary.com/dictionary/migration):
1 the movement of persons from one country or locality to anotherthe periodic passage of groups of animals (especially birds orfishes) from one region to another for feeding or breeding
2 (chemistry) the nonrandom movement of an atom or radicalfrom one place to another within a molecule
3 a group of people migrating together (especially in some giventime period)
Over 175 million people now live outside the country of their birth –double the figure in 1975. Many are economic migrants, who maybe fleeing poverty and severe deprivation. They are an importantdevelopment resource for their home countries, remitting aboutUS$80 billion per year to developing nations, compared to the $50billion such countries receive in world aid.1
Environmental refugees currently outnumber those fleeing fromwar, political or religious persecution and could soon reach 20 mil-lion people a year. By 2050 the new Economics Foundation claimsthat around 150 million people will be displaced by the impacts ofclimate change and such refugees will be a major cause of globalinstability and a fertile breeding ground for bitterness and resent-ments, and terrorism.2
The Third Report from the International Development Committeeof the House of Commons, on ‘Global climate change and sustainabledevelopment’ (2002), stated:3
Where vulnerability is extreme, often populations are left with no alter-native but to migrate. It is often used as a means of last resort.
Migration is an important traditional coping mechanism to deal with climaticsituations that are not survivable, and as such is an adaptation strategy. But
9 VULNERABILITY, EXPOSURE AND MIGRATION
Roaf_Ch09.qxd 29/10/04 6:50 PM Page 206

Vulnerability, exposure and migration 207
the right to migrate is increasingly being contested and is a source of conflictin many societies. Many of those displaced in Bangladesh by rising sealevels will migrate to India, exacerbating already high levels of illegal migra-tion. The immigration populations of the Sahel into the Ivory Coast was onsuch a scale that the Ivory Coast had introduced legislation preventingforeign nationals from owning land. There is no international recognition ofenvironmental refugees; they are not entitled to the same rights as refugeesfrom conflict and persecution. The UK Government has no specific policyto deal with them. The British Bangladeshi Professional Association calledfor a new convention to protect the rights of environmental refugees in thesame way that refugees fleeing conflict or persecution are protected underinternational law. The need for national and international policies to dealwith ‘environmental’ refugees will become greater as more people aretemporarily or permanently displaced from their homes by more frequentand more intense climate disasters or by progressive climate change, suchas rising sea levels or desertification. DFID [Department of Food andInternational Development of the UK Government] was recommended bythe Commons committee to push for a policy on ‘environmental’ refugees.Any policy response must recognize that this issue cuts across several[government] departments.
9.1.Children across the world arebecoming climate refugees, suchas this young man in Sudan.Would you close the door on hisfuture which is now threatenedby a combination of climatechange and war. (Source: AdrianArbib)
Roaf_Ch09.qxd 29/10/04 6:51 PM Page 207

208 Adapting Buildings and Cities for Climate Change
Migration has traditionally been seen as a ‘reaction’ to environmentaldisasters, but in an age where we have the tools and methodolo-gies to predict, and imagine, future impacts the movement of peo-ples must be developed as a ‘proactive’ tool. For instance,the inhabitants of Tuvalu, mentioned in Chapter 8, know very welltheir plight, but even today as their islands flood they have nowhereto go.
Every region and country should have well-developed models ofwhat climate change will do to their industries, populations andecosystems now, in order that humane political decisions on themovement of peoples in the future can be carefully planned toavoid the later devastation in extreme climate events.
Perhaps one of the most effective adaptation skills our societycould develop would be to train enough climate modellers to beable to inform a generation of decision-makers, and the commu-nities they serve, on how to minimize the impacts of climate changeon populations. But it would depend on who was being affected,because we all know that humane political decisions often do notwin votes, regardless of who is doing the polluting. Such informationmay also be against the entrenched interests of some politiciansand industries.
We know enough already, in many instances, for it to be arguablyirresponsible not to act to engineer our future history to minimizethe impacts of our actions today on the well-being of the childrenof tomorrow. The careful, pre-emptive planning, and movement, offuture populations is one of the most effective methods we haveof minimizing such impacts, across the world or just across a town.
The polluters should pay
The costs of supporting climate refugees is now a matter for opennegotiations. Many are now questioning why, when it is the richcountries that are creating the pollution that is driving climatechange, it falls on the shoulders of many of the world’s poorestcountries, and continents, to foot the bill for those peoples dis-placed by that climate change.
The New Economics Foundation warned in September 2003 thatthe rich countries of the world must be prepared to take their fairshare of the refugees created by climate change, in an extensionof the ‘Polluters Pay’ principal. This states that:2
People whose environments are damaged and destroyed and who arelosing their livelihoods, should be recompensed and protected by thoseresponsible.
The Foundation suggested that the Geneva Convention should beexpanded to include those displaced by environmental degradation.
Roaf_Ch09.qxd 29/10/04 6:51 PM Page 208

They argue that, despite widespread denials of liability, where coun-tries continue to pollute when they are fully aware of the damagingconsequences, they should be made to reflect their liability by takingin climate refugees. To disregard knowledge should be classed asintentional behaviour, and could be considered as environmentalpersecution. Environmental refugees currently outnumber thosefleeing from war, political or religious persecution and could reach20 million people a year. The number of refugees taken in, theysuggest, should be proportional to the amount of pollution a countrygenerates.
The UK, for instance, produces around 3% of greenhouse gasemissions and of the 20 million refugees created a year they shouldbe liable to take in 300,000. The figure for the United States, whichgenerates 25% of all greenhouse gases, would be 5 million refugeesa year. They cite the fact that rich countries spend around £50 bil-lion a year subsidizing fossil fuel industries but around £300 000helping poor countries manage their emissions and adapt to climatechange.
The idea that the impacts and severity of climate change could,over the coming decades, become the subject of international litigationis interesting; that the polluters will have to pay could add billionsto the budgets of countries as they face the challenges of footingthe bill for climate change in the future. But it is also within coun-tries that the issue of responsibility for paying for climate changeimpacts becomes critical.
In a desperate attempt to get the Bush administration to acceptits responsibilities in relation to climate change, a dozen US stateshave filed a suit against the US government to force them to acton global climate change.4 In the current suit the states claim thatthe agency is ignoring federal studies that demonstrate that cli-mate change is causing ‘disease, extreme weather, destruction ofshoreline and loss of critical wetlands and estuaries’. What is notcited are the economic and human impacts of the desertificationof tracts of the Mid-West and the huge costs of the inevitable,and happening, mass migration of people from stricken areas asagriculture is devastated by the climate.
In the UK could similar charges be levelled? The already stretchedwater reserves of the southeastern area of England are to berequired to supply a massive increase in homes and population inthe region, imposed upon them by the current government, sothreatening future availability of summer water supplies in theregion.5 Will such decisions be the source of law suits, either fromwater utility companies that will find it increasingly expensive tomake less water go further, or from populations whose water billsrise to insupportable levels because of injudicious decisions bytransient governments? Similarly as whole neighbourhoods of a
Vulnerability, exposure and migration 209
Roaf_Ch09.qxd 29/10/04 6:51 PM Page 209

210 Adapting Buildings and Cities for Climate Change
city have their transport, sewerage, water and electricity servicescompromised to support a monster building, for instance, whosedevelopers have sold, profited and moved on without paying forany of the environmental impacts of that building, will the pol-luters, in these cases, be made to pay?
One of the core issues here is the extent of the vulnerability ofcommunities to impacts.
VULNERABILITY
Many sources expand on the perception that the impacts of cli-mate change will not be evenly spread across the globe and arelikely to fall disproportionately on the poor.3 Such studies typicallyoutline the potential impacts on the developing world. The TyndallCentre, of the University of East Anglia, did an excellent study inVietnam,6 demonstrating that those already marginalized in theeconomy were likely to suffer the greatest impacts as they hadthe fewest resources for coping with adverse change, a findingreflected in a number of other studies.7
In the Commons Select Committee report on global climatechange referred to earlier, it was repeatedly stressed that climatechange has the potential to increase further the inequality betweendeveloped and developing countries. As with corruption andHIV/AIDS, they claim, climate change could undermine develop-ment investment.3 However, unlike corruption or HIV/AIDS, climatechange is not widely recognized as an immediate problem becausemany of its impacts have been, to date, gradual and long-term.
9.2.Regional depopulation may beaccelerated by a compounding ofissues such as low rain fall,pollution of water, waste, overpopulation and hightemperatures. (Source: AdrianArbib)
Roaf_Ch09.qxd 29/10/04 6:51 PM Page 210
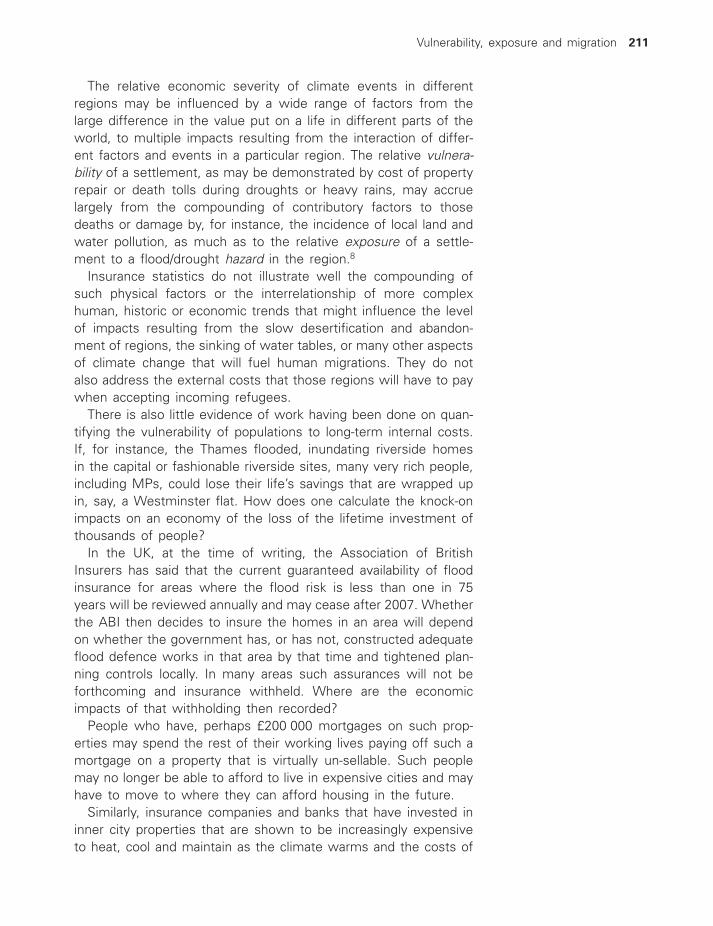
The relative economic severity of climate events in differentregions may be influenced by a wide range of factors from thelarge difference in the value put on a life in different parts of theworld, to multiple impacts resulting from the interaction of differ-ent factors and events in a particular region. The relative vulnera-bility of a settlement, as may be demonstrated by cost of propertyrepair or death tolls during droughts or heavy rains, may accruelargely from the compounding of contributory factors to thosedeaths or damage by, for instance, the incidence of local land andwater pollution, as much as to the relative exposure of a settle-ment to a flood/drought hazard in the region.8
Insurance statistics do not illustrate well the compounding ofsuch physical factors or the interrelationship of more complexhuman, historic or economic trends that might influence the levelof impacts resulting from the slow desertification and abandon-ment of regions, the sinking of water tables, or many other aspectsof climate change that will fuel human migrations. They do notalso address the external costs that those regions will have to paywhen accepting incoming refugees.
There is also little evidence of work having been done on quan-tifying the vulnerability of populations to long-term internal costs.If, for instance, the Thames flooded, inundating riverside homesin the capital or fashionable riverside sites, many very rich people,including MPs, could lose their life’s savings that are wrapped upin, say, a Westminster flat. How does one calculate the knock-onimpacts on an economy of the loss of the lifetime investment ofthousands of people?
In the UK, at the time of writing, the Association of BritishInsurers has said that the current guaranteed availability of floodinsurance for areas where the flood risk is less than one in 75years will be reviewed annually and may cease after 2007. Whetherthe ABI then decides to insure the homes in an area will dependon whether the government has, or has not, constructed adequateflood defence works in that area by that time and tightened plan-ning controls locally. In many areas such assurances will not beforthcoming and insurance withheld. Where are the economicimpacts of that withholding then recorded?
People who have, perhaps £200 000 mortgages on such prop-erties may spend the rest of their working lives paying off such amortgage on a property that is virtually un-sellable. Such peoplemay no longer be able to afford to live in expensive cities and mayhave to move to where they can afford housing in the future.
Similarly, insurance companies and banks that have invested ininner city properties that are shown to be increasingly expensiveto heat, cool and maintain as the climate warms and the costs of
Vulnerability, exposure and migration 211
Roaf_Ch09.qxd 29/10/04 6:51 PM Page 211

energy rise may find it impossible to sell such ‘White Elephant’ or‘Dog’ buildings, and sections of the markets, where large amountsof equity are placed in real estate, could collapse, taking swathesof white collar workers and their families into poverty. Similar resultscould accrue from the direct impacts of catastrophic storms thatdestroy vulnerable buildings, or fires or urban flooding. Buildings,or whole areas of a city, may become subject to negative equitywithin minutes.
What we learnt in the summer of 2003, as the lights went outin cities around the world (for millions of people in Italy becausea single tree blew across a power line in a storm), was that infact the people in the buildings of New York were the most vul-nerable of all during power failures. High rise buildings had toempty within minutes because the air was no longer breathableaccording to some evacuees. Those in simple traditional buildingsin cities in the developing world where the power failed oftenhardly noticed it, getting on with life as usual until the power wentback on. What would have happened if the electricity had failedin New York in a blizzard? Perhaps it is time for the developednations to look at the issue of vulnerability very closely in relationto their own cities and lifestyles.
As the pressures of climate change bites, the vulnerability ofpopulations to it will spread, from the dried-out Mid-West ofAmerica, hurricane-struck Florida, the flooded coastal flats of theThames Estuary, or to the deserts of Africa and the Middle East.Populations will not stay where they no longer have homes theycan afford to live in, food or water enough to survive, and theywill bring their anger to town, as has happened throughout history.When the Nile or the Rhine flooded, people came to the nearesttowns and cities in hope of surviving there, and were willing totake what they need to survive.
In an interesting study, written in the late 1930s, S.F. Markham,an extremely influential climatic determinist, mapped those areas ofthe world that could comfortably house European populations with-out too much heating and cooling.9 He argued that all those areaswithout shading in Figure 9.3, above and below the tropics, wouldrequire large amounts of energy to keep ‘civilised whitemen’ com-fortable, but, he opined, the domination of the white European inthe world would be established with the uptake of air conditioningin those areas where it was too hot to survive in a ‘civilised’ fash-ion without it. He also went on to point out that air conditioning,even in the hottest climate, gave people the ‘zest’ to dance, eat,work, earn and spend money. It is an interesting line of thought to associate global politics, religion and capitalism with the joys ofair conditioning. Recent studies, however, have begun to indicatethat in some climates people will spend more time out of doors,
212 Adapting Buildings and Cities for Climate Change
Roaf_Ch09.qxd 29/10/04 6:51 PM Page 212

Vulnerability, exposure and migration 213
shopping, eating and spending more money, in warmer weather.This is a field where much more work is needed on understandingexactly how such complex inter-relationships between climate, econ-omy and human behaviour can be manipulated to result in decisionswith low environmental impacts that can also benefit local andregional economies.
Much is written about ‘vulnerability’ to climate change. TheCommons Report describes it as being: ‘determined by social, insti-tutional and economic factors and the sensitivity of populations toclimate impacts, as well as by institutional capacity, the ability toadapt, and location. The Commons Report also states that:3
As the conditions within a country change, so does its vulnerability. Nationalvulnerability will increase if the main centres providing economic growthare located in vulnerable areas.
Do they mean exposed areas perhaps, or both? For example, thosecountries whose populations and economically productive enter-prises are in coastal zones will face a higher risk.
9.3.Areas of the world where the warmest months do not exceed a mean of 75 �F and the mean for the coldest month doesnot fall below 32�, 20� or 10 �F. (Tropical areas within these limits have been excluded because of the greater intensity ofsolar radiation.) These were areas Markham considered of optimal climate, requiring minimal heating and cooling tomaintain indoor comfort. (Source: Markham,9 p. 98)
Climatecontrols
introducedcirca 1830 A.D.
Climatecontrols
introducedcirca 1650 A.D.
Climatecontrols
not yet ingeneral use
Climatecontrols
introducedcirca 1880 A.D.
Climate controlsintroduced circa
1840 A.D.
Climatecontrols
introducedcirca 1350 A.D.
Climatecontrols
introducedcirca 1890 A.D.
10°
10°
10°10°
20°20°
32°32°
75°
75°
20°32°
Tropic of Cancer
Tropic of Capricorn
Winter isotherms 75˚ S
u m m er Isot
hermW
inter Isotherms
75˚ Summer Isotherm
32˚ Winter Isotherm
Roaf_Ch09.qxd 29/10/04 6:51 PM Page 213

IPCC Working Group II10 noted that the communities that are themost vulnerable to climate change were also subject to pressuresfrom population growth, resource depletion and poverty.
Rapid urbanization, land degradation, water pollution, water scarcity, andthe destruction of ecosystems are also added pressures. All these factorsaffect vulnerability to variations in the current climate, as well as to futureclimate change.
These conditions would appear to be applicable to many coastalcities such as London, New York and Tokyo. What is not mentionedis that the short-sighted actions of politicians can add substantiallyto this catalogue of risk factors, and the vulnerability of populations,by not taking seriously the challenges of future-proofing buildings,cities and regions against such pressures. MPs who represent localpopulations should be given key positions on committees makingdecisions on such developments in their constituencies.
The Commons Report3 goes on to claim that ‘Developing coun-tries have limited financial, human, technological, institutional andnatural resources, making them less able to respond to the effectsof climate change.’ That may be true, but how prepared is theSoutheast for the knock-on impacts of three million new homes –the need to find more local waste dumping sites, to make scarcesummer water supplies serve hundreds of thousands more people in the region, to increase sewerage capacity and build newpower plants in an already well-populated region?
QUIS CUSTODIET IPOS CUSTODIES?
Who guards the guardians? A major problem with the develop-ment of solutions to the problem of international climate refugeesis that no single international agency, not even the UNHCR (UnitedNations), exists to promote the rights and interests of environ-mental refugees.3
In the UK no single agency has the remit to promote environ-mental sustainability at the broad scale. One Department dealswith flooding, another with energy, waste and water supply. TheInstitution of Civil Engineers (ICE) called in 2003 for an IndependentChief Engineer (it could be a person in any profession with theright knowledge) ’to ensure that a co-ordinated, long term, sus-tainable approach is followed and that actions are not wholly drivenby political agendas’.5
What has not yet been ostensibly recognized by the British government, despite increasingly sophisticated scenario-based stud-ies of future impacts,11 is that the vulnerability of many people inthe UK to adverse impacts of the changing climate is increasing
214 Adapting Buildings and Cities for Climate Change
Roaf_Ch09.qxd 29/10/04 6:51 PM Page 214

more rapidly than anyone thought. What will happen to the ski resortcommunities of Scotland as the snow disappears? How will theagricultural and fishing industries be affected? Will enough water beavailable to the populations of the Southeast, at an affordable cost,as the summers get warmer and drier? Can the Thames Barrier holdback the tidal surges until the new barrier is built? Will the ThamesGateway development increase vulnerability to flooding of thecoastline communities of the whole of Southeast England? Willclimate refugees from the lower latitudes bring north with themsmouldering resentments, fuelled by hardship and global inequalityand will migrations carry with them the potential for spreading politicalconflict?
To quote from Mark Mawhinney, in the conclusions of his bookon sustainable development:12
the major issue remains the lack of clear evidence for decisions on devel-opment . . . and the risk that arises as a result of this. The lack of clearevidence often leaves humanity with a choice – act before the event usingpreventative principles or leave it until the evidence is available.
Migration is often seen as a safety net to be used to ease population pressures after a catastrophic event; in fact, it may alsobe one of the most powerful tools we have for the pre-emptiveplanning for the mitigation of climate change impacts.
NOTES AND REFERENCES
1 Guardian, 30 September 2003.
2 http://www.neweconomics.org/gen/uploads/nld2s2juqs2t34mdhr31235506122003192037.pdf, see also: http://www.wmo.ch/web/Press/Press.html.
3 Published on 24 July 2002: http://www.parliament.the-stationery-office.co.uk/pa/cm200102/cmselect/cmintdev/519/51902.htm.
4 The Ecologist, December 2003, p. 6.
5 ICE (2003) The state of the nation: an assessment of the stateof the UK’s infrastructure by the Institution of Civil Engineers.See text on: www.ice.org.uk.
6 Adger, W.N., Kelly, P.M. and Ninh, N.H. (eds) (2001) Livingwith Environmental Change: Social Resilience, Adaptation andVulnerability in Vietnam. London: Routledge, pp. 314.
7 IPCC (2001) Third Assessment Report: Impacts, Adaptationand Vulnerability.
8 A range of publications are available on planning for disastermitigation and response. See Freeman, P.K., Martin, L.A.,Mechler, R., Warner, K. and Hausman, P. (2001) Catastrophes
Vulnerability, exposure and migration 215
Roaf_Ch09.qxd 29/10/04 6:51 PM Page 215

and Development: Integrating Natural Catastrophes intoDevelopment Planning. Washington: World Bank. See alsowww.worldbank.org/dmf/files/catastrophes_complete.pdf, andthe International Federation of Red Cross and Red CrescentSocieties (2002) World Disasters Report: Focus on reducingrisk (www.ifrc.org/publicat/wdr2002/chapter8.asp).
9 Markham, S.F. (1944) Climate and the Energy of Nations. Oxford:Oxford University Press.
10 Report of IPCC Working Group II: Summary for Policy Makers,2001 (available from www.ipcc.ch/pub/spm22-01.pdf).
11 A number of different agencies are undertaking excellent stud-ies and scenarios of a range of impacts in a more or less coor-dinated fashion, but how the results of this work is fed to thegeneral public or feeds into the political decision-making processis less clear. See for instance http://www.foresight.gov.uk/;http://www.ukcip.org.uk/publications/pub.html; http://www.rcep.org.uk/energy.html.
12 Mawhinney, M. (2002) Sustainable Development: Understandingthe Green Debates. Oxford: Blackwell Science, p. 171.
216 Adapting Buildings and Cities for Climate Change
Roaf_Ch09.qxd 29/10/04 6:51 PM Page 216

But surely, before we start moving people around, the solution tokeeping comfortable in a hotter future already exists – air condi-tioning! S.F. Markham in 1939 realized the power of air condition-ing, as he pointed out, to a world unfamiliar with it, the miracleof this new technology.1 And it was a miracle, because it enabledpeople, adapted to the colder climates of Europe, to colonize theworld. Indigenous people had always populated most parts of theglobe, as we saw in Chapter 2, from the Arctic to the Equator,from the high valleys of the Himalayas to the great below sea levelbasins of the Dead Sea and the Turfan Oasis in China. IntrepidEuropean entrepreneurs and imperial armies had penetrated mostof the far-flung corners of the globe by the end of the 19th cen-tury, but Markham saw that if Westerners could actually live allyear in cool buildings, regardless of the climate outside, they couldtruly export their ‘civilization’, and their god, on a massive scaleto ‘heathen’ lands, exploit economically untapped regions andcapitalize on the wealth of even the most uncomfortable nationson the planet. And this is exactly what has happened, for betteror worse.
And if air conditioning could be used to enable people to becomfortable in hotter regions than they are adapted to, surely itcan be used to keep people comfortable in a hotter future?
AIR CONDITIONING HAS BEEN WITH US FOROVER 150 YEARS
Air conditioning was first used on a large scale at the turn of the20th century to cool food but as early as 1748 William Cullen atGlasgow University experimented with evaporating ether under a
10 AIR CONDITIONING – THE ULTIMATESOLUTION?
Roaf_Ch10.qxd 29/10/04 6:53 PM Page 217

10.1.The evolution of buildingschanged dramatically with theadvent of air conditioning, whichsignificantly increased theelectricity demands of buildings.(Source: Sue Roaf, digitallyproduced by Claire Palmer)
partial vacuum. It was not until 1805 that Oliver Evans, an American,caused water to freeze using a similar process, and the possibilityof cheap coolth appeared. At that time many were also experi-menting with freezing mixtures and the great natural ice trade wasat its peak. In 1834 a closed cycle system was patented by JacobPerkins and in the mid-1840s the use of room coolers was pio-neered independently by physician John Gorrie, who used ice tocool air in hospital wards in Florida and Charles Piazzi Smyth, a Scot.Gorrie was not able to capitalize on his idea, being thought a crankby many, and he died a pauper, never dreaming that his inventionwould one day dictate the forms of buildings around the world.2
218 Adapting Buildings and Cities for Climate Change
Roaf_Ch10.qxd 29/10/04 6:53 PM Page 218

In 1862, at an International Exhibition in London, crowds wereamazed to see hot-looking steam apparatus churning out miniatureicebergs and one of these machines, made by Seibe (FerdinandCarre produced the other) was bought by the Indian governmentand sent to relieve the suffering of the troops in India. In the 1870sa few ice production factories were set up in cities and provincialtowns but they were expensive and took time to become estab-lished. In 1877 a breakthrough was made when meat from Englandwas first exported to America in refrigerated ships, and in the1960s many cities around the world still got their main ice supplyfrom cold storage plants from which one bought blocks of ice.Fridges were not routinely designed into UK council houses untilas late as the 1960s.
Early examples of air-conditioned office buildings were being exper-imented with in the UK and the United States in the 1890s and bythe 1930s large buildings in the States were being more routinelyair-conditioned. Hotels had their main public rooms air-conditionedby the early 1930s and by the 1940s every room in the best hotelshad ‘conditioned air’.3 What air conditioning did was to liberatearchitects and engineers to create ‘modern buildings’ in which theinternal climate is completely disconnected from that outside. Inthem, people are isolated in increasingly thin-skinned, fixed enve-lope buildings that can only be occupied if the air conditioning systemis operating, and are un-occupiable if the machines stop!
‘MODERN’ BUILDINGS
The growth of the ‘modern building’ paradigm was made possibleonly because of the advent of air conditioning, fuelled by cheapfossil fuel energy, and based, until perhaps now, on the belief inthe availability of limitless energy to power the machines that pro-vided buildings, wherever in the world, with, to use Corbusier’swords, ‘une respiration exacte’, that is to say a controlled indoorclimate – air conditioning with precise controls.
Corbusier, arguably the greatest of the Modern Movement archi-tects, published his influential book Vers une architecture in 1928.4
In this he expounds his theories of a new sprit, for ‘architecture,stifled by custom’. In his writings in search of ‘l’esthétique de lavie moderne’ he developed, already by 1926, his ideas based onwhat would become known as ‘The Five Points Towards a NewArchitecture’:
1 The pilotty is elevating the mass off the ground.2 The free plan, achieved through the separation of the load-
bearing columns from the walls subdividing the space.
Air conditioning – the ultimate solution? 219
Roaf_Ch10.qxd 29/10/04 6:53 PM Page 219

3 The free facade, the corollary of the free plan in the verticalplane.
4 The long horizontal sliding window.5 The roof garden, restoring the area of ground covered by the
house.
Of those five points only the roof garden can improve the thermalperformance of a building in many climates. To raise a building offthe ground is to decouple it from the stable temperatures of theground and expose the sixth face to the unstable climate of theair. The deep plan building makes mechanical air conditioning anecessity as only relatively shallow plan buildings can be naturallyventilated. The free facade has turned traditionally robust wallswith sensibly sized windows into sheets of glass that increase thevulnerability of the building occupants to any external climate byan order of magnitude, and impose huge energy penalties ontobuilding owners to try to stabilize internal climates into a controlled‘comfort’ zone. The long horizontal sliding window, as we saw inVilla Mala Parte, almost eliminates any easily usable connectionbetween the inside and outside climates and has led to the vir-tual elimination of usable windows from modern buildings, be ithouses or offices. The green roof is the only feature that providesa modicum of thermal protection for a building as it is now beingdeveloped to provide good thermal resistance and rain water run-off control in roofs. These tenets by Corbusier continue to inspiregenerations of young architects who appear never to have ques-tioned their applicability to the very different societal or environ-mental conditions of the late 20th, let alone the 21st, century.
In Vers une architecture, Le Corbusier wanted to make it clearwhy
‘the engineer’s aesthetic’ is far more successful than architecture.Engineering takes advantage of the latest and most innovative buildingtypes, technologies and construction systems, based on mass-production,standardization and industrialization.
Architecture, if it wanted to embrace the ‘new spirit’, needed toembrace these modern methods of technology and progress awayfrom the static ‘safe’ traditional architecture. Le Corbusier encour-aged economy and mechanical precision in architecture, as thiswas the driving force in engineering’s success.5
Here Corbusier acknowledges the increased ‘risk’ of modernbuildings, referring to traditional buildings as ‘safer’. The extent towhich he recognized that they increased the vulnerability of occu-pants to the external climate is not clear, however he did not usehis European design models when he built in Chandigar in India.
220 Adapting Buildings and Cities for Climate Change
Roaf_Ch10.qxd 29/10/04 6:53 PM Page 220

His famous statement that ‘a house is a machine for living in’ hejustifies by stating that a house requires efficiency, economy, simplicity, elegance, and most of all, a form that is clear with regardto the function. He does not mention the need for comfort in allseasons, a sense of safety, quietness, low energy and mainte-nance bills. If his idea of economy and simplicity related to hisdemonstrated search for a ‘minimalistic appearance’ inside and out,rather than to efficient heating and cooling systems and structures,why were his buildings riddled with cold bridges and over-glazedfacades? If his grasp on the physics of building had been greaterthen perhaps 20th century architecture would have been different,but he was an upper middle class professional for whom eleganceheld a high priority, and infinite energy was apparently assured.
The Second World War was followed by a rebuilding programme,the scale of which exceeded anything built before, as whole citieswere ‘re-planned’. Increasing numbers of buildings were built inthe ‘modern’ style using modern construction methods, which wereinnovative, untried and apparently unquestioned. Because modernconstruction methods enable very rapid and large-scale projects,the impact on our cities was immediate and often devastating asthe old hearts of cities were torn out and replaced by concreteand steel and prefabricated structures as never before.
It was a changed Britain to which I returned: in just four years manytowns and cities had been transformed [wrote Rod Hackney of his home-coming to Manchester in 1968]. The guts had been torn out of them, andnew buildings had been carried out at an alarming rate ... Whole areaswere unrecognisable – acres of terraces had been razed and replaced by
10.2.Flats in Singapore on a newresidential estate without airconditioning in 1963. Todayalmost every dwelling on theisland is air-conditioned. (Source:Sue Roaf)
Air conditioning – the ultimate solution? 221
Roaf_Ch10.qxd 29/10/04 6:53 PM Page 221
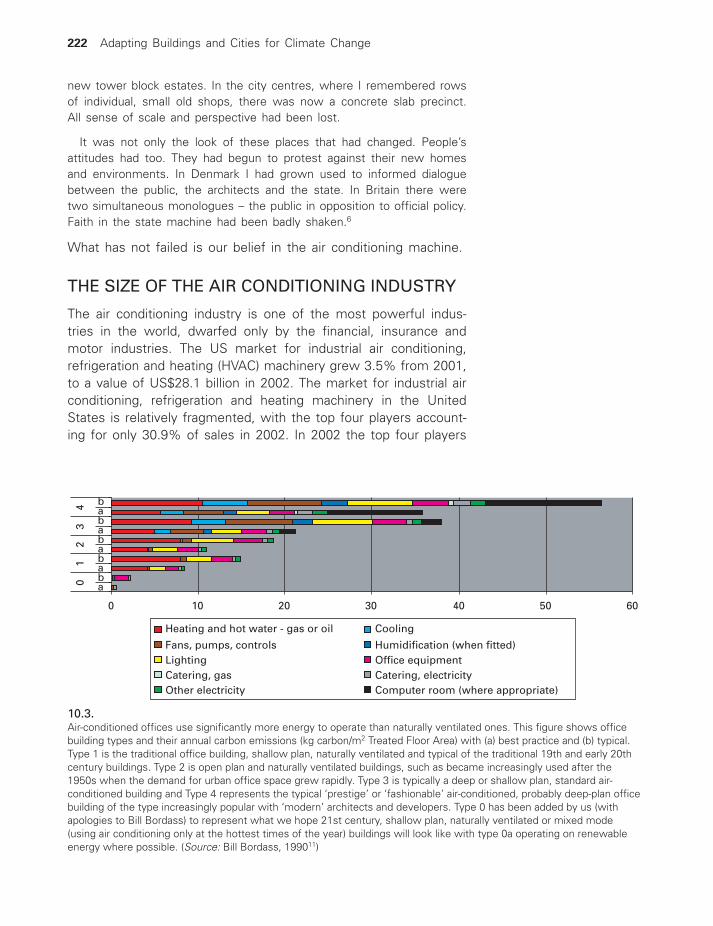
new tower block estates. In the city centres, where I remembered rowsof individual, small old shops, there was now a concrete slab precinct. All sense of scale and perspective had been lost.
It was not only the look of these places that had changed. People’sattitudes had too. They had begun to protest against their new homesand environments. In Denmark I had grown used to informed dialoguebetween the public, the architects and the state. In Britain there weretwo simultaneous monologues – the public in opposition to official policy.Faith in the state machine had been badly shaken.6
What has not failed is our belief in the air conditioning machine.
THE SIZE OF THE AIR CONDITIONING INDUSTRY
The air conditioning industry is one of the most powerful indus-tries in the world, dwarfed only by the financial, insurance andmotor industries. The US market for industrial air conditioning,refrigeration and heating (HVAC) machinery grew 3.5% from 2001,to a value of US$28.1 billion in 2002. The market for industrial airconditioning, refrigeration and heating machinery in the UnitedStates is relatively fragmented, with the top four players account-ing for only 30.9% of sales in 2002. In 2002 the top four players
10.3.Air-conditioned offices use significantly more energy to operate than naturally ventilated ones. This figure shows officebuilding types and their annual carbon emissions (kg carbon/m2 Treated Floor Area) with (a) best practice and (b) typical.Type 1 is the traditional office building, shallow plan, naturally ventilated and typical of the traditional 19th and early 20thcentury buildings. Type 2 is open plan and naturally ventilated buildings, such as became increasingly used after the1950s when the demand for urban office space grew rapidly. Type 3 is typically a deep or shallow plan, standard air-conditioned building and Type 4 represents the typical ‘prestige’ or ‘fashionable’ air-conditioned, probably deep-plan officebuilding of the type increasingly popular with ‘modern’ architects and developers. Type 0 has been added by us (withapologies to Bill Bordass) to represent what we hope 21st century, shallow plan, naturally ventilated or mixed mode(using air conditioning only at the hottest times of the year) buildings will look like with type 0a operating on renewableenergy where possible. (Source: Bill Bordass, 199011)
222 Adapting Buildings and Cities for Climate Change
ababababab
Heating and hot water - gas or oil Cooling
Fans, pumps, controls Humidification (when fitted)Lighting Office equipmentCatering, gas Catering, electricityOther electricity Computer room (where appropriate)
01
23
4
0 10 20 30 40 50 60
Roaf_Ch10.qxd 29/10/04 6:53 PM Page 222

in the market spent nearly US$1.5 billion on research and devel-opment. As the US market grows increasingly competitive and alack of pricing power limits overall market value growth, many man-ufacturers have focused on overseas expansion to drive futuresales, no doubt many looking to Iraq as a potentially fertile mar-ket for expansion for instance. The US market is expected to growby just over 26% during the 2003 to 2007 forecast period, reach-ing a value of US$37 billion by 2007.7
The UK is not yet so addicted to air conditioning that it playssuch a central part in the economy, but things are changing fast.Today around one-third of all UK office blocks have air condition-ing of one form or another, despite the fact that we know thatair-conditioned prestige offices consume four times the energyof traditional shallow plan naturally ventilated buildings, as wereubiquitous in the UK before the 1970s, and despite the fact thatwe do not actually need to cool well-designed buildings in theseislands.8
The problem is that air conditioning is a fundamental cause ofclimate change, the symptoms of which it was design to address,creating a ‘vicious circle’ that we have to break if we are to sur-vive. Buildings consume over 50% of all energy generated around
10.4.The mean maximum temperatures for July in Europe recorded for (a) 1960–90 and (b) predicted for 2050. This figureshows that Britain is predicted to remain with fairly moderate maximum temperatures well into this century andtemperatures that mean, in a well-designed passive building, air conditioning will not be needed for the foreseeablefuture. (Source: Climate models by G. Kenny8)
Air conditioning – the ultimate solution? 223
(a) (b)
Roaf_Ch10.qxd 29/10/04 6:53 PM Page 223

the world and produce over half of all climate change emissionsglobally. In the United States alone air conditioning uses around30–40% of all building-related energy, so say a fifth, or 20%, ofall energy in the United States is used for air conditioning. TheUnited States uses around 25% of all the world energy: that meansthat potentially around 5% of all the greenhouse gases in the worldcome from US air conditioning systems alone.
In the past two decades there has been an exponential growthin European sales of air conditioning that has been in the double-digit percentage growth during most of this period. The market forpackaged air conditioning in Europe grew by 20% in 1998 and11% in 1999. The most rapidly growing EU markets are in Greece,Spain and Italy.9
Two significant trends in the sale and design of air conditioningmarkets are:
● It is common for engineers to oversize air conditioning plant30–50% to future-proof buildings against climate change.10
● Building usage patterns are changing in ever-shorter cycles, forexample from office to apartment, shop to restaurant and powerstation to museum, requiring the market to develop more flexi-ble, adaptable, systems with shorter payback periods to reflectshorter life cycles.11
● This trend for smaller systems, more often changed, also has asignificant impact on the embodied energy of the systems, typicallymade with high embodied energy materials such as aluminium,tin and steel.
What is hard to understand is why modern buildings have evolvedin a form that requires expensive and unnecessary energy wastagein air conditioning when we knew as early as the 1950s that the‘modern building’ had serious design problems, including creatinguncomfortable indoor conditions that would require air condition-ing to alleviate, and as early (and later studies) have shown people often do not actually like working in air-conditioned offices.
LIGHTWEIGHT, OVER-GLAZED AND VULNERABLE BUILDINGS
It is important to deal with one of the key climatic design prob-lems of ‘modern’ buildings, and that is the excessive use of glassin their external envelopes. We have for nearly fifty years knownthat there is a problem with over-glazed facades, and these prob-lems will be significantly increased in a changing climate.
Early uses of ‘Building Performance Appraisal’12 techniques inoffices in the UK were originally developed as diagnostic tools
224 Adapting Buildings and Cities for Climate Change
Roaf_Ch10.qxd 29/10/04 6:53 PM Page 224

to understand the emerging problems of buildings that werechanging from the traditional ‘British’ building to the larger, morecomplex ‘modern’ building type in the ‘international style’ thatbegan to dominate the urban environment from the 1950s onwards.
In 1966, few air-conditioned buildings existed in London, and FloraBlack and Elizabeth Milroy, working at the Building Research Stationin Garston, completed a review and survey of the ‘experience ofair-conditioned buildings’ in London.13 Air conditioning was not thenconsidered climatically necessary in the UK, and remains so in somebuildings. Recent studies have shown that traditional passive build-ings may be robust enough to provide comfort conditions for sev-eral decades to come, even with the changing climate, withoutyear-round air conditioning.8
Black and Milroy’s study was designed to use feedback fromoffice workers to optimize working conditions in future offices byunderstanding emerging performance problems as the paradigmchanged. The results echo many, not dissimilar, studies donemore recently,14 namely that air-conditioned offices are perceivedto be cleaner and quieter (the buildings studied were new withfixed windows), and in very hot weather were preferred to naturallyventilated buildings, but in ‘less extreme weather, the thermalenvironment in the A/C buildings was in many ways less favouredthan that in offices with opening windows’.
One reason suggested for this was the type of building, ‘theheavier more conventional construction being more comfortablethan the lightweight building with large areas of glazing’. This studywas done to gauge the human impacts, and in turn the designimperatives, of the changing market in ‘building types’ with a viewto informing regulations on the issue. Such early studies were, ineffect, a ‘kind of quality control writ large’.15
A second study published two years later indicates how rapidlythe office market was developing16 in the UK in the 1960s. Thepaper by A.G. Loudon at the BRE resulted from the increasing prob-lem of overheating in buildings due to excessive glazing. In the1960s the style of building was changing rapidly as more glass andlighter-weight buildings replaced the traditional heavier type, and asurvey by Gray and Corlett17 showed that in pre-war offices thewindow areas averaged around 20% of the floor area and 85% ofoccupants wanted more sunshine in their offices, while only 9%were concerned that it should not be too hot. By 1961 a surveyby Loudon and Keighley18 in post-war offices showed that as manyas 40% of the occupants were sometimes too hot in summer andwas widely published in professional as well as research circles.19
The probable reasons for this increase were given as greateruse of glass, with windows over 50% larger in the 1961 survey
Air conditioning – the ultimate solution? 225
Roaf_Ch10.qxd 29/10/04 6:53 PM Page 225

than in the 1948 survey. Moreover, 80% of the internal partitionson post-war buildings were lightweight, warming up quickly, andin the pre-war buildings they were heavy. The fact that there wasmore traffic noise in the later survey, making people keep theirwindows shut, was also thought significant, and more complaintsabout over-heating were recorded near busy traffic routes.
This study concluded that buildings of heavy construction couldhave up to 50% of the external wall glazed, but that unless suncontrols were provided, glass areas in buildings with lightweightinternal walls and ceiling should be restricted to 20% of the wallarea, if they face south and are not shaded. If temperatures of27 �C were considered acceptable then this area could be extendedto 30% of the wall area in noisy areas and 50% in quiet ones forlightweight buildings. If more glass was required for reasons ofintroducing sunlight or the view then excess heat could be removedby air conditioning, however this was expensive and should beconsidered as a last choice after proper building design and the
226 Adapting Buildings and Cities for Climate Change
(a) (b)
10.5.(a) There are still cities in the hottest parts of the world where few buildings are air conditioned. View over down townYangon, in Myanmar. (Source: Sue Roaf) (b) Man leans over a balcony in Yangon: windows are an important link betweenlife inside buildings and that in the community outside. To close the window is to cut that link. (Source: Sue Roaf)
Roaf_Ch10.qxd 29/10/04 6:53 PM Page 226

use of external shading. This study was one of the building blocksfrom which the ‘admittance method’ was developed.20
The performance of passive and low energy cooling systems is,by their very nature, much more sensitive to climate than is theperformance of refrigeration-based systems and the low energycooling systems require higher levels of internal thermal mass inbuildings and will never be successfully applied in lightweight, over-glazed buildings that get too hot to handle without throwing vastamounts of energy at them to cool them on hot days.8 What theadmittance method shows is that mass is essential to sensible,passive building design.
A clear symptom of over-glazing in modern office buildings is thatthe blinds are so often closed, resulting in higher lighting energyuse and not reducing the over-heating problem. Once solar radia-tion has passed through glass, it is absorbed and re-emitted at adifferent wavelength at which it can no longer travel back out throughthe glass. This phenomenon is the basis for the greenhouse effect,and means that even with the blinds down, the building overheats.
That glass buildings with little or no shading cause severe over-heating is an international problem. From the Gulf, where the insidetemperatures recorded on glass walls often reach over 60–80 �C,to many fashionable modern buildings where internal temperaturessoar on hot days, even with the air conditioning on. It appears asif, for some architects, the penny has not dropped that it is extremelydifficult to live comfortably in a ‘greenhouse’. That is without theadded problems of the hotter climate and the rising energy costsof trying to keep such buildings cool.
Air conditioning – the ultimate solution? 227
10.6.Downtown Buenos Aires,Argentina: like many cities in theworld, the evolution of the lowenergy buildings of the early 19thcentury, with their sensibly sizedwindows, shade, blinds andshutters and awnings, gave wayover the decades to the thin,tight-skinned, highly glazedbuildings most commonly builttoday. There is little densitychange in the number of peopleoccupying adjacent buildings butthe modern buildings may welluse four or five times moreenergy to keep occupants nomore comfortable for manymonths of the year. (Source: SueRoaf)
Roaf_Ch10.qxd 29/10/04 6:53 PM Page 227

228 Adapting Buildings and Cities for Climate Change
Many attempts have been made to reduce internal temperatureswith ingenuity, famously in the National Library in Paris, designedin the late 1980s by architect Dominique Perrault. This grand mon-ument eventually cost the French people US$1.3 billion, and anundue amount of trouble. The towers contain more than one designflaw. For example, it was realized too late that a library built fromtransparent glass would provide little protection for the books fromsunlight; and that in fact, excessive sunlight would actually over-heat the towers (and pose a risk of turning them into blazing infer-nos!). To remedy this the architect specified timber shutters to linethe whole of the four towers to be made from top grade mahoganyfrom the Brazilian rainforests. In addition, the glass design failedto account for condensation, another threat to delicate books. Theseissues were remedied by the architect only after the constructionhad been started, and at considerable additional expense to theFrench public.21 It is difficult to think of a modern ‘monument’ thatdoes not suffer from similar problems, although the British Library,fortunately, was designed sensibly to avoid such a foolish mistake.
But there are a range of other well-known problems with ‘shiny’and over-glazed buildings, and some of these are illustrated inBoxes 10.1 and 10.2. A number of the examples have been con-tributed by, amongst others, members of the American Society ofBuilding Science Educators (SBSE), teachers of environmental sci-ence in US Schools of Architecture.22 Collectively that show thattight, thin, lightweight and over-glazed buildings are a chronic prob-lem today – and air conditioning can never be a solution to all theirproblems.
INDOOR AIR QUALITY
Buildings are becoming increasingly ‘sick’. In the United States theoffice worker on average takes a day a month off work sufferingfrom ‘Sick Building Syndrome’, a figure unimaginable in Europewhere we are less dependent on air conditioning.
Indoor air quality can be worse in an air-conditioned building thanin a comparable naturally ventilated one. Worryingly, researchers arefinding that the filters, ducts and plant of air conditioning systemsare often filthy, introducing air that is dirtier than if one simply openedthe window, even in the city.23 Ducts can harbour potentially killerchemicals and bugs, such as Legionella, moulds and particulatesthat are released back into the ducts from the filter. This happensparticularly when the weather changes, for instance, on gettingwarmer and wetter in a warm front.24 Such changes happen everytime a warm front moves across a region, only not in such a markedfashion.
Roaf_Ch10.qxd 29/10/04 6:53 PM Page 228

Air conditioning – the ultimate solution? 229
Many internal ducts are not only seldom cleaned but also impos-sible to get at to clean, and to make matters worse actually giveout toxic fumes from the plant, seals and duct work itself. Oftenuncleaned filters and long dirty duct runs collect passing toxinsand store them until ambient conditions become warmer and/ormore humid. In addition, already dirty duct air is then mixed withthe cocktail of volatile organic compounds, formaldehydes, moulds,fungi, dust mites and potentially toxic cleaning materials alreadyinside rooms. This may be one good reason why in air-conditionedbuildings many more people succumb to sick building syndrome.25
Furnishings and finishes that are made of natural materials reducethe problem of excessive toxin levels in the room air.
Air conditioning units also cannot filter out some of the mostharmful of pollutants in the air, such as diesel and other particu-lates, PCBs and any substances below approximately 9 ångströmin diameter. The poor location of air inlets often means that, ininner city locations in particular, the air circulated in air-conditionedbuildings is of a lower air quality than if the occupants had sim-ply opened a better-placed window. The claim is often made thatparticular buildings such as laboratories, museums and hospitalsshould have air conditioning as a matter of course, but on the con-trary, while there is a need for particular very clean spaces in suchbuildings studies have shown that office workers, artefacts andpatients are happier, last longer and get better sooner in naturallyventilated spaces.
WILL SYSTEM EFFICIENCY HELP?
There are a number of ways to ameliorate the negative impactsof air conditioning, including:
● Don’t use it.● Use it only at the hottest times of year.● Make the hardware more efficient.● Make it run on renewable clean energies that do not lead to
global warming.● Design better buildings that keep solar gain out, generate
minimal heat and are slow to heat.● Make the controls more intelligent, so they are not just set on
one indoor temperature for the whole year (as happens in manysystems) but can track outdoor temperatures, so saving up to50% of their running costs.
The importance of moving away from a dependence on fully, inef-ficiently, poorly controlled, air-conditioned buildings has been widely
Roaf_Ch10.qxd 29/10/04 6:53 PM Page 229

230 Adapting Buildings and Cities for Climate Change
recognized. There have been experiments in different countrieswith methods of changing the traditional approach to air condi-tioning a building – with varying success:
● Market forces. The theory that environmentally friendly tech-nologies will be increasingly used over more damaging onesdoes not seem to apply with air conditioning. Here, marketforces appear to work in favour of ‘prestige solutions’.26
● Guidance. Guidance measures, however strong, appear to beuseless. For example, in the UK for the engineering and archi-tectural professions strong guidance not to use air conditioningsystems has had minimal effect on the standards of environ-mental design of typical office buildings or their energy con-sumption. British Standard BS 8207:1985 the British StandardCode of Practice for Energy Efficiency in Buildings, Appendix B,has in Table 2 on the check-list for Design Teams Point 7: ‘Onlyspecify air conditioning where it is essential to do so.’ The RIBAin 1989 in its policy Guidelines advised its members against theunnecessary use of air conditioning and the Chartered Instituteof Building Service Engineers has as Item 1 on it Code ofProfessional Conduct devised to promote ethical practice: ‘Avoidthe use of refrigeration where natural and mechanical ventila-tion is a feasible alternative.’ Negligible attention has been paidto such guidance in the UK.
● Legislation. This works well. In the Canton of Zurich,Switzerland, a law was introduced practically overnight in thelate 1980s, banning the use of air conditioning in buildings unlessit could be proven to be absolutely necessary. Surprisingly, build-ing designers adapted to the new challenge very rapidly.27 Thedrawback has been that the building industry has learnt sincethen how to argue credibly that air conditioning is essential innew buildings. The real problem here is that it is very easy todesign an air-conditioned building that more or less works, butit takes great skill and expertise to design a good passive build-ing, skill that, frankly, many modern architects simply do nothave. The experience of Zurich has proved that they can learnfast, although even there architects and engineers are now find-ing ways around the pioneering regulations, showing thatenforcement is as important as the legislation itself.
● Political management of the problem. A major drawback isthat in most countries there is no single authority with jurisdic-tion over the control of energy use in, or CO2 emissions from,buildings – neither the planning nor the building regulationsdepartments – and hence there is no related authority to
Roaf_Ch10.qxd 29/10/04 6:53 PM Page 230

Air conditioning – the ultimate solution? 231
control the use and performance of air conditioning systems.With the increase in significance of CO2 emissions from build-ings, and their commoditization as an internationally tradable unitand legally controllable substance under international law, legis-lation for the control of energy use in buildings, and by coun-tries, will inevitably be considered and eventually implementedin most countries.
AIR CONDITIONING IS HERE TO STAY
We live in the air conditioning age and a number of books havebeen written about the importance of air conditioning to the Americanway of life and economy in particular. Gail Cooper points out:28
[the three different kinds of air conditioning in America] – the customdesigned systems, the plug in-appliance, and the standardized installationfor the tract home – illustrate the difficulties involved in integrating technicalexpertise into commercial products.
None of these systems fit [sic] perfectly the interests of the engineer,the company, and the aggregated groups known as the consumer ... Thecustomer-designed system produced the most technically rational designbut surprisingly afforded the user little flexibility. The plug-in appliance privileged the consumer, but its complete divorce from the building com-promised its performance. The standardized installation of the tract devel-opment provided affordability and performance, but in a buildings that wasdependent upon its mechanical services and alarmingly inefficient in energyconsumption.
10.7.The non-air-conditioned buildingsaround the ‘Padang’ in centralKuala Lumpur light up for‘Merdeka’, the independence daycelebrations in 1958. (Source:Sue Roaf)
Roaf_Ch10.qxd 29/10/04 6:54 PM Page 231

The extent of the dependence of building users on inefficient airconditioning systems in poor buildings in American was also a conclusion drawn in another classic work on air conditioningAmerica, by Marsha Ackermann, who concludes by mentioningthat Lewis Mumford, at the age of 75, wrote that air conditioningwas deeply complicit in our society’s authoritarian tendenciestowards control. Ackermann adds:29
The counterpart of technologically enabled control is dependency, and thehistory of air conditioning provides it in full measure. Air conditioning hasmade it possible to erect structures that must be evacuated when thepower fails, to make buildings in which people get sick. It gulps electric-ity; roars, wheezes, and whines; makes urban heat islands even hotterwith the exhaust of a million air-conditioned cars and thousands of sealedbuildings.
It has led to a human society that is increasingly unable to adaptto change, because of this dependency, but she adds:
For better and for worse, our world tomorrow will be air conditioned.
In Chapter 12 we look at the growing problems of oil and gas deple-tion that may, in the not so distant future, challenge this premise.Inevitably, we will all, sooner rather than later, have to ‘re-structureour expectations and our habits’ to refocus our efforts and invest-ments on the provision of our basic needs: shelter, health, realcomfort, security and survival. We need to extricate ourselves fromthe market place that sells comfort and air quality as a productrather than an ‘attribute’ or property of the building itself.Comfortable and healthy indoor conditions are created by goodbuilding design, and by truly good architects and engineers. Ratherthan wasting time discussing and rewarding small incremental
232 Adapting Buildings and Cities for Climate Change
10.8.The Mataro Library, powered by Desiccant Solar Air Conditioning designed by ICAEN, the Catalonian Energy Institute.(Source: Rodrigo Leal, ICAEN, Barcelona)
(b)
Roaf_Ch10.qxd 29/10/04 6:54 PM Page 232

improvements in the efficiency of a dated and profligate technol-ogy we urgently need to reorganize the ‘normality’ of what con-stitutes a good building, if we are to survive.
Air conditioning may be with us for quite a while longer butchanges in the industry will have to be as radical as those in themotor industry 15 years ago to meet the rapidly improving per-formance targets we need to achieve if we are to stabilize climatechange. The US air conditioning industry, in particular, is monolithic,outdated and already losing out, as it has in the car markets, toforeign manufacturers who realized a decade ago that deep effi-ciency and quality of product would be what mattered in the 21stcentury, and they were right. Developing countries will have to bevery wary in the future of having outmoded technologies dumpedon them as the First World decides it can no longer use such waste-ful products at home.
Rather than tinkering with small incremental improvements inthe efficiency of air conditioning systems, we need a step changeto new paradigms for cooling buildings. Just as with the cars, weneed super-low-consumption, dual fuel, eco-buildings that are nat-urally ventilated in spring, winter and autumn, and in summer arerun on solar air conditioning when the sun is out topped up bysmall amounts of grid electricity when it is not. This is the wayforward.
We have to move away from the chronically inefficient ‘mod-ern’, thin, tight-skinned, over-glazed and over-serviced buildings torobust, heavier, shallow plan buildings with opening windows. Todo this we need to wean ourselves from the ‘path-dependency’we have for the provision of inadequate products in the place ofwhat we really need – the genuine attributes of ‘comfort’ and a‘healthy working environment’.30 Perhaps the age of the HVACengineer and the ‘modern’ architect is over if we want such newbuilding paradigms, just as people will very soon require estateagents who actually know what the annual energy running costs,comfort levels and sick building syndrome history of a buildingsis. Such knowledge will contribute to identifying the high-impactand high-risk buildings, amongst which will be many of the worst environmental offenders, such as those dinosaurs of theModern Movement, tall buildings, which form the subject of the next chapter.
Air conditioning – the ultimate solution? 233
Roaf_Ch10.qxd 29/10/04 6:54 PM Page 233

234 Adapting Buildings and Cities for Climate Change
Box 10.1 People who live in glass houses . . .
Despite the known problems with over-glazed buildings, glasscontinues to be used more and more widely today. Apart from theissues of thermal comfort which are the main concern of Chapter 5,other problems with over-glazed buildings include:
● Loss of privacy: fellow workers can see untidiness, wall charts or flipboards that are being discussed, heated meetings!
● Difficulty of arranging furniture against glazed walls – forinstance, desks placed against glass are impossible to use bywomen who wear skirts. This caused a famous engineering firmto replace the lower half of the glass windows on their new HQbuilding with frosted glass – no one had thought about this at thedesign stage!
● The excessive daylight and glare make it difficult to read computermonitors. Engineers cite the fact that some monitors are now sobright they can be seen in full daylight, but at what cost in energyand eye strain? Glare is also the reason why so many highly glazedbuildings have their blinds full down and all the lights on, makingthe indoor conditions poor and energy use in them expensive.
These types of ostensibly trivial gripes are the sorts of factors that canmake the difference between being ‘happy’ at work or not.
Box 10.2 Reflectance, glare and ‘singing buildings’
Reflectance of light and heat from metal and glass finished buildingscan often cause chronic problems, to motorists, pedestrians and toadjacent buildings. The Hooker Building, built by OccidentalChemicals in 1980 in Niagara Falls, NY, was one of the first double-skin buildings in North America. It was designed with highlyreflecting airfoil type movable shading devices on all sides that weresupposed to reflect sunlight/daylight deeply into the interior. Thereflection of the sun off these foils was so bright as to blind themotorists crossing the Rainbow Bridge from Canada to the US.Within 4 months of the building being occupied they were refinishedwhite to eliminate this problem.
The Ontario Hydro building in Toronto, on the corner of College andUniversity Avenue, actually focuses the sun’s rays onto the sidewalkin front. It has a concave curved front with reflective glass. Thefocusing effect of the sun at a particular time of year not only causesglare problems but intense solar heating. Luckily the front facesnortheast so this occurs only for a short period during the summer inearly morning, but it is obviously a generic problem that should beavoided. Curved buildings also have acoustic issues, as they canmagnify sound as they reflect the sound waves within the curve.
Roaf_Ch10.qxd 29/10/04 6:54 PM Page 234

Air conditioning – the ultimate solution? 235
This raises the issue also of ‘singing buildings’. The glass and steelTD Bank tower designed by Mies Van der Rohe, with a blackenvelope, like the Seagram tower in New York, was 55 storeys highand the first true skyscraper in Toronto. It was designed for thermalexpansion on the south, east and west sides of the building to makeallowance for the effects of the sun on those facades, particularly asblack metal is highly affected by heat. When a new glass tower wasbuilt immediately to the north of the building it reflected so muchheat back at the TD Bank tower that its occupants were greatlyalarmed by the loud creaking and groaning that the building started toexhibit due to the unexpected solar thermal expansion on itsnorthern facade. Steps were taken to control this unexpectedmovement in the building and the groans stopped, but at anenormous cost to the Bank.
The Hancock Tower in Boston was built in the early 1970s and wonthe ‘most beautiful piece of architecture in Boston’ award. It is also atextbook example of problems with glass in buildings. The 60-storeybuilding framed in steel was totally clad, floor to ceiling, in two layersof reflective glass separated by a lead spacer soldered to the glasssheets. The inner surface of the outer glass light, or sheet, facing thecavity has a layer of silver reflective coating on it.i
Problems started from early on in the project and the first of fourdisasters struck. The foundations caused serious settlement ofbuildings in the surrounding streets. The second problem occurredwhen a windstorm hit Boston on 20 January 1973 and a number ofglass panels being erected in the tower blew out. The falling panelscaught in the air turbulence around the building hit and cracked anumber of other panels, which had to be replaced. Experts who werecalled in identified the fact that the tower itself was not safe inwindstorms and to remedy this the steel frame stiffness in the longdirection was reinforced with 1650 tonnes of extra diagonal steelbracing. The final problem in construction, that of a number of glasspanels cracking, was explained by the fact that the lead spacer haddeveloped fatigue because the bond obtained between the meltedlead spacer between the reflective coating and the outside light andthat between the reflective coating and the lead sealer did not yield,and thus transmitted the motions from thermal expansion to theouter light, cracking it first. The seal was too strong. All the 10 344identical panels of the Hancock Tower were replaced with single-thickness tempered glass. The cost of the building rose from US$75million to US$175 and its opening was delayed from 1971 to 1976.ii
But the Tower’s problems were not over. The building reflected somuch heat into the adjacent Copley Square Hotel that the hotel suedthe John Hancock building owners to pay for increased airconditioning equipment and operation costs. The owners of theTower ended up purchasing the Copley Square Hotel to settle theissue, which was sold on recently for a sum of over $900 000.
Roaf_Ch10.qxd 29/10/04 6:54 PM Page 235

236 Adapting Buildings and Cities for Climate Change
10.9.Gehry’s Walt Disney Concert Hallhas had to be covered up due tothe excessive levels of glareexperienced from its highlyreflective metal surface (Source:Bill Bordass)
External building elements can also cause temperature problems.The REJ building in Austin, Texas was designed with attractivecurvilinear, specular light shelves that would project light deep intothe interior of the building. Unfortunately, this meant projecting lightinto hallways that were then impossible to walk down when the sunwas shining just so. To fix this the building operator hung blindspermanently in front of the offending light shelves, making them intoexpensive plant shelves. Office furniture was also not installed asspecified by the architects, further blocking the light shelves.iii
Many leading architects have predicted the need for more carefuldesign of areas of glazing in buildings and the ‘BetterBricksDaylighting Lab’ in Washington has done a series of studies on the‘environmental’ impacts of the new OMA-Koolhaus Central SeattleLibrary glass reflections. An extensive series of model studies weredone on the nearly all-glass building. OMA spent a great deal of timeand money working with Schott Glass in Germany in developing amulti-layered glass system to reduce solar gain, glare and, hopefully,reflected sun problems while admitting as much light as possiblefrom the overcast sky. It will be for the building users and visitors todetermine if this has proved successful.iv
Another building to have major reflectance problems is the newWalt Disney Concert Hall, designed by Frank Gehry and owned bythe County of Los Angeles, which has had to call in experts in anattempt to reduce the glare and thermal issues surrounding (literally)the building. There are convex and concave stainless steel surfaces,in some cases brushed, and in some cases polished. In late June
Roaf_Ch10.qxd 29/10/04 6:54 PM Page 236

NOTES AND REFERENCES
1 Markham, S.F. (1944) Climate and the Energy of Nations.Oxford: Oxford University Press.
2 Beamon, S.F. and Roaf, S. (1989) The Ice-Houses of Britain.London: Routledge, pp. 138–49.
3 http://www.hevac-heritage.org/papers/papers.htm.
4 Le Corbusier (1986) Towards a New Architecture. London:Dover Publications (Mineola, New York). This is a translatedreprint of Corbusier’s original book Vers une architecture, firstpublished in 1928 in Paris.
5 http://www.geocities.com/rr17bb/LeCorbusier5.html.
6 Hackney, R. (1990) The Good, the Bad and the Ugly. London:Century Hutchinson, p. 37.
7 http://www.euromonitor.com/Industrial_air_conditioning_refrigeration_and_heating_machinery_in_USA_(mmp).
Air conditioning – the ultimate solution? 237
2003, when the builders peeled off the film used to cover the steelduring construction, the owners of condo apartments opposite beganto complain. In mid-afternoon the glare from the steel became sointense they had to leave their balconies, close the curtains and puton the air conditioning for three hours till the sun went off that faceof the building. The temperatures in their apartments went up by upto 15�C because of the added glare off the building. Gehry blamedthe builders. The county put a $6000 mesh over the steel as a stop-gap remedy, demonstrating a proactive approach to solving theproblems to neighbours of heat and light pollution caused by abuilding they commissioned. Modifications of the external reflectivesurfaces have been completed in order to change the reflectance ofsome of the surfaces and more work will have to be undertaken,although this not a building that can be easily or lightly modified.v
i Levy, M. and Salvadori, M. (1992) Why Buildings Fall Down. New York:W.W. Norton, pp. 197–205.
ii http://www.mit.edu/afs/athena/course/1/1.011/www/1.011-hancock-bostonglobe-290403A.pdf.
iii A report on this can be found in Song, S., Haberl, J. and Turner, D. (2002)Sustainability assessment of the Robert E. Johnson State Office Building,submitted to the Texas State Energy Conservation Office, Energy SystemsLaboratory Report No.ESL-TR-02/01-02, Texas A&M University, 139 pp (April).
iv The report on this project can be found on:http://www.lightingdesignlab.com/daylighting/daylighting_studio.htm
v sbse.org/newsletter/issues.sbsenewssp04linked.pdf.
Roaf_Ch10.qxd 29/10/04 6:54 PM Page 237

8 Haves, P., Roaf, S. and Orr, J. (1998) Climate change and pas-sive cooling in Europe. In Proceedings of PLEA Conference,Lisbon, James & James Science.
9 Roaf, S. (1992) Ozone loopholes – a case study of air condi-tioning in Britain. Proceedings WREC Conference. Reading:Pergamon Press, pp. 1870–6.
10 BSEE (2000) Technology and market demands drive boomingEuropean air conditioning market. Building Services &Environmental Engineer, vol. 10, December.
11 Bordass, B. (1990) Appropriate methods and technologies fornew build and refurbishment: offices. Global Responsibilitiesof Architects. London: RIBA Publications, pp. 15–17.
12 This term was coined in the early 1970s. Baird, G., Donnne, M.,Pool, F., Brander, W. and Aun, C. (1984) Energy Performanceof Buildings. Boca Raton, FL: CRC Press, p. 7.
13 Black, F. and Milroy, E (1966) Experience of air conditioningin offices. Journal of the Institute of Heating and VentilatingEngineers, September, pp. 188–96.
14 For a typical study of this type see a number referred to onthe following website that covers the methodology used forsuch studies: http://www.learn.londonmet.ac.uk/packages/mulcom/comfort/thermal/.
15 Leaman, A. (2004) Post-occupancy evaluation. In Roaf, S. withHorsley, A. and Gupta, R. Closing the Loop: Benchmarks forSustainable Buildings. London: RIBA Publications.
16 Loudon, A.G. (1968) Window design criteria to avoid over-heating by excessive solar gains. Building Research StationCurrent Paper 4/68, published by the BRS.
17 Gray, P.G. and Corlett, T. (1952) A survey of lighting in offices.Appendix 1 of Postwar Building Research No. 30. London: HMSO.
18 Loudon, F.J. and Keighley, E.C. (1964) User research in officedesign. Architect’s Journal, 139 (6), 333–9.
19 Loudon, F.J. and Danter, E. (1965) Investigations of summeroverheating. Building Science 1, 1, pp. 89–94.
20 The evolution of the admittance method is illustrated inDanter, E. ( 1965) Periodic heat flow characteristics of simplewalls and roofs. IHVE Journal, 28, pp. 136–46. And a workedexample is available on: http://www.esru.strath.ac.uk/Courseware/Class-16458/.
21 http://www.pps.org/gps/one?public_place_id�350.
22 www.sbse.org/newsletter/issues/newsw03weblinked.pdf.
238 Adapting Buildings and Cities for Climate Change
Roaf_Ch10.qxd 29/10/04 6:54 PM Page 238

23 Clausen, G., Olm, O. and Fanger, P.O. (2002) The impact ofair pollution from used ventilation filters on human comfortand health. Proceedings of the 9th International Conferenceon Indoor Air Quality and Climate, Monterey, vol. 1, pp. 338–43.www.indoorair2002.org.
24 Mauderly, J. (2002) Linkages between outdoor and indoor airquality issues: pollutants and research problems crossing thethreshold. Proceedings of the 9th International Conference onIndoor Air Quality and Climate, Monterey, vol. 1, pp. 12–13.
25 Bjorkroth, M., Asikainen, V., Seppanen, O. and Sateri, J. (2002)Cleanliness criteria and test procedures for cleanliness labellingof HVAC components. Proceedings of the 9th InternationalConference on Indoor Air Quality and Climate, Monterey, vol. 1,pp. 670–4.
26 Tselepidaki, I. and Santamouris, M. (1991) Statistical and per-sistence style analysis of high ambient summer temperaturesin Athens for cooling purposes. Energy and Buildings, vol. 17,pp. 243–51.
27 Meierhans, R. and Zimmermann, M. (1991) Slab cooling andearth coupling. Proceedings of the Future Buildings Forum –innovative cooling workshop. International Energy Agency,organized by Oscar Faber, May, pp. 1–24.
28 See for example the excellent: Cooper, Gail (1998) Air-conditioningAmerica: Engineers and the Controlled Environment, 1900–1960.Johns Hopkins Studies in the History of Technology. Baltimore,MD: Johns Hopkins University Press.
29 Ackermann, Marsha (2002) Cool Comfort: America’s Romancewith Air-conditioning. Washington, DC: Smithsonian InstitutionPress.
30 An excellent book that looks at the problems with viewing com-fort as a product rather than a quality is Shove, E. (2003) ComfortCleanliness � Convenience: The Social Organization of Normality.Berg: Oxford.
Air conditioning – the ultimate solution? 239
Roaf_Ch10.qxd 29/10/04 6:54 PM Page 239

The age of skyscrapers is at an end. It must now be considered an experi-mental building typology that has failed.1
SIZE MATTERS
Size matters, and always has mattered. It represents power, anddominance within a group. There are strong subliminal drivers forthe idea that to be ‘above’ is better. In terms of defence the fur-ther you can see the sooner you know that the enemy approaches.In early warfare there were significant physical advantages to being‘above’ when lobbing sling bullets, spears or cannon shot at theenemy, although this advantage is hardly relevant when the enemyis a disgruntled colleague, the hubris of the CEO of a large organi-zation, or an anthrax spore.
In animal groups, dominant males strengthen the ‘family line’through the idea of selective breeding, where the ‘strongest’ men,in a particular ecological niche, will win the fair hands of the strongestwives and so have the strongest children, so fortifying the ‘line’ inperpetuity within that niche, be it because they can run faster, earnmore or survive the cold. We also enjoy ‘looking down on’ people,from lofty ‘heights’, be they intellectual, financial or simply the seatof a great big SUV. In many settlements the best houses wereraised above the unhealthy masses in the cleaner fresher air thatwealth affords. We are also impressed by looking up at people, andtheir edifices, the ultimate symbol of great achievement. This ten-dency is reflected in a charming poem written in Cairo in the 14thcentury, about a windcatcher, which demonstrates that human naturechanges little over centuries:
A house resembling as-Samaw’al’s castle has come to bragAbout one of its architectural features, saying:‘I see my windcatcher rise up high in the air,Being mightier and taller than those who go after it’.
(Ibn Abi Hajalah at-Tilimsani, 1325–75)
11 TALL BUILDINGS
Roaf_Ch11.qxd 29/10/04 6:56 PM Page 240

Since the race to build the tallest building began, first won in thelate 1920s by the Empire State Building2 at 381 m and 102 storeys,over the Chrysler Building, at 319 m and 70 storeys, the title ofthe ‘owner of the tallest building in the world’ has also been agoal of very powerful men. The Twin Towers of the World TradeCenter held the title for a time.
Tall buildings 241
(b)(a)
(d)
(c)
11.1.Huge buildings in America were run with and without air conditioning in the 1930s and 1940s, still using careful climaticdesign, thermal mass, opening windows and shading. Here we see four: (a) The Hotel Lincoln in New York; (b) theMerchandise Mart in Chicago – an early ‘mall’ and the largest building in the world at that time; (c) the Stevens Hotel,Chicago, with circulating iced water in every room; and (d) the Chrysler building in New York, with a pioneering airconditioning system. (Source: S. Ross, postcard collection)
Roaf_Ch11.qxd 29/10/04 6:57 PM Page 241

Currently Taipei is now ahead in the skyscraper stakes, housing12 000 people in 101 Office block, which at 508 m has overtakenthe Malaysian Petronas Towers, and is designed to survive a 9/11-type attack. It has more escape stairs than the Petronas towers,not a small consideration, and can endure extreme winds and anearthquake above 7 on the Richter scale. Severe storms and tremorsare common in Taiwan. It also has the world’s fastest lifts, that travelat 37 mph and take passengers to the 90th floor in 39 seconds –when the electricity is on, that is.3
The 88-storey Jinmao tower, China’s tallest building, is located inShanghai. London’s tallest building, Canary Wharf, is somewaybehind in the stakes, at 235 m high and 50 floors.4 The ‘Shard ofGlass’, which has recently got planning permission, designed byRenzo Piano at 305 m high, is to be located in Southwark. The UK’shighest residential building, a 157 m high, 47-storey glass tower, isto be built in Manchester. The height was dictated by the fact thatManchester airport sets a 160 m height limit on buildings in thecity. It will be 30 m taller than the Barbican tower in London. Itwill cost £150 million to build and buyers have already reserved£60 million worth of space in it.
Some architects actively promote tall buildings
Richard Rogers is one who supports tall buildings, as was demon-strated by his recent attack on the UK Centre for the BuiltEnvironment’s5 decision to oppose permission for the high rise glass‘shard’ building designed by Renzo Piano for London. Despite muchopposition, by those who said that the building did not do enoughto improve the public realm in the area, Richard Rogers, stated:
To stop a massive development because some people think the publicdomain is not as good as it should be is an absolute mistake . . . It is com-pletely throwing the baby out with the bathwater . . . I don’t believe thatall tall buildings need public space.6
In his evidence to the planning inquiry for the building he claimedthat the building was:
a masterwork of architectural design, sited in the right place to maintainLondon’s status as a world city. Its impact on London’s protected skyline,as a part of a cluster of towers will be entirely positive, and will not harmstatutorily protected views or harm the setting of St Pauls.7
A number of architects supported the tower, which was vari-ously described as ‘very special’, ‘audacious’ and a ‘true master-piece’, and declared that it would be embraced by Londoners forits ‘meaning and elegance’, though what that meaning was is stillunclear. Those voicing strong opinions were notably those whomake a living out of big buildings, one notable claiming that this
242 Adapting Buildings and Cities for Climate Change
Roaf_Ch11.qxd 29/10/04 6:57 PM Page 242

building in particular ‘sensitively reflects its local context’, in con-trast to CABE’s concerns over its scale, form, detail, design ref-erences and the grain of the development. How do people justifysuch statements? What would sensitive mean in this context?8
In London, the Mayor Ken Livingston promoted the idea ofhigh buildings to trumpet the international status of the city.9 Anumber of new tower blocks had been proposed for London,including a 30-storey tower for the Southwark Estate and anumber of other multi-storey developments in Greenwich,10
Mill Harbour,11 Docklands, and the City.12 One developer waseven told to make his tower a number of floors higher, eventhough calculations showed that above 18 floors they wouldbegin to lose money.
Many people think tall buildings are not a good idea
A number of groups, such as English Heritage, have raised objec-tions at the planning stage to these developments, while othergroups have not only supported the building of these new towerblocks but also vilified the objectors. Livingston famously likenedEnglish Heritage to the Taliban of British Architecture for its objec-tion to the London Bridge scheme.13
Richard MacCormac and Sir Norman Foster have voiced theirreservations about new tower buildings in the City of London, thatcan ‘so easily become ghettos, just a series of fragments floatingapart and looking after themselves’.14 Sir Norman Foster sensiblycalled for ‘less hysterical debate – The issues need to be discussedrationally.’15 There are a number of people calling for a new lookat the potential for ‘ground scrapers’, and low rise, high- and medium-density developments.
And some cities resist them
Paris has one of the most untouched skylines of any city in theworld, and is now considering lifting a 30-year ban on skyscrapersat the edges of the city. In 1974 they outlawed the building of anybuilding above eight storeys over an area of 40 square miles. Themove comes at a time when there is growing pressure on space,but plans are only being considered for new higher buildings in thecity’s outskirts, not in the historic centre, where the only high build-ings are the Eiffel Tower built in 1889 to a height of 324 m16 andthe Montparnasse Tower, with 58 floors. It may be that major cor-porations that are now extremely concerned not to be situated in,or near ‘target’ buildings, may in future favour more ‘secure’ cities,free from such buildings.
Tall buildings 243
Roaf_Ch11.qxd 29/10/04 6:57 PM Page 243

SPACE PLANNING PROBLEMS
A high rise building usually consists of a shaft and elevators sur-rounded by living units on each storey. The properties of openingsin the south (sun: solar gain) and north (cold wind: infiltration) andthe very limited opportunities for the floor plans, with restrictedwalk distances to fire exits and access shafts, drastically reducesthe organizational possibilities of the plan.
Such are the conditions of a high rise form that, because of itsvery height, can severely disadvantage people who suffer fromvertigo, a recognized condition in which individuals are psycho-logically frightened of being ‘too high’. The enclosed access con-ditions for tall buildings may also trigger agoraphobia, a conditionthat can be exacerbated by high temperatures. Many people can-not work in such buildings for this reason, which would be a prob-lem if they were a key worker in an organization. It is unclear howemployers can insist on employees only occupying ‘high’ offices,where their business is located, when this work condition wouldcontravene employment law against the discrimination against indi-viduals or ‘minorities’ with such conditions. How does a personclimb the corporate ladder in a tall building when they suffer fromvertigo?
The form also has climatic design limitations, magnified becausethey occur on every floor in a rigid plan form. It has been provennigh on impossible, for instance, to prevent all south-facing apart-ments in high rise buildings from overheating in summer and allnorth-facing ones being cold in winter due to radiant gains andlosses. It is very difficult to attach solar shading to the outside of
11.2.Cities all around the world grewwithin a couple of decades totheir soaring current forms.When the author was a girl inSydney the highest building wasthe AMP building, at 28 storeysand the radio weatherprogramme would reportoccasionally that snow had beenspotted on the top of this hugebuilding! It can be seen behindthe ferry by the wharf. (Source:Sue Roaf)
244 Adapting Buildings and Cities for Climate Change
Roaf_Ch11.qxd 29/10/04 6:57 PM Page 244
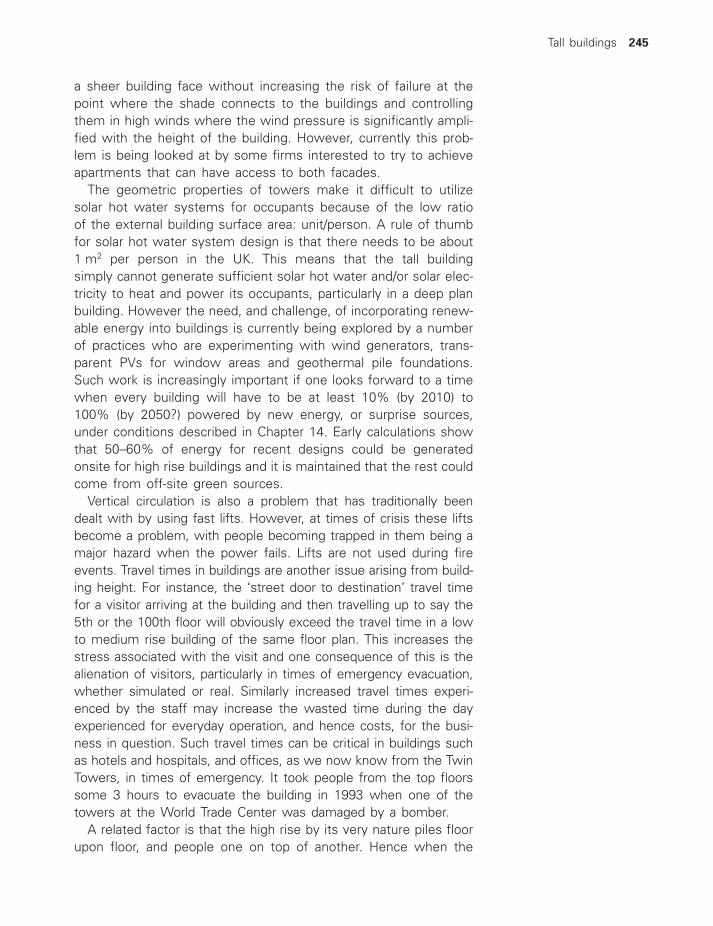
a sheer building face without increasing the risk of failure at thepoint where the shade connects to the buildings and controllingthem in high winds where the wind pressure is significantly ampli-fied with the height of the building. However, currently this prob-lem is being looked at by some firms interested to try to achieveapartments that can have access to both facades.
The geometric properties of towers make it difficult to utilizesolar hot water systems for occupants because of the low ratioof the external building surface area: unit/person. A rule of thumbfor solar hot water system design is that there needs to be about1 m2 per person in the UK. This means that the tall building simply cannot generate sufficient solar hot water and/or solar elec-tricity to heat and power its occupants, particularly in a deep planbuilding. However the need, and challenge, of incorporating renew-able energy into buildings is currently being explored by a numberof practices who are experimenting with wind generators, trans-parent PVs for window areas and geothermal pile foundations.Such work is increasingly important if one looks forward to a timewhen every building will have to be at least 10% (by 2010) to100% (by 2050?) powered by new energy, or surprise sources,under conditions described in Chapter 14. Early calculations showthat 50–60% of energy for recent designs could be generatedonsite for high rise buildings and it is maintained that the rest couldcome from off-site green sources.
Vertical circulation is also a problem that has traditionally beendealt with by using fast lifts. However, at times of crisis these liftsbecome a problem, with people becoming trapped in them being amajor hazard when the power fails. Lifts are not used during fireevents. Travel times in buildings are another issue arising from build-ing height. For instance, the ‘street door to destination’ travel timefor a visitor arriving at the building and then travelling up to say the5th or the 100th floor will obviously exceed the travel time in a lowto medium rise building of the same floor plan. This increases thestress associated with the visit and one consequence of this is thealienation of visitors, particularly in times of emergency evacuation,whether simulated or real. Similarly increased travel times experi-enced by the staff may increase the wasted time during the dayexperienced for everyday operation, and hence costs, for the busi-ness in question. Such travel times can be critical in buildings suchas hotels and hospitals, and offices, as we now know from the TwinTowers, in times of emergency. It took people from the top floorssome 3 hours to evacuate the building in 1993 when one of thetowers at the World Trade Center was damaged by a bomber.
A related factor is that the high rise by its very nature piles floorupon floor, and people one on top of another. Hence when the
Tall buildings 245
Roaf_Ch11.qxd 29/10/04 6:57 PM Page 245

building is catastrophically damaged causing collapse everythingabove the damaged floor falls, as we saw in New York. If the samespace is arranged in a low rise form, such as at the Pentagon,only a part of the building collapses. If the Pentagon had been ahigh rise building most of the people in it would have died, andbecause of its robust, low rise form, far fewer occupants wereaffected when the structure was hit by a plane. In addition, thesheer amount of material generated by the collapse of the TwinTowers was exponentially higher than would have accompaniedthe collapse of say a 10-storey building of the same size due tothe force of the collapse.
However, it was not only the main buildings of the Twin Towersthat collapsed but six adjacent buildings also had to be demolishedas part of the aftermath of the 9/11 attack. The decision to demol-ish the former Deutsche Bank building that overlooks the WorldTrade Center site was taken as late as June 2003. The 40-storeyskyscraper became known as the ‘widow’ because of the blacknetting hung over it to prevent debris from falling onto passers-by. The building, constructed in the 1970s, was severely damaged,with a 24-storey-high gash rent in it by collapsing steel from theSouth Tower. Worse damage was inflicted by a mould infestation,caused by the sprinkler system going off and standing water goingstagnant, making the building uninhabitable. The reason it has stoodfor so long untouched is that the insurers could not agree that itcould not be salvaged. It was calculated to cost US$100 millionalone to demolish, a sum that would cover the removal of asbestosand other contaminants from the building.17
Workplace Security and Business Continuity Planning experts alsowarn corporations, not surprisingly, to be wary of taking space nextto ‘high-risk’ buildings in view of the impacts they may have on adja-cent buildings if targeted in terrorist events, and the value of build-ings adjacent to new high profile ‘target’ buildings may be adverselyaffected by such trends in the business community.18
PSYCHOLOGICAL PROBLEMS
When high rise buildings were first commonly built in the UK anumber of studies were done evaluating and reporting on the oftenchronic problems amongst tower dwellers, including many psycho-logical and social problems, such as slower motor development amongchildren who are prevented from spending time outside without adultsupervision; distress and alienation, especially amongst groups ofcertain ages or genders who spend many hours indoors – women,the elderly and children; dissolution of social connections; a highercrime rate relative to the same phenomena in lower buildings,
246 Adapting Buildings and Cities for Climate Change
Roaf_Ch11.qxd 29/10/04 6:57 PM Page 246

particularly around lift shafts and stairways in poorer areas, wherethe lifts are often broken and irregularly maintained due to the lowpriority of the task for already overstretched budgets.19,20
There are now methodologies for including within the life cyclecostings for a building the increased costs to the UK NationalHealth Service of different types and conditions of housing by postcode.21 New studies could be instigated on the health costs ofexisting high rise housing, so they can be incorporated in the costplanning on new towers for which they seek planning consent.
There is also, currently, real concern raised about the after-effectsof the Twin Towers event in terms of psychological damage andthe impact on the minds and even productivity of people who nowoccupy high rise buildings around the world.
Voices raised against the skyscraper include that of the archi-tect and urbanist Constantine Doxiades:22
My greatest crime was the construction of high-rise buildings. The mostsuccessful cities of the past were those where people and buildings werein a certain balance with nature. But high-rise buildings work against nature,or, in modern terms, against the environment. High-rise buildings workagainst man himself, because they isolate him from others, and this iso-lation is an important factor in the rising crime rate. Children suffer evenmore because they lose their direct contacts with nature, and with otherchildren. High-rise buildings work against society because they preventthe units of social importance – the family . . . the neighbourhood, etc. –from functioning as naturally and as normally as before. High-rise build-ings work against networks of transportation, communication, and of util-ities, since they lead to higher densities, to overloaded roads, to moreextensive water supply systems –- and, more importantly, because theyform vertical networks which create many additional problems – crime . . .
BUILDING, OPERATIONAL AND MAINTENANCE COSTS
The higher the building, the more it costs to build, operate andmaintain. The primary increase in build costs, per metre square,results from the increased structure and construction required tosupport the building, earthquake-, fire- and weather-proof it andthe increased systems needed to operate it, including lifts, esca-lators, water pumping and electrical systems. These high costscan only pay back if higher than average prices are paid for thefloor area, housing or offices than would be the case in a lowerrise building. So to put social housing up in the air is to ask thepoor to pay over the odds for the simple provision of housing.
In addition, the higher the building, the more it costs to run becauseof the increased need to raise people (lifts), goods, and servicesand also, importantly, because the more exposed the building is to
Tall buildings 247
Roaf_Ch11.qxd 29/10/04 6:57 PM Page 247

the elements the more it costs to heat and cool. The higher thebuilding, the higher the wind speeds around the building, the moredifficult to keep it out, and the more the wind pressure on the enve-lope sucks heat from the structure, particularly as with many 20thcentury tower blocks the envelope leaks. The higher the building,if standing alone, the more exposed to the sun it is and the moreit can overheat. And hence the higher the building the more it coststo keep the internal environment comfortable.23
So in effect, by making the simple decision that those with lessmoney will live in the air in social housing ‘towers’, their quality oflife will be compromised: they will struggle to pay their utility billsand for the service charges for their lifts and for caretakers nec-essary to keep such buildings safe and clean. Local councils in theUK now have to charge home owners what it costs them to runa building people live in. Previously such service charges wereabsorbed in the general council charges, so making all tenants andcouncil tax payers pay to run the lifts in high rise buildings that oth-ers occupied; now individual house holders will have to foot thebills for the costs of their own homes. So individual council tax pay-ers and tenants foot the bill for a politician’s choice to go ‘high’.
Lifts are very energy-expensive and costly to run, maintain andreplace. Lifts alone can account for at least 5–15% of the build-ing running costs and the higher the building, the more it costs.24
The higher the building, the greater the annual maintenance coststo keep it clean, repaired and safe. The failure of a single buildingelement can be catastrophic. For example, the silicon mastic usedto weatherproof glazing panels was given in its early forms onlya 15 year performance guarantee. If mastic fails, it can result inthe need to remove and/or repair every single glazing panel in thesurface of a building, which in a high rise building would prove tobe a crippling expense. Day-to-day maintenance of buildings canbe similarly expensive and where building envelopes are prob-lematic to access, they can have enormous annual cleaning costs.One famous tower block in the City of London has allegedly provedimpossible to sell because of its astronomical maintenance andrunning costs, and even relatively lower rise buildings such as theGreater London Authority headquarters can run up annual windowcleaning bills in the tens of thousands of pounds.
Many tower blocks have fallen into a very poor state of repairbecause their owners cannot afford their upkeep. The historical real-ity has proved that it is often cheaper to blow up tower blocks thanrepair them. ‘Tower blocks are only for the rich’, said Mike Holmesof Arup Associates, so why is anyone considering them for socialhousing at all, particularly when, with climate change, wind speeds,storms, flooding and solar intensity will increase significantly over
248 Adapting Buildings and Cities for Climate Change
Roaf_Ch11.qxd 29/10/04 6:57 PM Page 248

the next decades, so speeding up their deterioration. Particularlyvulnerable to a more extreme climate will be leaky envelopes, typ-ical of concrete panel tower blocks, and glass and steel structuresthat suffer from very high levels of solar gain, are very difficult toshade high up and have traditionally had extreme cold bridging prob-lems through the structure. Tower blocks also typically have to haveair conditioning, as they are of sealed envelope construction, a deci-sion that can quadruple energy costs at a stroke, and in turn givesthem a disproportionately high carbon emitter status, at a timewhen carbon taxes for home owners are being spoken of. So ontop of high running costs homeowners would have also to con-sider that they may have to pay far higher carbon taxes associatedwith high rise buildings in the future.
OVERPOPULATION OF DISTRICTS
The concentration and compaction of high rise buildings permitsintensive land use but causes population over-crowding in locali-ties, at certain times of the day/week. This can result in drasticaffects on open areas, streets and parks, and places excessivestrain on the existing infrastructure, such as parking, roads, trans-port, sewerage, water and energy.25 If one breeds bacteria in atest tube they can double and double in number many times withno noticeable impact on their population until the test tube is halffull and when they double again the test tube becomes full. A sin-gle doubling incident becomes the point at which the habitat ceasesto become viable as its capacity is exceeded.
Leon Krier has referred to this as ‘urban hypertrophy’, makingthe additional point that overloading any given urban centre tendsto prevent the organic development of new healthy, mixed urbanfabric anywhere beyond the centre.26 Bear in mind, too, that someof the sturdiest and even aesthetically pleasing tall buildings of theearly 20th century are only now approaching the end of their so-called ‘design life’. What is their destiny? The worst offender inthis urban destruction is the monofunctional megatower, whichparadoxically has become an icon of modernity and progress. Thisissue has also been dealt with in Chapter 7, in consideration ofeffects on infrastructure and evacuation.
SOLAR, WIND AND LIGHT ACCESS RIGHTS
There are real issues of solar rights with high rise buildings thathave to be addressed and agreed. The higher a building is the greaterthe shadow it casts on the buildings around it.27 The shadow castby a two-storey building is larger than the shadow of a one-storey
Tall buildings 249
Roaf_Ch11.qxd 29/10/04 6:57 PM Page 249

building of identical floor plan by 2%. A building of 16-storeys castsa shadow 43% larger than a one-storey building, at noon on thewinter solstice.28 A high rise building will cast a shadow over a hugearea of a city. Naturally, if the building is close to the high rise itwill be shadowed most of the year and if it is distant it will be shad-owed perhaps for only a period in the day, however this could bewhen the solar energy is most needed. Solar rights legislation isbeing passed in cities around the world and an excellent exampleis that of the Solar Law of Boulder, Colorado27 where legislation hasbeen enforced to ensure that buildings do not steal the sunlightfrom adjacent properties. There is also a case to be made for windrights to ensure that new buildings do not cut off the air flow aroundbuildings that may be needed to power ventilation systems orgenerate electricity.
In a world where power failures will become more common,the use of non-grid-connected solar or wind generation systemsfor, for instance, failsafe security and fire alarms and lighting, elec-tric garage doors, UPS systems for computer networks and emer-gency lighting will increase, enhancing the need to protect thesolar and wind rights of buildings. In the less energy-secure futurewe will have to rely increasingly on emerging energy generationtechnologies, such as wind, solar and hydrogen systems, to runour buildings for hot water, space heating and electricity.
The higher up one gets, the higher the wind speed, and so onthe facades of high rise buildings there will be huge potential forwind generators. There is much interesting work currently beingdone by Dr Derek Taylor at the Open University on how to powerindividual buildings using the wind. Again there will be optimal lev-els of building surface available in relation to building volume andoccupancy to be explored here and optimal wind-driven buildingforms will emerge and be exploited. But again we come to theproblem of stealing other buildings’ energy, and if a series of windgenerators are built on city buildings, and an adjacent tower blockis erected in the direction of the prevailing wind, the wind energyof the first building is substantially reduced. There are also prob-lems of generator vibration, passing through to the structure of abuilding, that will have to be solved in high buildings and the nec-essary structural reinforcements would have to be factored intothe system and running costs.
There are increasingly high profile legal issues in allowing onebuilding to steal the sun, light, wind and sound from one or manyother buildings. Shanghai’s Urban Planning Administrative Bureauhas proposed curbing the height of tall buildings in the city.29 Overthe past decade the Chinese city has witnessed an extraordinary
250 Adapting Buildings and Cities for Climate Change
Roaf_Ch11.qxd 29/10/04 6:57 PM Page 250

construction boom – the Chinese government’s plan for Shanghaito replace Hong Kong as the financial hub of East Asia is thoughtto be on schedule. But a consequence of the city’s growing promi-nence has been a steep rise in land values, which in turn has con-tributed to the construction of a large number of tall buildings in
Tall buildings 251
(a) (b)
(c)
11.3.Simulation of an aerial view of San Francisco showing the surfaces that get most solar gain over a year and the shadowsthat buildings of different shapes and heights cast across an area of the city. (a) Predicted total annual irradiation incidenton building facades in San Francisco; (b) Irradiation scale; (c) View from above of the 3D model of San Francisco with anoverlay map of total annual irradiation for the study area. (Source: John Mardaljevic, Institute for Energy and SustainableDevelopment, De Montfort University; see www.iesd.dmu.ac.uk/)
Roaf_Ch11.qxd 29/10/04 6:57 PM Page 251

the city. Now, with a growing number of civil court cases allegingthat tall buildings can block light and raise the city’s temperatures,it has been proposed that buildings should not exceed 30 storeys.The proposal is unlikely to please developers. Land prices haverisen as high as US$1500 (RMB 12 000) per square metre.30 Thereare also concerns that the quality of some tall buildings is not highenough.
Two conditions conspire to make daylighting difficult in high den-sity buildings. One is how wide they are, from one external wallto another. Once the width of a building increases beyond about12 m it is difficult to daylight it. Not withstanding the depth of abuilding, the amount of daylight reaching an interior is dependenton how much clear sky is visible from any particular window. Themore sky which can be seen from a window, the greater the amountof daylight that can enter a room. In a dense urban setting, itbecomes clear that windows close to the ground will not providesignificant daylight to interiors in high rise districts.
WIND-PROOFING BUILDINGS
Peter Blake, in Form Follows Fiasco, condemned megatowers onseveral points. One was the disastrous wind shear that their sur-faces created; another was fires that had burned out of control intwo skyscrapers in Latin America. He warned the world that:
The first alternative to Modern Dogma should obviously be a moratoriumon high-rise construction. It is outrageous that towers more than a hun-dred storeys high are being built at a time when no honest engineer andno honest architect, anywhere on earth, can say for certain what thesestructures will do to the environment – in terms of monumental conges-tion of services (including roads and mass-transit lines), in terms of windcurrents at sidewalk level, in terms of surrounding water tables, in termsof fire hazards, in terms of various sorts of interior traumata, in terms ofdespoiling the neighborhoods . . .31
Perhaps the worst climatic impacts that are associated with highrise buildings result from the wind. The increasing height of a build-ing results in two major factors:
1 The speed of the wind increases the higher it is off the groundresulting in higher air pressure experienced on the surface ofthe building.
2 The higher the pressure at the top of the building the greaterthe difference in pressure between the top and the bottomof the building increasing the speed of the wind between theapex and the base of the building.
252 Adapting Buildings and Cities for Climate Change
Roaf_Ch11.qxd 29/10/04 6:57 PM Page 252

The increasing high level air pressure causes accelerated air speedson the surface of the building significantly increasing air penetra-tion into the building, and out on the leeward side of the buildingthrough openings and cracks.32 This can substantially increase theheating or the cooling load of an exposed high building over theloads of a low to medium rise building, often requiring expensivesystems of climate control to even maintain a comfortable indoorclimate the higher up the building one goes, but perhaps the poten-tially most severe impacts of wind discomfort occur in the out-door spaces around high rise buildings.33 Many of us will experiencesuch discomfort daily. In the city of London, for example, it is dif-ficult not to notice the significantly increased wind speeds on anordinary summer’s day in say, Threadneedle Street, adjacent to ahigh rise tower.
Wind becomes an annoyance at about 5 m/s, by causing clothesto flap and disturbance to the hair. At 10 m/s it becomes definitelydisagreeable and dust and litter are picked up and by 20 m/s it islikely to be dangerous. In studies the Building Research Establishmentfound that wind speeds of 5 m/s were exceeded less than 5% ofthe time in areas of low rise developments but were exceeded over20% of the time in areas with high rise buildings.34 With the increas-ingly deep low pressure systems currently being associated withclimate change and their associated increases in wind speeds, theground level turbulence and wind speeds in city streets may becomeincreasingly less tolerable for the ordinary citizen in areas adjacentto tower blocks.
Higher wind speeds at street level are also associated with higherwind chill factors, making the outdoors even more uncomfortable.Where today problems of outdoor air comfort may result from windflow down and up from high rise buildings, they may in future climates become the cause of increasingly dangerous street conditions as wind speeds increase.
There are a number of laboratories in the UK where the windimpacts of new city developments can be tested on models inwind tunnels or through simulation, as for instance at theUniversities of Cardiff, Sheffield, Cambridge, UMIST and at theBuilding Research Establishment and the National PhysicalLaboratory. Such wind testing is required by local authorities, byindependent bodies, but for current climates only, and not futurewind environments.
The highest percentage of the 85 UK construction-related deathsbetween 2001 and 2002 were caused by falls from height and areport on Health and Safety on sites concluded that ‘designers areoften abdicating their responsibility to reduce risk in relation towork at height by leaving it to the principal contractor without first
Tall buildings 253
Roaf_Ch11.qxd 29/10/04 6:57 PM Page 253

considering how they could change the design in a way that wouldmake it safer to build, clean or maintain’.35 Increased wind speedsat height, with a windier climate, will significantly increase the riskof construction worker deaths to the point where building firmsmay become reluctant to put their workforces under such risksduring certain seasons of the year.
SECURITY
There are four ways in which high rise buildings will impact onthe security of individuals, a business or a district. The first is obvi-ous, being the security threat posed by occupying a ‘target’ build-ing, occupied particularly by other target companies. In the currentanti-globalization atmosphere in current politics the larger the build-ing the bigger the trophy. In New York it was the highest symbolof American Imperialism that was targeted by Islamic fundamen-talist bombers. In London the Irish bombers chose again the dis-trict that represented the ‘heart of the beast’ to plant their largestbomb in the capital – Canary Wharf.
The second security issue is less obvious but may have more bear-ing on the everyday lives of people. It is the increasing wind speedat street level detailed above that has, and will increasingly have, thegeneral effect that people avoid the streets. This impacts on streetbusinesses as people begin to move out of doors less and less, lead-ing to a general reduction in the quality of street life. American stud-ies also show that lower numbers of people on the streets increasesthe levels of crime and violence, so reducing the security of wholedistricts.
In addition, studies of high rise housing estates have shown thatthey are subject to higher levels of crime generally and can havedisastrous impacts on society and culture. The problems of access
11.4.Just as financiers and pensionholders alike have ‘taken a bath’on the ‘Dog Funds’ that lost theirvalue overnight, so manybuildings may also say CaveCanem – ’Beware of the Dogs’.To avoid them look for signs ofvulnerability to a range of hazardsin a particular building.(Source: www.moloss.com)
254 Adapting Buildings and Cities for Climate Change
Roaf_Ch11.qxd 29/10/04 6:57 PM Page 254

and psychological alienation of high rise housing have been wellstudied. Such was the scale of the problem in Hulme in SouthManchester that the Chief Housing Office of the city actually quithis job in the 1970s to write a PhD on access in housing estates.
The third security issue is that of biological warfare. In buildingswith fixed windows and extensive air circulation systems there isan increased hazard from biological agents. Ventilation ducts haveproved to be a route of infection; at the Pentagon 31 anthrax sporeswere found in the air conditioning ducts of the building.36 The prob-lem here is the bigger the building, the bigger the risk. Many tall buildings have centralized circulation, servicing and air handling units that make them very vulnerable to attack from manydifferent sources.
A fourth issue we could add is nature’s ‘biological warfare’ onus. For example, after more than a year, Hilton Hawaiian Villagereopened in September 2003 after paying $55 million dollars inrepairs that saw the building closed for 14 months, because a single tower block became infected with mould throughout its air-handling system, exacerbated by very high humidity within thebuilding. The mould Eurotium aspergillus was said to be to blame,the same kind of mould seen on bread or cheese. It has no effecton most people, but some people get minor irritation of the nosearound it, the symptoms abating as soon as one moves away, whilea very few people have severe symptoms that in rare cases canbe life-threatening. This is not confined to the tropics, and indeeda problem similar to what Hilton experienced was found in hospitalsacross Canada in recent years.
Hilton has sued virtually every contractor that had anything todo with the construction of the Kalia Tower, including the archi-tect, all the consulting engineers and other specialists on the proj-ect, and even the company that provided the lanai glass doors. Ithas argued that both the design and the construction of the build-ing made it a ‘greenhouse’ for growing mould. The entire HVACsystem was rebuilt, mostly to ensure a more frequent turnover ofdrier air. The insurance industry has subsequently withdrawn ‘mouldcoverage’ from many policies and it is claimed mould will be the‘new asbestos’ in terms of payouts. The severity of the problemis reflected in the size of the payout to one family in a mould case,when a Texas jury awarded a family $32 million in a single toxicmould lawsuit against Farmers Insurance Group in June 2001.37
Such outbreaks may become more prevalent with a warmer, wet-ter climate, which will make buildings more susceptible to sys-temic infestations of naturally occurring toxins within large-scaleair-handling systems.
Tall buildings 255
Roaf_Ch11.qxd 29/10/04 6:57 PM Page 255

ENERGY SECURITY
The height of a building affects its internal climate. A building devel-ops its own internal micro-climate, and heat from the lower floorswill rise by natural buoyancy, making the higher floors hotter. Thehigher the building the greater this problem of thermal stratificationand the more energy that has to be thrown at cooling the upperfloors.
In a high rise building, where so many people are dependent onmachinery for their very survival, there are severe repercussionsfrom system failure. If a chiller breaks down and a part has to beobtained from Japan the systems of the whole building may beput at risk. In February 1998 in Auckland, New Zealand, all fourmain cables into the central city failed, cutting electricity to officesand more than 5000 apartments. Backup cables also failed, due inpart to the extreme summer temperatures38 and for up to 8 weeksthere was chaos in the city buildings, where temperatures soaredto over 50 �C and allegedly in the top floors of tall buildings toover 80 �C, making their habitation impossible. So taller means hot-ter at the top and more energy to heat and cool the building – afactor when floors are metered and lessees have to pay for theenergy they use on their own floors. Businesses with all their eggsin one building basket will be very vulnerable to the impacts ofenergy outages, particularly in thin, tight-skinned buildings with noopening windows that have to be immediately evacuated becausethe air indoors becomes unfit to breathe once a blackout begins.
A 100-storey office block in the centre of London with a 50 mby 50 m floor plan would, if it was inefficient, use in the region of1000 kWh/m2/annum of primary energy to run if it was of a busi-ness-as-usual design. This would translate to around 115 W/m2
(1000/(24 � 365) W/m2). Tall buildings, by their very nature of beingtall, can use twice as much energy as equivalent low buildings –to raise people, goods, water etc. throughout the building. Thereforepeak demand from the building could be say 250 W/m2 or 62.5 MW.A typical UK power station today has a rated output capacity ofabout 1 giga watt. So one more 1 MW power station would haveto be built to cope with 16 new high rise buildings in the City ofLondon for instance, and this would be paid for from the bills ofthe ordinary electricity consumers of a region. Is this fair peoplemay begin to ask, and especially when energy security is increas-ingly a core requirement of UK government policy.
Such buildings are a large part of the energy security problemin that they draw down so much of the energy in an area theycan jeopardize supplies to buildings around, particularly where the
256 Adapting Buildings and Cities for Climate Change
Roaf_Ch11.qxd 29/10/04 6:57 PM Page 256

power supply infrastructure is weak. The need to turn off or turndown buildings was seen in the case of the factories and shop-ping malls of Shanghai that had to be ‘turned off’ during brown-outs (severe drops in voltage that cause the lights to dim).
Many towers are advertised as ‘energy efficient’ or ‘green’, andsuch claims could be taken with a pinch of salt. However, mitigatingagainst reductions in air conditioning use with efficient technolo-gies is the fact that standards of environmental design of buildingenvelopes are decreasing continually, as evidenced by the fairlyuniversal trend in office buildings in the 1990s, and increasingly inresidential properties in the United States, towards thin, tight-skinned buildings, often with non-opening windows.39 The lack ofinsulation in the external envelopes of such buildings, often cou-pled with poor thermal fabric storage internally, increases the heat-ing and cooling loads of the buildings. With increasingly poorstandards of environmental design, including widespread exces-sive use of glass in envelopes, and rapidly increasing levels ofequipment use, and in particular of computers, air conditioningbecomes more and more essential.40
FIRE
A designer of the Twin Towers stated on TV the day after theevent that if they had designed in sufficient escape stairs for thebuilding then there would not have been enough office space leftto make the building economically viable. It is increasingly recog-nized that in such cases, in tall buildings, everyone above the fireis likely to die. As a result of this open acknowledgement of therisks of occupying high rise buildings, the Building ResearchEstablishment has been pressing UK ministers to tighten buildingregulations related to fire and have written to the Department ofTransport, Local Government and the Regions raising the issues.41
The current regulations do not take into account the provision forillegal acts, catastrophic fires or terrorism, nor was there sufficientprovision in the guidelines for very tall buildings. The increasinglystringent costs of building in new standards for fire precautionsmay affect the financial viability of high rise projects.
Statements were also made after the 9/11 event that no buildingcould have withstood the forces of the two aircraft and the associ-ated catastrophic fires after their crashes. What we know from thePentagon impact, however, is that in a robust, securely designed,low-rise building fatalities can be reduced. After 9/11 the whole way in which fire engineers calculate survival risks in cases of firehas changed. Traditionally they estimated on the notion of phased
Tall buildings 257
Roaf_Ch11.qxd 29/10/04 6:57 PM Page 257

evacuation where the floor of fire and the one above and one belowevacuates first. Today we know that in any fire event in a high risebuilding people will think ‘9/11’ and all scrabble to evacuate simul-taneously. There would never be enough fire exits in any high riseto enable that to happen within the minutes that may be available.We also know now that the fire engineers’ theories about ‘pressur-ized’ escape stairs are flawed and that it is impossible to maintaina pressurized escape when more than a few doors are opened intoit at the same time.
The New York fire department say that a fully clothed fire fightercan reach and operate effectively to around the tenth floor, butnot higher up, so people who need attention on floors higher thanthis may never be reached.
We also know that in catastrophic fires, explosions and black-outs, sprinkler systems and fire lifts can fail. We now know thatthe increasingly hot summers will increase general fire risks outof and inside cities and that they are often associated with wide-scale power failures. And we know that fires can be caused formany reasons, and ‘insecurity’ will increase the risk of them beingtriggered. On 1 February 1974, in S~ao Paulo, Brazil, a fire causedby electrical faults broke out in the upper storeys of a bank build-ing and killed 189 people, many of whom leapt to their deaths.On 31 December 1986, in San Juan, Puerto Rico, fire in the DupontPlaza Hotel set by three employees killed 96 people, largely dueto occupants breaking windows at the point of ‘flashover’, whena fire ball explodes, instantly killing many of the victims. On 23February 1991 a fire broke out on the 22nd floor of the 38-storeybuilding known as One Meridien Plaza in Philadelphia. The firebegan in a pile of oil-soaked rags left by a contractor. It burnedfor 19 hours, eight floors were gutted and three firefighters losttheir lives.42 In the August 2003 blackout in New York the city firebrigade were called to numerous fires caused by candles usedfor light.
WHAT IS THE FUTURE FOR TALL BUILDINGS?
In an increasingly insecure word, do we really need to live in moreinsecure buildings? What would common sense tell us about howhigh a building should go?
● High enough not to be a ‘target’ building – to nestle beneaththe canopy of the city skyline to escape storm winds and notshade the buildings next door from the sun – this depends onthe area of a particular city.
258 Adapting Buildings and Cities for Climate Change
Roaf_Ch11.qxd 29/10/04 6:57 PM Page 258

● High enough that a fire fighter could run up fully clothed topeople in a fire – so no more than ten floors.
● High enough to be comfortably naturally ventilated – say fifteenfloors.
● High enough for occupants to be able to carry bags, and water,up and down the stairs safely if a blackout occurs – say threefloors.
So, a compromise would be around six to eight storeys, but itsanybody’s choice and anybody’s guess. A sensible choice may be
11.5.Buildings with extremely highenergy costs and exposure toextreme winds and solar gainmay be one of the evolutionarytypes of buildings that die outfirst as the climate changes andthe costs of energy rise over thenext decades. (Source: Sue Roaf,digitally produced by ClairePalmer)
Tall buildings 259
Roaf_Ch11.qxd 29/10/04 6:58 PM Page 259

found in the city of Paris, which has a canopy built to these heights.So interestingly, the French, with their ‘Beaux Arts’ tradition andfew notable low energy buildings at all, may have a model for alow risk city. What will the market benefits of that be over thecoming decades?
Perhaps the days of size mattering are over and our buildingchoice in the future will be dominated by the desire to ensure thatwhat we build from now on has the smallest impacts and laststhe longest time rather than making the biggest impression today.Whatever form of building we chose to live and work in, in thefuture, one thing must be sure: that the occupants can survive init when the lights go out, because, in the last decades of the fos-sil fuels age, energy insecurity will drive many of our lifestylechoices. It is to this we turn next.
260 Adapting Buildings and Cities for Climate Change
The thrill of tall buildings has, to a large extent, been dampened forNew Yorkers, and many others around the world, by the events ofand after 11 September 2001. Some 70 million square feet of officespace was destroyed on 9/11. Two months afterwards the demandfor office space in Lower Manhattan was almost negligible becausecommerce and industry had moved out of the area to what theyconsider to be safer premises, lower and less prestigious perhaps,outside the city centre.
The Empire State Building, one of the city’s prime pieces of realestate, has become less prestigious and desirable.i Once againNew York City’s tallest structure, it has lost a number of its 880tenants since September 2001, and others have said they arethinking about new locations. Many business owners who arestaying in the Lower Manhattan area have numbers of employees,and their back-up information centres, located elsewhere due to theirfears of further terrorist attacks. Others found they were losingmoney because of their location.
In New York it is not only the big players in the property marketswho suffer, but also the florists, the grocers and the restaurants,many of whom are also moving out having lost everything, to try tostart again elsewhere. They have lost tens of thousands of well-heeled customers in the space of a couple of blocks due to the eventand out-migration of workers and there is not enough business left inthe area to keep many afloat. Economic migration is alreadyhappening in downtown New York.
‘The attacks on the World Trade Center and the Pentagon changedeverything – and have created immediate and intense visibility forCorporate Real Estate.’ This quote from Cathy Guilbeault, WorkplaceResource Director, Sun Microsystems Inc.ii shows how importantly
Box 11.1 The impact of ‘9/11’
Roaf_Ch11.qxd 29/10/04 6:58 PM Page 260
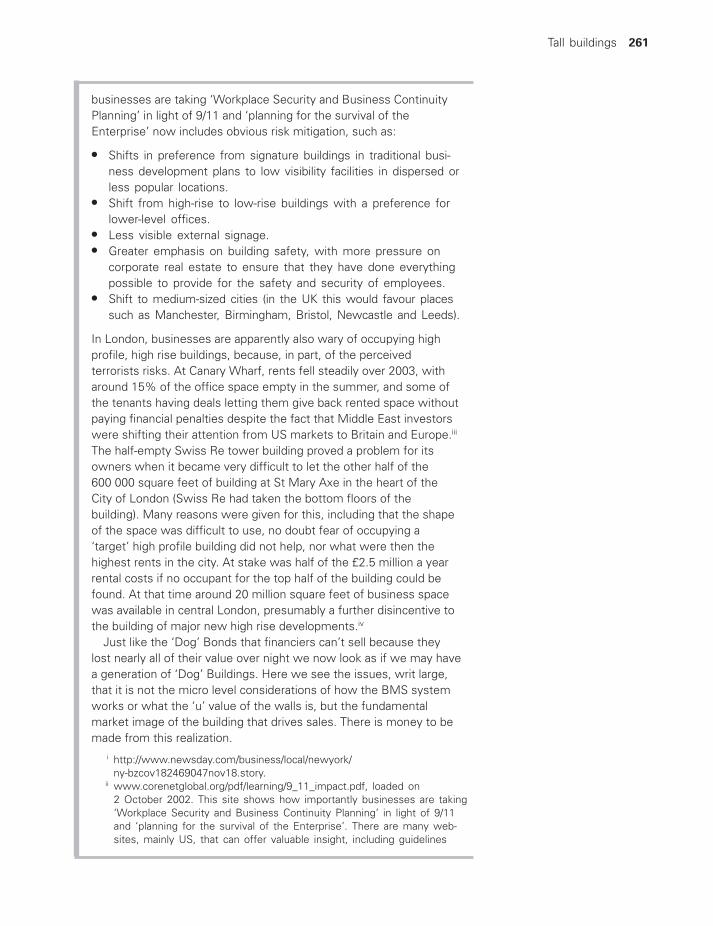
Tall buildings 261
businesses are taking ‘Workplace Security and Business ContinuityPlanning’ in light of 9/11 and ‘planning for the survival of theEnterprise’ now includes obvious risk mitigation, such as:
● Shifts in preference from signature buildings in traditional busi-ness development plans to low visibility facilities in dispersed orless popular locations.
● Shift from high-rise to low-rise buildings with a preference forlower-level offices.
● Less visible external signage.● Greater emphasis on building safety, with more pressure on
corporate real estate to ensure that they have done everythingpossible to provide for the safety and security of employees.
● Shift to medium-sized cities (in the UK this would favour placessuch as Manchester, Birmingham, Bristol, Newcastle and Leeds).
In London, businesses are apparently also wary of occupying highprofile, high rise buildings, because, in part, of the perceivedterrorists risks. At Canary Wharf, rents fell steadily over 2003, witharound 15% of the office space empty in the summer, and some ofthe tenants having deals letting them give back rented space withoutpaying financial penalties despite the fact that Middle East investorswere shifting their attention from US markets to Britain and Europe.iii
The half-empty Swiss Re tower building proved a problem for itsowners when it became very difficult to let the other half of the600 000 square feet of building at St Mary Axe in the heart of theCity of London (Swiss Re had taken the bottom floors of thebuilding). Many reasons were given for this, including that the shapeof the space was difficult to use, no doubt fear of occupying a‘target’ high profile building did not help, nor what were then thehighest rents in the city. At stake was half of the £2.5 million a yearrental costs if no occupant for the top half of the building could befound. At that time around 20 million square feet of business spacewas available in central London, presumably a further disincentive tothe building of major new high rise developments.iv
Just like the ‘Dog’ Bonds that financiers can’t sell because theylost nearly all of their value over night we now look as if we may havea generation of ‘Dog’ Buildings. Here we see the issues, writ large,that it is not the micro level considerations of how the BMS systemworks or what the ‘u’ value of the walls is, but the fundamentalmarket image of the building that drives sales. There is money to bemade from this realization.
i http://www.newsday.com/business/local/newyork/ny-bzcov182469047nov18.story.
ii www.corenetglobal.org/pdf/learning/9_11_impact.pdf, loaded on2 October 2002. This site shows how importantly businesses are taking‘Workplace Security and Business Continuity Planning’ in light of 9/11and ‘planning for the survival of the Enterprise’. There are many web-sites, mainly US, that can offer valuable insight, including guidelines
Roaf_Ch11.qxd 29/10/04 6:58 PM Page 261

262 Adapting Buildings and Cities for Climate Change
from the Federal Protective Service on How to Make Buildings Safe etc.for instance on: www.gsa.gov.
iii Observer, Business, 24 August 2003, p. 4.iv Evening Standard, 19 March 2003, p. 20.
There is no industry-wide policy of not offering mortgages on highrise flats and different lenders have their own policies as to whatthey will lend on. There are a number of issues that lenders will takeinto account when considering whether to lend on a flat. Thesewill include whether the area, and the block, is predominantlyowner-occupied, whether there is likely to be ongoing demand forthe property and what the short- and long-term maintenance costsare likely to be.
Large maintenance bills can be a particular issue in tower blockflats. Some borrowers have been faced with bills of £30 000 if majorrefurbishment is carried out on a block. If there were any possibilitythat a borrower will be faced with a bill of this order it would severelyrestrict their ability to pay their mortgage and affect the security of theloan, so older, poorly maintained, blocks are not favoured by lenders.
The fact that a lender is not prepared to accept the property formortgage purposes may have as much to do with the fact that thereis little or no demand for such properties in a particular area as withan individual property’s specific physical condition.
The type of construction is also an issue. Individual lenders will havetheir own policies on the types of construction they are prepared to lendon. Concrete panel construction has caused problems in the past,including cold bridging and air leakage problems through the envelope,and a number of lenders are reluctant to lend on this type of property.However, if the construction type is an unfamiliar one or there aredoubts about its durability, the lender will often ask for a recentstructural report. If the potential borrower is unwilling to pay for this thenthe mortgage will be refused even though the property may beacceptable. This associated risk is also amplified by the experience oflarge payouts from the insurance industry related to a single event, suchas the gas explosion in a single flat at Ronan Point, London, resulting inthe collapse, and subsequent demolition of, an entire tower block.
For poor people in Glasgow there is little chance of ever getting amortgage in a tower block on a council estate. This is one reasonwhy famous tower blocks that have dominated the Glasgow skylinefor over 40 years are being demolished. They had become
Box 11.2 Ghettos in the sky
Roaf_Ch11.qxd 29/10/04 6:58 PM Page 262

Tall buildings 263
synonymous with crime, poverty and urban decay in Britain’sunhealthiest city and billions of pounds will be spent over 10 years totransform the bleak landscape of Scotland’s biggest city, which hasthe highest concentration of public owned housing in Europe. Mostof the 250 blocks of flats will be knocked down to make way forthousands of new, purpose-built homes after the city’s 94 000 flatsare transferred from council control to community housing trusts.The plans are backed by the Scottish Executive and ChancellorGordon Brown, who has promised to write off the city’s £1 billionhousing debt if the transfer is successful. Under the plans, theGlasgow Housing Association will be given a £6 billion budget to dealwith dilapidated housing stock, including the tower blocks.
Housing consultants estimate the cost of refurbishing flats at RedRoad, Glasgow, to a standard that would last for the next 30 yearswould amount to more than £70 000 per home. They say it will becheaper to get rid of them and start again.i
For the same reason many other cities across Britain are blowingup their tower blocks, including Birmingham where all the 315 towerblocks are planned to be demolished. Officials confirmed that financefor the transfer is based on a programme to demolish 100 towerblocks in the next five years, and almost all of the remaining 215blocks before 2018.ii
Although some lenders have a greater appetite (and capacity) totake on loans which are considered a greater risk than others, and willinsure some tower flats, only a few will expose themselves in thismarket and this is why it is very important that tenants who areconsidering whether to exercise their right to buy should be advisedof the additional risks involved in purchasing a tower block flat and thepossible problems they may have if or when they come to resell it.
Some local authorities may be willing to buy back the propertyunder the ‘Buy Back Scheme’ introduced on 1 April 1999, wherelocal authorities are able to buy back homes from leaseholders orothers who are in difficulty or are having problems selling theirproperty. It allows local authorities to regain a property which canthen be re-let, but it is doubtful if many authorities would do this forsuch high-risk properties, which is one reason why Glasgow haschosen to demolish its tower stock. Alternatively, individuals couldseek a cash buyer or someone who would see it as an investmentproperty, as an investor may take a different view of the risks posed.
However, there are too few houses in Southeast England, and thusforced high house prices, meaning ordinary working families areunable to afford to live near their work and have to commute,sometimes for hours, to get to work. Local councils are increasinglyasking for a higher percentage of ‘social’ or ‘affordable’ housing in alldevelopments, up to 40–50% from some councils.
Developers reap less profit from social housing and are veryreluctant to build more than the minimum they can get away with.
Roaf_Ch11.qxd 29/10/04 6:58 PM Page 263

264 Adapting Buildings and Cities for Climate Change
In April 2003, London Mayor Ken Livingston threatened to blockBroadway Malyan’s 50-storey apartment block in Vauxhall as its 25%affordable homes was insufficient.iii He has developed a formula,dubbed the ‘Kenculator’, that responds to a range of factors to arriveat a reasonable figure for what numbers of low cost houses, up to50%, should be included in every new development. Developers arereluctant to lose such a substantial percentage of their profits byproviding low cost housing that gives them lower profit levels, andworryingly the architects are lending weight to the developers’arguments by openly doubting if the formula would work. Further, if ahigher percentage of units were social housing then mortgagelenders may be less willing to provide loans to buy such houses dueto their rules of thumb of the proportion of owner-occupiers theyrequire in a block to agree to lend on it.
However, some of the 1960s and 1970s tower blocks are beingrefurbished. Two 15-storey tower blocks on Conway Street, Liverpool,were in such poor condition that they seemed fit only for demolition,but having successfully renovated two similar blocks on Manchester’sWythenshawe Estate one developer saw an opportunity to provideaffordable homes. He bought the two towers for £1 million each andis spending eight times that amount to transform the 1960s towersinto flats with purchase prices starting at £49 500. The difference inthe refurbishment costs estimated by Glasgow’s consultants of£70 000 and the money spent on these blocks begs the question onhow long the refurbishments here will hold and, once they fail, willthese blocks just turn into ghettos again?
i http://society.guardian.co.uk/housing/story/0,7890,565387,00.html.ii http://society.guardian.co.uk/housingtransfers/story/
0,8150,632697,00.html.iii Building Design, 17 April 2003, p. 6.
In 1997 the House of Lords refused a claim by 700 residents of eastLondon who claimed that their television reception had beenseverely affected by the building of Canary Wharf. While the courtaccepted that this did amount to quite severe interference to theirenjoyment of their properties and could reduce their market value,there was still no legal basis to award compensation.i There is,however, hope for such residents who have suffered as the result ofradio and TV wave shadows in that the approach taken by the courtsis regarded as unlikely to survive the introduction of the HumanRights Act.ii If the loss of TV and sound quality from the erection of atall building constitutes ‘severe interference’ to the enjoyment of
Box 11.3 Stealing sound and vision
Roaf_Ch11.qxd 29/10/04 6:58 PM Page 264

Tall buildings 265
NOTES AND REFERENCES
1 Kunstler, J.H. and Salingaros, N. (2001) The end of tall build-ings. At: http://www.peoplesgeography.org/tall.html. See alsoSalingaros, N. (1998) Theory of the Urban Web. Journal ofUrban Design, 3, pp. 53–71. See http://www.math.utsa.edu/sphere/salingar/urbanweb.html.
2 The Empire State Building was the brain-child of John J. Raskob,the vice-president of General Motors, who wanted this newbuilding to exceed the height of the Chrysler Building, stillunder construction, when the plans were released on 29 August1929. The site had previously housed the ‘twin hotel’ ofWaldorf–Astoria (Waldorf Hotel 1893, Astoria Hotel 1897, bothby arch. Henry J. Hardenbergh), both built by the Astor fam-ily and eventually connected by a wide hall. After a fire thebuildings were demolished, a new Waldorf–Astoria built far-ther uptown and the construction of the Empire State Buildingwas started on the site. The excavations for the foundationswere begun on January 1930, work on the steel frameworkin March of the same year, and the building was completedon 11 April 1931.
3 Guardian, 18 October 2003, p. 20.
4 Independent, 28 October 2003, p. 9.
5 CABE is the Commission for Architecture and the BuiltEnvironment – whose stated aim is ‘inspiring people to demandmore from their buildings and spaces’. CABE’s home pagestates:
We believe that well designed homes, streets, parks, work-places,schools and hospitals are the fundamental right of everyone. We useour skills and resources to work for a higher quality of life for peo-ple and communities across England, with particular concern for those
properties then it does indeed constitute a ‘material consideration’and councils are obliged by law to consult with those so affected inthe planning process. So perhaps the residents affected could sue thecouncils for failing to meet their statutory obligation to consult with allthose who will in future be affected by a development.
i All England Law Reports: 1992, p. 426; Hunter v. Wharf, available from:http://www.lib.nus.edu.sg/linus/96oct/llbcdnew.html.
ii Guardian, Money, 16 February 2002.
Roaf_Ch11.qxd 29/10/04 6:58 PM Page 265

266 Adapting Buildings and Cities for Climate Change
living in deprived areas. We do this by making the case for change,gathering hard evidence, providing education opportunities andthrough direct help on individual programmes and projects.
We motivate those responsible for providing our buildings and spacesto design and develop well. We demonstrate to those clients thatinvestment in excellence will pay back many times over through amore productive workforce, more contented customers and a healthierbottom line.
6 Building Design, 9 May 2003, p. 1.
7 Building Design, 25 April 2003, p. 4.
8 Building Design, 25 April 2003, p. 4.
9 http://www.london.gov.uk/view_press_release.jsp?releaseid�
210.
10 Building Design, 6 July 2001.
11 Building Design, 5 October 2001.
12 Building Design, 22 July 2001.
13 Building Design, 6 July 2001.
14 Building Design, 6 July 2001.
15 Building Design, 6 July 2001.
16 Guardian, 3 November 2003, p. 16.
17 Guardian, 21 June 2003, p. 28.
18 www.corenetglobal.org/pdf/learning/9_11_impact.pdf.
19 Newman, O. (1973) Defensible Space. London: TheArchitectural Press.
20 Alexander, C. et al. (1977) A Pattern Language – Towns,Buildings, Construction. New York: Oxford University Press,pp. 114–19, 468–76.
21 Rudge, J. and Nicol, F. (2000) Cutting the Cost of Cold:Affordable Warmth for Healthier Homes. London: E&FN Spon.
22 Blake, P. (1974) Form Follows Fiasco: Why Modern ArchitectureHasn’t Worked. Boston: Little, Brown. See also an interestingdiscussion around the subject on: http://www.geocities.com/Athens/2360/jm-eng.fff-hai.html.
23 Meir, I., Etzion, Y. and Faiman, D. (1998) Energy Aspects ofDesign in Arid Zones. J. Blaustein Institute for Desert Research,Ben-Gurion University of the Negev, p. 115.
24 Al-Sharif, L. (1996) Lift and escalator energy consumption.Proceedings of the CIBSE/ASHRAE Joint National Conference,Harrogate, pp. 231–9.
25 Meir et al. Energy Aspects of Design in Arid Zones, p. 115.
26 Krier, L. (1984) Houses, Palaces, Cities. New York, St Martin’sPress.
Roaf_Ch11.qxd 29/10/04 6:58 PM Page 266

27 Littlefair, P. (1998) Solar access, passive cooling and micro-climate in the city: the polis project. Proceedings of EPIC 98,the 2nd European Conference on Energy Performance and IndoorClimate in Buildings. Lyons, p. 984. See also the solar ordinancesof Boulder Colorado, 1991, on: http://www.sustainable.doe.gov/municipal/codtoc.shtml. The City of Boulder’s solar access ordi-nance guarantees access to sunlight for homeowners andrenters in the city. This is done by setting limits on the amountof permitted shading by new construction. A solar access per-mit is available to those who have installed or who plan toinstall a solar energy system and need more protection than isprovided by the ordinance. For new developments, all units thatare not planned to incorporate solar features must be sited toprovide good solar access. They must also have roofs capableof supporting at least 75 square feet of solar collectors perdwelling unit. Non-residential buildings have similar requirementsfor siting. When applying for a building permit, a simple shadowanalysis must be submitted to the City’s Building Department.
28 Meir et al. Energy Aspects of Design in Arid Zones, p. 116.
29 Viljoen, A. and Bohn, K. (2000) Urban intensification and theintegration of productive landscape. Part One, ProceedingsWorld Renewable Energy Congress VI. Oxford: Elsevier Science,pp. 483–8.
30 RIBAWorld, Issue 231–232, Friday 23 August 2002, 16:17:10�0100 [email protected].
31 Blake, Form follows Fiasco, p. 150. See also http://www.peoplesgeography.org/tall.html.
32 Meir et al., Energy Aspects of Design in Arid Zones, p. 115.
33 Lawson, T. (2001) Building Aerodynamics. London: ImperialCollege Press.
34 See Geiger, R. (1965) The Climate Near the Ground. Cambridge,MA: Harvard University Press; Oke, T.R. (1978) Boundary LayerClimates. London: Methuen & Co.; Penwarden, A. and Wise,D. (1975) Air Flow around Buildings. Garston, Watford: BuildingResearch Establishment Digest.
35 Building Design, 9 May 2003, p. 3.
36 Guardian, 18 October 2001.
37 More results from www.bizjournals.com.
38 http://www.helio-international.org/Helio/anglais/reports/newzealand.html.
39 Robertson, G. (1992) A case study of Atria. In Roaf, S. andHancock, M. (eds) (1992) Energy Efficient Building: A DesignGuide. Oxford: Blackwell Scientific.
Tall buildings 267
Roaf_Ch11.qxd 29/10/04 6:58 PM Page 267

40 Bordass, B. (1990) Appropriate methods and technologies fornew build and refurbishment: offices. Global Responsibilitiesof Architects. London: RIBA Publications.
41 Building Design, 5 October 2001.
42 For a detailed analysis of this event and its implications for thefire hazards posed by tall buildings see http://www.iklimnet.com/hotelfires/meridienplaza/html.
268 Adapting Buildings and Cities for Climate Change
Roaf_Ch11.qxd 29/10/04 6:58 PM Page 268

The future of such energy-profligate buildings as skyscrapers islimited because we simply no longer have enough energy to runthem. We now have to start designing and planning for the build-ings to house us in the Post Fossil Fuel Age.1
The huge structural cracks already opening up in the fossil fueleconomy are reflected in the 2003 White Paper on Energy Policyput out by the UK Department of Trade and Industry, the key aimsof which were to:2
● Put the UK on a path to cut the its carbon dioxide emissions –the main contributor to global warming – by some 60% by about2050 with real progress by 2020.
● Maintain the reliability of energy supplies.● Promote competitive markets in the UK and beyond, helping to
raise the rate of sustainable economic growth and to improveour productivity.
● Ensure that every home is adequately and affordably heated.
The fact is that oil and gas resources are finite, outputs of bothare plateauing and will subsequently fall, and global demand isincreasing. It is the gap between the fossil fuels we use, and theexponential rise in this demand for energy, that is already result-ing in the energy insecurity that will be a hallmark of life, in allcountries, over the next decades.
The other problems are that the emissions of greenhouse gasesarising from our burning of fossil fuels are driving climate changeand must be reduced dramatically if we are to have any chanceof stabilizing the changing climate, and avoiding the $150 barrel!
OIL
Current estimates of how much oil we have left range from 30 to40 years, but the nature of oil reserves, exploitation and reporting isvery complex.3 Colin Campbell gives some insight into the complexity
12 THE FOSSIL FUEL CRISIS
Roaf_Ch12.qxd 29/10/04 6:59 PM Page 269

of the forces at play in the industry in his very interesting piece called‘The Heart of the Matter’,4 and his many published works offer afuller outline of the mechanics of the oil supply industry.5
Since the futurologists of the 1970s oil crisis began to warn usof ‘the end of oil’ based on estimates from fairly crude field sur-veys, the industry has become very proficient in identifying poten-tial oil fields, locating, quantifying and exploiting them with extremelysophisticated equipment and technologies. The industry can nowidentify the ‘needle in a haystack’6 and high levels of confidenceare placed in the validated figures they come up with.
HOW MUCH OIL LEFT IS THERE?
There are two kinds of commonly defined sources of oil and gas:
● Conventional – which is considered, roughly, to be all thesources that are not:
● Non-conventional:– Oil from coal and ‘shale’ (immature source rock)– Bitumen and extra-heavy oil (�100 API)
270 Adapting Buildings and Cities for Climate Change
19000
1
2
3
4
5
6
7
8
9
10HC
PopulationHC model 1996–2200 = 3100 Gboe(1900 Gb + 12 000 Tef)
HC prod. 1900–95 = 1020 Gboe (800 Gb+ 2200 Tcf)
Population modelPopulation dataHC per capitakboe/yr/inhab.
Po
pu
lati
on
(b
n in
hab
.), H
C p
rod
uct
ion
Gb
oe/
yr d
ivid
ed b
y 5
and
HC
per
cap
ita
kbo
e/yr
/inh
ab.
1920 1940 1960 1980 2000 2020
HC per capita
Year
2040 2060 2080 2100
Scenario of world’s population and hydrocarbons (liquids + gas) production: 1900–2100
12.1.Increases in the world population, coupled with the decrease from now on of fossil fuel availability will cause energyprices to skyrocket. (Abbreviations: Gb � billion barrels; Gboe � billion barrels oil equivalent; Tcf � trillion cubic feet (5.5 Tcf � 1 Gboe); HC � hydrocarbons). (Source: www.energy crisis.com)
Roaf_Ch12.qxd 29/10/04 7:00 PM Page 270

12.2.Image from the cover of ColinCampbell’s book The Essence ofOil and Gas Depletion.5 Campbellwas the first to highlight theglobal problem of ‘Peak Oil’ andalert the world to the comingenergy crisis that he nowbelieves may occur as soon as2008. (Source: Bill Hughes, Multi-Science Publishing Co.,Brentwood, Essex)
The fossil fuel crisis 271
30
20
10
01930 1940 1950 1960 1970
MEast
Other
RussiaEuropeUS48
1980 1990 2000 2010 2020 2030 2040 2050
US48 Europe Russia Other MEast Heavy Deepwater Polar P-NGL
Oil
and
nat
ura
l gas
liq
uid
s (G
b/y
r)
12.3.Showing the available global fossil fuel reserves (2003) and indicating how badly off the United States and Europe are inrelation to their dwindling stocks (Gb � billion barrels). (Source: www.peakoil.net)
Roaf_Ch12.qxd 29/10/04 7:00 PM Page 271

– Heavy oil (10–17.5 API)– Polar oil and gas– Deep water oil and gas (500 m depth)7
There are some 20 000 conventional oil fields around the globe.Technical estimates of the size of a field are relatively constantalthough they evolve as knowledge grows. These confidential esti-mates are tested by drilling, and a plan for the exploitation of afield then developed. Oil companies report estimated reserve sizes,but are prudent in typically underestimating them to ensure investorsare impressed by the rising outputs from a field. The process ofreserve reporting is a finely balanced one, and one that is easy toget wrong, as both BP and Shell know to their detriment. In 2001BP Chief Executive Lord Brown announced that output would beonly 3% up on the previous year rather than the 5.5% growthpromised. This was the third time he had slashed his estimates ina single year and he personally lost considerable market credibilityin having to do so8 and in January 2004 came the astounding newsthat Shell was downgrading its known reserves by 20%, a shock-ing admission that led to a rapid fall in its price on the markets.
In reality, the reserves in any field are finite and output from oilfields roughly follows a bell-shaped curve with a plateau that repre-sents the peak output of that field. One of the great challenges overthe past decades has been to develop technologies that were ableto get as much of the available oil out of the ground as possible and
12.4.Annual recorded and predictedglobal oil production ofconventional and non-conventional liquid gas and oilliquids production from 1925 to2125 (Gb � billion barrels). Notewhen production ‘peaks’.(Source: www.energycrisis.com/)
272 Adapting Buildings and Cities for Climate Change
World liquids production: ultimate 2000 Gbconventional + 750 Gb non-conventional
30
01925 1950 1975
Pastproduction
Conventional + non-conventional
Conventional
2000 2025
Year
2050 2075 2100 2125
5
10
15
20
25
An
nu
al p
rod
uct
ion
(G
b)
Gas liquids
Non-conventional
Roaf_Ch12.qxd 29/10/04 7:00 PM Page 272

enormous advances in extraction methods have taken place. However,it is unrealistic to expect that new technologies will release vastamounts of new conventional oil.9,10,11
A further major problem arises because the majority of the remain-ing reserves of oil are located in areas of the world where demandis not greatest, as in the Middle East, Eurasia, Africa and LatinAmerica. Half of what remains lies in five Middle Eastern countries:Abu Dhabi, Iran, Iraq, Kuwait and Saudi Arabia. At some point whenthe gap between supply and demand has ceased to be cushionedby these swing states contributions, and the gap between whatwe can produce and what we need yawns, the market will react,probably in proportion to its preparedness for that transition. Theresult may well come in the form of oil shocks, not in a gradualdecline in supply as Bartsch and Muller predicted in 2000:12
It is not that we will not have enough oil to take us to 2020 but that theroad is likely to be bumpy and subject to a number of economic and polit-ical shocks.
Another real problem for Western users is the location of the oilreserves geo-politically. The United States in particular is havingproblems exerting sufficient influence to stabilize and secure theoil production and transport facilities it would ideally want. The civiland political forces in Latin America, Asia, the Middle East andAfrica have proved difficult to overcome, even for a super-power.
GAS: ‘THE NEW OIL?’
Reserves of natural gas are far more abundant than those of oilbut it is a far more mobile material, which means it leaks from itstraps. More of it is recoverable from reserves than oil, around 75%,and its depletion profile gives a constant supply over a long periodbefore coming to an abrupt end, when production plummets andprices soar.
It is also much more difficult to model gas depletion, because itsprofile is dictated more by market forces than by the immutablephysics of the reservoir. The middle point in production is estimatedby Campbell to come at around 2020. The United States, and in thenot too distant future, Canada, are facing chronic gas shortfalls.Europe faces the same general future but has the advantage ofbeing ably to tap, by pipeline, into the reserves of the Middle East,the former Soviet Union and North Africa, politics permitting.
Britain is predicted to have around 3 years’ supply left, but insuf-ficient to meet its own total demands. In November 2003 the firstflow of gas into the UK via the gas interconnector pipe from Belgiumoccurred, accompanied by a sharp hike in the cost of UK gas (by up
The fossil fuel crisis 273
Roaf_Ch12.qxd 29/10/04 7:00 PM Page 273

to 10% higher than the weeks before), making prices for naturalgas in the UK some of the highest in the developed world. Beforethat the interconnector had been supplying gas to the Continent,at a time when UK prices were, even then, more than a third higherthan the equivalent elsewhere in Europe.13
Gas is a ‘cleaner’ fuel, emitting less carbon dioxide per unit of‘delivered’ energy produced, and hence politically a more popularfuel for the generation of electricity than coal or oil. It is also mainlylocated in politically interesting territories.
In November 2003 Shell signed a historic deal to explore a regionof Saudi Arabia for gas. Shell’s stated belief is that gas will over-take oil as the primary source of energy in the world, and alreadygas is playing an increasing role in meeting the world demand forenergy. It will overtake oil some time after 2020 as the ‘preferred’fuel,14 although no doubt through necessity rather than actualpreference.
However, gas supplies are decreasingly secure as UK importsof gas grow to meet growing demands and dwindling suppliesfrom UK sources. A £5.8 billion plan to develop Norway’s OrmenLange gas field, to be operated by Shell, will, the UK governmentclaims, ‘secure’ UK’s long term supplies via a 1200 km pipeline to
274 Adapting Buildings and Cities for Climate Change
12.5.Produced and predicted oil and gas reserves for the UK (mmboe � million barrels oil equivalent). (Source: UK Departmentof Trade and Industry, via www.peakoil.net)
Roaf_Ch12.qxd 29/10/04 7:00 PM Page 274

Easington in Yorkshire.15 This field is structurally difficult and expen-sive to tap and extract,16 with questions over the reservoir qualityof the gas according to Norsk Hydro, who are developing the field.17
Putting lots of British eggs in this particular gas basket is not arisk-free stratagem for the UK government.
There are a number of new developments in the area of reduc-ing pollution from related generation. Although CO2 sequestrationtechnologies are coming on line that will reduce the greenhousegas emissions from gas plants, particularly carbon dioxide, theywill actually require 10–20% more energy to produce the sameamount of electricity as a result, so here we have the question ofwhether it is more acceptable to reduce climate change emissionsand use our dwindling reserves of fossil fuels more rapidly, or thereverse.18
ENERGY WILL COST MORE
An inevitable result of such factors will be increasing prices forconsumers of oil and gas. In December 2003 came the news thatBritish Gas were going to start to raise gas and electricity pricesfor its 15 million consumers by 5.9% from 10 January 2004, blam-ing the sharp rises in wholesale prices and the growing costs ofmeeting green targets. Powergen’s prices were set to rise by 6.9%for gas and 4.9% for electricity.19 Similar rises were also beingintroduced by Scottish Power and Scottish and Southern Electric.Wholesale gas prices rose by 15% in 2003 and a further 21% risewas predicted for 2004. The cost of electricity rose by 15% in2003 with a predicted rise in 2004 forecast at 17%. Opponentsof the rises criticized the hikes saying that the significant reduc-tions in wholesale prices over the past few years had not beenpassed on to the consumers.20
Price hikes most affect the numbers of people in fuel poverty,those who spend more than 10% of their net income on energy.Almost 70 000 homes in the UK were disconnected in 2001, 2002and 2003. The numbers in fuel poverty halved between 1996 and2001 from 5 million to 2.5 million, a million of which could beattributed to falling prices. But it does not take a great increase inprices to switch someone back into fuel poverty. The UK govern-ment has a policy to end fuel poverty by 2010 for the vulnerableand by 2016 for all. This seems an ambitious target in the face ofalready rapidly escalating prices.
Price increases are also being driven by the need to maintain andmodernize power distribution networks to enable more renewablesto be included in supplies and to prevent the power outages thathave become increasingly common over the past years. In fact the
The fossil fuel crisis 275
Roaf_Ch12.qxd 29/10/04 7:00 PM Page 275

infrastructure of the privatized and publicly owned energy indus-tries around the world is weakening as plant comes to the end ofits life and maintenance practices slip.
The impact of such neglect was demonstrated in 1998 when anexplosion ripped through Esso’s natural gas plant in the southernAustralian state of Victoria, killing two workers, injuring eight othersand shutting off energy supplies throughout the state for at leasta week. One union official confirmed that the number of mainte-nance workers at the 30-year-old plant had been halved over thepast six years, and cited this as a possible contributory factor tothe explosion.21 Such accidents could cripple whole regions forlong periods.
Such neglect is evidenced not only by the widespread poweroutages in August 2003 but also by the unprecedented loss of sup-plies of gas which occurred in the UK on 17 and 18 June that wereblamed on maintenance problems at the Bacton import terminal inNorfolk.22
COAL
There are sufficient reserves of coal left to last for over 200 years.Coal currently provides only 26% of the world’s primary energyconsumption, very much less than in 1950 when this figure was59%. There are abundant reserves of coal in the ground, estimatedto be capable of lasting over 200 years. Over 50% of the reservesare in the United States, China and Russia. The coal industry doeshave the additional problems of poor working conditions in somemines and the high costs of transport for the fuel. In France it isexpected that all mines will be closed by 2005.
The main problem with coal now is that it is a dirty fuel and con-tributes 38% of CO2 emissions from commercial fuels. It is also amajor source of sulphur dioxide and nitrous oxide emissions as wellas particulates and other emissions. The UK government struggledto find ways of accommodating the EU’s Directive on sulphur emis-sions, which threatened the future of Britain’s coal industry. OtherEuropean sources of coal have a lower sulphur content (Britain’scoal is dirtier) and therefore could comply with the directive.
Under the Directive the UK would have to reduce sulphur diox-ide emissions 575 000 tonnes per annum, the bulk of which wouldcome from the electricity industry. The impact of these savings wasseen to be to close much of the UK coal industry, posing a furtherreal threat to the security of energy supply. The solution discussedwas to further tighten up on emissions control from power stationchimneys, but the government’s only public comment on the issuewas to state that they would go for the lowest cost option for
276 Adapting Buildings and Cities for Climate Change
Roaf_Ch12.qxd 29/10/04 7:00 PM Page 276

industry to solve the problem, implying that national security of sup-ply to them was not high on the list of priorities when making suchdecisions.23
NUCLEAR POWER
Nuclear energy at present provides around 25% of the electricitysupplied in the UK and is claimed not to contribute to atmosphericCO2, although such claims do not take into account the energycosts of the buildings and transport associated with the industry.
The ageing and fragile nuclear power industry is on its way outin Britain and has, worryingly, been sold off in part to Americanbuyers.24 The UK plants are leaking, poorly maintained and theproblem of what to do with the radioactive waste from the plantshas not been solved.
Another major problem with nuclear power is that it is too expen-sive to produce. The UK government, or more accurately the peo-ple of Britain, have been bankrolling the industry for decades, tothe tune of billions of pounds over that time. In September 2003,British Energy, the nuclear power generator, close to bankruptcyhaving been bailed out to the tune of £650 million by the govern-ment, suffered further heavy financial losses due to shutdowns attwo power stations. The company produces 20% of UK electricity.A problem at Sizewell B in Suffolk in 2003 resulted from leakagesfrom two welds in the generator. The other shutdown was atHeysham 1 plant in Lancashire, caused by a failure in a sea-watercooling pipe in the plant’s turbine hall,25 and lasted well over amonth. Friends of the Earth said at the time, ‘This is a classic exam-ple of why a future based on nuclear power is a bad idea’. The hugepower supply outage would have to be replaced by dirty coal asgas prices are already too high to compete with the coal poweredstations.26
Nuclear energy suffered another major setback when BritishNuclear Fuels announced that it was to close its Sellafield’s ThermalOxide Reprocessing Plant (THORP) on the 25 August 2003. It wasestimated that there would be around £3 billion worth of cleaningup to be completed to make the site safe. It was opened in 1994and was expected to close in 2010, two years before the proposedclosure of a much older reprocessing works, built in the 1950s bythe Ministry of Defence to separate plutonium for nuclear weapons.This latter plant will stay open until 2012, when all the old Magnoxnuclear power stations, which currently produce 8% of the UK’selectricity, are closed. All these stations are currently running at aloss but are needed to keep the lights on.27 The Sellafield site wascondemned as ‘unsafe’ to occupy in August of 2003, due to the
The fossil fuel crisis 277
Roaf_Ch12.qxd 29/10/04 7:00 PM Page 277
poor condition of buildings and the leaking of highly polluted waterand radioactivity from the structures.28
Although it was claimed that the widespread blackouts aroundthe world in the summer of 2003 meant that the UK governmentwas forced to reconsider the role of nuclear energy in terms ofprovision of high levels of energy supply, limited greenhouse gasemissions and the need to keep lights on,29 climate change hasalready proved to be threatening the proper operation of the Frenchnuclear power stations because of lack of cooling water for theplants.
In France in August 2003 the scorching temperatures causedthe nuclear plants to overheat and then have to be shut down. Ina plant in Fessenheim, near Strasbourg, staff were forced to hosedown the building to cool it as temperatures rose to 48.5 �C, only2 �C below the point at which an emergency shutdown would betriggered.30
As temperatures across France continued at 40 �C for the sec-ond week running French nuclear plants were granted permissionlate in August to pump their cooling water into the nearby riversat higher temperatures than usual to allow them to continue gen-erating electricity. Demand for electricity soared as people turnedup the air conditioning and fridges and rushed out to buy fans. In some regions river water levels dropped so low that the vitalcooling processes in the stations had become impossible, whilewater temperatures downstream of the cooling process exceededenvironmental safety levels.
That the UK cannot rely on French supplies to tide it over in dif-ficult periods was then demonstrated during the heat of Augustwhen, in an attempt to conserve energy for the nation, France,Europe’s largest energy exporter, cut its power exports by morethan half on 12 August 2003, causing a shortfall in supplies to theUK.31 This is another indication that cross-border dependency onfuel leads to insecurity of power supplies.
It is difficult to see nuclear power playing the role of the fairygodmother for our extravagant lifestyles either, although it maywell plug the energy gaps as we get used to doing more withless and as new solutions come online. Already, the UK Governmenthas delayed the decommissioning of some older stations by fiveyears, to give them more time to achieve their targets on green-house gas emissions, but no new UK stations are planned. Thisis part of a global trend, with Germany having committed to phas-ing out their nuclear industry within 20–30 years. However withthe approaching oil crisis the UK government may well have toreview this policy. It is difficult to see how we will cope withoutnuclear power, but selling off the nuclear industry to the highest
278 Adapting Buildings and Cities for Climate Change
Roaf_Ch12.qxd 29/10/04 7:00 PM Page 278

bidder can cause problems in the future when the high costs ofthe plant have to be recouped. Cutting corners can have catastrophicimpacts in this industry. On 15 April 2003, Tokyo’s main power com-pany, Tokyo Electric Power Co (Tepco) shut down the last of its 17nuclear reactors for safety checks after a series of accidents andscandals concerning lax safety procedures. Tepco was ordered tosuspend operations for a safety review after it was found to behiding structural problems in the plants and obstructing governmentinspections.32 The shutdown caused serious problems becauseTepco produces around 40% of the power used in the Tokyo area,and about 30% of Japanese energy overall is nuclear.
Countries that have abandoned nuclear power include Italy,Denmark, Ireland, Greece, Luxembourg and Portugal. Constructionof nuclear plants has stopped in Spain. However, most of the world’sbig industrial powers still rely, to a greater or lesser extent, on elec-tricity generated by nuclear reactors, including the United States,Russia, Britain, Japan and France. Whether this is a judicious moveor not is open to question and Sweden, which made great play ofthe fact that it was going to close down its nuclear plants, soonfound out that it would have to import electricity from dirty coalplants in Denmark and has subsequently reversed its policy.
RENEWABLE ENERGY
The advantage of renewable energy is that it is infinite. Add tothat the clean energy it produces, and the fact that people nowwant it. The UK Energy policy has established outline targets forthe production of 20% of energy from renewables by 2020, andto achieve these targets we will have to integrate solar and windgenerators into buildings, as well as locating them in the coun-tryside. This means a revolution in the way we supply energy inthe UK, because if we are to do this then it will be necessary tore-engineer the UK energy supply network to accept contributionsfrom millions of small power stations instead of a hundred largeones. The only solution is to rewire Britain.
Hydro power
Hydro power is currently the world’s largest renewable source ofelectricity, accounting for 6% of worldwide energy supply or about15% of the world’s electricity. In Canada, hydroelectric power isabundant and supplies 60% of the electrical needs. Traditionallythought of as a cheap and clean source of electricity, most largehydro-electric schemes being planned today are coming up againsta great deal of opposition from environmental groups and native
The fossil fuel crisis 279
Roaf_Ch12.qxd 29/10/04 7:00 PM Page 279
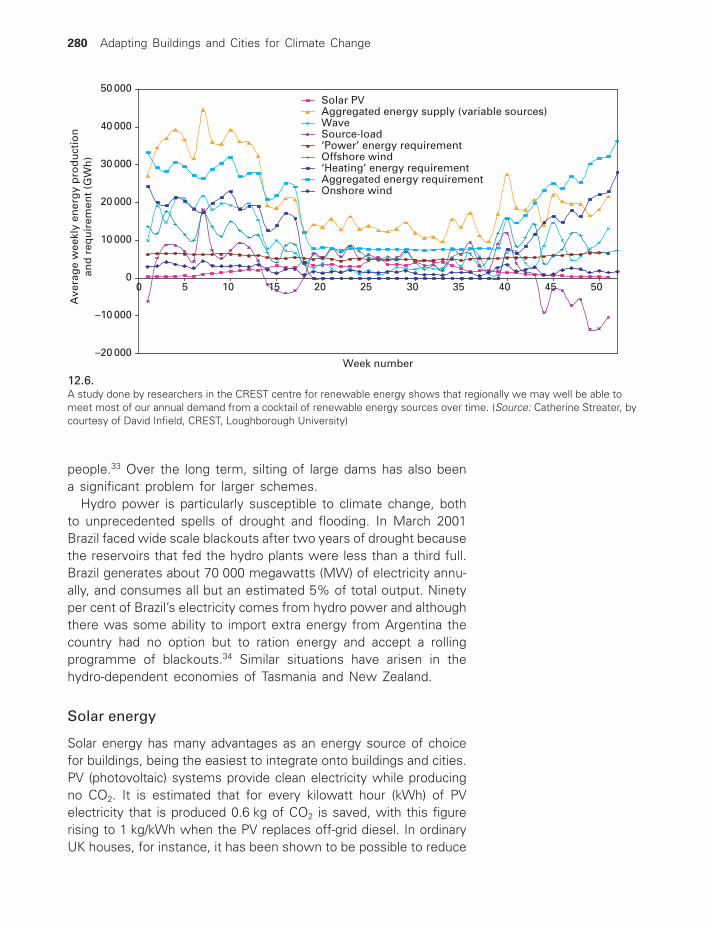
people.33 Over the long term, silting of large dams has also beena significant problem for larger schemes.
Hydro power is particularly susceptible to climate change, bothto unprecedented spells of drought and flooding. In March 2001Brazil faced wide scale blackouts after two years of drought becausethe reservoirs that fed the hydro plants were less than a third full.Brazil generates about 70 000 megawatts (MW) of electricity annu-ally, and consumes all but an estimated 5% of total output. Ninetyper cent of Brazil’s electricity comes from hydro power and althoughthere was some ability to import extra energy from Argentina thecountry had no option but to ration energy and accept a rollingprogramme of blackouts.34 Similar situations have arisen in thehydro-dependent economies of Tasmania and New Zealand.
Solar energy
Solar energy has many advantages as an energy source of choicefor buildings, being the easiest to integrate onto buildings and cities.PV (photovoltaic) systems provide clean electricity while producingno CO2. It is estimated that for every kilowatt hour (kWh) of PVelectricity that is produced 0.6 kg of CO2 is saved, with this figurerising to 1 kg/kWh when the PV replaces off-grid diesel. In ordinaryUK houses, for instance, it has been shown to be possible to reduce
280 Adapting Buildings and Cities for Climate Change
–20 000
–10 000
0
10 000
20 000
30 000
40 000
50 000
0 5 10 15 20 25 30 35 40 45 50
Week number
Ave
rag
e w
eekl
y en
erg
y p
rod
uct
ion
an
d r
equ
irem
ent
(GW
h)
Solar PVAggregated energy supply (variable sources)WaveSource-load‘Power’ energy requirementOffshore wind‘Heating’ energy requirementAggregated energy requirementOnshore wind
12.6.A study done by researchers in the CREST centre for renewable energy shows that regionally we may well be able tomeet most of our annual demand from a cocktail of renewable energy sources over time. (Source: Catherine Streater, bycourtesy of David Infield, CREST, Loughborough University)
Roaf_Ch12.qxd 29/10/04 7:00 PM Page 280

CO2 emissions by up to 60% with energy efficiency measures, butusing photovoltaics (PVs), solar hot water and passive solar systems,90% reductions in emissions can be achieved, enough, in the viewof the Royal Commission on Environmental Pollution, to stabilizeclimate change,35 if such reduction were achieved across thebuildings board.
The energy supply is located at the point of demand so thereare little or no losses incurred in transporting the electricity, andtherefore enhancing security in the supply. PVs can supply elec-tricity to locations remote from a traditional grid. PV electricity sup-ply can be isolated from the grid supply and so provide a reliableback-up at periods of grid failure. This factor is already importantbecause over 3 billion people today are connected to conventionalelectricity supply systems and PVs offer the opportunity for themto have such back-ups when the power fails, although the con-nection mechanisms are not well developed to achieve this yet.Thus solar energy will become increasingly important as conven-tional grid supplies become less reliable.
In many parts of the world brown-outs (reductions in voltage thatdim the lights) and blackouts already occur at the times of day whenpower is most needed. An example of this is in hot countries whenthe surge of demand on hot summer afternoons means that black-outs shut down air conditioning systems. In sensible low energybuildings cooling may be easily achieved with PV-powered ceilingfans or passive cooling, so making buildings, in many climates, com-fortable again. PV systems cannot run large air conditioning systems,although great advances have been made in the field of solar cool-ing. Solar systems are quiet, robust and require little maintenanceor repair. They often actually form part of the building skin itself, soreducing the cost of installation. When properly integrated into abuilding, solar systems can also perform other functions, such asrain screen cladding, roofing, sun shades, covered walkways, brise-soleil, roof tiling systems or solar slates, and PV generation systemson motorway barriers. PVs often have few or no moving parts, andso are potentially very durable systems. There are many knock-oneffects that may be important in a changing climate, such as thefact that a solar roof is ‘slippier’ than one of conventional construc-tion so may not have to be so steeply pitched in areas vulnerableto heavy snowfall, making large construction savings. Also, becauseeach slate is attached to the roof with firm fixings, it is less vulner-able to storm damage than some common roofing systems.
PV systems actually become less efficient as temperatures riseabove their test condition temperature of 25 �C and so althoughthey will respond well to more solar radiation they do not performwell during heat waves.
The fossil fuel crisis 281
Roaf_Ch12.qxd 29/10/04 7:00 PM Page 281

Recent work has shown that in fact Britain is very well suited forsolar technologies and will increasingly be so because of the pre-dicted rise in solar availability and intensity with climate change.Domestic solar PV systems could save half the annual energy needsfor an individual home, for an average saving of £100 a year, saysthe UK Energy Saving Trust. PV systems can generate up to 25%of a home’s total energy requirements over winter months.36
Wind power
Wind energy has become a major player in the energy generationfield and will become even more so with a planned increase inwind markets over the coming years. On 18 December 2003, theDepartment of Trade and Industry and the Crown Estate announcedthat 12 successful developers have been offered 15 site leases,with a potential combined capacity of 5.4 to 7.2 GW of offshorewind energy.37 New wind farms should provide enough power forabout one in six British households by 2010, and will help to meetthe renewable target of 10% of UK energy from renewables bythat date. The government hopes Britain will get 20% of its elec-tricity from renewables by 2020 and not only are the power com-panies enthusiastic about the boost for wind power but also thegovernment predicts that local communities will also benefit as itis estimated that the manufacturing of the wind turbines, the con-struction and maintenance of the off-shore wind farms would employabout 20 000 people.38
Large firms with little experience in energy generation are alsogetting in on the market. BT, the Telecoms group, is consideringplans to build wind turbines on its own land and invest in otherrenewable energy schemes in an attempt to meet its own targetsfor reducing greenhouse gases. The company believes that unlesssomething drastic is done the (self-imposed) target of 10% fromrenewables by 2010 will not be met; action is needed promptlyto counter the shortage of capacity in production of renewableenergy.39 The government needs a huge shake-up in the way itapproaches the renewable energy sector, including more publicfinance, according to a Report in October 2003, commissioned byBritish Telecom (BT) from Forum for the Future, a sustainable devel-opment charity. The Forum recommended that BT commission adetailed audit of its buildings and land to see where it would befeasible to install its own on-site renewable energy generating facil-ities, and urged BT to investigate the potential for investment inthe renewable technology sector, one that has grown at a rate of20–30% per annum over the past decade. This is an example ofa major company actually delivering on its own Corporate Social
282 Adapting Buildings and Cities for Climate Change
Roaf_Ch12.qxd 29/10/04 7:00 PM Page 282

Responsibility Commitments and using renewable energy as a highprofile, and cost-effective, means of doing so.40
Domestic wind generation is also coming a step closer, with thedesign of Britain’s first small-scale domestic wind generation unit,which the company who is selling them, Windsave, claims canproduce up to 15% of the domestic needs of an ordinary Scottishhome. The machine is a 3 ft by 2 ft sealed box with three bladesthat face into the prevailing wind and can be attached to the wallsor roof of an ordinary house. It tops up the existing mains supplyand, unlike bigger systems, it cannot sell power back to the grid.The cost of the system is £750 and there are government subsi-dies available for installation of the machine.41
Wind power is popular to UK investors because it has a relativelyquick return on the investment. However, it cannot, in itself, replacefossil fuels because it is very weather-dependent. There is also thereal problem that wind farms are perceived to spoil areas of natu-ral beauty, and this is already resulting in a significant backlash fromthe public. The people of Shetland were delighted when their sin-gle wind turbine was eventually scrapped and such public concernhas also led to the increasing emphasis put in the UK on the devel-opment of the offshore wind potential in these ‘windy Isles’.42
Wave power
The UK has an incredibly long coastline. Just one Scottish county,Argyll and Bute, has a longer coastline than the whole of France.While wave power is weather-dependent (though less subject tothe short-term vagaries of weather as are wind and solar), it couldprovide an important source of energy in the future, although thetechnology still has some way to go. Under existing policy andeconomic constraints, there is little to be expected from wavepower over the next decade or two. Perhaps it is the developmentof offshore barrages, still fraught with technical and funding diffi-culties, that holds out the best promise of large-scale wave powercontribution.
Tidal power
Following the oil price crisis in 1976, the government set up theSevern Barrage Committee to assess the feasibility of a tidal bar-rage across the Severn. According to evidence from this Committeeto the Parliamentary Select Committee on Climate Change in March1999, just this one barrage could make a significant contribution.It would cost around £10 000 million to build, but it would pro-duce 6% of the annual electricity demand of England and Wales,
The fossil fuel crisis 283
Roaf_Ch12.qxd 29/10/04 7:00 PM Page 283

and reduce annual greenhouse gas emissions by 16 million tonnes.A more ambitious scheme could generate even more power.
A tidal barrage would create more benign conditions in the Severnestuary and one recent proposal for the Severn estimated that abarrage could lead to 40 000 new jobs in the area. Such a barragecould be operational within 15 years of getting the funding to pro-ceed. A tidal barrage across the Severn could reduce the tidal floodrisk upstream, although measures might be needed to preventexcessive siltation, provide for disposal of effluent from Bristol andCardiff, and safeguard wetland wildlife.
The biggest stumbling block to such a project is the length oftime it would take to pay back the large capital costs, but as pres-sure grows for more ‘clean energy’ sources, the project becomesincreasingly attractive.
Combined heat and power (CHP)
Large-scale CHP plants are usually sized according to the base loadheat demand of the buildings or area they are supplying. Theiroverall efficiency and commercial success depend on the combi-nation of heat transfer efficiency and electrical generation efficiency,and the demand cycles for electricity and heat. Thus, CHP is notnecessarily more efficient than the alternative of stand-alone heatand grid-supplied electricity. CHP is most attractive when the priceof grid electricity is high and fuel for the plant, e.g. gas, is low.
In a fairly revolutionary development the world’s first commer-cially available domestic CHP plant, the ‘WhisperGen’, has beendeveloped jointly with Whisper Tech in New Zealand, and Powergenin the UK. It fits under the worktop in a kitchen, like a dishwasher,and provides hot water like a normal boiler. However, it containsa generator powered by a Stirling engine, which produces elec-tricity from the same gas supply and any surplus electricity will befed back into the National Grid and bought back from consumersby Powergen.43 Some estimate micro CHP systems will power upto 20% of all homes by 2020.
Bio energy
With current technology, for the UK, biomass energy crops arguablyhave the greatest potential of all non-nuclear renewable energy.As less and less farmland is needed for growing food crops, orrearing livestock, more is available for growing biomass. In addi-tion, British Biomass have calculated that there is more than enoughland currently not suitable for conventional agriculture but whichcould be used to grow biomass crops.
284 Adapting Buildings and Cities for Climate Change
Roaf_Ch12.qxd 29/10/04 7:00 PM Page 284

Biomass includes wood, especially willow, or other plants, whichcan be harvested for energy. Forestry and agricultural residues canalso be used. This is an area where UK expertise is world class.Although biomass burning releases carbon dioxide, a greenhousegas, no more is released than is absorbed during growth, or wouldbe released if the material was allowed to rot naturally, so theenergy is virtually carbon dioxide neutral. Experiments by the ForestryCommission on ‘short rotation coppicing’ have shown that biomasscan provide a continuous supply of fuel for small-scale local powerstations. Biomass is much less weather-dependent than, say, windor solar power and, in the short term, biomass planting could givegovernments a further breathing space by acting as a carbon dioxidesink for the purposes of the Kyoto Protocol.
Ethanol
The importance of ethanol (alcohol) is that it can be used to powerpetrol and diesel engine vehicles with minimal modification – justa computer chip in the fuel system and a fuel line made out ofslightly different materials. It is a relatively clean fuel with a higheroctane rating than petrol, but is less of a fire risk, and it can beproduced anywhere plants can be grown. The burning of ethanolresults in release of the carbon trapped by the plant, but this is farbetter than releasing the carbon formerly trapped in fossil fuels formillions of years because it is a truly renewable form of energy,that can be re-grown rapidly year on year, rather than being a finiteresource like oil and gas.
ENERGY FUTURES: THE NEW AGE OF DARK CITIES
In the transition from the fossil fuel age to whatever comes afterit, energy prices will rise and the hardest hit buildings will be thosebuilt in the last half of the twentieth century when energy wasabundant and size of building and energy profligacy were signs ofsuccess. The era of Big is Beautiful has already passed, and aswe saw in Chapter 11, the smart money is already moving out ofbig buildings and out of the hearts of big cities.
You cannot occupy a tall building when the power fails. Youcannot power a tall building on solar energy, but you can powera robust, well-designed, low rise building using renewable energyin Britain. Similarly, you cannot run a HVAC system in a thin, tight-skinned building in a hot country from photovoltaics, but you canrun ceiling fans from them in well-designed passive buildings in thesame climate.
The fossil fuel crisis 285
Roaf_Ch12.qxd 29/10/04 7:00 PM Page 285

We will rapidly have to implement the step changes needed tocreate a 21st century generation of deeply passive buildings, thatcan be run largely on renewable energy supplies, because in set-tlements around the world the lights are already going out. Somesay we are, even now, at the threshold of a new Age of Dark Cities.
NOTES AND REFERENCES
1 Pout, C.H., McKenzie, F. and Bettle, R. (2002) Carbon DioxideEmissions from Non-domestic Buildings: 2000 and Beyond.Garston, Watford: Building Research Establishment and Depart-ment for Environment, Food and Rural Affairs, p. 10. This pub-lication shows that buildings in the UK use around 46% of allenergy produced simply to heat, light, cook and run equipment,without the energy costs of materials and transport being takeninto account.
2 http://www.dti.gov.uk/energy/whitepaper/index.shtml; and see alsohttp://eeru.open.ac.uk/natta/renewonline/rol46/9.htm for informa-tion on UK energy consumption and policies
3 For more on the science of remaining reserves, see the com-panion website http://books.elsevier.com/companions/0750659114 and also the excellent Peak Oil and Energy Crisiswebsites: http://www.peakoil.net/ and http://www.energycrisis.com/.
4 http://www.energycrisis.com/campbell/TheHeartOfTheMatter.pdf.
5 See the following classic works on the subject: Campbell, C.J.(2003) The Peak of Oil: an economic and political turning pointfor the world. In Low, N. and Gleeson, B. (eds), MakingUrban Transport Sustainable. Basingstoke: Palgrave Macmillan,pp. 42–67. Campbell, C.J. (2002) The Essence of Oil and GasDepletion. Brentwood: Multi-Science Publishing. Campbell, C.J.(1997) The Coming Oil Crisis. Brentwood: Multi-Science Publishing.See: also: Youngquist, Walter (1997) Geodestinies: the InevitableControl of Earth Resources Over Nations and Individuals. Portland,OG: National Publishers. Deffeyes, Kenneth (2001) Hubbert’s Peak:The Impending World Oil Shortage. Princeton, NJ: PrincetonUniversity Press. Hoffman, Peter (2001) Tomorrow’s Energy:Hydrogen, Fuel Cells and the Prospect for a Cleaner Planet.Cambridge, MA: MIT Press.
6 Campbell, The Peak of Oil, p. 44.
7 Campbell, The Peak of Oil, p. 45. API stands for AmericanPetroleum Institute; degrees API is an oil-industry term usedas a measure of density.
286 Adapting Buildings and Cities for Climate Change
Roaf_Ch12.qxd 29/10/04 7:00 PM Page 286

8 Observer, Business, 3 November 2002, p. 3.
9 http://www.hubbertpeak.com/deffeyes/. See Deffeyes, Hubbert’sPeak.
10 Campbell, The Peak of Oil.
11 See also www.opec.org.
12 Bartsch, U. and Muller, B. (2000) Fossil Fuels in a ChangingClimate. Oxford: Oxford University Press.
13 Financial Times, 11 November 2003, p. 6.
14 Guardian, 17 November 2003, p. 25.
15 Guardian, 5 December 2003, p. 23.
16 http://www.hydro.com/en/press_room/news/archive/2002_09/ormen_iland_en.html.
17 http://aapg.confex.com/aapg/barcelona/techprogram/paper_83493.htm.
18 Singh, R. (2003) Costing carbon. European Power News, July,London, pp. 23–4.
19 Guardian, 5 December 2003, p. 23.
20 Guardian, 9 December 2003, p. 17 and Guardian, 5 December2003, p. 23.
21 http://www.wsws.org/news/1998/sep1998/gas-s29.shtml.
22 Daily Express, 15 August 2003, p. 2.
23 Guardian, 17 November 2003, p. 25.
24 http://www.guardian.co.uk/nuclear/0,2759,181325,00.html.
25 Guardian, 27 November 2003, p. 22.
26 Guardian, 31 October 2003, p. 32.
27 Guardian, 26 August 2003, p. 1.
28 Guardian, 26 August 2003, p. 4.
29 Guardian, 22 October 2003, p. 22.
30 Guardian 5 August 2003, p. 3.
31 Guardian, 13 August 2003, p. 13.
32 Guardian, 16 April 2003, p. 13.
33 http://www.iclei.org/EFACTS/HYDROELE.HTM.
34 http://eces.org/archive/ec/np_articles/static/98575920040789.shtml.
35 http://www.re-focus.net/news_archive/index.html.
36 http://www.re-focus.net/.
37 http://www.rcep.org.uk/newenergy.html and http://www.dti.gov.uk/energy/renewables/technologies/offshore_wind.shtml.
The fossil fuel crisis 287
Roaf_Ch12.qxd 29/10/04 7:00 PM Page 287

38 http://www.enn.com/news/2003-07-15/s_6554.asp.
39 Guardian, 17 October 2003, p. 24.
40 Roaf, S. (2004) Corporate Social Responsibility. Chapter 4 inClosing the Loop: Benchmarks for Sustainable Buildings.London: RIBA Publications.
41 Guardian, 24 November 2003, p. 5. See: http://www.windsave.com/main.htm.
42 See: http://www.offshorewindfarms.co.uk/ for a full outline ofsites and programmes of development for offshore wind farms.
43 http://www.whispergen.com/.
288 Adapting Buildings and Cities for Climate Change
Roaf_Ch12.qxd 29/10/04 7:00 PM Page 288
In many developing countries it is accepted that ‘brown-outs’ andblackouts will and do occur. This typically happens during periodsof peak electricity demand, which in hot countries are usually inmid-afternoon to coincide with peak air conditioning demand at thehottest times of day and year, and in cold climates in the eveningand mornings, before and after work.
However, in a turnaround, in November 2003 the UK NationalRail Enquiries blamed power blackouts in Britain for their decisionto move 600 call centre jobs to Bangalore, India from Cardiff, Derby,Newcastle and Plymouth. Rail Enquiries claimed that they hadhad ten blackouts in this year alone in the UK and that the Indianelectricity supply network would be more reliable than in Britain.Obviously the fact that Indian workers are paid considerably lessalso played a part in the decision to move the jobs abroad, but thatthe issue of energy insecurity in Britain has become an economicnegotiating card in this fashion is interesting.1
WEATHER-CAUSED OUTAGES
Over the hot summer of 2003, the UK had ‘insufficient systemsmargins’ seven times, that is inadequate reserve capacity to pro-vide a cushion for expectant demand surges, and each time gen-erators stepped in to provide extra power.2 Suppliers paid as muchas £1000 a megawatt-hour one day, on peak tariffs, in the 2003winter as opposed to normal wholesale prices of £17 because theUK energy supply system simply does not have the capacity tocope with severe weather.
A report commissioned by Brian Wilson, the then Minister atthe Department of Trade and Industry, from the independent con-sultants British Power International in May 2002, warned that sev-eral UK companies might not be able to cope with a widespread
13 FUEL SECURITY: WHEN WILL THE LIGHTS GO OUT?
Roaf_Ch13.qxd 29/10/04 7:00 PM Page 289

storm, because a number relied on the same pool of contractorsto provide mobile generators, engineers for overhead lines and thetechnology to handle surges in calls. The contractors would onlybe able to respond to one call at a time and would thus have toleave some areas uncovered if the devastation caused by somestorms was widespread.3 This report came in the wake of thestorms which left more than 20 000 customers of 24Seven, theutility that covers parts of London and East Anglia, without powerfor more than a week, as a result of staff cuts and bad manage-ment, although they claimed that the continuing failures were due
290 Adapting Buildings and Cities for Climate Change
c.3 000 000 BC
A B CD
E
Pre-industrial
c.1930 2025 est.
Ind.
X
Post-industrial
H
I
KL
c.3 000 AD
20 July 1969
G
F
J
13.1.Time for lights out. An image that represents the concerns of many of the public politicians around the world: the impactof per capita consumption patterns over the coming decades. (Source: www.dieoff.org)
1. Pre-Industrial Phase (c.3 000000 BC to 1765)A Tool making (c.3 000000 BC)B Fire used (c.1 000000 BC)C Neolithic agricultural revolution (c.8 000 BC)D Watts steam engine of 1765
2. Industrial Phase (1930 to 2025, estimated)E Per capita energy use 37% of peak valueF Peak energy useG Present energy useH Per capita energy use 37% of peak value
3. Post-Industrial Phase (c.2100 and beyond)J, K, and L � Recurring future attempts at industrialization fail
Other scenarios are possible
Roaf_Ch13.qxd 29/10/04 7:00 PM Page 290

to stronger winds in their region. 24Seven ended up paying over£2 million in compensation to its customers but some of the blamefor cuts was also passed on to the Regulator, who in 1998 placeda price cap on firms making it necessary to introduce cuts for staffand tree maintenance programmes.
Weather-related blackouts are a major cause of outages.Hurricane Isobel in late September 2003 plunged 4.5 million peo-ple in the Washington area into darkness as trees fell onto cablesaround the city.4
Italy experienced power cuts in mid-August 20035 caused bymassive surges in demand due to very hot weather and the unprece-dented use of air conditioning systems.6 The weather was alsoresponsible for the Italian blackouts of 2003, when 57 million peo-ple were plunged into darkness on 28 September. The problemstarted when a tree, uprooted in a storm, tumbled onto a powerline in Switzerland, cutting out 3–4000 MW of supply and settingoff a cascade effect of failures throughout the Italian grid. The impactswere catastrophic:7
● Planes were grounded.● Some 110 trains were halted, some for over 12 hours, with
30 000 travellers on board.● Lifts stuck.● Stores and underground car parks were unable to open their
security gates.● Electric turnstiles failing trapped people in buildings.● Traffic lights failed causing numerous accidents.● Mobile phones failed.● Hundreds of elderly people were hospitalized after falling over
in the dark.● Sales of coffees, food and ice creams worth 50 million euro
were lost.● Frozen food worth 70 million euro spoiled in freezers.● Hospitals ran out of fuel for their emergency generators.● Water pumping systems stopped, causing water supply prob-
lems in cities.● Sewage plants stopped operating causing effluent build ups.
On a smaller scale, the impacts of a local blackout can be just as disruptive, as this anecdotal story shows. When the power failed onemorning in a school in Scotland, no one in the building knew what to do because the emergency plan and all the emergency contactnumbers, parents’ phone numbers etc. were on the computer, so thechildren could not be sent home. The school could not supply lunchbut the children had used their lunch money to top up their magneticswipe cards, which they would normally use to buy lunch, so theycould not even go to the shops for a sandwich. They all had to leave
Fuel security: when will the lights go out? 291
Roaf_Ch13.qxd 29/10/04 7:00 PM Page 291

the school buildings because the fire alarm had no battery back up,and so they stayed in the playground for hours until the electricity wasfixed. Here the weather was good but imagine what would have hap-pened in a storm! Our dependence on electricity is so pervasive thatnothing seems to function if the power fails nowadays.
SYSTEM FAILURE
The UK’s biggest power cut in 25 years hit large parts of Londonin the early evening of 28 August 2003. The 37 minute blackoutwas caused by the failure of a single piece of sophisticated equip-ment that shut down when power surged through it. There wasalso a problem with a transformer in Kent and further blame forthe severity of the blackout – which involved the loss of 20% ofthe capital’s power – was levelled at the slow response time ofFrance’s EDF electricity grid company, in responding to the surgein demand.8 This in its turn was caused by the high demand expe-rienced in France due to very hot weather and the poor perfor-mance of the nuclear reactors in the extreme heat.
The effects on London during the evening rush hour were dire.The Underground and rail networks were paralysed. The problemfor people trying to find other ways home was exacerbated by thefact that automated cash machines were down, preventing themfrom getting access to the additional cash they needed to, forinstance, pay for taxis. Pubs benefited in the city though, as manycommuters avoided the grid-locked streets and over-crowded buseswith the pleasure of a slow pint on their long way home.9
On Thursday 14 August, in the United States, where US EnergySecretary Abraham said:
Reliable electric power is the lifeblood of the economy for both the UnitedStates and Canada. . . . It’s more than just a personal convenience – it’sessential to the health and safety of the two countries’ citizens.10
50 million people were hit by America’s and Canada’s worst powerfailure. The effects of the blackouts were particularly felt in cities likeNew York, Cleveland (Ohio), Detroit (Michigan) and Erie (Pennsylvania)as well as in many Canadian cities such as Toronto, Ottawa andNiagara Falls.
New York City suffered badly when office buildings were evacuated shortly after 4pm. The events of 11 September 2001were on people’s minds. Many were convinced, wrongly, that ter-rorists had struck again. On the Thursday night, thousands ofstranded commuters slept on the streets and in bus and train stations rather than venture on long walks home. In hotels guests had to sleep outside on the pavement because there wasno electricity to operate its electronic room keys and knock-on
292 Adapting Buildings and Cities for Climate Change
Roaf_Ch13.qxd 29/10/04 7:00 PM Page 292

effects also included:11
● During the night from Thursday to Friday New York suffered 60serious fires, mostly caused by people lighting candles in the dark.
● Nine nuclear reactors in four US states were taken offline,contributing here to the problem of fuel insecurity rather thansolving it.
● The US federal Administration halted flights into six airports –three in the New York area, one in Cleveland, and two in Canada.
● Sporadic looting was reported in at least four areas of the Canadiancapital, Ottawa, and 26 people were arrested for looting inBrooklyn, New York.
● The blackout closed the Detroit–Windsor Tunnel, which links theUnited States and Canada and is used by 27 000 vehicles daily.
● In the Canadian mining town of Sudbury some 100 miners weretrapped underground until power could be restored.
● Detroit’s 15 major car plants closed down until Monday18 August 2003.
A US–Canadian government investigation of the massive poweroutage in the Northeast singles out a series of operators’ mis-takes, computer failures, violations of grid rules and inadequatemaintenance by FirstEnergy Corp., the Akron-based utility servingnorthern Ohio, as the primary causes of the largest blackout inNorth American history.12
POOR MANAGEMENT OF SUPPLIES
California is perhaps the prime example of a region where mis-management of energy supplies has caused widespread hardship,
Fuel security: when will the lights go out? 293
13.2.The lights go out in New York inAugust 2003 and in cities aroundthe world, at a time ofunprecedented global heatwaves. (Source: AssociatedPress)
Roaf_Ch13.qxd 29/10/04 7:00 PM Page 293

and death. In California, the supplies across the whole state havebeen affected by rolling blackouts over the past three years, duein part to poorly managed privatization of the electricity industryand an inflexible legislative system. Very high energy demand frombuildings, for instance in the heat wave of 2000, caused a surgein demand and private companies, once a price cap was lifted inJune, raised their prices by up to three times in a matter of months.Poor management, in part by the Enron Corporation, and the State,resulted in outages in many cities and settlements. Reasons givenfor these failures included:● Excessive energy demand at peak period consumption, related
in a large part to high air conditioning use in very hot weather.● Lack of energy conservation measures in buildings and equipment.● Poorly managed energy tariff systems.● Lack of coordination of plant outages on an emergency basis.● Lack of back-up generating capacity.● Poor State management of the sector.● Corrupt private utilities.
By contrast, in New England in the US the electricity supply problems are different. The plans to increase the percentage ofelectricity generated by gas-powered stations from 16% in 1999to 45% by 2005 proved unrealistic, not only because of the soar-ing cost of gas in the United States but also because:● During peak demand some advanced gas turbine plants would
not be able to switch quickly enough to their back-up oil suppliesto avoid temporary outages.
● The existing gas pipeline capacity in the region would poten-tially be insufficient to supply the demand of the 45% increasein gas-generating plants at peak periods, a fact that caused gassupply problems in 2003.
● The pipeline construction, and power generation companies arenot one and the same.
There is concern that the New England power supply system, likethat of California but for different reasons, will not be able to meetdemand within a matter of years. The Boston area is particularlyvulnerable as the ageing grid in the area is considered, as in manyother areas of the United States, to be on the brink of failure. Thecompetitive market is failing also as suppliers are pulling out ofthe market rather than jumping in. The problem was highlightedin spring 2000 when an unexpected heat wave forced the powercompanies to call Boston customers to cut down on electricity usein order to prevent blackouts. Other cities have similar problems,such as New York where 2000 residents lost power in 1999 prompt-ing the city to plan to install 10 mini-power plants as back-up to
294 Adapting Buildings and Cities for Climate Change
Roaf_Ch13.qxd 29/10/04 7:00 PM Page 294

its main lines – a seemingly pointless gesture in the face of thescale of the 2003 blackouts.
It would appear that to improve their fuel security, what Americaneeds, as well as better energy infrastructure, is to use less energy.13
We are moving into an era in which we can no longer, in anycountry in the world, presume 100% security of delivered energysupplies. In the UK the old research facilities of the ElectricityIndustry at Capenhurst, where work on the optimization of powersupply and demand was undertaken, have been closed and suchresearch is no longer being undertaken in a coordinated fashionby the UK government.
This results in a lack of long-term, in-depth, knowledge, skillsand planning on such subjects, that will manifest itself as our sup-ply and demand systems are increasingly placed under pressurefrom new developments, climate change and energy scarcity.
The UK government’s move to privatize 100% of the UK energysupply market has exacerbated our energy insecurity. For instance,part-privatization of the London Underground was blamed for exac-erbating the August 2003 failure that brought the transport system to a standstill and affected tens of thousands of tube pas-sengers who were stuck in tunnels as trains stopped. In 2002London Underground’s 97-year-old independent power station, Lot’sRoad, was shut, and responsibility for powering the tubes washanded over to a new consortium, Seeboard Powerlink, in a private finance deal under which the tube now gets all its powerfrom the National Grid. Seeboard provided a back-up power sta-tion at Greenwich, south London, for use in emergency, but thearrangements failed, leaving dozens of trains stranded, raising againwith the unions, and many others, the question of the advisabilityof handing over to private finance contractors the responsibility ofkey public services. Senior Seeboard executives had decided notto start up the Greenwich generator when the 28 August black-out began at around 6.30pm at the height of the rush hour, hop-ing to switch supply from other parts of the grid that were stillworking. Questions were later asked as to why it had been feltnecessary to change a system that had kept the Undergroundworking all through the Blitz.
The move away from state-owned generating companies hassent prices tumbling around the world over the past decade butprivately owner power stations have not been investing in newplant or infrastructure because they see their profit margins beingsqueezed, and they have been shutting down what they see asexcess capacity to maintain their profits. Global warming is result-ing in more unpredictable weather and tending to result in massivesurges in demand for power.
Fuel security: when will the lights go out? 295
Roaf_Ch13.qxd 29/10/04 7:00 PM Page 295

The summer 2003 crisis in Italy highlighted its chronic dependencyon foreign sources of energy. GRTN, Italy’s grid manager, draws inpower not just from France and Switzerland, but also from Austria,Slovenia and even Greece via an underwater cable. Sixteen per centof Italy’s requirements are met from outside the country. At that timea bill to increase Italy’s generating power by a quarter had beenstalled in Parliament for months and calls were being made to restartthe nuclear programme that had been abandoned after a referen-dum in 1987. Its four remaining nuclear plants are currently beingdismantled. More than 75% of electricity generated in Italy comesfrom oil, gas and coal and producing it accounts for 25% of Italy’sgreenhouse gas emissions. The need for energy efficiency measureto damp the summer air conditioning peak was clear in this instance.14
Massive power cuts in Denmark in late September 2003 weresaid to be caused by damage to the power transmission lines linkingSweden and Denmark, from where Denmark obtains much of itspower. Some even claimed that the lines had been sabotaged byterrorists.15 This transboundary dependency for energy is increas-ing the risk of political as well as physical and economic insecurity.
Public concern also acts as a restraint on the operations of theprivatized utilities in their efforts to ensure supplies. PresidentBush’s plans to exploit the Alaskan oil fields were thwarted by a52 to 48 vote in the US Senate on 20 March 2003, when Democratsand eight Republicans voted to block, for at least a year, drillingfor oil over a 600 000 hectare area of the wilderness refuge ofAlaska. The US uses around 7 billion barrels of oil a year and thegovernment estimated that as many as 16 billion barrels could befound in Alaska.16 In the face of mounting oil shortages in the UnitedStates it is only a matter of time before the interests of environ-mentalists will, inevitably, have to give way to the need of Americansto feed their growing dependence on oil, and in turn, electricity, anissue that has already led to civil unrest on the streets.
Shanghai, a city with a booming population soaring above 20million people and the leading city in the Chinese economic revo-lution, is now facing an energy crisis. As the population flocks fromthe country to the city to cash in on the £2900 average annualincome available to workers, more and more tall buildings haveemerged to house the population and provide them with work-places. However the energy infrastructure is unable to meet therapidly growing demands for power and in December 2003 themunicipal authorities ordered many factories to move to night shiftsbecause energy supplies were unable to meet the soaring daytime demand for electricity.17
Tens of thousands of factory workers were affected and orderedto work nights because of power shortages caused by the rapidgrowth of China’s economy. Shanghai also urged shop owners to
296 Adapting Buildings and Cities for Climate Change
Roaf_Ch13.qxd 29/10/04 7:00 PM Page 296
turn down thermostats and conserve electricity. Such moves not onlyembarrassed government officials but also presaged a battle forenergy supplies in Asia. Car ownership in the city is rising at 25%a year. It has the world’s first commercial magnetic levitation train.But on 4 December the city announced that unless it took drasticaction to overcome the energy problems the trains might not runand the street lamps and skyscrapers may be blacked out.
As mid-winter approached the city authorities calculated that thecity was 2 million kilowatts short of the 11.6 million it needed tomeet peak demand. Although the city buys electricity from thenew Three Gorges Dam, and plans to buy an extra 1 million kilo-watts from there, it was still facing major problems. The city plannedto shut its most energy-intensive small factories and change workshifts to midnight to 8.00am in energy-intensive industries. Manyof the population can now afford electric heaters in winter, andone of the main problems has been identified as the gleamingnew shopping malls, where 0.4 million watts could be saved bylowering the temperature in them alone. Power pricing is chang-ing to encourage people to use less during the day (highlightingthe need to use thermal storage in buildings).
China’s general power consumption rose by 15% to 1.88 trillionkilowatts in 2003. More than half China’s provinces have been hitby shortages and the government has warned that the energyshortfall could hinder growth, despite more plant being broughtonline, and shortages would remain chronic until at least 2006.China was an energy exporter for three decades but is now oneof the world’s biggest oil importers.18
Such necessities of reducing consumption, rapidly and on a largescale, also exist in the UK. In the face of the blackouts in August2003, the National Grid company Transco denied that there was anyrisk that inadequate generating capacity in the power stations wouldlead to power shortages in the winter, although it did admit that ithad written to some of its largest industrial customers to offerinducements for lower usage contracts in August 2003. The sug-gestions, sent to major manufacturing plants, as owned by Rio Tintoand the aluminium manufacturer Alcon, and other heavy power users,include inducements for accepting ‘interruptible‘ contracts where thegrid can reduce supply at 24 hours’ notice to enable the Grid to freeup capacity to meet regional peaks in demand. The contracts canbe worth as much as £56 000 an hour, a bonus at a time when elec-tricity prices are expected to rise by as much as 30% over the nextyear for the renewal of such contracts.19
OTHER CAUSES OF POWER OUTAGES
There are two further major threats to the security of supplies.The first is terrorism. The blowing up of power lines and plants is
Fuel security: when will the lights go out? 297
Roaf_Ch13.qxd 29/10/04 7:00 PM Page 297

such an obviously effective means of bringing a region to its kneesand inflicting major economic damage that it significantly influencesthe thinking of politicians on the subject of future fuel mixes. Thesecond, and it has happened already, is when a country simply canno longer afford to pay for the oil and gas to run its plants.
EMBEDDED GENERATION
The electricity blackouts around the world in 2003 demonstratedclearly that many countries have become absolutely dependent,for the ordinary functioning of society, on a constant, and high qual-ity, supply of electricity. Quality of supply can be considered to havethree elements:20
● Reliability – long- and short-term interruptions of power supply.● Power quality – frequency and voltage stability, waveform
abnormalities.● Service – response time and restoration time.
Not only do we need a constant supply of electricity for basic func-tions like street and domestic lighting, that can operate under quitevaried voltage conditions, but the advanced electronic equipmentfound in modern working environments often requires a high levelof reliability from the incoming electricity supply.
For example, today’s complex manufacturing processes rely heav-ily on microcomputers, variable-speed drives and robotics devicesto achieve high levels of product throughput and product quality.This leads to higher expectations of electricity end consumers,who place increasing demands on electricity suppliers to meet thedemand for quality of supply. Evidence for this is given by the largemarket for power quality measurement and analysis systems.
National regulations dictate the minimum quality of electricity and,if these are complied with, the needs of most consumers will bemet. In the case of consumers with special requirements, or in areaswhere quality measurements give rise to concerns, there are meth-ods of ameliorating shortcomings in the electricity supply. However,some of these methods can themselves have an effect on thesupply network.
The winds of change?
There are new factors that raise several issues with regard to thecurrent distribution regulatory arrangements, which were not con-sidered 20 years ago. The industry is changing, with greater empha-sis on:
● Quality of supply.● Security of supplies.● Environment.
298 Adapting Buildings and Cities for Climate Change
Roaf_Ch13.qxd 29/10/04 7:00 PM Page 298
In recent decades, Great Britain has relied almost exclusively uponelectricity generated by large, traditional power stations that areconnected to the higher voltage national transmission system. Inline with this, distribution networks, the lower voltage part of thesystem, have largely been concerned with delivering electricity inone direction, from the transmission network to customers’ homes.However, structural changes are ahead, including the anticipatedgrowth of ‘distributed’ generation – that is, small, local power gen-erators, particularly of renewable energy – to underpin the ‘rewiringof Britain’.
What is embedded generation?
Embedded generation (also known as distributed, embedded ordispersed generation) is electricity generation connected to a distri-bution network rather than the high voltage transmission network.Distributed generators are mostly – though not exclusively – thosegenerating power from environmentally friendly renewable energysources (including small hydro, wind and solar power) or from com-bined heat and power (CHP) plants.
Historically, distribution networks have been designed to takeelectricity from the high voltage transmission system and to deliverit to customers. The management of this one-way flow of energyhas been termed ‘passive’. In order for the networks to accom-modate increased levels of distributed generation energy flow inboth directions will have to be managed – both to the customerand from the distributed generator. This is termed ‘active’ manage-ment. This move from ‘passive’ to ‘active’ management is a majorchallenge.
The nature of distribution networks today means that manysmaller generators find it difficult and expensive to connect to net-works that were not designed to accommodate them. The outputfrom photovoltaics (PVs) from a single house into the grid is littlemore than noise on the line, but when the whole street has solarhot water systems and PV arrays then the solar contribution topowering houses down the street becomes significant, especiallyif the householders are out all day at work during the week butat home during the week-end. Matching the load profiles to theelectricity supply becomes a real challenge.
Naturally, the large distribution companies involved find it is mucheasier to deal with the outputs from a handful of major genera-tors, but in the changing climate, with resource pressures devel-oping year on year, a strong theme of the UK government’s WhitePaper on Energy is the need for energy security, and it is widelyfelt that the sole reliance on the mega-grid for the supply of futureenergy would be a very high-risk strategy to follow.21
Fuel security: when will the lights go out? 299
Roaf_Ch13.qxd 29/10/04 7:00 PM Page 299
Future grid scenarios need to be built to also cover the poten-tial for ‘renewable energy cities, suburbs and streets’ within whicha relatively high proportion of, for instance, the domestic load islocally generated, during spring, summer and autumn, from build-ing-integrated solar hot water, micro-wind, CHP systems and PVsystems that supply unpredictable energy, depending on theweather of the day and the month. For such small-scale embed-ded generators, work is focusing on ‘micro-grid’ systems wherepower demand and supply are controlled within a local grid, sep-arated from the main grid by a power gate that can be shut off intimes of power supply emergencies to ensure security of supplieswithin the main grid system.
Within such micro-grids, it is envisaged that a cocktail of differ-ent generating sources could be located, from a range of solar, wind,hydrogen fuel-cells, CHP plants, hydro plants and other sources.Such systems can work well at the level of the ‘campus’, where asingle owner is responsible for the plant inside the power gate andthe management and control of energy supply and quality withinthe mini-grid. One example of such a campus site that has a two-way power gate into the national grid is that at the Centre forAlternative Technology at Machynlleth, Wales, that has a range ofembedded generators including wind and solar, within its micro-grid.As part of its active energy management system the site has a bankof batteries to provide energy storage, and a buffer against fluctu-ating supply and load situations.
If distribution networks are to accommodate increased quanti-ties of embedded generation, from a PV roof or a solar street, toan aluminum smelting plant’s power station, then they will needto be managed as ‘active’ rather than ‘passive’ systems. This notonly means installing complex control systems, but also equippingtransformers with tap changers that can control voltage locally. Ifthe cost burden that different sources of generation imposes onnetworks is not recognized early on by the charging arrangements,then the most efficient network/generator configurations are unlikelyto be implemented and charges to customers will be higher thanneed be in the long term as oil and gas prices rise. Insufficient invest-ment at the right time may cause future supply systems to be evenless secure.
Energy storage
The generating capacity available must be able to meet the peakdemand and, as demand is below peak for most of the time, asignificant amount of generating capacity is under-utilized. It hasbeen estimated that the average utilization of generating capacity
300 Adapting Buildings and Cities for Climate Change
Roaf_Ch13.qxd 29/10/04 7:00 PM Page 300

is around 50%. One way of improving generator utilization is touse ‘off-peak’ electricity in energy storage schemes.22
There are some very large schemes, for example, the Dinorwicpumped hydro scheme, in Wales, where electricity generated atoff-peak times can be pumped back up to the reservoir and usedto generate again at peak periods. Despite there being suitabletechnology available, for example regenerative fuel cells, as yet thereis little storage in the current supply chain.
It is often considered that renewable generation is of two types,despatchable and stochastic. Despatchable generation, such as con-ventional hydro or that powered by biofuels, can be made to pro-vide electricity in a manner which is related to demand. Stochasticgeneration, such as that powered by wind or wave, fluctuates ina manner that is unrelated to demand. However, stochastic gen-erators can provide electricity that contributes coherently to thedemand cycle if they are associated with appropriate energy stor-age systems.
The trading system for Great Britain was designed to enablecompetitive markets to develop, but critics claim that it is extremelycomplex to implement, creating problems for users.23
The main technical problem to be overcome in moving to embed-ded generation from the traditional grid system is that of provid-ing constant, high quality, electricity from unpredictable sources.The lack of back-up energy storage facilities in the UK systemswill be exacerbated by the increased use of generators poweredby fluctuating (stochastic) renewable energy sources, such as windand tide. Many of the proposed technical solutions will also meansignificantly increased costs of energy to the consumer.24 As fos-sil fuel prices rise, the marginal costs of this storage capacity willdecrease relative to the cost of the ‘delivered’ energy, that entersa building through the meter.
For many power generators, downtime, when power outagesoccur in plant, including its hidden costs, can represent 5–10% ofannual revenue and potentially 30–40% of annual profits, and out-age optimization regimes are increasingly central to the manage-ment of the energy supply system to make sure that neithermechanical nor human error causes unnecessary blackouts.25
CONCLUSIONS
We face a future in which we will no longer be able to rely on aconstant, reliable, high-quality supply of energy. 2003 gave us ataste of what is to come. Key issues are:
● Quality of supply. How important is quality if there is no supply?How will the inevitable ‘rewiring of Britain’ to accept renewables
Fuel security: when will the lights go out? 301
Roaf_Ch13.qxd 29/10/04 7:00 PM Page 301
affect the quality of supply? Will we have to adapt to using lowerquality energy, as well as to using less of it?
● Security of supply. This will be increasingly challenged by theend of the fossil fuel age; the rise of embedded generation;micro-grids, privatization, de-regulation; lack of investment in theindustry; geo-political insecurity; extreme weather, and a plethoraof other forces are gathering to test our ingenuity in keepingthe lights on for as long as possible.
● Environment. This must be the driver: energy use is dependenton weather and our warmer and more extreme weather hasproved to be the wild card that carries the poker game. Theblackouts in August were caused in large part by high demandin a hot summer, the sort of hot summer we will increasingexpect ever year or two in the future.The other critical factor isthat of the global environmental impacts of energy generation,the burning of fossil fuels that is driving the climate to change.Those who maintain that the problems of a changing climate canbe solved simply by throwing more energy at them – that energy-profligate buildings will provide bastions of comfort for those whocan afford it – are mistaken.
The Institution of Civil Engineers, in their State of the Nation Report2003,26 pointed out the chronic structural problems the UK faces:
● Over 95% of the country’s present generation mix is made upof coal, nuclear and gas supplies.
● Emissions constraints means that the remaining UK coal plantswill close within 15 years.
● Only one nuclear power station will remain open after 2020.
They asked for:
● Increasing investment in infrastructure (including – I would add –the knowledge infrastructure).
● Investment in developing the full range of fuels.
Add to this the need for more long-term storage of fuels in reserves.France, Germany and Italy have storage of more than 20% ofannual consumption – more than 70 days’ worth. The UK has lessthan 2 weeks’ worth.
Add to this the need for stringent demand side managementpolicies to make consumers use less.
Add to this the need to store more energy in the thermal massof buildings, where the thermal capacity of a building offers thepotential for providing a significant reservoir for heat or coolth.
Add to this the urgent need to re-wire Britain to accept emerg-ing energy technologies.
And finally add to this the imperative to design buildings in whichwe can survive when the lights do go out.
302 Adapting Buildings and Cities for Climate Change
Roaf_Ch13.qxd 29/10/04 7:00 PM Page 302

NOTES AND REFERENCES
1 Guardian, 13 November 2003, p. 9.
2 Guardian, 13 August 2003, p. 16.
3 Guardian, 15 November 2002, p. 9.
4 Guardian, 20 September 2003, p. 16.
5 Guardian, 13 August 2003, p. 16.
6 Guardian, 29 September 2003, p. 3.
7 Guardian, 29 September 2003, p. 3.
8 Guardian, 11 September 2003, p. 2 and Guardian, 29September 2003, p. 3.
9 Guardian, 29 August 2003, p. 7.
10 http://www.citymayors.com/news/power_blackout.html.
11 http://news.bbc.co.uk/1/hi/world/americas/3152985.stm.
12 http://www.washingtonpost.com/wp-dyn/articles/A62280-2003Nov19.html.
13 IPG (2001) International Power Generation. DMG World Media,UK, March.
14 Guardian, 30 September 2003, p. 15 and Daily Telegraph, 29September 2003, pp. 1, 3 and 21.
15 Guardian, 29 September 2003, p. 3.
16 Guardian, 21 March 2003, p. 18.
17 Guardian, 6 December 2003, p. 21.
18 Guardian, 5 December 2003, p. 18.
19 Independent, 25 August 2003, p. 16.
20 The following sections come largely from the IEE PolicyStatement on the issue. For a full text on the subject see:http://www.iee.org/Policy/Areas/EnvEnergy/embedgen.pdf.
21 http://www.dti.gov.uk/energy/whitepaper/index.shtml.
22 http://www.ofgem.gov.uk/elarch/retadocs/golive_explained.pdf.
23 http://www.ofgem.gov.uk/ofgem/shared/template2.jsp?id�
4221.
24 http://www.ofgem.gov.uk/ofgem/index.jsp.
25 International Power Generation, November/December 2002,p. 17.
26 ICE (2003) The State of the Nation: An assessment of thestate of the UK’s infrastructure by the Institution of CivilEngineers. See text on: www.ice.org.uk.
Fuel security: when will the lights go out? 303
Roaf_Ch13.qxd 29/10/04 7:00 PM Page 303
Buildings are in the front line of the battle against climate change.Either they change fast and radically or we lose the war. We must,with all speed:
● Reduce the production of greenhouse gases that are drivingclimate change.
● Adapt our buildings and cities so that as many people as pos-sible can survive as comfortably as possible in them, for as longas possible.
● Build buildings today that will last for as long as possible, withminimum of maintenance and refurbishment because the energyembodied in the construction, operation and demolition of build-ings, and the manufacture and transport of materials is perhapsglobally the major source of greenhouse gases, pollution and waste.
In every country on earth,1 regardless of class, creed or wealth,buildings are threatening the quality of our lives, either because ofthe emissions they generate, or the impacts they have on our livesthrough extreme weather trends and events. You cannot buy yourway out of a cyclone.
Books on the subject tend to try to fudge the problems. Theydwell on particular uni-dimensional aspects of the problem, such ashow a micro-grid works, or changing the building controls system,adding shading or changing the glass type.2 They do not challengethe heart of the beast, the fundamental paradigms of the buildingswhich cities and the market place accept as inevitable today; it isthese paradigms that are destroying our planet.
The market mantra of ‘you get what you want’ is but a hair’sbreadth away from the chilling ‘you get what you deserve’, and‘buyer beware’ – take the consequences of your own poor deci-sions. The time has come for buyers to educate, and future-proofthemselves, against climate change implications. Do you really want
14 THE PLAYERS
Roaf_Ch14.qxd 29/10/04 7:01 PM Page 304
to buy a house that will flood? Or work in a building you cannot getout of when it does? Or is under the path of a runway where theair will become extremely polluted in a heat wave? Or live wherethe drain in your drive will spill out raw sewage every time there isheavy rain?
To change the current paradigms will require a revolution, becauseof the deeply entrenched positions of the key players in the builtenvironment. The need exists to restructure the political, profes-sional, business, industrial, academic and media roles in our builtenvironment, as touched on below. But this may well happen fasterthan any of us anticipate because the 21st century markets arevery different from those even a couple of years ago.
The smart high-end movers and shakers have already moved on,left town, become more efficient, reduced their impacts, re-investedin quality leaving many of the good old boys to hawk their new‘modern’ ideas, and dated products, to their cronies, to the ill-informed,or to the developing world. The problem with the construction indus-try, as in the American computer industry, is perhaps it was all tooeasy and they just got sloppy.
HIGH TECH MISSIONARIES OF SLOPPINESS
In her very influential online paper entitled ‘High Tech Missionariesof Sloppiness’, Cheryl Aim, writing for Salon Magazine,3 pointedout the reasons why ‘India is going to eat the American computerindustry for lunch’, including:
● The US computer product is not reliable. (Modern buildings areoften not reliable, and in the UK insurance premiums are higherfor post-1971 houses because they fail more than the ones thatare centuries old, with the ABI considering some of the high-est-risk homes being the ‘innovative’ prefabricated types beingpromoted by the current government.)
● The industry had come to see their product reliability problemsas an inevitable side effect of what they excelled at – innova-tion at top speed. (‘Innovate’ – why?)
● The ‘Don’t Worry, Be Crappy’, philosophy, which holds that theway to sell is to ‘ship, then test’ and ‘Act fast and fix the prob-lems later’. (We are pulling down a ‘ship fast’ generation of build-ings from the 1960s, 1970s and even the 1980s all over the country.)
● Being first to market with new products is exalted as the high-est goal. (Make sure you have good lawyers.)
● ‘Glitchy software’ bugs are talked of as mere annoyances whenthey are in effect defects and should be labelled so. (Can youget the Advanced Building Control System to work properly?
The players 305
Roaf_Ch14.qxd 29/10/04 7:01 PM Page 305

Some of the leading engineers cannot even control the climatein their own buildings.)
● As in the automobile industry, where Japanese car makersgrabbed nearly a third of the US market and much of the inter-national market, why would a foreign company want to buy outdated inefficient American air conditioning if it could get reli-able super-efficient, low impact, Japanese (or Scandinavian) airconditioners for the same price?
● The era of ‘playful creativity’ governing the design and manu-facture of PCs is over, and has got to give way to one in whichcomputers are seen by their creators as being more like bridgesand tunnels than, say, the houses of Frank Lloyd Wright or LeCorbusier. (Could we bear to live in a world without Architectas Maestro? Do we actually know how to build buildings worthyof Brunel?)
● A High Dependability Computing Consortium (HDCC) wasplanned with an ‘In thee we trust’ mission.
● Carelessness freely wastes these firms’ own resources.● High-tech products . . . [often] have more style than substance –-
what computer scientists are calling ‘feature-itis’, ‘glitzware’ or,in a pointed reference to the products of late-1950s Detroit,‘tail fins’ and ‘flashy chrome bumpers’.
● ‘Not until the consumers demand [quality] and get it from over-seas (or less tech, low impact, lower cost, providers of reliableproduct?) will the reigning companies believe – American com-puter and software companies are making too much money inthe current environment to care.’
This article should strike a real chord in the building design world,as in many other industries, where many have had their eye offthe ball for a while, and increasingly look to a bemused publicas if they have lost the plot. Where is the ‘firmness, commod-ity and delight’ our forebears were so proud of, in the modern‘minimalistic’ paradigm? It certainly appears as if people havebeen cut out of the design equation in many cases. Perhaps build-ing users would be more forgiving if the buildings worked well,but the sloppiness has begun to bite, poor performance and highcosts and impacts have added extra coffin nails that are gradu-ally being eased into place. Industries come and go, the woolindustry, the shipping industry,4 and the aircraft industry will too,when the oil runs out. No Chief Executive Officer should be tooconfident that their business cannot fail. But why is more notbeing done to ensure that the designing professions and the con-struction industries survive, thrive and contribute to the ClimateChange War?
306 Adapting Buildings and Cities for Climate Change
Roaf_Ch14.qxd 29/10/04 7:01 PM Page 306

GOVERNMENTS
The Kyoto process has theoretically been extremely influential in cre-ating targets for emission reductions, and Europe is leading the worldin the imposition of biting targets for greenhouse gas emissions.On 12 August 2003, the European Commission unveiled tough pro-posals to cut emissions of particular potent greenhouse gases by aquarter before 2010, a really ambitious target.
This may well have been spurred on by the realization of thegrowing financial costs to governments of not taking such steps.The costs of the floods in Europe in 2002 were astronomical, aswere those of the heat wave of 2003 where governments wereforced to provide significant handouts of subsidies for stricken sec-tors. The German government, for example, arranged emergencyaid to farmers in conditions that were described as ‘desert like’by one agricultural leader.5 Climate change is really beginning tohurt major economies.
The problem for governments is how to turn the requirement toreduce impacts into a requirement to deliver target reductions. Thefaster, cheaper, mentality, characteristic of the height of the fossilfuel era, favoured privatization, and the more efficient delivery ofgoods and services that would make them cheaper for the voters.But that idea is evaporating as water and fuel become scarcer andcorporate profit requirements are paid for by the person in the street.
The ‘rate’ of change may also work against success. In 1950sand 1960s Britain the momentum for urban reform resulted in thedestruction of the hearts of many well-loved towns and citiesbeneath a carpet of brutal concrete and bitumen. Labour’s currentdeclared policy of building new towns in the green belt was chal-lenged by, among others, Richard Rogers, who said that DeputyPrime Minister John Prescott’s agenda to ‘go fast’ in building newtowns was wrong, and that we have made the same mistake beforeand had to pull the lot down. New development, he argued, shouldbe concentrated in places like Birmingham and Milton Keynes, echo-ing the trend amongst leading global businesses to move to provin-cial centres and away from ‘target’ buildings.6 As John Prescottsaid, ‘The Green Belt is one of the great success stories of theLabour Party and we intend building on it.’
What is needed by the government quite simply is a mecha-nism by which the contribution of every building to meeting thosetargets can be recorded and improved where necessary, and herethe 2001 European Building Directive will provide the means bywhich such accounting can be made through annual building per-formance audits and audits of performance at point of sale of bothhouses and offices.7
The players 307
Roaf_Ch14.qxd 29/10/04 7:01 PM Page 307

The European Commission Directive 2002/91/EC, adopted inDecember 2002, designed to result in savings of 45 million tonnesof CO2 by 2010, requires that member states:
● Apply a general framework for calculating the energy perfor-mance of buildings.
● Apply minimum standards of performance for all new buildings.● Apply minimum standards of performance for existing buildings
over 1000 m2 that are subject to major renovation.● Ensure that boilers, heating systems and air conditioning are
inspected regularly.● Ensure that when a building changes occupants an energy per-
formance certificate is made available and displayed in all publicbuildings plus those visited by the public.
The intention is to place a clear responsibility on those selling aproperty to provide information about that property at the point it isput on the open market. The domestic information will form a HomeInformation Pack (HIP), and will include a Home Condition Report(HCR) undertaken by a Home Inspector as well as evidence of titleand local searches. For offices and buildings over 1000 m2 wherethe general public can enter, a Performance Certificate, required tobe updated annually, must be publicly displayed after 2006.
Other provisions under the Directive cover the accreditation ofthose carrying out inspections, publication of the scheme andgovernance. It is also a requirement that the methodology for cal-culating energy performance is reviewed regularly, at least every2 years. Member states have a maximum of 3 years in which toimplement the provisions, by 4 January 2006. A further period of3 years is allowed for the introduction of full certification and inspec-tion of existing buildings if there is a lack of accredited experts tocarry out the work.8 However one big issue has been ignored inthe Bill, which is whether these inspectors will be legally liable forthe consequences of incorrect advice, and whether they will beable to afford professional indemnity insurance.
PRIVATIZATION
Chapter 13 touched on the impact privatization has had in desta-bilizing the security of the energy markets. In the United States,in particular, privatization has undermined the reliable provision of,for instance, energy in California, spurred on by corporate greedand corruption, famously flag-shipped by the Enron scandal. Thetrend to privatize pervades many different aspects of the way wedesign and manage our built environment.
One example is the loss of long-term theoretical research fromthe public to the private sector. Formerly publicly funded research
308 Adapting Buildings and Cities for Climate Change
Roaf_Ch14.qxd 29/10/04 7:01 PM Page 308

establishments, such as the UK’s Building Research Establishment,and the research centres of British Rail and the Electricity and Gasindustries, have been sold to the highest bidder or the attachedindustries, so losing for the nation an invaluable powerhouse ofexpertise that would be essential in future-proofing Britain againstthe exigencies of the coming decades. In their place we have a‘product oriented’ research community dependent on short-termresearch contracts handed out by a government increasingly inter-ested in getting ‘added-value’ for their research investments byfavouring research that is co-funded by industry. That means thatinstead of investigating theoretical or generic issues, priority is givento testing products, in a manner that promotes the agendas of thefunders, that is, industry. Gone are the researchers with decades ofexperience on ‘the big issues’, replaced by a hustling research mar-ket place, dealing in diminishing research funds, with large tranchesof tax payers’ money being paid directly to the privatized serviceindustries to do with as they like to promote, and hopefully effect,environmental impact reductions. The conflicts of interest betweenthe industry, the regulators and the research community must bedealt with and delineated, and contraventions of the bond of trustplaced in these bodies staunchly defended through the courts.
MARKET FORCES
We have seen elsewhere that for the air conditioning industry mar-ket forces are driving the exponential increase in the very air con-ditioning systems that are one of the major sources of carbondioxide emissions to the atmosphere. The use of ‘Guidance’ pro-grammes and publications without legislative teeth have tradition-ally proved ineffectual in the face of the urge to stay cool in apoorly designed building.
When the Royal Institute of British Architects urged their mem-bers against the unnecessary use of air conditioning and theChartered Institute of Building Service Engineers includes in itsCode of Professional Conduct the admonition to ‘Avoid the use ofrefrigeration where natural and mechanical ventilation is a feasiblealternative’, both professions continue to move indiscriminately toalmost universal use of air conditioning in their larger buildings.
However, it is hoped new initiatives will prove more successful.Many local councils recognize that they have to play a larger partin tackling climate change. The Local Government Association hasteamed up with the Energy Saving Trust to fund a senior projectofficer to work at the Greater London Authority on sustainable energyand climate change and to update the Association’s policy on suchmatters, in light of climate change developments and the govern-ment’s White Paper on energy that requires a 60% CO2 emissions
The players 309
Roaf_Ch14.qxd 29/10/04 7:01 PM Page 309

reduction by 2050.9 It may well be that people will come to rec-ognize the urgency of acting promptly, and the growing uptake ofthe tenets of Corporate Social Responsibility will encourage peopleto ‘do well by doing good’.10
REGULATION AND LEGISLATION
Without strict regulation and laws to ensure the:
● maintenance of air, land and water quality, and● reduction of waste production, water consumption and energy
emissions
they simply will not happen. Recent revisions to the BuildingRegulations have been significantly watered down in response toeffective lobbying by related professions and industries, at theexpense of the quality and sustainability of the built environmentand society in general.11
Imaginative new methods are being explored to give extra teethto the regulatory process. In the Introduction to the new HousingBill introduced on 8 December 2003, John Prescott said one of itsobjectives was to:
replace the housing fitness regime with an evidence-based risk assess-ment process, carried out using the Housing Health and Safety RatingSystem (HHSRS), enabling local authorities to address more effectivelythe hazards to health and safety in dwellings
although in considering health and safety, there is very little regardpaid to the risk of your roof being blown away, or flood water com-ing in through your walls.12
The ability of governments to modernize regulation effectivelyand rapidly, to deal with emerging challenges, will be an impor-tant adaptive mechanism in the 21st century.
PLANNERS
The planning system is in the front line of the forces makingsustainability happen. Unfortunately planners, although many arevery pro-active on such issues, are simply not equipped with theknowledge, or the statutory teeth, to deal with ‘unsustainable’developments.
In the current planning process, there is generally no statementon the thermal or environmental performance of a proposed build-ing given to councillors for consideration before it is granted plan-ning permission. So the planning member who decides if the buildingwill get permission may have no idea of the potential environmentalimpacts of the building on, for instance, greenhouse gas emissions,
310 Adapting Buildings and Cities for Climate Change
Roaf_Ch14.qxd 29/10/04 7:01 PM Page 310

traffic generated pollution, or health of the occupants and the qual-ity of life for those in the building. Planning members, the electedcouncillors, generally judge a building by what it looks like, and whatthey are, or would like to be, familiar with. Committees can giveapproval for fashionable, un-shaded, all glass and steel buildings withhuge air conditioning systems, and remain blissfully ignorant of thetask they have passed on, down the road in the process, to theBuilding Control officer to try to, at least make it appear to, conformto UK Building Regulations.
Even the pioneering steps taken by the London Borough Councilof Merton, who require that a ‘Sustainability Appraisal’ be sub-mitted with the proposals for building over 1000 m2 describing howthe building has been designed to reduce its environmental impactsover its lifetime, are meeting with resistance from the government,who are, incredibly, challenging the need for the use of such sus-tainability statements on a case by case basis, rather than pro-moting their generic use in the system.
If the government intends to meet the reductions targets of theEU Directive it is difficult to see how this will be achieved with-out organizations, albeit the planners, or the Environment Agency,having statutory teeth. Buildings will have to meet the requiredstandard before they are given planning permission, not afterwards.
As the climate changes buildings will have to incrementallyupgrade their defences against the sun and wind, with awnings,shades, solar systems, shuttering features and even wind turbinesand it will be necessary for the planning organizations to decidethe rules for their generic application, and to re-train planning offi-cers in relation to their applications.
Many of these adaptations require fast tracking through the plan-ning system, and in particular in relation to the need to put shadeawnings on the south- and west-facing windows of the rooms ofall elderly and disabled people who may be bed-ridden or find itdifficult to move. These are the groups who are, along with youngchildren, the most vulnerable to heat stroke, as the French foundout in August 2003.
For larger buildings, requirements on the ordinary untrained cit-izen who is elected to sit on planning committees to pass or rejecta building are onerous. It would be rare to find a councillor who isqualified to make such a decision on performance grounds. Evenwhen they do make intuitional decisions that their voters would notlike a particular building in their backyard, they can be overruled atappeal by those higher up in government whose interests may lieelsewhere than with those of the local community.
The complexity of the impact and performance issues involvedare difficult to deal with for overworked planning officers who are
The players 311
Roaf_Ch14.qxd 29/10/04 7:01 PM Page 311

not routinely trained to understand issues of building physics andimpacts, but from now on perhaps they should be. Without suchknowledge how are they, within their planning targets, to consider,for instance:
● The solar access implications of the building?● The wind impacts of the building?● The impact of the building on the local and regional public trans-
ports system, parking and road usage?● Energy implications for the local and regional energy supply sys-
tems, and emissions from the City in relation to the agreedKyoto targets for the City of London and the renewable energypotential of the development?
● The impacts of the development on local council facilities andfinances, such as heath care, education, sewerage, water, gasand electricity supply, implications of bio-regional material sourcingpolicies, policing, building cleaning, maintenance and demolitioncosts?
There is a strong case for every planning department to have a trainedsustainability officer to deal with such issues for most applications.
The disaster mitigation services in England and Wales also needurgent revision to deal with emerging climate-related events (thesystem in Scotland has already been revised). Neither theEmergency Powers Act 1920 nor the Civil Defence Act of 1948,both effected through the planning system, have been updated inEngland and Wales since the end of the Cold War.
Under the Civil Contingencies Bill, local councils in England andWales, including planning departments, will form core ‘Local ResilienceForums’, tasked with emergency planning, providing information tothe public, risk management advice and ensuring that businessescontinue to operate. For the first time councils in England and Waleswill have a statutory duty with respect to emergency planning as‘First Tier responders’,13 although many see this Bill as potentiallyimpinging on the civil liberties of people.14
County, metropolitan, unitary and London borough councils, unlikedistricts, receive direct funding in the form of a civil defence grantbut its value, even in the face of climate change, has been fallingyear on year, until 2000 when it rose from £5 million a year to £19million, and has stayed at this level since then. Studies have showedthat in fact the actual expenditure on emergencies in England andWales is over twice this, and flood-prone regions are dispropor-tionately penalized, particularly by floods over the past few years.These sums cover facilities such as the serious casualty accessteams, chemical spills and mobile decontamination centres, thelatter developed for the nuclear industry leakages.
312 Adapting Buildings and Cities for Climate Change
Roaf_Ch14.qxd 29/10/04 7:01 PM Page 312

Some counties, at the hub of transport networks also bear anundue burden of emergency planning costs. Surrey has developeda strategy for a super-jam on three busy motorways that passthrough the county. Helicopters would be used to rescue the injuredand vulnerable motorists and provide information to strandedmotorists. Such response capabilities require significant investment,taking money from other core services.
THE COMMUNITY AT LARGE
Many different local pressure groups and national organizations areworking on every aspect of how to make their locality more sus-tainable. These range from groups working on water, waste, pol-lution, transport and energy, to fuel poverty and helping the agedwho are, without doubt, the most vulnerable in our society.
Some groups are even working on projects to reduce carbondioxide emissions from buildings. CRED (which stands for carbonreductions) is the name given to an initiative, launched in August2003, by a group of scientists at the University of East Anglia. Theyare concerned that although the UK government has signed up, inits February 2003 White Paper on Energy, to reducing carbon dioxideemissions by 60% by the year 2050, it has provided no clues asto how it intends to get there, let alone develop plans for effec-tive strategies to do so. The government has begun a programmeof activities to reduce emissions locally, including the installation ofwind generators, night classes to teach people how to make solarpanels, doing environmental audits for local companies, holding com-munity meetings to advise people on how to conserve energy intheir homes, providing low emissions travel advice etc.15
For large-scale emitters of greenhouse gases there is also theEU Emissions Trading Scheme (EU ETS), a mandatory greenhousegas emission trading scheme, arising from European legislationthat came into force in October 2003. It is due to begin in 2005,the first phase running from 1 January 2005 to December 2007and subsequent phases lasting 5 years.
The main targets of the greenhouse gas trading scheme are thelargest individual emitters of carbon dioxide, including electricitygenerators, oil refineries, the iron and steel industry, the mineralindustry and paper, pulp and board manufacturing. However, othernon-industrial sites could fall within the scope of the scheme asa result of the size of their combustion facilities (any installationthat operates combustion facilities, for example boilers, above thethreshold of 20 MW will be included in the scheme).
All installations covered by the scheme must hold a greenhousegas emissions permit, or will be liable to financial penalties. Permits
The players 313
Roaf_Ch14.qxd 29/10/04 7:01 PM Page 313

were to have been obtained by 31 January 2004. Although thescheme may be expanded in the future to cover other greenhousegases, for the initial phase it only covers carbon dioxide.
The scheme will work on a ‘Cap and Trade’ basis. EU memberstate governments are required to set emissions limits or ‘caps’for all sites (known as installations) in their country that are cov-ered by the scheme. Each installation will then be allocatedallowances equal to that cap for the particular phase in question.For the first phase (2005–07) all allowances will be allocated freeof charge. The allowance allocations for each installation for anygiven period (the number of tradable allowances each installationwill receive), will be set down in a document called the NationalAllocation Plan (NAP). This plan will cover the whole of the UK.The overall allowances for the period for each installation will thenbe broken down into annual amounts.
Installations that reduce their annual emissions to below their allo-cation of allowances can trade their surplus allowances on the mar-ket or bank them (storing them for use in future years). Installationsthat need additional allowances to cover their annual emissions willbe able to buy them from the market. A reconciliation of allowancesand emissions will need to take place on an annual basis, completedby 30 April each year, for the preceding calendar year.
Many city and town councils also have excellent programmesaimed at carbon emissions reductions, including Enfield, Merton,Leicester, Nottingham, Oxford, Brent and Bristol. A quick trawlthrough their websites will give a good flavour of what they aretrying to achieve in their different ways to reduce emissions.
INDIVIDUALS
People can save lives in the changing climate, and behaviour pat-terns will have to adjust with the changing conditions. People shouldbe able to wear more or less than usual, or go home early, or takea few days off. In the heat wave of 2003 security guards at theLouvre in Paris no longer tried to prevent tourists from soaking theirfeet in the fountains because as one said, ‘at this temperature weunderstand that people have to get cool’, and across the ChannelLondoners were jumping into the fountains in Trafalgar Square.
A range of techniques for coping with, and surviving climaticextremes are available and should be taken on board by a genera-tion who will have to get used to it, whether they be a train driverin Paris in the August 2003 where heat wave speed limits wereimposed in an effort to reduce the levels of ozone, or a facilitiesmanager who takes the decision to shut down the Treasury buildingin London and send everyone home because it is too hot to work.
314 Adapting Buildings and Cities for Climate Change
Roaf_Ch14.qxd 29/10/04 7:01 PM Page 314

THE INTERNET AND THE MEDIA
The Internet is the most amazing source of future-proofing ideas,opportunities, strategies and experiences in the world. It is so fast-moving and all-pervasive that new ideas become universally availableinstantaneously. It can also peddle agendas and well-disguised lies,in the form of apparently ‘high-end’ information and guidance thateffectively promotes the interests of the funding organization of asite. It also works for the truth, in that a search engine like Googlesorts information according to patterns of its use, a system that canbe manipulated by clever Webmasters. With determined interroga-tion, however, that is, looking through all the pages on a subject,many sides of a discussion will be aired and a broad perspective ona subject can be enjoyed in the comfort of one’s own home.
The press is also very important in educating the public with keymessages, such as the fact that when watering gardens, one sprin-kler uses in an hour what a family of four consumes over a week.Such information could change habits.16
Many of the references in this book come from papers, journalsand the Internet. That is because of the rapid developments in thefield, which means that books resulting from events of recentmonths are not yet published and the Internet, newspapers andmonthly magazines are thus very important where speed and flex-ibility of response are an adaptive opportunity. However, the down-side is that the ‘opinion forming’ journalists need to be very wellversed in the issues, and to provide first class copy on those issuesif they are to help turn the ‘zeitgeist’ of the general public, and theship of government, in more sustainable and effective directions.
The architectural press has unfortunately suffered from too manyjournalists who are trained in related disciplines such as philosophy,art history and history, or are architects who perhaps never com-pleted their studies or practised and have little grasp of how build-ings ‘work’. It is not uncommon to read articles in which buildingsare described solely by how they ‘look’, on the ‘philosophy’ or ‘sym-bolism’ of a building, as seen by the journalist. This ‘opinion-based’reportage reflects the way assessment of work goes on in Schoolsof Architecture, as staff and students proffer opinions on design. Anexample, in the reporting of Will Alsop on going round Tate Modern(a great example of a recycled building) gives real cause for concern.He was reported as saying that it was like ‘going round a shoppingcentre’, and his analysis of the single greatest threat to modern archi-tecture being the local planning authorities was that it put power inthe hands of a group who ‘by and large don’t have a lot of vision’.And, demonstrating the breadth of his own vision perhaps, he alsocalled the Georgian architecture of Bath ‘boring . . . too many hanging
The players 315
Roaf_Ch14.qxd 29/10/04 7:01 PM Page 315

baskets’ and he said that it is a better time to be an architect in theUK than it has been for years because ‘there is no predominant styleany more’. ’Suddenly ... there would appear to be no rules.’17
What many architectural correspondents, and architects for thatmatter, find difficult to do, perhaps because they are not trained todo so, is to report on how buildings ‘perform’. The comparison ofthe energy consumption per square metre of the buildings of Bathagainst those of a modern development would be interesting anduseful, providing some ‘evidence’ for use in improving future designs.
One valid defence for such low levels of reporting is that archi-tects and engineering firms often will not brook open criticism oftheir buildings in the press. At least one, well-known, British archi-tectural journalist was effectively banned from candid comment-ing on buildings by her editor, because a ‘great man’ of architectureslapped a writ on his desk the morning after she had dared tovoice a criticism of his latest masterpiece. The press has quiteeffectively been gagged by the powers that be in the profession,and therefore many ordinary readers will continue to be surprisedthat there appears to be little intelligent discussion in the news-papers about buildings.
QUANGOS
The government has tried, in part, to remedy this by funding CABE,18
the architectural industry watchdog designed to help raise stand-ards of building and architectural design in the industry. In February2003 its influence on the building markets was strengthened whenits £4.4 million budget was increased to £10 million. It was alsogiven a series of new responsibilities to ensure that the 200 000new homes in the Communities plan would meet a high designstandard. This include the massive £466 million investment plannedin the Thames Gateway area and the £164 million for Milton Keynes,Ashford and the M11 corridor. Tony Blair has promised to person-ally oversee the Thames Gateway development.19
CABE now has its fingers in many architectural pies, and inNovember 2003 also proposed that the Building Listing Process,by which buildings are protected under the law from demolitionbecause of their architectural merit, be passed over, as its reten-tion would block a significant regeneration project. This proposalwas soundly rebutted by the traditional defenders of the Britishlandscape, both English Heritage and the RIBA.
RIBA President George Ferguson rejected the idea saying:
The RIBA believes that the sole criteria for listing should be those of archi-tectural, cultural and historic importance and that matters of viability andeconomy should be dealt with solely by listed building consent.
316 Adapting Buildings and Cities for Climate Change
Roaf_Ch14.qxd 29/10/04 7:01 PM Page 316

He maintained that CABE’s proposal would ‘corrupt’ the listingssystem and distract English Heritage from its main role in assess-ing the historic significance of any building.20 But CABE has usefulroles and has acted as a funnel for funds into improving quality inthe built environment and education on it. Unfortunately its tenetsof what constitutes ‘good design’ are based on the opinions ofmembers of its panels, such as the fashionable architects who arebiased in favour of the fashionable paradigms of design, which theypromote in their own work. CABE is ultimately no more nor lessthan a ‘high profile’ government quango, led by individuals whocontrol money and therefore have power.
What comes out of such a cocktail of interests will hopefully beindependent of who signs the cheques. The money may have beenbetter spent in completing Post Occupancy Evaluations of all themajor buildings in London to see how well, or how badly theyactually perform, an exercise that would educate us far more thanhearing what a particular CABE member thinks of a particular build-ing. In March 2004 one senior member of CABE was investigatedfor a conflict of interest, after people raised concerns that devel-opments proffered by his own company for review by CABE designquality panels always came out with high marks for excellence,unlike a number of other developments.
ARCHITECTS
What ethical and moral responsibilities does the profession have?In his book Streets for People, in 1969, Bernard Rudofsky wrote,and no doubt in part as a response to the brutal redevelopmentof many city centres at that time:21
Unlike physicians, today’s architects are not concerned with the generalwelfare; they are untroubled by scruples about strangling the cities andthe misery that this entails. Architects never felt the urge to establish ethical precepts for the performance of their profession, as did the medical fraternity. No equivalent of the Hippocratic oath exists for them.Hippocrates’ promise that ‘the regiment I adopt shall be for the benefitof my patients according to my ability and judgement, and not for theirhurt or for any wrong’ has no counterpart in their book. Criticism withinthe profession – the only conceivable way to spread a sense of respon-sibility among its members – is tabooed by their own codified standardsof practice. To bolster their egos, architects hold their own beauty con-tests, award each other prizes, decorate each other with gold medals,and make light of the damning fact that they do not amount to any moralforce ...
In fact, since this was written the Architect’s Registration Board,the body with the Statutory responsibility of registering UK
The players 317
Roaf_Ch14.qxd 29/10/04 7:01 PM Page 317

architects, as opposed to the Royal Institute of British Architectswhich is really a professional club, included in its Code of Conductan implied professional Duty of Care relating to their wider socialresponsibilities,22 stating that:
StandardIn carrying out or agreeing to carry out professional work, Architects shouldpay due regard to the interests of anyone who may reasonably be expectedto use or enjoy the products of their own work.
5.1 Whilst Architects’ primary responsibility is to their clients, they shouldnevertheless have due regard to their wider responsibility to conserve andenhance the quality of the environment and its natural resources.
What teeth such matters have in law is unclear, although archi-tects do have a tried and tested legal Duty of Care, under theLaws of Tort, to avoid injuring someone, damaging their property,or causing financial loss due to inadequate expert advice.
Design at what cost – a moral issue?
We have seen in the previous chapters that modern prestige build-ings often carry a very high environmental cost, in terms of theenergy they use and, in many, the risks they pose to their occu-pants and owners, including the financial penalties of being landedwith very high cleaning and maintenance costs. This disregard forthe ‘cost’ of a building to its owners is reflected in the growingtendency for buildings to come in well over time and over cost onbuilding budgets. This disregard for the client’s welfare first shockedthe British public when they were forced to pay for what turnedout to be the billion pound ‘Millennium Dome’ fiasco. Hackles havebeen kept raised by the sheer audacity of the insouciance of archi-tects to the implications what such costs may mean.23
The proposed £750 million design of the new Wembley stadiumwill ultimately be reflected in the ticket price fans have to pay for aseat in the stadium.24 The University of Birmingham had to cancelits landmark library following a dramatic rise in the estimated budgetfrom the original £100 million to £170 million in September 2003. Isit ultimately the students through their fees who will in future haveto cover the cost of doing expensive designs that are then scrapped?Is it the people of Wales who will have to pay for the rapidly esca-lating costs of the Welsh National Assembly in Cardiff, where uncon-trolled spending led to a ban on regular monthly payments todesigners, which was replaced by the Assembly’s agreement to payonly when individual work packages are complete. The move fol-lowed the Audit Commission’s investigation into why the original costof £12 million had risen to over £30 million in an attempt to stop
318 Adapting Buildings and Cities for Climate Change
Roaf_Ch14.qxd 29/10/04 7:01 PM Page 318

the practice of what some saw as the signing of blank cheques forthose firms involved in the construction of the project.25
The most publicized over-spend to date is where the people ofScotland will pay for decades for the new Scottish Parliament build-ing at Holyrood, designed by the Catalan architect, the late EnricMiralles. The cost of this building has risen from £37 million to£375 million, that is, around £150 for every one of the 2 345 000homes in Scotland.26 The fact that the designer knew nothing aboutthe British climate, people and building industry of Scotland mustsurely have added to these ridiculous costs and also to the risk offuture building failure. Miralles designed many complex windowsthat stand proud from the face of the building, and which will atevery joint potentially fail. This may have been a mistake, exacer-bated by the fact that it was such a ‘tricky’ solution that many ofthe windows as built did ‘not quite fit’. In addition, future main-tenance and cleaning bills on the structure will be very high, eachof those outstanding windows forms a cold bridge out into thechill winds of the windy city, and will deteriorate fairly rapidly, par-ticularly in the increasingly wet and windy, and scorching, futureclimates we expect. Perhaps here a wrong decision on the wrongbuilding will be made worse by a changing climate.
Competitions
Many have questioned the role of the ‘Design Competition’ in someof the above over-spends. For example, in May 2003 the EuropeanCommission received a 20 page complaint about the ScottishParliament building claiming that the competition that was won byMiralles disadvantaged some entrants unlawfully; so suggesting thatthere were breaches in EU regulations on the letting of contractsand secrecy and political bias over the selection of the site.27 Somebelieve that it was solely on the preference of the then Scottishleader, the late Donald Dewar, that the project was given to thelate Enric Miralles.
What we do have is a system in which the judges of fashionablecompetitions often include many fashionable architects whose lifework has been devoted to the promulgation of a later 20th centuryparadigm of prestige architecture. Reflections of their own style con-victions will become apparent in their choices of competition win-ners, so setting the benchmark standards of what constitutes ‘greatarchitectural masterpieces’. Unfortunately, the greater the ‘master-piece’, typically the greater its environmental impacts. Issues of envi-ronmental performance figure nowhere in the requirements of suchcompetitions and the resulting buildings, often ‘evaluated’ for theirperformance after construction, prove to be ‘nightmare’ buildings.
The players 319
Roaf_Ch14.qxd 29/10/04 7:01 PM Page 319
In October 2003 the Laban Dance Centre in Deptford, southeastLondon, won the £20 000 Stirling Prize for Architecture. The judgeswere Julian Barnes, novelist, Justine Frischmass, singer from theband Elastica, and others. Technical competence to evaluate theperformance of the buildings was obviously not a core require-ment of the judging panel. Designed by the Swiss team of Hertzogand de Meuron, it was a popular win. The sealed-envelope, fullyair-conditioned building on a waterside site could easily, and verypleasantly, have been naturally ventilated, in parts at least. Therewas no consideration of its environmental performance taken intoaccount in the judging and the current and long-term running costsof the building were never discussed by the press or the judgesof the competition.28
Exhibitions
Well-known architects get high profile exhibitions at the best ven-ues. It is a fact of life, because certain designers dominate thearchitectural press, the competitions and the zeitgeist of the late20th century public who consider them to be the ‘maestros’ ofarchitecture. The fact the famous often sit on the panels that choosethe designs of famous offices, often their own, for display is merelyan indication of their global excellence – perhaps?
The education of architects
Engineers are crucial to the solution of these [climate change] problems,but it might be that they could be avoided in the first place if the edu-cation and training of engineers was to include a bit more about the globe’sessential life-support systems. It is after all these systems which ensurethe habitability of our planet as it spins in the vast spaces of the universe.
HRH Prince Philip, writing in the January 2000 edition of the magazineIngenia, the Journal of the Royal Academy of Engineering
What about the basic concerns of the designing professions, interms perhaps of their ‘wider responsibility to conserve and enhancethe quality of the environment and its natural resources’ or eventhe interests of their clients.
On one aspect of their professional liability they have been shownto be wanting. Architects are, apparently, currently poorly educatedin their duties under the law with regards to Health and Safety. Astudy by the Health and Safety Executive (HSE), published in May2003,29 looked at designer’s compliance with the ConstructionDesign and Management (CDM) Regulations of 1994 and foundarchitect’s awareness of their duties woefully inadequate. The high-est percentage of the 85 construction-related deaths between
320 Adapting Buildings and Cities for Climate Change
Roaf_Ch14.qxd 29/10/04 7:01 PM Page 320

2001 and 2002 were caused by falls from height and the reportconcluded that ‘designers are often abdicating their responsibilityto reduce risk in relation to work at height by leaving it to the prin-cipal contractor without first considering how they could changethe design in a way that would make it safer to build, clean ormaintain a building’.30
Many students in schools of architecture around the world arepoorly taught on issues of building performance. In her doctoralthesis, Marianne Ryghaug did a detailed study in Norway of howarchitects view environmental issues such as energy efficiency andfound that it has a very low status in the teaching of the subject.Architects were perceived as more ‘artistic’ than engineers andmore preoccupied with design and form. She put the blame forthis partly on architectural education, where in many schools energyand environmental courses were optional. She also identified theneed for stricter regulations and funding for demonstration buildings,although perhaps more funding for Post Occupancy Evaluationsof the actual, not the predicted, performance of buildings wouldbe money better spent, as the 1990s was a decade of extensivedemonstration building funded by the EU. The study was done ofthe Norwegian markets, but could apply anywhere.31
A report funded by CEBE, the Centre for Education in the BuiltEnvironment, found that sustainability is rarely considered in thedesign curriculum and, when it is, the subject is treated as a one-off project or tagged to an existing brief. The majority of schoolshave one or two lone individuals who teach students to use sus-tainable design features such as energy efficiency, and healthymaterials, but the RIBA and ARB, the validating bodies for theschools, it argued, should insist that the subject is demonstratedon all design projects. One Head of School said that he thoughtit was a matter of opinion whether sustainability should be thedriving force for architectural education, and his view reflects thoseof many heads of architecture schools in Britain.32 The environ-ment is not an issue to most design teachers in schools of archi-tecture, who may, or may not, feel threatened by what they knownothing about themselves.
Teaching staff over the years have often been downgraded inschools of architecture so where a school had individuals teach-ing lighting, services, construction and structures they may nowhave one or two generalists, who will often teach by case stud-ies rather than getting students to grips with the basic principlesof building physics and performance. This may be because theyreally do not have a firm grip on the basics themselves, and/orbecause the ‘lighter touch’ of this approach complements the studioteaching style prevalent in many schools.
The players 321
Roaf_Ch14.qxd 29/10/04 7:01 PM Page 321

So what do they teach in schools of architecture?
Some of the best teaching on environmental issues takes place inthe American Schools of Architecture,33 often not greatly encour-aged by some heads of school. This was the impression given byan extraordinary website that has recently been pulled that showedhow distressed students at the Department of Architecture at theUniversity of California at Los Angeles were losing their rights topragmatic teaching in favour of a ‘highly’ theoretical approach todesign – the kind that has resulted in many visually arresting build-ings around the world, the kind of buildings known as the ‘pointy’,the ‘falling over’ and the ‘blob’.
Many of the counter-intuitive forms of such buildings have beenlargely influenced by ‘deconstructionism’. The following section ondeconstructionism was inspired by an important recent paper on thesubject by Nikos Salingaros.34
Deconstruction is a method of analysing texts based on the idea that lan-guage is inherently unstable and shifting and that the reader rather thanthe author is central in determining meaning. It was introduced by theFrench philosopher Jacques Derrida in the late 1960s.35
Deconstructionism disaggregates a specific text or building andthen reassembles the components in a manner that makes theviewer look at the building not in terms of its formal function butasks the question why the architect designed it in that particularway. It is about the ‘signature’ of the designer.
Deconstructionism’s most visible manifestation is in architecture,in a building style characterized by broken, jagged and lopsidedforms, evoking physical destruction. Salingaros states that archi-tectural theory has embraced deconstructionism in order to reversearchitecture’s main raison d’être: to provide shelter. Architecture’sgoals happen to be precisely what ostensibly Derrida rejects: aesthetics, beauty, usefulness, functionality, living and dwelling.The randomness of the buildings this approach produces36 is theantithesis of nature’s organized complexity. Housing buildings suchas scientific departments, university buildings and museums, whosefunction is to enhance and complement the order of the universe,in chaotic jumbles of form, is an often unnoticed irony.
Otherwise knowledgeable clients, including academics, havebeen seduced to commission tortuous buildings in the decon-structionist style, applauded by fellow architects and consideredugly, odd and useless by ordinary people. Salingaros builds up acareful picture of how forces combine to make such buildingsapparently ‘acceptable’ to those commissioning buildings, includ-ing its incomprehensibility, the silliness of people who do not wantto appear not to understand it, the desire of architects to ride a
322 Adapting Buildings and Cities for Climate Change
Roaf_Ch14.qxd 29/10/04 7:01 PM Page 322

wave of stylistic fashion for fame and profit, the desire to rejectthe ‘context’ of a building, and the desire of some architects tobe seen as ‘leading edge’ and ‘innovative’, hiding behind phrasessuch as fractals, complexity, emergence, chaos as well as theirmore conventional and perhaps more potentially questionable latemodernistic terms, such as transparency.
Roger Scruton37 pointed out that:
deconstruction . . . should be understood on the model of magic incanta-tion. Incantations are not arguments, and avoid completed thoughts andfinished sentences. They depend on crucial terms, which derive their effectfrom repetition, and from their appearance in a long list of cryptic syllables.Such incantations are a part of a ritual of indoctrination used to recruitfollowers, attracted by the extreme scepticism and disbelief that lies atthe heart of the theory; this cult demands total emersion,38 and humanbeings seem to be inclined to fall into a kind of uncritical group-think.
One should not underestimate the destructiveness of decon-structionism that is now becoming institutionalized, particularly inthe academic faculties of architecture in universities around theworld, where the impact of the theory is compounded when theadministration also then commissions a high profile decontructionistbuilding which effectively turns the whole school, and the univer-sity, into a training ground for decontructionists. Few people, design-ers, clients or architects, are keen to look foolish by admitting they
14.1.‘The Emperor has no clothes!’(Copyright Louis Hellman 2004)
The players 323
Roaf_Ch14.qxd 29/10/04 7:01 PM Page 323

were wrong, and now when the style is already nearing its sell-bydate, those buildings that were commissioned two or three yearsago are coming to site and the bandwagon rolls on.
After their initial infatuation with deconstruction, some architectshave turned to other wider influences for design inspiration, suchas ‘blobs’ or ‘folding’, a reflection of the fact that deconstructionis not a style that can be adapted or evolve to meet changingneeds and as such is already ‘passé’ with some architects.
Cities around the world are now seeing the next generation of‘blobs’. In the UK the first famous blobs were the four silver metalblobs of the Sheffield Centre for Popular Music, that was so inap-propriate for its surrounding brick terraced streets.39 Nearly a decadeon the buildings remain getting dirtier and dirtier as local groupscannot afford the high cleaning costs. The Centre folded, althoughpeople have tried to use these funny building forms for differentactivities subsequently, none very satisfactorily. Like the Dome,the shapes are not quite right for anything.
The largest UK blob is four storeys high and wrapped in a skindecorated with 15 000 spun aluminium discs painted blue. It is thenew Sainsbury’s supermarket in the Bull Ring redevelopment inBirmingham, designed by Future Systems and opened in the sum-mer of 2003. It was described as ‘Top of the Blobs’ by JonathanGlancy of the Guardian, and it makes no gesture at all to ‘fit in’to its context of surrounding buildings. It was hailed by Glancy as‘architectural entertainment’.40
14.2.The Museum of Popular Music inSheffield. (Source: SteveSharples)
324 Adapting Buildings and Cities for Climate Change
Roaf_Ch14.qxd 29/10/04 7:02 PM Page 324

Any end of year show at an architecture school will be domi-nated by blobs and shards, not least because many of the teach-ing staff are skilled at teaching blob design, which relates largelyto digital simulation skills. The computer images of blobs look stun-ning and many schemes are marked in schools by the quality ofthe digital presentation, rather than whether they illustrate a build-ing that would work, could be used, or would be liked by its clientsor its surrounding community, let alone what its impacts would beon the local, regional and global environment. More than a fewteachers in schools of architecture would not consider it necessary,desirable or conscionable to mention the actual construction orperformance of a building, its buildability or functionality, during thestudio tutorials, and in some cases students can pass thoughfive years of architectural education being virtually illiterate onperformance-based subjects. They then emerge into the offices ofunsuspecting practitioners who are expected to educate them inthe boring realities of how buildings work and are built, while pay-ing them for the privilege.
Peter Cook, head of the Bartlett School of Architecture, and ablob designer himself, was very worried about the increasing obscu-rity of his students’ work:
Some of Britain’s brightest students are producing work that not even theirexperienced tutors can understand, never mind clients, planners and thepublic . . . During last year’s summer exhibition I was often puzzled andbemused by the obscurity of intention, of brief or nature of the pursuit . . .lovely stuff that you had to play guessing games with . . . we are in dan-ger of collective headiness sustained within a ‘bubble’ of arcaneness.
Cook said that he would in future personally check that work isbetter declared and described.41
In the UK, however, this is changing fast as the RIBA and theARB have got together to ensure that teaching standards acrossthe board are of an adequate standard, and if not they withdrawtheir recognition from that school in an effective system of polic-ing standards in education.
One of the most effective ‘exclusionary’ techniques used by‘theoretical’ teachers and deconstuctionists alike is to brandtraditional architecture as bad, retrograde, non-innovative and animpediment to progress, eliminating solid traditional buildings fromconsideration in the teaching studio, or the market place.
Leon Krier expressed the view that architects like Rogers andFoster, arch proponents of the great British ‘glass box’ tradition, inparticular ‘have too much power’, and in agreeing with him RobertAdam said it was ‘offensive that they are so dogmatic . . . Theybelieve the future is theirs and there is no other way. You are a
The players 325
Roaf_Ch14.qxd 29/10/04 7:02 PM Page 325

traitor to the future if you disagree with them. It is intolerant.’42
Unfortunately, adaptability and flexibility are two of our survivalmechanisms, and it may be that just as we end up with whiteelephant buildings our changing environment will result in whiteelephant architects as well.
Salingaros states that ‘It is unlikely that those converted to decon-struction can be persuaded to abandon their irrational path. Sanityand rationality, however, are likely to be restored among a futuregeneration of architects.’ We return here to the notion of conven-tional wisdom, represented by the established theoretical ‘design’-driven teachers in schools of architecture:43
Keynes, in his most famous observation, noted that we are ruled by ideasand by very little else . . . But the rule of ideas is only powerful in a worldthat does not change. Ideas are inherently conservative. They yield notto attack of other ideas but to the massive onslaught of circumstanceswith which they cannot contend.
The economic and environmental context, around the glass houses,the shards and the blobs, is changing rapidly, and it is this needto respond to these changes that will drive society back to demand-ing robust buildings rather than ‘architectural entertainment’,because the former are capable of adapting to those changes whilethe latter are not.
The most celebrated proponents of deconstruction are American-trained architects, trained to design sealed, highly serviced build-ings. The buildings are little more than timber or steel framestructures with cut or bent plywood-like materials, metal or plastics bent and moulded as thin, tight skins over the framingstructure. Windows are often difficult to insert in this type of build-ing and they are few and far between. These air-conditioned andartificially light structures are built more like a boat hold than a build-ing. Cold bridging and insulation in such buildings are real problemsand, due to their lack of opening windows, they are impossible tooccupy during the power cuts. They thus use extremely high lev-els of energy and are responsible for high levels of emissions. Theyare in the very high-risk category of building in the 21st century,up there with the steel and glass boxes.
In light of the importance of ‘future-proofing’ our buildings andcities against climate change the time may well have come to splitarchitectural education into two distinct arms, one for those pri-marily interested in learning graphic and digital skills and anotherfor those interested in becoming more pragmatic building design-ers who are specialist in, for example, designing low energy andlow impact buildings. Then it would be clear to students, who willincreasingly have to pay for five years of their university educationthemselves, exactly what they are getting for their money.
326 Adapting Buildings and Cities for Climate Change
Roaf_Ch14.qxd 29/10/04 7:02 PM Page 326

POWER IN THE BUILDING INDUSTRY
There has been, in the term of this current UK government, a lotof support for high-end ‘design’ and the works of fashionable archi-tects who were seen to represent ‘Cool Britannia’. Tony Blair hasput considerable personal effort into lobbying for large design firms.He stepped in to help Foster and Partners and Arups scoop a£1.2 billion commission to extend Beijing airport in Autumn 2003.At a face-to-face meeting with Chinese prime minister Wen Jiabaoon his summer trip to Beijing, Mr Blair asked Wen Jiabao and pres-ident Hu Jintao to recognize the expertise of the UK in prestigiouslandmark projects around the world. His decision to do so camewhen two UK firms, Fosters and Vector Management, were puton the short list of three. Top-level lobbying for the work by thegovernment had gone on for two years.44
Powerful firms carefully place key men in key positions of politi-cal influence. Marco Goldschmied, a Director of Richard RogersPartnership, and ex-president of the RIBA, put in a bid to advise TonyBlair directly on sustainable development as one of 15 expertswho will provide advice as part of a Sustainable DevelopmentCommission,45 chaired by environmentalist Jonathon Porritt,46 but hewas not chosen. This followed on from the work done by RichardRogers himself, former Chair of the Government’s Urban Task Force,who was also the Mayor’s Chief Adviser on Architecture and Urbanismand the Chairman of Richard Rogers Partnership (RRP). He was orig-inally appointed by the Mayor of London to this post as a consult-ant in April 2001, supported by a small group in the Architecture andUrbanism Unit (A�UU). Unfortunately there arose during his timethere a range of ‘conflicts of interest’, including the weight given tohis deliberations on the future of tall buildings in the capital. Otherminuted conflicts of interest arose over his bids for work in a rangeof projects, although particular care was taken to ensure that he‘stepped outside’ when such conflicts arose during meetings.47
Real concern about too much design work going to a few largefirms was also voiced by the Office of Fair Trading, which wasasked by the Better Regulation Task Force in May 2003 to launchan inquiry into the government’s procurement policy because theyclaimed that small and medium-sized design and construction firmswere being excluded from government construction contracts.48
Both larger and smaller firms however will have to address theneeds for providing more resilient buildings and so climate changeissues cut right across the industry.
ENGINEERS
It is not surprising that in an age of ‘machines for living in’ engi-neers dominate the building process. Architects, who seem to be
The players 327
Roaf_Ch14.qxd 29/10/04 7:02 PM Page 327

happy to pass on as much design liability as possible to anyonewho will take it, often transfer their challenging designs to engi-neers and rely on them to make them work. The engineers whohad to try to make the original design of the GLA headquartersbuilding work, had their work cut out for them. They had to designout much of the glass on the roof, and try to control the indoorair temperatures with the sun beating down through the envelopeinto the building from above – a task that can only be done byusing not insignificant amounts of energy to remove the heat oncein the building. One could certainly ask whether there is a placefor glass roofs in the design of 21st century buildings.
A great consolation for engineers over the past decades since‘modern’ offices started to overheat in the 1950s, is that engi-neers are typically paid according to how much plant and ductwork they can get into a building, so the more environmentally‘innovative’ the project, the more they get paid to rectify the basicdesign mistakes of the architect.
If we are ever to get green buildings we must ensure that thiscontractual arrangement is promptly changed to ensure that engi-neers are fairly paid to reduce energy consumption, not encour-aged through their contracts to increase it. Engineers should workside by side with the architect, from the first days of the brief, toensure that the form and the fabric of the building itself is usedto minimize its costs and impacts, not expensive machines.
Terry Wyatt, an inspirational President of the Chartered Instituteof Building Service Engineers in 2003/04,49 in his inaugural speechentitled ‘Adapt or Die’, outlined the exciting possibilities for engi-neers who will have to re-tool for a business climate in which thetraditional work of building services engineers is shrinking whilethey will have to bear the brunt of pressures to reduce waste inthe construction industry by 30%. He identifies that work such ascalculations, sizing, positioning and coordination, specification,costing, manufacturing and the construction and fitting out of thebuilding with traditional air conditioning systems will diminish. Thiswork he regards as the ‘filling in a sandwich’ between one ‘sliceof bread’ that involves the briefing, footprint design, concepts andbudgets for the building and the other slice that includes opera-tion and maintenance work to keep the building functioning welland to make future change possible.
He identified two key pressures affecting the traditional work ofbuilding services engineers as globalization and standardization.However, he represents the industry that makes buildings work, andthis design knowledge will be increasingly important in the buildingdesign process. Engineering work could thus become more centralrather than less so in this process. He demonstrated how farsighted
328 Adapting Buildings and Cities for Climate Change
Roaf_Ch14.qxd 29/10/04 7:02 PM Page 328

companies are increasingly well positioned in the market place, suchas Colt in solar shading, Nuaire in efficient air-systems equipmentand Thermomax in solar thermal collectors, as engineers becomekey players in increasing building efficiency.
The biggest opportunity, he saw, as actually being offered by cli-mate change was government efforts to reduce carbon emissionsby 60% by 2050, accompanied by targets for energy efficiencyand renewable energy over the next 20 years. He describes therecent Energy White Paper as throwing down the gauntlet. Carbonmanagement offers huge opportunities for services consultantsand the wider industry, and the building services industry has amajor opportunity to be at the forefront of carbon managementwithin buildings. He even suggested that engineers would be wellplaced to become key players in the carbon trading markets, aswell as growing into the role of building-related renewable energyspecialists using, for instance, wind, solar, biomass and water power.
Hear we see a real visionary, assisting his members to come toterms with the challenges of the coming decades and helping themto strategically position themselves in the emerging market placesin what is an excellent example of ‘profession continuity planning’,an exercise essential to the survival of all professions in the com-ing decades.
CIBSE has intelligently sought to educate its members withhigh-quality annual conferences and a wide range of specialistgroups who meet to inform the membership of developments,and act fast and effectively to pre-empt the changes happeningall around. One of these is the need to begin to calculate the climatic performance of buildings for future climates, and theirclimate change group has been developing a dataset for futureclimates so that decisions made today about buildings that willhopefully stand for 100 years, can be tested against future climates.We saw how Spain has courted environmental disaster by basingthe calculations for the building of the canal from the Ebro riverto the south of Spain on climates of 20–50 years ago.50 Theyshould in fact have been done on the basis of river flows in 2020or 2050.
BUILDING OWNERS, OCCUPIERS ANDEMPLOYERS
It’s ‘wake up time’ for building owners and users, who have aresponsibility to future-proof their own interests against the exi-gencies of climate change, terrorism and fuel insecurity. All busi-nesses should now have a continuity planning strategy to includeemergency procedures for all events. The global corporate real
The players 329
Roaf_Ch14.qxd 29/10/04 7:02 PM Page 329

estate network has a range of strategies they promote, including,to list but a few:51
● Shift from high rise to low rise with a preference for lower leveloffices.
● Less visible external signage.● Careful lobby design.● Parking strategies.● Designs for evacuation including location and design of stair wells.● Security in terminology in leases and insurance policies.
Extreme climate events and blackouts over the summer of 2003reinforced the need for businesses and building owners to makepreparations for the repetition of such events.
It is a requirement under UK Health and Safety legislation thatemployers may face investigation and prosecution by the Healthand Safety Executive (HSE) if they fail to devise suitable contin-gency plans for emergencies. It is envisaged that claims couldarise from workplace accidents caused by the sudden loss of lights,power to lifts or failure of air conditioning systems in hot weather.Panic-induced trampling could occur, particularly if personnel arenot promptly informed about the cause of the failure. Stress claimscould be brought, particularly if staff suspect a terrorist attack.While many employers have strategies for incidents of fire or ter-rorist attack, it is now considered necessary, by legal experts inthe field, that they should also have an appropriate response todeal with total sudden power loss, under the 1999 Health andSafety Regulations,52 which requires employers to undertake a‘suitable and sufficient assessment’ of workplace risks. Extremeweather events were involved in most of the summer 2003 black-outs and so this issue should be factored into business planningfor blackouts in the future.
‘There are certainly identifiable dangers associated with swift andprotracted power failure at work. Further widespread electricity fail-ures are foreseeable. Accordingly, there is a compelling argumentthat a risk assessment should address the repercussions of sucheventuality,’ said Peter James, a health and safety lawyer at ParabisLaw in December 2003. Secondary lighting sources, generators andevacuation procedures were cited as primary options, but what itis not possible to do is to provide air conditioning over a long periodfor a high-energy building with back-up generators alone.
Accidents during darkness, complete or partial, could lead toprosecution. Health and Safety prosecutions are worrying becauseliability is absolute save for the defence of reasonable practicabil-ity and employers might argue that they had done everything thatwas reasonably practicable if they followed the HSE advice. There
330 Adapting Buildings and Cities for Climate Change
Roaf_Ch14.qxd 29/10/04 7:02 PM Page 330

is a possibility that if an employer follows the HSE guidance tothe letter but there is still a bad accident the employer might seekredress from those liabilities from the HSE.
Lawyers have commented on another dimension of the issue.Under the Building Regulations, fire safety regulations apply to thosewho build a building in the first place, or modify one. For manyyears this has meant having an ‘appropriate means of escape incase of fire’, that is, one that is capable of being safely and effec-tively used at all material times. But emergency lighting is not men-tioned, although it would be hard to argue that an escape routethat cannot be safely used when the power fails is ‘appropriate’.53
Employers also have a ‘duty of care’ under Fire Precautions(Workplace) Regulations 1997 to provide emergency lighting.Regulatory breach is an offence but does not give rise to civil liability.The quality of the emergency lighting may depend on the property’sage, and of course the diligence of the employers in ensuring thatthe regulations and legislation are complied with. Deep plan offices,with less available natural daylight obviously require more emer-gency lighting than offices with a shallower floor plan. Regular main-tenance of battery systems is also important. QC Graham Eklundwarns that legislation has enabled electricity supply companies ‘torestrict their liability for economic loss caused by negligence dis-rupting the supply’, so it is likely that ‘economic losses consequenton a negligently caused blackout or failure of the electricity supply’will not be coverable.54 In New York in the August 2003 blackoutsit should be noted that both simple and sophisticated systems foremergency lighting failed alike in some buildings.
Questions will arise in the law as to where liability lies wherebuildings also have to be abandoned in extreme weather events,such as the emptying of the Treasury building in the heat waveof August 2003. We have known since the 1960s that certain build-ing types, those with excessive glazing in particular, overheated inhot weather. It could, and no doubt will be, argued that becauseof the quantity of related information in the public realm on thesubject, that designers could be held liable for buildings that pro-vide unnecessarily uncomfortable temperatures during hot spells.This has yet to be tested in the courts but a good case could bemade. Similarly where loss of life occurs during flood events dueto insufficient attention being given to the problem at the designstage then designers could again be held culpable.
INSURERS
Insurers know what the problems are, they pay out on them. Inrelation to flooding they are particularly well prepared. A system
The players 331
Roaf_Ch14.qxd 29/10/04 7:02 PM Page 331

has been developed for capturing flood and storm damage data.It has been tested on a number of flood events on a pilot basis,and evaluated and refined by loss adjusters, architects and aca-demics. The system was also used to assist in establishing anational flood claims database for the UK.55
The system is called FASTER (Flood And STorm Event Reporting).The FASTER system not only streamlines the inspection of dam-aged property but provides all the data needed to build a vulner-ability database, and has been endorsed by all the key insuranceindustry bodies.
There is significant reluctance within the claims side of the indus-try, however, to change existing systems, because the main ben-efits would be to loss adjusters, consumers and to technicalunderwriters responsible for rate setting, while the benefits to indi-vidual insurers’ claims departments are less obvious.
The UK government has indicated that its UK Climate ImpactsProgramme will now have more emphasis on seeking ways to adaptto climate change, including ways to make buildings less vulnera-ble to storm and flood damage. Government may have a percep-tion that the insurance industry has considerable detailed data onthe effects of storms and floods on buildings from its claims recordsand may increasingly be looking to tap into such data.
The UK insurance industry could perhaps follow the example ofthe National House Building Council in the UK and the Institute ofBusiness and Home Safety in the USA, by employing their owninspectors, or training government inspectors. In Australia, insurersand mortgage lenders have gone even further. They have drawnup their own set of standards for certain types of buildings. Thestandards are called the ‘Blue Book’ and have in effect made theofficial standards redundant because all builders know that unlessthey follow the Blue Book, the building will not be insurable andthe bank will not lend money on it.
Another approach would be to classify new housing accordingto the build quality and specification, which would allow insurersto charge different rates according to vulnerability to windstorm,subsidence and flood. This would be similar in some ways to thedifferent groupings used by motor insurers: it would reflect therisk better, and could lead to public pressure for improvedstandards.
But in effect the insurance industry stands to be a major loserin the face of a changing climate, not only because of the esca-lating payouts for which they are responsible but also because asignificant proportion of their funds are already invested in whatcould be surmised to be high-risk buildings. Many of the moreglamorous buildings in major cities are owned by the insurance
332 Adapting Buildings and Cities for Climate Change
Roaf_Ch14.qxd 29/10/04 7:02 PM Page 332

industry, who hold significant stocks in ‘prestige’ developments.These are what is increasingly being recognized as the high-riskend of the property markets. There is a deadly Achilles’ heel inthe system. Insurance companies charge similar rates for officespace by post code, regardless of the risk an individual building,or space within a building poses. So similar insurance premiumsare charged for offices at the top of a very tall ‘target type’ toweras may be charged to a low rise robust office in a middle-sizedcity. So people in resilient buildings may be subsidising the risk ofthe target buildings, the buildings that are perhaps most vulnera-ble to extreme climate events. This unfair situation will only lastuntil the government decides to legislate that buildings should payaccording to the risks they present, or until the first clever insur-ance company divests itself of its ‘white elephant’ and high-riskbuildings so that it is itself sufficiently unencumbered by a port-folio of high-risk buildings to offer fair, lower premiums to low-riskbuilding owners, according to their actual risk vis-à-vis claims relatedto perhaps extreme climate or power outage events.
This issue also pertains to the ‘terrorist’ insurance, where officespace is charged the same premium at the top of a target build-ing as is charged for robust low provincial offices that are unlikelyto be threatened by terrorist events. Hence local councils are pay-ing top dollar around the country for now mandatory terrorist coverto, in part at least, protect the vulnerable ‘target’ assets of theindustry that provides that insurance. This again will only last aslong as government does not regulate against this monopolisticpractice or until a smart insurance company wakes up to the poten-tial to gain market advantage by charging buildings according totheir actual risk.
Architects were actually told by the insurance industry in March2003 to stop offering clients advice on ways of protecting build-ings against terrorist attacks and of providing escape routes becausethe service has recently been excluded from professional indem-nity insurance policies and it is felt by the industry that architectswould be stepping out of their area of expertise by doing so. Mostinsurers have now dropped clauses in their building insurance poli-cies that cover terrorism because insurers feel that it is not some-thing that is insurable without specialist coverage.56
This may in part explain why in a year of unprecedented pay-outs on climate events the insurance industry made a healthy profitin 2003. If architects, or engineers, started to try to quantify therisks associated with the buildings they are involved in it may leadto the growing public awareness of the relative risk of buildings,so requiring a shaking down of terrorist premiums to the detri-ment of the interest of the insurance industry.
The players 333
Roaf_Ch14.qxd 29/10/04 7:02 PM Page 333

REAL ESTATE MANAGERS
The blame for the inexorable rise in the market for prestige build-ings, that are increasingly recognized as ‘high risk’, can be laid partlyat the doors of real estate, and property portfolio, managers. Butperhaps ‘the higher you rise the harder you fall’. For the larger com-panies that have accumulated a portfolio of high-end prestige build-ings, may well be faced with plummeting rents on vulnerablebuildings, with clients gradually tending to prefer more robust, low-cost, low-impact, comfortable and less vulnerable buildings. Therewas a time in the 1980s and 1990s where the push was for higher-end prestige space in the portfolio. The more a client was chargedon a lease, the greater the cut for the property managers so thedrive was to push clients towards the high end to optimize profits.
There is an obvious need for the property management industryto start to service the requirement for resilient low-risk buildings inlow-risk locations, and the ability to track risk and performance willbe an increasingly marketable advantage in the industry. AnnualPerformance Evaluations will be a key tool of property managers inthe coming years as companies try to sort the space sheep fromthe space goats.57 The smart companies – who will not be the oneswho are locked into long-term, once-favourable leases – will alreadybe beginning to move in the direction of consolidating the ‘sus-tainability’ of their portfolio. Management and contract flexibility andadaptability here are two key adaptive skills.
INDUSTRY
Industry will do what it does best, respond to the market place.In simple terms the changing climate will lead to more demand inmany areas, and less in others. Marks & Spencer sold fewer over-coats in the 2003/4 winter because it was not cold. In Milan con-sumption of water in the heat wave of 2003 averaged 900 000 m3
a day, more than 50% more than normal.58 Tesco predicted a 100%increase in the sales of ice creams in the heat, taking out 500lorries to keep stocks supplied around the country. The heat waveof 2003 led to a dramatic increase in the sales of bottled waterof 11% on the year before, reaching a record retail value for themarker of over £1 billion a year.59
But here again the importance of Business Continuity Planningbecomes key. Many industries like the water supply industryare already prepared with their 50 year plans. For smaller bottledwater provision companies the 5 year plan with seasonal provi-sion, based on good climate-related data, will need careful thought.For major product distribution services, including those in the build-ing industry, the need to plan for extreme climate events may tend
334 Adapting Buildings and Cities for Climate Change
Roaf_Ch14.qxd 29/10/04 7:02 PM Page 334

manufacturers towards on-site provision of products, like site ice-cream making facilities at large supermarkets, if gridlock on theroads hampers delivery during periods of peak demand.
Industry, including the building industry, will have to plan care-fully over the short, medium and long term to be capable of respond-ing to, and profiting from, demand.
THE ‘AMERICA’ PROBLEM
The current occupants of the White House are putting huge effortinto denying that climate change even exists. In March 2003, amemo was exposed that advised the US Republican Party to avoid‘frightening’ phrases such as ‘global warming’ after an internal memohad warned that it is the domestic issue that George W. Bush ismost vulnerable on. The memo, by the leading Republican con-sultant Frank Luntz, conceded that the party has ‘lost the environ-mental communications battle’ and urged Republican politicians that:
The scientific debate is closing [against us] but not yet closed. There isstill a window of opportunity to challenge the science.
Mr Luntz wrote in a memo obtained by the Environmental WorkingGroup, a Washington-based campaigning organization:
Voters believe that there is no consensus about global warming withinthe scientific community. Should the public come to believe that the sci-entific issues are settled, their view about global warming will changeaccordingly. Therefore you need to continue to make the lack of scien-tific certainty a primary issue in the debate.60
The White House position that mandatory restrictions on emis-sions, as required by the Kyoto Protocol, should not be counte-nanced until further research is undertaken is a popular line fromthe Administration. Meanwhile the clock ticks on and more andmore Americans lose their lives and livelihoods to the climate.61
What is a major concern is that, not only is the American buildingtype, with its use of inefficient air conditioning systems and thin,tight-skinned, un-shaded, over-glazed, no-weight buildings beingexported to many countries, and being imposed on some like Iraq,but also that the American people will be left, when the lights dogo out in extreme weather events, trying to survive in highly vul-nerable buildings, highly exposed in their ‘continental’ climate.
CONCLUSIONS
The players in the buildings and climate change equation are toonumerous to cover comprehensively, but the reader should by nowhave an idea of the inter-connectivity of the roles of the players,and the huge step changes in all walks of our lives that need to
The players 335
Roaf_Ch14.qxd 29/10/04 7:02 PM Page 335

be taken to if we are to stabilize climate change and manage itsimpacts and survive with a decent quality of life.
Businesses, services, professions, communities and ordinary peo-ple will need ‘reorder normality’, rearrange the paths they take,and the costs they apportion, to make buildings happen, to plancarefully to future-proof their own lives. Change will touch all ofus from the fuel-poor to the corporate executive. The writing isnow on the wall, and at the heart of our response to these chal-lenges lies the ever-increasing need for resilient buildings.
NOTES AND REFERENCES
1 The notion that there is a developed and an undeveloped worldis dated in our ‘global’ society. In most countries there aregroups of people who live the ‘fossil fuel life’ and live in bigcomfortable houses, drive big cars, and are globally ‘connected’by cheap flights, cyberspace and growing trends in obesity.There are in most countries, including the United States, pock-ets of extreme deprivation, where the lack of food to eat couldbe seen as part, also, of a global problem. The global econ-omy has done nothing to break down the internationally ubiq-uitous wealth-based class systems, and is widely claimed tobe exacerbating the gaps between the rich and the poor.
By 2030 30% of the world’s population may well live inslums, according to a UN report released in October 2003. Itwarned that unplanned and unsanitary settlements maybecome trigger points for social instability in the future(Guardian, 4 October 2003, p. 17), and this is not just in thedeveloping world.
Squatter settlements in the United States and the UK mayprovide models of what will develop within or around our citiesin the future. The authors of the report claim that ‘cities havebecome a dumping ground for people working in unskilled, unpro-tected and low wage industries and trades . . . the slums ofthe developing (and developed) world swell’ (www.unhabitat.org/global_report.asp).
2 Ekins, P. (2003) Projects and Policies for Step Changes inthe Energy System: Developing an agenda for social scienceresearch. Report of the ESRC Energy Research Conference.Text available on: http://www.psi.org.uk/docs/2003/esrc-energy-conference-report.doc.
Jim Skea, in summing up: ‘emphasized the context ofthe Energy White Paper: the importance of the internationaldimension, and the need to secure international cooperationon the reduction of carbon emissions; and the importance of
336 Adapting Buildings and Cities for Climate Change
Roaf_Ch14.qxd 29/10/04 7:02 PM Page 336

assessing energy developments in a broader framework ofsustainable development, which includes issues of affordabil-ity, reliability and competitiveness, as well as carbon reduction.
‘Addressing such an agenda requires a wide disciplinaryperspective, in which engineering-economy modelling had animportant, but not exclusive, role to play. An emphasis on evi-dence was particularly important in this field: much goodresearch in a variety of relevant areas had been carried out inthe past, and this needed to be brought together through sys-tematic reviews and through research into the effectivenessof different policy approaches and into the evaluations of pol-icy initiatives that had already been implemented. There weremany issues that still needed further work, including assess-ment of the geopolitical situation, the need to invest in strength-ening the electricity distribution network, the whole relationshipbetween supply chains and the different interests of the actorsthey comprised, and the nature and role of public engage-ment. It should not be forgotten that a lot was already knownabout these issues. It might be that in this situation an invest-ment in networking existing knowledge might be more costeffective than new projects which sought to add to it. It wouldbe good if the new Research Council programmes could bearthis in mind.’
3 See http://dir.salon.com/tech/feature/2000/12/06/bad_computers/index.html.
4 Thanks to Terry Wyatt, in his 2003 Presidential Speech forCIBSE, the UK Chartered Institute of Building Service Engineers,for this idea that the building industry could follow such indus-tries into obscurity.
5 Guardian, 5 September 2003, p. 3. The fact that some regionsthat are more severely hit by droughts, or floods, will then havetheir staple crops disadvantaged in the wider markets was empha-sized when the Italian farmers’ federation said that due to theextreme drought of the summer of 2003 in 11 of the country’s20 regions, olive oil could go up by 30% in costs, that if passedon to the buyers would kill exports, leading to dire economicconsequences in the region (Guardian, 5 August 2003, p. 3).
6 Building Design, 16 May 2003, p. 2.
7 For coverage of Post Occupancy Evaluations and BuildingPerformance Evaluations see two recent books: Roaf, S. withHorsley, A. and Gupta, R. (2004) Closing the Loop: Benchmarksfor Sustainable Buildings. London: RIBA Publications; andPrieser, W. and Vischer, J. (2004) Assessing BuildingPerformance. Oxford: Butterworth-Heinemann.
The players 337
Roaf_Ch14.qxd 29/10/04 7:02 PM Page 337

8 See http://www.eurisol.com/pages/EPDirective.html and http://www.defra.gov.uk/environment/energy/internat/ecbuildings.htm.
9 See www.lga.gov.uk or ring 0207 664 3131 for more details.
10 Hampton, D. (2004) Corporate Social Responsibility. Chapter3 in Roaf, S. with Horsley, A. and Gupta, R. (2004) Closingthe Loop: Benchmarks for Sustainable Buildings. London: RIBAPublications.
11 The effectiveness of lobby groups from the voluntary sector isgrowing and many NGOs and charities, often funding by far-sighted management of major organizations, are now driving theagenda in related fields. For instance, a report commissioned byBT from Forum for the Future, a sustainable development char-ity, and published in October 2003, recommended that the gov-ernment should consider introducing binding national carbonreduction targets on a sliding scale, reaching a 60% decreaseon 1990 levels by 2050 (Guardian, 17 October 2003, p. 24).
12 Some interesting related Q&As can be seen on: http://www.odpm.gov.uk/stellent/groups/odpm_housing/documents/page/odpm_house_02625706.hcsp TopOfPage.
13 http://www.cityoflondon.gov.uk/our_services/law_order/security_planning/civil_contingencies_bill.htm.
14 http://www.statewatch.org/news/2004/jan/05uk-civil-contingencies-Bill.htm.
15 Guardian, 27 August 2003, p. 10.
16 Guardian, 5 August 2003, p. 3.
17 Guardian, 8 December 2003, p. 5.
18 Building Design, 7 November 2003, p. 2.
19 www.cabe.org.uk.
20 Building Design, 7 February 2003, p. 1.
21 Rudofsky, B. (1969) Streets for People. New York: Doubleday & Co.
22 http://www.arb.org.uk/regulation/code-of-conduct/conduct-and-competence.shtml.
23 Over budget projects are listed on: http://news.bbc.co.uk/1/hi/uk/911317.stm. See also other follies on www.follies.btinternet.co.uk/dome.html.
24 The Professional Footballers Association questioned thewisdom of spending £750 million on a new national stadiumat Wembley following news that football chiefs and the gov-ernment are set to declare that contracts for the controversialproject have finally been rubber-stamped, two years after amajor game was last played at the famous ground. The £750million cost of the project will include £352 million to build the
338 Adapting Buildings and Cities for Climate Change
Roaf_Ch14.qxd 29/10/04 7:02 PM Page 338

stadium, £120 million to buy land, £50 million for improvinginfrastructure, £23 million for demolition, £40 million for devel-opment costs and £80 million in financing costs. At a timewhen so many Football League clubs are facing financial crises,Gordon Taylor, Director of the Association, expressed his fearsthat ‘the new stadium could become a ‘white elephant’, andwas not convinced it was the best use of government (taxpayers) and FA money at such a time. Wembley had beenovertaken by events, such as the collapse of football broad-caster ITV Digital and the serious financial problems of one ofthe FA’s flagship leagues. Cardiff, Manchester and literallydozens of other magnificent stadiums have been created fora lot less and are being used by regular occupants. The factthat money is being borrowed from Germany rather than inthis country makes one wonder at the future viability of thescheme. http://www.givemefootball.com/pfa.html?newsID �456.
25 Building Design 12 September 2003, p. 2.
26 The cost of the new Scottish parliament building at Holyroodhas risen from £37 million to £375 million, while running badlyover time. The consultants fees alone are thought to exceed£60 million. £18.5 million were spent on windows that ‘don’tquite fit’ and £14.35 million was spent on extra fees to architects,engineers and cost consultants and for site running and con-struction management. Building Design, 13 June 2003, p. 1.
27 Building Design, 30 May 2003, p. 2. In May 2003 the EuropeanCommission received a 20 page complaint about the ScottishParliament building claiming that the competition disadvantagedsome entrants unlawfully, also suggesting that there werebreaches in EU regulations on the letting of contracts andsecrecy and political bias over the selection of the site.
28 Guardian, 13 October 2003, p. 10.
29 http://www.hse.gov.uk/construction/designers/index.htm.
30 Building Design, 9 May 2003, p. 3. Only 8% of designerssurveyed had been trained how to comply with the CDMRegulations. See also www.hse.gov.uk/statistics.
31 CADDET InfoPoint, Issue 2/03, p. 7. See http://www.caddetre.org/newsletter/back_issues.php.
32 Building Design, 30 May 2003, p. 7.
33 See the excellent website of the American Society of BuildingScience Educators (SBSE) on www.sbse.org/.
34 I am indebted to Nikos Salingaros, the American architect, philos-pher and mathematician for much of the following section ondeconstructionism. The full text of his important and thoughtful
The players 339
Roaf_Ch14.qxd 29/10/04 7:02 PM Page 339

paper on the subject is published in: Salingaros, Nikos (2003). TheDerrida Virus, TELOS, No. 126, Winter, pp. 66–82. Also availableonline on: http://www.math.utsa.edu/sphere/salingar/derrida.html.
35 See Encarta World English Dictionary (1999) New York: St MartinsPress.
36 Architects designing in a deconstructionist manner includePeter Eisenman, Frank Gehry and Daniel Libeskind.
37 Scruton, R. (2000) An Intelligent Person’s Guide to ModernCulture. South Bend, IN: St Augustine’s Press. pp. 141–2.
38 Lehman, D. (1991) Signs of the Times: Deconstruction andthe Fall of Paul de Man. New York: Poseidon Press, p. 55.
39 Apart from the alienating design, the architect chose a very rap-idly deteriorating surface to clad the blobs. Sheffield is a very‘dirty’ city due to the cold air inversion in the valley and theblobs looked awful within months. One very energetic group inSheffield put forward a clean-up bid, as reported here: ‘A bid toclean the grimy shell of the failed National Centre for PopularMusic has been given the brush off. Campaigners wanting tosee the tarnished stainless steel drums restored to their gleam-ing former self have failed to persuade regeneration agencyYorkshire Forward to underwrite a clean up. The group calledPride in Sheffield had lined up a £3000 bargain contract withlocal firm Stealth Access to restore the glitter to the building –wrong material – wrong shape.’ See: http://www.freelists.org/archives/ncpm/102002/msg00017.html. If such inappropriate ma-terials are used in a dirty city their deterioration in a changingclimate will be hastened. The importance of local knowledge isemphasized here, including the fact that this building was locatedin what is not a rich neighbourhood and that the £3000 requiredwas a great deal of money for them. It is a pittance when com-pared to the tens of thousands of pounds that the GreaterLondon Authority pays simply to clean the windows of its newheadquarters blob building every year.
40 Guardian, G2, 1 September 2003, p. 13.
41 Building Design, 1 February 2002, p. 1.
42 Building Design, 1 February 2002, p. 1.
43 Galbraith, J.K. (1963) The Affluent Society. Canada: MentorBooks.
44 Building Design, 7 November 2003, p. 1.
45 Architects Journal, 27 July 2003.
46 www.sd-commission.gov.uk/.
340 Adapting Buildings and Cities for Climate Change
Roaf_Ch14.qxd 29/10/04 7:02 PM Page 340

47 www.london.gov.uk/assembly/stndsmtgs/2003/stdoct16/stdoct16item05.pdf.
48 Building Design, 16 May 2003, p. 2.
49 http://www.bsee.co.uk/news/fullstory.php/aid/2733/CIBSE%92s_new_president_highlights_the_pressing_need_for_a_future_of_change.html.
50 Guardian, Society, 27 November 2002, p. 8.
51 http://www.corenetglobal.org/pdf/learning/9_11_impact.pdf. Seealso the business continuity section PAS 56 on www.thebci.org.
52 http://www.hmso.gov.uk/si/si1999/19993242.htm.
53 When the lights go out, Independent Review, 16 December2003, p. 12.
54 For an interesting case see AE Beckett & Sons (Lyndons) Ltdand Others v Midlands Electricity Plc http://www.lawreports.co.uk/civdec0.4.htm.
55 Black, A. and Evans, S. (1999) Flood Damage in the UK: NewInsights for the Insurance Industry. University of Dundee,Scotland (ISBN 0 903674 37 8).
56 Building Design, 28 March 2003, p. 1.
57 See Roaf, Closing the Loop.
58 Guardian, 5 August 2003, p. 3.
59 Observer, 13 July 2003, p. 5.
60 The text of the Luntz memo is available to download on theEnvironmental Working Group website, see www.ewg.org/briefings/luntzmemo/pdf.
61 Oliver Birkham, Washington, Guardian, 28 July 2003, p. 14.
The players 341
Roaf_Ch14.qxd 29/10/04 7:02 PM Page 341

We have seen the devastation wrought upon us by the changingclimate worsening year on year. We have counted the fallen in theclimate wars, those who have died from heat, hunger and disease,in the floods and droughts and a myriad of emerging horrors inour warming world. We can no longer give credence to the dis-believers. The war against climate change must be waged withthe utmost vigour, but what are the tactics and the weapons thatwe can take up in the ultimate battle for the planet itself?
THE INTELLIGENCE MUST BE RELIABLE
The first priority when going to battle must be to have availablehigh-quality, reliable intelligence. In the built environment, we areoften shielded from the truth by ignorance, or by people who,understandably, are keen not to reduce the market value of their‘product’. While heart surgeons and teachers have their successesand failures demonstrated in league tables in the national press,designers consider it acceptable to be ‘immune’ from the conse-quences of the performance of their buildings. A number of lead-ing designers are notoriously litigious. Stephen Brand, author ofthe excellent book How Buildings Learn, had to scrap a whole printrun of his book for the UK market because of the criticisms helevelled at one famous British architect, alleging that he producedbuildings that were often very expensive to maintain. He wasthreatened with legal action and withdrew the book, which thenhad to be altered before reprinting.1 The libel laws in Britain favoura relatively high degree of control of the media. Step one in oursearch for resilient buildings must be the flowering of a free, openand well-informed debate.
On the other hand we have excellent intelligence from the sci-entific community who, remarkably, have the extraordinary skillsto foretell the future, using simulations and scenarios,2 with which
15 THE BATTLE CONTINUES
Roaf_Ch15.qxd 29/10/04 7:02 PM Page 342
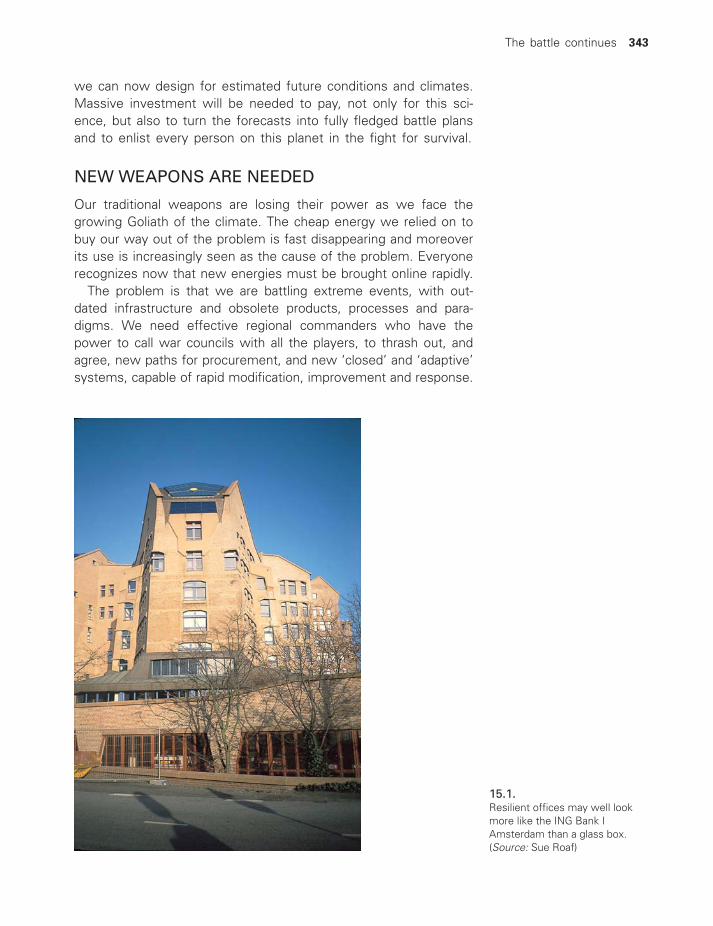
we can now design for estimated future conditions and climates.Massive investment will be needed to pay, not only for this sci-ence, but also to turn the forecasts into fully fledged battle plansand to enlist every person on this planet in the fight for survival.
NEW WEAPONS ARE NEEDED
Our traditional weapons are losing their power as we face thegrowing Goliath of the climate. The cheap energy we relied on tobuy our way out of the problem is fast disappearing and moreoverits use is increasingly seen as the cause of the problem. Everyonerecognizes now that new energies must be brought online rapidly.
The problem is that we are battling extreme events, with out-dated infrastructure and obsolete products, processes and para-digms. We need effective regional commanders who have thepower to call war councils with all the players, to thrash out, andagree, new paths for procurement, and new ‘closed’ and ‘adaptive’systems, capable of rapid modification, improvement and response.
15.1.Resilient offices may well lookmore like the ING Bank IAmsterdam than a glass box.(Source: Sue Roaf)
The battle continues 343
Roaf_Ch15.qxd 29/10/04 7:02 PM Page 343

The requirement for an annual evaluation of the performance andemissions of every public building is an obvious first start that canbe tied into global monitoring systems on the health of the planet,such as carbon taxes and trading, contraction and convergence plan-ning, and the strategic implementation of renewable energy quotasfor the built environment.
But early on, we have to face up to the need to plan for the obso-lescence of the worst aspects of the enemy, to get rid of a gen-eration of lethal technologies like the completely unnecessary sportsutility vehicles (SUVs) and the high-impact, high-emission buildingsthat have proliferated globally within the short time window of thepast 30 years. They are capable of being scrapped and recycledwithin an even shorter time frame with our improved knowledge,communications and information systems, and the global reach ofmeta-strategists, exemplified by the armies and actions created bythe Agenda 21 movement.
RESILIENT BUILDINGS: THE FRONT LINE OFDEFENCE
In the front line in our battle for survival must be a new genera-tion of resilient buildings, which would:
● Suffer less from the impacts of a changing climate than otherbuildings, being carefully placed within a robust infrastructureof transport, resources, services, jobs, food, water, and as safeas possible from the excessive stresses of climate change.
● Have fewer impacts on the people and environment aroundthem. Such buildings would:– Use as little energy as possible through good design.3
– Provide that energy, where possible, from clean, renewablesources that will not pollute nor run out.
– Reduce waste in construction, operation and demolition.4
– Be built with goods and materials that produce minimal pollution.– Not destroy fragile biodiversity and ecosystems.– Promote the health of all.– Ensure that people are comfortable, and can survive even in
extreme weather within them.
We see unresilient buildings all around us – buildings that are vul-nerable to climate change. Many are already uninsurable buildings,like the thousands of flood-blighted homes in the UK, or those alreadyfalling prey to a receding coastline. In August 2003 many homes andoffices were simply too hot to sleep,5 work or remain in and over15 000 people, many in lethal buildings, died in France in August2003. As insurers respond to the increase in climate-related hazards
344 Adapting Buildings and Cities for Climate Change
Roaf_Ch15.qxd 29/10/04 7:02 PM Page 344

with rising premiums, and the shelving of whole sections of theirportfolios of exposed and vulnerable buildings, some have predictedthat we may even see the catastrophic collapse of the insuranceindustry as a result of weather-related claims, if it cannot respondrapidly and effectively enough to the escalating impacts of climatechange.
REDUCE THE EXPOSURE AND VULNERABILITY OFPOPULATIONS
While it is impossible to move buildings and cities, growing pop-ulations can be housed in climate-safe regions, and existing pop-ulations shifted to regions where their chances of survival will beimproved during the coming decades. Where is the sense in plan-ning for major population growth in Florida or Sydney when thereis already insufficient water to meet the existing population’s needs?While people are being moved from exposed coastal locations insome countries, in many more, millions of people are still at riskfrom the rising sea. Regional planning is becoming a global issue.Every country should now have a High Commander for Sustainabilitywith real power to act.
Local authorities, who will have a good working knowledge ofwhere local infrastructures are failing in extreme weather events,
The battle continues 345
Architects:
Sue Roaf and David Woods
PV:
Energy Equipment Testing:Bruce Cross,Cardiff with Jeremy Dain,Inscape Architects, Bristol
Solar hot water:
George Goudsmit, AES Findhorn
Owner:
Susan Roaf
Location:
Oxford, UK, 51°N, 1°W, 40 mabove sea level
Climate:
Temperate
Area:
232 m2, 250 m2 including porchand sun space
15.2.Resilient dwellings may perform like the Oxford Ecohouse that has minimal carbon dioxide emissions. (Source: Sue Roaf,Manuel Fuentes and Stephanie Thomas, Ecohouse 2. Oxford: Architectural Press, 2003)
Roaf_Ch15.qxd 29/10/04 7:03 PM Page 345

should have a mandate to plan to reduce the impacts of short-and long-term climate changes.6 Reducing the vulnerability of theweakest sections of the population should be a priority for indi-viduals, organizations and governments alike, requiring immediateaction, from the putting of shades and awnings on all south- andwest-facing windows of rooms that house the elderly and young,to universally providing shaded areas in school playgrounds.
EMERGENCY PLANNING
In the short term, planning and educating for emergency warning,evacuation and support systems for businesses and communities,is vital. Much of the loss of life and property in a disaster resultsfrom the lack of effective response to the events, as was reflectedin heat waves in Chicago in 19957 and France in 2003, whereblame, in both cases, was placed largely on the shoulders of thepoliticians for their slow response to the developing crisis, and theunpreparedness of local governments in dealing with it.
Existing public institutions such as the emergency services, socialworkers and armed forces can do a great deal to reduce vulnera-bility by careful planning and a quick and effective response. Similarlyinsurers, by quick action, can reduce the social and economic dam-age following a disaster. For many years, fire insurers used to givediscounts for properties located near a fire station, and no doubtin the future other premium incentives will be available for robustand resilient buildings where future climate change risks have beenevaluated and effective mitigating strategies have been established.
15.3.Resilient buildings like thisresidence at Keble College,Oxford, designed by Rick Mather,are well loved by their occupants.(Source: Sue Roaf)
346 Adapting Buildings and Cities for Climate Change
Roaf_Ch15.qxd 29/10/04 7:03 PM Page 346

15.4.The future made possible by a new resilient building that can respond to the moving targets of the changing climate.(Source: Sue Roaf, digitally produced by Claire Palmer)
The battle continues 347
Roaf_Ch15.qxd 29/10/04 7:03 PM Page 347

CONTINUITY PLANNING: THE BATTLE PLAN
In the medium to long term, all nations, businesses, councils andgovernment departments, professions and individuals will need todraw up what amounts to a survival strategy and plan of action,and stick to it. The smarter end of the markets have already plannedwell ahead, in their well-informed Business Continuity PlanningDepartments,8 moving to medium-sized cities, away from citiessuch as London with its problems of flood potential, excessivehousing costs, poor infrastructure and large number of ‘target’buildings. They have a detailed grasp of ‘the big picture’, and youwill find a lot of ‘smart money’ already in Reading, Cambridge,Manchester, Wales, and areas where their operations are less vul-nerable to climate change, and terrorism, and there is a perceivedhigher quality of life for many workers and their families.
At a macro-scale it is possible to see how political issues, suchas those of land use planning and reform, property, human andemployment rights, privatization policies for service industries, willhave to be carefully scrutinized and reformed where necessary,as will the balance of power within different political systems, toavoid the problem, currently all too obvious, where small and self-interested minorities can have undue influence in the decision-making processes.
National and regional continuity planning, by governments andcouncils alike, must take into account that it is not just the haz-ard that is important, but exposure and vulnerability. If you put ahouse in the middle of a motorway, you must expect your chil-dren to be run over. If you put a house in a floodplain, you mustexpect it to be flooded. If you put a house on an old rubbish tip,you must expect it to subside. Buildings should not be placed nextdoor to hazardous chemical plants or oil refineries, or downstreamof dams or reservoir embankments, or on coastal mud flats knownto flood.
Society may not be able to do much to change the hazard, butmuch can and must be done to reduce our vulnerability, and tosome extent exposure, to it. Why are the overdue improvementsto our building stock so sadly lacking despite the obvious benefitsof early investment in the matter of future-proofing our buildingsagainst climate change, an issue that may amount to no more orless than life and death for many, particularly the most vulnerablein our society?9
This defining fight against climate change in the 21st century isnot about solving our problems by putting more and more machinesinto buildings, it is, to a large extent, about reducing the depend-ence of buildings on machines in buildings, and where there is a
348 Adapting Buildings and Cities for Climate Change
Roaf_Ch15.qxd 29/10/04 7:03 PM Page 348

need, of finding minimum-impact machines to meet the basic needsof those in the buildings.10
For buildings, the 19th century was the age of the great architect,the 20th century that of the great engineer, and the 21st centurywill be the age of the resilient building designer, one who combinesthe skills of the building physicist, architect, engineer, urban designerand community planner. Perhaps, it will rather be the age of designsdone by cooperatives of high dependability building consortia, inwhom we all can trust, and who are capable of new thinking andproducing the new solutions we urgently need now to survive.
IS IT TOO LATE?
Rapa Nui, or Easter Island, is a small (166 km2), inaccessible islandin the Pacific Ocean, 2000 miles from the nearest centre of pop-ulation on Tahiti, where the islanders outgrew their resources andended up destroying themselves. The available land for agriculturewas no longer sufficient to feed the growing population, theislanders cut down all the trees on the island for fuel and to buildtheir great moais, or totem statues, and without the means tobuild canoes and leave the island, they eventually resorted to warand cannibalism. Many theorists see what happened on EasterIsland as a warning to us all.11 They call it the Rapa Nui Syndrome,and ask whether it is possible that our society is going the sameway. When we look at the building industry today such fears maybe well founded. Only time will tell.
The good news is that it is not too late. We still have a gen-eration to adapt our lifestyles to survive the rapid changes occur-ring around us resulting from climate change, and to radically reducethe damage done by those lifestyles driving climate change. Thereare many positive signs: it looks increasingly as if Russia will ratify the Kyoto Agreement; people are taking very seriously theneed for Contraction and Convergence of carbon dioxide emis-sions; building regulations are tightening and people are being putback into the heart of the design process; major players such asthe insurance and energy industries are now understanding theneed to act fast to avoid the catastrophic changing of circum-stances around us; new technologies are emerging that offer great hope for the future, particularly in the fields of renewableenergy and fuels; governments are now gearing up to address theglobal scale of the war being waged around us, and the days ofglobal excess are numbered as we face up to the fact that in thevery nature of our own species lie the problems and their solu-tion. But urgent action is necessary now, for what is at stake is
The battle continues 349
Roaf_Ch15.qxd 29/10/04 7:03 PM Page 349

not the hubris of a long lost culture or king but the very survivalof all the species on this small, green planet, Earth.
In Egypt’s sandy silence, all alone,Stands a gigantic Leg, which far off throwsThe only shadow that the desert knows.‘I am great Ozymandias’ saith the stone,‘The King of Kings this mighty city showsThe wonders of my hand.’ The city’s gone,Nought but the leg remaining to discloseThe site of that forgotten Babylon.
We wonder, and some hunter may expressWonder like ours, when through that wildernessWhere London stood, holding the wolf in chaseHe meets some fragment huge, and stops to guessWhat wonderful, but unrecorded, raceOnce dwelt in that annihilated place.
‘Ozymandias’ Horace Smith (1779–1849)
NOTES AND REFERENCES
1 Look at the differences between the American and British ver-sions of Brand, S. (1997) How Buildings Learn. London andNew York: Weidenfeld & Nicolson.
2 For a fuller text with reference on both the issues of infra-structure and scenario planning see the companion websitehttp://books.elsevier.com/companions/0750659114.
15.5.A great Moais, on Rapa NuiIsland, a totem to the potentialfor a society to exceed thecarrying capacity of its land.(Source: Cliff Wassman)
350 Adapting Buildings and Cities for Climate Change
Roaf_Ch15.qxd 29/10/04 7:04 PM Page 350

3 Roaf, S., Fuentes, M. and Thomas, S. (2003) Ecohouse 2:A Design Guide. Oxford: Architectural Press.
4 Roaf, S., Horsley, A. and Gupta, R. (2004) Closing the Loop:Benchmarks for Sustainable Buildings. London: RIBA Publications.
5 The Insurance Industry is now entering a phase where it willno longer insure high-risk buildings. In the long run, the priceof insurance should reflect the degree of risk. If the industrydoes not successfully manage such risks there will be socialand political pressures and the ultimate threat of nationaliza-tion. For further discussion of these issues see our compan-ion website http://books.elsevier.com/companions/0750659114and the following websites: ww.aag.org/HDGC/www/hazards/supporting/supmat2–4.doc and http://www.munichre.com. Andsee: Dlugolecki, A. (ed.), Agnew, M., Cooper, M., Crichton, D.,Kelly, N., Loster, T., Radevsky, R., Salt, J., Viner, D., Walden,J. and Walker, T. (2001) Climate Change and Insurance.Chartered Insurance Institute Research Report, London, 2001(available on www.cii.co.uk).
6 See the section on infrastructure on the companion websitehttp://books.elsevier.com/companions/0750659114.
7 Klinenberg, E. (2002) Heat Wave: A Social Autopsy of Disasterin Chicago. Chicago: The University of Chicago Press.
8 http://www.corenetglobal.org/pdf/learning/9_11_impact.pdf. Seealso the business continuity section PAS 56 on www.thebci.org.
9 John Kennedy, of the Churches Together in Britain, points outthat the cost of ecologizing new build houses in the UK issoon lost in general inflation. Think back to the first housethat was completed under New Labour – say to mid-1998.The cost of ecologizng such a new-build house would havebeen around £3000. It would have been likely to expect thathouse to have appreciated by some 50% in 5 years, thus los-ing that initial £3000. The cost of more stringent building reg-ulations would simply have been eclipsed by house-priceinflation. In fact, the average house price cost has increasedby 80–100% over that time.
10 Meir, I. and Roaf, S. (2003) Between Scylla and Charibdis: Insearch for the sustainable design paradigm between vernac-ular and hi-tech. Proceedings of the PLEA Conference,Santiago, Chile, November (with apologies to ProfessorBordass).
11 There are many books and websites available on the historyof Easter Island and for a short introduction and link see:www.netaxs.com/~trance/linklist.html.
The battle continues 351
Roaf_Ch15.qxd 29/10/04 7:04 PM Page 351

Roaf_Ch15.qxd 29/10/04 7:04 PM Page 352
INDEX
Italic page numbers refer to illustrations
9/11 see World Trade Center101 Office, Taipei, 242
ABI see Association of BritishInsurers
Accidents see Health and SafetyAcid rain, 9Ackermann, Marsha, 232Adam, Robert, 325–6Adaptation:
design strategies, 59migration, 206–7physiological adaptation to
climate, 134vulnerability, 63–4
Adaptive behaviour, 110, 113–24,143–7, 145, 314
Adaptive opportunity, 119, 120Adaptive principle, 117, 138Admittance method, 227Africa, 17, 19AGCMs see Atmospheric general
circulation modelsAgenda 21, 14–16Agoraphobia, 244Agriculture, 36, 103, 162–3, 165Aim, Cheryl, 305–6Air conditioning, 217–37
air pollution, 96biological warfare, 255blackouts, 289, 294emergencies, 181engineers, 328health impacts of, 83–4industry, 222–4market forces, 309
Naples, 58Pakistan, 120solar energy, 281tall buildings, 241, 249, 257vulnerability, 212–13
Air pollution, 93–6, 134Air quality, 228–9Airports, 95–6, 107Alaska, 64Albedo, 195Allergies, 125–6Alligators, 101Alps, 102–3, 196–7Alsop, Will, 315–16American Schools of
Architecture, 322American Society of Heating,
Refrigeration and Air(ASHRAE), 112, 113
Animals, 101–2, 198Annan, Kofi, 31–2Antarctic Circumpolar Current, 195Antarctica:
ice sheets, 192, 197–8ozone depletion, 10, 11
Aral Sea, 162–3ARB see Architect’s Registration
BoardArchitects, 317–26
air conditioning, 219–22, 309CABE, 317competitions, 319–20education, 320–6engineers, 327–8exhibitions, 320immunity from faillures, 342
journalism, 315–16liability, 331tall buildings, 242–3terrorism advice, 333
Architect’s Registration Board(ARB), 317–18, 325
Architecture and Urbanism Unit(A�UU), 327
Arctic ice sheets, 195,197–8, 199
ASHRAE see American Society ofHeating, Refrigeration and Air
Asia, 17, 19Association of British Insurers
(ABI), 203–4, 211Asthma, 94, 125Athens, 88Atmospheric general circulation
models (AGCMs), 28Auckland, New Zealand, 256Aurora, 93Australia:
buildings standards, 332coral reefs, 100forest fires, 98insurance loss events, 17interest groups, 16scenarios for, 69skiing, 102Tuvalu, 5, 200water theft, 161
Austria, 102Aviation, 95–6, 107
Baker, N.V., 119Bangladesh, 163, 200, 207
Roaf_Index.qxd 30/10/04 5:21 AM Page 353

Barbican, London, 87Barnes, Jay, 183–5Baron, David, 101–2Bartsch, U., 273Basements, 40, 41, 41, 52, 54Bedford scale, 113, 121Behaviour:
individuals, 314thermal comfort, 110thermoregulation, 112–20see also Adaptive behaviour
Beijing Airport, 327Beiranvand tribe, 37–9, 37, 38Bio energy, 284–5Bioclimatic buildings, 56–8Biodiversity, 99Biological warfare, 255Bionic Tower, Shanghai, 186Birmingham, UK, 263Black, Flora, 225Blackouts, 289–303
emergency lighting, 331employers’ duties, 330–1fire hazard, 258safety, 330–1solar energy, 281tall buildings, 212, 256–7
Blair, Tony, 327Blake, Peter, 252‘Blobs’, 322, 324–6Blood pressure, 126Blood viscosity, 126Boardman, B., 127–8, 135Bordass, W.T., 118–29Bore holes, 163Boulder, Colorado, 250, 267‘Braer’ depression (1999), 64Braer storm (1993), 178Brahmaputra River,
Bangladesh, 163Brand, Stephen, 342Brazil, 280BRE see Building Research
EstablishmentBritish Geological Survey
(BGS), 160British Nuclear Fuels, 277British Telecom (BT), 282–3British Waterways, 173–4Brown-outs, 281, 289–303Buenos Aires, Argentina, 227Building industry see
Construction industry
Building Listing Process, 316–17Building Performance Appraisal,
224–5Building Research Establishment
(BRE), 81–2, 179, 309Building standards, 310,
320–1, 331air conditioning, 230CABE, 316–17cold, 134–6education of architects, 320–1escape routes during
storms, 182European Building Directive,
307–8evacuation, 258flooding, 166–7insurance industry, 79involvement of insurers, 332planning system, 310–13storm and subsidence damage,
74, 75, 178–80tall buildings, 257, 258
Bull Ring, Birmingham, 324Bush fires, 72, 94, 97–9Bush, George W., 5, 24,
94–5, 335Business, 334–5Business Continuity Planning,
246, 260–1, 334–5, 348–9
C&C see Contraction andConvergence
Caf, society, 97California, 293–4, 308Campbell, Colin, 269–70, 273Canada:
forest fires, 98hydro power, 279–80Kyoto Protocol, 13power blackouts, 292–3sea ice, 198
Canals, 173–4Canary Wharf, London, 242, 254,
261, 264–5Capri, Italy, 49, 54–6Carbon dioxide (CO2):
aviation, 95–6biomass energy, 285carbon trading, 13–14,
313–14, 329coal, 276community groups, 313
concentration of, 4emissions by region, 20engineers, 329ethanol, 285gas, 274, 275history of science of climate
change, 6–7, 9Kyoto Protocol (1997), 12–13Mauna Loa record, 6–7, 7solar energy, 280–1UKCIP02 scenarios, 69, 69, 70United States, 24
Carbon dioxide equivalent units(CO2e), 13
Carbon sinks, 13–14, 18, 285Carbon trading, 13–14, 329Cardiovascular conditions, 125–6,
130, 133, 133Central England Temperature
(CET), 89Central heating, 128, 129–31, 136Central Seattle Library, 236Centre for Alternative Technology,
Machynlleth, 300Centre for Education in the Built
Environment, 321CET see Central England
TemperatureCFCs, 4, 10–11CH4, 13Chartered Institute of Building
Service Engineers (CIBSE),328–9
Chicago, 131Children, 125–6, 130, 131China, 200, 250–2, 276, 296–7CHP see Combined heat and
powerChrysler Building, 241, 241, 265Circulatory conditions, 126, 130Cities:
evacuation, 186–8modern buildings, 221–2urban flooding, 168–9vulnerability, 211–12wild animals in, 101
Civil unrest, water, 161Climate controls:
energy security and tallbuildings, 256–7
sloppiness, 305–6thermal comfort, 118,
119–20, 122
354 Index
Roaf_Index.qxd 30/10/04 12:19 PM Page 354

wind and tall buildings, 253see also Air conditioning
Clothing, 143–5adaptive behaviour, 116evolution of, 34heat discomfort at work, 90heat loss by convection,
139–40Pakistan study, 121thermal comfort, 119, 120
Cloud cover, 88–9Club of Rome, 7–8Clyde Heritage Trust, 168Coal, 276–7Coastal communities, 198–200Coastline retreat, 190, 200–4Coca-Cola, 164–5Cold:
adaptive actions, 145building standards, 134–6effect on health, 124–6mortality, 125–8, 132–4,
132, 133public education, 137thermal comfort, 111vulnerability to, 129–31
Collins, K.J., 125–6Combined heat and power (CHP)
plants, 284Comfort vote, 143Commission for Architecture and
the Built Environment(CABE), 242–3, 265–6
Community, 313–14Competitions, architects, 319–20Computer industry, 305–6Computers, power outages, 298Conduction, 112Conference of Parties (COP)
meetings, 12–14, 18see also Kyoto Protocol
Conservation, 316–17Construction Design and
Management (CDM)Regulations, 320–1
Construction industry, 327architects, 318–19, 320–1CABE, 317costs, 247–9, 318–19flooding, 166–8, 203–4health and safety, 253–4,
320–1planning, 310–13
Polluters Pay principle, 209–10sloppiness, 305–6subsidence, 160Thames Gateway, 5, 165, 166,
203–4, 215, 316–17tower blocks and social
housing, 262–4urban flooding, 169vulnerability, 211–12see also Building standards
Continuity planning, 246, 260–1,334–5, 348–9
Contraction and Convergence(C&C), 19–24, 21, 23, 349
Convection, 47, 111, 139–40Convention on Biological
Diversity, 100Conventional wisdom, 5–6Cook Islands, 200Cook, Peter, 325Cooling, passive, 41–2Coolth:
adaptive behaviour, 116air conditioning, 217–37ice-houses, 42–6windcatchers, 39, 40, 41–2
Cooper, Gail, 231Copenhagen Protocol (1992),
10–11Coral reefs, 100Cordillera Blanca, Peru, 197Corlett, T., 225Coronavirus, 93Costs:
architects, 318–19construction, 247–9, 318–19fossil fuel crisis, 275–6tall building, 247–9
Coyotes, 101Craig, Larry, 24CRED (carbon reductions), 313Crichton, David, 80, 179Crime, tall buildings, 254–5Cullen, William, 217–18Curved buildings, 234,
236–7, 236Curwen, M., 125, 127–8
Dam break flood inundationmaps, 171–3
Damp, 125–6, 136, 138Dams, 171–3, 196, 280Daylight, 53, 249–52
De-seasonality, 128Dead Sea, 162Deconstructionism, 322–6Dee, River, 166Dehydration, 126, 131Denmark, 296Desalination, 162Desertification, 101, 103, 104Design Competitions, 319–20Despatchable generation, 301Deutsche Bank building,
New York, 246Developed world, 336Developing countries, 210–14Dewar, Donald, 319Disabilities, people with, 244Disasters:
by continent, 25insurance industry, 70–3, 78–9planning, 312–13windstorms, 177–8
Disease:heat, 90–1, 92–3Sick Building Syndrome,
228–9tall buildings, 255
Distribution networks, 299–301Dlugolecki, Dr A., 77Dobson Unit (DU), 29‘Dog’ Buildings, 261Dolgarrog, Wales, 171Donaldson, G.C., 125Doxiades, Constantine, 247Drought:
dam failure, 172hydro power, 280planning in the UK, 165subsidence, 160–1UK, 154, 158–9
DU see Dobson Unit
Earth Summit (Johannesburg), 100Earth Summit (Rio de Janeiro
1992), 12, 14–15Earthquakes, 11–12, 11Easter Island, 349, 350Economic migrants, 206Economy, 93, 96, 99–105Education:
adaptation, 139architects, 320–6Internet and media, 315–16UK, 137
Index 355
Roaf_Index.qxd 30/10/04 5:21 AM Page 355

Efficiency:air conditioning, 229–31, 233education of architects, 321engineers, 328–9tall buildings, 256–7UK housing, 135–6
Egypt, 200Eklund, Graham, 331El Nin~o, 100Elan Valley, Wales, 170Elderly people, 129–30, 131, 137Embedded generation, 298–301Emergencies:
employers’s duties, 330–1evacuation in windstorms,
181–8planning, 188, 312–13, 346solar and wind energy
rights, 250tall buildings, 245–6, 257–8Thames Gateway
development, 204Emergency lighting, 331Emergency planning, 188,
312–13, 346Emissions:
aviation, 95–6, 107biomass energy, 285building types, 222coal, 276–7concentrations of greenhouse
gases, 4environmental refugees, 209ethanol, 285evaluation of buildings, 344
Emissions trading, 13–14, 21, 22,313–14
Empire State Building, 241,260, 265
Employers, 329–31Energy:
air conditioning, 223–4, 229–31
air pollution in the US, 94–5building types, 222consumption by region, 19consumption by sector, 15consumption by source, 15costs, 247–9, 275–6evolution of buildings, 34–5fossil fuel crisis, 269–86ice-houses, 42–6infrastructure, 275–6
interaction between climateand buildings, 34
mechanical cooling andheating, 139
modern architecture, 220–1storage, 300–1tall buildings, 245, 247–9,
256–7UK consumption, 15
Energy Crisis (1970s), 9Energy efficiency see EfficiencyEnergy infrastructure:
embedded generation,299–301, 302
power blackouts, 294–7renewable energy, 279
Energy security, 289–303fossil fuel crisis, 269–86privatization, 308–9tall buildings, 256–7, 259
Engineers, 327–9English Channel, 192English Heritage, 243, 316–17English House Condition Survey,
134–5Environment Agency, 96Environmental refugees, 206–15Environmental Working
Group, 335Ethanol, 285Euphrates, river, 163Europe:
divergence from US, 24–5energy consumption, 19fossil fuel reserves, 271gas, 273hottest summers on record, 83insurance loss events, 17sea level rises, 191targets for emissions, 307thermal comfort, 120–4,
123–4Urban Heat Island effect, 88see also European Union
European Business Council for aSustainable Energy Future,29–30
European Union (EU):coal, 276Contraction and
Convergence, 22Emissions Trading Scheme (EU
ETS), 313–14
European Building Directive,307–8
greenhouse gases, 20Kyoto Protocol, 12, 18–19Scottish Parliament
building, 319Eurowinter Group, 128,
135–6, 153Evacuation:
employers’ duties, 330–1getting out during storms,
181–2tall buildings, 245–6, 257–8Thames Gateway
development, 204windstorms, 183–8
Evans, Oliver, 218Evaporation, 112, 141, 144–5Evelyn, John, 97–8Evolution of buildings, 33–62Exertional heat stress, 126Exhibitions, architects, 320Exposure:
continuity planning, 348impact, 65insurance industry, 78poverty, 211reducing, 345–6risk, 63, 64, 80Thames Gateway
development, 204Extinctions, 99, 100Extreme weather, 18
Business Continuity Planning,334–5
employers’s duties, 330–1energy security, 302insurance industry, 79–80precipitation, 158–9see also Flooding; Heat waves;
Storms; Windstorms
Fanger, P.O., 113, 113Farman, J., 10FASTER (Flood And STorm Event
Reporting) system, 332Fatalities see MortalityFerguson, George, 316–17Fire:
duty of builders, 331employers’ duties, 330–1increase in temperatures, 97–9lifts in tall buildings, 245
356 Index
Roaf_Index.qxd 30/10/04 5:21 AM Page 356

power blackouts, 293tall buildings, 252, 257–8wild, 72, 94, 97–9
Fish, 99–100, 170–1Fish, Michael, 185Flash flooding, 168–9Flood embankments, 166Flood plains:
escape routes during storms,181–2
flooding in the UK, 166–8insurance industry, 76–7, 79Thames, 5, 201
Floods:emergency planning, 312escape routes during storms,
181–2insurance industry, 71, 72,
74–5, 76–7insurance loss events, 11–12,
11, 331–3meltwater, 197sea level rises, 190, 198–204UK, 154–5, 158–9, 165–9, 200–4waste, 96worsened by drought, 158
Florida, 163, 183–5Forecasts, hurricanes, 183–5Foresight Scenarios, 66–7, 154–5Forest fires see Wild firesForests, 18, 182–3Forum for the Future, 282Fossil fuel:
air conditioning, 120aviation, 95–6crisis, 269–86greenhouse sceptics, 31impact of buildings, 4reserves, 271see also Coal; Gas; Oil
Foster, Sir Norman, 243, 327France:
coal, 276dam failures, 171, 172flooding, 182forest fires, 98heat waves, 83, 129National Library, 228nuclear power, 278wine, 103
Fuel poverty, 127, 129–31, 135,275–6
Fungi, 92
Galbraith, J.K., 5–6Gardens, 49–51, 54, 104–5Gardiner, B., 10Gas, 269, 270–2, 273–5GCMs see General circulation
modelsGehry, Frank, 236–7, 236General circulation models
(GCMs), 28Geneva Convention,
environmental refugees,208–9
Geothermal pile foundations, 245Germany, 102Ghettos, high-rise flats, 262–4Gioffredo, Mario, 52Givoni, Baruch, 61–2Glaciers, 196–7Glancy, Jonathan, 324Glare, 234–7Glasgow, 168, 262–3Glazing, 224–8, 234–7, 331Global commons, 22Global monitoring network, 10, 15Global Warming Potential
(GWP), 13Goldschmied, Marco, 327Goldsmith, Edward, 8Gorrie, John, 218Government, 307–8
air conditioning, 230–1building industry, 327
Grape harvests, 103Gray, P.G., 225Great Barrier Reef, 100Great Fire of London, 97Great Salt Anomaly (1960), 195Great Storm (1703), 202Great Storm (1987), 178, 185Greece, heat waves, 129, 132Greenhouse effect, 2, 3, 12Greenhouse gases:
carbon trading, 13concentrations of, 4greenhouse effect, 2, 3history of international
agreements on, 12–16see also Carbon dioxide;
EmissionsGreenhouse sceptics, 31Greenland, ice sheets, 197–8Groundwater, 163, 164–5Guilbeault, Cathy, 260–1
Gulf Stream, 194–6, 195GWP see Global Warming
Potential
Hackney, Rod, 221–2Halocarbons, 10–11Hammersmith Ark, noise, 97Hancock Tower, Boston, 235Harris, Paul, 26–7Hazard:
continuity planning, 348impact, 65insurance industry, 79poverty, 211risk, 63, 64, 80Thames Gateway
development, 204Health:
adaptive principle, 138air pollution, 93–6aviation, 107cold, 124–38heat, 83–4, 90–6, 124–38public education, 137rainfall, 138tall buildings, 246–7thermal comfort, 110–11UK, 137–8
Health and Safety:education of architects, 320–1employers’ duties, 330–1evacuation in windstorms,
181–2, 183–8falls from height, 253–4impact of 9/11 on tall buildings,
260–1Health and Safety Executive
(HSE), 330–1Heat:
adaptive actions, 145–6convection, 139–40discomfort, 90health effects, 90–6, 124–38loss by evaporation, 141, 144–5mortality rates, 131, 132–4,
132, 133physiological effects of, 126projected temperatures,
83–110public education, 137radiation, 140thermal comfort, 110–24vulnerability to, 131–2
Index 357
Roaf_Index.qxd 30/10/04 12:19 PM Page 357

Heat Balance, 111–13Heat stroke, 126Heat waves, 83–4
adaptive behaviour, 314agriculture, 103air pollution and health, 94fatalities, 125, 129governments, 307health impacts, 91, 94industry, 334insurance industry, 72nuclear power, 278power blackouts, 291, 294public education, 137solar energy, 281UK projected temperatures,
84–9vulnerability to, 131–2
Heating:de-seasonality, 128Eurowinter Study, 136fuel poverty, 129–31passive, 41–2winter deaths, 127
Henwood, M., 126–8Herculaneum, 49, 52–4HFCs see HydrofluorocarbonsHigh rise buildings see Tall
buildingsHigh tides, 193–4Hilton Hawaiian Village, 255History of science of climate
change, 6–26HM Treasury, London, 90Home Information Pack (HIP), 308Honduras, 182–3Hong Kong, 93Hooker Building, Niagra
Falls, 234Hotel Lincoln, New York, 241Houghton, Sir John, 17–18Housing, high-rise flats, 247–9,
254–5, 262–4HSE see Health and Safety
ExecutiveHuman beings:
evolution of, 34heat loss, 139–41thermal comfort, 34, 110–47
Humidity, 155Humphreys, M.A., 114, 116–18 Hurricane Andrew, 178, 183, 184Hurricane Isobel, 291
Hurricane Mitch, 182–3Hurricane Opal, 183, 184Hurricanes, 177, 178, 182–8, 291Hydro power, 196, 279–80, 301Hydrofluorocarbons (HFCs),
12–13Hyponatremia, 126Hypothermia, 125, 130
Ibn Abi Hajalah at-Tilimsani, 240Ice Ages, 35–6, 35Ice houses, 42–6, 52, 53Ice machines, 219Ice sheets, 192, 196, 197–8Ice trade, 43–5, 218Impact, risk, 65India, 18, 163, 164–5, 200Indian Ocean, 100Individuals, 314Indonesia, 183, 200Industry, 4, 334–5Infestations, 92, 255Insects, 92, 103Institute of Business and Home
Safety (USA), 332Instituto Motori, Naples, 49,
56–8, 57Insulation, 126–7, 135, 143–5Insurance industry, 70–9, 331–3
building standards, 332dam failure, 173flooding, 166, 168, 211hazard, 64impact, 65loss events, 11–12, 11, 17mould, 255planning for emergencies, 346resilient buildings, 344–5SARS, 93storms, 177–8, 179–81subsidence, 160–1tall buildings, 262, 263Thames Gateway, 203–4vulnerability, 211–12
Insurance loss events, 11–12,11, 17
Integrated Property DamageSystem, 77
International Panel on ClimateChange (IPCC), 12, 16, 29, 81
Internet, 315–16Intra-mural migration, 39–41, 54Investment, vulnerability, 211–12
IPCC see International Panel onClimate Change
Iran, 39–41, 40, 47, 48Iraq, 43, 46–7, 163Israel, 162Italy:
blackouts, 291dam failures, 171Naples, 48–58power blackouts, 296skiing, 102wine, 103
Ivory Coast, 207
James, Peter, 330Japan, 12Jinmao Tower, Shanghai, 242Jordan, 162Jordan, River, 162Journalism, 315–16
Kazakhstan, 162–3, 197Keatinge, W.R., 125Keighley, E.C., 225–7Keynes, John Maynard, 5–6Kha, K.T., 125, 126–8King, Sir David, 26Kochi, India, 164–5Kovats, S., 110–47Krier, Leon, 249, 325Kyoto Protocol (1997), 12–14, 349
biomass energy, 285carbon trading, 13Clean Development
Mechanism, 18governments, 307–8ratification, 20targets, 18–21United States, 335
Laban Dance Centre, Deptford, 320
Land movement, UK, 193, 193Landfill sites, 96Landslides, 182–3Le Corbusier, 219–21Leaman, A.J., 118–29Levins, R., 110Lewontin, R., 110Liberman, Joe, 24Lifts, 245, 248Light access rights, 249–52Light shelves, 236
358 Index
Roaf_Index.qxd 30/10/04 12:20 PM Page 358

Lighting, 51, 234Lightweight buildings, 223–8, 233Litigation, Polluters Pay
principle, 209Little Ice Age, 35, 36, 45–6Livingston, Ken, 243, 264Lobby groups, 16, 313–14,
327, 338Local authorities:
carbon emissions reductions, 314
emergency planning, 346planning system, 310–13terrorism insurance, 333
Local community, 313–14Logging, 182–3Lomborg, Bjorn, 31London:
air pollution and health, 94bore holes, 163evacuation in windstorms, 186failure of Thames Barrier, 188power blackouts, 292sea level rises, 169, 201–2tall buildings, 242–3, 261urban development, 2–5Urban Heat Island effect,
87–9, 89London Underground, 295Loudon, A.G., 225Loudon, F.J., 225–7Luntz, Frank, 335
McCain, John, 24McCartney, K.J., 119–20MacCormac, Richard, 243McIntyre, D.A., 112Maintenance costs, 247–9, 262,
275–6, 318–19Malaria, 91Market forces, 230, 309–10,
334–5Markham, S.F., 212–13, 213, 217Marshall Islands, 200Mastic, 248Mather, Rick, 346Matterhorn, 102–3, 196Mauna Loa, 6–7, 7Mawhinney, Mark, 215Mazria, E., 75Mean radiant temperature, 140Media, 315–16Meltwater, 197
Merchandise Mart, Chicago, 241Mesopotamia, 36Metabolic rate, 111–12, 141–2Methane, 4, 12–13Mexico, 163Micro-climates, 104Middle East, 271, 273Migration, 206–15
disease, 91human evolution, 34–6intra-mural, 39–41, 51SARS, 93seasonal, 36–9
Millennium Dome, London, 318Milroy, Elizabeth, 225Miralles, Enric, 319Models, 28
history of, 8–9migration, 208scenario planning, 65–70UK projected temperatures,
84–9, 85, 86, 87windstorms, 180see also Scenarios
Modern movement, 49, 58,219–22, 224–8
Molina, M.J., 10Monofunctionality, 187–8, 249Montreal Protocol (1987), 10Morality, architects, 317–19Mortality:
air pollution, 95–6displacement, 129, 134heat, 90–1, 129, 131insurance industry, 11–12, 11,
17, 71public education, 137rainfall, 138temperature relationship,
132–4, 132, 133windstorms, 177–8winter deaths, 124–8
Mortgages, 262–4Mosquitoes, 92Mould, 92
air conditioning, 228Deutsche Bank building, 246effects of cold, 125–6insurance, 71rainfall, 138tall buildings, 255
Mountain communities, 102–3Muller, B., 273
Multinational corporations, 78Mumford, Lewis, 232Munich Re, 71, 73, 74, 177–8
Naples, 48–58National House Building
Council, 332National Hurricane Center (US),
183–5National Library, Paris, 228Natural disasters see DisastersNatural Resources Defence
Council (NRDC), 24–5New Economics Foundation,
208–9New York City:
power blackouts, 292–5tall buildings, 260–1see also World Trade Center
New Zealand, 200Nicaragua, 182–3Nicol, Fergus, 110–47Nicol, J.F., 114, 116, 119–20Nighttime temperature, 87Nitrous oxide, 4, 12–13, 276NLV see Norwalk-like virusNocturnal convective
cooling, 61–2Noise, 96–7, 226Nomads, 36–9Norovirus, 92–3North Atlantic Conveyor (Gulf
Stream), 195North Sea Storm Surge (1953),
202–3Norwalk-like virus (NLV), 92–3NRDC see Natural Resources
Defence Council (NRDC)Nuclear power, 182, 277–9, 293
Occupiers, 329–31Ocean conveyers, 194–6Oceanic flip flop, 195, 195Oceans, thermal expansion,
192–3, 196Offices, heat discomfort at
work, 90Oil, 9, 16, 269–73, 272Ontario Hydro building,
Toronto, 234Outdoor temperatures, winter
deaths, 126–8Over-glazing, 224–8, 234–7, 331
Index 359
Roaf_Index.qxd 30/10/04 12:21 PM Page 359

Owners, 329–31Oxford Ecohouse, 345Ozone:
air pollution, 94stratospheric depletion, 9,
10–11
Pakistan, 41, 114–15, 115, 120–4,121–2
Palestine, 162Pallazzo Gravina, Naples, 49,
51–2, 52Paris, 228, 243, 259Parsons, K.C., 112Passive buildings, 41–2
after the fossil fuel age, 285–6
evolution of, 49–58thermal comfort, 118ventilation systems, 61–2Villa Campolietto, 54windcatchers, 46–8
Peak Oil, 271, 272Perfluorocarbons (PFCs), 12–13Performance, 224–5, 325,
329, 343Perkins, Jacob, 218Permafrost, Alps, 102–3Perrault, Dominique, 228Pests, 103PFCs see PerfluorocarbonsPhilip, HRH Prince, 320Philippines, 200Photovoltaic (PV) systems,
280–2, 299Physiology, 110, 125–6, 126,
141–2Piano, Renzo, 242Planning system, 310–13
building on flood plains, 166–8dams and reservoirs, 172insurance industry, 79reducing vulnerability and
exposure, 345–6subsidence, 160tall buildings, 242–6, 250–2Thames Gateway and flooding,
203–4water use, 164–5
Players, 304–36Polluters Pay principle, 208–10Pollution:
air conditioning, 228–9
Aral Sea, 163aviation, 107canals, 174flooding, 167health effects, 93–6Polluters Pay principle,
208–10rainwater run-off, 170temperature and mortality
relationship, 134upper-atmospheric, 9
Pompeii, 49–51Pompidou Centre, Paris, 77Pools, passive cooling, 49Population:
evacuation procedures, 186–7hydrocarbons, 270tall buildings, 249Urban Heat Island effect, 88windstorm evacuation, 183–4
Porritt, Jonathon, 327Portugal, 98Post Fossil Fuel Age, 269Post Occupancy Evaluations, 90,
317, 321Poverty:
developed and undevelopedworld, 336
fuel poverty, 127, 129–31, 135,275–6
vulnerability, 210–14Power cuts see Blackouts;
Brown-outsPrecipitation, 154–77
intense events, 159scenarios, 2UK, 138, 154–5, 156–7, 159waste, 96
Predicted Mean Vote (PMV), 113,113, 116
Prescott, John, 307, 310Pressurized staircases, 187, 258Privacy, over-glazing, 234Privatization, 295, 307, 308–9Property management, 334Property rights, tall buildings,
249–52Psychological problems, tall
buildings, 246–7Psychophysics, 112, 142–3Public Health, 126–9, 137
Quangos, 316–17
Radiation:heat loss, 111, 140human heat balance, 111
Rainfall see PrecipitationRapa Nui, 349, 350RCEP see Royal Commission on
Environmental PollutionReal estate management,
329–31, 332–3, 334Reflectance, 234–7Reflectivity, 87Refugees, 206–15Regulation, 310REJ building, Austin, 236Renewable energy, 279–85
embedded generation,298–301
tall buildings, 245Research, privatization, 308–9Reservoirs, 171–3Resilient buildings, 344–5Respiratory diseases:
air pollution, 93–6cold, 130heat, 91, 129temperature relationship to
mortality, 133, 133winter deaths, 125–6
RIBA see Royal Institute ofBritish Architects
Rio Summit see Earth Summit(Rio de Janeiro 1992)
Risk, 63–82aversion, 78employers’s duties, 330–1escape routes during storms,
181–2impact of 9/11 on tall buildings,
260–1insurers, 73–4, 332–3management, 73–4, 77–9modern buildings, 220–1real estate managers, 334scenarios, 67
Rogers and Foster, 325–6Rogers, Richard, 242,
307, 327Roof gardens, 220Rowland, F.S., 10Royal Commission on
Environmental Pollution(RCEP), 66, 67, 74
Royal Geographical Society, 79
360 Index
Roaf_Index.qxd 30/10/04 5:21 AM Page 360

Royal Institute of British Architects(RIBA), 316–17, 318, 325
Rudge, Janet, 110–47Rudofsky, Bernard, 317Russia:
fossil fuel reserves, 271, 276Kyoto Protocol, 19, 24, 30
Ryghaug, Marianne, 321
Safety see Health and SafetySakamoto-Momiyama, M., 128Salingaros, Nikos, 187, 322, 326,
339–40San Francisco, 251Sani people, 38Sarking boards, 178SARS see Severe Acute
Respiratory SyndromeSaudi Arabia, gas, 274SBSE see Society of Building
Science EducatorsSCATS survey, 123, 123–4Scenarios, 65–70
Gulf Stream, 195sea level change, 193–4, 193UK precipitation, 154–5, 158–9UK projected temperatures,
84–9, 85, 86, 87see also Models
SCEP see Study of CriticalEnvironmental Problems
Sceptics, 31Schnellnhuber, John, 70Scottish Parliament building, 319Scruton, Roger, 323Sea level rises, 154, 169,
190–205Sealed envelope construction, 249Seas:
salinity, 194–5warming, 191–5, 192
Seasons:clothing, 120migration, 36–9precipitation, 155–8Seasonality, 128
Security:outages, 289–303tall buildings, 254–5see also Energy security
Sellafield, 277–8SET see Standard Effective
Temperature
Severe Acute RespiratorySyndrome (SARS), 92–3
Severn Barrage, 283–4Shade, 91–2Shanghai, 160, 186, 250–2, 296–7Shanklin, J., 10‘Shard of Glass’, Southwark,
242–3Shards, 325–6Sheffield Centre for Popular
Music, 324, 324, 340Shorelines, 190, 194, 200–4Sick Building Syndrome, 228–9Singapore, 221Singing buildings, 234–7Sizewell B, 277Skiing, 102Skin cancer, 91–2Skin temperature, 47, 142–3Skyscrapers see Tall buildingsSMIC see Study of Man’s Impact
on the ClimateSmoyer, K.E., 132Smyth, Charles Piazzi, 218Snowfall, 157, 196–7Society of Building Science
Educators (SBSE), 228Soil shrinkage, 158, 160–1Solar gain:
glazing, 224–8insurance industry, 79Pallazzo Gravina, 52singing buildings, 235tall buildings, 244–5, 249, 251Urban Heat Island effect, 88–9Villa Julio Polibio, 49Villa Mala Parte, 56
Solar power, 280–2, 280embedded generation,
299–301solar rights, 250tall buildings, 245
Solar radiation, 91–2Solar rights, 249–52Spain, 19, 161Squatters, 336Standard Effective Temperature
(SET), 116Standeven, M.A., 119Stevens Hotel, Chicago, 241Stochastic generation, 301Storm Tide Warning
Service, 203
Storms:FASTER system, 332flooding, 165power outages, 289–92sea level, 201–4tornadoes, 105UK, 75, 165, 201–4wind, 177–89
Stratospheric ozone depletion, 9,10–11
Study of Critical EnvironmentalProblems (SCEP), 8
Study of Man’s Impact on theClimate (SMIC), 8, 10
Subsidence, 160–1, 172Sudan, 207Sudden oak death, 92SUDS see Sustainable Urban
Drainage SystemsSulphur dioxide, 276Sulphur hexafluoride (SF6), 12–13Sunbeds, 91–2Sustainability:
building industry, 327Contraction and
Convergence, 22education of architects, 321flooding, 204planning, 310–13real estate managers, 334reducing vulnerability and
exposure, 345–6Rio Declaration, 14–15water, 164–5
Sustainable Urban DrainageSystems (SUDS), 169
Sweat, 126, 141Sweden, 11, 19, 279Swiss Re tower, London, 261Switzerland, 102Sydney, 244Syria, 163Systems failure, 292–3
Taipei, 242Tall buildings, 240–65
building industry, 327evacuation procedures,
186–8real estate managers, 334thermal expansion, 235vulnerability, 212
Tanganyika, Lake, 170–1
Index 361
Roaf_Index.qxd 30/10/04 5:21 AM Page 361

‘Target’ buildings, 246, 254, 258,260–1
Taylor, Derek, 250TD Bank tower, Toronto, 235Television reception, 264–5Temperature:
adaptive behaviours, 117–18changeability, 135–6highest on record, 83indoor, 117–18, 126–8, 135–6mean radiant temperature, 140nighttime, 87projected temperatures,
83–110response to change, 42scenarios, 2thermal comfort, 110–24, 141–2thermal thresholds, 47–8through the ages, 35
Tents, 36–9, 37, 38Termites, 92Terrorism:
employers’ duties, 330–1insurance premiums, 333power outages, 297–8‘target’ buildings, 246, 254,
258, 260–1Thailand, sea level rises, 200Thames Barrier, 188, 201Thames Gateway, 5
building materials, 166quangos, 316–17sea level rises, 203–4vulnerability, 215water shortage, 165
Thames, River:flooding, 5, 201, 211freezing of, 45–6Thames Gateway, 5, 165, 166,
203–4, 215, 316–17Thermal capacity:
energy security, 302Urban Heat Island effect, 87
Thermal comfort, 83–124,127–37, 143–5
Thermal expansion, 235Thermal mass, 62Thermal Oxide Reprocessing
Plant (THORP), 277Thermal physiology, 110,
141–2Thermal thresholds, 46–8, 61–4Thermohaline loops, 194–5Thermoregulation, 112
Thomas, Jeremy, 27THORP see Thermal Oxide
Reprocessing PlantTidal power, 283–4Tigris River, 163Timber frame buildings, 98–9, 166Time, adaptive behaviour, 117,
120, 146–7Tornadoes, 18, 71, 72, 105Tourism, 161Townsend, Mark, 26–7Trade Union Congress (TUC), 90Traffic noise, 97Transport:
Business Continuity Planning,334–5
evacuation procedures, 186–7fossil fuel use, 4Rio Declaration, 15
TUC see Trade Union CongressTufa, 51, 53Turfan, China, 104Turkey, 163Tuvalu, 5, 199–200, 208Tyndall Centre, 210
UKCIP see United KingdomClimate Impacts Programme
Underground rooms, 41Undeveloped world, 336UNFCCC see United Nations
(UN), Framework Conventionon Climate Change
United Kingdom:agriculture, 103air conditioning, 223, 225, 230air pollution, 94–6aviation, 95–6, 107biomass energy, 284–5Building Performance
Appraisal, 224–5building standards, 134–6canals and waterways, 173–4Climate Impacts Programme
(UKCIP), 15–16, 66–9, 67,69–70, 84, 190–2, 332
coal, 276–7cold, 134–6dams and reservoirs, 171–3drought, 158–9emission reduction, 13,
19, 313energy consumption by
sector, 15
energy security, 289–92, 302Environment Transport and
Regional Affairs SelectCommittee on ClimateChange, 76–7
exposure, 64falls from height, 253–4fishing, 100flooding, 76–7, 165–9Foresight Programme, 66–7,
154–5fossil fuel crisis, 269gas, 273–5greenhouse gas inventory, 81Gulf Stream, 194–6health, 94–6, 137–8heat waves, 132ice-houses, 44–6, 44insurance industry, 74–5, 77Kyoto Protocol, 19nuclear power, 277–9oil and gas reserves, 274Polluters Pay principle, 209–10power blackouts, 292, 295,
297, 299precipitation, 154–5, 156–7projected temperatures, 84–9renewable energy, 279, 280–3sea level rises, 192–6, 193,
200–4snowfall, 157solar energy, 280–1, 282subsidence, 160–1sustainability, 214–15vulnerability, 214–15water reservoirs, 170water shortage, 165windstorms, 177–9winter deaths, 125–8
United Nations (UN):climate war, 15–16Conference of Development
and the Environment (RioEarth Summit), 14–15
Conference on the HumanEnvironment (1972), 8
Environment Programme, 12, 76
Framework Convention onClimate Change(UNFCCC), 12, 13, 14, 21–3, 81
ozone depletion, 10water wars, 163
362 Index
Roaf_Index.qxd 30/10/04 5:21 AM Page 362

United States:air conditioning, 219, 222–4,
231–3air pollution, 94–5bore holes, 163CFCs, 10climate change policy, 5, 335coal, 276computer industry, 305–6dam failures, 171, 173Environmental Protection
Agency, 94–5evacuation, 183–5forest fires, 98fossil fuel reserves, 271gas, 273greenhouse sceptics, 31insurance industry, 17, 77–8Kyoto Protocol, 12–13, 19, 20,
24–5legal actions, 30lobby groups, 16oil supply, 273, 296Polluters Pay principle, 209power blackouts, 291, 292–5scenarios for, 69sea levels, 169, 200Sick Building Syndrome, 228storms, 180, 183–5tornadoes, 18, 105Urban Heat Island effect, 88wild animals in cities, 101–2
Urban development, 2–5, 307,345–6
Urban flooding, 168–9Urban Heat Island effect, 87–9,
88, 89Urban hypertrophy, 249Urban webs, 187Uzbekistan, 162–3
Van der Rohe, Mies, 235Vanvitelli, Carlo, 52Vanvitelli, Luigi, 52Venice, 169Ventilation, 61–2
biological warfare, 255Pallazzo Gravina, 52UK housing, 135–6Villa Campolietto, 53–4Villa Julio Polibio, 49Villa Mala Parte, 56Villa Ranzo, 56wind rights, 250
Venturi towers, 54Vernacular buildings, 33Vertigo, 244Vietnam, 200, 210Villa Campolietto, Herculaneum,
49, 52–4, 53Villa Julio Polibio, Pompeii,
49–51, 50Villa Mala Parte, Capri, 49, 54–6, 55Villa Ranzo, Capri, 56, 57Vulnerability, 210–14
cold, 129–31continuity planning, 348FASTER system, 332heat, 131–2heat discomfort at work, 90impact, 65insurance industry, 79, 332–3modern buildings, 220–1real estate managers, 334reducing, 345–6risk, 63–4, 63, 80storm damage, 179–80, 181–2Thames Gateway
development, 204
Wallstrom, Margot, 24Walt Disney Concert Hall,
Los Angeles, 236–7, 236War, water, 16, 30, 161–3Waste, increasing
temperatures, 96Water, 154–77
bore holes, 163Business Continuity Planning,
334–5civil unrest, 161droughts in the UK, 159health effects, 91melting of glaciers, 196–7nuclear power, 278ownership, 164–5quality, 170–1Rio Declaration, 15theft, 161wars, 16, 30, 161–3see also Drought
Water reservoirs, UK, 170Waterways, 173–4Wave power, 280, 283Weather see Extreme weatherWeather forecasts, 183–5Welsh National Assembly, 318–19Wembley, London, 318
Wen Jiabao, 327WHO see World Health
OrganizationWild fires, 72, 94, 97–9Wilkinson, P., 127Wilson, Brian, 289–90Wind:
impact on street life, 254power, 245, 249–52, 280,
282–3shear, 252–3tall buildings, 235, 252–4Urban Heat Island effect, 87–9 windstorms, 11–12, 11, 72,
177–89, 235Windcatchers, 39, 40, 41–2,
46–7, 240Windows, 224–8, 234–7
importance of shade, 92Instituto Motori, 58modern architecture, 220noise, 97Villa Mala Parte, 56
Windstorms, 177–89insurance industry, 11–12, 11, 72tall buildings, 235
Wine, 103Winter deaths, 124–8, 137Work at height, 321Workplace Security and Business
Continuity Planning, 246,260–1
World Disasters Report 2000, 74World Health Organization
(WHO), 16, 90–1World Meteorological
Organization, 12, 18, 83World Register of Large
Dams, 172World Trade Center:
evacuation, 186, 187, 245–6,257–8, 260–1
insurance, 71psychological problems as a
result of the attack, 247‘target’ buildings, 241, 254
Wyatt, Terry, 328–9Wyeth, Nathaniel, 43–4
Yazd, Iran, 39–42, 40, 47
Zagros Mountains, 35–7, 37Zedan, Hamdallah, 100Zurich, 230
Index 363
Roaf_Index.qxd 30/10/04 12:21 PM Page 363

Roaf_Index.qxd 30/10/04 5:21 AM Page 364