Medical software for three-dimensional analysis of magnetic resonance (MR) and computed axial...
132
Transcript of Medical software for three-dimensional analysis of magnetic resonance (MR) and computed axial...
THE TECHNICAL UNIVERSITY OF �ÓD�
Faculty of Electrical and Electronic Engineering
Master of Engineering Thesis
�Medical software for three-dimensional
analysis of magnetic resonance (MR) and
computed axial tomography (CAT) images
with embedded reporting engine for description
of patient's health�
Bartªomiej Wilkowski
Student's number: 115006
Supervisor:
dr in». Marcin Janicki
Auxiliary supervisors:
Óscar Pereira
Paulo Miguel de Jesus Dias
�ód¹, 2007
ABSTRACT
This thesis refers to the speci�c medical software designed for the radiolo-
gist/doctor assistance. The whole functionality of the software is enclosed
in the package called MIAWARE. MIAWARE stands for Medical Image
Analysis With Automated Reporting Engine. The complete descrip-
tion of the functionality of this software and its application can be found
here.
MIAWARE integrates two important aspects of image-based medicine.
It makes possible to analyze radiological images in order to �nd any disease
changes, and at once allows to carry out reporting of the patient's health
state in a very automated manner.
MIAWARE's report generation engine requires from the user (radiologist)
a detailed speci�cation of the pathologic changes found in patient's body and
their locations. Unlike to the present habits, the radiologist cannot describe
those �ndings with his own words, but can use only the speci�c medical
vocabulary provided by the application. Consequently, MIAWARE software
is able to create normalized medical reports according to the information
about pathologies introduced earlier by the user.
Finally, the intelligent search engine for medical reports is implemented,
based on the relations between the real-world objects. The ontology for lungs
was developed in order to use the relations between the parts of the lungs
in the search algorithm. Consequently, a deductive report search was ob-
tained, which can improve the disease recognition process. Any patient case
can be compared to other archive reports (cases), which contain of similar
symptoms, what should lead to better diagnoses and faster decisions over the
suitable patient's treatment to apply.
STRESZCZENIE
Prezentowana praca dotyczy oprogramowania medycznego przeznaczonego
do analizy zdj¦¢ tomogra�i komputerowej. Caªe oprogramowanie znajduje
si�e w pakiecie nazwanym MIAWARE, co po angielsku oznacza Medical Image
Analysis With Automated Reporting Engine (Analiza obrazów medycznych
ze zautomatyzowanym moduªem raportuj¡cym). W kolejnych rozdziaªach
tej pracy mo»na znale¹¢ dokªadny opis zastosowania oraz funkcjonalno±ci
omawianego oprogramowania.
Gªównym zadaniem oprogramowania MIAWARE jest integracja dwóch
wa»nych aspektów medycyny obrazowej. MIAWARE umo»liwia analiz¦ i
wizualizacj¦ radiologicznych obrazów medycznych w celu rozpoznania zmian
patologicznych w badanym obszarze ciaªa pacjenta. W mi¦dzyczasie, wszys-
tkie spostrze»enia oraz wnioski na temat znalezionych zmian chorobowych,
patologii, etc. mog¡ by¢ zachowane i powi¡zane z krytycznymi miejscami
na zdj¦ciach w celu pó¹niejszego otrzymania sprawozdania o stanie zdrowia
pacjenta. Na t¦ chwil¦, MIAWARE oferuje mo»liwo±¢ tworzenia sprawozda«
tylko dla obszaru pªuc ludzkich.
Technika raportowania patologii zaimplementowana w MIAWARE ma na
celu ostateczne otrzymanie sprawozda« medycznych znormalizowanych pod
wzgl¦dem terminologii w nich u»ywanej. Oznacza to, »e radiolog pracuj¡c z
oprogramowaniem MIAWARE i opisuj¡c znalezione patologie nie mo»e robi¢
tego w dowolny sposób i u»ywa¢ wªasnych sªów. MIAWARE oferuje baz¦
terminów medycznych niezb¦dnych do scharakteryzowania patologii w pªu-
cach ludzkich, które s¡ wybierane krok po kroku przez radiologa podczas
procesu tworzenia sprawozdania. Ostatecznie, moduª raportuj¡cy zaimple-
mentowany w MIAWARE szereguje otrzymane informacje i automatycznie
generuje odpowiednio sformatowane, znormalizowane sprawozdanie medy-
czne. Dzi¦ki takiej metodzie, sprawozdania sporz¡dzone na podstawie zdj¦¢
jednego pacjenta powinny prawie zawsze, niezale»nie od radiologa, by¢ iden-
tyczne. Ewentualne ró»nice mi¦dzy sprawozdaniami mog¡ by¢ spowodowane
niedokªadn¡ analiz¡ b¡d¹ bª¦dami ludzkimi.
Ostatni¡, istotn¡ cz¦±ci¡ pakietu MIAWARE jest inteligentna wyszuki-
warka raportów medycznych. U»ywaj¡c jej, lekarz b¡d¹ radiolog, mog¡ �l-
trowa¢ archiwalne sprawozdania medyczne w celu znalezienia patologii w
okre±lonych lokalizacjach pªuc. Co istotne, sprawozdania nie s¡ przeszuki-
wane tylko na podstawie sªów wprowadzanych do kryterium wyszukiwania,
ale równie» na podstawie terminów logicznie powi¡zanych z wprowadzonymi
sªowami kluczowymi. Funkcja ta zostaªa zaimplementowana przy u»yciu on-
tologii, gdzie wszystkie anatomiczne elementy pªuc zostaªy uªo»one w pewn¡
logiczn¡ struktur¦, dzi¦ki której komputer jest w stanie wydedukowa¢ wszys-
tkie podelementy danej cz¦±ci pªuc.
Normalizacja sprawozda« medycznych byªa warunkiem koniecznym do
stworzenia wydajnej wyszukiwarki. Wymienione aspekty oprogramowania
MIAWARE, odpowiednio u»yte, mog¡ uªatwi¢ lekarzowi stawianie diagnoz
oraz przespieszy¢ proces rozpoznawania choroby.
CONTENTS
Abstract . . . . . . . . . . . . . . . . . . . . . . . . . . . . . . . . . . . 2
Streszczenie . . . . . . . . . . . . . . . . . . . . . . . . . . . . . . . . . 3
Contents . . . . . . . . . . . . . . . . . . . . . . . . . . . . . . . . . . . 5
List of Figures . . . . . . . . . . . . . . . . . . . . . . . . . . . . . . . 8
List of Tables . . . . . . . . . . . . . . . . . . . . . . . . . . . . . . . . 10
1. Introduction . . . . . . . . . . . . . . . . . . . . . . . . . . . . . . . 11
1.1 Motivations . . . . . . . . . . . . . . . . . . . . . . . . . . . . 11
1.1.1 Present radiological reporting schema . . . . . . . . . . 12
1.1.2 Shortcomings and limitations of the present reporting
schema . . . . . . . . . . . . . . . . . . . . . . . . . . . 12
1.1.3 Automated reporting with MIAWARE . . . . . . . . . 13
1.2 Contributions of this thesis . . . . . . . . . . . . . . . . . . . . 14
1.2.1 Integration of visualization, reporting and searching . . 14
1.2.2 Normalized report generation . . . . . . . . . . . . . . 15
1.2.3 User-friendly software . . . . . . . . . . . . . . . . . . 16
1.3 Applications . . . . . . . . . . . . . . . . . . . . . . . . . . . . 16
1.3.1 Analysis of CAT images . . . . . . . . . . . . . . . . . 16
1.3.2 Reporting over lung pathologies . . . . . . . . . . . . . 16
1.3.3 Medical reports �ltering . . . . . . . . . . . . . . . . . 18
1.4 Roadmap . . . . . . . . . . . . . . . . . . . . . . . . . . . . . 18
2. Radiological examinations overview . . . . . . . . . . . . . . . . . . 20
2.1 MRI characteristics . . . . . . . . . . . . . . . . . . . . . . . . 20
2.1.1 MRI technology . . . . . . . . . . . . . . . . . . . . . . 21
2.1.2 MRI advantages and disadvantages . . . . . . . . . . . 23
2.2 CAT characteristics . . . . . . . . . . . . . . . . . . . . . . . . 24
2.2.1 CAT technology . . . . . . . . . . . . . . . . . . . . . . 24
2.2.2 CAT advantages and disadvantages . . . . . . . . . . . 26
2.3 MRI and CAT comparison . . . . . . . . . . . . . . . . . . . . 28
3. MIAWARE Architecture . . . . . . . . . . . . . . . . . . . . . . . . 30
3.1 Decisions . . . . . . . . . . . . . . . . . . . . . . . . . . . . . . 30
3.1.1 Tools for visualization � review . . . . . . . . . . . . . 30
3.1.2 Tools for reporting and ontology-based search engine �
review . . . . . . . . . . . . . . . . . . . . . . . . . . . 31
3.1.3 Tools for GUI applications � review . . . . . . . . . . . 33
3.1.4 Final environment choice for the MIAWARE software . 35
3.2 Image visualization and GUI development . . . . . . . . . . . 36
3.2.1 Integrating VTK with Java . . . . . . . . . . . . . . . 37
3.2.2 Creating 3D model . . . . . . . . . . . . . . . . . . . . 37
3.2.3 3D model cross-sections generation . . . . . . . . . . . 42
3.2.4 Creating GUI . . . . . . . . . . . . . . . . . . . . . . . 45
3.3 Medical report generation . . . . . . . . . . . . . . . . . . . . 46
3.3.1 Medical vocabulary selection and representation . . . . 46
3.3.2 XML-based reporting form creation . . . . . . . . . . . 48
3.3.3 Resource Description Framework . . . . . . . . . . . . 52
3.3.4 Normalized medical report generation . . . . . . . . . . 54
3.4 Ontology-based search engine development . . . . . . . . . . . 59
3.4.1 Ontology de�nition and development . . . . . . . . . . 59
3.4.2 Medical ontology for lungs . . . . . . . . . . . . . . . . 70
3.4.3 Search algorithm for RDF �les . . . . . . . . . . . . . . 82
4. Medical analysis and reporting with MIAWARE . . . . . . . . . . . 92
4.1 Installation notes . . . . . . . . . . . . . . . . . . . . . . . . . 92
4.2 Analysis of CAT images . . . . . . . . . . . . . . . . . . . . . 94
4.2.1 Specifying CAT stack location . . . . . . . . . . . . . . 94
4.2.2 3D model manipulation . . . . . . . . . . . . . . . . . . 97
4.2.3 2D images manipulation . . . . . . . . . . . . . . . . . 99
4.3 Reporting over lung pathologies . . . . . . . . . . . . . . . . . 101
4.3.1 De�ning pathologies . . . . . . . . . . . . . . . . . . . 101
4.3.2 Viewing and editing pathology descriptions . . . . . . . 103
4.3.3 Generating medical reports . . . . . . . . . . . . . . . 105
4.4 Searching for the medical reports . . . . . . . . . . . . . . . . 106
5. Conclusions . . . . . . . . . . . . . . . . . . . . . . . . . . . . . . . 109
Bibliography . . . . . . . . . . . . . . . . . . . . . . . . . . . . . . 110
Appendix 115
A. How to build VTK on Windows with Java support . . . . . . . . . 116
A.1 Required downloads and software installation . . . . . . . . . 118
A.1.1 VTK source download . . . . . . . . . . . . . . . . . . 118
A.1.2 CMake download and install . . . . . . . . . . . . . . . 118
A.1.3 C++ compiler installation . . . . . . . . . . . . . . . . 118
A.1.4 Java SDK download and installation . . . . . . . . . . 118
A.1.5 Eclipse download and installation . . . . . . . . . . . . 119
A.2 Compiling the VTK source with CMake . . . . . . . . . . . . 119
A.3 Building the con�guration in C++ compiler (Microsoft Visual
Studio 2005) . . . . . . . . . . . . . . . . . . . . . . . . . . . . 121
A.4 Con�guration of Java environment in Eclipse . . . . . . . . . . 123
A.5 Summary . . . . . . . . . . . . . . . . . . . . . . . . . . . . . 125
B. Article about MIAWARE software . . . . . . . . . . . . . . . . . . 126
LIST OF FIGURES
1.1 CAT stack images analysis . . . . . . . . . . . . . . . . . . . . 17
2.1 Siemens Symphony MRI scanner . . . . . . . . . . . . . . . . 20
2.2 Functional con�guration of MRI scanner . . . . . . . . . . . . 21
2.3 MRI knee reconstruction . . . . . . . . . . . . . . . . . . . . . 22
2.4 Toshiba Aquillion CAT scanner . . . . . . . . . . . . . . . . . 25
2.5 CAT scan work principle . . . . . . . . . . . . . . . . . . . . . 26
2.6 Human thorax CAT slice . . . . . . . . . . . . . . . . . . . . . 27
3.1 Steps of CAT stack processing in MIAWARE . . . . . . . . . . 38
3.2 3D model representation . . . . . . . . . . . . . . . . . . . . . 42
3.3 3D model manipulation with widgets . . . . . . . . . . . . . . 43
3.4 2D cross-section planes . . . . . . . . . . . . . . . . . . . . . . 44
3.5 Pathology reporting form . . . . . . . . . . . . . . . . . . . . . 50
3.6 Ontology for cars visualization . . . . . . . . . . . . . . . . . . 64
3.7 Ontology inverse properties . . . . . . . . . . . . . . . . . . . 65
3.8 Ontology class relationship . . . . . . . . . . . . . . . . . . . . 67
3.9 Inferred hierarchy of ontology . . . . . . . . . . . . . . . . . . 69
3.10 Ontology reasoning classi�cation results . . . . . . . . . . . . . 70
3.11 Human lungs structure . . . . . . . . . . . . . . . . . . . . . . 72
3.12 Classes taxonomy in lungs ontology � part 1 . . . . . . . . . . 72
3.13 Classes taxonomy in lungs ontology � part 2 . . . . . . . . . . 73
3.14 Properties in lungs ontology . . . . . . . . . . . . . . . . . . . 75
3.15 Restrictions in lungs ontology . . . . . . . . . . . . . . . . . . 76
3.16 Ontology-based search engine . . . . . . . . . . . . . . . . . . 83
3.17 Ontology-based search algorithm �owchart � part 1 . . . . . . 85
3.18 Ontology-based search algorithm �owchart � part 2 . . . . . . 86
3.19 Ontology-based search algorithm �owchart � part 3 . . . . . . 87
3.20 Ontology-based search algorithm �owchart � part 4 . . . . . . 89
3.21 Ontology-based search algorithm �owchart � part 5 . . . . . . 90
4.1 MIAWARE software �les . . . . . . . . . . . . . . . . . . . . . 93
4.2 MIAWARE graphical user interface . . . . . . . . . . . . . . . 95
4.3 Medical images loading � progress bar . . . . . . . . . . . . . 96
4.4 3D model rendering window . . . . . . . . . . . . . . . . . . . 97
4.5 Actions and manipulation toolbar for the 3D model view . . . 98
4.6 2D cross-sections panel . . . . . . . . . . . . . . . . . . . . . . 100
4.7 Add pathology � con�rmation dialog . . . . . . . . . . . . . . 101
4.8 Pathology reporting frame . . . . . . . . . . . . . . . . . . . . 102
4.9 List of the pathologies . . . . . . . . . . . . . . . . . . . . . . 103
4.10 Pathology description view frame . . . . . . . . . . . . . . . . 104
4.11 Medical report disk location and name de�nition . . . . . . . . 105
4.12 Successful report generation dialog . . . . . . . . . . . . . . . 106
4.13 Ontology-based search engine graphical user interface . . . . . 107
4.14 TXT medical report view frame . . . . . . . . . . . . . . . . . 107
A.1 CMake window before con�guration . . . . . . . . . . . . . . . 120
A.2 CMake window before customization . . . . . . . . . . . . . . 120
A.3 Visual Studio 2005 screenshot . . . . . . . . . . . . . . . . . . 122
9
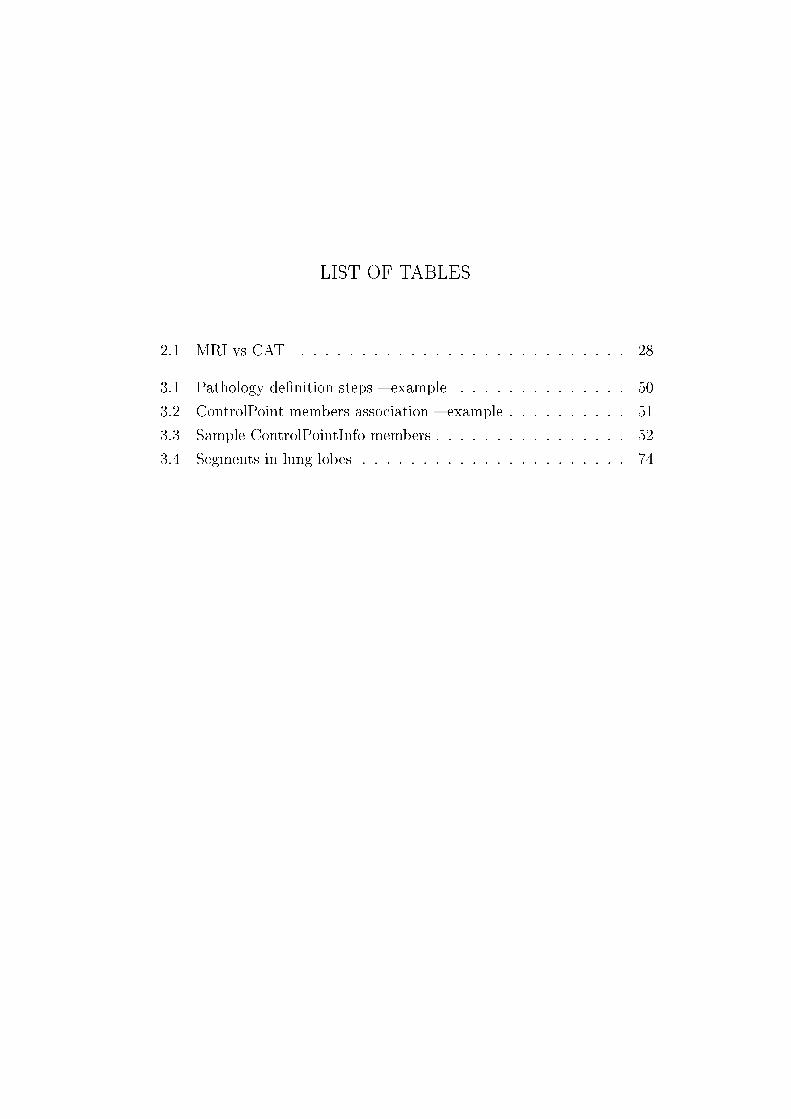
LIST OF TABLES
2.1 MRI vs CAT . . . . . . . . . . . . . . . . . . . . . . . . . . . 28
3.1 Pathology de�nition steps � example . . . . . . . . . . . . . . 50
3.2 ControlPoint members association � example . . . . . . . . . . 51
3.3 Sample ControlPointInfo members . . . . . . . . . . . . . . . . 52
3.4 Segments in lung lobes . . . . . . . . . . . . . . . . . . . . . . 74
1. INTRODUCTION
The �rst objective of this thesis is to present MIAWARE software (Medical
Image Analysis With Automated Reporting Engine), which enables doctors
and radiologists to carry out detailed analysis of the patient's lungs state ex-
amining medical tomography images and then, in parallel, to perform health
state reporting process. Secondly, an intelligent search engine for medical re-
ports is presented, together with all its advantages over the ordinary searching
schemas.
The entire MIAWARE software and its modules presented here were pre-
pared by the author of this thesis. Any external, other authors' sources used
during the development of the MIAWARE software are properly documented
and accompanied with suitable references. The complete source code of the
MIAWARE software can be found on the CD enclosed with this thesis. The
description of the MIAWARE software can be also found on the web page:
www.miaware.org.
Finally, the Appendix B contains an article describing the MIAWARE
software, which was submitted to BIOSTEC 2008 - International Joint Con-
ference on Biomedical Engineering Systems and Technologies.
1.1 Motivations
Medical image analysis performed with the software, which gives the oppor-
tunity to localize and mark the pathologic changes during its observation as
well as to add additional comments out of hand, can increase the precision of
the pathology reporting and speed up that process. Moreover, an automated
medical report generation can be considered as a potential improvement in
report analysis process.
Furthermore, creation of a three-dimensional model from two-dimensional
medical images should add more realism to the analysis course. It is easier
and more natural to observe the disease changes having a visual reference to
the 3D model, thus the radiologist's deduction may be more accurate.
Integration of the detailed three-dimensional analysis of the radiological
images with the `on the �y' reporting system, able to normalize the radiolo-
gist's observations and generate automatically the �nal report, can possibly
improve the disease recognition process in the radiology area.
Last, but not least important feature of the MIAWARE software - an
intelligent search of the archive medical reports, can improve a disease recog-
nition process since the earlier patients' cases can be easily compared with
the recent ones, what automatically may produce faster and more e�cient
diagnosis.
1.1.1 Present radiological reporting schema
Preparation of the medical reports by the radiologists is very common and
frequent activity. Radiologists are responsible for preparing a report after
the detailed analysis of the MR or CAT images. Usually, they can view the
set of the 2D images (slices) made in one or more plane directions during the
MR/CAT scan. A radiologist looks carefully for all worrisome alterations in
the patient's body which can resemble any disease, de�ne it and describe in
the report which is later analyzed by the doctor.
1.1.2 Shortcomings and limitations of the present reporting schema
The accuracy of the present reporting process is not su�ciently high to be
sure that the diagnosis made by radiologist and doctor is very accurate.
There can be found some serious shortcomings. The main problem is that
reports di�er in structure from radiologist to radiologist. Every human has
di�erent way of thinking, di�erent way of expressing things, remarks and
observations. It means that given the same medical data to many radiologists
in order to make analysis, it can and will, almost surely, produce many
di�erent reports with various observations on the patient's health. Moreover,
12
sometimes the doctor interprets the report in some di�erent way than the
radiologist which lowers the e�ciency of the diagnosis.
1.1.3 Automated reporting with MIAWARE
In order to improve the present radiological reporting schema, creation of a
new reporting structure is needed. In the MIAWARE package, the automated
reporting engine with its own, unique way of expressing data is proposed.
Such a new solution should enhance following factors of the reporting process:
• Visualization 3D � a three dimensional model created from two dimen-
sional images provides users with di�erent, additional view of a given
data.
• Disease location � the radiologist can mark the critical, pathologic
points on the image (cut) and can see their location on 3D model im-
mediately. Moreover, the disease searching is easier and faster as some
special tools are introduced which allows cutting the model in one of
three plane directions and showing the output in order to perform closer
analysis.
• Disease de�nition � while doing the analysis, the radiologist is using the
set of the speci�c medical vocabulary de�ned earlier by the quali�ed
doctors. The radiologist does not have to think about how to describe
the pathology, but only which of the given options de�nes it in the best
and accurate way.
• Normalized reporting � the generated reports are always written with
the same syntax and layout, independently on the person which does
the analysis and introduces the data. Moreover, additional reports in
the computer understandable language are created to enable its further
processing.
• Intelligent report �ltering � normalized reports, readable for a com-
puter, allow the deduction-based searching of the reports according
to the given search criteria. Thanks to the ontologies, the search is
13
performed according to the logical connections (relations) between the
real-world concepts (in this case, human body parts), thus it is not
pure, ordinary, lexical search, based only on the words entered in the
search query.
MIAWARE software package addresses to the aforementioned areas. The
three dimensional visualization may bring some improvement to de�nition
and recognition of critical changes in a human body. Interactive reporting
schema should speed-up and ease-up an analysis course and make it more
accurate. Finally, the normalization favors the easier understanding of the
reports for the doctors, patients and also computers what makes a place for
implementation of an e�cient search engine.
1.2 Contributions of this thesis
The MIAWARE software package contributes to the radiological reporting
area in the following ways.
1.2.1 Integration of visualization, reporting and searching
The MIAWARE software package allows to open CAT images, visualize and
process them and �nally process the �nal report. Moreover, the set of the
previously generated reports can be �ltered according to given criteria.
This software presents how the previously mentioned aspects work when
joined together and why such a software is important to be introduced to
the real life. The presented MIAWARE software version is prepared and
opened for future development in order to achieve �nal, market product. It
is properly working prototype with well-built structure, but still with too
limited capabilities to be used in real-life situations. An advantage of this
application over the others, used by radiologists up to now, can be the fact
that they don't need to separate the steps of viewing the radiological images
and then writing a report.
Furthermore, a radiologist can investigate a three-dimensional model as
well as its slices (cross-sections), obtained from three cutting widgets (CAT
14
scan usually o�ers, as the output, the images in only one plane direction, thus
images in others are generated directly by the software). While observing
medical data, radiologist can interactively change its view, make analysis
and add report information. Finally, when all the remarks are made, the
report can be generated.
Finally, the ontology-based search engine is provided. User can choose
a pathology to be searched and its location in the lungs. Afterwards, a
previously speci�ed set of RDF medical reports (generated by MIAWARE
software) is veri�ed according to given criteria. Thanks to that, doctor can
consult the database of old medical reports in order to �nd similar patient's
cases. This may speed up a diagnosis process and improve disease recogni-
tion.
1.2.2 Normalized report generation
The MIAWARE software package incudes the reporting engine implementa-
tion. It requires from the radiologist only some pure, basic data to introduce
such as type of the diseases, its location etc. Afterwards, the normalized
report is generated, based on the previously set layout. Up to now, only the
reports over the patient's lungs medical state can be generated.
The software has its own database of the all possible lung pathologic
changes and their characteristics. As a result, the radiologist does not in-
troduce the description of the �nding using his own words, but chooses the
options available from the database. In the future software releases there can
be added the option for adding short, extra comments or de�ning the size of
the pathology change. In the recent software version the full aspect of the
normalization is kept and there is no option to insert any extra information.
All the data de�ned by the radiologist is sent to the engine, which is able to
create the report, normalized with some rules, describing the patient's health
state. The style, context and layout of the report is less dependent on the
radiologist. It gives an advantage that the generated reports, which concern
the same type of diseases or similar patients cases, will not di�er or will di�er
very slightly.
15
1.2.3 User-friendly software
The MIAWARE package software was designed to o�er to users an intuitive
framework with friendly Graphical User Interface and to be �exible for fur-
ther development and extensions. User interface is entirely created in Java
programming language with usage of the Java Swing components. Processing
of the data is performed with the usage of Visualization Toolkit (VTK) [22]
and ImageJ environment [31] (a public domain Java image processing pro-
gram).
1.3 Applications
This section describes the applications of the MIAWARE software.
1.3.1 Analysis of CAT images
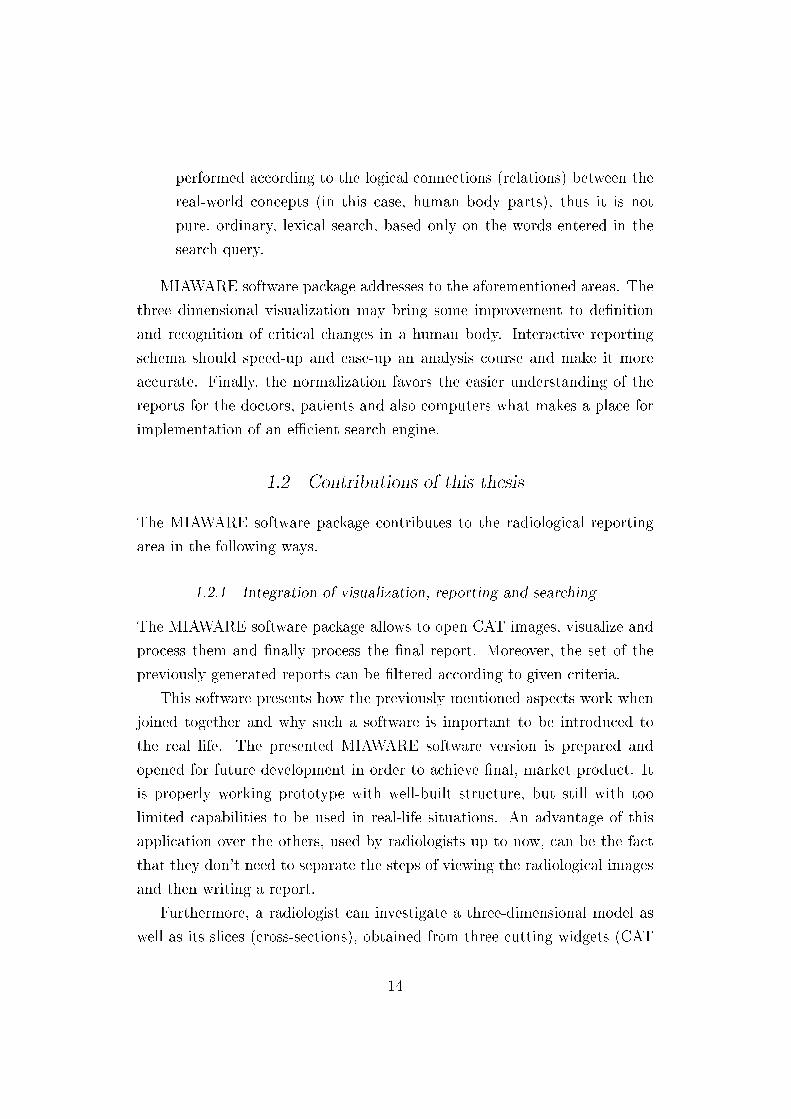
The MIAWARE software provides users with the intuitive graphical user in-
terface together with a functionality, which allows to perform detailed analy-
sis of the computed axial tomography images. Figure 1.1 presents the screen
shot of the MIAWARE application.
Tomography examinations usually provide the set of images (slices) only
in one plane direction. MIAWARE software supplies the view of the slices in
three main plane directions (x,y,z) integrated together with the 3D model.
Thanks to that, every point of the body (scanned by CAT apparatus) can
be in three di�erent plane cuts. It improves the preventive research of the
human body for alarming pathology changes. The full description of how the
analysis can be performed with MIAWARE software is presented in Chap-
ter 4, section 4.2.
1.3.2 Reporting over lung pathologies
This application is closely connected with the previous one. After the analysis
of the CAT images for human thorax, the special reporting engine can be
started in order to report the pathologies found in the lungs. It can be
simply done by marking the pathologic change on one of the 2D slices and
16
Fig. 1.1: MIAWARE graphical user interface (CAT stack images analysis)
17
then associate the exact information with it. During the pathology reporting
process, the groups of options are presented to the user, in order to de�ne the
exact de�nition of the pathology type and its location in the lungs. Finally,
the text report is written as an output. The detailed description of the
steps that can be performed when reporting with MIAWARE is described in
Chapter 4, section 4.3.
1.3.3 Medical reports �ltering
Finally, the MIAWARE software package can be used by doctors during the
medical investigation of the patient's case and assist the decision process over
the suitable treatment application. The doctor can consult the database of
old medical reports in order to �nd reports with similar cases by applying
the �lter criteria in the query for MIAWARE search engine. Afterwards, the
disease recognition can be made taking into account all previous cases, what
increases signi�cantly the e�ciency. The speci�city of the MIAWARE search
engine for medical reports is described in the Chapter 3, section 3.4.1. The
user's guide for report �ltering with MIAWARE can be found in Chapter 4,
section 4.4.
1.4 Roadmap
After short introduction, the four following chapters will describe the de-
tails of the MIAWARE software together with the theoretical aspects closely
connected to this thesis.
Chapter 2: Radiological examinations overview (MRI and CAT) � brief de-
scription of two radiological examination types: Magnetic resonance
imaging (MRI) and Computed axial tomography (CAT), their features,
applications, apparatus.
Chapter 3: MIAWARE Architecture � description of related work, develop-
ment and design of MIAWARE software architecture, decisions, speci�-
cations, theoretical references, creation of the 3D model from 2D slices,
18
normalized reporting schema, ontology-based search engine for medical
reports and graphical user interface.
Chapter 4: Medical analysis and reporting with MIAWARE � user's guide,
software functionality, illustrations of the user interface, analysis of
CAT images, reporting of the lung pathological changes, �ltering sets
of medical reports according to the given criteria with MIAWARE soft-
ware.
Chapter 5: Conclusions
19
2. RADIOLOGICAL EXAMINATIONS OVERVIEW
This chapter refers to two major radiological examinations, magnetic res-
onance imaging and computer axial tomography. Both of them are non-
invasive and painless methods for examining the body internal structures.
They produce the sets of images demonstrating the internal parts of the
object (human body) in order to �nd physiological alterations.
2.1 MRI characteristics
MRI, sometimes known as NMRI (Nuclear Magnetic Resonance Imaging) is
a relatively new method that is used in medicine since the beginning of 1980s.
The following subsections describe brie�y how the MRI apparatus looks like
and works, what are the main features of this examination method and when
such examinations are performed.
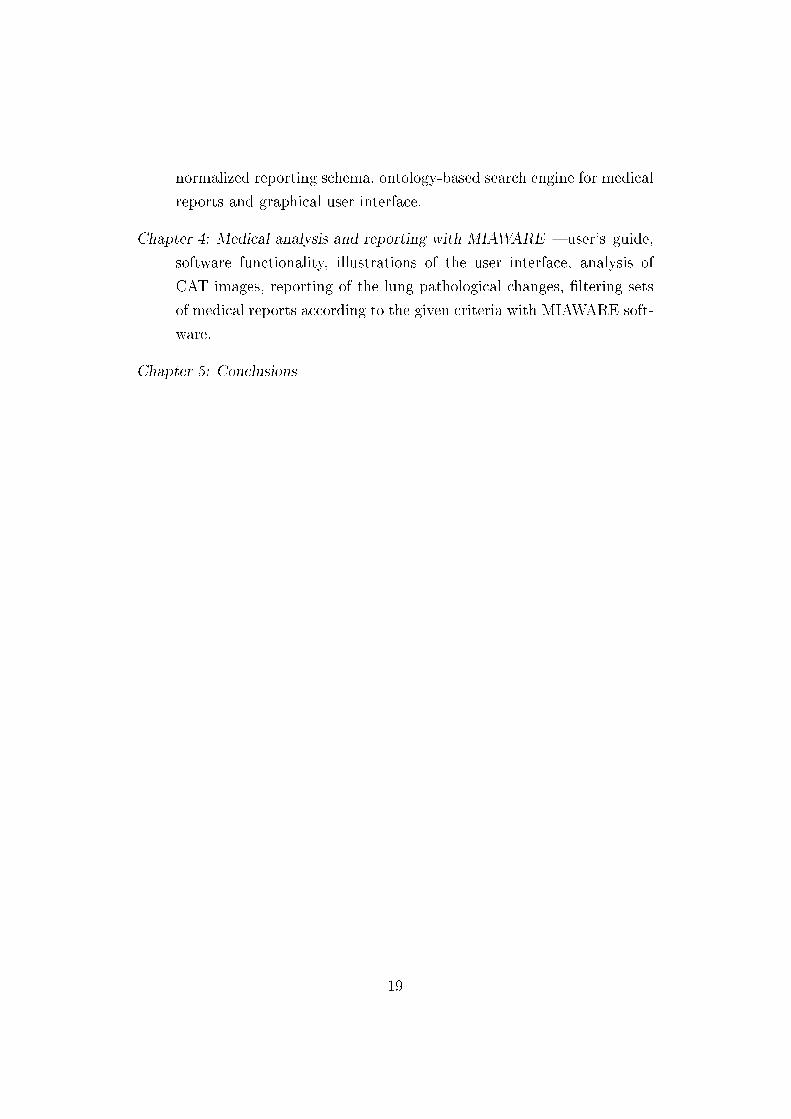
Fig. 2.1: Siemens Symphony MRI scanner [14]
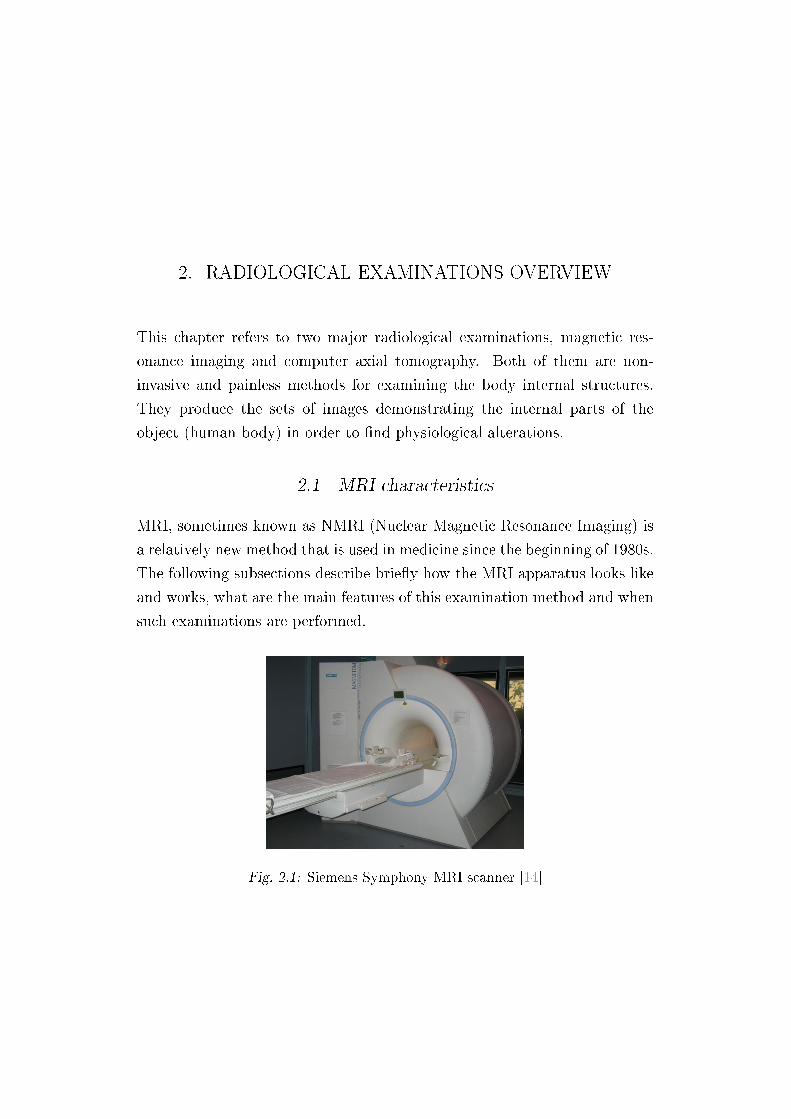
Fig. 2.2: Functional con�guration of MRI scanner [36]
2.1.1 MRI technology
Figure 2.1 presents the photo of MRI scanner (Siemens Symphony). This
speci�c scanner has �a tunnel 1.5m long and 60cm in diameter� [14], and
moreover, the visible cylinder is in fact the 1.5 Tesla Superconducting Mag-
net. The general functional con�guration of the MRI scanner is presented in
Figure 2.2.
The following description of the MRI scanner functionality was prepared
based on the content of the HowStu�Works web page. Every MRI scanner
uses both, magnetic and radio-frequency waves for creation of the output
imaging. The patient, during the MRI examination, is lying on the special
table, which slides slowly into the horizontal tube, called bore of the magnet.
The scan begins when the body part to examine is exactly in the isocenter
of the magnetic �eld.
Since human body consists mainly of water (billions of hydrogen atoms),
the principle of the MRI scanner's work relies on the speci�c behaviour of
such atoms in strong magnetic �elds composition in presence of the RF waves.
All the hydrogen atom nuclei are randomly spinning in every direction. In
the magnetic �eld of the MRI scanner, the hydrogen atoms will line up with
the direction of the �eld in any of its two turns. This results in that majority
21
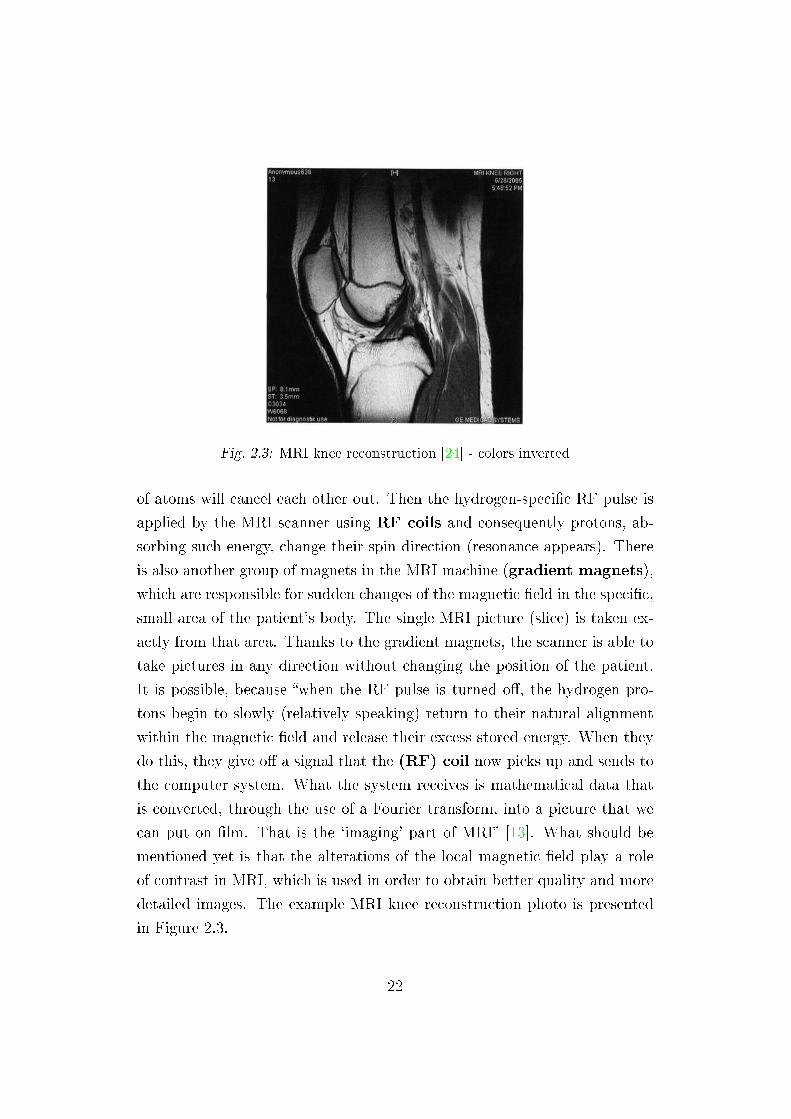
Fig. 2.3: MRI knee reconstruction [24] - colors inverted
of atoms will cancel each other out. Then the hydrogen-speci�c RF pulse is
applied by the MRI scanner using RF coils and consequently protons, ab-
sorbing such energy, change their spin direction (resonance appears). There
is also another group of magnets in the MRI machine (gradient magnets),
which are responsible for sudden changes of the magnetic �eld in the speci�c,
small area of the patient's body. The single MRI picture (slice) is taken ex-
actly from that area. Thanks to the gradient magnets, the scanner is able to
take pictures in any direction without changing the position of the patient.
It is possible, because �when the RF pulse is turned o�, the hydrogen pro-
tons begin to slowly (relatively speaking) return to their natural alignment
within the magnetic �eld and release their excess stored energy. When they
do this, they give o� a signal that the (RF) coil now picks up and sends to
the computer system. What the system receives is mathematical data that
is converted, through the use of a Fourier transform, into a picture that we
can put on �lm. That is the `imaging' part of MRI� [13]. What should be
mentioned yet is that the alterations of the local magnetic �eld play a role
of contrast in MRI, which is used in order to obtain better quality and more
detailed images. The example MRI knee reconstruction photo is presented
in Figure 2.3.
22
2.1.2 MRI advantages and disadvantages
The MRI examination gives the opportunity to see the tissue-level images,
full of details, clear slices of the patient's body in any direction. The major
advantage of the MRI scan is the great number of situations when it can be
applied. The Netdoctor [30] web page provides broad overview of the MRI
applications, thus it is cited here:
�Because the MRI scan gives very detailed pictures it is the best
technique when it comes to �nding tumours (benign or malignant
abnormal growths) in the brain. If a tumour is present the scan
can also be used to �nd out if it has spread into nearby brain
tissue.
The technique also allows us to focus on other details in the brain.
For example, it makes it possible to see the strands of abnormal
tissue that occur if someone has multiple sclerosis and it is possi-
ble to see changes occurring when there is bleeding in the brain,
or �nd out if the brain tissue has su�ered lack of oxygen after a
stroke.
The MRI scan is also able to show both the heart and the large
blood vessels in the surrounding tissue. This makes it possible
to detect heart defects that have been building up since birth, as
well as changes in the thickness of the muscles around the heart
following a heart attack. The method can also be used to examine
the joints, spine and sometimes the soft parts of your body such
as the liver, kidneys and spleen.�
Moreover, MRI does not use the ionizing radiation and does not present
any serious side e�ects. Unfortunately, it has also some disadvantages.
Firstly, the MRI machines are very loud, what produces very unpleasant
atmosphere in the examination room. Another problem is that not all the
people can take part in MRI examinations, because of the claustrophobia
or because they are simply too big. Next drawback is the price of the MRI
scan. Since the whole system is very expensive, the examination prices are
23
also relatively high. Finally, the last problem is that the MRI images are
distorted frequently. The reason of that can be found in relatively long
duration of the examination (from 20 minutes up to 90 minutes). During
this time, patient should not move, since it can produce distortions and the
examinations would have to be repeated. The distortion can be caused also
by the hardware in the examination area, since it a�ects and changes the
MRI magnetic �eld slightly, and only in presence of the uniform magnetic
�eld, high quality MRI images can be obtained.
This concludes the section over magnetic resonance imaging. In the next
part, the overview of the computed tomography is given.
2.2 CAT characteristics
Computed axial tomography (CAT), sometimes shortened to computed to-
mography (CT), is a type of examination, which produces as the output sets
of photos (slices) through the examined body part. Following the Wikipedia,
the word "tomography" derives from two Greek terms: tomo � slicing, cutting
and graphos � image or graphein � to write. Simply speaking, tomography
is a process of representing three dimensional body in form of its subsequent
2D slices. It is worth to notice that aforementioned MRI examination is also
a tomographic technique since it produces 2D images of the examined body.
2.2.1 CAT technology
CAT scanner produces narrow slices of the examined body only in one (ax-
ial) cutting plane direction. Computed tomography is, in fact, modern and
more advanced X-ray imaging, which enables easy three-dimensional com-
puter model reconstruction, since the output slices are always in the same
plane direction and have equal spacing between each other. The MIAWARE
software uses that advantage and with help of VTK toolkit is able to generate
from axial CAT slices, not only the 3D model, but also 2D slices in sagittal
and transaxial planes. The typical CAT scanner resembles from exterior the
MRI scanner (see Figure 2.4).
24
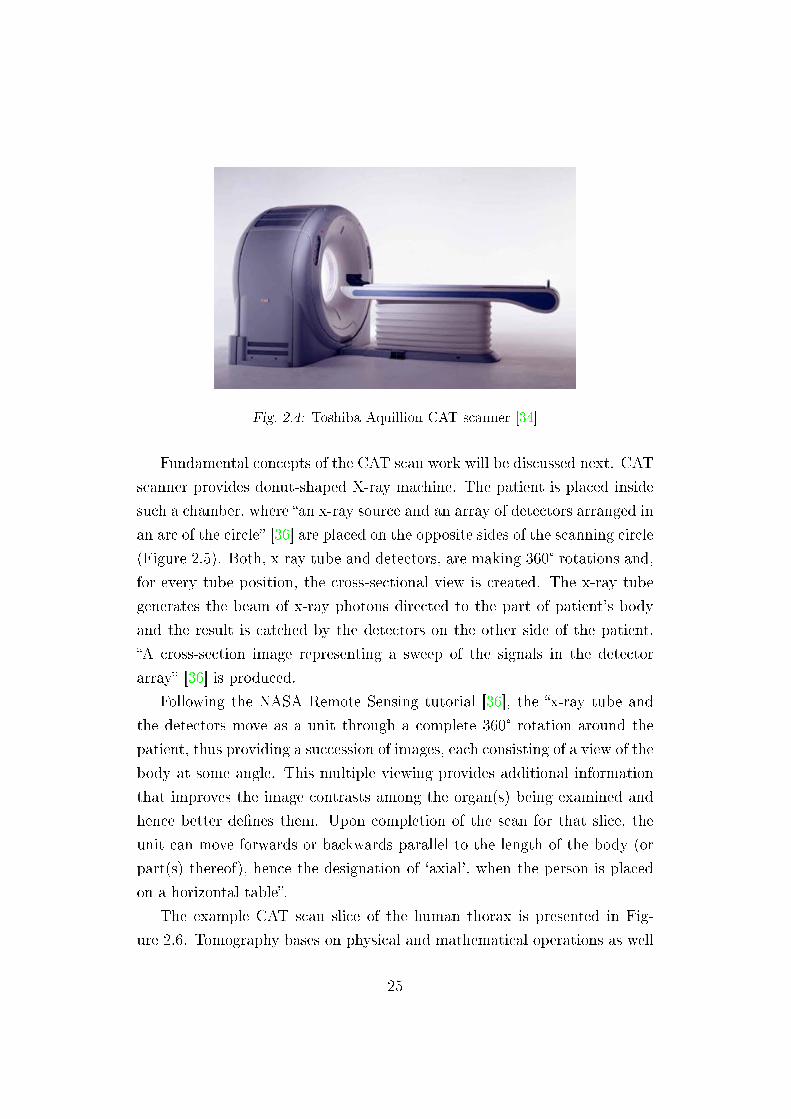
Fig. 2.4: Toshiba Aquillion CAT scanner [34]
Fundamental concepts of the CAT scan work will be discussed next. CAT
scanner provides donut-shaped X-ray machine. The patient is placed inside
such a chamber, where �an x-ray source and an array of detectors arranged in
an arc of the circle� [36] are placed on the opposite sides of the scanning circle
(Figure 2.5). Both, x-ray tube and detectors, are making 360° rotations and,
for every tube position, the cross-sectional view is created. The x-ray tube
generates the beam of x-ray photons directed to the part of patient's body
and the result is catched by the detectors on the other side of the patient.
�A cross-section image representing a sweep of the signals in the detector
array� [36] is produced.
Following the NASA Remote Sensing tutorial [36], the �x-ray tube and
the detectors move as a unit through a complete 360° rotation around the
patient, thus providing a succession of images, each consisting of a view of the
body at some angle. This multiple viewing provides additional information
that improves the image contrasts among the organ(s) being examined and
hence better de�nes them. Upon completion of the scan for that slice, the
unit can move forwards or backwards parallel to the length of the body (or
part(s) thereof), hence the designation of `axial', when the person is placed
on a horizontal table�.
The example CAT scan slice of the human thorax is presented in Fig-
ure 2.6. Tomography bases on physical and mathematical operations as well
25
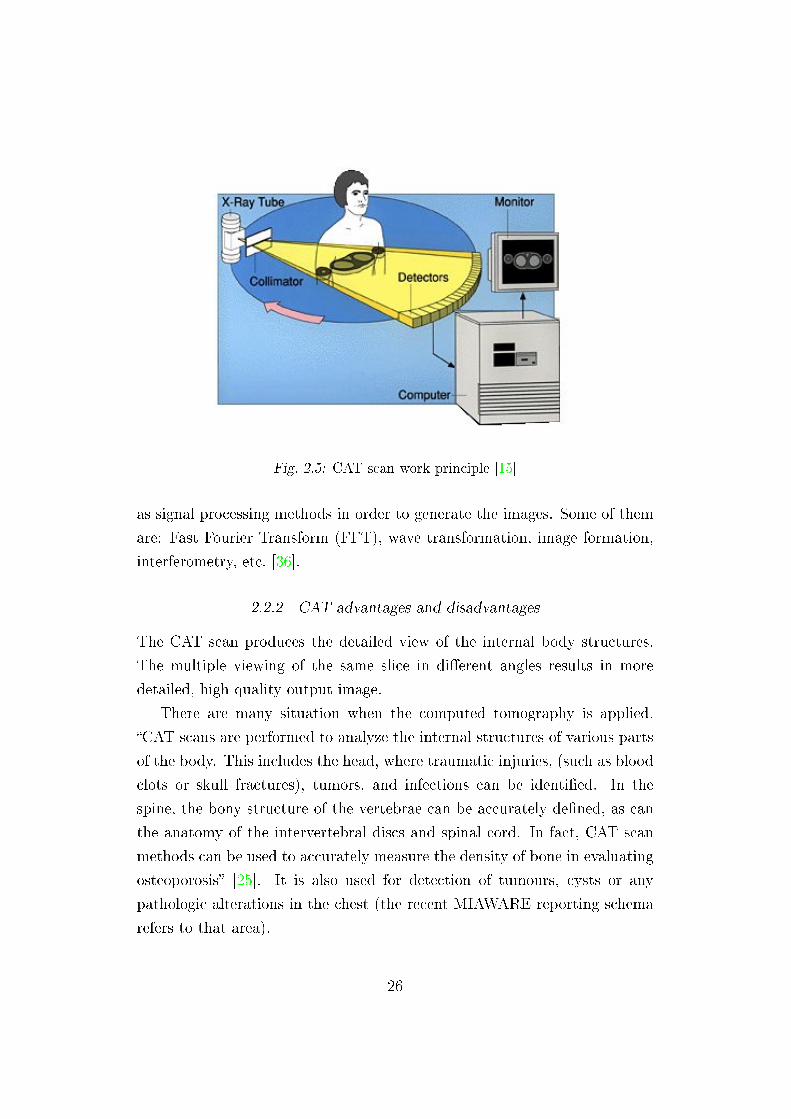
Fig. 2.5: CAT scan work principle [15]
as signal processing methods in order to generate the images. Some of them
are: Fast Fourier Transform (FFT), wave transformation, image formation,
interferometry, etc. [36].
2.2.2 CAT advantages and disadvantages
The CAT scan produces the detailed view of the internal body structures.
The multiple viewing of the same slice in di�erent angles results in more
detailed, high quality output image.
There are many situation when the computed tomography is applied.
�CAT scans are performed to analyze the internal structures of various parts
of the body. This includes the head, where traumatic injuries, (such as blood
clots or skull fractures), tumors, and infections can be identi�ed. In the
spine, the bony structure of the vertebrae can be accurately de�ned, as can
the anatomy of the intervertebral discs and spinal cord. In fact, CAT scan
methods can be used to accurately measure the density of bone in evaluating
osteoporosis� [25]. It is also used for detection of tumours, cysts or any
pathologic alterations in the chest (the recent MIAWARE reporting schema
refers to that area).
26
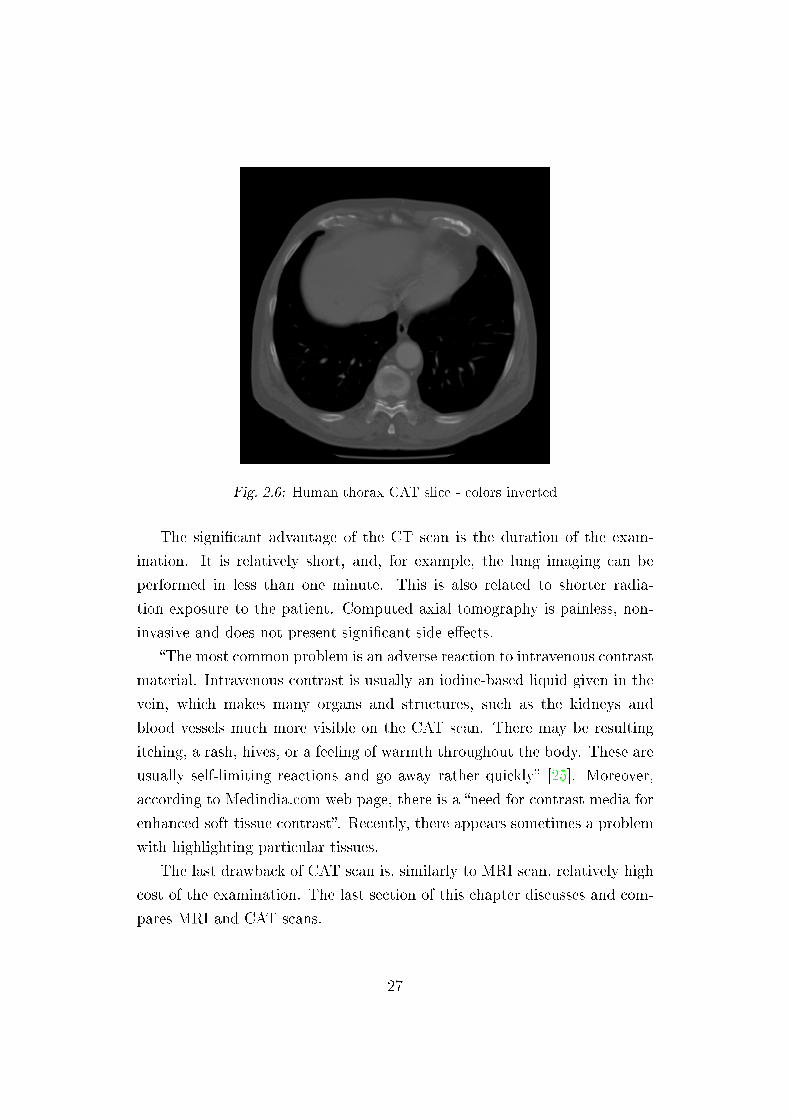
Fig. 2.6: Human thorax CAT slice - colors inverted
The signi�cant advantage of the CT scan is the duration of the exam-
ination. It is relatively short, and, for example, the lung imaging can be
performed in less than one minute. This is also related to shorter radia-
tion exposure to the patient. Computed axial tomography is painless, non-
invasive and does not present signi�cant side e�ects.
�The most common problem is an adverse reaction to intravenous contrast
material. Intravenous contrast is usually an iodine-based liquid given in the
vein, which makes many organs and structures, such as the kidneys and
blood vessels much more visible on the CAT scan. There may be resulting
itching, a rash, hives, or a feeling of warmth throughout the body. These are
usually self-limiting reactions and go away rather quickly� [25]. Moreover,
according to Medindia.com web page, there is a �need for contrast media for
enhanced soft tissue contrast�. Recently, there appears sometimes a problem
with highlighting particular tissues.
The last drawback of CAT scan is, similarly to MRI scan, relatively high
cost of the examination. The last section of this chapter discusses and com-
pares MRI and CAT scans.
27
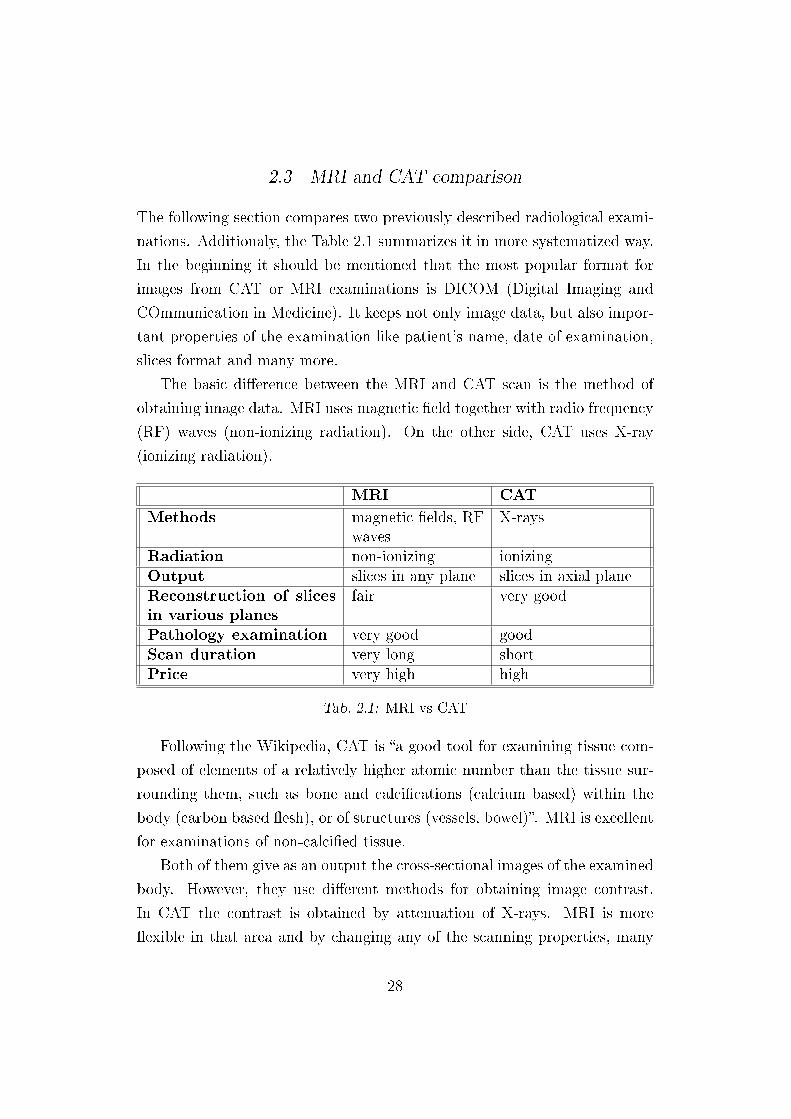
2.3 MRI and CAT comparison
The following section compares two previously described radiological exami-
nations. Additionaly, the Table 2.1 summarizes it in more systematized way.
In the beginning it should be mentioned that the most popular format for
images from CAT or MRI examinations is DICOM (Digital Imaging and
COmmunication in Medicine). It keeps not only image data, but also impor-
tant properties of the examination like patient's name, date of examination,
slices format and many more.
The basic di�erence between the MRI and CAT scan is the method of
obtaining image data. MRI uses magnetic �eld together with radio frequency
(RF) waves (non-ionizing radiation). On the other side, CAT uses X-ray
(ionizing radiation).
MRI CAT
Methods magnetic �elds, RFwaves
X-rays
Radiation non-ionizing ionizingOutput slices in any plane slices in axial planeReconstruction of slicesin various planes
fair very good
Pathology examination very good goodScan duration very long shortPrice very high high
Tab. 2.1: MRI vs CAT
Following the Wikipedia, CAT is �a good tool for examining tissue com-
posed of elements of a relatively higher atomic number than the tissue sur-
rounding them, such as bone and calci�cations (calcium based) within the
body (carbon based �esh), or of structures (vessels, bowel)�. MRI is excellent
for examinations of non-calci�ed tissue.
Both of them give as an output the cross-sectional images of the examined
body. However, they use di�erent methods for obtaining image contrast.
In CAT the contrast is obtained by attenuation of X-rays. MRI is more
�exible in that area and by changing any of the scanning properties, many
28
various features can be shown. For di�erent purposes, di�erent materials
with paramagnetic properties are used, creating di�erent contrast agents.
Both of the technologies produce the slice (cross-sectional views) images,
but on the contrary to MRI, which can give images in any plane, CAT results
with images only in axial plane. On the other side, MRI does not give
such great �exibility for reproducing the image data in any plane, as CAT
technology. Multi-detector CAT scanners with near-isotropic resolution allow
to generate images in any plane having only the photos made in axial plane.
This feature is used by MIAWARE software where di�erent plane images are
generated together with 3D model.
Although MRI is better for �nding pathologies and tumours than CAT,
CAT is used more frequently since it is cheaper, the duration of the scan
is much shorter and consequently it is more comfortable for the patients,
which, for example, does not need to be sedated or anesthetized before the
examination.
This concludes the chapter. In the Chapter 3 the full description of
the MIAWARE software package architecture is given. According to the
contributions of this thesis, the MIAWARE software performs processing of
the CAT images and provides the necessary tools facilitating their analysis.
29
3. MIAWARE ARCHITECTURE
In this chapter the full architecture of the MIAWARE software is presented.
The description of the MIAWARE software development process is divided
into three main parts. First part refers to the visualization made with usage
of the VTK toolkit [22], Java Swing [28] and ImageJ [31] software. Second
part deals with the generation of normalized medical reports over patient's
lungs state. Finally, the functionality of the ontology-based search engine is
presented together with the user interface. All these parts are accompanied
with a necessary theoretical basis.
3.1 Decisions
After circumscribing the motivations, advantages and general reasons for the
creation of the software MIAWARE, presented in Chapter 1, the selection of
the environment and adequate tools for its development was the very crucial
step for success of the further work.
3.1.1 Tools for visualization � review
One of the MIAWARE project objectives is to generate three-dimensional
model from two-dimensional CAT images. First step was to �nd appropriate
tools, which can facilitate the work in this area. It was required to �nd
any toolkit, which is freely available (under public domain) and open source.
Due to the fact that the Visualization Toolkit (VTK) [22] matches almost
completely with all previously de�ned needs, it was chosen as the main tool
for development of the project's visualization part.
Visualization Toolkit is the system for the 3D computer graphics, ad-
vanced image processing and visualization. Moreover, it is a toolkit, open
for development, implemented in C++ programming language. The advan-
tage of VTK comparing to other similar tools is its �exibility, since it contains
several wrappers to various programming languages. Thanks to that VTK
applications can be written not only in C++, but also in Tcl/Tk, Java or
Python. VTK can be easily integrated with the GUI classes of any of the
mentioned environments.
Other tools that could be used for 3D computer graphics, like OpenGL or
PEX, are created at lower level of abstraction than VTK, therefore creating
the 3D visualizations and processing it is more di�cult and time-consuming
process comparing to VTK.
The only disadvantage of VTK, found just at the beginning of mastering
it, is its documentation. Its manual (API) lacks of precise function de�nition
and furthermore uses ambiguous argument/parameter names, what impedes
the understanding of the member functionality and slows down solution-
�nding process.
Another objective of MIAWARE software is to present the 2D cross-
sections of the generated 3D model and at this stage of project preparation
the other tools besides the VTK were taken into account. ImageJ package
was one of such tools and was considered as a potential help in this case.
ImageJ [31] is a public domain, free Java image processing program. It
is able to read all types of the images and create the image stacks from the
many image slices made in one plane direction, as it is with the images taken
from the computed axial tomography.
3.1.2 Tools for reporting and ontology-based search engine � review
The second and third, closely related parts of MIAWARE architecture is
automated report generation and ontology-based searching over previously
prepared reports. The generation of the reports is achieved having detailed
de�nition of the pathologic changes found in the patient's body, based on
the medical images and created 3D model analysis. Two types of reports are
to be created: �rst one, normal ASCII text report and the second, actually
more important, the report in RDF format. Such a speci�c format (Resource
31
Description Framework) facilitates performing e�cient ontology-based report
search over some given criteria.
The detailed characteristics and de�nition of ontology and RDF �le for-
mat can be found in the following subsections: 3.4.1 and 3.3.3.
The normalized report generation requires the accurate de�nition of the
vocabulary which will be used for description of the disease changes. Such
vocabulary has to be kept in some �exible format which allows its easy re-
de�nition and manipulation. Moreover, it should have structured form of
representation for easier processing by di�erent information systems (in this
case, by MIAWARE software). After close review of the possible options for
such case, the XML format was chosen for its �exibility and easiness in use.
The other options were: database or normal text �le. The �rst one intro-
duces some di�culty in data rede�nition. The doctors or radiologists could
�nd it quite di�cult to edit the vocabulary which is kept in the database.
Only the specialists would be able to do it. On the other hand, the normal
text �le format hampers processing of such data by software. XML format
seems to be the golden mean as it allows easy manipulation of data in any
text editor, and at the same time has simple structure for processing by in-
formation systems. The detailed description of the structure of the XML �le
used by MIAWARE software can be found in the subsection 3.3.2.
The review of the ontology development tools brought the list of some
interesting applications worth considering. The brief description and �nal
decision is presented below.
Protégé ontology editor
Protégé [16] is a free, open source ontology editor, which allows to export the
ontologies in many formats: XMLSchema, OWL (Web Ontology Language),
RDF. Protégé is Java software with room for extensions and plugins. The
creation of the ontologies in Protégé is made visually, without the necessity of
writing any code. There exist some special Protégé plugins, like OntoViz [37]
and OWLViz [4], that allow graphical representation of the ontologies and
are used for presentation purposes.
32
Jena framework
Jena [11] is the programming environment for developing the semantic web
applications, thus also ontologies. It is open source framework implemented
in Java programming language with distribution packages for further devel-
opment. Jena provides environment for development in RDF, RDFS, OWL
and SPARQL.
Decision
These two editors presented above are considered as the best for this applica-
tion with very good API (Application Programming Interface) and detailed
documentation what signi�cantly eases and speeds up the programming pro-
cess. Finally, the decision is that Protégé editor is to be used for design of
the ontology, and afterwards, Jena framework is exploited for programming
re-creation of the ontology previously designed in Protégé. As the output,
Semantic Web ontology (OWL �le) is obtained. The advantage of Jena over
the Protégé is that it facilitates both: RDF (reports) and OWL (ontology)
�les creation and processing programatically in Java using the same distri-
bution packages. Despite of it, Protégé is excellent tool for visualization of
the ontologies and makes the beginning stage of ontology development much
simpler.
3.1.3 Tools for GUI applications � review
After de�ning the speci�c tools for the visualization and ontology develop-
ment, a full review through the tools for Graphical User Interface applications
was made. The choice of the appropriate one is dependent on the type of
the work environment used for the software development and the additional
toolkits. Some golden mean is required to be found in order to integrate
them to work together.
Below, one can �nd a brief description of the GUI libraries/tools which
were investigated.
33
Microsoft Foundation Classes - MFC
Microsoft Foundation Classes, originally known also as Application Frame-
work eXtensions (AFX) is the application framework, which basically is the
library, wrapping together the Windows API and C++ classes. It can be used
obviously when working with the C++ programming language and provides
object�oriented programming model to the Windows API. Furthermore, the
creation of Model�View�Controller�based architectures can be created using
the Document/View framework.
The disadvantage of MFC is that it is not portable across various oper-
ating systems.
Quasar Technologies Qt
Qt is the toolkit used for application development, mainly prepared for C++,
but it provides also bindings to Java, Python, Ruby, PHP, C#. It is mainly
used for the development of the GUI programs.
The additional advantages of Qt are visible through the embedded inter-
nationalization support and the availability.
GLUI library
GLUI is the library which provides the GUI elements for the OpenGL ap-
plications. It relies on GLUT (OpenGL Utility Toolkit) library thus it is
de facto the GLUT-based C++ user interface. It does not contain many
features like the others tools described in this subsection, but its advantage
is the ease in usage.
Java Swing toolkit
Java Swing is the GUI toolkit created for Java programming language. It is
the successor of AWT (Abstract Window Toolkit) and provides all necessary
GUI widgets for the creation of advanced GUI programs.
Swing is platform-independent toolkit with Model-View-Controller GUI
framework for Java system. Moreover, it is freely available and open for
34
development like the Java programming language. It is recommended to use
Swing when developing the applications in Java.
3.1.4 Final environment choice for the MIAWARE software
After the full review of the necessary tools to use, the �nal decision about
the work environment was to be made. Two programming languages were
taken to account: C++ and Java. Below, one can �nd the pros and cons
of the above-mentioned programming languages for the development of the
MIAWARE software.
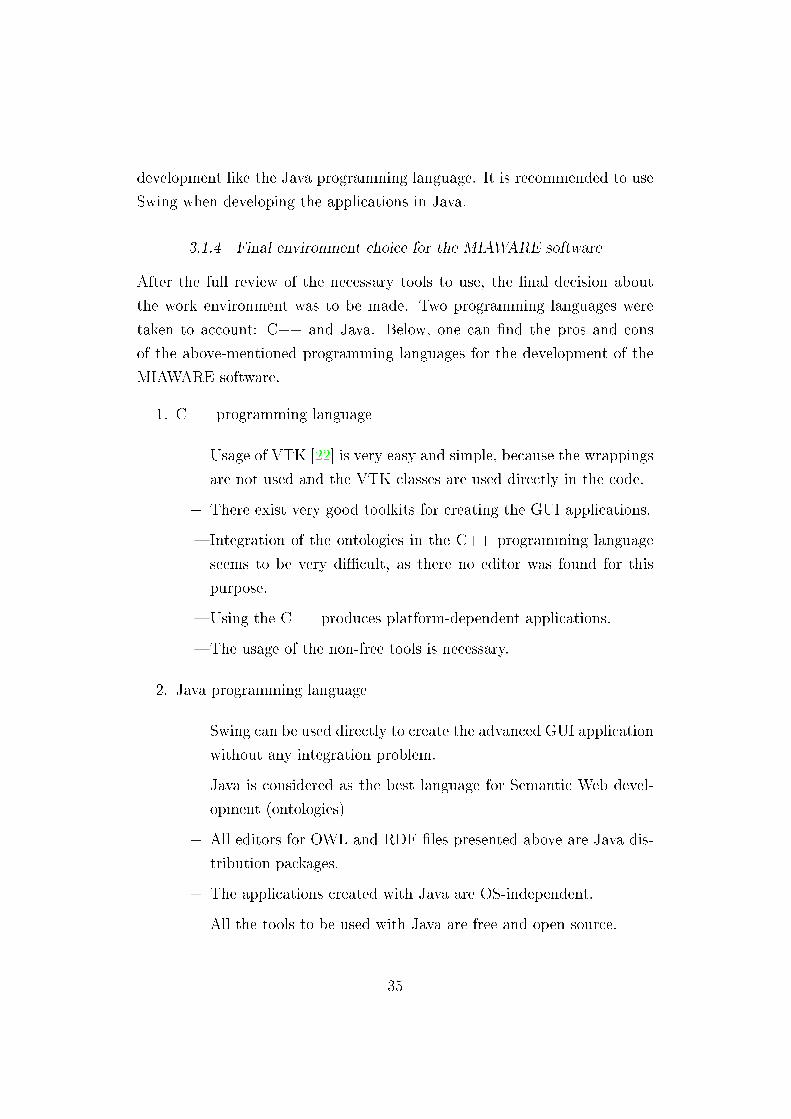
1. C++ programming language
+ Usage of VTK [22] is very easy and simple, because the wrappings
are not used and the VTK classes are used directly in the code.
+ There exist very good toolkits for creating the GUI applications.
� Integration of the ontologies in the C++ programming language
seems to be very di�cult, as there no editor was found for this
purpose.
� Using the C++ produces platform-dependent applications.
� The usage of the non-free tools is necessary.
2. Java programming language
+ Swing can be used directly to create the advanced GUI application
without any integration problem.
+ Java is considered as the best language for Semantic Web devel-
opment (ontologies)
+ All editors for OWL and RDF �les presented above are Java dis-
tribution packages.
+ The applications created with Java are OS-independent.
+ All the tools to be used with Java are free and open source.
35
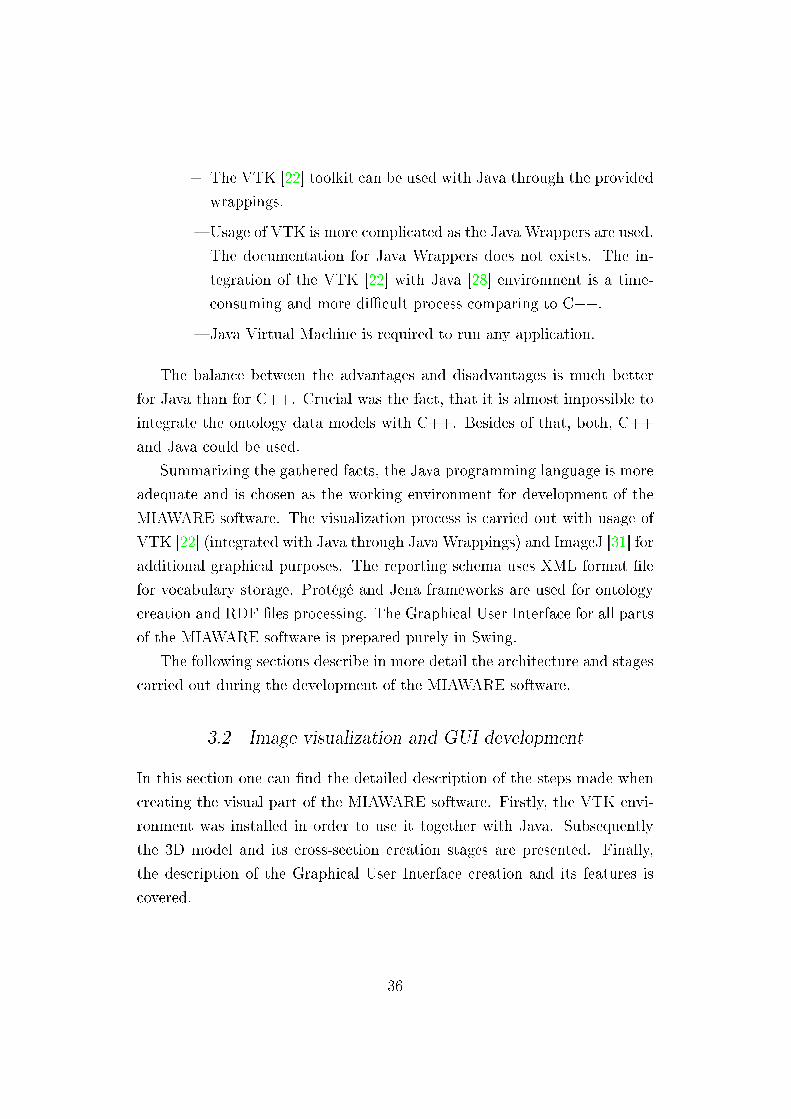
+ The VTK [22] toolkit can be used with Java through the provided
wrappings.
� Usage of VTK is more complicated as the Java Wrappers are used.
The documentation for Java Wrappers does not exists. The in-
tegration of the VTK [22] with Java [28] environment is a time-
consuming and more di�cult process comparing to C++.
� Java Virtual Machine is required to run any application.
The balance between the advantages and disadvantages is much better
for Java than for C++. Crucial was the fact, that it is almost impossible to
integrate the ontology data models with C++. Besides of that, both, C++
and Java could be used.
Summarizing the gathered facts, the Java programming language is more
adequate and is chosen as the working environment for development of the
MIAWARE software. The visualization process is carried out with usage of
VTK [22] (integrated with Java through Java Wrappings) and ImageJ [31] for
additional graphical purposes. The reporting schema uses XML format �le
for vocabulary storage. Protégé and Jena frameworks are used for ontology
creation and RDF �les processing. The Graphical User Interface for all parts
of the MIAWARE software is prepared purely in Swing.
The following sections describe in more detail the architecture and stages
carried out during the development of the MIAWARE software.
3.2 Image visualization and GUI development
In this section one can �nd the detailed description of the steps made when
creating the visual part of the MIAWARE software. Firstly, the VTK envi-
ronment was installed in order to use it together with Java. Subsequently
the 3D model and its cross-section creation stages are presented. Finally,
the description of the Graphical User Interface creation and its features is
covered.
36
3.2.1 Integrating VTK with Java
The �rst step in the MIAWARE development was to integrate the VTK
classes with the Java programming language. As the VTK provides the
wrappers to Java, the only thing to do is to con�gure it correctly. The entire
con�guration is performed using the CMake [18] system following the VTK
recommendations. Many useful information about the VTK, its functionality,
development and installation steps were found in the VTK User's Guide [17].
CMake [18] is �the cross-platform, open-source make system. CMake is
used to control the software compilation process using simple platform and
compiler independent con�guration �les� [18]. CMake is able to generate the
make�les and workspace for a chosen compiler.
VTK and CMake are the products developed by Kitware, thus the CMake
con�guration �les provided with VTK source were used to con�gure VTK
for Java. After the con�guration, where the VTK wrapping for Java was
enabled, the whole VTK source was compiled using the C++ compiler (in
this case it was Visual Studio 2005). After, long-term compilation process,
the Java classes and source �les were generated in order to use them for
further development of VTK applications in Java.
Unfortunately, the VTK installation process described above had brought
many unexpected problems. Moreover, there was almost no information
in the Internet about installation of VTK with Java. As a result, after
completing successfully this stage, the HOWTO document was created for
the other VTK users who are keen to install and use VTK with Java. The
document was placed on the web page: http://www.spinet.pl/ wilku/vtk-
howto/. It can be also found in the Appendix A of this thesis.
The Java application was developed with usage of the Eclipse framework,
which facilitates enormously the design and writing code process. Eclipse is
a free and open software.
3.2.2 Creating 3D model
After successful VTK con�guration the �rst task was to render and display
the 3D model from the set of CAT images. Figure 3.1 is a schematic rep-
37
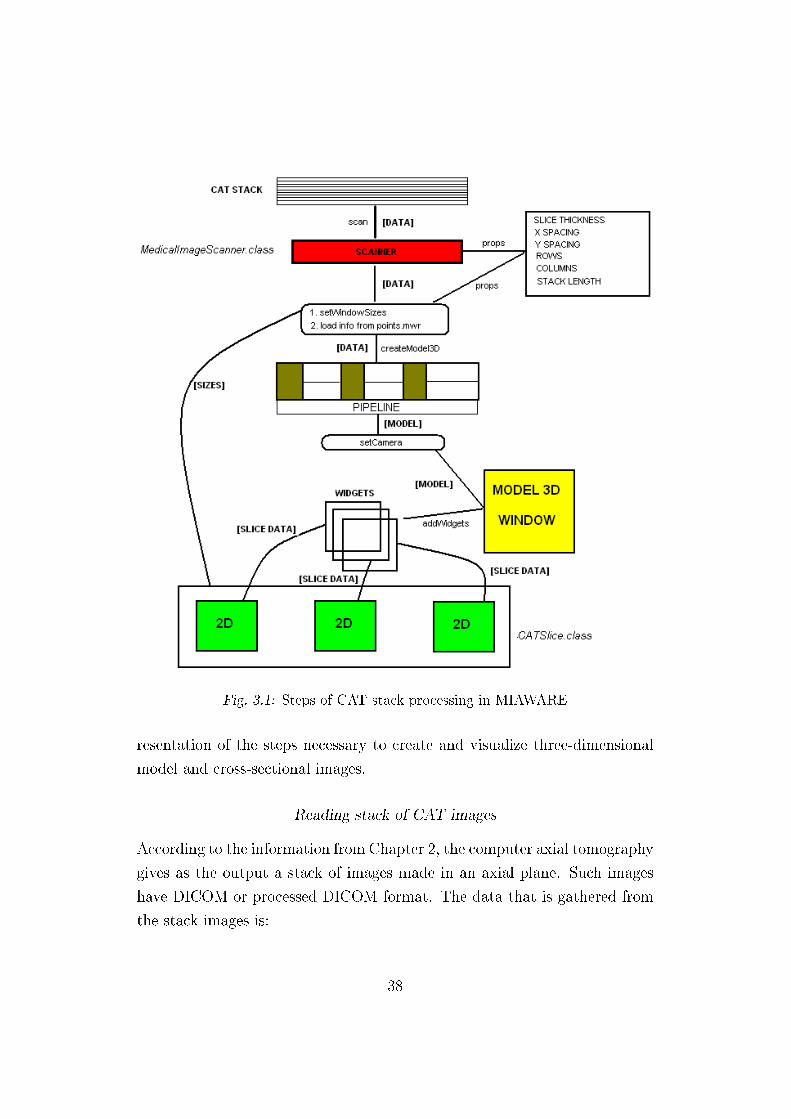
Fig. 3.1: Steps of CAT stack processing in MIAWARE
resentation of the steps necessary to create and visualize three-dimensional
model and cross-sectional images.
Reading stack of CAT images
According to the information from Chapter 2, the computer axial tomography
gives as the output a stack of images made in an axial plane. Such images
have DICOM or processed DICOM format. The data that is gathered from
the stack images is:
38
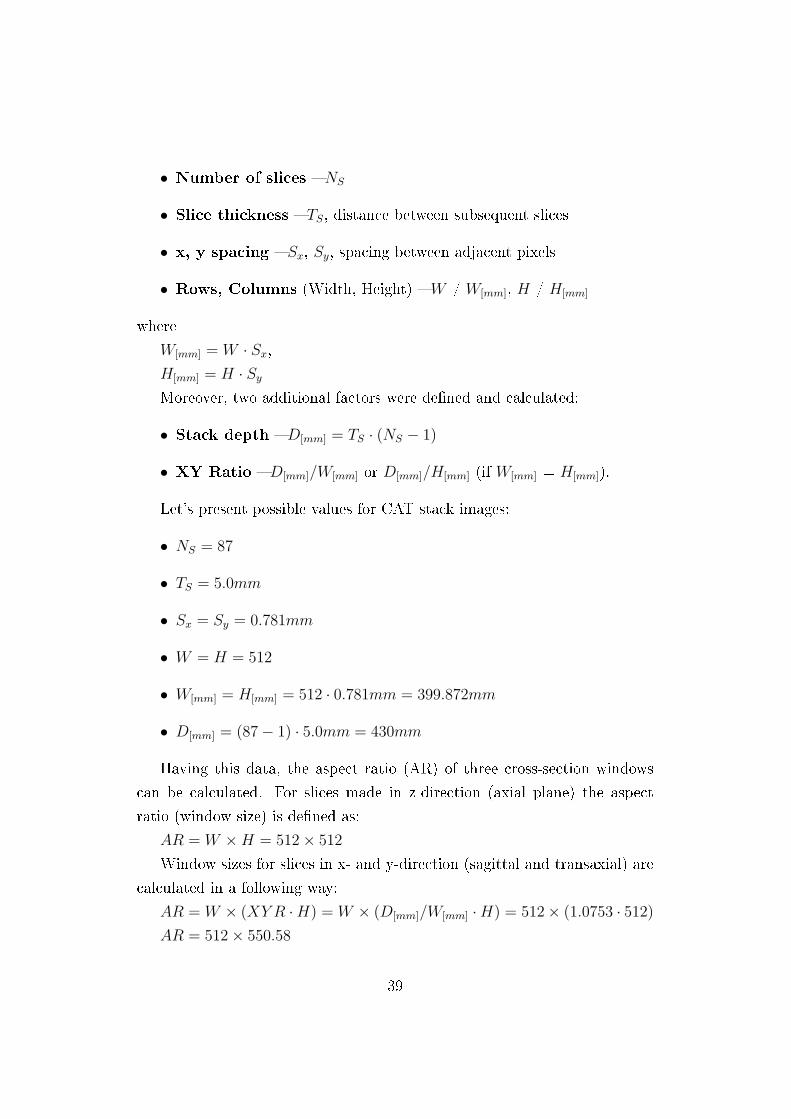
• Number of slices � NS
• Slice thickness � TS, distance between subsequent slices
• x, y spacing � Sx, Sy, spacing between adjacent pixels
• Rows, Columns (Width, Height) � W / W[mm], H / H[mm]
where
W[mm] = W · Sx,
H[mm] = H · Sy
Moreover, two additional factors were de�ned and calculated:
• Stack depth � D[mm] = TS · (NS − 1)
• XY Ratio � D[mm]/W[mm] or D[mm]/H[mm] (if W[mm] = H[mm]).
Let's present possible values for CAT stack images:
• NS = 87
• TS = 5.0mm
• Sx = Sy = 0.781mm
• W = H = 512
• W[mm] = H[mm] = 512 · 0.781mm = 399.872mm
• D[mm] = (87− 1) · 5.0mm = 430mm
Having this data, the aspect ratio (AR) of three cross-section windows
can be calculated. For slices made in z-direction (axial plane) the aspect
ratio (window size) is de�ned as:
AR = W ×H = 512× 512
Window sizes for slices in x- and y-direction (sagittal and transaxial) are
calculated in a following way:
AR = W × (XY R ·H) = W × (D[mm]/W[mm] ·H) = 512× (1.0753 · 512)
AR = 512× 550.58
39
Such properties are read in MIAWARE using ImageJ [39] software pack-
age. Suitable class in Java was created (MedicalImageScanner), in order to
retrieve information using the class ImagePlus (from ImageJ).
Following the diagram presented in Figure 3.1, two important actions
are performed before the start of 3D model creation procedure. Firstly, the
size of the GUI windows must be calculated (using the above formulas) and
set according to the properties data read by MedicalImageScanner class.
Secondly, the points.mwr �le (created by the MIAWARE software) is to
be read. This �le stores the data, about the pathologies and their speci�c
location (coordinates) on the images, inserted by the user.
Afterwards, the VTK starts its role by loading the images into mem-
ory using the class vtkImageReader2. To achieve proper rendering of the
image data, some properties have to be introduced to the instance of vtkIm-
ageReader2 class.
Firstly, data spacing for three dimensions (x, y, z) is to be set. Data
spacing for x and y plane direction is simply a pixel distance in any 2D
stack image. Data spacing for z direction is the parameter called also slice
thickness. That value is the further property read by MedicalImageScanner.
This is basically the distance between two proceeding images made during
the CAT examination.
The second property to be set is the data extent. In VTK, such a property
is de�ned by six values, one pair of values for each plane direction. The
di�erence between each of two values from any pair gives the length of the
image in a speci�ed direction. Thus, for the x direction, these values specify
image width (in pixels) while, in the y direction case, image height. Values
for the z direction represent simply the index number of both, the �rst and
the last images in the stack, which belong to the 3D model. vtkImageReader2
allows also reading any single image, not only stacks. In such a case, the two
last values should be equal.
Finally, the path for the folder with the images (�le pre�x ) and the �le
pattern should be set. The execution of the method Update �nishes the
action of loading image stack data into memory.
40
Preparing model for display
The image data already loaded must be processed in order to create the
displayable 3D model. This is achieved using the VTK �lters, mappers and
actors. These are also known as the visualization pipeline.
The contour �lter is applied to the 3D image data as the �rst. Setting
the threshold values in such a �lter can create respective isosurfaces. In case
of the MIAWARE 3D model only one threshold value is used.
After the data �ltering, the mapper is used (vtkPolyDataMapper) which
maps polygonal data and graphics primitives. The mapper can change dis-
played colour of the model by changing the model scalar values. Actually,
this option is not used with MIAWARE recently.
Finally, the actor is created, which represents the 3D object (model) in
a rendered scene. The additional actor options like opacity, color, position,
etc. can be set in order to improve the model appearance on the screen.
Rendering the scene
Showing the scene with actors, in our case � 3D model, is made using the VTK
wrapper class for Java, called vtkCanvas. It is the heavy-weight component
in Java, what means that it remains always on top in the GUI application.
This class inherits from the other VTK wrapper class � vtkPanel. Both of
them encapsulate some VTK objects responsible for showing the scene and
interacting with it (vtkRenderer, vtkRenderWindow, vtkRenderWindowInter-
actor).
To create the scene, it is only necessary to create the object of the vtk-
Canvas class, add the camera (vtkCamera) which allows viewing and model
manipulations. Some properties of the camera like position or focal point can
be set. Finally, the model is rendered and displayed in the 3D model window.
The sample model created from arbitrary set of CAT images is presented in
Figure 3.2.
The vtkCanvas has the default interaction set with mouse and the key-
board. Thanks to that, it is possible to rotate, zoom and translate the object.
Such the interactor can be overloaded and the mouse and keyboard behavior
41
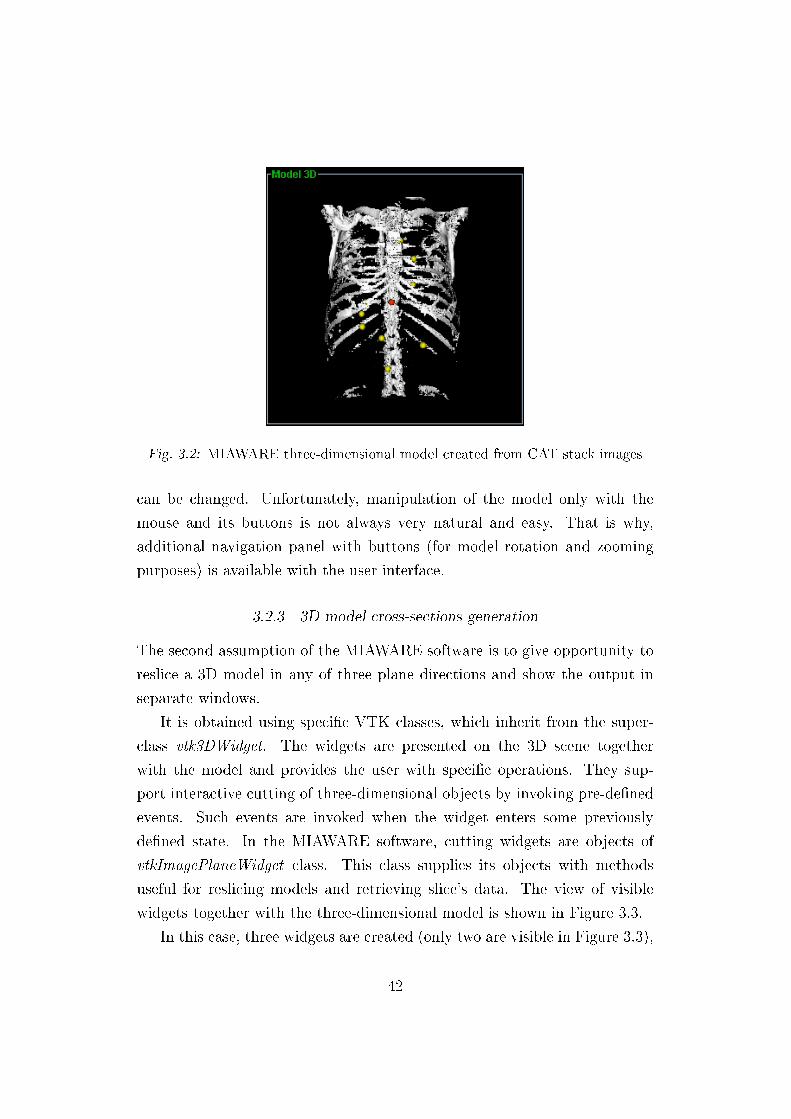
Fig. 3.2: MIAWARE three-dimensional model created from CAT stack images
can be changed. Unfortunately, manipulation of the model only with the
mouse and its buttons is not always very natural and easy. That is why,
additional navigation panel with buttons (for model rotation and zooming
purposes) is available with the user interface.
3.2.3 3D model cross-sections generation
The second assumption of the MIAWARE software is to give opportunity to
reslice a 3D model in any of three plane directions and show the output in
separate windows.
It is obtained using speci�c VTK classes, which inherit from the super-
class vtk3DWidget. The widgets are presented on the 3D scene together
with the model and provides the user with speci�c operations. They sup-
port interactive cutting of three-dimensional objects by invoking pre-de�ned
events. Such events are invoked when the widget enters some previously
de�ned state. In the MIAWARE software, cutting widgets are objects of
vtkImagePlaneWidget class. This class supplies its objects with methods
useful for reslicing models and retrieving slice's data. The view of visible
widgets together with the three-dimensional model is shown in Figure 3.3.
In this case, three widgets are created (only two are visible in Figure 3.3),
42
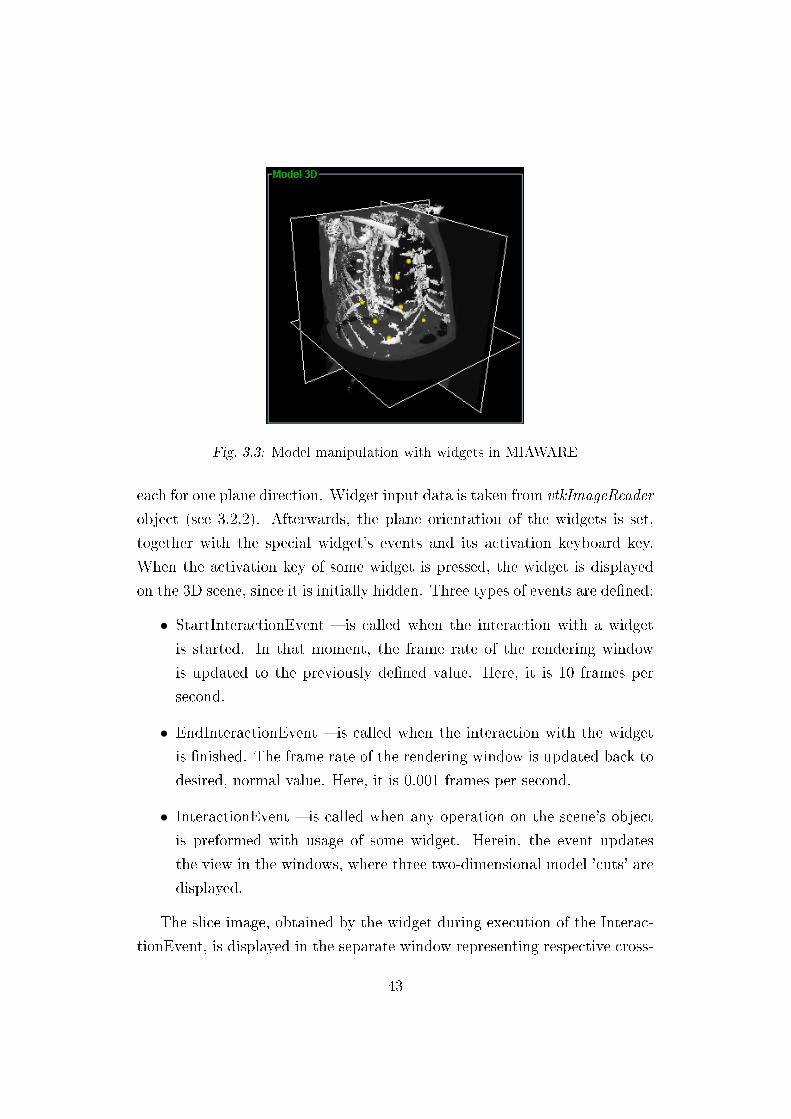
Fig. 3.3: Model manipulation with widgets in MIAWARE
each for one plane direction. Widget input data is taken from vtkImageReader
object (see 3.2.2). Afterwards, the plane orientation of the widgets is set,
together with the special widget's events and its activation keyboard key.
When the activation key of some widget is pressed, the widget is displayed
on the 3D scene, since it is initially hidden. Three types of events are de�ned:
• StartInteractionEvent � is called when the interaction with a widget
is started. In that moment, the frame rate of the rendering window
is updated to the previously de�ned value. Here, it is 10 frames per
second.
• EndInteractionEvent � is called when the interaction with the widget
is �nished. The frame rate of the rendering window is updated back to
desired, normal value. Here, it is 0.001 frames per second.
• InteractionEvent � is called when any operation on the scene's object
is preformed with usage of some widget. Herein, the event updates
the view in the windows, where three two-dimensional model 'cuts' are
displayed.
The slice image, obtained by the widget during execution of the Interac-
tionEvent, is displayed in the separate window representing respective cross-
43
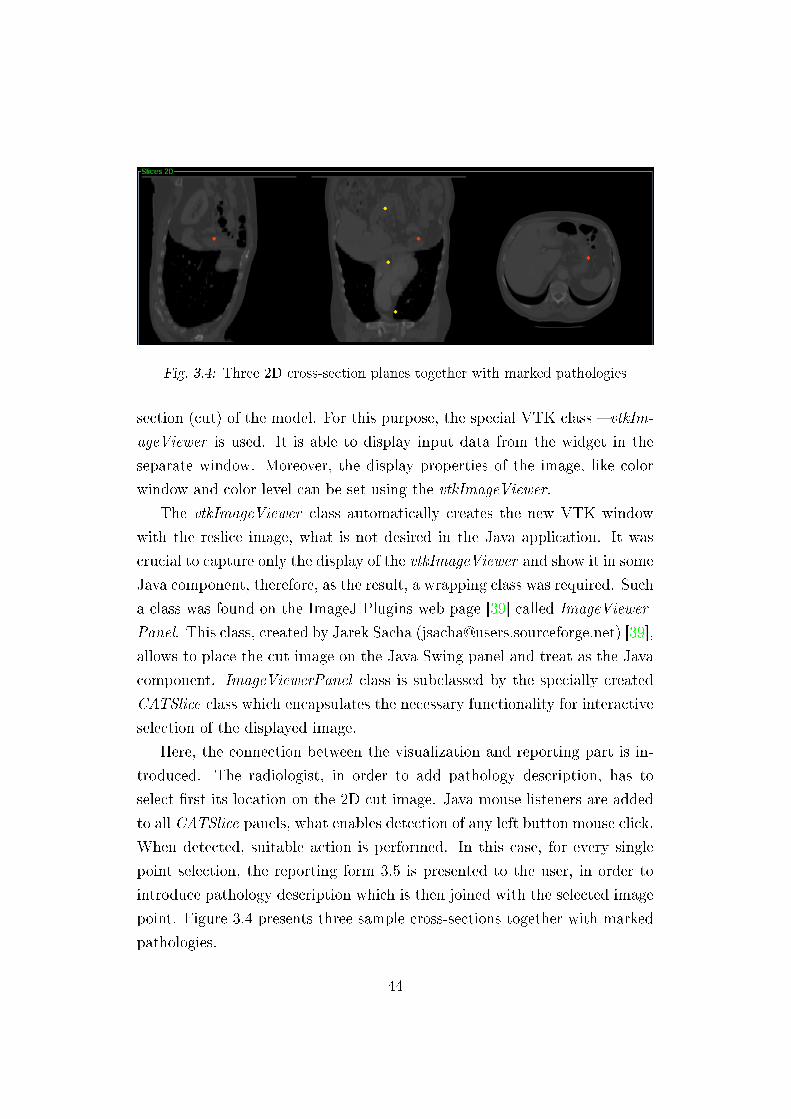
Fig. 3.4: Three 2D cross-section planes together with marked pathologies
section (cut) of the model. For this purpose, the special VTK class � vtkIm-
ageViewer is used. It is able to display input data from the widget in the
separate window. Moreover, the display properties of the image, like color
window and color level can be set using the vtkImageViewer.
The vtkImageViewer class automatically creates the new VTK window
with the reslice image, what is not desired in the Java application. It was
crucial to capture only the display of the vtkImageViewer and show it in some
Java component, therefore, as the result, a wrapping class was required. Such
a class was found on the ImageJ Plugins web page [39] called ImageViewer-
Panel. This class, created by Jarek Sacha ([email protected]) [39],
allows to place the cut image on the Java Swing panel and treat as the Java
component. ImageViewerPanel class is subclassed by the specially created
CATSlice class which encapsulates the necessary functionality for interactive
selection of the displayed image.
Here, the connection between the visualization and reporting part is in-
troduced. The radiologist, in order to add pathology description, has to
select �rst its location on the 2D cut image. Java mouse listeners are added
to all CATSlice panels, what enables detection of any left button mouse click.
When detected, suitable action is performed. In this case, for every single
point selection, the reporting form 3.5 is presented to the user, in order to
introduce pathology description which is then joined with the selected image
point. Figure 3.4 presents three sample cross-sections together with marked
pathologies.
44
Any introduced pathology is represented on 2D images as well as on the
3D model, in form of small spheres. These spheres are actually simple VTK
actors added to the 2D and 3D scenes. They can be later picked with mouse
in order to edit previously inserted information or simply delete it.
3.2.4 Creating GUI
The whole GUI window for the MIAWARE software was designed using the
Java Swing components. The modelling and placing of the components was
performed in the Eclipse Visual Editor, an open development platform sup-
plying platforms for creating GUI applications. The additional information
about creating the GUI applications and other useful information about pro-
gramming in Java were found in the book Java - How to Program by Harvey
M. Deitel [2] and Sun's Java Tutorial [29].
All the VTK outputs described above, like renderer window with the 3D
model and three cross-section windows were placed in the Java Swing panels
(JPanel) and easily integrated with the GUI. As mentioned in the subsection
3.2.3, special wrapper classes, which inherit from Java components, were
created in order to complete the full integration with Java.
The objects of the created wrapping class CATSlice (subclass of Im-
ageViewerPanel) were connected directly to the widget event � Interaction-
Event (look at section 3.2.3). Thanks to that, with every interaction per-
formed on the 3D model widget, the cross-section view is changed automat-
ically in the respective CATSlice object.
The cross section panel size is dependent on the properties of the input
images. The Properties object, which stores the necessary information about
the format of introduced medical data, created by the object of the ImagePlus
class (taken from ImageJ [31] distribution, see section 3.2.2), supplies the GUI
window object with the image dimensions or stack length and, consequently,
is able to �t the images completely in cross-section panels.
45
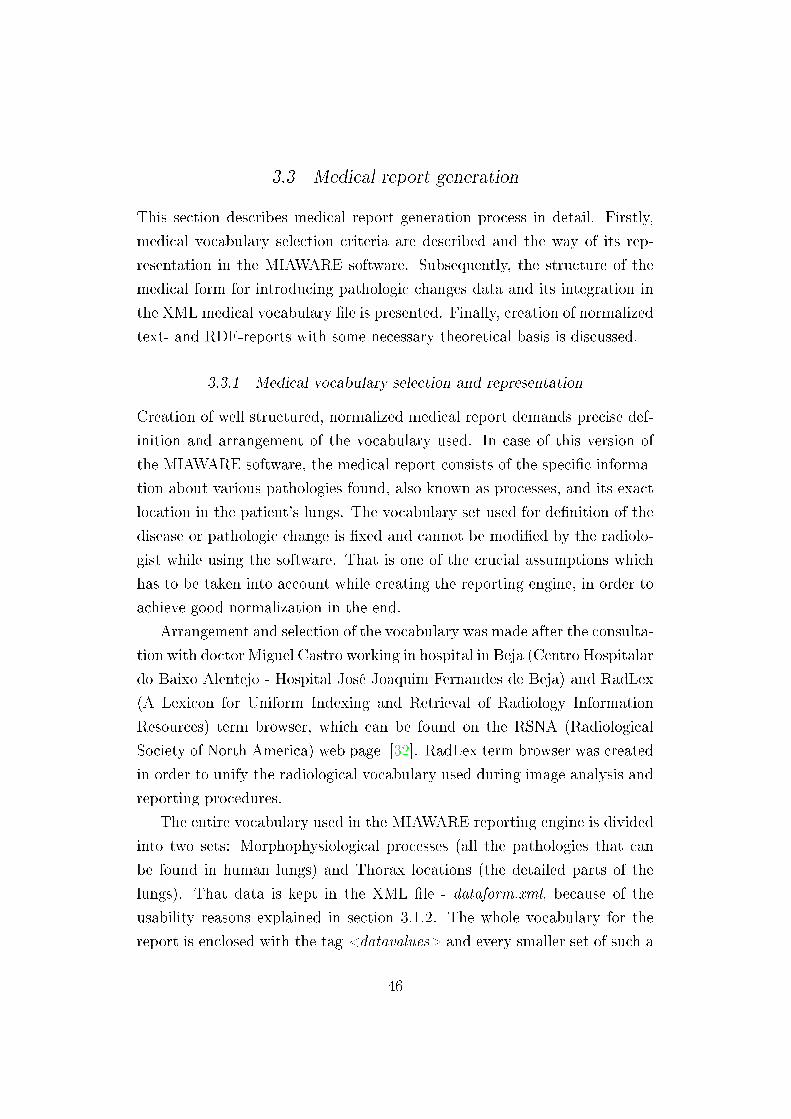
3.3 Medical report generation
This section describes medical report generation process in detail. Firstly,
medical vocabulary selection criteria are described and the way of its rep-
resentation in the MIAWARE software. Subsequently, the structure of the
medical form for introducing pathologic changes data and its integration in
the XML medical vocabulary �le is presented. Finally, creation of normalized
text- and RDF-reports with some necessary theoretical basis is discussed.
3.3.1 Medical vocabulary selection and representation
Creation of well structured, normalized medical report demands precise def-
inition and arrangement of the vocabulary used. In case of this version of
the MIAWARE software, the medical report consists of the speci�c informa-
tion about various pathologies found, also known as processes, and its exact
location in the patient's lungs. The vocabulary set used for de�nition of the
disease or pathologic change is �xed and cannot be modi�ed by the radiolo-
gist while using the software. That is one of the crucial assumptions which
has to be taken into account while creating the reporting engine, in order to
achieve good normalization in the end.
Arrangement and selection of the vocabulary was made after the consulta-
tion with doctor Miguel Castro working in hospital in Beja (Centro Hospitalar
do Baixo Alentejo - Hospital José Joaquim Fernandes de Beja) and RadLex
(A Lexicon for Uniform Indexing and Retrieval of Radiology Information
Resources) term browser, which can be found on the RSNA (Radiological
Society of North America) web page [32]. RadLex term browser was created
in order to unify the radiological vocabulary used during image analysis and
reporting procedures.
The entire vocabulary used in the MIAWARE reporting engine is divided
into two sets: Morphophysiological processes (all the pathologies that can
be found in human lungs) and Thorax locations (the detailed parts of the
lungs). That data is kept in the XML �le - dataform.xml, because of the
usability reasons explained in section 3.1.2. The whole vocabulary for the
report is enclosed with the tag <datavalues> and every smaller set of such a
46
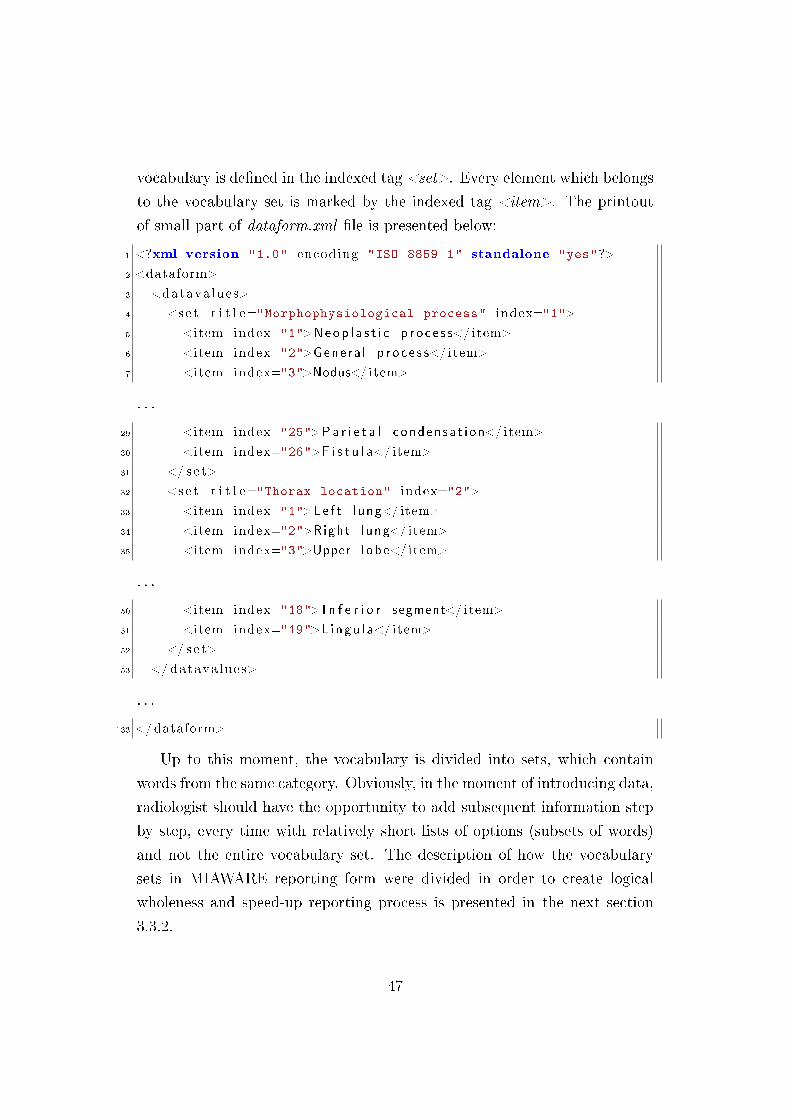
vocabulary is de�ned in the indexed tag <set>. Every element which belongs
to the vocabulary set is marked by the indexed tag <item>. The printout
of small part of dataform.xml �le is presented below:
1 <?xml version="1.0" encoding="ISO-8859-1" standalone="yes"?>
2 <dataform>
3 <datava lues>
4 <se t t i t l e="Morphophysiological process" index="1">
5 <item index="1">Neop l a s t i c p r o c e s s</ item>
6 <item index="2">Gene ra l p r o c e s s</ item>
7 <item index="3">Nodus</ item>
. . .
29 <item index="25">P a r i e t a l c onden sa t i on</ item>
30 <item index="26">F i s t u l a</ item>
31 </ se t>
32 <se t t i t l e="Thorax location" index="2">
33 <item index="1">L e f t l ung</ item>
34 <item index="2">Right lung</ item>
35 <item index="3">Upper l ob e</ item>
. . .
50 <item index="18"> I n f e r i o r segment</ item>
51 <item index="19">L i n gu l a</ item>
52 </ se t>
53 </datava lues>
. . .
133 </dataform>
Up to this moment, the vocabulary is divided into sets, which contain
words from the same category. Obviously, in the moment of introducing data,
radiologist should have the opportunity to add subsequent information step
by step, every time with relatively short lists of options (subsets of words)
and not the entire vocabulary set. The description of how the vocabulary
sets in MIAWARE reporting form were divided in order to create logical
wholeness and speed-up reporting process is presented in the next section
3.3.2.
47
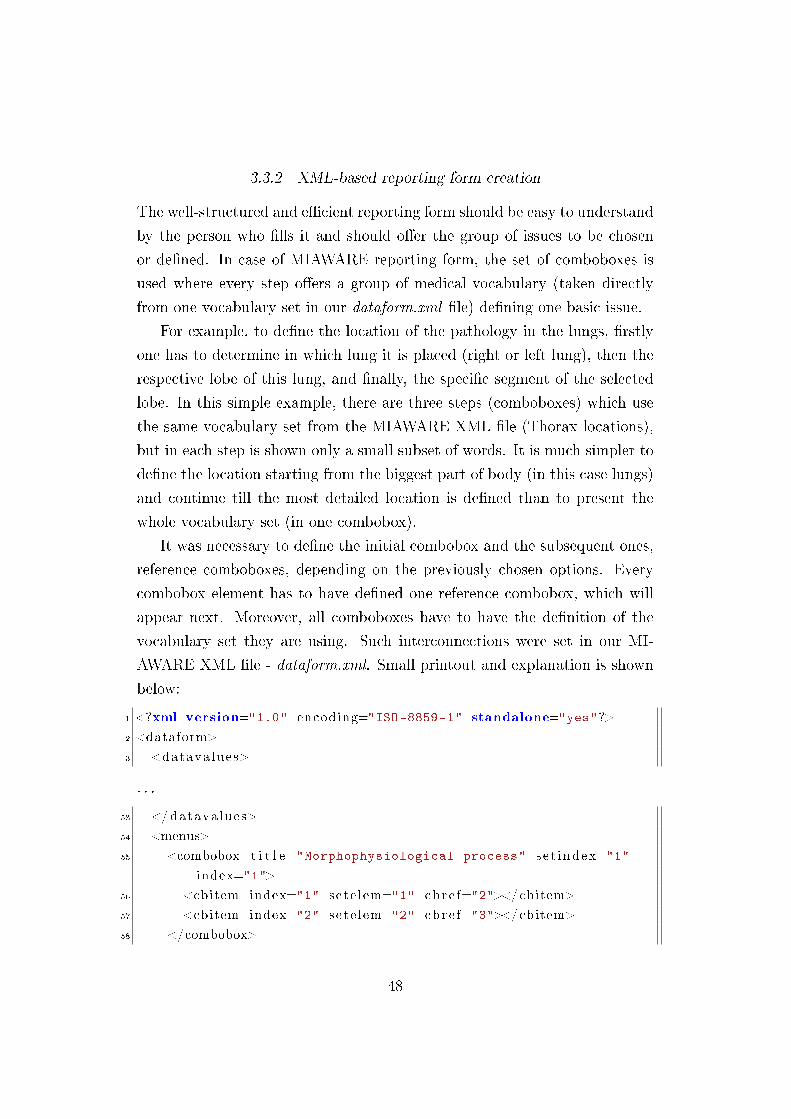
3.3.2 XML-based reporting form creation
The well-structured and e�cient reporting form should be easy to understand
by the person who �lls it and should o�er the group of issues to be chosen
or de�ned. In case of MIAWARE reporting form, the set of comboboxes is
used where every step o�ers a group of medical vocabulary (taken directly
from one vocabulary set in our dataform.xml �le) de�ning one basic issue.
For example, to de�ne the location of the pathology in the lungs, �rstly
one has to determine in which lung it is placed (right or left lung), then the
respective lobe of this lung, and �nally, the speci�c segment of the selected
lobe. In this simple example, there are three steps (comboboxes) which use
the same vocabulary set from the MIAWARE XML �le (Thorax locations),
but in each step is shown only a small subset of words. It is much simpler to
de�ne the location starting from the biggest part of body (in this case lungs)
and continue till the most detailed location is de�ned than to present the
whole vocabulary set (in one combobox).
It was necessary to de�ne the initial combobox and the subsequent ones,
reference comboboxes, depending on the previously chosen options. Every
combobox element has to have de�ned one reference combobox, which will
appear next. Moreover, all comboboxes have to have the de�nition of the
vocabulary set they are using. Such interconnections were set in our MI-
AWARE XML �le - dataform.xml. Small printout and explanation is shown
below:
1 <?xml version="1.0" encoding="ISO-8859-1" standalone="yes"?>
2 <dataform>
3 <datava lues>
. . .
53 </datava lues>
54 <menus>
55 <combobox t i t l e="Morphophysiological process" s e t index="1"
index="1">
56 <cbitem index="1" se te l em="1" cb r e f="2"></cbitem>
57 <cbitem index="2" se te l em="2" cb r e f="3"></cbitem>
58 </combobox>
48
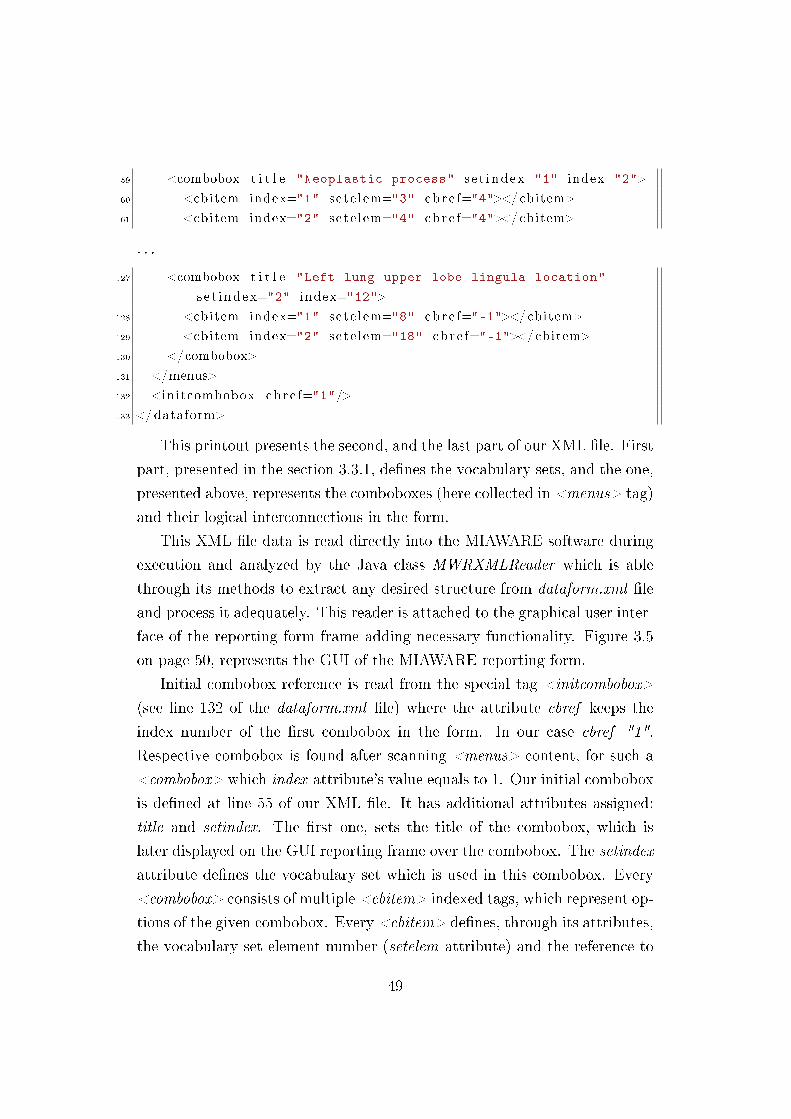
59 <combobox t i t l e="Neoplastic process" s e t index="1" index="2">
60 <cbitem index="1" se te l em="3" cb r e f="4"></cbitem>
61 <cbitem index="2" se te l em="4" cb r e f="4"></cbitem>
. . .
127 <combobox t i t l e="Left lung upper lobe lingula location"
s e t index="2" index="12">
128 <cbitem index="1" se te l em="8" cb r e f="-1"></cbitem>
129 <cbitem index="2" se te l em="18" cb r e f="-1"></cbitem>
130 </combobox>
131 </menus>
132 <initcombobox cb r e f="1"/>
133 </dataform>
This printout presents the second, and the last part of our XML �le. First
part, presented in the section 3.3.1, de�nes the vocabulary sets, and the one,
presented above, represents the comboboxes (here collected in <menus> tag)
and their logical interconnections in the form.
This XML �le data is read directly into the MIAWARE software during
execution and analyzed by the Java class MWRXMLReader which is able
through its methods to extract any desired structure from dataform.xml �le
and process it adequately. This reader is attached to the graphical user inter-
face of the reporting form frame adding necessary functionality. Figure 3.5
on page 50, represents the GUI of the MIAWARE reporting form.
Initial combobox reference is read from the special tag <initcombobox>
(see line 132 of the dataform.xml �le) where the attribute cbref keeps the
index number of the �rst combobox in the form. In our case cbref="1".
Respective combobox is found after scanning <menus> content, for such a
<combobox> which index attribute's value equals to 1. Our initial combobox
is de�ned at line 55 of our XML �le. It has additional attributes assigned:
title and setindex. The �rst one, sets the title of the combobox, which is
later displayed on the GUI reporting frame over the combobox. The setindex
attribute de�nes the vocabulary set which is used in this combobox. Every
<combobox> consists of multiple <cbitem> indexed tags, which represent op-
tions of the given combobox. Every <cbitem> de�nes, through its attributes,
the vocabulary set element number (setelem attribute) and the reference to
49
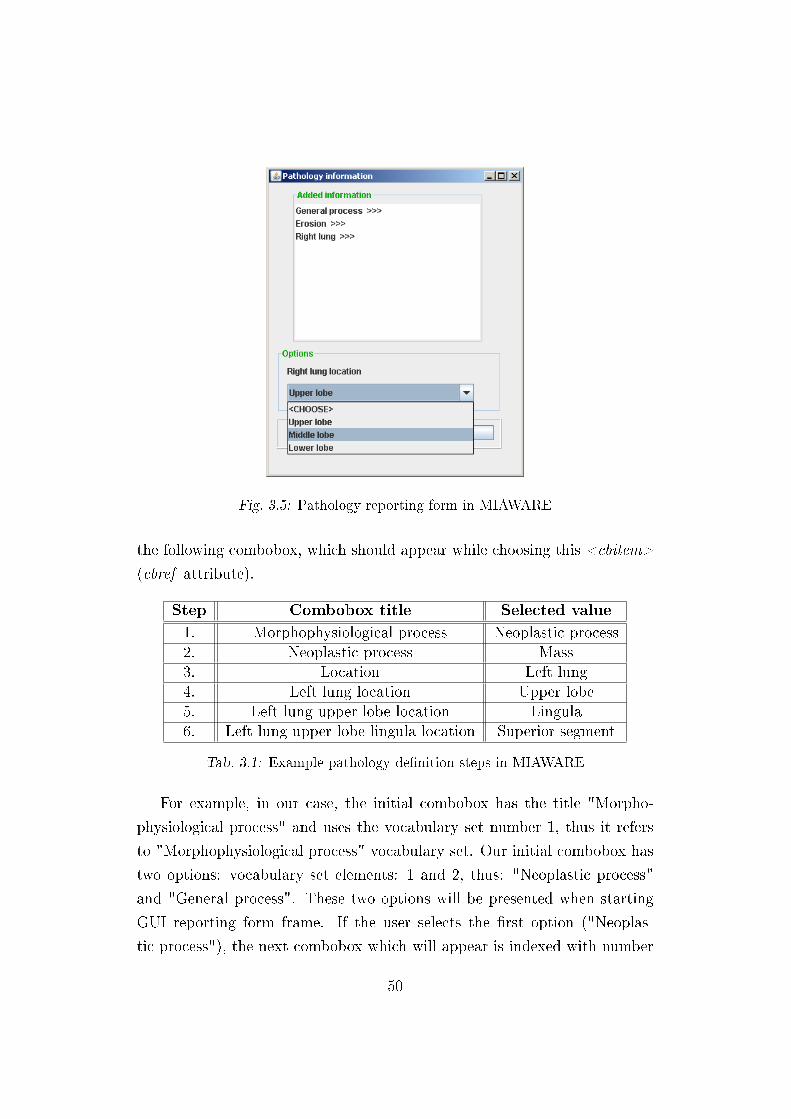
Fig. 3.5: Pathology reporting form in MIAWARE
the following combobox, which should appear while choosing this <cbitem>
(cbref attribute).
Step Combobox title Selected value
1. Morphophysiological process Neoplastic process2. Neoplastic process Mass3. Location Left lung4. Left lung location Upper lobe5. Left lung upper lobe location Lingula6. Left lung upper lobe lingula location Superior segment
Tab. 3.1: Example pathology de�nition steps in MIAWARE
For example, in our case, the initial combobox has the title "Morpho-
physiological process" and uses the vocabulary set number 1, thus it refers
to "Morphophysiological process" vocabulary set. Our initial combobox has
two options: vocabulary set elements: 1 and 2, thus: "Neoplastic process"
and "General process". These two options will be presented when starting
GUI reporting form frame. If the user selects the �rst option ("Neoplas-
tic process"), the next combobox which will appear is indexed with number
50
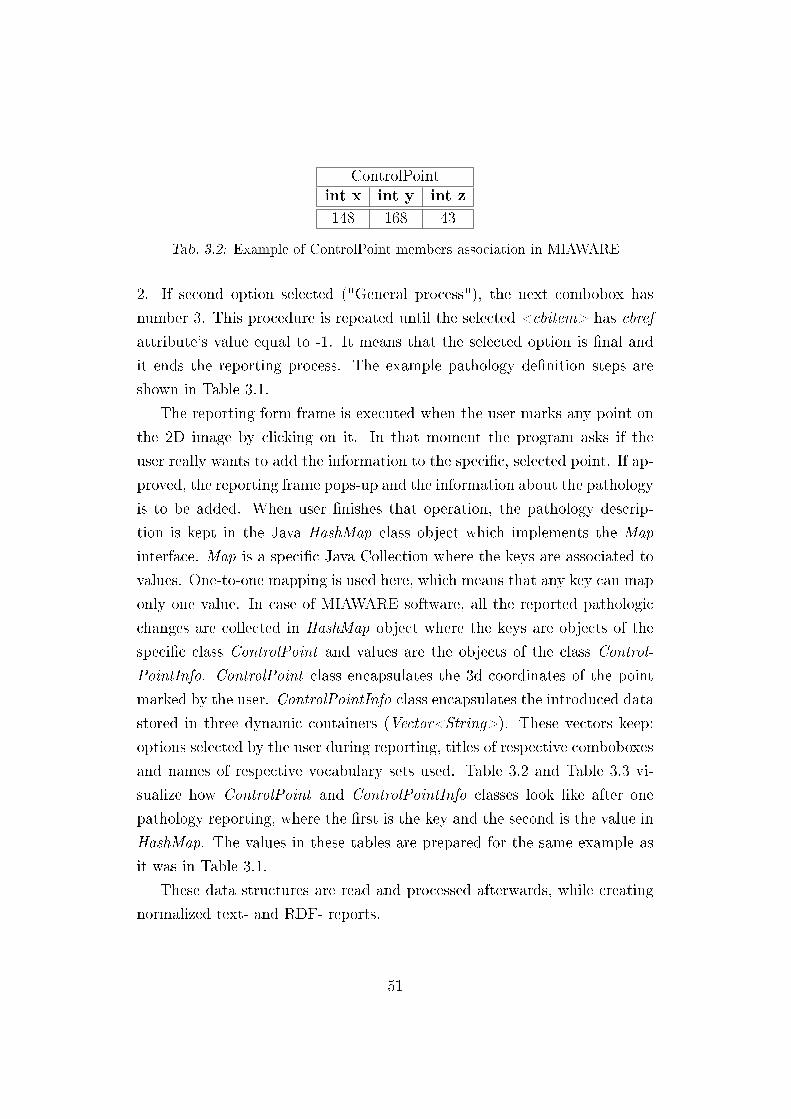
ControlPointint x int y int z
148 168 43
Tab. 3.2: Example of ControlPoint members association in MIAWARE
2. If second option selected ("General process"), the next combobox has
number 3. This procedure is repeated until the selected <cbitem> has cbref
attribute's value equal to -1. It means that the selected option is �nal and
it ends the reporting process. The example pathology de�nition steps are
shown in Table 3.1.
The reporting form frame is executed when the user marks any point on
the 2D image by clicking on it. In that moment the program asks if the
user really wants to add the information to the speci�c, selected point. If ap-
proved, the reporting frame pops-up and the information about the pathology
is to be added. When user �nishes that operation, the pathology descrip-
tion is kept in the Java HashMap class object which implements the Map
interface. Map is a speci�c Java Collection where the keys are associated to
values. One-to-one mapping is used here, which means that any key can map
only one value. In case of MIAWARE software, all the reported pathologic
changes are collected in HashMap object where the keys are objects of the
speci�c class ControlPoint and values are the objects of the class Control-
PointInfo. ControlPoint class encapsulates the 3d coordinates of the point
marked by the user. ControlPointInfo class encapsulates the introduced data
stored in three dynamic containers (Vector<String>). These vectors keep:
options selected by the user during reporting, titles of respective comboboxes
and names of respective vocabulary sets used. Table 3.2 and Table 3.3 vi-
sualize how ControlPoint and ControlPointInfo classes look like after one
pathology reporting, where the �rst is the key and the second is the value in
HashMap. The values in these tables are prepared for the same example as
it was in Table 3.1.
These data structures are read and processed afterwards, while creating
normalized text- and RDF- reports.
51
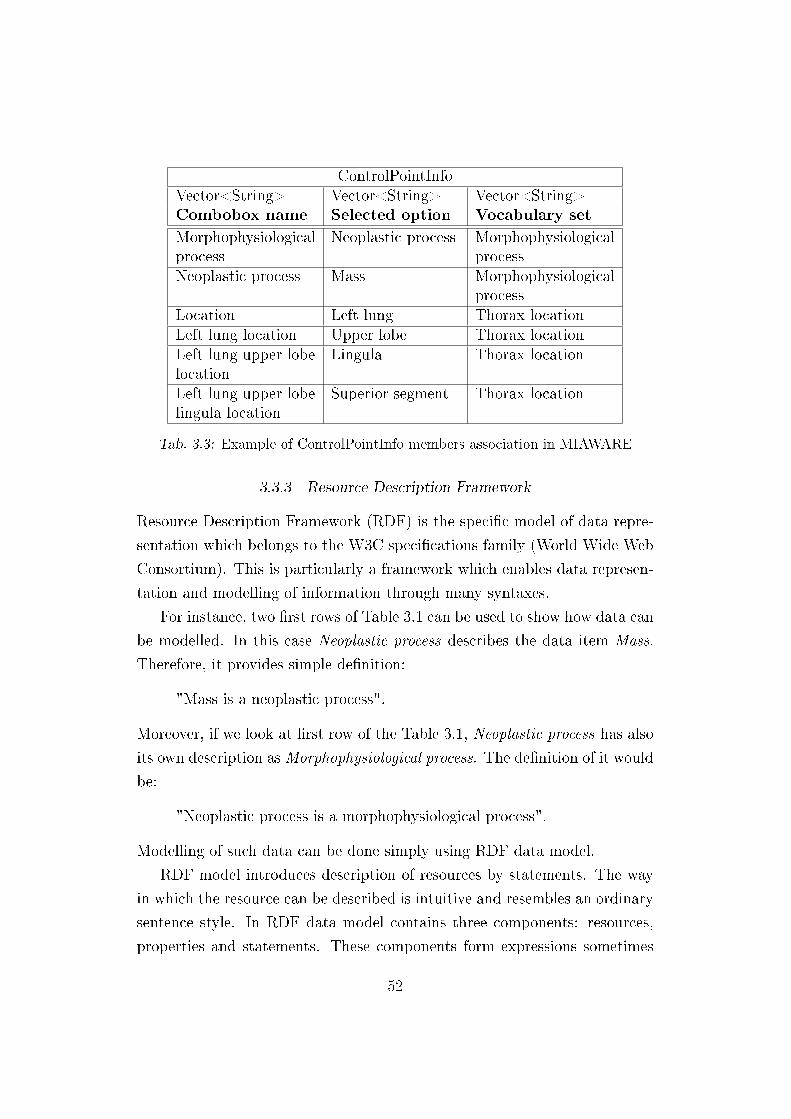
ControlPointInfoVector<String> Vector<String> Vector<String>Combobox name Selected option Vocabulary set
Morphophysiologicalprocess
Neoplastic process Morphophysiologicalprocess
Neoplastic process Mass Morphophysiologicalprocess
Location Left lung Thorax locationLeft lung location Upper lobe Thorax locationLeft lung upper lobelocation
Lingula Thorax location
Left lung upper lobelingula location
Superior segment Thorax location
Tab. 3.3: Example of ControlPointInfo members association in MIAWARE
3.3.3 Resource Description Framework
Resource Description Framework (RDF) is the speci�c model of data repre-
sentation which belongs to the W3C speci�cations family (World Wide Web
Consortium). This is particularly a framework which enables data represen-
tation and modelling of information through many syntaxes.
For instance, two �rst rows of Table 3.1 can be used to show how data can
be modelled. In this case Neoplastic process describes the data item Mass.
Therefore, it provides simple de�nition:
"Mass is a neoplastic process".
Moreover, if we look at �rst row of the Table 3.1, Neoplastic process has also
its own description asMorphophysiological process. The de�nition of it would
be:
"Neoplastic process is a morphophysiological process".
Modelling of such data can be done simply using RDF data model.
RDF model introduces description of resources by statements. The way
in which the resource can be described is intuitive and resembles an ordinary
sentence style. In RDF data model contains three components: resources,
properties and statements. These components form expressions sometimes
52
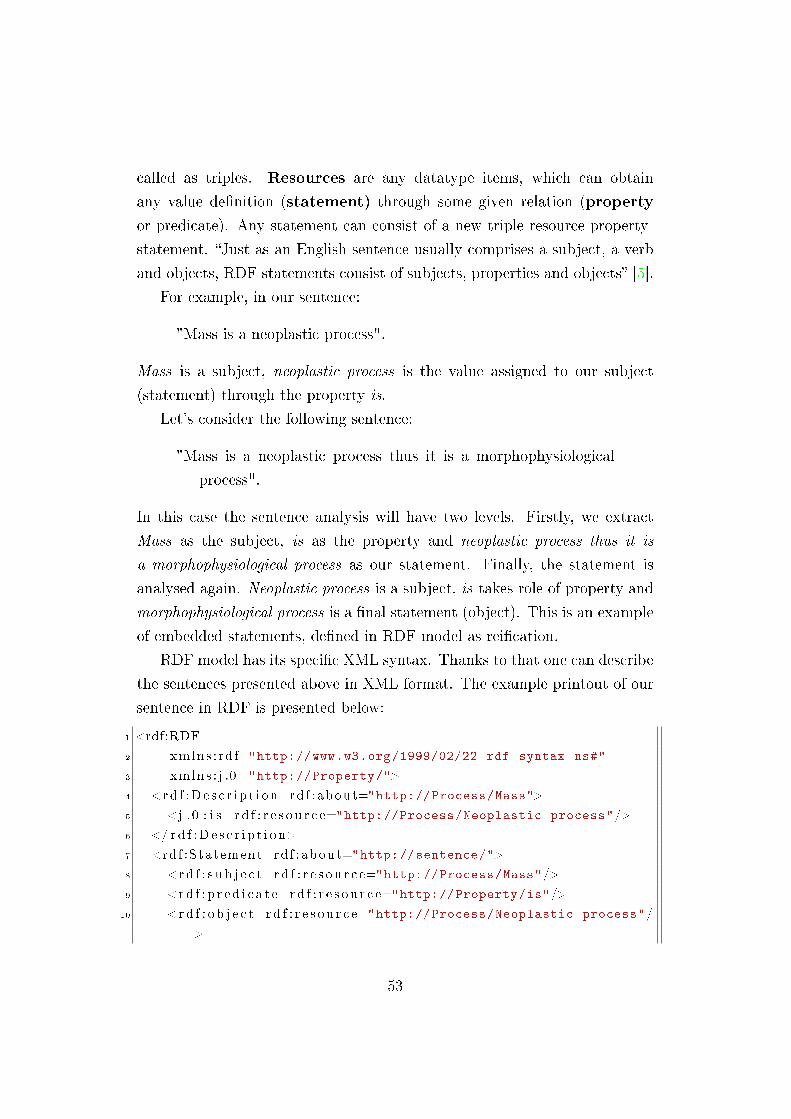
called as triples. Resources are any datatype items, which can obtain
any value de�nition (statement) through some given relation (property
or predicate). Any statement can consist of a new triple resource-property-
statement. �Just as an English sentence usually comprises a subject, a verb
and objects, RDF statements consist of subjects, properties and objects� [5].
For example, in our sentence:
"Mass is a neoplastic process".
Mass is a subject, neoplastic process is the value assigned to our subject
(statement) through the property is.
Let's consider the following sentence:
"Mass is a neoplastic process thus it is a morphophysiological
process".
In this case the sentence analysis will have two levels. Firstly, we extract
Mass as the subject, is as the property and neoplastic process thus it is
a morphophysiological process as our statement. Finally, the statement is
analysed again. Neoplastic process is a subject, is takes role of property and
morphophysiological process is a �nal statement (object). This is an example
of embedded statements, de�ned in RDF model as rei�cation.
RDF model has its speci�c XML syntax. Thanks to that one can describe
the sentences presented above in XML format. The example printout of our
sentence in RDF is presented below:
1 <rdf:RDF
2 xmlns : rd f="http://www.w3.org/1999/02/22-rdf-syntax-ns#"
3 xmlns : j .0="http://Property/">
4 <rd f :D e s c r i p t i o n rd f : about="http://Process/Mass">
5 <j . 0 : i s r d f : r e s o u r c e="http://Process/Neoplastic process"/>
6 </ rd f :D e s c r i p t i o n>
7 <rdf :Statement rd f : abou t="http://sentence/">
8 <rd f : s u b j e c t r d f : r e s o u r c e="http://Process/Mass"/>
9 <rd f : p r e d i c a t e r d f : r e s o u r c e="http://Property/is"/>
10 <rd f : o b j e c t r d f : r e s o u r c e="http://Process/Neoplastic process"/
>
53
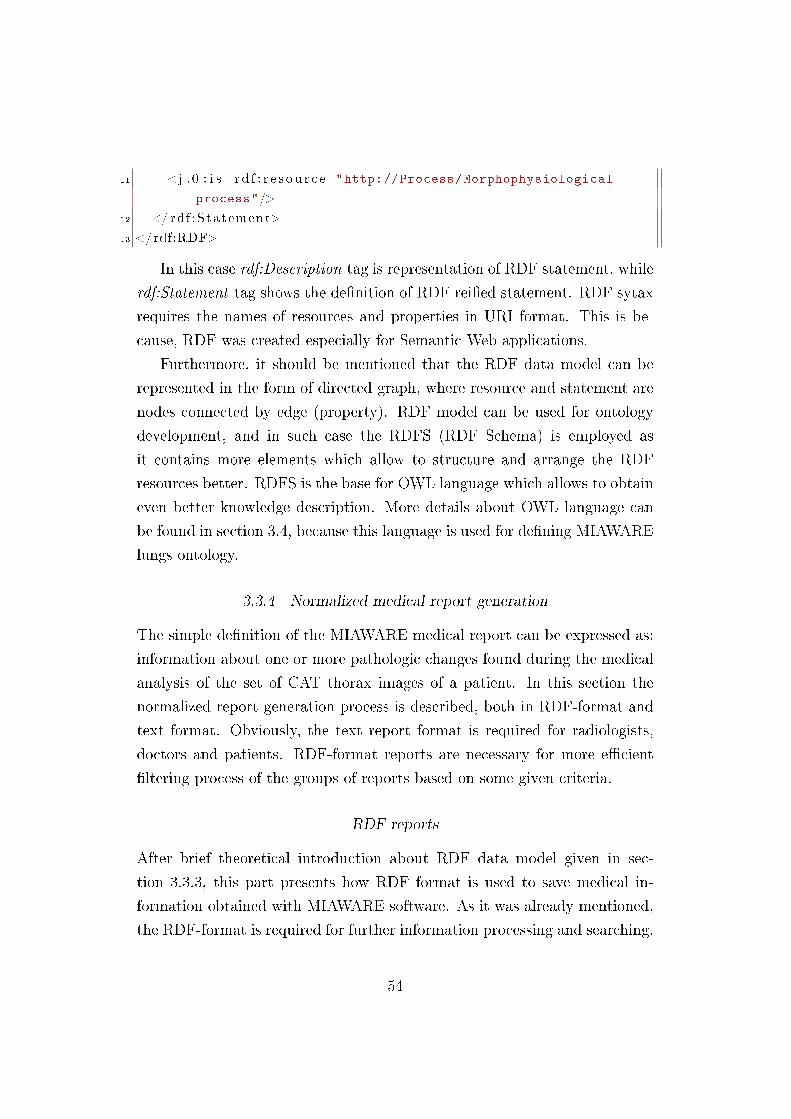
11 <j . 0 : i s r d f : r e s o u r c e="http://Process/Morphophysiological
process"/>
12 </ rd f :Statement>
13 </rdf:RDF>
In this case rdf:Description tag is representation of RDF statement, while
rdf:Statement tag shows the de�nition of RDF rei�ed statement. RDF sytax
requires the names of resources and properties in URI format. This is be-
cause, RDF was created especially for Semantic Web applications.
Furthermore, it should be mentioned that the RDF data model can be
represented in the form of directed graph, where resource and statement are
nodes connected by edge (property). RDF model can be used for ontology
development, and in such case the RDFS (RDF Schema) is employed as
it contains more elements which allow to structure and arrange the RDF
resources better. RDFS is the base for OWL language which allows to obtain
even better knowledge description. More details about OWL language can
be found in section 3.4, because this language is used for de�ning MIAWARE
lungs ontology.
3.3.4 Normalized medical report generation
The simple de�nition of the MIAWARE medical report can be expressed as:
information about one or more pathologic changes found during the medical
analysis of the set of CAT thorax images of a patient. In this section the
normalized report generation process is described, both in RDF-format and
text format. Obviously, the text report format is required for radiologists,
doctors and patients. RDF-format reports are necessary for more e�cient
�ltering process of the groups of reports based on some given criteria.
RDF reports
After brief theoretical introduction about RDF data model given in sec-
tion 3.3.3, this part presents how RDF format is used to save medical in-
formation obtained with MIAWARE software. As it was already mentioned,
the RDF-format is required for further information processing and searching.
54
Section 3.3.2 explains how the description of any single pathologic change
found in patient's lungs is de�ned and saved by the MIAWARE software.
Table 3.1 represents one example of such pathology de�nition. The �nal
medical report will usually contain more such de�nitions grouped in some
speci�c way. The data gathered in the Table 3.1 can be represented as nor-
mal, lexical group of sentences describing any pathology found. For example:
`A morphophysiological process was found. It is in the form of a
neoplastic process of the type mass. It is located in the left lung,
in its upper lobe, exactly in the superior segment of the lingula.'
Such a group of sentences can be represented as resource-property-statement
model and it is used in MIAWARE medical RDF reports. In this case,
the �rst underlined word is a resource and the rest is a statement. As
our statement consists of group of resources it has to be analyzed further.
Then the �rst resource of the previous statement is a resource and the rest
group another statement. Such embedded structure of the resource-property-
statement is created through RDF rei�ed statements. It should be mentioned
that the properties (which connect resources with the statements) in the
above example are: in form of, of the type, etc.
The MIAWARE medical report in RDF format bases on the examples
shown above. It uses rei�ed sentences to connect appropriate resources with
each other. The only di�erence is the choice of the properties. For simpli�-
cation reasons, every property will be the combobox name of the resource in
resource-property-statement group. For example, the sentence (underlined
words are properties):
`Morphophysiological process in form of neoplastic process'
is de�ned in RDF-report as:
`Morphophysiological process morphophysiological process neo-
plastic process'
Another example:
`Mass is located in left lung'
55
appears in RDF-report as:
`Mass location left lung'
One could say that such statements lack a lexical sense, and it is true, but
such solution eases the further RDF �le processing. Nevertheless, the second
example in comparison with the �rst keeps its correct lexical sense. More-
over, the main task of the RDF-format reports is not to be human-readable,
but computer-readable, that's why such solution cannot be considered as a
problem.
The whole process of RDF-format report generation is done by a specially
created PlainRDFReport class. The functionality of this class is created
on the base of the methods from Jena distribution packages, in order to
create the RDF �le format data output. Firstly, PlainRDFReport creates
the empty model, Model class from Jena package com.hp.hpl.jena.rdf.model
using the ModelFactory.createDefaultModel() method. This model will be
�lled-in with the RDF model elements, created by PlainRDFReport class
methods. PlainRDFReport reads the HashMap (see section 3.3.2) with the
pathology descriptions and processes every single key-value pair step by step:
1. Retrieve the (value) ControlPointInfo object for a given key and read
its members of type Vector<String> (see Table 3.3)
2. Create the URI base names for the resources (reminder: RDF �le for-
mat requires all the names in URI format). Resources in this case
are comboboxes' selected options. The MIAWARE resource URI name
format is as follows:
http://<VocabularySetName>/<ResourceName>/
For example: the URI name for Left lung is:
http://ThoraxLocation/LeftLung/
3. Create the URI names for the rei�ed sentences. The MIAWARE format
of such URIs is:
56
http://sentence<number>
4. Create resources (objects of Jena-de�ned class Resource from the pack-
age com.hp.hpl.jena.rdf.model using previously created resources URI
names).
5. Create properties (objects of Jena-de�ned class Property from the pack-
age com.hp.hpl.jena.rdf.model). The MIAWARE property URI name
format is as follows:
http://Property/<Combobox_name>/
For example: the URI property name for resource Upper lobe of left
lung is:
http://Property/Left_lung_location/
6. Connect previously created resources through adequate properties us-
ing Jena-de�ned classes Statement and Rei�edStatement from the pack-
age com.hp.hpl.jena.rdf.model. In this moment, the URI names of sen-
tences created in step 3 are used.
This step ends the algorithm, which is repeated as many times as the number
of key-value pairs in the HashTable. During every single execution, all the
created elements: statements, resources, properties are added to the global
RDF model created in the beginning. Afterwards, when all the information
is passed to the RDF model, it is saved to the �le using ordinary Java �le
output stream.
Text reports
The generation of normalized medical reports in ordinary text format is an-
other objective realized by the MIAWARE software. The reports created
nowadays by the radiologists are the sets of sentences describing the patho-
logic changes in the patient's body. One of the initially de�ned objectives for
MIAWARE software is to create a text report which is clear and legible for
both the patient and the doctor. That is why the layout of the MIAWARE
57
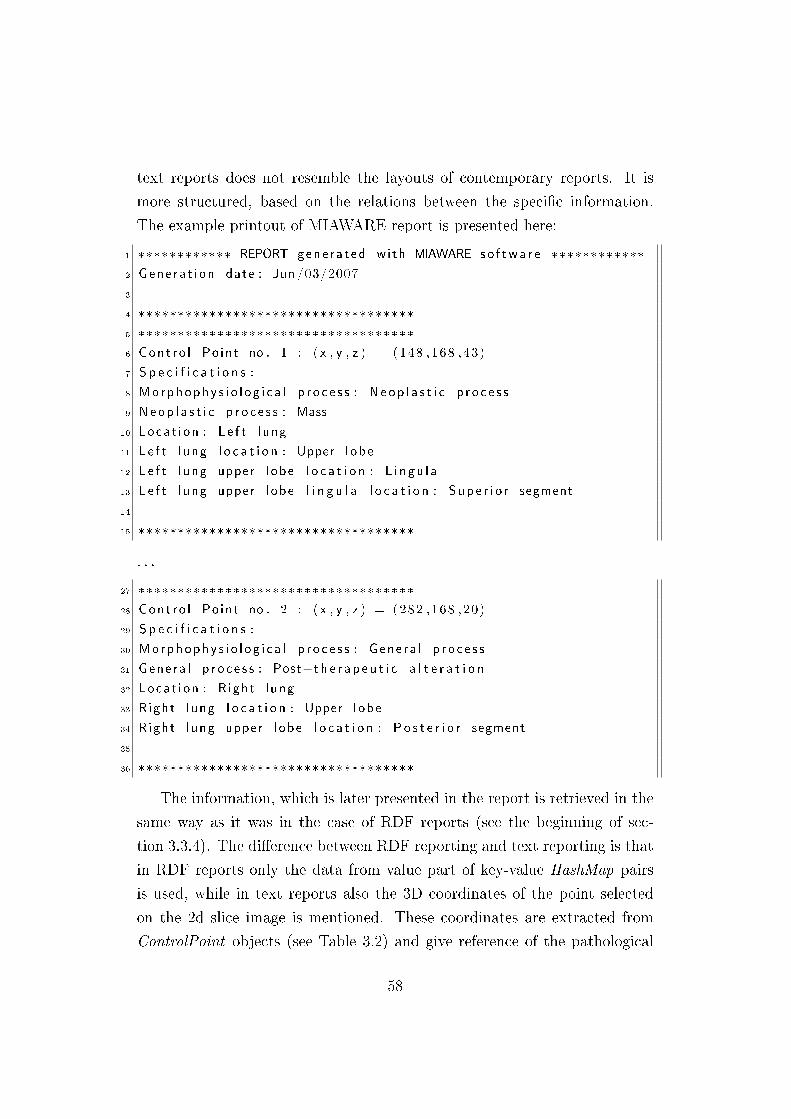
text reports does not resemble the layouts of contemporary reports. It is
more structured, based on the relations between the speci�c information.
The example printout of MIAWARE report is presented here:
1 ************ REPORT gene r a t ed wi th MIAWARE so f twa r e ************
2 Gene r a t i on date : Jun /03/2007
3
4 ***********************************
5 ***********************************
6 Con t r o l Po in t no . 1 : ( x , y , z ) = (148 ,168 ,43)
7 S p e c i f i c a t i o n s :
8 Morphophy s i o l o g i c a l p r o c e s s : Neop l a s t i c p r o c e s s
9 Neop l a s t i c p r o c e s s : Mass
10 Loca t i on : L e f t l ung
11 L e f t l ung l o c a t i o n : Upper l ob e
12 L e f t l ung upper l o b e l o c a t i o n : L i n gu l a
13 L e f t l ung upper l o b e l i n g u l a l o c a t i o n : Sup e r i o r segment
14
15 ***********************************
. . .
27 ***********************************
28 Con t r o l Po in t no . 2 : ( x , y , z ) = (282 ,168 ,20)
29 S p e c i f i c a t i o n s :
30 Morphophy s i o l o g i c a l p r o c e s s : Gene ra l p r o c e s s
31 Gene ra l p r o c e s s : Post−t h e r a p e u t i c a l t e r a t i o n
32 Loca t i on : Right lung
33 Right lung l o c a t i o n : Upper l ob e
34 Right lung upper l o b e l o c a t i o n : Po s t e r i o r segment
35
36 ***********************************
The information, which is later presented in the report is retrieved in the
same way as it was in the case of RDF reports (see the beginning of sec-
tion 3.3.4). The di�erence between RDF reporting and text reporting is that
in RDF reports only the data from value part of key-value HashMap pairs
is used, while in text reports also the 3D coordinates of the point selected
on the 2d slice image is mentioned. These coordinates are extracted from
ControlPoint objects (see Table 3.2) and give reference of the pathological
58
change found by the radiologist on the 3d model.
This concludes the overview of the reporting schema in MIAWARE soft-
ware. In the next section the �ltering of MIAWARE medical reports is char-
acterized.
3.4 Ontology-based search engine development
In the previous section (3.3) it was mentioned that the generation of the
RDF reports is needed for its future processing and searching. Herein, that
necessity for e�ective medical reports �ltering is going the be clari�ed.
Firstly, it must be understood that radiological examinations are carried
out quite often in such places as hospitals, private and public surgeries or any
other medical institutions. As a result, it produces a great amount of medical
reports in relatively short time. Such reports should be kept and gathered
together for future usage as references to previously encountered and de�ned
pathologies or diseases. Manual searching of great amount of documents is
really time-consuming. The automated generation of reports in some speci�c
�le format easy to read for computer (e.g. RDF) is a milestone in develop-
ment of state-of-the-art computer-based searching. Consequently, intelligent
search engine of medical reports can signi�cantly speed-up the disease recog-
nition process, as, considering given criteria, it would immediately result in
sets of references to the archive reports with similar pathological symptoms
in other patients, the resultant diagnoses and applied treatments.
Consecutive parts of this section deal with the de�nition of ontologies
as well as give the clari�cation of why and how good ontology should be
created to improve searching process. Afterwards, the developed ontology-
based search algorithm for �ltering MIAWARE medical reports is explained
together with a presentation of the graphical user interface for MIAWARE
search engine.
3.4.1 Ontology de�nition and development
In the beginning of this section the simple question should be formed: What
actually the word 'ontology' means and what it refers to? The �rst, basic an-
59
notation should be made before starting any explanation. Words: 'ontology'
and 'Ontology' describe the same aspect in general, but actually are used
with di�erent references. The 'Ontology', written with capital 'o', refers to
the philosophy branch - philosophy of being. On the other hand, 'ontology'
written with small 'o', refers to computer science and information science,
simply speaking, has Knowledge Engineering sense. Ontology Engineering
bases signi�cantly on the assumptions made in Ontology. [5]
After the introduction concerning Ontology as a philosophy of being with
its historical background given, the ideas of ontological engineering will be
presented.
Philosophy of being
One of the main targets of the ancient philosophers was to de�ne how the
world is built, how to classify the objects (things) which exist in everyday
life, and the concepts which are broadly understood, but cannot be perceived
by human senses. Across the centuries, many various de�nitions and ways of
thinking were claimed. Di�erent opinions were given, because the people's
level of knowledge about the surrounding world was increasing with time and
consequently more complex ideas, with more details, could appear.
Two important aspects of Ontology are, following the introductory chap-
ter of Ontological Engineering book [5], the essence and existence:
�The essence of something is what this something is (Gambra,
1999). However, an existence is to be present among things in
the real world.�
The example of something what has its essence but does not exist can be a
gri�n. Following the Greek mythology, gri�n is a lion with the head, hands
and wings of the eagle. It cannot be perceived and seen by us (without
existence), but still has the essence.
The things in this world can change some of its properties, but they still
are the same thing (their essence is the same). Philosophers were trying
to de�ne the essence of the things, each of them in a di�erent way. Plato
and the Platonists (through the Theory of Forms) were claiming that �the
60
material world as it seems to us is not the real world, but only a shadow
of the real world� [42]. Aristotle, in contrast, tried to understand world
empirically and it was him, who de�ned various states of being in order to
classify anything in the world. Such classi�cation could be made through
categories like: substance, quality, quantity, relation, action, passion, place
and time [5]. For instance, if two descriptions are considered: `John is Jane's
brother' and `John is in the kitchen', they have di�erent states of being:
relation and place, respectively. Such set of the general properties describing
things were called also as universal patterns (universals). Many questions
about what universals really are and corresponding assumptions appeared.
In Middle Ages the main issue were universals and it was then, when the
term 'ontology' was used for the �rst time by Christian Wol� (1679-1754),
a German philosopher. Back then the main issue was to de�ne if universals
are de�ned things of the world (realism) or only the words (categories) which
give description of actual things (nominalism). Finally, the baseline of that
times appeared to de�ne universals as symbols, de�nitions of things.
Even more complex theory, which just can have the re�ection in today's
life information systems, was created by Emmanuel Kant (1724-1804). He
de�ned other categorization to structure the world's things. �Kant's frame-
work is organized into four classes, each of which presents triadic pattern:
quantity(unity, plurality, totality), quality(reality, negation, limitation), re-
lation(inherence, causality, community) and modality(possibility, existence,
necessity)� [5]. Logic was involved in creating such framework, as e.g. (unity,
plurality, totality) triple refers directly to three logical judgments (singular
logic judgment, ∃ - 'exists' judgment, ∀ - 'for all' judgment).
In such a way, the world's things de�ning (Ontology) is being developed
till now. Recently, the philosophy of being is closely connected to information
systems engineering. From the beginning, ontology was closely connected to
other life areas. �Ontology is not a discipline which exists separately and
independently from all the other scienti�c disciplines and also from other
branches of philosophy. Rather, ontology derives the general structure of the
world; it obtains the structure of the world as it really is from knowledge
embodied in other disciplines� [38].
61
Ontological engineering
The concepts expressed by Ontology as a philosophical movement are be-
ing used in Knowledge-based systems, Arti�cial Intelligence or Computer
Science, simply because they are common for today's world objects or situ-
ations and recently, there is a need to develop such computer systems which
resemble, more and more, the real life. The questions formulated by Ontol-
ogy like: 'What is this?', 'What describes it?' or 'How can it be described?'
represent actually the model where some thing (subject) is to be described by
other thing (object) through some relationship. The RDF model described
in section 3.3.3 uses identical triple (subject-property-object) to represent
the data.
This example allows to create a simple de�nition of ontology data model
as �a set of concepts within a domain and the relationships between these
objects� [41]. The authors of the Ontological Engineering book [5] present
the following ontology types:
• highly informal � natural language ontologies.
• semi-informal � natural language ontologies, but with some structure
and restrictions in the form.
• semi-formal � arti�cial language (formally de�ned) ontologies
There are also views that highly informal ontologies are not actually ontolo-
gies as they cannot be understood by the computers (machines).
An ontology has some main components which are used during the devel-
opment process. There exist many languages and many di�erent knowledge
modelling techniques to model the ontologies. For every technique or lan-
guage, the ontology components can di�er somehow. Herein, the detailed
description of the Web Ontology Language (OWL) will be presented as the
MIAWARE ontology for lungs (see section 3.4.2) was developed exactly in
that language.
OWL is the language created especially for Web ontologies de�ning. It
uses description logics as its knowledge representation technique. Description
62
logics is �used to represent the terminological knowledge of an application
domain in a structured and formally well-understood way� [40]. Since OWL
belongs to W3C recommendation family, the original OWL description is
given here:
�The OWL Web Ontology Language is designed for use by ap-
plications that need to process the content of information in-
stead of just presenting information to humans. OWL facilitates
greater machine interpretability of Web content than that sup-
ported by XML, RDF, and RDF Schema (RDF-S) by providing
additional vocabulary along with a formal semantics. OWL has
three increasingly-expressive sublanguages: OWL Lite, OWL DL,
and OWL Full.� [23]
An OWL ontology can be considered as a network of its three main com-
ponents:
• classes � �de�ne names of the relevant domain concepts and their logical
characteristics� [19]. Sometimes, classes are called sets of individuals,
since they describe a category, in which, the de�ned instances exist.
They can be de�ned in taxonomies (superclasses with its subclasses).
• properties (slots, attributes, roles) � �de�ne the relationship between
classes� [19] or establish the link between de�ned classes (individuals).
Properties can be inverse, functional, inversely functional, transitive
and symmetric.
• individuals (de�ned classes) � �are instances of the classes with speci�c
values for the properties� [19].
Below, the detailed description of most important components and their
types is presented, basing on the example ontology for cars designed espe-
cially for educational purposes using Protégé OWL plugin [16] described in
section 3.1.2. This is a simple ontology which de�nes relations between car
models and countries where they are produced.
63
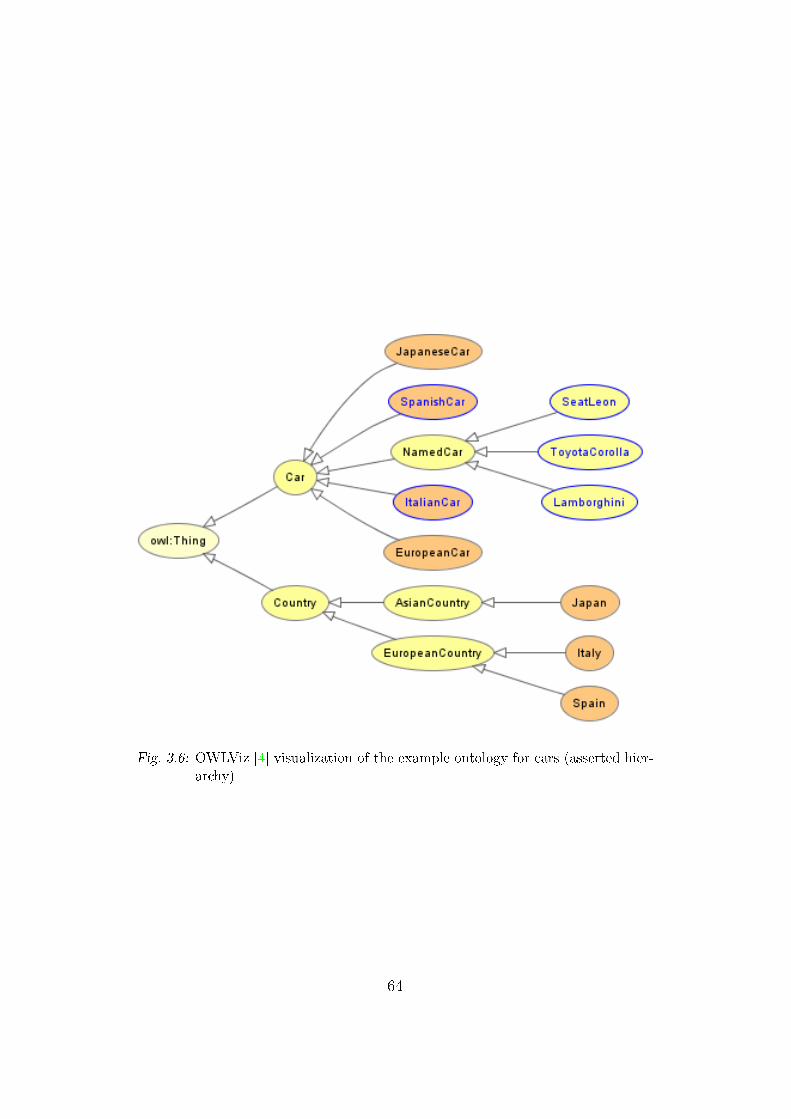
Fig. 3.6: OWLViz [4] visualization of the example ontology for cars (asserted hier-archy)
64
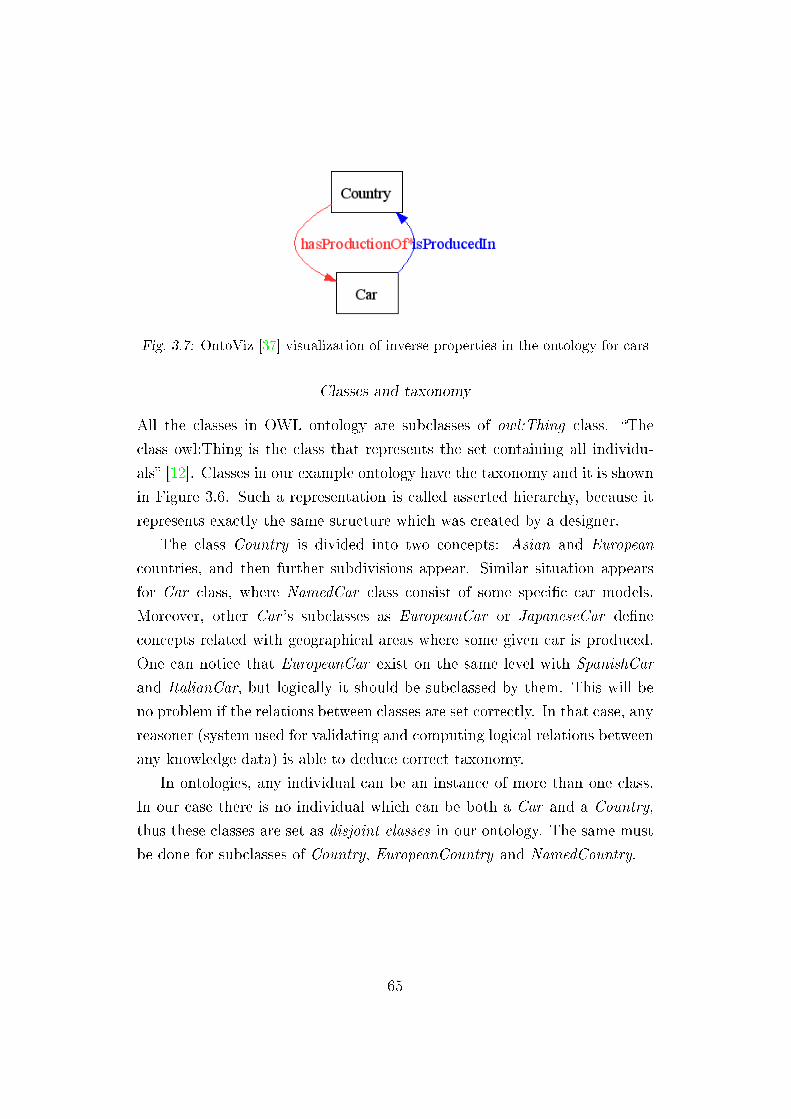
Fig. 3.7: OntoViz [37] visualization of inverse properties in the ontology for cars
Classes and taxonomy
All the classes in OWL ontology are subclasses of owl:Thing class. �The
class owl:Thing is the class that represents the set containing all individu-
als� [12]. Classes in our example ontology have the taxonomy and it is shown
in Figure 3.6. Such a representation is called asserted hierarchy, because it
represents exactly the same structure which was created by a designer.
The class Country is divided into two concepts: Asian and European
countries, and then further subdivisions appear. Similar situation appears
for Car class, where NamedCar class consist of some speci�c car models.
Moreover, other Car 's subclasses as EuropeanCar or JapaneseCar de�ne
concepts related with geographical areas where some given car is produced.
One can notice that EuropeanCar exist on the same level with SpanishCar
and ItalianCar, but logically it should be subclassed by them. This will be
no problem if the relations between classes are set correctly. In that case, any
reasoner (system used for validating and computing logical relations between
any knowledge data) is able to deduce correct taxonomy.
In ontologies, any individual can be an instance of more than one class.
In our case there is no individual which can be both a Car and a Country,
thus these classes are set as disjoint classes in our ontology. The same must
be done for subclasses of Country, EuropeanCountry and NamedCountry.
65
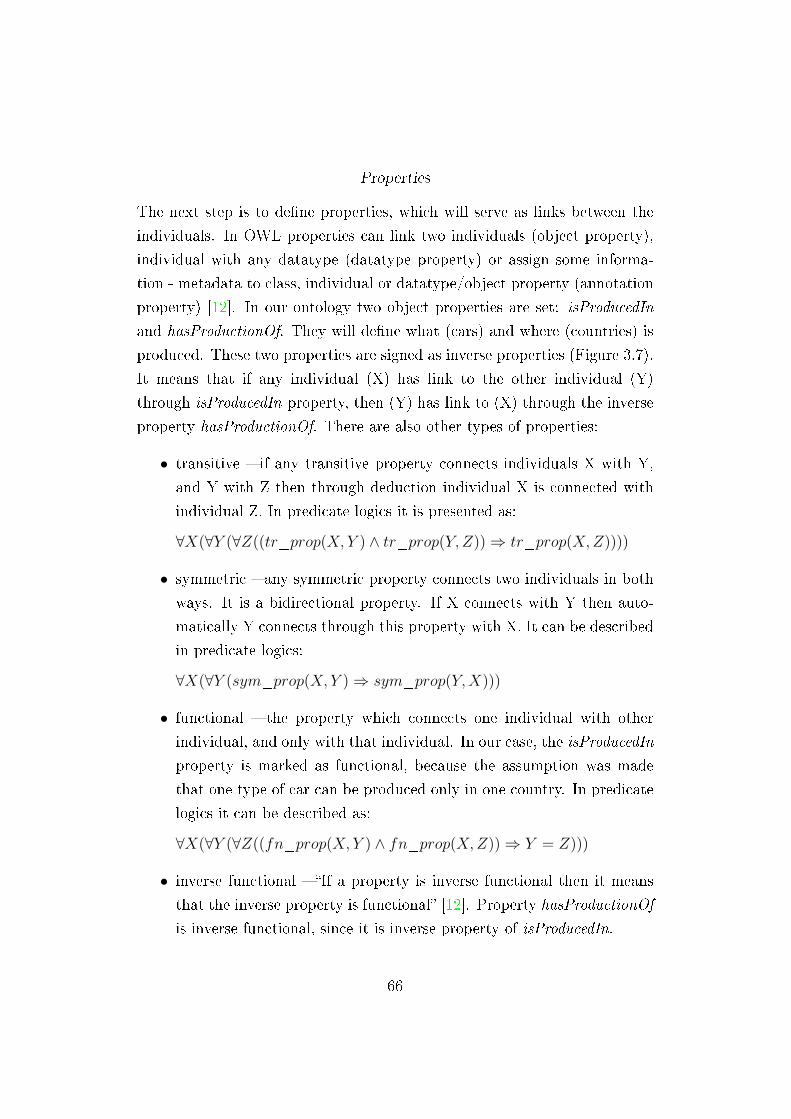
Properties
The next step is to de�ne properties, which will serve as links between the
individuals. In OWL properties can link two individuals (object property),
individual with any datatype (datatype property) or assign some informa-
tion - metadata to class, individual or datatype/object property (annotation
property) [12]. In our ontology two object properties are set: isProducedIn
and hasProductionOf. They will de�ne what (cars) and where (countries) is
produced. These two properties are signed as inverse properties (Figure 3.7).
It means that if any individual (X) has link to the other individual (Y)
through isProducedIn property, then (Y) has link to (X) through the inverse
property hasProductionOf. There are also other types of properties:
• transitive � if any transitive property connects individuals X with Y,
and Y with Z then through deduction individual X is connected with
individual Z. In predicate logics it is presented as:
∀X(∀Y (∀Z((tr_prop(X, Y ) ∧ tr_prop(Y, Z)) ⇒ tr_prop(X, Z))))
• symmetric � any symmetric property connects two individuals in both
ways. It is a bidirectional property. If X connects with Y then auto-
matically Y connects through this property with X. It can be described
in predicate logics:
∀X(∀Y (sym_prop(X, Y ) ⇒ sym_prop(Y, X)))
• functional � the property which connects one individual with other
individual, and only with that individual. In our case, the isProducedIn
property is marked as functional, because the assumption was made
that one type of car can be produced only in one country. In predicate
logics it can be described as:
∀X(∀Y (∀Z((fn_prop(X, Y ) ∧ fn_prop(X, Z)) ⇒ Y = Z)))
• inverse functional � �If a property is inverse functional then it means
that the inverse property is functional� [12]. Property hasProductionOf
is inverse functional, since it is inverse property of isProducedIn.
66
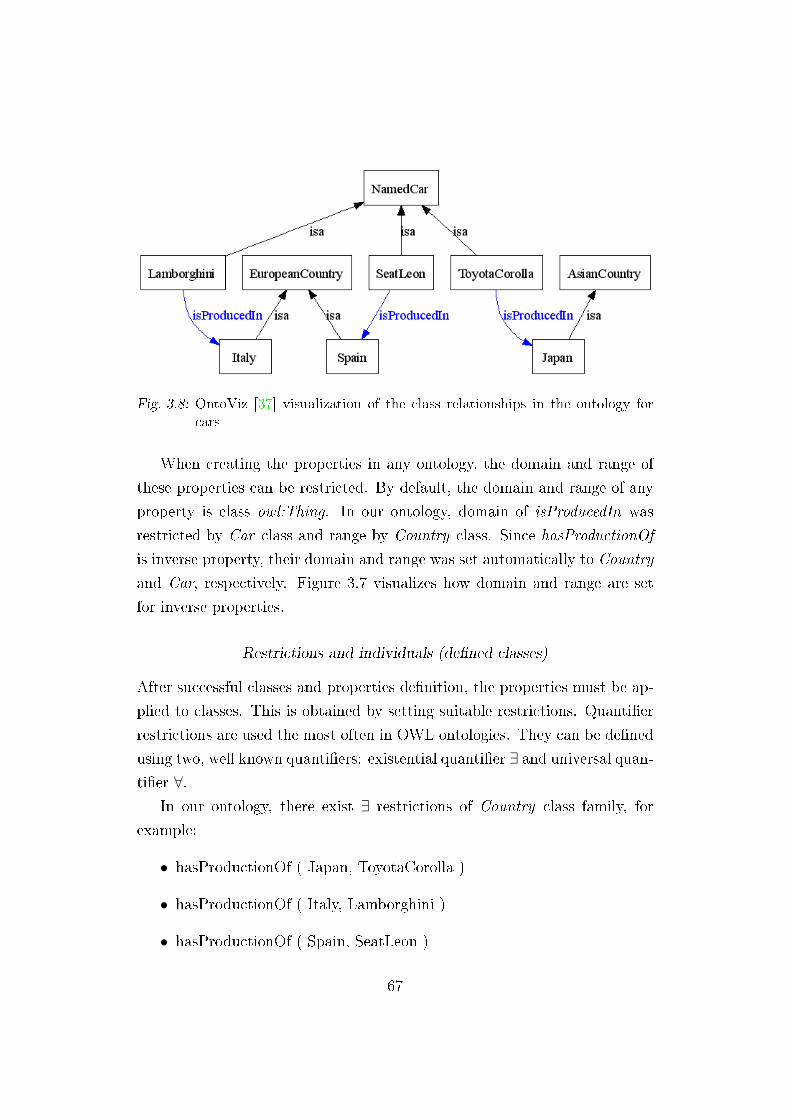
Fig. 3.8: OntoViz [37] visualization of the class relationships in the ontology forcars
When creating the properties in any ontology, the domain and range of
these properties can be restricted. By default, the domain and range of any
property is class owl:Thing. In our ontology, domain of isProducedIn was
restricted by Car class and range by Country class. Since hasProductionOf
is inverse property, their domain and range was set automatically to Country
and Car, respectively. Figure 3.7 visualizes how domain and range are set
for inverse properties.
Restrictions and individuals (de�ned classes)
After successful classes and properties de�nition, the properties must be ap-
plied to classes. This is obtained by setting suitable restrictions. Quanti�er
restrictions are used the most often in OWL ontologies. They can be de�ned
using two, well known quanti�ers: existential quanti�er ∃ and universal quan-ti�er ∀.
In our ontology, there exist ∃ restrictions of Country class family, for
example:
• hasProductionOf ( Japan, ToyotaCorolla )
• hasProductionOf ( Italy, Lamborghini )
• hasProductionOf ( Spain, SeatLeon )
67
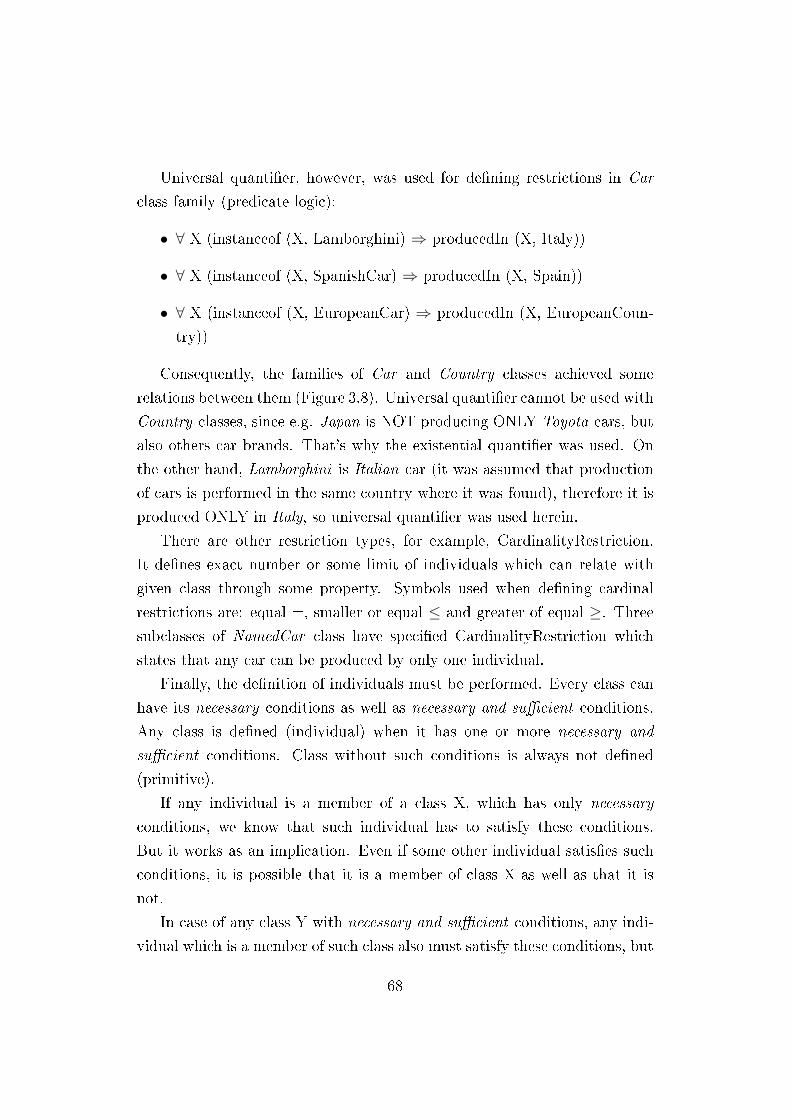
Universal quanti�er, however, was used for de�ning restrictions in Car
class family (predicate logic):
• ∀ X (instanceof (X, Lamborghini) ⇒ producedIn (X, Italy))
• ∀ X (instanceof (X, SpanishCar) ⇒ producedIn (X, Spain))
• ∀ X (instanceof (X, EuropeanCar) ⇒ producedIn (X, EuropeanCoun-
try))
Consequently, the families of Car and Country classes achieved some
relations between them (Figure 3.8). Universal quanti�er cannot be used with
Country classes, since e.g. Japan is NOT producing ONLY Toyota cars, but
also others car brands. That's why the existential quanti�er was used. On
the other hand, Lamborghini is Italian car (it was assumed that production
of cars is performed in the same country where it was found), therefore it is
produced ONLY in Italy, so universal quanti�er was used herein.
There are other restriction types, for example, CardinalityRestriction.
It de�nes exact number or some limit of individuals which can relate with
given class through some property. Symbols used when de�ning cardinal
restrictions are: equal =, smaller or equal ≤ and greater of equal ≥. Threesubclasses of NamedCar class have speci�ed CardinalityRestriction which
states that any car can be produced by only one individual.
Finally, the de�nition of individuals must be performed. Every class can
have its necessary conditions as well as necessary and su�cient conditions.
Any class is de�ned (individual) when it has one or more necessary and
su�cient conditions. Class without such conditions is always not de�ned
(primitive).
If any individual is a member of a class X, which has only necessary
conditions, we know that such individual has to satisfy these conditions.
But it works as an implication. Even if some other individual satis�es such
conditions, it is possible that it is a member of class X as well as that it is
not.
In case of any class Y with necessary and su�cient conditions, any indi-
vidual which is a member of such class also must satisfy these conditions, but
68
Fig. 3.9: OWLViz [4] visualization of the ontology for cars (inferred hierarchy)
now it is working like equivalence. If any individual satis�es these conditions,
it is surely a member of class Y.
In our ontology all the classes marked in orange in Figure 3.6 are in-
dividuals (have necessary and su�cient conditions), while yellow ones are
primitive classes. SpanishCar, EuropeanCar, ItalianCar, JapaneseCar and
Italy, Japan, Spain are individuals, as they are instances with de�ned prop-
erties. For example, SpanishCar has for all restriction isProducedIn Spain,
and for such restriction it is obvious that all the cars produced in Spain will
be Spanish cars. That's why these restrictions are necessary and su�cient
conditions. Opposite situation present the following classes: SeatLeon, Lam-
borghini or ToyotaCorolla. SeatLeon has the same restriction as SpanishCar,
but in this case it is not individual, because it is not true that every car
produced in Spain is SeatLeon. There are also other car brands, which can
be produced in Spain, thus these restrictions are only necessary conditions.
Final step in ontology development is validation of the ontology with
the reasoner. This ontology was successfully checked (no inconsistence was
found) with the Racer reasoner [33]. Additional feature o�ered by reasoners
is that since they can deduce facts from ontologies, they can also create a
69
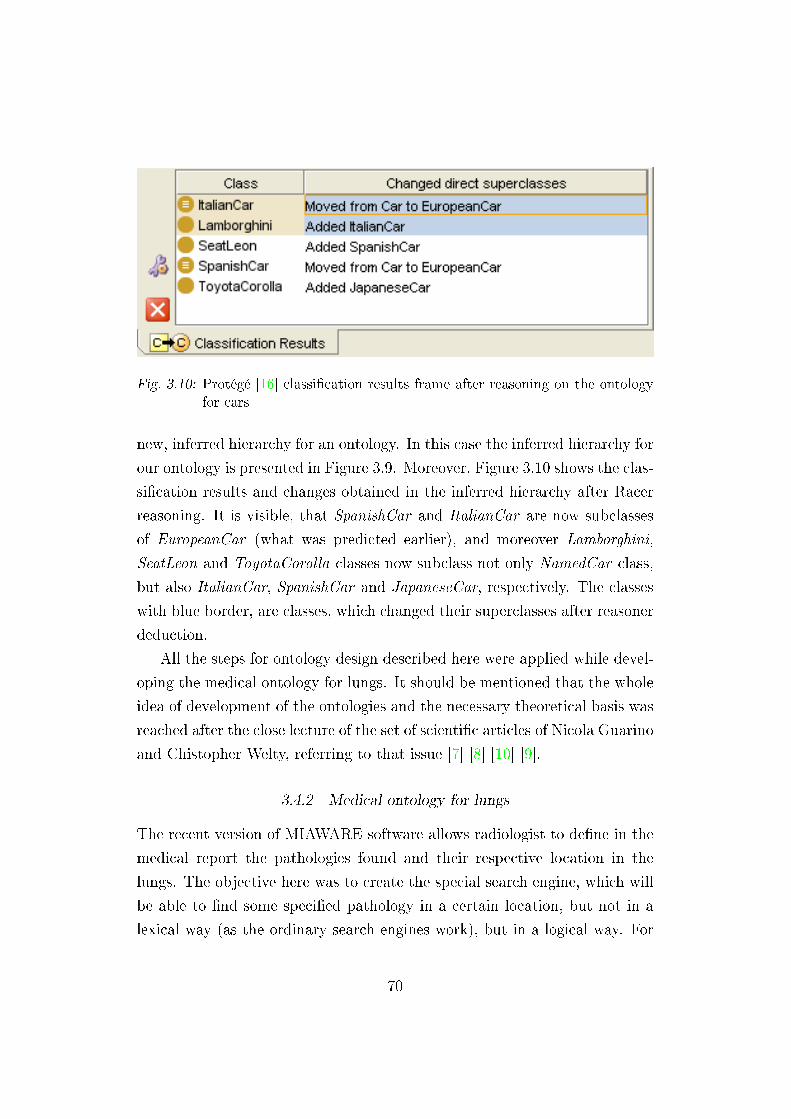
Fig. 3.10: Protégé [16] classi�cation results frame after reasoning on the ontologyfor cars
new, inferred hierarchy for an ontology. In this case the inferred hierarchy for
our ontology is presented in Figure 3.9. Moreover, Figure 3.10 shows the clas-
si�cation results and changes obtained in the inferred hierarchy after Racer
reasoning. It is visible, that SpanishCar and ItalianCar are now subclasses
of EuropeanCar (what was predicted earlier), and moreover Lamborghini,
SeatLeon and ToyotaCorolla classes now subclass not only NamedCar class,
but also ItalianCar, SpanishCar and JapaneseCar, respectively. The classes
with blue border, are classes, which changed their superclasses after reasoner
deduction.
All the steps for ontology design described here were applied while devel-
oping the medical ontology for lungs. It should be mentioned that the whole
idea of development of the ontologies and the necessary theoretical basis was
reached after the close lecture of the set of scienti�c articles of Nicola Guarino
and Chistopher Welty, referring to that issue [7] [8] [10] [9].
3.4.2 Medical ontology for lungs
The recent version of MIAWARE software allows radiologist to de�ne in the
medical report the pathologies found and their respective location in the
lungs. The objective here was to create the special search engine, which will
be able to �nd some speci�ed pathology in a certain location, but not in a
lexical way (as the ordinary search engines work), but in a logical way. For
70
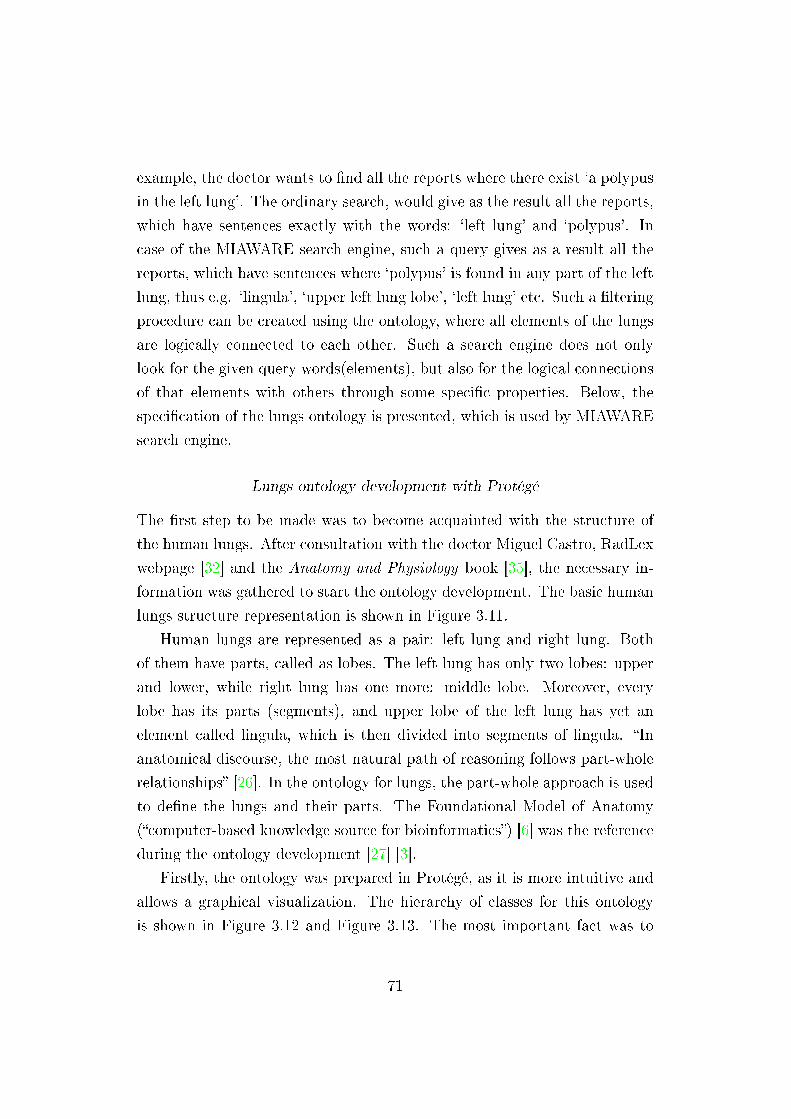
example, the doctor wants to �nd all the reports where there exist `a polypus
in the left lung'. The ordinary search, would give as the result all the reports,
which have sentences exactly with the words: `left lung' and `polypus'. In
case of the MIAWARE search engine, such a query gives as a result all the
reports, which have sentences where `polypus' is found in any part of the left
lung, thus e.g. `lingula', `upper left lung lobe', `left lung' etc. Such a �ltering
procedure can be created using the ontology, where all elements of the lungs
are logically connected to each other. Such a search engine does not only
look for the given query words(elements), but also for the logical connections
of that elements with others through some speci�c properties. Below, the
speci�cation of the lungs ontology is presented, which is used by MIAWARE
search engine.
Lungs ontology development with Protégé
The �rst step to be made was to become acquainted with the structure of
the human lungs. After consultation with the doctor Miguel Castro, RadLex
webpage [32] and the Anatomy and Physiology book [35], the necessary in-
formation was gathered to start the ontology development. The basic human
lungs structure representation is shown in Figure 3.11.
Human lungs are represented as a pair: left lung and right lung. Both
of them have parts, called as lobes. The left lung has only two lobes: upper
and lower, while right lung has one more: middle lobe. Moreover, every
lobe has its parts (segments), and upper lobe of the left lung has yet an
element called lingula, which is then divided into segments of lingula. �In
anatomical discourse, the most natural path of reasoning follows part-whole
relationships� [26]. In the ontology for lungs, the part-whole approach is used
to de�ne the lungs and their parts. The Foundational Model of Anatomy
(�computer-based knowledge source for bioinformatics�) [6] was the reference
during the ontology development [27] [3].
Firstly, the ontology was prepared in Protégé, as it is more intuitive and
allows a graphical visualization. The hierarchy of classes for this ontology
is shown in Figure 3.12 and Figure 3.13. The most important fact was to
71
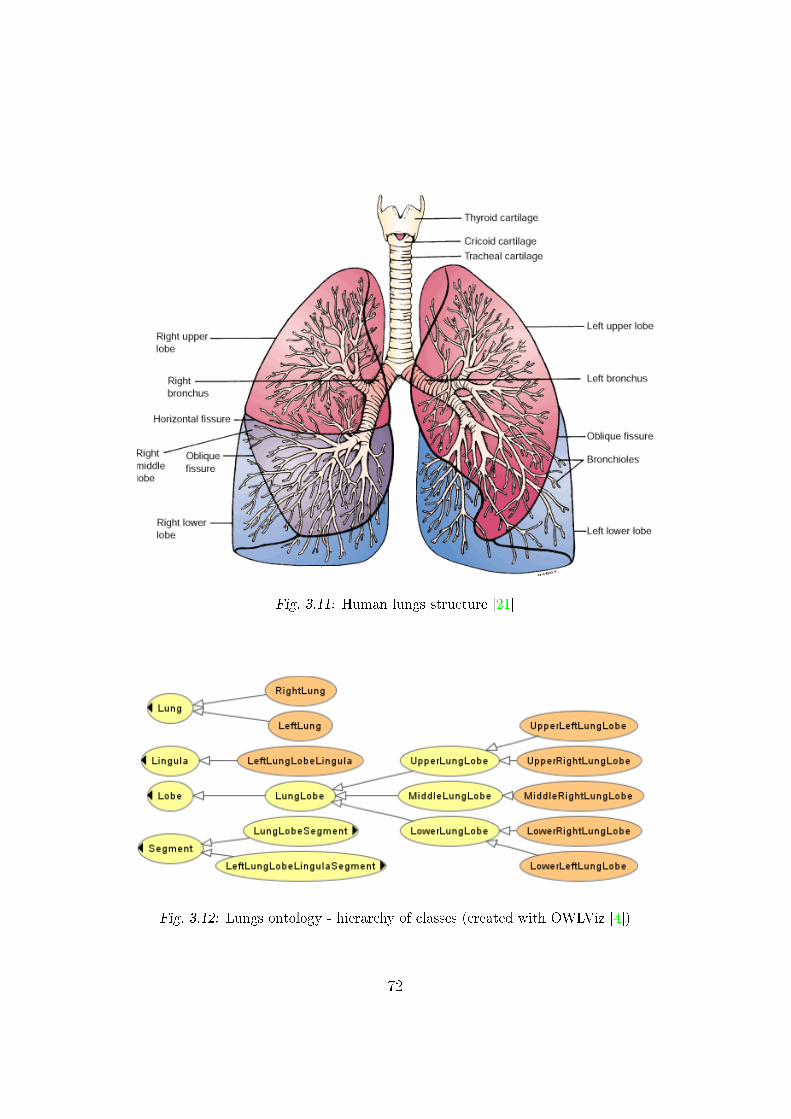
Fig. 3.11: Human lungs structure [21]
Fig. 3.12: Lungs ontology - hierarchy of classes (created with OWLViz [4])
72
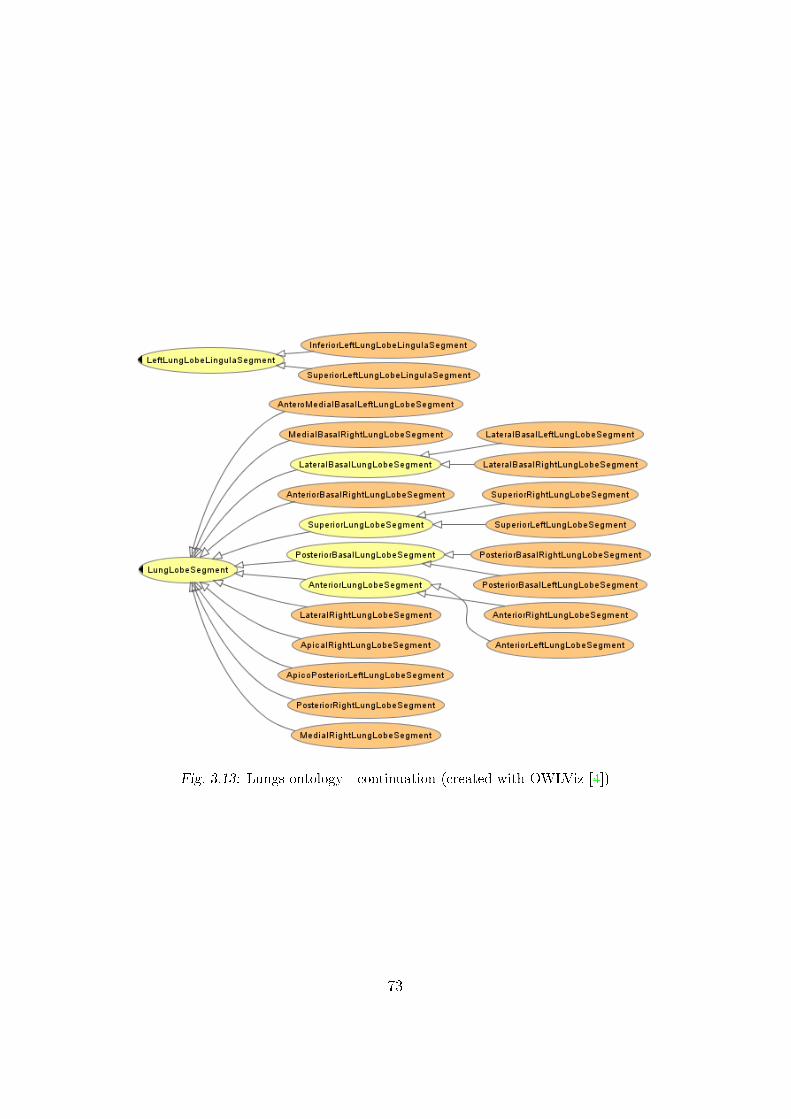
Fig. 3.13: Lungs ontology - continuation (created with OWLViz [4])
73
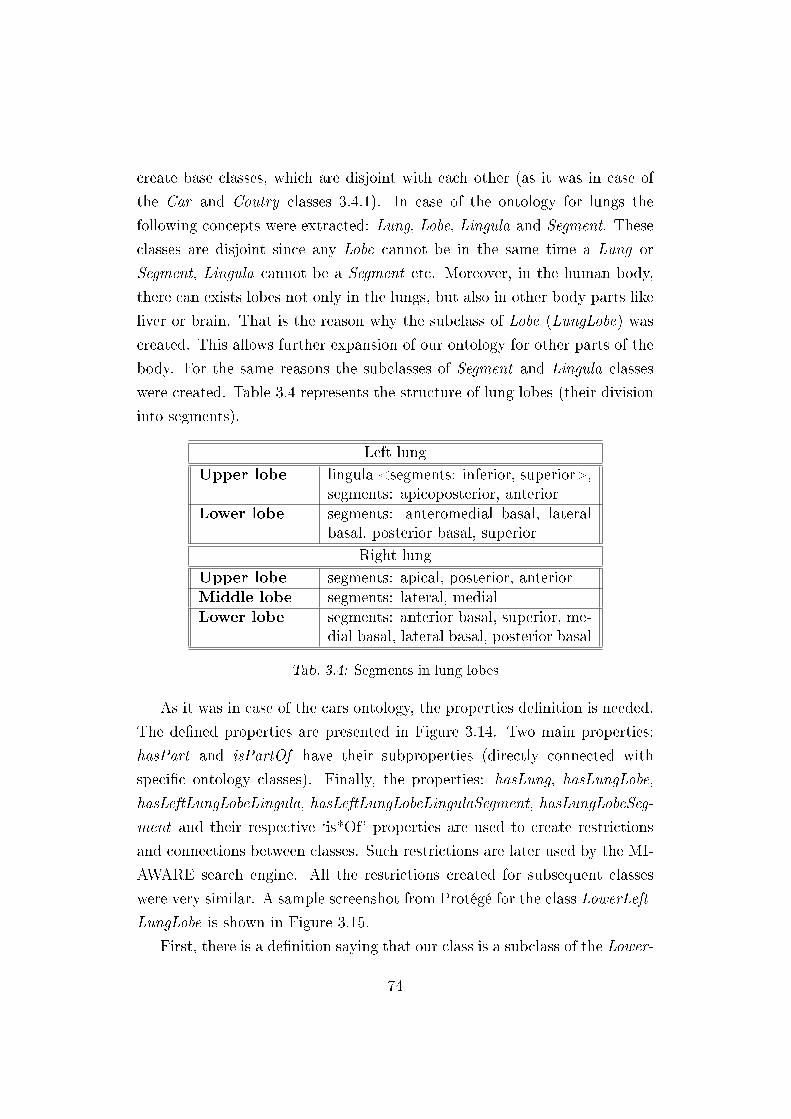
create base classes, which are disjoint with each other (as it was in case of
the Car and Coutry classes 3.4.1). In case of the ontology for lungs the
following concepts were extracted: Lung, Lobe, Lingula and Segment. These
classes are disjoint since any Lobe cannot be in the same time a Lung or
Segment, Lingula cannot be a Segment etc. Moreover, in the human body,
there can exists lobes not only in the lungs, but also in other body parts like
liver or brain. That is the reason why the subclass of Lobe (LungLobe) was
created. This allows further expansion of our ontology for other parts of the
body. For the same reasons the subclasses of Segment and Lingula classes
were created. Table 3.4 represents the structure of lung lobes (their division
into segments).
Left lung
Upper lobe lingula <segments: inferior, superior>,segments: apicoposterior, anterior
Lower lobe segments: anteromedial basal, lateralbasal, posterior basal, superior
Right lung
Upper lobe segments: apical, posterior, anteriorMiddle lobe segments: lateral, medialLower lobe segments: anterior basal, superior, me-
dial basal, lateral basal, posterior basal
Tab. 3.4: Segments in lung lobes
As it was in case of the cars ontology, the properties de�nition is needed.
The de�ned properties are presented in Figure 3.14. Two main properties:
hasPart and isPartOf have their subproperties (directly connected with
speci�c ontology classes). Finally, the properties: hasLung, hasLungLobe,
hasLeftLungLobeLingula, hasLeftLungLobeLingulaSegment, hasLungLobeSeg-
ment and their respective `is*Of' properties are used to create restrictions
and connections between classes. Such restrictions are later used by the MI-
AWARE search engine. All the restrictions created for subsequent classes
were very similar. A sample screenshot from Protégé for the class LowerLeft-
LungLobe is shown in Figure 3.15.
First, there is a de�nition saying that our class is a subclass of the Lower-
74
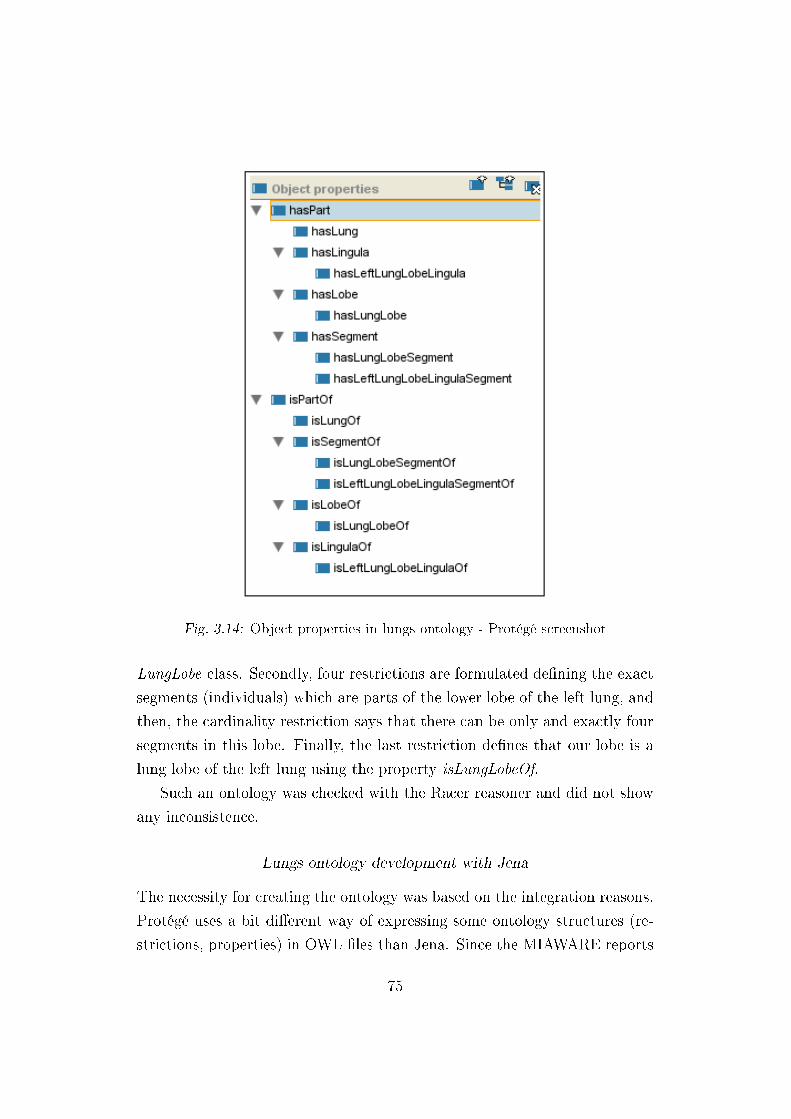
Fig. 3.14: Object properties in lungs ontology - Protégé screenshot
LungLobe class. Secondly, four restrictions are formulated de�ning the exact
segments (individuals) which are parts of the lower lobe of the left lung, and
then, the cardinality restriction says that there can be only and exactly four
segments in this lobe. Finally, the last restriction de�nes that our lobe is a
lung lobe of the left lung using the property isLungLobeOf.
Such an ontology was checked with the Racer reasoner and did not show
any inconsistence.
Lungs ontology development with Jena
The necessity for creating the ontology was based on the integration reasons.
Protégé uses a bit di�erent way of expressing some ontology structures (re-
strictions, properties) in OWL �les than Jena. Since the MIAWARE reports
75
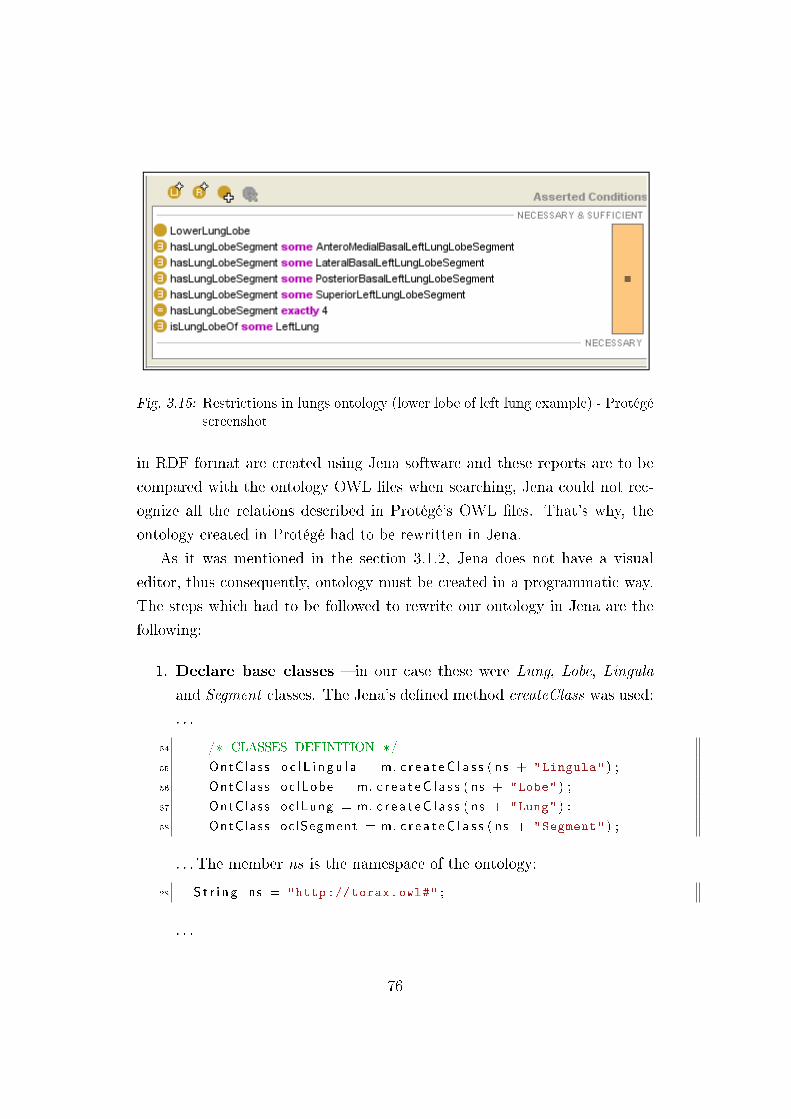
Fig. 3.15: Restrictions in lungs ontology (lower lobe of left lung example) - Protégéscreenshot
in RDF format are created using Jena software and these reports are to be
compared with the ontology OWL �les when searching, Jena could not rec-
ognize all the relations described in Protégé's OWL �les. That's why, the
ontology created in Protégé had to be rewritten in Jena.
As it was mentioned in the section 3.1.2, Jena does not have a visual
editor, thus consequently, ontology must be created in a programmatic way.
The steps which had to be followed to rewrite our ontology in Jena are the
following:
1. Declare base classes � in our case these were Lung, Lobe, Lingula
and Segment classes. The Jena's de�ned method createClass was used:
. . .
54 /* CLASSES DEFINITION */
55 OntClass o c l L i n g u l a = m. c r e a t e C l a s s ( ns + "Lingula" ) ;
56 OntClass oc lLobe = m. c r e a t e C l a s s ( ns + "Lobe" ) ;
57 OntClass oc lLung = m. c r e a t e C l a s s ( ns + "Lung" ) ;
58 OntClass oc lSegment = m. c r e a t e C l a s s ( ns + "Segment" ) ;
. . . The member ns is the namespace of the ontology:
28 S t r i n g ns = "http://torax.owl#" ;
. . .
76
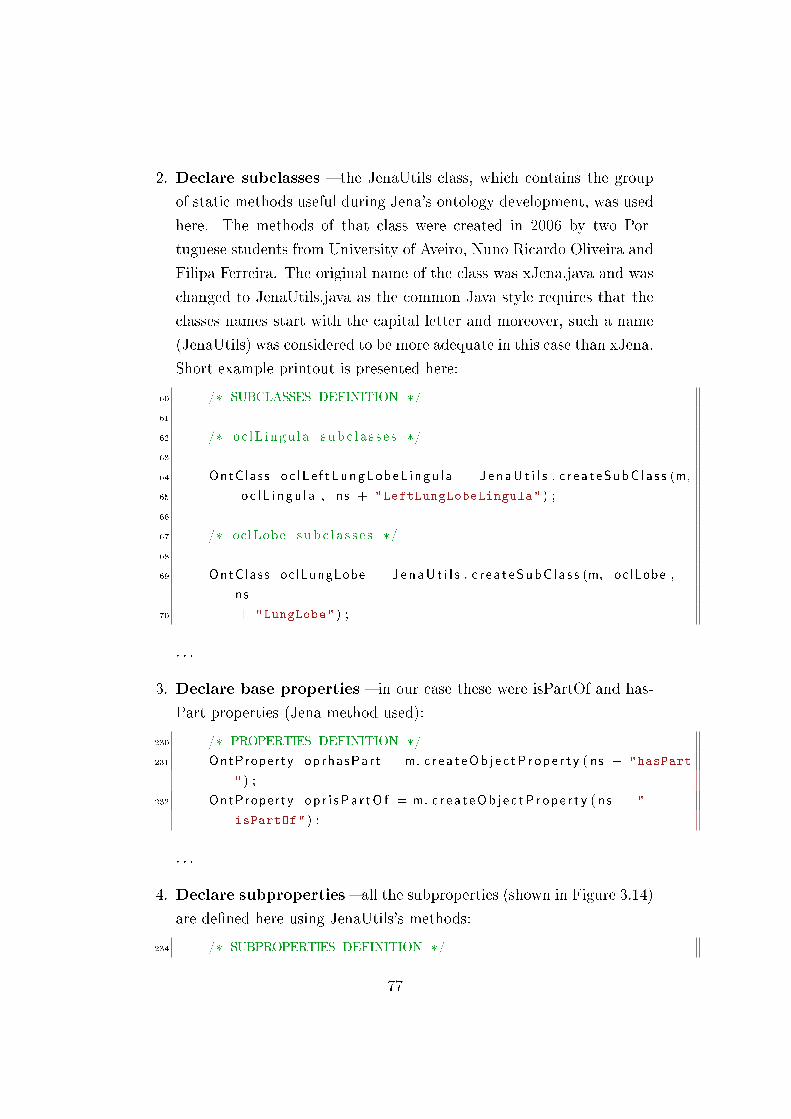
2. Declare subclasses � the JenaUtils class, which contains the group
of static methods useful during Jena's ontology development, was used
here. The methods of that class were created in 2006 by two Por-
tuguese students from University of Aveiro, Nuno Ricardo Oliveira and
Filipa Ferreira. The original name of the class was xJena.java and was
changed to JenaUtils.java as the common Java style requires that the
classes names start with the capital letter and moreover, such a name
(JenaUtils) was considered to be more adequate in this case than xJena.
Short example printout is presented here:
60 /* SUBCLASSES DEFINITION */
61
62 /* oc lL ingu l a s ub c l a s s e s */
63
64 OntClass o c l L e f t LungLobeL i ngu l a = J e n aU t i l s . c r e a t eSubC l a s s (m,
65 o c l L i n g u l a , ns + "LeftLungLobeLingula" ) ;
66
67 /* oclLobe sub c l a s s e s */
68
69 OntClass oc lLungLobe = J e n aU t i l s . c r e a t eSubC l a s s (m, oc lLobe ,
ns
70 + "LungLobe" ) ;
. . .
3. Declare base properties � in our case these were isPartOf and has-
Part properties (Jena method used):
230 /* PROPERTIES DEFINITION */
231 OntProperty op rha sPa r t = m. c r e a t eOb j e c tP r o p e r t y ( ns + "hasPart
" ) ;
232 OntProperty o p r i sPa r tO f = m. c r e a t eOb j e c tP r o p e r t y ( ns + "
isPartOf" ) ;
. . .
4. Declare subproperties � all the subproperties (shown in Figure 3.14)
are de�ned here using JenaUtils's methods:
234 /* SUBPROPERTIES DEFINITION */
77
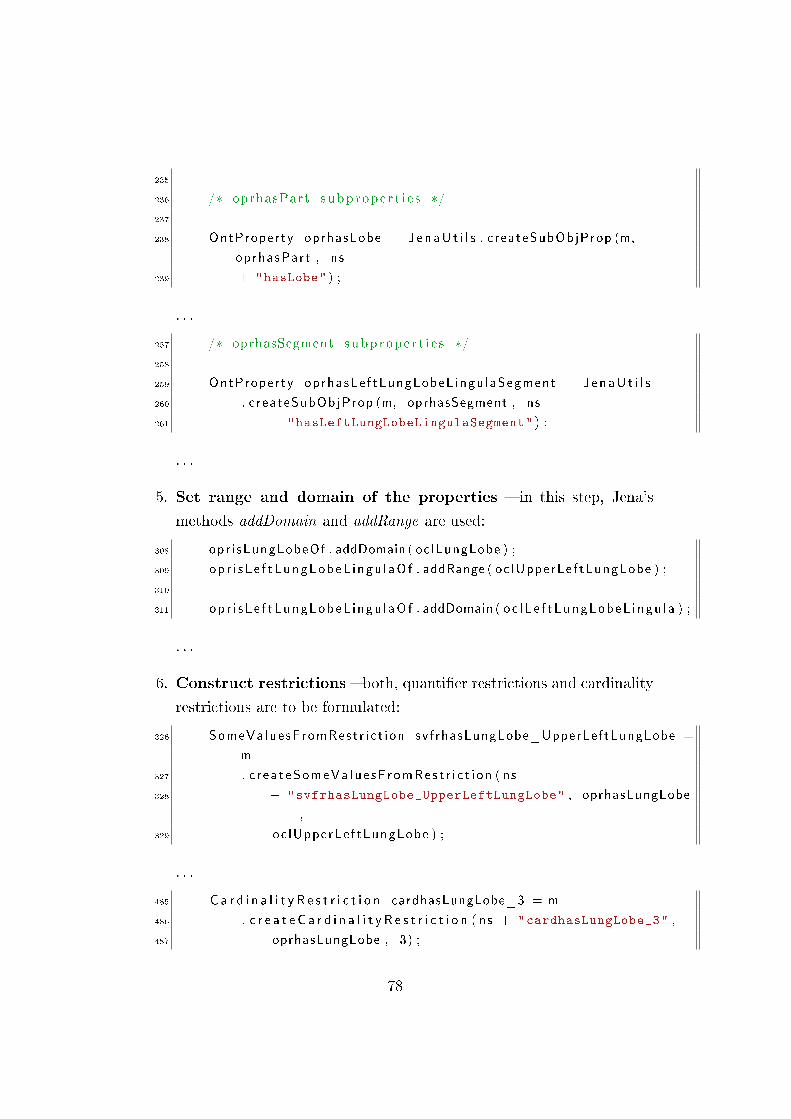
235
236 /* oprhasPart subprope r t i e s */
237
238 OntProperty oprhasLobe = J e n aU t i l s . createSubObjProp (m,
oprhasPar t , ns
239 + "hasLobe" ) ;
. . .
257 /* oprhasSegment subprope r t i e s */
258
259 OntProperty oprhasLe f tLungLobeL ingu laSegment = J e n aU t i l s
260 . createSubObjProp (m, oprhasSegment , ns
261 + "hasLeftLungLobeLingulaSegment" ) ;
. . .
5. Set range and domain of the properties � in this step, Jena's
methods addDomain and addRange are used:
308 opr i sLungLobeOf . addDomain ( oc lLungLobe ) ;
309 op r i s L e f t LungLobeL i ngu l aO f . addRange ( oc lUpperLe f tLungLobe ) ;
310
311 op r i s L e f t LungLobeL i ngu l aO f . addDomain ( oc l L e f t LungLobeL i n gu l a ) ;
. . .
6. Construct restrictions � both, quanti�er restrictions and cardinality
restrictions are to be formulated:
326 SomeVa lue sF romRes t r i c t i on sv f rhasLungLobe_UpperLef tLungLobe =
m
327 . c r e a t eSomeVa l u e sF romRes t r i c t i on ( ns
328 + "svfrhasLungLobe_UpperLeftLungLobe" , oprhasLungLobe
,
329 oc lUpperLe f tLungLobe ) ;
. . .
485 C a r d i n a l i t y R e s t r i c t i o n cardhasLungLobe_3 = m
486 . c r e a t e C a r d i n a l i t y R e s t r i c t i o n ( ns + "cardhasLungLobe_3" ,
487 oprhasLungLobe , 3) ;
78
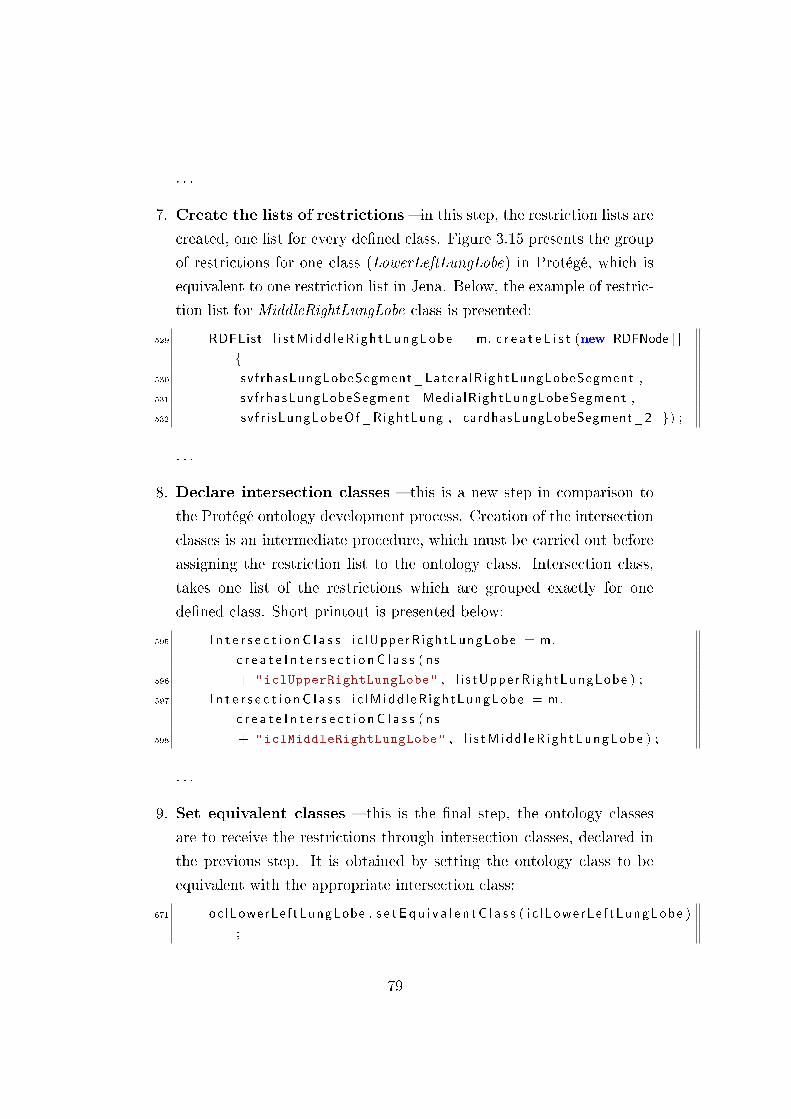
. . .
7. Create the lists of restrictions � in this step, the restriction lists are
created, one list for every de�ned class. Figure 3.15 presents the group
of restrictions for one class (LowerLeftLungLobe) in Protégé, which is
equivalent to one restriction list in Jena. Below, the example of restric-
tion list for MiddleRightLungLobe class is presented:
529 RDFList l i s tM i dd l eR i gh tLungLobe = m. c r e a t e L i s t (new RDFNode [ ]
{
530 sv f rhasLungLobeSegment_Latera lR ightLungLobeSegment ,
531 svfrhasLungLobeSegment_Media lRightLungLobeSegment ,
532 sv f r i sLungLobeOf_RightLung , cardhasLungLobeSegment_2 }) ;
. . .
8. Declare intersection classes � this is a new step in comparison to
the Protégé ontology development process. Creation of the intersection
classes is an intermediate procedure, which must be carried out before
assigning the restriction list to the ontology class. Intersection class,
takes one list of the restrictions which are grouped exactly for one
de�ned class. Short printout is presented below:
595 I n t e r s e c t i o n C l a s s i c lUppe rR igh tLungLobe = m.
c r e a t e I n t e r s e c t i o n C l a s s ( ns
596 + "iclUpperRightLungLobe" , l i s tUppe rR i gh tLungLobe ) ;
597 I n t e r s e c t i o n C l a s s i c lM idd l eR i gh tLungLobe = m.
c r e a t e I n t e r s e c t i o n C l a s s ( ns
598 + "iclMiddleRightLungLobe" , l i s tM i dd l eR i gh tLungLobe ) ;
. . .
9. Set equivalent classes � this is the �nal step, the ontology classes
are to receive the restrictions through intersection classes, declared in
the previous step. It is obtained by setting the ontology class to be
equivalent with the appropriate intersection class:
671 oc lLowerLe f tLungLobe . s e t E q u i v a l e n t C l a s s ( i c l Lowe rLe f tLungLobe )
;
79
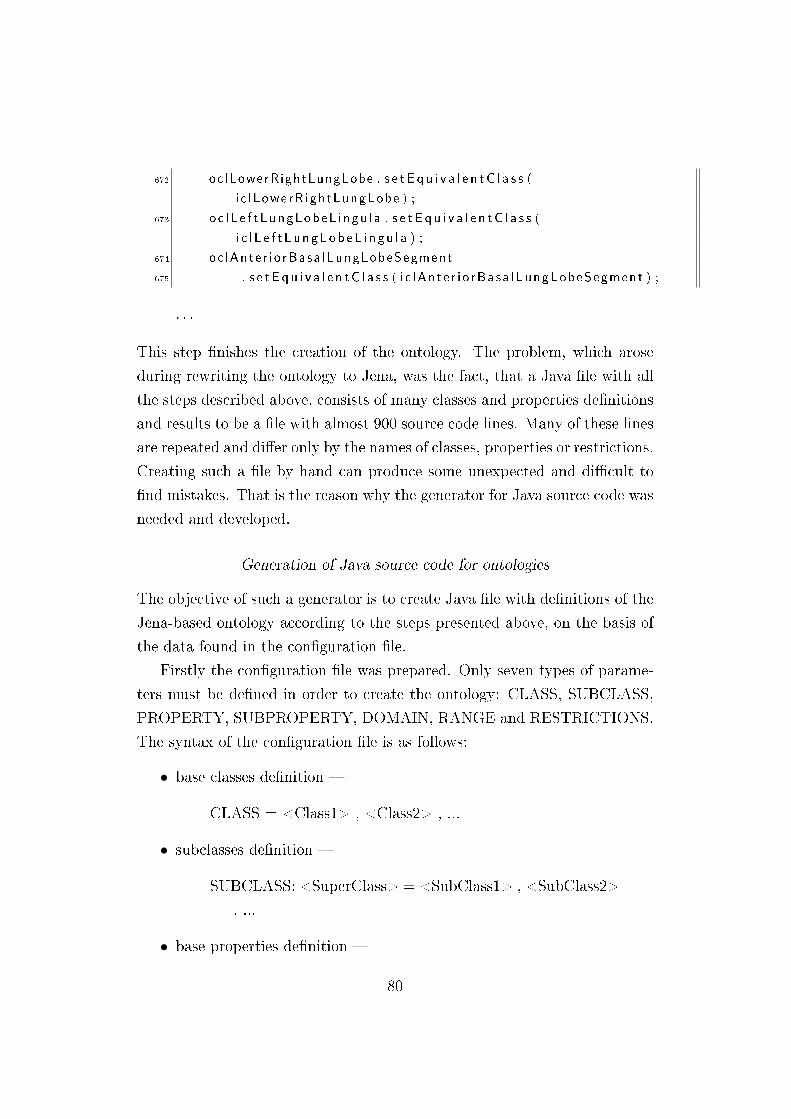
672 oc lLowerRightLungLobe . s e t E q u i v a l e n t C l a s s (
i c l Lowe rR igh tLungLobe ) ;
673 oc l L e f t LungLobeL i n gu l a . s e t E q u i v a l e n t C l a s s (
i c l L e f t L u n gLob eL i n g u l a ) ;
674 oc lAnte r i o rBasa lLungLobeSegment
675 . s e t E q u i v a l e n t C l a s s ( i c lAn t e r i o rBa sa l LungLobeSegmen t ) ;
. . .
This step �nishes the creation of the ontology. The problem, which arose
during rewriting the ontology to Jena, was the fact, that a Java �le with all
the steps described above, consists of many classes and properties de�nitions
and results to be a �le with almost 900 source code lines. Many of these lines
are repeated and di�er only by the names of classes, properties or restrictions.
Creating such a �le by hand can produce some unexpected and di�cult to
�nd mistakes. That is the reason why the generator for Java source code was
needed and developed.
Generation of Java source code for ontologies
The objective of such a generator is to create Java �le with de�nitions of the
Jena-based ontology according to the steps presented above, on the basis of
the data found in the con�guration �le.
Firstly the con�guration �le was prepared. Only seven types of parame-
ters must be de�ned in order to create the ontology: CLASS, SUBCLASS,
PROPERTY, SUBPROPERTY, DOMAIN, RANGE and RESTRICTIONS.
The syntax of the con�guration �le is as follows:
• base classes de�nition �
CLASS = <Class1> , <Class2> , ...
• subclasses de�nition �
SUBCLASS: <SuperClass> = <SubClass1> , <SubClass2>
, ...
• base properties de�nition �
80
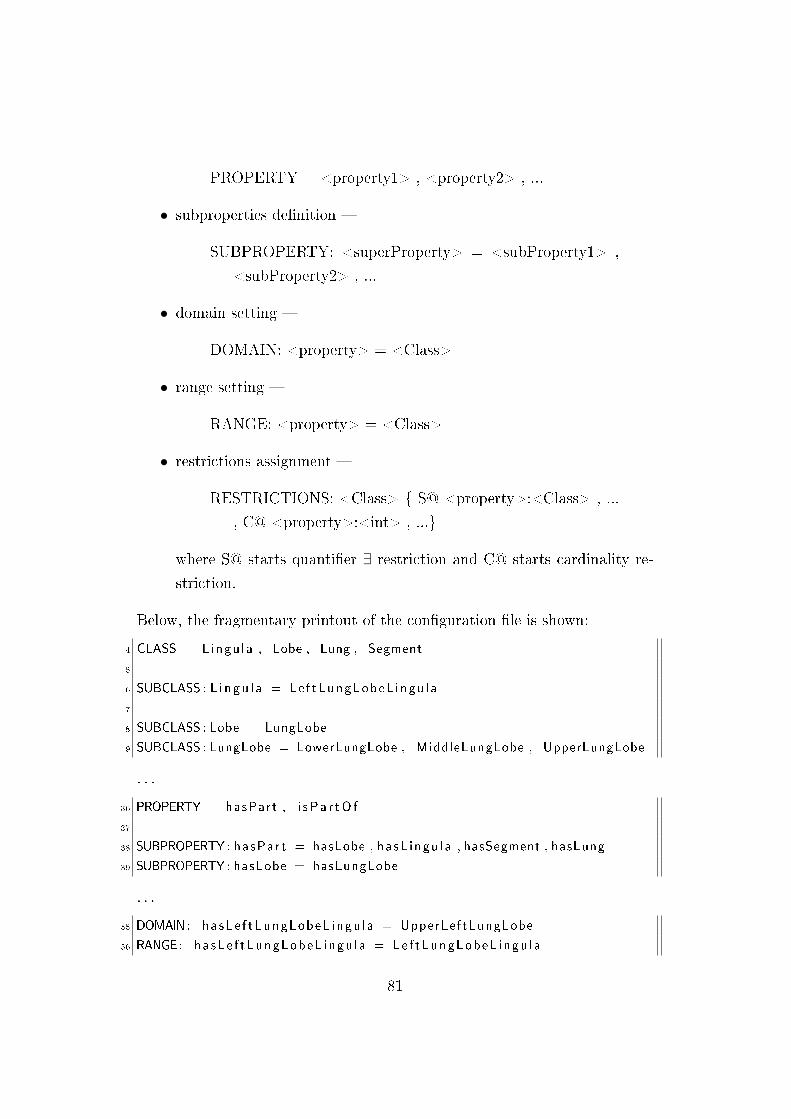
PROPERTY = <property1> , <property2> , ...
• subproperties de�nition �
SUBPROPERTY: <superProperty> = <subProperty1> ,
<subProperty2> , ...
• domain setting �
DOMAIN: <property> = <Class>
• range setting �
RANGE: <property> = <Class>
• restrictions assignment �
RESTRICTIONS: <Class> { S@ <property>:<Class> , ...
, C@ <property>:<int> , ...}
where S@ starts quanti�er ∃ restriction and C@ starts cardinality re-
striction.
Below, the fragmentary printout of the con�guration �le is shown:
4 CLASS = L ingu l a , Lobe , Lung , Segment
5
6 SUBCLASS : L i n gu l a = Le f tLungLobeL ingu l a
7
8 SUBCLASS : Lobe = LungLobe
9 SUBCLASS : LungLobe = LowerLungLobe , MiddleLungLobe , UpperLungLobe
. . .
36 PROPERTY = hasPart , i s P a r tO f
37
38 SUBPROPERTY : hasPar t = hasLobe , hasL ingu l a , hasSegment , hasLung
39 SUBPROPERTY : hasLobe = hasLungLobe
. . .
55 DOMAIN : ha sLe f tLungLobeL ingu l a = UpperLeftLungLobe
56 RANGE : ha sLe f tLungLobeL ingu l a = Le f tLungLobeL ingu l a
81
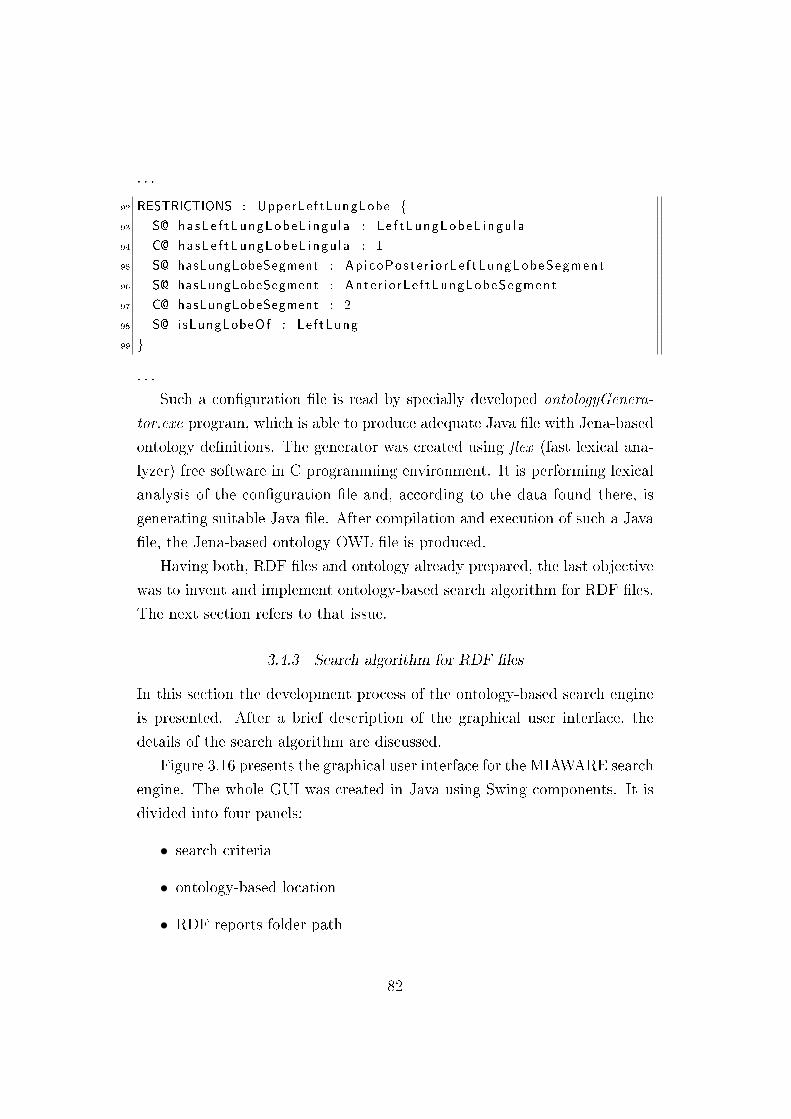
. . .
92 RESTRICTIONS : UpperLeftLungLobe {
93 S@ hasLe f tLungLobeL ingu l a : Le f tLungLobeL ingu l a
94 C@ hasLe f tLungLobeL ingu l a : 1
95 S@ hasLungLobeSegment : Ap icoPos te r i o rLe f tLungLobeSegment
96 S@ hasLungLobeSegment : Ante r i o rLe f tLungLobeSegment
97 C@ hasLungLobeSegment : 2
98 S@ isLungLobeOf : Lef tLung
99 }
. . .
Such a con�guration �le is read by specially developed ontologyGenera-
tor.exe program, which is able to produce adequate Java �le with Jena-based
ontology de�nitions. The generator was created using �ex (fast lexical ana-
lyzer) free software in C programming environment. It is performing lexical
analysis of the con�guration �le and, according to the data found there, is
generating suitable Java �le. After compilation and execution of such a Java
�le, the Jena-based ontology OWL �le is produced.
Having both, RDF �les and ontology already prepared, the last objective
was to invent and implement ontology-based search algorithm for RDF �les.
The next section refers to that issue.
3.4.3 Search algorithm for RDF �les
In this section the development process of the ontology-based search engine
is presented. After a brief description of the graphical user interface, the
details of the search algorithm are discussed.
Figure 3.16 presents the graphical user interface for the MIAWARE search
engine. The whole GUI was created in Java using Swing components. It is
divided into four panels:
• search criteria
• ontology-based location
• RDF reports folder path
82
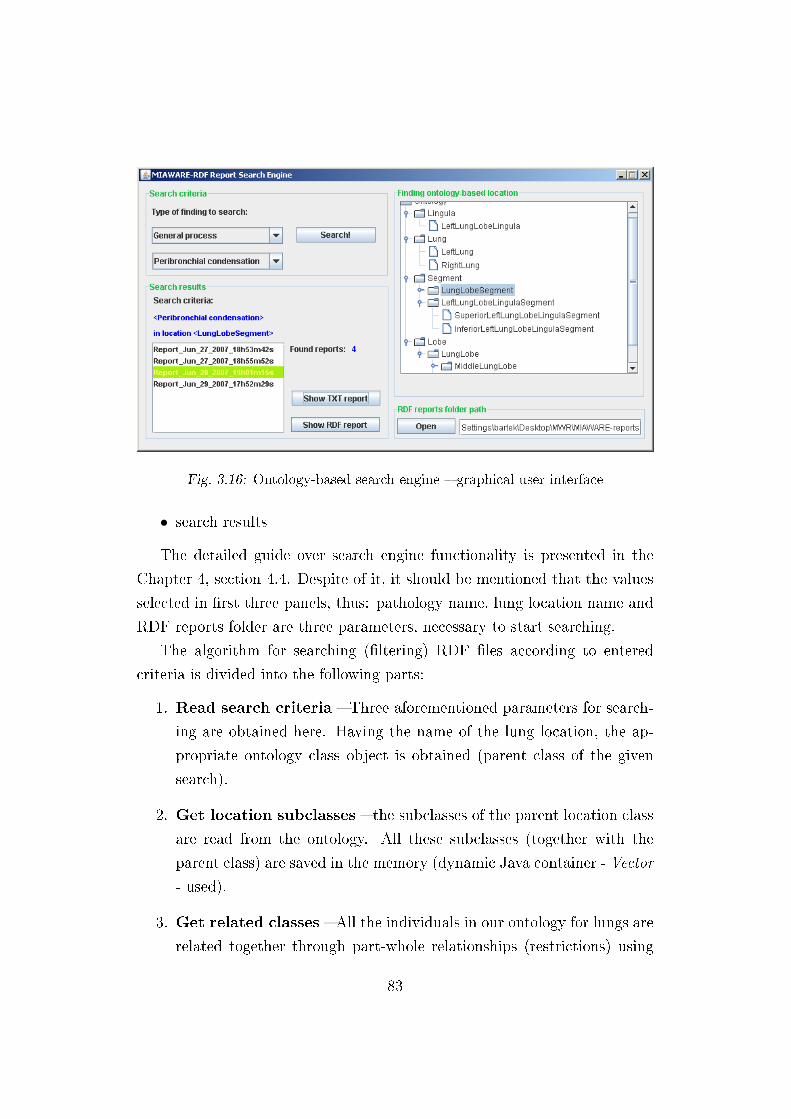
Fig. 3.16: Ontology-based search engine � graphical user interface
• search results
The detailed guide over search engine functionality is presented in the
Chapter 4, section 4.4. Despite of it, it should be mentioned that the values
selected in �rst three panels, thus: pathology name, lung location name and
RDF reports folder are three parameters, necessary to start searching.
The algorithm for searching (�ltering) RDF �les according to entered
criteria is divided into the following parts:
1. Read search criteria � Three aforementioned parameters for search-
ing are obtained here. Having the name of the lung location, the ap-
propriate ontology class object is obtained (parent class of the given
search).
2. Get location subclasses � the subclasses of the parent location class
are read from the ontology. All these subclasses (together with the
parent class) are saved in the memory (dynamic Java container - Vector
- used).
3. Get related classes � All the individuals in our ontology for lungs are
related together through part-whole relationships (restrictions) using
83
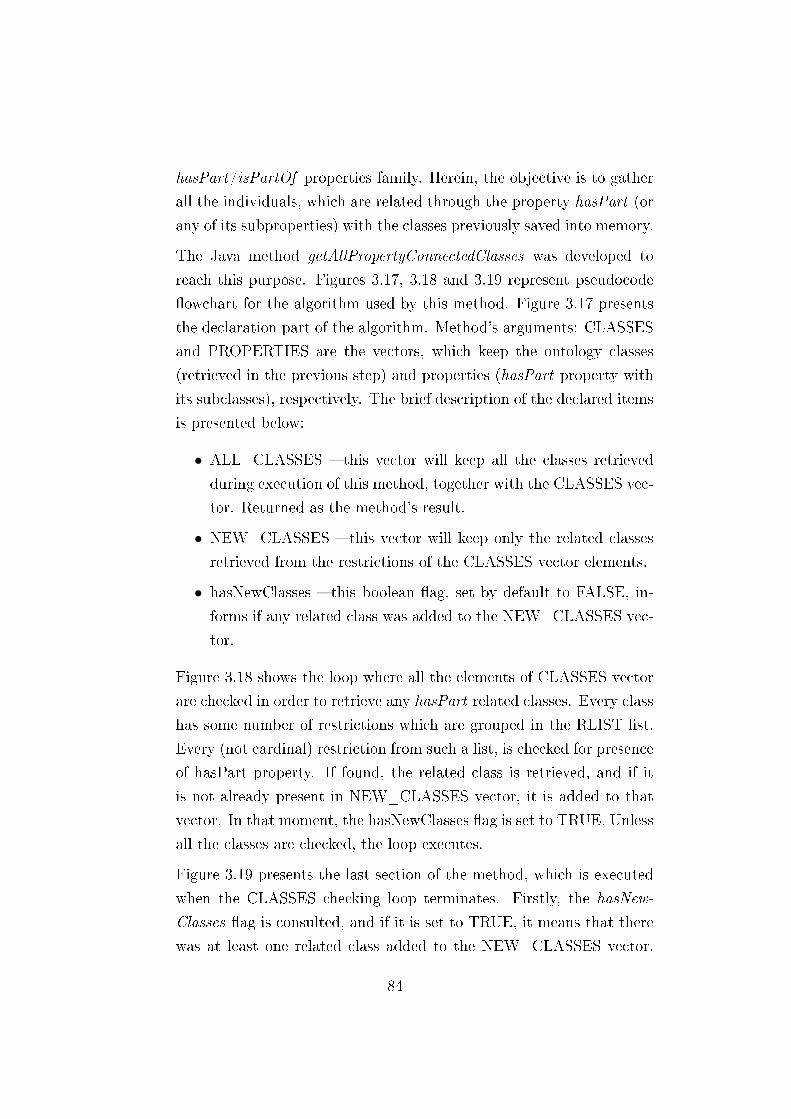
hasPart/isPartOf properties family. Herein, the objective is to gather
all the individuals, which are related through the property hasPart (or
any of its subproperties) with the classes previously saved into memory.
The Java method getAllPropertyConnectedClasses was developed to
reach this purpose. Figures 3.17, 3.18 and 3.19 represent pseudocode
�owchart for the algorithm used by this method. Figure 3.17 presents
the declaration part of the algorithm. Method's arguments: CLASSES
and PROPERTIES are the vectors, which keep the ontology classes
(retrieved in the previous step) and properties (hasPart property with
its subclasses), respectively. The brief description of the declared items
is presented below:
• ALL_CLASSES � this vector will keep all the classes retrieved
during execution of this method, together with the CLASSES vec-
tor. Returned as the method's result.
• NEW_CLASSES � this vector will keep only the related classes
retrieved from the restrictions of the CLASSES vector elements.
• hasNewClasses � this boolean �ag, set by default to FALSE, in-
forms if any related class was added to the NEW_CLASSES vec-
tor.
Figure 3.18 shows the loop where all the elements of CLASSES vector
are checked in order to retrieve any hasPart related classes. Every class
has some number of restrictions which are grouped in the RLIST list.
Every (not cardinal) restriction from such a list, is checked for presence
of hasPart property. If found, the related class is retrieved, and if it
is not already present in NEW_CLASSES vector, it is added to that
vector. In that moment, the hasNewClasses �ag is set to TRUE. Unless
all the classes are checked, the loop executes.
Figure 3.19 presents the last section of the method, which is executed
when the CLASSES checking loop terminates. Firstly, the hasNew-
Classes �ag is consulted, and if it is set to TRUE, it means that there
was at least one related class added to the NEW_CLASSES vector.
84
Fig. 3.17: Ontology-based search algorithm �owchart, part 1
85
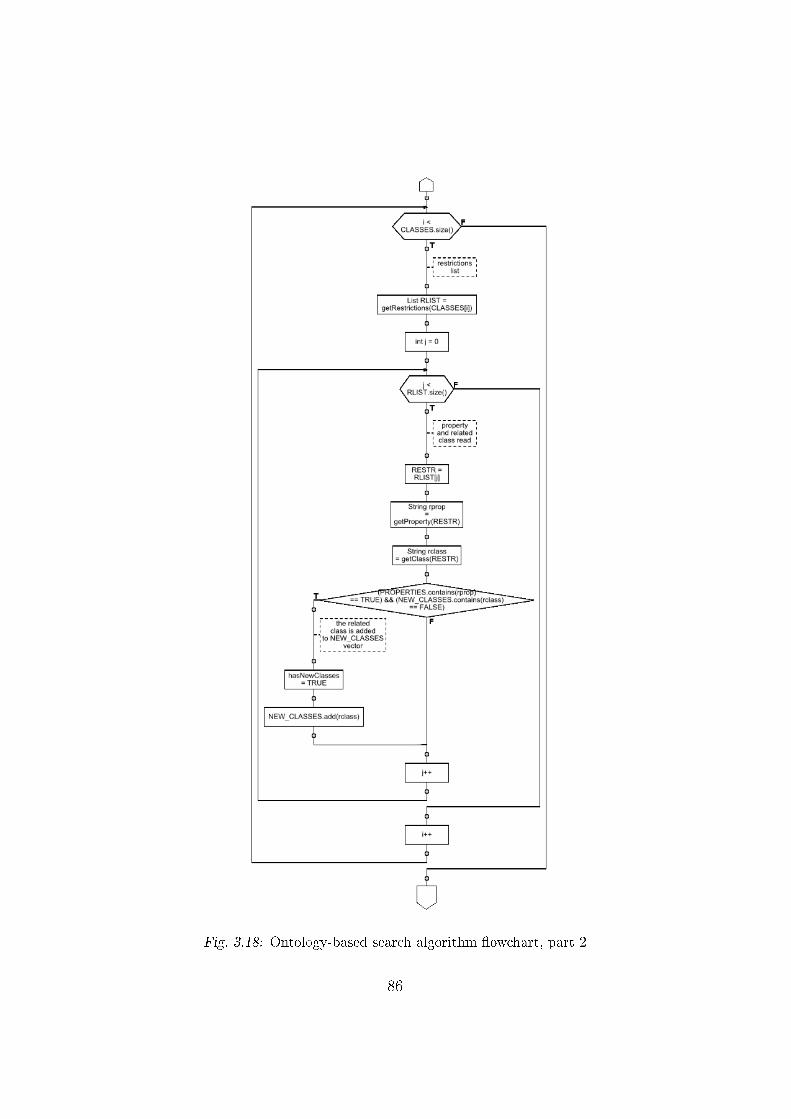
Fig. 3.18: Ontology-based search algorithm �owchart, part 2
86
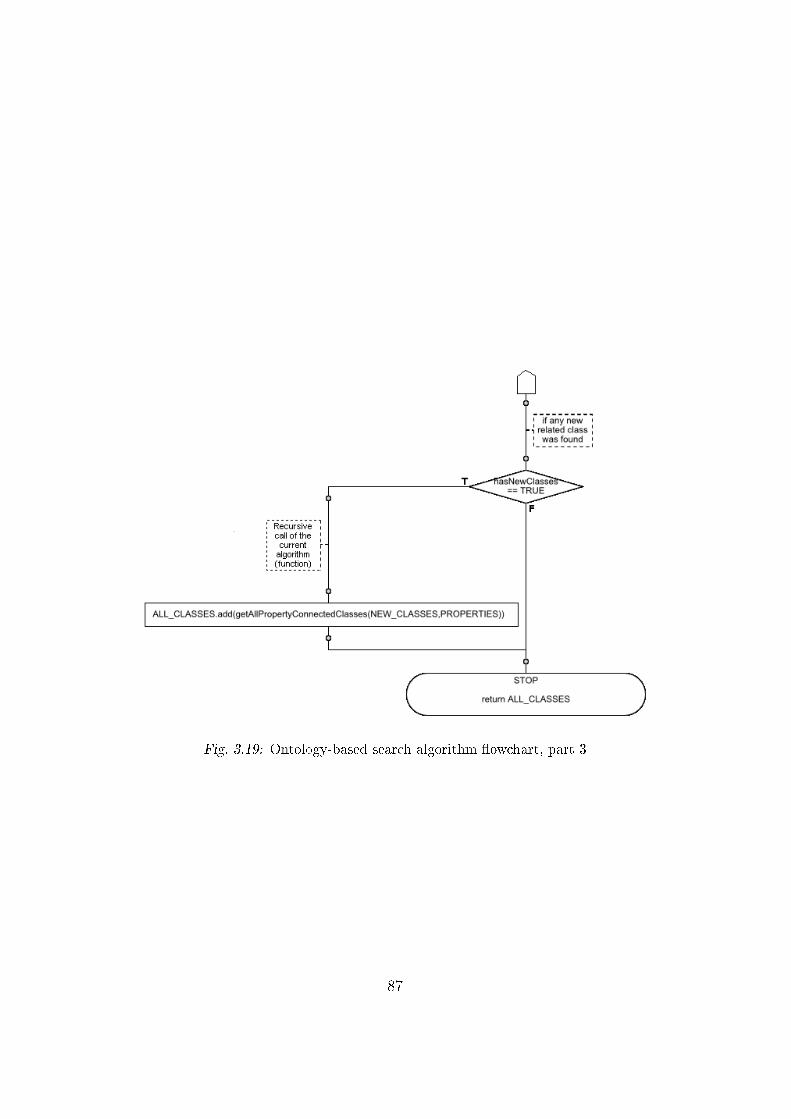
Fig. 3.19: Ontology-based search algorithm �owchart, part 3
87
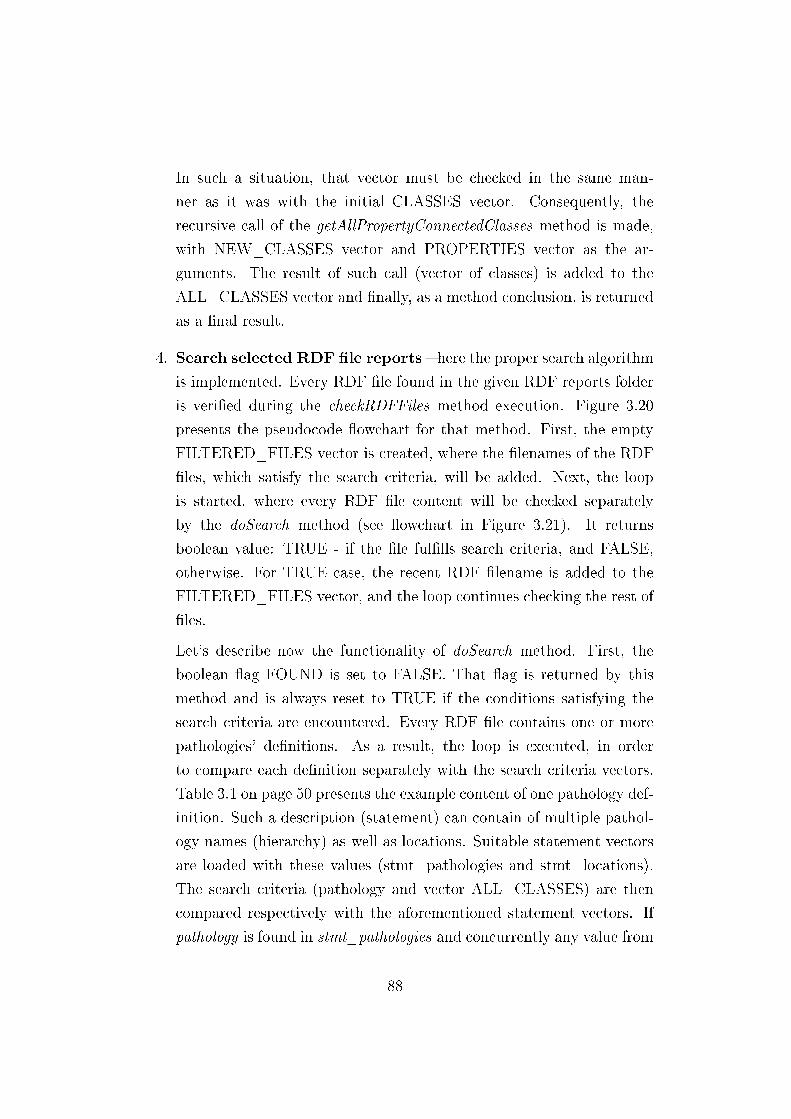
In such a situation, that vector must be checked in the same man-
ner as it was with the initial CLASSES vector. Consequently, the
recursive call of the getAllPropertyConnectedClasses method is made,
with NEW_CLASSES vector and PROPERTIES vector as the ar-
guments. The result of such call (vector of classes) is added to the
ALL_CLASSES vector and �nally, as a method conclusion, is returned
as a �nal result.
4. Search selected RDF �le reports � here the proper search algorithm
is implemented. Every RDF �le found in the given RDF reports folder
is veri�ed during the checkRDFFiles method execution. Figure 3.20
presents the pseudocode �owchart for that method. First, the empty
FILTERED_FILES vector is created, where the �lenames of the RDF
�les, which satisfy the search criteria, will be added. Next, the loop
is started, where every RDF �le content will be checked separately
by the doSearch method (see �owchart in Figure 3.21). It returns
boolean value: TRUE - if the �le ful�lls search criteria, and FALSE,
otherwise. For TRUE case, the recent RDF �lename is added to the
FILTERED_FILES vector, and the loop continues checking the rest of
�les.
Let's describe now the functionality of doSearch method. First, the
boolean �ag FOUND is set to FALSE. That �ag is returned by this
method and is always reset to TRUE if the conditions satisfying the
search criteria are encountered. Every RDF �le contains one or more
pathologies' de�nitions. As a result, the loop is executed, in order
to compare each de�nition separately with the search criteria vectors.
Table 3.1 on page 50 presents the example content of one pathology def-
inition. Such a description (statement) can contain of multiple pathol-
ogy names (hierarchy) as well as locations. Suitable statement vectors
are loaded with these values (stmt_pathologies and stmt_locations).
The search criteria (pathology and vector ALL_CLASSES) are then
compared respectively with the aforementioned statement vectors. If
pathology is found in stmt_pathologies and concurrently any value from
88
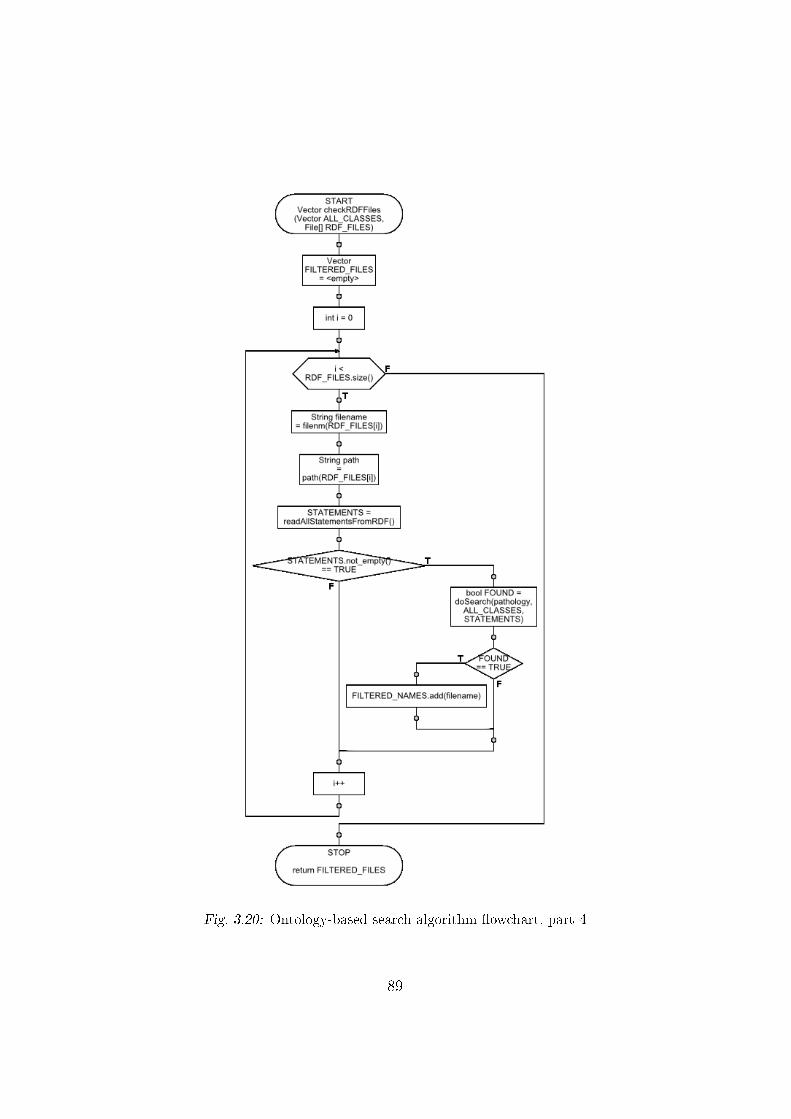
Fig. 3.20: Ontology-based search algorithm �owchart, part 4
89
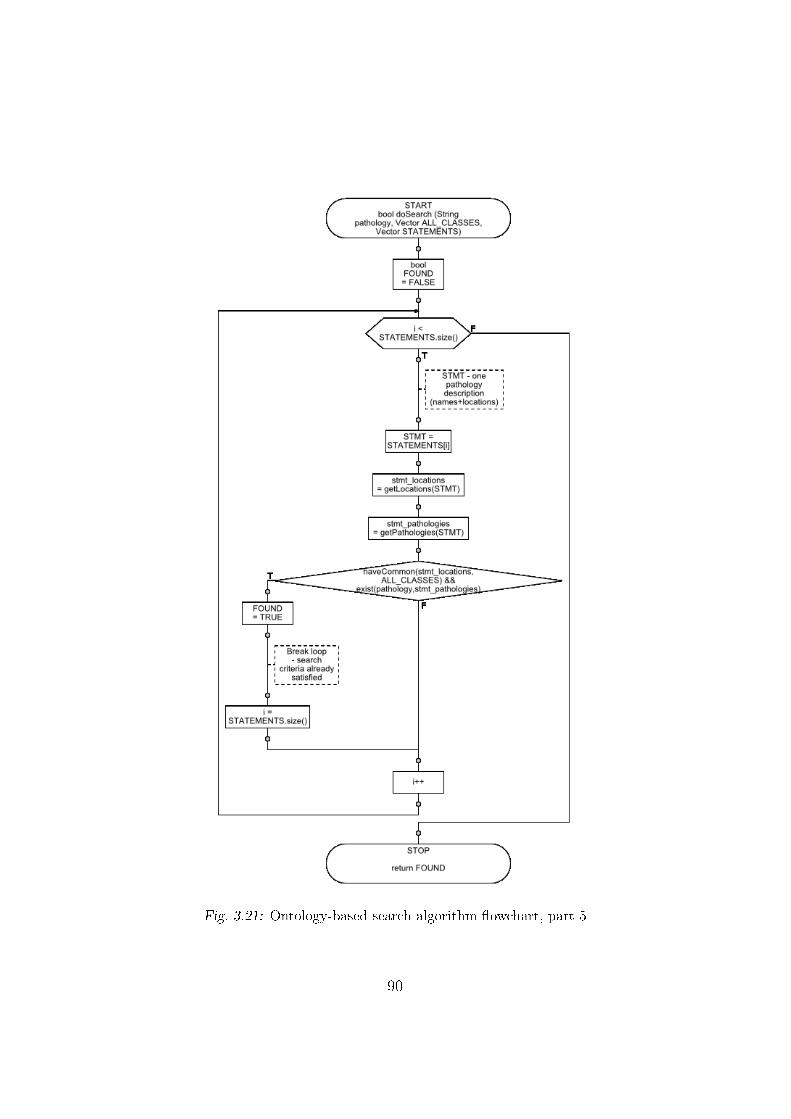
Fig. 3.21: Ontology-based search algorithm �owchart, part 5
90

ALL_CLASSES can be found in stmt_locations, the search criteria is
satis�ed, the present loop breaks and doSearch method returns FOUND
�ag set to TRUE. Otherwise, the loop continues the scan of remain-
ing pathology de�nitions. If no pathology satis�ed the search criteria,
doSearch method returns FALSE.
All the methods, used in the above presented steps, are grouped in the
Java OntologyBasedSearch class. That concludes present section over the
ontology-based search engine and simultaneously �nishes the entire overview
of the MIAWARE software architecture. Chapter 4 describes and summarizes
the capabilities of the MIAWARE software package in form of the practical
guide for its users.
91
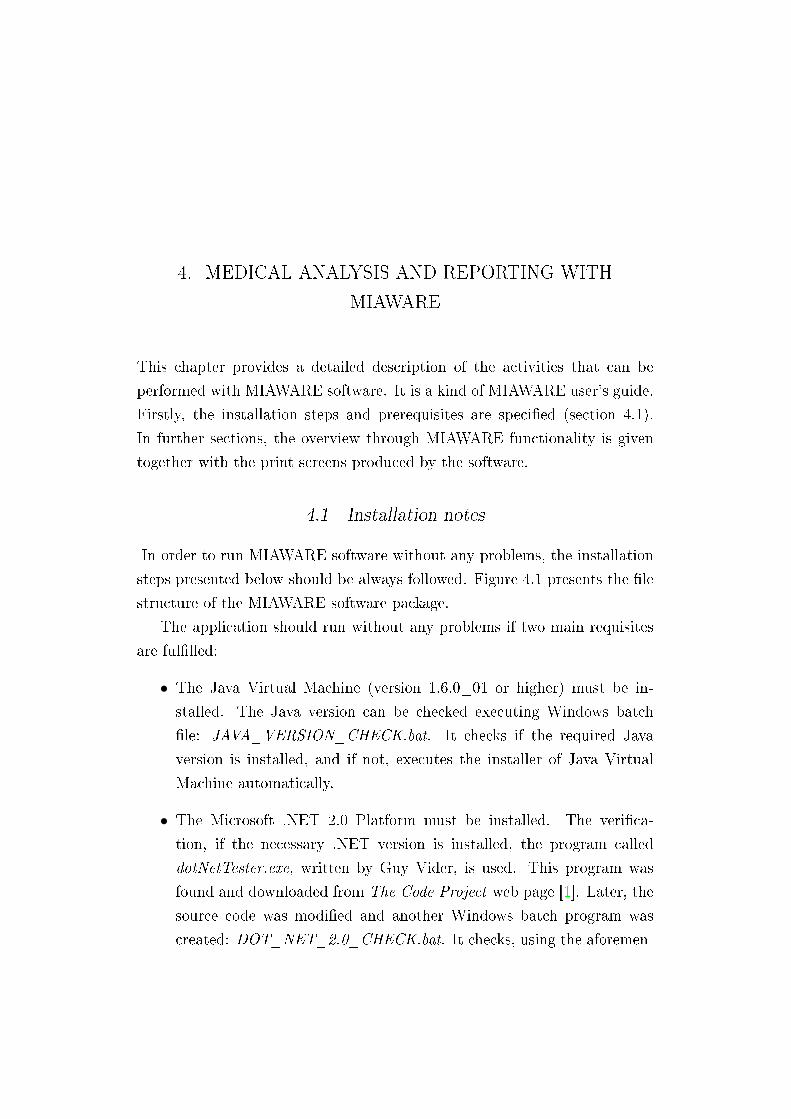
4. MEDICAL ANALYSIS AND REPORTING WITH
MIAWARE
This chapter provides a detailed description of the activities that can be
performed with MIAWARE software. It is a kind of MIAWARE user's guide.
Firstly, the installation steps and prerequisites are speci�ed (section 4.1).
In further sections, the overview through MIAWARE functionality is given
together with the print screens produced by the software.
4.1 Installation notes
In order to run MIAWARE software without any problems, the installation
steps presented below should be always followed. Figure 4.1 presents the �le
structure of the MIAWARE software package.
The application should run without any problems if two main requisites
are ful�lled:
• The Java Virtual Machine (version 1.6.0_01 or higher) must be in-
stalled. The Java version can be checked executing Windows batch
�le: JAVA_VERSION_CHECK.bat. It checks if the required Java
version is installed, and if not, executes the installer of Java Virtual
Machine automatically.
• The Microsoft .NET 2.0 Platform must be installed. The veri�ca-
tion, if the necessary .NET version is installed, the program called
dotNetTester.exe, written by Guy Vider, is used. This program was
found and downloaded from The Code Project web page [1]. Later, the
source code was modi�ed and another Windows batch program was
created: DOT_NET_2.0_CHECK.bat. It checks, using the aforemen-
Fig. 4.1: This �gure presents the �les and folders which belongs to the MIAWAREpackage. Four selected elements are necessary to be executed in order toinstall and execute properly the MIAWARE software.
93
tioned dotNetTester.exe program, if the Microsoft .NET 2.0 Platform
is installed. If it is not, the Microsoft .NET 2.0 installer executes au-
tomatically.
Both installers, for Java VM 1.6.0u1 and Microsoft .NET 2.0 Platform
were downloaded from the web pages of Sun and Microsoft companies, re-
spectively.
After the successful installation of the software, the MIAWARE applica-
tion can be run. It is done simply by the execution of MIAWAREv1.0.exe
�le. The *.exe �le was created using the Launch4j software [20]. Since Java
creates executable programs with *.jar extension, it was decided to wrap it
to *.exe �le. Following the Launch4j webpage, �Launch4j is a cross-platform
tool for wrapping Java applications distributed as jars in lightweight Win-
dows native executables�.
Execution of the MIAWAREv1.0.exe �le will produce the MIAWARE
main frame, presented in Figure 4.2. All the elements in that �gure are
indexed in order to be used as references in further sections of this chapter.
For example, the reference to the Start analysis button will be represented
in this chapter as [E2 - 4.2], which means: element number 2 in Figure 4.2.
4.2 Analysis of CAT images
The detailed examination and analysis of the radiological images is a �rst
step in the pathology de�nition and further disease recognition. The follow-
ing subsections describe all the tools and features of MIAWARE provided in
order to ease-up image analysis process.
4.2.1 Specifying CAT stack location
In order to start an analysis, a single folder path with the radiological ex-
amination (CAT) images (stack) must be speci�ed. The path can be entered
directly to the text �eld [E1b - 4.2]. Another option is to use �le chooser
dialog, which appears when user clicks the Open button [E1 - 4.2].
94
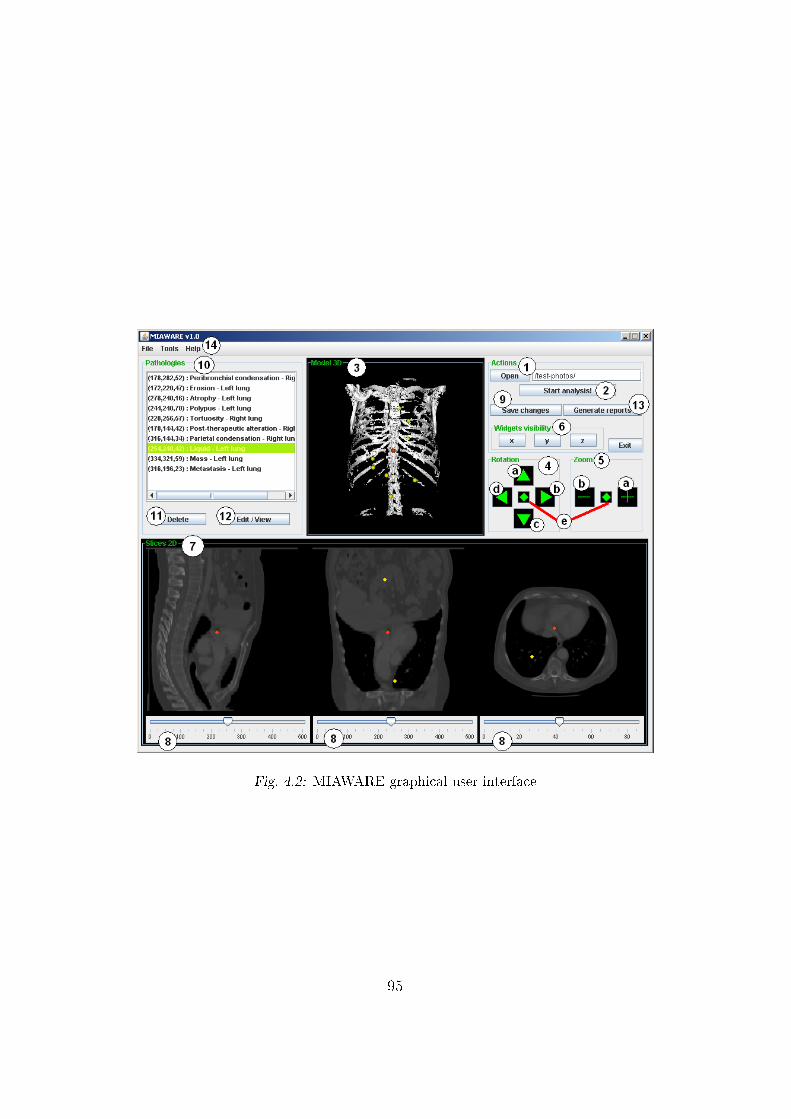
Fig. 4.2: MIAWARE graphical user interface
95
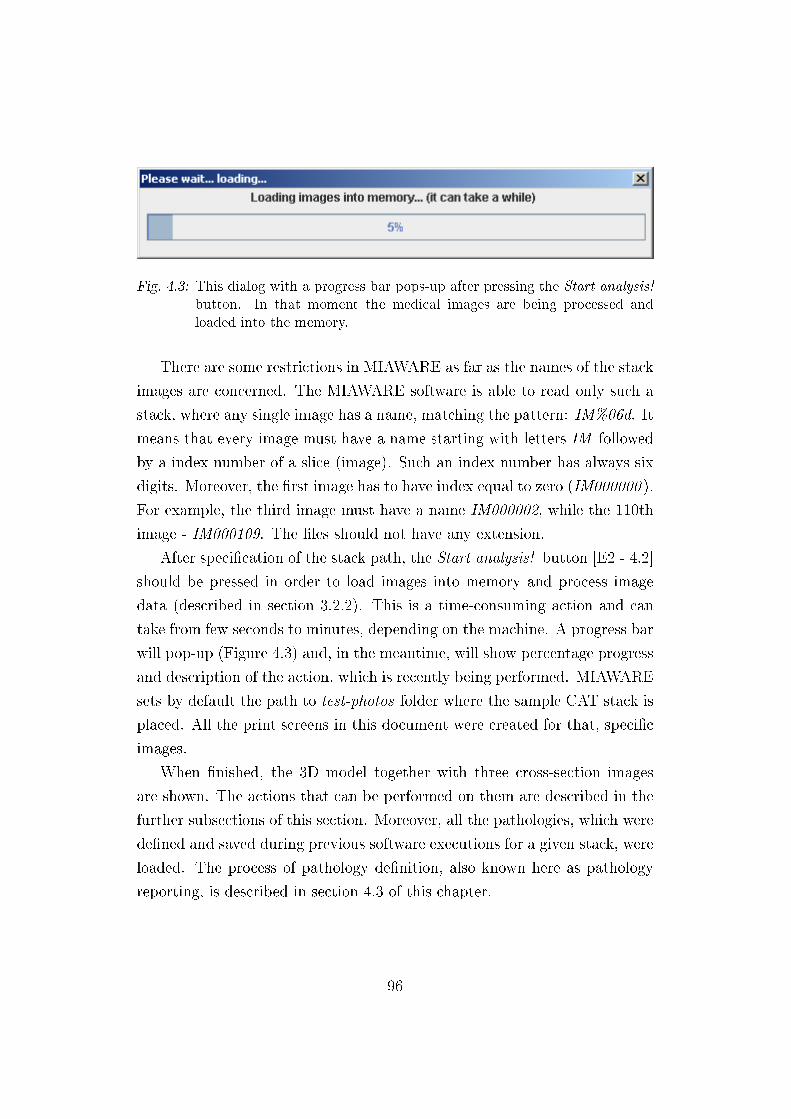
Fig. 4.3: This dialog with a progress bar pops-up after pressing the Start analysis!button. In that moment the medical images are being processed andloaded into the memory.
There are some restrictions in MIAWARE as far as the names of the stack
images are concerned. The MIAWARE software is able to read only such a
stack, where any single image has a name, matching the pattern: IM%06d. It
means that every image must have a name starting with letters IM followed
by a index number of a slice (image). Such an index number has always six
digits. Moreover, the �rst image has to have index equal to zero (IM000000 ).
For example, the third image must have a name IM000002, while the 110th
image - IM000109. The �les should not have any extension.
After speci�cation of the stack path, the Start analysis! button [E2 - 4.2]
should be pressed in order to load images into memory and process image
data (described in section 3.2.2). This is a time-consuming action and can
take from few seconds to minutes, depending on the machine. A progress bar
will pop-up (Figure 4.3) and, in the meantime, will show percentage progress
and description of the action, which is recently being performed. MIAWARE
sets by default the path to test-photos folder where the sample CAT stack is
placed. All the print screens in this document were created for that, speci�c
images.
When �nished, the 3D model together with three cross-section images
are shown. The actions that can be performed on them are described in the
further subsections of this section. Moreover, all the pathologies, which were
de�ned and saved during previous software executions for a given stack, were
loaded. The process of pathology de�nition, also known here as pathology
reporting, is described in section 4.3 of this chapter.
96
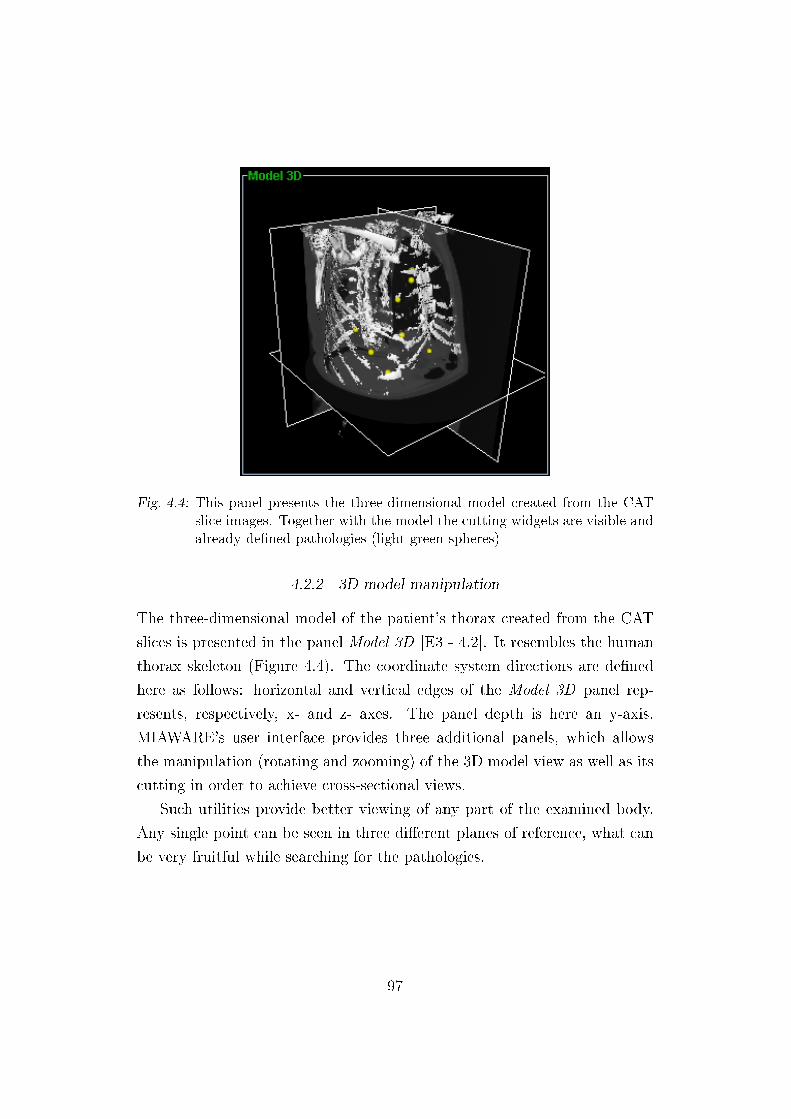
Fig. 4.4: This panel presents the three-dimensional model created from the CATslice images. Together with the model the cutting widgets are visible andalready de�ned pathologies (light green spheres)
4.2.2 3D model manipulation
The three-dimensional model of the patient's thorax created from the CAT
slices is presented in the panel Model 3D [E3 - 4.2]. It resembles the human
thorax skeleton (Figure 4.4). The coordinate system directions are de�ned
here as follows: horizontal and vertical edges of the Model 3D panel rep-
resents, respectively, x- and z- axes. The panel depth is here an y-axis.
MIAWARE's user interface provides three additional panels, which allows
the manipulation (rotating and zooming) of the 3D model view as well as its
cutting in order to achieve cross-sectional views.
Such utilities provide better viewing of any part of the examined body.
Any single point can be seen in three di�erent planes of reference, what can
be very fruitful while searching for the pathologies.
97
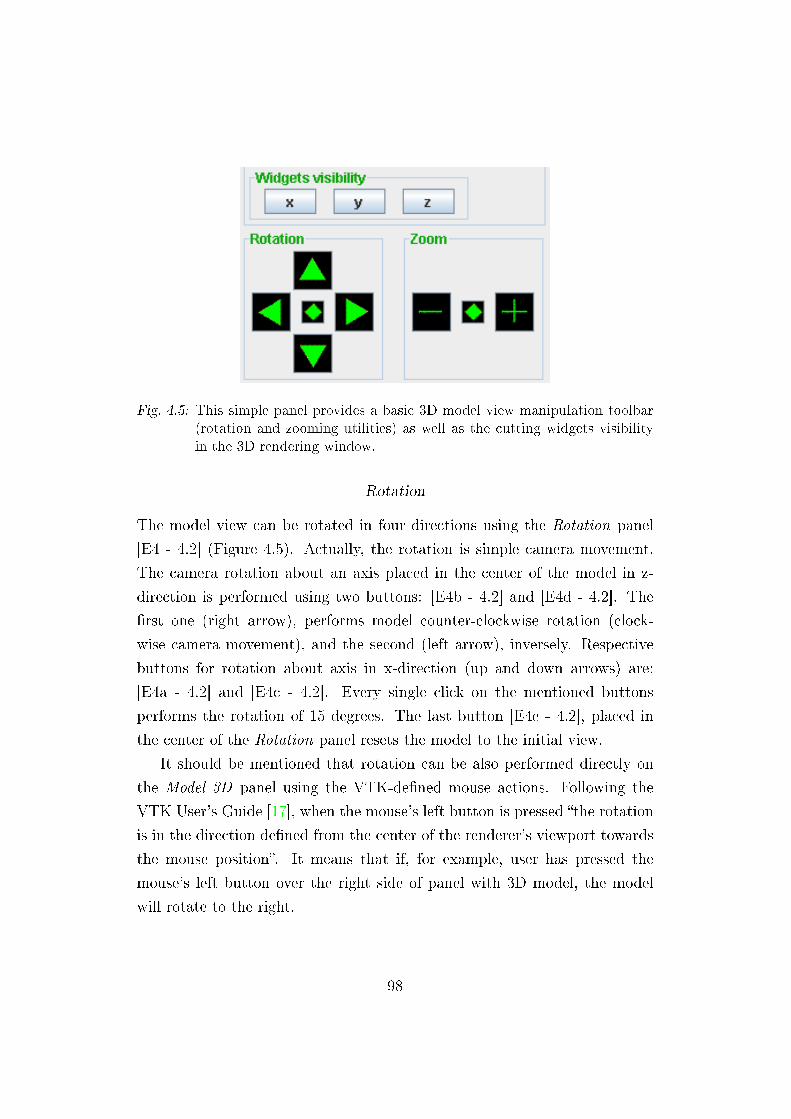
Fig. 4.5: This simple panel provides a basic 3D model view manipulation toolbar(rotation and zooming utilities) as well as the cutting widgets visibilityin the 3D rendering window.
Rotation
The model view can be rotated in four directions using the Rotation panel
[E4 - 4.2] (Figure 4.5). Actually, the rotation is simple camera movement.
The camera rotation about an axis placed in the center of the model in z-
direction is performed using two buttons: [E4b - 4.2] and [E4d - 4.2]. The
�rst one (right arrow), performs model counter-clockwise rotation (clock-
wise camera movement), and the second (left arrow), inversely. Respective
buttons for rotation about axis in x-direction (up and down arrows) are:
[E4a - 4.2] and [E4c - 4.2]. Every single click on the mentioned buttons
performs the rotation of 15 degrees. The last button [E4e - 4.2], placed in
the center of the Rotation panel resets the model to the initial view.
It should be mentioned that rotation can be also performed directly on
the Model 3D panel using the VTK-de�ned mouse actions. Following the
VTK User's Guide [17], when the mouse's left button is pressed �the rotation
is in the direction de�ned from the center of the renderer's viewport towards
the mouse position�. It means that if, for example, user has pressed the
mouse's left button over the right side of panel with 3D model, the model
will rotate to the right.
98
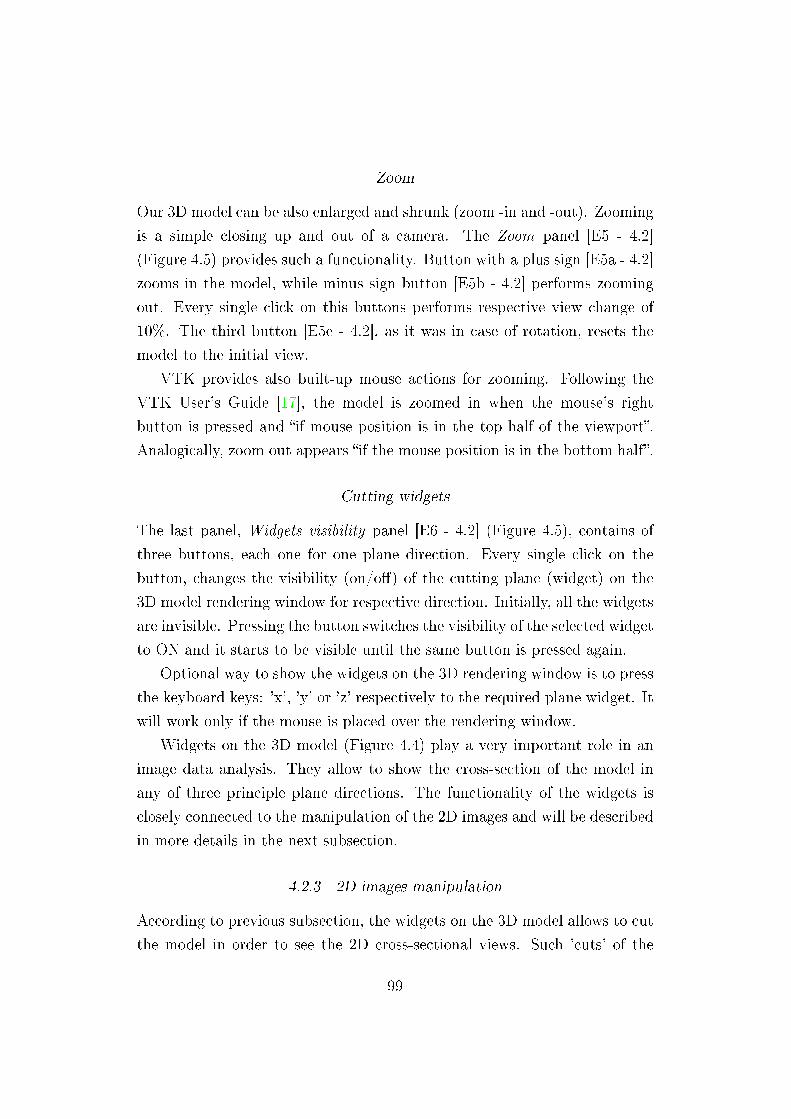
Zoom
Our 3D model can be also enlarged and shrunk (zoom -in and -out). Zooming
is a simple closing up and out of a camera. The Zoom panel [E5 - 4.2]
(Figure 4.5) provides such a functionality. Button with a plus sign [E5a - 4.2]
zooms in the model, while minus sign button [E5b - 4.2] performs zooming
out. Every single click on this buttons performs respective view change of
10%. The third button [E5e - 4.2], as it was in case of rotation, resets the
model to the initial view.
VTK provides also built-up mouse actions for zooming. Following the
VTK User's Guide [17], the model is zoomed in when the mouse's right
button is pressed and �if mouse position is in the top half of the viewport�.
Analogically, zoom out appears �if the mouse position is in the bottom half�.
Cutting widgets
The last panel, Widgets visibility panel [E6 - 4.2] (Figure 4.5), contains of
three buttons, each one for one plane direction. Every single click on the
button, changes the visibility (on/o�) of the cutting plane (widget) on the
3D model rendering window for respective direction. Initially, all the widgets
are invisible. Pressing the button switches the visibility of the selected widget
to ON and it starts to be visible until the same button is pressed again.
Optional way to show the widgets on the 3D rendering window is to press
the keyboard keys: 'x', 'y' or 'z' respectively to the required plane widget. It
will work only if the mouse is placed over the rendering window.
Widgets on the 3D model (Figure 4.4) play a very important role in an
image data analysis. They allow to show the cross-section of the model in
any of three principle plane directions. The functionality of the widgets is
closely connected to the manipulation of the 2D images and will be described
in more details in the next subsection.
4.2.3 2D images manipulation
According to previous subsection, the widgets on the 3D model allows to cut
the model in order to see the 2D cross-sectional views. Such 'cuts' of the
99
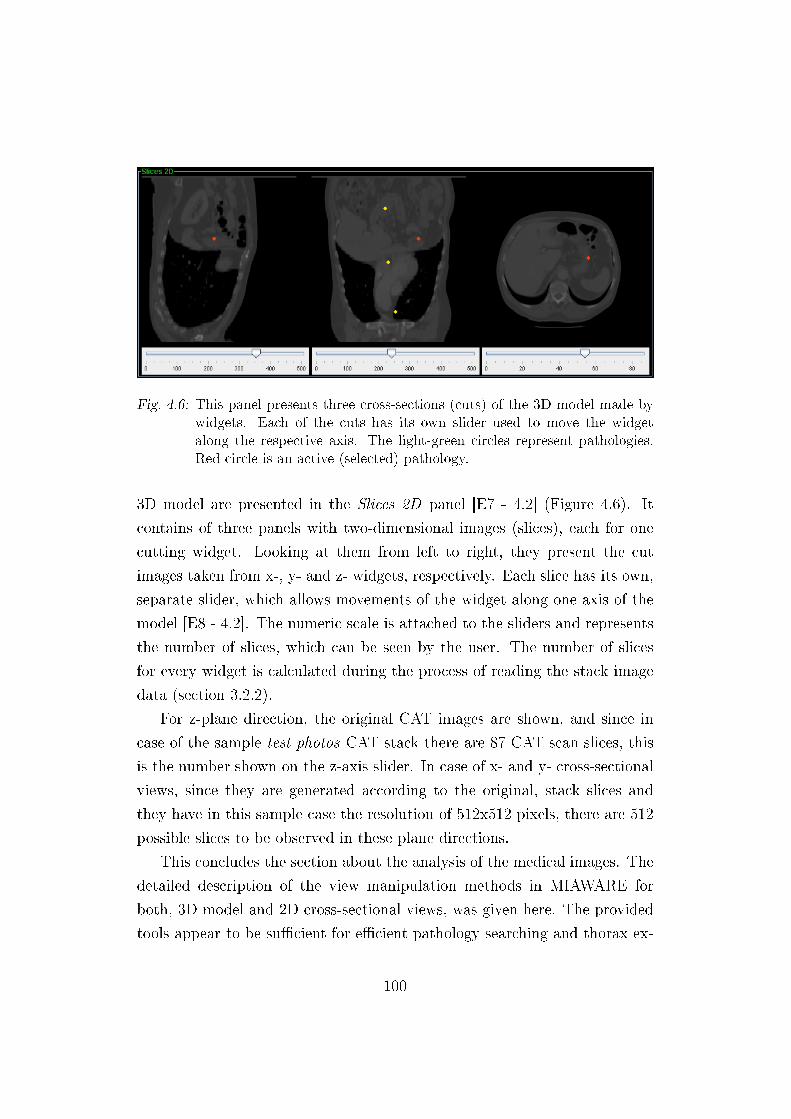
Fig. 4.6: This panel presents three cross-sections (cuts) of the 3D model made bywidgets. Each of the cuts has its own slider used to move the widgetalong the respective axis. The light-green circles represent pathologies.Red circle is an active (selected) pathology.
3D model are presented in the Slices 2D panel [E7 - 4.2] (Figure 4.6). It
contains of three panels with two-dimensional images (slices), each for one
cutting widget. Looking at them from left to right, they present the cut
images taken from x-, y- and z- widgets, respectively. Each slice has its own,
separate slider, which allows movements of the widget along one axis of the
model [E8 - 4.2]. The numeric scale is attached to the sliders and represents
the number of slices, which can be seen by the user. The number of slices
for every widget is calculated during the process of reading the stack image
data (section 3.2.2).
For z-plane direction, the original CAT images are shown, and since in
case of the sample test-photos CAT stack there are 87 CAT scan slices, this
is the number shown on the z-axis slider. In case of x- and y- cross-sectional
views, since they are generated according to the original, stack slices and
they have in this sample case the resolution of 512x512 pixels, there are 512
possible slices to be observed in these plane directions.
This concludes the section about the analysis of the medical images. The
detailed description of the view manipulation methods in MIAWARE for
both, 3D model and 2D cross-sectional views, was given here. The provided
tools appear to be su�cient for e�cient pathology searching and thorax ex-
100
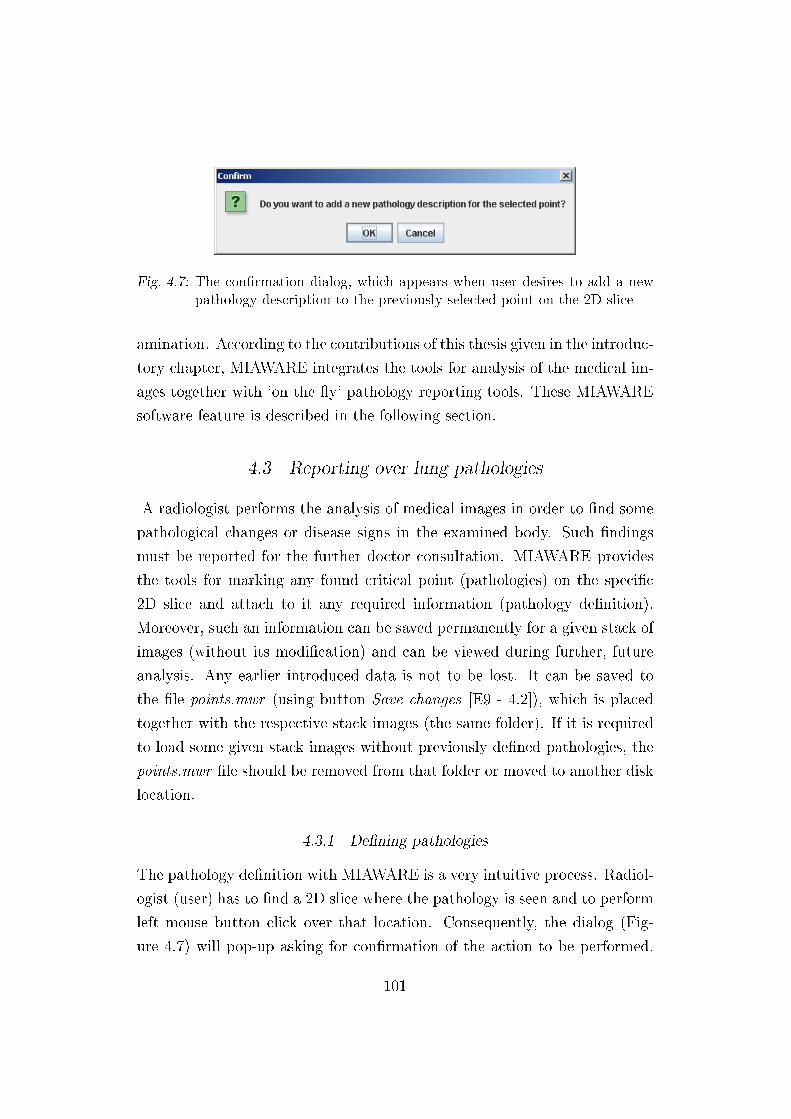
Fig. 4.7: The con�rmation dialog, which appears when user desires to add a newpathology description to the previously selected point on the 2D slice
amination. According to the contributions of this thesis given in the introduc-
tory chapter, MIAWARE integrates the tools for analysis of the medical im-
ages together with `on the �y' pathology reporting tools. These MIAWARE
software feature is described in the following section.
4.3 Reporting over lung pathologies
A radiologist performs the analysis of medical images in order to �nd some
pathological changes or disease signs in the examined body. Such �ndings
must be reported for the further doctor consultation. MIAWARE provides
the tools for marking any found critical point (pathologies) on the speci�c
2D slice and attach to it any required information (pathology de�nition).
Moreover, such an information can be saved permanently for a given stack of
images (without its modi�cation) and can be viewed during further, future
analysis. Any earlier introduced data is not to be lost. It can be saved to
the �le points.mwr (using button Save changes [E9 - 4.2]), which is placed
together with the respective stack images (the same folder). If it is required
to load some given stack images without previously de�ned pathologies, the
points.mwr �le should be removed from that folder or moved to another disk
location.
4.3.1 De�ning pathologies
The pathology de�nition with MIAWARE is a very intuitive process. Radiol-
ogist (user) has to �nd a 2D slice where the pathology is seen and to perform
left mouse button click over that location. Consequently, the dialog (Fig-
ure 4.7) will pop-up asking for con�rmation of the action to be performed.
101
Fig. 4.8: The pathology reporting frame, which provides user with the set of options(comboboxes) to choose in order to de�ne (in a normalized way) thepathology name and its location in the lungs.
If con�rmed, the Pathology information frame will appear (Figure 4.8) and
the description of the selected pathology can be added.
The panel Pathologies [E10 - 4.2] presents a list of all pathologies de�ned,
showing theirs 3D coordinates on the model and a basic description.
Process of adding a pathology description is normalized (in accordance
with the contributions of this thesis). Normalization is achieved by the
`choose-option' manner used for de�nition of the name of the pathology and
its location in examined lungs. It means that, radiologist cannot add any
description in his own words, but he can only follow and choose the options
presented in the subsequent comboboxes. When �nished, a new pathology is
de�ned and saved into program memory.
The pathology appears as a small red sphere on the 3D rendering win-
dow and it is placed in the respective location according to the previously
selected point on the 2D slice. Moreover, all the widgets are placed in the
location of the recently created point (pathology) and consequently, three
2D cross-sectional panels show the added pathology as a red circle. Usu-
102
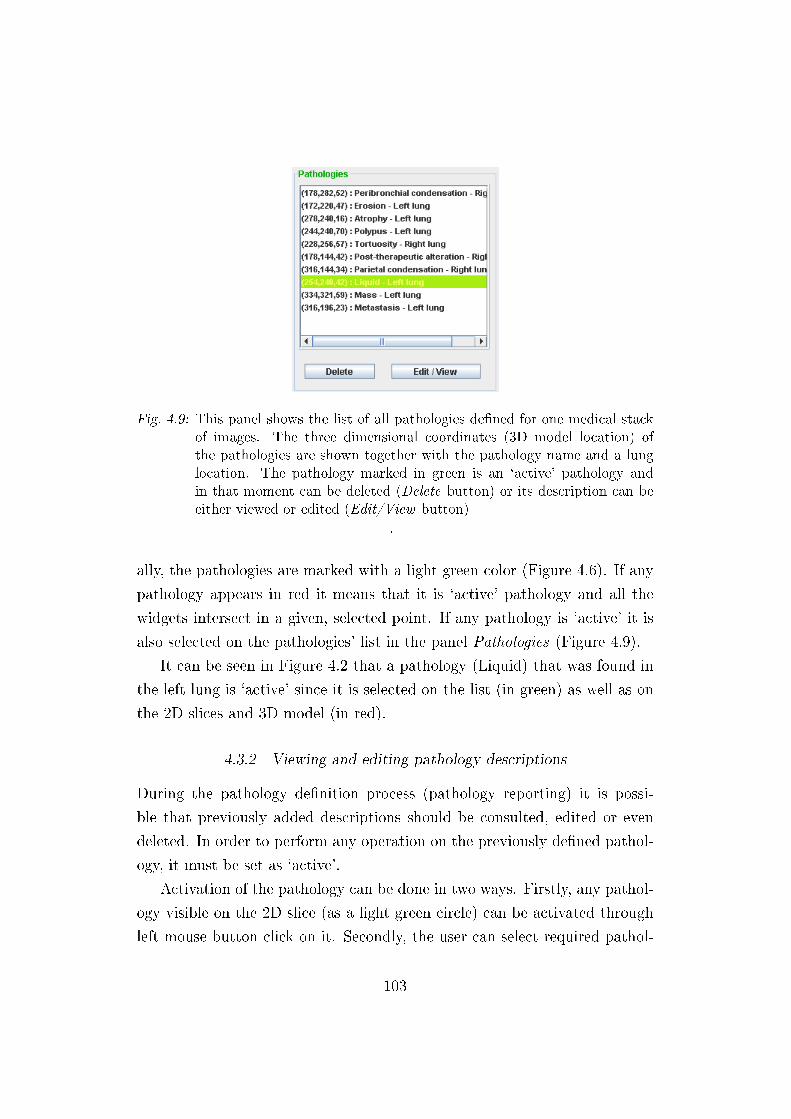
Fig. 4.9: This panel shows the list of all pathologies de�ned for one medical stackof images. The three dimensional coordinates (3D model location) ofthe pathologies are shown together with the pathology name and a lunglocation. The pathology marked in green is an `active' pathology andin that moment can be deleted (Delete button) or its description can beeither viewed or edited (Edit/View button)
.
ally, the pathologies are marked with a light green color (Figure 4.6). If any
pathology appears in red it means that it is `active' pathology and all the
widgets intersect in a given, selected point. If any pathology is `active' it is
also selected on the pathologies' list in the panel Pathologies (Figure 4.9).
It can be seen in Figure 4.2 that a pathology (Liquid) that was found in
the left lung is `active' since it is selected on the list (in green) as well as on
the 2D slices and 3D model (in red).
4.3.2 Viewing and editing pathology descriptions
During the pathology de�nition process (pathology reporting) it is possi-
ble that previously added descriptions should be consulted, edited or even
deleted. In order to perform any operation on the previously de�ned pathol-
ogy, it must be set as `active'.
Activation of the pathology can be done in two ways. Firstly, any pathol-
ogy visible on the 2D slice (as a light green circle) can be activated through
left mouse button click on it. Secondly, the user can select required pathol-
103
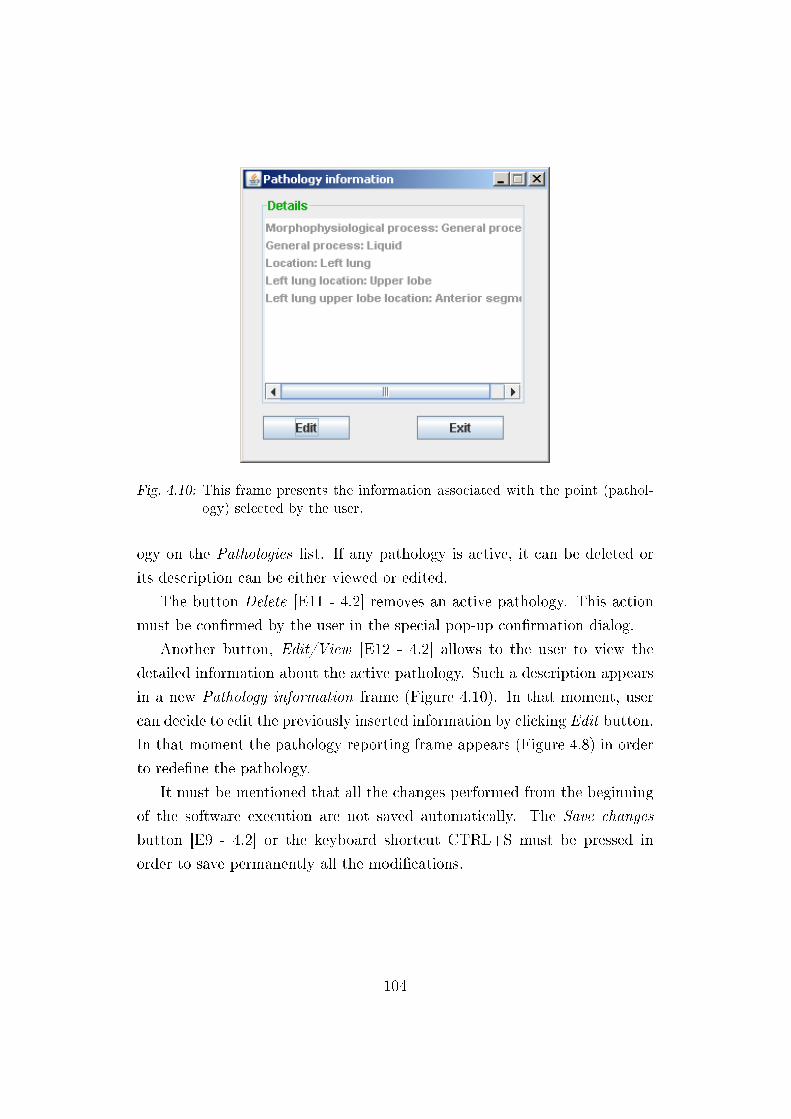
Fig. 4.10: This frame presents the information associated with the point (pathol-ogy) selected by the user.
ogy on the Pathologies list. If any pathology is active, it can be deleted or
its description can be either viewed or edited.
The button Delete [E11 - 4.2] removes an active pathology. This action
must be con�rmed by the user in the special pop-up con�rmation dialog.
Another button, Edit/View [E12 - 4.2] allows to the user to view the
detailed information about the active pathology. Such a description appears
in a new Pathology information frame (Figure 4.10). In that moment, user
can decide to edit the previously inserted information by clicking Edit button.
In that moment the pathology reporting frame appears (Figure 4.8) in order
to rede�ne the pathology.
It must be mentioned that all the changes performed from the beginning
of the software execution are not saved automatically. The Save changes
button [E9 - 4.2] or the keyboard shortcut CTRL+S must be pressed in
order to save permanently all the modi�cations.
104
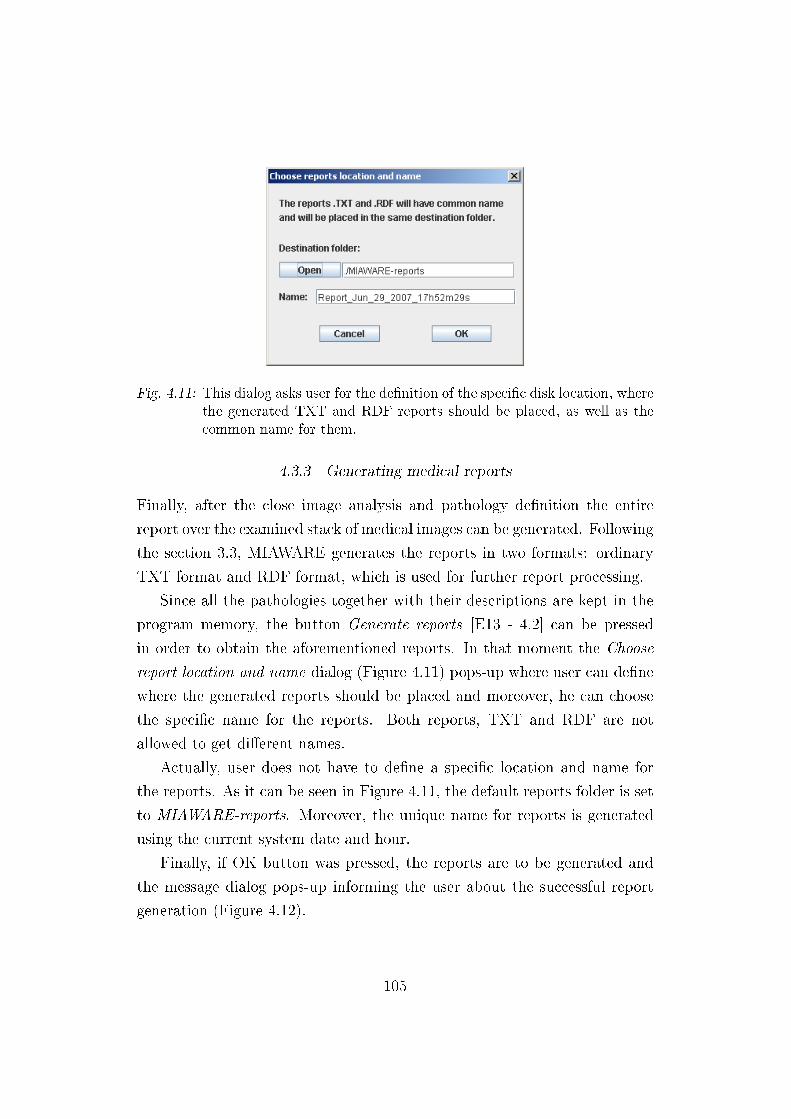
Fig. 4.11: This dialog asks user for the de�nition of the speci�c disk location, wherethe generated TXT and RDF reports should be placed, as well as thecommon name for them.
4.3.3 Generating medical reports
Finally, after the close image analysis and pathology de�nition the entire
report over the examined stack of medical images can be generated. Following
the section 3.3, MIAWARE generates the reports in two formats: ordinary
TXT format and RDF format, which is used for further report processing.
Since all the pathologies together with their descriptions are kept in the
program memory, the button Generate reports [E13 - 4.2] can be pressed
in order to obtain the aforementioned reports. In that moment the Choose
report location and name dialog (Figure 4.11) pops-up where user can de�ne
where the generated reports should be placed and moreover, he can choose
the speci�c name for the reports. Both reports, TXT and RDF are not
allowed to get di�erent names.
Actually, user does not have to de�ne a speci�c location and name for
the reports. As it can be seen in Figure 4.11, the default reports folder is set
to MIAWARE-reports. Moreover, the unique name for reports is generated
using the current system date and hour.
Finally, if OK button was pressed, the reports are to be generated and
the message dialog pops-up informing the user about the successful report
generation (Figure 4.12).
105
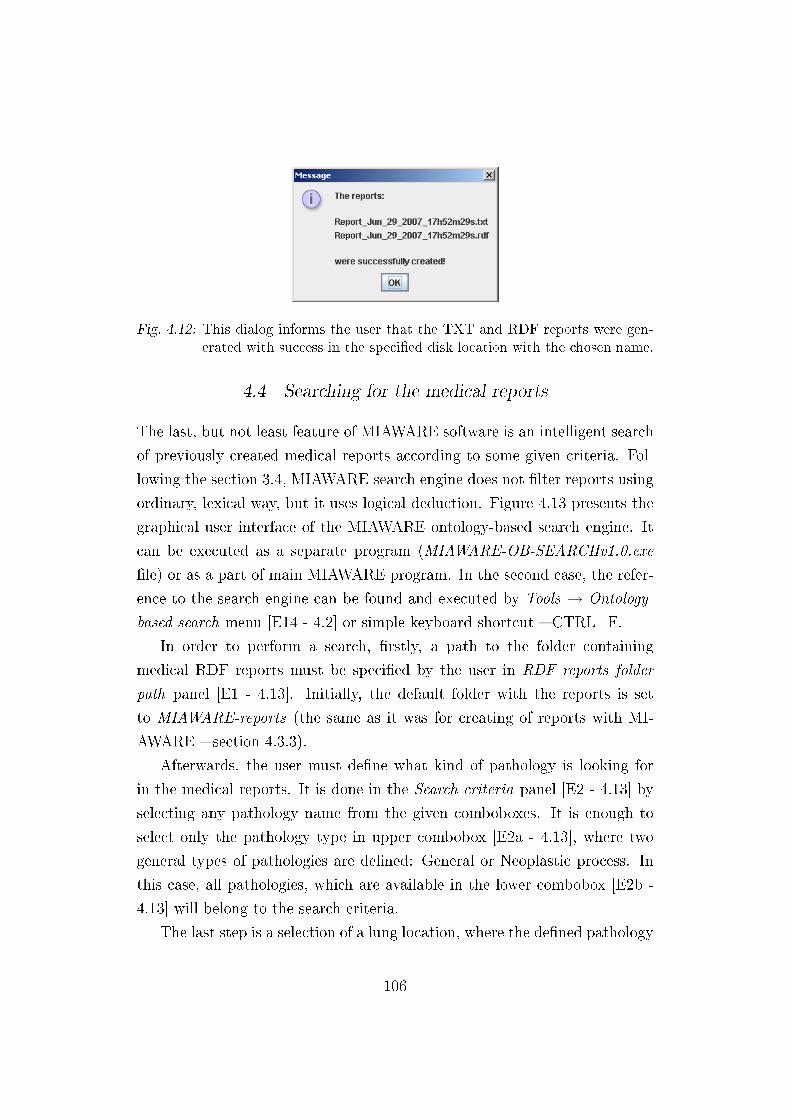
Fig. 4.12: This dialog informs the user that the TXT and RDF reports were gen-erated with success in the speci�ed disk location with the chosen name.
4.4 Searching for the medical reports
The last, but not least feature of MIAWARE software is an intelligent search
of previously created medical reports according to some given criteria. Fol-
lowing the section 3.4, MIAWARE search engine does not �lter reports using
ordinary, lexical way, but it uses logical deduction. Figure 4.13 presents the
graphical user interface of the MIAWARE ontology-based search engine. It
can be executed as a separate program (MIAWARE-OB-SEARCHv1.0.exe
�le) or as a part of main MIAWARE program. In the second case, the refer-
ence to the search engine can be found and executed by Tools → Ontology-
based search menu [E14 - 4.2] or simple keyboard shortcut � CTRL+F.
In order to perform a search, �rstly, a path to the folder containing
medical RDF reports must be speci�ed by the user in RDF reports folder
path panel [E1 - 4.13]. Initially, the default folder with the reports is set
to MIAWARE-reports (the same as it was for creating of reports with MI-
AWARE � section 4.3.3).
Afterwards, the user must de�ne what kind of pathology is looking for
in the medical reports. It is done in the Search criteria panel [E2 - 4.13] by
selecting any pathology name from the given comboboxes. It is enough to
select only the pathology type in upper combobox [E2a - 4.13], where two
general types of pathologies are de�ned: General or Neoplastic process. In
this case, all pathologies, which are available in the lower combobox [E2b -
4.13] will belong to the search criteria.
The last step is a selection of a lung location, where the de�ned pathology
106
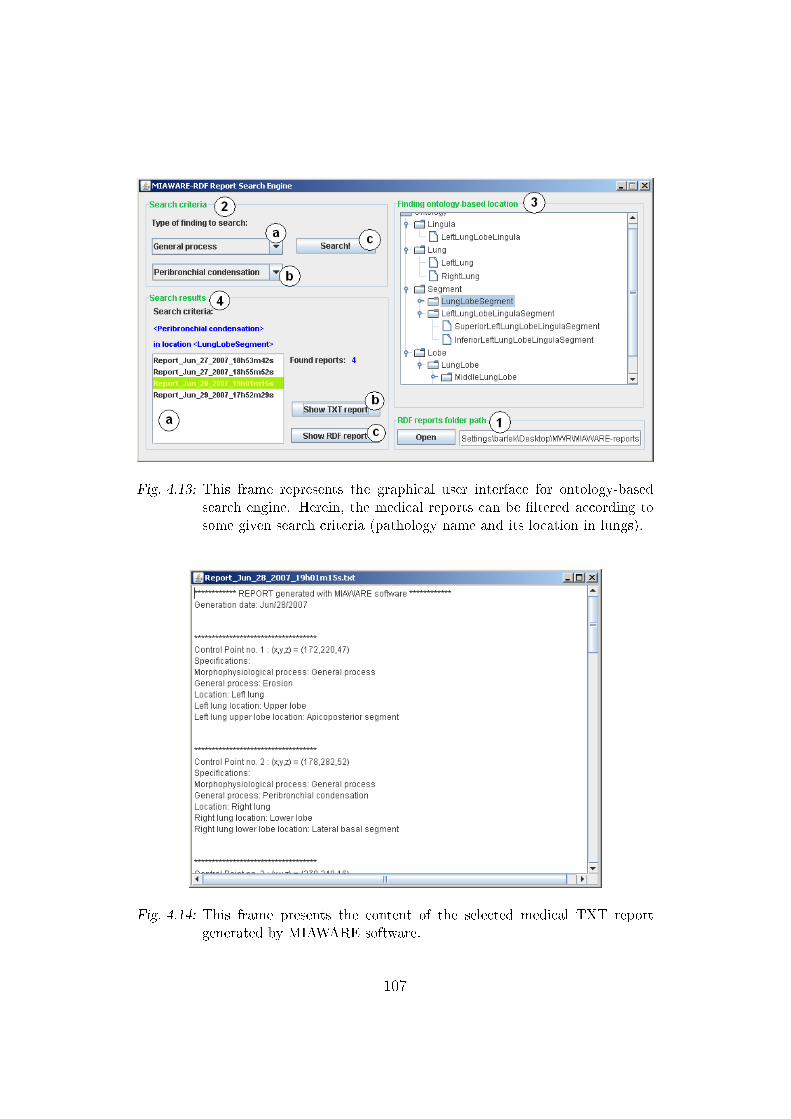
Fig. 4.13: This frame represents the graphical user interface for ontology-basedsearch engine. Herein, the medical reports can be �ltered according tosome given search criteria (pathology name and its location in lungs).
Fig. 4.14: This frame presents the content of the selected medical TXT reportgenerated by MIAWARE software.
107
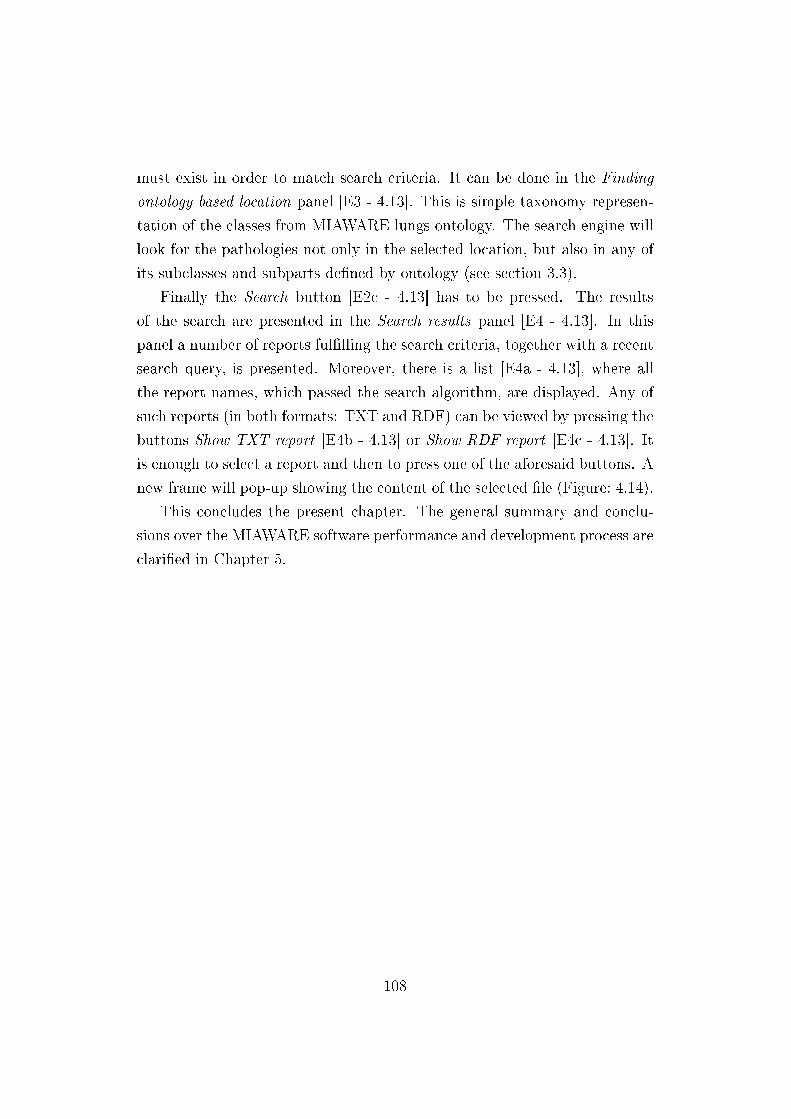
must exist in order to match search criteria. It can be done in the Finding
ontology-based location panel [E3 - 4.13]. This is simple taxonomy represen-
tation of the classes from MIAWARE lungs ontology. The search engine will
look for the pathologies not only in the selected location, but also in any of
its subclasses and subparts de�ned by ontology (see section 3.3).
Finally the Search button [E2c - 4.13] has to be pressed. The results
of the search are presented in the Search results panel [E4 - 4.13]. In this
panel a number of reports ful�lling the search criteria, together with a recent
search query, is presented. Moreover, there is a list [E4a - 4.13], where all
the report names, which passed the search algorithm, are displayed. Any of
such reports (in both formats: TXT and RDF) can be viewed by pressing the
buttons Show TXT report [E4b - 4.13] or Show RDF report [E4c - 4.13]. It
is enough to select a report and then to press one of the aforesaid buttons. A
new frame will pop-up showing the content of the selected �le (Figure: 4.14).
This concludes the present chapter. The general summary and conclu-
sions over the MIAWARE software performance and development process are
clari�ed in Chapter 5.
108
5. CONCLUSIONS
This thesis describes a medical software, which can be used by radiologists
and doctors during the analysis of the computed-axial tomography (CAT)
scan images. MIAWARE application allows to visualize radiological images
as a three-dimensional model generated from the CAT scan image stack.
Moreover, two-dimensional images (cuts) of the 3D model are easily gener-
ated in order to facilitate the medical analysis. The obtained model can be
easily manipulated, viewed at any angle and �nally resliced by the cutting
planes in the direction of any axis of the 3D coordinate system.
MIAWARE contributes also to the lungs pathology de�nition and its fur-
ther reporting. It provides an intuitive way for marking the pathological
changes on the obtained images (slices) and reporting its properties and char-
acteristics. The characteristic feature of MIAWARE reporting scheme is seen
through the fact that it does not permit radiologist to describe remarks in
his own words. A medical vocabulary database is provided and consequently,
pathologies can be described using only such vocabulary set. As a result, the
normalized reports are obtained as a �nal output, what signi�cantly improve
their further computer processing. In my opinion, normalization of the med-
ical reports, can also improve the work between radiologists and doctors. A
doctor will be able to understand faster and better the radiologist's remarks
if it is written in the normalized language, what can lead to better diagnoses
and faster disease recognition.
The last MIAWARE quality is represented by the intelligent search mod-
ule for MIAWARE medical reports, developed on the basis of the ontological
engineering. Firstly, such search engine allows rapid �ltering of the medical
reports according to the pathologies de�ned in there. After a detailed lungs
structure analysis, a hierarchic structure of their parts was prepared and
developed (ontology). Providing MIAWARE search engine with the knowl-
edge about the parts relationship in the lungs, it is able to deduce internal
elements of the speci�ed lung part and to perform report searching of the
pathologies not only in the determined lung location, but also in its sub-
parts. This can actually be described as a logical searching of pathologies in
the medical reports.
The development of the aforementioned MIAWARE features was a time
consuming process with many integration boundaries and implementation
problems encountered. Fortunately, thanks to the World Wide Web com-
munities together with the bibliographical positions, it was possible to �nish
successfully the presented project and reach all the objectives circumscribed
at the beginning. I must admit that this work and the �nal performance of
the MIAWARE project gives me lot of inner satisfaction and contentment. I
have exercised a lot of di�erent techniques applicable in that practical pro-
gramming project and every subsequent problem, when solved, transformed
into a valuable experience for the future.
Finally, I would like to express my hope and willingness for further MI-
AWARE software development in order to contribute, more and more sig-
ni�cantly, to the medical software engineering area. After the research and
development of MIAWARE project, I feel more dedicated to the medical area
and I am considering seriously the continuation of my professional career ex-
actly in that �eld.
110
BIBLIOGRAPHY
[1] CodeProject. The code project webpage, 2007. http://www.
codeproject.com/.
[2] Harvey M. Deitel. Java: How to Program. Prentice Hall Professional
Technical Reference, 2002.
[3] Maureen Donnelly, Thomas Bittner, and Cornelius Rosse. A formal
theory for spatial representation and reasoning in biomedical ontologies.
2006.
[4] Nick Drummond. Owlviz - ontology visualization tool webpage, 2007.
http://www.co-ode.org/.
[5] Asuncion Gomez-Perez, Oscar Corcho, and Mariano Fernandez-Lopez.
Ontological Engineering : with examples from the areas of Knowledge
Management, e-Commerce and the Semantic Web. First Edition (Ad-
vanced Information and Knowledge Processing). Springer, July 2004.
[6] Structural Informatics Group. Foundational model of anatomy spec-
i�cations - webpage, 2007. http://sig.biostr.washington.edu/
projects/fm/AboutFM.html.
[7] Nicola Guarino and Christopher A. Welty. A formal ontology of prop-
erties. 2000.
[8] Nicola Guarino and Christopher A. Welty. Evaluating ontological deci-
sions with ONTOCLEAN. 2002.
[9] Nicola Guarino and Christopher A. Welty. An overview of ontoclean.
2004.
[10] Nicola Guarino, Christopher A. Welty, and Christopher Partridge. To-
wards a methodology for ontology based model engineering. 2000.
[11] Hewlett-Packard. Jena framework webpage, 2007. http://jena.
sourceforge.net/.
[12] Matthew Horridge. A Practical Guide To Building OWL Ontologies
With The Protege-OWL Plugin. University of Manchester, 1 edition,
June November 2004.
[13] HowStu�Works. How mri works webpage, 2007. http://www.
howstuffworks.com/mri7.htm.
[14] Southern Health Diagnostic Imaging. Mri scanners, 2007. http://www.
southernhealth.org.au/imaging/mri_mmc_equip.htm.
[15] Imaginis. Cat work principles, 2007. http://www.imaginis.com/
ct-scan/how_ct.asp.
[16] Stanford Medical Informatics. Protégé webpage, 2007. http://
protege.stanford.edu/.
[17] Kitware. The VTK User's Guide. Kitware, 2006.
[18] Kitware. Cmake web page, 2007. http://www.cmake.org.
[19] Olivier Holger Knublauch. Weaving the biomedical semantic web with
the protege owl plugin. 2004.
[20] Grzegorz Kowal. Launch4j webpage, 2007. http://launch4j.
sourceforge.net/.
[21] Williams & Wilkins Lippincott. Representation of human lungs struc-
ture, 2007. http://connection.lww.com/products/smeltzer9e/
images/figurelarge19-4.gif.
[22] Ken Martin, Will Schroeder, and Bill Lorensen. Vtk web page, 2007.
http://www.vtk.org.
112
[23] Deborah L. McGuinness and Frank van Harmelen. Owl web ontol-
ogy language overview (w3c) webpage, 2007. http://www.w3.org/TR/
owl-features/.
[24] On Topic Media. Sport talk - mri knee reconstruction, 2007. http:
//www.sporttalk.com.au/knee-reconstruction-mri/.
[25] MedicineNet. Medicinenet.com webpage, 2007. http://www.
medicinenet.com/.
[26] José L.V. Mejino Jr, Augusto V. Agoncillo, Kurt L. Rickard, and Cor-
nelius Rosse. Representing complexity in part-whole relationships within
the foundational model of anatomy. 2003.
[27] Joshua Michael, José L.V. Mejino Jr, and Cornelius Rosse. The role of
de�nitions in biomedical concept representation. 2001.
[28] Sun Microsystems. Java webpage, 2007. http://java.sun.com.
[29] Sun Microsystems. Sun's java tutorial, 2007. http://java.sun.com/
docs/books/tutorial/.
[30] NetDoctor. Netdoctor.co.uk - webpage, 2007. http://www.netdoctor.
co.uk/.
[31] National Institutes of Health. Imagej webpage, 2007. http://rsb.
info.nih.gov/ij/.
[32] Radiological Society of North America. Rsna - radlex term browser
webpage, 2007. http://radlex.com/radlex/.
[33] GmbH & Co. Racer Systems. Racer ontology reasoner webpage, 2007.
http://www.racer-systems.com/.
[34] Konzept Design Realisierung Rilogistic. Rilogistic webpage, 2007. http:
//www.rilogistic.com/files/.
[35] Rod R. Seeley, Trent D. Stephens, and Philip Tate. Anatomy and Phys-
iology. McGraw-Hill Higher Education, 2005.
113
[36] Nicholas M. Short Sr. Nasa remote sensing tutorial, 2007. http://rst.
gsfc.nasa.gov/Intro/Part2_26c.html.
[37] Michael Sintek. Ontoviz - ontology visualization tool webpage, 2007.
http://protege.cim3.net/cgi-bin/wiki.pl?OntoViz.
[38] Barry Smith. State university of new york at bu�alo - department of
philosophy webpage, 2007. http://ontology.buffalo.edu/.
[39] SourceForge.net. Imagej plugins webpage - java vtk examples, 2007.
http://ij-plugins.sourceforge.net/vtk-examples/index.html.
[40] Wikimedia-Foundation. Description logic - wikipedia webpage, 2007.
http://en.wikipedia.org/wiki/Description_logic.
[41] Wikimedia-Foundation. Ontology in computer science (de�nition) -
wikipedia webpage, 2007. http://en.wikipedia.org/wiki/Ontology_
(computer_science).
[42] Wikimedia-Foundation. Theory of forms - plato - wikipedia webpage,
2007. http://en.wikipedia.org/wiki/Theory_of_forms.
114

APPENDIX

A. HOW TO BUILD VTK ON WINDOWS WITH JAVA
SUPPORT
ABSTRACT
I have decided to write this document to ease up to the other users the process
of (sometimes painful and frustrating) building the VTK on Windows with
Java support. The date of creation of this document: October 2, 2006. Of
course, this is only mine experience, so unfortunately I can't assure and give
any warranty to anybody that all of my remarks given here are correct, but
for sure, such con�guration and such steps resulted that the VTK is working
correctly with Java on my computer.
The details refer to my own experience with building VTK-5.0.2 source on
Windows XP Service Pack 2, in order to use it with Sun's Java Development
Kit 1.5.0_08 (JDK 1.5.0_08) support on Eclipse SDK 3.2 environment.
A.1 Required downloads and software installation
A.1.1 VTK source download
The VTK source we can download from the VTK o�cial site [22] . Then we
proceed by entering the Download sub page and downloading the latest re-
lease of VTK for Windows (in my case it was vtk-5.0.2.zip). BE CAREFUL!!!
If you want to use VTK with Java support you must download the source,
not Windows installer. We can enable the Java wrapping only during the
manual compilation of VTK - with Windows Installer it's impossible.
It is very important. You must unpack your vtk-[version].zip
�le on the NTFS partition. With FAT32 I had some serious errors
during compilation process
A.1.2 CMake download and install
To compile VTK I was using CMake software. CMake controls the software
compilation process using simple platform and compiler independent con�g-
uration �les. For Microsoft and Borland compilers there are pre-compiled
binary. You can download the software from the CMake's webpage [18]. In
my case, I got the most recent version (2.4).
Install CMake soft on the NTFS partition also (I'd recommend
the same partition as the VTK). I suppose it could not work on
FAT32.
A.1.3 C++ compiler installation
I used the Microsoft Visual Studio 2005 compiler. I know that it can be also
Borland but I didn't try it.
A.1.4 Java SDK download and installation
You can download it from the Sun's webpage: http://java.sun.com/. It
MUST be Java Development Kit (JDK) not Java Runtime Environment
(JRE)!! Then there are various options to install it. You can enter the Sun's
webpage, follow the link Java SE in the Download area and then look for
118
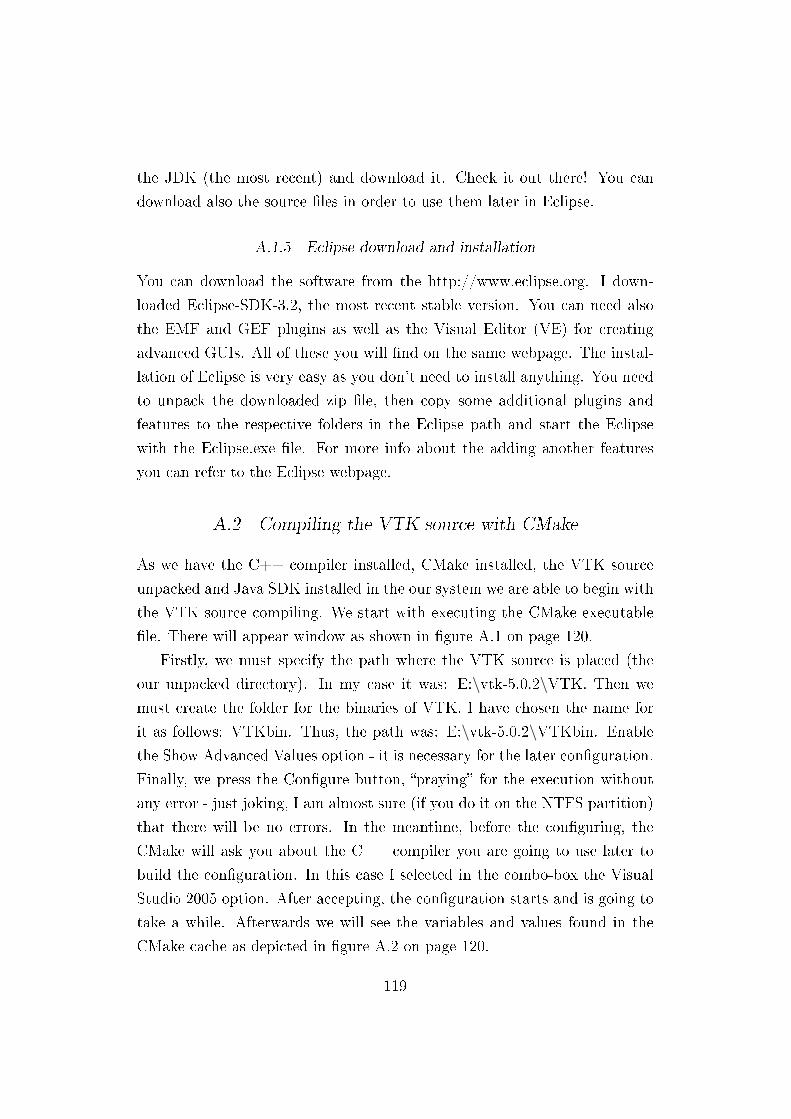
the JDK (the most recent) and download it. Check it out there! You can
download also the source �les in order to use them later in Eclipse.
A.1.5 Eclipse download and installation
You can download the software from the http://www.eclipse.org. I down-
loaded Eclipse-SDK-3.2, the most recent stable version. You can need also
the EMF and GEF plugins as well as the Visual Editor (VE) for creating
advanced GUIs. All of these you will �nd on the same webpage. The instal-
lation of Eclipse is very easy as you don't need to install anything. You need
to unpack the downloaded zip �le, then copy some additional plugins and
features to the respective folders in the Eclipse path and start the Eclipse
with the Eclipse.exe �le. For more info about the adding another features
you can refer to the Eclipse webpage.
A.2 Compiling the VTK source with CMake
As we have the C++ compiler installed, CMake installed, the VTK source
unpacked and Java SDK installed in the our system we are able to begin with
the VTK source compiling. We start with executing the CMake executable
�le. There will appear window as shown in �gure A.1 on page 120.
Firstly, we must specify the path where the VTK source is placed (the
our unpacked directory). In my case it was: E:\vtk-5.0.2\VTK. Then we
must create the folder for the binaries of VTK. I have chosen the name for
it as follows: VTKbin. Thus, the path was: E:\vtk-5.0.2\VTKbin. Enable
the Show Advanced Values option - it is necessary for the later con�guration.
Finally, we press the Con�gure button, �praying� for the execution without
any error - just joking, I am almost sure (if you do it on the NTFS partition)
that there will be no errors. In the meantime, before the con�guring, the
CMake will ask you about the C++ compiler you are going to use later to
build the con�guration. In this case I selected in the combo-box the Visual
Studio 2005 option. After accepting, the con�guration starts and is going to
take a while. Afterwards we will see the variables and values found in the
CMake cache as depicted in �gure A.2 on page 120.
119
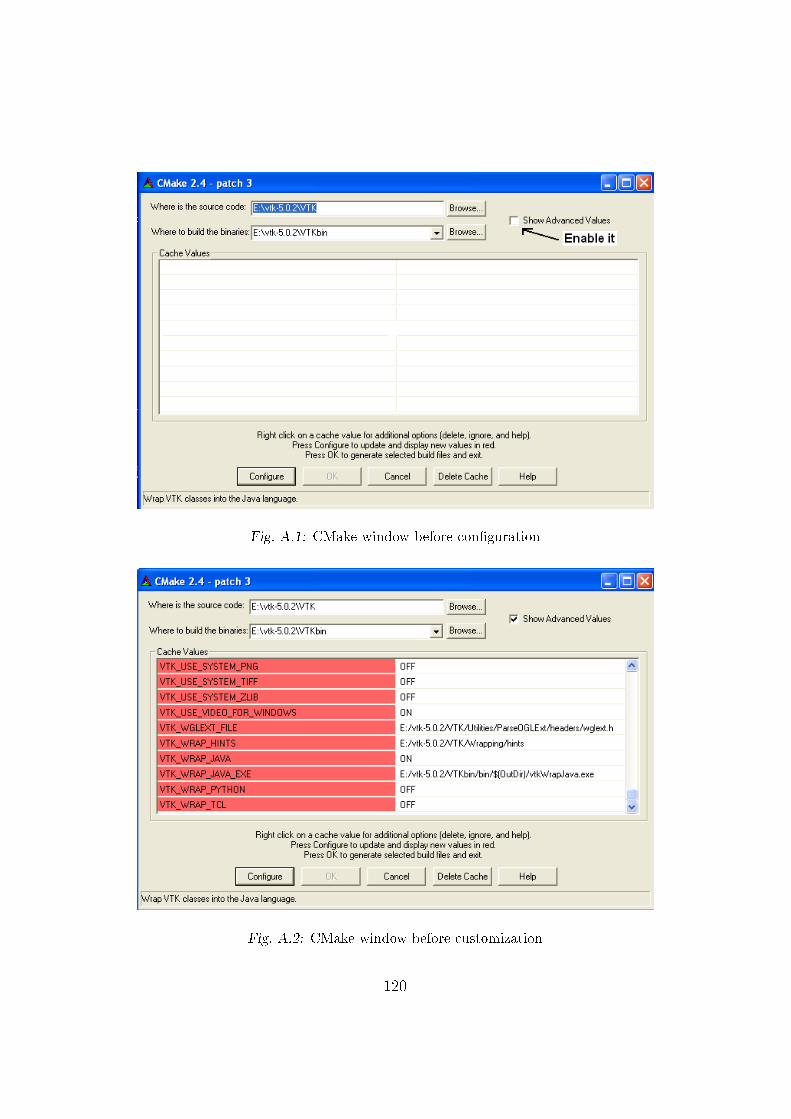
Fig. A.1: CMake window before con�guration
Fig. A.2: CMake window before customization
120
Now, we are customizing our build. In order to compile successfully
you must enable (set to ON) the following options: VTK_WRAP_JAVA,
BUILD_SHARED_LIBS, and VTK_USE_RENDERING. These are the
options, which are almost always necessary. Another time, you can always
open CMake and enable more options if you require.
After enabling and disabling all the options you consider as necessary, you
must press Con�gure button one more time (or more times). You must do
it until you reach that all the variables and values are not any longer in red.
Then you can generate selected build �les by pressing the OK button. This
will cause CMake to write out the build �les for the build selected. After
that, the CMake will exit.
In case of any error appearance (at any moment), I recommend you not
to carry on with the next step of this tutorial, but to repeat all the actions
described here. It is easier to repeat it than to be disappointed afterwards
(the next step takes a longer while).
A.3 Building the con�guration in C++ compiler (Microsoft
Visual Studio 2005)
Now, we must build the entire con�guration in the C++ compiler. We do
it in the following manner. We must �nd the location in Windows of our
already created binaries. Open this folder in a normal Windows window. In
my case the path was: E:\vtk-5.0.2\VTKbin. We are there looking for the
project called ALL_BUILD. In my case it was the �le ALL_BUILD.vcproj.
Double-click then and you will simultaneously enter to your's earlier chosen
C++ compiler environment (in my case - the Visual Studio 2005) as depicted
on the �gure A.3 on page 122.
Single-click on the Solution VTK (look at the screenshot above) and then
choose the option Build�Build Solution. We can de�ne before the Active
Con�guration of the build. I used the default one (Debug) but there are
also Release, MinsizeRel and RelWithDebInfo modes. The build is the long-
time process. At the end of it we expect to not to have any error and
afterwards usually all the libraries and executables are located in the VTK
121
Fig. A.3: Visual Studio 2005 screenshot
122
binary directory speci�ed before (E:\vtk-5.0.2\VTKbin). Unfortunately, youwill encounter some errors after the build. In my case there were problems
with the build of the Java �les. The compiler didn't compile any of my *.java
�les. In this apparently bad situation, it is the great information if you have
only such the errors. It is very easy to repair it. You must only compile
all the Java classes with any Java compiler. I did it with Eclipse, but you
can do it even with the Windows Command Line. In the next point I will
describe how I compiled it in Eclipse and how to start the �rst Java-VTK
application.
The very important thing you must do yet is to edit your PATH envi-
ronment variable. You turned on the option BUILD_SHARED_LIBS thus
you must let Windows know where to �nd the DLLs. I used the Debug
con�guration thus I added to the PATH variable the following path: E:\vtk-5.0.2\VTKbin\bin\debug. It is recommended that you add this entry in the
beginning of the PATH de�nition.
Moreover, as the Java JDK and VTK has been installed, you need to
set your CLASSPATH environment variable to include the VTK classes.
You must include vtk\java directory. In my case the path was: E:\vtk-5.0.2\VTKbin\java\.
A.4 Con�guration of Java environment in Eclipse
You can build the Java classes in very basic and manual manner. Firstly,
you have to localize them. In my case I found them in the path: E:\vtk-5.0.2\VTKbin\java. Inside this folder there is another folder vtk which con-
tains all the Java source classes (*.java). You only need to compile them to
obtain the *.class �les. The vtk folder is like the Java package. Thus, you
must create a new project in Eclipse (File� New� Project� Java Project).
The name of the project is not important (in my case it was New) as you are
going to use it only to compile the classes. After creating the new, empty
project in Eclipse, add the source folder src. Then copy (do not cut it bet-
ter) the whole folder vtk from the java folder (E:\vtk-5.0.2\VTKbin\java)to the newly created project in the Eclipse workspace (in my case the path
123
was: D:\Program Files\eclipse-SDK-3.2\eclipse\workspace\New\src). Thencome back to Eclipse environment, right-click on the New project and choose
the Refresh option. Afterwards, you will have all your classes built to the
*.class �les in your Eclipse project path, in the folder bin. Now you must
copy all the *.class �les to the your vtk folder in the binaries VTK (E:\vtk-5.0.2\VTKbin\java\vtk). Now, you can create the *.zip archive, packing the
vtk folder into it. It will contain both, source and binary �les. In my case I
created vtk.zip archive.See compact version of steps:
1. Unzip your vtk.zip package
2. Create in Eclipse empty project (any name)
3. Add to this project in Eclipse, the Source folder called src
4. Copy the unpacked vtk folder to the src folder
5. Click right on the project in Eclipse and press Refresh (Eclipse builds
the �les automatically to folder bin/vtk in Eclipse)
6. There can be one error in this package (for VTKJavaWrapped �le) so
delete it
7. Copy all the �les from bin/vtk to src/vtk replacing all the �les with
the same name
8. Zip the vtk package from /src/vtk path to the �le vtk.zip
9. Include this package to any VTK project and...
SUCCESS, it should work!
Now, you can run your �rst Java - VTK application. Let's say you want
to run the Cone.java example given by the VTK. You can �nd it in the VTK
folder, which in my case was:
E:\vtk-5.0.2\VTK\Examples\Tutorial\Step1\Java
124
Therefore, create the new project in Eclipse called Cone. Then add the
source folder as earlier and copy the Cone.java into it. Refresh the project
under Eclipse. Now, you will need to include the vtk.zip archive containing
all the VTK classes into the project. Just right-click on the project, choose
Properties and then in Java Build Path press Add External Jar button. Find
you vtk.zip archive and accept. Now you can compile and run your �rst Java-
VTK application without any problem.
A.5 Summary
You can �nd more information about installing VTK on UNIX from webpage
`Building VTK on Linux with Java Support':
http://www.duke.edu/∼ iwd/howto/VTK-Linux-Java_HOWTO.html
Any Java with VTK examples you can �nd on [39]. Some addition to the
previous ones: the 3D data viewer based on VTK and Java called CASSAN-
DRA, look at:
http://dev.artenum.com/projects/cassandra
I would be very grateful with any feedback and comments. Please do not
hesitate to send me an e-mail ([email protected]). With your sugges-
tions this manual can be better and better. Send me also some useful links
connected with VTK. Thanks in advance.
125

B. ARTICLE ABOUT MIAWARE SOFTWARE SUBMITTED
TO BIOSTEC 2008 - INTERNATIONAL JOINT
CONFERENCE ON BIOMEDICAL ENGINEERING
SYSTEMS AND TECHNOLOGIES
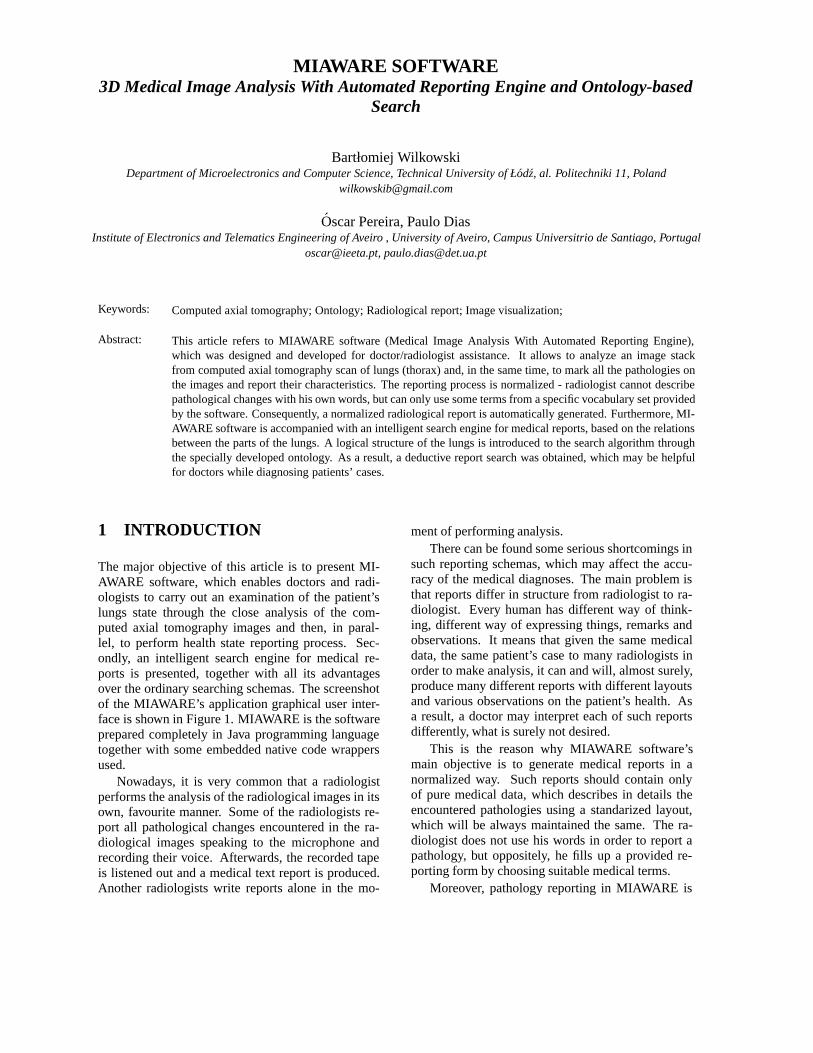
MIAWARE SOFTWARE3D Medical Image Analysis With Automated Reporting Engine and Ontology-based
Search
Bartłomiej WilkowskiDepartment of Microelectronics and Computer Science, Technical University of Łodz, al. Politechniki 11, Poland
Oscar Pereira, Paulo DiasInstitute of Electronics and Telematics Engineering of Aveiro , University of Aveiro, Campus Universitrio de Santiago, Portugal
[email protected], [email protected]
Keywords: Computed axial tomography; Ontology; Radiological report; Image visualization;
Abstract: This article refers to MIAWARE software (Medical Image Analysis With Automated Reporting Engine),which was designed and developed for doctor/radiologist assistance. It allows to analyze an image stackfrom computed axial tomography scan of lungs (thorax) and, in the same time, to mark all the pathologies onthe images and report their characteristics. The reporting process is normalized - radiologist cannot describepathological changes with his own words, but can only use some terms from a specific vocabulary set providedby the software. Consequently, a normalized radiological report is automatically generated. Furthermore, MI-AWARE software is accompanied with an intelligent search engine for medical reports, based on the relationsbetween the parts of the lungs. A logical structure of the lungs is introduced to the search algorithm throughthe specially developed ontology. As a result, a deductive report search was obtained, which may be helpfulfor doctors while diagnosing patients’ cases.
1 INTRODUCTION
The major objective of this article is to present MI-AWARE software, which enables doctors and radi-ologists to carry out an examination of the patient’slungs state through the close analysis of the com-puted axial tomography images and then, in paral-lel, to perform health state reporting process. Sec-ondly, an intelligent search engine for medical re-ports is presented, together with all its advantagesover the ordinary searching schemas. The screenshotof the MIAWARE’s application graphical user inter-face is shown in Figure 1. MIAWARE is the softwareprepared completely in Java programming languagetogether with some embedded native code wrappersused.
Nowadays, it is very common that a radiologistperforms the analysis of the radiological images in itsown, favourite manner. Some of the radiologists re-port all pathological changes encountered in the ra-diological images speaking to the microphone andrecording their voice. Afterwards, the recorded tapeis listened out and a medical text report is produced.Another radiologists write reports alone in the mo-
ment of performing analysis.There can be found some serious shortcomings in
such reporting schemas, which may affect the accu-racy of the medical diagnoses. The main problem isthat reports differ in structure from radiologist to ra-diologist. Every human has different way of think-ing, different way of expressing things, remarks andobservations. It means that given the same medicaldata, the same patient’s case to many radiologists inorder to make analysis, it can and will, almost surely,produce many different reports with different layoutsand various observations on the patient’s health. Asa result, a doctor may interpret each of such reportsdifferently, what is surely not desired.
This is the reason why MIAWARE software’smain objective is to generate medical reports in anormalized way. Such reports should contain onlyof pure medical data, which describes in details theencountered pathologies using a standarized layout,which will be always maintained the same. The ra-diologist does not use his words in order to report apathology, but oppositely, he fills up a provided re-porting form by choosing suitable medical terms.
Moreover, pathology reporting in MIAWARE is
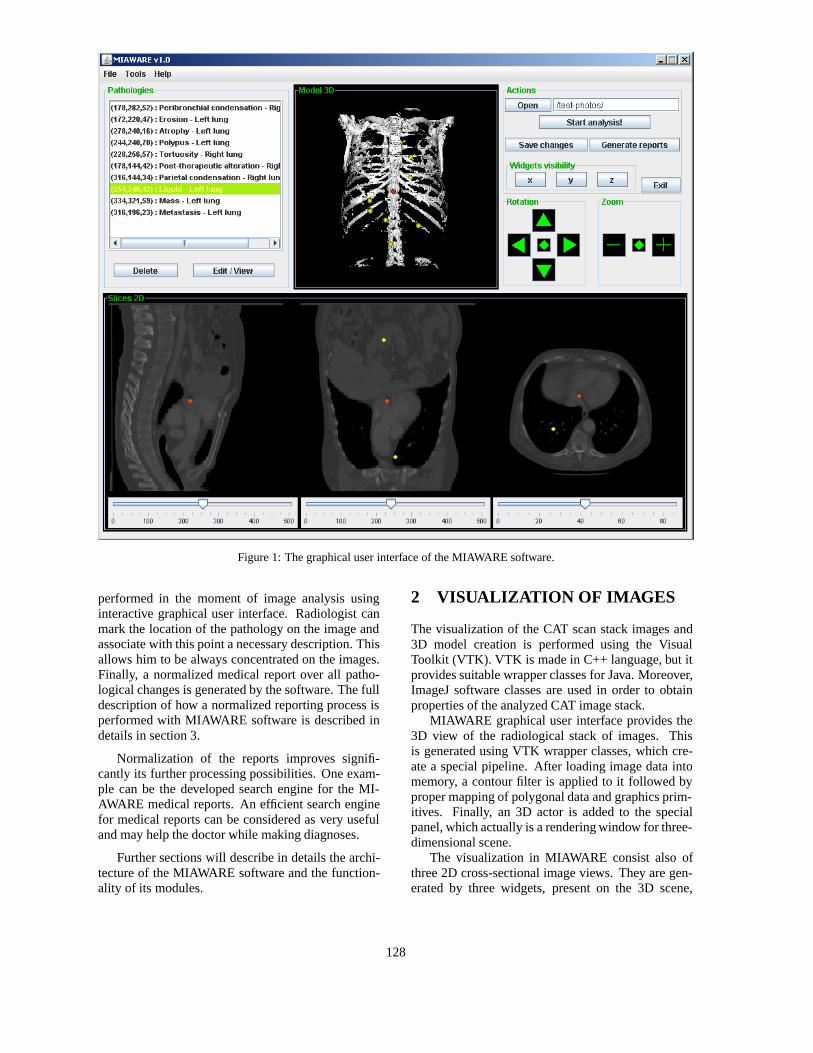
Figure 1: The graphical user interface of the MIAWARE software.
performed in the moment of image analysis usinginteractive graphical user interface. Radiologist canmark the location of the pathology on the image andassociate with this point a necessary description. Thisallows him to be always concentrated on the images.Finally, a normalized medical report over all patho-logical changes is generated by the software. The fulldescription of how a normalized reporting process isperformed with MIAWARE software is described indetails in section 3.
Normalization of the reports improves signifi-cantly its further processing possibilities. One exam-ple can be the developed search engine for the MI-AWARE medical reports. An efficient search enginefor medical reports can be considered as very usefuland may help the doctor while making diagnoses.
Further sections will describe in details the archi-tecture of the MIAWARE software and the function-ality of its modules.
2 VISUALIZATION OF IMAGES
The visualization of the CAT scan stack images and3D model creation is performed using the VisualToolkit (VTK). VTK is made in C++ language, but itprovides suitable wrapper classes for Java. Moreover,ImageJ software classes are used in order to obtainproperties of the analyzed CAT image stack.
MIAWARE graphical user interface provides the3D view of the radiological stack of images. Thisis generated using VTK wrapper classes, which cre-ate a special pipeline. After loading image data intomemory, a contour filter is applied to it followed byproper mapping of polygonal data and graphics prim-itives. Finally, an 3D actor is added to the specialpanel, which actually is a rendering window for three-dimensional scene.
The visualization in MIAWARE consist also ofthree 2D cross-sectional image views. They are gen-erated by three widgets, present on the 3D scene,
128
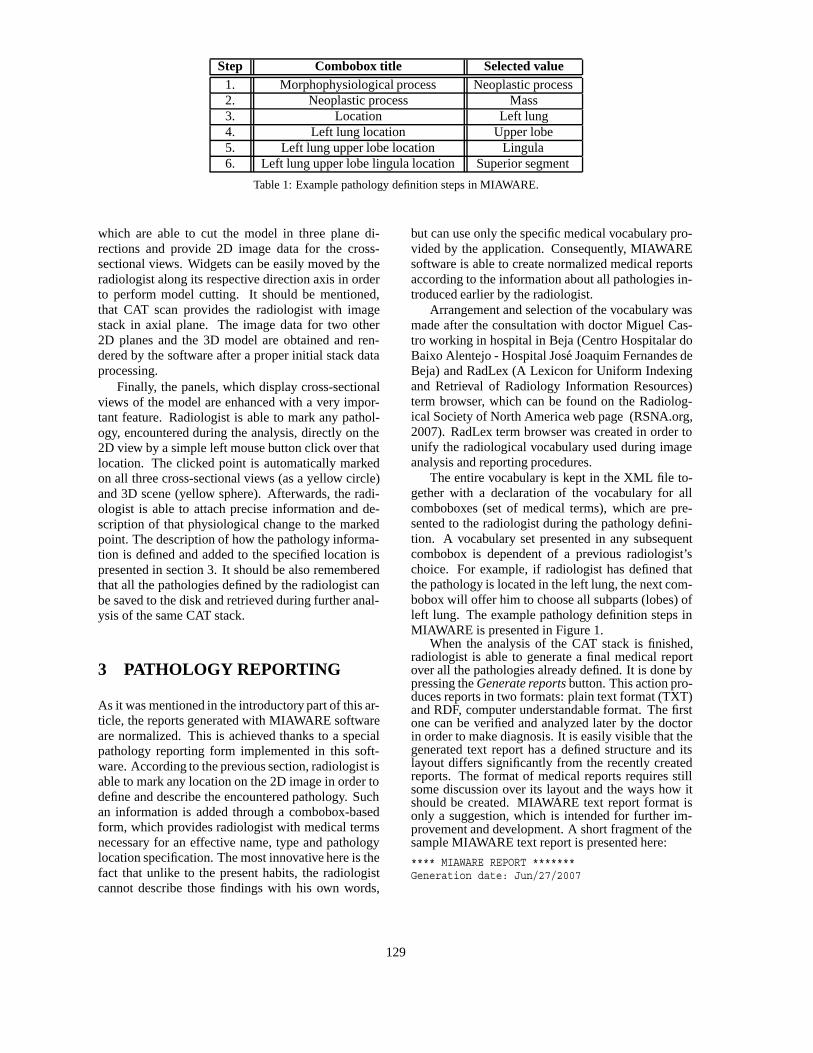
Step Combobox title Selected value1. Morphophysiological process Neoplastic process2. Neoplastic process Mass3. Location Left lung4. Left lung location Upper lobe5. Left lung upper lobe location Lingula6. Left lung upper lobe lingula location Superior segment
Table 1: Example pathology definition steps in MIAWARE.
which are able to cut the model in three plane di-rections and provide 2D image data for the cross-sectional views. Widgets can be easily moved by theradiologist along its respective direction axis in orderto perform model cutting. It should be mentioned,that CAT scan provides the radiologist with imagestack in axial plane. The image data for two other2D planes and the 3D model are obtained and ren-dered by the software after a proper initial stack dataprocessing.
Finally, the panels, which display cross-sectionalviews of the model are enhanced with a very impor-tant feature. Radiologist is able to mark any pathol-ogy, encountered during the analysis, directly on the2D view by a simple left mouse button click over thatlocation. The clicked point is automatically markedon all three cross-sectional views (as a yellow circle)and 3D scene (yellow sphere). Afterwards, the radi-ologist is able to attach precise information and de-scription of that physiological change to the markedpoint. The description of how the pathology informa-tion is defined and added to the specified location ispresented in section 3. It should be also rememberedthat all the pathologies defined by the radiologist canbe saved to the disk and retrieved during further anal-ysis of the same CAT stack.
3 PATHOLOGY REPORTING
As it was mentioned in the introductory part of this ar-ticle, the reports generated with MIAWARE softwareare normalized. This is achieved thanks to a specialpathology reporting form implemented in this soft-ware. According to the previous section, radiologist isable to mark any location on the 2D image in order todefine and describe the encountered pathology. Suchan information is added through a combobox-basedform, which provides radiologist with medical termsnecessary for an effective name, type and pathologylocation specification. The most innovative here is thefact that unlike to the present habits, the radiologistcannot describe those findings with his own words,
but can use only the specific medical vocabulary pro-vided by the application. Consequently, MIAWAREsoftware is able to create normalized medical reportsaccording to the information about all pathologies in-troduced earlier by the radiologist.
Arrangement and selection of the vocabulary wasmade after the consultation with doctor Miguel Cas-tro working in hospital in Beja (Centro Hospitalar doBaixo Alentejo - Hospital Jose Joaquim Fernandes deBeja) and RadLex (A Lexicon for Uniform Indexingand Retrieval of Radiology Information Resources)term browser, which can be found on the Radiolog-ical Society of North America web page (RSNA.org,2007). RadLex term browser was created in order tounify the radiological vocabulary used during imageanalysis and reporting procedures.
The entire vocabulary is kept in the XML file to-gether with a declaration of the vocabulary for allcomboboxes (set of medical terms), which are pre-sented to the radiologist during the pathology defini-tion. A vocabulary set presented in any subsequentcombobox is dependent of a previous radiologist’schoice. For example, if radiologist has defined thatthe pathology is located in the left lung, the next com-bobox will offer him to choose all subparts (lobes) ofleft lung. The example pathology definition steps inMIAWARE is presented in Figure 1.
When the analysis of the CAT stack is finished,radiologist is able to generate a final medical reportover all the pathologies already defined. It is done bypressing the Generate reports button. This action pro-duces reports in two formats: plain text format (TXT)and RDF, computer understandable format. The firstone can be verified and analyzed later by the doctorin order to make diagnosis. It is easily visible that thegenerated text report has a defined structure and itslayout differs significantly from the recently createdreports. The format of medical reports requires stillsome discussion over its layout and the ways how itshould be created. MIAWARE text report format isonly a suggestion, which is intended for further im-provement and development. A short fragment of thesample MIAWARE text report is presented here:
**** MIAWARE REPORT *******Generation date: Jun/27/2007
129
*****************************Control Point no. 1 : (x,y,z) = (178,282,52)Specifications:Morphophysiological process: General processGeneral process: Peribronchial condensationLocation: Right lungRight lung location: Lower lobeRight lung lower lobe location:->Lateral basal segment
******************************Control Point no. 2 : (x,y,z) = (172,220,47)Specifications:Morphophysiological process: General processGeneral process: Post-therapeutic alterationLocation: Right lungRight lung location: Middle lobeRight lung middle lobe location:->Medial segment
...
****** END OF REPORT ******
The second type of reports, this in RDF format,is created for further processing of its content (reportsearching). It is described in details in section 4.
4 MEDICAL REPORTSEARCHING
This section describes the structure of the RDF medi-cal reports and the MIAWARE search engine togetherwith an ontology for lungs developed specially forthis purpose.
4.1 RDF reports
As it was already mentioned, the RDF format formedical reports is required for further informationprocessing and searching. RDF model introducesdescription of resources by statements and its datamodel contains of three components: resources, prop-erties and statements (called as triples). Resources areany datatype items, which can obtain any value defi-nition (statement) through some given relation (prop-erty). Any statement can consist of a new tripleresource-property-statement. “Just as an English sen-tence usually comprises a subject, a verb and objects,RDF statements consist of subjects, properties andobjects” (Gomez-Perez et al., 2004).
Table 1 represents one example of pathology def-inition. The final medical report will usually containmore such definitions grouped in some specific way.The data gathered in the Table 1 can be represented
as normal, lexical group of sentences describing anypathology found. For example:
‘A morphophysiological process was found. Itis in the form of a neoplastic process of thetype mass. It is located in the left lung, in itsupper lobe, exactly in the superior segment ofthe lingula.’
Such a group of sentences can be represented asresource-property-statement model and it is used inMIAWARE medical RDF reports. In this case, thefirst underlined word is a resource and the rest is astatement. As our statement consists of group of re-sources it has to be analyzed further. Then the firstresource of the previous statement is a resource andthe rest group another statement. Such embeddedstructure of the resource-property-statement is createdthrough RDF reified statements. It should be men-tioned that the properties (which connect resourceswith the statements) in the above example are: in formof, of the type, etc.
The RDF reports generated by MIAWARE soft-ware keep the pathology information in the mannerpresented above. It should be only mentioned that therole of properties in our reports play titles of the sub-sequent comboboxes. These names are taken fromthe XML file used by pathology definition form, de-scribed in section 3.
4.2 Ontology-based report searching
It must be understood that radiological examinationsare carried out quite often in such places as hospitals,private and public surgeries or any other medical in-stitutions. As a result, it produces a great amount ofmedical reports in relatively short time. Such reportsshould be kept and gathered together for future usageas references to previously encountered and definedpathologies or diseases. Manual searching of greatamount of documents is really time-consuming. Theautomated generation of reports in some specific fileformat easy to read for computer (e.g. RDF) is a mile-stone in development of state-of-the-art computer-based searching. Consequently, intelligent search en-gine of medical reports can significantly speed-up thedisease recognition process, as, considering given cri-teria, it would immediately result in sets of referencesto the archive reports with similar pathological symp-toms in other patients, the resultant diagnoses and ap-plied treatments.
The search engine for medical reports developedtogether with MIAWARE software is able to find allreports where exist some specified pathology definedin a lung part (specified as a search criteria) or anyof its subparts. This adds some intelligence to the
130
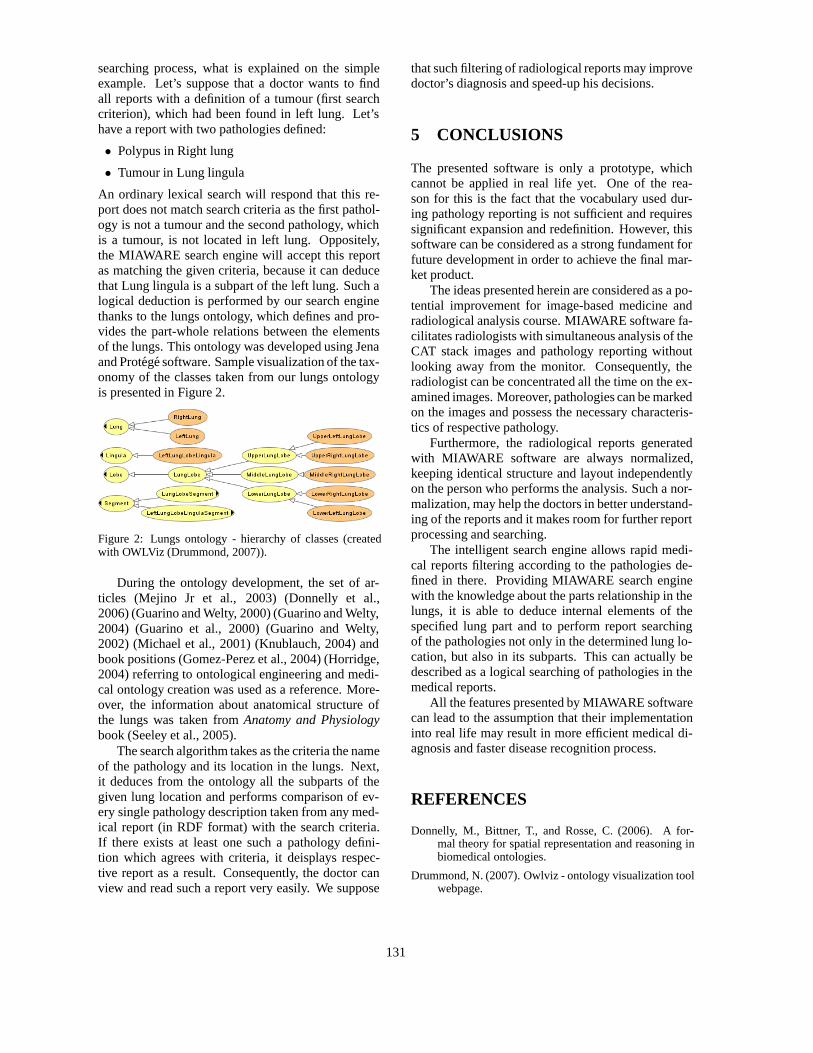
searching process, what is explained on the simpleexample. Let’s suppose that a doctor wants to findall reports with a definition of a tumour (first searchcriterion), which had been found in left lung. Let’shave a report with two pathologies defined:
• Polypus in Right lung
• Tumour in Lung lingula
An ordinary lexical search will respond that this re-port does not match search criteria as the first pathol-ogy is not a tumour and the second pathology, whichis a tumour, is not located in left lung. Oppositely,the MIAWARE search engine will accept this reportas matching the given criteria, because it can deducethat Lung lingula is a subpart of the left lung. Such alogical deduction is performed by our search enginethanks to the lungs ontology, which defines and pro-vides the part-whole relations between the elementsof the lungs. This ontology was developed using Jenaand Protege software. Sample visualization of the tax-onomy of the classes taken from our lungs ontologyis presented in Figure 2.
Figure 2: Lungs ontology - hierarchy of classes (createdwith OWLViz (Drummond, 2007)).
During the ontology development, the set of ar-ticles (Mejino Jr et al., 2003) (Donnelly et al.,2006) (Guarino and Welty, 2000) (Guarino and Welty,2004) (Guarino et al., 2000) (Guarino and Welty,2002) (Michael et al., 2001) (Knublauch, 2004) andbook positions (Gomez-Perez et al., 2004) (Horridge,2004) referring to ontological engineering and medi-cal ontology creation was used as a reference. More-over, the information about anatomical structure ofthe lungs was taken from Anatomy and Physiologybook (Seeley et al., 2005).
The search algorithm takes as the criteria the nameof the pathology and its location in the lungs. Next,it deduces from the ontology all the subparts of thegiven lung location and performs comparison of ev-ery single pathology description taken from any med-ical report (in RDF format) with the search criteria.If there exists at least one such a pathology defini-tion which agrees with criteria, it deisplays respec-tive report as a result. Consequently, the doctor canview and read such a report very easily. We suppose
that such filtering of radiological reports may improvedoctor’s diagnosis and speed-up his decisions.
5 CONCLUSIONS
The presented software is only a prototype, whichcannot be applied in real life yet. One of the rea-son for this is the fact that the vocabulary used dur-ing pathology reporting is not sufficient and requiressignificant expansion and redefinition. However, thissoftware can be considered as a strong fundament forfuture development in order to achieve the final mar-ket product.
The ideas presented herein are considered as a po-tential improvement for image-based medicine andradiological analysis course. MIAWARE software fa-cilitates radiologists with simultaneous analysis of theCAT stack images and pathology reporting withoutlooking away from the monitor. Consequently, theradiologist can be concentrated all the time on the ex-amined images. Moreover, pathologies can be markedon the images and possess the necessary characteris-tics of respective pathology.
Furthermore, the radiological reports generatedwith MIAWARE software are always normalized,keeping identical structure and layout independentlyon the person who performs the analysis. Such a nor-malization, may help the doctors in better understand-ing of the reports and it makes room for further reportprocessing and searching.
The intelligent search engine allows rapid medi-cal reports filtering according to the pathologies de-fined in there. Providing MIAWARE search enginewith the knowledge about the parts relationship in thelungs, it is able to deduce internal elements of thespecified lung part and to perform report searchingof the pathologies not only in the determined lung lo-cation, but also in its subparts. This can actually bedescribed as a logical searching of pathologies in themedical reports.
All the features presented by MIAWARE softwarecan lead to the assumption that their implementationinto real life may result in more efficient medical di-agnosis and faster disease recognition process.
REFERENCES
Donnelly, M., Bittner, T., and Rosse, C. (2006). A for-mal theory for spatial representation and reasoning inbiomedical ontologies.
Drummond, N. (2007). Owlviz - ontology visualization toolwebpage.
131
Gomez-Perez, A., Corcho, O., and Fernandez-Lopez,M. (2004). Ontological Engineering : with ex-amples from the areas of Knowledge Management,e-Commerce and the Semantic Web. First Edition(Advanced Information and Knowledge Processing).Springer.
Guarino, N. and Welty, C. A. (2000). A formal ontology ofproperties.
Guarino, N. and Welty, C. A. (2002). Evaluating ontologicaldecisions with ONTOCLEAN.
Guarino, N. and Welty, C. A. (2004). An overview of onto-clean.
Guarino, N., Welty, C. A., and Partridge, C. (2000). To-wards a methodology for ontology based model engi-neering.
Horridge, M. (2004). A Practical Guide To Building OWLOntologies With The Protege-OWL Plugin. Universityof Manchester, 1 edition.
Knublauch, O. H. (2004). Weaving the biomedical semanticweb with the protege owl plugin.
Mejino Jr, J. L., Agoncillo, A. V., Rickard, K. L., and Rosse,C. (2003). Representing complexity in part-whole re-lationships within the foundational model of anatomy.
Michael, J., Mejino Jr, J. L., and Rosse, C. (2001). The roleof definitions in biomedical concept representation.
RSNA.org (2007). Rsna - radlex term browser webpage.
Seeley, R. R., Stephens, T. D., and Tate, P. (2005). Anatomyand Physiology. McGraw-Hill Higher Education.
132