Medical Geology in Russia and the NIS
407
-
Upload
independent -
Category
Documents
-
view
10 -
download
0
Transcript of Medical Geology in Russia and the NIS


Medical Geology

International Year of Planet Earth
Series Editors:
Eduardo F. J. de MulderExecutive Director International SecretariatInternational Year of Planet Earth
Edward DerbyshireGoodwill AmbassadorInternational Year of Planet Earth
The book series is dedicated to the United Nations International Year of Planet Earth. The aim of the Yearis to raise worldwide public and political awareness of the vast (but often under-used) potential of Earthsciences for improving the quality of life and safeguarding the planet. Geoscientific knowledge can savelives and protect property if threatened by natural disasters. Such knowledge is also needed to sustainablysatisfy the growing need for Earth’s resources by more people. Earths scientists are ready to contribute toa safer, healthier and more prosperous society. IYPE aims to develop a new generation of such experts tofind new resources and to develop land more sustainably.
For further volumes:http://www.springer.com/series/8096

Olle Selinus · Robert B. Finkelman ·Jose A. CentenoEditors
Medical Geology
A Regional Synthesis
123

EditorsOlle SelinusGeological Survey of SwedenSE-751 28 [email protected]
Jose A. CentenoU.S. Armed Forces Institute of
Pathology (AFIP)Department of Environmental & Toxicologic
Pathology6825 16 Cpy NW.Washington DC [email protected]@afip.osd.mil
Robert B. FinkelmanDepartment of GeosciencesUniversity of Texas at DallasCenter for Lithospheric
Studies800 W. Campbell RoadRichardson TX [email protected]
ISBN 978-90-481-3429-8 e-ISBN 978-90-481-3430-4DOI 10.1007/978-90-481-3430-4Springer Dordrecht Heidelberg London New York
Library of Congress Control Number: 2010925026
© Springer Science+Business Media B.V. 2010No part of this work may be reproduced, stored in a retrieval system, or transmitted in any form or byany means, electronic, mechanical, photocopying, microfilming, recording or otherwise, without writtenpermission from the Publisher, with the exception of any material supplied specifically for the purpose ofbeing entered and executed on a computer system, for exclusive use by the purchaser of the work.
Printed on acid-free paper
Springer is part of Springer Science+Business Media (www.springer.com)
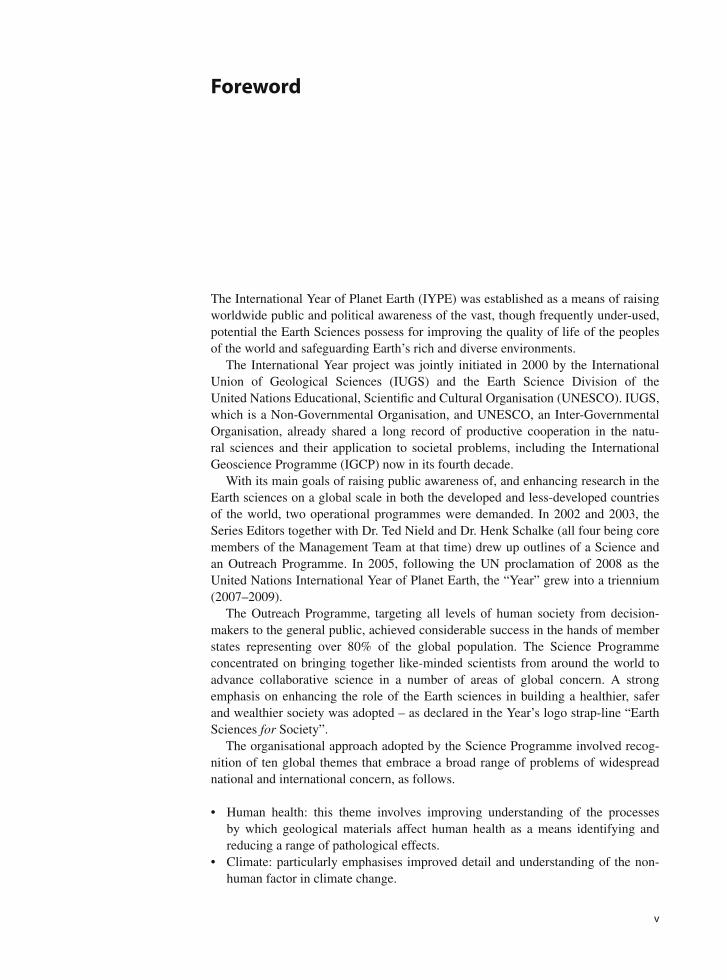
Foreword
The International Year of Planet Earth (IYPE) was established as a means of raisingworldwide public and political awareness of the vast, though frequently under-used,potential the Earth Sciences possess for improving the quality of life of the peoplesof the world and safeguarding Earth’s rich and diverse environments.
The International Year project was jointly initiated in 2000 by the InternationalUnion of Geological Sciences (IUGS) and the Earth Science Division of theUnited Nations Educational, Scientific and Cultural Organisation (UNESCO). IUGS,which is a Non-Governmental Organisation, and UNESCO, an Inter-GovernmentalOrganisation, already shared a long record of productive cooperation in the natu-ral sciences and their application to societal problems, including the InternationalGeoscience Programme (IGCP) now in its fourth decade.
With its main goals of raising public awareness of, and enhancing research in theEarth sciences on a global scale in both the developed and less-developed countriesof the world, two operational programmes were demanded. In 2002 and 2003, theSeries Editors together with Dr. Ted Nield and Dr. Henk Schalke (all four being coremembers of the Management Team at that time) drew up outlines of a Science andan Outreach Programme. In 2005, following the UN proclamation of 2008 as theUnited Nations International Year of Planet Earth, the “Year” grew into a triennium(2007–2009).
The Outreach Programme, targeting all levels of human society from decision-makers to the general public, achieved considerable success in the hands of memberstates representing over 80% of the global population. The Science Programmeconcentrated on bringing together like-minded scientists from around the world toadvance collaborative science in a number of areas of global concern. A strongemphasis on enhancing the role of the Earth sciences in building a healthier, saferand wealthier society was adopted – as declared in the Year’s logo strap-line “EarthSciences for Society”.
The organisational approach adopted by the Science Programme involved recog-nition of ten global themes that embrace a broad range of problems of widespreadnational and international concern, as follows.
• Human health: this theme involves improving understanding of the processesby which geological materials affect human health as a means identifying andreducing a range of pathological effects.
• Climate: particularly emphasises improved detail and understanding of the non-human factor in climate change.
v

vi Foreword
• Groundwater: considers the occurrence, quantity and quality of this vital resourcefor all living things against a background that includes potential political tensionbetween competing neighbour-nations.
• Ocean: aims to improve understanding of the processes and environment of theocean floors with relevance to the history of planet Earth and the potential forimproved understanding of life and resources.
• Soils: this thin “skin” on Earth’s surface is the vital source of nutrients that sustainlife on the world’s landmasses, but this living skin is vulnerable to degradation ifnot used wisely. This theme emphasizes greater use of soil science information inthe selection, use and ensuring sustainability of agricultural soils so as to enhanceproduction and diminish soil loss.
• Deep Earth: in view of the fundamental importance of deep the Earth in supplyingbasic needs, including mitigating the impact of certain natural hazards and control-ling environmental degradation, this theme concentrates on developing scientificmodels that assist in the reconstruction of past processes and the forecasting offuture processes that take place in the solid Earth.
• Megacities: this theme is concerned with means of building safer structures andexpanding urban areas, including utilization of subsurface space.
• Geohazards: aims to reduce the risks posed to human communities by both naturaland human-induced hazards using current knowledge and new information derivedfrom research.
• Resources: involves advancing our knowledge of Earth’s natural resources andtheir sustainable extraction.
• Earth and Life: it is over two and half billion years since the first effects oflife began to affect Earth’s atmosphere, oceans and landmasses. Earth’s biolog-ical “cloak”, known as the biosphere, makes our planet unique but it needs tobe better known and protected. This theme aims to advance understanding ofthe dynamic processes of the biosphere and to use that understanding to helpkeep this global life-support system in good health for the benefit of all livingthings.
The first task of the leading Earth scientists appointed as Theme Leaders wasthe production of a set of theme brochures. Some 3500 of these were published,initially in English only but later translated into Portuguese, Chinese, Hungarian,Vietnamese, Italian, Spanish, Turkish, Lithuanian, Polish, Arabic, Japanese andGreek. Most of these were published in hard copy and all are listed on the IYPEwebsite.
It is fitting that, as the International Year’s triennium terminates at the end of 2009,the more than 100 scientists who participated in the ten science themes should bringtogether the results of their wide ranging international deliberations in a series ofstate-of-the-art volumes that will stand as a legacy of the International Year of PlanetEarth. The book series was a direct result of interaction between the InternationalYear and the Springer Verlag Company, a partnership which was formalised in 2008during the acme of the triennium.
This IYPE-Springer book series contains the latest thinking on the chosen themesby a large number of Earth science professionals from around the world. The booksare written at the advanced level demanded by a potential readership consistingof Earth science professionals and students. Thus, the series is a legacy of theScience Programme, but it is also a counterweight to the Earth science information in

Foreword vii
several media formats already delivered by the numerous National Committees of theInternational Year in their pursuit of world-wide popularization under the OutreachProgramme.
The discerning reader will recognise that the books in this series provide not only acomprehensive account of the individual themes but also share much common groundthat makes the series greater than the sum of the individual volumes. It is to be hopedthat the scientific perspective thus provided will enhance the reader’s appreciation ofthe nature and scale of Earth science as well as the guidance it can offer to govern-ments, decision-makers and others seeking solutions to national and global problems,thereby improving everyday life for present and future residents of Planet Earth.
Eduardo F.J. de Mulder Edward DerbyshireExecutive Director International Secretariat Goodwill AmbassadorInternational Year of Planet Earth International Year of Planet Earth

Preface
This book series is one of the many important results of the International Yearof Planet Earth (IYPE), a joint initiative of UNESCO and the International Unionof Geological Sciences (IUGS), launched with the aim of ensuring greater andmore effective use by society of the knowledge and skills provided by the EarthSciences.
It was originally intended that the IYPE would run from the beginning of 2007until the end of 2009, with the core year of the triennium (2008) being proclaimedas a UN Year by the United Nations General Assembly. During all three years,a series of activities included in the IYPE’s science and outreach programmeshad a strong mobilizing effect around the globe, not only among Earth Scientistsbut also within the general public and, especially, among children and youngpeople.
The Outreach Programme has served to enhance cooperation among earth scien-tists, administrators, politicians and civil society and to generate public awarenessof the wide ranging importance of the geosciences for human life and prosper-ity. It has also helped to develop a better understanding of Planet Earth and theimportance of this knowledge in the building of a safer, healthier and wealthiersociety.
The Scientific Programme, focused upon ten themes of relevance to society, hassuccessfully raised geoscientists’ awareness of the need to develop further the interna-tional coordination of their activities. The Programme has also led to some importantupdating of the main challenges the geosciences are, and will be confronting withinan agenda closely focused on societal benefit.
An important outcome of the work of the IYPE’s scientific themes includes thisthematic book as one of the volumes making up the IYPE-Springer Series, whichwas designed to provide an important element of the legacy of the InternationalYear of Planet Earth. Many prestigious scientists, drawn from different disciplinesand with a wide range of nationalities, are warmly thanked for their contri-butions to a series of books that epitomize the most advanced, up-to-date anduseful information on evolution and life, water resources, soils, changing climate,deep earth, oceans, non-renewable resources, earth and health, natural hazards,megacities.
This legacy opens a bridge to the future. It is published in the hope that the coremessage and the concerted actions of the International Year of Planet Earth through-out the triennium will continue and, ultimately, go some way towards helping toestablish an improved equilibrium between human society and its home planet. As
ix

x Preface
stated by the Director General of UNESCO, Koichiro Matsuura, “Our knowledge ofthe Earth system is our insurance policy for the future of our planet”. This book seriesis an important step in that direction.
R. Missotten Alberto C. RiccardiChief, Global Earth Observation Section PresidentUNESCO IUGS

Contents
Medical Geology Issues in North America . . . . . . . . . . . . . . . . . . 1Robert B. Finkelman, Heather Gingerich, Jose A. Centeno,and Gary Krieger
A Regional Perspective of Medical Geology – Cadmiumin Jamaica . . . . . . . . . . . . . . . . . . . . . . . . . . . . . . . . . . . 29Paul R. D. Wright, Robin Rattray, and Gerald Lalor
Medical Geology in Mexico, Central Americaand the Caribbean . . . . . . . . . . . . . . . . . . . . . . . . . . . . . . . 59M. Aurora Armienta, Ramiro Rodríguez, Nuria Segovia,and Michele Monteil
Medical Geology Studies in South America . . . . . . . . . . . . . . . . . 79Bernardino R. Figueiredo, Marta I. Litter, Cássio R. Silva,Nelly Mañay, Sandra C. Londono, Ana Maria Rojas, Cristina Garzón,Tommaso Tosiani, Gabriela M. Di Giulio, Eduardo M. De Capitani,José Ângelo S. A. Dos Anjos, Rômulo S. Angélica,Maria Celeste Morita, Mônica M. B. Paoliello, Fernanda G. Cunha,Alice M. Sakuma, and Otávio A. Licht
An Overview of Medical Geology Issues in Australia and Oceania . . . . 107Karin Ljung, Annemarie de Vos, Angus Cook, and Philip Weinstein
Medical Geology in the Middle East . . . . . . . . . . . . . . . . . . . . . 135Humam Misconi and Maryam Navi
Some Aspects of the Medical Geology of the Indian Subcontinentand Neighbouring Regions . . . . . . . . . . . . . . . . . . . . . . . . . . 175C.B. Dissanayake, C.R.M. Rao, and Rohana Chandrajith
Medical Geology in Africa . . . . . . . . . . . . . . . . . . . . . . . . . . . 199T.C. Davies
xi

xii Contents
Medical Geology in Russia and the NIS . . . . . . . . . . . . . . . . . . . 221Iosif F. Volfson, Evgeny G. Farrakhov, Anatoly P. Pronin,Ospan B. Beiseyev, Almas O. Beiseyev, Maxim A. Bogdasarov,Alla V. Oderova, Igor G. Pechenkin, Alexey E. Khitrov,Oxana L. Pikhur, Julia V. Plotkina, Olga V. Frank-Kamenetskaya,Elena V. Rosseeva, Olga A. Denisova, Georgy E. Chernogoryuk,Natalia Baranovskaya, Leonid P. Rikhvanov, Igor M. Petrov,Armen K. Saghatelyan, Lilit V. Sahakyan, Olga V. Menchinskaya,Tamara D. Zangiyeva, Murat Z. Kajtukov, Zukhra H. Uzdenova,and Anastassia L. Dorozhko
Medical Geology in Europe . . . . . . . . . . . . . . . . . . . . . . . . . . 259Olle Selinus, Mark Cave, Anne Kousa, Eiliv Steinnes, Jaques Varet,and Eduardo Ferreira da Silva
Medical Geology in China: Then and Now . . . . . . . . . . . . . . . . . . 303Zheng Baoshan, Wang Binbin, and Robert B. Finkelman
Medical Geology in Japan . . . . . . . . . . . . . . . . . . . . . . . . . . . 329Hisashi Nirei, Kunio Furuno, and Takashi Kusuda
Medical Geology in Hellas: The Lavrion Environmental Pollution Study . 355Alecos Demetriades
Index . . . . . . . . . . . . . . . . . . . . . . . . . . . . . . . . . . . . . . 391

Contributors
José Ângelo S.A. Dos Anjos University of Salvador, Salvador, BA, Brazil
Rômulo S. Angélica Federal University of Para, Belem, PA, Brazil
M. Aurora Armienta Universidad Nacional Autónoma de México, Instituto deGeofísica, México, DF 04510, México, [email protected]
Zheng Baoshan The State Key Laboratory of Environmental GeochemistryInstitute of Geochemistry, Chinese Academy of Sciences, Guiyang 55002, P. R.China, [email protected]
Natalia Baranovskaya Polytechnic University, Lenin Avenue 634050, Tomsk,Russia, [email protected]
Ospan B. Beiseyev Satpaev Kazakh National Technic University, Republic ofKazakhstan 050013, Almaty, Kazakhstan, [email protected]
Almas O. Beiseyev Al-Faraby Kazakh National University, Republic ofKazakhstan 050065, Almaty, Kazakhstan, [email protected]
Wang Binbin The State Key Laboratory of Environmental Geochemistry Instituteof Geochemistry, Chinese Academy of Sciences, Guiyang 55002, P. R. China,[email protected]
Maxim A. Bogdasarov State Brest University named after A.S. Pushkin, Republicof Belarus 224016, Brest, [email protected]
Mark Cave British Geological Survey, Keyworth, Nottingham NG12 5GG, UK
Jose A. Centeno U.S. Armed Forces Institute of Pathology, Washington, DC20306, USA, [email protected]; [email protected]
Rohana Chandrajith Department of Geology, University of Peradeniya,Peradeniya, Sri Lanka, [email protected]
Georgy E. Chernogoryuk Siberian State Medical University (SibGMU), RussianFederation 634050, Tomsk, Russia, [email protected]
Angus Cook School of Population Health, University of Western Australia, Perth,WA, Australia
Fernanda G. Cunha Geological Survey of Brazil – CPRM, Rio de Janeiro, RJ,Brazil
xiii

xiv Contributors
T.C. Davies Department of Mining and Environmental Geology, University ofVenda, Thohoyandou 0950, Limpopo Province, Republic of South Africa,[email protected]
Eduardo M. De Capitani University of Campinas, Campinas, SP, Brazil
Alecos Demetriades Institute of Geology and Mineral Exploration, Acharnae,Hellas Gr-136 77, Greece, [email protected]
Olga A. Denisova Siberian State Medical University (SibGMU), RussianFederation 634050, Tomsk, Russia, [email protected]
Gabriela M. Di Giulio Environmental Studies Center, University of Campinas,Campinas, SP, Brazil
C.B. Dissanayake Institute of Fundamental Studies (IFS), Kandy, Sri Lanka,[email protected]
Anastassia L. Dorozhko Sergeev Institute of Environmental Geoscience RussianAcademy of Sciences (IEG RAS), Moscow 101000, Russia,[email protected]
Evgeny G. Farrakhov Russian Geological Society, Moscow 115191, Russia,[email protected]
Bernardino R. Figueiredo Institute of Geosciences, University of Campinas,Campinas, SP, Brazil, [email protected]
Robert B. Finkelman University of Texas at Dallas, Richardson, TX 75080, USA;China University of Geosciences, Beijing 100083, P. R. China, [email protected]
Olga V. Frank-Kamenetskaya Department of Geology, St. Petersburg StateUniversity, Russian Federation 199034, St. Petersburg, Russia, [email protected]
Kunio Furuno Research Institute of Environmental Geology, Chiba. 3-5-1,Image-kaigan, Mihama-ku, Chiba City, 261-0005, Japan,kuniofurunojp@gmail-com
Cristina Garzón INGEOMINAS, Bogotá, Colombia
Heather Gingerich University of Queensland, School of Population HealthBrisbane, Australia
Murat Z. Kajtukov Community Scientific Organization of Veterans and Invalids,Vladikavkaz 362013, Russia, [email protected]
Alexey E. Khitrov Fedorovsky VIMS, Russian Federation 119017, Moscow,Russia, [email protected]
Anne Kousa Geological Survey of Finland, GTK, FI-70211 Kuopio, Finland
Gary Krieger NewFields, Denver, CO 80202, USA
Takashi Kusuda Research Institute of Environmental Geology, Chiba. 3-5-1,Image-kaigan, Mihama-ku, Chiba City, 261-0005, Japan,[email protected]

Contributors xv
Gerald Lalor International Centre for Environmental and Nuclear Sciences,2 Anguilla Close, UWI, Mona, Kingston 7, Jamaica
Otávio A. Licht MINEROPAR, Curitiba, PR, Brazil
Marta I. Litter Atomic Energy National Commission, Consejo Nacional deInvestigaciones Científicas y Técnicas and University of San Martín, San Martín,Buenos Aires, Argentina
Karin Ljung School of Population Health, University of Western Australia, Perth,WA, Australia; Institute of Environmental Medicine, Karolinska Institutet,Stockholm, Sweden, [email protected]
Sandra C. Londono National University of Colombia, Bogotá, Colombia
Nelly Mañay University of the Republic of Uruguay, Montevideo, Uruguay
Olga V. Menchinskaya Institute of Mineralogy, Geochemistry and CrystalChemistry of Rare Elements, Moscow 121357, Russia, [email protected]
Humam Misconi Consultant, Baghdad, Iraq, [email protected]
Michele Monteil University of West Indies, St. Augustine, Trinidad and Tobago,Jamaica, [email protected]
Maria Celeste Morita University of Londrina, Londrina, PR, Brazil
Maryam Navi National Geoscience Database of Iran, Geological Survey of Iran,Tehran, Iran, [email protected]
Hisashi Nirei Japan Branch of the International Medical Geology Association,1277, Kamauchiya, Motoyahagi, Katori City, Chiba Prefecture, 287-0025 Japan,[email protected]
Alla V. Oderova Fedorovsky VIMS, Russian Federation 119017, Moscow, Russia,[email protected]
Mônica M.B. Paoliello University of Londrina, Londrina, PR, Brazil
Igor G. Pechenkin Fedorovsky VIMS, Russian Federation 119017, Moscow,Russia, [email protected]
Igor M. Petrov Ltd. Infomine Research Group, Moscow 119049, Russia,[email protected]
Oxana L. Pikhur St. Petersburg Medical Academy of Postgraduate Education,Russian Federation 191015, St. Petersburg, Russia, [email protected]
Yulia V. Plotkina Institute of Precambrian Geology and Geochronology RAS,Russian Federation 199034, St. Petersburg, Russia, [email protected]
Goeffry Plumlee U.S. Geological Survey, Denver, CO 80225, USA
Anatoly P. Pronin Geotech VIMS, Fedorovsky VIMS, Moscow 119017, Russia,[email protected]
C.R.M. Rao Geological Survey of India, Bandlaguda, Hyderabad 500068, India,[email protected]

xvi Contributors
Robin Rattray International Centre for Environmental and Nuclear Sciences,2 Anguilla Close, UWI, Mona, Kingston 7, Jamaica
Leonid P. Rikhvanov Department of Geology, Polytechnic University, LeninAvenue 634050, Tomsk, Russia, [email protected]
Ramiro Rodríguez Universidad Nacional Autónoma de México, Instituto deGeofísica, México, DF 04510, México, [email protected]
Ana Maria Rojas INGEOMINAS, Bogotá, Colombia
Elena V. Rosseeva Department of Geology, St. Petersburg State University,Russian Federation 199034, St. Petersburg, Russia, [email protected]
Armen K. Saghatelyan Center for Ecological-Noosphere Studies of NAS RA(Armenia), Republic of Armenia 0025, Yerevan, [email protected];[email protected]
Lilit V. Sahakyan Center for Ecological-Noosphere Studies of NAS RA (Armenia),Republic of Armenia 0025, Yerevan, [email protected]; [email protected]
Alice M. Sakuma Adolfo Lutz Institute, Sao Paulo, SP, Brazil
Nuria Segovia Universidad Nacional Autónoma de México, Instituto de Geofísica,México, DF 04510, México, [email protected]
Olle Selinus Geological Survey of Sweden, Uppsala SE-751 28, Sweden
Cássio R. Silva Geological Survey of Brazil – CPRM, Rio de Janeiro, RJ, Brazil
Eduardo Ferreira Da Silva Universidade de Aveiro, Aveiro, Portugal
Eiliv Steinnes Department of Chemistry, Norwegian University of Science andTechnology, Trondheim NO-7491, Norway
Tommaso Tosiani Central University of Venezuela, Caracas, Venezuela
Zukhra H. Uzdenova Department of Medicine, Kabardino-Balkaria StateUniversity, Nalchik, KBR 360004 Russia, [email protected]
Jaques Varet Geological Survey of France, BRGM, Orléans cedex 02, France
Iosif F. Volfson Russian Geological Society, Moscow 115191, Russia,[email protected]
Annemarie de Vos School of Population Health, University of Western Australia,Perth, WA, Australia
Philip Weinstein School of Population Health, University of Queensland,Brisbane, QLD, Australia
Paul R.D. Wright International Centre for Environmental and Nuclear Sciences,2 Anguilla Close, UWI, Mona, Kingston 7, Jamaica, [email protected]
Tamara D. Zangiyeva Institute of Mineralogy, Geochemistry and CrystalChemistry of Rare Elements, Moscow 121357, Russia, [email protected]

Reviewers
Kaj Lax Geological Survey of Sweden, Uppsala, Sweden
Reijo Salminen Geological Survey of Finland, Espoo, Finland
Pauline Smedley British Geological Survey, Keyworth, Nottingham, UK
Philip Weinstein University of Queensland, Brisbane, QLD, Australia
Bob Finkelman University of Dallas at Texas, Texas, USA
Jose Centeno US Armed Forces Institute of Pathology, Washington, DC, USA
Eduardo Ferreira Da Silva Universidade de Aveiro, Aveiro, Portugal
Monica Nordberg Karolinska Institute, Stockholm, Sweden
Ulf Lindh Uppsala University, Uppsala, Sweden
Erland Johansson Uppsala University, Uppsala, Sweden
xvii

Introduction
Medical Geology – A Regional Synthesis
This book, part of a series that will be a legacy to the International Year of PlanetEarth, focuses on earth and health, or, as this subject is commonly referred to, med-ical geology. Medical geology is the science dealing with the relationship betweennatural geological factors and health in man and animals. It does not deal with pureanthropogenic factors. There is, however, a gray zone. The arsenic catastrophe inBangladesh is caused by geology factors (naturally occurring arsenic in the ground-water); however, the health problem was triggered by boring millions of tube wellsto bring this water to the surface. Mining brings ores and minerals from depth tothe surface environment. Unfortunately, there are often serious health consequencescaused by oxidation of the ores, liberation of the minerals, etc. Organic pollutants aregenerally not an issue for medical geology because they are usually anthropogenic;however, there are serious health problems when these compounds are transported bygroundwater and deposited in soils. Geoscientists and the information they generatecan have important roles to play even in these ‘gray zones.’
Medical geology is a rapidly expanding field concerned with the relationshipbetween natural geological factors and human and animal health, including under-standing the influence of environmental factors on the geographical distribution ofhealth problems. Medical geology brings together geoscientists and medical/publichealth researchers to address health problems caused or exacerbated by geologicalmaterials; ultimately, it is only with multidisciplinary collaborations that interven-tions can be devised to reduce morbidity and mortality from such problems. Medicalgeology also deals with the many health benefits of geologic materials and processes.
Rocks are the source of most chemical elements found on the earth. Many ele-ments in the right quantities are essential for plant, animal, and human health. Mostof these elements enter the human body via food and water in the diet and throughthe air that we breathe. Through weathering processes, rocks break down to formsoils on which crops and animals that constitute the food supply are raised. Drinkingwater moves through rocks and soils as part of the hydrological cycle. Much of thenatural dust and some of the gases present in the atmosphere are the result of geolog-ical processes. Elements that are essential for our well-being and non-elements, somepotentially toxic, exist side-by-side in bedrock or soils and may become a direct riskfor human and animal health if present in low quantities (deficiency) or if present inexcessive quantities (toxicity). The inability of the environment to provide the correctchemical balance can lead to serious health problems. The links between environ-ment and health are particularly important for subsistence populations that are heavily
xix

xx Introduction
dependent on the local environment for their food supply. Trace element deficienciesin crops and animals are commonplace over large areas of the world and mineralsupplementation programs are widely practiced in agriculture.
Infectious diseases in humans are also dramatically affected by the geologicalenvironment, albeit indirectly. Geological forces shape the environments in whichmicrobes thrive, sometimes creating opportunities for the emergence of infectiousdiseases as major public health problems.
Because of the emergence of these health problems, there has been a growingawareness of the interaction between the natural environment and animal and humanhealth for the past several decades – medical geology. More and more people in devel-oped and developing countries are becoming aware of the potential health impactscaused by geologic processes along with human activities of all kinds that redis-tribute elements and minerals from sites where they are harmless to places wherethey adversely impact animal and human health.
Medical geology issues transcend political boundaries, and many issues are foundin countries around the globe putting at risk the health of billions of people. A fewexamples will be mentioned here.
Arsenic in drinking water is one example of international concern. Millions ofpeople in Bangladesh and West Bengal, India, suffer from exposure to high arseniclevels in drinking water. Also millions of people in many countries on other continentsare suffering from arsenic exposure or are at risk of arsenic poisoning, a potentiallyfatal health problem.
High fluorine content in drinking water is another medical geology issue causingproblems with teeth and limbs all over the world. Fluorides are ubiquitous in natureand are present in rocks, soil, water, plants, foods, and even air. Excessive ingestionof fluoride through water, food, or dust causes acute toxicity or a debilitating diseasecalled ‘fluorosis.’ Chronic fluoride poisoning is more common and can affect animalsas well as humans. Excessive intake during pre-eruptive stage of teeth leads to den-tal fluorosis and further continued ingestion over years and decades causes bony orskeletal fluorosis.
Iodine deficiency resulting in health problems, such as goiter, affects many mil-lions of people and is a consequence of the local geology, deficiency of the elementiodine in bedrock and soils and thus a deficiency of iodine in the diet.
Selenium is an essential trace element. However, selenium deficiency (due to soilslow in selenium) has been shown to cause severe physiological impairment and organdamage. Several areas in the world have been demonstrated to have soils deficient inselenium. Selenium deficiency is particularly prevalent in China.
Geology is the most important factor controlling the source and distribution ofradon. Relatively high levels of radon emissions are associated with particular typesof bedrock and unconsolidated deposits, for example, some, but not all, granites,phosphatic rocks, and shales rich in organic materials. Inhalation of radon was asevere occupational hazard for uranium miners, commonly resulting in fatal lungcancer.
Balkan endemic nephropathy (BEN), an irreversible kidney disease associatedwith renal pelvic cancer, was thought to be confined to several rural regions of theBalkans, but recently it has been discovered in other parts of the world by medicalgeology scientists.
Atmospheric dust is a global phenomenon. Dust storms from Africa regu-larly reach the European Alps and the Western Hemisphere. Asian dust can reach

Introduction xxi
California in less than a week, some of the dust ultimately crossing the Atlantic andreaching Europe. The ways in which mineral dust impacts upon life and health arewide ranging. These include changes in the planet’s radiative balance, transport ofdisease bacteria to densely populated regions, dumping of wind-blown sediment onpristine coral reefs, general reduction of air quality, provision of essential nutrients totropical rainforests, and transport of toxic substances. Mobilization of dust is both anatural and an anthropogenically triggered process.
This book will cover all these aspects and many more, on a global and regionalscale. Many specialists from all around the globe have contributed with their exper-tise. The book gives many examples of environmental health issues from differentcontinents and also an overview of what is going on now in the field of medical geol-ogy. A truly international book like this also reflects the different scientific culturesfrom all around the world with different terminologies and different ways of thinking.The readers must bear this in mind when reading the book.
Uppsala, Sweden Selinus, OlleWashington, DC Centeno, J.A.Richardson, TX Finkelman, R.B.

Medical Geology Issues in North America
Robert B. Finkelman, Heather Gingerich, Jose A. Centeno, and Gary Krieger
Abstract To a larger degree than most others, NorthAmericans are shielded from the natural environment.Nevertheless, health problems caused by geologicmaterials and geologic processes do occur in NorthAmerica. In contrast to the acute health problemscaused by the geologic environment in developingcountries, in North America these health concerns aremore likely to be chronic, caused by long-term, low-level exposures. Among the potential health concernsthat have received public health attention are exposureto trace elements such as fluorine, arsenic, and radon;exposure to natural mineral dusts; occupational andcommunity exposures to trace elements; and ingestionof naturally occurring organic compounds in drinkingwater. This chapter provides North American examplesof each of these environmental health problems andsuggestions how the earth sciences can be an integralpart of multi-disciplinary teams working to mitigatethese problems.
Keywords United States · Canada · Fluorosis ·Cancer · Asbestos · Black lung disease · BEN · Organiccompounds · Radon · Arsenic · Diabetes · Fluorine
Introduction
To a larger degree than most other people, NorthAmericans are shielded from the natural environment.North Americans commonly live, work, and travel
R.B. Finkelman (�)University of Texas at Dallas, Richardson, TX, 75080, USAe-mail: [email protected]
With contributions by Geoff Plumlee on Evolving Concernsabout Asbestos and A Growing Role for Earth Sciences inEnvironmental Disaster Response and Planning.
in air-conditioned environments; in supermarkets theypurchase foods grown all over the world; most drinkmunicipal water that has been purified; and manytake daily vitamins to supplement dietary deficien-cies. Despite this shielding from the natural environ-ment, health problems caused by geologic materialand geologic process do occur in North America.In contrast to the acute health problems caused bythe geologic environment in developing countries, inNorth America these problems are generally chronic,caused by long-term, low-level exposures.
There is a rich medical geology history in NorthAmerica dating back to 1792 when John Rouelledescribed the medicinal properties of mineral water inVirginia (Rouelle, 1792). The 1970s enjoyed a renais-sance marked by the appearance of a series of publi-cations focused on the impacts of trace elements onhuman health. These publications included GeologicalSociety of America (GSA) Memoir 123 (Cannon andHopps, 1971); GSA Special Paper 140 (Cannon andHopps, 1972); Annals of the New York Academyof Sciences Volume 199 (Hopps and Cannon, 1972);U.S. Geological Survey Professional Paper 574-C(Shacklette et al., 1970); GSA Special Paper 155(Freedman, 1975); and National Research Council(1979).
Changes in staffing and priorities resulted in a hia-tus in North American medical geology activities fromthe 1980s until the mid-1990s. The past decade hasseen a resurgence of interest in medical geology evi-denced by the inclusion of human health issues inthe USGS Strategic Plan (U.S. Geological Survey,2007), the formation of GSA’s Geology and HealthDivision, and strong North American leadership andrepresentation in the International Medical GeologyAssociation.
1O. Selinus et al. (eds.), Medical Geology, International Year of Planet Earth,DOI 10.1007/978-90-481-3430-4_1, © Springer Science+Business Media B.V. 2010

2 R.B. Finkelman et al.
This chapter is not intended to be a compendium ofgeology and health issues in North America. Rather,our objective is to highlight some of the more preva-lent issues such as exposure to selected trace elements,dust, naturally occurring organics, and occupationalhealth issues providing both historical and currentexamples of heath issues caused by geologic materials.
With renewed interest in the links between geologyand health, natural elemental hazards are an impor-tant consideration in the rural areas as well as thedensely populated urban centers of North Americawhere cumulative, low-dose, and long-term exposurescan lead to some of the chronic illness that con-sumes moderate percentages of the national incomes(as GDP) of the United States (15.9%), Canada (9.7%),and Mexico (6.7%), respectively (The Economist, July19, 2007).
Trace Element Exposure
One of the major themes of the geology and healthstory involves acquiring an understanding of the con-sequences of both natural and perturbed cycling ofelements between and within the lithosphere, the atmo-sphere, the hydrosphere, and the biosphere. In somecases, human settlement on our increasingly crowdedlandscape has expanded to include environments thatare “naturally impaired” by either an over-abundanceor a deficiency of elements relative to human andanimal biological requirements.
Where elemental exposures create toxicity, safe-guarding health becomes a matter of finding the“point(s) of intervention” in the Source–Path–Traprelationship, whether it be in air, water, earth materialsor the food chain, and adapting appropriately to thenatural environment in sustainable ways. In otherinstances, the challenge is to distinguish naturalelemental occurrences, which we generally canonly avoid through awareness, from “anthropogenicoverprinting.” Naturally occurring elements suchas fluorine, radon, and arsenic have had variableimpacts on different communities in North Americaas a function of route of exposure and dose. Forexample, US EPA considers that radon, “. . . is theleading cause of lung cancer among non-smokers.Radon is the second leading cause of lung cancer inAmerica and claims about 20,000 lives annually.”(http://www.epa.gov/radon/). Similarly, naturally
occurring arsenic levels in ground water sources canbe a significant issue in many parts of the United Statesespecially in the western mountain regions whereground water levels often exceed regulatory standards(http://www.epa.gov/safewater/arsenic/index.html).
Fluorine
Owing to its extensive use in preventive dentistry inthe post-World War II era, fluorine (F), which is com-monly referred to as its ionic form, fluoride, is oneof the most familiar and controversial elements of thePeriodic Table. Safe, responsible, and sustainable useof fluorides is dependent on decision makers (whetherthey be politicians or parents) having a firm grasp onthree key principles: (i) fluorine is not so much “essen-tial” as it is “everywhere,” (ii) recent human activitieshave significantly increased fluorine exposures to thebiosphere, and (iii) fluorine has biogeochemical effectsbeyond bones and teeth.
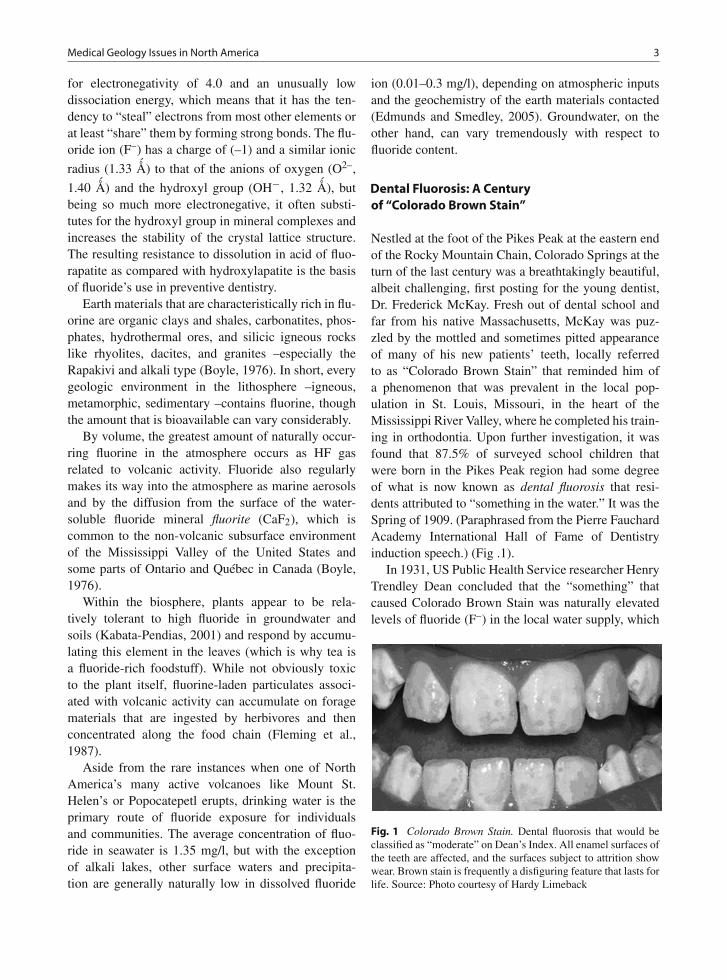
Some of the fluorine that is ingested, imbibed,inhaled, or absorbed through the skin is excreted viathe kidneys after having spent time in the circulatorysystem (WHO, 1997), whereas the balance is inte-grated into the body’s mineralized tissues of teeth,bone (Ledbetter et al., 1960), the pineal gland (Luke,2001), and sometimes as constituents of calculi or“stones” in the kidney, gallbladder, and tonsils. Theeasily identified and irreversible cosmetic, and some-times structural, damage of dental fluorosis (Fig. 1) iscaused by ingestion of excessive fluoride prior to theeruption of the tooth through the gum-line in childhood(Ruan et al., 2007). Skeletal fluorosis mimics a hostof osteological disorders, including osteoarthritis andosteoporosis, and primarily affects adults in middle agealthough earlier incidence can occur in severe cases(Skinner, 2005). The full range in dysfunction associ-ated with systemic fluorosis is still not well understood,although research has found correlations with thyroiddisorders (National Research Council, 2006), certaincancers (Bassin et al., 2006), and deleterious effects onthe brain (Mullenix et al., 1995).
Fluorine is ubiquitous in the natural environment.At the atomic level, fluorine is not only the 14th mostabundant element in the Earth’s crust –more abundantthan any other halogen and even the “Basic BuildingBlock of Life”, carbon (C) –but also supremely reac-tive and oxidative, with the highest Pauling value
Medical Geology Issues in North America 3
for electronegativity of 4.0 and an unusually lowdissociation energy, which means that it has the ten-dency to “steal” electrons from most other elements orat least “share” them by forming strong bonds. The flu-oride ion (F–) has a charge of (–1) and a similar ionic
radius (1.33 Å) to that of the anions of oxygen (O2–,
1.40 Å) and the hydroxyl group (OH−, 1.32 Å), butbeing so much more electronegative, it often substi-tutes for the hydroxyl group in mineral complexes andincreases the stability of the crystal lattice structure.The resulting resistance to dissolution in acid of fluo-rapatite as compared with hydroxylapatite is the basisof fluoride’s use in preventive dentistry.
Earth materials that are characteristically rich in flu-orine are organic clays and shales, carbonatites, phos-phates, hydrothermal ores, and silicic igneous rockslike rhyolites, dacites, and granites –especially theRapakivi and alkali type (Boyle, 1976). In short, everygeologic environment in the lithosphere –igneous,metamorphic, sedimentary –contains fluorine, thoughthe amount that is bioavailable can vary considerably.
By volume, the greatest amount of naturally occur-ring fluorine in the atmosphere occurs as HF gasrelated to volcanic activity. Fluoride also regularlymakes its way into the atmosphere as marine aerosolsand by the diffusion from the surface of the water-soluble fluoride mineral fluorite (CaF2), which iscommon to the non-volcanic subsurface environmentof the Mississippi Valley of the United States andsome parts of Ontario and Québec in Canada (Boyle,1976).
Within the biosphere, plants appear to be rela-tively tolerant to high fluoride in groundwater andsoils (Kabata-Pendias, 2001) and respond by accumu-lating this element in the leaves (which is why tea isa fluoride-rich foodstuff). While not obviously toxicto the plant itself, fluorine-laden particulates associ-ated with volcanic activity can accumulate on foragematerials that are ingested by herbivores and thenconcentrated along the food chain (Fleming et al.,1987).
Aside from the rare instances when one of NorthAmerica’s many active volcanoes like Mount St.Helen’s or Popocatepetl erupts, drinking water is theprimary route of fluoride exposure for individualsand communities. The average concentration of fluo-ride in seawater is 1.35 mg/l, but with the exceptionof alkali lakes, other surface waters and precipita-tion are generally naturally low in dissolved fluoride
ion (0.01–0.3 mg/l), depending on atmospheric inputsand the geochemistry of the earth materials contacted(Edmunds and Smedley, 2005). Groundwater, on theother hand, can vary tremendously with respect tofluoride content.
Dental Fluorosis: A Centuryof “Colorado Brown Stain”
Nestled at the foot of the Pikes Peak at the eastern endof the Rocky Mountain Chain, Colorado Springs at theturn of the last century was a breathtakingly beautiful,albeit challenging, first posting for the young dentist,Dr. Frederick McKay. Fresh out of dental school andfar from his native Massachusetts, McKay was puz-zled by the mottled and sometimes pitted appearanceof many of his new patients’ teeth, locally referredto as “Colorado Brown Stain” that reminded him ofa phenomenon that was prevalent in the local pop-ulation in St. Louis, Missouri, in the heart of theMississippi River Valley, where he completed his train-ing in orthodontia. Upon further investigation, it wasfound that 87.5% of surveyed school children thatwere born in the Pikes Peak region had some degreeof what is now known as dental fluorosis that resi-dents attributed to “something in the water.” It was theSpring of 1909. (Paraphrased from the Pierre FauchardAcademy International Hall of Fame of Dentistryinduction speech.) (Fig .1).
In 1931, US Public Health Service researcher HenryTrendley Dean concluded that the “something” thatcaused Colorado Brown Stain was naturally elevatedlevels of fluoride (F–) in the local water supply, which
Fig. 1 Colorado Brown Stain. Dental fluorosis that would beclassified as “moderate” on Dean’s Index. All enamel surfaces ofthe teeth are affected, and the surfaces subject to attrition showwear. Brown stain is frequently a disfiguring feature that lasts forlife. Source: Photo courtesy of Hardy Limeback

4 R.B. Finkelman et al.
substituted for hydroxyl (OH−) ions of similar sizeand charge in the apatite [Ca10(PO4)6(OH,F,Cl,Br)2]crystals of teeth. Looking at the geology of theColorado Springs area, this is hardly surprising,as there are no less than three significant geogenicsources of fluoride in the environment. With meteoricwaters of low ionic strength and slightly acidic pHcascading off the 1.1 billion year-old Rapakivi granitesof the Pikes Peak Batholith, and at least two majormineralized faults (the Ute Pass and Rampart RangeFaults) that are associated with the Laramide Orogeny(or mountain building event) 65 million years ago,fluoride from easily dissolved minerals would bepicked up and concentrated all along the flow path.Being a black (organic-rich), and therefore alsolikely fluorine enriched, Cretaceous sedimentary unitdeposited sometime over the last 65–145.5 millionyears, the Pierre Shale that underlies Colorado Springswould have contributed even more fluoride to the localwater supply once it bubbled up through the networkof fractures and fissures in the bedrock of the plateau(Fig. 2).
In the decades that followed, dental data have beeninstrumental in identifying fluoride-rich environments,as children are especially susceptible to developingthe tell-tale sign of mottled teeth that they carry intoadulthood due to high fluoride exposure relative totheir low body weight during critical phases in enamelformation. H. Trendley Dean became the first direc-tor of the National Institute of Dental Research in1948 and was able to identify several other geo-chemical environments that are associated with highnaturally occurring fluoride resulting in adverse bio-logical effects within the continental United States.Notable among them are the petroleum-rich Lone StarState which is home to “Texas Teeth” (a southerncousin of “Colorado Brown Stain”), the fault- andfracture-riddled bedrock that hosts the metal-sulfideore deposits of the Upper Mississippi River Valley(noted by Frederick McKay during his time inSt. Louis), the highly metamorphosed coal-bearinghills of Virginia, Maryland, and Pennsylvania alongthe eastern seaboard, and the phosphate-rich FloridaPanhandle (Fig. 3).
Fig. 2 Geologic cross-section of the Pikes Peak area. Clearly anenvironment that would be prone to the development of fluoro-sis in children with three natural sources of fluoride. Naturallyoccurring fluoride in the water supply of nearby Manitou
Springs is reportedly in the 3.0–3.6 mg/L range. Source: Fromhttp://gazetteoutthere.blogspot. com/2007/07/colorado-springs-geology-rocks.html

Medical Geology Issues in North America 5
Fig. 3 Many UScommunities have 0.7 ppm ormore natural fluoride in theirwater supply
Recent Human Activities Have Perturbed NaturalFluorine Cycling
While volcanic eruptions do not happen every day,and few people live in close proximity to an eco-nomically significant mineral deposit, the fluorineexposures of modern North American residents haveincreased dramatically since the end of World WarII when industrial fluorine use became commonplace.Today, the primary sources of anthropogenic fluorineemissions include phosphate fertilizer production, alu-minum and magnesium smelting, coal burning, oilrefining, steel production, chemical production, pri-mary copper and nickel production, clay production,lead and zinc smelting, glass and enamel making, brickand ceramic manufacturing, glues and adhesives pro-duction, fluoridation of drinking water, waste fromsewage sludge, and the production of uranium triflu-oride (UF3) and uranium hexafluoride (UF6) for thenuclear industry (Environment Canada, 2001). Mostof these new sources of fluorine to the atmosphereand hydrosphere are the result of processing Earthmaterials that had previously been largely biologicallyunavailable as little as 60 years ago.
Taken together with the advent of fluorinated agri-chemicals and phosphate fertilizers introduced tothe food chain via intensive agricultural practices
(Hudlicky and Pavlath, 1995), the development andmarketing of an FDA-approved fluoridated toothpasteby Proctor and Gamble Company, and the applica-tion of deep well drilling technology to groundwaterresources (Bailey, 2006, personal communication) thatalso coincided with the post-war era, it is perhapsnot too much of an exaggeration to say that con-sumer choices (i.e., what you eat, where you live,where you get your drinking water) now play a big-ger role in determining overall fluorine exposures thanNature. And whether water in particular is consideredto be “high” or “low” in fluoride is relative only toestablished benchmarks that seem to vary considerablydepending on its intended use but not its eventual fate.
In broad terms, it can be said that groundwater sup-plies in arid climates in North America are more fluo-ride rich than those in temperate climates; that aquifersinfluenced by certain igneous and metamorphic earthmaterials are generally more fluoride-enriched thanaquifers pumping from sedimentary rock (althoughsedimentary aquifers are more widespread); that deep-source bedrock water wells produce more fluoriferouswater as compared to shallow overburden wells; andthat bedrock aquifers that are highly fractured dueto industrial blasting, hydraulic fracturing, meteoriteimpacts, seismicity, and/or glacial isostasy are higherin fluoride than undisturbed formations (Boyle, 1976).

6 R.B. Finkelman et al.
Skeletal Fluorosis: The Danger of DrillingDeeper
In the 1970s, when the shallow dug wells of a smalltown in Canada’s Gaspé Peninsula were no longer ableto meet their needs, the residents of Maria, Québec,did what most rural residents would do –they drilleddeeper. This has become standard practice in mostparts of Canada, where 33% of the population currentlyrely on groundwater resources, especially with mount-ing concerns over the vulnerability of shallow wellsto dropping water table levels associated with climatechange and susceptibility to anthropogenic surfacecontaminants like road salt run-off, landfill and sep-tic system leachate, fertilizers, pesticides, floodwaters,and manure. What the residents did not anticipate whenthey drilled through the 10–30 m (30–100 feet) ofQuaternary glacial tills, whose mean fluoride concen-tration was 0.1 mg/l, was that they had been exposingthemselves to 100 times more fluoride from “fossilwaters” extracted from the highly mineralized andnaturally softened Carboniferous sedimentary bedrockaquifer (Fig. 4).
Although it took several years, eventually the dra-matically increased incidence of osteoarthritis-likesymptoms among Maria residents caught the atten-tion of local public health authorities who, withthe help of a geoscientist well versed in fluoridegeochemistry, diagnosed skeletal fluorosis resulting
from the consumption of fluoride-enriched drinkingwater for as little as 6 years (Boyle and Chagnon,1995). X-rays of the affected individuals would havebeen familiar to Dr. Kaj Roholm, who had observedsimilar effects in the skeletons of Danish cryo-lite (Na3AlF6) workers in Greenland in the 1930s,documenting his findings in the landmark publica-tion, Fluorine Intoxication: A Clinical-Hygienic Studyin 1937 (Roholm, 1937: source of photos below)(Fig. 5).
Dental fluorosis was not prevalent in either the cry-olite workers in Greenland, whose primary route ofexposure was via inhaled dust particles, or the mostlyadult population of 2,500 in the town of Maria becausethe critical period of exposure in the biomineraliza-tion of enamel occurs before a tooth erupts through thegum-line during early childhood. The human skeletonis continuously being re-modeled through the action ofosteoclasts and osteoblasts, replacing itself completelythree times over the course of an average lifespan.Therefore, skeletal fluorosis is the most obvious signof pathology in adults exposed to high levels of fluo-rine but there is some hope of recovery once fluorideinputs have been significantly reduced, whereas dentalfluorosis is irreversible.
Fluorine from any source has biological effectsbeyond human bones and teeth that are consistent withits unique chemical characteristics. From a geologyand health perspective, it is important to realize that
Fig. 4 British postage stampshowing the glaciated terrainof the Gaspé Peninsula and itslocation on the brackishwaters of the St. LawrenceSeaway. The overburden isunder the influence ofmeteoric waters, whereas thepresence of sodium increasesthe solubility of fluorideminerals in the cement of theCarboniferous bedrocksediments

Medical Geology Issues in North America 7
Fig. 5 Chest X-rays of a 51-year-old Danish cryolite worker(left) and a 50-year-old non-worker (right). The sternum is thick-ened and misshapen and the articular surfaces of the costal (rib)bones are sclerosed, making inhalation difficult
fluorine’s function in nature is to facilitate chemicalreactions. It lowers the energy required to both bringcertain elements together and break molecules apart –its behavior remains the same across the lithosphere,atmosphere, biosphere, and hydrosphere. This raisesquestions regarding the extent of the effects of anthro-pogenic fluorine exposures in the human system aswell as the ecosystem, as municipal and industrialwastewaters are discharged into surface water bodiesat levels that are greater than 10 times what sensi-tive aquatic species can tolerate (Environment Canada,2001).
The combination of natural and man-made fluo-rine compounds in the upper atmosphere is resultingin “greenhouse powerhouse” gases like trifluoromethylsulfur pentafluoride (SF5CF3) (Sturges et al., 2000)and fluoride-facilitated mineralization in the pinealgland early in life is thought to be contributing to thepremature sexual maturation (Luke, 1997) with all of
its associated “social system” implications related toearly parenting. Infancy appears to be a critical timewith regard to fluorine exposures and the developmentof symptoms of systemic fluorosis in adulthood, anaspect that was not captured in the early water fluorida-tion studies that lasted only 10 years (Bast et al., 1950).
One of fluorine’s often over-looked effects in thehydrosphere is that it makes lead-, copper-, andcadmium-containing compounds in plumbing pipesand fixtures and cookware more soluble in water,particularly at the higher temperatures that might beexperienced from the water heater to the tap or whilecooking with copper pots (Boyle, 1976). Geochemistrytells us that the corrosivity of a low pH solution(i.e., surface water) is further enhanced when Na+
and Cl− ions are also present (Barnes, 1979), as isthe case when certain disinfecting agents like sodiumhypochlorite or chlorine bleach (NaClO) and chlo-ramine (NH2Cl) are added to naturally or artificiallysoftened water. Many naturally low-fluoride NorthAmerican municipal water supplies are now artifi-cially fluoridated to levels of between 0.6 and 1.2 mg/lusing fluoride salts (NaF, villiaumite also known assodium fluoride) or, more commonly, with fluorine-rich by-products of phosphate fertilizer processing likehydrofluosilicic acid (H2SiF6) that also contain otherelemental constituents like lead, arsenic, and naturalradionuclides because phosphate mineral deposits arenever 100% pure (Wedepohl, 1978).
Systemic Fluorosis: The Catalyst of the Universe
Lead is among the handful of elements that are knownto have adverse neurological effects to which unbornand young children are the most vulnerable due totheir low body weight and susceptible stage of braindevelopment (Gavaghan, 2002). Aside from updatingold infrastructure, recommending to homeowners thatlead plumbing be replaced, and incorporating the useof lead-free materials into the building code, man-agers of municipal water supplies can also controlcorrosion in the system by using some additives thatadjust pH and alkalinity and others that are meant toinhibit leaching through the formation of an inorganicfilm on the inside of the pipes. The effectiveness ofthis last measure will depend heavily on the purityof the corrosion inhibitors (typically orthophosphate,polyphosphate and sodium silicate), as phosphate rock

8 R.B. Finkelman et al.
contains between 10,400 and 42,000 mg/kg of fluorine(Boyle, 1976) and some sodium silicate minerals con-tain up to 5% fluorine by weight (Wedepohl, 1978),possibly doing more harm than good in the cases whereartificial fluoridation is the cause of the corrosion(Fig. 6).
High lead exposures in childhood can have signifi-cant long-term neurological effects that can range fromextremely subtle to gross impacts on motor function.Some research data indicate that high early child-hood exposures are associated with significant long-term effects including lower intellectual performance
Fig. 6 Blood levels in children in Minneapolis collected by the Public Health Unit

Medical Geology Issues in North America 9
Fig. 7 Violent crime incidence for the week of July 29 – August4, 2008 in the Third Precinct of Minneapolis, a US city thatartificially fluoridates its drinking water. Adding fluorosilicatesto weakly-mineralized and low-pH surface water from lakesand rivers increases community lead exposure, particularly in
older and economically-depressed neighborhoods where leadplumbing has not been updated. Fluoride in water also increasesthe leaching of copper, cadmium and zinc from infrastructure,contributing to metal toxicity in consumers
and higher rates of delinquency. Large and long-established communities like Minneapolis, Minnesota(incorporated in 1867), are particularly at risk becauseof the metals in the pipes of the old infrastructurethat is common to the more densely populated andpoorer parts of town where nutritional status is alsolow. Residences closest to the treatment and distri-bution centers might also be receiving higher dosesof chlorine and fluorine (up to 1.2 mg/l) added toMississippi River water as compared to those at “theend of the line.” Though there are more questions thananswers at this point, aided by GIS technology, a multi-disciplinary team of researchers is currently investi-gating different aspects of the relationship betweenfluoride-enhanced lead exposures via drinking waterand violent crime rates in major US cities (Fig. 7).
Prior to the Industrial Revolution, overly fluorine-rich “provinces” were generally restricted to specificnatural environments like coastal, volcanic, and aridareas, or to places with deposits of soluble fluoride
minerals like fluorite (CaF2), villiaumite (NaF), andcryolite (Na3AlF6) and/or rifted, faulted, and fracturedterrain (Edmunds and Smedley, 2005). Given its chem-ical properties, it becomes clear that sufficient fluorineexposure to meet the biological requirements of a par-ticular organism is easily obtained from a variety ofsources –even outside of these “fluoriferous” natu-ral environments –without any effort, and so attentionneeds to be focused on avoiding toxicity.
Fluoride’s geochemical associations with some“bad company” in the public health world, togetherwith the enhanced solubility of certain metals foundin plumbing and fixtures in the presence of fluoridatedwater (particularly with a low pH and low calcium–magnesium content as is common to surface watersources), make it a potentially useful tool for identi-fying communities in environments that are naturallyprone to arsenicosis, heavy metal toxicity, and radongas exposure from the radioactive decay of uranium inearth materials.

10 R.B. Finkelman et al.
Radon
The harmful isotope-222 of the noble gas, radon, isproduced from the natural radioactive decay of radium-226 and uranium-238, but this was not known whenCzech silver miners were suffering from Bergkrankheitor “mountain sickness” in 1550 (Witschi, 2001). Theultimate cause of this pulmonary illness that wasthe cause of death among miners 75% of the time,now diagnosed as lung cancer, was not identifieduntil 1924 –almost 3 decades after Becquerel haddiscovered radioactivity (in 1896) and the husbandand wife team of Pierre and Marie Curie had iso-lated radium (in 1898), and well over a century afterMartin Klaproth extracted uranium from the min-eral pitchblende (in 1789) or uraninite (UO2) (Porterand Ogilvie, 2000). The carcinogenicity of radongas is associated with its decay products, primarilypolonium-218 and polonium-214, which deliver a radi-ologically significant dose of alpha and gamma raysto pulmonary epithelium as inhaled aerosols of short-lived progeny on the way to eventually becoming thestable isotope of lead-206 –a process that takes about22 years (National Research Council, 1999).
Between the mid-1940s and 1990 in North America,several cohorts of more than 3,500 fluorspar and ura-nium miners receiving high occupational exposuresof radon-222 were followed. But before these studieshad concluded, public health researchers were alreadylooking at the carcinogenicity of radon gas expo-sures in North American residential settings (NationalResearch Council, 1999). By the mid-1990s it wasconcluded that 10–15% of lung cancers in the UnitedStates and Canada were caused by radon gas, 90% ofwhich were also smokers.
Radiation in the Navajo Nation
Being primarily engaged in agriculture and other“open-air” activities and originally having low smok-ing rates, lung cancer among Native American Indiansin the southwest was once a rare occurrence (Gottlieband Luverne, 1982). But when vast uranium depositswere discovered beneath their territory in the yearsleading up to World War II, many male members ofthe Navajo Nation were eager for work in the mines soclose to their homes, despite the fact that they wouldbe paid less than minimum wage (between $0.81 and
1.00) for their back-breaking labor. Although theywere doing most of the work by hand in an enclosedspace, they were not provided with any protectiveequipment, as ventilation measures developed from theEuropean experience with “mountain sickness” werepurported to have drastically reduced radon exposures.As is common, the greatest public health failure seemsto have been related to poor communication and lackof education, as there is no word for “radiation” in theNavajo language, and few Navajo miners spoke muchEnglish. Adding to the constellation of factors were thehigh rates of smoking among all miners, particularlyduring wartime and the period immediately following,and lack of clear legislation that required employersand public health researchers to inform workers of theoccupational hazard (Brugge et al., 2006) (Fig. 8).
Fig. 8 Uranium mines and mills in the southwest United Statesemployed many local Native Americans who suffered fromhigh rates of pulmonary illness, including lung cancer. Source:http://www.ehponline.org/docs/2007/115-12/ mining.jpg
The radon story parallels that of fluorine. The earthmaterials that may produce radon are also similar tothose that are known to be high in fluorine, namelysilicic igneous rocks, organic-rich clays and shales,phosphates, carbonatites, and hydrothermal or metaso-matic ore deposits in “structural disconformities” suchas are found in Canada’s Athabasca Basin and variouslocations in the United States (Fig. 9).
The atmosphere and the hydrosphere provide sub-surface pathways for radon into the biosphere, wherehuman exposures occur in the home. Depending on itslocation and construction, radon may be inhaled as it
Medical Geology Issues in North America 11
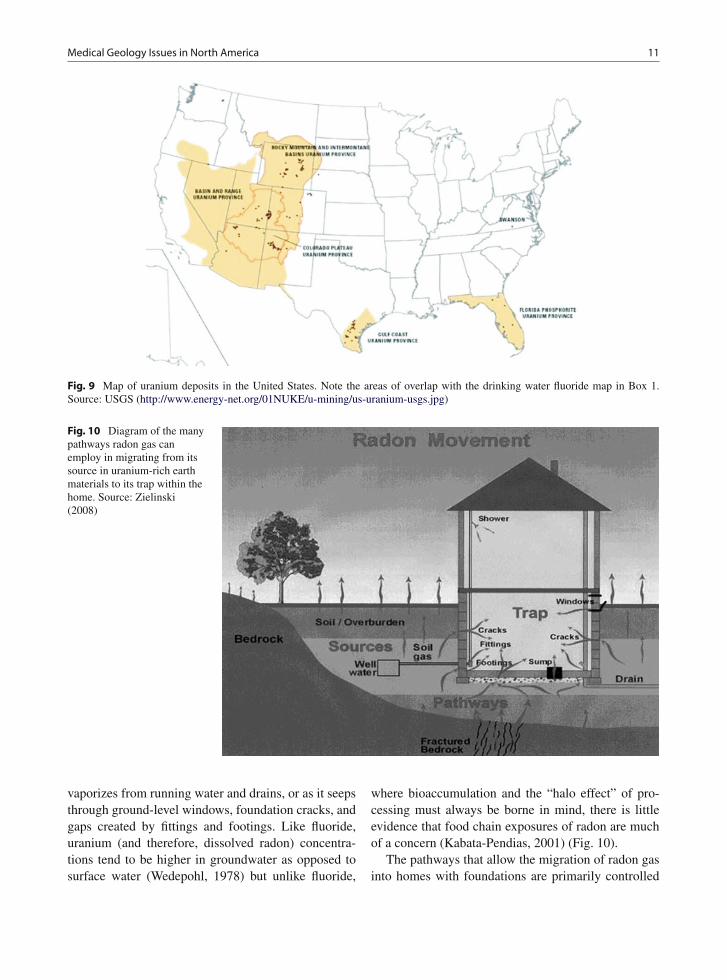
Fig. 9 Map of uranium deposits in the United States. Note the areas of overlap with the drinking water fluoride map in Box 1.Source: USGS (http://www.energy-net.org/01NUKE/u-mining/us-uranium-usgs.jpg)
Fig. 10 Diagram of the manypathways radon gas canemploy in migrating from itssource in uranium-rich earthmaterials to its trap within thehome. Source: Zielinski(2008)
vaporizes from running water and drains, or as it seepsthrough ground-level windows, foundation cracks, andgaps created by fittings and footings. Like fluoride,uranium (and therefore, dissolved radon) concentra-tions tend to be higher in groundwater as opposed tosurface water (Wedepohl, 1978) but unlike fluoride,
where bioaccumulation and the “halo effect” of pro-cessing must always be borne in mind, there is littleevidence that food chain exposures of radon are muchof a concern (Kabata-Pendias, 2001) (Fig. 10).
The pathways that allow the migration of radon gasinto homes with foundations are primarily controlled

12 R.B. Finkelman et al.
by rock mechanics and climate, which determine thenumber and “connectedness” of potential conduits,mineral surface area, atmospheric pressure, and per-meability of the channels due to saturation with water.In this way, radon gas hazards may present intermit-tently in a wide variety of geochemical environments,making geologic hazard identification difficult, espe-cially when considering the effects of global climatechange. It is conceivable that dropping water table lev-els and the “drying up” of clay- and organic-rich soilswill create new pathways for the liberation of signifi-cant amounts of radon gas into existing homes or thatsoils relocated by extreme weather events like hurri-canes or airborne dusts from dried-up lakebeds anddeforestation could lay dangerous foundations for newconstruction in areas that are not currently consideredto be radon gas prone.
Lung Cancer Hot Spots
Thick Palaeozoic sedimentary bedrock units underliethe most densely populated parts of Ontario, and so itis not surprising that lung cancer rates in this provincelag significantly behind those of Nova Scotia, NewBrunswick, and Québec (Canadian Cancer Society,2008) where more of the Canadian Shield is exposed(Fig. 11). However, the influence of uranium-rich claysbecomes apparent when looking at the intra-provincial
lung cancer statistics. Both lung cancer morbidity andmortality rates for the province are highest in areasunderlain by heavy clay (Fig. 12, zone 1) and CanadianShield (zones 10, 12, 13, and 14). Predictably, the low-est rates of incidence and death from lung cancer arereported for the Central zone (8) which covers thehighlands formed by the Algonquin Arch but which isunderlain by a thick blanket of coarse Quaternary sed-iments that are low in uranium content and Palaeozoicbedrock (Cancer Care Ontario, 2006 2004 data).
Internationally, the generally accepted guideline forresidential exposures is 200 Bq/m3. If this thresholdis exceeded, the recommended remedial measures areinexpensive, simple to implement, and can generallybe completed in a short period of time. In so doing,it is estimated that hundreds of cases of lung cancerper year could be prevented in North America, thussignificantly reducing the burden on the health-caresystem.
Arsenic
Arsenic contamination through natural (geogenic) andanthropogenic sources is a serious threat to humansall over the world. Several epidemiological studieshave documented the global impact of arsenic con-tamination and the characterization of the sources ofexposure. The health effects of chronic exposure to
Fig. 11 Map of uranium (U)in the A horizon of southernOntario. Dark gray “hot spots”of higher U concentrations insoil are indicative of apotential radon gas hazard.Source: Map compiled byR. Klassen from unpublishedGeological Survey of Canadadata collected by D. Sharpe

Medical Geology Issues in North America 13
Fig. 12 Map of local health integration networks in the provinceof Ontario. 1 – Erie St. Clair, 2 – South West, 3 – WaterlooWellington, 4 – Hamilton Niagara Haldimand Brant, 5 – CentralWest, 6 – Mississauga Halton, 7 – Toronto Central, 8 – Central,9 – Central East, 10 – South East, 11 – Champlain, 12 – NorthSimcoe Muskoka, 13 – North East, 14 – North West. Source:http://www.lhins.on.ca/FindYourLHIN.aspx
arsenic are well established in countries with higharsenic in drinking water; however, such evidence isnot so readily available in countries with lower lev-els of environmental arsenic, or treated drinking watersystems. Of more relevance to developed and indus-trialized countries, such as the United States, are thepotential health consequences of long–term, low-levelexposure via drinking water or through occupation ormedical use although the relationship between healtheffects and exposure to drinking water arsenic is notwell established in US populations (Lewis et al., 1999).We provide here an overview of the state of arsenicstudies in the United States and a discussion of theavailable epidemiological and human health literaturein the United States.
Epidemiological and EnvironmentalHealth Studies on Arsenic Exposure
Areas of the United States have been affected byarsenic in drinking water, especially in areas close tomining sites, for example, Twisp, Okanogan County,Washington (Peplow and Edmonds 2004) and NewHampshire (Karagas et al., 2002). Recently, the USGeological Survey (USGS) published an updatedversion of a map illustrating “Arsenic in Ground Waterof the United States.” The map was generated from
the most recent arsenic measurements from 31,350wells and springs showing national level patterns ofnaturally occurring arsenic in ground water resourcesof the United States and Puerto Rico. The data setdisplayed on this map is a moving 75th percentile,which is the maximum arsenic concentration foundin 75% of samples within a moving 50 km radius(the median size of a US county; USGS, 2005).The USGS map shows that there are parts of manystates affected by high levels of arsenic in ground-water, following the new USEPA MCL for 10 μg/l(http://water.usgs.gov/nawqa/trace/pubs/geo_v46n11/fig2.html).
Several recent studies have been published concern-ing the distribution of arsenic levels in the US drinkingwater supplies. A study by Frost et al. (2003) identified33 counties in 11 states with an estimated mean drink-ing water arsenic concentration of 10 μg/l or greater.A total of 11 of these counties have an estimated meanarsenic concentration of 20 μg/l or more, and two havean estimated mean arsenic concentration of 50 μg/l ormore. Domestic wells are a particular issue, for exam-ple, in New Hampshire, domestic wells serve roughly40% of the population, and about 10% of these containarsenic concentrations in the controversial range of 10–50 μg/l (Karagas et al., 2002). Based on census data,between 1950 and 1999 there were approximately 51.1million person-years of exposure to drinking waterarsenic at levels of 10 μg/l or more, 8.2 million atlevels of 20 μg/l or more, and 0.9 million at levels of50 μg/l or more (Frost et al., 2003).
Although several studies have described the dis-tribution of arsenic within the US drinking watersupplies, there is a lack of epidemiologic data toindicate disease associations within the United States(Brown and Ross, 2002). It has been suggested that themortality and incidence of diseases known to be asso-ciated with arsenic exposure should be examined inother high exposure State/Counties as part of an assess-ment of arsenic health effect in US populations (Frostet al., 2003).
Cardiovascular Effects
The association of drinking water arsenic and mor-tality outcome was investigated in a cohort of res-idents from Millard County, Utah. Median drinkingwater arsenic concentrations for selected towns ranged

14 R.B. Finkelman et al.
from 14 to 166 μg/l and were from public and pri-vate samples. Standard mortality ratios (SMRs) werecalculated. Statistically significant findings includedincreased mortality from hypertensive heart diseaseamong males (SMR 2.20, 95% CI (confidence inter-val) 1.36–3.36), increased mortality for hypertensiveheart disease among females (SMR 1.73, 95% CI1.11–2.58), and for the category of all other heartdisease (SMR 1.43, 95% CI 1.11–1.80) (Lewis et al.,1999).
A case–control study in the United States inves-tigated the association between chemicals in mater-nal drinking water consumed during pregnancy andcongenital heart disease in the offspring. Two hundredand seventy affected children and 665 healthy chil-dren took part in the study. Data included informationon contaminant levels in maternal drinking water andon health, pregnancy management, and demographiccharacteristics. Nine inorganic metals were analyzedfor detection of an association with congenital heartdisease. Arsenic exposure at any detectable level wasassociated with a threefold increase in occurrence ofcontraction of the aorta (OR (odd ratios) 3.4, 95% CI1.3–8.9) (Zierler et al., 1988).
A recent US study analyzed water samples andused self-report format for 1,185 people who reporteddrinking arsenic-contaminated water for more than 20years. They found that respondents with arsenic lev-els of >2 μg/l were statistically more likely to reporta history of depression, high blood pressure, circula-tory problems, and heart bypass surgery (Zierold et al.,2004).
Diabetes Mellitus
Diabetes is a major source of morbidity and mor-tality in the United States and recent studies havereported an increase in the incidence and prevalenceof this disease. For example, the overall prevalencerose from 4.9% in 1990 to 6.5% in 1998 (Mokdadet al., 2001). As discussed, diabetes has recently beenfound to be associated with arsenic exposure in someepidemiologic studies, predominantly on studies con-ducted in Taiwan (Lai et al., 1994; Tseng et al., 2002),However, no work to date has been undertaken exam-ining the relationship between diabetes mellitus withlower chronic doses of arsenic in drinking water in theUnited States.
Skin Cancer
A case–control study examining the associationbetween drinking water and cutaneous melanoma inIowa was undertaken. This study found an increasedrisk of melanoma for participants with elevated toe-nail arsenic concentrations (OR 2.1, 95% CI 1.4, 3.3).This is the first study to find a significant associationbetween arsenic and melanoma in the United Statesand warrants further investigation (Beane Freemanet al., 2004).
Lung, Stomach, and Colon Cancer
Increased risk for lung cancer with arsenic exposurehas been consistently observed in ecological, case–control, and cohort studies in Taiwan, Japan, Chile,and Argentina, but not yet in the United States (WHO,2004). Significant excess mortality from cancers ofthe digestive tract has been observed among cop-per smelter workers in Anaconda, Montana, with astandardized mortality ratio of 1.3 (Enterline et al.,1987) only a slight excess in mortality from digestivetract cancer was observed among smelter workers inTacoma, Washington. Colon cancer mortality has alsobeen significantly associated with chronic exposuresto inorganic arsenic among copper smelter workers inTacoma, Washington, with a significant standardizedmortality ratio of 2.1 for those who were employedbefore respirators were implemented in the smelterexposure areas (Enterline et al., 1987).
Breast Cancer
An association between arsenic exposure and breastcancer has been investigated but not confirmed.The associations between toenail levels of five traceelements and breast cancer risk were studied amonga cohort of 62,641 US women who were free fromdiagnosed breast cancer in 1982. Among 433 cases ofbreast cancer identified during 4 years of follow-up andtheir matched controls, the OR comparing the highestwith the lowest quintiles was 1.12 (95% CI 0.66–1.91).Even though breast cancer is examined as part of thisepidemiological exercise, results to date do not provideevidence for an effect of arsenic on breast cancer risk(Garland et al., 1996).

Medical Geology Issues in North America 15
Bladder Cancer
New Hampshire is known to have high arsenic ingroundwater and along with other States in NewEngland has among the highest bladder cancermortality rates in the country. These facts prompted alarge case–control study to be undertaken in this regionexamining toenail arsenic levels and their associationwith skin and bladder cancer (Karagas et al., 1998).The OR for squamous cell carcinoma (SCC) and basalcell carcinoma (BCC) were close to unity in all but thehighest arsenic percentile category. Among individu-als with toenail arsenic concentrations above the 97thpercentile, the adjusted ORs were 2.07 (95% CI 0.92–4.66) for SCC and 1.44 (95% CI 0.74–2.81) for BCC,compared with those with concentrations at or belowthe median (Karagas et al., 2002). Among smokers, anelevated OR for bladder cancer was observed for theuppermost arsenic category (OR 2.17, 95% CI 0.92–5.11) (Karagas et al., 2004). However, because the 95%CI includes the value 1.0, arsenic levels cannot be con-sidered a useful predictor variable, thus these resultsmerely suggest an association between arsenic and thecancers examined and indicate that smoking may actas a co-carcinogen.
Ayotte et al. (2006) found a statistically significantpositive correlation between residential bladder cancermortality rates and private water supply use in NewEngland. Previous studies (Montgomery et al., 2003)found elevated levels of arsenic in the well water.
Prostate Cancer
Epidemiologic studies have suggested a possible asso-ciation between exposure to inorganic arsenic andprostate cancer (Wu et al., 1989; Chen and Wang,1990), including a recent study of populations residingin the United States, in which SMR analysis by low-,medium-, and high-arsenic exposure groups indicateda dose relationship for prostate cancer (Lewis et al.,1999). Prostate cancer SMR was 1.45 (95% CI 1.07–1.91). A study by Achanzar et al. (2002) which foundhuman prostate epithelial cells are directly suscepti-ble to the transforming effects of inorganic arsenite.Another study on the effect of chronic oral exposureto arsenic on male mouse testicular and accessory sexorgan weights, sperm parameters, testicular markerenzymes, and distribution of arsenic in reproductive
organs, found a significant accumulation of arsenic intestes, epididymis, seminal vesicle, and prostate glandin treated animals (Pant et al., 2004). These laboratorystudies show biological plausibility in the relationshipbetween arsenic and prostate cancer.
The health effects of chronic exposure to arsenicare well established in countries with high levels ofdrinking water arsenic; however, such evidence is notso readily available in countries with lower levels ofarsenic, such as the United States. The research thathas been undertaken in the United States is limited andmuch of what has been undertaken is not definitive.
From the studies that have been carried out in theUnited States, some have found a statistically signif-icant association between disease and arsenic levels,most consistently the cardiovascular studies (Lewiset al., 1999, Zierler, et al., 1988, Zierold et al., 2004).Prostate cancer also showed a significant associationwith arsenic levels (Lewis et al., 1999), which has beenfound to be biologically plausible in laboratory stud-ies (Achanzar et al., 2002, Pant et al., 2004). Finally,a study on the risk of melanoma found a significantassociation with elevated toenail arsenic concentra-tions (Beane Freeman et al., 2004). In the United Statesthe arsenic-related environmental etiology of severalchronic diseases warrants further investigation.
Naturally Occurring OrganicCompounds
Long-term exposure to low levels of organic sub-stances leached from low-rank coal aquifers has beenhypothesized to be linked to kidney disease and uri-nary system cancers (Orem et al., 2007). This link hasbeen most firmly established in the case of BalkanEndemic Nephropathy (BEN), a fatal kidney dis-ease with associated renal/pelvic cancer that occurs inrestricted areas of the Balkans where Pliocene lignitesdeposits are present (Tatu et al., 1998). In north-western Louisiana, where lignites underlie a regionhaving an elevated incidence of renal pelvic cancers,recent studies have shown that a suite of coal-derivedorganic substances occur in drinking water supplies,resembling those observed in drinking water sup-plies from areas impacted by BEN (Bunnell et al.,2006). Recently (Peterson et al., 2009) collected watersamples from two counties in East Texas reportedto have relatively high incidences of renal/pelvic

16 R.B. Finkelman et al.
cancer. Dichloromethane extractable organic com-pounds in the water samples were identified bygas chromatography/mass spectrometry. Compoundspresent in the water samples included some sub-stituted polycyclic aromatic hydrocarbons (mostlylower molecular weight), heterocyclic and substitutedaromatics, phenols, terpenoids, and aliphatic hydro-carbons at sub-microgram/liter levels. This suite oforganic compounds is similar to those observed inother coal containing aquifers. These results suggestthat a BEN-like health problem may exist in the GulfCoast region of the United States.
Evolving Concerns About Asbestos
Asbestos is a term applied to a group of fibrous sili-cate minerals that were mined and used commerciallyfor centuries, primarily because of their flexibility,weavability, high tensile strength, and resistance toheat, chemicals, and electricity. The potential healtheffects of exposure to asbestos have been recognizedfor decades and include diseases such as asbestosis,mesothelioma cancer, lung cancer, pleural plaques,pleural thickening, and others (Roggli et al., 2004;Dodson and Hammar, 2006). These diseases are knownto result from occupational exposures to high levelsof asbestos dusts. As a result, mining and processingof asbestos ceased in the United States in 2002, andUS commercial use of asbestos has plummeted sincethe 1970s; however, some asbestos is still imported foruse in some commercial applications such as roofing(Virta, 2009).
In spite of decades of research into the healtheffects of asbestos, substantial debate continues as tothe exact mechanisms of toxicity, the potential healtheffects of low-level exposures, potential health effectsof elongated mineral particles that do not fit compo-sitional or morphological definitions of asbestos, andother aspects (NIOSH, 2009; Plumlee and Ziegler,2007; Roggli et al., 2004; Dodson and Hammar, 2006).Further, the last decade has seen a substantial increasein public health concern about potential health effectsresulting from occupational and environmental expo-sures to dusts generated by mining of mineral depositsthat contain asbestos as a natural contaminant, or bynatural weathering or human disturbance of rock typesthat contain naturally occurring asbestos (Van Gosen,2009; Harper, 2008; Pan et al., 2005).
Vermiculite deposits mined at Libby, Montana,from 1923 to 1990 provided the bulk of the Nation’svermiculite used commercially during that time period.High rates of asbestos-related disease are noted inLibby vermiculite miners and workers exposed occu-pationally, in their family members, and in Libbytownspeople with no occupational connection to themine (Peipins et al., 2003; Sullivan, 2007). Elevatedrates of asbestos-related disease are also noted in com-munities elsewhere in the United States that receivedand processed vermiculite ore from Libby (Hortonet al., 2008). It is generally agreed that the source ofthese diseases was exposure to asbestiform and fibrousamphiboles intergrown with the Libby vermiculite thatwere released into the air as the vermiculite was mined,processed, or otherwise disturbed.
Rocks that contain natural asbestos are found in 35of the 50 United States (Van Gosen, 2009). As theserocks are weathered naturally, mined for aggregate orindustrial mineral commodities, or exposed by earthmoving for road and building construction, there isthe potential for release of asbestos-containing dustsinto the environment. In the last decade, substantialdebate has developed as to whether these dusts posea health risk to residents and workers alike. The debatehas been particularly intense in the area around ElDorado Hills, California, an area that is underlain byserpentinites and other ultramafic rocks that containchrysotile and tremolite–actinolite asbestos (Harper,2008; Van Gosen, 2007; USEPA, 2006). Asbestosoccurrences in or released from their original geologicsource rocks, or soils derived naturally from thoserocks have been termed “naturally occurring asbestos,”or “NOA” (Harper, 2008).
How Earth Sciences Can Help
Earth sciences investigations are providing importantcontributions on a wide variety of asbestos issues,ranging from policy-making to fundamental healthresearch. On a local to regional scale, fundamen-tal geologic mapping, remote sensing, geophysical,and related characterization studies are helping mapthe distribution and mineralogical characteristics ofasbestos-containing rocks (Churchill and Hill, 2000;Clinkenbeard et al., 2002; Swayze et al., 2009). Insome jurisdictions such as California and FairfaxCounty, Virginia, geologic mapping forms the basis

Medical Geology Issues in North America 17
of policies requiring enhanced dust control measuresand other practices in areas underlain by asbestos-containing rocks.
Studies are underway to inventory asbestos locali-ties and map the distribution of geologically favorablerock types containing asbestos across the United States(Van Gosen, 2007, 2009). These studies are needed toaid in the interpretation of regional to national scaleepidemiological data on asbestos-related diseases, withthe ultimate goal of understanding better the healthrisks associated with living on or rocks containingNOA (Pan et al., 2005).
Mineralogical characterization studies are essentialto help understand the nature of the particles to whichaffected populations have been exposed. For exam-ple, mineralogical characterization has shown that theLibby amphiboles occur in a range of morphologiesand chemical compositions, only a subset of which hasbeen traditionally regulated as “asbestos” (Meeker et.al, 2003). In El Dorado Hills, California, mineralogi-cal studies also documented a wide range of elongatedparticle types in air samples that would all be countedas potentially hazardous under current regulations, butonly a subset of these particles is truly asbestiform(Meeker et al., 2006).
Other areas in which earth scientists work in col-laboration with health scientists can contribute include(Plumlee et al., 2006; Plumlee and Ziegler, 2007;NIOSH, 2009) characterization of dosing materialsused in asbestos-related toxicity testing; characteriz-ing particles to which various worker cohorts havingelevated asbestos-related disease rates were exposed;examining dissolution rates of asbestos and other min-eral particles in body fluids encountered along inhala-tion and ingestion exposure pathways; examining otherchemical interactions of particles with the body, andhow these interactions (such as oxidation–reductionreactions that generate free radicals and oxidativestress) may influence toxicity in the body.
A Growing Role for Earth Sciencesin Environmental Disaster Responseand Planning
Natural and anthropogenic disasters (e.g., earthquakes,volcanic eruptions, wildfires, urban fires, landslides,hurricanes, tsunamis, floods, industrial spills, terrorist
attacks) can produce copious solid, gaseous, or liq-uid materials of potential environmental and publichealth concern. Examples include contaminated and/orpathogen-bearing waters, dusts, soils, and sediments;liquids; gases; smoke; ash; and debris. Many of thesematerials are derived from the earth, geochemical pro-cesses influence how they evolve in the environment,and their geochemical characteristics can stronglyinfluence their potential impacts on the environmentand health (Plumlee and Ziegler, 2007). As a result,there is a growing role for process-focused earth sci-ence expertise and methods applied to environmentaldisaster response and planning.
Volcanologists have had a long history of helpingassess impacts of volcanic ash and gases on theenvironment and health, and Mt. St. Helens andKilauea volcanoes in the United States have playedprominently in these studies. Water leach studies ofash have documented that rain waters falling ontofresh ash could become quite acidic, due to theliberation of acidic gas species that had condensedonto the ash particles in the eruption cloud (Hinkleyand Smith, 1987; Witham et al., 2005). Studies ofother eruptions from around the world have regularlydemonstrated that fluoride can be leached in sufficientquantities from ash to trigger fluorosis in humans andother animals that consume water affected by ash, oranimals that eat vegetation coated by ash (Weinsteinand Cook, 2005). Volcanology collaborations withthe public health community have helped elucidateand communicate to the public the health hazardsassociated with exposure to volcanic fog (vog) ema-nating from volcanoes, and laze (lava haze) producedwhen lava flows into seawater (USGS, 2008). Recentarticles provide excellent summaries of the potentialhealth hazards associated with respiratory exposureto volcanic ash (Hansell et al., 2006; Horwell andBaxter, 2006; Weinstein and Cook, 2005), and toxico-logically important reactions involving ash (Horwellet al., 2007). Other information on volcanic ash canbe found through web sites of the US GeologicalSurvey (http://volcanoes.usgs.gov/ash/health/) andInternational Volcanic Health Hazards Network(http://www.ivhhn.org).
The outbreak of the fungal disease Valley Feverin humans and sea otters immediately following the1994 Northridge, California, earthquake is often citedas an example of the links between earth processes,geophysical disasters, and health. Landslide specialists

18 R.B. Finkelman et al.
worked directly with public health experts to helpexamine the timing and spatial distribution of sickenedpeople and were able to determine that the outbreakoriginated through exposures to dust clouds generatedduring earthquake-triggered landslides (Jibson et al.,1998; Schneider et al., 1997). The landslides had dis-turbed soils that contained spores of the pathogenic soilfungus Coccidioides immitis, the etiological agent ofValley Fever that is endemic to soils in much of the USdesert southwest. Since 1994, substantial research hasfocused on determining potential geological and othercontrols on the habitat of C. immitis in soils (Bultmanet al., 2005; Fisher et al., 2007).
In the last decade, interdisciplinary earth sciencestudies have helped provide insights into the poten-tial environmental- and health-hazard characteristics ofmaterials produced by a number of natural and anthro-pogenic disasters in addition to volcanic eruptions,including
• dust and debris produced by the attacks on and col-lapse of the World Trade Center towers (Clark et al.,2001, 2005; Plumlee et al., 2005; Meeker et al.,2005; Swayze et al., 2005);
• flood waters and flood sediments left in the greaterNew Orleans area by 2005 hurricanes Katrina andRita (e.g., Pardue et al., 2005; Plumlee et al., 2006;Presley et al., 2006; Van Metre et al., 2006; Cobbet al., 2006; Plumlee et al., 2007a; Farris et al.,2007; USEPA, 2005–2008; Griffin et al., 2009);
• ash and burned soils from wildfires (Plumlee et al.,2007b; Wolf et al., 2008);
• mud from the ongoing LUSI, East Java mud vol-cano eruption (Plumlee et al., 2008).
How Earth Sciences Can Help
These studies collectively demonstrate that impor-tant contributions can be made in disaster responsefrom across the earth science disciplines, includinggeology, geophysics, geochemistry, hydrology, remotesensing, geomicrobiology, and others. For example,during a disaster, earth scientists can, in collabora-tion with emergency managers, public health experts,microbiologists, and ecologists, help to
• characterize the physical, chemical, and microbialmakeup of materials generated by the disaster;
• identify source(s) of the materials;• monitor, map, and/or model dispersal and evolution
of materials in the environment;• understand how the materials are modified by envi-
ronmental processes;• identify key characteristics and processes that influ-
ence the materials’ toxicity to exposed humans andecosystems; and
• estimate shifts away from pre-disaster environmen-tal baseline conditions.
The key goal of all these studies is to help define themagnitude and nature of the environmental and healthrisks posed by a specific disaster, both spatially andover time.
In addition, results from past responses can be usedto anticipate and plan for future disasters. As part ofdisaster preparedness, earth scientists can
• measure and compile data on pre-disaster environ-mental baseline conditions;
• develop models for the environmental behavior andeffects of materials generated by similar types ofdisasters;
• develop a resource of appropriate data and methodsthat can be used to enhance and guide responses tofuture environmental disasters; and
• work with emergency planners to help miti-gate effects of and improve resiliency to futuredisasters.
Occupational Health Issues
Occupational health issues associated with metalsexposure are both industry and metal specific. Whilethere are a large number of metals that are importantin a workplace setting, there are six “heavy metals”that are considered to be the most significant in termsof potential toxicity to exposed workers. These arearsenic, beryllium, cadmium, hexavalent chromium,lead, and mercury. The other metals of significanceinclude Al, Sb, Co, Cu, Fe, Mn, Mo, Ni, Se, Ag, Sn,V, and Zn. Each of these metals can also producepotentially significant dose-related health effects.
Unlike the situation associated with communityexposures where either the food pathway or directsoil ingestion routes dominate, in an industrial setting,

Medical Geology Issues in North America 19
the dominant pathway is air. Occupational exposurestandards are primarily focused on the air pathway,as neither the dermal nor direct ingestion routes ofexposure are typically as significant in comparisonto the air route. The exceptions to this observationare beryllium and hexavalent chromium where dermalexposures are important potential routes of exposureand health effects.
In general, there are several important questions thatshould be considered when analyzing the potential foradverse effects from workplace exposures to metals:
1. What industrial operations are typically associatedwith workplace exposures to the metal under con-sideration?
2. What health effects are associated with exposuredose to the specific metal?
3. How are exposure and/or dose evaluated?4. What are the relevant regulatory exposure stan-
dards?5. What are some of the typical strategies utilized to
minimize or prevent exposure?
The first four questions tend to be substancespecific and will be briefly summarized for eachof the most important “heavy metals.” However,regulatory standards are country specific and thereader should always consult the most current avail-able guidance. Health effects are metal and dosespecific. Simply listing observed generic clinicaleffects, e.g., rash, cough, fatigue, provides little orno useful information as health effects are stronglydose related. Exposure minimization strategiesapply to all of the metals. Excellent sources ofinformation for both toxicology and occupationalexposures, including regulatory considerations are (i)Agency for Toxic Substance and Disease Registry(ATSDR) site, http://www.atsdr.cdc.gov/toxpro2.html;(ii) Occupational Health and Safety Administration(OSHA) site, http://www.osha.gov/SLTC/metalsheavy/index.html; and (iii) Canadian Centre for Occupationalhealth and Safety (CCOHS) site, http://www.ccohs.ca/
Arsenic: Potential exposures to inorganic arsenicand its compounds include coke oven emissions, smelt-ing, wood preservation, glass production, nonferrousmetal alloys, and electronic semiconductor manufac-turing industries.
Chronic long-term exposure can lead to specificforms of dermatitis, mild pigmentation keratosis of the
skin, vasospasticity, gross pigmentation with hyperker-atinization of exposed areas, and wart formation. Thesehealth effects are not due to direct dermal exposurebut instead can be observed in individuals exposedby inhalation or ingestion, particularly via contami-nated drinking water. Arsenic-related skin lesions havebeen well described when exposures were due to highlevels, either anthropogenic or naturally occurring, indrinking water. Arsenic is considered to be a knownhuman carcinogen via chronic high-dose inhalationexposure.
Exposures are determined by a combination of (i)airborne industrial hygiene sampling, e.g., personaland/or area and/or (ii) biological monitoring which caninclude blood and urine sampling.
Beryllium: Occupational exposure can occur in min-ing, extraction, and in the processing of alloy metalscontaining beryllium. There are significant applica-tions in the aerospace, nuclear, and manufacturingindustries. Beryllium is extremely light weight andstiff; hence it has wide usage in dental appliances, golfclubs, non-sparking tools, wheel chairs, and electronicdevices.
The adverse health effects of beryllium exposureare due to an immunological reaction that produces anallergic-type response. According to OSHA, approx-imately 1–15% of all people occupationally exposedto beryllium in air become sensitive to berylliumand may develop chronic beryllium disease (CBD),an irreversible and sometimes fatal scarring of thelungs.
Air, wipe, and bulk sampling techniques can beused to measure occupational exposures. A specificblood test, the beryllium lymphocyte proliferation test(BeLPT), is an important screening tool that has beendeveloped in order to determine which workers havebecome sensitized to beryllium.
Cadmium: Most cadmium exposures are associ-ated with workplaces where ores are processed orsmelted. Exposures in electroplating, and weldingoperations have also been observed. Cadmium isalso a component of certain industrial paints andis utilized in the manufacture of nickel–cadmiumbatteries.
Cadmium toxicology is quite complex with targetorgans primarily centered on the lung and kidney.Cadmium is considered to be a potential lung humancarcinogen via inhalation exposures. The kidney is animportant target that exhibits threshold effects, i.e.,

20 R.B. Finkelman et al.
an overall “critical concentration” is observed prior todevelopment of observable adverse effects.
Both industrial hygiene (air) and biological moni-toring (urine) are used for determining exposures andas regulatory compliance monitors.
Chromium-hexavalent (Cr+6): Toxicity tochromium is directly related to valence state, i.e.,the more common naturally occurring trivalentform (Cr+3) has an extremely low toxicity profile.According to OSHA, occupational exposures are asso-ciated with workers who handle pigments containingdry chromate, spray paints and coatings containingchromate, operate chrome-plating baths, and weld orcut metals containing chromium, such as stainlesssteel. Hexavalent chromium compounds includechromate pigments in dyes, paints, inks, and plastics;chromates added as anticorrosive agents to paints,primers, and other surface coatings; and chromic acidelectroplated onto metal parts to provide a decorativeor protective coating. Hexavalent chromium can becreated during “hot work” i.e., welding on stainlesssteel or melting chromium metal. In these situationsthe high temperatures involved in the process oxidizethe Cr+3 to the hexavalent state.
Exposures can occur via inhalation, dermal expo-sure, and ingestion. The most significant routes areinhalation and dermal (skin and eye) and the upperrespiratory tract and lung are the most important tar-get organs for toxicity with increased lung cancer ratesobserved in a dose-related exposure pattern.
Both industrial hygiene (air) and biological moni-toring (urine) are used for determining exposures. Airexposures are used for regulatory compliance moni-tors. Biological exposure indices can be performed;however, pre- and post-shift monitoring of urine is nec-essary as the urine test measures Cr+3 a normal dietaryintake component.
Lead: Lead exposures are one of the most commonin an industrial setting. OSHA considers lead exposureas a leading cause of chemical-related workplace ill-ness. Aside from mining and smelting, lead is foundin numerous industrial settings. In addition, work-ers can be exposed to lead while working at certainhazardous waste sites or during remediation of olderhousing stock where lead-based paints were com-monly used. According to OSHA, standard particulatesampling techniques are used to evaluate lead expo-sures. Wipe sampling can indicate potential for leadingestion.
Toxicity in workers can be acute or chronic andis typically dose related. Symptoms of lead toxicityinclude loss of appetite, nausea, vomiting, stomachcramps, constipation, difficulty in sleeping, fatigue,moodiness, headache, joint or muscle aches, anemia,and decreased sexual drive. However, these symptomsare non-specific and can be commonly elicited dur-ing a history and physical examination. Hence the useof biological monitoring is extremely important, i.e.,measuring the blood lead level.
Target organs include blood-forming, nervous,renal, and reproductive systems. Both air samplingand biological monitoring are mainstays for expo-sure determination and are also used for regulatorycompliance.
Mercury: Exposure can occur during mining andrefining of gold and silver ores. Unlike commer-cial gold miners who use cyanide-based processes,“artisanal” miners commonly use mercury in theirsmall-scale extraction efforts. Mercury can be foundin thermometers, manometers, barometers, gauges,valves, switches, batteries, and high-intensity dis-charge (HID) lamps. Mercury is also used in amalgamsfor dentistry, preservatives, heat transfer technology,pigments, catalysts, and lubricating oils.
In the workplace, mercury can be found in threeforms (i) elemental (metallic); (ii) inorganic, i.e., typi-cally combined with chlorine, sulfur, and oxygen; and(iii) organic, i.e., combined with carbon or carbon-containing substances into straight (alkyl) or aromatic(aryl) ring forms. In general the alkyl forms are themost toxic although all forms exhibit a dose-relatedtoxicity pattern.
Both air sampling and biological monitoring aremainstays for exposure determination. Regulatoryagencies have issued specific standards for the majormercury compounds; hence, it is critical to determinewhich category a compound belongs to before com-paring it with a standard or determining its relativetoxicity.
Regardless of the specific chemical, workplaceexposure control strategies are based on engineer-ing controls, administrative controls, (i.e., good workpractices and training), and the use of personal pro-tective equipment (PPE), e.g., clothing and respi-rators, where required. According to OSHA, engi-neering controls include material substitution, iso-lation, process/equipment modification, and localventilation. Administrative controls include good

Medical Geology Issues in North America 21
housekeeping, appropriate personal hygiene practices,periodic inspection and maintenance of process andcontrol equipment, proper procedures to perform atask, and appropriate supervision to ensure that theproper procedures are followed.
North America, United States, and Canada havea 100+ year history of mining activity. While over-all base metal mining and smelting has declined,particularly in the United States, mining activity con-tinues to be an extremely important economic driverin many discrete geographic areas. In Canada, asopposed to the United States, mining is far more impor-tant economically as a percent of the overall GrossDomestic product (GDP). In the United States, miningis extremely geographically focused and often centeredon gold mining as opposed to more “traditional” basemetals, e.g., lead, copper, zinc.
As discussed in this chapter, the medical geol-ogy of mining activity is minimally a function ofthe (i) specific suite of metals in the ore and theirchemical speciation and mineralogy; (ii) the type ofextractive procedures used on the ore, i.e., smelting,flotation, leaching, or closed circuit cyanide extrac-tion processes; (iii) background environmental char-acteristics of the mine site; (iv) the fate-transport(chemodynamics) characteristics of the individual met-als (e.g., existing relationship between surface andground water, air patterns,); and (v) demographiccharacteristics of the potentially exposed popula-tions, e.g., socio-economics, age distributions, hous-ing stock ages. All of these elements influence thedegree in which source→ exposure→dose→potentialhealth effects. Various complex conceptual modelshave been developed by the regulatory agencies andrisk assessment professionals to illustrate this fun-damental sequence. Each historic and active sitehas a unique set of circumstances that should beconsidered.
Despite these site-specific difference, over thelast 30 years there has been a substantial regula-tory history of evaluating and managing the envi-ronmental and human health effects from miningactivity, particularly legacy sites that are no longeractively operating. Many of these “legacy sites”are extremely complex and are often referred toas “mining megasites.” In 2005, the US NationalAcademy of Sciences (NAS) published a large mono-graph, entitled “Superfund and Mining Megasites:Lessons form the Coeur d’Alene River Basin”
(http://www.nap.edu/catalog/11359.html). While thereare a large number of US-centric features about themonograph these are entirely related to the legal con-text of managing sites as opposed to the medicalgeology of a complex megasite. From a scientific per-spective, the NAS analysis is an extremely useful anddetailed road map of the twists and turns of analyzinglarge legacy mining sites. While focused on inactive orlegacy issues, the technical analysis is easily applicableto active locations.
One of the critical insights of the report is thatapproaches to evaluating sites, including their ultimateremediation, are constantly evolving. The dispositionand effects of contaminants within a geographicallocation have evolved significantly over the last 30+years; hence, decisions are always made based on lim-ited technical information. The information databasegrows and evolves in sophistication and complexity. Inaddition, the medical/health effects database does notremain static. For example, background levels of bloodlead in US children under age 7 have dramaticallyfallen almost sevenfold over the last 35 years. Bloodlead levels that were considered “normal” in the 1970sand 1980s now trigger intense regulatory and medicalinvestigation. The medical toxicology has clearlyshifted from a consideration of gross effects to subtleoften sub-clinical considerations, i.e., findings notobservable on physical examination but instead requir-ing sophisticated longitudinal testing procedures. Atmany of the US megasites, e.g., Bunker Hill leadsite in the Coeur d’Alene basin, this has been thesituation. Medically site investigations have evolvedfrom gross exposure in emergency rooms to long-termmedical monitoring protocols for both previous work-ers and exposed community residents. Similarly, theenvironmental assessment has transitioned from “hotspot” analysis of gross contamination to concerns overlow-level exceedances of background or calculated“safe” soil levels. For example, at the Tacoma smelterin Washington State, United States, arsenic levels insoil greater than 20 ppm are considered a “publichealth concern.” (“Dirt Alert: Arsenic and lead inSoils” Washington State Department of Ecology,www.ecy.wa.gov/programs/tcp/sites/tacoma_smelter/ts_hp.htm). Similarly, lead in soils above 250 ppmis also considered a “public health concern.” Aspreviously noted in the chapter, background arsenicand lead soil levels often significantly exceed theseadministrative levels of “public health concern.”

22 R.B. Finkelman et al.
The history of megasite remediation indicates thatdecades of effort and hundreds of millions of dollarsare spent on remediation. Critics often ask whether thisconcerted effort is “worth it.” As pointed out by theNAS, this question goes beyond matters that sciencealone can address. Complex economic and societalvalues tend to dominate the megasites and while “sci-ence” is necessary it rarely seems “sufficient” based onthe historic record. Thus, medical geology practition-ers need to realize that the process may be more artthan science and framed by a heavy dose of legal andpolitical considerations. Megasites, whether BunkerHill Idaho, Leadville Colorado, Tacoma smelter site,Washington, copper sites in the Gaspé Region ofQuebec Canada, all illustrate these observations.
Black Lung Disease
Although the incidence of Coal Worker’sPneumoconiosis (CWP: Black Lung Disease), aprogressive, debilitating respiratory problem causedby inhalation of coal dust has decreased dramaticallyin the United States, it still takes a heavy toll on formerminers coal miners. For more than 100 years it hasbeen assumed that black lung disease was caused bythe inhalation of the black pulverized particles of coal.Recent research (Huang et al., 2004), however, hasshown that CWP may be initiated not by the coal par-ticles but by inhalation of pulverized pyrite, a commoncoal mineral. The pyrite dissolves in the lung fluidsreleasing strong acids that irritate the lung tissues.Particles (coal dust, quartz, clay, pyrite, etc.) that thencontact the irritated tissues will cause the fibrosisleading to decreased oxygen exchange capacity. Thus,knowledge of the mineral composition of the coal maybe a key parameter in anticipating the incidence ofCWP. Information on the mineralogy of the coal beingmined may provide essential data needed to protectthe health of the miners in cost-effective ways thusreducing the enormous financial burden of health careand lost productivity.
Community Effects
Community level exposures to metals genericallyoccur in two forms: (i) anthropogenic, i.e., man-made
activity and (ii) natural, i.e., low-level concentrationsfound in soils. The anthropogenic exposures to met-als are generally related to industrial activity, eitherlegacy (e.g., past mining and smelting) or currentoperations with releases to air, water, and soils. Forexample, coal combustion associated with electri-cal power generation is a common source of atmo-spheric metals emissions, e.g., mercury and selenium.Depending upon the specific form, naturally occur-ring soil levels of virtually all of the metals is eas-ily demonstrated. These “background” levels exhibitsignificant heterogeneity as a function of geogra-phy. Hence, background is invariably presented as awide range as variation in natural mineralization isextremely common. In many situations it is importantto fully understand the local and regional backgroundlevels of a specific metal as the variability can eas-ily span a factor of 10, i.e., an order of magnitude.This variability becomes important at the two endsof the concentration distribution profile and both crit-ical micronutrient deficiencies, e.g., iodine and sele-nium, and over exposures, e.g., lead, arsenic, andcadmium are well documented in the literature. A con-venient source of high-quality information describingthe most important metals can be found at the Agencyfor Toxic Substance and Disease Registry (ATSDR)site, http://www.atsdr.cdc.gov/toxpro2.html. ATSDRhas published extensive “Toxicological Profiles” fora wide variety of chemicals, including the medicallymost significant chemicals.
From a medical toxicology perspective, commu-nity exposures are typically focused on four common“heavy metals”: (i) arsenic, (ii) cadmium, (iii) lead,and (iv) mercury. Each of these metals has a distinc-tive fate-transport (how it moves in the environmentin air, water, and soil) profile that influences how andwhere the metal accumulates once released from ananthropogenic source. For example, all of these metalsexist in multiple forms that preferentially accumulatein soils, sediments, and biota. The geochemistry ofeach metal is the key factor and must be understoodin order to anticipate whether a potential human healthproblem actually exists. Many metals are present informs that have very low bioavailability; hence, whilean individual is exposed to the metal, the actual internaldose is quite low and may have little or no dis-cernable clinical effects. Therefore, it is extremelyimportant that specific chemical forms of the metalunder consideration are evaluated and characterized.

Medical Geology Issues in North America 23
For example, legacy issues (arsenic, cadmium, lead,and mercury) associated with mining and smeltinghave been a major focus of the regulatory agenciesin the United States with development of extensiveand multi-million dollar remediation effects. Muchof this effort is driven by the observation that somemetals, e.g. lead, do not have a known physiologi-cal function in humans. In contrast, certain forms ofarsenic do have an essential biochemical function inhumans.
In general, exposure to the heavy metals is dom-inated by two routes: inhalation and ingestion. Thethird pathway, dermal (skin), is usually considered tobe extremely minor. Unless there is an ongoing indus-trial operation, e.g., smelting, incineration, power plantemissions, the inhalation or air pathway is usuallyquite small relative to ingestion. Ingestion is domi-nated by food, water, and direct contact with soils.In a non-legacy situation, i.e., significant concentra-tions above naturally occurring background are notpresent, overall human exposures are primarily drivenby dietary intake. Overall diet intake is a functionof the natural level found in soils, the geochem-istry of the soils, e.g., pH, carbon content, cationicexchange capacity, and the specific types of cropsand/or livestock that are in local or regional pro-duction. In addition, some personal choice habits,e.g., smoking, dramatically influence the daily expo-sure level to specific metals, e.g., cadmium. Smokershave twice the body burden of cadmium versusa non-smoker. In situations associated with dailyintake of cadmium from food, the margin of safetybecomes significantly narrower for an individual whosmokes.
In the northern hemisphere, the legacy problemsassociated with heavy metals have often dominated thediscussion surrounding medical geology. However, themicronutrient deficiency burden of disease at a com-munity level is significantly larger in terms of overallattributable morbidity (illness) and mortality (death).A low daily intake (usually less than 100 μg/day) of awide variety of metals, e.g., Fe, I, Se, Cu, Zn, Co, Mn,and Mo, is essential for normal health and wellness.The normal daily intake of these metals comes fromdiet. In areas that have naturally occurring deficienciesin these metals a variety of gross and subtle clinicaleffects can be found. Iron and iodine deficiency are twoof the most common micronutrient deficiencies, par-ticularly. In rural sub-Saharan Africa, geographically
distributed pockets of micronutrient deficiencies canbe found where there is a largely rural subsistenceeconomy and soils are deficient in one or more of theessential metals.
For example, selenium serves an extremely impor-tant role in number of important physiologicallyimportant processes, particularly enzymes involvedin antioxidant defense mechanisms, thyroid hormonemetabolism, and redox control of intracellular reac-tions (ATSDR, Toxicological Profile for Selenium,2003). Both excessive intake and deficiency scenariosare possible and have been clinically documented.The creation of an excess or deficiency risk is largelya function of background soil concentration, specificsoil geochemistry, and daily diet. For humans, meatproducts generally contain the highest concentrationof selenium, while vegetables and fruits contain thelowest. In some areas of the world, e.g., foothills ofthe Andes Mountains, soils contain elevated levelsof selenium and local agricultural products, such asBrazil nuts, can have extremely high levels of selenium(ATSDR, 2003). In the United States, the highest lev-els of selenium in soil are found in certain areas of theWest and Midwest.
Acknowledgments Parts of this chapter has been partiallypublished in “Metal Contaminants in New Zealand –Sources,Treatments and Effects on Ecology and Human Health” (MooreTA, Black A, Centeno JA, et al., 2005, Editors; resolutionzpress, Christchurch, New Zealand. ISBN: 0-476-01619-3). JACis grateful to Dr. Tim Moore and resolution press for allow-ing the use of this material. This chapter has been reviewedin accordance with the policy and guidelines of the ArmedForces Institute of Pathology and the Department of Defense,and approved for publication. Approval should not be con-strued to reflect the views and policies of the Department ofthe Army, the Department of the Navy, the Department ofDefense, or the United States Government, nor does mention oftrade names or commercial products constitute endorsement orrecommendation for use.
References
Achanzar WE, Brambila EM, Diwan BA, Webber MM, WaalkesMP (2002) Inorganic arsenite-induced malignant transforma-tion of human prostate epithelial cells. J Natl Cancer Inst94:1888–1891.
ATSDR (Agency for Toxic Substances and Disease Registry)(2003) Toxicological profile for selenium. http://www.atsdr.cdc.gov/toxprofiles/tp92.html
Ayotte JD, Baris D, Cantor KP, Colt J, Robinson Jr, GR, LubinJH, Karagas M, Hoover RN, Fraumeni Jr, JF, Silverman DT

24 R.B. Finkelman et al.
(2006) Bladder cancer mortality and private well use in NewEngland: an ecological study. J Epidemiol Comm Health60:168–172.
Barnes HL (1979) Geochemistry of Hydrothermal Ore Deposits.New York: John Wiley & Sons.
Bast D, Finn SB, McCaffrey I (1950) The Newburg-KingstonCaries Fluorine Study. Am J Public Health 40:716–724.
Beane Freeman LE, Dennis LK, Lynch CF, Thorne PS, Just CL(2004) Toenail arsenic content and cutaneous melanoma inIowa. Am J Epidemiol 160:679–687.
Boyle DR (1976) The Geochemistry of Fluorine and ItsApplication in Mineral Exploration. Ph.D. Thesis. London:University of London.
Boyle DR, Chagnon M (1995) An incidence of skeletal fluorosisassociated with groundwaters of the Maritime CarboniferousBasin, Gaspé region, Quebec, Canada. Environ GeochemHealth17:5–12.
Brown KG, Ross GL (2002) American council on science andhealth. Arsenic, drinking water, and health: a position paperof the American council on science and health. Regul ToxicolPharmacol 36:162–174.
Brugge D, Benally T, Yazzie-Lewis E (2006) The Navajo Peopleand Uranium Mining. Albuquerque, NM: University of NewMexico Press.
Bultman MW, Fisher FS, Pappagianis D (2005) The ecologyof soil-borne human pathogens. In O Selinus, B Alloway, JCenteno, R Finkelman, R Fuge, U Lindh, P Smedley (Eds),Essentials of Medical Geology (pp. 481–512). Amsterdam:Elsevier Inc.
Bunnell JE, Tatu CA, Bushon RN, Stoeckel DM, BradyAMG, Beck M, Lerch, HE, McGee B, Hanson BC, ShiR, Orem WH (2006) Possible Linkages Between LigniteAquifers, Pathogenic Microbes, and Renal Pelvic Cancerin Northwestern Louisiana, USA. Environ Geochem Health28:577–587.
Canadian Cancer Society/National Cancer Institute of Canada(2008) Canadian Cancer Statistics 2008. Toronto, Canada.
Cancer Care Ontario 2006. New cases and deaths for allcancers (2004) Geographic patterns of cancer in Ontario.http://www.cancercare.on.ca/ocs/snapshot/cancerstats/
Cannon HL, Hopps (1971) Environmental Geochemistry inHealth and disease. Ottawa, Canada: Geological Society ofAmerica Memoir 123.
Cannon HL, Hopps HC (1972) Geochemical Environment inRelation to Health and Disease. Ottawa, Canada: GeologicalSociety of America Special Paper 140.
Chen CJ, Wang CJ (1990) Ecological correlation betweenarsenic level in well water and age-adjusted mortality frommalignant neoplasms. Cancer Res 50:5470–5474.
Churchill RK, Hill RL (2000) A general location guidefor ultramafic rocks in California –Areas more likely tocontain naturally occurring asbestos: Sacramento, Calif.,California Department of Conservation, Division ofMines and Geology, DMG Open-File Report 2000–19,http://www.consrv.ca.gov/
Clark RN, Green RO, Swayze GA, Meeker GP, Sutley S,Hoefen TM, Livo KE, Plumlee G, Pavri B, Sarture C,Wilson S, Hageman PL, Lamothe PJ, Vance JS, BoardmanJ, Brownfield I, Gent C, Morath LC, Taggart J, TheodorakosPM, Adams M (2001) Environmental Studies of theWorld Trade Center area after the September 11, 2001
attack: U.S. Geological Survey Open File Report 01-0429,http://pubs.usgs.gov/of/2001/ofr-01-0429/
Clark RN, Swayze GA, Hoefen TM, Green RO, Livo KE,Meeker G, Sutley S, Plumlee G, Pavri B, Sarture C,Boardman J, Brownfield I, Morath LC (2005) Environmentalmapping of the World Trade Center area with imaging spec-troscopy after the September 11, 2001 attack. In JS Gaffney,NA Marley (eds) Urban Aerosols and Their Impacts: LessonsLearned from the World Trade Center Tragedy (pp. 66–83).American Chemical Society Series 919.
Clinkenbeard JP, Churchill RK, Lee, Kiyoung (eds) (2002)Guidelines for geologic investigations of naturally occurringasbestos in California: Sacramento, Calif., CaliforniaDepartment of Conservation, California Geological SurveySpecial Publication 124, p. 70.
Cobb GP, Abel MT, Rainwater TR, Austin GP, Cox SB, KendallRJ, Marsland EJ, Anderson TA, Leftwich BD, Zak JC,Presley SM (2006) Metal distributions in New Orleans fol-lowing hurricanes Katrina and Rita: A continuation study.Environ Sci Technol 40:4571–4577.
Dodson RF, Hammar SP (eds) (2006) Asbestos: RiskAssessment, Epidemiology, and Health Effects. Boca Raton,FL: Taylor and Francis.
Edmunds M, Smedley P (2005) Fluoride in natural waters. InSelinus et al. (eds) Essentials of Medical Geology (pp. 301–329). Amsterdam: Elsevier.
Enterline PE, Henderson VL, Marsh GM (1987) Exposure toarsenic and respiratory cancer: A reanalysis. Am J Epidemiol25:929–938.
Environment Canada (2001) Canadian Water Quality Guidelinesfor the Protection of Aquatic Life: Inorganic Fluorides.National Standards Office, Ottawa.
Farris GS, Smith GJ, Crane MP, Demas CR, Robbins LL,Lavoie DL, (eds) (2007) Science and the storms: The USGSresponse to the hurricanes of 2005: U.S. Geological SurveyCircular 1306.
Fisher FS, Bultman MW, Johnson SM, Pappagianis D, ZaborskyE (2007) Coccidioides niches and habitat parameters in thesouthwestern United States-A matter of scale. Ann New YorkAcad Sci 1111:47–72.
Fleming WJ, Grue CE, Schuler CA, Bunck CM (1987) Effectsof oral doses of fluoride on nestling European starlings. ArchEnviron Contam Toxicol 16:483–489.
Freedman J (ed) (1975) Trace element geochemistry in healthand disease. Geolog Soc Am, Special Paper 155.
Frost FJ, Muller T, Petersen HV, Thomson B, Tollestrup K(2003) Identifying US populations for the study of healtheffects related to drinking water arsenic. J Expo Anal EnvironEpidemiol 13:231–239.
Garland M, Morris JS, Colditz GA, Stampfer MJ, SpateVL, Baskett CK, Rosner B, Speizer FE, Willett WC,Hunter DJ (1996) Toenail trace element levels andbreast cancer: a prospective study. Am J Epidemiol144:653–660.
Gavaghan H 2002 Lead, unsafe at any level. Bull World HealthOrgan [online] 80(1): 82–82.
Gottlieb LS, Luverne AH (1982) Lung cancer among Navajouranium miners. Chest, 81:449–452.
Griffin DW, Petrosky T, Morman SA, Luna VA (2009)A survey of the occurrence of Bacillus anthracis inNorth American soils over two long-range transects and

Medical Geology Issues in North America 25
within post-Katrina New Orleans: Applied Geochemistry24:1464–1471.
Hansell A, Horwell CJ, Oppenheimer C (2006) The health haz-ards of volcanoes and geothermal areas. Occup Environ Med,Continuing Professional Development Series, 63:149–156.
Huang X, Li W, Attfield MD, Nadas A, Frenkel K, FinkelmanRB (2004) Mapping and prediction of Coal Workers’Pneumoconiosis with bioavailable iron content in bituminouscoals. Environ Health Persp 113(8):964–968.
Harper M (2008) 10th anniversary critical review: Naturally-occurring asbestos. J Environ Monit 10:1394–1408.
Hinkley TK, Smith KS (1987) Leachate chemistry of ash fromthe May 18, 1980 eruption of Mount St. Helens, with asection on laboratory methods developed for Mount St.Helens water and acid leaching studies, by SA Wilsonand CA Gent. In T.K. Hinkley (ed) Chemistry of Ash andLeachates from the May 18, 1980 Eruption of Mount St.Helens. Washington: U.S. Geological Survey ProfessionalPaper 1397.
Hopps HC, Cannon HL (1972) Geochemical environment inrelation to health and disease. Annal New York Acad Sci 199.
Horton DK, Bove F, Kapil V (2008) Select mortality and cancerincidence among residents in various U.S. communities thatreceived asbestos-contaminated vermiculite ore from Libby,Montana. Inhal Toxicol 20:767–775.
Horwell CJ, Baxter PJ (2006) The respiratory health hazardsof volcanic ash: a review for volcanic risk mitigation. BullVolcanol 69:1–24.
Horwell CJ, Fenoglio I, Fubini B (2007) Iron-induced hydroxylradical generation from basaltic volcanic ash. Earth Plan SciLett 261:662–669.
Hudlicky M, Pavlath AE. (1995) Chemistry of organic fluorinecompounds II: A critical review. (ACS Monograph Series187). Washington, DC: American Chemical Society.
Jibson, RW, Harp EL, Schneider E, Hajjeh RA, Spiegel RA(1998) An outbreak of coccidioidomycosis (valley fever)caused by landslides triggered by the 1994 Northridge,California, earthquake. Geol Soc Rev Eng Geol 12:53–61.
Kabata-Pendias A (2001) Trace elements in soil and plants (3rded.). Boca Raton, FL: CRC Press.
Karagas MR, Tosteson TD, Blum J, Morris JS, Baron JA, KlaueB (1998) Design of an epidemiologic study of drinking waterarsenic exposure and skin and bladder cancer risk in a U.S.population. Environ Health Perspect 4:1047–1050.
Karagas MR, Stukel TA, Tosteson TD (2002) Assessment ofcancer risk and environmental levels of arsenic in NewHampshire. Int J Hyg Environ Health 205:85–94.
Karagas MR, Tosteson TD, Morris JS, Demidenko E, MottLA, Heaney J, Schned A (2004) Incidence of transitionalcell carcinoma of the bladder and arsenic exposure in NewHampshire. Cancer Causes Cont 15:465–472.
Lai MS, Hsueh YM, Chen CJ, Shyu MP, Chen SY, Kuo TL, WuMM, Tai TY (1994) Ingested inorganic arsenic and preva-lence of diabetes mellitus. Am J Epidemiol 139:484–492.
Ledbetter MC, Mavridubneau R, Weiss AJ (1960) Distributionstudies of radioactive fluoride18 and stable fluoride19 intomato plants. Contrib Boyce Thompson Inst 20:331–348.
Lewis DR, Southwick JW, Ouellet-Hellstrom R, Rench J,Calderon RL (1999) Drinking water arsenic in Utah:A cohort mortality study. Environ Health Perspect 107:359–365.
Luke J (1997) The effect of fluoride on the physiology of thePineal Gland. Ph.D. Thesis. University of Surrey, Guildford
Luke J (2001) Fluoride deposition in the aged human pinealgland. Caries Res 35:125–128.
Meeker GP, Bern AM, Brownfield IK, Lowers HA, Sutley SJ,Hoefen TM, Vance JS (2003) The composition and mor-phology of amphiboles from the Rainy Creek complex, nearLibby, Montana: Am Mineral 88:1955–1969.
Meeker GP, Sutley SJ, Brownfield IK, Lowers HA, Bern AM,Swayze GA, Hoefen TM, Plumlee GS, Clark RN, Gent CA(2005) Materials characterization of dusts generated by thecollapse of the World Trade Center. In J.S. Gaffney, N.A.Marley (eds) Urban aerosols and their impacts: Lessonslearned from the World Trade Center Tragedy (pp. 84–102).American Chemical Society Series 919.
Meeker GP, Lowers HA, Swayze GA, Van Gosen BS, SutleySJ, Brownfield IK (2006) Mineralogy and Morphologyof Amphiboles Observed in Soils and Rocks in ElDorado Hills, California: U.S. Geological Survey OpenFile Report 2006-1362, http://pubs.usgs.gov/of/2006/1362/downloads/pdf/OF06-1362_508.pdf
Mokdad AH, Bowman BA, Ford ES, Vinicor F, MarksJS, Koplan JP (2001) The continuing epidemics of obe-sity and diabetes in the United States. JAMA 286:1195–1200.
Montgomery DL, Ayotte JD, Carroll PR, Hamlin P (2003)Arsenic Concentrations In Private Bedrock Wells InSoutheastern New Hampshire. U. S. Geological Survey FactSheet 051-03.
Mullenix PJ, Denbesten PK, Schunior A, Kernan WJ (1995)Neurotoxicity of sodium fluoride in rats. NeurotoxicolTeratol 17(2):169–177.
National Research Council (1979) Geochemistry of water inrelation to cardiovascular disease / Panel on the geochemistryof water in relation to cardiovascular disease, Subcommitteeon the Geochemical Environment in Relation to Healthand Disease, U.S. National Committee for Geochemistry.Washington, DC.
National Research Council (1999) Health Effects of Radon:BEIR VI. Washington, DC: National Academy Press.
National Research Council (2006) Fluoride in drinking water:A scientific review of EPA’s standards. Washington, DC:National Academies Press.
NIOSH (2009) Asbestos Fibers and Other ElongatedMineral Particles: State of the Science and Roadmapfor Research, revised draft: National Institutes ofOccupational Safety and Health. Accessed June, 2009.http://www.cdc.gov/niosh/review/public/099/
Orem W, Tatu C, Pavlovic N, Bunnell J, Lerch H, Paunescu V,Ordodi V, Flores D, Corum M, Bates A (2007) Health effectsof toxic organic substances from coal: Toward “Pandmic”nephropathy. Ambio 36(1):98–102.
Pan X, Day HW, Wang W, Beckett LA, Schenker MB (2005)Residential proximity to naturally occurring asbestos andmesothelioma risk in California. Am J Res Crit Care Med72:1019–1025.
Pant N, Murthy RC, Srivastava SP (2004) Male reproduc-tive toxicity of sodium arsenite in mice. Hum Exp Toxicol23:399–403.
Pardue JH, Moe WM, McInnis D, Thibodeaux LJ, Valsaraj KT,Maciasz E, Van Heerden I, Korevec N, Yuan QZ (2005)

26 R.B. Finkelman et al.
Chemical and microbiological parameters in New Orleansfloodwater following hurricane Katrina. Environ Sci Tech39:8591–8599.
Peipins LA, Lewin M, Campolucci S, Lybarger JA, MillerA, Middleton D, Weis C, Spence M, Black B, Kapil V(2003) Radiographic abnormalities and exposure to asbestos-contaminated vermiculite in the community of Libby,Montana, U.S.A.. Environ Health Perspect 111:1753–1759.
Pardue JH, Moe WM, McInnis D, Thibodeaux LJ, Valsaraj KT,Maciasz E, Van Heerden I, Korevec N, Yuan QZ (2005)Chemical and microbiological parameters in New Orleansfloodwater following hurricane Katrina. Environ Sci Tech39:8591–8599.
Peplow D, Edmonds R (2004) Health risks associated with con-tamination of groundwater by abandoned mines near Twispin Okanogan County, Washington, USA. Environ GeochemHealth 26:69–79.
Peterson M, Finkelman RB, Orem W, Lerch H, Bunnell J, TatuC (2009) Organic compounds in the Carrizo-Wilcox aquiferof East Texas and possible health implications. Geolog SocAm Abs Prog 41(2):13.
Plumlee GS, Casadevall TJ, Wibowo HT, Rosenbauer RJ,Johnson CA, Breit GN, Lowers HA, Wolf RE, HagemanPL, Goldstein H, Berry CJ, Fey DL, Meeker GP, MormanSA (2008) Preliminary analytical results for a mud sam-ple collected from the LUSI mud volcano, Sidoarjo, EastJava, Indonesia. U.S. Geological Survey Open-File Report2008-1019.
Plumlee GS, Foreman WT, Griffin DW, Lovelace JK, MeekerGP, Demas CR (2007a) Characterization of flood sedimentsfrom Hurricane Katrina and Rita and potential implicationsfor human health and the environment. In GS Farris, GJSmith, MP Crane, CR Demas, LL Robbins, DL. Lavoie, ,(eds) Science and the storms: The USGS response to the hur-ricanes of 2005: U.S. Geological Survey Circular 1306, pp.246–257.
Plumlee GS, Hageman PL, Lamothe PJ, Ziegler TL, MeekerGP, Theodorakos P, Brownfield I, Adams M, Swayze GA,Hoefen T, Taggart JE, Clark RN, Wilson S, Sutley S (2005)Inorganic chemical composition and chemical reactivity ofsettled dust generated by the World Trade Center buildingcollapse. In JS Gaffney, NA Marley (eds) Urban Aerosolsand Their Impacts: Lessons Learned from the World TradeCenter Tragedy (pp. 238–276). Washington, DC: AmericanChemical Society Symposium Series 919.
Plumlee GS, Martin DA, Hoefen T, Kokaly R, Hageman P,Eckberg A, Meeker GP, Adams M, Anthony M, LamothePJ (2007b) Preliminary analytical results for ash andburned soils from the October 2007 Southern CaliforniaWildfires: U.S. Geological Survey Open-File Report 2007-1407 http://pubs.usgs.gov/of/2007/1407
Plumlee GS, Meeker GP, Lovelace JK, Rosenbauer R, LamothePJ, Furlong ET, Demas CR (2006) USGS environmentalcharacterization of flood sediments left in the New Orleansarea after Hurricanes Katrina and Rita, 2005 –progressreport: U.S. Geological Survey Open-File Report 2006-1023.http://pubs.usgs.gov/of/2006/1023
Plumlee GS, Morman SA, Ziegler TL (2006) The toxicologicalgeochemistry of earth materials: an overview of processesand the interdisciplinary methods used to study them, InN Sahai, M Schoonen (eds) Reviews in Mineralogy and
Geochemistry, 64, Medical Mineralogy and Geochemistry(pp. 5–58).
Plumlee GS, Ziegler TL (2007) The medical geochemistryof dusts, soils, and other earth materials –2007 webupdate. In BS Lollar (ed) Treatise on Geochemistry,online version, Volume 9, Chapter 7, Elsevier, 1–61.http://www.sciencedirect.com/science/referenceworks/9780080437514
Porter R, Ogilvie M (2000) The Biographical Dictionary ofScientists (3rd ed). New York: Oxford University Press.
Presley SM, Rainwater TR, Austin GP, Platt SG, Zak JC, CobbGP, Marsland EJ, Tian K, Zhang B, Anderson TA, Cox SB,Abel MT, Leftwich BD, Huddleston JR, Jeter RM, KendallRJ (2006) Assessment of pathogens and toxicants in NewOrleans, LA following Hurricane Katrina. Environ Sci Tech40:468–474.
Roggli VL, Oury TD, Sporn TA (eds) (2004) Pathologyof Asbestos-Associated Diseases (2nd Ed, pp. 1–16).New York: Springer.
Roholm K (1937) Fluorine Intoxication: A Clinical-HygienicStudy. Copenhagen: NYT Nordisk Forlag.
Rouelle J (1792) A complete treatise on the mineral waters ofVirginia containing a description of their situation, their nat-ural history, their analysis, contents, and their use in medicine(68 p). Philadelphia, PA: Charles Cist Publisher.
Ruan JP, Bårdsen A, Astrøm AN, Huang RZ, Wang ZL, BjorvatnK (2007) Dental fluorosis in children in areas with fluoride-polluted air, high-fluoride water, and low-fluoride water aswell as low-fluoride air: A study of deciduous and permanentteeth in the Shaanxi province, China. Acta Odontol Scand65(2):65–71.
Schneider E, Spiegel RA, Jibson RW, Harp EL, Marshall GA,Gunn RA, McNeil MM, Pinner RW, Baron RC, Burger RC,Hutwagner LC, Crump C, Kaufman L, Reef SE, FeldmanGM, Pappagianis D, Werner B (1997) A coccidioidomycosisoutbreak following the Northridge, Calif, earthquake. J AmMed Assoc 277:904–908.
Shacklette HT, Saur HI, Miesch AT (1970) Geochemical envi-ronmental and cardiovascular mortality rates in Georgia. U.S.Geological Survey Professional Paper 574-C.
Skinner HCW (2005) Mineralogy of bone. Contrib. Essentials ofMedical Geology (pp. 667–693). Amsterdam: Elsevier Press.
Sturges WT, Wallington TJ, Hurley MD, Shrine KP, SihraK, Engel A, Oram DE, Penkett SA, Mulvaney R andBrenninkmeijer CAM (2000) A potent greenhouse gassidentified in the atmosphere: SF5CF3. Science, 289(5479):611–613.
Sullivan PA (2007) Vermiculite, respiratory disease, andasbestos exposure in Libby, Montana –Update of a cohortmortality study. Environ Health Perspect 115:579–585.
Swayze GA, Hoefen TM, Sutley SJ, Clark RN, Livo KE,Meeker GP, Plumlee GS, Morath LC, Brownfield IK (2005)Spectroscopic and x-ray diffraction analyses of asbestos inthe World Trade Center dust. In JS Gaffney, NA Marley(eds) Urban Aerosols and Their Impacts: Lessons Learnedfrom the World Trade Center Tragedy (40–65). AmericanChemical Society Series 919.
Swayze GA, Kokaly RF, Higgins CT, Clinkenbeard JP, ClarkRN, Lowers HA, Sutley SJ (2009) Mapping potentiallyasbestos-bearing rocks using imaging spectroscopy. Geology37:763–766.

Medical Geology Issues in North America 27
Tatu CA, Orem WH, Finkelman RB, Feder GL (1998)The etiology of Balkan Endemic Nephropathy: Still morequestions than answers. Environ Health Persp 106(11):689–700.
Tseng CH, Tseng CP, Chiou HY, Hsueh YM, Chong CK, ChenCJ (2002) Epidemiologic evidence of diabetogenic effect ofarsenic. Toxicol Lett 133:69–76.
USEPA (U.S. Environmental Protection Agency) (2006)Response to the November 2005 National Stone, Sand& Gravel Association Report Prepared by the R.J.Lee Group, Inc. ‘Evaluation of EPA’s Analytical Datafrom the El Dorado Hills Asbestos Evaluation Project’,United States Environmental Protection Agency, Region IX,San Francisco, CA, www.epa.gov/region09/toxic/noa/ eldo-rado/index.html
USEPA (U.S. Environmental Protection Agency) (2005–2008)Response to 2005 hurricanes: U.S. Environmental ProtectionAgency, http://www.epa.gov/katrina/, accessed 6/2009.
USGS (U.S. Geological Survey) (2008) Volcanic gasesand their effects: U.S. Geological Survey Web Site,http://volcanoes.usgs.gov/hazards/gas/index.php, accessed6-09.
USGS (U.S. Geological Survey) (2007) Facing Tomorrow’sChallenges –U.S. Geological Survey Science in the Decade2007–2017. U.S. Geological Survey Circular 1309.
USGS (U.S. Geological Survey) (2005) National Atlas of theUnited States. The Arsenic in Ground Water of the UnitedStates. http://nationalatlas.gov/natlas/natlasstart.asp
Van Gosen BS (2007) The geology of asbestos in the UnitedStates and its practical applications: Environ Eng Geosci13(1):55–68.
Van Gosen BS (2009) The geologic relationships of industrialmineral deposits and asbestos in the Western United States:Preprints of the 2009 SME Annual Meeting, February 22–25, 2009, Denver, Colorado: Littleton, Colo., Society forMining, Metallurgy, and Exploration, Inc. (SME) Preprint09-061, 6 p.
Van Metre PC, Horowitz AJ, Mahler BJ, Foreman WT, FullerCC, Burkhardt MR, Elrick KA, Furlong ET, SkrobialowskiSC, Smith JJ, Wilson JT, Zaugg SD (2006) Effects of hurri-canes Katrina and Rita on the chemistry of bottom sedimentsin Lake Pontchartrain, Louisiana, USA. Environ Sci Tech40:6894–6902.
Virta RL (2009) Asbestos: Mineral Commodity Summaries,2009, U.S. Geological Survey, 24–25.
Wedepohl KH (1978) Handbook of Geochemistry. Volume II/1.New York: Springer-Verlag.
Weinstein P, Cook A (2005) Volcanic emissions and health. InO Selinus, B Alloway, J Centeno, R Finkelman, R Fuge, ULindh P Smedley (eds) Essentials of Medical Geology (pp.203–226). Amsterdam: Elsevier Inc.
Witschi H (2001) A short history of lung cancer. Toxicol Sci64:4–6.
Witham CS, Oppenheimer C, Horwell CJ (2005) Volcanic ash-leachates: A review and recommendations for samplingmethods. J Volcanol Geother Res 141:299–326.
Wolf RE, Morman SA, Plumlee GS, Hageman PL, Adams M(2008) Release of hexavalent chromium by ash and soils inwildfire-impacted areas: U.S. Geological Survey Open-FileReport 2008–1345 http://pubs.usgs.gov/of/2008/1345/
World Health Organization (WHO) (1997) Environmental healthcriteria for fluorides and fluorosis (Second ed). InternalTechnical Report. International Program on Safety. Geneva,Switzerland.
World Health Organization (WHO) International Agency forResearch on Cancer. (2004) IARC Monographs on theEvaluation of Carcinogenic Risks to Humans. Volume84. Some Drinking-water Disinfectants and Contaminants,including Arsenic. Lyon, France.
Wu MM, Kuo TL, Hwang YH, Chen CJ (1989) Dose-response relation between arsenic concentration in wellwater and mortality from cancers and vascular diseases. AmJ Epidemiol 130:1123–1132.
Zielinski J (2008) Presentation “Residential radon and lungcancer: a case study in risk assessment and risk man-agement” and “RC-7 epidemiological methods: residentialradon and cancer risk”. Bureau of Environmental HealthScience, Health Canada. Department of Epidemiological andCommunity Medicine, University of Ottawa.
Zierler S, Theodore M, Cohen A, Rothman KJ (1988) Chemicalquality of maternal drinking water and congenital heartdisease. Int J Epidemiol 17:589–594.
Zierold KM, Knobeloch L, Anderson H (2004) Prevalenceof chronic diseases in adults exposed to arsenic-contaminated drinking water. Am J Public Health 94:1936–1937.

A Regional Perspective of Medical Geology – Cadmiumin Jamaica
Paul R. D. Wright, Robin Rattray, and Gerald Lalor
Abstract High levels of geogenic cadmium (Cd)have been found in some soils of Jamaica, particu-larly in the central part of the island. The potentialhealth impact on residents who consumed foods grownon these soils was determined. The foods which haveshown the greatest affinity for Cd uptake are mainlygreen leafy vegetables, tubers and root vegetables. Dietstudies showed that some residents are at risk of ingest-ing Cd in excess of the 7 μg/kg body weight PTWIestablished by the WHO. Cd exposure and proximaltubular dysfunction were measured as urine Cd (U-Cd)and β2-microglobulin (β2-MG) in urine, respectively.Mean U-Cd and β2-MG concentrations of 4.6 μgCd/g_cr and 290 μg/g_cr confirm that the populationis being exposed to elevated Cd levels and there isevidence of very mild tubular proteinuria. The pro-teinuria detected in the population was related to Cdexposure, evidenced by the relationship between U-Cd and β2-MG. While positive results were obtainedfor the identification of Cd-related renal biomarkersin the study population and there was a clear associa-tion between U-Cd and β2-MG, the absolute concen-trations obtained were well below critical limits forthe onset of acute or chronic renal effects. Womentypically ingested less Cd than men but absorbedgreater amounts than males in the same cohortgroups.
Keywords Jamaica · Cadmium · Diet · Uptake ·Proteinuria · Biomarkers
P.R.D. Wright (�)International Centre for Environmental and Nuclear Sciences,UWI, Mona, Kingston 7, Jamaicae-mail: [email protected]
Introduction
Medical geology focuses on the relationship betweennatural geology and health problems in humans, ani-mals and plants. The discipline integrates the fields ofgeology, geochemistry, medicine, nutrition and pub-lic health in order to solve complex problems of traceelement interactions with the human body. The unique-ness of the geochemistry of Jamaican soils, particularlytheir trace element content, may have associated poten-tial health impacts. The occurrences of high naturallevels of arsenic, lead and cadmium or deficiencies iniodine or selenium may bring associated morbiditiesto resident populations. In Jamaica, specific geochemi-cal anomalies exist that may impact human and animalhealth. Some soils have geogenic cadmium concen-trations that are orders of magnitude higher (Lalor,1995) than regulated worldwide levels. These levelswere established to limit Cd exposure and minimisethe potential nephrotoxic effects of its bioavailabil-ity. Given the fact that the population has an elevatedrate of chronic renal failure (Barton et al., 2004), itwas important to establish cadmium’s contribution tothe incidence of renal disease. To this end, multi-disciplinary studies were carried out in areas withsignificantly elevated soil cadmium concentrations inorder to identify its contribution to any related morbid-ity in the population.
Aspects of Environmental CadmiumToxicity
Health effects from occupational exposure to cad-mium were first identified in nickel–cadmium batteryworkers (Friberg 1950), who breathed toxic vapours.
29O. Selinus et al. (eds.), Medical Geology, International Year of Planet Earth,DOI 10.1007/978-90-481-3430-4_2, © Springer Science+Business Media B.V. 2010

30 P.R.D. Wright et al.
The resulting metal fume fever rapidly progressedin many cases to chemical pneumonitis, pulmonaryedema and even death as a result of respiratory failure(Beton et al., 1966; Seidal et al., 1993). As an envi-ronmental hazard, cadmium was responsible for theoccurrence of itai-itai disease in Japan in the 1950s.Itai-itai, which is Japanese for “ouch-ouch”, is a formof acquired Fanconi’s syndrome and is characterisedby chronic calcium loss and the development of brittle,easily broken bones. Following World War II, farmingpopulations living along the banks of the Jinzu Riverwere exposed to food and water contaminated by minewastes (Nogawa and Kido, 1996). The cadmium accu-mulated in rice crops grown downstream, which wereconsumed by residents of nearby villages, resulting inrenal abnormalities, including osteomalacia, protein-uria and glucosuria (Jarup et al., 1998; Nordberg et al.,1997). Older post-menopausal, multiparous, malnour-ished women were most affected (Shigematsu, 1984).
In non-occupational settings the general popula-tion is exposed to cadmium through tobacco smokingand ingestion from dietary sources. Smoking carries agreater risk of Cd exposure and it has been estimatedthat about 10% of the cadmium content of a cigaretteis inhaled (Morrow, 2001; NTP, 2005). The lungs havea very high absorption efficiency compared to the gutand as much as 50% of the cadmium inhaled maybe absorbed (Friberg, 1983). On average, smokers arereported to have four to five times higher blood cad-mium concentrations and two to three times higher kid-ney cadmium concentrations than non-smokers (Lewiset al., 1972, Vahter et al., 2002).
The dietary route provides the most significant path-way for non-smoking populations (Jarup et al., 1998).Cadmium accumulates in leafy vegetables such as let-tuce and spinach and staples such as root tubers andgrains (ATSDR, 2008). The exposure risk is high forpersons who consume large amounts of these foodsand also some shellfish and organ meats (liver andkidney). The estimated daily intakes of cadmium innon-smoking adult males and females living in theUnited States are 0.35 and 0.30 μg Cd/kg/day, respec-tively. Females generally absorb greater amounts ofcadmium in the gastrointestinal tract than do males(ATSDR, 2008). Cadmium exposure in humans is typ-ically measured by concentration increases in the urine(U-Cd), an indication of body burden and/or the blood(B-Cd), a measure of more recent exposure (ATSDR,2008; Olsson et al., 2002).
Etiology of Toxicity
The primary target organs for Cd are the kidney andliver but it can be also found in bone, gall blad-der, pancreas, prostate, testes and the thyroid. It isgenerally considered to be one of the more toxicelements and consequently its effects have been thor-oughly reviewed (Agency for Toxic Substances andDisease Registry (ATSDR), 2008). As a result of thesignificant body of work following the itai-itai inci-dent in Japan (Aoshima, 1997; Nogawa, 1981; Fanet al., 1998), many countries have placed maximumlimits on the content of Cd in food. The World HealthOrganization maintains a provisional tolerable weeklyintake (PTWI) for Cd of 7 μg/kg body weight (JECFA,2000). This value was recently revised by the EU togive a TWI of 2.5 μg/kg body weight (EFSA, 2009).There have been, however, populations such as thosein Shipham in the United Kingdom that despite highexposures to Cd have been spared related health prob-lems (Baker et al., 1977; Ewers et al., 1985; McKenzie-Parnell and Eynon, 1987; Kido et al., 1988; Strehlowand Barlthrop, 1988; Sarasua et al., 1995).
The etiology of Cd toxicity has been widely studiedand the mechanisms of uptake and concentration in theproximal renal tubules are well understood (Nordberg,1984; Jarup et al., 1998; Bernard, 2008). An illustra-tion of the mechanism is shown in Fig. 1 (Bernard,2008). Following exposure, Cd is bound by metalloth-ionein (MT) in the liver forming a Cd-metallothioneincomplex (Cd-MT). The low molecular weight of Cd-MT allows free passage through the glomerular mem-brane of the kidney into the tubular fluid. The Cd-MTis transported by pinocytosis into the proximal tubularcells of the kidney where it is degraded by lysosomes,releasing free Cd into the cytoplasm. This free Cdinduces de novo synthesis of MT in the kidney tubuli,once again forming protective Cd-MT. Tubular damagecan occur if the influx of Cd-MT into the tubuli is veryhigh and the kidney cannot produce sufficient MT tobind the Cd released by the lysosomes (Nordberg et al.,2000; Friberg, 1984). At this stage the non-MT-boundCd becomes toxic, resulting in degradation of the prox-imal tubules. The resulting renal dysfunction is charac-terised by a reduced filtration capacity and is measuredby determining the concentrations of low molecularweight proteins such as α1-microglobulin (α1-MG),β2-microglobulin (β2-MG) or retinol-binding proteinin urine (Friberg et al., 1986). These are known to

A Regional Perspective of Medical Geology – Cadmium in Jamaica 31
Fig. 1 Illustration of the mechanism of Cd accumulation in proximal tubular cells of the kidney (Reprinted by permission fromBernard, 2008), copyright, the IJMR
be early indicators of the onset of proximal tubulardysfunction (Kjellstrom et al., 1977; Friberg, 1984;Lauwerys et al., 1984; Buchet et al., 1990; Piscator,1991). Japanese studies have shown that there is a non-linear relationship between Cd and β2-MG in urine,with the β2-MG increasing sharply once a thresholdvalue of U-Cd is exceeded (Ikeda et al., 2005).
Micronutrient Amelioration of CadmiumToxicity
Cadmium has the capacity to interact with othermicronutrients (chromium, magnesium, zinc, sele-nium, and iron) having similar physical and chemicalproperties. This interaction may change the rate ofabsorption of this metal by the body, resulting in eitherincreased or reduced toxicity. For example, exposure toCd coupled with a low-iron diet may contribute to theincrease in the toxicity of this metal. These interactionsmay happen in different phases of the absorption, dis-tribution and excretion of Cd and its elements (Brzóskaand Moniuszko-Jakoniuk, 1997). The absorption of Cdvia the gastrointestinal tract may be affected by sev-eral factors, such as age, gender and nutritional status.Among these, being younger, having iron deficiencyin the organism and especially being a woman are
characteristics that may accelerate the absorption ofthe metal (Olsson et al., 2002; Satarug and Moore,2004; Horiguchi et al., 2004). Women are generallymore affected by the toxic effects of Cd due to thefact that they have less iron burden than men. In somecases, one of the symptoms associated with cadmiumintoxication is the development of anaemia on exposedindividuals, as a result of an inhibiting effect of Cd inthe metabolism and absorption of iron (Vahter et al.,2002). It was found that in a study of urine and bloodCd in 105 individuals in Sweden, there were 1.6 timeshigher Cd levels in women compared to men (Olssonet al., 2002). According to the authors, the fact may beattributed to the lower iron levels in women as therewere no statistically significant differences betweenthe Cd intakes.
Local Health Concerns
Chronic non-communicable diseases continue to be adrain on the national budget. According to the availablerecords which reflect discharges from public hospitals,the most common occurrences are conditions relatedto the circulatory system, malignant neoplasms, dia-betes mellitus and renal failure in that order. In 2002,circulatory system, malignant neoplasms and diabetes

32 P.R.D. Wright et al.
mellitus ranked among the top five, renal failure rankedninth among the listed disease conditions. All thesehave been associated in one way or other with Cd butthe records do not allow links to be made and showno evident geographic links. It has been suggested bymembers of the medical fraternity in Jamaica that theprevalence of chronic renal failure (CRF) in the popu-lation is extremely high. The Diabetes Association ofJamaica has estimated that about 400–600 new cases ofCRF per million occur in Jamaica each year. A studycarried out on a group of persons with CRF from acrossthe island estimated prevalence in 1999 to be 327 casesof CRF per million (Barton et al., 2004). However,there were concerns of serious underreporting makingthe potential impact even greater. Of great interest isthe possible influence of the nephrotoxicity of Cd onthe prevalence of renal impairment in Jamaica.
A population autopsy survey carried out in Jamaicawith persons not resident in high cadmium areas hassuggested that the concentrations of Cd in the kid-neys are elevated when compared to other parts of theworld (Lalor et al., 2004). We were unable to differ-entiate between smoking and non-smoking subgroups,probably because of elevations in the background lev-els by other sources. In central Jamaica, where thecadmium levels in the soils are highest, indicativedata collected suggest a doubling in the concentra-tion of Cd in kidneys of local autopsy subjects whencompared to the population (unpublished data). This
could imply correlations between Cd concentrations insoil and urine and possibly also any associated renaldysfunction.
Given worldwide concerns of the toxicity of cad-mium and efforts taken to minimise exposure to thegeneral population, a thorough examination of thelocal situation was required. Elevated Cd concentra-tions in some farm soils in Jamaica result in accu-mulations in some crops grown for local consumption(Howe et al., 2005). Having confirmed elevated con-centrations in the kidneys of the general population itwas necessary to examine what health risk was posedby exposure to diet-sourced cadmium.
Geologic Origins of the Caribbeanand Jamaica
Jamaica is located in the Caribbean Sea (Fig. 2)at approximately latitude 18◦N and longitude 77◦W,about 4.5◦ south of the Tropic of Cancer or mid-way between the southern tip of Florida and thePanama Canal. The island has an area of approximately11,244 km2 (or about 4,411 square miles) (Fig. 3).
The islands of both the Greater Antilles (exceptCuba) and Lesser Antilles are located on the CaribbeanPlate, an oceanic tectonic plate underlying CentralAmerica and the Caribbean Sea off the north coast of
Fig. 2 Map of the Greater Antilles

A Regional Perspective of Medical Geology – Cadmium in Jamaica 33
Fig. 3 Parish map of Jamaica
South America. The plate is approximately 3.2 millionsquare kilometres (1.2 million square miles) in areaand borders the North and South American Nazca andCocos Plates. These bordering plates are intensely seis-mic, with frequent earthquakes, occasional tsunamisand volcanic eruptions. The eastern boundary isa subduction zone, resulting from convergence ofthe Caribbean Plate and either the North or SouthAmerican Plates or both. The subduction activityformed the volcanic islands of the Lesser Antilleswhich are home to 17 active volcanoes includ-ing Montserrat’s Soufriere Hills, Mount Pelée onMartinique, Guadeloupe’s La Grande Soufrière andSoufrière Saint Vincent on Saint Vincent. The south-ern boundary of the Caribbean Plate is the result ofa combination of transform and thrust faulting alongwith some subduction. Its interaction with the SouthAmerican Plate formed Barbados and Trinidad (bothon the South American Plate) and Tobago (on theCaribbean Plate) and islands off the coast of Venezuela(including the Leeward Antilles) and Colombia.
Two models of the tectonic evolution of theCaribbean Plate and genesis of the Cretaceous sub-marine flood basalts have been postulated. Generallycalled the Pacific and Atlantic models, both pro-pose that the submarine flood basalts originated froma hotspot/mantle plume, but differ on the location.The Pacific model suggests that the thick, Caribbeanoceanic crust and its flood basalts formed in the Pacific
Ocean from the Galapagos hotspot in the Farallon Plateand migrated to its present location (Burke et al., 1978;Ross and Scotese, 1988; Pindell and Barrett, 1990).The Atlantic model suggests that the Caribbean crustwas formed in-place on a mantle plume between Northand South America (Donnelly, 1985; Meschede andFrisch, 1998).
Jamaica is situated on the northwest rim of theCaribbean Plate (Green, 1977) and is seen as the emer-gent, uplifted, easterly tip of the Nicaragua rise. TheCaribbean Plate has moved east–north–east by about1,400 km with respect to North America since the lateEocene period. The east–west trending, seismicallyactive Cayman Trench separates Jamaica from theNorth American Plate. The island shares many of itsgeological features with Cuba, Hispaniola and PuertoRico. The earliest Caribbean seafloor was formed dur-ing the Jurassic period and the oldest dated rocksin Jamaica are consistent with the late Jurassic/earlyCretaceous ages of ophiolitic rocks typically found inthe Greater Antilles (Wadge et al., 1982). The islandcan be described as a Cretaceous volcano-plutonicarc, 70% of which is now covered unconformablyby Cenozoic sediments. Approximately 10% of thepresent-day land surface is covered by the majorCretaceous inliers. Calc-alkaline igneous rocks andvolcaniclastics occur in the Blue Mountains inlier(Grippi and Burke, 1980). During the mid-Eocene,yellow limestones unconformably overlay tectonically

34 P.R.D. Wright et al.
Fig. 4 Simplified geology map of Jamaica highlighting major formations
stable blocks, while a conformable cover extendedover the subsiding terranes of the Wagwater andMontpelier-Newmarket belts. Approximately 60% ofthe surface formations on the island are deposits ofthe White Limestone Group that accumulated duringthe late Eocene/early Miocene periods. A simplifiedgeology map of Jamaica is shown in Fig. 4.
During the Miocene period the northern end of theBlue Mountains block saw extensive uplift and vol-canic activity. During this time, the limestone coverwas removed from numerous tectonically stable local-ities of the island interior. The late Miocene sand-stone and limestone of the present-day Coastal Groupwere produced by continued sedimentation aroundthe coastal margins. The uplift that created the BlueMountain range occurred during the Pliocene. Thatuplift continued over the whole island during thePleistocene, resulting in the southward tilting anddown-faulting of the southern coastal plains.
Soils
Topologically, Jamaica can be divided into tworegions: a highland interior and a flatter coastal periph-ery. Approximately 15% of the soils have slopes of5% or less and about 50% have slopes above 20%.Jamaica shows diverse variation in soil types as a resultof differing parent materials, topography and rainfall.About two-thirds of the land is covered with soilsunderlain by limestone with the remainder weathered
from conglomerates, tuffs, shales, igneous and meta-morphic rocks. These soils are classified into threebroad categories, which reflect the underlying geologyand altitude (JRA, 1982).
Highland Soils
These occur at altitudes greater than 1,000 m in theBlue Mountains and in sections of the central and west-ern mountainous axis. They are mainly derived fromthe weathering of Cretaceous volcano-sedimentaryrocks. Two soil types can be distinguished:
1. Lithosols: Immature, highly porous soils whichhave been leached to acidity. Deforestation hasresulted in the erosion and subsequent truncationof the soil profile resulting in low-nutrient, infer-tile soils. Exceptions exist in areas of forest cover,which allows the development of an upper layer thatis organic rich and fertile.
2. Less acidic clays, produced by the weathering ofshales in areas with reduced drainage.
Upland Plateau Soils
These soils account for about 60% of Jamaica’s landsurface and occur over limestone between 700 and1,000 m. Two types exist, terra rossa (red limestone)and rendzina (black limestone). Terra rossa soils occurmainly in the parishes of Manchester and St. Annand are leached, well oxidised and dehydrated resid-ual bauxitic soils. They vary greatly in depth and have

A Regional Perspective of Medical Geology – Cadmium in Jamaica 35
no distinctive profile. The fine-grained rendzina soilsare weathered over the exposed stone and are poorlydrained. Their high Ca content and wetness limit fer-rous to ferric oxidation resulting in a darker colour andan absence of the typical red colour associated withbauxites.
Bauxite
The bauxite deposits are found mainly in areas under-lain by Cenozoic white limestones deposited in shal-low water. They are mainly of blanket type, althoughthe deposits can concentrate in depressions such asthose that occur in the extensively karstified CockpitCountry. The genesis of bauxites and their relationshipto the limestone bedrock have been the subject of muchdiscussion and are described by three principal models:
1. Bauxites were formed by the concentration ofimpurities following dissolution of the underlyinglimestone bedrock.
2. Alumina-rich residues, derived from the weather-ing of the volcanic rocks of the Cretaceous inliers,were transported onto and into the limestone ter-rain, with bauxites resulting from in situ weathering(Zans, 1952).
3. The deposition of ash falls derived from externalvolcanic activity that occurred close to the island(Comer, 1974).
Alluvial Plain and Valley Soils
These are deposited by rivers and are most extensiveon the southern slopes of the island. Narrow stripsalso occur in the central valleys and along the northcoast. The soils are highly fertile and consist of loam,sand and gravel. Other soil variations include riverinesoils covered by heavy clay soils of marine origin andswamp soils, notably in the Black River and Negrilareas.
Background Trace Element Researchin Jamaica
Jamaica has been the focus of significant geologicalresearch, resulting in extensive bibliographies (Draperand Lewis, 1990; Wright and Robinson, 1993). Earlygeochemical work was focused on defining the ele-mental content of the economically important bauxitedeposits. Detailed mapping of the island-wide soil
geochemistry was undertaken during the 1980 s fol-lowing the launch of the Centre for Nuclear Sciences(now the International Centre for Environmental andNuclear Sciences, ICENS) and the commissioning ofthe SLOWPOKE nuclear reactor used for InstrumentalNeutron Activation analysis (INAA). ICENS wasestablished to conduct integrated research programmesbased on environmental geochemistry.
Orientation Survey
A detailed geochemical orientation survey was con-ducted as a precursor to more extensive mappingand established the sampling and sample preparationmethodologies used for subsequent work (Simpsonet al., 1991). Six sample sites were chosen that cov-ered the main lithologic and climatic zones of Jamaica.Samples were analysed for 35 elements, using neu-tron activation analysis, X-ray fluorescence analysisand direct reading optical emission spectrometry.
Jamaican soils were found to contain a high propor-tion of fine fraction <150 μm (<100 mesh) material.This fraction was found to provide better geochem-ical differentiation than higher fractions and showedminimal variation of element concentrations with par-ticle size. This fine fraction was chosen as the sam-pling medium for the regional geochemical survey ofJamaica.
Radiation Survey
Approximately 6,700 km of roads and tracks were tra-versed by a Land Rover, with a rigidly mounted 6" ×4" sodium iodide scintillation detector (Fig. 5). The
Fig. 5 Radiometric monitoring equipment used during thesurvey
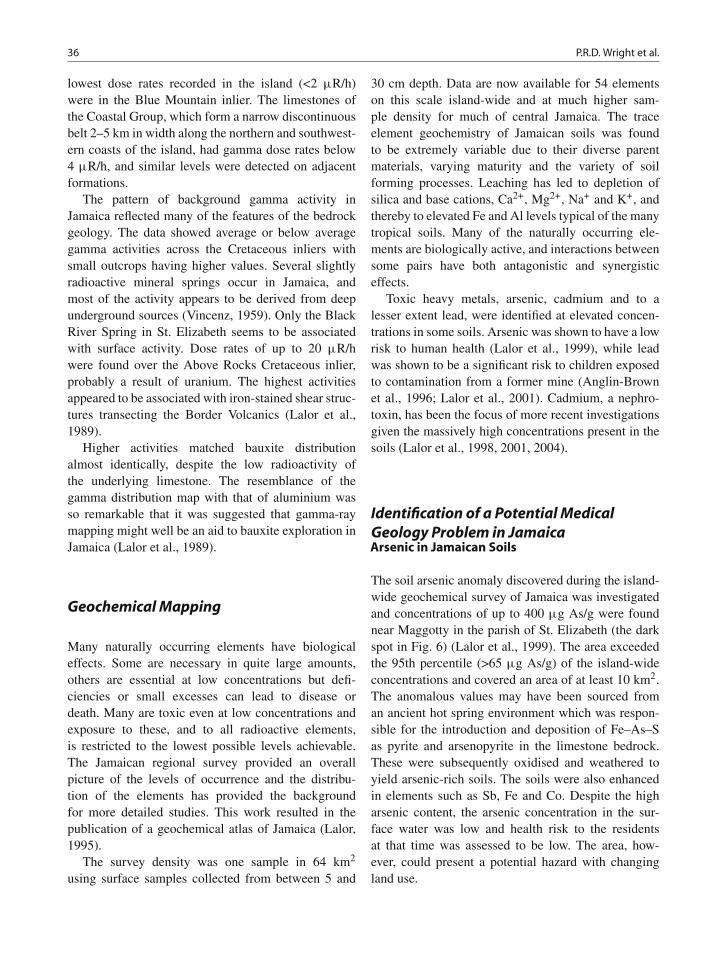
36 P.R.D. Wright et al.
lowest dose rates recorded in the island (<2 μR/h)were in the Blue Mountain inlier. The limestones ofthe Coastal Group, which form a narrow discontinuousbelt 2–5 km in width along the northern and southwest-ern coasts of the island, had gamma dose rates below4 μR/h, and similar levels were detected on adjacentformations.
The pattern of background gamma activity inJamaica reflected many of the features of the bedrockgeology. The data showed average or below averagegamma activities across the Cretaceous inliers withsmall outcrops having higher values. Several slightlyradioactive mineral springs occur in Jamaica, andmost of the activity appears to be derived from deepunderground sources (Vincenz, 1959). Only the BlackRiver Spring in St. Elizabeth seems to be associatedwith surface activity. Dose rates of up to 20 μR/hwere found over the Above Rocks Cretaceous inlier,probably a result of uranium. The highest activitiesappeared to be associated with iron-stained shear struc-tures transecting the Border Volcanics (Lalor et al.,1989).
Higher activities matched bauxite distributionalmost identically, despite the low radioactivity ofthe underlying limestone. The resemblance of thegamma distribution map with that of aluminium wasso remarkable that it was suggested that gamma-raymapping might well be an aid to bauxite exploration inJamaica (Lalor et al., 1989).
Geochemical Mapping
Many naturally occurring elements have biologicaleffects. Some are necessary in quite large amounts,others are essential at low concentrations but defi-ciencies or small excesses can lead to disease ordeath. Many are toxic even at low concentrations andexposure to these, and to all radioactive elements,is restricted to the lowest possible levels achievable.The Jamaican regional survey provided an overallpicture of the levels of occurrence and the distribu-tion of the elements has provided the backgroundfor more detailed studies. This work resulted in thepublication of a geochemical atlas of Jamaica (Lalor,1995).
The survey density was one sample in 64 km2
using surface samples collected from between 5 and
30 cm depth. Data are now available for 54 elementson this scale island-wide and at much higher sam-ple density for much of central Jamaica. The traceelement geochemistry of Jamaican soils was foundto be extremely variable due to their diverse parentmaterials, varying maturity and the variety of soilforming processes. Leaching has led to depletion ofsilica and base cations, Ca2+, Mg2+, Na+ and K+, andthereby to elevated Fe and Al levels typical of the manytropical soils. Many of the naturally occurring ele-ments are biologically active, and interactions betweensome pairs have both antagonistic and synergisticeffects.
Toxic heavy metals, arsenic, cadmium and to alesser extent lead, were identified at elevated concen-trations in some soils. Arsenic was shown to have a lowrisk to human health (Lalor et al., 1999), while leadwas shown to be a significant risk to children exposedto contamination from a former mine (Anglin-Brownet al., 1996; Lalor et al., 2001). Cadmium, a nephro-toxin, has been the focus of more recent investigationsgiven the massively high concentrations present in thesoils (Lalor et al., 1998, 2001, 2004).
Identification of a Potential MedicalGeology Problem in JamaicaArsenic in Jamaican Soils
The soil arsenic anomaly discovered during the island-wide geochemical survey of Jamaica was investigatedand concentrations of up to 400 μg As/g were foundnear Maggotty in the parish of St. Elizabeth (the darkspot in Fig. 6) (Lalor et al., 1999). The area exceededthe 95th percentile (>65 μg As/g) of the island-wideconcentrations and covered an area of at least 10 km2.The anomalous values may have been sourced froman ancient hot spring environment which was respon-sible for the introduction and deposition of Fe–As–Sas pyrite and arsenopyrite in the limestone bedrock.These were subsequently oxidised and weathered toyield arsenic-rich soils. The soils were also enhancedin elements such as Sb, Fe and Co. Despite the higharsenic content, the arsenic concentration in the sur-face water was low and health risk to the residentsat that time was assessed to be low. The area, how-ever, could present a potential hazard with changingland use.

A Regional Perspective of Medical Geology – Cadmium in Jamaica 37
Fig. 6 Arsenic distribution inJamaican soils
Cadmium in Jamaican Soils
Origins of Cadmium
The higher levels of cadmium in Jamaican soils areassociated with the white limestone geology and theoverlying aluminium-rich bauxite deposits in the cen-tral parishes (Lalor, 1995) (Fig. 7). The soils contain-ing the highest soil cadmium concentrations typicallyoccur at elevations greater than 200 m.
The two theories of the origin of cadmium inJamaica’s soils are the same as those postulated forthe genesis of bauxite (Zans, 1952; Comer, 1974).The competing theories of weathering from parent
limestone (Zans) or deposition of Miocene volcanicash (Comer) have to be examined in light of theidentification of a phosphatic band at the bauxite–limestone interface rich in Cd and other elements suchas Be and Y. This band, seen in some soils at varyingdepths, forms the interface between the limestone andoverlying bauxite soils. It was first identified by Eyles(1958) and examined in greater detail more recently(Garrett et al., 2008), which suggests a relationship tolate Miocene or Pliocene phosphorites derived fromthe weathering of fossilised sea bird guano depositsfrom rookeries that spanned the central part of theisland. The material contains fossilised fish bones andteeth suggesting a relation to the marine environment.The accurate dating of this material would be useful
Fig. 7 Cadmium associationwith underlying geology

38 P.R.D. Wright et al.
in determining whether the Cd is a result of concen-tration in limestone solutions as suggested by Zans oris the result of leachate from overlying volcanic parentminerals, which was postulated by Comer, weatheredto form the bauxites.
Concentration of Cd in Soils
The Jamaican soil Cd concentrations vary widely, witha mean value of approximately 20 mg/kg with maxi-mum values exceeding 900 mg/kg in some areas (Laloret al., 1998). These concentrations are in stark contrastto world averages of approximately 0.1–0.5 mg/kg(Adriano, 1986; Waldron, 1980). The extraordinarylevels in Jamaican soils are compared with worldvalues in Table 1.
Table 1 Comparison of Cd concentrations in selected Jamaicanand world soils
Manchester range Manchester mean World range
Cd (mg/kg) 0.56–931 54 0.005–2.9
These, with the exception of some values from theDominican Republic, appear to be the highest geogeniclevels observed in the literature, often orders of mag-nitude larger than for example the Canadian qualityguideline for Cd of 1.4 mg/kg (CCME, 1999) in agri-cultural soils. The mapping in Fig. 8 illustrates theconcentration distribution.
As a result of the perceived toxicity of Cd, sev-eral countries have placed maximum limits on soilCd concentrations which affect usage. Critical limitsabove which the soils are considered inappropriate forany human use are shown in Table 2 (DeVries et al.,
Table 2 Some critical limits for Cd and Zn in soils(mg/kg DW)
Country Cd Zn
Canada 0.5 50Denmark 0.3 100Finland 0.3 90The Netherlands 0.8 140Germanya 0.4–1.5 60–200Switzerland 0.8 200Czech Republic 0.4 150Eastern Europeb 2 100Ireland 1.0 150aThe first value is for sandy soils and second valuefor clay soilsbEastern Europe includes Russia, Ukraine, Moldaviaand Belarus
1998) and are significantly lower than the averageconcentrations in Jamaica.
Cadmium in Food
Some plant species have been shown to have an affin-ity for the uptake of cadmium. The soils of centralJamaica support major crop growing areas and investi-gations were undertaken to identify crops sensitive toCd uptake as shown in Table 3 for samples of fruit,legumes, leafy and root vegetables and root crops.Significant variation in Cd uptake was found betweencrop types. Soil Cd content is the main factor otherthan species type in controlling uptake (Howe et al.,2005).
There is significant variability in the concentrationsof Cd in food crops, which extends to over threeorders of magnitude in the analysed samples. Rootcrops (excluding root vegetables) had concentrations
Fig. 8 Cadmium distributionin Jamaican soils

A Regional Perspective of Medical Geology – Cadmium in Jamaica 39
Table 3 Comparisons of the Cd compositions of Jamaican foods by category
Cd concentrations (mg/kg fresh weight)
Food category Number of samples Range Mean EU limit
Fruit 18 0.005–0.14 0.03 0.005Legumes 4 0.026–0.132 0.17 0.2Vegetables: leafy 12 0.02–1.71 0.383 0.2Vegetables: root 9 0.43–0.94 0.49 0.1Other root crops 35 0.026–1.04 0.18 0.1Food category Types of samplesFruit Ackee, banana, breadfruit, corn, cucumber, orange, ortanique, plantain, tomato, pumpkin,
squash, sweet pepper, zucchiniLegumes Cow peas, French bean (string bean), gungo peas, red kidney beansVegetables: leafy Broccoli, cabbage, callaloo, cauliflower, lettuce, pak choi, thyme, scallionVegetables: root Beet, carrot, onion, turnipOther root crops Cassava, coco, dasheen, ginger, potato, sweet potato, yam
Table 4 Comparisons of mean Cd concentration of food forthree countries (mg/kg fresh weight)
Food category Jamaica United Kingdom United States
Fruit 0.029 0.002 0.004Legumes 0.33 0.059 0.054Leafy vegetables 0.4 0.023 0.058Root vegetables 0.4 0.011 0.014Root crops 0.2 0.026 0.018
between 0.004 and 6.5 mg/kg, root vegetables rangedfrom 0.001 to 1.8 mg/kg and leafy vegetables cov-ered a 0.002–1.7 mg/kg range. Jamaican foods haveCd concentrations 10–20 times higher than thosereported in the literature (Table 4), and the overall aver-age is greatly influenced by the values from centralJamaica.
There was significantly less variability in the con-centrations of other elements in the food crops. Thedifference observed for Cd may be attributable tothe absence of a mechanism of homeostatic con-trol as that which exists for the other elements. The
absence of this uptake regulating mechanism is illus-trated very well using yams and carrots, both of whichare able to concentrate significant amounts of Cd(Fig. 9).
Comparing the concentration range for Cd in thesamples with Fe, Zn, Cu, K, Ca, Mg and P, it is seenthat there is a much wider spread of data for Cd, up tothree orders of magnitude. The remaining elements ofinterest, Se (no data for carrots), As, Co, Mn, Cr andSc, show increased spread but not as much as for Cd.It is apparent from the data that the variability of Cd insoils is also reflected in the plants. Also, despite vary-ing levels of trace elements in the soils, both yam andcarrot regulate their uptake of bioessential elementsensuring the maintenance of constant internal levels tosupport growth.
The cadmium concentration in some foods isdirectly related to the soil Cd, illustrated by yams inFig. 10. The cadmium concentrations of yams showa strong correlation with the soil Cd up to a point,followed by a decrease at very high soil Cd concen-trations, suggesting possible toxicity.
Fig. 9 Distribution of Cd andother trace elements in yamsand carrots

40 P.R.D. Wright et al.
Fig. 10 Variation of the median concentrations of Cd in soilsand yams
Extractability of Cd in Gastric Juices
Tests of the extractability of Cd using simulated gas-tric juices carried out on a set of raw and cooked foodsshow that (a) cooking does not reduce the Cd con-tent and (b) all the Cd is extracted (Hoo-Fung et al.,2005–2006). For those crops examined (callaloo, car-rot, pak choi, sweet potato and yam) there is no lossof Cd during the usual cooking procedures of steam-ing and boiling and all the Cd present is effectivelyextracted by simulated gastric juices. This means thatall cadmium ingested is available for absorption acrossthe gut. Typically, absorption of Cd from the gut isreported as between 5 and 10% and varies depend-ing on factors such as the dietary intake of iron, wherehigher levels have been linked to reduced absorption.
Assessment of Cd Exposurein a Jamaican Population
The confirmation of cadmium accumulation in somefoods and its availability following gastric dissolu-tion suggested a possible exposure risk to popula-tions consuming foods grown in high-cadmium areas.Accumulation of cadmium in the kidneys was con-firmed in the general population following examinationof cortical cadmium concentrations using data from
autopsy subjects (Lalor et al., 2004). Cortical Cd con-centrations were elevated when compared to othercountries, except Japan.
In order to better determine what contribution foodconsumption had on this observation, a population inthe highest cadmium section of the island was exam-ined. Dietary assessments and the determination offood consumption frequencies were used to determinethe intake of cadmium and also examine variationsthroughout the population by age group. The exposurewas further confirmed by the examination of cadmiumin the urine of persons in these areas and also examina-tions of renal dysfunction biomarkers as an indicationof impact of cadmium intake.
Description of Study Area
The area chosen for studies on cadmium exposureis enclosed by the box shown in Fig. 11 and con-sists of contiguous sections of the central parishesof Clarendon, St. Ann, St. Elizabeth, Manchester andTrelawny. Cadmium concentrations vary from verylow to extremely high. In the main, however, thestudy area parishes represent areas of highest cadmiumconcentrations island-wide.
The geology of the area is dominated by white lime-stone and contains some areas of yellow limestone,sedimentary and volcanic rocks (Serpentinite andSchists). The study area encloses an intensively farmedarea of 22 km by 34 km, about 74,800 ha (Fig. 12), andis one of Jamaica’s “bread basket” regions.
Using soil data collected prior to the study, the areawas further divided into four strata according to Cdstatus shown in Table 5. The lowest soil Cd concen-tration strata had an upper limit of 4 mg/kg, alreadyconsidered very high for uncontaminated soils in mostcountries. The lowest concentration of Cd obtainedwithin the study area was 1.3 mg/kg, a figure, ashas been shown, considered elevated in most othercountries (CCME, 1999).
Population Demographics
The total population of the study area was 47,266according to the 2001 census (Statistical Institute ofJamaica) distributed relatively evenly between malesand females (52/48%). The number of persons over

A Regional Perspective of Medical Geology – Cadmium in Jamaica 41
Fig. 11 Island-wide distribution of cadmium highlighting the study area
Fig. 12 Study area showing local Cd distribution
the age of 40 based on the census data is approxi-mately 13,800 persons again with 52% of those beingmale. A total of 678 individuals were interviewed, withage from 18 to 85 years (mean 41.9 years). In thistotal, 64.3% were female, with the greatest number ofindividuals in the 25- to 34-year-old range.
Dietary Patterns
Cadmium intake was determined from the dietary pat-terns of persons in the study population. The dailyintakes were compared to the WHO provisional tol-erable weekly intake (PTWI) of 7 μg/kg bodyweight/

42 P.R.D. Wright et al.
Table 5 Definition of stratified soil Cd areas and the populationdistribution
StrataSoil Cd status(mg/kg)
Percentage of studypopulation in stratum
Low <4 38Medium 5–19 5High 20–59 28Very high >60 27
week (JECFA, 2000) and an estimate of risk forexcessive dietary intake ascertained. A sub-sampleof persons >40 years of age was surveyed for renalbiomarkers of cadmium exposure to estimate whateffects, if any, dietary cadmium was having on thehealth of the population. The study included the occur-rence of Cd and other elements in soils, food and urine.The dietary patterns of selected populations and con-sequent intakes from food have been evaluated. Alsoinvestigated were blood pressure, body mass index andurine dipstick measurements of blood, protein, pH andsugars.
Food Consumption Frequency
The major foods consumed by the individuals, theirrelated Cd content and their corresponding daily con-sumption rates (grams/day) are shown in Table 6. Themajority of the foods eaten were tubers, root vegeta-bles and leafy vegetables, all of which can have highuptakes of Cd.
Cd Intake and Micronutrients Consumption
The mean Cd intake was 9.3 μg/kg bodyweight/week;median: 5.4 μg/kg bodyweight/week. In the popula-tion, 39.2% of persons had Cd intake above the WHOPTWI of 7 μg/kg bodyweight/week. Cd intake meanswere higher and statistically significant (p ≤ 0.05)for those individuals that lived in medium and lowCd strata, males, farmers, individuals with ages 18–34 years, current smokers and alcohol consumers. Theintake and calculated risk factors are shown in Table 7.
Health Effects of Dietary Exposureto Cadmium
Other than the cases of itai-itai disease in Asia, espe-cially in Japan, no reports of significant morbidityassociated with diet-sourced cadmium have been pub-lished in the literature record. In Jamaica, a uniqueopportunity has been afforded to study the extent towhich the nephrotoxic effects of cadmium can beidentified in a population of persons residing and con-suming foods grown on enriched soils. The presenceof significant morbidity associated with cadmium inJamaica would serve to confirm what has been sug-gested about the toxicity of cadmium and the need toregulate its intake in the human body. On the otherhand, if identifiable morbidities in Jamaica remainlow and cadmium intakes are significantly higher thanthe PTWI, the real risk to the population will needto be assessed. It will be important to examine and
Table 6 Rankings of foods eaten and food Cd contents
Cd concentration (mg/kg) by percentile
Food Daily consumption (g) 25th percentile 50th percentile 75th percentile 95th percentile
Total carrot juice 164 0.072 0.073 0.076 0.079Total bush tea 117 0.0002 0.0005 0.0009 0.003Total yam 69 0.04 0.158 0.548 1.231Total ackee 46 0.089 0.178 0.305 0.654Total pak choi 29 0.34 0.57 0.81 1Total callaloo 29 0.06 0.34 0.89 1.54Total peanuts 27 2.063 2.442 2.82 3.124Total chicken liver 15 No value No value No value No valueTotal carrot 15 0.07 0.33 0.84 1.6Total cabbage 11 0.006 0.01 0.012 0.02Total cow liver 11 0.15 0.27 1.02 1.56Total lettuce 9 0.06 0.07 0.083 0.09Total cow kidney 7 1.14 3.13 6.14 12.1

A Regional Perspective of Medical Geology – Cadmium in Jamaica 43
Table 7 Cd intake and calculated risk factors
≤7 μg Cd/kga >7 μg Cd/kga
Variables Cd mean p-Value N (%) N (%) p-Value∗
GenderMale 13.4 0.000 ∗ 116 28.6 125 46.3 0.000Female 7.1 290 71.4 145 53.7Age groups18–24 12.2 0.000∗ 61 15.1 62 23 0.00325–34 11.7 75 18.6 67 24.835–44 9.3 81 20 54 2045––54 7.1 72 17.8 32 11.955–64 7.6 61 15.1 35 1364+ 5.5 54 13.4 20 7.4OccupationFarmers, labourers 11.5 0.000∗ 112 27.6 105 38.9 0.002Others 7.0 294 72.4 165 61.1AreaLow/median 10.8 0.009∗ 114/37 28.1/9.1 96/27 35.6/10 0.14High/very high 8.2 144/111 35.5/27.3 88/59 32.6/21.9SmokerNon-smoker 7.9 0.000∗ 348 85.7 197 73Past smoker 11.2 13 3.2 7 2.6Current smoker 13.6 30 7.4 31 11.5 0.000Smoke other substances 17.7 15 3.7 35 13
∗ t-Test; significant p < 0.05a PTWI/WHO – Provisional tolerable weekly intake recommended by World Health Organization. Men had ahigher average ingestion of Cd than women (13.4 and 7.1 μg/kg bodyweight/week) as they generally tend to con-sume higher amounts of food than women and may have as a consequence a higher intake of the metal (Watanabeet al., 2004)
quantify the intake of potential ameliorating micronu-trients and assess if any genetic adaptations exist thatmay provide additional protection. The co-ordinationof multi-disciplinary studies must be furthered in orderto fully identify and assess any Cd-related morbid con-ditions in the population and to help better understandtheir prevalences of lack thereof. Some of this workhas already commenced and it is hoped that furtherstudies will be conducted with collaborators to betterunderstand the local etiology of Cd toxicity.
Cd Exposure and Renal Biomarker Survey
Urine was sampled from persons living in areas of dif-fering soil Cd concentrations within the study area.The group was a subset of the larger sample of per-sons that took part in the diet survey that quantifiedtheir intake of Cd. The urine samples allowed thedetermination of a quantitative relationship betweenurine cadmium (U-Cd) and β2-microglobulin (β2-MG)and also facilitated the identification of the threshold
U-Cd that causes a significant increase in β2-MG. Thelink between increased U-Cd and geographic locationand the associated soil Cd concentrations was alsoinvestigated.
Cd (Creatinine Adjusted – U-Cd/g_cr)and β2-Microglobulin (CreatinineAdjusted – β2-MG/g_cr) in Urine
Results for Cd (Table 8) and β2-MG (Table 9) in urinewere obtained for 143 participants in the urine survey.The range of U-Cd in the total sample was 0–35.9 witha mean of 4.6 and a median of 3.1. The range of β2-MGin the samples was 2–10,440 μg Cd/g_cr with a mean
Table 8 Cadmium in urine
U-Cd (μg/g_cr)
Gender N Range Median
Male 51 0.3–22.3 2.46Female 92 0.01–35.9 3.42

44 P.R.D. Wright et al.
Table 9 β2-MG in urine
β2-MG (μg/g_cr)
Gender N Range Median
Male 51 9–10,440 78Female 92 2–8897 74
of 290 and a median of 74. About 17% of the sub-jects exceed 200 μg/g creatinine, the level consideredby the University Hospital of the West Indies (UHWI)Chemical Pathology Department to be normal. Urinedata were adjusted using creatinine content to correctfor dilution between samples.
Age
The median concentrations of U-Cd and β2-MG plusmedian Cd intakes for a series of increasing age
groups with ranges of 10 years, divided into totalpopulation, male and female groups, are shown inTable 10.
Figures 13, 14 and 15 are box plots of U-Cd,β2-MG and Cd intake, respectively, vs. age groupsfor the total population, male and female subgroups.A very gradual increase in U-Cd concentrations isobserved for the 70–79 age group, after which a sig-nificant decrease is observed (Fig. 13). No discerniblepattern is observed in the median values measuredfor β2-MG concentrations between the subject agegroupings (Fig. 14). Cd intake gradually decreaseswith age in the total population (Fig. 15) and sim-ilarly in the male population. The intake of Cd byfemales is more consistent across age groups, decreas-ing significantly in the 80–89 age group; however,the number of persons in that group was very low(n=2).
Table 10 Median U-Cd (μg/g_cr), β2-MG (μg/g_cr) and Cd intake (μg Cd/kg bodyweight/week) by age range
Total (n = 143) Male (n = 51) Female (n = 92)
Age range U-Cd β2-MG Cd intake U-Cd β2-MG Cd intake U-Cd β2-MG Cd intake
40–49 3 (41) 67 3.4 3.14 (17) 81 4.02 2.96 (25) 58 2.4150–59 2.7 (36) 83 2.77 2.5 (11) 140 3.16 3.5 (25) 81 2.4060–69 3.5 (37) 87 2.93 2.04 (12) 84 1.93 3.6 (25) 117 3.3170–79 4.5 (23) 59 2.26 6.94 (8) 54.5 1.22 3.68 (15) 88 2.3380–89 0.8 (5) 51 1.37 0.8 (3) 48 5.93 3 (2) 215 0.80
Fig. 13 Total population urine Cd by age range

A Regional Perspective of Medical Geology – Cadmium in Jamaica 45
Fig. 14 Total population β2-MG in urine by age range
Fig. 15 Total population Cdintake by age range
Gender
The median concentrations of U-Cd and β2-MG plusmedian Cd intakes for survey subjects aged 40 yearsand greater are shown in Table 11. Box plots show-ing U-Cd and β2-MG concentrations and Cd intake,respectively, for both gender groups have been plot-ted in Figs. 16, 17 and 18. The median concentrationof cadmium in the urine of females is slightly higherthan that for the males (3.4 vs. 2.5 μg Cd/g_cr), while
Table 11 Median U-Cd (μg/g_cr), β2-MG (μg/g_cr) and Cdintake (μg Cd/kg bodyweight/week) by gender
Male (n = 51) Female (n = 92)
U-Cd β2-MG Cd intake U-Cd β2-MG Cd intake
2.5 78 3.4 3.4 74 2.6
the β2-MG concentrations are almost the same (78vs. 74 μg/g_cr). The relative Cd intake is higher formales than females (3.4 vs. 2.6 μg Cd/kg bodyweight/week).

46 P.R.D. Wright et al.
Fig. 16 Box plots of U-Cdby gender
Fig. 17 Box plots of Cdintake by gender in>40-year-old population
The Cd intake variations with age were assessedand the median concentrations are shown in Table 12.Relative values of U-Cd by gender group are shownin Fig. 19. In the population below 40 years of age,males have more than double (6.8 vs. 3.0 μg Cd/g_cr)the Cd intake of females with the highest intakesrecorded for the 20- to 29-year-old males. Comparedto their respective >40 age groups, the Cd intake was
significantly higher for younger males while youngerfemales were only slightly higher.
Contribution of Smoking to Cd Exposure
The median concentrations of U-Cd, β2-MG andmedian Cd intakes for smoking status cohort groups

A Regional Perspective of Medical Geology – Cadmium in Jamaica 47
Fig. 18 Box plots of β2-MGby gender
Table 12 Cd intake in<40-year-old population bygender
Male < 40 years (n = 124) Cd intake Female < 40 years (n = 219) Cd intake
6.8 3.0
Fig. 19 Plot of Cd intake in<40-year-old population
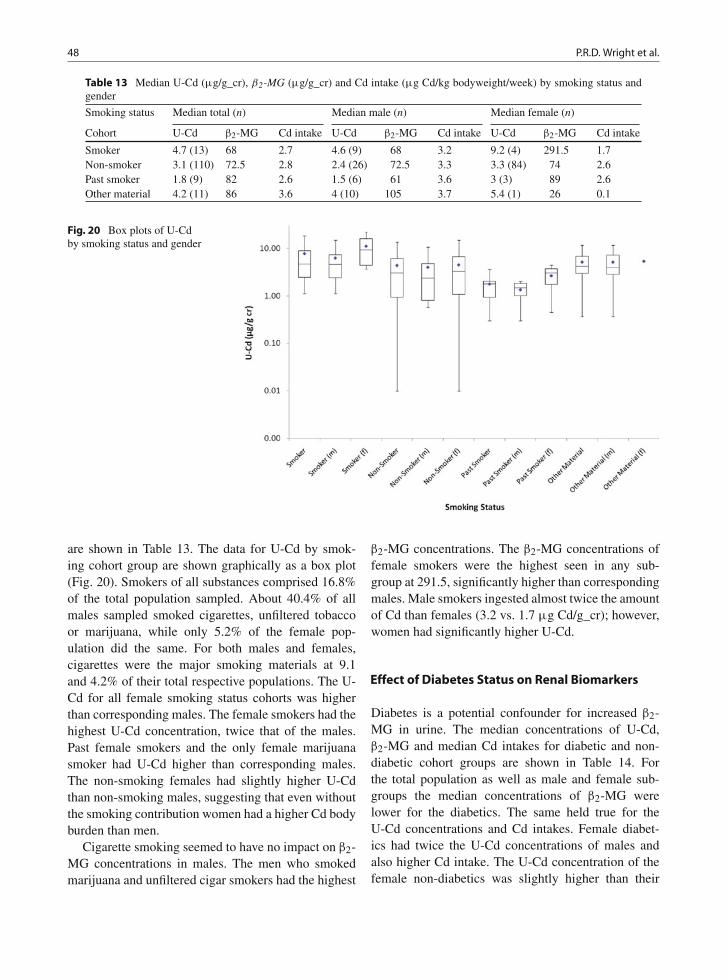
48 P.R.D. Wright et al.
Table 13 Median U-Cd (μg/g_cr), β2-MG (μg/g_cr) and Cd intake (μg Cd/kg bodyweight/week) by smoking status andgender
Smoking status Median total (n) Median male (n) Median female (n)
Cohort U-Cd β2-MG Cd intake U-Cd β2-MG Cd intake U-Cd β2-MG Cd intake
Smoker 4.7 (13) 68 2.7 4.6 (9) 68 3.2 9.2 (4) 291.5 1.7Non-smoker 3.1 (110) 72.5 2.8 2.4 (26) 72.5 3.3 3.3 (84) 74 2.6Past smoker 1.8 (9) 82 2.6 1.5 (6) 61 3.6 3 (3) 89 2.6Other material 4.2 (11) 86 3.6 4 (10) 105 3.7 5.4 (1) 26 0.1
Fig. 20 Box plots of U-Cdby smoking status and gender
are shown in Table 13. The data for U-Cd by smok-ing cohort group are shown graphically as a box plot(Fig. 20). Smokers of all substances comprised 16.8%of the total population sampled. About 40.4% of allmales sampled smoked cigarettes, unfiltered tobaccoor marijuana, while only 5.2% of the female pop-ulation did the same. For both males and females,cigarettes were the major smoking materials at 9.1and 4.2% of their total respective populations. The U-Cd for all female smoking status cohorts was higherthan corresponding males. The female smokers had thehighest U-Cd concentration, twice that of the males.Past female smokers and the only female marijuanasmoker had U-Cd higher than corresponding males.The non-smoking females had slightly higher U-Cdthan non-smoking males, suggesting that even withoutthe smoking contribution women had a higher Cd bodyburden than men.
Cigarette smoking seemed to have no impact on β2-MG concentrations in males. The men who smokedmarijuana and unfiltered cigar smokers had the highest
β2-MG concentrations. The β2-MG concentrations offemale smokers were the highest seen in any sub-group at 291.5, significantly higher than correspondingmales. Male smokers ingested almost twice the amountof Cd than females (3.2 vs. 1.7 μg Cd/g_cr); however,women had significantly higher U-Cd.
Effect of Diabetes Status on Renal Biomarkers
Diabetes is a potential confounder for increased β2-MG in urine. The median concentrations of U-Cd,β2-MG and median Cd intakes for diabetic and non-diabetic cohort groups are shown in Table 14. Forthe total population as well as male and female sub-groups the median concentrations of β2-MG werelower for the diabetics. The same held true for theU-Cd concentrations and Cd intakes. Female diabet-ics had twice the U-Cd concentrations of males andalso higher Cd intake. The U-Cd concentration of thefemale non-diabetics was slightly higher than their

A Regional Perspective of Medical Geology – Cadmium in Jamaica 49
Table 14 Median U-Cd (μg/g_cr), β2-MG (μg/g_cr) and Cd intake (μg Cd/kg bodyweight/week) by diabetes status andgender
Diabetes status Median total (n) Median male (n) Median female (n)
Cohort U-Cd β2-MG Cd intake U-Cd β2-MG Cd intake U-Cd β2-MG Cd intake
Diabetes 1.5 (19) 56 1.7 1.1 (8) 52 1.3 3.0 (11) 57 2.4No diabetes 3.3 (124) 81 2.9 2.8 (43) 82 3.7 3.5 (83) 80 2.6
male counterparts whose Cd intake was slightly ele-vated by comparison.
Effect of Hypertension Status on RenalBiomarkers
Hypertension is another potential confounder for ele-vations in β2-MG concentrations. The median con-centrations of β2-MG, U-Cd and median Cd intakesfor hypertensive and non-hypertensive cohort groupsare shown in Table 15. The β2-MG is virtually thesame in both total population cohorts and showedvery little variation between male and female cohorts.Both female cohorts have higher U-Cd concentra-tions than males but have either the same Cd intake(hypertensive) or significantly lower Cd intake (non-hypertensive).
Soil Cd Status
The median concentrations of U-Cd and β2-MG forsurvey subjects located in areas stratified by soil Cdconcentration are shown in Table 16. U-Cd is directly
related to the soil Cd status of the residence. Theβ2-MG was not related to the soil Cd status, with con-centrations being relatively consistent across soil Cdstrata groups (Fig. 21).
Relationship Between Urine Cadmiumand β2-Microglobulin
The total population, male and female median β2-MGconcentrations for a series of increasing U-Cd concen-tration groups with ranges of 4 μg/g_cr are shown inTable 17.
The data were plotted using bands of 4 μg Cd/g_cr(Fig. 22), and the medians outline the central J-shapedtrend in the data with a U-Cd flexure point between 8and 12 μg/g_cr. The females show a similar trend, witha flexure range of approximately 8–12 μg Cd/g_cr withthe 16–20 U-Cd range showing a much higher valuefor the β2-MG concentration (602.5 vs. 351 μg/g_cr).Median concentrations of β2-MG in the male subgroupare similar to those obtained for the females with asimilar flexure range of 8–12 μg Cd/g_cr. The devel-opment of the exponential increase is, however, limited
Table 15 Median U-Cd (μg/g_cr), β2-MG (μg/g_cr) and Cd intake (μg Cd/kg bodyweight/week) by hypertension statusand gender
Hypertensionstatus Median total (n) Median male (n) Median female (n)
Cohort U-Cd β2-MG Cd intake U-Cd β2-MG Cd intake U-Cd β2-MG Cd intake
Hypertension 4.1 (46) 74 2.5 3.1 (41) 49.5 2.5 3.9 (39) 88 2.5No hypertension 3.1 (78) 76 3.2 2.5 (37) 82 3.9 3.3 (51) 84 2.6
Table 16 Median U-Cd (μg/g_cr), β2-MG (μg/g_cr) and Cd intake (μg Cd/kg bodyweight/week) by soil Cd statusand gender
Soil Cd status Total population median (n) Male population median (n) Female population median (n)
Strata U-Cd β2-MG U-Cd β2-MG U-Cd β2-MG
Low 1.2 (41) 70 1.4 (16) 84.5 1.0 (25) 64Medium 1.8 (11) 147 1.8 (1) 196 2.3 (10) 147High 3.3 (51) 71 2.8 (21) 71 4.8 (30) 70.5Very High 5.1 (40) 66.5 5.2 (13) 82 5.0 (27) 59

50 P.R.D. Wright et al.
Fig. 21 Box plots of U-Cdby soil Cd status and gender
Table 17 Median U-Cd (μg/g_cr) (in 4 μg ranges) and β2-MG(μg/g_cr) for total population and by gender
U-Cd
Total populationmedian (n)β2-MG
Female populationmedian (n)β2-MG
Male populationmedian (n)β2-MG
<4 68.5 (90) 59 (56) 76 (34)4–8 70.5 (30) 72 (21) 67 (9)8–12 120 (13) 108.5 (8) 142 (5)12–16 131 (3) 131 (3)16–20 351 (3) 602.5 (2) 28 (1)20–24 557 (3) 2,205 (1) 342 (2)>24 551 (1) 551( 1)
by a lack of males with U-Cd values in excess of 12 μgCd/g_cr.
Discussion
Much of the concern about environmental cadmiumtoxicity is based on the Japanese experience of thehorrible itai-itai disease. The symptoms were firstnoted in the Toyama Prefecture, Japan, in 1912(Imamura, 2007), and after World War II, an outbreakin the nearby Jinzu basin attracted worldwide attention(Aoshima, 1997; Nogawa, 1981; Fan et al., 1998). The
Fig. 22 Plot of creatinineadjusted β2-MG vs. creatinineadjusted U-Cd as box plots foreach 4 μg Cd/g_cr interval

A Regional Perspective of Medical Geology – Cadmium in Jamaica 51
sufferers were elderly, multiparous women (Nogawa,1981; Aoshima, 1997) who had lived for more than 30years near a Cd-contaminated stream and whose maindiet was rice grown in cadmium-contaminated pad-dies (Tsukahara et al., 2003a; Tsukahara et al., 2003b;Ikeda et al., 2006; Chaney et al., 2000; Simmons et al.,2003).
Itai-itai like diseases seem to have occurred onlyin Asia, linked to the staple diet of rice grown insome circumstances on soils with as little as 2 mg/kgCd (Cai et al., 1990). The high cadmium uptake ofrice was accompanied by low levels of calcium, ironand especially zinc, likely a strong contributing factorinfluencing the absorption of Cd and its distributionin organs and tissues (Berglund et al., 1994; Brzóskaand Moniuszko-Jakoniuk, 1997; Chaney et al., 2000;Chaney et al., 2001; Flanagan et al., 1978; Fox et al.,1979; Reeves and Vanderpool, 1998). Such deficien-cies exacerbate Cd-related health risks (Hallberg et al.,1977; Pedersen and Eggum, 1983). Higher Zn/Cdratios are reported as particularly important in amelio-rating the absorption and possible ill effects of Cd onhumans (Chaney et al., 2000).
Itai-itai affected a population with specific charac-teristics and the confluence of factors was differentfrom what is obtained in the West and indeed else-where in Japan. Several studies have indicated anincreased cadmium intake in women with reducedbody iron stores (Berglund et al., 1994; Flanagan et al.,1978; Fox et al., 1979; Pedersen and Eggum, 1983). Znand Fe deficiencies can increase Cd retention and riskand would very much apply to an essential element-deficient population. There may be other confoundingfactors including Cd bioavailability differences amongfoods, the percentage of absorption of dietary Cd in apopulation, genetics, lifestyle and antagonistic or syn-ergistic exposures to other elements. The disease hasnot to the best of our knowledge been reported out-side of Asia and certainly not in Jamaica where someof the soil Cd are so high that a helpful anonymousreferee of our first paper which contained the val-ues (Lalor et al., 1998) queried the analytic accuracy,suggesting that with levels like these there should bemany dead people around. He was only convinced,though still surprised, by confirmatory results usingneutron activation analysis. There is also no questionabout cadmium’s bioavailability and accumulation insegments of the Jamaican population.
In numerous examples in the literature, cadmium islinked with one of several afflictions including renaldisease, osteomalacia, prostate cancer and diabetes.
Incidences of hypertension, diabetes, cardiac disease,prostate cancer and end-stage renal disease are con-sidered high in Jamaica. There, however, seems to beno relationship between the observed incidence of end-stage renal failure and soil Cd concentrations (Bartonet al., 2004). There is still no evidence of increasedmorbidity or mortality that can be attributed to Cd inJamaica. The life expectancy of Jamaicans at birth is73.59 years and ranks #100 in the world (CIA, 2008),comparing well with Caribbean countries with differ-ent soils. Also, it is observed that in the >40-year-oldpopulation, the highest median age of death is found inthe parish with the highest soil Cd concentrations.
At the levels being found, the Jamaican situationmay be somewhat puzzling but is not entirely uniqueas there are at least five other examples in the litera-ture with reports of high cadmium concentrations thattoo have led to no obvious effects. They are France (deBurure et al., 2003), Germany (Ewers et al., 1993),United Kingdom (Strehlow and Barlthrop, 1988),United States (Sarasua et al., 1995) and New Zealand(McKenzie-Parnell and Eynon, 1987). Where compar-isons can presently be made, the general situation inJamaica appears very similar to that in the UK sites.Aside from the itai-itai cases there seems to be noother significant morbidity recorded in literature asa result of cadmium in the diet. However, there areseveral dose–response studies at various levels of cad-mium exposure and clearly a renal response exists andthis dose–response is also observed between urinarycadmium and β2-MG in the Jamaican population. Butthe levels being observed are simply not high enoughto be of concern for the onset of significant renalimpairment.
Studies of Cd exposure in occupational settings andthe Asian itai-itai experiences have defined the physio-logical effects of Cd toxicity. Such information was thebase of many regulations and guidelines and informedthe World Health Organization’s provisional tolerableweekly intake (PTWI) value for Cd (7 μg Cd/kg body-weight/week) (JECFA, 2000) and the recently revisedEU TWI of 2.5 μg Cd/kg bodyweight/week (EFSA,2009). There has been a great deal of work report-ing links of cadmium with numerous diseases so thereported soil concentrations in Jamaica, the observedtransfers to foods and to people raised justifiable con-cerns about the potential public health of cadmium onthe population.
U-Cd may be influenced by smoking and age, whilethe renal impacts of diabetes and hypertension mayincrease the β2-MG concentrations observed. U-Cd

52 P.R.D. Wright et al.
typically increases with age (Satarug et al., 2002;Satarug and Moore, 2004; Benedetti et al., 1999),and in the Jamaican population it was found thatan increase in U-Cd did occur with age and wasmainly attributed to the women, who showed a dis-tinct, gradual increase. However, the median age ofthe population studied was 58 years and there wasno bias in the sample towards persons with higheraccumulations of Cd (70–79 years). The influence ofsmoking was evident in both males and females, whereU-Cd concentrations were significantly higher thanrespective non-smokers. The females demonstratedenhanced susceptibility to Cd absorption also iden-tified by other workers (Nishijo et al., 2004; Jarupet al., 1998). Regardless of the fact that male smok-ers ingested twice the diet-sourced Cd of females,the U-Cd concentration for females was significantlylarger. The difference between female smokers andnon-smokers was significantly larger than that betweenthe male smoking cohorts. Though the smoking cohortshowed significantly higher U-Cd than non-smokers,the group comprised only 16.8% of persons surveyed.The majority of persons were therefore influenced onlyby diet-sourced cadmium. Chronic illnesses such asdiabetes and hypertension can increase β2-MG concen-trations (Hong, 2000). There have been some studiesthat suggest diabetics may be more susceptible to Cdtoxicity (Akesson et al., 2005; Buchet et al., 1990).For this work, diabetes and hypertension showed noconfounding influence on the β2-MG concentrations.
The concentrations of cadmium in tubers, greenleafy vegetables and root vegetables are directly influ-enced by the soil Cd concentrations. The plants affinityfor Cd is exacerbated by what seems to be a lack ofthe homeostatic controls seen for essential elements.
The result is that cadmium uptake continues, whileessential elements are regulated and have a very narrowconcentration range across soils of varying concentra-tions. This lack of homeostatic control presents a largerproblem, as the ratios between Cd and amelioratingelements such as Zn, Se, Ca or Fe increase, potentiallyincreasing the toxicity of Cd.
The Asian experience has shown that rice is anexcellent vector for Cd and the potential for micronu-trient amelioration is reduced given low levels ofcalcium, iron and zinc (Chaney et al., 2000; Simmonset al., 2003). It has been argued that other elementsin foods, zinc in particular, may influence the absorp-tion of Cd and its distribution in organs and tissues(Berglund et al., 1994; Brzóska and Moniuszko-Jakoniuk, 1997; Chaney et al., 2001; Flanagan et al.,1978; Fox et al., 1979; Reeves and Vanderpool, 1998)and low plant concentrations may exacerbate Cd-related health risks (Hallberg et al., 1977; Pedersen andEggum, 1983).
The Zn/Cd ratios in soils are usually >100(Holmgren et al., 1993) but low values appear to bean island-wide characteristic (Lalor et al., 2001). InJamaica, the spatial distribution of zinc is similar toCd, but the Zn/Cd ratios are very low in the soils ofcentral Jamaica. These low Zn/Cd ratios in the soilsare reflected in the crops grown therein, resulting inratios much lower than those from the United Statesor United Kingdom (Table 18). In Manchester, meanplant Zn/Cd ratio is as low as 8, and in the area withthe highest Cd concentration the ratio falls to 0.3. Thelow ratios may deserve attention in terms of poten-tial health hazards (Chaney et al., 1999) as it mayreduce the potential of zinc to ameliorate the effects ofCd following ingestion. However, the soils also show
Table 18 Comparison of Cd concentrations with EU limits, Zn concentrations and Zn/Cd ratios (Jamaica, United Kingdomand United States)
Food category Cd Zn Cd limit (EU) Zn/Cd (JA) Zn/Cd (UK) Zn/Cd (US)
Fruit n 65 69 0.05Mean 0.057 2.47 43 425 475
Legumes n 18 18 0.2Mean 0.638 21.27 33 508 389
Leafy vegetables n 84 88 0.2Mean 0.163 4.43 27 170 43
Root vegetables n 90 94 0.1Mean 0.350 3.64 10 218 200
Other root crops n 542 424 0.1Mean 0.200 3.81 19 127 167

A Regional Perspective of Medical Geology – Cadmium in Jamaica 53
enhancements in other elements, such as calcium andiron which may also restrict the uptake and effects ofcadmium.
For the total population, it is observed that bothmen and women have mean Cd intakes that are sig-nificantly higher than the WHO PTWI. Given that Cdexposure has a cumulative impact, the current intake ofCd through the diet is not a suitable measure of lifetimeCd exposure. To get a better proxy of the fluctuationof individual Cd intake with age, intakes were exam-ined across increasing 10-year age groups in the studypopulation. Younger men ingested significantly morecadmium than older males and the same was true forwomen, however, with a smaller difference betweenthe groups. Suffice to say, the Jamaican population isbeing exposed to an elevated amount of cadmium overtime.
The mean and median values of U-Cd in theJamaican study population were 4.6 and 3.1 μgCd/g_cr, respectively. The results suggest an elevatedexposure to Cd with the potential for an increasein excretion of tubular enzymes (Table 19). Japanesestudies have reported itai-itai disease patients with U-Cd as high as 20–30 μg Cd/g_cr (Nogawa and Kido,1993) and values of approximately 6–10 μg Cd/g_cr inthe areas where Cd pollution was identified in the envi-ronment and tubular dysfunction (no itai-itai disease)was detected in the population (Watanabe et al., 2000).
Table 19 Renal effects associated with increasing urine cad-mium concentrations
Urine Cd μg/g_creatinine
Exposure status(non-occupational) Effects/response
≤2 Normal value Between 0.5 and 2.0increased urinaryexcretion of NAG-B mayoccur
2–5 Overexposure Potential increase in urinaryexcretion of tubularenzymes or antigens(total NAG, AAP)
5–10 Significantoverexposure
Potential renal tubulardamage and associatedlow and high molecularweight proteinuria(increase in β2-MG).Onset of osteomalacia,glucosuria. Primary aswell as secondaryprevention intervention
Table 20 Interpretation of elevated values of urinary β2-microglobulin (β2-MG) and retinol-binding protein (RBP)induced by occupational or environmental exposure to Cd
β2-MG in urine(μg/g_cr) Renal significance
<300 Normal300–1,000 Incipient Cd tubulopathy (potential
reversal of condition if exposure isremoved and urinary Cd is not tooelevated, i.e. below 20 μg/g_cr)
1000–10,000 Irreversible tubular proteinuria that mayaccelerate the decline of glomerularfiltration rate with age. At this stageglomerular filtration rate is normal orslightly impaired
>10,000 Overt Cd nephropathy usually associatedwith a decreased glomerular filtrationrate
Modified from Bernard (2004)
In Jamaica, the values are well below both sets of val-ues. The mean and median β2-MG concentrations were290 and 74 μg/g_cr, respectively, suggesting no sig-nificant renal tubular dysfunction (Table 20) (Bernard,2004). There were only five subjects with β2-MG con-centrations greater than 1,000 μg/g_cr, the level wherethere should be serious consideration of irreversibletubular proteinuria with retention of normal glomerularfiltration rates.
The data illustrate the tendency for females toabsorb greater amounts of Cd than males. Femalesingested less Cd than males but their U-Cd excretionwas similar or greater, suggesting that they absorbedmore. Increased Cd absorption in females has beencovered in the literature (Nishijo et al., 2004; Jarupet al., 1998) and it was postulated that as a resultof reduced iron stores in women (menstruation bloodloss) their absorption of Cd across the intestines wasgreater than that of males (Akesson et al., 2002;Berglund et al., 1994; Vahter et al., 1996). For women,this increases any risk associated with exposure todiet-sourced cadmium compared to males.
The data also show that as the soil Cd increasedin concentration, so did the median U-Cd. A signifi-cant number of the persons surveyed were subsistencefarmers and their dietary Cd intake was most likelyrelated to the ingestion of foods whose Cd content wasrelated to the local farm soils. The relationship betweenU-Cd and soil Cd was not evident between β2-MGand soil, but is not surprising as the extent of absorp-tion depends on a host of factors including amounts of

54 P.R.D. Wright et al.
protective metallothionein available to bind Cd and thepresence of ameliorating elements that limit absorptionin the gut (e.g. iron). The variability of these factors inany population makes direct linkages of β2-MG to Cdsources difficult.
While a direct link could not be established betweenrenal dysfunction and soil Cd (and by extension food)there was clearly a dose–response between U-Cd andβ2-MG. For this study, median β2-MG was 1.5 timeshigher in subjects with U-Cd/g_cr >5 μg Cd/g_cr com-pared with those <5 μg Cd/g_cr, increasing for valuesin excess of 9 μg Cd/g_cr. The dose–response wascharacterised by an exponential increase in β2-MGconcentrations once a threshold level of U-Cd between9 and 12 μg Cd/g_cr was exceeded. This thresholdlevel is similar to values of 10 μg Cd/g_cr postulatedin the literature (Nordberg et al., 2002; Ikeda et al.,2003). The majority of persons with U-Cd concentra-tions in excess of 9 and 12 μg Cd/g_cr were females.It was also shown that β2-MG exceeds the “normal”value of 300 μg/g_cr at a threshold U-Cd concentra-tion between 11 and 12 μg Cd/g_cr, similar to thevalue of 11.5 μg Cd/g_cr suggested in the literature(Lauwerys et al., 1994). These factors notwithstanding,there was no group of persons whose median β2-MGexceeded 1,000 μg/g_cr (irreversible renal damage)and there were only four persons or 2.8% of the totalpopulation where U-Cd exceeded the 20 μg Cd/g_crlevel, identified in Japanese itai-itai patients (Nogawaand Kido, 1993).
The link between the soil Cd and the U-Cd inJamaica is clear as is the Cd dose–response with β2-MG concentrations once the threshold of 9–12 μgCd/g_cr for U-Cd is exceeded. However, the U-Cdconcentrations are not at levels that would suggestpossible onset of renal impairment. Similarly the con-centrations of β2-MG measured are below levels thatwould suggest irreversible renal damage. The popula-tion though exposed to an elevated amount of Cd is notdisplaying significant renal impairment, most likely aresult of limited absorption.
Summary
Geogenic levels of Cd in the soils of central Jamaicaare high and have been shown to be available to somefoods, mainly green leafy vegetables, tubers and rootvegetables. The ingestion of these foods exposes the
persons consuming them to an elevated dose of Cd.Cd exposure has been confirmed in the urine of res-idents of high-cadmium areas. Mean urine cadmiumand β2-MG concentrations of 4.6 μg Cd/g_cr and290 μg/g_cr, respectively, confirm that the (a) popula-tion is being exposed to elevated Cd levels and (b) thereis evidence of very mild tubular proteinuria. There wasclear evidence of an association between U-Cd and soilCd (and by extension food Cd) grouped by strata. Theproteinuria detected in the population was related toCd exposure, evidenced by the relationship between U-Cd and β2-MG. While positive results were obtainedfor the identification of Cd-related renal biomarkers inthe study population and there was a clear associationbetween U-Cd and β2-MG, the absolute concentrationsobtained were well below critical limits for the onsetof acute or chronic renal effects. The study identifiedthat women absorbed greater amounts of Cd than menin the same cohort groups. Even with a lower dietaryintake of Cd than men, women clearly retained moreof what they ingested, evidenced by U-Cd concentra-tions that were either slightly or significantly more thanmales, depending on cohort group.
The reasons why the effects of Cd in the Jamaicanenvironment are seemingly so slight may be attributedto dietary balance, nutrient amelioration or perhapsgenetic adaptation. A thorough assessment of the tox-icity of Cd, taking into account ingestion of amelio-rating nutrients, is warranted and the real risk to thepopulation must be quantified. It may be that the rep-utation of cadmium as an environmental toxin may beoverrated in normal conditions, with the absence of thespecific population characteristics associated with theAsian itai-itai occurrence.
Acknowledgements Thanks are due to the entire staff ofICENS who contributed in many ways to this work. KameakaDuncan and Richard Hanson, who coordinated the field compo-nent of the urine sampling programme. Richard also contributedsignificantly to the analyses, the results of which are alsobeing used in the pursuit of his masters of sciences degree.The International Development Research Centre (IDRC) whoprovided the major funding for this project. We would alsoacknowledge the following agencies and persons:
Dr. Pauline Samuda, Dr. Beverley Lawrence and PaulineJohnson, Caribbean Food and Nutrition Institute;
Dr. Peta-Anne Baker and Horace Levy, Social Work Unit;Dr. Leslie Simpson, Caribbean Agricultural Research and
Development Institute;Dr. Nadia Williams, Department of Pathology, University
Hospital of the West Indies;Dr. Blossom Anglin-Brown, Director, University Health
Centre;

A Regional Perspective of Medical Geology – Cadmium in Jamaica 55
Professor Everard Barton, Head and ConsultantNephrologist, Department of Medicine (UWI);
Dr. Robert G. Garrett, Geological Survey of Canada;Dr. Edna Massae Yokoo, Federal University of Mato Grosso,
Brazil;The Environmental Foundation of Jamaica;The Government of Jamaica;The Organisation of American States;The University of the West Indies, Mona.
References
Adriano DC (1986) Trace Elements in the TerrestrialEnvironment. New York: Springer-Verlag.
Agency for Toxic Substances and Disease Registry (ATSDR)(2008) Draft Toxicological Profile for Cadmium. Atlanta:ATSDR.
Akesson A, Berglund M, Schutz A, Bjellerup P, Bremme K,Vahter M (2002) Cadmium exposure in pregnancy andlactation in relation to iron status. Am J Public Health92(2):284–287.
Akesson A, Lundh T, Vahter M, Bjellerup P, Lidfeldt J, NerbrandC, et al. (2005) Tubular and glomerular kidney effects inswedish women with low environmental cadmium exposure.Env Health Perspect 113:1627–1631.
Anglin-Brown B, Armour-Brown A, Lalor GC, Preston J,Vutchkov MK (1996) Lead in a residential environment inJamaica. Environ. Geochem. Health, 18:129–133.
Aoshima K (1997) Recent advances in studies of Itai-itai disease.Jpn J Toxicol Environ Health 43(6): 317–330.
Baker EL, Hayes GG, Landrigan PJ, handke JL, Leger RT,Housworth WJ, et al. (1977) A nationwide survey of heavymetal absorption in children living near primay copper, leadand zinc smelters. Am. J. Epidemiol., 106, 261–273.
Barton EN, Sareant LA, Samuels D, Smith R, James J, Wilson R,et al. (2004) A Survey of Chronic Renal failure in Jamaica.West Indian Med J 53(2):81–84.
Benedetti J-L, Samuel O, Dewailly E, Gingras S, Lefebvre M(1999) Levels of cadmium in kidney and liver tissues amonga Canadian population (Province of Quebec). J ToxicolEnviron Health 56:146–163.
Berglund M, Akesson A, Nermell B, Vahter M (1994) Intestinalabsorption of dietary cadmium in women depends onbody-iron stores and fiber intake. Environ Health Perspect,102:1058–1066.
Bernard A (2008) Cadmium and its adverse effects on humanhealth. Indian J Med Res 128:557–564.
Bernard A (2004) Renal dysfunction induced by cadmium:biomarkers of critical effects. Biometals 17:519–523.
Beton DC, Andrews GS, Davies HJ, Howells L, Smith GF(1966) Acute cadmium fume poisoning; five cases withone death from renal necrosis. Br J Ind Med 23(4):292–301.
Brzóska MM, Moniuszko-Jakoniuk J (1997) The influence ofcalcium content in diet on the accumulation and toxicologyof cadmium in the organism. Arch Toxicol 72:63–73.
Buchet JP, Lauwerys R, Roels H (1990) Renal effects ofcadmium body burden in the general population. Lancet336:699–702.
Burke K, Fox PJ, Sengor AM (1978) Buoyant ocean floorand the evolution of the Caribbean. J Geophys Res 833949–3954.
Cai SW, Yue L, Hue ZN, Zhong XZ, Ye ZL, Xu HD (1990)Cadmium exposure and health effects among residents in anirrigation area with ore dressing wastewater. Sci Tot Environ90:67–73.
CCME (1999) Canadian Soil Quality Guidelines for theProtection of Environmental and Human Health: Cadmium.Canadian Environmental Quality Guidelines.
Chaney RL, Reeves PG, Angle JS (2001) Rice plant nutritionaland human nutritional characteristics role in human Cd tox-icity. In WJ Horst (ed) Plant nutrition: Food security andsustainability of agro-systems (pp. 288–289). Netherlands:Kluwer Academic Publishers.
Chaney RL, Ryan JA, Li YM, Angle JS (2000) Transferof cadmium through plants to the food chain. In JKSkyres, M Gochfeld (ed) Proceedings of the SCOPEWorkshop Environmental cadmium in the Food Chain:Sources, Pathways and Risks. Brussels: Belgian Academy ofSciences. 13–16 September.
Chaney RL, Ryan JA, Li YM, Brown SL (1999) Soil cadmium asa threat to human health. In MJ McLaughlin, BR Singh (eds)Cadmium in Soil and Plants (pp. 219–256). Netherlands:Kluwer Publishers.
CIA (2008) The 2008 World Factbook. Central IntelligenceAgency.
Comer JB (1974) Genesis of Jamaican Bauxite. EconomicGeology 69(8):1251–1264.
de Burure C, Buchet JP, Bernard A, Leroyer A, Nisse C,Haguenoer JM, et al. (2003) Biomarkers of renal effectsin children and adults with low environmental expo-sure to heavy metals. J Toxicol Environ Health A66:783–798.
DeVries W, Bakker DJ (1998) Manual for calculating criticalloads of heavy metals for terrestrial ecosystem: Guidelinesfor cirtical limits, calculation methods and input data. TNOInstitute of Environmental Sciences, Energy Research andProcess Innovation. The Netherlands: Den Helder; 144 pp.
Donnelly TW (1985) Mesozoic and Cenzoic plate evolutionof the caribbean region. In FG Stehli, SD Webb (eds) TheGreat American Biotic Interchange (pp. 89–121). New York:Plenum Press.
Draper G, Lewis JF (1990) Geology and tectonic evolution ofthe northern Caribbean margin. In G Dengo JE Case (eds)The Caribbean Region (Vols. Geology of North America v.H, 120). Boulder, CO: Geological Society of America.
EFSA (2009) Scientific opinion of the Panel on Contaminats inthe food chain on a request from the European Commissionon cadmium in food. EFSA J 980:1–139.
Ewers U, Brockhous A, Dolgner R, Freier I, Jermann E, BernardA, et al. (1985) Environmental exposure to cadmium andrenal function in elderly women living in cadmium-pollutedareas of the Federal Republic of Germany. Int Arch OccupEnviron Health 55:217–239.
Ewers U, Freier I, Turfeld M, Brockhaus A, Hofsetter L, KonigW, et al. (1993) Heavymetals in garden soil and vegetablesfrom private gardens located in lead/zinc smelter area andexposure of gardeners to lead and cadmium (in German).Gesundheitswesen 55: 318–325.
Eyles VA (1958) A phosphatic band underlying bauxite depositsin Jamaica. Nature 182:1367–1368.

56 P.R.D. Wright et al.
Fan J, Aoshima K, Katoh T, Teranishi H, Kasuya M (1998) Afollow-up study on renal tubular dysfunction in women livingin the cadmium-polluted Jinzu River basin in Toyama, Japan.Nippon Eiseigaku Zasshi 53(3):545–557.
Flanagan PR, McLellan JS, Haist J, Cherian G, ChamberlainMJ, Valberg LS (1978) Increased dietary cadmium absorp-tion in mice and human subjects with iron deficiency.Gastroenterology 74:841–846.
Fox MR, Jacobs RM, Jones AO, Fry BE (1979) Effectsof nutritional factors on metabolism of dietary cadmiumat levels similar to those of man. Env Health Perspect28:107–114.
Friberg L (1983) Cadmium. Ann Rev Public Health 4:367–373.Friberg L (1984) Cadmium and the Kidney. Environ Health
Perspect 554:1–11.Friberg L (1950) Health hazards in the manufacture of alka-
line accumulators with special reference to chronic cadmiumpoisoning. Acta Med Scand 133(Supple 240):1–124.
Friberg L, Kjellstrom T, Nordberg GF (1986) Cadmium. InL Friberg GF Nordberg VB Vouk (eds) Handbook on theToxicology of Metals (2nd ed., pp. 130–184). Amsterdam:Elsevier.
Garrett RG, Porter AR, Hunt PA, Lalor GC (2008) The pres-cence of anomalous trace element levels in Jamaican soilsand the geochistry of late-miocene or pliocene phosphorites.Appl Geochem 23:822–834.
Green GW (1977) Structure and stratigraphy of the Wagwaterbelt. Overseas Geol Miner Resour 48:21.
Grippi J, Burke K (1980) Ubmarine canyon comples amongCretaceous island arc sediments, Western Jamaica. Geol SocAm Bull 91:179.
Hallberg L, Bjorn-Rasmussen E, Rossander L, Suwanik R(1977) Iron absorption from Southeast Asian diets. II. Roleof various factors that might explain low absorption. Am JClin Nutr 30:539–548.
Holmgren GG, Meyer MW, Chaney RL, Daniels RB (1993)Cadmium, lead, copper and nickel in agricultural soils of theUnited States of America. J Environ Qual 22:335–348.
Hong C (2000) Urinary protein excretion in Type 2 diabetes withcomplications. J Diabet Complic 14(5):259–265.
Hoo-Fung L, Lalor G, Rattray R (2005–2006) Effect of cookingand extraction with simulated gastric juice on the cadmiumcontent of selected foods. Jamaica J Sci Tech 16&17:26–29.
Horiguchi H, Oguma E, Sasaki S, Miyamoto K, Ikeda Y,Machida M, et al. (2004) Dietary exposure to cadmium atclose to the curent provisional tolerable weekly intake doesnot affect renal function among female japanese farmers.Environ Res 95:20–31.
Howe A, Hoofung L, Lalor GC, Rattray R, Vutchkov M (2005)Elemental composition of Jamaican foods 1: A survey offive food crop categories. Environ Geochem Health 27:19–30.
Ikeda M, Ezaki T, Moriguchi J, Fukui Y, Ukai H, Okamoto S,et al. (2005) The threshold cadmium level that causes a sub-stantial increase in B-2 Microglobulin in urine of generalpopulations. Tohoku J Exp Med 205:247–261.
Ikeda M, Ezaki T, Tsukahara T, Moriguchi J, Furuki K, FukuiY, et al. (2003) Threshold levels of urinary cadmium in rela-tion to increases in urinary B2-microglobulin among generalJapanese populations. Toxicol Lett 137:135–141.
Ikeda M, Shimbo S, Watanabe T, Yamagami T (2006)Correlation among cadmum levels in river sediment, inrice, in daily foods and in urine of residents in 11
prefectures in Japan. Int Arch Occup Environ Health 79:365–370.
Imamura T (2007) History of public health crises in Japan. JPublic Health Policy 2(8):221–237.
Jarup L, Berglund M, Elinder CG (1998) Health effects of cad-mium exposure – a review of the literature and risk estimate.Scand J Work Environ Health 24:1–52.
Jarup L, Berglund M, Elinder CG, Nordberg G, Vahter M (1998)Health effects of cadmium exposure– a review of the lit-erature and a risk estimate. Scand J Work Environ Health24:11–51.
JECFA (2000) Summary and conclusions of the fifty-fiftymeeting, Geneva, 6–15 June 2000. Geneva: World HealthOrganisation, Joint FAO/WHO Expert Comittee on FoodAdditives.
JRA (1982) Comprehensive Resource Inventory and EvaluationSystem (CRIES) Project. Jamaica Resource Assessment.Jamaica: Ministry of Agriculture.
Kido T, Honda R, Tsuritani I, Yamaya H, Ishizaki M, YamadaY, et al. (1988) Progress of renal dysfunction in inhabi-tants environmentally exposed to cadmium. Arch Env Health43:213–217.
Kjellstrom T, Ervin PE, Rahnster B (1977) Dose-response rela-tionship of cadmium induced tubular proteinuria. EnvironRes 13:303–317.
Lalor GC (1995) A Geochemical Atlas of Jamaica. Jamaica:Canoe Press, Universty of the West Indies.
Lalor GC, Davies BE, Vutchkov M (2001) Cadmium inJamaican soils. Environmental Cadmium in the FoodChain: Sources, pathways and risks. Proceedings of theSCOPE Workshop, Belgian Academy of Sciences, Brussels,Belgium, 13–16 September 2000. Scientific Commitee onProblems of the Environment (SCOPE) of the internationalCouncil for Science (ICSU).
Lalor GC, Miller JM, Robotham H, Simpson PR (1989) Gammaradiometric survey of Jamaica. Tran Inst Min Metall 98:34–37.
Lalor GC, Rattray R, Simpson P, Vutchkov M (1998) Heavymetals in Jamaica part 3: The distribution of cadmium inJamaican soils. Rev Int Cont Ambient, 14, 7–12.
Lalor GC, Rattray R, Williams N, Wright P (2004) Cadmiumlevels in kidney and liver of Jamaicans at autopsy. West IndMed J 53(2):76–80.
Lalor G, Rattray R, Simpson P, Vutchkov MK (1999)Geochemistry of an arsenic anomaly in St. ElizabethJamaica. Environ Geochem Health 21:3–11.
Lalor G, Rattray R, Vutchkov M, Campbell B, Lewis-Bell K(2001) Blood lead levels in Jamaican school children. Sci TotEnviron 269:171–181.
Lauwerys RR, Bernard A, Roels HA, al e (1984)Characterisation of cadmium proteinuria in man andrat. Environ Health Perspect 54:147–152.
Lauwerys R, Bernard A, Roels H, Buchet JP (1994) Cadmium:Exposure markers as predictors of nephrotoxic effects. ClinChem 40(7):1391–1394.
Lewis GP, Coughlin LL, Jusko WJ, Hartz S (1972) Contributionof cigarette smoking to cadmium accumulation in man.Lancet 1(7745):291–292.
McKenzie-Parnell JM, Eynon G (1987) Effect on new Zealandadults consuming large amounts of cadmium in oysters. InDD Hemphill (ed) Trace Substances in Environmental Health– XXI (pp. 420–430). Columbia, MO: University of MissouriPress.

A Regional Perspective of Medical Geology – Cadmium in Jamaica 57
Meschede M, Frisch W (1998) A plate-tectonic model for theMesozoic and early Cenzoic history of the Caribbean plate.Tectonophysics 296:269–291.
Morrow H (2001) Cadmium and cadmium alloys. In Kirk-Othmer encyclopaedia of chemical technology (pp. 471–507). John Wiley and Sons.
Nishijo M, Satarug S, Honda R, Tsuritani I, Aoshima K (2004)The gender differences in health effects of environmen-tal cadmium exposure and potential mechanisms. Mol CellBiochem 255(1–2):87–92.
Nogawa K (1981) Itai-itai disease and follow-up studies. In JONriagu (ed) Cadmium in the Environment (Vol. 2, pp. 1–37).New York: Wiley.
Nogawa K, Kido T (1993) Biological monitoring of cadmiumexposure in itai-itai disease epidemiology. Int Arch Occupenviron health 65:S43–S46.
Nogawa K, Kido T (1996) Itai-itai disease and health effects ofcadmium. In LW Chang (ed) Toxicology of Metals (pp. 353–369). New York: CRC.
Nordberg GF, Jin T, Bernard A, al, e (1997) Biological monitor-ing of cadmium exposure and renal effects. Sci Total Environ199:111–114.
Nordberg G, Jin T, Bernard A (2002) Low bone density and renaldysfunction following environmental cadmium exposure inChina. Ambio 31(6):478–481.
Nordberg G, Jin T, Leffler P, Svensson M, Zhou T,Nordberg M (2000) Metallothioneins and diseaseswith special reference to cadmium poisoning. Analusis28(5):396–400.
Nordberg M (1984) General aspects of cadmium:Transport,uptake and metabolism by the kidney. Environ HealthPerspect 5:13–20.
NTP (2005) Report on carcinogens. 11th ed. Research TrianglePark, NC: U.S. Department of Health and Human Services,Public Health Service, National Toxicology Program.
Olsson I, Bensryd I, Lundh T, Ottosson H, Skerfving S,Oskarsson A (2002) Cadmium in blood and urine – impactof sex, age, dietary intake, iron status and former smok-ing – association of renal effects. Environ Health Perspect110(12):1185–1190.
Pedersen B, Eggum BO (1983) The influence of milling on thenutritive value of flour from cereal grains: 4. Rice. PlantFoods Hum Nutr 33:267–278.
Pindell JL, Barrett SF (1990) Geological evolution of theCaribbean region: A plate tectonic perspective. In G Dengo,JE Case (eds) The Caribbean Region, Geology of NorthAmerica (Vol. H, pp. 405–432).Washington, DC:GeologicalSociety of America.
Piscator M (1991) Early detection of tubular dysfunction.Kidney Int 40(Suppl 34):15–17.
Reeves PG, Vanderpool RA (1998) Organ content and fecalexcretion of cadmium in male and female rats consumingvariable amounts of naturally occurring cadmium in con-fectionery sunflower kernels (Helianthus annuus L.). J NutrBiochem 9:636–644.
Ross MI, Scotese CR (1988) A hierarchal tectonic model of theGulf of Mexico and Caribbean region. In CR Scotese, WWSager (eds) Tectonophysics 155:139–168.
Sarasua SM, McGeehin MA, Stallings FL, Terracciano G, AmlerRW, Logue JN, et al. (1995). Technical assistance to thePennsylvania department of health. Biologic indicators ofexposure to cadmium and lead. Final Report. Palmerton, PA.
Satarug S, Moore MR (2004) Adverse health effects of chronicexposure to low-level cadmium in foodstuffs and cigarettesmoke. Environ Health Persp 112(10):1099–1103.
Satarug S, Baker JR, Reilly PE, Moore MR, Williams DJ (2002)Cadmium levels in the lung, liver, kidney cortex and urinesamples from Australians without occupational exposure tometals. Arch Environ Health 57:69–77.
Seidal K, Jorgensen N, Elinder C (1993) Fatal cadmiuminduced pneumonitis. Scand J Work Environ Health 19:429–431.
Shigematsu I (1984) The epidemiological approach to cadmiumpollution in Japan. Ann Acad Med, 13:231–236.
Simmons RW, Pongsakul P, Chaney RL, Saiyasitpanich D,Klinphoklap S, Nobuntou W (2003) The relative exclusionof zinc and iron from rice grain in relation to rice graincadmium as compared to soybean: Implications for humanhealth. Plant Soil 257:163–170.
Simpson PR, Hurdley J, Lalor GC, Plant JA, Robotham H,Thompson C (1991) Orientation studies in Jamaica for multi-purpose geochemical mapping of the Caribbean region.Transactions of the Institution of Mining and Metallurgy100:B98–B110.
Strehlow CD, Barlthrop D (1988) The Shipham report – Aninvestigation into cadmium concentrations and its implica-tions for human health: 6. Health Studies. Sci Tot Environ75:101–133.
Tsukahara T, Ezaki T, Moriguchi J, Furuki K, Fukui Y, UkaiH, et al. (2003b). No significant effect of iron deficiency oncadmium body burden or kidney dysfunction among womenin the general population in Japan. Int Arch Occup EnvironHealth 76:275–281.
Tsukahara T, Ezaki T, Moriguchi J, Furuki K, Shimbo S,Matsuda-Inoguchi N, et al. (2003a) Rice as the mostinfluential source of cadmium intake among generalJapanese population. Sci Tot Environ 305:41–51.
Vahter M, Berglund M, Akesson A, Liden C (2002) Metals andwomens health. Environ Res 88(3):145–155.
Vahter M, Berglund M, Nermell B, Akesson A (1996)Bioavailability of cadmium from shellfish and mixed diet inwomen. Toxicol Appl Pharmacol 136(2):332–341.
Vincenz SA (1959) Some observations of radiation emittedfrom a mineral spring in Jamaica. Geophys Prospect 7(4):422–434.
Wadge G, Jackson TA, Isaacs MC, Smith TE (1982) Ophioliticbath dunrobin formation, Jamaica: Significance for the creta-ceous plate margin evolution in the north-western Caribbean.J Geol Soc London 139:321.
Waldron HA (ed) (1980) Metals in the Environment. London:Academic Press Inc.
Watanabe K, Kobayashi E, Suwazono Y, Okubo Y, Kido T,Nogawa K (2004) Tolearable life-time cadmium intake cal-culated from the inhabitants living in the Jinzu River Basin.Jpn Bull Environ Contamin Toxicol 72:1091–1097.
Watanabe T, Zhang ZW, Moon CS, Shimbo S, Nakatsuka H,Matsuda-Inoguchi N, et al. (2000) Cadmium exposure ofwomen in general populations in Japan during 1991–1997compared with 1977–1981. Int Arch Occup Environ Health73:26–34.
Wright RM, Robinson E (1993) Biostratigraphy of Jamaica.Washington, DC: Geological Society of America, Memoir.
Zans VA (1952) Bauxite resources of Jamaica and their develop-ment. Colon Geol Mine Resour 3:307–333.

Medical Geology in Mexico, Central Americaand the Caribbean
M. Aurora Armienta, Ramiro Rodríguez, Nuria Segovia, and Michele Monteil
Abstract An overview of the occurrence, concentra-tions, and possible sources of toxic elements releasedby geogenic processes that may threat the health ofmillions of people of Mexico, Central America, andthe Caribbean is presented. The geology and tectoniccharacteristics of Mexico and Central America consti-tute an appropriate environment for the presence ofarsenic and fluoride in groundwater of many zonesof the area. Health problems linked with As-taintedwater consumption have been documented in Mexicoand Nicaragua where epidemiological and toxicolog-ical studies have been developed. Fluorosis has beenrecognized mainly in the central and northern partof Mexico and also in Antigua, Puerto Rico, andTrinidad. Specific health effects resulting from expo-sure to natural dust transported from Africa have beenidentified in the Caribbean. Radon exposure may alsoaffect the population living in volcanic and active tec-tonic environments. However, this problem has onlybeen studied by some researchers, mainly in Mexicoand Nicaragua. Collaboration among research groupsand authorities has been scarce. The review presentedhere, although not exhaustive, shows the urgency forincreasing that collaboration specially to identify pol-luted areas, sources, and health effects, of the routinecollection and analysis of arsenic and fluoride in allpotable water sources of the area, and of developingshort-term measures to decrease their concentrationsto safe levels.
M.A. Armienta (�)Universidad Nacional Autónoma de Mexico, Instituto deGeofísica, Mexico, DF 04510, Mexicoe-mail: [email protected]
Keywords Mexico · Central America · Nicaragua ·El Salvador · Cuba · Caribbean · Arsenic · Fluorine ·Radon
Introduction
The geological framework of Mexico and CentralAmerica is defined by its volcanic origin and active tec-tonic setting. The Trans-Mexican Volcanic Belt, TVB,crosses Mexico, 900 km from west to east. The CentralAmerican Volcanic Arc confers a similar environmentto the rest of the Central American countries.
Mexico is almost 2,000,000 km2 in extent. TheGlobal Volcanism Program (GVP, 2009) lists about30 Holocene volcanoes and 4 Pleistocene volcanoeswith geothermal activity, many of which are locatedalong the TVB. The southern part of its Pacific Coastis one of the most seismically active areas in the worlddue to the subduction of the Cocos and Rivera Platesunder the North American Plate (Fig. 1). The recur-rence period for large earthquakes (up to Ms 8.2) inthis area has been estimated to be in the range from 30to 70 years (Singh and Mortera, 1991).
The Mexican Highlands are surrounded by twolarge mountain ranges. The Sierra Madre Occidentalin Northwestern Mexico hosts some of the largest flu-orite deposits in the world (Ruiz et al., 1985). El Bajio,in Central Mexico, is characterized by felsic volcanicrocks with Sn, Au, Ag, and F mineralization (Méridaet al., 1998).
The countries located in Central America, Belize,Costa Rica, El Salvador, Guatemala, Honduras,Nicaragua, Panamá, about 520,000 km2 in extenthave a common volcanic axis, the Central American
59O. Selinus et al. (eds.), Medical Geology, International Year of Planet Earth,DOI 10.1007/978-90-481-3430-4_3, © Springer Science+Business Media B.V. 2010

60 M.A. Armienta et al.
Fig. 1 Tectonic setting and political division of Mexico
Fig. 2 Tectonic setting andcountries of Central America
Volcanic Arc. The subduction of the Cocos and NazcaPlates under the North American and Caribbean Plates(Fig. 2) generates large earthquakes in the zone thataffect recurrently the populated areas of large cities.
The regionally prevalent rocks may contain As-bearing minerals. Arsenic minerals are also foundin intrusive bodies in calcareous rocks in miningareas. Arsenic can be incorporated in groundwater
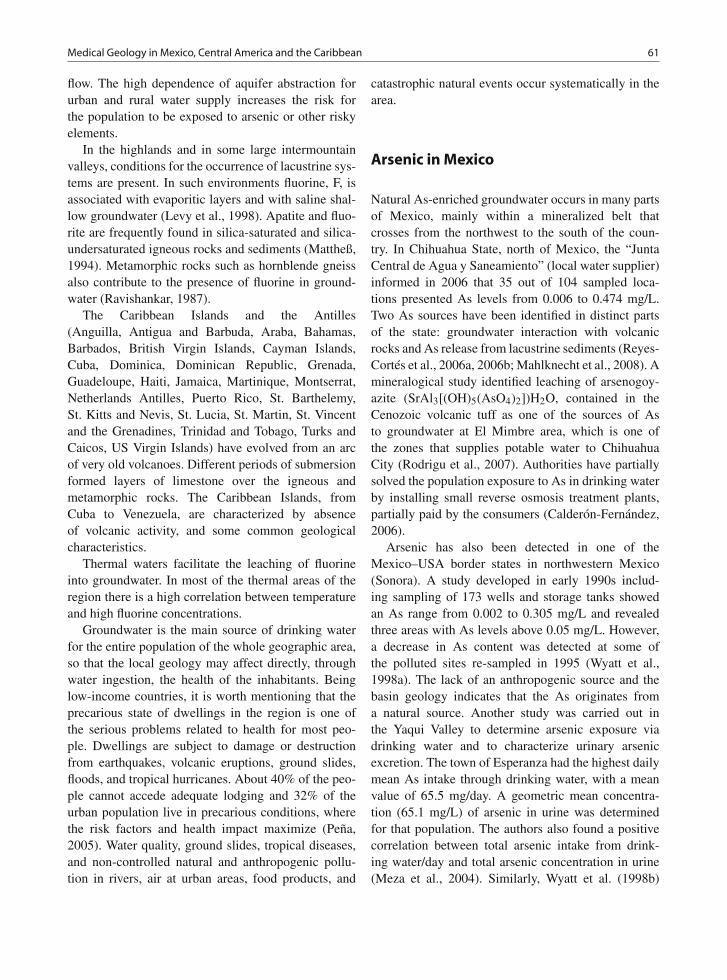
Medical Geology in Mexico, Central America and the Caribbean 61
flow. The high dependence of aquifer abstraction forurban and rural water supply increases the risk forthe population to be exposed to arsenic or other riskyelements.
In the highlands and in some large intermountainvalleys, conditions for the occurrence of lacustrine sys-tems are present. In such environments fluorine, F, isassociated with evaporitic layers and with saline shal-low groundwater (Levy et al., 1998). Apatite and fluo-rite are frequently found in silica-saturated and silica-undersaturated igneous rocks and sediments (Mattheß,1994). Metamorphic rocks such as hornblende gneissalso contribute to the presence of fluorine in ground-water (Ravishankar, 1987).
The Caribbean Islands and the Antilles(Anguilla, Antigua and Barbuda, Araba, Bahamas,Barbados, British Virgin Islands, Cayman Islands,Cuba, Dominica, Dominican Republic, Grenada,Guadeloupe, Haiti, Jamaica, Martinique, Montserrat,Netherlands Antilles, Puerto Rico, St. Barthelemy,St. Kitts and Nevis, St. Lucia, St. Martin, St. Vincentand the Grenadines, Trinidad and Tobago, Turks andCaicos, US Virgin Islands) have evolved from an arcof very old volcanoes. Different periods of submersionformed layers of limestone over the igneous andmetamorphic rocks. The Caribbean Islands, fromCuba to Venezuela, are characterized by absenceof volcanic activity, and some common geologicalcharacteristics.
Thermal waters facilitate the leaching of fluorineinto groundwater. In most of the thermal areas of theregion there is a high correlation between temperatureand high fluorine concentrations.
Groundwater is the main source of drinking waterfor the entire population of the whole geographic area,so that the local geology may affect directly, throughwater ingestion, the health of the inhabitants. Beinglow-income countries, it is worth mentioning that theprecarious state of dwellings in the region is one ofthe serious problems related to health for most peo-ple. Dwellings are subject to damage or destructionfrom earthquakes, volcanic eruptions, ground slides,floods, and tropical hurricanes. About 40% of the peo-ple cannot accede adequate lodging and 32% of theurban population live in precarious conditions, wherethe risk factors and health impact maximize (Peña,2005). Water quality, ground slides, tropical diseases,and non-controlled natural and anthropogenic pollu-tion in rivers, air at urban areas, food products, and
catastrophic natural events occur systematically in thearea.
Arsenic in Mexico
Natural As-enriched groundwater occurs in many partsof Mexico, mainly within a mineralized belt thatcrosses from the northwest to the south of the coun-try. In Chihuahua State, north of Mexico, the “JuntaCentral de Agua y Saneamiento” (local water supplier)informed in 2006 that 35 out of 104 sampled loca-tions presented As levels from 0.006 to 0.474 mg/L.Two As sources have been identified in distinct partsof the state: groundwater interaction with volcanicrocks and As release from lacustrine sediments (Reyes-Cortés et al., 2006a, 2006b; Mahlknecht et al., 2008). Amineralogical study identified leaching of arsenogoy-azite (SrAl3[(OH)5(AsO4)2])H2O, contained in theCenozoic volcanic tuff as one of the sources of Asto groundwater at El Mimbre area, which is one ofthe zones that supplies potable water to ChihuahuaCity (Rodrigu et al., 2007). Authorities have partiallysolved the population exposure to As in drinking waterby installing small reverse osmosis treatment plants,partially paid by the consumers (Calderón-Fernández,2006).
Arsenic has also been detected in one of theMexico–USA border states in northwestern Mexico(Sonora). A study developed in early 1990s includ-ing sampling of 173 wells and storage tanks showedan As range from 0.002 to 0.305 mg/L and revealedthree areas with As levels above 0.05 mg/L. However,a decrease in As content was detected at some ofthe polluted sites re-sampled in 1995 (Wyatt et al.,1998a). The lack of an anthropogenic source and thebasin geology indicates that the As originates froma natural source. Another study was carried out inthe Yaqui Valley to determine arsenic exposure viadrinking water and to characterize urinary arsenicexcretion. The town of Esperanza had the highest dailymean As intake through drinking water, with a meanvalue of 65.5 mg/day. A geometric mean concentra-tion (65.1 mg/L) of arsenic in urine was determinedfor that population. The authors also found a positivecorrelation between total arsenic intake from drink-ing water/day and total arsenic concentration in urine(Meza et al., 2004). Similarly, Wyatt et al. (1998b)

62 M.A. Armienta et al.
determined that urine As was also correlated withwater contents at Hermosillo City.
La Comarca Lagunera (Durango and Coahuilastates of northern Mexico) was the first place wherehealth problems related to As intake were detectedin Mexico in 1958 (Cebrián et al., 1994). Perifericalvascular diseases including black foot disease, keratho-sis, skin pigmentation, and gastrointestinal sicknesswere observed in people drinking As-polluted water.A population of approximately 400,000 persons wasconsidered to be exposed. Concentrations from 0.008to 0.624 mg/L were measured in groundwater from128 wells sampled in 1990 (Del Razo et al., 1990).The highest concentrations have been measured inthe towns of Francisco I. Madero (up to 0.740 mg/Lin 1992), Tlahualilo (up to 0.590 mg/L in 1992 and0.718 mg/L in 2000), and San Pedro (0.490 mg/L in1992 and 0.26 mg/L in 2000) (Rosas et al., 1999;Molina, 2004). Various sources have been hypothe-sized as origin of the arsenic: extinct hydrothermalactivity, evaporation processes, oxidation of sulfides,desorption, and dissolution of Fe and Mn oxides(González-Hita et al., 1991; Ortega-Guerrero, 2003;Molina, 2004; Gutiérrez-Ojeda, 2009). Investigationson As-related health problems in this area have shownrelationships between As speciation in urine and signsof dermatological affectations (Del Razo et al., 1997).In addition, a significant increase in the frequency ofchromatide deletions, isochromatides in lymphocytes,and in micronuclei of urinary and oral epithelial cellswere observed in people exposed to As (Gonsebattet al., 1997). Higher risk of having diabetes was deter-mined in people with higher concentrations of total Asin urine, in a case–control study developed in 2003 inthis area (Coronado-González et al., 2007).
In Aguascalientes City, Central Mexico, an aver-age of 0.0145 ± 0.0077 mg/L of As was determinedin one-third of the potable water sources. Minimum(1.6 × 10⁻⁴) and maximum (1.81 × 10⁻³) exposuredoses were calculated based on As concentrations inwater. Estimation of cancer risk yielded 9.5 cases per100,000 inhabitants for the lower water As contentand 1.63 cases per 1,000 inhabitants for the highestAs content, suggesting a health risk for the population(Trejo-Vázquez and Bonilla-Petriciolet, 2002).
In Guanajuato State, within the Mexican Highlands,many studies trying to explain the occurrence and
Table 1 Arsenic contents in localities in Guanajuato State
Locality As concentration (mg/L) Reference
Acámbaro 0.05–0.08 (in 3 wells) SSP (2009)San Miguel
Allende0.03 (1 well) ESF (2006)
Silao-Romita 0.031–0.059(agricultural wells)
Horst (2006)
El Copal 0.30 Rodríguez et al.(2006)
Salamanca 0.02–0.18 Mejía et al. (2007)
health affectations of arsenic have been carried out.In the Independence aquifer, As (up to 0.12 mg/L)contents were found in groundwater (CODEREG,2000). Cuerámaro, near Cuitzeo Lake, presented As inthe main supply well. A thermal well located in CerritoAgua Caliente (east of Cuerámaro) had an As contentof 0.22 mg/L. High temperatures and As concentra-tions are associated in Abasolo with concentrationsranging between 0.10 and 0.17 mg/L (Martínez andGarcía, 2007). Other localities and concentrations ofAs in groundwater of Guanajuato State are shown inTable 1.
Salamanca is the only region where an anthro-pogenic origin was identified for arsenic inGuanajuato. Leachates from fallout of power plantparticulates rich in As result in variations of ground-water As content (0.02–0.18 mg/L). However, Ascoming from rocks has also been recognized (Mejíaet al., 2007).
Many arsenic minerals occur in the Mexican terri-tory such as arsenopyrite, mimetite, adamite, scorodite,and tennantite. At the La Ojuela mine in DurangoState, about 29 distinct As minerals have been rec-ognized such as conichalcite, adamite, and legrandite.In addition, arsenic may occur associated with silver,lead, zinc, and iron sulfides. Mining zones may bepolluted by arsenic from natural sources but also bycenturies of ore extraction and processing activities.Studies regarding concentrations and geochemical pro-cesses releasing As to groundwater have been devel-oped only in a few of the mineralized areas. One ofthe most studied areas has been Zimapán, in HidalgoState, Central Mexico. Mineralization comprises thecomplete spectrum of high-temperature Mexican min-erals in carbonates. More than eight As minerals havebeen reported in the area, arsenopyrite being the most

Medical Geology in Mexico, Central America and the Caribbean 63
widespread. In 1993 up to 1.1 mg/L of arsenic wasmeasured in one of the deep wells used as drink-ing water supply (Simons and Mapes-Vazquez, 1956;Megaw et al., 1988; Armienta et al., 1997a). Theaquifer system is composed of deep fractured lime-stone and granular perched aquifers derived fromthe calcareous rocks. Mining wastes polluted shallowwells within the granular aquifer. The deep aquiferpresents the highest arsenic contents released by anatural source. Arsenic enrichment is produced by dis-solution of arsenic-bearing minerals, mainly arsenopy-rite and scorodite in the mineralized zones within thelimestones (Armienta and Rodríguez, 1996; Armientaet al., 2001). Arsenic is carried through fractures andfaults in a complex regional flow system influenced byseasonal processes (Rodríguez et al., 2004). However,until about 5 years ago, the limestone aquifer providedmost of the potable water. Currently, good qualitywater is pumped from a non-polluted well out of thevalley and mixed with tainted deep water. This mix-ing results on varying As concentrations along time(0.10 mg/L in November 2008).
Toxicity and effects of groundwater As intake on theinhabitants’ health have also been investigated in thisarea. Experimental studies showed a concentration–response relationship between SCE (sister chromatidexchanges) in root tip meristems of the broad beanVicia faba and As contents of Zimapán wells (Gómez-Arroyo et al., 1997). Hyperkeratosis, hypopigmen-tation, and hyperpigmentation were associated withAs concentrations in hair and drinking water in asample of 120 Zimapán inhabitants (Armienta et al.,1997b). Reséndiz and Zúñiga (2003) carried out asimilar study including another 71 individuals; an aver-age of 9.74 mg/kg As was determined in the hairof that group. More than half (56.1%) of the stud-ied population showed dermal damage. The highest Ascontent in hair (average of 29.25 mg/kg) was measuredin people ranging from 50.1 to 60 years old. One-factor ANOVA test showed correlation between dermalhealth effects and As concentrations in hair. Valenzuelaet al. (2007) observed at least one sign of arsenicismin about half of a high As (0.104 mg/L on average)exposed group of 72 women. Besides, association ofarsenic presence with the increment of transforminggrowth factor alpha (TGF-α) levels in bladder urothe-lial cells was also shown. TGF-α levels in urothelial
cells were significantly linked with As in urine in thoseindividuals presenting skin lesions.
At the historical mining zone of Villa de la Paz,San Luis Potosí State, high As concentrations weremeasured in water, soil, sediments, and maize leaves,as well as elevated levels of Pb in soils and sedi-ments (Castro-Larragoitia et al., 1997; Razo et al.,2004). Increased DNA damage was observed in chil-dren exposed to As and Pb in this area (Yáñezet al., 2003). Gamiño and Monroy (2009) also deter-mined high soil As and Pb bioaccesibility and demon-strated that children showed concentrations higher thanthe maximum national and international criteria forchildren health risk prevention, resulting from expo-sure to naturally enriched soils and mining wastes.Similar results would be expected as well at othermining sites of the country processing skarn oredeposits.
Arsenic is also present in aquifers of geothermalareas like Los Humeros and Acoculco located east ofthe TVB. Concentrations as high as 100 mg/L occurat a depth from 600 to 3,000 m below sea level ingeothermal reservoirs along the TVB. Physical andchemical reactions at elevated temperatures increaseAs contents derived from dissolution of volcanic hostrock in geothermal fluids (Armienta and Segovia 2008;Birkle and Bundschuh, 2009). High As concentrations(up to 0.2629 mg/L) were measured also in wells usedas potable water sources at Los Altos de Jalisco region,west of the TVB. In 2005, 34% of 129 sampled wellscontained As above the national drinking water stan-dard of 0.025 mg/L. Estimated exposure doses were1.1–7.6 μg/kg/day for babies, 0.7–5.1 μg/kg/day forchildren, and 14.7–101.9 μg/kg/day for adults. Twogroups of water samples were identified in this zone;in one of them As was correlated with temperature(Hurtado-Jiménez and Gardea-Torresdey, 2009).
Concentrations above the Mexican drinking waterstandard have also been determined in wells ofZacatecas and San Luis Potosí, Central Mexico. Thetown of San Ramón was considered to represent thegreatest health problem in Zacatecas based on waterAs levels (about 0.500 mg/L), groundwater abstractedvolumes, and exposed population (Leal-Ascencio andGelover-Santiago, 2006). In the Rio Verde locality,in San Luis Potosí State, the presence of As ingroundwater (up to 0.05 mg/L) was associated with

64 M.A. Armienta et al.
its release from lacustrine sediments (Planer-Friedrichet al., 2001).
Fluorine in Mexico
Fluoride is one of the main contaminants in ground-water in Mexico. Its presence has been reported inmany areas, often in the same areas with high Aslevels. It is estimated that a population of 4 mil-lion people live in areas naturally enriched in fluorine(Estupiñán-Day et al., 2005). To evaluate the informa-tion about fluoride use (mainly from fluoridated salt)and fluorosis in Mexico and to provide recommenda-tions to cope with fluoride excess in some areas of thecountry, a meeting took place in 2004 with the par-ticipation of the National Commission of Water andthe Secretary of Health (Comisión Nacional del Agua,Secretaría de Salud) of Mexico, the Pan AmericanHealth Organization, and the Center for DiseaseControl and Prevention of the USA. The final reportpoints out that the states of Aguascalientes, Sonora,Zacatecas, San Luis Potosí, Baja California, andDurango have groundwater concentrations equal orhigher than 0.7 mg/L, 24% overall prevalence of den-tal fluorosis, and represent 67% of the national cases.Distribution of fluoridated salt was prohibited by lawin those states. However, fluoride groundwater con-tents above 0.7 mg/L occur at other locations such asComarca Lagunera and Monclova, in Coahuila State,several localities in Chuihuahua, and Acapetahua inChiapas State. About 1,750,000 children and teenagersliving in Aguascalientes, Chihuahua, Durango, andJalisco states were expected to be at risk of developingdental fluorosis (Estupiñán-Day et al., 2005). Althoughmeasures have been taken to reduce the exposure levelconsisting mainly of dilution with good quality water,exposure to fluoride concentrations above the drinkingwater standard is still a health problem in some areasof the country. A critical review of the publicationsconcerning dental fluorosis in Mexico was written bySoto-Rojas et al. (2004). Specific studies regardingnatural fluoride occurrence in water and fluorosis arepresented next.
At Comarca Lagunera, concentrations from lessthan 0.5 to 3.7 mg/L fluoride in groundwater werereported in 1993. Higher fluoride contents were deter-mined in wells located in As-polluted areas (Del Razo
et al., 1993). At Hermosillo City, arsenic concentra-tions also correlated with those of fluoride (Wyatt et al.,1998b). In Durango State, fluoride concentrationsabove drinking water standards (1.5–5.67 mg/L) weremeasured in groundwater of Durango City (Alarcón-Herrera et al., 2001a; Ortiz et al., 1998). About 95%of the population was estimated to be exposed tofluoride levels higher than 2.0 mg/L (Ortiz et al.,1998) and showed dental fluorosis and increased bonefractures (Alarcón-Herrera et al., 2001a). A positiverelationship between water fluoride intake and dentalfluorosis in children was also determined (Alarcón-Herrera et al., 2001a). In addition, about half ofthe 74 sampled wells used as potable water sourcesfor Durango City exceeded 0.05 mg/L As (Alarcón-Herrera et al., 2001b). Concentrations of fluoride atLos Altos de Jalisco, an area also with high As ground-water contents, ranged from 0.1 to 17.7 mg/L. Abouthalf of the 105 wells sampled in 2002 contained fluo-ride concentrations above the Mexican drinking waterstandard (1.5 mg/L). The potential risk of dental,skeletal fluorosis, and bone fracture for the inhab-itants was estimated based on calculation of expo-sure doses (Hurtado-Jiménez and Gardea-Torresdey,2005).
San Luis Potosí is one of the most studied zonesregarding fluoride occurrence and health impact. Thedeep fractured volcanic aquifer is the main sourceof fluoride in the groundwater (Carrillo-Rivera et al.,1996). However, increased pumping contaminated alsoshallower waters. Mineralogical and geochemical evi-dence indicate that water interaction with rhyoliticrocks has contaminated the aquifer. The higher thewater temperature, the higher the fluoride content(Cardona et al., 1993, Carrillo-Rivera et al., 2002).High fluoride concentrations in drinking water pro-duced dental fluorosis in children of San Luis Potosíand also in Aguascalientes State. Concentrations offluoride in urine and severity of dental fluorosiscorrelated with drinking water contents of fluorine(Grimaldo et al., 1995; Loyola-Rodríguez et al., 2000;Hernández-Montoya et al., 2003). Neurotoxicologicaleffects due to tap water fluoride intake were alsofound in children living in San Luis Potosí. Threetests were used to evaluate the neuropsychologi-cal development: (1) Wechsler Intelligence Scale forChildren Revisited version for Mexico (WISC-RM),(2) Rey Osterrelth-Complex Figure test, and (3)Continuous Performance Test (CPT). Urinary fluoride

Medical Geology in Mexico, Central America and the Caribbean 65
(1.6–10.8 mg/g creatinine) correlated positively withreaction time and inversely with the scores in visu-ospatial organization (Calderón et al., 2000). Anotherstudy carried out in children from San Luis Potosíand Durango states showed that arsenic and fluorideintake result in increased risk of reduced IQ scores(Rocha-Amador et al., 2007).
Within the Mexican Highlands, high water fluo-ride contents and associated health effects have beendocumented for some cities. Rodríguez et al. (1997)determined F concentrations of up to 4 mg/L in urbanwells supplying Aguascalientes City, whose originwas associated with local igneous rocks. In Irapuatoand Salamanca, within Guanajuato State, groundwa-ter concentrations ranged from 1 to 3 mg/L fluoride(Rodríguez et al., 2000, 2006). Cases of dental fluo-rosis were observed in this area (Ovalle, 1996) andalso in students at Leon City (Garcia and Ovalle,1994). Wells with 4.0 mg/L F were identified inSan Miguel de Allende, Guanajuato. However, healthaffectations have not been reported in this city (ESF,2006). Up to 16 mg/L of fluoride in groundwater wereattributed to weathering of acid volcanic rocks in theIndependence aquifer in Queretaro State (Mahlknechtet al., 2004). Dental fluorosis linked with water con-sumption was recognized in Tequisquiapan, in thesame state (Sanchez-Garcia et al., 2004).
Although official reports of groundwater fluoridecontents are not available in many regions, occurrenceof health effects indicates its presence in some areas.In El Bajio Guanajuatense, Central Mexico, e.g., thepresence of fluorine is deduced from cases of dentalfluorosis in the population. Fragoso et al. (1997) men-tioned that inhabitants of San Francisco del Rinconalso suffer from that illness. Abasolo and JuventinoRosas cities and Valtierrilla, a small settlement nearSalamanca City, are supplied with thermal water thatprobably contains fluoride since dwellers show evi-dence of dental fluorosis. Occasionally, the local watersupply organizations recognize the presence of F andAs in groundwater. JUMAPA (local water supplier)in Celaya City reported concentrations of those ele-ments over the national drinking water standard (1.5and 0.025 mg/L, respectively) in some urban wells (A.M., 2008).
Irigoyen and col. (1995) informed the presence of Fin concentrations of up to 2.8 mg/L in supplied wateraffecting teeth of children in Xochimilco, Basin ofMexico.
Fluoride has also been detected in sedimentary rockenvironments, such as Campeche in southern Mexico,where children groups showed injured teeth (Vallejo-Sanchez et al., 1998).
Arsenic in Central America
Arsenic occurrence and health problems related tothe ingestion of polluted water have been discussedby researchers and authorities in various CentralAmerican countries. This information is mainly avail-able from Nicaragua and El Salvador.
Nicaragua
Hydroarsenicism cases have been observed in somelocations in Nicaragua. In 1996, arsenic-related healthproblems were reported in a community of El Zapotetown in Sébaco Valley caused by people drinking waterfrom a well with an arsenic concentration of 1.32 mg/Lduring a 6-month period (Altamirano, 2005). TheINAA (Instituto Nicaragüense de Acueductos yAlcantarillados) detected 11 wells containing As abovethe drinking water standard of Nicaragua (10 μg/L),with a maximum concentration of 0.289 mg/L As inthat valley. The areas of El Zapote-San Isidro, SantaRosa del Peñón, La Cruz de la India, Susucayán-Ciudad Sandino, and Mina de Agua-Rincón de Garcíanear to thermal zones parallel the Nicaragua depres-sion and some locations in Boaco, Chontales, Estelí,Jinotega, Terrabona, and Matagalpa have been found tocontain As above 0.010 mg/L in groundwater (Estrada,2003; Armienta et al., 2008). Some correlation wasfound between sites with high As contents and the faultsystem. Respiratory and skin problems were detectedin dwellers consuming water with the highest As con-centrations (from 0.080 to 0.380 mg/L) (González,1998; Armienta et al., 2008).
A national study on water quality developed in 2004identified the northern zone of the country as havingthe greatest As contents (Barragne, 2004). UNICEFin 2005 developed a sampling program in Llano dela Tejera and results showed 87% of wells withAs concentrations over the drinking water standards(Altamirano-Espinoza and Bundschuh, 2009).
A hydrogeochemical study carried out during 2002–2003 in the southwestern part of Sébaco Valley

66 M.A. Armienta et al.
revealed groundwater As contents above 0.010 mg/Lin 21 out of 57 samples. Consolidated volcanic rocks,hydrothermally altered Tertiary volcanic rocks, andalluvial sediments were identified as the As source.Arsenic is mobilized from the solid matrix by weath-ering and changing redox conditions (Altamirano-Espinoza and Bundschuh, 2009).
At San Juan de Limay, Estelí Department, thepresence of geogenic arsenic (up to 0.115 mg/L)was revealed by a 2005 study in that rural area.Concentrations showed significant variability andAs(V) was the dominant species. A volcanic ashlayer appeared to be the main groundwater As source(Morales et al., 2009).
El Salvador
El Salvador is located on the western part of theCaribbean Plate. Subduction, oblique to the plateboundary of the Cocos Plate, beneath the NorthAmerican and Caribbean Plates produced a prominentmagmatic arc, the modern Central American arc, inthe western active margin. This tectonic setting hasresulted also in the existence of many active volcanoesand geothermal zones (Agostini et al., 2006). Arsenicoccurrence was revealed by studies in some of theseareas.
Although it is known that several institutions haveanalyzed arsenic in waters at El Salvador, only partof the information is available to the public. Studiescarried out in volcanic lakes showed As presence.Coatepeque Lake had concentrations from 0.09 up to3.09 mg/L, Ilopango Lake from 0.15 to 0.78 mg/L, andone sample from Olomega Lake had an As content of4.21 mg/L. Those lakes are the largest water reservoirsof the country. Furthermore, in spite of high As andboron levels, people living near their shores employthe water for domestic use and irrigation (López et al.,2009; Armienta et al., 2008). Fluxes of gases seemto occur south of the Ilopango Caldera, where higherconcentrations of As and boron were also measured(López et al., 2009).
Other sites with As presence in Nicaragua arethe Ahuachapán and Berlín geothermal fields withconcentrations from 0.01 to 0.21 mg/L and 0.002to 0.285 mg/L, respectively. Arsenic also occursin Las Burras (0.164 mg/L) and Obrajuelo (0.016–0.330 mg/L). The polluted water is not directly used
by dwellers; however, thermal discharges may contam-inate superficial waters (Armienta et al., 2008).
Fluorine in Central America
Less information than that regarding arsenic is avail-able about fluorine in waters and soils of CentralAmerican countries. Folleti and Paz (2001) reportedcases of dental fluorosis in 39 small communitiesin Sula Valley, Honduras. The highest concentrationmeasured was 7.5 mg/L. Other sites with fluoridepresence are Kimuna, in La Libertad Municipality. Insix villages more than 1,200 persons were affectedby fluoride ingestion. In Nicaragua, the maximumgroundwater fluorine content in a survey carried out byUNICEF during 2002 was 1 mg/L (Barragne, 2002). InHonduras and Nicaragua F is associated with ground-water flow through volcanic rocks.
Strock et al. (2008) reported high F concentrationsin groundwater of Belize. They did not specify places,concentrations, or origin.
Fluorosis and natural fluoride-enriched water wereidentified in Chorotega and in central Costa Rica.However, high prevalence of fluorosis in Huetar Norteand Huetar Atlántica regions and low prevalence inCentral Pacific Area need to be explained by morestudies (Salas-Pereira et al., 2008).
Aspects of Medical Geologyin the Caribbean
Introduction
The Caribbean archipelago borders the Caribbean Seaand extends from the Bahamas in the north (situated inbetween 24◦15′N latitude and 76◦00′W longitude) tothe twin island republic of Trinidad and Tobago in thesouth (situated between 10◦2′ and 11◦12′N latitude and60◦ 30′ and 61◦ 56′ W longitude) (Fig. 3). Also knownas the West Indies, these islands are noted for theirphysical beauty, wide variety of flora and fauna, andcultural diversity. Table 2 lists the Caribbean Islandsand summarizes important demographic and geologicinformation.

Medical Geology in Mexico, Central America and the Caribbean 67
Fig. 3 The Caribbean region(taken from the all free mapwebsite –www.english.freemap.jp )
There is comparatively little in the publishedEnglish medical literature about medical geologi-cal disorders in the Caribbean. They were searchedto identify relevant articles. The information pre-sented in this overview was gleaned from the articles,abstracts, and conference proceedings that were iden-tified from PubMed, Google Scholar, and MedCAribdatabases.
Heavy Metal Toxicity
The most widely reported heavy metal poisoning in theCaribbean is lead poisoning. In 1997, a report fromthe Lead Research Group of the Pan American HealthOrganization (PAHO) expressed concern about thepotential for increased lead exposure following rapidindustrialization in Latin America and the Caribbean.There was particular mention about lead exposure asa result of widespread use of leaded gasoline, leadin industrial emissions, battery recycling, use of leadpaints and varnishes, and ingestion of contaminatedfood and water (Romieu et al., 1997).
Since the Pan American Health Organization(PAHO) Lead Research Group report, most CaribbeanIslands have implemented the use of lead-free gaso-line but recent national surveys show that lead toxicityremains a problem in some territories. Nationwide
surveys of blood lead levels in young children havebeen conducted in Jamaica (Lalor et al., 2007) andTrinidad and Tobago (Rajkumar et al., 2006). Lalorand colleagues surveyed 1,081 children, aged 2–6years old, and found that blood lead levels rangedfrom 1.4 to 202 micrograms (mcg)/dL with a geo-metric mean of 4.35 mcg/dL. Of these, 230 children(21.3%) had blood lead levels above 10 mcg/dL andof these 80 children received medical attention, 11(1%) had chelation therapy, and 6 had acute lead poi-soning and required repeated sessions of chelation.The situation was less severe in Trinidad and Tobago.Rajkumar and colleagues surveyed 1761 children aged5–7 years and found a smaller range of blood lead lev-els from <1 to 28.6 mcg/dL. Fifteen children (0.9%)had blood lead levels above 10 mcg/dL and onlythree children (0.2%) met the criteria for lead poison-ing. The higher blood lead levels recorded in someJamaican children were linked to lead-contaminatedareas.
Previous studies of lead toxicity in other CaribbeanIslands have focused on children and adults withincreased risk for lead poisoning. In Barbados, Koplanand colleagues (1977) described high blood levels inpotters and their families where there has been tradi-tional use of lead glazes. High blood levels were alsonoted in members of a community living near a pre-vious auto battery recycling plant in the Dominican

68 M.A. Armienta et al.
Table 2 Summary of the demography and geography of theCaribbean Islands
Country PopulationTotal area(km2)++
Rocktype++
Max.elevation(m)++
Anguilla 13,477 102 L 65Antigua and
Barbuda85,632 442.6 L/V 402
Aruba 104,494 193 188Bahamas 323,000 13,940 L 63Barbados 279,000 431 L/S 336British Virgin
Islands22,000 153 S/M/V 521
CaymanIslands
48,000 262 L 43
Cuba 11,382,000 110,860 L/S/M 2,005Dominica 72,660 754 V 1,447Dominican
Republic9,183,394 48,730 V/L 3,175
Grenada 103,000 344 V 840Guadeloupe 448,000 1,628 1,467Haiti 8,528,000 27,750 2,680Jamaica 2,651,000 10,991 L/S/M 2,556Martinique 396,000 1,128 V 1,397Montserrat 4,000 102 V 930Netherland
Antilles183,000 960 862
Puerto Rico 3,955,000 13,790 L/S/M 1,339St.
Barthelemy8,450 21 286
St. Kitts andNevis
43,000 261 V 1,156
St. Lucia 161,000 616 V 950St. Martin 35,000 54.4 424St. Vincent
andGrenadines
119,000 389 V 1,234
Trinidad andTobago
1,305,000 5,128 L/S/M-T’dad
M/V –T’go
940- T’dad572 – T’go
Turks andCaicos
26,000 430 L 49
US VirginIslands
112,000 1,910 S/M/V 475
Rock Type: L, limestone; M, metamorphic; S, sedimentary;V, volcanic; data from Wikipedia-List of Caribbean IslandCountries by Population(www.en.wikipedia.org/wiki/List_of_Caribbean_island_ coun-tries_by_population). www.geographic.org and www. mon-trosetravel.com//cs_cgeography.html
Republic (Kaul and Mukerjee, 1999) and in childrenliving near backyard smelters of lead in Jamaica (Laloret al., 2006). Sanchez-Nazario et al. (2003) reported on
lead levels in the house dust of homes of children livingin a former landfill in Puerto Rico and found that leadon window sills and toys, and geophagia were signifi-cant predictors of higher blood lead levels in the studypopulation.
There is little information about other forms ofheavy metal poisoning in the Caribbean area. TheCaribbean Environmental Program (CEP) web site listsseveral sources of mercury exposure in the regionincluding high volcanic activity, “gold mining, non-metal extraction, dental laboratories and hospitals, fishcanning, municipal, mercury lamps, batteries and elec-trical components” (CEP website, 2009). The frequentconsumption of fish by island populations has alsoraised concern about possible mercury poisoning asa significant public health problem. The UN Atlas ofthe Ocean has noted high levels of mercury in sharks,swordfish, marlins, and tunas which are among thefish that are widely consumed by Caribbean peopleand hence lends support for possible chronic mer-cury poisoning in groups with heavy fish consumption.Additionally, a study in Trinidad and Venezuela ofheavy metal contamination of sediments, mussels, andoysters showed that mercury levels in the sedimentstested exceeded internationally recognized guidelines(Astudillo et al., 2005) and lend support to the concernof high mercury exposure through regular consump-tion of these mollusks.
High cadmium levels have been found in food cropsin Jamaica (Howe et al., 2005) and high levels ofcadmium, chromium, and zinc have been found insediments from multiple sites in the Caribbean andLatin America. There is concern that marine activitiescould further increase the concentrations of these met-als which could be taken up by marine organisms andenter the food chain (CEP website, 2009).
Arsenic has been reported in soil in bauxite occur-rence areas in the parish of St. Elizabeth in Jamaica(Lalor et al., 1999); in gold deposit areas in theDominican Republic (Nelson, 2000); and in groundwater in the volcanic island of Nevis (USACE, 2004).There have been no reports of arsenic-associated healthproblems from any of these sites. However, a studyof arsenic and other heavy metals in the gold min-ing district of Delita area of Isla de la Juventud inCuba showed that there was leaching of arsenic intothe well water in this area and that children wereexposed to high levels of this metal (Toujague et al.,2003).

Medical Geology in Mexico, Central America and the Caribbean 69
Fluorosis
There have been a few reports of dental fluorosisin Antigua (Vignarajah, 1993), Puerto Rico (Elias-Boneta et al., 2006), and Trinidad (Naidu et al., 2006).Further, a study of the fluoride content of differentwater sources in and around Port-au-Prince, Haiti, hasshown that people, who obtained water from areas withsedimentary formations, were at increased risk of den-tal fluorosis though it was not shown, in that paper,that there was an increased prevalence of dental flu-orosis in the susceptible population (Angerville et al.,2000).
Cuellar-Luna and Garcia-Melian (2003) foundhigh natural fluoride concentrations in eastern Cubawhere the water was obtained from wells located inCretaceous volcanic arc rocks but this report did notassess any associated increased prevalence in dentalfluorosis in these areas. In all territories, more severeforms of fluorosis were not reported.
Elemental Deficiencies
Iodine deficiency was previously a significant publichealth problem in some parts of the Caribbean suchas mountainous areas of Cuba (Rodríguez-Ojea et al.,1998). However, widespread use of iodized salt hasameliorated this situation.
Selenium deficiency has been linked with casesof epidemic neuropathy in parts of Cuba (Becket al., 2003) and with cardiomegaly and hepatomegalyin malnourished children from limestone areas ofJamaica (Bennett et al., 1983). An outbreak of cox-sackievirus infection in parts of Cuba led to the devel-opment of neuropathy in patients who smoked and hadvarious nutritional deficiencies. Affected persons werenoted to have significantly lower levels of seleniumcompared to unaffected persons. It was postulatedthat selenium deficiency led to a state of oxidativestress in the host, which in turn, facilitated morevirulent infection (Beck et al., 2003). Malnourishedchildren with selenium deficiency were more likelyto have enlarged hearts on chest radiographs, largelivers, skin ulceration, and edema. There was alsoa tendency for selenium-deficient patients to gainweight more slowly during recovery (Bennett et al.,1983).
Long-Distance Natural Dust
Every year an estimated 70 × 106 tons of dustfrom the Saharan desert reaches the Caribbean Islands(Kaufman et al., 2005). These clouds of “Saharan dust”impart a characteristic reddish hue to prevailing cloudcover because of its relatively high concentration ofiron, primarily in the ferric form (Zhu et al., 1997).Chemical contaminants (Garrison et al., 2006), fungi,and microbes (Prospero et al., 2005) have also beenidentified in these clouds.
The dust clouds that reach the Caribbean originatefrom two major sources: the Bodele Depression inChad and an area extending from eastern Mauritania,western Mali, and Algeria (Goudie and Middleton,2001). Movement of the dust clouds westward leads tothe deposition of heavier particles over the west coastof Africa and the Atlantic Ocean. The clouds reach-ing the Caribbean region are enriched in particles of2.5 μm or less aerodynamic diameter. Particles of thissize can enter small airways in the lungs and cause res-piratory disease. Particles of <1 μm diameter, whichare also present in the dust clouds, have been impli-cated in acute cardiovascular disorders. The possibilitythat Saharan dust clouds could cause or exacerbatedisease in Caribbean populations has led to ongoingresearch in several territories.
Gyan and colleagues (Gyan et al., 2005) conducteda retrospective assessment of Saharan dust cover andpediatric asthma admissions to a single hospital inTrinidad. They found a weak positive associationbetween dust cover and asthma admissions. In con-trast, Prospero et al. (2008) did not find any associationwith emergency room asthma admissions in Barbadosand short-term surges in dust levels when they exam-ined pediatric emergency room asthma admissions tothe major public hospital in Barbados in relation toSaharan dust cover from 1996 to 1997. To date, as faras the authors are aware, there have been no publishedreports of acute cardiovascular disease in relation toSaharan dust cover in the region.
Radon
The potential hazards posed by exposure to alpha radi-ation from air radon have been of concern worldwide,especially associated with increased lung cancer risk.

70 M.A. Armienta et al.
A tiny bit of radon is incorporated into our body ineach breath of air, due essentially to the geology of ourresidence region. It is also found in groundwater, butsoil-borne radon provides the main source of exposurefor the general population. Radon becomes a problemwhen it collects in our homes at high concentrations(Segovia et al., 2007). Domestic radon has been identi-fied as the most important environmental risk factor forlung cancer. UNSCEAR (2000) estimation indicatesthat radon and its radioactive daughters contribute 75%to the effective dose due to natural terrestrial sources.
In Central America, the Caribbean, and Mexico,several radon projects were performed during the lastquarter of the 20th century. Projects related to geologyand geophysics such as the study of soil and ground-water radon variations in seismic zones and aroundactive volcanoes were especially welcomed in this partof the world where long chains of active volcanoes arepresent and where very large earthquakes occur sys-tematically, due to the subduction of the Pacific Platesunder the continent.
The methodologies to evaluate radon concentrationlevels in air and water in the region consist mainly inthe use of passive detectors (solid-state nuclear trackdetectors, electrets, and activated charcoal) (Espinosaand Gammage, 2003; Canoba et al., 2002), activedetectors (Armienta et al., 2002), and the liquid scin-tillation method for determination of radon in watersamples (Segovia et al., 2003).
The interest in the effective radiation dose receivedby the general population due to inhalation of radonand its radioactive daughters, that adhere to suspendedatmospheric particulate matter, was also demonstratedin the evaluation of radon in closed atmospheres suchas dwellings, caves, or spa buildings, together with theamount of 226Ra, 222Rn, and daughters in groundwa-ter used mainly for drinking water supply in the wholeregion. Recent studies to relate atmospheric pollutantsand lung cancer cases have already started.
Radon in Mexico
In Mexico radon in the soil and groundwater studiesstarted in the 1980s around active volcanoes such asPopocatepetl and Colima (Segovia et al., 2005), andalong the seismic zone of the Pacific Coast (Segoviaet al., 1999).
Many radon-in-soil surveys have been conductedto obtain an estimate of the radon concentration lev-els in Mexico. Those values obtained from stationsdeployed at more than 150 sites were presented ina map covering approximately one-third of the terri-tory of Mexico. Radon-in-soil levels were relativelylow; the mean value was approximately 10 kBq/m3.The highest values appear in the north of the coun-try where a radioactive-rich mineralization zone exists,with maximum values up to 500 kBq/m3 related toa uranium-rich zone in the state of Sonora. In thesouthern part of the country, moderate radon levelsof 18 kBq/m3 were associated with intrusive rocksand with enhanced hydrothermal activity. In CentralMexico and Mexico City maximum values of 8 and15 kBq/m3, respectively, were reported. The lowestvalues within the studied sites were found in activevolcanoes (Colima, El Chichon, and Popocatepetl vol-canoes).
Soil radon determination has also been system-atically performed along the Pacific Coast. During1997, the seismicity was extremely intense along thecoastal zone of the state of Guerrero and some radonpeaks (between 20 and 30 kBq/m3) were observedat Acapulco. The variations observed correspondedwith a period of particularly intense meteorologicalperturbations produced as a consequence of El Niño,culminating with the formation of a tropical hurri-cane that struck the Guerrero coast (Segovia et al.,1999).
The first measurements of radon in groundwaterwere made in some samples from alluvial and volcanicaquifers. The water samples were taken from wells andsprings in San Luis Potosí, Michoacán, and Mexicostates. Radon content varied depending on the sam-ple source, reaching a maximum value of 11.3 kBq/m3
at Toluca City. However, the highest radon concentra-tions values (34.2 and 27.3 kBq/m3) in groundwaterand drinking water supply system, respectively, weremeasured in Aldama, Chihuahua, located in the north-ern part of the country (Colmenero et al., 2004).
Outdoor radon concentrations in different geologi-cal zones were quite comparable; average values werebetween 13 and 23 Bq/m3. The small fluctuationsobserved can be attributed to air convection during thesampling time.
Indoor radon concentrations were measured in fam-ily houses located at several towns within the MexicanVolcanic Belt, and in other family houses from towns

Medical Geology in Mexico, Central America and the Caribbean 71
80
90
100
110
120
130
140
150
160
1997 1998 1999 2000 2001 2002 2003 2004 2005 2006 2007 2008
Par
ticle
s P
M-1
0 (N
W)
0
20
40
60
80
100
120
140
160
180
200
ParticlesRadon
Radon concentration (B
q m–3
)
Fig. 4 Lung cancer case trends along 10 years vs. (a) SPM (PM-10) and (b) average indoor radon
in the north part of the country. The Mexican datamedian value for dwellings (72 Bq/m3) is higher bya factor of 1.7 than the worldwide radon concentra-tion median value (46 Bq/m3) reported by UNSCEAR(2000). The average effective dose derived by use ofthe equation
HE = CRnEqTCFRn10−6,
where HE is the annual effective dose by inhalationof radon (mSv/y), CRn is the radon concentration inair (Bq/m3), Eq is the equilibrium factor (0.4 and 0.6for indoor and outdoor environments, respectively), Tis the occupancy factor (7000 and 1760 h/y for theindoor and outdoor environments to the general pub-lic, respectively), CFRn is a dose conversion factor forradon (9 and 6 nSv/Bq/h m3 in terms of the equilib-rium equivalent radon concentration and equilibriumfactors of 0.4 and 0.6 for indoor and outdoor environ-ments, respectively), results in the calculation that theaverage effective dose (2.1 ± 1.1 mSv/y) was twice theworld average effective dose (1.0 mSv/y) for indoorenvironments (UNSCEAR, 2000). Chihuahua State innorthern Mexico was the zone showing highest values(Colmenero et al., 2004).
In Mexicali City near the Mexican–USA bor-der, indoor radon concentration was measured in 95houses. Reyna-Carranza and López-Badilla (2002)determined that the number of deaths was higher inneighborhoods without pavement with respect to thosepaved; Rn levels were also higher at homes registeringa death. More female than male deaths were ascribedto their longer permanence periods at home.
In Mexico City, the calculated average indoor radonconcentrations and range taking into consideration all
the values reported were 73.8 and 4300 Bq/m3, respec-tively. In certain areas of Mexico City, many sources ofsuspended particulate matter (SPM), from motor vehi-cles, factories, or deforested soil, among others, inducehigh concentration of particles that remain suspendedin the atmosphere practically all year long (Espinosaet al., 2008). Radon daughters can adhere easily tothe SPM. These often-radioactive carriers are danger-ous due to their high mobility to enter through thenasal fosses into the respiratory system and reachingthe alveolus. Lung cancer is the first cause of death bymalignancies in Mexico; in recent decades an increas-ing frequency of lung cancer has been reported. Thereasons for this increase have not been adequately elu-cidated. Data on mortality of the last 10 years, dataroutinely collected, and tendencies published from theHealth Ministry (SSA, 2003) indicate that yearly PM-10 average concentrations at the center-north part ofMexico City, between 1998 and 2007, follow the sametendency as lung cancer cases reported in the same areaof the city (Fig. 4). Both curves show the same shapeand an increase with time. On the other hand, the aver-age indoor radon behavior at the same region showsstability with time (Espinosa et al., 2009). However,the role of radon as compared with SPM was notconclusive in this case.
Radon in Central America
The active volcanic range along Central America ischaracterized by the presence of settlements wherethousands of people live around volcanoes. Studiesof gaseous emissions from the craters, fumaroles, and

72 M.A. Armienta et al.
ground fractures are rarely applied to determine theeffects of the emissions on people or the environment.However, results of the degassing monitoring can beanalyzed in the future to estimate the impact on healthof the local population (Baxter, 2005).
Costa Rica
In Costa Rica, radon-in-soil studies started in 1981related to volcanic eruptions. Several volcanoes suchas Poas and Arenal have been continuously monitoredfor soil radon (Barquero et al., 2005). The determi-nation of the effective dose received by constructionworkers of a tunnel due to radon concentration levelsof up to 1.5 kBq/m3 in the underground air showed thatthe maximum effective dose was 13.5 mSv/y, for peo-ple working in the tunnel 8 h a day (Garcia Vindas andMora, 2004). Recently, regional cooperation to pro-mote nuclear science and technology (ARCAL-IAEA,2005) initiated proposals for regional projects. Amongthem, a project to evaluate radon as a possible precur-sor of seismic events and volcanic eruptions togetherwith the role of radon in environmental pollution wasproposed by Costa Rica for the 2007–2008 ARCALschedule. Several Latin American countries (Ecuador,Chile, Colombia, Argentina, and Guatemala) wereinterested in the Costa Rica proposal.
Nicaragua
Radon studies related to fault location were reportedsince 1982 in active volcanoes from Nicaragua(Crenshaw et al., 1982, Connor et al., 1996). Thesestudies continue within cooperation programs withuniversities from abroad.
El Salvador
The same interest for volcanic radon gas related tothe volcanic monitoring for risk assessment occurs inEl Salvador, where studies on volcanoes such as SanMiguel have included radon and other volcanic gases(Cartagena et al., 2004). Radon was also measured inseveral studies developed at Ilopango Lake. Soil Rnconcentrations were higher than 100 pCi/L in severallocations of the caldera. The strongest anomalies of Rn
and carbon dioxide were observed in a region locatedbetween the south and southwest of Ilopango Lake,close to a region of frequent seismicity (López et al.,2009).
The Caribbean
Cuba
In Cuba, projects in association with internationalorganizations have shown interesting results performedat Elguea Spa, in the north-central part of the island,the most important natural thermal resource of radioac-tive groundwater. The hot spring is associated with asystem of geological faults where anomalous valuesof uranium, thorium, and potassium have been found.The gamma anomaly is the most intense in Cuba andis associated with Cretaceous limestones. 226Ra and222Rn concentration values in the spring water wereup to 32.5 and 220.5 kBq/m3, respectively. During a10-year period dosimetry studies of the effective dosecontrol of the spa workers were performed. Indoorradon concentrations were up to 52 kBq/m3(Manchadoet al., 2005). As reported by the authors, the sys-tematic medical observation of professional workersexposed at this high-dose radiation showed very lowindicators of negative health effects, concluding thatan evidence of hormesis effect for 222Rn occurred.Studies of radioactive isotopes in sediments from LaHabana Bay also revealed no effects related to healthon the population (Gela et al., 2001).
Final Remarks
Studies of As and fluoride including concentrationlevels, distribution, and their impact on health havebeen performed in various zones within Mexico,Central America, and the Caribbean. However, mostof them were conducted by isolated research groupsfrom universities or the government. Internationalorganizations have also been involved or have givensupport for specific projects. One of those jointefforts was developed during the years 2003–2005in Nicaragua, when UNICEF supported ENACAL-GAR (Empresa Nicaragüense de Acueductos yAlcantarillados-Gerencia de Acueductos Rurales)

Medical Geology in Mexico, Central America and the Caribbean 73
through the project “Determinación de la Calidaddel Agua de Consumo Humano, con énfasis enArsénico” (Determination of drinking water qualitywith emphasis on arsenic), to determine arsenic con-tents in drinking water sources at the departmentsof Boaco, Chontales, Estelí, Jinotega, and Matagalpa(Altamirano-Espinoza and Bundschuh, 2009). On theother hand, the large area (about 2,000,000 km2)of Mexico is one of the causes of scarce coop-eration among research groups within the country.Nevertheless, more joint efforts have been startedrecently. In 2006, the creation of the Iberoarsen net-work (supported by the Spanish Agency CYTED) pro-moted a networking enhancement on arsenic studieswithin Latin America and the Iberian countries. Thisgroup focused particularly on information exchange,joint projects development, and formation of expertson the themes of distribution, analytical determination,and remediation. On the other hand, As sources havebeen revealed only in certain regions, and people arestill consuming As- and/or fluoride-tainted water atmany sites. There is not a consensus on the numberof people exposed to As in the area, but about 4 mil-lion people exposed have been estimated (Bundschuhet al., 2008). However, the problem is exacerbated inrural areas with a lack of access to unpolluted water.
More research studies are needed in the whole areato identify arsenic sources, environmental fate, andrisks to human, animals, and vegetation. There is alsoa need to develop innovative and affordable methodsfor the removal of arsenic and fluoride from water. Atthe same time, water authorities should be willing toinstall those new methodologies on a routine basis. Theinfluence of seasonal changes on As and fluoride ontheir concentrations and fate in waters should also beinvestigated.
Mexico was the seventh country in the world toadopt salt fluoridation as a “mass measure” adding250 mg of potassium fluoride to the salt for humanconsumption since 1994 (Pazos, 1991). Toothpastescontain about 1,000 ppm F, although in regions withhigh contents of F, there are no Mexican toothpasteswithout fluorine available. Since 1997 the US Foodand Drug Administration, USFAD, put a warning labelon toothpastes and restricts the maximum F contentper package to 276 mg (USFDA, 2003). In CentralAmerican countries there are no similar restrictions.
The overview of aspects of medical geological dis-orders in the Caribbean suggests that there is a paucity
of published reports on a range of geologically relatedmedical disorders in the Caribbean region. However,it must be noted that only English medical databaseswere searched and that relevant articles may exist inthe Spanish, French, and Dutch medical literature,since these are also languages of the Caribbean region.Nonetheless, this region offers opportunities for uniqueand important research on a diverse range of topicssuch as the effects of long-range dust on humans, ani-mals, and marine life; and the impact of rapid industrialdevelopment in small island states.
The review presented here, although being non-exhaustive, shows the urgency of establishing thedetermination of arsenic and fluoride routinely in allpotable water sources of the area, and to adopt mea-sures immediately to decrease their concentrations tosafe levels in all drinking water sources.
References
Agostini S, Corti G, Doglioni C, Carminati E, Innocenti F,Tonarini S, Manetti P, Di Vincenzo G, Montanari D (2006)Tectonic and magmatic evolution of the active volcanic frontin El Salvador: Insight into the Berlín and Ahuachapángeothermal areas. Geothermics 35:368–408.
Alarcón-Herrera MT, Martín-Domínguez IR, Trejo-Vázquez R,Rodríguez-Dosal S (2001a) Well water fluoride, dental flu-orosis, bone fractures in the Guadiana Valley of Mexico.Fluoride 34:139–149.
Alarcón-Herrera MT, Flores-Montenegro I, Romero-Navar Pet al. (2001b) Contenido de arsénico en el agua potabledel valle del Guadiana, Mexico. Ing Hidraul Mex XVI:63–70.
Altamirano M (2005) Distribution of arsenic pollution inthe groundwater of the South West basin of Sebacovalley-Matagalpa, Nicaragua. Proceedings Hydrogeologyand Water Resources Management: Working together for theFuture. March 2005, Managua.
Altamirano-Espinoza M, Bundschuh J (2009) Natural arsenicgroundwater contamination of the sedimentary aquifers ofsouthwestern Sébaco valley, Nicaragua. In J Bundschuh,MA Armienta, P Birkle, P Bhattacharya, J Matschullat,AB Mukherjee (eds) Natural arsenic in groundwaters ofLatin America – Occurrence, health impact and remediation.London: Taylor and Francis Group.
A. M. (2008) Consumen dos colonias agua con flúor y arsénico.A. M., Regional newspaper. Feb 23, 2008, Guanajuato.
Angerville R, Emmanuel E, Nelson J, Saint-Hilaire P (2000)Assessment of the fluoride concentration in the waterresources in the hydrographic region of central southHaiti. Case Studies on Water and Envrionment Issues inHaiti.UNESCO Regional Office for Science & Technologyfor Latin America and the Caribbean (Uruguay) DocumentCode, UY/2000/SC/PHI/PI/1.

74 M.A. Armienta et al.
Armienta MA, Rodríguez R (1996) Arsénico en el Vallede Zimapán, Mexico: Problemática Ambiental. RevistaMAPFRE Segur 63:33–43.
Armienta MA, Rodríguez R, Aguayo A, Ceniceros N, VillaseñorG, Cruz O (1997a) Arsenic contamination of groundwater atZimapán, Mexico. Hydrogeol J 5:39–46.
Armienta MA, Rodríguez R, Cruz O (1997b) Arsenic content inhair of people exposed to natural arsenic polluted ground-water at Zimapán, Mexico. Bull Environ Contam Toxicol59:583–589.
Armienta MA, Villaseñor G, Rodríguez R et al. (2001) The roleof arsenic bearing rocks in groundwater pollution at ZimapánValley, Mexico. Environ Geol 40:571–581
Armienta MA, Varley N, Ramos E (2002) Radon and hydro-geochemical monitoring at Popocatepetl volcano, Mexico.Geofis Int 41:271–276.
Armienta MA, Amat PD, Larios T, López DL (2008) AméricaCentral y Mexico. In J Bundschuh, M Litter, A Pérez-Carrera (eds) IBEROARSEN, Distribución del arsénico enlas regiones Ibérica e Iberoamericana. CYTED, BuenosAires.
Armienta MA, Segovia, N (2008) Arsenic and fluoride inthe groundwater of Mexico. Environ Geochem Health 30:345–353.
Astudillo LR, Yen IC, Bekele I (2005) Heavy metals in sed-iments, mussels and oysters from Trinidad and Venezuela.Rev Biol Trop 53:41–53.
Barragne P (2002) Evaluación rápida de la contaminación porarsénico y metales pesados de las aguas subterráneas deNicaragua. PIDMA-UNICEF Managua.
Barragne P (2004) Contribución al estudio de cinco zonascontaminadas naturalmente por arsénico en Nicaragua.Managua, Nicaragua: UNICEF.
Barquero J, Fernandez E, Monnin M et al. (2005) Water chem-istry and radon survey at the Poas volcano (Costa Rica). AnGeophys 48:33–42.
Baxter P (2005) Human impacts of volcanoes. In J Marti, GGJErnst (eds) Volcanoes and the Environment. Cambridge:Cambridge University Press.
Beck MA, Levander OA, Handy J (2003) Selenium deficiencyand viral infection. J Nutr 138:1643S–1467S.
Bennett FI, Golden MH, Golden BE (1983) Red cellgluthathione peroxidase concentration in Jamaican childrenwith malnutrition. Proceedings 28th Scientific meeting of theCommonwealth Caribbean Medical Research Council, April20–23 Kingston.
Birkle P, Bundschuh J (2009) The abundance of natural arsenicin deep thermal fluids of geothermal and petroleum reser-voirs in Mexico. In J Bundschuh, MA Armienta, P Birkle,P Bhattacharya, J Matschullat, AB Mukherjee (eds) NaturalArsenic in Groundwaters of Latin America – Occurrence,Health Impact and Remediation. London: Taylor and FrancisGroup.
Bundschuh J, Perez-Carrera A, Litter M (2008) Introducción:Distribución del arsénico en las regions Ibérica eIberoamericana. In Bundschuh J, Litter M, Pérez-CarreraA (eds) IBEROARSEN, Distribución del arsénico en lasregiones Ibérica e Iberoamericana. Buenos Aires: CYTED.
Calderón J, Machado B, Navarro M et al. (2000) Influence of flu-oride exposure on reaction time and visuospatial organizationin children. Epidemiol 11 (4) Supplement S153.
Calderón-Fernández ML (2006) Alternativas de depuración deagua para consumo humano en el estado de Chihuahua. JuntaCentral de Agua y Saneamiento de Chihuahua. DocumentosForo Mundial del Agua. Mexico, DF.
Canoba A, Lopez FO, Arnaud MI et al. (2002) Indoor radonmeasurements in six Latin American countries. Geofis Int41:453–457.
Cardona BA, Carrillo RJJ, Armienta HMA (1993) Elementotraza: Contaminación y valores de fondo en aguas sub-terráneas de San Luis Potosí, SLP, Mexico. Geofis Int32:277–286.
Carrillo-Rivera JJ, Cardona A, Moss D (1996) Importance of thevertical component of groundwater flow: a hydrogeochem-ical approach in the valley of San Luis Potosí, Mexico. JHydrol 23:23–44.
Carrillo-Rivera JJ, Cardona A, Edmundo WM (2002) Use ofabstraction regime and knowledge of hydrogeological con-ditions to control high-fluoride concentration in abstractedgroundwater: San Luis Potosí Basin, Mexico. J Hydrol261:24–47.
Cartagena R, Olmos R, Lopez D et al. (2004) Diffusesoil degassing of carbon dioxide, radon and mercuryat San Miguel volcano, El Salvador. In W Rose, JBommer, D Lopez, M Carr, J Major (eds) NaturalHazards in El Salvador. Boulder: Geological Survey ofAmerica.
Castro-Larragoitia J, Kramar U, Puchelt H (1997) 200 yearsof mining activities at La Paz/San Luis Potosi/Mexico –Consequences for environment and geochemical exploration.J Geochem Explor 58:81–91.
Cebrián ME, Albores A, García-Vargas G, Del Razo LM (1994)Chronic arsenic poisoning in humans: The case of Mexico.In JO Nriagu (ed) Arsenic in the Environment, Part II.New York: John Wiley & Sons Inc.
CEP website (2009) Caribbean Environmental Programme web-site, http://www.cep.unep.org/publications-and-resources/marine-and-coastal-issues-links/heavy-metals. Accesed 20March 2009.
CODEREG (2000) Acuífero de la Independencia, municipios deSan José Iturbide, Doctor Mora, San Luis de la Paz, DoloresHidalgo, San Felipe, San Diego de la Unión y San Miguel deAllende, Guanajuato. Technical Report inedit. Consejo parael Desarrollo Regional Noreste y Norte, Guanajuato.
Colmenero SL, Montero CME, Villalba L et al. (2004) Uranium-238 and thorium-232 series concentrations in soil, radon-222indoor and drinking water concentrations and dose assess-ment in the city of Aldama, Chihuahua, Mexico. J EnvironRadioact 77:205–219.
Connor CB, Hill BE, La Femina PC et al. (1996) Soil radon pulseduring the 1995 phreatic eruption of Cerro Negro, Nicaragua.J Volcanol Geotherm Res 73:119–127.
Coronado-González JA, Del Razo LM, García-Vargas G et al.(2007) Inorganic arsenic exposure and type 2 diabetes melli-tus in Mexico. Environ Res 104:383–389.
Crenshaw WB, William SN, Stoiber RE (1982) Fault locationby radon and mercury at an active volcano in Nicaragua. Nat300:345–346.
Cuellar-Luna L, Garcia-Melian M (2003) Fluoride in drink-ing water in Cuba and its association with geologicaland geographical variables. Pan Am J Public Health 14:341–349.

Medical Geology in Mexico, Central America and the Caribbean 75
Del Razo LM, Arellano MA, Cebrián ME (1990) The oxida-tion states of arsenic in well-water from a chronic arseni-cism area of northern Mexico. Environ Pollut 64:143–153.
Del Razo LM, Corona JC, García-Vargas G et al. (1993) Fluoridelevels in well-water from a chronic arsenicism area of north-ern Mexico. Environ Pollut 80:91–94.
Del Razo LM, Garcia-Vargas GG, Vargas H et al. (1997)Altered profile of urinary arsenic metabolites in adults withchronic arsenicism. A pilot study. Arch Toxicol 71:211–217.
Elias-Boneta AR, Psoter W, Elias-Viera AE et al. (2006)Relationship between dental caries experience (DMFS) anddental fluorosis in 12-year-old Puerto Ricans. CommunityDent Health 23:244–250.
ESF (2006) Well water quality in San Miguel de Allende. PhaseI: Results and Conclusions. Ecosystem Sciences Foundation,ESF, San Miguel de Allende Municipality. Technical Reportinedit, Guanuajuato.
Espinosa G, Gammage RB (2003) A representative survey ofindoor radon in the sixteen regions in Mexico City. RadiatProt Dosim 103:73–76.
Espinosa G, Golzarri JI, Bogard J et al.(2008) Indoorradon measurements in Mexico City. Radiat Meas 43:S431–S434.
Espinosa G, Golzarri JI, Ponciano RG et al. (2009) Populationvulnerability due to the exposure to radon and airborne par-ticulate matter (PM10), in Mexico City. Submitted to RadiatMeas.
Estrada F (2003) Estudio preliminar de la incidencia del arsénicoen aguas subterráneas con relación al medio físico naturalen la región noroeste y sureste de Nicaragua: Periodo 2001–2002. Universidad Nacional de Ingeniería UNI. Programa deInvestigación y Docencia en Medio Ambiente, Managua.
Estupiñán-Day S, Vera H, Duchon K et al. (2005) FinalReport “Task-Force Meeting” Defluoridation systems inLatin America and the Caribbean, Washington DC, 22–24October, 2004. Comisión Nacional del Agua, Secretaría deSalud de Mexico, Pan American Health Organization, WHO,Washington DC.
Folleti C, Paz G (2001) Diagnóstico de fluorosis dental en 39comunidades del valle de Sula, Honduras. En Superaciónsanitaria y ambiental: el reto. AIDIS, Tegucigalpa.
Fragoso R, Jackson G, Cuairan V, Gaitan L (1997) Efectividaddel acido clorhídrico como blanqueador dental en piezas confluorosis dental. Rev ADM LIV:219–222.
Gamiño SP, Monroy M (2009) Evaluation of children expositionand effect biomarkers in a mining site with high concentra-tion of arsenic and lead bioaccesibility as a case study forabandoned sites associated to Pb-Zn-Cu-Ag skarn depositsin Central Mexico. Geological Society of America Abstractswith Programs, 16–17 March Dallas, TX 41(2):13, Dallas.
Garcia S, Ovalle J (1994) Grado de fluorosis dental en pacientesde la Univ. Del Bajío. Rev ADM 51:162–168.
Garcia Vindas JR, Mora P (2004) Radon concentration and doseassessment in a tunnel under construction in Costa Rica.Radioisot53:517–522.
Garrison VH, Foreman WT, Genualdi S et al. (2006) Saharandust- a carrier of the persistent organic pollutants, metalsand microbes to the Caribbean? Rev Biol Trop 54(supl.3):9–21.
Gela A, Solo J, Diaz, Simon MJ et al. (2001) Radiological eval-uation of sediments from the Havana Bay. VII Workshop onNuclear Physics, La Habana.
Gómez A (2002) Monitoreo y atención de intoxicadoscon arsénico en El Zapote-San Isidro, Departamento deMatagalpa. Nicaragua. Reporte Técnico. Estudio real-izado con apoyo financiero de UNICEF por MINSA,Managua.
Gómez-Arroyo S, Armienta MA, Cortés-Eslava J, Villalobos-Pietrini R (1997) Sister chromatid exchanges in Viciafaba induced by arsenic-contaminated drinking water fromZimapan, Hidalgo, Mexico. Mutat Res 394:1–7.
González-Hita L, Sánchez L, Mata I (1991) Estudio hidrogeo-químico e isotópico del acuífero granular de la ComarcaLagunera. Instituto Mexicano de Tecnología del Agua.Technical Report inedit, Jiutepec.
Gonsebatt ME, Vega L, Salazar AM et al. (1997) Cytogeneticeffects in human exposure to arsenic. Mutat Res 386:219–228.
González M (1998) Exposición al arsénico en comunidadesrurales de San Isidro, Matagalpa. OPS/OMS, Managua.
Goudie AS, Middleton NJ (2001) Saharan dust storms: Natureand consequences. Earth Sci Rev 56:179–204.
Grimaldo M, Borja-Aburto VH, Ramírez AL et al. (1995)Endemic fluorosis in San Luis Potosí, Mexico. Environ Res68:25–30.
Gutiérrez-Ojeda C (2009) Determining the origin of arsenicin the Lagunera region aquifer, Mexico using geochemi-cal modeling. In J Bundschuh, MA Armienta, P Birkle, PBhattacharya, J Matschullat, AB Mukherjee (eds) Naturalarsenic in groundwaters of Latin America – Occurrence,health impact and remediation. London: Taylor and Francisgroup.
GVP (2009) Mexico, Volcanoes of Mexico and Central America,Global Volcanism Program, Smithsonian Institution,Washington DC, http://www.volcano.si.edu/world/region.cfm?rnum=1401, Accessed 16 April 2009.
Gyan K, Henry W, Lacaille S et al. (2005) African dust cloudsare associated with increased paediatric asthma accident andemergency admissions on the Caribbean island of Trinidad.Int J Biometeorol 49:371–376.
Hernández-Montoya V, Bueno-López JI, Sánchez-Ruelas AMet al. (2003) Fluorosis y caries dental en niños de 9 a 11años del estado de Aguascalientes, Mexico. Rev Int ContamAmbient 19:197–204.
Horst A (2006) Use of Stable and Radioactive Isotopes andGaseous Tracers for Estimating Groundwater Recharge,Time of Residence, Mixing of the Different Types ofGroundwater and Origin in the Silao Romita Aquifer,Guanajuato, Central Mexico. FOG, Freiberg Online Geol 17,Freiberg.
Howe A, Fung LH, Lalor G et al. (2005) Elemental compositionof Jamaican foods 1: A survey of five food crop categories.Environ Geochem Health 27:19–30.
Hurtado-Jiménez R, Gardea-Torresdey J (2005) Estimación de laexposición a fluoruros en Los Altos de Jalisco, Mexico. RevPanam Salud Publica 20:236–247.
Hurtado-Jiménez R, Gardea-Torresdey J (2009) Contaminationof drinking water supply with geothermal arsenic. InJ Bundschuh, MA Armienta, P Birkle, P Bhattacharya,J Matschullat, AB Mukherjee (eds) Natural arsenic in

76 M.A. Armienta et al.
groundwaters of Latin America – Occurrence, health impactand remediation. London: Taylor and Francis Group.
Irigoyen ME, Molina N, Luengas I (1995) Prevalence andseverity of dental fluorosis in a Mexican community withabove optimal fluoride concentrations in drinking water.Community Dent Oral Epidemiol 23(4):243–245.
Kaufman YJ, Koren I, Remer LA et al. (2005) Dust transportand deposition observed from the Terra-Moderate ResolutionImaging Spectroradiometer (MODIS) spacecraft over theAtlantic Ocean. J Geophys Res 110:D10S12.
Kaul B, Mukerjee H (1999) Elevated blood lead and erythro-cyte protopophyrin levels of children near a battery-recyclingplant in Haina, Dominican Republic. Int J Occup EnvironHealth 5:307–312.
Koplan JP, Wells AV, Diggory HJ et al. (1997) Lead absorptionin a community of potters in Barbados. Int J Epidemiol 6:225–229.
Lalor GC, Rattray R, Simpson P, Vutchkov M (1999)Geochemistry of an arsenic anomaly in St. ElizabethJamaica. Environ Geochem Health 21:3–11.
Lalor GC, Vutchkov MK, Bryan ST et al. (2006) Acute lead poi-soning associated with backyard lead smelting in Jamaica.West Indian Med J 55:394–398.
Lalor GC, Vutchkov MK, Bryan ST (2007) Blood lead levelsof Jamaican children island-wide. Sci Total Environ 374:235–241.
Leal-Ascencio MT, Gelover-Santiago S (2006) Evaluación deacuíferos de la mesa del norte, V Congreso Internacional yXI Congreso Nacional de Ciencias Ambientales, MemoriasOaxtepec, Morelos, 7–9 de junio, 2006, Oaxtepec.
Levy DB, Schramke JA, Esposito KJ et al. (1998) The shal-low ground water chemistry of arsenic, fluorine, and majorelements: Eastern Owens Lake, California. Appl Geochem14:53–65.
López DL, Ransom L, Monterrosa J et al. (2009) Volcanicarsenic and boron pollution of Ilopango lake, El Salvador.In J Bundschuh, MA Armienta, P Birkle, P Bhattacharya, JMatschullat, AB Mukherjee (eds) Natural arsenic in ground-waters of Latin America – Occurrence, health impact andremediation. London: Taylor and Francis Group.
Loyola-Rodríguez JP, Pozos-Guillén, CD, Hernández-GuerreroJC et al. (2000) Fluorosis en dentición temporal en unárea con hidrofluorosis endémica. Salud Publ Mex 42:194–200.
Manchado A, Cervantes P, Lantigua L (2005) Evidencias sobrela hormesis por 222Rn en el balneario Elguea, Cuba.Proceedings of the First Convention on Earth Sciences, LaHabana.
Mahlknecht J, Steinich B, Navarro I (2004) Groundwater chem-istry and mass transfers in the Independence aquifer, CentralMexico, by using multivariate statics and mass-balance mod-els. Environ Geol 45:781–795.
Mahlknecht J, Horst A, Hernández-Limón G, Aravena R (2008)Groundwater geochemistry of the Chihuahua City regionin the Rio Conchos Basin (Northern Mexico) and implica-tions for water resources Management. Hydrol Proces 22:4736–4751.
Martínez P, García M (2007) Distribución de iones mayoresy metales en el agua subterránea de la subcuenca del RíoTurbio, estados de Guanajuato y Jalisco. Rev Geocienc1:37–54.
Mattheß G (1994) Groundwater Properties. Hydrogeologie,Band 2. Berlin, Stuttgart: Gebriider Borntraeger.
Megaw PK, Ruiz JR, Titley SR (1988) High temperature, car-bonate.hosted Ag-Pb-Zn(Cu) deposits of northern Mexico.Econ Geol 83:131–140.
Mejía JA, Rodriguez R, Armienta A et al. (2007) Aquifer vulner-ability zoning, an indicator of atmospheric pollutants input?Vanadium in the Salamanca aquifer, Mexico. Water, Air, SoilPollut 185:95–100.
Mérida R, Reyes A, Hernández I (1998) Texto GuíaCarta Magnética Guanajuato. Consejo Recursos Minerales,SECOFI, Mexico, Mexico DF.
Meza MM, Kopplin M, Burges JL, Gandolfi J (2004) Arsenicdrinking water exposure and urinary excretion among adultsin the Yaqui Valley, Sonora, Mexico. Environ Res 96:119–126.
Molina MA (2004) Estudio hidrogeoquímico en la ComarcaLagunera, Mexico. M.Sc. Thesis, Posgrado en Cienciasde la Tierra. Universidad Nacional Autónoma de Mexico,Mexico DF.
Morales L, Puigdomènech C, Puntí A et al. (2009) Arsenicand water quality of rural community wells in San Juan deLimay, Nicaragua. In J Bundschuh, MA Armienta, P Birkle,P Bhattacharya, J Matschullat, AB Mukherjee (eds) Naturalarsenic in groundwaters of Latin America – Occurrence,health impact and remediation. London: Taylor and Francisgroup.
Naidu R, Prevatt I, Simeon D (2006) The oral health andtreatment needs of schoolchildren in Trinidad and Tobago:Findings of a national survey. Int J Paediatr Dent 16:412–418.
Nelson C (2000) Volcanic domes and gold mineralization inthe Pueblo Viejo district Dominican Republic. Miner Depos35:511–525.
Ortega-Guerrero A (2003) Origin and geochemical evolutionof groundwater in a closed-basin clayey aquitard, NorthernMexico. J Hydrol 284:26–44.
Ortiz D, Castro L, Turrubiartes F et al. (1998) Assessment ofthe exposure to fluoride from drinking water in Durango,Mexico, using a geographic information system. Fluoride31:183–187.
Ovalle J (1996) Fluorosis dental de la población escolar deSalamanca Guanajuato. Rev ADM 53:289–294.
Pazos L (1991) Salt Fluoridation in Mexico. NationalCoordination of the Salt Fluoridation Program in Mexico. OnMay 27, 1991. Mexico City.
Peña M (2005) Reto del milenio en los asentamientosprecarios de America Latina y el Caribe. InvitedConference. Regional Symposium on Healthy Houses,San Jose.
Planer-Friedrich B, Armienta MA, Merkel BJ (2001) Origin ofarsenic in the groundwater of the Rioverde Basin, Mexico.Environ Geol 40:1290–1298.
Prospero JM, Blades E, Mathison G, Naidu, R (2005)Interhemispheric transport of viable fungi and bacteriafrom Africa to the Caribbean with soil dust. Aerobiol 21:1–19.
Prospero JM, Blades E, Naidu et al. (2008) Relationship betweenAfrican dust carried in the Atlantic trade winds and surgesin paediatric asthma attendances in the Caribbean. Int JBiometeorol 52:823–832.

Medical Geology in Mexico, Central America and the Caribbean 77
Rajkumar WS, Manohar J, Doon R et al. (2006) Blood lead lev-els in primary school children in Trinidad and Tobago. SciTotal Environ 361:81–87.
Ravishankar S (1987) Status of Geothermal Exploration inMaharashtra and Madhya Pradesh (C.R.). GSI Rec 115(6):7–29.
Razo I, Carrizales L, Díaz-Barriga F, Monroy M (2004) Arsenicand heavy metal pollution of soil, water and sediments in asemi-arid climate mining area in Mexico. Water, Air, SoilPollut 152:129–152.
Reséndiz MRI, Zúñiga LJC (2003) Evaluación de la Exposiciónal arsénico en pobladores del municipio de Zimapán,Hidalgo, Bachelors Thesis Eng. Chem., UniversidadTecnológica de Mexico, Mexico, DF.
Reyes-Cortés IA, Reyes-Cortés M, Villalba L et al. (2006a)Origen del As en las cuencas endorreicas, Chihuahua,Mexico. Geos 26:39.
Reyes-Cortés IA, Vázquez-Balderas JF, Ledesma-Ruiz R(2006b) As en el sistema hidrogeológico del valle deDelicias, Chihuahua, Mexico. Geos 26:40.
Reyna-Carranza MA, López-Badilla G (2002) Estudio del efectodel radón en los casos de muerte por cáncer pulmonar en lapoblación de Mexicali, Baja California, Mexico. Rev MexIng Biomed XXIII:68–73.
Rocha-Amador D, Navarro ME, Carrizales L, Morales R,Calderón J (2007) Decreased intelligence in children andexposure to fluoride and arsenic in drinking water. Cad SaúdePública Rio de Janeiro 23suppl. 4:5579–5587.
Rodrigu A, Ren M, Goodell P (2007) Potential bedrock sourceof groundwater arsenic anomaly in northeastern ChihuahuaCity, Chihuahua, Mexico. American Geophysical Union, FallMeeting 2007, San Francisco Ca, 10–14 Dec, 2007, abstract#H11E-0824.
Rodriguez-Ojea A, Menendez R, Terry B et al. (1998) Low lev-els of urinary iodine excretion in schoolchildren of rural areasin Cuba. Eur J Clin Nutr 52(5):372–375.
Rodríguez R, Hernández G, González T, Cortes A (1997)Definición del flujo regional de agua subterránea, su poten-cialidad y uso en la zona de la Cd. De Aguascalientes, Ags.Technical Report inedit, IGF-UNAM, Mexico, DF.
Rodríguez R, Mejía JA, Berlín J, Armienta A, González T(2000) Estudio para la determinación del grado de alteraciónde la calidad del agua subterránea por compuestos orgáni-cos en Salamanca, Gto.. Technical Report inedit, CEASG,IGF-UNAM, Mexico, DF.
Rodríguez R, Ramos JA, Armienta MA (2004) Groundwaterarsenic variations: The role of local geology and rainfall.Appl Geochem 19:245–250.
Rodríguez R, Armienta MA, Morales P, Silva T, HernándezH (2006) Evaluación de Vulnerabilidad Acuífera delvalle de Irapuato Gto. Technical Report inedit, JAPAMI,CONCyTEG, IGF UNAM. Mexico, DF.
Romieu I, Lacasana M, McConnell R (1997) Lead exposure inLatin America and the Caribbean. Lead research group of thePan-American health organization. Environ Health Perspect105:398–405.
Rosas I, Belmont R, Armienta A, Baez A (1999) Arsenicconcentrations in water, soil, milk and forage in ComarcaLagunera, Mexico. Water, Air, Soil Pollut 112:133–149.
Ruiz J, Kesler S, Jones L (1985) Strontium isotope geochem-istry of fluorite mineralization associated with fluorine-rich
igneous rocks from The Sierra Occidental, Mexico; possibleexploration significance. Econo Geol 80:33–42.
Salas-Pereira MT, Beltrán-Aguilar ED, Chavarría P et al. (2008)Enamel fluorosis in 12- and 15-year-old school children inCosta Rica. Results of a national survey, 1999. CommunDent Health 25:178–184.
Sanchez-Garcia S, Pontigo-Loyola A, Heredia-Ponce E, Ugalde-Arellano J (2004) Fluorosis dental en adolescentes de trescomunidades del estado de Querétaro. Rev Mex Pediatr17:5–9.
Sanchez-Nazario EE, Mansilla-Rivera I, Derieux-Cortes JC et al.(2003) The association of lead-contaminated house dust andblood lead levels of children living on a former landfill inPuerto Rico. P R Health Sci 22:153–159.
Segovia N, Armienta MA, Valdes C et al. (2003) Volcanic moni-toring for radon and chemical species in the soil and in springwater samples. Radiat Meas 36:379–383.
Segovia N, Gaso MI, Armienta MA (2007) Environmentalradon studies in Mexico. Environ Geochem Health 29:143–153.
Segovia N, Mena M, Peña P, et al. (1999) Soil radon time series:Surveys in seismic and volcanic areas. Radiat Meas 31:307–312.
Segovia N, Peña P, Valdes C, et al. (2005) Radon, water chem-istry and pollution check by volatile organic compounds insprings around Popocatepetl volcano, Mexico. Ann Geophys48:85–91.
Simons SF, Mapes-Vazquez VE (1956) Geology and oredeposits of the Zimapán mining district, State of Hidalgo,Mexico. US Geological Survey Professional Paper 284,Washington, DC.
Singh SK, Mortera F (1991) Source time functions of largeMexican subduction earthquakes, morphology of the BenioffZone, age of the plate, and their tectonic implications. JGeophys Res 96:21487–21502.
Soto-Rojas AE, Ureña-Cirett JL, Martínez-Mier EA (2004) Areview of the prevalence of dental fluorosis in Mexico. RevPanam Salud Publ 15:9–18.
SSA (2003) Mortalidad observada por cáncer pulmonar segúnsexo y entidad federativa. Reporte Interno. DirecciónGeneral de Epidemiología. Secretaría de Salud. Mexico.Mexico, DF.
SSP (2009) http://proteccioncivil.guanajuato.gob.mx/atlas/ sani-tario/acambaro.php. Accessed 15 March 2009.
Strock C, Songer A, Fiori Ch (2008) Appropriate technologiesfor sustainable access to safe drinking water: A case studyin Belize. Proceedings Construction in Developing CountriesInternational Symposium, Trinidad & Tobago, WI, Trinidadand Tobago.
Toujague RT, Leonarte A, Reyes Verdecia BL, Miravet RM(2003) Arsénico y metales pesados en aguas del área Delita,Isla de la Juventud. Ciencias de la Tierra y el Espacio, Cuba4:5–8.
Trejo-Vázquez R, Bonilla-Petriciolet A (2002) Cuantificaciónde arsénico en el agua subterránea de la ciudad deAguascalientes, Mexico, y evaluación de riesgos entre lapoblación. Rev Ing Hidraul Mex 17:79–88.
UNSCEAR (2000) United Nations Scientific Committee on theEffects of Atomic Radiation, Sources and effects of ioniz-ing radiation. Annex A and B, United Nations, E.00.IX.3,New York.

78 M.A. Armienta et al.
USACE (2004) Water resources assessment of Dominica,Antigua, Barbuda, St. Kitts and Nevis. US Army Corps ofEngineers Report.
USFDA (2003) Oral health care drug products for over thecounter human use. 21 CFR Part 356. Department of Healthand Human Services, Food and Drug Administration.
Valenzuela OL, Germolec DR, Borja-Aburto VH et al. (2007)Chronic arsenic exposure increases TGFalpha concentrationin bladder urothelial cells of Mexican populations envi-ronmentally exposed to inorganic arsenic. Toxicol ApplPharmacol 222:264–270.
Vallejo-Sanchez A, Perez-Olivares S, Casanova-Rosales A,Gutierrez Salazar M (1998) Prevalencia, severidad de flu-orosis y caries dental en una población escolar de 6 a 12años de edad en la Cd. De Campeche, 1997–98. Rev ADM55:266–271.
Vignarajah S (1993) Dental caries experience and enamel opac-ities in children residing in urban and rural areas of Antigua
with different levels of natural fluoride in drinking water.Commun Dent Health 10:159–166.
Wyatt, CJ, Fimbres C, Romo L et al. (1998a) Incidence of heavymetal contamination in water supplies in Northern Mexico.Environ Res A 76:114–119.
Wyatt CJ, Lopez Quiroga V, Olivas-Acosta RT, Méndez RO(1998b) Excretion of arsenic (As) in urine of children, 7–11 years, exposed to elevated levels of as in the city watersupply in Hermosillo, Sonora, Mexico. Environ Res A 78:19–24.
Yáñez L, García-Nieto E, Rojas E et al. (2003) DNA damagein blood cells from children exposed to arsenic and lead in amining area. Environ Res 93:231–240.
Zhu XR, Prospero JM, Millero FJ (1997) Diel variability ofsoluble Fe (II) and soluble total Fe in North African dustin the trade winds at Barbados. J Geophys Res 102(D17):21297–21305.

Medical Geology Studies in South America
Bernardino R. Figueiredo, Marta I. Litter, Cássio R. Silva, Nelly Mañay,Sandra C. Londono, Ana Maria Rojas, Cristina Garzón, Tommaso Tosiani,Gabriela M. Di Giulio, Eduardo M. De Capitani, José Ângelo S. A. Dos Anjos,Rômulo S. Angélica, Maria Celeste Morita, Mônica M.B. Paoliello, Fernanda G. Cunha,Alice M. Sakuma, and Otávio A. Licht
Abstract “Earth and Health” or medical geology hasbeen promoted worldwide as one of the fundamentalthemes of the International Year of Planet Earth (2007–2009). This was in response to relevant achievementsnoted in this new field of applied science from the timeof the IGCP 454 project which led to foundation of theInternational Medical Geology Association (IMGA)in 2004. In association with international movements,several academic, professional, and student groups inSouth America began to study medical geology whichstarted with scientific meetings held in Chile, Brazil,and Uruguay in 2002 and 2003. In this chapter, anattempt is made to describe South American scien-tists’ relevant contributions to various subjects such asarsenic, lead, mercury, and selenium as well as fluorineand environmental problems affecting different partsof the continent. Some societal issues arising frommedical geology studies are also highlighted from thepoint of view of the international risk communica-tion and risk governance debate and the pioneeringethnographic descriptions of geophagy in the Andeanand Amazonian countries. Finally, some ongoing med-ical geology projects in South America are identi-fied as inspiring initiatives that may encourage futureeducational and research activities in this sciencefield.
Keywords South America · Brazil · Colombia ·Uruguay · Argentina · Metals · Arsenic · Lead ·Selenium · Mercury · Risk communication · Geophagy
B.R. Figueiredo (�)Institute of Geosciences, University of Campinas, Campinas,São Paulo, Brazile-mail: [email protected]
Historical Background and Scopeof Medical Geology Studies
Medical geology has been recognized worldwide as apromising scientific field in which geosciences, envi-ronmental medicine, and other disciplines contributetogether in attempting to test relationships betweennatural geological factors and the health of humans andof other living beings. Not coincidently, medical geol-ogy was included as one of the ten main themes of theInternational Year of Planet Earth under the title “Earthand Health – for a safer environment.” Under the coor-dination of IUGS and UNESCO, the International Yearwas conceived to show the general public how earthsciences are contributing to society’s well-being bymaking the world safer and healthier. Many initiativesand an extraordinary number of scientific activitieswere undertaken in the current decade to disseminateconcepts and methods adapted to this new area ofapplied science. In South America the first short courseon medical geology was held in Santiago in 2002 fol-lowed by the first workshops dedicated to the subjectin Brazil, Uruguay, and Argentina from 2003 to 2007.Since then, South American professionals have madea modest but significant scientific contribution to thisfield. As an example, the first book on medical geol-ogy (in Portuguese) was published in 2006, only a yearafter “Essentials of Medical Geology” (Selinus et al.,2005) appeared. It is well known that other textbooksand an impressive number of papers were published inall continents during this period, showing that medicalgeology is already a consolidated international science.
Taking this historical background into account, itis easy to see that everything has happened veryquickly for medical geology all around the world.
79O. Selinus et al. (eds.), Medical Geology, International Year of Planet Earth,DOI 10.1007/978-90-481-3430-4_4, © Springer Science+Business Media B.V. 2010

80 B.R. Figueiredo et al.
South America is not an exception in this regard and,as in other parts of world, compiling medical geologyaccomplishments in the continent is not an easy task.
This chapter presents the first attempt to reportrecent and ongoing medical geology studies in SouthAmerica and is far from being complete and shouldtherefore be regarded as a partial inventory. Its aim isto motivate reflection among academics, professionals,and students on what is going on in some coun-tries. The present monograph may stimulate updatingefforts in the near future and hopefully it will inspireother researchers to further pursue the scientific linesdescribed here. In South America there are around400 million people interested in how medical geologycan contribute to improve their standard of living with-out compromising the environment and save resourcesby pointing out the beneficial properties of rocksand minerals; by preventing adverse health effects forhumans, animals, and plants; and by protecting thosein need of more protection.
The presence of metals and other substances inSouth America is addressed and available informationon human exposure and health effects is provided inthis chapter. Additionally, some societal issues aris-ing from medical geology studies are also highlightedfrom the point of view of the international debateon risk governance as well as from the pioneeringethnographic descriptions of geophagy in the Andeanand Amazonian countries. Finally, some ongoing med-ical geology projects in South America are identi-fied as inspiring initiatives that may encourage futureeducational and research activities in this sciencefield.
In the following sections, the distribution of arsenic,lead, and mercury in South America is identifiedaccording to recently published reports. For a longtime these substances have been considered the mostdangerous toxic substances for humans (ATSDR –CERCLA, 2003). They are widely dispersed in theenvironment and may be as much a threat to humanhealth as some agrochemicals and radioactive sub-stances. These reported case studies were carried outin Argentina, Chile, Brazil, and Uruguay.
Arsenic in South America
Water contamination from arsenic is a worldwide prob-lem when considering the number of regions wherearsenic-contaminated surface water and groundwater
are being consumed by the people. This problemis estimated to affect more than 100 million peopleworldwide.
Long-term ingestion of water with high concentra-tions of arsenic can lead to a disease known as chronicendemic regional hydro-arsenicism, highly prevalentin Asia and Latin America. Keratosis, hyperkeratosis,damage to the central nervous system and lever, loss ofhair, incidence of different types of cancer such as skincancer and cancer of internal organs (lung, kidney, andbladder) are epidemiological evidence of exposure toinorganic arsenic. There is not yet a medical treatmentfor hydro-arsenicism; hence, prevention and attenua-tion of human exposure to arsenic is the only way tosolve the problem.
The presence of arsenic in water and soil comesfrom anthropogenic causes (mining, metal smeltingand refining, use of pesticides, etc.) as well as natu-ral processes. Arsenic can be mobilized from rocks andsoils toward water bodies through biogeochemical pro-cesses, changes in pH, volcanism, and microbiologicalaction (Mansilla and Cornejo, 2002).
The World Health Organization recommends thelimit of 10 μg/L As for drinking water (WHO, 2004).Considering this limit, around 14 million people inLatin America are exposed to prolonged consump-tion of arsenic-contaminated water and threatened byserious health problems. Potentially dangerous situa-tions in South America have been known for decades,especially in Argentina, Chile, and Peru. However,governmental intervention intended to solve this prob-lem has not been effective and does not exist in manyisolated regions where communities do not have accessto pre-treated potable water.
The most critical areas of Latin America concerningarsenic contamination of surface water and ground-water are depicted in Fig. 1. Estimated populationexposure for different countries in relation to the for-mer limit of 50 μg/L As in drinking water is quoted,according to Bundschuh et al. (2008a) and Bundschuhet al. (2008b). In these countries arsenic is foundmainly in groundwater as geogenic arsenic associatedwith Andean volcanism.
Considering a maximum limit of 50 μg/L As indrinking water, the exposed population in Mexico,Argentina, and Chile in relation to the total populationis estimated to be 0.4, 3.0–5.1, and 3.1%, respec-tively. Only recently in Argentina a new regulationwas introduced lowering the maximum arsenic con-tent in drinking water to 10 μg/L (Argentina, 2007)in accordance to WHO regulations.

Medical Geology Studies in South America 81
Fig. 1 Areas with high arsenic contents in surface water andgroundwater in Latin America. 1 South Baja California, 2–9Mexico, 10 Guerrero, 11–19 Central America, Mexico, 20–24
Bolivia, 25 Peru, 26 Atacama, Chile, 27–31 Argentina (Modifiedfrom Bundschuh et al., 2008a, b)
Argentina
In Argentina, the highest arsenic contents in ground-water are found in the Chacopampean plain, Puna, andCuyo. However, the Patagonia region still needs tobe studied in more detail. Updated information aboutthese regions is presented below.
Chacopampean Plain
This is the largest and most populated geographicregion in Argentina, covering more than 1 millionsquare kilometers. Comprehensive information about
arsenic sources, mobility, and concentration factorsin shallow aquifers is not available due to the vastsize of the area. However, a number of local stud-ies point to several risk zones located in the north ofLa Pampa province, south and southeast of Cordobaprovince, Buenos Aires province, Santa Fe province,Santiago del Estero, Chaco and Salta provinces, andin the eastern portion of Tucumán province. A totalpopulation of 2 million people is estimated to be atrisk of hydro-arsenicism. Besuschio et al. (1980) andHopenhayn-Rich et al. (1996) have described sev-eral arsenic-related health problems affecting peoplein some parts of this region and drawn attention to anincreasing prevalence of certain types of skin, bladder,digestive tract, and lung neoplasm.

82 B.R. Figueiredo et al.
Groundwater composition in the central north andsoutheast of La Pampa province varies. Arseniccontents range from less than 4 to 5,300 μg/L, and 99%of water samples exceed the reference value of 10 μg/L(Nicolli et al., 1997; Smedley et al., 1998, 2002,2006).
For most sites located in southern Cordobaprovince, arsenic contents in groundwater fall in thenarrow interval of 0–100 μg/L mainly consisting ofAs (V); however, at Alejo Ledesma groundwater wasfound to contain up to 300 μg/L As. In the province’ssoutheast plain, arsenic contents in groundwater varyfrom less than 10 to 3,810 μg/L with 46% of sam-ples in the interval 100–316 μg/L (Nicolli et al., 1989).The highest anomalies were found in the San Justo,Marcos Juárez, Unión, Río Cuarto, Río Primero, andGeneral San Martín departments where arsenic con-tents in groundwater range from 10 to 4,550 μg/L(Nicolli et al., 1985, 1989; Pinedo and Zigarán, 1998;Pérez Carrera et al., 2005).
Arsenic in water in Buenos Aires province is par-ticularly but not exclusively related to the Pampeanaquifer beneath a large area of the Pampean Plain. Thisaquifer is the major groundwater source for the wholeregion (south of the Santa Fe province: 0.13 mg/L As;Atlantic coast: 0.1–0.3 mg/L As; La Pampa province:0.04–0.5 mg/L As). Fortunately, the northern partof Buenos Aires province is served by the Puelcheaquifer with better water quality (As < 0.01 mg/L; F< 1.5 mg/L), although excess of nitrate may occasion-ally be caused by domestic sewers, waste disposal, oragrochemicals.
This Puelche aquifer in the western region of SantaFe Province contains high-saline water, inappropri-ate for consumption. In the shallows, which containbicarbonate-sodic water, arsenic is present at high con-centrations, up to 0.78 mg/L As, along with somefluorine content (Nicolli et al., 2007a).
In Santiago del Estero province, Bhattacharya et al.(2006) determined that groundwater originated from ashallow aquifer, 12 m deep, had a mean arsenic con-tent of 53 μg/L, and a maximum value of 14,969 μg/LAs. The authors found that As (III) content in thewater was 1.9–45% of total arsenic with an average of125 μg/L As. Some phenomena such as mobilizationof organic matter by excessive irrigation may alter thelocal physical–chemical conditions, facilitating arsenicmobility in the area.
In the Chaco province, people are affected byendemic hydro-arsenicism caused by ingestion of
drinking water with high As content, with casesdescribed as depending on genetic factors andexposure length. Specific damage was identified inpatients from Resistencia, Roque Sáenz Peña, SantaSylvina, Santa Iglesia, Charata, and other places (WebOdontológica, 2007). Water with high arsenic content(0.01–0.8 μg/L), mainly As (V), and high fluorine con-tent led to a risk of hydro-arsenicism along with dentaland skeletal fluorosis among rural and urban popu-lations from Comandante Fernández, Independencia,Quitilipi, Maipú, Almirante Brown, General Belgrano,9 de Julio, 25 de Mayo, 12 de Octubre, MayorJ. Fontana, and San Lorenzo (Osicka et al., 2007).According to Concha et al. (1998), in Taco Pozo,some individuals with 9.1 and 11 μg/L As detected inblood presented hydro-arsenicism from consumptionof water with 200 μg/L As.
Groundwater from the Salí River basin is the mostimportant arsenic reservoir in the eastern part of theTucumán province, as identified by Nicolli et al.(1989), Smedley et al. (2002), and Tineo et al. (1998).Positive correlations between arsenic, fluorine, andvanadium contents in water were identified by Nicolliet al. (2001a). Arsenic and related elements (F, B, andother elements) are present in rather high amounts inquaternary loess deposit volcanic materials. High pHvalues (up to 9.24) in groundwater favor dissolutionof volcanic glass and leaching of pyroclastic rocks,as stated by Nicolli et al. (1989). As (V) was shownto be the dominant species by Nicolli et al. (2007b),who noted as well an increase of the arsenic contentpredominantly in shallow waters caused by desorptionphenomena. Similar arsenic concentrations were alsofound in this part of Tucumán province in the smallbasin of Burruyacú as identified by Nicolli et al. (2001,2006).
Puna Province
The geological province of Puna, at the southernpart of the Bolivian and Peruvian Altiplano, entersArgentinean territory from the Bolivia border (21◦45′)down to San Buenaventura Cordillera (26◦15′). PunaAlto has median altitudes exceeding 3,500 m above sealevel. Prevalence of arid climate, oxidizing conditions,and high water salinity yield anomalous concentrationsof certain anions such as arsenic complexes and fluo-ride in water. In the Pompeya and Antuco spring fields,elevated As contents were found in thermal water.Elevated arsenic concentrations in water from La Puna

Medical Geology Studies in South America 83
Fig. 2 Geographic map ofnorthern Chile (Modified fromBundschuh et al., 2008b)
region were found by Farías et al. (2006). The high-est As content in drinking water (up to 2,030 μg/L)was found in the locality called San Antonio de losCobres.
Cuyo Region
Studies carried out in the southeastern part of the SanJuan Province by Gómez et al. (2004) showed Asconcentrations greater than 150 μg/L in groundwaterconsumed by the 1000 rural and urban inhabitants ofEl Encón. In the study, arsenic contents in biologicalsamples (hair, nail, and urine) and food samples wereanalyzed.
In the Mendoza province, elevated arsenic levels inwater were found in the northern district of Lavalle.In the province of San Luis, arsenic contents in waterexceeding 50 μg/L were recorded in the districts ofCoronel Pringles, General Pedernera, and GobernadorDupuy. In the Buena Esperanza district, arsenic con-tents ranging from 43 to 170 μg/L were found in waterfrom 13 wells and from 90 to 97 μg/L As in treatedwater (González et al., 2003, 2004).
In the Patagonia region, data are scarce up to thepresent. Sandali and Diez (2004) monitored arsenicin drinking water from 27 localities in the Chubutprovince. In 25 of them, arsenic concentrations werebelow 20 μg/L, whereas contents of 30 and 50 μg/Lwere found at Garayalde and Camarones, respectively.Additional studies are needed in the region because thegeological context suggests that higher As concentra-tions in water are to be expected.
Chile
In Chile, arsenic-related problems have been solvedfor most parts of the country but the arsenic lev-els found in drinking water in the north are still ofgreat concern. This region is located between paral-lels 17◦30′ and 28◦30′S (Fig. 2), 250,000 km2 in themiddle of the Atacama Desert and extending fromArica to Antofagasta cities. In this region where 420volcanoes can be seen, some still active, 35,000 km2
is made up of quaternary rocks (Cabello et al.,2007).
Total arsenic contents are very high in Chilean watersources such as rivers, springs, and brines, exceedingnational and international standards by as much as 6–300 times. In some places, communities are at this verymoment consuming water with As contents above thelimit of 10 μg/L established by Chilean Regulation409/1 in 2005 (Chile, 2005). These communities livein the middle of the largest desert in the world, whereprecipitation is zero and water is scarce. Surface waterin this zone may contain 1,000–5,100 μg/L As andarsenic can also be found in bedrock, soil, and plantson riverbanks.
Arica and Parinacota Region
People from the rural zone of Arica have beenaffected by hydro-arsenicism for more than 4,500 years(Mansilla et al., 2003; Cornejo et al., 2006). Arsenicis derived from natural processes related to volcanic

84 B.R. Figueiredo et al.
activity in Andean Cordillera. In Arica Province,arsenic is very common in water, soil and plants orig-inating from minerals, and rocks transported fromCordilleran peaks by drainage.
Lluta and Azapa are two alluvium valleys thatare very important for agriculture in the Arica andParinacota region. The Lluta Valley is located only10 km from the Peruvian border. This valley is formedby the 150 km long Lluta River that extends from theTacora volcano to the sea, carrying water with around200 μg/L As. In the Azapa Valley, only low arsenicconcentrations in water have been observed (Cabelloet al., 2007).
The 4,500-ha Camarones Valley is located 100 kmsouth of Arica city and is crossed by the CamaronesRiver, historically the most important water source inthe region (Cornejo et al., 2006). Small local communi-ties such as Esquiña, Illapata, Camarones, Taltape, andHuancarane with around 60 inhabitants each (Mansillaand Cornejo, 2002) were shown to be exposed toarsenic through water consumption in several differentways. People at Esquiña consume low-arsenic waterfrom springs (Yañez et al., 2005) while people fromthe other communities are consuming surface waterwith high arsenic contents, in some cases greater than1 mg/L As (Lara et al., 2006).
Antofagasta Region
Antofagasta is known as the mining capital of Chileand is one of the most important copper producers inthe world. The region is extremely arid and Andeanvolcanism has been particularly intense consideringthe frequent volcanic eruptions and the number of gey-sers and thermal springs. The waters in the regionaltered by these phenomena have variable chemicalcompositions. Surface water originating in the AndeanPrecordillera is the main water source for human con-sumption and irrigation for around 3,000 people.
The Antofagasta Rivers are different in size andpresent variable arsenic concentrations in water rang-ing from 10 to 3,000 μg/L (Queirolo et al., 2000). Inthe Loa province (22◦12′ to 23◦45′S; 68◦20′W), how-ever, high arsenic concentrations (100–1,900 μg/L)were found in water used in the area for human con-sumption and irrigation. In some rivers very higharsenic concentrations in excess of 3,000 μg/L werefound by Oyarzun et al. (2004).
The Elqui Valley in the Coquimbo Region
This 9,800 km2 valley is also located in northern Chile.The river originates in the Andean peaks and in itscourse drains important hydrothermal alteration zonesand epithermal ore deposits that contain copper, gold,and arsenic in the context of the famous El Indiomineral district. According to several recent studies(Oyarzun et al., 2004), river sediments and ancient lakesediments in the area are highly enriched with arsenicthat comes not only from modern mining activity butmainly from long-term erosion processes that affectednatural deposits of arsenic-bearing minerals and ores.
Brazil
Integrated studies on environmental and anthropogenicarsenic contamination have been carried out in onlythree areas of Brazil as seen in Fig. 3. They are (1) theIron Quadrangle in the state of Minas Gerais, wherelarge amounts of As have been released into drainage,soil, and the atmosphere as a result of gold mining overthe last 300 years; (2) the Ribeira Valley, where As wasdispersed as a byproduct of Pb–Zn mining over the lastcentury and also as a result of weathering of naturalAu-sulfide deposits located downstream from the min-ing area; (3) the Santana district in the Amazon regionwhere As occurs in association with manganese oreprocessed locally in the last 50 years. To date, Brazilhas had no reports of diffuse pollution sources (geo-logical formations, rivers, and aquifers which extendacross the region) such as those described in Argentinaand Chile.
The Iron Quadrangle
The Iron Quadrangle (in the state of Minas Gerais)has been the most famous gold-producing area inBrazil since colonial times. Arsenopyrite is commonlyassociated with gold ores hosted in metamorphosedbanded iron formations, schist, meta-basalts, and sed-imentary rocks. These terrains of the Archean andPaleoproterozoic ages are an important geochemi-cal As anomaly in the southern portion of the SanFrancisco craton. During the last 300 years, most ofthe As-rich waste has been discarded into drainage or

Medical Geology Studies in South America 85
Fig. 3 Contaminated areas ofarsenic in Brazil withgeologic-tectonic unitsindicated (After Figueiredoet al., 2007)
stored in tailing piles along river banks and until theseventies was also used for arsenic oxide production.Oliveira et al. (1979), Deschamps et al. (2002), andDeschamps and Mello (2007) have shown that soilsaround Iron Quadrangle gold deposits are enrichedwith As. The release of natural As originating fromthe oxidation of arsenopyrite into water was exam-ined in situ by Borba and Figueiredo (2004) in severalunderground mines.
As previously mentioned, there is significantanthropogenic contribution to As pollution in the IronQuadrangle. Arsenic contents in stream sediments(<63 μm) are at very high levels throughout the entireregion and concentrations up to 4,000 mg/kg are com-mon. On the other hand, high arsenic contents of upto 350 μg/L in surface water were only found nearmines and tailing piles whereas exceptionally high Ascontents of up to 2,980 μg/L were observed for runoffwater from some old gold mines in the region (Borbaet al., 2003). In general, arsenic contents in surfacewater rarely exceeded the threshold of 50 μg/L estab-lished by former Brazilian regulations for non-treatedwater. Low As values, rarely exceeding the limit of10 μg/L, were also found in spring water and tapwater.
In 1998, human screening was carried out amongschool children (7–12 years) in two municipalitiesin the Iron Quadrangle which used arsenic contentin urine as a bioindicator (Matschullat et al., 2000).The mean value of inorganic As content in urine fora population sample of 126 children was 25.7 μg/Lwith 20% of samples above 40 μg/L As, for whichadverse health effects cannot be excluded on a long-term basis. The probable route of exposure was contactwith contaminated soil and dust since As content in thedomestic water supply did not exceed 10 μg/L. Duringthe following monitoring campaigns the percentageof individuals in this class (>40 μg/L As) decreasedconsistently down to 3% in 2003 (Couto et al., 2007).
The Ribeira Valley
The Ribeira Valley is located in the southeastern regionof Brazil (Fig. 3) extending for about 500 km interritories of the states of Parana and São Paulo.
Lead and arsenic contamination in the Ribeira Riveras a result of Pb–Zn ore production and smeltingoperations in the Upper Valley during the last cen-tury has long been demonstrated. In addition, in the

86 B.R. Figueiredo et al.
Fig. 4 Lead-contaminated site at La Teja in Montevideo, Uruguay
Middle Valley, a number of noneconomic gold-sulfidedeposits occur, forming a northeasterly geochemicalanomaly, locally known as the Piririca belt (CPRM,1982; Perrota, 1996). Most of Pb–Zn ore in the UpperValley originated from lode ore deposits found in meta-morphosed carbonate rocks and schist whereas thePiririca gold deposits are associated with metapelitesand basic intrusions.
In the period 1999–2003, human exposure to arsenicwas evaluated for the populations of all municipali-ties affected by mining and metal refining activities inthe Upper Ribeira Valley and also for several residentcommunities in the Middle Valley (De Capitani et al.,2006). The population of Cerro Azul village, whichis located far from the mining district, was chosenas a reference group. Different communities’ arseniccontents in urine as a bioindicator of recent humanexposure are shown in Table 1.
As expected, the lowest values were obtained incontrol area Cerro Azul (3.60 μg/L for children, n= 73; 3.87 μg/L for adults, n = 83). The highestAs contents in urine for the Upper Valley were foundin Serra district, municipality of Iporanga (8.94 μg/Lfor children, n = 89; 8.54 μg/L for adults, n = 86).The difference in As levels between these groups wasproven to be statistically significant, a finding that
Table 1 Arsenic contents in urine from various communities(children and adults) of Ribeira Valley, Brazil
Locality No. of samples Mean (μg/L) Range
Cerro Azul 156 3.86 1–34.12Serra district 175 8.90 1–62.54Iporanga town 112 8.14 1–33.49Pilões 49 4.63 1–68.92Castelhanos 54 9.48 1–60.32São Pedro 51 11.35 1–76.19Ivaporunduva 30 10.02 1–34.57Maria Rosa 26 2.24 1–24.34Nhungara 22 6.98 1–36.55
Source: Sakuma (2004) and De Capitani et al. (2006)
may be explained by the fact that the population ofthe Serra district is exposed to an environment thathas been affected by Pb–Zn–Ag mines located in thevicinity.
In the Middle Valley, weathering of mineralizedrocks gave rise to soils with high arsenic contents ofup to 764 mg/kg As (Abreu and Figueiredo, 2004). Inthis area, stream sediments with as much as 355 mg/kgAs (Toujague, 1999) can be found in contrast withlow arsenic concentrations in surface water that do notexceed 10 μg/L according to Takamori and Figueiredo(2002).

Medical Geology Studies in South America 87
Arsenic contents in urine were also low for thisarea (Table 1). However, the communities with high-est As levels in urine are those living near Piririca belt.The difference between As levels in urine obtained atthe Castelhanos, Ivaporunduva, and São Pedro local-ities and that from the control area in Cerro Azulis statistically significant and indicates that the qual-ity of the environment is an important determiningfactor for human As exposure level. For Castelhanosand São Pedro only 3.4 and 11.8% of urine samplesyielded arsenic concentrations greater than 40 μg/L,respectively (De Capitani et al., 2006).
The Santana District
The Santana district is located on the margin ofAmazon River, in the state of Amapa. Arsenic dis-persion originated from beneficiation of arsenopyrite-bearing manganese ore of the Precambrian Serra doNavio deposit that has been mined for more than 50years. At Santana wastes contain up to 1,700 mg/kgAs and some wells close to the facility were shownto contain extremely high As contents, as much as2,000 μg/L.
Several studies were carried out in the area whenarsenic hazards were revealed and these included sur-face and groundwater, stream sediment, soil, ore, andwaste (Lima, 2003; Santos et al., 2003). Arsenic con-centration in surface water was found to range from 5to 231 μg/L, but most of the As values fell below 50 oreven below 10 μg/L and they did not exceed 0.5 μg/Lin residential tap water. Stream sediments and sus-pended particulate were particularly rich for arsenic,yielding maximum values of 1,600 and 696 mg/kg As,respectively.
Arsenic content in hair was determined in a sam-pling population of 512 people of a total population ofaround 2,000 residents at Santana. According to Santoset al. (2003), As mean value in hair was 0.2 μg/gwith maximum concentrations lower than 2 μg/g As.According to Choucair and Ajax (1988) and Franzblauand Lilis (1989), As concentrations in hair and nailsof 1 μg/g or less should be considered to be normal,which was also defined by ATSDR (2000).
These results suggest low human exposure toarsenic at Santana, which is rather consistent withingestion of low-arsenic drinking water and with
restricted contact of humans with poisoned soil andsediments.
These recurrent observations of low exposure lev-els for arsenic and low arsenic contents in naturalwater in different places in Brazil were interpreted byFigueiredo et al. (2007) in terms of relative immobilityof arsenic in soil and derived sediments under the influ-ence of strong, chemical weathering processes of tropi-cal and sub-tropical regions. In addition, they observedthat the communities investigated were less dependenton groundwater consumption and mostly made domes-tic use of treated surface water. Nevertheless, periodichealth monitoring of these communities and periodicassessment of the environment were recommended toassure that the risk remains under control.
Additional Arsenic Cases in Brazil
Other point-source contaminated areas for arsenic areknown in Brazil. Also related to gold mining, arsenicoccurs in several places such as northern Bahia, Goiás,and northern Minas Gerais states, but no human mon-itoring has been reported for these places. Coal for-mations in southern Brazil are known to contain sig-nificant concentrations of sulfur and arsenic. A verypreliminary hydrogeochemical study carried out in 21wells yielded very low arsenic contents in groundwa-ter from the Rio Bonito aquifer in the state of Paraná.This aquifer is located in coal-bearing formations thatextend southward to the states of Santa Catarina andRio Grande do Sul.
In Brazil 50% of municipalities are known to havesome degree of dependence on groundwater usage foragriculture, industry, and domestic use. However, ana-lytical data for arsenic are still very scarce for ground-water in Brazil. To date the arsenic content of majorBrazilian aquifers remains unknown and any probablenon-point-source contaminated areas for arsenic suchas those previously identified in Argentina and Chilehave never been revealed in Brazil.
Lead in South America
Lead has long been listed among the three mosthazardous metals worldwide. Beyond recycled lead,which accounts for 50% of consumption, a significant

88 B.R. Figueiredo et al.
amount of lead, around 3.4 million tons (estimation for2006 from the Mineral Commodity Summaries, USGeological Survey), is still being mined and releasedinto the environment as metallic lead and chemicalcompounds. Lead is used in the manufacture of auto-mobile and industrial batteries (70%), paint pigment(12%), alloys, welding, gasoline additives, and pesti-cides as well as being part of domestic and industrialwaste.
Chronic or acute exposure to lead can affect thehuman central nervous system and may cause sev-eral adverse effects on human health, e.g., anemia,gastric irritation, kidney, liver, and heart dysfunctions,and brain damage and mental retardation, especiallyamong children. Since the main human intoxicationroute is through contact with polluted soil and dust,small children are the most exposed population group.Nevertheless, exposure of workers in mines, smelt-ing plants, and other workplaces and contaminationby inhalation of gases or aerosols or ingestion of leadenriched food should also be considered.
Average concentrations of lead in the Earth’s crustand soils are in the range of 5–20 ppm according todata compiled by Smith and Huyck (1999). Accordingto Brazilian regulations, lead concentrations may notexceed 10 μg/L in surface water (CONAMA, 2005).Intervention values of 350 μg/g Pb and 200 μg/g Pbfor soil in residential and agriculture areas, respec-tively, are defended by CETESB (2005). In relation toair quality, the upper limit of 1.5 μg/m3 Pb has beenestablished by USEPA.
Lead-contaminated sites and regions are knownin a number of South American countries. In 2007the Blacksmith Institute (Green Cross of Switzerland)included the La Oroya Pb-mine in Peru in the listof the ten most contaminated areas in the world.However, integrated environmental–human exposurestudies have so far been carried out in few areas.
Uruguay
Major sources of lead contamination in Uruguay aresimilar to those in other developing countries: metal-lurgical industries, lead-acid battery processing, leadwire and pipe factories, metal foundries, metal recy-clers, leaded gasoline (phased out in December 2003in Uruguay), lead water pipes in old houses, scrapand smelter solid wastes, and others. Non-occupational
lead exposure usually results from living in or nearcurrent or former manufacturing areas or improperhandling of lead-containing materials or solid wastes(a particularly important health risk for children).
Lead Contamination in Montevideo (La Teja)
The case of the neighborhood of La Teja, inMontevideo, Uruguay, arose in 2001 (Fig. 4). There,several families were exposed to lead from foundriesof metallurgical companies that had shuttered in thelast decades for economic reasons. The worst situa-tion was identified in the slum settlements of La Tejaand other areas where more than 3,000 μg/g Pb insoil was found (Mañay et al., 2003, 2008). In responseto the strong mobilization of La Teja communitydemanding solutions, the Health Ministry establishedan interinstitutional and multidisciplinary committeeto handle the situation. This committee included del-egates from health, environmental, labor, education,and social security institutions as well as communityorganizations. The University of the Republic was par-tially responsible for technical support and for carryingout an ambitious human monitoring program for leadthat has made more than 14,000 blood tests for leadavailable to date.
According to Alvarez et al. (2003a), the ToxicologyDepartment of the Faculty of Chemistry performed10,131 lead analyses on blood samples as a communityand advisory service during the years 2001 and 2002.These samples were collected from 5,848 children and1,268 adults; for 3,015 samples age was not speci-fied. The analytical results are presented in Table 2.The average BLL found for children was 12.3 μg/dLand 60% of the values exceeded the 10 μg/dL limit(CDC, 1991). Since 2001, children with BLL higherthan 20 μg/dL have received public health and/or
Table 2 Average blood lead levels (BLL) from three popula-tion groups in Uruguay
Children Adults
Knownexposedadults
BLL (μg/dL) 12.3 14.6 37.1Reference value (μg/dL) 10 25 30Percentage above reference
value>60 13 9
Source: Mañay et al. (2006) adapted from Alvarez et al. (2003a)

Medical Geology Studies in South America 89
medical assistance at the Chemical Pollutant MedicalCare Center of the Pereira Rossell Hospital consistingof supplementing iron intake and improved nutrition.Mothers were oriented toward hygiene and diet prac-tices and how to reduce lead absorption. Alvarez et al.(2003b) reported follow-up testing on 387 of thesechildren. The results of these tests statistically demon-strated that BLLs have significantly decreased with themedical interventions that have been adopted.
Also since 2001, soil samples from several slum set-tlements undergoing environmental intervention havebeen analyzed for lead by the city of Montevideoin coordination with the Ministerial Division ofEnvironment. The authors (IMM, 2003) attempted toassess possible sources of lead pollution and identi-fied the primary pollution sources as local smelters andmetallurgical factories, disposal of industrial wastesin landfills, battery recycling, burning wire for copperrecovery, and vehicular traffic emissions. They con-cluded that soil is the secondary major source of humanlead exposure but lead-based paint and lead residuesin water from lead pipelines were also recognized aspotential sources of lead exposure.
The high-quality data assembled on lead pollutionin Uruguay between 2001 and 2004 enabled effec-tive identification of lead pollution and facilitatedofficial intervention to prevent new pollution events.Nevertheless, full research studies must still be done,including both environmental monitoring of soil, air,and water as well as extensive screening of BLLdirected to some population groups. Future health andenvironmental actions are needed, not only to imple-ment remediation strategies in some regions, but alsoto assess other sources of lead hazards.
Lead from Gasoline in Uruguay
In 2004, after lead in gasoline had been finally phasedout, three population groups were sampled for the pur-pose of evaluating probable changes in blood leadlevels of Uruguayan populations in a 10-year period(1994–2004) considering the current actions to pre-vent lead exposure risks. Those groups were children(n = 180), non-occupationally exposed adults (n =708), and workers (n = 81). Besides blood lead level(BLL) correlation, variables such as age, sex, area ofresidence, environmental lead data, and others wereconsidered. Mañay et al. (2006) compared the results
with those from a similar screening study done 10years before to assess the current risk factors with astatistical approach.
In 2004 the BLL for children (5.7 μg/dL) andadults (5.5 μg/dL) were significantly lower than thoseobtained in 1994 (9.9 μg/dL and 9.1 μg/dL, respec-tively) with p < 0.001.
Spot samples of gasoline were also analyzed afterleaded gasoline was officially phased out in December2003 and during the following months. Lead con-centrations varied widely during 2004. Exposed gasstation workers showed no significant BLL differencesbetween 1994 and 2004 (49 and 42 μg/dL), althoughthey exceeded reference values.
These results indicate the necessity for Uruguayto implement a more complete official surveillancescreening program.
Brazil
Many areas in Brazil have been identified as being con-taminated by lead in previous studies in both urbanand rural areas. But integrated geochemical and humanexposure studies have only been reported for threeareas in Brazil: (i) Santo Amaro da Purificação in thestate of Bahia, which lies in the northeastern region;(ii) Adrianópolis in the state of Paraná, in the southernregion; and (iii) Bauru in the state of São Paulo, in thesoutheastern region.
Lead Contamination in Santo Amaro daPurificação
In the suburbs of this city (50,000 inhabitants), theruins of the Plumbum smelter that operated from 1960to 1993 can still be seen, surrounded by an extensivelead-contaminated area that was left behind (Fig. 5).The processed lead ore and concentrate were partiallyextracted from the Boquira mine, 700 km far fromSanto Amaro, as well as imported from other coun-tries. Dos Anjos (2003) reported contaminated soil inthe vicinity of the facility with high metal contents ofup to 8,200 μg/g Pb and 117 μg/g Cd.
An unfortunate situation well known in the city wasthat a large volume of slag and other harmful materi-als was donated by the company to pave the streets as

90 B.R. Figueiredo et al.
Fig. 5 Ruins of the Plumbum smelter plant in Santo Amaro da Purificação, state of Bahia, Brazil (location map of Todos os SantosBay and Salvador city)
well as to be used as landfill in the backyards of somehouses in past decades.
Several studies carried out since 1980 have shownelevated lead contents in surface water, edible mol-lusks, cattle, and greens. Because of the size of pop-ulation, the extension of lead and cadmium dispersionin the city, and the very high levels of human expo-sure at the time the facility was active, Santo Amaro isconsidered the most serious case of lead contaminationever described in Brazil.
Three human monitoring campaigns carried outamong children in the period 1980–1998 yielded themean BLL shown in Table 3. Regardless of samplepopulation size, the decreasing lead exposure levelsmay reflect the shutdown of the facility and the effectsof several environmental and sanitary actions imple-mented in the area since the results of initial studies inSanto Amaro were disclosed.
Table 3 Blood lead concentrations in children from SantoAmaro da Purificação, state of Bahia, Brazil
1980 1985 1998
Age 1–9 1–4 1–4N 555 53 47Mean BLL (μg/dL) 59.1 ± 25.0 36.9 ± 22.9 17.1 ± 7.3BLL > 20 μg/dL 32%
Source: Carvalho et al. (2003)
Lead Contamination in Adrianópolis
Adrianópolis is located in the state of Paraná and untilrecently was the most important site of lead–zinc min-ing in the Ribeira Valley, southeastern Brazil. Duringmuch of the last century, several mines were in pro-duction in the region leading to widespread metalcontamination in the Ribeira River basin, as identifiedin previous studies. More recently, additional geo-chemical and toxicological studies were carried outin the Upper Ribeira Valley and reported by Paolielloet al. (2002, 2003), Paoliello and De Capitani (2005),and Cunha et al. (2005). They clearly showed thatsites with the most impact were the villages VilaMota and Capelinha, in the vicinity of the Plumbumsmelter and the Panelas mine both located not far fromAdrianópolis center (Fig. 6). The Plumbum industrywas in production from 1945 to 1995 when it wasshut down probably for financial and technologicalreasons.
Among all screened groups, the highest meanblood lead levels among children were found inthese two villages and the results are shown inTable 4. Human monitoring among adults yieldedquite similar results with a mean BLL of 8.80 μg/dL(n = 101).
High lead concentrations in soil were found in thesurrounding industrial areas by Cunha et al. (2005)
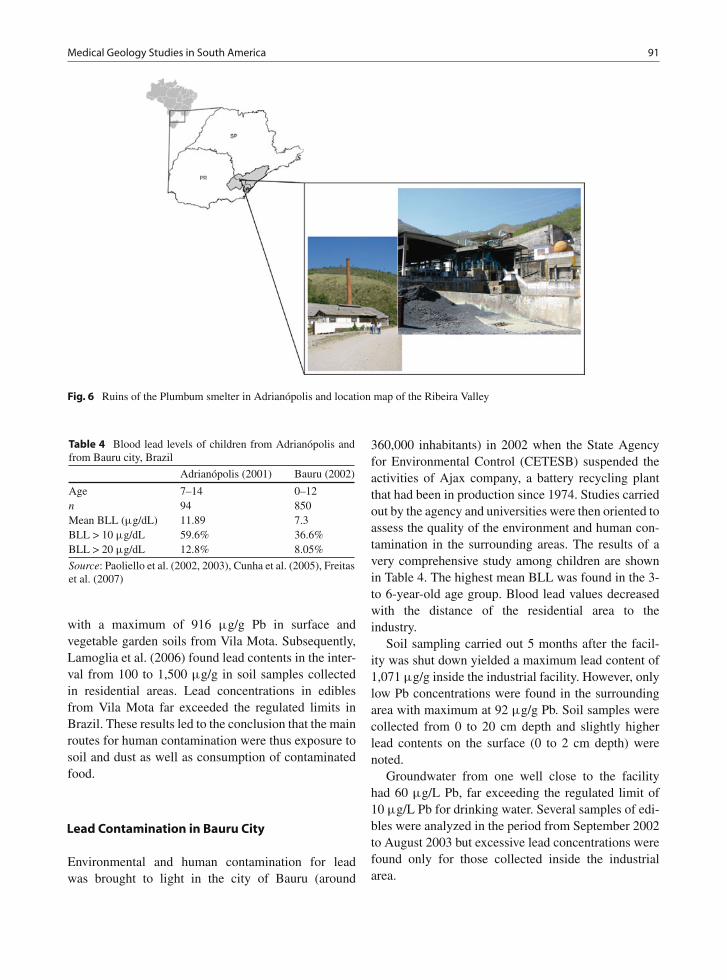
Medical Geology Studies in South America 91
Fig. 6 Ruins of the Plumbum smelter in Adrianópolis and location map of the Ribeira Valley
Table 4 Blood lead levels of children from Adrianópolis andfrom Bauru city, Brazil
Adrianópolis (2001) Bauru (2002)
Age 7–14 0–12n 94 850Mean BLL (μg/dL) 11.89 7.3BLL > 10 μg/dL 59.6% 36.6%BLL > 20 μg/dL 12.8% 8.05%
Source: Paoliello et al. (2002, 2003), Cunha et al. (2005), Freitaset al. (2007)
with a maximum of 916 μg/g Pb in surface andvegetable garden soils from Vila Mota. Subsequently,Lamoglia et al. (2006) found lead contents in the inter-val from 100 to 1,500 μg/g in soil samples collectedin residential areas. Lead concentrations in ediblesfrom Vila Mota far exceeded the regulated limits inBrazil. These results led to the conclusion that the mainroutes for human contamination were thus exposure tosoil and dust as well as consumption of contaminatedfood.
Lead Contamination in Bauru City
Environmental and human contamination for leadwas brought to light in the city of Bauru (around
360,000 inhabitants) in 2002 when the State Agencyfor Environmental Control (CETESB) suspended theactivities of Ajax company, a battery recycling plantthat had been in production since 1974. Studies carriedout by the agency and universities were then oriented toassess the quality of the environment and human con-tamination in the surrounding areas. The results of avery comprehensive study among children are shownin Table 4. The highest mean BLL was found in the 3-to 6-year-old age group. Blood lead values decreasedwith the distance of the residential area to theindustry.
Soil sampling carried out 5 months after the facil-ity was shut down yielded a maximum lead content of1,071 μg/g inside the industrial facility. However, onlylow Pb concentrations were found in the surroundingarea with maximum at 92 μg/g Pb. Soil samples werecollected from 0 to 20 cm depth and slightly higherlead contents on the surface (0 to 2 cm depth) werenoted.
Groundwater from one well close to the facilityhad 60 μg/L Pb, far exceeding the regulated limit of10 μg/L Pb for drinking water. Several samples of edi-bles were analyzed in the period from September 2002to August 2003 but excessive lead concentrations werefound only for those collected inside the industrialarea.
92 B.R. Figueiredo et al.
Following these studies some environmental inter-vention actions were implemented such as removalof topsoil from the area surrounding the facil-ity, cleaning of houses, and restoration of waterreservoirs.
The results summarized above for Brazil deservesome comments. In Adrianópolis as well as in SantoAmaro, poisoned soils function as secondary diffusesources of lead in residential areas within distancesof 500–1,500 m from the industrial plants. In bothlocalities, elevated BLL levels reveal that people arecoexisting with lead pollution for several years afterthe plant shut down. In the case of the Ajax bat-tery facility, despite being located in an urban area(Bauru city), both environmental impact and humanexposure were found to be less severe than in SantoAmaro and Adrianópolis. Additionally, environmentaland societal actions were less difficult to implement incosmopolitan Bauru than in other areas.
Few decades ago the area dominated by the Cubatãopetrochemical industrial complex near the coast of thestate of São Paulo was known as the most polluted sitein South America. After a period when several envi-ronmental campaigns were undertaken, some data onhuman exposure for lead have been reported by SantosFilho et al. (1993). Mean BLL of 17.8 ± 5.8 μg/dL wasfound for a group of 250 children 1–10 years old fromCubatão. This case has not received much comment inrecent times.
Also in the Ribeira Valley, human monitoring forlead was carried out among a group of 43 childrenfrom the Serra district located not far from somePb–Zn mines. Cunha et al. (2005) reported a meanblood lead value of 5.36 μg/dL Pb with only 9.3% ofsamples exceeding the normal limit 10 μg/dL for chil-dren. These figures lie well below the exposure levelsfound in Adrianópolis where the Panelas mine and thePlumbum refinery were simultaneously in operationfor decades. Although both sites could be consideredindustrial point sources, the dispersion of lead intothe environment was more widespread in Adrianópolisthan in the Serra district.
Additional point-source lead pollution associatedwith mining may be found at the Morro Agudo zincmine (in the state of Minas Gerais) and around pastlead-ore producers such as the Boquira mine (in thestate of Bahia) and several middle-sized mines inthe Ribeira Valley (in the states of Paraná and SãoPaulo).
Mercury in the Amazon
Human exposure to mercury is mainly by inges-tion of contaminated food and can lead to adversehealth effects such as fever, lung edema, pneu-monitis, anorexia, irritability, emotional disturbances,photophobia, disorders of memory and cognitivefunctions.
Since the Minamata tragedy in the 1950s, mercurydispersion into the environment has become a subjectof concern worldwide. Mercury is being investigatedin a number of countries especially in places where itis frequently used for gold recovery in low-technologybased mines. Hence, several studies have been car-ried out for mercury in South America in the pastdecades.
In Brazil most studies concentrated in the Amazonwhere rudimentary gold mining, locally called“garimpo,” made use of mercury for gold amalgamfor decades at an annual rate of 80–100 tons accord-ing to reliable estimations (Veiga et al., 1999). TheBrazilian Amazon covers 58% of the country and has apopulation of 20 million inhabitants (12% of Brazilianpopulation).
It is well known that water and river sedimentsin “garimpo” areas often have higher Hg contentsthan those from remote areas. A compilation of mer-cury data for Amazon fishes from three major rivers(Madeira, Tapajós, and Negro) and from two waterreservoirs (Tucuruí and Balbina) from various authorsmade by Malm (1998) indicate an average value lessthan 0.2 μg/g Hg (wet wt) for virgin areas and mercurycontents of 2–6 μg/g Hg or even higher for contam-inated areas, far exceeding the maximum tolerablelimit of 0.5 μg/g established by Brazilian regulationin 1975.
Several determinations of mercury content inhuman hair from residents in the Tapajós River basinwere compiled from various authors by Lima de Sáet al. (2006). Mercury contents from five exposedgroups (n = 1,287) fell in the interval 11.8–25.3 μg/gwhereas Hg contents from seven less exposed com-munities (n = 1,644) ranged from 4.0 to 10.8 μg/g.The latter were very consistent with the maximumtolerable level of 10 μg/g Hg established by WHO(1990).
Malm (1998) reported an even more comprehen-sive data set on mercury content in human hair from

Medical Geology Studies in South America 93
Table 5 Total mercury contents in human hair from variousAmazonian areas
Locality No. of samples Average (μg/g)
Madeira River 169 8.98Madeira River 242 17.20Tapajós River 432 16.76Tapajós River 96 13.20Negro River 154 75.50Tucuruí Reservoir 125 35.00Balbina Reservoir 58 5.78
Source: Malm (1998) compilation from various authors
different areas and human groups in the Amazon asshown in Table 5. These data revealed that communi-ties exposed to mercury in Amazon are not restricted to“garimpo” areas but may be found around water reser-voirs, newly deforested regions, and even in protectedindigenous peoples’ areas. This find was subsequentlyconfirmed by Jardim and Fadini (2001) who reportedelevated mercury contents in soil, water, and air in theRio Negro River basin where no “garimpo” or any kindof factory has ever existed. The authors argued thatthe mercury levels in the environment were neverthe-less comparable to other known industrial centers indeveloped countries.
After decades of research work on mercury inthe Amazon, scientists are coming to the conclusionthat mercury distribution in the region is much morewidespread than was thought before. According toMalm (1998), concentration of methyl-mercury in sed-iment, water, and fish is a function of total mercuryconcentration, microbiological activity, concentrationof organic matter, presence of methyl-group donors,pH, Eh, oxygen activity, and other factors. High mer-cury methylation rates were found in tropical aqueoussystems such as seasonal inundated forest and at rootzones of floating meadows formed by aquatic vegeta-tion (Guimarães et al., 1997).
The physical, chemical, and biological functions ofthe Amazon rainforest to retain and recycle mercury ofnatural origin probably related to Andean volcanismstill require future studies to be understood.
An interesting matter concerning mercury stud-ies in the Brazilian Amazon is the lack of infor-mation on human health effects caused by mercuryexposure. It is widely thought that the Amazonianpopulation is protected against mercury intoxicationby a selenium-rich diet that is widespread in theregion.
Selenium in Venezuela
Since the 1970s some pioneering works on human andanimal exposure to selenium have been carried out inVenezuela. Jaffé et al. (1972) described some symp-toms such as hair loss and anomalies in the skin andnails among children from Villa Bruzual (in the stateof Portuguesa, Fig. 7) and pointed out that those chil-dren presented a mean blood selenium concentration(813 mg/L) much higher than children from the capital,Caracas (0.355 mg/L). Mondragón and Jaffé (1976)found selenium concentrations in milk, egg, cheese,pork, and chicken produced in Venezuela exceedingselenium contents in similar products imported fromeastern USA by 5 to 10 times. The authors believedthat the probable cause of contamination is the Se-richsesame cultivated in the Turén district, produced foranimal feed.
Furthermore, it was noted that nursing children inthe region ingest 10 times more selenium than childrenfrom Finland (Jaffé, 1992). This fact was anticipatedby Otaiza et al. (1977) who investigated the blood Selevels in cows from three regions in Venezuela. Theyfound an average Se level of 0.21 mg/L in the cen-tral region whereas in Portuguesa this average was0.67 mg/L, reaching 1.02–3.24 mg/L for cows in thefarms located in Turén.
More recently, studies on selenium were extendedto the state of Merida, where an attempt was madeby Burguera et al. (1990) to correlate blood Se levelswith cancer prevalence in humans. Selenium contentsfell in the interval 58–115 mg/L, well correlated withsoil selenium. Cancer was less common in population
Fig. 7 Map of the Amazon region with indication of locationscited in the text

94 B.R. Figueiredo et al.
groups with higher average Se blood levels. Thehypothesis that ingestion of selenium prevents inci-dence of cancer had already been demonstrated inthe 1970s in many countries (Shamberger and Frost(1969); Schrauzer (1977); Passwater, 1996). Theseresults point to a favorable situation for Venezuela con-cerning consumption of food cultivated in selenium-rich soil. In addition, selenium deposits in Venezuelaand human and animal exposure to selenium pose avery promising research topic for medical geology inVenezuela.
Fluorine and Fluorosis in Brazil
Fluorine has been investigated in many regionsof South America, e.g., in the Andean countries,Argentina, Brazil, and other places. In Brazil, fluorinestudies have been carried out in several states suchas Santa Catarina, Paraná, São Paulo, Minas Gerais,Goiás, and Bahia. However, only a few integratedstudies carried out in Brazil will be referred here.
In the state of Parana, south Brazil, following pub-lication of the multi-elementary geochemical maps(MINEROPAR, 2001), two important fluorine anoma-lies were revealed for surface water, the largest onelocated in the northern part of the state and the otherin the vicinity of fluorite mining areas in the RibeiraValley (Fig. 8).
In northern Parana the fluorine anomaly was inter-preted as geogenic and as derived from water–rock
Fig. 8 Fluorine distribution in surface water, Geochemical Atlasof Paraná (MINEROPAR, 2001)
interaction. This motivated a research group to assessthe probable fluorosis prevalence in the region. Agroup of 1,129 children from the São Joaquimdo Pontal and Itambaracá municipalities was thenscreened for dental fluorosis. The results were reportedby Cardoso et al. (2001) who pointed out incidences oflight and very light fluorosis in 57% of children andincidences of moderate and severe fluorosis in 4% ofsampled population.
In the Ribeira Valley, an environmental assay ofwater and stream sediments yielded the results reportedby Andreazzini et al. (2006). In this region two fluoritemines are found but only one has been active in recentyears. Fluorine contents in surface water exceedingregulated values for Brazil (1.4 mg/L F) were deter-mined only in water samples collected from drainageclose to the mines. Tap water analyses revealed fluorinecontents in line with Ministry of Health recommenda-tions. Elevated fluorine contents in stream sedimentsgreater than 800 μg/g were restricted to areas sur-rounding the mines. Due to these positive results,implementation of an epidemiologic campaign for den-tal fluorosis was not considered necessary in the area.
Another comprehensive investigation of fluorineand human exposure was carried out in the stateof Minas Gerais. Disseminated and vein-like fluoriteoccurs widely in limestone and other rocks of theBambui Group in the northern portion of the state.Velásquez et al. (2008) identified fluorine in groundwa-ter in northern Minas Gerais extending across 25 citiesand towns. The main groundwater sources includekarstic aquifers as well as Cretaceous sandstone andCenozoic sediments. The authors reported fluorinecontents from 155 wells out of 342 wells recorded.Average F content in the karstic aquifer is 0.72 mg/Land in the other aquifers 0.34 mg/L. Approximately19% of wells show fluorine contents greater than0.8 mg/L (Brazilian regulation) with maximum valueof 11 mg/L F found in the town of Verdelandia. In twotowns, Verdelandia and São Francisco, residents coex-ist with endemic fluorosis and people from other areaswhere water fluorine exceeds 1.5 mg/L are under riskof dental fluorosis.
In previous studies carried out in the region bya multidisciplinary team from the Federal Universityof Minas Gerais made up of geologists, dentists,epidemiologists, and other professionals, fluorine ingroundwater and prevalence of fluorosis had beenidentified in the town of São Francisco. Since 2004

Medical Geology Studies in South America 95
this project developed toward implementation of manyactivities oriented to disseminating information on theenvironment, fluorine hazards, and oral health in theregion. In addition, they gave dentistry assistance topeople affected by dental fluorosis. In this work, stu-dents and professionals of different specialties interactwith social and health assistants and with the public ingeneral (Castilho et al., 2004).
Societal Issues in the Scope of MedicalGeology
As explained above, in connection with fluorine inves-tigations in Brazil, very often geoscientists and otherprofessionals working in medical geology must dealwith societal issues. In many projects, collaboration ofthe public is essential not only because residents are aprivileged information source but also because they arethe leading actors to solve environmental and healthproblems of their concern.
To better understand the social scenery in whichscientific work takes place, basic concepts of anthro-pology, environmental sociology, and risk governanceare required, among others. Currently, two fieldsof interdisciplinary work that require methodologicalapproaches from social science are being exploredin the scope of medical geology in South America.A research group from the National University ofColombia is collecting data on geophagy practices inthe continent and another team from the University ofCampinas, Brazil, is investigating some communitiesthat were exposed to lead contamination from the pointof view of risk communication and risk governance.
There must certainly be other similar projects goingon in South America, but in the scope of this chap-ter, only these two works are reported in the followingsections.
Geophagy in South America
In South America, geophagy has been observed bothin animals and in humans. Evidences found in arche-ological contexts have demonstrated the antiquity ofthis practice in the continent. It was reported in chron-ics written by the Spanish, Portuguese, and otherresearchers; explorers; and missionaries of the “NewWorld.” Numerous elements, minerals, clays, loams,
and soils were used in preparations or ingested in tradi-tional therapeutics. Today this practice survives as partof the folklore and cultural heritage, although much ofthis knowledge has been lost to destruction of ancientcultures, evangelization, and ethnocide perpetrated byconquerors in the 16th century.
Animals may obtain benefits from this behav-ior in which they have persisted. In the Amazonrainforest, some nurturing places called salt lickscould be damaged by deforestation, intensive eco-tourism, and changes in land use. These keystoneresources can be lost, negatively affecting biodiver-sity (Montenegro, 2004). In this sense, understandinggeophagy is a very important tool for conservation andfor resource management at least for countries likethe Amazonian countries (Brazil, Colombia, Ecuador,Peru, and Venezuela).
Geophagy in Animals
Geophagy has been reported in the Andes (Lizcano andCavelier, 2004; Acosta et al., 1996; Downer, 1996) andin the Amazon rainforest for a wide range of wildlifespecies (Montenegro, 2004; Gilardi et al., 1999; Lipsand Duivenvoorden, 1991; Emmons and Stark, 1979).Natural licks are particular sites and habitats often vis-ited by wild animals with the purpose of licking orconsuming soil. Among the users, there are medium tolarge species of birds such as rails, curassows, guans,pigeons, macaws, and parakeets; mammals such aslarge primates, ungulates, medium to large rodents,felines (jaguar and ocelot); and members of the batfamilies (Montenegro, 2004).
Species from the Camelidae family living inthe Central Andes (lamas, vicugnas, guanacos, andalpacas) used to lick minerals enriched in clay phyl-losilicates: smectites, kaolinites, chlorites, and illites(Browman, 2004). These same clays are those foundto be ingested by humans. The composition of thedeposits and the mineralogy of the salt licks show vari-ations when compared with non-licking sites. But insome salt licks, the animals do not only consume soilbut also drink the water at these sites. The compositionof the water differs from adjacent waters. In the Andes,Lizcano and Cavelier (2004) report a higher content ofsulfate, nitrogen, and zinc in water from licks whencompared to an adjacent gully.
In the understanding of the indigenous society ofthe Uitotos from northwest Amazonia, Mother Earth

96 B.R. Figueiredo et al.
nurtures the animals from the forest in these sites asif it were mother’s milk. They also believe that ingest-ing soil and water from natural licks is constrained toanimals, but that they can benefit from these sites byhunting. Natural licks are important sites for the sur-vival of these societies. That is why they can be listedas keystone resources (Montenegro, 2004; Primack,1993), resources critical or limiting in particular habi-tats but crucial for many species of a community(Primack, 1993).
Natural licks are a result of particular hydrologic,ecologic, sedimentary, and mineralogical conditions.In some areas they may be controlled by the tectonicsetting (Montenegro, 1998). Thus they are related tothe environmental and geological evolution of a region.They also seem to be dynamic: they can dry out andanother lick may appear somewhere else. Geologistscan contribute to the study of these key resources.This knowledge is important for conservation plans,for natural resource management, and to understandthe natural history and the world that has created us.
Geophagy in Humans: Positive Feedbacks
The Otomac tribe from South America was wellknown for their custom of eating large amounts ofclay. The Otomacs used to live in the Neotropics,in the lower llanos of Apure, and on the banks ofthe Orinoco River (Venezuela, Fig. 7). Today they
have disappeared. Among their representatives werethe Guamos, Taparitos, Otomacos, and Yaruros. Theyall shared the taste for soil consumption.
The Otomacs caught the attention of naturalists suchas Humboldt (1985) and different missionaries such asFather Gumilla (published in 1944) and Father Bueno(published in 1933). They recorded the Otomacs’ habitof eating clay in copious quantities. Clay was extractedfrom the alluvial beds from the Orinoco River, duringhigh water levels, a period where the food seemed tobe scarce, although geophagy was practiced all yearlong. Otomacs enjoyed eating clay, they cooked it andmade small balls to be carried and consumed as a snackor as a small meal, and they also had recipes such as“clay bread”: They mixed clay with corn and turtle orcaiman fat, left the mix for fermentation, and then ateit (Gumilla cited in Rosenblat, 1964).
In the Northern Andes, on the coast of Ecuador, cer-tain “clay” artifacts were recovered from the Japotóand Acatames archeological sites by Guinea (2006).The objects were described as being composed ofcalcite-rich soils with a significant content of iron andother minerals such as feldspars, quartz, and some-times very small amounts of smectite clay. They hadprints of leaves and had elongated or spherical shapes(Fig. 9).
They are reminiscent of tamales, bollos, and othertraditional foods in which dough, paste, or batter iswrapped in leaves which add a natural flavor. Theywere found to have been cooked, and because of
Fig. 9 Geological materialsfound in the Atacames andJapoto archeological sites.Note the leaf printing and theshape. (Reproduced withpermission of M. Guinea,2006)

Medical Geology Studies in South America 97
heating they could be preserved. Guinea (2006) assignsthe earth to the taku, or pasa, or even poya type.
The pre-conquest cultures had vast knowledgeabout their environment. Their medical system wascompletely fused with their culture and religiousviews, as an emanation from the cultural frame(Gutierrez, 1985), making efforts to explain geophagyconsidering the ecological and cultural framework.Although traditional explanations of diseases couldinclude supernatural forces or curses, some therapieshave proven to be efficient, and some of them havebeen observed in very different cultures such as theingestion of clays to treat digestive upset.
The use of clays as detoxifying agents is well knownin traditional cultures. Johns (1986) reports the han-dling of clay material composed of kaolinite, interstrat-ified illite-smectite, and chlorite by indigenous groupsfrom Peru, Bolivia, and Arizona. Poisonous speciesof wild potato were covered with clay and then con-sumed without harm. Clays eliminate the bitter tasteand absorbed the glycoalkaloid tomatine, preventingstomach aches and vomiting. A study conducted in theCentral Andes (Bolivia and Argentina) by Browman(2004), reports 24 types of earths used by the inhab-itants either as a food supplement or as drugs; thesamples are composed of phyllosilicates, sodic andcalcium earths, sulfur minerals, and another groupmade up of iron and copper salts. The inhabitants ofthe Central Andes may have learned the geophagealbehavior from the Camelids.
This knowledge is part of their cultural heritage, asthere were some samples recovered in archeologicalcontexts and these raw materials can currently be foundin local markets. The handling of these earthy materi-als dates back at least five millennia. Browman (2004)reports the traditional names as Pasa and Chagofor raw materials composed of mixed clays (smec-tites, kaolinite, chlorite, illite) being highly appreciatedearths for their properties to alleviate gastrointestinalupsets related to phytotoxins present in domesticatedplants (such as solanine in potatoes or saponine inquinoa).
Another case comes from the Aymaras that used tolive in the high planes of Lake Titicaca. Women atea plastic soil called Chaco as candy (Patiño, 1984).Half a century ago, Rowe (1946) stated that in theInca Empire “a quantity of edible clay was collectedand exchanged with some frequency in the southernmountains.”
During the evangelization period in South America,some Franciscan friars were prominent and wellversed in medicine. A complete vademecum foundin the provincial files was published in 2002 by theColombian Academy of Exact, Physical and NaturalSciences. It was written by an anonymous Franciscanfriar in the 18th century (Díaz and Mantilla, 2002). Itis a result of mixing the legacy of occidental medicineand the traditional indigenous medicine.
Numerous reports accounted for geophagy as aform of pica since the period of the conquest. In theFranciscan vademecum mentioned in previous section,children with the habit of eating earth were treatedwith cow milk mixed with a little lead carbonate inthe mornings, until they detoxify by vomiting (Díazand Mantilla, 2002). In Colombia, reported remnantsof that habit are found in Magdalena and in Naré; thedisease caused by eating dirt was called “jipatera.”Colombian writer Gabriel García Márquez capturedgeophagy in his novel “One hundred years of solitude”:Rebecca was an orphan girl, with the custom of eatingdirt and lime from the walls when she faced emotionalcrisis.
In the northwest Amazon basin, in Colombia,Londoño (2007) reports the ingestion of clay mineralsin solution by the Uitotos indigenous society as a ther-apy for alleviating digestive upsets, detoxification ofthe liver, and counteracting poisonous compounds. Theraw materials were dominated by clay and the com-position was the same as that reported by Johns andBrowman. In the Uitoto classification they belong tothe Nógoras group (Fig. 10).
Fig. 10 Medicine man and woman from the Uitoto indigenoussociety collecting clay for medicine purposes in the Amazonrainforest. (After Londoño, 2007)

98 B.R. Figueiredo et al.
These examples reflect gaps that exist in our knowl-edge; the intricate relation between culture, ecology,and geological elements; and the interesting challengethat geophagy represents.
Soil Living Helminthes (Geo-Helminthes)
Soils and minerals may contain toxic compounds andpathogenic organisms. In fact, the excessive consump-tion of an essential mineral may lead to health prob-lems. Geo-helminthiasis (caused by parasites that livein soil) is one of the most widespread parasites inthe world, affecting almost 2,000 million people allover the world (WHO, 2002). The pathogenic agents(Ascaris lumbricoides, Trichuris trichiura, Uncinariasp.) depend on many environmental variables dur-ing their early stages of life to become infectious forhumans. Some of these variables include soil tempera-ture, weather, air humidity, and soil properties. A firstapproach to assess this issue was attempted in 2005with the study “Influence of geological factors on theprevalence of soil transmitted helminthes in Colombia”(Valencia et al., 2008). The main objective was to iden-tify the most relevant environmental variables in anepidemiological sense.
The study was performed with epidemiological datain the form of prevalence of helminthiasis statisticallycorrelated with environmental and geological data. Apositive relationship was found between temperature,annual precipitation, and index of basic unsatisfiedneeds.
This compiled information leads to a conclusionthat geophagia is a part of natural history. It is abehavior now restricted to certain cultural patterns andwild animals, its causes and consequences cannot begeneralized. Medical geology can be an important con-tributor to the study of geophagia in trying to explainthis behavior by integrating a variety of perspectivesand disciplines.
Risk Communication and RiskGovernance
In recent years, societies have had to face com-plex environmental and health risks, which arecharacterized by controversial values, high stakes,
and urgent decisions. These problems, associated withchemical substances, unknown effects of hazards, anduncertainty within the scientific community demanda new approach to deal with these risks, called riskgovernance.
This approach considers that risk is more thana situation or an event during which something ofhuman value, including humans themselves, is at stakeand where the outcome is uncertain. Since risks canonly be seen and measured within a social context,it must be understood as a social construction. Thismeans that hazards interact with psychological, social,institutional, and cultural processes in ways thatgreatly affects public reaction to risk (Hannigan, 1995;Slovic, 1987).
This approach also takes into account that risksare part of our routine. This means that all actorsinvolved in a risk situation have the right to participatein the definition of and solution to the problems thatthey face. This participation is facilitated when dia-logue is encouraged. This dialogue is known as riskcommunication.
Conceptual Framework of Risk Communicationand Risk Governance
Risk communication practices should not be limitedto a knowledge deficit model, which considers thatexperts have to communicate their scientific knowl-edge to the lay public in order to stop them fromcontinuing to live in a state of ignorance. The ideathat lay knowledge is not irrational characterizes thedialogue among social actors involved within the riskmanagement arena. It includes considering that valuejudgments and subjective influences are present inevery phase of risk management, also dividing theexperts opinions (Guivant, 2004). In this approach, riskcommunication must be a process that provides guide-lines and strategic tools for scientists and authorities tocreate a confident atmosphere with all social actors.
The risk communication concept includes strategiesthat ensure information is supplied in a clear andexplanatory manner, so that local populations areinformed about and aided to understand pertinentinformation and its subsequent implications as well asbeing encouraged to actively participate in mitigationof risk (Horlick-Jones, Sime, and Pidgeon, 2003;

Medical Geology Studies in South America 99
Renn, 2003; Lundgren and McMakin, 2004; Wynne,1989).
The concept of risk communication has undergonesignificant advancements and an increase in popular-ity since the Chernobyl nuclear accident that occurredin the Ukraine in 1986. The accident illustrated thedifficulties that researchers were faced with in tryingto adequately disseminate information to the pub-lic regarding risk assessments and their uncertainties(Wynne, 1989). Since then, scientists, communicators,and public administrators have highlighted the need toput an interactive communication process into prac-tice, which can accommodate the necessary exchangeof opinions between the various social actors involvedduring a risk management process. Today, more than20 years after the Chernobyl incident, risk communi-cation has gained ground on the public agenda. Thischange could be seen as better addressing the widerange of situation of risks that we live with, such asnatural disasters, environmental changes, outbreaks ofinfectious or chronic diseases, as well as terrorism.
These events also help to promote a discussionabout risk governance. The concept of governanceis related to a new institutional arrangement wherethe decision-making process is collective and involvesgovernmental and non-governmental actors. In thispractice, the power of society is recognized andrespected. Experts and authorities recognize that com-plex problems, such as those that are faced in situationof risks, demand more than a technical solution. Thechoice of these solutions is not a technical decision,but also has political, social, cultural, and economicaspects.
According to Jasanoff and Martello (2004), the con-cept of governance means rules, processes, and behav-iors that affect how power is practiced, particularlyregarding participation, accountability, efficiency, andresponsibility in the decision-making process. Theseauthors agree that in environmental situations, whenthe limits of science are so evident, the social dimen-sions of knowledge production must be recognized andmore attention must be given to local perspectives andtraditional knowledge.
The great interest in this new approach to dealingwith risks (involving risk communication and gover-nance) is a result of the debate about justice, trust,public participation, and democracy that has been
happening in societies in recent years. These subjectshave had a central role in the development of researchand political agendas.
Interest is also related to the idea that it is possible todeal more efficiently with public answers to risk if peo-ple that really live these hazard situations are involvedin the decision-making process. This means that therisk management must be an analytical and delibera-tive process in which the effects of social amplificationof risk are included as an important element in thedecision.
Social amplification of risk denotes the phe-nomenon by which information processes, institu-tional structures, social group behavior, and individualresponses shape the social experience of risk, therebycontributing to consequences of risk (Kasperson et al.,2005). Therefore acceptance or non-acceptance ofexistence of a risk is determined by a number ofelements such as an individual’s familiarity with theproblem, ability to solve the problem, exposure tothe media coverage, beliefs, and personal feelings(Duncam, 2004; Smith, 1992; Weyman and Kelly,1999; Sturloni, 2006). The legitimacy of the insti-tutions involved in risk management as well as thelack of direct participation during the decision-makingprocesses of local people involved in a situation ofrisk influences the level of concern felt by a givenpopulation.
Many different experiences with environmental andhealth risks have shown that when people are involvedin the decision-making process, they know and pre-serve better the place where they live and act indi-vidually and collectively to reduce risks. Besides, thechances to avoid a community or place being stigma-tized by the risks that they are facing decrease whenpeople are integrated in the solution of their problems.
Public participation in assessment and managementof risks also has direct implications in the develop-ment of democratic principles. Even if not all desiresand aspirations of the communities are satisfied, thesimple fact that people are involved in associative mod-els because they have a political project in commonthat could improve their life quality is a significantadvance. It is the chance to develop those commu-nities’ personal capacities of analyses and argument,tolerance, and solidarity which is so important indemocratic societies.
100 B.R. Figueiredo et al.
Environmental Contamination and Health Risks
The debate and practices about risk communicationand governance is more advanced in the United Statesand Europe. In the United States risk communica-tion is often conducted as a result of a law, regula-tion, or other government inducement (Lundgren andMcMakin, 2004), but it is a regular procedure dur-ing risk management. One example of this is the actknown as CERCLA or Superfund (ComprehensiveEnvironmental Response Compensation, and LiabilityAct). It requires that specific procedures be imple-mented to assess the release of hazardous substancesat inactive waste sites. Those procedures involve theinclusion of “community relations” in the evaluationprocess. According to Lundgren and McMakin (2004)“community relations” refers to developing a workingrelationship with the public to determine acceptableways to clean up the site so that the community isincluded in the decision-making process and partici-pates effectively in risk management.
In Europe, although each country has a unique wayto deal with risks related to contamination, there is acommon idea about promoting an open debate withthe public and giving more attention to local andtraditional knowledge to face problems. The UnitedKingdom and France, for instance, have legislationabout getting input from the public before some actionsare taken by authorities in uncertain areas.
Unfortunately, the debate about risk communicationand governance is still reduced in developing coun-tries. The paradigm of assessment and management ofrisks includes numerical data about the intensity of pol-lution and measures to reduce threats, but it does nottake into account – or perhaps barely takes into account– how people perceive and live with these risks.
Nonetheless, environmental and health researchers(and in some circumstances government) are con-vinced about the necessity to promote a dialoguebetween experts that assess and manage risks andthe people that really live these risks. The latter’sexperiences, especially those that involve environmen-tal contamination and human exposure to dangeroussubstances, show the necessity to include social dimen-sions and all kinds of knowledge (technical, lay, tra-ditional, and local) to deal with hazard situations (DiGiulio et al., 2008a, b, c).
This necessity is evident in a study focusing onthree cases in Brazil (Adrianopolis, Santo Amaro, and
Bauru) and one in Uruguay (La Teja) in which res-ident communities had to deal with environmentalcontamination and human exposure to lead.
Based on bibliographic research, analysis of jour-nalistic articles, and interviews conducted with peoplewho played different roles in the events, a lack ofadequate planning for information release to localpeople was identified in Adrianópolis. This circum-stance seriously undermined the relationships betweenresearchers and community and contributed to a mis-perception of risk among people. There, the absenceof a community involvement plan produced a feel-ing of exclusion from the decision-making process.In Santo Amaro a concern about risk communicationwas noted among researchers, although local peoplehad always demanded more information about theproblem. There is a local association of contamina-tion victims that presses the government for solutionsbut the level of public involvement is probably not asextensive as it could be. In Bauru, the relatively goodrelationship between researchers, authorities, and localpeople was facilitated by the existence of a risk com-munication plan. The strategies of risk communicationaimed at encouraging public participation in the solu-tion of the problem, although this participation waslimited to only public pressure. Local people insistedon actions directed to pollutant control, searched forclarification regarding the health effects of these pollu-tants and for assistance from the public health service.Finally, in La Teja (Montevideo) local people werefrom the beginning very engaged in handling the risks,although the risk communication strategies were notenough to open dialogue and to empower communityrepresentatives to actively participate in risk manage-ment. People’s engagement in La Teja resulted fromthe potential existence of social mobilization repre-sented by a neighborhood association that played animportant role in guaranteeing information to localpeople and to press governmental institutions to action.
These experiences show that even when there isa risk communication plan, the strategies formulatedare still limited to a knowledge deficit model and notto contributing to create a trustful and confident rela-tionship between all social actors involved in the riskarena. Without trust it becomes difficult to promotesocial interaction to handle the risks. This difficultyis more evident when experts and authorities adopt arisk management approach that underestimates poten-tial input from the public. However, these experiences

Medical Geology Studies in South America 101
also highlighted that being aware of public values andcharacter as well as taking into account social orga-nizations’ input might be the easiest way to mobilizepeople and promote risk governance.
Other Medical Geology Studies in SouthAmerica
As mentioned earlier in this chapter the list of environ-mental problems discussed above is far from exhaus-tive. Other hazardous substances such as chromium,cadmium, siliceous particulate, metallic or asbestos-bearing dust, agrochemicals, radioactive elements, andmany other substances may cause harmful effects toexposed populations. These themes are focused in anumber of ongoing projects and publications in SouthAmerica. Additional information on Se, As, and Cu inUruguay; on chemical composition of drinking waterin several metropolitan areas in Brazil; on human expo-sure to atmospheric particulates in urban and ruralareas; on natural gamma radiation in the environmentas well as at U–Th mine sites; and on the presenceof agro toxins in edibles are available in a number ofpapers, technical reports, dissertations, doctoral theses,and presentations in diverse congresses.
These environmental and human health studiescover a wide spectrum of scientific themes in responseto real problems identified in South American coun-tries. They benefit from a laboratory infrastructurethat could be considered good especially in themore developed regions. In the past decades gettinghigh-quality analytical data, for example, for leadin blood, arsenic speciation, or any trace-elementconcentration at ppb or ppt levels was an obstacleto scientific research in South America. However,substantial advances in laboratory facilities haveoccurred in recent years in many places that canlargely benefit scientists, professionals, and studentsfrom less developed regions. Participation in variousweb lists and research networks that are active in thecontinent may be the best way to improve scientificresearch on medical geology in this part of world.
Future of Medical Geology in SouthAmerica
In Brazil, the most promising medical geological ini-tiative undertaken so far is the Geomedicine Project
of the State of Paraná. Since 2006 a comprehensivestudy on surface geochemistry and public health hasbeen conducted by the Pele Pequeno Principe ResearchInstitute in cooperation with the local geological com-pany Mineropar. Interest in this study has arisen fromthe fact that in the state there is an elevated incidenceof TP33 genetic alteration generally associated withadrenal cortex cancer among children and mammalcancer. The project was designed to verify its existenceand indentify probable relationships between healthproblems and environmental parameters. The researchteam takes advantage of the excellent geochemicaldatabase generated by Mineropar since the 1990s.A substantial amount of public health, demographic,social-economic, and surface geochemical data arebeing stored in a web mapping system from whichdifferent user friendly maps are produced for systemusers, according to Pedrini et al. (2010).
Current and future achievements of the ParanaGeomedicine Project illustrate very well the thesis thatsignificant advances in future medical geology willoccur in those regions where geological and geochem-ical mapping efforts succeed. That brings attentionto the strategic plans of geological surveys and othergeological institutions in the continent. Incidentally,the Geological Survey of Brazil (CPRM) recentlyannounced additional investments in low-density geo-chemical mapping of the country (Silva, 2008). Thesegeochemical studies include the chemical composi-tions of surface water, stream sediments, and soil aswell as trace-element analyses of treated water fordomestic use in some metropolitan areas.
In connection with regional, geological, and geo-chemical mapping, a great number of new researchinitiatives may be undertaken by South American uni-versities and research centers. They will also to a greatextent be based on the results from current researchwork, which covers a wide thematic spectrum frominvestigations of air quality in urban and rural areasand probable correlations with lung and heart diseasesand mortality rates; remediation experiments at labo-ratory and pilot scales on arsenic removal from acidmine drainage and chromium removal from contami-nated water; use of phosphate or bio-accumulators forrehabilitation of contaminated soil for lead and othermetals, etc.
Despite the difficulty of being able to create multi-disciplinary research teams and interinstitutional col-laboration between Earth, life and social scientific

102 B.R. Figueiredo et al.
institutions, this seems to be the best model to followand the most effective way for future medical geol-ogy studies in the continent to succeed in response tosocietal needs and scientific challenges.
References
Abreu MC, Figueiredo BR (2004) Mapeamento geoquímicode arsênio e metais pesados em solo da Unidade Piririca,Vale do Ribeira (SP). In Brazilian Geological Congress, 41,Proocedings, João Pessoa, Paraíba.
Acosta H, Cavelier J, Londoño S (1996) Aportes alconocimiento de la biología de la danta de montaña Tapiruspinchaque en los Andes Centrales de Colombia. Biotropica28:258–265.
ATSDR (Agency for Toxic Substances and Disease Registry)(2000) Toxicological profile for Arsenic. Atlanta, GA: U.S.Department of Health and Human Services, Public HealthService.
Alvarez C, Piastra C, Cousillas A, Mañay N (2003a)Importancia del dato analítico en la contaminación por plomodurante 2001–2002 en Uruguay. In Congresso Brasileiro deToxicologia, XIII, Londrina, Brasil.
Alvarez C, Piastra C, Queirolo E, Pereira A, Mañay N (2003b)Evolución de plumbemias en niños de Montevideo-Uruguay.In Congresso Brasileiro de Toxicologia, XIII, Londrina,Brasil.
Andreazzini MJ, Figueiredo BR, Licht OAB (2006)Comportamento geoquímico do flúor nas águas e sedi-mentos fluviais da Região de Cerro Azul, Estado do Paraná.Rev Bras Geoc 36:74–94.
Argentina (2007) Código Alimentario Argentino, modificationof articles 982 and 983, May 22, 2007, Buenos Aires,Argentina. http://www.anmat.gov.ar/normativa/normativa/Alimentos/Resolucion_Conj_68-2007_96-2007.pdf.
ATSDR-CERCLA (2003) Top 20 Hazardous Substances fromthe CERCLA Priority List of Hazardous Substances,Comprehensive Environmental Response, Compensation,and Liability Act, CERCLA/Superfund, 2002.
Besuschio SC, Desanzo AC, Pérez A, Croci M (1980)Epidemiological associations between arsenic and cancer inArgentina. Biol Trace Elem. Res 2:41–55.
Bhattacharya P, Claesson M, Bundschuh J, Sracek O, FagerbergJ, Jacks G, Martin RA, Storniolo A. del R, Thir JM (2006)Distribution and mobility of arsenic in the Río Dulce alluvialaquifers in Santiago del Estero Province, Argentina. Sci TotalEnviron 358:97–120.
Borba RP, Figueiredo BF (2004) A influência das condiçõesgeoquímicas na oxidação da arsenopirita e na mobilidadedo arsênio em ambientes superficiais tropicais. RevistaBrasileira de Geociências 34(3):489–500.
Borba RP, Figueiredo BR, Matschullat J (2003) Geochemicaldistribution of arsenic in waters, sediments and weatheredgold mineralizes rocks from iron quadrangle, Brazil. EnvironGeol 44(1):39–52.
Browman DL (2004) Tierras comestibles de la Cuenca delTiticaca: Geofagia en la prehistoria boliviana. EstudiosAtacameños 28:133–141.
Bueno R (1933) Apuntes sobre la provincia misionera 1785–1804. Caracas, Tipografía Americana.
Bundschuh J, García ME, Birkle P, Cumbal LH, Bhattacharya P,Matschullat J (2008a) Occurrence, health effects and reme-diation of arsenic in groundwater of Latin America. In JBundschuh, MA Armienta, P Bhattacharya, J Matschullat, PBirkle, AB Mukherjee (eds) Natural Arsenic in Groundwaterof Latin America — Occurrence, Health Impact andRemediation. Leiden, Holland: A.A. Balkema Publishers.
Bundschuh J, Pérez Carrera A, Litter MI (2008b) Distribucióndel Arsénico en la Región Ibérica e Iberoamericana”,Argentina, CYTED, octubre de 2008. ISBN 13 978-84-96023-61-1.
Burguera JL, Burguera M, Gallignani M, Alarcón OM, BurgueraJA (1990) Blood serum selenium in the province of Mérida,Venezuela, related to sex, cancer incidence and soil sele-nium content. J Trace Elem Electrolytes Health Dis 4:73–77.
Cabello G, Cornejo L, Arriaza B, Santero C (2007)Comprendamos el desierto para que seamos protagonistasdel desarrollo de nuestra región. In G Cabello Fernández (ed)Proyecto Explora-Conicyt, ISBN N 978-956-8649-00-5.
Cardoso L, Morita MC, Alves JC, Licht OAB (2001) Anomaliahidrogeoquímica e ocorrência de fluorose dentária emItambaracá-Pr. In Congresso Brasileiro de Geoquímica, VIII,SBGq, Curitiba. Resumos (CD Rom).
Carvalho FM, Silvany Neto AM, Tavares TM, Costa ACA,Chaves CR, Nascimento LD, Reis MA (2003) Chumbo nosangue de crianças e passivo ambiental de uma fundição dechumbo no Brasil. Revista Panamericana de Salud Pública13(1):1–10.
Castilho LS, Ferreira EF, Jorge WV, Menegasse LN, FantinelLM (2004) Geologia, odontologia e saúde: instrução decomunidades rurais sobre aspectos geoambientais e epidemi-ológicos da fluorose dentária em São Francisco, MG. InEncontro de Extensão da Universidade Federal de MinasGerais, 7, Belo Horizonte, Anais.
CDC (1991) United States Center of Disease Control. PreventingLead Poisoning in Young Children. A Statement by theCenter of Disease Control US. Atlanta, Georgia: Departmentof Health and Human Services.
CETESB (2005) Estabelecimento de Valores Orientadorespara Solos e Águas Subterrâneas no Estado de SãoPaulo. Companhia de Tecnologia de Saneamento Ambiental.Decisão Diretoria 195-05, São Paulo, 4 p.
Chile (2005) Instituto Nacional de Normalización (INN), Chile,Norma Chilena 409/1 of 2005, Agua Potable Parte 1:Requisitos.
Choucair AK, Ajax ET (1988) Hair and nails in arsenicalneuropathy. Ann Neurol 23(6):628–629.
CPRM (Companhia de Pesquisa de Recursos Minerais) (1982)Projeto Eldorado, Relatório Final Integrado de Pesquisa(Final Report), CPRM, São Paulo.
CONAMA (2005) Resolution 357, March 17, 2005 CONAMA(National Council for the Environment), Brazil
Concha G, Nemel B, Vahter M (1998) Metabolism of inorganicarsenic in children with chronic high as exposure in NorthernArgentina. Environ Health Perspect 6:355–359.
Cornejo L, Mansilla H, Arenas J, Flores M, Flores V, FigueroaL, Yánez J (2006) Remoción de arsénico en aguas del ríoCamarones, Arica, Chile, utilizando la Tecnología RAOS

Medical Geology Studies in South America 103
modificada. In M Litter, A Jiménez (eds) Avances en tec-nologías económicas solares para la desinfección, descon-taminación y remoción de arsénico en aguas de comunidadesrurales de América Latina (métodos FH y RAOS). ProyectoOEA AE141/2001, ISBN N 978-95081-9-X, Cap. 4:pp.85–92.
Couto N, Mattos S, Matschullat J (2007) Biomonitoramentohumano. In E Deschamps, J Matschullat (org), Arsênio antro-pogênico e natural, Fundação Estadual do Meio Ambiente,Belo Horizonte, pp. 241–269.
Cunha FG, Figueiredo BR, Paoliello MMB, De Capitani EM,Sakuma AM (2005) Human and environmental lead contami-nation in the upper Ribeira valley, southeastern Brazil. Terrae2(1–2):28–36.
De Capitani EM, Sakuma AM, Figueiredo BR, Paoliello MMB,Okada IA, Duran MC, Okura RI (2006) Exposição humanaao arsênio no Médio Vale do Ribeira, São Paulo, Brasil. InCR Da Silva et al. (eds) Geologia Médica no Brasil, CPRM-Serviço Geológico do Brasil, Rio de Janeiro, pp. 82–87.
Deschamps E, Mello J (2007) Solos e sedimentos. In: E.Deschamps, J Matschullat (org), Arsênio Antropogênicoe Natural, Fundação Estadual do Meio Ambiente, BeloHorizonte, pp. 200–215.
Deschamps E, Ciminelli VST, Lange FT, Matschullat J, RaueB, Schmidt H (2002) Soil and sediment geochemistry ofthe Iron Quadrangle, Brazil: The case of arsenic. J SoilsSediments 2(4):216–222.
Díaz S, Mantilla LC (2002) La terapéutica en el Nuevo Reino deGranadaun recetario franciscano del siglo XVIII. AcademiaColombiana de Ciencias Exactas, Físicas y Naturales, Il.Bogotá, Colombia, 207 p.
Di Giulio GM, Pereira NM, Figueiredo BR (2008a) Lead con-tamination, the media and risk communication: A casestudy from the Ribeira Valley, Brazil. In DGE Liverman,C Pereira, B Marker (Org.) Communicating EnvironmentalGeoscience. London: Geological Society, London, SpecialPublications, 305, pp. 63–74.
Di Giulio GM, Pereira NM, Figueiredo BR (2008b) O papel damídia na construção social do risco: o caso Adrianópolis, noVale do Ribeira. História, Ciências, Saúde-Manguinhos, 15,pp. 293–311.
Di Giulio GM, Figueiredo BR, Ferreira LC (2008c)Communicating environmental risks as a long-term policy.In Berlin Conference on the Human Dimensions of GlobalEnvironmental Change, Berlin, Germany.
Dos Anjos JASA (2003) Avaliação da eficiência de uma zonaalagadiça (wetland) no controle da poluição por metais pesa-dos: o caso da Plumbum em santo Amaro da Purificação, BA.Doctoral Thesis, Escola Politécnica, USP, 326 p.
Downer CC (1996) The mountain tapir, endangered “flagship”species of the high Andes. Oryx 30:45–58.
Duncam B (2004) Percepción pública y comunicación eficazdel riesgo. http://www.jrc.es/home/report/spanish/articles/vol82/-welcome.html.
Emmons LH, Stark NM (1979) Elemental composition of anatural mineral lick in Amazonia. Biotrópica 11(4):311–313.
Farías SS, Bianco de Salas G, Servant RE, Bovi Mitre G,Escalante J, Ponce RI, Ávila Carrera ME (2006) Survey ofarsenic in drinking water and assessment of water intakeof arsenic in La Puna, Argentina. In J Bundschuh, MAArmienta, P Bhattacharya, J Matschullat, AB Mukherjee
(eds) Natural Arsenic in Groundwaters of Latin America– Occurrence, Health Impact and Remediation, Leiden,Balkema.
Figueiredo BR, Borba RP, Angélica RS (2007) Arsenic occur-rence in Brazil and human exposure. Environ GeochemHealth, Springer, Netherlands 29:109–118.
Franzblau A, Lilis R (1989) Acute arsenic intoxication fromenvironmental arsenic exposure. Archiv Environ Health44(6):385–390.
Freitas CU, De Capitani EM, Gouveia N, Simonetti MH, SilvaMRP, Kira CS, Sakuma AM, Carvalho MFH, Duran MC,Tiglea P, Abreu MH, (2007) Lead exposure in an urbancommunity: Investigation of risk factors and assessmentof the impact of lead abatement measures. Environ Res103(3):338–344.
Gilardi JD, Duffey SS, Munn CA, Tell LA (1999) Biochemicalfunctions of geophagy in parrots: Detoxification of dietarytoxins and cytoprotective effects. J Chem Ecol 25:897–922.
Gómez D, Molina S, Naranjo A, Cabrera I (2004)Contaminación del agua de consumo con arsénico enla población de El Encón. In Taller de Evaluación y Manejode Riesgos por Exposición a Arsénico en Agua de Consumo,10, S. M. de Tucumán, Argentina, (unpublished).
González DM, Ferrúa NH, Cid J, Sansone MG, Jiménez I (2003)Arsénico en aguas de San Luis (Argentina). Uso de un equipoalternativo Al De Gutzeit modificado. Acta ToxicológicaArgentina. 11 (1), p. 3–6.
González DM, Ferrúa NH, Sansone MG, Ferrari S, Cid JA(2004) Arsénico en agua de consumo humano en pobla-ciones de las provincias de San Luis y Buenos Aires. ActaToxicológica Argentina. 12:7.
Guimarães JRD, Meili M, Hylander LD, Castro e Silva E,Roulete M, Mauroa JBN, Lemos RA (1997) Mercury netmethylation in five tropical flood plain regions of Brazil: highin the root zone of floating macrophyte mats but low in sur-face sediments and flooded soils. The Science of the TotalEnvironment, 261:99–107.
Guinea M (2006) El uso de tierras comestibles por los puebloscosteros del Periodo de Integración en los Andes septen-trionales. Bulletin de l’Institut Français d’Études Andines35(3):321–334
Guivant JS (2004) A governança dos riscos e os desafiospara a redefinição da arena pública do Brasil. In Ciência,Tecnologia + Sociedade. Novos Modelos de Governança.Brasiília, dezembro, 2004. http://www.nisra.ufsc.br/pdf/A%20governa%5B1%5D.pdf
Gumilla, J. (1944) El Orinoco ilustrado. Tomo I. Bilbiotecapopular de cultura colombiana. 360 p.
Gutiérrez V (1985) Medicina Tradicional de Colombia. Magia,religión y Curanderismo. V II, Universidad Nacional deColombia, Bogotá, Colombia.
Hannigan J (1995) Sociologia Ambiental – a formação de umaperspectiva social. Lisboa: Instituto Piaget.
Horlick-Jones T, Sime J, Pidgeon N (2003) The social dynam-ics of environmental risk perception: implications for riskcommunication and practice. In N Pidgeon, RE Kasperson,P Slovic, The Social Amplification of Risk (pp. 262–285).Cambridge: Cambridge University Press.
Hopenhayn-Rich C, Biggs ML, Fuchs A, Bergoglio R, TelloE, Nicolli H, Smith AH (1996) Bladder cancer mortalityassociated with arsenic in drinking water in Córdoba,

104 B.R. Figueiredo et al.
Argentina. Epidemiology 7:117–124. http://wonder.cdc.gov/wonder/prevguid/p0000029/p0000029.asphttp://www.ufmg.br/proex/arquivos/7Encontro/Saude95.pdf(May 26, 2009)
Humboldt A (1985) [1799] Viaje a las Regiones Equinoccialesdel Nuevo Continente. Caracas: Monte Ávila Editores, T. 4,601 p. (translated by Lisandro Alvarado).
IMM (2003) Contaminación por Metales en suelo. In InformeAmbiental de Montevideo. Intendencia Municipal deMontevideo, Documentos de Desarrollo Ambiental.http://www.montevideo.gub.uy/ambiente/documentos/infoamb03c.pdf.
Jaffé WG (1992) Selenium, an essential and toxic element. LatinAmerican data. Arch Latinoam Nutr 42:90–93.
Jaffé WG, Ruphael MD, Mondragón MC, Cuevas MA(1972) Clinical and biomedical studies on school chil-dren from a seleniferous zone. Arch Latinoam Nutr 22:595–611.
Jardim WF, Fadini PS (2001) A origem do mercúrio nas águasdo rio Negro. Ciência Hoje 30:62–64.
Jasanoff S, Martello ML (2004) Earthy Politics: Local andGlobal in Environmental Governance. EUA: MIT Press.
Johns T (1986) Detoxification functions of geophagyand domestication of the potato. J Chem Ecol 12:635–646.
Kasperson RE, Renn O, Slovic P, Brown HS, Emel J, GobleR, Kasperson JX, Ratick S (2005) The social amplifica-tion of risk: a conceptual framework. In J Kasperson, RKasperson, (eds) The Social Contours of Risk: Publics, RiskCommunication and the Social Amplification of Risk (pp.99–114). London: Earthscan.
Lamoglia T, Figueiredo BR, Sakuma AM, Buzzo ML, OkadaIA, Kira CS (2006) Lead in Food and Soil from a MiningArea in Brazil and Human Exposure. Chinese Journal ofGeochemistry, Supplementary Issue dedicated to the 7thInternational Symposium on Environmental Geochemistry,Beijing, September, p. 66.
Lara F, Cornejo L, Yáñez J, Freer J, Mansilla HD (2006)Solar-light assisted arsenic removal from natural waters: theeffect of iron and citrate concentrations. J Chem TechnolBiotechnol 81:1282–1287.
Lima de Sá A, Herculano AM, Pinheiro MC, Silveiras LCL,Do Nascimento JLM, Crespo-López ME (2006) Exposiçãohumana ao mercúrio na região Oeste do Estado do Pará,Revista Paraense de Medicina, 20(1), Belém.
Lima MO (2003) Caracterização geoquímica de arsênio totalem águas e sedimentos em áreas de rejeitos de minérios demanganês no Município de Santana, Estado do Amapá. MScDissertation, Universidade Federal do Pará.
Lips JM, Duivenvoorden JF (1991) Morphological and chem-ical features of mineral salt licks in the middle Caquetabasin, Amazonas, Colombia, Colombia Amazónica, 5(1),pp. 119–130.
Lizcano DJ, Cavelier J (2004) Características químicas desalados y hábitos alimenticios de la Danta de montaña(Tapirus pinchaque Roulin, 1829) en los Andes Centrales deColombia. Mastozool Neotrop 11(2):193–201.
Londoño SC (2007) Caracterización Geoquímica Preliminar DeLas Arcillas Con Potencial De Uso Medicinal Presentes EnAraracuara, Caquetá, Colombia. BSc Monograph, GeologyProgram, Universidad Nacional, Bogotá, Colombia.
Lundgren R, McMakin A (2004) Risk Communication: AHandbook for Communicating Environmental, Safety andHealth Risks. Ohio: Battelle Press.
Malm O (1998) Gold mining as a source of mercury exposure inthe Brazilian Amazon. Environ Res Section A 77:73–78.
Mañay N, Alonzo C, Dol I (2003) Contaminación por plomoen el barrio La Teja, Montevideo-Uruguay. In Suplemento“Experiencia Latinoamericana” Salud Publica de México45:268–275.
Mañay N, Alvarez C, Cousillas A, Pereira L, Baranano R,Heller T (2006) Changes in blood lead levels in Uruguayanpopulations. In MC Alpoim, PV Morais, MA Santos, ACristovao J Centeno P Collery (eds) Metals Ions in Biologyand Medicine, 9 (pp. 530–534). Paris: John Libbey Eurotext.
Mañay N, Cousillas AZ, Alvarez C, Heller T (2008) Lead con-tamination in Uruguay: The “La Teja” neighborhood case. InDM Whitacre (ed) Reviews of Environmental Contaminationand Toxicology, 93, Springer, 195, pp. 93–115.
Mansilla H, Cornejo L (2002) Chile, relevamiento de comu-nidades rurales de América Latina para la aplicación detecnologías económicas para la potabilización de aguas. InM Litter (ed) Proyecto OEA AE 141/2001, ISBN N 987-43-54127, 2002, pp. 43–58.
Mansilla H, Cornejo L, Lara F, Yánez J, Lizama C, Figueroa L(2003) Remoción de arsénico de aguas del río Camarones,Arica, Chile. In M Litter, H Mansilla (eds) Remoción deArsénico Asistida por Luz Solar en Comunidades Rurales deLatinoamérica. ISBN N 987-43-6943-4. Cap. 2, pp. 35–46.
Matschullat J, Borba RP, Deschamps E, Figueiredo BR, GabrioT, Schwenk M (2000) Human and environmental contam-ination in the Iron Quadrangle, Brazil. Appl Geochem 15:181–190.
MINEROPAR (2001) Atlas Geoquímico do Estado do Paraná.Curitiba, 80 p.
Mondragón MC, Jaffé WG (1976) Ingestion of selenium inCaracas, compared with some other cities. Arch LatinoamNutr 26:343–352.
Montenegro O (1998) The Behavior of Lowland Tapir (Tapirusterrestris) at a Natural Mineral Lick in the Peruvian Amazon.Master Dissertation, University of Florida.
Montenegro O (2004) Natural Licks as Keystone Resources forWildlife and People in Amazonia. PhD Thesis, University ofFlorida.
Nicolli HB, O’Connor TE, Suriano JM, Koukharsky MML,Gómez Peral MA, Bertini A, Cohen LM, Corradi LI, BaleaniOA, Abril EG (1985) Geoquímica del arsénico y de otros oli-goelementos en aguas subterráneas de la llanura sudorientalde la provincia de Córdoba. Miscelánea No. 71, Acad. Nac.Ciencias. Córdoba, Argentina.
Nicolli HB, Smedley PL, Tullio JO (1997) Aguas subterráneascon altos contenidos de flúor, arsénico y otros oligoelementosen el norte de la provincia de La Pampa: estudio preliminar.In Congreso Internacional sobre Aguas y Workshop sobreQuímica Ambiental y Salud, Abstracts, III-40, Buenos Aires,Argentina.
Nicolli HB, Suriano JM, Gómez Peral MA, Ferpozzi LH,Baleani OM (1989) Groundwater contamination with arsenicand other trace elements in an area of the Pampa, Province ofCórdoba. Argentina Environ Geol Water Sci 14(1):3–16.
Nicolli HB, Tineo A, Falcón CM, García JW, MerinoMH, Etchichury MC, Alonso MS, Tofalo OR (2006)

Medical Geology Studies in South America 105
Hydrogeochemistry of arsenic in groundwaters fromBurruyacú basin, Tucumán Province, Argentina. In JBundschuh, MA Armienta, P Bhattacharya, J Matschullat,AB Mukherjee (eds) Natural Arsenic in Groundwatersof Latin America – Occurrence, Health Impact andRemediation. Leiden: Balkema.
Nicolli HB, Tineo A, Falcón CM, Merino MH (2001a)Movilidad del arsénico y de otros oligoelementos asociadosen aguas subterráneas de la cuenca de Burruyacú, provinciade Tucumán, República Argentina. In A Medina, J Carreray L Vives (eds) Congreso Las Caras del Agua SubterráneaI (pp. 27–33). Madrid: Instituto Geológico y Minero deEspaña.
Nicolli HB, Tineo A, García JW, Falcón CM, Merino MH(2001) Trace-element quality problems in groundwater fromTucumán, Argentina. In R Cidu (ed) Water-Rock Interaction2 (pp. 993–996). Lisse: Balkema.
Nicolli HB, Tineo A, García JW, Falcón CM, Merino MH,Etchichury MC, Alonso MS, Tofalo OR (2007b) Arsenic-contamination source of groundwater from Salí basin,Argentina. In TD Bullen, Y Wang (eds) Water-RockInteraction. Leiden: Balkema.
Nicolli HB, Tujchneider OC, Paris M del C, Barros AJ (2007a)Fuentes y movilidad del arsénico en aguas subterráneas delárea centro-norte de la provincia de Santa Fe (unpublished).
Oliveira JJC, Ribeiro JH, Souza Oki S, Barros JRR(1979) Projeto Geoquímica do Quadrilátero Ferrífero:Levantamento orientativo e regional. CPRM (GeologicalSurvey of Brazil), Final Report (Vol. I).
Osicka RM, Agulló NS, Herrera Aguad CE, Jiménez MC(2007) Evaluación de las concentraciones de fluoruro yarsénico en las aguas subterráneas del Domo Central dela Província del Chaco. Website: www.msal.gov.ar/htm/site/pdf/FyAsChaco.pdf, 2002 (visited in 2007).
Otaiza ER, Valeri H, Cumare V (1977) Selenium content in theblood cattle from Venezuela. I. Central and Portugueste zone.Arch Latinoam Nutr 27:233–246.
Oyarzun R, Lillo J, Higueras P, Oyarzú J, Maturana H (2004)Strong arsenic enrichment in sediments from the Elqui water-shed, Northern Chile: industrial (gold mining at El Indio–Tambo district) vs. geologic processes. J Geochem Explor84:53–64.
Paoliello MMB, De Capitani EM (2005) Environment contam-ination and human exposure to lead in Brazil. Rev EnvironContam Toxicol 184:59–96.
Paoliello MMB, Capitani EM, Cunha FG, Carvalho MF, MatsuoT, Sakuma A, Figueiredo BR (2003) Determinants of bloodlead levels in an adult population from a mining area inBrazil. Journal de Physique IV 107:127–130.
Paoliello MMB, Capitani EM, Cunha FG, Matsuo T, CarvalhoMF, Sakuma A, Figueiredo BR (2002) Exposure of childrento lead and cadmium from a mining area of Brazil. Environ.Res., Section A 88:120–128.
Passwater RA (1996) Selenium against cancer and AIDS. NewCanaan CT: Keats, 1996, pp. 47–48.
Patiño VM (1984) La alimentación en Colombia y en los paísesVecinos. Tomo I de Historia de la cultura material en laAmérica Equinoccial, pp. 23–24.
Pedrini H, Ibáñez HC, Figueiredo BC (2010) Sistema WebMapping. In: B.C. Figueiredo and H.C. Ibáñez, GeoMedicinano Paraná, Instituto de pesquisa Pelé Pequeño Príncipe,
Secretaria de Estado de Ciencia, Tecnología e EnsinoSuperior, Curitiba, PR (in forthcoming).
Pérez Carrera A, Moscuzza C, Fernández Cirelli A (2005)Aporte de macrominerales del agua de bebida a la dieta debovinos de leche (Córdoba, Argentina). Revista Argentina deProducción Animal 25(3–4):115–121.
Perrota MM (1996) Potencial aurífero de uma região no Valedo Ribeira, São Paulo, estimado por modelagem de dadosgeológicos, geoquímicos, geofísicos e de sensores remo-tos num sistema de informações geográficas. PhD Thesis,University of São Paulo.
Pinedo M, Zigarán A (1998) Hidroarsenicismo en la Provinciade Córdoba, actualización del mapa de riesgo e inciden-cia. In Congreso Interamericano de Ingeniería Sanitaria yAmbiental, 26, Lima, Perú.
Primack RB (1993) Essentials of Conservation Biology. SinauerAssociates Inc: Sunderland, Mass.
Queirolo F, Stegena S, Mondaca J, Cortés R, Rojas R, ContrerasC, Muñoz L, Schwuger MJ, Ostapczuk P (2000) Totalarsenic, lead, cadmium, copper, and zinc in some salt riversin the northern Andes of Antofagasta, Chile. The Sci of theTotal Environ 255:85–95.
Renn O (2003) Social amplification of risk in participation: Twocase studies. In N Pidgeon, RE Kasperson, P Slovic (eds)The Social Amplification of Risk (pp. 374–401). Cambridge:Cambridge University Press.
Rosenblat A (1964) Los otomacos y taparitas de los llanosde Venezuela. Estudio etnográfico y lingüístico. Tomo I.Instituto de antropología e historia.
Rowe JH (1946) Inca culture at the time of the Spanish con-quest. In J Steward (ed) The Andean Civilizations, Bureauof American Ethnology, Washington DC, Bulletin 143(2):183–330.
Sakuma AM (2004) Avaliação da Exposição Humana ao Arsêniono Alto Vale do Ribeira, Brasil, Doctoral Thesis, Faculdadede Ciencias Médicas, University of Campinas, 196 p.
Sandali G, Diez E (2004) Determinación del contenido dearsénico en agua de consumo humano en la provincia delChubut. Acta Toxicológica Argentina Supl 12:13–14.
Santos Filho E, Silva RS, Barreto HHC, Inomata ONK, LemesVRR, Sakuma AM, Scorsafava MA (1993) Concentraçõessanguíneas de metais pesados e praguicidas organocloradosem crianças de 1 a 10 anos. Rev Saúde Pública 27(1):59–67.
Santos ECO, Jesus IM, Brabo ES, Fayal KF, Lima MO(2003) Exposição ao mercúrio e ao arsênio em estadosda Amazônia: síntese dos estudos do Instituto EvandroChagas/FUNASA. Revista Brasileira de Epidemiologia6(2):171–185.
Schrauzer GN (1977) Cancer mortality correlation studies–III: Statistical associations with dietary selenium intakes.Bioinorg Chem 7(1):23–31.
Selinus O, Alloway B, Centeno JA, Finkelman RB, Fuge R,Lindh U, Smedley P (2005). Essentials of Medical Geology.Amsterdam: Elsevier, 812 pp.
Shamberger R, Frost D (1969) Possible protective effect ofselenium against human cancer. Can Med Assoc J 100:682.
Silva CR (2008) Programa Nacional de Pesquisa em GeoquímicaAmbiental e Geologia Médica – PGAGEM. In CongressoBrasileiro de Geologia, 44, Curitiba, SBG, Anais, p. 374.
Slovic P (1987) Perception of risk. Science 236:280–285.

106 B.R. Figueiredo et al.
Smedley PL, Nicolli HB, Barros AJ, Tullio JO (1998)Origin and mobility of arsenic in groundwater from thePampean Plain, Argentina. In EB Arehart, JR Hulston(eds) Water-Rock Interaction (pp. 275–278). Rotterdam:Balkema.
Smedley PL, Nicolli HB, Macdonald DMJ, Barros AJ, TullioJO (2002) Hydrogeochemistry of arsenic and other inorganicconstituents in groundwater from La Pampa, Argentina. ApplGeochem 17(3):259–284.
Smedley PL, Nicolli HB, Macdonald DMJ, Kinniburgh DG(2006) Arsenic in groundwater and sediments from LaPampa Province, Argentina. In J Bundschuh, MA Armienta,P Bhattacharya, J Matschullat, AB Mukherjee (eds) NaturalArsenic in Groundwaters of Latin America – Occurrence,Health Impact and Remediation. Leiden: Balkema.
Smith KS, Huyck LO (1999) An overview of the abundance,relative mobility, bioavailability, and human toxicity ofmetals. In GS Plumlee, MJ Logsdon, The EnvironmentalGeochemistry of Mineral Deposits, Part A: Processes,Techniques, and Health Issues. Reviews in EconomicGeology, 6A, pp. 29–70.
Smith K (1992) Environmental Hazards – Assessing Risk andReducing Disaster. London: Routledge.
Sturloni G (2006) Le mele de Chernobyl sono buone: mezosecolo di rischio tecnológico. Editore Sironi, Milano. Italy.
Takamori AY, Figueiredo BR (2002) Monitoramento da quali-dade de água do rio Ribeira de Iguape para arsênio e metaispesados. Brazilian Geological Congress, 41, Proocedings,João Pessoa Paraíba, p. 255.
Tineo A, Falcón C, García J, D’Urso C, Rodríguez G (1998)Hidrogeología. In Geología de Tucumán, (2nd ed.). Colegiode Geólogos de Tucumán (publicación especial), S. M. deTucumán, Argentina, pp. 259–274.
Toujague RDR (1999) Arsênio e metais associados na regiãoaurífera do Piririca, Vale do Ribeira, São Paulo, Brasil. MScDissertation, University of Campinas, Brazil.
Valencia HC, Fernández NJ, Londoño SC, Cucunubá Z, ReyesHP, Lopez PM (2008) Geological Influences on the Soil,Contributions to Infections Transmitted by Helminths inColombia. In International Geological Congress, 33, Oslo,2008, Proceedings.
Veiga ATC, Salomão EP, Veiga MM, Barros JGC (1999) TapajósProject – A Proposal for a Clean “Garimpagem” in theBrazilian Amazon. Mercury as a Global Pollutant. In 5thInternational Conference, Rio de Janeiro, CETEM/UFF,Abstracts, p. 291.
Velásquez LNM, Fantinel LM, Uhlein A, Iglésias MM, FerreiraEF, Castilho LS, Vargas AMD, Rodriges PCH (2008)Investigação hidrogeológica do flúor em aqüíferos carbonáti-cos do Médio São Francisco-MG e epidemiologia da fluorosedentária associada. In Congresso Brasileiro Geologia, 44,Curitiba, SBG, Anais, p. 371.
Web Odontológica (2007) Website: http://webodontologica.com/index.asp (visited in 2007).
Weyman AK, Kelly CJ (1999) Risk Perception and RiskCommunication – A Review Literature. Broad Lane,Sheffield: HSE Books,.
WHO (1990) Methylmercury. IPCS Environmental HealthCriteria Document 101. Geneve: World Health Organization.
WHO (2002) Prevention and Control of Schistosomiasisand Soil Transmitted Infections Report of EHO ExpertCommittee. Geneve: World Heath Organization.
WHO (2004) Guidelines for Drinking Water Quality (Vol.1, 3rd ed.). Recommendations. Geneve: World HealthOrganization.
Wynne B (1989) Sheep farming after Chernobyl – A casestudy in communicating scientific information. Environ Mag31:10–15.
Yañez J, Mansilla H, Figueroa L, Cornejo L (2005) Arsenicspeciation in human hair: A new perspective for epidemio-logical assessment in chronic arsenicism. J Environ Monit7:1335–1341.

An Overview of Medical Geology Issues in Australiaand Oceania
Karin Ljung, Annemarie de Vos, Angus Cook, and Philip Weinstein
Abstract Australia and Oceania together make upsome of the oldest and youngest geologic formationson the planet, ranging from rocks dating back to4,400 million years to newly formed volcanic isles inthe Pacific. The health issues related to these diversegeological materials range from those derived fromexposure to metals and minerals to volcanic emis-sions including gas and ash, bushfires, dust storms,as well as health threats posed by natural hazards.With the position of a large part of this region withinthe Ring of Fire, many Australian and Oceanian livesare impacted upon by the forces related to tectonicmovement, including earthquakes, tsunamis, and vol-canic eruptions. There are also a number of medicalgeology issues related to the soil in this area. Theseinclude geophagy, melioidosis – an infectious diseasecaused by soil bacteria, and the impacts from ecosys-tem transformations caused by the disturbance of acidsulfate soils. An example of this is the increase ofvector-borne mosquitoes carrying the Ross River viruswith the formation of acidic ponds through acid sulfatesoil oxidation. The potential adverse health outcomesfrom disturbing some parts of the land have long beenacknowledged by traditional Aboriginal landowners ofAustralia, who refer to an area particularly rich inuranium and other metals as Sickness Country.
Keywords Australia · Oceania · metals · Volcaniceruptions · Acid sulfate soils · Geophagy ·Vector-borne diseases · Sickness country
K. Ljung (�)School of Population Health, University of Western Australia,Perth, WA, Australia; Institute of Environmental Medicine,Karolinska Institutet, Stockholm, Swedene-mail: [email protected]
General Background
Australia and Oceania together consist of a few largeislands, including Australia, New Zealand, Papua NewGuinea, and Fiji, and thousands of small coral atollsand volcanic islands within Melanesia, Micronesia,and Polynesia. These islands are all defined as “smallisland states” as they cover less than 10,000 km2 andare inhabited by less than 500,000 people (McMichaelet al., 2003) (Fig. 1).
The total population of the region is around 36 mil-lion, with nearly 22 million in continental Australia,6 million in Papua New Guinea, and 4 million in NewZealand and the Oceanian part of Indonesia. Hawaii,although politically part of the United States, is with itspopulation of just over 1 million generally included inOceania, but is not specifically included in this chapter.The remaining 3 million inhabit just over 20 islands orgroups of islands, with Fiji and the Solomon Islandsbeing the largest with 800,000 and 500,000 inhabi-tants, respectively, and the Pitcairn Islands having thesmallest population of only 47 (CIA, 2009).
It has been suggested that altered weather patterns,including gradual warming secondary to greenhousegas emissions, may have resulted in increasing aver-age global temperatures over the last 30 years. Islandhabitats are particularly vulnerable to probable con-sequences of global warming, such as rising sea lev-els. The Intergovernmental Panel on Climate Change(IPCC) has indicated that small islands are vulnera-ble to increasing amplitudes and frequencies of hightides, greater wave damage, and intrusion of salt waterinto the islands underground reserves of freshwater.Atolls, such as the Kiribati, are at particular riskfrom even small changes in sea level (Nunn, 1991).Many low-lying states may partially disappear, eroding
107O. Selinus et al. (eds.), Medical Geology, International Year of Planet Earth,DOI 10.1007/978-90-481-3430-4_5, © Springer Science+Business Media B.V. 2010

108 K. Ljung et al.
Fig. 1 Australia and Oceania. Courtesy of Reis (2006)Australasia: AU = Australia; NZ = New Zealand; Melanesia:FJ = Fiji; NC = New Caledonia; PG = Papua New Guinea;SB = Solomon Islands; VU = Vanuatu Micronesia; FM =Federated States of Micronesia; GU = Guam (USA); KI =Kiribati; MH = Marshall Islands; NR = Nauru; MP = Northern
Mariana Islands; PW = Palau; Polynesia: AS = AmericanSamoa; CK = Cook Islands (NZ); PF = French Polynesia(France); NU = Niue (NZ); PN = Pitcairn Islands (UK); WS =Samoa; TK = Tokelau (NZ); TO = Tonga; TV = Tuvalu; WF =Wallis and Futuna (France)
terrestrial habitats and triggering further competitionfor use of the remaining land. However, this chap-ter mainly relates to medical geology issues of con-cern in the areas which house the largest populations.Although geologically mediated natural hazards suchas earthquakes, tsunamis, and volcanoes are included,other threats more related to weather as well as thethreat of rising sea levels with climate change are notconsidered issues of medical geology and are onlycovered in brief.
Geology of Australia and Oceania
Australia did not fall out of the sun, as was proposedby Rev. W.B. Clarke in 1861 (Johnson, 2004). Insteadof being a new continent as was initially believed, itis one of the oldest land masses on Earth, contain-ing almost all known rock types from all geologicaltime periods. The continental crust of Australia hasbeen dated at older than 3,500 million years, withmetamorphosed sedimentary rocks in some regionscontaining zircons that are even older, dated at 4,400million years, making it the oldest material known onEarth (Johnson, 2004). In contrast, much of the geol-ogy of New Zealand is relatively recent and reflects itslocation between the tectonic plates of Australia and
the Pacific. Its largest city, Auckland, sits on top ofan active volcano field, while Wellington, its capital,is built on the active Wellington fault, with approxi-mately one earthquake per week registered below thecity. On the South Island, a 600 km active fault cutsacross the landscape, slipping at a rate of approxi-mately 25 mm/year. Similarly, many of the islandsin the Pacific are characterized by tectonic and vol-canic activities resulting from the long collision of theAustralian, Eurasian, and Pacific plates and comprisesome of the youngest land formations on Earth (TeAra, 2007).
Geological Features Related to Health
The Australian continent encompasses a range of cli-matic zones from arid to humid temperate to wettropical as well as areas of seasonal freezing and snow.The lowest temperature on record was –23◦C (–9.4◦F)measured in New South Wales in 1994, while the high-est temperature of 53◦C (127.4◦F) was recorded inQueensland about a hundred years earlier, in 1889. Thesmall town of Marble Bar in Western Australia boaststhe record as the hottest town in Australia after itsrecord spell of 160 days in a row with temperaturesrecorded above 37.5◦C (99.5◦F). Annual rainfalls also

An Overview of Medical Geology Issues in Australia and Oceania 109
vary, with a record precipitation set in 1979 whenover 11 m of rain fell over Mount Bellenden Ker inQueensland. The same state holds the wettest annualaverage of 4,048 mm. At the other end of the spec-trum, Lake Eyre in south Australia has experienced thelowest rainfall on record – an annual precipitation of amere 125 mm (Johnson, 2004).
Although many areas experience frequent floods,the Australian continent is one of the driest, withapproximately one-third being desert and another thirdsemiarid (Johnson, 2004). As a result, Australia isdusty in large parts of the inland areas with subse-quent health issues. Lake Eyre, in spite of its name,only filled three times in the past century and istogether with the surrounding deserts a significantsource of dust during its usual dry condition. Residentsof Sydney recently experienced this as they woke upto a “Mars-like” city on September 23, 2009, whendust from inland Australia was uplifted and transportedsome 4,000 km to the coast, filling the air with reddust and decreasing visibility to 300 m. It has beensuggested that the Lake Eyre area is the largest sourceof airborne dust in the Southern Hemisphere, althoughits contribution to global dust levels is small comparedto, for example, the Sahara desert (Earth Observatory,2006). Prolonged periods of drought coupled with highwinds and the flammable nature of eucalyptus alsoprovide excellent conditions for bushfires. In 2009,swathes of the state of Victoria were consumed by rag-ing February bushfires, which caused the death of 210people and destroyed over 2,000 homes.
In addition to particular natural events affectinghuman health, there are a number of geological fea-tures of the Australian landscape that cause chronicexposures and sometimes more subtle or long-termhealth effects. Examples of potential hazards includethe occurrence of natural asbestos as well as a range ofminerals, metals, and radioactive elements. Some areasparticularly rich in uranium are referred to as SicknessCountry by the Aboriginal landowners, who warn thatdisturbing the land will cause disease.
With New Zealand’s position between two mov-ing tectonic plates, the geological issues of concernwith regard to health mainly include those relatedto this activity. Earthquakes and volcanic eruptionscause direct physical injury, and volcanic emissionsand geothermal springs may greatly increase exposureto potentially toxic elements. Other natural hazards ofrelevance in New Zealand include tsunamis and land-slides. Papua New Guinea and the numerous islands
of the Pacific are characterized by their position in theRing of Fire, and similar to New Zealand, these arefrequented by geological events that can threaten localcommunities (Box 1).
This chapter has been divided into four main parts,each discussing area-specific geological features andtheir relation to human health. The first section cov-ers minerals and metals, the second discusses naturalhazards, the third covers geological emissions, and thefourth covers issues related to soil.
Box 1 Island Life
Among the most vulnerable areas of inhabitedland are coral atolls and volcanic islands of smallsize (Fig. 2). With severe constraints on availablespace, people must live and function in relativelyclose proximity to any industrial process, suchas mining. Many islands have limited capacity toproduce and store food resources and also sufferfreshwater shortages needed for both human andecosystem health. Among the most vulnerablesites are small atolls, which may be fully depen-dent on rainwater or imported water supplies. Insuch delimited locations, reserves are depletedfrom two directions: from the “bottom-up” bysalinization of the underground lens of fresh-water and from the “top-down” contamination
Fig. 2 Oeno Island, 280 km NW of Pitcairn Islands inthe Pacific Ocean (Ong, 2006) covers 0.5 km2 and has amaximum elevation of 5 m

110 K. Ljung et al.
of freshwater by agricultural and human wastes.On occasion, groundwater supplies totally dryup, as occurred on Vanuatu’s Nguna Islandin 1992: the island population was forced toconsume coconut milk to maintain hydration(Thistlethwaite and Davis, 1996).
Islands are also vulnerable to catastrophicevents that create sudden imbalances betweenutilizable land and population. In the 1800s,both the Cook Islands and Mangareva in FrenchPolynesia underwent cycles of drought andsevere damage of crops by hurricanes, result-ing in recurring famine; the Micronesian Islandof Pingelap experienced a similar fate over thelast century, spurring migration to neighboringcenters. Climatic-driven changes may limit thecapacity for islanders to utilize their aquaticresources, such as by increasing the risk of diar-rheal illness, particularly on islands where waterreserves are already scarce (Singh et al., 2001).Marine food sources may also be placed in jeop-ardy, such as through the threat of ciguatera(fish poisoning). Ciguatera, occurring from theconsumption of fish which have ingested tox-ins produced by algal microflagellates, affectsPacific Island populations with greater frequencywhere local warming of the oceanic surfaceoccurs (Hales et al., 1999). It is predicted that theacceleration of global warming will result in anincreased incidence of ciguatera in populationsdependent on reef fish as a food supply.
A common problem that compromises thesafety of crops and waterways of many islandcommunities is soil erosion. Removal of forestsfor firewood and agriculture accelerates thisprocess and precipitates flash flooding. Evenislands with a diverse range of habitats maybe severely affected. In Papua New Guinea andother Melanesian Islands, the combination ofsteep topography, volcanic soils, and torrentialrainfall may often trigger lethal mudslides.
Minerals and Metals
Since the discovery of gold in Australia in the mid-1800s, the mining industry has been a significant con-tributor to the Australian economy (Australian Bureauof Statistics, 2008a). Australia currently mines, or has
unworked deposits of, almost all mineral commodities.It is one of the world’s leading miners of coal, bauxite,diamonds, gold, iron ore, lead, manganese, nickel, tita-nium, uranium, zinc, and zircon (Australian Bureau ofStatistics, 2006). It is ranked as one of the world’s lead-ing mining nations with significant mineral and fuelresources close to the surface. In the 1960s, Australiaemerged as a major trader in black coal, bauxite, ironore, nickel, manganese, titanium, and zirconium, andby the 1980s, new technologies expanded gold pro-duction and the processing of bauxite into alumina andaluminum. At the end of the 20th century, Australiawas a world producer and exporter of alumina, dia-monds, gold, copper, silver, manganese ore, uranium,and tantalum (Australian Bureau of Statistics, 2006),the world’s largest producer of bauxite, mineral sands,and tantalum and one of the top producers of uranium,iron ore, lead, zinc, and nickel (Australian Bureau ofStatistics, 2008a) (Box 4).
Other areas of Oceania also have rich depositsof metals, with gold mining in New Zealand, PapuaNew Guinea, and Fiji as well as in a number ofsmaller states (CIA, 2009). Other mineral depositsin Oceania include copper, lead, nickel, zinc, man-ganese, chromium, molybdenum, cobalt, and phos-phate (Advameg, 2009). Although there are occupa-tional health issues as a result of mining, environmen-tal exposure may also exert negative effects throughelevated exposures from drinking water and crops aswell as from soil and dust (Box 2). An area partic-ularly rich in mineral deposits in northern Australiahas been dubbed Sickness Country as it is believedby the Aboriginal landowners that sickness will fallupon those that enter there. Geochemical analyses havefound that this area coincides with unusually highnatural levels of thorium, uranium, arsenic, mercury,fluorine, and radon in groundwater and drinking water(McKay et al., 2008) (Box 3). In this section, we willlook at how the minerals and metals present in the landaffect human health.
Box 2 Silent Spring in Esperance
In December 2006, birds started falling fromthe sky in the small coastal town of Esperancein Western Australia. By the end of January2007, over 20 incidents had been reported with

An Overview of Medical Geology Issues in Australia and Oceania 111
hundreds of birds found dead. At least 500birds were confirmed dead over the 2 months,with extrapolation using local bird density datasuggesting around 4,000 birds may have diedin the town during this time (Department ofEnvironment and Conservation, 2007a). By theend of March, this estimate had reached 9,500birds (Western Australia Legislative Committee,2007). At first, a viral or bacterial cause wassuspected (Department of Environment andConservation, 2007a), but subsequent testingrevealed the cause of death to be lead poisoning(Department of Environment and Conservation,2007b). Isotope testing showed the source tobe lead carbonate from a mining companywhich used the Esperance Port for shippingout their product (Western Australia LegislativeCommittee, 2007).
Export of lead carbonate through theEsperance port started in June 2005 and contin-ued up until the suspicion of its environmentalcontamination in March 2007. The lead is minednear Wiluna, which was expected to provide 2%of the world’s lead at target production. The leadcarbonate was processed here and transportedaround 900 km south to Esperance where it wasshipped to China, mainly for the manufacture ofcar batteries (Esperance Port Authority, 2008).As a result of the finding of lead contaminationcausing the bird deaths, the Port Authority putan immediate stop to lead carbonate shipmentsthrough the port in mid-March 2007. A fewdays later, the Department of Environment andConservation (DEC) issued a prevention noticefor further transport into and out of the port,which left 9,000 tons of lead carbonate stored onport grounds (Government of Western Australia,2007).
Concern was raised about the lead exposureto the children in the town, and free bloodlead testing was offered. Out of the 600 chil-dren tested, 81, or 13.5% had blood lead levelsabove or equal to the internationally accept-able level of 5 μg/l (WACL, 2007). The con-tribution of lead from the Wiluna mine to theblood of the children tested varied between 30and 87%, and of the children with blood leadlevels above 3 μg/l, 84% had at least 50%Wiluna lead (WACL, 2007). An inquiry by the
Legislative Committee into the lead contamina-tion of Esperance revealed that the incidence wasboth foreseeable and foreseen and in spite ofa detailed examination it remained unclear howthe events leading up to the contamination couldhappen anyway. Sadly, it became evident thatwithout the death of the birds and the persis-tence of local community members, the exposurewould have continued.
Box 3 Sickness Country
Our land was first created by Bula, who came fromsaltwater country to the north. With his two wives,the Ngallenjilenji, he hunted across the land andin doing so transformed the landscape through hisactions. Bula finally went under the ground at anumber of locations north of Katherine in an areaknown to us as ‘Sickness Country.’ It is called thisbecause the area is very dangerous and should notbe disturbed for fear that earthquakes and fire willdestroy the world.
Bolung the rainbow serpent inhabits the deepgreen pools found in the Second Gorge. We donot fish in the pools where Bolung sits. When fish-ing close to these pools, we can take only a smallportion of the fish caught and throw back the restin order to appease Bolung. Drinking water mustnot be taken from these deep pools but rather fromthe shallow associated waters. Pregnant womenand new initiates may not swim in the KatherineRiver for fear of disturbing Bolung, who mustnot be spoken to and must be left undisturbed.(Dreamtime of Jawoyn people)
Sickness Country described above is locatedin the northern inland part of the NorthernTerritory of Australia (Fig. 3). As the Dreamtimeexplains, the Jawoyn people who are thetraditional Aboriginal landowners have longbeen aware of potentially adverse health effectsfrom disturbing this land. Interestingly, the loca-tion of Sickness Country coincides with some ofthe largest uranium deposits in Australia (Fig. 3)(McKay et al., 2008). Although many areaswithin Sickness Country are sacred to avoid dis-turbing Bula, in modern times they are alsovery attractive to mining companies. In the early1990s, the Jawoyn people opposed the proposalto mine Coronation Hill, or Guratba, which hasbeen referred to as “one of the great unmined
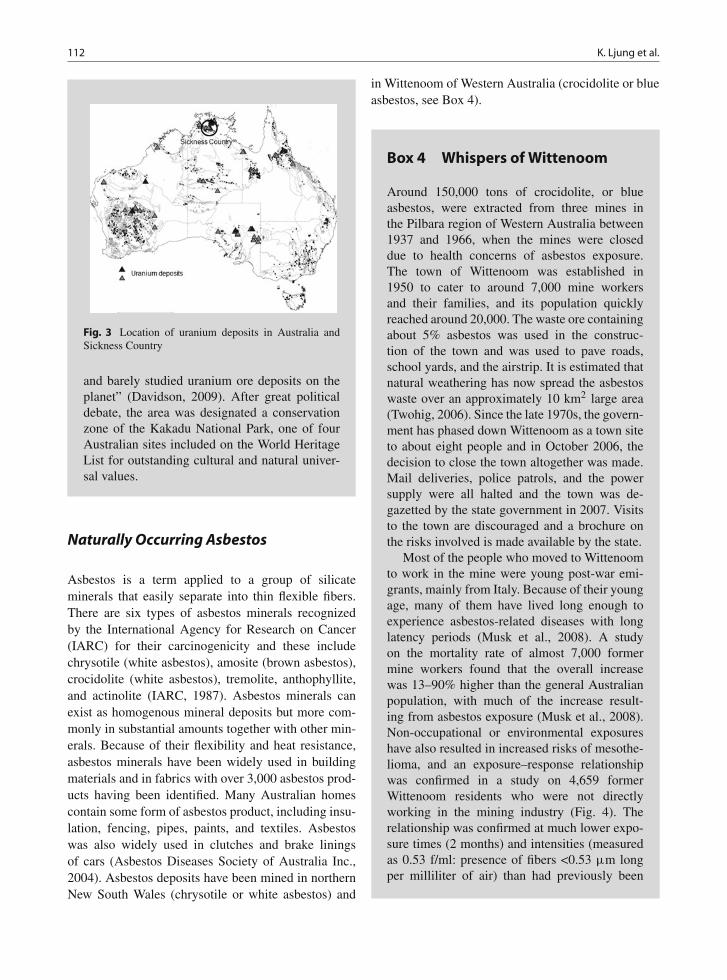
112 K. Ljung et al.
Fig. 3 Location of uranium deposits in Australia andSickness Country
and barely studied uranium ore deposits on theplanet” (Davidson, 2009). After great politicaldebate, the area was designated a conservationzone of the Kakadu National Park, one of fourAustralian sites included on the World HeritageList for outstanding cultural and natural univer-sal values.
Naturally Occurring Asbestos
Asbestos is a term applied to a group of silicateminerals that easily separate into thin flexible fibers.There are six types of asbestos minerals recognizedby the International Agency for Research on Cancer(IARC) for their carcinogenicity and these includechrysotile (white asbestos), amosite (brown asbestos),crocidolite (white asbestos), tremolite, anthophyllite,and actinolite (IARC, 1987). Asbestos minerals canexist as homogenous mineral deposits but more com-monly in substantial amounts together with other min-erals. Because of their flexibility and heat resistance,asbestos minerals have been widely used in buildingmaterials and in fabrics with over 3,000 asbestos prod-ucts having been identified. Many Australian homescontain some form of asbestos product, including insu-lation, fencing, pipes, paints, and textiles. Asbestoswas also widely used in clutches and brake liningsof cars (Asbestos Diseases Society of Australia Inc.,2004). Asbestos deposits have been mined in northernNew South Wales (chrysotile or white asbestos) and
in Wittenoom of Western Australia (crocidolite or blueasbestos, see Box 4).
Box 4 Whispers of Wittenoom
Around 150,000 tons of crocidolite, or blueasbestos, were extracted from three mines inthe Pilbara region of Western Australia between1937 and 1966, when the mines were closeddue to health concerns of asbestos exposure.The town of Wittenoom was established in1950 to cater to around 7,000 mine workersand their families, and its population quicklyreached around 20,000. The waste ore containingabout 5% asbestos was used in the construc-tion of the town and was used to pave roads,school yards, and the airstrip. It is estimated thatnatural weathering has now spread the asbestoswaste over an approximately 10 km2 large area(Twohig, 2006). Since the late 1970s, the govern-ment has phased down Wittenoom as a town siteto about eight people and in October 2006, thedecision to close the town altogether was made.Mail deliveries, police patrols, and the powersupply were all halted and the town was de-gazetted by the state government in 2007. Visitsto the town are discouraged and a brochure onthe risks involved is made available by the state.
Most of the people who moved to Wittenoomto work in the mine were young post-war emi-grants, mainly from Italy. Because of their youngage, many of them have lived long enough toexperience asbestos-related diseases with longlatency periods (Musk et al., 2008). A studyon the mortality rate of almost 7,000 formermine workers found that the overall increasewas 13–90% higher than the general Australianpopulation, with much of the increase result-ing from asbestos exposure (Musk et al., 2008).Non-occupational or environmental exposureshave also resulted in increased risks of mesothe-lioma, and an exposure–response relationshipwas confirmed in a study on 4,659 formerWittenoom residents who were not directlyworking in the mining industry (Fig. 4). Therelationship was confirmed at much lower expo-sure times (2 months) and intensities (measuredas 0.53 f/ml: presence of fibers <0.53 μm longper milliliter of air) than had previously been

An Overview of Medical Geology Issues in Australia and Oceania 113
(a)
(b)
Fig. 4 (a) Road sign at the entrance of Wittenoom. (b)Children playing with asbestos in a Wittenoom backyard.Photographs courtesy of Asbestos Diseases Society ofAustralia Inc
reported (Hansen et al., 1998). Increased can-cer mortality rates were also found for womenexposed in their environment or homes whencompared to the Western Australian femalepopulation (Reid et al., 2008). In a study onthe disease incidence in an Aboriginal popula-tion living in the Pilbara, one of the highestpopulation-based rates of environmental expo-sure was recorded at 250 per million at age15 and over. The exposure had mainly resultedfrom asbestos transport from the Wittenoomoperation (Musk et al., 1995). In 1999, theWestern Australian mesothelioma incidence ratewas the highest in the country at 47.7 casesper million, while the national annual incidencerate of 31.8 cases per million was the highestnational rate reported in the world (Leigh andDriscoll, 2003).
Because of the fiber-like structure of asbestos min-erals, they can penetrate deep into lungs when inhaledand cause significant damage to affected tissues. Thesix types of asbestos minerals listed above are listed asClass 1 carcinogens by world health authorities (IARC,1987) and are known to cause four main illnesses,
including asbestosis (chronic chest disease leading tofibrosis), benign pleural plaques (thickening of pleu-ral membranes), mesothelioma (cancer of the pleura),and lung cancer of the bronchial tubes, lung, and alve-oli. In addition, exposure to asbestos has been linkedto laryngeal cancer, diffuse pleural thickening as wellas cancers in the gastrointestinal tract. The toxicityof asbestos fibers is affected by three main factors:fiber dimension, biopersistence, and dose. The fiberdimension, i.e., the relationship between fiber lengthand fiber diameter, determines the place of deposi-tion in the lung. Smaller fibers or particles can reachdeeper down in the lung and those of a diameter <0.5μm are generally more likely to cross membranesand enter lymphatic and circulatory systems. Normallythese particles would be engulfed by macrophagesand transported out of the lungs, but because of thelength of these fibers, this function is inhibited. Asa result, enzymes, inflammatory mediators, oxidants,and other contents of the macrophages are releasedinto the lung where they can be toxic. With regardto fiber dimension, lung cancer has primarily beenassociated with fibers >10 μm in length and >0.15μm in diameter, mesothelioma with fibers >5 μm inlength and <0.1 μm in diameter while fibrosis has beenassociated with particles >5 μm in length (NationalInstitute of Occupational Health and Safety, 2007).Biopersistence of asbestos fibers in the lung is deter-mined by a number of factors including the site andrate of deposition, where a high rate can overwhelmmacrophages and affect toxicity, rate of clearance, par-ticle solubility, rate and pattern of breakage as wellas translocation across membranes. Chrysotile mineralfibers make up around 90% of the asbestos presenttoday. The chrysotile fibers are curly or wavy (serpen-tine asbestos) while the other asbestos forms have moreneedle-like straight and long fibers and are referred toas amphibole asbestos. Amphibole asbestos mineralsare usually dominating in mesothelioma cases, whilethe forms amosite and crocidolite are considered themost hazardous and can persist in the lungs for a longtime, even decades (National Institute of OccupationalHealth and Safety, 2007).
The use of amosite and crocidolite has been bannedin Australia since the mid-1980s. Chrysotile wasbanned by the end of 2003, and it is at present illegalto import, export, use, re-use, or sell any product con-taining any form of asbestos in Australia, but this bandoes not apply to products already in use. Since the clo-sure of Australia’s asbestos mines, the largest exposure

114 K. Ljung et al.
source today is from renovation of houses built fromasbestos-containing material. Australia is ranked 11thin the world for mesothelioma mortality rates becauseof the widespread use of asbestos-containing productsand the high rate of occupational exposure. Around10% of the cases have no known exposure source(Leigh and Driscoll, 2003) and it has been suggestedthat these cases may be due to naturally occurringasbestos (NOA) rather than from commercial products(Hendrickx, 2008). This hypothesis is supported by astudy from California that found significant correla-tions between mesothelioma and residential proximityto NOA (Pan et al., 2005).
In eastern Australia, around 0.2% of the land areahas potential asbestos-bearing rocks, and this propor-tion increases to around 2.5% of areas in southernAustralia (Hendrickx, 2008). It should be noted thatNOA does not constitute a health risk unless dis-turbed, but those working or living near new urbandevelopments as well as farmers, construction workers,and quarry workers whose activities routinely disturbsoil and rock may be at risk of excessive exposures(Hendrickx, 2008). For natural weathering of asbestosminerals, Hendrickx (2008) calculated an annualrelease rate of about 72.5 tons of asbestos across east-ern Australia, although it is unknown to which degreethe weathering products result in forms that consti-tute a risk for human health. Asbestos-bearing mineralshave been identified in Western Australia, Tasmania,South Australia, New South Wales, and Queensland.
A high incidence of malignant pleural mesothe-lioma has also been observed in New Caledonia. In acase–control study including all cases diagnosed withrespiratory cancers during 1993–1995, a significantassociation was found between mesothelioma and theuse of a whitewash produced from asbestos-bearingminerals (Luce et al., 2000). A subsequent studyincluding all mesothelioma cases between 1984 and2002 demonstrated a significant relationship betweenmesothelioma and chrysotile in soil, which is in turna likely constituent of the whitewash (Baumann et al.,2007).
Metals and Mental Health
Australia is the world’s third largest producer of man-ganese ore, holding 12% of the world’s economically
Fig. 5 Map of Australian manganese mines, 2008. Adaptedfrom Geoscience Australia: © Commonwealth of Australia(Geoscience Australia) [2009] http://www.ga.gov.au/servlet/BigObjFileManager?bigobjid=GA3030
demonstrated resources of manganese (GeoscienceAustralia, 2003; McKay et al., 2008). Manganese ismined at three main sites, of which one is located inWestern Australia and two in the Northern Territory(Fig. 5). The largest supplier of manganese ore isthe mine in Groote Eylandt, which produces 10% ofthe world’s high-grade manganese ore (BHP Billiton,2008).
Manganese, albeit an essential element, is a knownneurotoxin. A Parkinson-like disease, manganism, wasfirst noted in 1837 in five pyrolusite mill workers andhas since been reported in hundreds of occupation-ally exposed workers (Mergler, 1999; World HealthOrganization, 2004). Excessive manganese exposurehas also been linked to learning disabilities in children(Collipp et al., 1983; Takser et al., 2003; Wassermanet al., 2006; Ericson et al., 2007), manganism in elderlyexposed from drinking water (Kondakis et al., 1989),and to a neurological disease among an Aboriginalcommunity of Groote Eylandt in the Northern Territoryof Australia (Purdey, 2004), known locally as “birddisease” with features similar to the neurodegen-erative disease amyotrophic lateral sclerosis, ALS(Donaldson, 2002). The disease has also been locallycalled the Groote Eylandt syndrome, but its propername is Machado Joseph disease (MJD), or spinocere-bellar ataxia type 3 (SCA3) a rare incurable hereditary

An Overview of Medical Geology Issues in Australia and Oceania 115
neurodegenerative disease that affects a disproportion-ately large population of the island.
Machado Joseph disease was first described inthe Azores Islands 1972, when two families ofPortuguese/Azorean descent, Machado and Joseph,were described with the unique symptoms of the dis-ease. The Azorean Island of Flores holds the highestprevalence of the disease in the world, with 1 in 140affected, and the prevalence is generally highest amongpeople of Portuguese/Azorean descent. For this reasonit has been hypothesized that the disease was intro-duced into Groote Eylandt and the area by visiting fish-ermen from Sulawesi, many of whom have Portugueseancestry (Burt et al., 1993). However, MJD has beenidentified among a diverse array of ethnic popula-tions around the world, also in families of isolatedareas with no apparent Portuguese descent (Purdey,2004; National Institute of Neurological Disorders andStroke, 2008).
The familial motor symptom disorders resemblingthose later attributed to MJD have been reported inAboriginal communities of the east Arnhem land inthe Northern Territory of Australia since the 1960s(Kiloh et al., 1980; Burt et al., 1993; Burt et al.,1996; Purdey, 2004). In 1980, Kiloh and cowork-ers reported 13 cases of neurological disorder withup to 28 years duration in a population of approxi-mately 1,100 Aborigines living on Groote Eylandt andits adjacent mainland. The authors hypothesized thecausative mechanisms to be both genetic and environ-mental, recognizing the large manganese deposits onthe island, which had been mined by open-cut meth-ods since 1962; the main staple food of the toxic cycadnuts; and the ingestion of clay cakes for medicinal andother purposes likely holding high concentrations ofmanganese (Kiloh et al., 1980).
Purdey strongly supported the hypothesis of anenvironmental cause of the disease and suggested thatthe primary cause for the MJD expansion mutation isinitiated by external environmental and dietary factorswhich bring about an excess of manganese and defi-ciency of magnesium in the human body. He testedthis hypothesis by carrying out an epidemiological andenvironmental study on affected Aboriginal commu-nities on Groote Eylandt and Azorean communities.The study included a survey on dietary, occupational,and lifestyle status as well as analysis of soil, water,and staple foods for a range of trace elements. Itwas suggested that the onset of the disease on Groote
Eylandt in the 1960s was attributed to the 1942 reloca-tion of the community from low- to high-manganeseareas and also to the development of the area intoan open-cut manganese mine in 1962, resulting in amajority of the population residing in close proximityto a dusty dump of manganese ore (Kiloh et al., 1980;Purdey, 2004). The vegetables grown locally held amanganese concentration of around 1,000 mg/kg, tobe compared with yams from non-MJD areas hav-ing a mean concentration of around 30 mg/kg. Inaddition, the customary cooking practice involved cov-ering the food with soil, further increasing manganeseexposure (Purdey, 2004). In contrast, the magnesiumintake was generally low for the populations due tolow concentrations in soil, food, and water, and bodystores were likely further depleted from excessive useof culinary salt.
It is generally recognized that manganese can read-ily substitute for magnesium binding sites involved inthe catalysis of certain key enzymes and vice versa.Within normal cells, the concentrations of magnesiumions greatly exceed that of manganese ions. Wheneverthis balance is upset, the resulting inactivation ofenzyme groups dependent on this balance can havedevastating consequences. Endonuclease-1 is one suchenzyme whose active centers require a combination ofmagnesium and manganese for catalysis to proceed.This enzyme protects against the expansion and con-traction of the same CAG trinucleotide repeats thatare implicated in MJD pathogenesis. Since two mag-nesium ions are needed for the successful catalysis ofendonuclease-1, Purdey proposed that the manganese-loaded/magnesium-depleted individual fails to activatethis enzyme, thereby leading to the development ofthe expansion mutation of the ataxin-3 protein that hasbeen heralded as the central core of MJD pathogenesis(Purdey, 2004).
The extensive study by Purdey suggests that whileMJD is indeed a genetic disorder, its onset and clinicalmanifestations are exacerbated by a geologic environ-ment which simultaneously provides excessive man-ganese and deficient magnesium. Indeed, the GrooteEylandt is the site of one of Australia’s three mainmanganese mines, and the open-cut mine is located inthe village of Angurugu, which is also the residence ofmost of those on Groote Eylandt who suffer from MJD(Cowan, 2006).
In a review on “manganese madness” by Donaldson(2002), it is suggested that several clusters of

116 K. Ljung et al.
neurological disorders in the Australia and Oceaniaregion may be derived from a geologic anomaly con-nected to Groote Eylandt by a line running throughapproximately 140◦ longitude. This anomaly has highmanganese and/or aluminum concentration and lowmagnesium and/or calcium. Studies have revealed acorrelation between a high incidence of motor neurondisorders in Western Pacific regions with low concen-trations of calcium and magnesium in soil and water.The role of calcium is likely its disruption of criti-cal absorptive processes which results in the otherwiseregulated uptake from food and water becoming toxic(see also Section “Lytico-Bodig – A Medical GeologyDisease?”).
Natural Hazards
The Pacific Ring of Fire encompasses a horseshoe-shaped area in the Pacific Ocean in which frequentearthquakes and volcanic eruptions occur (see Fig. 6).It is estimated that 75% of the world’s active anddormant volcanoes are situated within the Ring ofFire, which also experiences 80% of the world’s earth-quakes, including 90% of the world’s largest ones.
Many of the countries of Oceania are situated in theRing of Fire and are subsequently affected by someof the 452 volcanoes within this area. The naturalactivities which impact on human health include earth-quakes, volcanic eruptions and landslides, as well astsunamis, caused by movements generated from theseactivities.
Earthquakes and Tsunamis
In New Zealand, around 14,000 earthquakes shakethe ground every year, although only around 150–200are large enough to be felt at the surface (Te Ara,2007). In the last 150 years, eight major earthquakeshave caused considerable damage and killed around300 people. Most deaths occurred as a result of col-lapsing buildings and falling debris, but collapsingmines, landslides, and mudflows have also caused fatalinjuries. The earthquake that caused the most fatalitiesin New Zealand occurred in 1931 with a magnitude of7.8, when 256 people died in the Hawke’s Bay regionand thousands more were injured as the cities of Napierand Hastings were devastated (Fig. 7). As a result of
Fig. 6 The Ring of Fire – earthquakes and volcanic activities in the Pacific Ocean. Image courtesy of the US Geological Survey

An Overview of Medical Geology Issues in Australia and Oceania 117
Fig. 7 Post office damaged by the 1931 earthquake in Hastings,New Zealand Courtesy of Alexander Turnbull Library
the devastation caused by collapsing buildings, guide-lines were developed for safer buildings which werethe forerunners of the building codes used throughoutNew Zealand today (Te Ara, 2007).
Earthquakes also commonly occur in other regionsof Oceania. The World Data Center for Seismology hasrecorded numerous earthquakes in Vanuatu, SolomonIslands, Guam, Australia, Tonga, and other islands inthe Pacific although few resulted in serious disasters.In Papua New Guinea, 18 earthquakes were reportedbetween 1998 and 2007. Six of them (in 1987, 1993,1995, 1998, 2000, and 2002) were reported to the UNOffice for the Coordination of Humanitarian Affairs(OCHA), which gathers information on humanitarianemergencies and disasters. An earthquake in 1998,which struck 25 km off the Papua New Guinea coastwith a magnitude of 7.0, caused an undersea landslidewhich in turn caused a tsunami. When the tsunamihit the coast, over 2,000 people were killed, thou-sands were injured and almost 10,000 were madehomeless (US Geological Survey, 1998). Accordingto the Intergovernmental Oceanographic Commission(IOC), around 60% of all tsunamis take place inthe Pacific Ocean and are mainly caused by under-sea earthquakes (Intergovernmental OceanographicCommission, 2008). More recently, on September 29,2009, an earthquake of magnitude 8.0 occurred off thecoast of Samoa, triggering a tsunami which resulted inat least 110 people killed in Samoa, 22 in AmericanSamoa, and 7 in Tonga and was felt as far awayas Wallis and Futuna Islands (US Geological Survey,2009).
Volcanic Eruptions
It has been estimated that around 300,000 people havebeen killed in the past 400 years as a result of vol-canic eruptions. At present, more than 500 millionpeople, or 10% of the world’s population, live within100 km of an historically active volcano (Feldman andTilling, 2007). More than half of the world’s activevolcanoes above sea level are found in the Ring ofFire. However, the definition of an “active” volcanovaries with the time frame being considered: accordingto the Smithsonian Institute, around 20 volcanoes areerupting now, 50–70 each year, 150 each decade, andaround 550 eruptions have occurred historically, whichimplies that the event was documented (SmithsonianInstitute, 2009). Death and disease from volcanic erup-tions have resulted from physical injury from ejecta,lava, lahars, and tephra and also from indirect phys-ical injuries similar to those of earthquakes, includ-ing collapsing buildings. The health hazards relatedto volcanic eruptions are not only the result of theactual eruption but also due to emissions of poten-tially toxic substances in the periods between eruptions(Hansell et al., 2006). According to Feldman andTilling (2007), approximately 70% of fatalities asso-ciated with volcanoes are due to direct impacts oferuptions, such as pyroclastic flows, lahars, tsunamis,and toxic gases, while the remainder historically hasbeen caused by post-eruption famine and disease epi-demics. Health effects of a non-physical character,such as increased exposure to metals and volcanicashfalls, will be discussed in “Geologic Emissions”below.
During the 20th century, 490 volcanic events aroundthe world resulted in impacts on 4–6 million people,including the destruction of homes and evacuation.Around half of the events had fatal outcomes, resultingin the deaths of 80,000–100,000 people (Hansell et al.,2006). In the Oceania region, the Relief Web of theUnited Nations registered 10 volcano-related emergen-cies in Papua New Guinea between 1984 and 2006 and5 in Vanuatu between 1995 and 2008. Several of thesereported cases of respiratory and eye irritation com-plaints and a risk for contamination of water suppliesand crops from ashfalls (Global Identifier Number,2009). In New Zealand, the deadliest eruption in recenthistory was the Tarawera eruption of 1886. At the time,it was not realized that the mountain was a volcano,

118 K. Ljung et al.
and tourists were drawn to the many hot springs inthe area, especially the Pink and White Terraces on theshore of Lake Rotomahana. In an eruption lasting lessthan 6 h, a 17 km rift spewed steam, mud, and ash cov-ering hundreds of square kilometers (Te Ara, 2007).Where the terraces had once been, a 100-m deep craterwas now opened up. Steam eruptions continued formany months and within 15 years, the crater had filledup with water, and a new and larger Lake Rotomahanatook form (Te Ara, 2007).
The Ring of Fire coincides with some of themost populated areas in the world, and as the globalpopulation increases, the risk for catastrophic resultsfrom future eruptions is considerable. Lava flows onlyaccount for a small part of the fatalities of volcanoeruptions, given that these are often predictable andallow time for evacuation. Larger numbers of peopleare affected by destroyed crops and animal food sup-plies, contaminated water supplies, and air pollutedby volcanic ash (Hansell et al., 2006). Another threatis from lahars, an Indonesian term for volcanic mud-flows, which form when water mixes with hot or coldvolcanic debris to a consistency similar to wet con-crete. They can travel very rapidly down the flank of avolcano and are extremely dangerous as they can formnot only before, during, or after an eruption but also bynon-eruptive forces such as heavy rainfall and earth-quakes (Box 5). Any settlements in the path of thesemudflows can be rapidly buried (Feldman and Tilling,2007).
Box 5 Lashing Lahars
Lahars present an ongoing threat to communi-ties and travelers near Mount Ruapehu in NewZealand. In 1953, a railway bridge was smashedfrom a lahar flowing down the side of themountain just minutes before a passenger trainapproached, resulting in 151 deaths. Smallerlahars reportedly traveled down the mountain-side in 1969, 1971, 1995, and 1996. Thanks toan early warning system, no one was injuredin 2007 when a lahar again flowed down themountainside to form a river of mud 30–40 macross, which rose 6–8 m above an access bridge(Earth Observatory, 2008). While no injurieswere reported during the increased activity of
Ruapehu in 1995/1996, it had large impacts onthe local economy as the popular ski areas hadto be closed, power supply was frequently inter-rupted by ashfalls, and traffic had to take detours.Ashfalls also intermittently disrupted air travel inthe North Island of New Zealand, with financiallosses of NZ$2.4 million (Te Ara, 2007).
Geologic Emissions
Dust
The issue of dust and associated disease in theAustralia and Oceania region is mainly limited to theAustralian continent. Approximately 40% of the landarea is in the arid zone, covered by dunes, playa lakes,and other desert landforms which all represent majorsources of dust (Greene et al., 2001). Dust stormsoccur frequently in Australia and are for the most partrestricted to the inland areas where significant amountsof topsoil are uplifted by the wind, with devastatingconsequences in arable areas (Fig. 8). With respect to
Fig. 8 Dust storm over eastern Australia, February 2, 2005.An estimated 5 million tons of topsoil was blown away inQueensland and plumes of windblown dust can be seen in thebottom left corner, escaping from the dry salt pan lake bed ofLake Eyre (Earth Observatory, 2005a)

An Overview of Medical Geology Issues in Australia and Oceania 119
human exposure, the effects of dust storms are mainlyobserved in drought years when huge amounts of dustcan be transported by wind to the more densely popu-lated coastal areas. Many dust storms were generatedduring the extended drought of the 1930s and 1940s(Bureau of Meteorology, 2009a, b). In Sydney in 1944,the dust falls were sufficiently severe for city lights tobe turned on in the afternoon, and railway lines wereblocked by sand. In Adelaide, several dust storms inDecember of the same year disrupted train traffic andalso required lights to be turned on, in some cases earlyin the morning. In January of the following year, anumber of dust storms struck both New South Walesand Victoria, resulting in power cuts and four childrenlosing their way home from school, only to be foundafter the storm had subsided. After a continued droughtinland, the sun over Melbourne appeared blue throughthe dust in late March of 1945 (Bureau of Meteorology,2009c). Box 6 describes one of the worst dust stormevents in modern time, which descended on the city ofMelbourne in 1983 (Fig. 9).
Box 6 Dusty Dawn – Melbourne,February 1983
Late in the morning of February 8, 1983,a strong, but dry, cold front began crossingthe state of Victoria, preceded by hot, gustynortherly winds. It was an El Nino year andthe normally dry sandy areas of Mallee andWimmera located west of Melbourne wereexceptionally dry. The loose topsoil was quicklyuplifted by the wind and eventually grew intoa massive cloud of dust as the front movedeast. By 11 am, the dust cloud was visible atHorsham, in western Victoria; an hour later ithad obscured the sky. In Melbourne, the temper-ature rose quickly as the north wind strengthenedand had reached a February maximum of 43.2
◦C
(109.8◦F) by mid-afternoon. Half an hour later,
at 3 o’clock, visibility was reduced to 100 mas a spectacular reddish-brown cloud reachedMelbourne, accompanied by a rapid tempera-ture drop and a wind strong enough to uproottrees and unroof about 50 houses (Fig. 9). Theworst of the dust storm was over by 4 o’clockwhen the wind speed dropped rapidly (Bureauof Meteorology, 2009c).
At its height, the dust storm extended acrossthe entire width of Victoria. The dust cloud wasup to 320 m deep when it struck Melbourne,but in other areas extended thousands of metersinto the atmosphere. It was estimated that about50,000 tons of topsoil was stripped from theMallee – about a fifth was dumped on the city –leaving the ground bare and clogging open waterchannels with sand and dirt (Australian Bureauof Statistics, 2008b).
The enormous volumes of dust transported by windand deposited around Australia increase the load ofinhalable dust in the air, which may cause ill-health(Greene et al., 2001). Few studies have been conductedon the associations between naturally occurring par-ticulate exposures and respiratory health outcomes, asmost studies on respiratory disease have focused onurban emissions. However, a number of dust eventsnear Brisbane between 1992 and 1994 were signif-icantly associated with changes in asthma severityalthough general relationships were not determined(Rutherford et al., 1999). In a study on respiratoryhealth of two remote Aboriginal communities inWestern Australia, the community located in the cen-tral desert had greater prevalence of respiratory mor-bidity than the one from a coastal community in thetropical north. The differences were not explained bydoctor-diagnosed asthma, allergy, or increased airwayresponsiveness and were present despite the lowerprevalence of cigarette smoking in the desert commu-nity adults. It was concluded that other environmental
Fig. 9 Dust storm over Melbourne 1983. Photograph courtesyof Trevor Farrar (Bureau of Meteorology, 2009c)
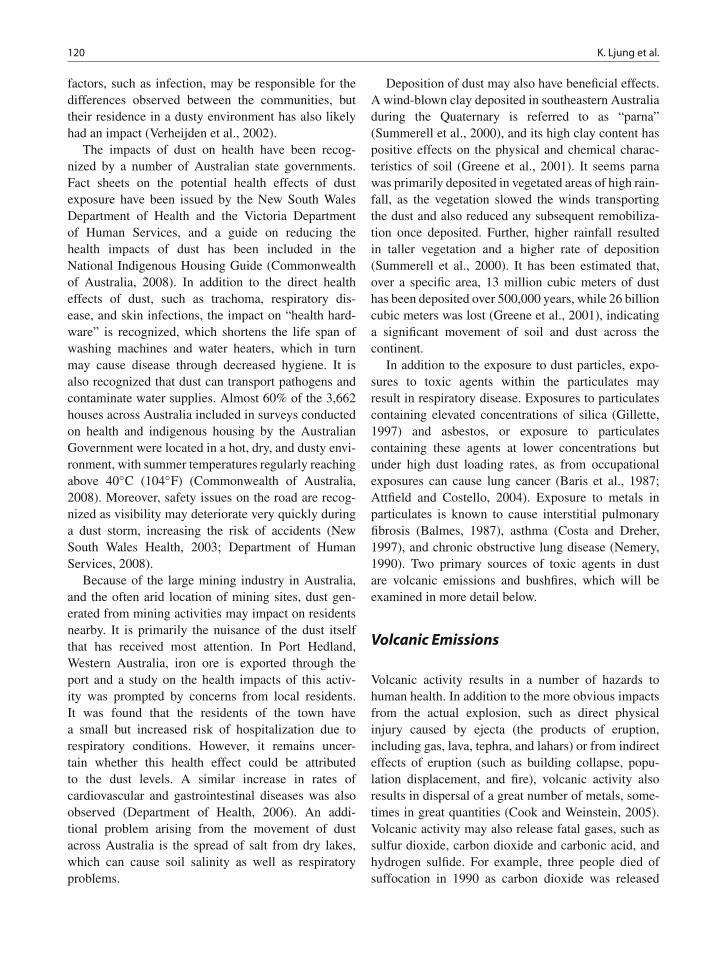
120 K. Ljung et al.
factors, such as infection, may be responsible for thedifferences observed between the communities, buttheir residence in a dusty environment has also likelyhad an impact (Verheijden et al., 2002).
The impacts of dust on health have been recog-nized by a number of Australian state governments.Fact sheets on the potential health effects of dustexposure have been issued by the New South WalesDepartment of Health and the Victoria Departmentof Human Services, and a guide on reducing thehealth impacts of dust has been included in theNational Indigenous Housing Guide (Commonwealthof Australia, 2008). In addition to the direct healtheffects of dust, such as trachoma, respiratory dis-ease, and skin infections, the impact on “health hard-ware” is recognized, which shortens the life span ofwashing machines and water heaters, which in turnmay cause disease through decreased hygiene. It isalso recognized that dust can transport pathogens andcontaminate water supplies. Almost 60% of the 3,662houses across Australia included in surveys conductedon health and indigenous housing by the AustralianGovernment were located in a hot, dry, and dusty envi-ronment, with summer temperatures regularly reachingabove 40◦C (104◦F) (Commonwealth of Australia,2008). Moreover, safety issues on the road are recog-nized as visibility may deteriorate very quickly duringa dust storm, increasing the risk of accidents (NewSouth Wales Health, 2003; Department of HumanServices, 2008).
Because of the large mining industry in Australia,and the often arid location of mining sites, dust gen-erated from mining activities may impact on residentsnearby. It is primarily the nuisance of the dust itselfthat has received most attention. In Port Hedland,Western Australia, iron ore is exported through theport and a study on the health impacts of this activ-ity was prompted by concerns from local residents.It was found that the residents of the town havea small but increased risk of hospitalization due torespiratory conditions. However, it remains uncer-tain whether this health effect could be attributedto the dust levels. A similar increase in rates ofcardiovascular and gastrointestinal diseases was alsoobserved (Department of Health, 2006). An addi-tional problem arising from the movement of dustacross Australia is the spread of salt from dry lakes,which can cause soil salinity as well as respiratoryproblems.
Deposition of dust may also have beneficial effects.A wind-blown clay deposited in southeastern Australiaduring the Quaternary is referred to as “parna”(Summerell et al., 2000), and its high clay content haspositive effects on the physical and chemical charac-teristics of soil (Greene et al., 2001). It seems parnawas primarily deposited in vegetated areas of high rain-fall, as the vegetation slowed the winds transportingthe dust and also reduced any subsequent remobiliza-tion once deposited. Further, higher rainfall resultedin taller vegetation and a higher rate of deposition(Summerell et al., 2000). It has been estimated that,over a specific area, 13 million cubic meters of dusthas been deposited over 500,000 years, while 26 billioncubic meters was lost (Greene et al., 2001), indicatinga significant movement of soil and dust across thecontinent.
In addition to the exposure to dust particles, expo-sures to toxic agents within the particulates mayresult in respiratory disease. Exposures to particulatescontaining elevated concentrations of silica (Gillette,1997) and asbestos, or exposure to particulatescontaining these agents at lower concentrations butunder high dust loading rates, as from occupationalexposures can cause lung cancer (Baris et al., 1987;Attfield and Costello, 2004). Exposure to metals inparticulates is known to cause interstitial pulmonaryfibrosis (Balmes, 1987), asthma (Costa and Dreher,1997), and chronic obstructive lung disease (Nemery,1990). Two primary sources of toxic agents in dustare volcanic emissions and bushfires, which will beexamined in more detail below.
Volcanic Emissions
Volcanic activity results in a number of hazards tohuman health. In addition to the more obvious impactsfrom the actual explosion, such as direct physicalinjury caused by ejecta (the products of eruption,including gas, lava, tephra, and lahars) or from indirecteffects of eruption (such as building collapse, popu-lation displacement, and fire), volcanic activity alsoresults in dispersal of a great number of metals, some-times in great quantities (Cook and Weinstein, 2005).Volcanic activity may also release fatal gases, such assulfur dioxide, carbon dioxide and carbonic acid, andhydrogen sulfide. For example, three people died ofsuffocation in 1990 as carbon dioxide was released

An Overview of Medical Geology Issues in Australia and Oceania 121
from a vent of the side of the volcano Tavurvur inPapua New Guinea. Three more people died when try-ing to retrieve the bodies (Global Volcanism Program,1990). In spite of the potentially large impact onhuman health from volcanic gases, a recent system-atic review found few primary studies (Hansell andOppenheimer, 2004). However, with regard to the geo-logical activity in the Australia and Oceania region,it can be assumed that health effects described else-where from volcanic emissions are likely to also affectthe Pacific population. For example, the Ambrym vol-cano on Vanuatu was the site of the most significantpoint source of sulfur dioxide on the planet in the firstmonths of 2005. The emissions were not due to a largeeruption but rather to leaking from passive or non-eruptive emissions. The resulting acid rain killed cropsand contaminated water supplies, leaving the popula-tion dependent on food aid (Earth Observatory, 2005b).
Gaseous Emissions
Carbon dioxide and hydrogen sulfide are both highlytoxic gases that are released from volcanic eruptionsand because they are denser than air they can col-lect in low-lying areas. Carbon dioxide can causeunconsciousness and death if inhaled at high concen-trations (>20–30%) while hydrogen sulfide can causedeath after a single breath if concentrations are high(Feldman and Tilling, 2007). Asphyxiation has beenreported from accumulations of hydrogen sulfide andcarbon dioxide from volcanic and geothermal sourceswhile chronic exposure to hydrogen sulfide has beenassociated with increases in nervous system and res-piratory diseases (Hansell and Oppenheimer, 2004).Sulfur dioxide and acid aerosols from eruptions anddegassing events have been associated with respiratorymorbidity and mortality in those with pre-existing dis-ease. In a recent epidemiological study on exposureto volcanic sulfur dioxide emissions, 35% of the 335participants perceived health effects from a volcaniceruption, and increased risk estimates were associatedwith a number of both self-reported and diagnosedcardiorespiratory diseases (Longo, 2009). Hydrogenfluoride is also emitted from volcanic activity andalthough there have been no fatalities reported as adirect result of its exposure, it can cause crop fail-ure and death of livestock, with subsequent famine(Feldman and Tilling, 2007).
In Rotorua, New Zealand, the population is con-tinuously exposed to geothermal emissions. A healthassessment conducted in the town found exposure–response trends, particularly for nervous system, res-piratory, and cardiovascular diseases (adjusted for age,ethnicity, and gender) (Bates et al., 2002). Theseresults are supported by the findings of a spatial analy-sis of respiratory disease in the same area, where clus-ters of increased relative risk for obstructive pulmonarydisease coincided with geothermal fields (Durand andWilson, 2006). A study conducted in Hawaii alsofound significant associations between cardiorespira-tory diseases and chronic exposure to sulfur-containingvolcanic emissions (Longo et al., 2008). Both of thetwo latter studies concluded that there is an urgent needfor further community studies and for greater collabo-ration between epidemiologists and volcanologists.
Volcanic Ashfalls
Ash from volcanoes does not refer to the burnt sub-stances often regarded as ash, but instead to ejectedparticles, including very fine material that may beinhaled. Although inhalation of ash may be a relativelybenign health hazard to healthy individuals as the par-ticles are often too large to inhale, and any high-dustconcentrations settle relatively quickly, the fine ashfraction can be dangerous to individuals with asthma orother respiratory diseases (Feldman and Tilling, 2007).For example, the 1995/1996 Ruapehu eruption in NewZealand resulted in the deposition of 7 million tonsof ash over North Island and the principal health out-come was a 44% increase in hospital admissions forbronchitis (Cook and Weinstein, 2005). Another issuewith regard to ashfall is the risk of death or injuryfrom house collapse since as little as 10 cm on a flatroof may cause its collapse, especially if it gets wet(Fig. 10). The 1991 eruption of Mt. Pinatubo in thePhilippines unluckily coincided with a typhoon whichresulted in the killing of at least 300 people from col-lapsing roofs due to ashfall. Ash may also increaseinjuries from road accidents as visibility decreases androads become slippery (Feldman and Tilling, 2007).
One of the most severe consequences of ashfalls isthe destruction of crops and other vegetation and itscontamination of waterways. According to Feldmanand Tilling (2007) famine from destroyed crops wasthe number one cause of death associated with volcanic

122 K. Ljung et al.
Fig. 10 Vehicles buried in ash in the 1994 Rabaul erup-tion, Papua New Guinea. Courtesy of Cascades VolcanoObservatory/US Geological Survey
activity before the 20th century. For example, while10,000 people died from direct injuries during thelargest historical eruption on Earth, in Indonesia in1815, over 82,000 died from disease and starva-tion as a result of ruined crops. In 1865, the Maoritold of how the eruption of Mt. Ngauruhoe in NewZealand resulted in several inches of black dust cov-ering the ground and how the fish living in a smalllake in the area had been poisoned by the ash (TeAra, 2007). Nearby, ashfall from the eruption ofMt. Ruapehu in 1945 gave rise to “Ruapehu throat”(throat irritation) and eye irritation. Ash also killedcrops, contaminated water supplies, and affected stockas pastures were rendered inedible by the ash cover.Dry ash was stirred up from the ground and in addi-tion to being a nuisance, it damaged machinery. Asa result, the New Zealand army had to move 700vehicles from its base in the Ruapehu area (Te Ara,2007).
Volcanic eruptions may also contribute to the mobi-lization of harmful metal and halide ions. In a reviewon water contamination from ashfalls and subsequenthealth issues, it was concluded that fluoride was themain element of concern together with an increasedrisk for infectious disease outbreaks due to inhibiteddrinking water disinfection (Stewart et al., 2006). Ina simple model of the impact from the 1995/1996Ruapehu eruptions on water supplies, it was foundthat there was a risk of exceeding World HealthOrganization (WHO) drinking water guidelines foriron, aluminum, and manganese. Whereas guidelinevalues for iron and aluminum are set as aesthetic lim-its, the value for manganese in drinking water is set
with regard to the increased risk for neurological dam-age (World Health Organization, 2004). In a study onWhite Island in New Zealand, an active offshore vol-cano serving as research station and tourist attraction,10 volunteers measured increased urinary aluminumafter only 20 min exposure (Durand et al., 2004). In aseparate study of volcanic ash effects on public healthin Vanuatu, it was found that drinking water suppliesexceeded guidelines for fluoride, even in times of lowvolcanic activity, increasing the risk for chronic den-tal and skeletal fluorosis (Cronin and Sharp, 2002). Ingeneral, acute health effects from volcanic emissionshave been the focus of past epidemiological researchbecause they are easier to detect. In contrast, little workhas been conducted on the long-term effects of livingclose to a volcano. Metal exposure from such eventshas been suggested as an under-evaluated health riskrelated to volcanoes (Cook and Weinstein, 2005).
Bushfire
Particulates released from wildland fires can includea mix of smoke particles derived from vegeta-tion combustion and soil particles brought intothe plume through convective updrafts: combustion-derived organic compounds such as polycyclic aro-matic hydrocarbons may thus mix with mercury andother metals, as well as crystalline silica or asbestos ifsuch minerals are components of the underlying soils.Wildfire ash and burned soils can be the source of dustwith elevated levels of some metals. The types andabundances of the metals or metalloids are a functionof the underlying bedrock geology, soil type, vegeta-tion burned, and intensity of the burn. Dust from areasrecently burned by wildfires may contain elevated lev-els of wildfire ash, which is a well-known source ofcaustic alkalinity that can lead to similar irritationof the eyes, respiratory tract, and skin (Plumlee andZiegler, 2007).
Bushfires are naturally occurring events across theAustralian continent at any time of the year, with thegreatest extent of bushfires occurring in the savannasof northern Australia and in the southeastern cor-ner of the continent, south of a line from Sydney toAdelaide. Due to climatic variation across the nation’svast land mass, the bushfire seasons vary in differentparts of Australia (Fig. 11). In southeastern Australia,

An Overview of Medical Geology Issues in Australia and Oceania 123
Fig. 11 Bushfire seasonsacross Australia (Bureau ofMeteorology, 2006)
including Tasmania, the major fire season is summerand early autumn; in coastal New South Wales andsouthern Queensland, spring and early summer; andin much of northern Australia, winter and spring. Inthe arid zones of Australia large fires most commonlyoccur in the months following an abnormally wet sea-son, when there is enough vegetation to provide fuel(Bureau of Meteorology, 2006).
For more than 40,000 years, Aboriginal people haveused fire for a variety of purposes, including signal-ing, game hunting, cooking, tree felling, illumination,and clearing the land to stimulate re-growth of nativegrasses (Singh and Geissler, 1985). The journals ofearly navigators contain many references to the sight-ing of smoke along the Australian coastline. In theGeelvinck, a ship’s log from Willem De Vlamingh’sDutch expedition to Terra Australis (1696–1697),Rottnest Island outside Perth in Western Australia isreferred to as Mist Eiland (Fog Island). It is suggestedthat the island came into view through a haze of smokeblown from the mainland, where many bushfires, litby the Aborigines, were then burning (Playford, 1998).The consistent observation of the first explorers was ofopen forests and woodlands with grassy understorey,with an impression of an annual conflagration during
the fire season. In May 1770, Captain James Cookdescribed the vegetation and country on Botany Bay’ssouthern shore as follows:
The moors looked like our moors in England and as notrees grew upon it but everything was covered with a thinbrush of plants about as high as the knees (Banks, 1770).
Cook’s description fits with vegetation which isburned annually or, in the case of heathlands, every2 or 3 years (Cheney, 1995). These observationswere repeated by other explorers, who referred fre-quently to fires smoldering or raging, according tothe nature of the fuel conditions. During the 19thcentury, Australia underwent a process of sparse set-tlement, largely through use of axes and fire sticks tocarve small farms out of the bush. Despite the generalview that European settlement increased the frequencyof bushfires in Australia, it is clear from historicalevidence that as settlement increased, fire frequencydecreased. However, as a result, the fuels built up and,consequently, fires that did occur were more intensethan those under the Aboriginal annual burning regime(Luke and McArthur, 1978).
Bushfires are caused by natural processes, humanactivities, or a combination of both. Lightning strikes

124 K. Ljung et al.
are the cause of virtually all naturally occurringbushfires and account for approximately 26% of allbushfires on public land in Victoria (Department ofSustainability and Environment, 2009). Most otherbushfires start as a result of human activity and includeboth deliberate and accidental ignitions.
The state of Victoria has experienced the most dev-astating fires in Australian history. The greatest devas-tation occurred on “Black Friday” in 1939, when firesburned in almost every part of the state. Townshipswere destroyed and others badly damaged, and ash andsmoke reached as far as New Zealand (Department ofPrimary Industries, 2004). The “Ash Wednesday” firesof February 16, 1983, are Australia’s most well-knownbushfires and caused severe damage in Victoria andSouth Australia. Nearly 400,000 ha of land wereburned, and property damage was estimated at approx-imately $200 million (Department of Sustainabilityand Environment, 2006). Most recent is the “BlackSaturday” bushfires in Victoria in February 2009. Witha death toll of 210, and an area of 450,000 ha burned,this is the worst disaster in recorded history in 110years in Australia.
Many epidemiological studies worldwide havedemonstrated a consistent association between parti-cle air pollution from bushfire smoke and respiratorydisease. Yet, only four of six Australian studies haveshown an association between bushfire smoke and res-piratory health outcomes, such as asthma (Churchesand Corbett, 1991; Cooper et al., 1994; Smith et al.,1996; Jalaludin et al., 2000; Johnston et al., 2002;Chen et al., 2006). Given the high frequency andseverity of bushfires in Australia, and the impact onboth the environment and the population, it is evidentthat bushfires play a key role in the lives of manyAustralians. Whether it is through the destruction ofland and structures, the devastating effects on floraand fauna, or the injuries and loss of human life, theimpacts of bushfires are dramatic, extensive, and mayhave long-term consequences.
Soil
Soil quality can have profound effects on humanhealth. It influences the degree of human exposure toboth potential contaminants and beneficial elementsthrough its role as substrate for plant growth; it acts
as a natural filter for drinking water and a contribu-tor to the dust load in ambient air. The main exposurepathway to soil is through ingestion, which primar-ily occurs involuntarily and can give rise to diseaseslinked to bacteria in the soil as in the case of melioi-dosis discussed below, or through toxic exposure tometals. Soil may also be ingested deliberately and thisbehavior is referred to as geophagia or geophagy. It hasbeen reported from all parts of the world and thereare various explanations for its practice. In additionto the diseases that result from the natural interactionwith soil in our everyday lives, human interferencewith the landscape may interrupt ecosystems and resultin sometimes unexpected effects on human health. Inthis section, both the natural impact on human healthfrom soil and impacts resulting from human interfer-ence will be explored in the settings of Australia andOceania.
Acid Sulfate Soils
Acid sulfate soils are naturally occurring soils con-taining sulfidic minerals which, when in contact withair, oxidize to produce sulfuric acid. The acid pro-duced causes a significant drop in soil pH, an increasein soil metal mobility, and a decrease in soil nutri-ent availability (Dent, 1986). For these reasons, theirimpact on vegetation as well as water quality is severe,with reported soil scalds (areas lacking vegetation) andmassive fish kills (Brown et al., 1983; Callinan et al.,1993; Russell and Helmke, 2002; Rosicky et al., 2004;Fältmarsch, 2006; Stephens and Ingram, 2006; Whiteet al., 2006). The main impact of acid sulfate soilsonce disturbed constitutes the increased mobility ofacid and metals, which may pollute drinking watersources with potentially toxic elements and result infood shortages through ruined crops and killing ofaquatic organisms. Acid sulfate soil scalds are rela-tively minor on a global scale, but may have impactson air quality on a local scale through increased dustgeneration and thereby respiratory health. In Australia,an increase in vector-borne diseases including theRoss River and Barma viruses has been reportedbecause of the preferred breeding patterns of disease-carrying mosquitoes in acidic pools (Broom et al.,2000; Macdonald et al., 2006). Figure 12 shows therange of direct and indirect impacts of improper

An Overview of Medical Geology Issues in Australia and Oceania 125
Fig. 12 Environmentaleffects of acid sulfate soildisturbance, correspondingecosystem services that maybe affected, and adverseimpacts on human well-being(adapted from Ljung et al.,2009)
management of acid sulfate soils on ecosystems andhow these impacts in turn affect human health andwell-being.
Acid sulfate soils have been identified as a majorproblem in coastal areas of Australia, as almost allof its coastal land is underlain by sediments contain-ing iron sulfide minerals. These floodplains are underpressure from both urban and agricultural develop-ment. About 80% of Australians currently live in thecoastal zone, with 25–30% of the coastline being sub-jected to increasing development expected to continueover the next 5 decades (White et al., 1999). Thecoastal floodplains on the eastern coast of Australiawere the first to be developed for agriculture follow-ing European settlement because of their favorableclimate and environmental conditions (White et al.,2006). The government actively encouraged develop-ment and flood mitigation through drainage and floodgates which successfully controlled excess water, buthave resulted in severe water quality and ecologi-cal problems (White et al., 1999). In Queensland,drainage for sugarcane production has resulted in therelease of 72,000 tons of sulfuric acid since 1976,acidifying 110 ha of land and causing an increase inaluminum, zinc, iron, and arsenic concentrations innearby waters (Hicks et al., 1999). Concern has beenraised about indirect effects on the Great Barrier ReefMarine Park, with the location of important spawn-ing and nursery areas for reef fish in recipient areasof acid sulfate soil discharge (Cook et al., 2000).Fish kills and run-off from acid sulfate soils haveaffected the livelihoods of commercial fishers, tourismoperators, oyster farmers, and sugarcane producers
(White et al., 2006). In Queensland, costs attributed toacid sulfate soils have been estimated at AUS$189 mil-lion (Powell and Martens, 2005), and in New SouthWales, the overall annual costs to fishery resourceshave ranged between AUS$ 2.2 and 23 million (NewSouth Wales Government, 2008). Because of the alter-ations to natural drainage caused by past mitigationschemes, episodic ecological emergencies can con-tinue for decades. Floodplains continue to dischargeacid water for centuries once the oxidation processeshave been initiated, and floodgates form acid reservoirsthat leak acidic water to the surrounding environmentfor months (White et al., 1997).
Disturbance of acid sulfate soil underlying a sub-urb to the Western Australian capital of Perth resultedin a severe decrease in groundwater quality in 2002.The contamination was due to the excavation of peat-based wetlands in the area for housing developmentsand subsequent disposal of the material in stockpileswhich underwent acidification as the peat oxidized.In addition, a combination of prolonged dry seasonsand groundwater abstraction in the area contributed tolowering the groundwater table by as much as 6 m,causing a subsequent oxidation of subsurface acid sul-fate soils (Angeloni et al., 2004). The issue came tolight after a resident reported that their vegetable gar-dens were dying as a result of bore water irrigation(Water and Rivers Commission, 2002). Investigationsshowed that the ground water in the area had pHvalues as low as 2.25, arsenic concentrations up to1,000 times the WHO guideline value for drinkingwater, and elevated concentrations of a number ofmetals.

126 K. Ljung et al.
Box 7 Soil Salinity – The White Death
The area of salt-affected land in Western Australia is increasing at a rate of one football field per hour,and soil salinity costs both New South Wales and South Australia millions of dollars every year in roadand building maintenance (National Action Plan, 2001). Salinization of soil in dry areas, dryland salinity,is the result of forest clearance, often for agricultural production, which replaces deep-rooted plants withshallow-rooted ones. As a result, natural salts previously bound in the unsaturated soil above the ground-water table now dissolve and are brought to the surface as the groundwater table rises (National ActionPlan, 2001).
Fig. 13 Linkages between deforestation, mosquitoes, and human health. Modified from Jardine et al. (2007)
In Australia, an unexpected indirect health effect of salinization has been identified. A study on populationdynamics of mosquitoes in Western Australia found that the development of dryland salinity and waterlogging has led to an increase in the mosquito specie primarily responsible for carrying the Ross Rivervirus (Fig. 13) (Jardine et al., 2008). In addition to increased risk of Ross River virus, a recent review onthe health implications of dryland salinity in Western Australia concluded that the salinity-induced envi-ronmental degradation may affect respiratory health through increased wind-borne dust and also mentalhealth through adverse effects on livelihood and recreational areas (Jardine et al., 2007).
Melioidosis
Melioidosis is an infectious disease caused by soilbacteria (Burkholderia pseudomallei). Exposure path-ways include ingestion of contaminated soil and/orwater, inhalation of dust, or exposure through skinwounds. The disease is manifested by abscesses inskin and internal organs, pneumonia-like symptoms,and septicemia (presence of pathogenic organisms inthe bloodstream), but it is not uncommon for the
infected person to remain free of symptoms. However,in those who develop clinical disease, the outcomemay be fatal even with correct treatment. The bac-terium is found in wet soils, accounting for the greaterfrequency of the melioidosis in tropical areas. Ithas commonly been referred to as “Nightcliff gar-dener’s disease,” referring to the high incidence amonghome gardeners in Darwin’s northern suburbs, includ-ing Nightcliff. Other common names for the diseaseinclude paddy-field disease, due to the susceptibility

An Overview of Medical Geology Issues in Australia and Oceania 127
of rice paddy farmers who work in close contactwith muddy waters, and Vietnamese tuberculosis, afterthe tuberculosis-like symptoms of the chronic formsof the disease which affected many Americans afterthe Vietnam War (White, 2003). The risk of mor-tality greatly increases in patients with predisposingconditions such as lung or kidney disease, cancer,alcohol abuse, and those on long-term immunosup-pressive drugs. It has also been reported that up to50% of patients with symptomatic melioidosis havepre-existing type II diabetes (White, 2003). Relapse israre in children but adult patients require follow-upsthroughout their lives (White, 2003).
The disease is endemic in parts of Southeast Asia,in northern Australia, and in the Torres Strait Islands.The incidence rate is particularly high in the NorthernTerritory of Australia with an annual disease rate of16.5 per 100,000 and it has been recognized as themost common cause of fatal community-acquired bac-terial pneumonia at the Royal Darwin Hospital (Currieet al., 2000). During a 10-year period starting in 1989,252 cases were confirmed in this area, most during thewet season (85%) with 49 deaths (19%). The mean ageof the affected patients was 47 years, but ranged from16 months to 91 years. Most patients were men (75%)and just over half were Aboriginal (Currie et al., 2000).Between October 2004 and February 2005, 24 caseswere confirmed, a significant increase compared withprevious years (Healthy Living Northern Territory,2005). The mortality rate has decreased in recent yearsdue to earlier case detection and intensive care treat-ment (White, 2003). Three main features distinguishthe presentation of the disease in Australia comparedto that of Thailand: the proportion of children affectedis lower (4% compared to 15%); infection of the uri-nary system and reproductive organs is more common(15% compared to 2%); and brainstem encephalitisis more common (4% compared to <0.2%) (White,2003).
Geophagy
Geophagy, or the eating of soil, occurs both due toneuropsychiatry and developmental disorders and asa normal practice in cultures all over the world. Inthe extensive review by Laufer published in 1930,the applications of soil are described as varied as the
cultures in which geophagy is practiced: as substitutefor food in times of scarcity, as condiment, as med-ical ailment for a range of disorders, and as a tasteenhancer (Laufer, 1930). Rowland (2002) points outthat the ingestion of soil during famine may arise fromits detoxifying properties when people are confined toeating less nutritious and often toxic “famine foods.”Laufer stresses that the behavior is individual andshould never be ascribed to an entire group/tribe/nationonly because it has been observed by some of its mem-bers. It occurs everywhere, regardless of climate, race,culture, affluence, or modernity. With these caveats inmind, we will present the practice of geophagy in theareas of Australia and Oceania.
Geophagy was reportedly practiced by the Maoriof New Zealand in times of scarcity. The village ofKaiuku, for example, means “eat clay” and got itsname from the ingestion of uku, a white soapy clay,as food supplies ran out during a long siege in 1832(Laufer, 1930). Clay eating in times of scarcity wasalso reported from the Rotorua and Lake Taupo regionson the North Island. The British settlers referredto a fine gray yellow ooze ejected by the volca-noes in the area as “native porridge,” and while thesame mud springs are described elsewhere, the useof them was reportedly limited to cooking and noteating. Geophagy is not widely reported from anyother locations in Polynesia, where instead soil wasmainly used as a base for paint on buildings (Laufer,1930).
Many travelers reported geophagy in New Guinea,where red, gray, and yellow clays were eaten. Thesoils of the different regions were distinguishable intaste and were used for barter. For example, a whiteclay found inland was used as a relish and a face-paint and was brought to the coast for exchange. Adifferent type of clay was found in coastal areas, agray marine clay, which was described as being helpfulfor digestion. It was particularly popular with preg-nant women who stated that it was beneficial forthe fetus, with a recommendation of daily ingestionuntil delivery. A fatty (heavy) clay of ochre color wasreportedly used on an island off the coast of PapuaNew Guinea for the treatment of digestive problems(Laufer, 1930). Soil ingestion was also observed inNew Caledonia, in some areas by men and in othersonly by women, reportedly eaten to fill the stomachor in response to craving sensations, similar to theuse of tobacco or opium. Different clays were eaten

128 K. Ljung et al.
in different areas, including steatite containing a sig-nificant amount of copper eaten in Baladea; a friablegrayish earth in Baaba; weathered yellow marl crushedand eaten in Mare; and red earth eaten after it hadbeen burnt. An aluminous soil full of organic debriswas reportedly eaten in the Loyalty Islands, while atough dark brown clay mixed with organic materialswas ingested by pregnant women in North Santo andMalekula. In Santo, the clay was flattened out like abiscuit and dried in smoke, while it was shaped intosmall balls, dried, and sucked on in Malekula (Laufer,1930).
In Australia, geophagy has been reported in someAboriginal tribes but not others. Laufer (1930)included only two cases from Australia in his exten-sive review on geophagy: In Queensland, clay ormud pills were reportedly prescribed for diarrheaand in Western Australia, a certain type of clay waspounded and ingested together with the root of themene (Haemodorum coccineum or scarlet bloodroot).Rowland (2002) suggested that the detoxifying char-acteristics of clay may have enabled the first arrivalsto the continent some 40,000 years ago to adapt tosome of the native toxic plants. In contrast to Laufer’stwo examples, Rowland includes numerous exam-ples of geophagy in different Aboriginal tribes acrossAustralia for a range of reasons. For example, theAnbarra in the Northern Territory reportedly ingestedmineral matter as a normal part of a meal, and at timescollected white clay and material called galamba fromant-bed as food in its own right. This material has infact been found to contain some protein (Rowland,2002). As reported for Queensland, soil derived fromant-hills or termite mounds was also used to treat diar-rhea in some Northern Territory tribes, while a fatty redclay was used for the same purpose in parts of WesternAustralia, in some places mixed with seeds and rootsand baked in hot ashes prior to ingestion (Rowland,2002) (Fig. 14).
In some tribes of Queensland, diarrhea was treatedby a roasted special clay, and tuberculosis and cough ina tribe living on Cape York were treated by ingestionof a white clay (Rowland, 2002). In the Queenslandrainforest, the Kuku Yalanji tribe ate a clay called gum-buru during famine. In another rainforest tribe, claywas allegedly ingested for abortive and contraceptivepurposes. On Groote Eylandt, a variety of clays wereingested for different purposes, but reportedly only bywomen: a reddish or yellow clay as well as material
Fig. 14 Termite mounds near Pine Creek, Northern Territory.Courtesy of Kobold (2006)
from termite mounds reportedly cured mineral defi-ciencies; white clay was used for diarrhea, to “makethe stomach cool,” and if fish was craved because ofthe clay’s similarity in taste. On Mornington Island,white clay was used to cure internal pains, headaches,joint pains, eye complaints, and snakebite wounds andto increase the flow of breast milk. On Merr Island,pregnant women ate a chocolate-like clay which wasrolled up in banana leaves and roasted to ensure thebirth of a fair skinned baby, similar to the practice ofNew Guinean women. It was also eaten by children inthe belief that it would make them braver, stronger, andsturdier (Rowland, 2002).
In a psychiatric review on geophagy amongAustralian Aboriginals by Eastwell (1979), the prac-tice of eating soil was linked with social insecurity. Hedescribes an “epidemic” in 1958–1959 among middle-aged women, allegedly brought on by the introductionof a cash economy system which eliminated the roleof these women in the provision of food for the com-munity. Another epidemic was reported in 1974 withthe introduction of higher wages and social welfarepayments to Aboriginals from the Australian govern-ment, with the result that working mothers returnedto their domestic duties but the elderly women whohad previously cared for the children became increas-ingly marginalized in the local society. According tothe author, these events caused depression among someand brought on the ingestion of soil, suggesting it tobe a “medicine for life’s dissatisfactions” (Robbins,1980).

An Overview of Medical Geology Issues in Australia and Oceania 129
Lytico-Bodig – A Medical Geology Disease?
Research on the cause of the unusually high incidenceof neurodegenerative disorders on the Pacific Islandof Guam has been ongoing for the past 60 years.During this time, various causes have been hypoth-esized and dismissed, ranging from genetics to theendemic cycads to fruit bats. Researchers of many dis-ciplines have wanted to solve the puzzle of the Guamdisorder in the hope that by doing so it may also pro-vide some clues to other neurological diseases suchas Parkinson, amyotrophic lateral sclerosis (ALS), andAlzheimer’s. The following review will focus on theenvironmental exposures, although both genetic andenvironmental risk factors have been recognized butnot yet fully elucidated (Steele and McGeer, 2008).
The first record of a paralyzing neurodegenerativedisease on Guam is from 1904, although the island wasdescribed as early as 1565 by a Portuguese explorer.Two years earlier, the Chamorro people of Guamhad been described as “remarkably free of disease”and reportedly lived long. The number of cases ofneurological disease grew quickly until it became theleading cause of death in adult Chamorro between1940 and 1965. The symptoms of the disease vary fromALS to Parkinson’s with or without dementia, and itwas originally considered as two separate entities (Hofand Perl, 2002). Locally it was called lytico-bodig,where lytico referred to a progressive paralysis resem-bling ALS and bodig to the Parkinsonian symptoms(van den Enden, 2009). One of the first studies in1954 found that the Chamorro people were 100 timesmore likely to suffer the symptoms of ALS than thegeneral population (Steele and McGeer, 2008). Thehigh frequency in some families and uneven distribu-tion on the island initially suggested a genetic link.This may have been secondary to the drastic popula-tion decrease from around 100,000 people in the 17thcentury down to 1,000 by the end of the 1800s due todisease, famine, and slavery after colonial exploitation.The recovery from near extinction may have enabledthe inheritance of the genetic polymorphism and anexceptionally high disease frequency in the remainingpopulation (Ince and Codd, 2005). However, geneticinfluences could not alone explain its distribution, andit was concluded that an unidentified environmentalexposure also played an important role. In the 1980s,the incidence of lytico-bodig on Guam seemed to
decrease but has of today not disappeared. However,over time, its clinical characteristics have shifted fromALS to Parkinsonism and now to dementia. The age ofits onset has also increased (Steele and McGeer, 2008).
Nutritional deficiencies of calcium and magnesiumwere suggested in the 1980s, but proved inaccuratewhen symptoms persisted in spite of elimination ofthe deficiencies. The finding of a high incidence ofan unusual retinal disease in patients suffering fromthe Guam syndrome, similar to the pathology of bot-fly infections, suggested a transmissible agent of thedisease. However, follow-up studies to identify a vec-tor of the disease have not been reported (Steele andMcGeer, 2008). A popular hypothesis throughout theyears has been that lytico-bodig is caused by the toxiceffects from cycads, a palm-like plant used locally tomake flour for tortillas and dumplings. This possiblecausative agent was first suggested in the 1950s buthas repeatedly failed to find supporting evidence. Itwas first dismissed in the 1970s after intense inves-tigations continuously failed. The toxic agent wasidentified in the 1980s as being beta-methylamino-alanine (BMAA), and the cycad hypothesis gainedrenewed focus (Caparros-Lefebvre and Lees, 2005).By 2002, it was suggested that the toxin found incycads is bioaccumulated in fruit bats, which thenare eaten by the Chamorro, causing a toxic insultdecades after consumption (Cox and Sacks, 2002).This proposal corresponded with the previous findingby Reed et al. (1987) that traditional Chamorro diet isthe only factor known to correlate with disease inci-dence (Banack et al., 2006). Elevated concentrationsof the toxin BMAA were found in various foodstuffsof the Chamorro diet, as well as in brains of Chamorrowith the disease, but not in a comparison population(Banack et al., 2006). The role of BMAA in the Guamdisease and the cycad hypothesis is still controversialand a number of issues still need to be resolved (Inceand Codd, 2005). For example, a subsequent studyfailed to confirm the findings of BMAA in humanbrain (Montine et al., 2005), although it was laterargued that the reason was a different methodology forBMAA detection and failure to measure protein-boundBMAA (Cox et al., 2006). Another hypothesis regard-ing toxicity from food plant sources originates fromGuadeloupe in the Caribbean where a similar type ofParkinson as noted on Guam was reported. It was sug-gested that a significant environmental factor was theexposure to plants containing alkaloid toxins, agents

130 K. Ljung et al.
that were simultaneously toxic for dopaminergic neu-rons and inhibited mitochondrial respiration. Thesetoxins were derived from herbal medicine, high intakeof tropical fruits, and herbal tea (Caparros-Lefebvreand Lees, 2005).
Cox and coworkers (2003) found that BMAA isin fact produced by cyanobacteria living inside theroots of the cycads. The bacteria provide the plant withnitrogen and the cycad relocate the BMAA to its seeds,possibly as protection against herbivores (van denEnden, 2009). This may explain why the disease hasoccurred in places where cycads or fruit bats are notconsumed. The most recent study (Pablo et al., 2009)suggests that cyanobacteria and its related neurotoxinsare an environmental factor for certain sporadic neu-rodegenerative diseases in vulnerable individuals. Theexact cause of the disease is thus still debated, althoughit seems generally accepted that both genetic and envi-ronmental factors play significant roles. This diseaseis an exceptional example of the need for multidisci-plinary collaboration and an area where the importanceof medical geology is highlighted.
References
Advameg (2009) Encyclopedia of the Nations, Vol 2009.Illinois: Advameg Inc.
Angeloni J, Peek A, Appleyard S, Wong S, Watkins R (2004)Acid sulfate soils: distribution, impacts and regulation(a Western Australian perspective). Corros Prev 106:1–13.
Asbestos Diseases Society of Australia Inc. (2004) AsbestosProducts. In Asbestos Information. Perth: Asbestos DiseasesSociety of Australia Inc.
Attfield MD, Costello J (2004) Quantitative exposure-responsefor silica dust and lung cancer in Vermont granite workers.Am J Ind Med 45:129–138.
Australian Bureau of Statistics (2006) Special article – a cen-tury of mining in Australia. In Coal and Mineral IndustriesDivision (ed) Australian Mining Industry 1998–1999.Adelaide: Department of Industry Science and Resources.
Australian Bureau of Statistics 2008a: Mining. In B Pink(ed) Yearbook of Australia 2008 (Vol. 1301). Canberra:Australian Bureau of Statistics.
Australian Bureau of Statistics 2008b: Feature article 4: Naturaldisasters in Australia. In: Pink B (ed) Yearbook of Australia2008, vol 1301. Australian Bureau of Statistics, Canberra.
Balmes JR (1987) Respiratory effects of hard-metal dust expo-sure. Occup Med 2:327–244.
Banack SA, Murch SJ, Cox PA (2006) Neurotoxic flying foxesas dietary items for the Chamorro people, Marianas Islands.J Ethnopharmacol 106:97–104.
Banks (1770) Banks Journal – Daily Entries. In National Libraryof Australia Southseas Collection. Canberra: NationalLibrary of Australia,
Baris I, Simonato L, Artvinli M, Pooley F, Saracci R, SkidmoreJ, Wagner C (1987) Epidemiological and environmental evi-dence of the health effects of exposure to erionite fibres: Afour-year study in the Cappadocian region of Turkey. Int JCancer 39:10–17.
Bates MN, Garrett N, Shoemack P (2002) Investigation of healtheffects of hydrogen sulfide from a geothermal source. ArchEnviron Health 57:405–411.
Baumann F, Rougier Y, Ambrosi JP, Robineau BP (2007) Pleuralmesothelioma in New Caledonia: an acute environmentalconcern. Cancer Detect Prev 31:70–76.
BHP Billiton (2008) About BHP Billiton and Manganese.Melbourne: BHP Billiton.
Broom A, Lindsay M, Oliveira N, Jasinska E, Heuzen Bv,Sturrock K, Vetten S, Maley F, Durling S, Dodsley N,Voss S, Ypelaar I, Smith D, Shellam G (2000) TheUniversity of Western Australia Arbovirus Surveillanceand Research Laboratory Annual Report: 1998–2000.In The University of Western Australia ArbovirusSurveillance and Research Laboratory Annual Report,Perth.
Brown T, Morley A, Sandersen N, Tait R (1983) Report of a largefish kill resulting from natural acid water. J Fish Biology22:335–350.
Bureau of Meteorology (2006) Fire Seasons. In Bureau ofMeteorology, Australian Government (eds). Melbourne:Commonwealth of Australia.
Bureau of Meteorology 2009a: “Darkness at noon” – the sum-mer of 1944/1945. In Bureau of Meteorology, AustralianGovernment (eds). Melbourne: Commonwealth of Australia.
Bureau of Meteorology 2009b: Dust-storms. In Bureau ofMeteorology, Australian Government (eds). Melbourne:Commonwealth of Australia.
Bureau of Meteorology 2009c: The Melbourne dust-stormof February 1983. In Bureau of Meteorology, AustralianGovernment (eds). Melbourne: Commonwealth of Australia.
Burt T, Blumbergs P, Currie B (1993) A dominant hereditaryataxia resembling Machado-Joseph disease in Arnhem Land,Australia. Neurology 43:1750–1752.
Burt T, Currie B, Kilburn C, Lethlean AK, Dempsey K,Blair I, Cohen A, Nicholson G (1996) Machado-Joseph dis-ease in east Arnhem Land, Australia: Chromosome 14q32.1expanded repeat confirmed in four families. Neurology46:1118–1122.
Callinan R, Fraser G, Melville M (1993) Seasonally recurrentfish mortalities and ulcerative disease outbreaks associatedwith acid sulfate soils in Australian estuaries. In D Dent, Mvan Mensvoort (eds) Selected Papers of the Ho Chi MinhCity Symposium on Acid Sulphate Soils, Vol Publication 53.Wageningen: International Institute for Land Reclamationand Improvement.
Caparros-Lefebvre D, Lees AJ (2005) Atypical unclassifi-able parkinsonism on Guadeloupe: an environmental toxichypothesis. Mov Disord 20(Suppl 12):S114–S118.
Chen L, Verrall K, Tong S (2006) Air particulate pollution dueto bushfires and respiratory hospital admissions in Brisbane,Australia. Int J Environ Health Res 16:181–191.

An Overview of Medical Geology Issues in Australia and Oceania 131
Cheney NP (1995) Bushfires – An Integral Part of Australia’sEnvironment. In Yearbook of Australia 1995, Vol. 1301.
Churches T, Corbett S (1991) Asthma and air pollution inSydney. NSW Public Health Bull 2:72–73.
CIA (2009) The 2008 World Factbook. US Government. https://www.cia.gov/library/publications/the-world-factbook/index.html. Accessed 31 March 2009.
Collipp PJ, Chen SY, Maitinsky S (1983) Manganese in infantformulas and learning disability. Ann Nutr Metab 27:488–494.
Commonwealth of Australia (2008) National IndigenousHousing Guide. Department of Families Housing,Community Services and Indigenous Affairs (ed). Canberra:Commonwealth of Australia.
Cook A, Weinstein P (2005) Volcanic emissions and healthrisks of metal contaminants in New Zealand. In T Moore,A Black, J Centeno, J Harding, D Trumm (eds) Metal con-taminants: sources, effects and integration in New Zealand.Christchurch: University of Canterbury Press.
Cook FJ, Hicks W, Gardner EA, Carlin GD, Froggatt DW (2000)Export of acidity in drainage water from acid sulphate soils.Marine Pollut Bull 41:319–326.
Cooper CW, Mira M, Danforth M, Abraham K, Fasher B,Bolton P (1994) Acute exacerbations of asthma and bush-fires. Lancet 343:1509.
Costa D, Dreher K (1997) Bioavailable transition metals in par-ticulate matter mediate cardiopulmonary injury in healthyand compromised animal models. Environ Health Perspect105:1053–1060.
Cowan J (2006) Angurugu Community Grapples with MachadoJoseph Disease. ABC Online – Stateline Northern Territory.http://www.abc.net.au/stateline/nt/content/2006/s1606126.htm. Accessed 31 March 2009.
Cox P, Banack SA, Murch S (2003) Biomagnification ofcyanobacterial neurotoxins and neurodegenerative diseaseamong the Chamorro people of Guam. PNAS 100:13380–13383.
Cox PA, Banack S, Murch S, Sacks O (2006) Commentary on:Return of the cycad hypothesis does the amyotrophic lateralsclerosis/Parkinsonism dementia complex (ALS/PDC) ofGuam have new implications for global health? NeuropatholAppl Neurobiol 32:679–682.
Cox PA, Sacks OW (2002) Cycad neurotoxins, consumptionof flying foxes, and ALS-PDC disease in Guam. Neurology58:956–959.
Cronin SJ, Sharp DS (2002) Environmental impacts on healthfrom continuous volcanic activity at Yasur (Tanna) andAmbrym, Vanuatu. Int J Environ Health Res 12:109–123.
Currie B, Fisher D, Howard D, Burrom J, Lo D,Selva-nayagam S, Anstey N, Huffam S, Snelling P,Marks P, Stephens D, Lum G, Jacups S, Krause V (2000)Endemic melioidosis in tropical Northern Territory: a10-year prospective study and review of the literature. ClinInfect Dis 31:981–986.
Davidson G (2009) Uranium- and platinum-rich unconformity-style ore deposit genesis in the South Alligator Valley,Northern Territory. In School of Earth Sciences (ed) ARCCentre of Excellence in Ore Deposits, Vol. 2009. Hobart:University of Tasmania.
Dent D (1986) Acid Sulphate Soils: A Baseline for Research andDevelopment (Vol. 39). Wageningen: ILRI Publications.
Department of Environment and Conservation 2007a: DECinvestigates further bird deaths. Media statement 17 January2007.
Department of Environment and Conservation 2007b: Esperancebird death test results. Media statement 9 March 2007.
Department of Health (2006) Port Hedland dust study resultsreleased. Department of Health, Media Release 13 July2006. Government of Western Australia. http://www.health.wa.gov.au/press/view_press.cfm?id=606. Accessed 31March 2009.
Department of Human Services (2008) Community factsheet –dust storms and health. Department of Human Services (ed).Public Health Emergency Management CommunityFact Sheet. www.health.vic.gov.au/environment/downloads/dust_storms_and_health.pdf. Accessed 31 March2009.
Department of Primary Industries (2004) The 1939 Fires.Knowledge Resource Centre (ed). The Virtual Exhibition.Victoria: Department of Primary Industries. http://www.dpi.vic.gov.au/virtualexhibition/39fires/index.htm. Accessed 31March 2009.
Department of Sustainability and Environment (2006) AshWednesday – Significant Fire Years (ed). Victoria: Depart-ment of Sustainability and Environment. http://www.dse.vic.gov.au/DSE/nrenfoe.nsf/childdocs/-D79E4FB0C437E1B6CA256DA60008B9EF-7157D5E68CDC2002CA256DAB0027ECA3?open. Accessed 31 March 2009.
Department of Sustainability and Environment (2009) BushfireStatistics. Victoria: Department of Sustainability andEnvironment. http://www.dse.vic.gov.au/DSE/nrenfoe.nsf/childdocs/-D79E4FB0C437E1B6CA256DA60008B9EF-3D569492B50F5A78CA256DA600095F56?open. Accessed31 March 2009.
Donaldson J (2002) “Manganese madness” Clues to the aeti-ology of human brain disease emerges from a geologicalanomaly. Med Geol Newsl 4:8–10.
Durand M, Florkowski C, George P, Walmsley T, Weinstein P,Cole J (2004) Elevated trace element output in urine fol-lowing acute volcanic gas exposure. J Volcanol Geother Res134:139–148.
Durand M, Wilson JG (2006) Spatial analysis of respiratorydisease on an urbanized geothermal field. Environ Res101:238–245.
Earth Observatory 2005a: Dust storm in Australia. NASA (ed)Earth Observatory, 2009. EOS Project Science Office,NASA Goddard Space Flight Center. http://earthobservatory.nasa.gov/NaturalHazards/view.php?id=14580. Accessed 31March 2009.
Earth Observatory 2005b: Sulfur dioxide leaks from the Amb-rym volcano. NASA (ed) Earth Observatory, 2009. EOS Pro-ject Science Office, NASA Goddard Space Flight Center.http://earthobservatory.nasa.gov/NaturalHazards/view.php?id=14796. Accessed 31 March 2009.
Earth Observatory (2006) Ghostly face in South Australiandesert. NASA (ed) Earth Observatory, 2009. EOS ProjectScience Office, NASA Goddard Space Flight Center.http://earthobservatory.nasa.gov/IOTD/view.php?id=7076.Accessed 31 March 2009.
Earth Observatory (2008) Lahar on Mount Ruapehu, New Zea-land. NASA (ed) Earth Observatory, 2009. EOS ProjectScience Office, NASA Goddard Space Flight Center.

132 K. Ljung et al.
http://earthobservatory.nasa.gov/NaturalHazards/view.php?id=18166. Accessed 31 March 2009.
Eastwell H (1979) A pica epidemic: a price for seden-tarism among Australian ex-hunter-gatherers. Psychiatry42:264–273.
Ericson JE, Crinella FM, Clarke-Stewart KA, Allhusen VD,Chan T, Robertson RT (2007) Prenatal manganese levelslinked to childhood behavioral disinhibition. NeurotoxicolTeratol 29:181–187.
Esperance Port Authority (2008) Lead Removal Plan. C/2300.Retrieved 5 October 2009 from http://www.esperanceport.com.au/downloads/report/LRP_Final.pdf.
Fältmarsch R (2006) Effect of toxic metals mobilised fromFinnish acid sulphate soils on terrestrial and aquatic biota andhuman health: A literature review. In 18th World Congress ofSoil Science (Vol. 174–4). Philadelphia.
Feldman J, Tilling RI (2007) Danger Lurks Deep: The HumanImpact of Volcanoes. Feature Article. Geotimes November2007.
Geoscience Australia (2003) Australian Mines Atlas: Copper.Department of Industry, Tourism and Resources (ed) AIMRReport, 2005. Canberra: Commonwealth of Australia.
Gillette D (1997) Soil derived dust as a source of silica: Aerosolproperties, emissions, deposition, and transport. J Expo AnalEnviron Epidemiol 7:303–311.
Global Identifier Number (2009). Asian Disaster ReductionCentre (ACDR). http://www.glidenumber.net/glide/public/search/search.jsp. Accessed 4 March 2009.
Global Volcanism Program (1990) BGVN 15:06. Rabaul. CO2kills six at Tarvurvur, seismicity remains low. In GlobalVolcanism Program (ed) Bulletin of the Global VolcanismNetwork, vol 2009. Smithsonian National Museum forNatural History.
Government of Western Australia (2007) Response of theWestern Australian government to the Western AustralianLegislative Assembly, Education and Health StandingCommittee in relation to the cause and extent of lead pol-lution in the Esperance area.
Greene R, Gatehouse R, Scott K, Chen X (2001) Symposiumreport: Aeolian dust – implications for Australian mineralexploration and environmental management. Austr J of SoilRes 39:1–6.
Hales S, Weinstein P, Woodward A (1999) Ciguatera (FishPoisoning), El Nino, and Pacific sea surface temperatures.Ecosyst Health 5:20–25.
Hansell A, Horwell C, Oppenheimer C (2006) The health haz-ards of volcanoes and geothermal areas. Occup Environ Med63:149–156.
Hansell A, Oppenheimer C (2004) Health hazards from volcanicgases: a systematic literature review. Arch Environ Health59:628–639.
Hansen J, de Klerk NH, Musk AW, Hobbs MS (1998)Environmental exposure to crocidolite and mesothelioma:exposure-response relationships. Am J Respir Crit Care Med157:69–75.
Healthy Living Northern Territory (2005) Melioidosis – infor-mation sheet. Diabetes Association of the Northern Territory(ed). www.healthylivingnt.org.au/content/?action=getfile&id=45-. Accessed 31 March 2009.
Hendrickx M (2008) Naturally occurring asbestos in easternAustralia: A reveiw of geological occurrence, disturbance
and mesothelioma risk. Environ Geol. Doi 10.1007/s00254-008-1370-5. Accessed 31 March 2009.
Hicks W, Bowman G, Fitzpatrick R (1999) Environmentalimpacts of acid sulfate soils near Cairns, QLD.Technical Report 15/99. CSIRO Land and Water.http://www.clw.csiro.au/publications/technical99/tr15-99.pdf. Accessed 31 March 2009.
Hof PR, Perl DP (2002) Neurofibrillary tangles in the pri-mary motor cortex in Guamanian amyotrophic lateralsclerosis/parkinsonism-dementia complex. Neurosci Lett328:294–298.
IARC (1987) Asbestos. In IARC Monographs on the Evaluationof Carcinogenic Risks to Humans, Overall Evaluations ofCarcinogenicity: An Updating (Vol. 1, Suppl 7). Lyon: WhoHealth Organization, International Agency for Research onCancer.
Ince PG, Codd GA (2005) Return of the cycad hypothe-sis – does the amyotrophic lateral sclerosis/parkinsonismdementia complex (ALS/PDC) of Guam have new impli-cations for global health? Neuropathol Appl Neurobiol 31:345–353.
Intergovernmental Oceanographic Commission (2008)Tsunami, The Great Waves, Revised edition. In:Intergovernmental Oceanographic Commission (ed) IOCBrochure 2008-1. Paris: UNESCO, .
Jalaludin B, Smith M, O’Toole B, Leeder S (2000) Acute effectsof bushfires on peak expiratory flow rates in children withwheeze: A time series analysis. Austr NZ J Public Health24:174–177.
Jardine A, Lindsay M, Johansen C, Cook A, Weinstein P (2008)Impact of dryland salinity on population dynamics of vec-tor mosquitoes (diptera: culicidae) of Ross River virus inareas of southwestern Western Australia. J Med Entomol 45:1011–1022.
Jardine A, Speldewinde P, Carver S, Weinstein P (2007) Drylandsalinity and ecosystem distress syndrome: Human healthimplications. Eco Health 4:10–17.
Johnson D (2004) The Geology of Australia, Illustrated edn.Cambridge: Cambridge University Press, .
Johnston FH, Kavanagh AM, Bowman DMJS, Scott RK (2002)Exposure to bushfire smoke and asthma: An ecological study.Med J Austr 76:535–538.
Kiloh LG, Lethlean AK, Morgan G, Cawte JE, HarrisM (1980) An endemic neurological disorder in tribalAustralian aborigines. J Neurol Neurosurg Psychiatry 43:661–668.
Kobold K (2006) Termite Mounds NT. Image LicensedUnder the Creative Commons Attribution SharAlike 2.0:http://creativecommons.org/licenses/by-sa/2.0/
Kondakis XG, Makris N, Leotsinidis M, Prinou M,Papapetropoulos T (1989) Possible health effects ofhigh manganese concentration in drinking water. ArchEnviron Health 44:175–178.
Laufer B (1930) Geophagy (Vol. XVIII). Chicago: FieldMuseum Press.
Leigh J, Driscoll T (2003) Malignant mesothelioma inAustralia, 1945–2002. Int J Occup Environ Health 9:206–217.
Ljung K, Maley F, Cook A, Weinstein P (2009) Acid sulfatesoils and human health – a millenium ecosystem assessment.Environ Int 35:1234–1242.

An Overview of Medical Geology Issues in Australia and Oceania 133
Longo BM (2009) The Kilauea Volcano adult health study. NursRes 58:23–31.
Longo BM, Rossignol A, Green JB (2008) Cardiorespiratoryhealth effects associated with sulphurous volcanic air pollu-tion. Public Health 122:809–820.
Luce D, Bugel I, Goldberg P, Goldberg M, Salomon C, Billon-Galland MA, Nicolau J, Quenel P, Fevotte J, Brochard P(2000) Environmental exposure to tremolite and respira-tory cancer in New Caledonia: a case-control study. Am JEpidemiol 151:259–265.
Luke RH, McArthur AG (1978) Bushfires in Australia.Canberra: Australian Government Publishing Service.
Macdonald B, White I, Heath L, Smith J, Keene A, TunksM, Kinsela A (2006) Tracing the outputs from drainedacid sulphate flood plains to minimize threats to coastallakes. In C Hoanh, T Tuong, J Gowing, B Hardy (eds)Environment and livelihoods in tropical coastal zones.Wallingford, Oxfordshire: CAB International.
McKay AD, Miezitis Y, Jaireth S (2008) Australian UraniumResources, May 2008 edn. 1:10,000,000 scale map.Australian Government (ed), May 2008 edn. Canberra.www.ga.gov.au/servlet/BigObjFileManager?bigobjid=GA11404 -. Accessed 31 March 2009.
McMichael A, Woodruff R, Whetton P, Hennessy K, NichollsN, Hales S, Woodward A, Kjellstrom T (2003) Humanhealth and climate change in Oceania: A risk assessment2002. Commonwealth Department of Health and Ageing(ed). Canberra: Commonwealth of Australia.
Mergler D (1999) Neurotoxic effects of low level exposureto manganese in human populations. Environ Res 80:99–102.
Montine TJ, Li K, Perl DP, Galasko D (2005) Lack ofbeta-methylamino-l-alanine in brain from controls, AD, orChamorros with PDC. Neurology 65:768–769.
Musk AW, de Klerk NH, Eccles JL, Hansen J, Shilkin KB (1995)Malignant mesothelioma in Pilbara Aborigines. Aust J PublicHealth 19:520–522.
Musk AW, de Klerk NH, Reid A, Ambrosini GL, Fritschi L,Olsen NJ, Merler E, Hobbs MS, Berry G (2008) Mortalityof former crocidolite (blue asbestos) miners and millers atWittenoom. Occup Environ Med 65:541–543.
National Action Plan (2001) Australia’s Salinity Problem.Department of Agriculture, Fisheries and ForestryDepartment of the Environment and Water Resources(eds). Canberra: National Action Plan, Government ofAustralia.
National Institute of Neurological Disorders and Stroke (2008)Machado Joseph Disease Fact Sheet. Bethesda: NationalInstitute of Health. Publication No. 02-2716.
National Institute for Occupational Safety and Health (2007).Asbestos and Other Mineral Fibers: A Roadmap forScientific Research. Retrieved 5 October 2008 fromhttp://www.cdc.gov/niosh/review/public/099/pdfs/NIOSHAsbestosRoadmap.pdf.
Nemery B (1990) Metal toxicity and the respiratory tract. EurRespirol J 3:202–219.
New South Wales Health (2003) Dust Storms. In Departmentof Health (ed). New South Wales Health Factsheet. Sydney:New South Wales Government.
New South Wales Government (2008) Acid SulfateSoils, What are the Effects of Acid Sulfate Soils?
http://www.naturalresources.nsw.gov.au/soils/what_effects.shtml. Accessed 23 June 2008.
Nunn P (1991) Causes of environmental changes on PacificIslands in the last millennium: implications for decision mak-ers. In T Johnson, J Flenley (eds) Aspects of EnvironmentalChange. Palmerston North: Massey University.
Ong L (2006) Island Evolution Part 2: Oeno Island. InNASA (ed) EO-1 Science Team, Earth Observatory.http://earthobservatory.nasa.gov/IOTD/view.php?id=6786.Accessed 31 March 2009.
Pablo J, Banack SA, Cox PA, Johnson TE, PapapetropoulosS, Bradley WG, Buck A, Mash DC (2009) Cyanobacterialneurotoxin BMAA in ALS and Alzheimer’s disease. ActaNeurol Scand 4:216–225.
Pan XL, Day HW, Wang W, Beckett LA, Schenker MB (2005)Residential proximity to naturally occurring asbestos andmesothelioma risk in California. Am J Respir Crit Care Med172:1019–1025.
Playford PE (1998) Voyage of discovery to Terra Australis, byWillem De Vlamingh, 1696–1697. Perth: Western AustralianMuseum.
Plumlee G, Ziegler T (2007) The medical geochemistry of dusts,soils and other earth materials. In B Lollar (ed) Treatise onGeochemistry (Vol. 9.07). Amsterdam: Elsevier Press.
Powell B, Martens M (2005) A review of acid sulfate soilimpacts, actions and policies that impact on water qual-ity in Great Barrier Reef catchments, including a casestudy on remediation at East Trinity. Marine Pollut Bull 51:149–164.
Purdey M (2004) The pathogenesis of Machado Joseph Disease:a high manganese/low magnesium initiated CAG expan-sion mutation in susceptible genotypes? J Am Coll Nutr 23:715S–729S.
Reed D, Labarthe D, Chen KM, Stallones R (1987) A cohortstudy of amyotrophic lateral sclerosis and parkinsonism-dementia on Guam and Rota. Am J Epidemiol 125:92–100.
Reid A, Heyworth J, de Klerk N, Musk AW (2008) The mortalityof women exposed environmentally and domestically to blueasbestos at Wittenoom, Western Australia. Occup EnvironMed 65:743–749.
Reis J (2006) Oceania_ISO_3166-1. Image licensed underthe Creative Commons Attribution ShareAlike 2.5 License:http://creativecommons.org/licenses/by-sa/2.5/.
Robbins K (1980) Abstracts and Reviews: 4 Australia: APica Epidemic: A price for sedentarism among Australianex-hunter-gatherers by Harry D. Eastwell. Psychiatry 42(1979): 264–273. Transcult Psychiatry 17:168–170.
Rosicky M, Sullivan L, Slavich P, Hughes M (2004) Factors con-tributing to the acid sulfate soil scalding process in the coastalfloodplains of New South Wales, Australia. Aust J Soil Sci42:587–594.
Rowland M (2002) Geophagy: An assessment of implicationsfor the development of Australian Indigenous plant process-ing technologies. Aust Aborig Stud 1:51–66.
Russell D, Helmke S (2002) Impacts of acid leachate on waterquality and fisheries resources of a coastal creek in northernAustralia. Marine Freshw Res 53:19–33.
Rutherford S, Clark E, McTainsh G, Simpson R, Mitchell C(1999) Characteristics of rural dust events shown to impacton asthma severity in Brisbane, Australia. Int J Biometeorol42:217–225.

134 K. Ljung et al.
Singh G, Geissler EA (1985) Late Cainozoic history of vege-tation, fire, lake levels and climate, at Lake George, NewSouth Wales, Australia. Philos Trans Royal Soc Lond SeriesB 311:379–447.
Singh R, Hales S, de Wet N, Raj R, Hearnden M, Weinstein P(2001) The influence of climate variation and change on diar-rhoeal disease in the Pacific Islands. Environ Health Perspect109:155–159.
Smith M, Jalaludin B, Byles J, Lim L, Leeder S (1996) Asthmapresentations to emergency departments in western Sydneyduring the January 1994 Bushfires. Int J Epidemiology25:1227–1236.
Smithsonian Institute (2009) How Many Active Volcanoesare There in the World? Program GV (ed) 2009.http://www.volcano.si.edu/faq/index.cfm?faq=03. Accessed31 March 2009.
Steele JC, McGeer PL (2008) The ALS/PDC syndrome of Guamand the cycad hypothesis. Neurology 70:1984–1990.
Stephens F, Ingram M (2006) Two cases of fish mortality in lowpH, aluminium rich water. J Fish Dis 29:765–770.
Stewart C, Johnston D, Leonard G, Horwell C, Thordarson T,SJC (2006) Contamination of water supplies by volcanicashfall: A literature review and simple impact modeling. JVolcanol Geotherm Res 158:296–306.
Summerell G, Dowling T, Richardson D, Walker J, Lees B(2000) Modelling current parna distribution in a local area.Aust J Soil Res 38:867–878.
Takser L, Mergler D, Hellier G, Sahuquillo J, Huel G(2003) Manganese, monoamine metabolite levels at birth,and child psychomotor development. Neurotoxicology 24:667–674.
Te Ara (2007) Life on the Edge: New Zealand’s Natural Hazardsand Disasters. Auckland: David Bateman Ltd.
Thistlethwaite B, Davis D (1996) Pacific 2010: A sustainablefuture for Melanesia? In National Centre for DevelopmentStudies (ed), Canberra.
Twohig J (2006) Management of asbestos contamina-tion in Wittenoom. In Department of Industry andResources, Department of Local Government and RegionalDevelopment (eds). Canberra: GHD Pty Ltd.
U.S. Geological Survey (1998) Magnitude 7.0 near north coastof Papua New Guinea, 1998 July 17. In PreliminaryEarthquake Report. Denver: National EarthquakeInformation Center, World Data Center for Seismology.
U.S. Geological Survey (2009) Magnitude 8.0 – Samoa islandsregion. Earthquakes Hazards Program. In: PreliminaryEarthquake Report. Denver: National EarthquakeInformation Center, World Data Center for Seismology.
van den Enden E (2009) Lytico-Bodig. In Medical ProblemsCaused by Plants. Antwerpen: Institute of Tropical Medicine.
Verheijden MW, Ton A, James AL, Wood M, Musk AW (2002)Respiratory morbidity and lung function in two Aboriginalcommunities in Western Australia. Respirology 7:247–253.
Wasserman GA, Liu X, Parvez F, Ahsan H, Levy D, Factor-Litvak P, Kline J, van Geen A, Slavkovich V, LoIaconoNJ, Cheng Z, Zheng Y, Graziano JH (2006) Watermanganese exposure and children’s intellectual functionin Araihazar, Bangladesh. Environ Health Perspect 114:124–129.
Water and Rivers Commission (2002) Investigation ofsoil and groundwater acidity, Stirling: Report to theMinister for the Environment and Heritage. Perth: Waterand Rivers Commission, Department of EnvironmentalProtection.
Western Australia Legislative Committee (2007) Inquiry intothe cause and extent of lead pollution in the Esperancearea. Report No. 8 in the 37th Parliament. Education andHealth Standing Committee. Western Australia: GovernmentPrinter, State Law Publisher.
White I, Heath L, Melville M (1999) Ecological impacts of floodmitigation and drainage in coastal lowlands. Aust J EmergManag 14:9–15.
White I, Melville M, Macdonald B, Quirk R, Hawken R, TunksM, Buckley D, Beattie R, Heath L, Williams J (2006) Fromconflict to industry – regulated best practice guidelines: Acase study of estuarine flood plain management of the TweedRiver, eastern Australia. In C Hoanh, T Tuong, J Gowing,B Hardy (eds) Environment and Livelihoods in TropicalCoastal Zones. Wallingford: CAB International.
White I, Melville M, Wilson B, Sammut J (1997) Reducing aciddischarge from coastal wetlands in eastern Australia. WetlEcol Manag 5:55–72.
White N (2003) Melioidosis. Lancet 361:1715–1722.World Health Organisation (2004) Manganese in drinking
water – background document for development of WHOguidelines for drinking-water quality. WHO/SDE/WSH/03.04/104. Geneva: World Health Organisation.

Medical Geology in the Middle East
Humam Misconi and Maryam Navi
Abstract The Middle East region has reported someendemic diseases which are more prominent than inother parts of the world and in some cases have beenseen only in this region. This chapter provides infor-mation and addresses various cases from all over theMiddle East.
The Middle East is well known for its arid andsemi-arid environment with frequent and severe dust-and sand storms. This has affected human health inthe southern provinces of Iran like the southwesternKhuzestan Province and the southeastern Sistan andBaluchistan Provinces. Health effects of dust stormsin Khuzestan Province include asthma in some cities,especially for people with chronic respiratory and car-diovascular diseases. In spite of the fact that dustand sand storms endanger the lives of over 3 millionof Khuzestan Province inhabitants, no detailed stud-ies exist on the nature, type, and health effects ofwind-blown dust and sand. Also, two main regions inIraq including Baghdad and Al-Basra are stricken fre-quently by dust and sand storms, but little attention hasbeen paid to study the health impact of dust and sandstorms in Iraq. This section shows health impacts ofdust storms in four case studies.
Numerous examples from all over the Middle Eastare illustrated on element toxicities such as arsenic andfluorine and deficiencies, especially iodine deficiency.This chapter emphasizes health problems resultingfrom arsenic toxicities in the region and shows casesof the long-existing iodine deficiency disorders in theMiddle East.
H. Misconi (�)Consultant, Baghdad, Iraqe-mail: [email protected]
Several areas from the Middle East face high naturalfluoride levels in drinking water. The levels of naturalfluoride in drinking water of up to 3 mg l−1 were foundin the Negev Desert region in Israel. In some parts ofSaudi Arabia like Hail region a strong association isseen between fluoride levels in well water used fordrinking and the severity of dental fluorosis. Meccawas also reported to be an area with endemic fluoro-sis. There are also some cities in Iran where high levelsof fluoride in drinking water account for incidence offluorosis.
The relationship between radon exposure and healtheffects in the Middle East is also described. Manyepidemiological studies have shown a relationshipbetween radon exposure and lung cancer. Case–controlstudies have also been carried out in Ramsar in north-ern Iran indicating inverse relationship between resi-dential radon exposure and lung cancer.
Geophagia associated with iron and zinc defi-ciency, short stature, delayed sexual maturity, hep-atosplenomegaly, and delayed bone age is reportedfrom Middle East countries. This includes Shiraz inIran, parts of Saudi Arabia, and Arab children fromGaza Strip.
Keywords Iran · Iraq · Jordan · Israel · Saudi Arabia ·Yemen · Dust · Arsenic · Fluorine · Iodine · Geophagia
Minerogenic Aerosols
Minerogenic aerosols are a heterogeneous mixtureof air-suspended particles that can be solid, liquid,or both, organic and inorganic, and of varying sizeand shape. Sources include sand and dust storms,combustion of fossil fuels, industrial aerosols from
135O. Selinus et al. (eds.), Medical Geology, International Year of Planet Earth,DOI 10.1007/978-90-481-3430-4_6, © Springer Science+Business Media B.V. 2010

136 H. Misconi and M. Navi
construction, mining and mineral processing activities,both natural and man-made fires (e.g., oil well fires ofAl Kuwait of 1991 and the fire of Al Mishraq StateSulfur Mine in northern Iraq in 2003), incinerationof waste, and the detonation of explosive ammunitionand devices, especially depleted uranium ammunition(DU dust).
The Middle East is well known for its arid andsemi-arid environment with frequent and severe dustand sand storms. Arabia is recognized as one of fiveworld regions where dust storm generation is espe-cially intense (Idso, 1976) and characterized by awide distribution of aeolian sediments. This appliesalso to southwestern and southern Iran. Until recently,this has been related mostly to the wind action inresponse to the fluctuation in temperature and pre-cipitation and the absence of vegetation in two-thirdsof this region (Ghahreman, 2003). However, with theintensive utilization of natural resources, urbanization,industrialization, armed conflicts, and other anthro-pogenic activities, land’s surface disturbance becameinevitable and the frequency, intensity, complexity, andduration of dust and sand storms have increased sub-stantially, imposing heavy damages to the economy,society, and public health.
Dust and sand storms in the Middle East occur whenthe sub-tropical jet stream pushes up from south ofthe Arabian Peninsula and a polar front jet streampushes down from the European continent (Fig. 1) andprevail mostly in the spring and summer when thenorthwesterly winds dominate.
The high winds and soil moisture deficiency depictsall needed criteria to the creation of dust storms.
Nowadays the anthropogenic disruption of land surfaceincreases the spreading of deserts in the Middle East.Knowing the source and distribution process is a keyfactor in drawing the distribution patterns and antici-pating the affected areas where life is endangered. Duststorm brings microbes, insects, organic and inorganicparticles, and also organic chemicals such as dyes andpesticides which result in a wide range of respiratoryand infectious diseases.
Health effects of wind-blown sand and dust aswell as minerogenic aerosols on human pulmonaryand cardiovascular functions vary with a numberof factors. These include particle size, composition,levels and duration of exposure, and the health statusof the exposed population. Particles of a diameterof less than 10 μm may reach the upper part of theairways and lung while fine particles can penetratemore deeply and may reach the alveolar region. Healtheffects are also a function of timescale, which rangefrom long-term exposure (months to years) influencingthe incidence of chronic disease and susceptibilityand short-term exposure (days) causing acute healthevents. On both scales, health effects may range inseverity from subclinical to deadly. The proportionof the population affected decreases as the severityof the effect increases. Specific health effects ofchronic exposure include increase in lower respiratorysymptoms, chronic obstructive pulmonary disease(COPD), reductions in lung function, and reduction inlife expectancy (primarily related to cardiorespiratorymortality) (Weese and Abraham, 2009).
The amount of dust and the kinds of particlesinvolved influence how serious the lung injury will be.
Fig. 1 Weather map for theMiddle East showingconditions for a prefrontaloccurrence of dust storms(Source: Taghavi and Asadi,2008)

Medical Geology in the Middle East 137
Dust is organic and inorganic (Sullivan and Krieger,2001). Organic dusts consist of particles of biologi-cal, animal, and microbial origin and contain bacteriaand fungi. Allergic alveolitis is caused by organic dust(Sullivan and Krieger, 2001). Histoplasmosis, parrotdisease (psittacosis), and Q Fever are diseases thatpeople can get if they breathe in organics that areinfected with certain microorganisms. Dusts can alsooccur from organic chemicals (e.g., dyes, pesticides).Inorganic dusts can occur from grinding metals or min-erals such as rock or soil. Examples of inorganic dustsare silica, asbestos, and coal (CCOHS, 2005). Theinfluence of inorganic particles when inhaled varieswith the size and nature of the particles (Collis andGreenwood, 1977). The changes which occur in thelungs vary with the different types of dust. For exam-ple, the injury caused by exposure to silica is markedby islands of scar tissue surrounded by normal lungtissue. Some particles dissolve in the bloodstream. Theblood then carries the substance around the body whereit may affect the brain, kidneys, and other organs. Thetable below summarizes some of the most commonlung diseases caused by dust (Table 1).
Little information is available on the mineralogicalcomposition of sand and dust particles in the MiddleEast. Al-Ali (2000) indicated that over central andsouthern Iraq sand and dust particles comprised 8–45%carbonates, 18–63% quartz, 4–27% feldspar, 1–16%mica, and 1–8% gypsum in addition to 4–28% multi-mineral rock fragments. Texturally, most of the falloutconsists of very fine sand (125–62 μm) and coarse silt(62–31 μm). Alternatively, dust fallout over the DeadSea consists of soluble salts, carbonates (6.7–47.9%),apatite (1–5%) (derived from the phosphate miningactivity 45 km away), and clay minerals (Singer et al.,2003).
Health Effects of Dust Storm in KhuzestanProvince – Iran
Dust storms blow out of Iraq and Saudi Arabia overwestern, southwestern, and central provinces of Irancausing severe health effects, especially in KhuzestanProvince, southwestern Iran with Ahvaz as its center.Khuzestan Province lies between 47◦ 40′ E and 50◦33′ E longitude and 29◦ 57′ N and 33◦ 00′ N latitudeand covers an area of 64,055 km2.
Table 1 Some types of pneumoconiosis according to dust andlung reaction
Inorganic dust Type of disease Lung reaction
Asbestos Asbestosis FibrosisSilica (quartz) Silicosis FibrosisCoal Coal
pneumoconiosisFibrosis
Beryllium Beryllium disease FibrosisTungsten carbide Hard metal disease FibrosisIron Siderosis No fibrosisTin Stenosis No fibrosisBarium Baritosis No fibrosisOrganic dustMoldy hay, straw, and
grainFarmer’s lung Fibrosis
Droppings and feathers Bird Fancier’s lung FibrosisMoldy sugarcane Bagassosis FibrosisCompose dust Mushroom worker’s
lungNo fibrosis
Dust or mist Humidifier fever No fibrosisDust of heat-treated
sludgeSewage sludge
diseaseNo fibrosis
Mold dust Cheese washers’lung
No fibrosis
Dust of dander, hairparticles, and driedurine of rats
Animal handlers’lung
No fibrosis
Source: Data from CCOHS, 2005
In the period 2006–2008, the frequency, intensity,and duration of dust and sand storms have increasedsubstantially from a record annual average of 2–3 toup to 50 in 2007 with 31 occurring in fall and win-ter of 2007 lasting 46 h reflecting a changing seasonalpattern. During some of these dust and sand storms,high density of up to 17 times the standard limit ofsuspended particles or aerosols caused low visibilityand endangered inhabitants’ health. In 2008, a recordof 57 dusty days occurred until July 5 with 27 dust andsand storms lasting over 60 h. The density of particu-late matter ranged between 450 and 3,786 μg m–3 onApril 19, 2008 (Figs. 2, 3, 4, and 5).
Several factors stirred up these dust and sand stormsincluding the presence of the vast desert region ofwestern and southern Iraq and the Arabian Peninsula,decrease in precipitation, lack of vegetation in partof Khuzestan Province, drying up part of Hoor-Al-Azim Wetland, and decreasing discharge of Tigris andEuphrates related to global climate change (Zarasvandiand Mokhtari, 2008).
Health effects of dust in Khuzestan Province includeincreasing asthma in some cities especially for people

138 H. Misconi and M. Navi
Fig. 2 A massive dust plume blowing out of south-central SaudiArabia in a counter-clockwise direction over central and south-ern Iraq, southwestern and southern Iran, and the Persian Gulfon April 18, 2008. The dust narrowly misses the United ArabEmirates (UAE) and leaves the eastern part of the Persian Gulfclear. The dust appears particularly thick over Qatar (NASA,2008)
Fig. 3 A street in Khoramshahr, April 30, 2008 (Source: FarsNews Agency)
with chronic respiratory and cardiovascular diseases.Allergic diseases are more frequent in children andadolescence compared to other age groups. On June16 and 17, 2008, 205 people went to hospital and 2people perished due to respiratory poisoning of dust(Fazlollahi, 2008).
Fig. 4 Abadan, April 30, 2008
Fig. 5 Ahvaz, April 19, 2008 (Source: Islamic Republic NewsAgency)
In spite of the fact that dust and sand storms endan-ger the lives of over 3 millions of Khuzestan Provinceinhabitants, no detailed studies exist on the nature,type, and health effects of wind-blown dust and sand.Zarasvandi and Mokhtari (2008, unpublished data)have done sampling of dust fallout from Ahvaz andalong the Iraq–Iran border and results showed chem-ical, mineral, and microbial contaminants in manysamples. The contents of uranium, thorium, arsenic,lead, zinc, nickel, and cobalt exceeded the naturalbackground level. The dust consisted predominantly ofclay and quartz silt. The dust storm sediments analyzedconsisted of a large amount of clay and silt (quartzsilt). Clay soil is lighter and can move farther. Dustsoriginating from Khuzestan are of this type. Althoughthe levels of chemical, mineral, and microbial contam-inants are not very high, the contaminants could enter

Medical Geology in the Middle East 139
into the food chain and cause health problems; there-fore more studies on contaminants in food and waterresources in the region are required.
Health Effects of Dust Storms in Sistanand Baluchistan Provinces
Sistan and Baluchistan Provinces are located in east-ern and southeastern Iran, between latitudes 25◦ 4′ Nand 31◦ 29′ N and longitudes 55◦ 58′ E and 63◦ 20′E (Fig. 6 ) and covers an area of 181,785 km2. Sistanregion in the northern part of the province lies within adry temperate zone with lowlands. It is an arid regionwith very low annual precipitation (61 mm), low air
humidity, and frequent droughts and dry winds. SistanBasin once used to accommodate the 2,000 km2 wet-land ecosystem known as the Hamoun Wetlands whichconsists of several lakes (Dhondia and Diermanse,2006). But with unprecedented population growth inthe region throughout the 20th century, coupled with arelatively sudden and dramatic increase of irrigation ofthe Helmand River, in addition to human mismanage-ment of the river, the Hamoun Wetlands have almostcompletely dried up within the last 5 years. The light,silty lake floor is now vulnerable to the intense heatand strong winds often experienced in this region that,after the 1999 drought (Miri et al., 2007), startedto generate some very impressive dust storms thatappear to be increasing in both frequency and severity(Fig. 6).
Fig. 6 Asthma mortality map of Iran. Mortality data obtained from the Ministry of Health. The dark boundary indicates Sistan andBaluchistan Province and the dark strip shows Zabol District (prepared by Navi, 2009)

140 H. Misconi and M. Navi
Tens of thousands of people have been sufferingthrough months of devastating sand storms in SistanBasin, especially the cities Zabol and Zahak and sur-rounding villages. A severe sandy dust storm occurredin Zahak and its 80 villages on June 30, 2008 andresulted in closed schools and businesses. With thestorm lasting about 5 days, more than 3,000 peoplesuffering from allergy and respiratory diseases went tohospitals or health centers. Miri et al. (2007) showedthat 63% of the people of Zabol suffer from respiratorydiseases with the majority coming from villages ratherthan the city. Miri et al. (2007) indicated that 132,000people have been considered as patients sufferingfrom respiratory diseases related to the dust storms.The health damages to the population were estimatedat over US $66.7 million in the period 1999–2004.The information obtained from hospitals indicated thatmost of the patients who visited hospitals sufferedfrom chronic obstructive pulmonary disease (COPD)and asthmatic diseases with the peak of incidence dur-ing the summer season (June, July, and August) whenthe severest dust storms occur. It is estimated that90% of the population living in the region sufferedfrom respiratory problems in June, July, August, andSeptember. Medical costs for patients for the periodof study exceeded US $166.7 million (Miri et al.,2007).
According to the Asthma Mortality Map of Iran(Fig. 6), the rate of asthma in Zabol is higher than inother cities in Sistan and Baluchistan Provinces.
Health Problem Related to Dust StormsAl-Basra Governorate, Southern Iraq
Al-Basra Governorate is located in the extreme south-eastern part of Iraq, at the northeastern rim of theArabian Peninsula, and comprises the lowermost partof the Mesopotamian Plane in the north, part of theIraqi Southern Desert in the west and south andrelatively short coast on the Arabian Gulf. In thenorthern part of Al-Basra Governorate, Tigris andEuphrates merge forming Shatt Al Arab which flowssouthward to the Arabian Gulf. The total area ofAl-Basra is 19,070 km2 and the population exceeds3 million, including 1.7 million in Al-Basra City(Fig. 7a–c).
Fig. 7 a–c. The city of Baghdad ground to a halt on August 8,2005, under a cloud of suffocating dust that lingered over theregion until the next day. According to The New York Timesand the Website TerraDaily, reduced visibility slowed traffic toa crawl among those determined to brave the storm while manycommuters stayed home. A number of Iraqis were quoted as say-ing that this dust storm is the worst they have seen in years.The storm also reportedly overwhelmed Al Yarmuk TeachingHospital, which treated more than a thousand people with respi-ratory distress. City officials shut down Baghdad’s main airport,and Iraq’s constitution talks were postponed (Source: NASAMODIS Aqua, August 7, 2005)

Medical Geology in the Middle East 141
Fig. 7 (continued)
Dust and sand storms occur frequently presentingan acute environmental problem with impact on humanhealth, economy, and safety. Al-Najem (1975) identi-fied two main regions stricken by dust and sand storms:one is the central part of Iraq with Baghdad as itscenter and another in the southern part of Iraq withits center west of Al-Basra. The major source of dustis the Southern Desert (the northern extension of theGreat Arabian Desert) with the Northern Desert play-ing a secondary role. Estimates of the regional rateof dust fallout sedimentation ranged between 1.5 mmper year in central and southern Iraq and 0.88 mmper year in the northwestern part of the ArabianGulf. Khalaf and Al-Hashash (1983) estimated dustfallout over Al Kuwait as 1,002.7 tons/km−2 inJuly 1979 compared to 9.8 tons/km−2 in November1979.
In spite of the increasing frequency, duration,and intensity, especially since 1991, little attentionhas been paid to study the health impact of dustand sand storms in Iraq. In Al-Basra GovernorateAl-Kabi (1999) studied the geographical pattern ofsome chronic, non-communicable diseases while Al-Huwaider (2001) studied the effect of industrial pollu-tion on geographic distribution of allergy and asthmadiseases. Respiratory system allergies gained the first
rank among other categories of allergies and asthma inAl-Basra Governorate while bronchial asthma gainedthe third rank. Geographically, Al-Zubair Districtin the southwest comprising mostly desert plainsrecorded the highest incidence (3.95% of its total pop-ulation) while Al Qurna District located in the northwithin the Mesopotamian Plain recorded the lowestincidence (0.34% of its total population) with the otherfive districts ranging between (Al-Huwaider, 2001).An exception is Um Qasr Sub-District situated in theextreme southeast on the head of the Arabian Gulf.There, Al Marsoumi (2009) attributed the unexpect-edly high rate of incidence to the abundance of dustparticles less than 5 μm in size which represent a seri-ous health risk. Figure 8 illustrates the great similaritybetween the monthly distribution of dust fallout overAl-Basra Governorate and the number of infections bybronchial asthma.
Al-Huwaider (2001) attributed this variation to thegeographical, geological, and climatological factorswhile Al Marsoumi (2009) considered the texturalcomposition of dust as another factor.
Fig. 8 Comparison between the monthly average weight atdust fallout and the number of infections during the period1998–1999 (Source: Al-Ali, 2000; Al-Huwaider, 2001)
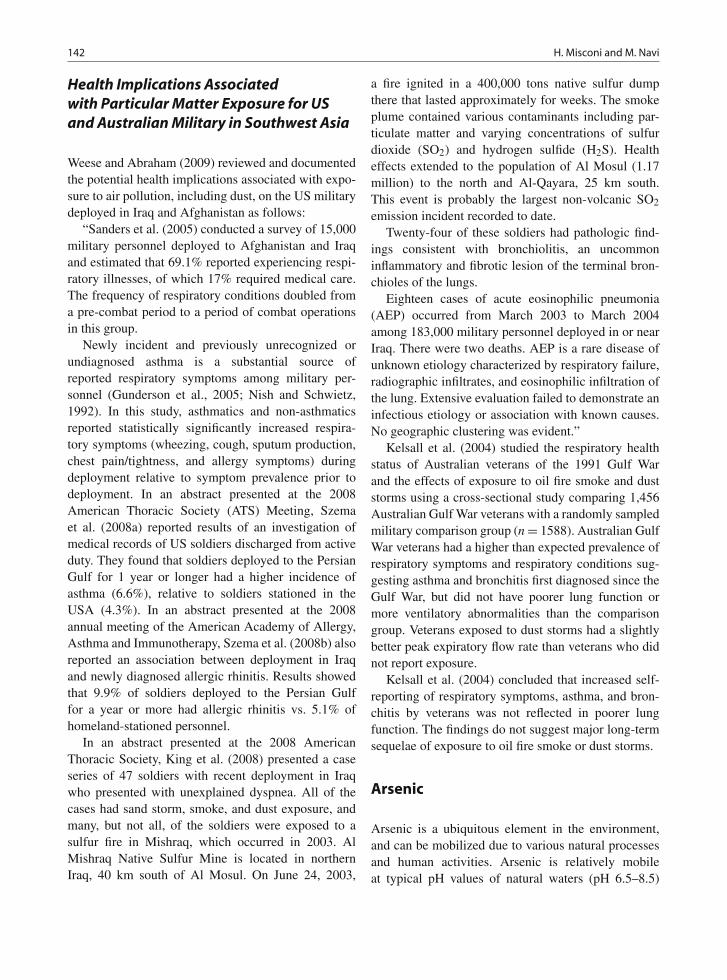
142 H. Misconi and M. Navi
Health Implications Associatedwith Particular Matter Exposure for USand Australian Military in Southwest Asia
Weese and Abraham (2009) reviewed and documentedthe potential health implications associated with expo-sure to air pollution, including dust, on the US militarydeployed in Iraq and Afghanistan as follows:
“Sanders et al. (2005) conducted a survey of 15,000military personnel deployed to Afghanistan and Iraqand estimated that 69.1% reported experiencing respi-ratory illnesses, of which 17% required medical care.The frequency of respiratory conditions doubled froma pre-combat period to a period of combat operationsin this group.
Newly incident and previously unrecognized orundiagnosed asthma is a substantial source ofreported respiratory symptoms among military per-sonnel (Gunderson et al., 2005; Nish and Schwietz,1992). In this study, asthmatics and non-asthmaticsreported statistically significantly increased respira-tory symptoms (wheezing, cough, sputum production,chest pain/tightness, and allergy symptoms) duringdeployment relative to symptom prevalence prior todeployment. In an abstract presented at the 2008American Thoracic Society (ATS) Meeting, Szemaet al. (2008a) reported results of an investigation ofmedical records of US soldiers discharged from activeduty. They found that soldiers deployed to the PersianGulf for 1 year or longer had a higher incidence ofasthma (6.6%), relative to soldiers stationed in theUSA (4.3%). In an abstract presented at the 2008annual meeting of the American Academy of Allergy,Asthma and Immunotherapy, Szema et al. (2008b) alsoreported an association between deployment in Iraqand newly diagnosed allergic rhinitis. Results showedthat 9.9% of soldiers deployed to the Persian Gulffor a year or more had allergic rhinitis vs. 5.1% ofhomeland-stationed personnel.
In an abstract presented at the 2008 AmericanThoracic Society, King et al. (2008) presented a caseseries of 47 soldiers with recent deployment in Iraqwho presented with unexplained dyspnea. All of thecases had sand storm, smoke, and dust exposure, andmany, but not all, of the soldiers were exposed to asulfur fire in Mishraq, which occurred in 2003. AlMishraq Native Sulfur Mine is located in northernIraq, 40 km south of Al Mosul. On June 24, 2003,
a fire ignited in a 400,000 tons native sulfur dumpthere that lasted approximately for weeks. The smokeplume contained various contaminants including par-ticulate matter and varying concentrations of sulfurdioxide (SO2) and hydrogen sulfide (H2S). Healtheffects extended to the population of Al Mosul (1.17million) to the north and Al-Qayara, 25 km south.This event is probably the largest non-volcanic SO2
emission incident recorded to date.Twenty-four of these soldiers had pathologic find-
ings consistent with bronchiolitis, an uncommoninflammatory and fibrotic lesion of the terminal bron-chioles of the lungs.
Eighteen cases of acute eosinophilic pneumonia(AEP) occurred from March 2003 to March 2004among 183,000 military personnel deployed in or nearIraq. There were two deaths. AEP is a rare disease ofunknown etiology characterized by respiratory failure,radiographic infiltrates, and eosinophilic infiltration ofthe lung. Extensive evaluation failed to demonstrate aninfectious etiology or association with known causes.No geographic clustering was evident.”
Kelsall et al. (2004) studied the respiratory healthstatus of Australian veterans of the 1991 Gulf Warand the effects of exposure to oil fire smoke and duststorms using a cross-sectional study comparing 1,456Australian Gulf War veterans with a randomly sampledmilitary comparison group (n = 1588). Australian GulfWar veterans had a higher than expected prevalence ofrespiratory symptoms and respiratory conditions sug-gesting asthma and bronchitis first diagnosed since theGulf War, but did not have poorer lung function ormore ventilatory abnormalities than the comparisongroup. Veterans exposed to dust storms had a slightlybetter peak expiratory flow rate than veterans who didnot report exposure.
Kelsall et al. (2004) concluded that increased self-reporting of respiratory symptoms, asthma, and bron-chitis by veterans was not reflected in poorer lungfunction. The findings do not suggest major long-termsequelae of exposure to oil fire smoke or dust storms.
Arsenic
Arsenic is a ubiquitous element in the environment,and can be mobilized due to various natural processesand human activities. Arsenic is relatively mobileat typical pH values of natural waters (pH 6.5–8.5)

Medical Geology in the Middle East 143
and under both oxidizing and reducing conditions.However, arsenic exhibits maximum mobility underhigh pH and oxidizing conditions and under stronglyreducing conditions.
Although most environmental arsenic problemsresult from mobilization under natural conditions,anthropogenic impacts have been locally significantdue to such activities as mining, fossil fuel combustion,and use of arsenic chemicals.
Human exposure to arsenic may be through a num-ber of pathways, including air, food, water, and soil.Of these, drinking water represents the greatest threatto human health, with the highest aqueous arsenic con-centrations tend to be found in groundwaters becauseof the natural water–rock interaction processes and thehigh solid/solution ratios found in aquifers (Smedleyand Kinniburgh, 2005).
Chronic exposure to arsenic may cause skin disor-ders (melanosis and keratosis), chronic cardiomyopa-thy (especially preclinical microcirculatory defects andarterial insufficiency), interstitial inflammation withfibrosis, hypertension, and diabetes mellitus, proba-ble lower IQ, and a variety of cancers involving theskin, lungs, bladder, kidney, and liver. Acute arsenictoxicity may result in a toxic myocarditis (Smedleyand Kinniburgh, 2005; Fowles et al., 2005). Arsenicmay cause also brain neuronal apoptosis which leadto Alzheimer’s disease (Gharibadzeh and Hoseini,2008).
Arsenic is associated with the metallic mineral-izations in the Eastern Iran Zone (Khorasan Razaviand Khorasan South Provinces), Central IranianMicro-Continent (Lut Block) (Yazd and KermanProvinces), Alborz Mountains Zone (Khorasan North,Golestan, and Mazandaran Provinces), Sanandaj–Sirjan Zone (Azarbayjan East, Azarbayjan West,and Kurdistan Provinces), and the Arabian Shield.Arsenic is also associated with sulfide minerals incoal and bitumen deposits in the Central IranianMicro-Continent (Lut Block) and Alborz MountainsZone and with thermal springs in Sanandaj–SirjanZone, Central Iranian Micro-Continent and ZagrosFold Belt (Kermanshah, Ilam, Lorestan, Khuzestan,Charmahal-e-Bakhtiyari, Kohgiluyeh, Bushehr, Fars,and Hormozgan Provinces).
In a statistical modeling of global geogenic arseniccontamination in groundwater, Amini et al. (2008a)considered the Middle East region of prevailing highpH/oxidizing conditions where arsenic is soluble in
its oxidized state. The statistical model indicated thatsubstantial parts of the Middle East region have 0.25–0.50 probability of >10 μg l−1 with higher probabilityof 0.50–0.75 in Al Hijaz (the Arabian Shield), the cen-tral part of the Arabian Plateau (Hayil Arch), and astrip in north central Iraq corresponding to an evap-orate terrain. The highest probability corresponds toa strip within the central part of the MesopotamianPlain comprising Baghdad and Babil Governorates aswell as to the Precambrian igneous complexes of theArabian Shield and probably to Hadramawt Group(Paleocene–Eocene) in the northern and eastern partsof Yemen, respectively. However, this model is ques-tionable at least within the Mesopotamian Plain; nei-ther the geology of the terrain which consists of verythick sequences of recent sediments with no possi-ble sources of geogenic arsenic nor available anal-yses of underground water for arsenic support that(Fig. 9).
Arsenic Distribution and Mortality Ratesof Related Diseases in Iran
The Arsenic Distribution and Mortality Rates ofRelated Diseases (National Geoscience Database ofIran, 2007) (Fig. 10) shows the relationship betweenarsenic and some diseases in Iran. The map illus-trates the geochemical distribution of arsenic in variousgeological units and in hot springs, mineralizations,arsenic containing coal and bitumen deposits, and thegeographical distribution of arsenic mortality ratesobtained from the Ministry of Health and MedicalEducation in the period 2001–2003.
The map shows that the mortality rate is higherin Isfahan, Semnan, Kerman, Khorasan Razavi, andAzerbaijan (particularly Azerbaijan West) Provincesthan in other parts of Iran. Maximum recorded mor-tality rates of skin and liver cancers are, respectively,5 and 25 per 100,000 while the maximum mortalityrate of all cancers is 125 per 100,000. There is nosignificant change in the mortality rates of skin andliver cancers in the period 2001–2003. Also, mortalityrate of cardiovascular diseases increased in the period2001–2003 to over 400 per 100,000.
The geochemical distribution of arsenic demon-strates significant correlation with mortality rate dis-tribution of all cancers in East Azerbaijan, Khorasan

144 H. Misconi and M. Navi
Probability ofAs>10 mgL–1
in oxidizingconditions
0.00–0.25
0.25–0.50
0.50–0.75
0.75–1.00
Fig. 9 Global probability of geogenic arsenic contamination in groundwater for high-pH/oxidizing conditions where arsenic issoluble in its oxidized state (Source: Amini et al., 2008a)
Razavi, Kerman, southern parts of Yazd, and particu-larly Azerbaijan West, Semnan, and Isfahan.
In addition to arsenic mineralizations, significantamounts of arsenic may also be associated with gold,silver, lead–zinc, and cobalt ores. Mining of these may
result in mobilization and/or transportation of arsenicinto drinking water.
Geothermal spring waters mainly in AzerbaijanWest, Kerman, and Fars Provinces contain relativelyhigh concentrations of arsenic, hence the positive
Fig. 10 Arsenic distribution and mortality rates of related diseases (Source: Navi, 2007)

Medical Geology in the Middle East 145
correlation between the distribution of geothermalsprings, arsenic, and mortality rate of all cancers inAzerbaijan West.
Arsenic Occurrence in Drinking Waterof Iran – The Case of Kurdistanand Azerbaijan Provinces
Mosaferi et al. (2008) indicated that several partsof Iran suffer from natural arsenic contamination ofgroundwater, one of these is Bijar District in KurdistanProvince (Fig. 9). Bijar District is 580 km2 and situated1,750 m, above sea level. The total annual consump-tion of water for municipal, industrial, and agriculturalpurposes is about 30 million cubic meter, most of itfrom groundwater resources through 42 springs, 9 sub-terranean channels, 17 deep wells, and 616 hand-dugwells (Fig. 11).
Field studies indicate elevated levels of arsenic indrinking water ranging (for 18 villages) between 10.7and 1,480 μg l−1 (Table 2) with an average valueof 290 μg l−1 compared to a national upper limit of50 μg l−1.
The source of arsenic is definitely geogenic dueto the dissolution of arsenic and arsenic containingminerals. Although mining and the application of
pesticides as anthropogenic sources also mightcontribute, the study did not identify industrialwastewater or pesticide application as sources ofpollution.
Mosaferi et al. (2008) indicated that the first caseof chronic arsenic poisoning in Iran was recognizedin Kurdistan Province in 1986. This particular casewas a woman with intense skin lesions who lived ina village in Bijar District and she had lost her legsas a result of gangrene due to the consumption ofwater containing high levels of arsenic. Some limitedmonitoring of drinking water resources had shown aconcentration of arsenic >1 mg l−1 in some villages inIran.
In a later, comprehensive study, Mosaferi et al.(2008) investigated skin lesions among 752 partici-pants in eight villages in Bijar District with emphasison total lifetime intake of arsenic (TLIA) from drink-ing water. Arsenic concentrations ranged between 0.01(±0.006) and 0.46 (±0.02) mg l−1 with a mean of0.138 (±0.154) mg l−1. The study concluded that thereis significant linear relationship between TLIA andhyperkeratosis and hyperpigmentation (Table 3). Thestudy concluded also that for a more accurate esti-mation of exposure it is necessary to investigate thehistory of water sources with regard to arsenic con-centration for the whole period of exposure, exposure
Fig. 11 Location map ofKurdistan Province (Source:Mosaferi et al., 2008)

146 H. Misconi and M. Navi
Table 2 Arsenic concentration of some water sources in ruralareas of Kurdistan Province. Sampling conducted in 2001 andarsenic determined using neutron activation
No. ofvillage
Type of watersource Type of use
As concentration(μg l−1)
1 Spring Piped fordrinking
32
2 Spring Piped fordrinking
10.7
3 Well Piped fordrinking
21
4 Spring Piped fordrinking
187
5 Well Piped fordrinking
205
Undergroundchannel
Non-drinking 206
6 Spring Piped fordrinking
11.6
Spring Non-drinking 117 Spring Piped for
drinking15.9
8 Spring Non-drinking 289 Spring Non-drinking 1510 Spring Non-drinking 2811 Spring Non-drinking 4512 Spring Piped for
drinking90
Spring Piped fordrinking
30
13 Spring Non-drinking 1,040Spring Piped for
drinking210
Spring Piped fordrinking
801
Spring Non-drinking 440Spring Non-drinking 470
14 Spring Usually usedfor drinking
43
15 Spring Piped fordrinking
23.9
16 Spring Piped fordrinking
1,480
Spring Usually usedfor drinking
20.8
Spring Non-drinking 11817 Spring Piped for
drinking422
18 Spring Non-drinking 408
Source: Data from Mosaferi et al., 2008
to arsenic in drinking water for long periods whichincreases mortality from cancer. The prevalence of skinlesions varied among villages and families probablydue to genetic and nutritional differences. In an overall
Table 3 Logistic regression analysis between hyperkeratosis,hyperpigmentation, intake of arsenic, and age
Variable ORa (eb) 95% CI for eb
Hyperkeratosis TLIA (g) 1.14 1.039–1.249Age (year) 1.024 1.009–1.04
Hyperpigmentation TLIA (g) 1.254 1.112–1.416Age (year) 1.029 1.006–1.052
aFor hyperpigmentation adjusted for age and EC. bFor hyper-keratosis adjusted for age, EC, TDS, hardness, alkalinity, Cl−,HC03
−, Na+, Al3+, and Fe3+
Source: Data from Mosaferi et al., 2008
conclusion, the study found a clear dose–response rela-tionship between the prevalence of skin lesions andTLIA as a reliable indicator of exposure. In similarepidemiological studies where the sources of drink-ing water have been changed, TLIA may prove to bea better indicator of arsenic exposure than the currentlevel of arsenic in drinking water. The study recom-mended further investigation of other health problemsof arsenic in drinking water, e.g., internal cancers, inpolluted areas of Kurdistan Province.
Mosaferi et al. (2008) studied the arsenic contentin drinking water in Hashtrood District in AzerbaijanEast Province to the north of Kurdistan Province andrelated health effects. The study covered all urban andrural centers in Hashtrood District. Analysis of drink-ing waters indicated that arsenic was present in thewater supply of 50 villages, with 9 villages higher thanthe national upper limit of 50 μg l−1. The source ofarsenic is geogenic and its health impact on 11,087persons (21.96% of the total population) have beeninvestigated.
Correlation Between ArsenicConcentration in Drinking Waterand Human Hair
Mosaferi et al. (2008) conducted a follow-up researchin three villages in Bijar District, Kurdistan Province,to determine if arsenic in hair can be used as a proxyfor total life arsenic intake via drinking water. Hairsamples were taken from 39 female participants (age11–74 and mean 32 ± 17 years) residing in threevillages (13 samples from each village) with differ-ent drinking water sources and different levels ofexposure to arsenic via drinking water for a duration

Medical Geology in the Middle East 147
of 2–74 years. One village, Najafabad, has had noarsenic in drinking water and, accordingly, consid-ered unexposed. The second, Gheshlaghnoruz, hasbeen exposed to low-level (85 μg l−1 annual average)arsenic while the third village had high levels (455 μgl−1 annual average) of arsenic in drinking water butthe exposure was eliminated 4 years ago. Hair sam-ples were analyzed for arsenic using neutron activationanalysis.
Mosaferi et al. (2008) indicated that there is nostatistical significance between age and residence dura-tion of the three villages. Alternatively, Fig. 10 showsthat there is a consistency in arsenic concentrationsin hair and total life intake. A strong positive corre-lation also exists between hair arsenic and total arsenic
content via drinking water and between current arseniccontent of drinking water and arsenic concentrationin hair samples. For each milligram increase in hairarsenic there has been a 2.69 increase in total arsenicintake via drinking water irrespective of age (Figs. 12,13, and 14).
The study concluded that (1) the concentration ofarsenic in hair clearly increased in people consum-ing drinking water with high arsenic concentration;(2) there is close relationship between arsenic concen-tration in hair and total lifetime intake (via ingestionof contaminated water); and (3) significant correla-tion exists between arsenic concentration of drinkingwater and in hair. While arsenic concentration in haircan be used as proxy for chronic arsenic ingestion via
1
9
8
7
Hai
r ar
sen
ic c
on
c. (
pp
m),
Tota
l lif
etim
e in
take
(g
)
Case
6
5
4
3
2
1
0
2 3 4 5 6 7 8 9 1011 12 13 14 15 1617 1819 20 2122 2324 25 26 2728 29 30 31 3233 34 35 36 37 38 39
Total life time intake
Hair arsenic conc.
Fig. 12 Consistency of arsenicconcentration in hair samples and total life intake in each participant (Source: Mosaferi et al., 2008)
00
1
2
Hai
r A
rsen
ic C
on
c. (
mg
As/
Kg
Hai
r)
3
4
2 4
Total Lifetime Intake via drinking water (g)
6 8 10
y = 0.1882X+0.1645
R = 0.71.p < 0.001
Fig. 13 Arsenicconcentrationin hair vs. totalarsenic intake via drinkingwater. (Source: Mosaferiet al., 2008)

148 H. Misconi and M. Navi
2.0
1.5
95%
Cl h
air
arse
nic
cont
ent a
s pp
m
1.0
.5
0.0
–.5
N – 13
13
13
13
0.0 mg/l 0.085 mg/l
water arsenic average concentration as mg/l
0.455 mg/l13 13
Fig. 14 Distribution of arsenic concentration of hair samples in different exposure groups (Source: Mosaferi et al., 2008)
drinking water, it is not known how much of the arsenicin hair that originates from arsenic in blood and howmuch is bound due to external contact with contam-inated water. The study concluded also that extrinsiccontamination of hair with arsenic is not of majorconcern in the community.
Arsenic in Drinking Water in KhohsorkhArea, Northeast Iran
Ghassemzadeh et al. (2008) studied the distribution ofarsenic in surface waters of Khohsorkh area, KhorasanRazavi, and northeastern Iran and the possible impactof ingestion of arsenic-contaminated water over a longperiod of time on public health via comparison witha similar population in the same region unexposed toarsenic.
In this study, 79 water samples have been seasonallycollected from small tributaries of Chelpo River, fromChelpo River itself at four stations (Fig. 15), and fromtap water derived from surface waters and used by localpopulation in four villages (Bakhtiar, Chelp, Aliabad,and Tacala). Out of the total population of the four vil-lages of 3,287, only 200 adult participants have beenselected randomly and interviewed for their history,
height, weight, diet, and general health. All of the par-ticipants used the same contaminated water for a longperiod of time. All subjects underwent examinationfor dermatological changes in hands and feet (ker-atosis and melanosis). The community of Akbarabad,10 km south, has been selected as control populationfor non-exposed.
Chemical analysis showed that the concentrations ofarsenic ranged between 37.4 and 376 μg l−1 in tribu-tary and river waters and between 25.5 and 104.0 μgl−1 in tap water with an overall mean value of 97.1 μgl−1 compared to a mean of 7.8 μg l−1 in the drinkingwater of unexposed population.
The study revealed that out of the 200 cases, 20cases had dermatological problems (keratosis), 65% ofthem are women more than 40 years old who usuallywash dishes and clothes with contaminated water. Inaddition, 80% of the cases suffered from malnutritionreflected in below average height and weight.
Comparison of total deaths in six different groups(prenatal, infectious diseases, cardiovascular, cancer,accidents, and others) in exposed and unexposed pop-ulations and on the national level is given in Table 3.
The source of arsenic in this naturally pollutedarea is Paleozoic deposits cut by faults with metallicmineralizations along this fault zone.

Medical Geology in the Middle East 149
Fig. 15 Location map of Khohsorkh area, Khorasan Razavi (Source: Ghassemzadeh et al., 2008)
As indicated in Table 4, a 10% prenatal death rate inthe exposed population is much higher than that in theunexposed population (3.8%). Also, 95% of the newlyborn babies are 2.5 kg or less in weight. There is asubstantially higher death rate of cancer in the exposedpopulation (26.0%) compared to the unexposed popu-lation (8.3%) and the national average for rural com-munities in Iran (11.7%). However, out of this 26%mortality rate, none is caused by skin lesions, whiledigestive track cancer and pulmonary cancers account
Table 4 Percentage of deaths by cause in the exposed andunexposed communities and average for rural communities inIran
Cause of death
Exposedpopulation(%)
Unexposedpopulation(%)
Average forrural com-munities(%)
Prenatal 10.0 3.8 4.2Infectious diseases 2.5 5.8 1.6Cardiovascular 12.5 19.6 33.8Cancer 26.0 8.3 11.7Accident 9.5 15.2 12.4Others 39.5 47.0 35.9
Source: Data from Ghassemzadeh et al., 2008
for 36.7 and 16.7% of cancer mortalities, respectively.Also 52% of the study participants, mostly men in theage range of 30–65 years, suffered from other pul-monary effects, specifically cough and shortness ofbreath. Considering that Kohsorkh is located in anarid region where dust particles might be contami-nated with arsenic from nearby ore bodies, pulmonarycancer and effects can be shown, especially for farm-ers and shepherds working in open air. Malnutrition,widespread among the study participants, and the pres-ence of antimony in association with arsenic mightincrease the toxicity of arsenic and its health impact.
Iodine
Iodine has long been known as an essential elementfor humans, and mammals in general, where it is con-centrated in the thyroid gland. It is a component ofthe thyroid hormone thyroxine. Deprivation of iodineresults in a series of iodine deficiency disorders (IDD),the most common of which is endemic goiter, a con-dition where the thyroid gland becomes enlarged in anattempt to be more efficient. Iodine deficiency during

150 H. Misconi and M. Navi
fetal development and in the first year of life canresult in endemic cretinism, a disease which causesstunted growth and general development along withbrain damage. However, the more insidious problemis that iodine deficiency impairs brain development inchildren even when there is no obvious physical effect.
Indeed it has been suggested that iodine deficiencyis the most common preventable cause of mental retar-dation (Combs, 2005; Nordberg and Cherian, 2005).
Endemic goiter and cretinism along with relatedIDD have long been recognized as serious health prob-lems and consequently much work has been carried outon the etiology and geographical distribution of thesediseases. It became generally agreed that the primarycause of IDD is a lack of iodine in the diet. Iodinewas the first element recognized as being essential tohumans and endemic goiter was the first disease to berelated to environmental geochemistry (Fuge, 2005).Iodine remains the classic success story in medicalgeology as far as human health is concerned (Davieset al., 2005)
Endemic goitrous areas where IDD are concen-trated tend to be geographically defined. Thus manyof the most severe occurrences of endemic goiter andcretinism have been found to occur in high moun-tain ranges, rain shadow areas, and central continentalregions. This distribution of IDD results from theunique geochemistry of iodine. Most iodine is con-centrated in seawater and derived from volatilizationfrom the oceans with subsequent transport onto land.Since most of the iodine in soils is derived from theatmosphere and ultimately the marine environment, theproximity of an area to the sea therefore is likely toexert a strong influence on the iodine content of soils inthat area. This also results in considerable geographicvariation of soil iodine content.
IDDs in the Middle East affect those parts remotefrom marine influence, including continental inlands,mountainous regions, and their rain shadow areassuch as the Alburz Mountains in northern Iran,Taurus–Zagros Mountains in northern–northeasternIraq and northwestern Iran, Lebanon, and Anti-Lebanon Mountains in western Syria and Lebanonand Al Hijaz and Asir Mountains in western SaudiArabia and its southern extensions in Yemen. In allof these parts, IDD can be explained according to theclassic explanations of low iodine supply and hence
low iodine availability. However, the prevalence ofIDD cannot be simply explained in this context in atleast one case where a near coastal area suffers fromIDD. This is likely governed by the geochemistry ofiodine and its bioavailability. Iodine retention capacityof soils is related to composition with organic matterand iron and aluminum oxides are the most impor-tant retentive components. So, sandy soils deficient inthese components and prevailing in coastal areas aredeficient in iodine. Another example of environmentalcontrol on IDD is the apparent strong association ofsome goitrous regions with limestone bedrock widelyexposed in northwestern Iran, northern and north-eastern Iraq, and Lebanon Mountains. IDD occurs insome of these limestone terrains despite relatively highiodine in soils. This would imply that iodine is notbioavailable (Fuge, 2005).
In a review of IDD in the Middle East, Azizi (2001)indicated that before 1987, IDD had not been recog-nized as a serious health problem in the Middle East. Inthe mid-1980s, IDDs in the Middle East were regardedas strictly limited to certain geographical areas andthus not a public health problem of national interest.
In Asia, where the largest global concentration ofpopulation affected by IDD is located, salt fortifica-tion and iodized oil distribution, training, and educa-tion have produced improvements in some countries(ACC/SCN, 1992). Following maps show the effects ofimplementing programs to eliminate iodine deficiency,including the purchase of salt iodization equipment(Fig. 16).
The International Council for Control of the IodineDeficiency Disorders (ICCIDD) has issued detailednational and regional reports on the status of the IDDin the Middle East.
Although Iran was announced IDD-free since 2001with a total goiter rate (TGR) dropped from 68.0% in1989 to 54.6% in 1996 and 9.8% in 2001, some inves-tigations of IDD are still underway. Monajemzadehand Moghadan (2008) studied the prevalence of goi-ter among 11–16-year-old children in Ahwaz City,Khuzestan Province, southwestern Iran. The studiedpopulation comprised of 1,950 (1,050 males and 900females) children, 146 children with goiter. Prevalenceof goiter was 4.4 and 11.1% for male and female stu-dents, respectively. The study observed a significantdifference in height and weight between students of

Medical Geology in the Middle East 151
Fig. 16 a. Global Prevalence of IDD (circa 1990); b.Percentage of households consuming iodized salt (1992–1996) (Source: IDD data from UNICEF ‘Report on Progress
Towards Universal Salt Iodization’, 1994. Salt iodization datacompiled by UNICEF, 1997). (http://www.unicef.org/sowc98/approach4.htm)

152 H. Misconi and M. Navi
grade 1 goiter (83 cases) and those with grades 2 (55cases) and 3 (8 cases) goiter. The study concluded thatAhwaz City is not endemic with IDD due to its geo-graphic location, low altitude, and nutritional habits ofits people. Najafi et al. (2008) conducted a pilot neona-tal thyroid screening in the mild IDD endemic regionof eastern Iran. In the period May 2006–February 2007a total of 59,436 neonates have been screened andrecall rate and incidence of hypothyroidism recorded.The study indicated that the recall rate of 3.6 is highcompared to other countries in the region while thefrequency of neonatal blood thyroid stimulate hor-mone (TSH) was above 3% indicating mild iodinedeficiency. The incidence of hypothyroidism (2 per1,000) was relatively high. The study concluded thathypothyroidism is of the transient type and is of highprevalence (Table 5).
Caughey and Follis (1965) observed high preva-lence of thyroid enlargement in Al Mosul and othercities in Ninawa Governorate, northern Iraq, and con-ducted a preliminary study on 500 adult patients at theRepublican Hospital in Al Mosul. Goiter was foundin 273 (55%) of them, 85 men and 188 women. Ageand sex were clearly significant, since the prevalence
was high in females aged 10–30 years. In men andwomen over 50 years, the prevalence fell and thy-roid glands were notably smaller. The majority of thepatients were Arabs or Kurds, the remainder beingTurkman, Assyrian, or Armenian. Race did not appearto be important. The study investigated also the preva-lence of goiter at a girls school and a boys school, bothintermediate with an age range of 11–18 (Table 6). Theresults confirm the experience of Marine and Kimbell(1917) (in Caughey and Follis, 1965) that adolescentgirls form the most sensitive group in any population.Similar studies were conducted in Tell Afar, 120 kmnorthwest of Al Mosul, on 60 teenage girls with anage range of 10–16 and in Dohuk and Akra, 55 and110 km north and northeast of Al Mosul, respectively(Table 7). Data on urinary iodine excretion indicatedthat iodine excretion per gram of creatinine is low(16.8–24.0 μg g–1 creatinine) except in Tell Afarwhere it is higher (33.2 μg g–1 creatinine). Iodinewater content (μg l−1) ranged between 3 in Al Mosulto 4 in Akra, 7 in Dohuk and, for comparison, 3.5 inBaghdad while in Tell Afar the iodine content is 17.5since its source is natural springs. The study explainedthe situation in Al Mosul as of very high prevalence
Table 5 Iodine deficiency disorder (IDD) status in some countries of the Eastern Mediterranean Region
Country Endemic regionPrevalence (beforeintervention)
MUI μgdl−1 TGR % IDD status Notes
(1) (2) (3) (4) (5) (6) (7)
Iran Highly endemic areasouthwest of Tehran(Shahryar)
17–100% prevalenceamong schoolchildren invarious regions
16.7 9.8 Free
Iraq Northern mountain region(Ninawa) and aroundBaghdad
60–85% in hyperendemicnorthern area. About30% around Baghdad
2.4 22–44 Severe
Syria < 10 70 Mild Data need to be updatedLebanon Throughout 40–75% in mountain and
hilly regions and about12% in coastal areas
9.4 25.7 Mild Data need to be updated
Jordan Northern region 37.7 (18–76%) 15.4 32.1 Mild Needs regular monitoringPalestine NA 14.9 in schoolchildrenOman Only mild TGR 10% 9.5 10 Mild No national IDD control
programUAE Desert and mountainous
areas1.5–20% 10 1.5–20 Mild
Saudi Arabia Probably southern region NA 18 4–30 Moderate Needs IDD controlprogram, especially insouthern province
Yemen Mountainous region TGR 32%, 60–100% insome locations
17.3 16.8 Mild Needs regular monitoring
Source: Compiled from Azizi (2001) (columns 2 and 3) and Azizi and Mehran (2004)

Medical Geology in the Middle East 153
Table 6 Goiter in studied populations in Ninawa Governorate, northern Iraq
Classification
Location No. examinedNo. withgoiter
Group 0(normal)
Group 1(small)
Group 2(medium)
Group 3(large)
Al Mosul School (Girls) 436 429 (98%) 7 374 54 1Al Mosul School (Boys)) 471 303 (64%) 168 298 5 0Tell Afar 60 43 (72%) 14 43 0 0Akra 68 53 (79%) 15 44 8 1Dohuk 100 95 (95%) 5 77 18 0
Source: Data from Caughey and Follis, 1965
Table 7 Prevalence of goiter in Baghdad and Al-Basra
Positive goiter (%)
Location SexAge group(years)
Total no.examined Grade 1 Grades 2 and 3 All grades
Baghdad (urban) MF
6–12 2,1021,910
16.822.0
4.55.6
21.327.6
MF
12–16 1,6191,459
22.733.3
2.87.9
25.541.2
MF
17–20 1,2271,208
19.738.4
1.717.7
21.446.1
MF
Over 21 550264
16.527.3
4.210.6
20.737.9
Baghdad (rural) 412 27.4 2.9 30.0548 25.7 4.0 29.7503 3.6 Nil 3.6
Al-Basra MF
6–12 1,1791,044
2.23.8
Nil0.8
2.24.6
MF
12–16 7231,025
4.28.4
0.12.4
4.310.8
MF
17–20 568242
2.610.7
0.33.2
2.913.9
Source: Data from Demarchi et al., 1969
of goiter and recommended an immediate responsethrough a program of goiter prophylaxis.
Demarchi et al. (1969) conducted a comprehensiveinvestigation of goiter and its etiology in Baghdad andAl-Basra, the largest cities in Iraq and the surround-ing rural areas. The study covered the examination forthyroid enlargement of 11,852 persons in the Baghdadand 4,789 persons in the Al-Basra, representing about1% of the population of the areas surveyed (Table 6).The majority of the subjects were students of pri-mary and secondary schools. The study concluded thatBaghdad is endemic in goiter while Al-Basra is notand explained, on basis of iodine radionuclide uptakeby the thyroid gland, that there is iodine avidity ofthe thyroid gland as an attempt to make up either fora deficient supply of iodine or for a block in iodinemetabolism by goitrogenic factors. In addition the
study indicated that deficiency in vitamin A might beanother factor.
In the most recent study on the sedimentary andenvironmental geochemistry of iodine in, Iraq, Al-Jumaily (2001) indicated that iodine content in theexposed rock units in Al Mosul and the adjacent areasranges between 3.1 and 9.0 μg g−1 while its aver-age content in soil and drainage sediments is 10.7and 14.0−16.2 μg g−1, respectively. In water, aver-age iodine content varied between 0.39 μg g−1 inrain water (the content decreased with successive rainfall), 0.63 μg g−1 in mineral springs, 0.5 μg g−1
in shallow wells, and 0.44 μg g−1 in Tigris River.The study identified different sources of iodine insoil including washed iodine from atmospheric dustparticulate (wet precipitation), liberated iodine fromhydrocarbons associated with mineral springs activity,

154 H. Misconi and M. Navi
dissolved iodine from exposed and unexposed rockunits, added iodine by dust fall (dry precipitation), andhuman activities. However, the study considered theatmosphere as the main source of iodine in the soiland water with dry and wet precipitation amountingto 3.26 and 0.05 mg l−1 m−2 year−1. The environmen-tal cycle showed the presence of geochemical barriersthat reduces mobility and, hence, the bioavailability ofiodine. The study compared the incidence of IDD inAl Mosul with that in Al-Basra, about 950 km south,and concluded that the incidence of IDD in Al Mosul isalmost twice than that in Al-Basra considering that thepopulation is almost the same (Fig. 17). This is partlyexplained by the higher content of iodine in drinkingwater in Al-Basra (0.54 μg g−1) compared to Al Mosul(0.26 μg g−1) However, the study recognized a sharpincrease in IDD incidence in Al-Basra in the period1991–1997 probably due to the environmental and eti-ological changes following the 1991 Gulf War and theimposition of the international sanctions on Iraq since1990.
In Jordan, Al-Sarayrah et al. (2005) conducted astudy on the prevalence of IDD among 210 (110females and 100 males) schoolchildren aged 8–10years in Al Tafilah Governorate, southern Jordan.Urinary iodine excretion level was estimated for 76children with thyroid enlargement (48 females and 28males). The study indicated that the frequency of goi-ter is 36.2% with goiter more common in females thanmales. However, this frequency is less than the figureof 76.1% recorded in 1993.
In the Palestinian Territories, Sack et al. (1998)conducted a screening for congenital hypothyroidism(CH) among the Arab population of the WestBank as part of the neonatal screening programin Israel. In the period June 1990–February 1994,49,694 infants were screened, of whom only 24were detected with CH, a ratio of 1:2.070 com-pared to a ratio of 1:1,447 in East Jerusalem inalmost the same period. The study explained thehigher rate among the Arab population to the consan-guineous marriages leading to dyshormonogenesis and
Fig. 17 Incidence of IDD inAl Mosul and Al-Basra, Iraq.IDD is still endemic in AlMosul, a historically goitrousregion in Iraq. In Al-Basra, arelatively mild IDD region,the situation deterioratedfollowing Gulf War I due toenvironmental and etiologicalchanges reflected in almostdouble incidence of IDD(Source: Data fromAl-Jumaily, 2001)

Medical Geology in the Middle East 155
to environmental factors, probably iodine or seleniumdeficiencies.
Brand et al. (1961) studied endemic goiter in north-ern Israel using 2,189 children from 13 differentcommunities in the Upper Galilee, a highland areabordering Lebanon and Syria. Goiters were found in12–17% of girls but in only 6–9% of boys. The I131
uptake was high (77.9% at 24 h) but not different fromthat in subjects without goiter in the same area. Urinaryiodine was measured in only 18 children and the aver-age level was 41 μg per 24 h (range 10–70 μg per 24 h)in both goiterous and non-goiterous children, signifi-cantly lower than that of the Jerusalem controls with100–120 μg per 24 h. The iodine content in drink-ing water was 0.5–6 μg l−1, also below the 58 μg l−1
found in Jerusalem.Barzilai and Harris (1965) studied 5,500 people
(4,675 children) from seven Arab villages in WadiAra, a valley crossing the lower part of northern Israelfrom east to west, and 1,250 people (450 schoolchil-dren) from five Jewish settlements in the Jordan Valley.The prevalence of goiter was 31% (range 17–68%) inWadi Ara and 24% (range 17–34%) in Jordan Valley.More recently, Sack et al. (1998) studied urinary iodineexcretion as a surrogate of iodine intake in 146 preg-nant women from Western Galilee (47 Jewish, 99non-Jewish). Among the Jewish women urinary iodinewas normal (median I27 ∼μg I g−1 creatinine) withonly 3% under 50∼μg I g−1 creatinine; among thenon-Jews urinary iodine was borderline low (median96 ∼μg I g−1 creatinine) with 23% under 50∼μg Ig−1 creatinine. Benbassat et al. (2004) conducted anassessment of iodine intake in the Israel coastal areaaiming at investigating urinary iodine excretion alongwith iodine concentration in tap water. The study popu-lation comprised 102 adults (99 females, 52 pregnant).The median and mean urinary iodine concentrationswere 143 and 130.1 μg l−1, respectively. A medianurinary iodine concentration <100 μg l−1 was found in24.7% of the whole population. Mean iodine concen-tration in tap water was 22.8 μg l−1 (range 0.5–53.5 μgl−1). The fact that 27.7% fell in the range of mildto moderate iodine deficiency contradicts the currentbelief that because of its Mediterranean Sea vicinity,iodine deficiency in Israel should not represent a prob-lem. Also, it may explain the perception of a highrate of amiodarone-induced thyrotoxicosis rather thanhypothyroidism among Israelis. Interestingly, the studyfound no statistically significant difference in urinary
iodine excretion between pregnant and non-pregnantwomen.
Al-Nuaim et al. (1997) conducted a nationalcross-sectional epidemiological survey among Saudischoolchildren for studying the iodine status in SaudiArabia, through urinary iodine estimate and clinicalassessment of thyroid gland. The sample included4,638 Saudi schoolchildren, 2,365 (51%) males and2,273 (49%) females, aged 8–10 years old. They wererandomly selected from different regions of the coun-try. The national median and mean (SD) urinary iodineconcentrations were 180 and 170 μg l−1. The medianand mean (SD) urinary iodine concentrations for maleand female subjects were 18, 17, and 17, 17 μg l−1,respectively (P = 0.008). The majority of subjects hadurinary iodine concentration >10 μg l−1. The studyindicated that at the national level, 23% of the studiedpopulation (1,043 students) had urinary iodine con-centration <10 μg l−1. The southern Asir Provincehad the highest percentage (45%) of students with lowurinary iodine concentration, 18% of students with aurinary iodine concentration <5 μg l−1, and the low-est median urinary iodine concentration (11 μg l−1).The lowest percentage was observed in the central andwestern provinces (8%) where the urinary iodine con-centration was the highest (24 μg l−1). The differencecan be attributed to the special character of each ofthese provinces, where Asir Province is characterizedby being of high altitude, low to medium income, andwithout easy access to high-iodine content food such asfish and fresh food compared to the western province,which is of low altitude, medium to high income,and has easy access to food high in iodine content.Goiter prevalence in the studied areas ranged from 8to 30%. The clinical assessment showed good correla-tion between the prevalence of goiter and the median ofurinary iodine concentration in different geographicalareas.
Abu-Eshy et al. (2001) investigated goiter inschoolchildren in high- and low-altitude areas inAsir Province. The area of Asir Province is about80,000 km2 and has a population of 1,200,000 and islocated in southwestern Saudi Arabia. Sharing its bor-der with Yemen, the area extends from the high Asirmountains, almost 3,200 m above sea level, down tothe Red Sea. The study aimed to estimate the preva-lence of goiter among schoolchildren in high- and low-altitude areas of Asir Province. For this purpose, high-altitude (3,150 m asl), Tamnia and Al Soda, areas were
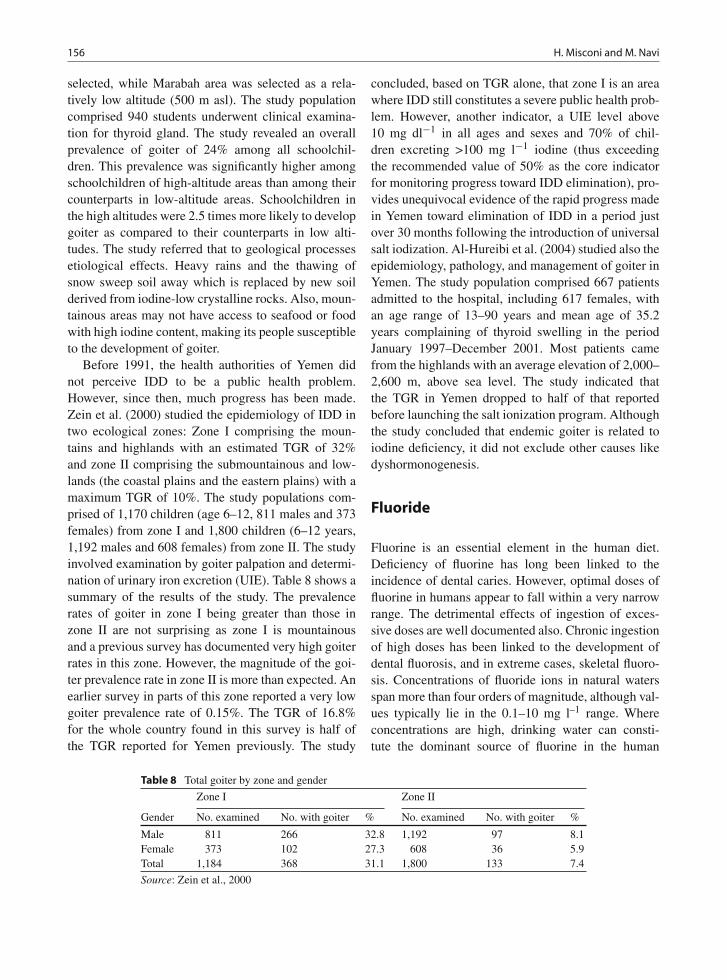
156 H. Misconi and M. Navi
selected, while Marabah area was selected as a rela-tively low altitude (500 m asl). The study populationcomprised 940 students underwent clinical examina-tion for thyroid gland. The study revealed an overallprevalence of goiter of 24% among all schoolchil-dren. This prevalence was significantly higher amongschoolchildren of high-altitude areas than among theircounterparts in low-altitude areas. Schoolchildren inthe high altitudes were 2.5 times more likely to developgoiter as compared to their counterparts in low alti-tudes. The study referred that to geological processesetiological effects. Heavy rains and the thawing ofsnow sweep soil away which is replaced by new soilderived from iodine-low crystalline rocks. Also, moun-tainous areas may not have access to seafood or foodwith high iodine content, making its people susceptibleto the development of goiter.
Before 1991, the health authorities of Yemen didnot perceive IDD to be a public health problem.However, since then, much progress has been made.Zein et al. (2000) studied the epidemiology of IDD intwo ecological zones: Zone I comprising the moun-tains and highlands with an estimated TGR of 32%and zone II comprising the submountainous and low-lands (the coastal plains and the eastern plains) with amaximum TGR of 10%. The study populations com-prised of 1,170 children (age 6–12, 811 males and 373females) from zone I and 1,800 children (6–12 years,1,192 males and 608 females) from zone II. The studyinvolved examination by goiter palpation and determi-nation of urinary iron excretion (UIE). Table 8 shows asummary of the results of the study. The prevalencerates of goiter in zone I being greater than those inzone II are not surprising as zone I is mountainousand a previous survey has documented very high goiterrates in this zone. However, the magnitude of the goi-ter prevalence rate in zone II is more than expected. Anearlier survey in parts of this zone reported a very lowgoiter prevalence rate of 0.15%. The TGR of 16.8%for the whole country found in this survey is half ofthe TGR reported for Yemen previously. The study
concluded, based on TGR alone, that zone I is an areawhere IDD still constitutes a severe public health prob-lem. However, another indicator, a UIE level above10 mg dl−1 in all ages and sexes and 70% of chil-dren excreting >100 mg l−1 iodine (thus exceedingthe recommended value of 50% as the core indicatorfor monitoring progress toward IDD elimination), pro-vides unequivocal evidence of the rapid progress madein Yemen toward elimination of IDD in a period justover 30 months following the introduction of universalsalt iodization. Al-Hureibi et al. (2004) studied also theepidemiology, pathology, and management of goiter inYemen. The study population comprised 667 patientsadmitted to the hospital, including 617 females, withan age range of 13–90 years and mean age of 35.2years complaining of thyroid swelling in the periodJanuary 1997–December 2001. Most patients camefrom the highlands with an average elevation of 2,000–2,600 m, above sea level. The study indicated thatthe TGR in Yemen dropped to half of that reportedbefore launching the salt ionization program. Althoughthe study concluded that endemic goiter is related toiodine deficiency, it did not exclude other causes likedyshormonogenesis.
Fluoride
Fluorine is an essential element in the human diet.Deficiency of fluorine has long been linked to theincidence of dental caries. However, optimal doses offluorine in humans appear to fall within a very narrowrange. The detrimental effects of ingestion of exces-sive doses are well documented also. Chronic ingestionof high doses has been linked to the development ofdental fluorosis, and in extreme cases, skeletal fluoro-sis. Concentrations of fluoride ions in natural watersspan more than four orders of magnitude, although val-ues typically lie in the 0.1–10 mg l–1 range. Whereconcentrations are high, drinking water can consti-tute the dominant source of fluorine in the human
Table 8 Total goiter by zone and gender
Zone I Zone II
Gender No. examined No. with goiter % No. examined No. with goiter %
Male 811 266 32.8 1,192 97 8.1Female 373 102 27.3 608 36 5.9Total 1,184 368 31.1 1,800 133 7.4
Source: Zein et al., 2000

Medical Geology in the Middle East 157
diet. Concentrations in drinking water of around 1 mgl−1 are often thought to be optimal; however, chronicuse of drinking water with concentrations above about1.5 mg l−1 is considered to be detrimental to health.The World Health Organization (WHO) (1993) guide-line value for fluoride in drinking water is 1.5 mgl−1.
High fluoride concentrations are most often associ-ated with groundwaters as these accumulate fluorideas a result of water-rock interaction. However, in mostgroundwaters are below the upper concentrations con-sidered detrimental to health.
Despite the uncertain health effects of fluoride indrinking water at low concentrations (0.7 mg l−1
or less), the chronic effects of exposure to exces-sive fluoride in drinking water are well established.The most common symptom is dental fluorosis (mot-tled enamel). With higher exposure to fluoride, skele-tal fluorosis can result. This manifests in the earlystages as osteosclerosis, involving hardening and cal-cifying of bones and causes pain, stiffness, andirregular bone growth. At its worst, the conditionresults in severe bone deformation and debilitation(Table 9).
Fluorosis has been described as an endemic diseaseof tropical climates (Fawell et al., 2006). One of thereasons for that in the tropics is temperature (Ekstrandet al., in Aminabadi et al., 2007). People in tropicalregions drink more water, hence more fluoride intake(Fejerskov et al., in Aminabadi et al., 2007). The preva-lence of dental fluorosis has been reported in childrenliving at an altitude of 2,800 m (with 2.5 mg F/L inthe drinking water) is higher than children living atan altitude of 1750 m (with the same level of F inthe drinking water) (Rwenyonyi in Poureslami et al.,
Table 9 Health effects of fluoride concentrations in drinkingwater
Fluorideconcentrationrange (mg l−1) Chronic health effects
Nil Limited growth and fertility0.0–0.5 Dental caries0.5–1.5 Promotes dental health, prevents tooth
decay1.5–4.0 Dental fluorosis (mottled teeth)4–10 Dental fluorosis, skeletal fluorosis>10 Crippling fluorosis
Source: Data from Dissanayake, 1991
2008). Severe dental fluorosis is endemic in parts of theworld where extremely high concentrations of fluorideoccur naturally in drinking water.
In the Middle East region, fluorite deposits occurwithin Sanandaj–Sirjan Zone (metamorphic rocks withintrusive igneous bodies) (Kurdistan and MarkaziProvinces), Central Iran Domain (crystalline base-ment) (Semnan and Yazd Provinces), and within thePrecambrian Arabian Shield (crystalline basement) (AlHijaz). Disseminated fluorite is probably associatedwith the volcaniclastic sediments of Zagros fold Belt innorthern and northeastern Iraq and western Iran and theclastic and evaporate sequences of the MesopotamianBasin.
Amini et al. (2008b) constructed a statistical modelof global geogenic fluoride contamination in ground-water aiming at providing a global probability mapindicating the risk of fluoride contamination in ground-water (Fig. 18). The model indicates that Middle Eastregion has a 0.8–1 probability of fluoride concentra-tions exceeding 1.5 mg l−1. However, this probabilitymodel is based on measured points for 92 samples inIran (F− range 1.49–41.71 mg l−1, median 4.7 mg l−1
with 98% of the concentrations less than 1.5 mg l−1)and 12 samples in Palestine (F− range 0.02–0.56 mgl−1, median 0.13 mg l−1) with all of the concen-trations less than 1.5 mg l−1. However, this modelis questionable at least within the MesopotamianPlain; neither the geology of the terrain which con-sists of very thick sequences of recent sediments withno possible sources of geogenic fluoride nor avail-able analyses of groundwater for fluorine supportthat.
Fluoride is found in both surface waters and ground-water. In surface freshwater, however, fluoride concen-trations are usually low (0.01–0.3 mg l−1). In ground-water, the natural concentration of fluoride dependson the geological, chemical, and physical characteris-tics of the aquifer, the porosity and acidity of the soiland rocks, the temperature, the action of other chem-ical elements, and the depth of wells. Because of thelarge number of variables, the fluoride concentrationsin groundwater can range from well under 1 mg l−1 tomore than 35 mg l−1 (UNICEF, 2000). Figure 18 indi-cates countries with endemic fluorosis due to excessfluoride in drinking water. The map coincides wellwith the map of predicted probability of fluoride con-centration in the groundwater except for the ArabianPeninsula.

158 H. Misconi and M. Navi
Fig. 18 Predicted probability of fluoride concentration in the groundwater exceeding the WHO guideline for drinking water of1.5 mg l–1 (Source: Amini et al., 2008b)
Fluorosis Case Studies in the Middle East
There are some regions in Iran such as Maku,Koohbanan, Dayer in Bushehr, Bandarlenge, andLarestan, some parts of Isfahan province, Karaj, andPoldasht that have high levels of fluoride in drinkingwater and fluorosis. The map below shows locations ofthe areas with incidence of fluorosis (Fig. 19).
A study in four areas of Isfahan province hasshown incidence of fluorosis among 7–12-year-oldschoolchildren who using drinking water containingfluoride. The levels of drinking water fluoride in fourareas of Najafabad, Joozdan, Rahmatabad, and Filorwere 0.23, 0.6, 1.35, and 0.78 ppm, respectively.There was a direct relationship between the drinkingwater containing fluoride and incidence of fluorosis(Khademi and Taleb, 2000).
High-fluoride groundwater occurs in Maku area,in the north of West Azerbaijan Province, northwestof Iran. Groundwater is the main source of drink-ing water for the residents. Inhabitants of the areawho obtain their drinking water supplies from basalticsprings and wells are suffering from dental fluorosis.The population of the study area is at a high risk dueto excessive fluoride intake (Asghari Moghaddam andFijani, 2008). Water fluoride levels were measured in
different rural areas in 1983 ranging from 0 to 9 ppm.In 33.8% of the villages, water fluoride concentra-tion was higher than standard limit (Gholamhoseini inRamezani et al., 2004).
A study in Koohbanan (Kuh-e Banan) which islocated in Kerman Province in SE Iran has deter-mined high fluoride content in foods. The fluoridecontent varied from a very low level of 0.02 mg kg−1
to a relatively high level of 8.85 mg kg−1, and inwater sources ranging from 2.36 to 3.10 mg l−1. Thesmall city of Koohbanan (Kuh-e Banan, population ca.20,000) is situated in a cold mountainous region 2,000m above sea level. Most mountains and hills aroundthe city have coal mines. In this region, vegetablesand fruits are grown by the inhabitants, and drinkingwater and agricultural water are provided from sepa-rate sources. In a survey of secondary school studentsin Koohbanan, the prevalence of dental fluorosis wasfound to be 93%. It appears that in Koohbanan at 2,000m above sea level and 2.38 mg F l−1 in the drinkingwater, altitude is an influencing factor on the preva-lence and severity of dental fluorosis (Poureslami et al.,2008).
Observations in some regions such as Dayer cityin Bushehr province in the south of Iran and thePersian Gulf areas have shown that fluorosis is prob-ably endemic in the region. Dayer city is considered a

Medical Geology in the Middle East 159
Fig. 19 Map of some areas with incidence of fluorosis in Iran (Source: National Geoscience Database of Iran)
hot region. The water fluoride concentration was deter-mined from six supplies including three city suppliesand three village supplies. The most of Dayer is sup-plied from springs and semi-deep wells. The meanfluoride concentration was 2.23 ± 0.25, ranging from2 to 2.5 ppm in city areas and 2.63 ± 0.21, rang-ing from 2.4 to 2.8 ppm in rural areas. The fluorideconcentration was higher than the standard limit (0.6–1.2 ppm) in all of the drinking water supplies, andin rural areas 0.40 ppm (17.9%) higher compared tourban areas (Ramezani et al., 2004).
Reports also show fluorosis prevalence up to 67% insome regions of Iran such as Bandarlenge and Larestanregions (Aminabadi et al., 2007). Drinking water flu-oride concentration was 1.27 ± 0.68 (Eftekhari inRamezani et al., 2004) and fluorosis rate was 76%(Eftekhari and Mazloum, 1999) in Larestan and its
suburb in the year 1996–1997 (Eftekhari in Ramezaniet al., 2004). The average water fluoride level inBandarlenge was 0.15–1.35 ppm in the year 1999(Airemlou in Ramezani et al., 2004).
Five hundred and ten samples of 84 popular foodsand drinks were collected from three areas of Iranwhere water fluoride concentrations were 0.32, 0.58,and 4.05 mg l−1. The concentration of fluoride in waterinfluences positively fluoride concentration in foodscooked in water, but the increase in food was lessthan the increase in fluoride concentration in water(Zohouri and Rugg-Gunn, 1999). In a report on flu-oride in vegetables in Fars Province of Iran, morefluoride was found in stem parts than in roots andthat the use of pesticides and herbicides increased flu-oride levels (Poureslami et al., 2008). Some areas ofIran such as Karaj and Poldasht have shown fluorosis

160 H. Misconi and M. Navi
prevalence 69% in Karaj (Esmailpourin Aminabadiet al., 2007) and 100% prevalence in Poldasht with3 ppm fluoride (Aminabadi et al., 2006). In all ofthe above-mentioned, a direct relation between waterfluoride and fluorosis prevalence has been observed.
Dobaradaran et al. (2008, 2009) examined the rela-tionship between dental caries in children, fluoridecontent, and some inorganic constituents of ground-water used for drinking in 14 villages in DashtestanDistrict of Bushehr Province, southwestern Iran. Thestudy population comprised 2,340 children 6–11 yearsold. Fluoride concentration in groundwater variedbetween 0.99 and 2.50 mg l−1. The study concludedthat there is direct but weak linear correlation betweenincreasing fluoride concentration in drinking waterand dental caries in permanent and deciduous teeth(Fig. 20).
Meyer-Lueckel et al. (2006) investigated the rela-tionship of caries and fluorosis prevalence in adoles-cents from an area with high- and low-fluoride levels inthe drinking water in Iran and indicated that fluorosis issignificantly more prevalent in the high-fluoride com-pared with the low-fluoride areas. Regression analysisadjusted for age and status of father’s occupation esti-mated a negative association of caries and a positiveassociation of fluorosis with drinking water fluorideconcentration. The study concluded that caries preva-lence in the examined areas in Iran is quite low.Water fluoride concentration is negatively related tocaries experience and strongly positively related to flu-orosis severity and prevalence under the conditionsexamined.
In spite of the fact that there are potential fluoride-rich drinking waters in the northern and northeastern
parts of Iraq associated with the igneous complexesof Zagros Belt and the volcaniclastic sediments of theAlpine Geosyncline, no systematic study of fluoridein groundwater and associated fluorosis is available.However, some cases of fluorosis in elderly peoplehave been reported in Bashiqa, a town 20 km north-east of Al Mosul, Ninawa Governorate. These casesrelate, most probably, to relatively high fluoride con-tents in hand-dug groundwater wells used as source ofdrinking water until late 1960s.
Hamdan (2003) investigated dental fluorosis among1,878 children of 12 years age in urban and rural areasin Jordan and concluded that prevalence of fluorosis inrural areas is higher than in urban areas and is relatedto the sources of drinking water.
Rosenzweig and Abewitz (1963) studied dentalcaries and endemic fluorosis in 262 young students inQiryat Haiyim, a suburb of Haifa and determined a flu-orosis index of 0.53. While the study concluded thatcaries prevalence is within the limits observed in themajor cities of Israel, fluorosis is far more prevalentin Qiryat Haiyim. The study related the fluorosis tothe fluoride concentration in the groundwater supplyof Qiryat Haiyim varying between 0.35 and 0.95 mgl−1.
Milgalter et al. (1974) (Fawell et al., 2006) indicatednatural fluoride levels in drinking water of up to 3 mgl−1 in Yotvata in the Negev Desert region in Israel,probably related to Yotvata Salt Flat. Yet, there is noreference in the study to the health effects of such highconcentrations of fluoride.
Mann et al. (1990) investigated fluorosis and dentalcaries in 152 children 6–8-year-old in a 5 mg l−1 flu-oride drinking water in Israel and indicated that 41%
(a) (b) (c) (d)
Fig. 20. Examples of dental fluorosis in three villages ofDashtestan District with 1.87–2.07 mg l–1 fluoride in drinkingwater. a: age: 8, sex: male, village: Dalaki; b: age: 9, sex: female,
village: Dalaki; c: age: 10, sex: male, village: Tang-e Eram; d:age: 11, sex: female, village: Bushkan (Source: Dobaradaranet al., 2008)

Medical Geology in the Middle East 161
of the investigated cases had mild fluorosis in bothprimary and permanent dentition, 20% with moder-ate fluorosis and 36% with severe fluorosis, mostly inpermanent dentition.
Al Khateeb et al. (1991) examined 1,400 childrenof ages 6–15 years from schools in Jeddah, Rabagh,and Mecca, all in Mecca Province of Saudi Arabia with<0.3, 0.77, and 2.47 mg l−1 fluoride in drinking water,respectively. However, the study did not refer to fluo-rosis in Mecca in connection with the relatively highfluoride level.
In Ha’il Province, northern Saudi Arabia, Akpataet al., 1997 investigated the relationship between flu-oride levels in drinking water from wells, severity ofdental fluorosis, and dental caries in 2,355 rural chil-dren 12–15 years old. The study revealed that over90% of the examined subjects showed dental fluoro-sis and that a strong association exists between fluoridelevel (0.5–2.8 mg l−1) in well water used for drinkingand the severity of dental fluorosis.
Almas et al. (1999) examined fluorosis in 400 sub-jects in four age groups (12 ≥ 65 years in age) in AlQaseem Province in central Saudi Arabia and indicatedthat fluorosis is more prevalent in rural areas, espe-cially among the age group 35–44 years and relatedthis to the fluoride level of 2–3 mg l−1 in the water sup-ply. Later, Al-Dosari et al. (2004) indicated that thereis no linear correlation between drinking water fluoridelevel and caries in Al Qaseem and the neighboring AlRiyadh Provinces.
In 2006, King Abdulaziz City of Science andTechnology initiated the “Fluoride Mapping of SaudiArabia” with the objectives of establishing a fluoridedistribution map and correlate it with prevalence ofdental caries and fluorosis. Al-Dosari et al. (2007)indicated that 5,134 water samples, including 4,419drinking water samples, have been collected from all ofthe 13 provinces of Saudi Arabia. Preliminary resultsrevealed that Ha’il Province exhibited the highest levelof 1.27 mg l−1.
In Al Yemen, people in rural areas use deep wells assource of water drinking and household uses. However,some of these underground waters contain 2.5–32 mgl−1 of fluoride with the highest levels recorded inSana’a, Ibb, Dhamar, Ta’iz, Al Dhalei, and RaimahGovernorates. In Sanhan District, southeast of Sana’a,there has been an abnormal increase in the incidenceof rickets among children in addition to osteomalaciain adults and decay and corrosion of teeth (Figs. 21
and 22). In Al Maqula village (population 3,100), thefluoride level varies between 5 and 6 mg l−1 while inShe’an (population 2,850) and Al Daram (population950) villages the level is 5.3 and 1.5–1.9, respectively.
Fig. 21 Rickets in a 3-year-old child in Sanhan (Source:Ghaleb, 2007)
Fig. 22 Dental fluorosis in an adult in Sanhan (Source: Ghaleb,2007)

162 H. Misconi and M. Navi
The groundwater is there associated with aquiferswithin Al Yemen Volcanic Group
Natural Radiation
Sources of natural radiation include radon, terrestrialgamma rays, and cosmic rays. Geological sourcesconstitute the major proportion of sources of natu-ral radiation with radon isotopes contributing about60%. Radon is a natural radioactive gas producedby the radioactive decay of radium which in turnis derived from the radioactive decay of uranium.Radon decays to form alpha and beta radioactiveparticles and gamma radiation. Geology is the mostimportant factor controlling the sources and distribu-tion of radon (Appleton, 2005). Relatively high lev-els of radon are associated with particular types ofbedrock (some granites, phosphate rocks, and shalesrich in organic matter associated with unconsolidateddeposits). Everyone is exposed in daily life to radon.Radon and its decay products are well established aslung carcinogens (UN, 2006). The health effects dueto radon exposure have been well studied in min-ing populations and provide firm evidence of the linkbetween radon exposure and lung cancer (Makofskeand Edelstein, 1988). In addition to uranium minersand other hard rock miners, workers in the oil–gasindustry are exposed to high level of radon gas byinhalation. The number of workers subject to techno-logically enhanced natural radiation exposure is sig-nificantly higher in the Middle East and Central Asiaas compared to the number of workers of all otherregions combined (Steinhausler, 2003). But studies ofhealth effects due to radon exposure in workers of oil–gas industry in the Middle East are limited by lack ofinformation.
Natural Radiation in the Middle East:Case Studies
Natural radiation in the Middle East region is con-fined to igneous complexes and the associated faultsystems in the northwestern, northern, and central partsof Iran and in the Arabian Shield in the western partof Saudi Arabia (Al Hijaz), Yemen, and the extremesouthern parts of Jordan and Israel on the Gulf of
Aqaba. Natural radiation is associated with the rela-tively active Dead Sea Transform Fault (the northernextension of the Great Rift Valley) extending from theGulf of Al Aqaba through Wadi Araba, the Dead Sea,Jordan River Valley westward to the Golan Heightsin Syria and Lebanon, and Anti-Lebanon Mountains.Natural radiation is associated with the widespreadphosphate deposits in western (Azerbaijan West,Chahar Mahal, and Bakhtiari and Kohkilyueh andBuyer Ahmad Provinces), central (Semnan Province),and southern (Kerman Province) of Iran, in theWestern and Southern Deserts of Iraq, and its south-ern extension in Sarhan–Al Turaif Basin of north-ern Saudi Arabia, in Jordan, and in Negev Desert,Israel. However, almost all the investigations carriedout until now concentrated on radon as the majorsource of natural radiation and the associated healtheffects.
Iran
In some parts of Iran there is an association betweenradon exposure, lithology, and geological structures,the most significant of which is Ramsar, a northerncoastal city of Iran (Fig. 23). In Ramsar there are sev-eral high-level natural radiation areas (HLNRAs) andone of the highest known background radiation levelsin the world occurs here. The high background radi-ation is primarily due to the presence of very highamounts of 226Ra and its decay products brought to theearth’s surface by hot springs. Groundwater is heatedby subsurface geological activity and then passesthrough relatively young, uraniferous igneous rocksdissolving radium. When reaching the surface, dis-solved CaCO3 is precipitated as travertine with radiumsubstituting for calcium in the minerals (Karam et al.,2002; Ghiassi-Nejad et al., 2002). A secondary sourceof high radiation levels is travertine deposits with highthorium concentration. Since soils are derived fromthe weathering of local bedrock, the radioactivity ofthese soils and food grown on them is high as well. Atleast nine hot springs with various levels of radioac-tivity occur around Ramsar and used as health spas.Locals use the residue of these hot springs as build-ing material for their houses. The indoor and outdoorgamma radiation-absorbed dose rates vary between 50and 900 μm Gy h−1 with the annual dose to moni-tored individuals ranges up to 132 m Gy. Compared

Medical Geology in the Middle East 163
Fig. 23 Location map of Ramsar, the area with the highest environmental levels of radiation in the world
to the recommended dose limit for workers in Iran of20 mSv year−1 (Karam et al., 2002), some residentsof Ramsar are exposed to levels of natural radiation ashigh as 55–200 times higher than the average globaldose rate. Furthermore, radon levels in some regionsof Ramsar are up to 3,700 Bq m−3 (Mortazavi et al.,2005a).
Out of the total population of Ramsar city of about69,000, 1,000 people are living in HLNRAs, namelyChaparsar, Ramak, and Talesh Mahalleh (Fig. 24)(Karam, 2002). The population of Talesh Mahalleh isabout 500 (118 families) and around 10% of this pop-ulation are called “critical group.” This group receivesthe highest total effective dose and possesses reason-ably homogeneous exposure in the region (Sohrabi,1993 in Ghiassi-Nejad et al., 2003). In Talesh Mahallehthe maximum and minimum vegetable-to-soil concen-tration ratio (CR) was measured in leafy and rootvegetables with average values of 1.6 × 10⁻² and4.0 × 10−3, respectively. The mean effective dose
resulting from 226Ra due to consumption of edible veg-etables by adults in the critical group in this region wasestimated to be 72.3 μSv year−1. This value is about 12times greater than the average of effective dose result-ing from this radionuclide due to combined intake ofall foods and drinking water in normal backgroundareas. The concentrations of natural radionuclides infood and drinking water of the residents are higherthan the world average and are correlated with the highconcentration of these radionuclides in soil and water(Samavat et al., 2006).
The preliminary studies of Ghiassi-Nejad et al.(2002) show no significant differences between res-idents in high background radiation areas (HBRAs)compared to those in normal background radia-tion areas (NBRAs) in the areas of life span, can-cer incidence, or background levels of chromosomalabnormalities. Further, when administered an in vitrochallenge dose of 1.5 Gy of gamma rays, donor lym-phocytes showed significantly reduced sensitivity to

164 H. Misconi and M. Navi
Fig. 24 High background radiations areas of Ramsar (Source: Karam et al., 2002)
radiation as evidenced by their experiencing fewerinduced chromosome aberrations among residents ofHBRAs compared to those in NBRAs. Specifically,HBRA inhabitants had 44% fewer induced chromoso-mal abnormalities compared to lymphocytes of NBRAresidents following this exposure.
Several case–control studies and recently publisheddata suggest that there is no detectable chromosomaldamage from the high levels of natural backgroundradiation found in Ramsar and other HBRAs, contraryto the predictions of linear, no-threshold, or supra-linear models of radiation dose–response (Ghiassin-ejad et al., 2005). In fact, these investigations indicatedinverse relationship between residential radon expo-sure and lung cancer. Mortazavi et al. (2002) showedthat the highest lung cancer mortality rate was inGalesh Mahalleh, where the radon levels were nor-mal. Interestingly, the lowest lung cancer mortalityrate was recorded in Ramak, where the highest con-centrations of radon in the dwellings were found. Thestudy also indicated that crude and adjusted lung can-cer rates in the district with the highest recorded level
of radon concentration is lower than those of the otherdistricts and concluded that lung cancer may show anegative correlation with natural radon concentration.Karam et al. (2002) explained that although there isno solid epidemiological information yet, most localphysicians in Ramsar believe that there is no increasein the incidence rates of cancer or leukemia in theirarea, and the life span of the high-level natural radi-ation areas residents also appears no different thanthat of the residents of a nearby normal backgroundradiation area. Accordingly, overall data showed asignificant radioadaptive response in the residents ofhigh-level natural radiation areas (Mortazavi et al.,2005b).
Several other investigations of natural radiationin Iran exist, but none have dealt with healtheffects. Beitollahi et al. (2007) investigated five hotsprings called Abegarm-e-Mahallat located in MarkaziProvince, central Iran. Water of these springs is ofmixed origin (magmatic geothermal), sulfated witha mean temperature of 46 ± 1◦C. While these hotsprings are used as spas, the precipitated travertine

Medical Geology in the Middle East 165
is used as building material and decorative stone.Abegarm-e-Mahallat is of high natural radiation back-ground due to the presence of 226Ra and its decayproducts in the deposited travertine while radiation lev-els above that of normal background (∼100 nGy h−1)are mainly limited to the Quaternary travertine forma-tions in the vicinity of the hot springs. Alirezazadeh(2005) studied radon concentrations in Tehran’s pub-lic water supply system and concluded that althoughgroundwater consisting 30% of Tehran’s water sup-ply contains relatively high concentrations of radon(range 27.7–74.3, mean 40.4 Bql−1), the concentra-tion of radon in tap water is much less (range 2.7–6.0,mean 3.7 Bq l−1) due to mixing with surface waters.Fathabadi et al. (2006) studied the exposure of min-ers to radon and its decay products in 12 non-uraniumunderground mines and indicated that the radon expo-sure dose is relatively high (10–31 mSv year−1) inthree mines only. Talaeepour et al. (2006) determinedthe average concentration of radon in Tehran’s sub-way system as 14.19 Bq m−1, which is much lowerthan the threshold dose of 148 Bq m−1 and con-cluded that variation in radon concentration is relatedto lithology not to depth. Mowlavi and Binesh (2006)measured radon concentrations in eight springs, deepwells, and river water resource of Mashhad Province,northeastern Iran, and indicated that some sampleshave radon concentration of more than 10 Bq l−1.Hadad et al. (2007) monitored indoor radon in Lahijan,Ardabil, Sar–Ein and Namin cities in northern Iran andindicated that Ardabil and Lahijan have the highestradon concentrations in Iran following Ramsar with163 and 240 Bq m−3 corresponding to annual effec-tive doses of 3.43 and 5.00 mSv y−1, respectively,with maximum and minimum concentrations of 2.386(during winter) and 55 Bq m−3 (during spring). Thestudy also dealt with the relation between radon con-centration and building material and room ventilationand concluded that the four cities can be catego-rized as Average Natural Radiation Zones. Gilmoreand Vasal (2009) conducted a reconnaissance studyon radon concentrations in dwellings in Hamadan,western Iran built on permeable alluvial fan deposits.Indoor radon level varied between 4 and 364 Bq m−3
with a mean value of 107.87 which is 2.5 times theglobal average. The study concluded that the use ofhammered clay floors, the widespread use of subsur-face channels locally called “kariz” to distribute water,the textural properties of surficial sediments, and the
human behavior affect radon concentrations in oldbuildings.
Syria
In Syria, Othman et al. (1996) conducted a nation-wide investigation of radon levels in Syrian housesin the period 1991–1993, which indicated that themean radon concentration is 45 Bq m−1 with the high-est values recorded in Damascus Governorate in thesouth. The study concluded that old houses built withmud with no tiling exhibited higher radon concentra-tions. However, there is no indication of health impactassociated with radon exposure.
Jordan
In Jordan, Matiullah and Khatobeh (1997) studiedindoor radon levels and natural radioactivity in soilsin some cities and indicted that indoor levels of radonvary from 27 to 88 Bq m−3 and elates directly toradon contents in soils. Abumurad et al. (1997) deter-mined radon concentrations at different depths in soilsof Irbid Governorate in the north. The study concludedthat radon levels vary considerably according to typeof soil and underlying bedrock from 4,000 Bq m−3
in limestone to 400,000 Bq m−3 in chalky marl andincrease exponentially with depth. Al-Tamimni andAbumurad (2001) investigated radon levels in soil airalong traceable fault planes and indicated that radonlevels are higher by a factor of 3–10 away from faultsand recommended a detailed study on the implicationsof the fact that several cities in Jordan lie on inten-sive fault zones. Abumurad and Al-Tamimim (2005)investigated natural radioactivity related to radon inSoum region, northwest of Jordan, and indicated thataverage indoor radon concentration is 144 Bq m−3
which is less than the action level recommended byICRP but about three times the national Jordanianaverage. Namrouqa (2009) reported that the radia-tion level of Disi aquifer south of Jordan is 20 timesmore than what is considered safe for drinking, mostlyrelated to radon. This aquifer is being developed tobe the major source of water for Jordan, one ofthe driest 10 countries in the world, in the coming100 years,

166 H. Misconi and M. Navi
Israel
Haquin et al. (2006) conducted a radon survey of Israelin 1998 and in 2003 to determine the radon prone areasin Israel. The survey calculated that the national aver-age radon concentration is 47 Bq m−3, identified sixareas as radon prone, and concluded that there is astrong correlation between geological conditions andindoor radon concentration. Shirav-Schwarzz (2004)commented on the natural terrestrial dose rate map(Fig. 25) and indicated that the average dose rate forthe entire territory of Israel is 0.28 mGy year−1, withsome 20% of the territory having ranges between 0.47and 5.1 mGy year−1. Most of the high natural back-ground radiation terrains covering about 10% of theterritory coincide with the exposure of Mount ScopusGroup, a Senonian–Palaeocene rock unit characterizedby phosphorite layers with appreciable amounts (90–100 ppm) of uranium. Elevated radiation levels of upto 3.0 mGy year−1 in other areas are associated withhigh concentrations of thorium and potassium in soilsand outcrops of young basalts in central and north-ern Israel. Although in most cases the outcrops ofuranium-rich phosphorites are located in desert areas,some heavily populated cities are located in theseregions – Maale Adumim, Arad, and the eastern partof Jerusalem. High radon levels have been recorded inthese urban communities. However, a GIS analysis ofhealth-related data for the period 1984–1999 publishedby the Israeli Cancer Registry did not reveal, so far,any correlation between the geographic distribution ofmalignant diseases and high natural background radi-ation terrains or high radon levels. In Jordan, some ofthe most populated areas are built on rocks equivalentto the Mount Scopus Group (i.e., Amman, capital ofJordan), where traditionally a large portion of the pop-ulation is living on ground floor dwellings. All overthe region, workers in the phosphate mining indus-try should be monitored, as well as people living intemporary ground level dwellings.
Saudi Arabia
In Saudi Arabia, Vincent (2008) explained thatalthough detailed epidemiological studies are still to becarried out there is no doubt that lung cancer cases arewell above expected norms in western Saudi Arabia
and these are probably linked to Rn-222. Data forSaudi Arabia are few and far between. Abu-Jarad andAl-Jarallah (1986) conducted the first study on indoorradon in 400 houses all over Saudi Arabia and indi-cated that radon concentrations varied from 5 to 36 Bqm−3 with a mean of 16 Bq m−3. Al-Jarallah (2001)measured radon exhalation for 50 selected samples ofconstruction material used in Saudi Arabia and foundthat granite is the main source of radiation and asource of indoor radon. Al-Ghorabie (2004) reportedindoor gamma radiation dose in At-Taif city in AlHijaz as of ranging between 90 and 221 nGy h−1
for the time interval September 2002–September 2003and that the measured dose varied with the type ofhouse and season. The highest average value 192 ±7 nGy h−1 was measured inside apartments made ofcement and brick (157–221 nGy h−1) and the low-est average value 92 ± 6 nGy h−1 in mud houses(58–117 nGy h−1). The average indoor gamma radi-ation dose rate received by the population of At-Taifcity is 138 nGy h−1 and its corresponding annual doseis 1,211 μGy y−1. Al-Jarallah and Fazal-ur-Rehman(2006) studied indoor radon concentrations in 136dwellings of Al-Jauf region, northern Saudi Arabia,and indicated that the average, minimum, maximumradon concentrations and standard deviation were 35,7, 168, and 30 Bq m−3, respectively. Recent prelim-inary work by Elliot and Hashem (in Vincent, 2008)indicated that Rn-222 is potentially a serious hazard.They have investigated Jabal Said mineralized gran-ite consisting of an aplite–pegmatite radioactive bodyapproximately 35 km northeast of Mahd adh Dhahab(N 23◦ 50′, E 40◦ 57′). Values of radon in soil gasranged from 55 to 35, 182 pCi L−1 with the extremelyhigh values associated with alluvium derived directlyfrom the aplite–pegmatite body. The level of Ra-222 inthe poorly ventilated village houses along the floors ofthe widyan draining this body clearly needs to be inves-tigated as a matter of some urgency. Hisham (2006)indicated that the Saudi Arabian Geological Surveystarted geological radon mapping of rocks and soil in2000. The geological and structural data together withradiometric data from airborne survey and geochemi-cal analyses of 280 samples were used to describe thepotential existence of radon gas. Soil permeability datawere also included to show the gas mobility in soil.All the previous data were used to set up the first draftof the base potential map of the Arabian shield (crys-talline map). The final map shows areas of interest,
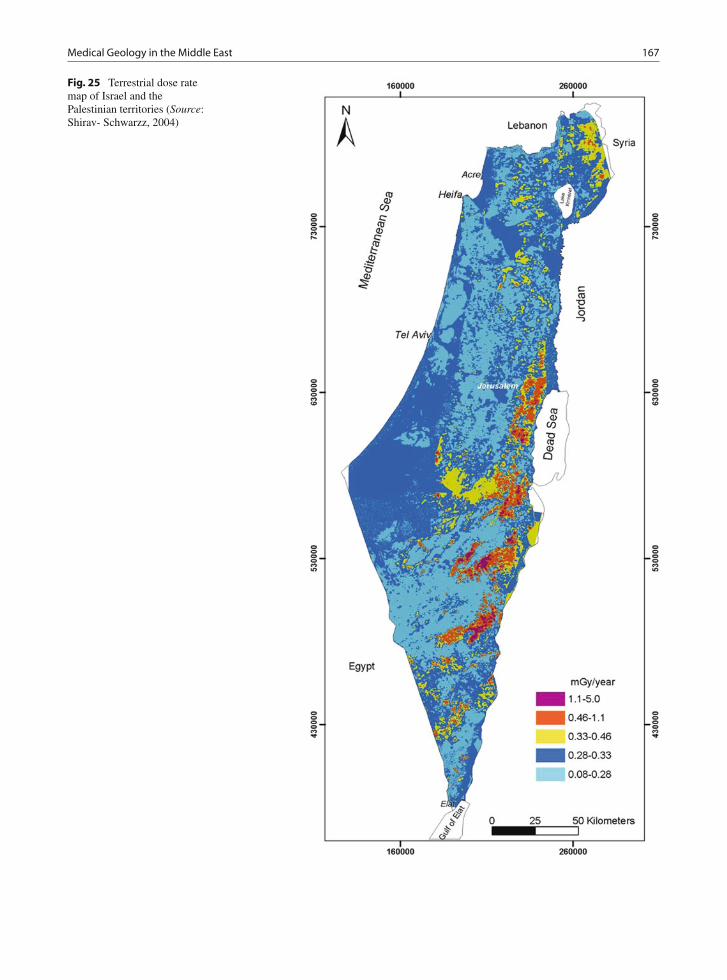
Medical Geology in the Middle East 167
Fig. 25 Terrestrial dose ratemap of Israel and thePalestinian territories (Source:Shirav- Schwarzz, 2004)

168 H. Misconi and M. Navi
including Ha’il in the north part of the KSA, whichconsists mainly of uranium-bearing granitic rocks. Themaximum radon concentration of the collected datawas 105 Bq l−1 and the minimum was 20 Bq l−1 at50 cm depth from the ground surface. The final mapshows good correlation with radon concentration insoil. Further work has to be carried out to complete theremaining zones, prior to the final production of theradon risk map within the culmination of the project.
Yemen
Khayrat et al. (2003) conducted an indoor radon sur-vey in 241 dwellings distributed in Dhamar, Taiz, andHodeidah in Yemen and indicated that radon concen-trations varied from 3 to 270 Bq m−3 with an averageof 42 Bq m−3 and that radon concentration increaseswith altitude since the highest concentrations occur inDhamar, a mountain city, and the lowest in Hodeidad,a seaport.
Geophagia
Geophagia can be defined as the deliberate ingestion ofsoil (Abrahams, 2005). Many people around the worldpractice geophagia. Geophagia may be stimulated bydietary deficiencies (Coreil et al., 2000), a culturalphenomenon passed from generation to generation,
the consumption of soil for physiological, psychiatric,and psychological causes (Abrahams, 2005) the wayto satisfy the appetite (Coreil et al., 2000), or asa way to detoxify foods containing poisoning sub-stances (Johns, 1991 in Coreil et al., 2000). It can alsobe considered as a behavioral symptom of structuralbrain disorders (Nejat and Kazmi, 2005). Intake ofsoil is usually associated with risk of human diseases.Examples are pathogens such as tetanus and worminfections (Norman and Sparks, 1992). The clinicalmanifestations of prolonged geophagia are iron defi-ciency, microcytic anemia, hepatosplenomegaly, shortstature, delayed puberty (Quattromani et al., 2008),and mental disorders (NRC, 2007). Radiographic man-ifestations of geophagia are delayed skeletal mat-uration, radiopaque material in the GI tract (lead)(Quattromani et al., 2008). In addition geophagia hasbeen clearly associated with both iron and zinc defi-ciency; debate persists as to whether pica is the causeor result of the deficiency (Korman., 1990). The fol-lowing table reveals potential benefits and negativeconsequences of geophagia (Table 10).
Geophagia associated with iron and zinc defi-ciency, short stature, delayed sexual maturity, hep-atosplenomegaly, and delayed bone age is reportedfrom Middle East countries (Korman, 1990). Thisincludes Turkey’s villages (Çavdar et al., 1980 inAbrahams, 2005), villages around Shiraz in Iran(WHO, 1973) (Prasad, 1989), among adults in SaudiArabia (Hawass et al., 1987), and Arab children fromGaza (Korman, 1990).
Table 10 Overview of potential benefits and negative consequences of geophagia
Mechanism Potential benefits Potential negative consequences
Adds elements Adds useful micronutrients, e.g., iron, zinc, orcalcium
Adds poisonous elements, e.g., lead, mercuryAdds helpful minerals in excess, e.g.,
potassium, zincBinds substances Binds with plant toxins
Binds with pathogens: bacteria, viruses, fungi,protozoa
Binds with dietary iron (causing nutritionalimmunity)
Binds with dietary iron (causing irondeficiency)
Reduces the effectiveness of pharmaceuticals)
Creates a barrier Protective coating of intestineSlows gastric motility
Damages intestinal mucosaGastric/intestinal obstruction, constipation
Quells gastrointestinalupset
Reduces upper and lower gastrointestinal upset Inhibits useful mechanisms for detoxification(e.g., diarrhea)
Increases pH Soothes heartburn Makes iron less availableMore hospitable environment for enterotoxins
and/or helminthesIntroduces organisms Live micro organisms Geohelminthis
Source: Data from Young, 2008

Medical Geology in the Middle East 169
In Iran, Geophagia appears to be linked to zincdeficiency. Zinc response growth failure and sexualinfantilism have been studied in detail in southernIran and observed in both sexes (WHO, 1973). Prasad(1989) indicated that the habit of geophagia in thevillages around Shiraz was fairly common. Excessamount of phosphate in the clay may have preventedabsorption of both dietary iron and zinc (Sigel, 2004).Analysis of clay of the type eaten by some vil-lagers was obtained from an area in southern Iranrevealed a high calcium level, 25.4% as CaO, or18.6% calcium. Since the clay was supplemented ata 20% level, this resulted in 3.7% additional calciumbeing added to the basal diet. Preliminary experi-ments feeding untreated clay showed that this highlevel of calcium resulted in growth inhibition witha high incidence of urolithiasis (Smith and Halsted,1970).
Halsted and Prasad (1961) studied a syndromeoccurring in males characterized by severe irondeficiency anemia, hypogonadism, dwarfism, hep-atosplenomegaly, and geophagia, observed in villagersin Iran suffering from malnutrition, with 11 suchpatients, studied in detail (Figs. 26 and 27). Despitehepatosplenomegaly the liver function tests were uni-formly normal except for alkaline phosphatase whichwas consistently elevated. The anemia was not associ-ated with blood loss, hookworm infestation, or intesti-nal malabsorption and responded promptly to oral irontherapy. Although the diet contained adequate amountsof iron it is believed that the predominantly wheatdiet with a high phosphate content interfered with itsabsorption because of formation of insoluble iron com-plexes. Correction of the anemia resulted in markeddecrease in the size of liver and spleen. Prolongedfollow-up of patients receiving a well-balanced diet
Fig. 26 Some of the cases studied. Staff physician at left is 183 cm in height (Source: Halsted and Prasad, 1961)

170 H. Misconi and M. Navi
Fig. 27 Characteristic spoonnails (koilonychia), present ina majority of the patients(Source: Halsted and Prasad,1961)
indicates that the endocrine abnormalities of growthand sexual development are reversible. Although thestudy indicated that the relationship of geophagia(which existed in nearly all patients) to this syndromeis not clear, and has been discussed, the fact that 9 ofthe 11 patients continued to eat clay in large amountsfor 10–13 years cannot be ignored. The study consid-ered the possibility of zinc deficiency as an explanationof hypogonadism, dwarfism, and changes in alkalinephosphatase.
Prasad et al. (1963) reported syndrome ofhypochromic anemia due to iron deficiency, hep-atosplenomegaly, dwarfism, and lack of developmentof primary and secondary sexual characteristics inrelation to prolonged history of geophagia in villagessurrounding Shiraz, central Iran. They explained thatthe entire range of clinical features of this syndromewas revered following adequate nutrition and irontherapy for anemia. Prasad (1992) explained that themajor constituent of diet of individuals in these areasis cereal proteins high in phosphates and phytates,which adversely affected the availability of iron andzinc. Once dwarfs who were hospitalized in SaadiHospital received adequate nutrition, they did notrevert to geophagia after discharge from the hospital(Prasad, 1991). Clinical observation in Shiraz figuredout a patient who was 21-year-old male but he lookedlike a 10-year-old boy. In addition to severe growthretardation and anemia he had hypogonadism, hep-atosplenomegaly, rough and dry skin, mental lethargy,and geophagia. The patient ate only bread made from
wheat flour and consumed one pound of clay daily(Prasad, 1989).
Among some subgroups, the practice of pica isgreatest during pregnancy (Sayers et al., 1974 inHooper et al., 1993). In recent years prevalence ofpica was reported among pregnant women in Iran.Mortezavi and Mohammadi (2002, 2003) indicatedthat the prevalence of pica among 560 pregnant womenwho referred to health centers in Zahedan, southeast-ern Iran, was 15.5%, of which 25.3% ate soil. This ratewas 22.3% in pregnant women in Kermanshah, west-ern Iran (Rezavand, Rawshani, 2006). In Tehran, theprevalence of pica among the studied population was17.5% and soil was the most common non-nutritivesubstance (Rostami, 2003). Childbearing women atesoil probably for perceived purposes of stress med-ication (Edwards et al., 1994), enhanced digestion,preventing frequent vomiting in early pregnancy, andas a mineral nutrient supplement, though the causesof pica prevalence in pregnant women in Iran are animportant gap which has to be investigated.
Hawass et al. (1987) recorded the first cases ofgeophagy undertaken by adults in Saudi Arabia. Thestudy dealt with three female cases, two with a historyof eating mud and one with a history of eating peb-bles. Systematic examination revealed hepatomegaly,weak lower limbs with hypotonia and hyperreflexia,gallstones, and intra intestinal stones.
Korman (1990) described three Arab children fromGaza with long-standing geophagia and iron deficiencyin whom celiac disease was ultimately diagnosed. The

Medical Geology in the Middle East 171
dramatic resolution of the pica in these cases after insti-tution of a gluten-free diet is consistent with a mech-anism of pica having been induced by iron deficiencysecondary to the celiac disease.
References
Abrahams PW (2005) Geophagia and the involuntary inges-tion of soil. In O Selinus, BJ Alloway , JA Centeno, RBFinkelman, R Fuge, U Lindh, P Pauline Smedley (eds) (2005)Essentials of Medical Geology. Elsevier Academic Press,812 p.
Abu-Eshy SA, Abolfutouh MA, Al Naggar YM (2001) Endemicgoiter in school children in high and low altitude areas ofAsir Region, Saudi Arabia. Saudi Medical Journal 22(2):146–149.
Abu-Jarad F, Al-Jarallah MI (1986) Radon in Saudi houses.Radiat Protect Dosim 14:243–249.
Abumurad KM, Al-Tamimim H (2005) Natural radioactivity dueto radon in Soum region, Jordan. Radiat Meas 39(1):77–80.
ACC/SCN (Administrative Committee onCoordination/Subcommittee on Nutrition (1992) 2ndReport on the World Nutrition Situation – Volume I: Globaland regional results, October 1992.
Al-Ali JT (2000) Study of Textural, Mineralogical Compositionand Amount of Aeolian Deposits in Al Basra, UnpublishedM.Sc Thesis, Al Basra University, 95 p. (in Arabic).
Al-Dosari AM, Wyne AH, Akpata ES, Khan NB (2004) Cariesprevalence and its relation to water fluoride level for schoolchildren in Central Province of Saudi Arabia. Int Dent J54(6):424–428 (Abstract).
Al-Dosari AM, Akpata ES, Al-Shalan TA, Khan N (2007)Fluoride map of different cities, towns and villages in SaudiArabia. Saudi Dent J 19 (SI) (Abstract).
Al-Ghorabie FHH (2004) Measurements of indoor gamma radi-ation dose in At-Taif city, Saudi Arabia using CaSO4:Dy(TLD-900). Radiat Protect Dosim 113(2):178–184.
Al-Hureibi KA, Abdulmughni YA, Al-Hureibi MA (2004)The epidemiology, pathology and management of goiter inYemen. Ann Saudi Med 24(2):119–123.
Al-Huwaider AJM (2001) The Effect of Industrial Pollution ofthe Geographic Distribution of Allergy and Asthma Diseasesin Al Basra Governorate, Unpublished Ph.D Thesis, Al BasraUniversity, 221 p. (in Arabic).
Alirezazadeh N (2005) Radon concentrations in public watersupplies in Tehran and evaluation of radiation dose. Iran JRadiat Res 3(2):79–83.
Al-Jarallah M. (2001) Radon exhalation from granites used inSaudi Arabia. J Environ Radioactiv 53:91–98 (Abstract).
Al-Jarallah MI, Fazal-ur-Rehman (2006) Indoor radon con-centration measurement in the dwellings of Al-Jauf regionof Saudi Arabia. Radiat Protect Dosim 12(3):293–296(Abstract).
Al-Jumaily HAAH (2001) Sedimentary Geochemistry of Iodineand Its Environmental Significance in Al Mosul and AdjacentAreas – Northern Iraq, Unpublished Ph.D Thesis, Al MosulUniversity, 171p. (in Arabic).
Al-Kabi ASA (1999) The Geographical Pattern of Some ChronicDiseases (non-communicable) in Al Basra Governorate,Unpublished Ph.D Thesis, Al Basra University, 185 p. (inArabic).
Al-Khateeb TL, Al-Marsafi AI, O’Mullane DM (1991) Cariesprevalence and treatment amongst children in an Arabiancommunity, Community Dent Oral Epidemiol 19(5):227–280 (Abstract).
Al-Marsoumi AMH (2009) Dust fallout and bronchial asthmadiseases in Al Basra Governorate. Al Basra J Sci27(C)(1):96–106.
Almas Kh, Shakir ZF, Afzal M (1999) Prevalence and severity ofdental fluorosis in Al-Qaseem province – kingdom of SaudiArabia. Odonto- Stomatologies Tropicate 85:44–47.
Al-Najem F (1975) Dust storms in Iraq, Bulletin of the Collegeof Science, University of Baghdad, 16(2):437–451.
Al-Nuaim AR, Al-Mazrou Y, Kamel M, Al-Attas O, Al-DaghariN, Silimani R (1997) Iodine deficiency in Saudi Arabia. AnnSaudi Med 17(3):293–297.
Al-Sarayrah L Izzat M, Takrouri H, Nader M, Abu-Zaid A(2005) Prevalence of iodine deficiency among goiterousschool children. J Jordan Royal Med Serv 12(2):42–44.
Al-Tamimi MH, Abumurad KM (2001) Radon anomalies alongfaults in north of Jordan. Radiat Meas 34(1):397–400(Abstract).
Aminabadi N, Taghizdeh Gangi A, Balayi E, Sadighi M (2007)Prevalence of fluorosis in 5–12 year-old children in theNorth-Western villages of Makoo. J Dent Res, Dent Clin,Dent Prospects, 1(1):33–41.
Amini M, Abbaspour KC, Berg M, Winkel L, Hug SJ, HoehnE, Yang H, Annette Johnson C (2008a) Statistical model-ing of global geogenic arsenic contamination in groundwater.Environ Sci Technol 42:3669–3375.
Amini M, Muller K, Abbaspour KC, Rosenberg T, Afyuni M,Moller KC, Sarr M Annettejohnson C (2008b) Statisticalmodeling of global geogenic fluoride contamination ingroundwaters. Environ Sci Technol 42:3662–3668.
Appleton JD (2005) Radon in air and water. In O Selinus, BJAlloway, JA Centeno, RB Finkelman, R Fuge, Lindh, U.and Pauline SmedleyP (Eds.) (2005) Essentials of MedicalGeology (812 p). Elsevier Academic Press.
Asghari Moghaddam A, Fijani E (2008) Distribution of fluoridein groundwater of Maku area, northwest of Iran. J EnvironGeol 56:281–287.
Azizi F (2001) IDD in the Middle East, IDD Newsletter.International Council for Control of Iodine DeficiencyDisorders 17(3).
Azizi F, Mehran L (2004) Experiences in the prevention, controland elimination of iodine deficiency disorders: A regionalperspective. East Mediterr Health J 10(6):761–770.
Barzilai D, Harris P (1965) The problem of endemic goiter inWadi Ara and the Jordan valley – Northern Israel. Israeli JMed Sci 1:62–70.
Beitollahi M, Ghiassi-Nejad M, Esmaeli A, Dunker R (2007)Radiological studies in the hot spring region of Mahallat,Central Iran. Radiat Protect Dosim 123:505–508.
Benbassat C, Tsvetov G, Schindel B, Hod M, Blonder Y,Sela BA (2004) Assessment of iodine intake in theIsrael coastal area. IMAJ, Israel Medical Association6(2):75–77.
172 H. Misconi and M. Navi
Brand N, Gedalia I, Jungreis E, Levitus Z, Maayan M (1961)Endemic Goiter in northern Galilee. Israeli Medical J20:206–214.
Canadian Centre for Occupational Health and Safety (CCOHS)(2005) What are the Effects of Dust on the Lungs?.http://www.ccohs.ca/oshanswers/chemicals/lungs_dust.html.Retrieved on 18 April, 2002
Caughey JE, Follis RH (1965) Endemic goiter and iodine mal-nutrition in Iraq. Lancet I:1032–1034.
Collis EL, Greenwood M (1977) The Health of the IndustrialWorker. Ayer Publishing, 450 p.
Combs GF (2005) Geological impacts of nutrition. In O Selinus,BJ Alloway, JA Centeno, RB Finkelman, R Fuge, U Lindh,P Pauline Smedley (eds) Essentials of Medical Geology (812p.). Elsevier Academic Press.
Coreil J, Bryant CA, Henderson JN, Forthofer MS, Quinn GP(2000) Social and Behavioral Foundations of Public Health.Published by SAGE, 360 p.
Demarchi MB, Al-Hindawi A, Abdulnabi M, El-Din Tj H (1969)Prevalence and etiology of goiter in Iraq. Am J Clin Nutr22:1660–1666.
Dhondia J, Diermanse F (2006) Integrated Water ResourcesManagement for the Sistan Closed Inland Delta, Iran. AnnexF – FFS Manual. Delft Hydraulics. http://www.wldelft.nl/cons/area/rbm/wrp1/pdf/annex_f.pdf. Retrieved on 19 April2009.
Dissanayake, CB (1991) The fluoride problem in the groundwa-ter of Sri Lanka—Environmental management and health. IntJ Environ Stud 38:137–156.
Dobaradaran S, Mahvi AH, Dehdashti S, Vakil Abadia DR(2008) Drinking water fluoride and child dental caries inDashteshan, Iran. Fluoride 41(3):220–226.
Dobaradaran S, Mahvi AH, Dehdashti S, Dobaradaran S,Shoara R (2009) Correlation of fluoride with some inorganicconstituents in groundwater of Dashtestan, Iran. Fluoride42(1):50–53.
Edwards CH, Johnson AA, Knight EM, Oyemade UJ, ColeOJ, Westney OE, Jones S, Laryea H, Westney LS (1994)Pica in an urban environment. J Nutr 124:954S–962S(Abstract).
Eftekhari M, Mazloum Z (1999) Fluorosis prevalence studyand its relation to drinking water among the 7–11 year oldstudents in Larestan town and its suburb, Shahid BaheshtiUniversity of Medical Sciences Dental Faculty ResearchMagazine, 17:75–79.
Fathabadi N, Ghiassi-Nejad M, Haddadi B, Moradi M (2006)Miners’ exposure to radon and its decay products in someIranian non-uranium underground mines. Radiat ProtectDosim 118(1):111–116 (Abstract).
Fawell JK, Bailey K, Chilton J, World Health Organization,Dahi E (2006) Fluoride in Drinking-Water. World HealthOrganization, 134 pages.
Fazlollahi MR (2008) Member of Asthma and Allergic DiseasesCommittee of Iran, Interview with Mehr News, 10 July 2008.(In Persian).
Fuge R (2005) Soils and iodine deficiency. In O Selinus, BJAlloway, JA Centeno, RB Finkelman, R Fuge, U Lindh, PPauline Smedley (eds) Essentials of Medical Geology (812p.). Elsevier Academic Press
Ghahreman A (2003) Flora of Iran (Vol.1–23). University ofTehran Press.
Ghaleb T (2007) Yemen: Fluoride contamination is puttingbones at risk. Yemen Observer, June 05, 2007. http://www.yobserver.com/sports-health-and-ifestyle/10012356.html
Gharibadzeh S, Hoseini SS (2008) Arsenic exposure may be arisk factor for Alzheimer’s disease. J Neuropsychiatry ClinNeurosci 20:501.
Ghassemzadeh F, Yousefzadeh H, Arbab-Zavar MH (2008)Arsenic phytoremediation by phragmites Australis: Greentechnology. Int J Environ Stud 65(4):587–594.
Ghiassi-Nejad M, Mortazavi SMJ, Cameron JR, Nirooman-RadA, Karam PA (2002) Very high background radiation areasof Ramsar, Iran: Preliminary biological studies. Health Phys82(1):87–93.
Ghiassi-Nejad M, Beitollahi MM, Asefi M, Reza-Nejad F (2003)Exposure to 226Ra from consumption of vegetables in thehigh level natural radiation area of Ramsar-Iran. J EnvironRadioact 66:215–225.
Ghiassi-Nejad M, Beitollahia MM, Fallahiana N, SaghirzadehbM (2005) New findings in the very high natural radiation areaof Ramsar, Iran. Int Congr Series 1276:13–16.
Gilmore GK, Vasal NJ (2009) A reconnaissance study of radonconcentration in Hamadan city, Iran. Geophys Res Abstr 11(Abstract).
Gunderson EK, Garland CF, Gorham ED (2005) Health surveil-lance for asthma in the US Navy: Experience of 9,185,484person-years. Ann Epidemiol 15(4):310–315.
Hadad K, Doulatdar R, Mehdizadeh S (2007) Indoor radonmonitoring in Northern Iran using passive and active mea-surements. J Environ Radioact 95(1):39–52 (Abstract).
Halsted JA, Prasad AS (1961) Syndrome of iron deficiencyanemia, hepatosplenomegasly, hypogonadism, dwarfismand geophagia. Trans Am Clin Climatol Assoc 72:130–148.
Hamdan MA (2003) The prevalence and severity of dental flu-orosis among 12-year old school children in Jordan. Int JPediatr Dentistry 13(2):85–92.
Haquin G, Reimer T, Shamai Y, Margaliot M, Shirav-SchwartzM, Kenett R (2006) Radon Survey of Israel, Proceedingsof the Conference of Nuclear Societies in Israel, Dead Sea,February 2006.
Hawass NE, Alnozha MM, Kolawole T (1987) Adult geopha-gia – report of three cases with review of the literature. TropGeograph Med 39(2):191–195.
Hisham H (2006) General Radon Potential Map of the Kingdomof Saudi Arabia, Radon Investigations in the Czech RepublicXI and the 8th International Workshop on the GeologicalAspects of Radon Risk Mapping, Prague, Czech Republic(Abstract).
Hooper SR, Hynd GW, Mattison RE (1993) ChildPsychopathology: Diagnostic Criteria and ClinicalAssessment. Lawrence Erlbaum Associates, 504 pages.
Idso SB (1976) Dust storms. Sci Am 235(4):108–11, 113–14.Karam PA, Mortazavi SMJ, Ghiassi-Nejad M, Ikushima T,
Cameron JR, Niroomand-Rad A (2002) ICRP evolution-ary recommendations and the reluctance of the membersof the public to carry out remedial work against radon insome high-level natural radiation areas. Int Congr Series1236:35–37.
Kelsall HL, Sim MR, Forbes AB, McKenzie DP, Glass DC, IkinJK, Ittak P, Abramson MJ (2004) Respiratory health statusof Australian veterans of the 1991 Gulf War and the effects

Medical Geology in the Middle East 173
of exposure to oil fire smoke and dust storms, Thorax 59:897–903.
Khademi H, Taleb M (2000) Dental caries and fluorosis indifferent levels of drinking water fluoride. J Res Med Sci(JRMS) Fall 5(3):213–215.
Khalaf F, Al-Hashash M (1983) Aeolian sedimentation in thenorthwestern part of the Arabian Gulf. J Arid Environ6(4):319–332.
Khayrat AH, Al Jarallah MI, Fazal-ur-Rahman X, Abu-Jarad F(2003) Indoor radon survey in dwellings of some regions inYemen. Radiat Meas 36:449–451 (Abstract).
King MS, Miller R, Johnson J, Ninan M, Lambright E, Shorr AF,Sheller MJ (2008) Bronchiolitis in Soldiers with InhalationalExposures in the Iraq War. Presented at the AmericanThoracic Society, May, 2008, Toronto, Canada.
Korman SH (1990) Pica as a presenting symptom in childhoodceliac disease. Am J Clin Nutr 51:139–141.
Makofske WJ, Edelstein MR (1988) Radon and theEnvironment. William Andrew Inc., 465 pages.
Mann J, Mahmoud W, Ernest M, Sgan-Cohen H, Shoshan N,Gedaia I (1990) Fluorosis and dental caries in 6–8 year-oldchildren in a 5 ppm fluoride area. Community Dent OralEpidemiol 18(2):77–79 (Abstract).
Matiullah AN, Khatobeh AJAH (1997) Indoor radon levels andnatural radioactivity in Jordanian soils. Radiat Protect Dosim71:231–233 (Abstract).
Meyer-Lueckel H, Paris S, Shirkhani B, Hopfenmuller W,Kielbassa AM (2006) Caries and fluorosis in 6- and 9-year-old children residing in three communities in Iran.Community Dent Oral Epidemiol. 34(1):63–70.
Miri A, Ahmadi H, Ghanbari A, Moghaddamnia A (2007) Dusttorms impact on air pollution and public health under hot anddry climate. Int J Energy Environ 2(1):101–105.
Monajemzadeh SM, Moghadan AZ (2008) Prevalence of goiteramong children aged 11–16 years in Ahwaz, Iran. Med PrincPrac 17(4):331–333,
Mortazavi SMJ, Ghiassi-Nejadb M, Rezaieanc M (2005a)Cancer risk due to exposure to high levels of natural radonin the inhabitants of Ramsar, Iran. Int Congr Series 1276:436–437.
Mortazavi SMJ, Shabestani-Monfaredb A, Ghiassi-Nejadc M,Mozdarani H (2005b) Radioadaptive responses induced inlymphocytes of the inhabitants in Ramsar, Iran. Int CongrSeries 1276:201–203.
Mortazavi SMJ, Ghiassi-Nejad M, Ikushima T (2002) Do thefindings on the health effects of prolonged exposure tovery high levels of natural radiation contradict current ultra-conservative radiation protection regulations?. Int CongrSeries 1236(1):9–21.
Mortezavi Z, Mohammadi M (2003) The prevalence of pica inpregnant women referring to health centers in Zahedan. MedJ Reproduct Infert 4(16) (In persian).
Mosaferi M, Yunesian M, Dastgiri S, Mesdaghinia A,Esmailnasab N, (2008) Prevalence of skin lesions and expo-sure to arsenic in drinking water in Iran. Sci Total Environ390(1):69–76.
Mowlavi AA, Binesh A (2006) Radon concentration measure-ment in the some water sources of Mashhad region in Iran.In S Kim, T Suk Suh (2007)World Congress on MedicalPhysics and Biomedical Engineering 2006: “imaging theFuture Medicine”.
Najafi M, Khodaee GH, Bahari M, Sabahi Farsi MM. Kiani F(2008) Neonatal thyroid screening in a mild iodine deficiencyendemic area in Iran. Indian J Med Sci 62(3):113–116.
Namrouqa H. (2009) No hidden agenda behind water study –researcher. The Jordan Times, 2 March 2009.
National Aeronautics and Space Agency (NASA) (2005) Iraqdust storms, AQUA, August 9, 2005. http://www.nasa.gov/vision/earth/lookingatearth/iraq_dust_storm.html. Retrievedon 22 September 2008.
National Aeronautics and Space Agency (NASA) (2008)Dust over the Persian Gulf, http://earthobservatory.nasa.gov/NaturalHazards/view.php?id=19813&oldid=14792.Retrieved on 22 Sep 2008
National Research Council (NRC) (U. S.) (2007) EarthMaterials and Health: Research Priorities for Earth Scienceand Public Health. Published by National AcademiesPress, 176 p.
Navi M (2007) Map of arsenic distribution and mortality ratesof related diseases. National geoscience database of Iran(NGDIR), geological survey of Iran, Ministry of Industriesand Mines. Official Report pressed by NGDIR.
Navi M (2009) The health effect of dust storms in Iran, Nationalgeoscience database of Iran (NGDIR), Geological surveyof Iran, Ministry of Industries and Mines. Official Reportpressed by NGDIR.
Nejat F, Kazmi SS (2005) Pica in neurosurgery: Report of aninfant with pica and posterior fossa dermoid tumor. J PedNeonatal 2(3):CR60–61.
Nish WA, Schwietz LA (1992) Underdiagnosis of asthma inyoung adults presenting for USAF basic training. AnnAllergy 69(3):239–242.
Nordbeg M, Cherian MG (2005) Biological responses ofelements. In O Selinus, BJ Alloway, JA Centeno, RBFinkelman, R Fuge, U Lindh, P Pauline Smedley (eds)Essentials of Medical Geology (812 p.). Elsevier AcademicPress.
Norman AG, Sparks DL (1992) Advances in Agronomy.Academic Press, 332 pages.
Othman I, Hushari M, Raja G, Al Sawaf A (1996)Radon in Syrian houses. J Radiol Protect 16:45–50(Abstract).
Poureslami HR, Khazaeli P, Nooric GR (2008) Fluoride infood and water consumed in Koohbanan (Kuh-e Banan) Iran2008 International Society for Fluoride Research, ResearchReport, Fluoride, 41(3):216–219.
Prasad AS (1989) Zinc deficiency in humans. Citation classic.Current Contents/ Clinical Medicine 17(38):14.I8 September1989.
Prasad AS (1991) A diet of zinc or clay. Citation classic. CurrentContents/Life Science 34(28):11.
Prasad A S (1992) Deficiencies of iron and zinc. CurrentContents/ Clinical Medicine 44:10.
Quattromani F, Handal G, Lampe R (2008) Pediatric Imaging:Rapid-Fire Questions and Answers. Published by Thieme,436 pages.
Ramezani GH, Valaei N, Eikani H (2004) Prevalence of DMFTand fluorosis in the students of Dayer City (Iran). J IndianSoc Pedo Prev Dent June (2004) 22(2):49–53.
Rezavand N, Rawshani D (2006) Pica and its related iron defi-ciency anaemia in pregnant women in Kermanshah. Med JBehbood 10(3):226–234 (In persian).

174 H. Misconi and M. Navi
Rosenzweig KA, Abewitz I (1963) Prevalence of endemic fluo-rosis in Israel at medium fluoride concentration. Pblic HealthRepos 78(1):77–80.
Rostami A (2003) The prevalence of pica in pregnant womenreferring to Rasul-Akram and Akbarabadi hospitals inTehran. Iran University of Medical Science, graduation thesis(In persian).
Sack J, Feldman I, Kaiserma I (1998) Congenital hypothroidismscreening in the West Bank: At test case for screening indeveloping regions. Hormone Research.
Samavat H, Seaward MRD, Aghamiri SMR, Reza-Nejad F(2006) Radionuclide concentrations in the diet of residentsin a high level natural radiation area in Iran. Radiat EnvironBiophys 45:301–306.
Sanders JW, Putnam SD, Frankart C, Frenck RW, MontevilleMR, Riddle MS, Rockabrand DM, Sharp TW, TribbleDR (2005) Impact of illness and non-combat injury dur-ing Operations Iraqi Freedom and Enduring Freedom(Afghanistan). Am J Trop Med Hygiene 73(4):713–719.
Shirav-Schwarzz M (2004) Some Remarks on High NaturalBackground Radiation Terrains, Geology and Public Healthin Israel and Adjacent Countries, Presentation Dedicated toDr. Uzi Vulcan (1938–1999).
Sigel H (2004) Metal Ions and Their Complexes in Medication:Metal Ions and Their Complexes in Medication (Vol. 41, 519p). Published by CRC Press.
Singer A, Ganor E, Dultz S, Fischer W (2003) Dust depositionover the dead sea. J Arid Environ 53(1):41–59 (Abstract).
Smedley P, Kinniburgh DG (2005) Arsenic in groundwater andthe environment. In O Selinus, BJ Alloway, JA Centeno,RB Finkelman, R Fuge, U Lindh, P Pauline Smedley (eds)Essentials of Medical Geology (812 p.). Elsevier AcademicPress.
Smith JC, Halsted JA (1970) Clay Ingestion (Geophagia) as asource of zinc for rRats. J Nutr 100:973–980.
Steinhausler F (2003) Radiological impact on man and the envi-ronment from the oil and gas industry : Risk assessment forthe critical group. In MK Zaidi, I Mustafaev(eds) RadiationSafety Problems in the Caspian Region: Proceedings of theNATO Advanced Research Workshop on Radiation SafetyProblems in the Caspian Region, Baku, Azerbaijan, 11–14September 2003, Springer, 249 p.
Sullivan JB, Krieger GR (2001) Clinical Environmental Healthand Toxic Exposures. Lippincott Williams and Wilkins, 1323pages.
Szema AM, Peters MC, Weissinger KM, Gagliano CA, ChenJJ (2008a) Increased Rates of Asthma Among U.S. MilitaryPersonnel after Deployment to the Persian Gulf. Presented atthe American Thoracic Society, May, 2008, Toronto, Canada.
Szema AM, Peters MC, Weissinger KM, Gagliano CA, Chen JJ(2008b) Increased allergic rhinitis rates among U.S. MilitaryPersonnel after deployment to the Persian Gulf. J AllergyClin Immunol 121(2):S230.
Taghavi F, Asadi A (2008) The Persian Gulf 12th April 2007dust storm: Observation and model analysis. EUMETSATMeteorological Satellite Conference, Darmstadt, Germany8–12 Sep. 2008
Talaeepour M, Moattar F, Atabi F, Borhan Azad S, TalaeepourAR (2006) Investigation on radon concentration in theTehran subway stations in regard with environmental effects.J Appl Sci 6(7):1617–1620.
(UN) United Nations, General Assembly. United NationsScientific Committee on the Effects of Atomic Radiation:Report of The Fifty-Fourth Session (29 May-2 June2006) Published by United Nations Publications, 2006,18 pages.
UNICEF (United Nations Children Fund) (2000) UNICEF’sPosition on Water Fluoridation available, http://www.nofluoride.com/Unicef_fluor.htm
Vincent, P. (2008) Saudi Arabia: An Environmental Overview,Routledge, 332 p.
Weese CB, Abraham JH (2009) Potential health implicationsassociated with particulate matter exposure in deployed set-tings in Southwest Asia. Inhal Toxicol 21(4):291–296.
WHO Expert Committee (1973) Trace Elements in HumanNutrition, World Health Organization. Technical ReportSeries No. 532.
Young SL (2008) A vile habit? In J MacClancy, J Henry,H Macbeth (eds) Consuming the Inedible: NeglectedDimensions of Food Choice. Berghahn Books, 208 pages.
Zarasvandi A, Mokhtari B (2008) A Scientific Overview ofthe 50th Dusty Days in Khuzestan, Unpublished Data.http://www.tabnak.ir/pages/?cid=13646. Retrieved on 10July 2008 (In Persian).
Zein AZ, Al-Haithamy S, Obadi Q, Noureddin S (2000) The epi-demiology of iodine deficiency disorders (IDD) in Yemen.Public Health Nutr 3:245–252.
Zohouri FV, Rugg-Gunn AJ (1999) Fluoride concentrationin foods from Iran. Int J Food Sci Nutr 50(4):265–274(Abstract).

Some Aspects of the Medical Geology of the IndianSubcontinent and Neighbouring Regions
C.B. Dissanayake, C.R.M. Rao, and Rohana Chandrajith
Abstract The tropical terrains of the Indian sub-continent and the neighbouring regions provide someof the best examples in medical geology where theimpact of the geosphere on human health is markedlyseen. The life styles of millions of people in theseregions are such that there is a very close and inti-mate association between the rocks, minerals, soils,water and the human population. The case studiesdescribed in this chapter, as illustrated from India,Pakistan, Sri Lanka, Bangladesh and Nepal, notablyon fluorides, iodine deficiency disorders (IDD), arsenicpollution, selenium-based health issues among oth-ers, demonstrate this close geochemical interaction.The problem of contamination of groundwater byarsenic in Bangladesh and West Bengal, termed asone of the world’s largest environmental disasters,as discussed in this chapter typifies the dangers thatcould threaten countries and extremely large popula-tions, when geochemistry of the environment and theassociated medical geology are not properly under-stood and neglected. The negative impact of suchgross neglect will be seen for many years to comeand in Bangladesh and West Bengal for many futuregenerations.
Keywords India · Sri Lanka · Pakistan · Bangladesh ·Nepal · Iodine · Fluorine · Arsenic · Selenium ·Podoconiosis · Radiation
C.B. Dissanayake (�)Institute of Fundamental Studies (IFS), Kandy, Sri Lankae-mail: [email protected]
General Introduction
The Indian subcontinent and the neighbouring regionsprovide some of the best examples of the impactof geology on the health and well-being of humanbeings and animals. Unlike the developed countries ofthe temperate climates, the millions of people of theregions in and around the Indian subcontinent live inintimate association with the general geological envi-ronment. The impact of the rocks, minerals, soils,water and the vegetation on the health of these peo-ple is far more profound than that observed in mostother parts of the world. This is clearly due to the factthat the vast majority of the population obtain theirdrinking water supplies directly from the ground andsurface waters and locally grown crops. The geochem-ical pathways of the essential trace nutrients that enterthe food chain are clear and being intimately linked tothe immediate geological environment, the impact ofthe mineral excesses, deficiencies and imbalances onhumans are very well marked. The clear demarcationof “geochemical provinces” is also closely linked tothe incidence of several regionally distributed diseases.
The economic status of the general population,many of them living in poverty, contributes to thedirect impact of the environmental chemistry on health.Proper sanitation, pipe-borne clean water, etc. are seri-ously lacking and this clearly enhances the spread ofmany diseases. Contrary to the popular belief that envi-ronmental poisoning due to toxic metals and trace ele-ments is an endemic problem of highly industrializedcountries, it is the population of developing countrieslike India, Pakistan, Sri Lanka and Bangladesh amongmany others that are more vulnerable to such threats.This is mainly due to
175O. Selinus et al. (eds.), Medical Geology, International Year of Planet Earth,DOI 10.1007/978-90-481-3430-4_7, © Springer Science+Business Media B.V. 2010

176 C.B. Dissanayake et al.
• a very high population and poor hygienic conditionsin the crowded cities
• a high percentage in population of vulnerablegroups such as children and pregnant women
• general poverty, leading to poor nutrition and healthstatus
• consumption of food grown in contaminated areas,since food imported from non-contaminated areasis costly
• poor implementation of pollution control laws• low level of awareness about health hazards due to
environmental toxins• limited availability of health care
It should also be emphasized here that even thoughthe World Health Organization (WHO) has givenguidelines for limits of essential and toxic elementsin water, food, etc. many of these guidelines do notstrictly apply to the people living in areas mentionedabove in view of a variety of factors including poorresistance against disease and lack of other essen-tial elements necessary to counteract the ill effects ofsome of the disease-causing trace elements. A goodcase in point is that an average American wouldbe able to withstand a higher degree of fluoride indrinking water without any ill effects while a povertystricken adult from the Indian subcontinent may suf-fer visible ill effects even at a considerably lowerfluoride dosage, presumably due to lack of other essen-tial elements, notably calcium. The danger limits fordisease-causing elements for such countries shouldtherefore be much lower. Thus, in view of the vulnera-bility of the population, geomedical studies in generalpertaining to adverse health effects of low-dose, high-duration exposure to toxic elements in particular areessential.
The tropical environment, in which the lands underdiscussion lie, is characterized by seasonal heavy rain-fall (exceeds over 5,000 mm/yr in some cases) withlong periods of drought and high ambient tempera-tures. The intensity of chemical weathering is thereforeextreme and some soils are weathered to such an extentthat potassium, an essential plant nutrient, usuallyfound in appreciable concentrations, is present only intrace amounts (Fyfe et al., 1983). Coincidentally, theworld’s most underdeveloped countries also lie in suchtropical environments, where poor agricultural produc-tivity caused by impoverishment of soil in essentialnutrients has, over the years, had a marked impact on
the economy and now on the health of the population ofthese countries. The very thick laterite formations andextensive leaching out of essential nutrients have, overseveral decades, caused severe mineral imbalances.The rock-soil-water-plant links are thus extraordinarilymarked in the lands of the Indian subcontinent, makingtropical medical geology truly a fascinating subject.
Arsenic in Groundwater
The presence of arsenic in groundwater notably inSouth and Southeast Asia has become a major healthissue. The prevalence of skin disorders, cancer and car-diovascular diseases among others, is caused mainlyby the consumption of arsenic-laden drinking waterand also food grown in arsenic-rich soils. Hyper-pigmentation, melanosis, plantar and palmer keratoses,carcinoma of the hand (Fig. 1), broken nails, crackedsoles, gastroenteritis and oedema of legs are some ofthe common clinical symptoms related with arsenicpoisoning.
Fig. 1 Bowen’s carcinomaof the hand due to arsenicpoisoning (photo courtesyof Arsenic Foundation Inc.)
Smedley (2005) in a publication of the World Bank(2005) noted that even though arsenic in natural watersglobally is usually low (<10 μg/L), under certain spe-cific geochemical and hydrogeological conditions, thearsenic concentration can reach much higher levels,bearing in mind that most occurrences of high-arsenicgroundwater are of natural origin.
It has been noted that sediments of Quaternary ageconstituents, the large alluvial deltaic plains and inlandbasins as seen in South Asia are most vulnerable toarsenic enrichment. The Bengal Basin of Bangladeshand West Bengal are typical examples. These regions

Some Aspects of the Medical Geology: India and Neighbouring Regions 177
are also extremely densely populated and any contam-ination of ground and drinking water resources willundoubtedly have an enormous impact on the health ofthese large populations. As shown by Smedley (2005),the increasing incidence of arsenic-related health prob-lems in the South Asian regions coincided with thechange to using groundwater from tube wells about30 years ago. Slow groundwater movement and stag-nant conditions within the sedimentary basins enhancethe arsenic enrichment, and variability of the actualarsenic content within a small distance is very large.This creates a necessity for the testing of virtu-ally each and every well in a region. Prediction ofarsenic-rich regions is therefore difficult though someolder aquifers in Bangladesh, West Bengal and Nepalappear to have much lower arsenic concentrations.Table 1 shows the summary of the distribution, natureand scale of documented arsenic problems (>50 μg/L)in aquifers in South and East Asia.
Arsenic-Contaminated Aquifers in India
The arsenic problem in Bangladesh and the WestBengal state of India is a major groundwater pollution
Table 1 Summary of the distribution, nature and scale of doc-umented arsenic problems (>50 μg/L) in aquifers in South andEast Asia (World Bank, 2005)
LocationArial extent(km2)
Populationat riska
Arsenic range(μg/L)
Alluvial/deltaic/lacustrine plains
Bangladesh 150,000 35,000,000 <1.0–2,300China (Inner
Mongolia,Xinjiang, Shanxi)
68,000 5,600,000 40–4,400
India (West Bengal) 23,000 5,000,000 <10–3,200Nepal 30,000 550,000 <10–200Taiwan 6,000 (?) 10,000b 10–1,800Vietnam 1,000 10,000,000c 1–3,100Myanmar 3,000(?) 3,400,000 naCambodia <1,000(?) 320,000d naPakistan na na na
Source: World Bank Regional Operational Responses to ArsenicWorkshop in Nepal, 26–27 April 2004na – Not availableaEstimated to be drinking water with arsenic >50 μg/L (fromSmedley, 2003 and data sources therein). bBefore mitiga-tion. cUnited Nations Children’s Fund (UNICEF) estimate.dMaximum
problem and has been classified as one of the world’sgreatest environmental disasters. The arsenic-inducedpublic health hazard was first noticed around 1978in West Bengal, when frequent cases of patientswith symptoms of dermatological disorders attractedthe attention of medical specialists in Murshidabaddistrict. Later, a link between arsenical dermato-sis and arsenic-contaminated groundwater, the mainsource of drinking water, in the region was estab-lished (Chakraborty and Saha, 1987). Research car-ried out by various state, national and internationalgeological organizations in India, over the last twodecades in West Bengal, have generated a wealth ofgeoscientific data which can be effectively utilizedby medical experts for conducting further epidemi-ological studies on arsenic-related health problems(Fig. 2).
Arsenic is naturally occurring and is not derivedfrom any anthropogenic source. Its primary sourcehas been ascribed mainly to the rock formations ofthe Himalayan Mountain system and partly to therock formations of Shillong Plateau (Acharyya et al.,1999a). The recently reported occurrence of arsenicin the Quaternary formations and groundwater inparts of Nepal and in groundwaters of a few spo-radic locations in the Himalayan foothill zone of Indiastrongly supports this contention. However, accord-ing to some workers, at least a part of the arsenicwas derived from rock formations of Bihar Plateauregion (Chakrabarti, 2004). The recent detection ofhigh arsenic values in the groundwaters of Bhojpurdistrict (Bihar), located on Ganga flood plain depositsof Quaternary age, indicates that from the primarysources arsenic was transported either in solution orin suspension along with detrital sediment particles,by the rivers originating in the Himalayan mountains,Shillong Plateau and Bihar Plateau and flowing into theGanga–Brahmaputra deltaic region.
The area in which transported arsenic was finallydeposited is referred to as the arsenic sink. Amongthe geological formations occurring within the sink,arsenic is localized within a particular formation.This formation comprises semi-consolidated and un-oxidized sequences of silt, clay and mostly fine tomedium grained sands. These sediments were laiddown as flood plains, meander belts and deltaicdeposits related to the present day river systems.Arsenic mainly occurs in an adsorbed state in hydrousferric oxides (HFO) associated with these sediments,
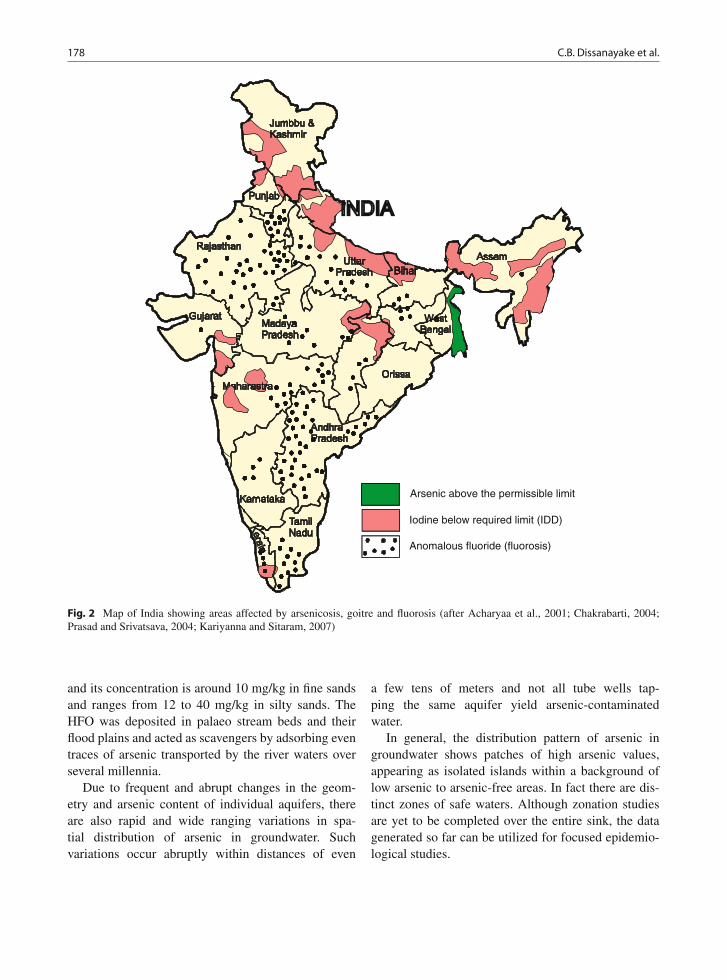
178 C.B. Dissanayake et al.
Arsenic above the permissible limit
Iodine below required limit (IDD)
Anomalous fluoride (fluorosis)
Fig. 2 Map of India showing areas affected by arsenicosis, goitre and fluorosis (after Acharyaa et al., 2001; Chakrabarti, 2004;Prasad and Srivatsava, 2004; Kariyanna and Sitaram, 2007)
and its concentration is around 10 mg/kg in fine sandsand ranges from 12 to 40 mg/kg in silty sands. TheHFO was deposited in palaeo stream beds and theirflood plains and acted as scavengers by adsorbing eventraces of arsenic transported by the river waters overseveral millennia.
Due to frequent and abrupt changes in the geom-etry and arsenic content of individual aquifers, thereare also rapid and wide ranging variations in spa-tial distribution of arsenic in groundwater. Suchvariations occur abruptly within distances of even
a few tens of meters and not all tube wells tap-ping the same aquifer yield arsenic-contaminatedwater.
In general, the distribution pattern of arsenic ingroundwater shows patches of high arsenic values,appearing as isolated islands within a background oflow arsenic to arsenic-free areas. In fact there are dis-tinct zones of safe waters. Although zonation studiesare yet to be completed over the entire sink, the datagenerated so far can be utilized for focused epidemio-logical studies.

Some Aspects of the Medical Geology: India and Neighbouring Regions 179
Geochemical processes which release arsenic fromthe sediments of the sink to groundwaters, though notyet fully understood, have been ascribed to bacteria-mediated reductive dissolution of HFO which containsarsenic in an adsorbed state (Korte, 1991; Acharyya,1999a, 1999b; Nickson et al., 2000). The onset ofreducing conditions, due to the establishment of shal-low water table aquifers and degradation of organicmatter contained in the sediments, caused the reductionof Fe from HFO as well as the reduction of adsorbedarsenic associated with it, from stable higher valencystates to unstable, water-soluble lower valency states.Consequently, the HFO is dissolved and the adsorbedarsenic is released locally into the groundwaters in a,comparatively, much more toxic trivalent state. Theactivities of anaerobic Fe-reducing bacteria present inthe aquifer sediments also help in breaking down ofHFO and keeping the released arsenic in solution. Thearsenic desorption process can occur in a matter ofweeks when new sources of labile organic matter enterthe system through natural or anthropogenic means.The released arsenic enters the human body mainlythrough drinking water drawn through tube wellstapping arsenic-contaminated groundwater and partlythrough food crops grown on arsenic-contaminatedsoils and irrigated with arsenic-contaminated water.Although not well established as yet, there is a growingconcern that minor amounts of arsenic is entering thehuman body due to inhalation of arsenic-contaminateddust derived from the soils of the sink area.
Geoscientific information plays a vital role in theselection of appropriate sites for sinking deep tubewells and construction of dug wells, both of whichyield arsenic-safe waters. Deep tube wells, being pro-vided by the Government of West Bengal, tap thelowest group of aquifers of the Panskura Formationor those belonging to the underlying and geologicallyolder Sijua Formation. Dug wells, sited on a palaeopoint bar complex, delineated through visual interpre-tation of satellite imagery, in two areas in 24-Paraganasdistrict under the “Project Well” program of the USAhave proved to be highly effective as the arsenic con-centration of their waters, monitored over the past3 years, never exceeded the WHO permissible limit of10 μg/L. The depth of the dug wells are being keptwithin the depth of oxidation of the enclosing sedimenton the basis of geological evidence being monitoredduring their construction.
Arsenic in Chhattisgarh
In 1996, the Public Health Department of Rajnandgaondistrict was informed by some members of thepublic about the appearance of symptoms of anunknown type of skin disease among the popula-tion of Kaurikasa village. Subsequent investigationsby the National Environmental Engineering ResearchInstitute (NEERI) in the villages of Ambagarh ChowkiBlock revealed high concentrations of arsenic ingroundwater, which is the principal source of drink-ing water. The Geological Survey of India initiatedstudies of the problem in 1999 in Chowki Block.In addition, the Council of Scientific and IndustrialResearch (CSIR) sponsored a geological researchproject on arsenic in Chhattisgarh which providedsome important geomedical information (Acharyyaet al., 2000). Arsenic occurs naturally and is defi-nitely geogenic in origin with acid volcanic rocks andgranites being identified as primary sources. Arsenichas been released from the source rock as a result ofnatural alteration and weathering processes and wasadsorbed on the Fe-Mn-oxyhydroxide phases of thealtered rocks. The arsenic content of the weatheredbed rocks range from 10 to 250 mg/kg and that of theoverlying soil profile range from 500 to 800 mg/kg.The release of arsenic from the Fe-Mn-oxyhydroxidesinto the surrounding discontinuity planes (secondaryporosity) of the rocks comprising the primary sourcehas been ascribed to a reduction process aided byFe-reducing bacteria.
Unlike in West Bengal, the sink area in thiscase may be defined as the geographical region/zoneunderlain by groundwater with arsenic concentra-tions exceeding permissible limits for potable water.The entire sink area is yet to be demarcated and,according to presently available data, it stretches fromAmbagarh Chowki to Korse Kohri and includes thevillages of Kaurikasa, Joratari, Sansayatola, Dewarsur,Mulhetitola, Muragaon, Kurse, Kohri, Gurwandi andDordekadar. The arsenic values of the groundwaters ofthe sink area range from 0.01 to 0.68 mg/L and a signif-icant number of people inhabiting the aforementionedvillages show some symptoms of arsenic-related dis-eases. The dispersal of arsenic from the primary sourcerocks is very limited and rather patchy in their distri-bution and unlike West Bengal does not have a wideregional spread. The sink zone is exclusively confined
180 C.B. Dissanayake et al.
to the Dongargarh rift zone. This geological controlmakes the demarcation of the sink and identification oftarget areas for epidemiological studies, comparativelyeasy (Acharyya et al., 2000).
The toxicity of arsenic depends upon its chemicalform, route of entry and dose/duration of exposure.The nutrition level of the person exposed to arsenictoxicity plays a key role on the magnitude of effect.Although high values of arsenic are reported in someregions of India, no cases of arsenic-related diseaseswere reported. In the Gurwandi area, for instance,where arsenopyrite is present in the rhyolitic countryrock in which arsenic values are as high as 250–680 μg/L in groundwater, no arsenic-related symptomswere recorded.
Remedial Measures
Short-term measures:
(i) Use of conventional surface water sources withtreatment for arsenic.
(ii) Construction of rain water-harvesting ponds.(iii) Replacement of arsenic-affected water sources.(iv) Attachment of arsenic removal filters in the exist-
ing hand pumps.
Long-term measures:
(i) Deep tube well tapping of arsenic-free water.(ii) Deep tube wells with community arsenic removal
plants.(iii) Surface water and conventional water treatment
plants.
Arsenic in Bangladesh
The problem of arsenic poisoning in Bangladesh wherean estimated population of 35 million is at risk is con-sidered to be the largest mass poisoning in history.The British Geological Survey in a very detailed report(BGS, 2001) has discussed all aspects of the problemextensively.
Geologically, the Bengal Basin consists of a 15 kmthick sequence of Cretaceous to Recent sediments.This covers an area of about 10,000 km2 of lowlandflood plain and delta making it one of the largest in theworld. The sediment load carried by the rivers Ganga,
Brahmaputra and Meghna (GMB) river systems sur-passes that of any other river system in the world. Theextensive aquifer system underlying these sediments istherefore a result of the deposition of Pleistocene toRecent fluvial and estuarine sediments.
The work of the British Geological Survey (BGS,2001) has estimated that most elements includingarsenic are found in the fine-grained sediments,notably clayey sediments. This therefore supports thehypothesis that iron oxides are a primary source ofarsenic in the groundwater of Bangladesh. It wasobserved that the process of adsorption and co-precipitation of arsenic on iron oxides yielded the netarsenic-rich groundwater. Hence areas rich in theseiron oxides had markedly high arsenic contents in thewater.
In view of the fact that a large number of tubewells in Bangladesh are contaminated, an estimated95% of the population of Bangladesh is highly sus-ceptible to arsenic poisoning indicating the magnitudeof the problem. A total of 4.7 million tube wells inBangladesh have been tested for arsenic and 1.4 mil-lion of those were found to contain arsenic abovethe Bangladesh Government drinking water limit of50 μg/L. About 20 million people in Bangladesh usethese tube wells containing arsenic (UNICEF, 2008).This was also shown by the British Geological Survey(BGS, 2001) from among 2,022 samples of wateranalysed as given below:
(i) 51% were above 10 μg/L (WHO guideline value)(ii) 35% were above 50 μg/L
(iii) 25% were above 100 μg/L(iv) 8.4% were above 300 μg/L(v) 0.1% were above 1,000 μg/L
Only 20% of the wells were considered to be“arsenic free”.
Smedley and Kinniburgh (2002) had shown thatarsenic tends to be released slowly from recentlyburied sediments in rivers, lakes and ocean. Arsenicis adsorbed on the surface of the iron oxide/hydroxidephase making them arsenic rich. Microbial reductionof FeOOH brings about a change from arsenate toarsenite. Even though the actual mean concentrationof arsenic in the sediments may not be extremely high,the vast amount of sediments involved in this processmakes even low levels of arsenic quite important.

Some Aspects of the Medical Geology: India and Neighbouring Regions 181
Apart from the drinking water, the rice grains,which form the staple diet of the Bangladesh pop-ulation, also show markedly high arsenic contentsparticularly in areas where the paddy soil is contam-inated. Some rice samples had arsenic contents as highas 1.7 μg/g, and among the crops, Arum (Colocasiaantiquorum) and boro rice had high arsenic contents(Huq et al., 2006).
As in the case of West Bengal in India, arsenicmanifests itself in a variety of diseases in Bangladeshand from among these, patients with melanosis (93%),leucomelanosis (39.1%), keratosis (68.3%), hyperker-atosis (37.6%), dorsum, non-petting oedema, gangreneand skin cancers have been identified (Karim, 2000).
Arsenic in Tube Wells of Bangladesh
The fact that about 130 million people comprising of97% of the population relay on 8.6 million tube wellsin Bangladesh indicates the importance of groundwa-ter as the major source of potable water. In a majorstudy of the spatial variability of arsenic in 6,000 tubewells in a 25 km2 area in Bangladesh, van Geen et al.(2003), noted that arsenic ranges from <5 to 900 μg/Lin groundwater obtained from these tube wells. Theyalso observed that the arsenic increases from 25% withdepth between 8 and 10 m to 75% between 15 and30 m, with a decline to less than 10% at 90 m. Thisindicates a geologically related arsenic concentrationover a period of time. van Geen et al. (2003) wereof the view that the oxic low-As aquifers accessibleby drilling were of Pleistocene age while the shal-lower reducing aquifers which had higher and variableAs concentrations had been deposited since the lastGlacial Maximum, approximately 20,000 years ago.
Arsenic in Groundwater of Nepal
Arsenic in groundwater is now seen as a major healthissue in Nepal with many shallow tube wells contain-ing arsenic at concentrations higher that the safe limitof WHO. As shown by the population census data of2001, the total population of Nepal was 23.4 million ofwhich about 45% live in 20 Terai districts where 8%of tube wells were found to be contaminated (Panthiet al., 2006).
As in the case of Bangladesh and West Bengal,arsenic is considered to be clearly associated with theoxidation–reduction processes of iron oxide and pyrite.Bhattacharya et al. (2003) had shown that in a stronglyreducing environment (Eh: −110 to −200 mV) ofgroundwater in Nepal, the reductive desorption theoryis perhaps more likely. The arsenic-rich iron oxides areknown to enter the aqueous phase easily.
When arsenic contamination in groundwater of theBengal Delta Plain in the neighbouring Indian stateof West Bengal and Bangladesh was detected, theDepartment of Water Supply and Sewage (DWSS)with assistance from WHO, Nepal, conducted severalstudies (Panthi et al., 2006). Table 2 summarizes thearsenic concentrations recorded in Nepal.
A very approximate estimate of the tube wells ofNepal gives a figure of 400,000 of which 25,058 hadbeen tested for arsenic in 2003. Of this 1916 tubewells (about 8%) had arsenic concentrations more than50 μg/L while 23% had more than 10 μg/L. As shownin Table 2, Nawalaparasi is the most affected district
Table 2 Arsenic concentrations in Nepal (after NASC, 2003)
Samples with arsenic
DistrictTotal no.of tests <10 μg/L
10–50μg/L
>50μg/L
Max.conc.detected
Jhapa 571 493 77 1 79Morang 341 264 72 5 70Sunsari 675 566 105 4 75Saptari 772 669 94 9 98Siraha 289 191 70 28 90Dhanusha 331 267 55 9 140Mahottari 202 177 21 4 80Sarlahi 532 402 114 16 98Rautahat 2,485 740 1,520 225 324Bara 2,124 1,783 291 50 254Parsa 2,207 1,895 253 59 456Chitwan 219 219 0 0 8Nawalparasi 3,833 1,385 1,340 1,108 571Rupandehi 2,725 2,191 410 124 2,620Kapilvastu 4,099 3,471 466 162 589Dang 667 639 25 3 81Banke 1,835 1,316 486 33 270Bardiya 652 472 160 20 181Kailali 299 149 106 44 213Kanchanpur 200 167 21 12 221Total
sampletested
25,058 17,456 5,686 1,966 2,620
% of totaltested
100 69 23 8

182 C.B. Dissanayake et al.
in Nepal with Rautahat, Kailali and Siraha also beingseriously affected in which 69% wells had greater than50 μg/L of arsenic.
Maharjan et al. (2005) conducted a community-based dose–response study on arsenic contaminationin three communities in Terai in lowland Nepal. Thearsenic concentration of all the tube wells in use (n =146) and the prevalence of arsenic-induced skin man-ifestations among 1,343 (approx 80%) of the subjects,indicated the existence of a higher contamination inTerai. The authors observed a rate of 6.4% of arsenosisin the population older than 15 years, nearly the sameas that found in Bangladesh. Further, they observedthat males had a prevalence twice as much as females.
The Arsenic Problem in Pakistan
As in the case of West Bengal, Nepal and Bangladesh,Pakistan also faces a health hazard due to arsenic con-centration of groundwater. In major cities, such asLahore, thousands of people are susceptible to dis-eases caused by excessive quantities of arsenic in theirdrinking water supplies.
In the Muzaffargah district of southwestern Punjab,central Pakistan, for example, concentration of arsenicexceeded the WHO permissible guideline value of10 μg/L, in 58% of 49 samples of groundwater(Nickson et al., 2000). A maximum arsenic levelof 906 μg/L had also been detected. The authorsattributed this high level of arsenic in the semi-aridregion to canal irrigation that caused water logging andevaporative concentration of salts. It was observed thatin rural areas, the levels remain below 25 μg/L, in viewof fact that arsenic is in the shallow oxic groundwaterwhere sediments sorb the arsenic.
Arsenic in the Indus Plain of Pakistan
The Indus Plain of Pakistan, mainly Punjab and SindhProvince, comprising of Quaternary sediments of allu-vial and deltaic origin has shown significant arsenicconcentrations in the groundwater. As in the caseof Bangladesh and West Bengal, these sediments arealso derived from the Himalayan sources. Climatically,however, this region is more arid with greater uncon-fined and greater aerobic aquifer conditions (Mahmood
Table 3 Range of arsenic concentrations found in groundwatersamples from northern Punjab (Iqbal, 2001)
DistrictNo. ofsamples
<10–11(%)
11–20(%)
21–50(%) >50 (%)
Gujrat 38 33 (87) 2 (5) 1 (3) 2 (5)Helum 37 32 (86) 1 (3) 3 (8) 1 (3)Chakwal 72 63 (88) 9 (12) 0 (0) 0 (0)Sargodha 59 49 (83) 5 (8) 2 (3) 3 (5)Attock 74 68 (92) 6 (8) 0 (0) 0 (0)Rawalpindi 84 81 (96) 3 (4) 0 (D) 0 (0)Total 364 326 (90) 26 (7) 4 (1) 6 (2)
et al., 1998). The different redox conditions of theIndus plain as compared to that of Bangladesh makearsenic mobilization in the groundwater more difficult.
Unlike in Bangladesh and West Bengal, surveys forarsenic in groundwater in Pakistan are limited. TheWorld Bank Report (2005) on arsenic mentions a test-ing program conducted by the Provincial Governmentof Punjab with UNICEF in 2000. From a total of364 samples analysed, 90% had arsenic concentra-tions less than 10 μg/L with 2% having concentrationsabove 50 μg/L (Table 3) (Iqbal, 2001). The levelsof arsenic concentrations of groundwater in the IndusPlain appear to be relatively small though furtherdetailed surveys are clearly required.
Fluoride in Groundwater and DentalHealth
Dental Fluorosis in Sri Lanka
In studies on the distribution of diseases linked togeology and geochemistry, the concept of geochemicalprovince becomes very useful. Very broadly, one coulddefine a geochemical province as a geological terrainconsisting of a characteristic chemical composition insoil, rock, water and stream sediments and which couldbe delineated from other such provinces. Even thoughit was originally used in mineral exploration, due to theimbalances of chemical elements in the delineated geo-chemical province, the different populations living onthem could show symptoms of different diseases andhence its use in medical geology.
In Sri Lanka, four major geochemical provinces canbe demarcated, based on the hydrogeochemical mapsof the country (Dissanayake and Weerasooriya, 1986).

Some Aspects of the Medical Geology: India and Neighbouring Regions 183
The climate plays the most significant role in Sri Lankawith the climatic zones, namely dry, intermediate andwet zones showing clear geochemical differences anddifferent weathering rates, clay mineralogy and leach-ing of essential elements. This intense leaching, socharacteristic of humid tropical terrains, is clearly seenin Sri Lanka. The dry zone in particular is geochemi-cally very different from the wet zone and the impactis clearly seen in the distribution of some diseases,namely dental fluorosis and iodine deficiency disorders(IDD).
The dry zone of Sri Lanka is markedly rich influoride-rich groundwater (Fig. 3). Over 2 million
people, the majority of them children, are suscepti-ble to dental fluorosis caused by the consumption ofwater with high levels of fluoride, as obtained fromthe groundwater. It should be emphasized here thateven at rather low levels of fluoride in the groundwa-ter (e.g. 0.4–0.6 mg/L), dental fluorosis is still common(Fig. 4). This indicates possibly a higher consumptionof water, bearing in mind the hot dry climate, and adeficiency of other essential elements (e.g. calcium,which may retard the onset of dental fluorosis). TheWHO recommended levels are not appropriate in thiscase and a maximum level of 0.6 mg/L has been rec-ommended for fluoride in drinking water in Sri Lanka
Trincomalee
Batticaloa
MonaragalaRatnapura
KurunegalaAmpara
Colombo
Anuradhapura
Jaffna
Hambantota
Sites with >1.5 mg/l F-
Climatic Boundary
Mannar
0 40 KmFig. 3 Distribution offluoride in groundwater of SriLanka (after Dissanayake andWeerasooriya, 1986)

184 C.B. Dissanayake et al.
Fig. 4 A young boy affectedby dental fluorosis which iscommon in dry zone of SriLanka (photo by RohanaChandrajith)
(Warnakulasuriya et al., 1992). Precambrian metamor-phic rocks constitute about 90% of the lithology ofSri Lanka, and these contain fluoride-bearing mineralssuch as hornblende, mica, topaz, and fluorite.
In the wet zone, on the other hand, the easy leacha-bility of the fluoride ion causes the soils to be depletedof the ion with resulting low concentrations in thegroundwater. Dental caries therefore are significantin the children living in the wet zone of Sri Lanka.In view of the fact that the majority of the popula-tion in Sri Lanka lives in a rural environment devoidof central water treatment plants supplying domesticwater, groundwater is the main source of water supply.In the dry zone, they are compelled to use fluoride-rich groundwater for their domestic purposes. Manydeep wells which had been drilled in the hard rocks ofthe Precambrian metamorphic terrain of the dry zonehave high fluoride levels (in some cases as much as10 mg/L), as a result of which, skeletal fluorosis is alsoprevalent though in lesser percentages than in SouthIndia and some parts of Africa.
In order to alleviate the dental problems causedby high-fluoride groundwater, Padmasiri andDissanayake, 1995 discussed the use of burntbricks as a defluoridating agent at the householdlevel. The filter constructed is simple in design and isfabricated using a 225 mm diameter, 1 m PVC pipelength; 20 mm diameter, 1 m PVC pipe length; and anelbow bend. In order to get a longer retention time ofwater to pass through the defluoridating material, i.e.burnt bricks, the upward flow technology was used.In using this filter, the high-fluoride water should beretained for a minimum period of 12 hours in thedefluoridator at the start. Thereafter, the high-fluoride
water is fed into the column and the defluoridatedwater comes from the outlet. This simple techniquehas been quite successfully used in the remote areas ofSri Lanka affected by dental fluorosis resulting fromthe intake of high-fluoride water.
Fluoride in Drinking Water in Pakistan
Figure 5 illustrates the fluoride distribution in ground-water in Pakistan (Khan et al., 2002). Analysis of 987water supplies showed that they are predominantly
Fig. 5 Fluoride distribution in Pakistan (after Khan et al., 2002)

Some Aspects of the Medical Geology: India and Neighbouring Regions 185
low in fluoride content, 84% containing less than0.7 mg/L fluoride. The majority (64%) of the drinkingwater sources of Pakistan had fluoride levels less than0.3 mg/L, while 20% ranged from 0.3 to 0.7 mg/L. Arange of 0.7–1.00 mg/L fluoride was observed in 6%of the samples and another 6% had 1.00–2.00 mg/L.Fluoride in the range of 2.00–3.00 mg/L was foundin 1.5% of the samples while 2% had fluoride levelshigher than 3.00 mg/L.
Determining the optimal levels of fluoride in drink-ing water in hot dry climates of the tropical belt hassome inherent difficulties. Yet, the community as awhole requires a knowledge of the most appropriateconditions, in view of the fact that dental diseases area major health concern.
The areas in the Indian subcontinent and neigh-bouring regions, as discussed in this chapter, haveextremely large populations with nearly all of themhaving a very low rate of pipe-borne water supply,generally 20–30%. Such large populations depend-ing on groundwater and surface water mainly fortheir drinking water supplies are therefore highlyvulnerable to any mineral excesses, deficiencies and
imbalances in water, fluoride being one of the bestexamples.
The case of Pakistan was studied by Khan et al.(2004) and this study clearly proved the need forconsideration of a variety of factors needed for theestablishment of optimal drinking water standards.Khan et al. (2004) carried out clinical dental exam-inations of 1,020 school children aged 12 years, in19 cities of Pakistan (Table 4). Correlations betweenconcentrations of water fluoride, caries and fluoro-sis levels were studied by analysing the data offluoride.
Based on the observation of the trend lines for flu-orosis and dental caries (Fig. 6), it was shown that at0.35 mg/L fluoride in water, the maximum reduction indental caries was observed while the level of fluorosiswas 10%. Only mild degrees of fluorosis were obtainedat 0.35 mg/L level fluoride. Khan et al. (2002) also rec-ommended a value of 0.39 mg/L as the optimal fluoridein drinking water for Pakistan.
This recommendation should be viewed againstsome background facts, namely 80% of the popula-tion has no access to a piped water supply and that
Table 4 Level of dental caries (as DMFT: D = Decayed,M = Missing due to caries, F = Filled, T = Teeth) and fluo-rosis (Dean’s index) for 12-year-olds, according to the varying
concentrations of fluoride in drinking water of 19 cities inPakistan (Khan et al., 2004)
Dean’s index (%)
CityFluoride level(mg/L) DMFT Very mild Mild Moderate Severe Total fluorosis (%)
Mirpur Khas 0.03 2.20 0 0 0 0 0Islamabad 0.07 1.86 7 3 0 0 10Jehlum 0.10 0.64 0 0 0 0 0Sialkot 0.14 1.05 3 3 0 0 6Karachi 0.15 1.08 10 10 0 0 20Lahore 0.15 1.07 3 10 0 0 13Peshawar 0.15 1.02 3 0 0 0 3Hyderabad 0.16 0.97 3 0 0 0 3Faisalabad 0.20 0.78 12 3 0 0 15Rahimyar Khan 0.22 0.76 3 3 0 0 6Gujranwala 0.29 0.51 0 0 0 0 0Sukkur 0.30 0.46 3 2 0 0 5Sahiwal 0.33 0.42 7 3 0 0 10Khanpur 0.40 0.50 7 3 3 0 13Sammundari 0.53 0.60 12 15 12 3 42Hasilpur 0.60 0.60 10 12 10 3 35Khairpur 0.73 0.60 10 20 10 18 58Quetta 0.91 0.60 7 30 18 10 65Mianwali 1.40 0.90 3 15 45 30 93Pakistan (total) 0.90 6 7 5 3 21

186 C.B. Dissanayake et al.
Severe Moderate Mild Very mild DMFT
0.000.03 0.07 0.10 0.14 0.15 0.150.15 0.16 0.20 0.22 0.29 0.30 0.33 0.40 0.53 0.60 0.91 0.400.73
0.15
1.00
1.50
2.00
2.50
0
10
20
30
40
50
60
70
80
90
100
Flu
oro
sis
(%)
DM
FT
Fig. 6 The relationship of varying degree of dental flu-orosis and dental caries among 12-year-olds to the flu-oride concentration in drinking water of 19 cities inPakistan (DMFT refers to permanent teeth: D = decayed,
M = missing due to caries, F = filled, T = teeth; The DMFTindex is most commonly used indices in epidemiologic surveysof dental caries) (after Khan et al., 2004)
the provision of piped water to the majority of thepopulation cannot be a possibility in the near future.The case of Pakistan illustrates further the importanceof each country having its own recommended standardfor fluoride in water, some examples of which areshown in Table 5.
The distribution of fluoride in groundwater undervarying geological conditions is an interesting aspectof medical geology (Edmunds and Smedley, 2004).For example, the Thar desert located in the southwest-ern corner of Pakistan in the Sindh Province covers an
Table 5 Recommended standard for fluoride in water fromdifferent countries
CountryRecommendedF level (mg/L) Reference
Austria 0.7–1.00 Nell and Sperr (1994)Botswana <0.5 Zietsman (1991)Sudan <0.5 Ibrahim et al. (1995)Senegal 0.6 Brouwer et al. (1988)Sri Lanka 0.6 Warnakulasuriya et al. (1992)Chile 0.5–0.6 Locker (1999)Western India 0.34 Chandra et al. (1980)WHO value 0.50–1.50 WHO (1994)
area of 22,000 km2. Except for the occurrence of a fewgranites and other igneous rocks, the desert is mostlya sand dune terrain. Water is available only at depthsaround 52–93 m and this is brackish and rich in flu-oride (Rafique et al., 2008). The high fluoride levelsin the water are attributed to the granites which havefluoride-bearing minerals and which leach out fluorideinto the groundwater upon weathering in which flu-oride contents vary from 0.09 to 11.60 mg/L with amean of 3.64 mg/L and median of 3.44 mg/L (Rafiqueet al., 2008).
It was observed that based on WHO values for flu-oride in drinking water, 88.4% (n = 108) out of a totalof 122 groundwater samples were above the value of1.5 mg/L. With fluoride levels reaching levels as highas 11.63 mg/L (Mau area) and 8.23 mg/L (Pabe joTar area) and 9.05 mg/L (Mithi Town) even skeletalfluorosis is prevalent.
Rafique et al. (2008) also comment on the extremeand arid climatic conditions prevalent and the highwater consumption. Thus, as shown in the work ofKhan et al. (2004), the recommended value for fluorideneeds to be lowered drastically, bearing in mind theother factors such as inputs of other essential elementsand dietary habits.

Some Aspects of the Medical Geology: India and Neighbouring Regions 187
Fluoride in India
Fluorosis is a countrywide problem in India and ithas reached alarming proportions in 17 states (Fig. 1)(Susheela, 1999); these are
• States having 50–100% districts affected – AndhraPradesh, Tamil Nadu, Uttar Pradesh, Gujarat andRajasthan.
• States having 30–50% districts affected – Bihar,Haryana, Karnataka, Maharashtra, MadhyaPradesh, Punjab, Haryana, Orissa and West Bengal.
• States having <30% districts affected – Jammu andKashmir, Delhi and Kerala.
Fluorosis was first reported from India by Shorttet al. (1937) and since then there have been a num-ber of reports of fluorosis from different parts of thecountry (Reddy 1985; Reddy et al., 2004). Even todayfluorosis persists as a disease without proper treat-ment and cure. Endemic fluorosis known as genuvalgum is common in parts of Andhra Pradesh andTamil Nadu.
Fluorspar (fluorite), apatite (fluorapatite) and phos-phorite are generally the main minerals contribut-ing to the presence of fluoride in soil and water.Several thermal springs are known to contain veryhigh fluoride levels ranging from 10 to 17 mg/L.Secondary dispersion of fluoride is known in soil,river and groundwaters, rain and atmosphere. The sec-ondary dispersions correlate favourably with primaryoccurrences.
Fluorspar deposits in India are of three types:(i) those associated with the Precambrian gran-ites – gneisses, pegmatites, quartz veins, mostly inprominent shear zones as in Tamil Nadu, AndhraPradesh, Madhya Pradesh, Gujarat, Rajasthan andBihar; (ii) those associated with the carbonatites asin Gujarat (Early Tertiary) in the Narmada tectoniclineaments; and (iii) sedimentary digenetic types asin Ramanwara Rewa (Proterozoic–Early Cambrian) inMadhya Pradesh (Kariyanna, 1987).
The major apatite deposits in India are associatedwith Singhbhum shear zones in Bihar and EasternGhats, orogenic belt, in Vishakhapatnam, AndhraPradesh. The second type is associated with carbon-atites as in Sattur, Tamil Nadu, in prominent shear
zones and the third type is with the lamprophyre intru-sives (late Cretaceous – Early Tertiary) in the lowerGondwana coal fields in Bihar and along the Damodarfault/graben in West Bengal.
The phosphorite occurrences are in Uttar Pradesh,Himachal Pradesh, Jammu and Kashmir, Rajasthan, inthe northwest, and Tamil Nadu, in the south, besidesa few minor occurrences in other states. Low-gradephosphorite and guano of recent origin occur in theLaccadive–Amindivi group of Islands. The fluorinecontent of the phosphorite varies from 0.21 to 1.65%(Kariyanna, 1987).
Fluoride-Related Diseases in India
Fluorosis is of four types, viz.: (a) dental fluorosis, (b)skeletal fluorosis, (c) osteoporosis or genu valgum and(d) dental caries.
(a) Dental fluorosis: The teeth lose their shiny appear-ance and chalky white patches develop. This isknown as “mottled enamel” and is an early signof dental fluorosis. White patches later becomeyellow and sometimes brown or black. In sev-eral cases loss of enamel is accompanied by pit-ting which gives the tooth corroded appearance.Mottling is best seen on incisors of the upperjaw.
(b) Skeletal fluorosis: In older people, the diseaseaffects the bones and ligaments. Early symptomsare tingling sensation in legs and feet followed bypain and stiffness of the back, later, joints of bothlimbs and limitation of neck movements. Earlydetection of the disease may escape till radio-logical help is sought. Radiological changes arequite characteristic and include formation of newbones (exostotis) and calcification of tendons andligaments membranes. Skeletal fluorosis has beenreported to be a public health problem of consider-able magnitude in several parts of Andhra Pradesh,Haryana, Karnataka, Kerala, Punjab, Rajasthanand Tamil Nadu (Susheela, 1999).
(c) Genu valgum: Recently scientists working at theNational Institute of Nutrition, Hyderabad, founda new form of fluorosis characterized by genu val-gum (knock knee) in South India, particularly inAndhra Pradesh and Tamil Nadu. The prevalence

188 C.B. Dissanayake et al.
of genu valgum was as high as 3–4% especiallyin Nalgonda and Prakasam districts of AndhraPradesh and Pollachi area, Coimbatore districtof Tamil Nadu. Circumstantial evidence stronglysuggests that building of dams in and aroundsoil rich in fluoride contents may have a role toplay in the etiopathogenesis of endemic genu val-gum in fluorosis affected communities (Reddy,1985).
(d) Dental caries: Fluoride levels below 0.5 mg/L areusually associated with high prevalence of dentalcaries.
Treatment of Fluorosis: Possible Measures
The study of fluorosis has assumed great importancein a developing country like India. The element flu-orine has been used as the therapeutic agent in den-tal caries, atherosclerosis and osteoporosis in humanbeings, but because of its profound affinity for skeletaltissues “fluorosis” results if taken in excess amounts(Reddy, 1985). An attempt has been made by Rao et al.(1974) to treat human beings suffering from endemicfluorosis, using serpentine which is a silicate of mag-nesium and capable of taking up colossal amounts offluoride over a wide range of pH in aqueous solu-tions. Oral as well as intravenous administration ofMg(OH)2 has also been suggested (Reddy et al., 1974).According to Rao and Murthy (1974), the mecha-nism by which serpentine and Mg(OH)2 operate isnot clear but suggestions are offered for the role ofMg(OH)2 in complexing the free fluoride ions. Thusthe possible utility of other defluoridating agents suchas aluminium hydroxide and ferric hydroxide in thetreatment of fluorosis is also indicated (Meenakshi andMaheswari, 2006).
Gupta and Gupta (2004) indicate that fluorosiscould be reversed, at least in children, by a therapeu-tic regimen (calcium, vitamin C and vitamin D) whichis cheap and easily available. Treatments take a lot oftime and also have a limited application for wide scaleuse. Taking precautionary early measures is the onlyeffective way for prevention of fluorosis. For fluorosis,change or modification of the water supply is the onlylong-term practical solution. Digging deep bore wellshas been shown to provide lower, but not appropri-ate fluoride contents. Defluoridation of water can also
be performed by adding activated alumina or by theNalgonda technique (alkalinization and chlorinationfollowed by adding aluminium salts). However, thesemethods, though effective, require strong motivationand cooperation of local population and administration(Singh and Maheswari, 2001).
Meenakshi et al. (2004) have proposed nano filtra-tion as a cost- effective deflouridation measure, whichcan be applied to field conditions in third world coun-tries. Nano filtration (also called low-pressure reverseosmosis) is a membrane-based process, which canselectively remove small molecules and ions includ-ing fluoride and can sterilize water. It is a low-costtechnique, is effective and requires a small amountof energy, which can be supplied by a photo-electriccell.
Fluoride affects virtually all the components of bonemetabolism. The pathogenesis of skeletal fluorosis isstill not clear. The role of micronutrients and macronu-trients still needs to be well defined. Skeletal fluorosisis symptomatic only in later stages of the disease.Presently, no effective treatment is available and pro-vision of fluoride-free water seems to be the onlysolution. Several deflouridation techniques are avail-able but has not attained wide acceptance for want ofpublic cooperation and bureaucratic apathy. Creatingawareness among the public about the safe drinkingwater and toxicity of fluoride is therefore, very muchrequired for fluorosis prevention.
Crippling deformities characteristic of vitamin Ddeficiency were also associated with the villagersconsuming water containing high level of fluoride(Hari Kumar et al., 2004). The unique features indi-cate that children suffered from these deformities,while the adults suffered from stiffness of the spine.Environmental changes in recent years suggest thatvery high levels of fluorine in water could lead tosecondary vitamin D deficiency. It is possible thatdeficiency of several nutrients may modify and aggra-vate the toxic effects of chronic fluoride intoxication,while playing a part in the causation of these deformi-ties. Supplementation of the entire population of theaffected village with calcium tablets (400 mg/day forthe children aged between 1 and 9 years; 600 mg/dayfrom 10 to 15 years, 500 mg/day from 16 to 18 yearsand 1,000 mg/day in case of pregnant and lactatingwomen) may be used as a remedy. Vitamin D mayalso be given as an empirical treatment (Gupta andGodbole, 2004).

Some Aspects of the Medical Geology: India and Neighbouring Regions 189
Medical Geology of Iodine DeficiencyDisorders
Iodine is a vitally important trace element presentin soil, water, and vegetables/cereals, whose defi-ciency is usually a harbinger of the disease knownas endemic goitre. Endemic goitre normally doesnot occur when the adult iodine intake ranges above0.075 mg/day level. Ideally, the daily requirement ofiodine is 0.14 mg for an adult man and 0.10 mg for anadult woman. Growing children and pregnant or lac-tating woman may need more. Iodine is essential forthe synthesis of the thyroid hormones, thyroxin andtriiodothyronine.
Endemic goitre (Fig. 7) is a health hazard to bothhuman and animals, commonly due to lack of dietaryiodine and environmental deficiency. It has a crip-pling effect upon the affected communities and leadsto high incidence of endemic cretinism in the severelyaffected areas. Endemic cretinism represents develop-mental abnormalities including decreased intellectualpotential.
It is generally observed that except for marine rocks,which are rich in iodine, most rocks of continentalorigin are conspicuously deficient in iodine and haveconcentrations ranging from 0.2 to 0.8 mg/kg andin basic rocks, it ranges from 0.5 to 0.8 mg/L andacid volcanic rocks have an average of 0.4 mg/kg.Metamorphic rocks (schist) and certain sedimentary
Fig. 7 Typical case of endemic goitre (photo by Dr. RohanaChandrajith)
rocks (clay) contain slightly higher concentrationsof iodine (1–2 mg/kg). However, sedimentary rocksof marine origin contain extremely high concentra-tions (100–1,000 mg/kg) of iodine (Vinogradov, 1959).Sands, sandy glacial deposits being more porous andpermeable and limestone have low contents of iodine(0.2–0.3 mg/kg).
Water is an important medium for the iodine supplyto humans and animals with hardness of water playinga vital role in the disease proliferation. Goitre is com-monly associated with limestone terrains and in areasyielding high calcium. Rains, water logging, and bio-logical activities within the soils also contribute iodine.The distribution of iodine in the soil profile increaseswith enhanced organic matter and humus accumula-tion. The soils of maritime regions have higher iodinecontents, the principal source being atmospheric iodinecoming from the evaporation of seawater.
Iodine Deficiency Disorders in Sri Lanka
As shown by Dissanayake and Chandrajith (2007), thegeochemistry of iodine and its bioavailability influencethe prevalence of iodine deficiency disorders (IDDs)and geological and mineralogical factors play a keyrole in this process. Among the factors noted were
(a) intense rainfall(b) high temperature and their marked diurnal varia-
tions(c) very high rates of weathering and leaching of rocks
and soils(d) clay–organic interactions(e) greater fractionation of elements in the physical
environment
Poverty and poor dietary habits were consideredto be the main non-geological factors that influenceIDD.
As illustrated in Fig. 8, the endemic goitre belt inSri Lanka is more influenced by the climate whichinfluences the heavy leaching of soils. Lateritic typesof soils are abundant in the wet zone of Sri Lanka.The groundwater fluctuations are quite marked and anyiodine present in the already leached soils is removedby the groundwater.

190 C.B. Dissanayake et al.
Fig. 8 Endemic goitre region of Sri Lanka
Iodine Deficiency Disorders in Pakistan
Pakistan is another country in the South Asian regionwhere IDDs are prevalent. It has been shown thatabout 20 million people live in iodine-deficient areas ofPakistan and of these 9 million have shown symptomspertaining to IDD including mental retardation (Khan,2008). In the early 1990s, an “Iodine DeficiencyProject” was jointly carried out by the Governmentof Pakistan, UNICEF and the Population ServicesInternational (PSI). The study showed that in 1993, anestimated 70% of the population was at risk with iodinedeficiency.
More recently, Elahi et al. (2004) studied the statusof iodine-deficiency in Lahore, Pakistan, by estimationof neonatal cord serum thyrotropin (CST). They anal-ysed the blood of 1,295 neonates randomly selectedfrom 25,000 live births during a 5-year period from1998 to 2002. The results showed that in areas wherethere was sufficient iodine, there was an incidence ofless than 3% with CST values >10 mlU/L where afrequency of 3–19.9% indicated mild IDD. On theaverage, 13.5% of the neonates had a CST level of>10 mlU/L indicating mild IDD.
Iodine Deficiency Problems in India
Geological studies reveal that goitre endemicity ismore pronounced in the lesser Himalayas wheremetasedimentary rocks, dolomite, limestone, granites,and crystalline rocks are exposed, have low iodine con-tents or are completely devoid of it (Fig. 1). The rocksof the Siwalik belt mainly comprising of sandstoneand the Tarai region of alluvial plain are covered withsandy soils. It is observed that clay sediments havehigher concentrations of iodine (100–1,000 mg/kg) ascompared to sandy soil (0.4–5 mg/kg) (Prasad andSrivatsava, 2004). Deficiency in iodine in this area isdirectly related to the chemical composition of rocksand soil. Distribution of goitre shows a close correla-tion with the areas and extent of Quaternary glaciationswhere soils have not yet been sufficiently saturatedwith post-glacial airborne oceanic iodine.
It was reported that goitre incidence is high interrains of magnesium limestone sequences and inareas where soil and water are rich in calcium con-tents (Prasad and Srivatsava, 2004 and the referencestherein). Geomorphologically, steep gradients in theHimalayan terrain, ranging in elevation from 100 to1,000 m; between Siwalik belt and alluvial plain ele-vation ranging from 200 to 1,000 m; promote quickrun off of the surface water, with the result that waterfinds little time to transfer its iodine to the soil and inturn to the groundwater.
Migration of the rivers like Gandak, Ghaghra, etc.has led to the development of extensive, wide floodplains in the alluvial plain, covered with thick piles ofsandy sediments and subjected to frequent and severeflooding due to natural geographical locations, erodingtop clayey soil of the flood plain that contains requisitetrace elements including iodine.
Geoenvironmental Factors Responsiblefor Goitre Endemicity in India
Flood Menace
The goitre endemic area experiences moderate to highrainfall (119 cm average of 50 years). The frequencyof rainfall based on data of Indian MeteorologicalDepartment for the period 1901 and 1950 indicates100 cm in 8 years, 120–130 cm in 7 years, 130–140 cmin 5 years, 160 cm in 3 years and 160–170 cm in 1 year.

Some Aspects of the Medical Geology: India and Neighbouring Regions 191
Torrential rain of short spells in the Himalayan regionand longer spells in the Tarai region and alluvial plainssaturate the soil. This oversaturation of the groundresults in increased run off and flash floods. Intenseglaciations in the higher Himalaya and frequent floodstogether with sandy soil in the area are responsiblefor iodine-deficient soils and shallow aquifer water(Prasad and Srivatsava, 2004).
Socioeconomic Conditions
Sandy soil deficient in iodine, irrigated through iodine-deficient dug well water, contributes towards an iodine-deficient food chain. Poverty and faulty diet are alsothe reasons for the disease. Inhabitants dependentupon locally produced iodine-deficient food are moreprone to the disease as compared to the populace whoconsume food/vegetable transported from goitre freeareas.
Endemic goitre is therefore a serious health hazardto both human and animal resources. Its incidencetransgresses all social barriers and observations areconsistent with the hypothesis that environmentaliodine deficiency is the primary cause for its endemic-ity. During the course of studies between 1981 and1984 and again in 1988, it was observed that therehas been a marked decline in the prevalence rate ofgoitre from 65% in 1965 to 15% in 1985 and now itis even less than 10% (Prasad and Srivatsava, 2004).This is attributed to (a) besides supply of iodizedsalt, supply of drinking water from a deeper aquifer(iodine content ranging from 2–10 μg/L) through handpumps and tube wells and (b) control of flood menaceand soil conservation measures like construction ofcheck dams/bunds has reduced soil erosion and runoff of surface water which in turn has facilitatedconservation of top soil of the flood plain includingatmospheric iodine.
Remedial Measures
In order to make the program more effective and suc-cessful, long- and short-term measures are suggested:
(i) Drinking water and irrigation may be suppliedfrom deeper aquifers.
(ii) Control of flood-menace and soil erosion byconstructing barriers/check dams may be taken
up more rigorously for preserving atmosphericiodine to the soil.
(iii) Use of iodized fertilizer in the goitrogenic areas.
These measures will help in replenishing iodine inthe system itself. Endemics in most part of the areahave been controlled and eliminated by better livingstandards and high intake of better quality food. Apartfrom the above measures, supply of iodized salt in thediet to optimum intake of 0.075 mg level per day maybe continued.
Selenium Geochemistry
Selenium Geochemistry in Sri Lanka
There had been an extreme scarcity of research on sele-nium in rocks, water and soils in Sri Lanka. Fordyceet al. (1998) for the first time studied the seleniumgeochemistry of these geomaterials. In recent years ithas been suggested that selenium deficiency may be animportant factor in the onset of goitre and other iodinedeficiency disorders (IDD). The pioneering work ofFordyce et al. (2000) in Sri Lanka focused on the sele-nium status of the human population (demonstratedby hair samples from women) from 15 villages. Thevillages were characterized by low (<10%), moderate(10–25%) and high (>25%) goitre incidence (NIDD,MIDD and HIDD, respectively). Their results fromthe analysis of 75 soil samples showed that concentra-tions of total Se and iodine were highest in the HIDDvillages. Even though the actual amount of iodine ishigh, factors such as clay content may have reducedthe bioavailability of the iodine and selenium. Fordyceet al. (2000) also showed that a significant proportionof the Sri Lankan female population may be seleniumdeficient (24, 24 and 40% in the NIDD, MIDD andHIDD villages, respectively), as summarized in thedata in Table 6.
Selenium Geochemistry in India
Selenium ranging from 0.85 to 4.52 mg/kg is reportedin soils from parts of Hoshiarpur, Nawanshahr andJalandhar districts of Punjab. The reported seleniferous

192 C.B. Dissanayake et al.
Table 6 Summary of iodine and selenium determi-nations in all sample types in each goitre incidence villagegroup (Abbreviations: NIDD, no/low goitre incidence; MIDD,
moderate goitre incidence; HIDD, high goitre incidence; nd, nodata) (Fordyce et al., 2000)
Group Sample type Min. Se Max. Se Mean Se No. Min. I Max. I Mean I No.
NIDD Soil (ng/g) 113 663 226 25 130 10,000 2,260 25Rice (ng/g) 6.8 150 42 25 45 58 51 5Water(μg/L) 0.06 0.24 0.11 5 53 84 66.5 5Hair (ng/g) 104 765 294 25 nd nd nd
MIDD Soil (ng/g) 310 5,238 875 24 130 6,600 2,008 25Rice (ng/g) 0.1 776 55 25 <38 <38 <38 5Water(μg/L) 0.06 0.09 0.07 5 3 23.5 5.5 5Hair (ng/g) 118 2,652 389 25 nd nd nd
HIDD Soil (ng/g) 276 3,947 1,124 25 1,000 9,600 3,914 25Rice (ng/g) 0.1 127 25 25 <38 <38 <38 5Water (μg/L) 0.06 0.09 0.07 5 3.3 20.2 7.02 5Hair (ng/g) 111 984 302 25 nd nd nd
area lies in the interfluves area of Satluj and Beas riversin the proximity of Siwalik Foot Hills. Plants grownon seleniferous soil show high selenium contents. Thelivestock of the area has been found to be affected byconsumption of excess selenium through water, plant,cereals, vegetables and fodders. Diseases like cracksin the hoofs and their gradual detachment, necrosisof tails and premature abortions, etc. are observed(Dhilon and Dhilon, 1991).
The Quaternary sediments in which selenium toxic-ity has been reported are mostly derived from Siwaliksas well as Lesser- and Higher-Himalayas rock for-mations. The geology, geomorphology, geochemicalenvironment and tectonic control of the area show anassociation with the selenium enrichment in the soil(Dhilon and Dhilon, 1991; Prasad and Kar, 2004).
Podoconiosis (Non-filarialElephantiasis)
It was in 1988 that Ernest Price observed clinicalfeatures of swelling and deformity of the legs, verymuch akin to what otherwise is known is elephanti-asis, but associated with enlargement of the draininglymph nodes. He could clearly show that this partic-ular type of clinical features were of non-filarial typeand named the cases as “Podoconiosis” or non-filarialelephantiasis (Price, 1988, 1990). He further confirmedthat the podoconiosis cases came from many regionsin Africa with very similar climatic conditions andsoil type (Price and Bailey, 1984). Superimposing the
prevalent data for podoconiosis on a geological map ofAfrica reveals a correlation between alkali basalts andpodoconiosis.
In Bhiwapur area of Nagpur district in India, onevery frequently comes across people with clinical fea-tures of swelling and deformity of legs. The problem ismore frequent in the ladies working as farm labourers.A cursory look in the records of Bhiwapur PublicHealth Clinic (PHC) catering to the health needs ofthe residents of 72 nearby villages shows that duringthe year 2002–2003, 864 patients with clinical featuresof so-called elephantiasis reported to the PHC. Onmedical examination of these patients, only 388 caseswere confirmed as cases of “filaria” with micro-filarialgerms detected in their blood samples. For the remain-ing 476 patients, filaria could not be established andthey have been treated as “unexplained cases” as perthe medical terminology. However, of late it has beenestablished in various parts of the world that these clin-ical features are not linked to filaria but are causedby geogenic factors the cases being “podoconiosis”.The geogenic factors for the disease are presence ofsubmicron size particles in clayey soil containing alu-minosilicate and silica. Such particles enter into theblood through abrasions in the feet and affect the cellsof the immune system. The pathogenicity of such par-ticles depends on its enrichment in Ti and Fe content,near surface composition, surface micro-topography,surface charge and pH. Geologically the Bhiwapurarea comprises of a thick succession of basic andacid volcanic and metapelites. The basic volcanic andassociated tuffs have a very high Ti content besideshigh Fe. The area of active cultivation is over a flat

Some Aspects of the Medical Geology: India and Neighbouring Regions 193
land developed over the basic volcanic-tuff terrain.The geological set-up of Bhiwapur area thus matchesvery well with the established zones and case historiesaffected with “podoconiosis”. It is time that the unex-plained cases of elephantiasis from Bhiwapur area areclinically tested for “podoconiosis” (Sinha and Saha,2004).
At present, it is suspected that there could be a largepopulation of victims of podoconiosis in Bhiwapur andsurrounding areas. Hence extensive geochemical stud-ies need to be carried out on the soil profile developedin the flat terrain as referred to above, to confirm a pos-itive area for podoconiosis. It is also necessary to carryout in-depth studies as to why the women engaged inpaddy and chilly transplantation working in this areasuffer more from the “swelled feet” syndrome. It isalso a fact that almost all the women carry out theirfarm-related jobs barefooted and hence more proneto abrasion and cuts which in turn make them moresusceptible to podoconiosis.
Natural Radiation
The United Nations Scientific Committee on Effectsof Atomic Radiation Report (UNSCEAR, 2000) statesthat while the natural background radiation is thelargest contributor to human exposure, the worldwideaverage annual effective dose per capita is 2.4 mSv.Radioactivity in natural materials is due to uranium(238U), thorium (232Th) and potassium (40K) presentnaturally in the geological materials. Besides thenature of the geological materials, external sourcesand life style also contribute to the naturally avail-able radiation in the environment (Kathren, 1991).The anomalous concentration of radioactive mineralsin rocks at certain places may give rise to radiationenhancement, but they are also natural and the peopleliving in such environments are adapted to it over cen-turies. Dissanayake (2006) in his essay on “Of stonesand health–medical geology in Sri Lanka” commentedon the seemingly lack of health issues among peopleliving in high background radiation areas (HBRAs)such as Ramsar (Iran), Kerala (India) and Guarapari(Brazil). Cameron (2001) stated that disease can beattributed to excesses of essential trace elements suchas potassium, calcium and phosphorus in the diet anddisease (e.g. radiation sickness) can be attributed to
a massive dose of ionizing radiation absorbed over ashort period of time. It is important, however, to dis-tinguish between an acute dose of 3–5 Gy (1 Gray =100 rads), the LD50 for nuclear radiation and a chronicexposure of 260 mGy/yr as reported for Ramsar (Iran),which would lead to an accumulated dose of 3–5 Gyin a mere 12–20 years. The people in Ramsar sur-vive to old age and exhibit none of the symptoms ofradiation disease, although these residents are exposedto extraordinary levels (up to 260 mGy/y) of naturalradiation (Mortazavi et al., 2003). Ramsar residentsshowed fewer chromosome aberrations compared toresidents in a nearby control area. This implies theexistence of some sort of radioadaptive mechanismwhich repairs the damage done to the body by the ion-izing radiation over a period of time (Cameron, 2001).Every one of us, no matter where we live, is sub-jected to “natural” or “background” radiation and thisaccount for 82% of the total exposure that an aver-age human being receives during a life time (Hall,2001). Facius (2005) was of the view that the “radi-ation paradox” (that people living in certain areas withhigh levels of background radiation do not seem to suf-fer adverse effects from exposure to radiation) residesentirely in the minds of those who are convinced thatany small amount of chronic exposure to ionizing radi-ation constitutes a health risk, a notion devoid of anyempirical corroboration.
In natural surroundings, certain radioactive sub-stances occur in abundances far greater than theirnormal level of concentration, for example, some vaststretches of coastal India where the beach sands areenriched in placer deposits of “black sands” whichcarry heavy minerals such as ilmenite, garnet and mon-azite. Monazite is a highly insoluble rare mineral andthe radionuclides in the monazite are from the 232Thseries, but there is also some uranium and its progeny226Ra. The external radiation levels and the black sandsrange up to 5 mrad/hr (50 mGy/hr), almost 400 timesthe normal background (Paul et al., 1998).
The monazite deposits of Kerala, in the south-west, and Bhimilipatnam in east India are larger thanthose in Brazil. The radiation dose from external radi-ation is on average similar to the doses reported inBrazil, 500–600 m rad/yr (5–6 mGy/hr), but individ-ual doses up to 3,260 m rad/yr (32.6 mGy/yr) havebeen reported (Mohanty et al., 2004a, b). In India itwill be worthwhile to carry out radon surveys in areasover granite/gneiss terrains, or in areas traversed by

194 C.B. Dissanayake et al.
major lineament and groundwater movement. In someparts of Hyderabad, the granites are enriched in ura-nium and these areas need to be specifically studied bygeochemists and town planners.
There are numerous species of uranium-bearingminerals occurring in nature, viz. pitchblende, urani-nite, samarskite and thorianite. These are knownto occur in the Singhbhum copper belt, Jharkhand,Udaipur, Bilwara, Alwara, Durgapur and Jhunjhunudistrict in Rajasthan, Jhansi areas in Uttar Pradesh,Kalsapur in Chikamagalur district and Karnataka.The known monazite occurrence includes Gaya dis-trict in Bihar, coastal tracts of Cuttack, Ganjam,Bhimilipatnam in Andhra Pradesh and beach sands ofKerala, Tamil Nadu, Quilon and Kanya Kumari coasts.Mining of radioactive minerals like uranium, monazitecreates health hazards due to ionized radiation hazardsand causes acute burns, dermatitis, etc. Chronic expo-sure causes malignancies, congenital defects and alsolung cancer due to inhalation of radioactive dust.
The Kanya Kumari coast has very high radiation ofmore than 1,200 mrem as in Quilon Coast. Thorium, aradioactive mineral producing alpha radiation is foundin very high quantities. Due to the high incidences ofcancer in the district, an International Cancer Centrewas established at Neyyoor Hospital and a recent sur-vey showed that more than 2,800 cases of cancers werereported from Kanya Kumari Coast at Regional CancerResearch Centre, Tiruvanthapuram and about 2,000cases in Nagercoil Hospital. More intensive studies arein progress on the Kanya Kumari and Quilon coastalpopulation on the relationship of natural radiation andoccurrence of cancer (Saxena, 2004).
Collaborative Medical Geology Projects
Several collaborative projects with reputed organi-zations like Apollo Hospitals, Hyderabad; NizamInstitute of Medical Sciences (NIMS), Hyderabad;National Institute of Nutrition (NIN), Hyderabad;Sanjay Gandhi Postgraduate Institute of MedicalSciences, Lucknow; Andhra Pradesh Panchayathi RajDepartment, Hyderabad at present are involved in sev-eral medical geology research projects such as (a) kid-ney diseases in some parts of the rural areas in AndhraPradesh, (b) toxic elements in fluoride-contaminatedwaters, (c) reasons for several kidney stone problems
in some parts of the rural areas in Lucknow andGorakhpur districts in the state of Uttar Pradesh and (d)study to collect information on trace elements/essentialminerals as well as toxic metals in soil, food and fodderas well as human blood samples..
It has been observed that, when groundwatersources are used for drinking purposes and which arecontaminated with high amounts of silica, strontiumand uranium, these areas have been acutely affectedby various kidney problems. In some villages nearNalgonda and Prakasam districts of Andhra Pradesh,where fluoride levels in drinking waters are near ormarginally higher than the permissible limit, the peo-ple have serious fluorosis problems in comparison tothe people using higher fluoride levels in drinkingwater. To find out the causative factors scientists anddoctors in Hyderabad are carrying out detailed investi-gations and it was observed that in areas where peoplehave serious fluorosis problems the drinking water alsocontain appreciable concentrations of nitrate, total dis-solved solids (TDS) and toxic elements like Cr, Ni, Pb,Cd, rare earth elements, etc. Their presence may haveresulted in the rapid deterioration of kidney function-ing thereby causing serious health problems even atlower levels of fluoride contents. The National Instituteof Nutrition (NIN), India, is undertaking a pilot projectwith the collaboration of the Department of Scienceand Technology to study trace elements/essential min-erals as well as toxic metals in soil, food, fodder as wellas human blood samples at village level. This informa-tion will be used for predicting disease as well as helpin prevention.
It has been observed that the number of patientsseeking health care for chronic kidney diseases (CKD)in the north central regions of Sri Lanka has shown amarked upwards trend. This is a recent phenomenonand appears to be having an uncertain aetiology andcommon among the farming community. It was note-worthy that not only the prevalence appeared to beincreasing during the 8–10 years, but the disease alsoappears to have a heavy geographical bias towardsthe north central dry zone region of the country.The Department of Geology and the Department ofPharmacology of the University of Peradeniya, SriLanka, jointly are carrying out research studies pertain-ing to the occurrence of CKD with uncertain aetiologyin the affected districts. Thus population-based stud-ies were carried out in different geographical areasin Sri Lanka to understand the disease profile and to

Some Aspects of the Medical Geology: India and Neighbouring Regions 195
identify the possible risk factors. Based on the stud-ies carried out so far, there is an indication of aninvolvement of geoenvironmental factors and thereforea multidisciplinary study has been initiated to find thepossible causative factors. Population screening andanalysing geoenvironmental samples in affected andnon-affected regions are currently being carried out.With systematic studies of populations for CKD, in-depth histological, biochemical investigations and siteinvestigations for geoenvironmental analysis, medicalscientists and geochemists would be in a better positionto contribute towards the origin of the CKD.
Use of Minerals and Metalsin Ayurvedic Medicine
The Ayurvedic (Ayu = life, Veda = science, in Sanskrit)system of medicine as practiced in Southeast Asia,mainly in India and Sri Lanka has been in existencesince the Vedic period or even earlier. This is theperiod in the second and first millennia of BCE (BeforeCommon Era) continuing up to the 6th century BCE asbased on literary evidence. The Ayurvedic system ofmedicine endeavours to create a balance between thephysical, mental and spiritual functions of the humantoday. The ancient Indians had a deep understanding ofboth the human body as well as the physical environ-ment and one could therefore say that the Science ofMedical Geology was, in a way, well known to theseancient Indians (Rao, 1993).
As far back as the 7th Century BC, minerals, includ-ing gems had been used in the treatment of diseasesand prior to this, herbal medicines were used amidstprayers and chanting of Mantras (Prakash, 1997). Thegems and other minerals found in ancient India hasbeen well documented (Mitra and Sayakhare, 1993).While the beneficial effects of minerals and metalswere known to the ancient practitioners of Ayurvedicmedicine, they were also well aware of their toxiceffects when used in excessive concentrations.
The preparations of the minerals and metals to beintroduced to the medicines were therefore, carefullycarried out using elaborate ancient chemical proce-dures as noted in the texts. The methodology, prepa-rations and extractions of metals from minerals isdescribed in the ancient test “Rasa Sastra” (Prakash,1997). From among the metals, mercury, zinc, copper,
tin, gold, silver, lead, iron, arsenic and antimony hadbeen used in the medicines.
Prakash (1997) describes the process of man-ufacturing metals into the digestible “bhasma” as(a) Satrapatana (metal extraction); (b) bhasmikarana(conversion to non-toxic chemical form); (c) other pro-cesses such as conversion to metallic chemicals usingsublimation, distillation, etc. The processing of miner-als including gems includes (a) selection and controlof mineral, (b) Sodhana or purification, (c) Marana orconversion to non-toxic powder, (d) Mardan or prepa-ration of intermediate mixture or paste, (e) Jarana oralchemical reactions to high temperature.
Interestingly, substances such as organic juice mix-tures, lime, water, urine, oil and herbal extracts wereused in the mineral and metal purification stages.Biotite in particular had been extensively used forthe extraction of iron, with cow urine being used toquench the biotite. Smelting had been done in a cru-cible at temperatures 1,450–1,500◦C. Likewise, copperhad been extracted from chalcopyrite. As describedby Jha (1990), the process consists of roasting thesulphides mineral to remove sulphur and conversionof the copper sulphides into copper oxide by the useof lime juice. The production of the gold bhasmais also an interesting procedure using organic bilejuices to form organometallic compounds (Parish andCottrill, 1987). The selection of the suitable miner-als for the extraction of metals was done by skilledworkers using the natural mineral properties of colour,streak, lustre, refraction, etc. Cow dung figured promi-nently as a fuel for the furnaces used for heating thematerials.
Medically, the benefits of the indigenous systemof medicine, Ayurveda, are well known to millionsof people in the Indian subcontinent. Among the dis-eases treated by Ayurveda are acne, allergies, asthma,anxiety, arthritis, chronic fatigue syndrome, colds, col-itis, depression, diabetes, flu, gastric ailments, heartdiseases, hypertension, problems of immunity, inflam-mation, insomnia, nervous disorders, obesity, skinproblems, and ulcers.
Copper is thought of as being beneficial to thespleen, liver and lymphatic system and is used to treatobesity, oedema and anaemia. Gold is used for thetreatment of heart ailments, epilepsy and hysteria andfor improving stamina (Lad, 1984). The metal con-tents in Ayurvedic medicines have been studied bySaper et al. (2004) and Dargan et al. (2008) and they

196 C.B. Dissanayake et al.
warn of the toxicity caused by the excess of metals inthe medicines. Shukhla and Jain (2006) discuss theseissues and they are of the opinion that even thoughthe actual metal contents may appear to be high, thenon-toxic chemical form of the metal in the Ayurvedicmedicine needs to be emphasized.
Future of Medical Geology in the IndianSubcontinent
Though at present, animal and human health problemsrelated to the anomalous association of toxic elementsin water, soils and sediments have been reported in alimited way, their exact inter-relationship needs to besystematically established. The awareness of certaindiseases of animal/human/plant life related to toxic-ity by As, F, Hg, etc. requires a coordinated approachbetween geological, medical and agronomic fraterni-ties. Geochemical mapping programs on a nationalscale (as envisaged in recent years) as an aid to mineralexploration, soil fertility assessment, human and ani-mal health, establishing valid environmental baselinedata and understanding the chemistry of our environ-ment are expected to guide in the detection of anoma-lies for various elements. Though the main objectiveis to identify new targets for mineral search (near sur-face and subsurface ore bodies) this database should beutilized to clearly delineate anomalies for As, F, Hg,etc. which may prove hazardous for human, animal, orplant life. The modern tools of scientific analysis willhelp in the detection of various elements at very lowlevels thus facilitating easy and accurate delineation ofgeochemical anomalies. Filtering of the anomaly mapsto generate toxic element distribution patterns will goa long way to guide in this important aspect of medicalgeology.
Toxic element maps will help in delineating regionalgeological and human factors, which can then berelated to prevalent health problems as well as antic-ipated diseases in different areas by integrating theinformation collected by geologists and health experts.A coordinated effort by geoscientists and medical sci-entists can lead to the identification of the causativefactors for health hazards and their geological locales(soil, surface and groundwater, alluvium, older sed-iments, etc.). This can then help in mitigating thehealth hazards by scientific use of preventive measures,
biogenetic and chemical treatments and any other mod-ern techniques. This alone will reduce the likely dan-gers being caused or which may be caused to the healthof human beings, plants and animals.
In view of the unique geological and climatic fea-tures of the Indian subcontinent with the associatedhealth problems medical geology will prove to be aninvaluable asset in all future health programs.
References
Acharyya SK, Chakravarti P, Lahiri S, Raymahashay BC, GuhaS, and Bhowmik A (1999a) Arsenic poisoning in the Gangadelta. Nature 401: 545.
Acharyya SK, Chakravarti P, Lahiri S, Mukherjee (1999b)Ganga-Bhagirathi delta development and arsenic toxic-ity in groundwater. International Conference on Man andEnvironment Silver Jubilee Celebration, Center for Study ofMan and Environment, Nov 99, Calcutta, 178–192.
Acharyya SK, Lahiri S, Raymahashay BC, Bhowmik A (2000)Arsenic toxicity of groundwater in parts of the Bengal basinin India and Bangladesh: The role of Quaternary stratig-raphy and Holocene sea-level fluctuation. Environ Geol39(10):1127–1137.
Acharyaa SK, Ashyiya ID, Pandey Y, Lahiri S, Khangan VW,Sarkar SK (2001) Arsenic Contamination in Groundwater inParts of Ambagarh Chowki – Korse Kohri belt (Dongargarh –Kotri Rift zone) Chattisgarh. GSI Sp Pub. No 65 (I): 8–18.
Bhattacharya P, Tandukar N, Neku A, Valero AA, MukherjeeAB, Jacks G(2003) Geogenic arsenic in groundwaters fromTerai Alluvial Plain of Nepal. J Phys IV France 107:173–176.
British Geological Survey (2001) Arsenic Contamination ofGroundwater in Bangladesh. BGS/DFID Technical ReportWC/00/19, Keyworth, UK.
Brouwer ID, DeBruin A, Backer-Dirks O, Hautvast JGAJ (1988)Unsuitability of World Health Organisation guidelines forfluoride concentrations in drinking water in Senegal. Lancet1:223–225.
Cameron J (2001) Is radiation an essential trace energy? Forumon Phys Soc 30(4):1–4.
Chakrabarti P (2004) Arsenic and mercury pollution- A geomed-ical perspective in the Indian context. Proceedings of theWorkshop on Medical Geology IGCP-454 held at Nagpur,India, 3–4 Feb.2004, GSI Sp. Pub. No 83, pp. 20–28.
Chakraborty AK, Saha KC (1987) Arsenical dermatosis fromtubewell water in West Bengal. Indian J Med Res 85:326–334.
Chandra S, Sharma R, Thergaonkar VP, Chaturvedi SK (1980)Determination of optimal fluoride concentration in drinkingwater in an area in India with dental fluorosis. CommunityDent Oral Epidemiol 8:92–96.
Dargan PI, Gawarammana IB, Archer JRH, House IM, Shaw D,Wood DM (2008) Heavy metal poisoning from Ayurvedictraditional medicines, an emerging problem? Int J EnvironHealth 2(3/4):463–474.
Some Aspects of the Medical Geology: India and Neighbouring Regions 197
Dhilon KS, Dhilon SK (1991) Selenium toxicity in soils, plantsand animals in some parts of Punjab, India. Int J EnvironStudies 37:15–24.
Dissanayake C (2006) Of stones and health: Medical geology inSri Lanka. Science 309:883–885.
Dissanayake CB, Chandrajith R (2007) Medical Geology in SriLanka. Environ Geochem Health 29(2):155–162.
Dissanayake CB, Weerasooriya SVR (1986) The Hydrogeo-chemical Atlas of Sri Lanka (103 pp). Colombo: NaturalResources Energy and Science Authority of Sri Lanka.
Edmunds WM, Smedley PL (2004) Fluoride in natural waters. InO Selinus (ed) Essentials of Medical Geology (pp. 301–329).Amsterdam: Elsevier.
Elahi S, Syed Z, Nagra S (2004) Status of iodine deficiency dis-orders as estimated by neonatal cord serum thyrotropin inLahore, Pakistan. Nutrient Research 24:1005–1010.
Facius R (2005) The paradox of radiation’s effects. Science 310(5752):1279.
Fordyce F, Johnson CC, Navaratne URB, Appleton JD,Dissanayake CB (1998) Studies of Selenium Geochemistryand Distribution in Relation to Iodine Deficiency Disordersin Sri Lanka. Tech Report WC/98/28, Overseas GeologySeries BGS-UK.
Fordyce F, Johnson CC, Navaratne URB, Appleton JD,Dissanayake CB (2000) Selenium and iodine in soil rice anddrinking water in relation to endemic goiter in Sri Lanka. SciTotal Environ 263:127–141.
Fyfe WS, Kronberg BI, Leonardos OH, Olorunfemi N (1983)Global tectonics and agriculture a geochemical perspective.Agric Ecosys Environ 9:383–399.
Gupta S, Godbole MM (2004) Endemic Fluorosis and ItsMedical Implications. Proceedings of the Workshop onMedical Geology IGCP-454 held at Nagpur, India, 3–4 Feb.2004, GSI Sp. Pub. No 83, pp. 41–45.
Gupta AB, Gupta SK (2004) Recent Advances in Fluorosisand Defluoridation with Special Referenc to Rajasthan.Proceedings of the Workshop on Medical Geology IGCP-454held at Nagpur, India, 3–4 Feb. 2004, GSI Sp. Pub. No 83,pp. 38–40.
Hall JE (2001) Radiation in life, World Nuclear Association,Introduction to Nuclear Energy, Education papers, 1–9 pp.
Hari Kumar R, Khandare AL, Siva Kumar B (2004) Vitamin–DDeficiency in Fluorosis Affected Village in Nawada Districtof Bihar State. Proceedings of the Workshop on MedicalGeology IGCP-454 held at Nagpur, India, 3–4 Feb.2004, GSISp Pub No. 83, pp. 177–181.
Huq SMI, Joardar JC, Parvin S, Correll R, Ravi Naidu R (2006)Arsenic Contamination in food-chain: Transfer of arsenicinto food materials through groundwater irrigation. J HealthPopul Nutr 24(3):305–316.
Ibrahim Y, Affan A, Bjorvatn K (1995) Prevalence of dental flu-orosis in Sudanese children from two villages with 0.25 and2.56 ppm fluoride in the drinking water. Int J Paediatr Dent5:223–229.
Iqbal SZ (2001) Arsenic contamination in Pakistan. Presentationat a UN-ESCAP meeting, Geology and Health: Solvingthe Arsenic Crisis in the Asia-Pacific Region; UNESCAP,Bangkok, May 2001
Jha CB (1990) Study of Satvapatana with Special Referenceto Abharaka and Makshika. Ph.D. Thesis, B.H University,Varanasi, India.
Karim MM (2000) Arsenic in groundwater and health problemsin Bangladesh. Water Research 34(1):304–310.
Kariyanna H (1987) Geological and geochemical environmentand causes of fluorosis: Possible treatment – A brief review,Paper presented at National Symposium on the Role of EarthScience in Environment held at IIT, Mumbai, pp. 113–122.
Kariyanna H, Sitaram GS (2007) Endemic diseases ofSouth India-A medical geology perspective. Appl Geochem9(1):142–149.
Kathren R (1991) Radioactivity in the Environment. USA:Taylor & Francis.
Khan AA, Whelton H, O’Mullane D (2002) A map of naturalfluoride in drinking water in Pakistan. Int Dent J:291–297.
Khan AA, Whelton H, O’Mullane D. (2004) Determiningthe optimal concentration of fluoride in drinking water inPakistan. Community Dent Oral Epidemiol 32:166–172.
Khan M (2008) Pakistan’s Iodine Deficiency Program; http://socialmarketing.wetpaint.com (assessed on 8-03-2009).
Korte NE (1991) Naturally occurring groundwater in the mid-western United States. Env Geol Water Sci 18:137–141.
Lad V (1984) Ayurveda – The Science of Healing (175 pp).India: Lotus Press.
Locker D (1999) Benefits and Risks of Water Fluoridation.Toronto: Ontario Ministry of Health.
Maharjan M, Watanabe C, Ahmad A, Ohtsuka R (2005) Arseniccontamination in drinking water and skin manifestations inlowland Nepal: the first community-based survey. Am J TropMed Hyg 73(2):477–479.
Mahmood SN, Naeem S, Siddiqui I, Khan FA (1998) Metalcontamination in groundwater of Korangi Indutrial Area,Karachi. J Chem Soc Pakistan 20:125–131.
Meenakhi, Maheswari, RC, Jain SK, Gupta A, (2004) Useof membrane technique for potable water production.Desalination 170(2):105–112.
Meenakshi, Maheswari RC (2006) Fluoride in drinking waterand its removal. J Hazardous Materials B137:456–463.
Mitra S, Sayakhare K (1993) Metals and Minerals in AncientIndia. Souvenir Volume of First National Workshop on ‘RasaSastra’.
Mohanty AK, Sengupta D, Das SK, Saha SK, Vans KV (2004a)Natural radioactivity and radiation exposure in the high back-ground area at Chhatrapur beach placer deposit of OrissaIndia. J Environ Radioact 75:15–33.
Mohanty AK, Sengupta D, Das SK, Vijayan V, Saha SK (2004b)Natural radioactivity in the newly discovered high back-ground radiation area on the eastern coast of Orissa India.Radiat Meas 38:156–165.
Mortazavi SMJ, Ghiassi-Nejad M, Ikushima T, Assaie R,Heidary A, Varzegar R, Zakeri F, Asghari K, Esmaili A(2003) Are the inhabitants of high background radiationareas of Ramsar more radioresistant? Iran J Radiol June:37–43.
NASC (2003) Nepal’s Interim Arsenic Policy PreparationReport, Report prepared for Nepal Arsenic SteeringCommittee. Nepal: DWSS.
Nell A, Sperr W (1994) Fluoridgehaltuntersuchung desTrinkwassers in Osterreich 1993 (Analysis of the fluoridecontent of drinking water in Austria 1993). Wien Klin,Wochenschr 106:608–614 (abstract).
Nickson RT, McArthur JM, Ravenscroft P, Burgess WG, AhmedKM (2000) Mechanism of arsenic release to groundwater,

198 C.B. Dissanayake et al.
Bangladesh and West Bengal. J Appl Geochem 15(4):403–413.
Padmasiri JP, Dissanayake CB (1995) A simple defluoridator forremoving excess fluorides from fluoride-rich drinking water.Int J Environ Health Res 5:153–160.
Panthi SR, Sharma S, Mishra AK (2006) Recent status ofarsenic contamination in groundwater of Nepal-a review.Katmandu University J Sci, Engineering Technol II(1):1–11.
Parish RV, Cottrill SM (1987) Medicinal gold compounds. GoldBulletin 20:1–12.
Paul AC, Pillai PMB, Haridasan PP, Radhakrishnan S,Krishnamony S (1998) Population exposure to airborne tho-rium at the high natural radiation areas in India. J EnvironRadioact 40(3):251–259.
Prakash B (1997) Use of metals in Ayurvedic Medicine. IndianJournal of History of Science 32 (1): 1–27
Prasad M, Srivatsava VC (2004) Goitre Endemicity in Deoriaand Gonda Districts of Uttar Pradesh and its GeologicalLinkage, Proceedings of the Workshop on Medical GeologyIGCP-454 held at Nagpur, India, 3–4 Feb. 2004, GSI Sp PubNo. 83, pp. 139–143.
Prasad S, Kar SK (2004) Geological control of selenium con-centration in the soil of Punjab plain, India, Proceedingsof the Workshop on Medical Geology IGCP-454 heldat Nagpur, India, 3–4 Feb.2004, GSI Sp Pub No. 83:pp. 306–313.
Price EW (1988) Non-filarial elephantiasis-confirmed as geo-chemical disease, and renamed podoconiosis. Ethiop Med J26:151–153.
Price EW (1990) Podoconiosis Non-Filarial Elephantiasis(144 pp). Oxford: Oxford University Press.
Price EW, Bailey D (1984) Environmental factors in the aeti-ology of endemic elephantiasis of the lower legs in tropicalAfrica. Tropical Geogr Med 36:1–5.
Rafique T, Naseem S, Bhanger MI, Usmani TH (2008)Fluoride ion contamination in the groundwater of Mithisub-district, the Thar desert, Pakistan. Environ Geol 56(2):317–326.
Rao SR, Murty KJR, Murty TVSD, Reddy SS (1974) CervicalSpondylosis in Fluorosis. Proceedings of the Symposium onFluorosis (Hyderabad) Paper 45, 441–448.
Rao KV, Murty BVSR (1974) On the Possible Roleof Defluoridating Agents in Treatment of Fluorosis.Proceedings of the Symposium on Fluorosis (Hyderabad)Paper 49, 471–475.
Rao TS (1993) ‘Atharva Veda’: An Ulterior Modern Science.Congress on Traditional Sciences and Technologies of India.8th Nov. Bombay.
Reddy DR (1985) Some observation on fluoride toxicity.Nimhans J 3:79–86.
Reddy DR, Rao CRM, Nayak RK, Prasad BCM (2004)Estimation of Trace Elements in Drinking Water Suppliesof Podili, Darsi and Kanigiri Areas of Andhra Pradesh.Proceedings of the Workshop on Medical Geology IGCP-454held at Nagpur, India, 3–4 Feb 2004, GSI Sp Pub. No. 83,pp. 384–390.
Reddy DR, Satyanarayana K, Khader SA, Narasinga RaoG, Pentaiah P (1974) Trial of Intravenous MagnesiumHydroxide in Fluorosis. Proceedings of the Symposium onfluorosis (Hyderabad) Paper 46, pp. 449–453.
Saper RB, Kales SN, Paquin J (2004) Heavy metal contentof Ayurvedic herbal medicine products. J Am Med Assoc292(23):2868–2873.
Saxena VP (2004) Radioactive Minerals, Radiations and HealthHazards. Proceedings of the Workshop on Medical GeologyIGCP-454 held at Nagpur, India, 3–4 Feb 2004, GSI Sp Pub.No. 83, pp. 46–58.
Shortt HE, Mcrobert GR, Barnard TW, Nayar ASM (1937)Endemic fluorosis in Madras presidency. Ind J Med Res25:553.
Shukhla K, Jain V (2006) Heavy Metals in AyurvedicFormulations – Safety Issue. The Pharmacological Magazine(Vol. 1, pp. 1–4). Raipur, India: Institute of Pharmacy, Pt.Ravishankar Shukla University.
Singh R, Maheswari RC (2001) Defluoridation of drinkingwater- a review. Ind J Environ Protec 21(11):983–991.
Sinha M, Saha AK (2004) A possible linkage of non-filarialelephantiasis “Podoconiosis” with geochemical factors,Bhiwapur area, Nagpur district, Maharashtra, Proceedingsof the Workshop on Medical Geology IGCP-454 heldat Nagpur, India, 3–4 Feb.2004, GSI Sp Pub. No. 83,pp. 391–396.
Smedley, PL (2003) Arsenic in groundwater – South and EastAsia. In AH Welch, KG Stollenwerk (eds) Arsenic in GroundWater: Geochemistry and Occurrence (pp. 179–209). Boston,MA: Kluwer Academic Publishers.
Smedley PL (2005) Arsenic occurrence in groundwater inSouth and East Asia. In K Kemper, K Minatullah (eds)Towards a More Effective Operational Response (pp. 20–98).Washington, DC: World Bank.
Smedley PL, Kinniburgh DG (2002) A review of the source,behaviour and distribution of arsenic in natural waters. ApplGeochem 17:517–568.
Susheela AK (1999) Fluorosis management program in India.Curr Sci 77(10):1250–1256.
UNICEF (2008) Arsenic Mitigation in Bangladesh, UNICEF,4 pp.
UNSCEAR (2000) Source and Effects of Ionizing Radiation.New York: United Nations Scientific Committee on the effectof atomic radiation, United Nations.
van Geen A, Zheng Y, Versteeg R, Stute M, Horneman A, DharR, Steckler M, Gelman A, Small C, Ahsan H, Graziano JH,Hussain I, Ahmed KM (2003) Spatial variability of arsenicin 6000 tube wells in a 25 km2 area of Bangladesh. WaterResources Res 39:1140.
Vinogradov AP (1959) The Geochemistry of Rare and DispersedChemical Elements in Soil (2nd ed.). (Eng. Translation).London: Chapman Hall.
Warnakulasuriya KA, Balasuriya S, Perera PA, Peiris LC (1992)Determining optimal concentrations of fluoride in drinkingwater for hot, dry climates – a case study in Sri Lanka.Community Dent Oral Epidemiol 20:364–367.
WHO (1994) Expert Committee on Oral Health Status andFluoride Use. Fluorides and Oral Health. Technical ReportSeries, 846 pp.
World Bank (2005) Towards a more effective operationalresponse arsenic contamination of groundwater in South andEast Asian Countries. Report No. 31303 Vol. II:219 pp.
Zietsman S (1991) Spatial variation of fluorosis and fluoride con-tent of water in an endemic area in Bophuthatswana. J DentAssoc S Afr 46:11–15.

Medical Geology in Africa
T.C. Davies
Abstract A large body of evidence points to signifi-cant health effects resulting from our interactions withthe physical environment and we continue to recog-nise connections between geological materials andprocesses and human and animal disease. In Africa,these relationships have been observed for many years,but only recently have any real attempts been madeto formalise their study. Africa is a continent with adiverse geography, characterised by a range of alti-tudes, a peculiar hydrological network created in partby the formation of the Great Rift Valley on the east-ern flank and arid lands typified by the Sahara and theMega Kalahari. Volcanic activity accompanying riftingand formation of most of the highlands and moun-tains has released various trace elements, mostly abovebackground levels, into the environment. A unique dis-tribution pattern of these elements has developed inmore recent geological times, following pronouncedseparation due to extreme tropical conditions of weath-ering, leaching and eluviation. It is therefore possibleto delineate large areas of the continent containingelement deficiencies or toxicities, which are closelyrelated to the local geology and/or geographical loca-tion. In a region where rural communities are stilllargely dependent on water and food sources that arelocally derived, the above setting provides an attractiveopportunity for studying the influence of geochemi-cal factors on the distribution of diseases in man andanimals. This pursuit constitutes a large part of thestudy of the rapidly emerging science of “medicalgeology”.
T.C. Davies (�)Department of Mining and Environmental Geology, Universityof Venda, Thohoyandou 0950, Limpopo Province, Republic ofSouth Africae-mail: [email protected]
According to this definition, the influence of theindoor environment, for example in factories andoffices, thus falls outside the scope of medical geologyand comes within the area of occupational medicine.To attain completeness in the present review, however,industrially derived exposure to known toxic elements(originating from mining or ore processing, such asare contained in mineral dust, for instance) is alsobriefly considered. Of the elements for which thereare proven or suspected direct causal relationships withman’s health, significant data exist for fluorine, iodine,silicon, arsenic and certain trace metals (both micronu-trients and potentially harmful elements). The readeris presented with a summary of available informa-tion including current hypotheses and an illustrationof why improved understanding of these relationships,based on interdisciplinary studies, would lead to betterdiagnoses and therapy.
Keywords Africa · Geochemical factors · Diseases ·Diagnoses · Therapy
Introduction
Medical geology is a rapidly emerging discipline thatexamines links between geological materials and pro-cesses and the incidence and spatial/temporal distribu-tion of human (and other animal) diseases. In Africahealth problems arising from our interactions withthe natural environment have been observed for manyyears. Indeed, many of the leading causes of death inAfrica, as in other developing regions of the world,could be linked to factors of the environment (Table 1).Pervasive dust from geogenic sources causes respi-ratory infections that include asthma; water pollution
199O. Selinus et al. (eds.), Medical Geology, International Year of Planet Earth,DOI 10.1007/978-90-481-3430-4_8, © Springer Science+Business Media B.V. 2010

200 T.C. Davies
Table 1 Top ten causes of death in low-income countries in2004
CausesDeaths inmillion
Percentageof deaths
Lower respiratory infections 2.94 11.2Coronary heart disease 2.47 9.4Diarrhoeal diseases 1.18 6.9HIV/AIDS 1.51 5.7Stroke and other cerebrovascular
diseases1.48 5.6
Chronic obstructive pulmonarydisease
0.94 3.6
Tuberculosis 0.91 3.5Neonatal infections 0.90 3.4Malaria 0.86 3.3Prematurity and low birth weight 0.84 3.2
Source: WHO (2008)
causes diarrhoeal diseases and other water-related ill-nesses; water hardness has been implicated in someforms of cardiovascular disorders (e.g. Leary, 1985;Derry et al., 1990). The crust of Africa has undergonewidespread episodes and styles of ancient mineralisa-tion dating as far back as the Archaean. Substantialquantities of elements, both nutritional and toxic, thatwere involved in ore forming processes, have beenreleased into the environment, either by later geolog-ical processes (e.g. weathering, leaching and eluvia-tion) or by mining and ore-processing operations, withsometimes severe public health consequences.
Again, volcanic activities (both ancient and modern)in tectonically active regions of the continent con-tinue to impact the lives of geographically marginalpopulations, e.g. the Lake Nyos disaster of 1986(Lanigan, 1989), the Mount Nyiragongo eruption of2003 (Allard et al., 2003). Geologically related healthproblems on the continent are also more keenly feltdue to the added stress of factors such as poverty andmalnutrition.
Additionally, while most of the population ofthe developed countries have diets that includefood sources from geographically diverse regions, inAfrican countries most of the population live closeto the land, relying on locally produced food andwater. Large tracts of cultivated land in Africa are arid,semi-arid or lack essential trace elements for healthyplant growth (Fig. 1). In these settings, therefore, theprobability of detecting relationships between the geo-logical environment and certain diseases is greatlyincreased.
Fig. 1 Africa vegetation overview. (Source: Xenakis (2004))
Although there is now a burgeoning interest in thisstudy, research on medical geology in Africa is stillconsidered to be in its infancy. A significant bodyof knowledge exists for the halogens (fluorine andiodine), arsenic, silicon and a small number of tracemetals (Table 2), but here too, data interpretation andidentification of meaningful correlations between geo-chemistry and epidemiology are hampered by the useof non-multidisciplinary approaches and lack of high-quality assurance data for pertinent elements in envi-ronmental samples (soils, plants, natural waters, etc).Nor are there enough trained personnel for these typesof analyses.
To draw tangible correlations, we need input froma battery of professionals including physicians, nutri-tionists, geochemists, botanists, biochemists, atmo-spheric chemists and others. We need to improve ourmedical record-keeping, sources from which reliableepidemiological data about incidence, prevalence andtrends in disease occurrence can be extracted. Weneed a more enhanced analytical capacity that wouldenable the contents of nutritional and potentially harm-ful elements (PHE) to be measured at the very lowconcentrations needed for making tangible correlationsbetween geology and environmental health conditions(Davies, 1996).

Medical Geology in Africa 201
Table 2 Some examples of proven or suspected correlations between geochemical factor and environmental disease/public healthcondition in Africa
Geochemical factorPossible healtheffects Distribution Mitigation Reference Remarks
Fluoride deficiency(less than0.5 mg l−1)
Dental caries anddental cavitiesmay occur; weakbones and teeth
A continent-wideproblem
Increased fluorideintake can beachieved bycontrolled directadditions todrinking water orto specific foods
Shike (2006);WHO (2004)
Adding fluorides tosoils thatproduce foodcrops isineffectivebecause fluoridesin the soil areinactivated anddo not usuallyfind their wayinto the foodchain
Fluoride toxicity(greater than1.5 mg l−1)
Mottling of teethand dentalfluorosis mayoccur;association withskeletal fluorosisat higherconcentrations
Populations livingwithin the Africanrift zones andassociatedvolcanic centres(Ethiopia, Kenya,Tanzania, etc);areas of crystallinebedrock (e.g.Ghana, parts ofTanzania andMalawi), andsome sedimentarybasins withhigh-fluoridegroundwaters (e.g.Senegal and partsof North Africa)
Defluoridation, forwhich there are anumber ofsimple andreadily availabletechniques, e.g.the Nalgondatechnique
Davies (2008);Edmunds (2008)
–
Iodine deficiency Iodine deficiencydisorders (IDD),namely goitreand its sequelae
These disorders arefound in almostevery countryright across thecontinent
Mainly fortificationof table salt byaddition ofpotassium iodateand use of oil
WHO (2007) A noteworthyachievement ofWHO is therecent reductionof IDD inAfrican countriesthat haveimplemented theuniversal saltiodisationprogramme
High arsenicconcentrations indomestic watersupply
Skin disorders andmalignancy;internal cancers
Populations living inthe vicinity ofmetal sulphidemines (e.g. SouthAfrica,Zimbabwe) andthose consumingarsenic-richgroundwatersfrom mineralisedProterozoicbasement rocks(e.g. BurkinaFaso)
Methods forremoval ofarsenic fromcontaminatedwater by use ofactivatedalumina, ironoxide adsorption,membrane andion exchange;chelation therapy
James et al. (2005);Smedley et al.(2007); WHO(2004)
The new maximumacceptableconcentration ofarsenic indrinking water is10 μg l−1 (WHO2004)

202 T.C. Davies
Table 2 (continued)
Geochemical factorPossible healtheffects Distribution Mitigation Reference Remarks
Seleniumdeficiency insoils and foodcrops
IDD and highdiffusion rate ofHIV-1 insouthern Africa
IDD incidence iscontinent-wide;HIV-1 incidencehighest insouthern Africa
Seleniumsupplementation;researchon-going on themost effectivemeans ofsupplementation
Taylor et al.(1997); Utiger(1998)
–
Othermicronutrientdeficiencies, e.g.iron, zinc,selenium,phosphorous,potassium,calcium andmanganese
Possible examplesare Mseleni jointdisease (MJD)and geophagy
The onlydocumented casesof MJD are foundin Maputaland inSouth Africa;geophagy ispracticedcontinent-wide
MJD is treated withnon-steroid-containing drugsand anti-inflammatorymedication;sometimes a totalhip replacementis needed
Ceruti et al. (2003);Abrahams(2005)
–
Mineral dust (i) Asbestosis Populations in andaround asbestosmining andprocessing plants,mainly in southernAfrica, e.g.Swaziland andZimbabwe(chrysotile); SouthAfrica (amphibolefibre)
– Mcculloch (2003) Most asbestosmines have nowclosed, but thelatency periodfor asbestosiscan be up to 40years
(ii) Silicosis; canpredispose totuberculosis
Found among minersand miningcommunities incountries wheremining andprocessing of oredepositsassociated withfree crystallinesilica take place,e.g. gold andgemstones (Ghanaand South Africa);diatomite(Algeria, Ethiopia,Kenya and SouthAfrica)
– Churchyard et al.(2004)
The occupationalexposure limit(OEL) for silicadust of 0.1 mgm−3 seems notto be protectiveagainst silicosis,as a large burdenof silicosisamong olderblack SouthAfrican goldminers is likelyto worsen
(iii) Coal worker’spneumoconiosis(CWP)
Coal-producingcountries ofAfrica, of whichSouth Africa is byfar the largest
– Naidoo et al.(2004)
–
Highenvironmentallevels of cerium
Endomyocardialfibrosis
The onlydocumented casesare found inUganda
– Masembe et al.(1999)
–

Medical Geology in Africa 203
Table 2 (continued)
Geochemical factorPossible healtheffects Distribution Mitigation Reference Remarks
Fine reddish-brownvolcanic soilshigh in elementssuch asberyllium andzirconium
Podoconiosis(non-filarialelephantiasis)
Endemic in Africa,especially amongpopulations livingin areas of heavyexposure tovolcanic clayminerals, such asaround the AfricanRift Valley
The mainpreventivemeasure iswearingprotective shoesfrom childhood
Gomes and Silva(2007)
–
Highenvironmentallevels of irontaken in asinorganic iron inthe diet
Siderosis (ironoverload); thedeposition ofiron occursmainly in theliver and reticu-loendothelialsystem
Most notableexample foundamong the SouthAfrican Bantuliving in areas ofiron-rich soils inJohannesburg
– Joffe (1964);Wapnick et al.(1971)
The iron-rich soilsare thought tohave beenformed by themetamorphismof ultrabasicrocks by theJohannesburgDome, a graniticintrusion lyingbetweenJohannesburgand Pretoria
Exposure to radongas and its decayproducts
Lung cancer inuranium minersand associatedcommunities
Uranium depositsoccur in severalcountries allaround thecontinent, butSouth Africa,Niger, Namibiaand Gabon havethe largestresources
Adherence to thecode of practiceand safety guidefor radiationprotection andradioactive wastemanagement inmining andmineralprocessing,including (i)hermetic sealingof galleries; (ii)elimination ofinfiltrating water;(iii) powerfulventilation and(iv) normal dustpreventiontechniques
Abdelouas (2006) –
However it may be, it is evident from the scenariodescribed that geochemists working in Africa are in aunique position to contribute to a better understand-ing of the role of minerals in diseases. With continuedimprovement in analytical protocol, characterisation ofnaturally occurring trace elements and toxic organiccompounds in groundwater will help to explain pat-terns of diseases such as various cancers, cardiovas-cular diseases and osteoporosis. In partnership withpublic health professionals, geoscientists working on
environmental health problems in Africa will begin tounderstand the role of earth materials and systems inthe spread of infectious diseases such as West Nilevirus fever.
This chapter sets out to summarise and syn-thesise the geomedical information so far avail-able for Africa, as well as emphasise the poten-tial effectiveness of more holistic, multi-disciplinary,multi-element studies in advancing this emergentfield.

204 T.C. Davies
Historical Development of MedicalGeology in Africa
Realisation of the links between the geological envi-ronment and disease grew rapidly in Africa since the1960s, at about the same time that the principles ofgeochemical exploration began to be incorporated inmineral exploration programmes across the continent.Originally referred to as “geomedicine” in the North,but now referred to as “medical geology” by inter-national consensus (Skinner and Berger, 2003), thefoundations of this science were firmly laid downby the Norwegian Academy of Sciences and Letters(NASL). Under the chairmanship of Prof. Jul Låg,NASL convened a symposium in Oslo in May 1978to provide a reciprocal orientation for and contactbetween researchers engaged in this field. The sympo-sium rightly concluded that scientists in other countrieswill, at a later stage, be interested in joining an organ-ised research effort.
Organised efforts aimed at clarifying relationshipsbetween geology and health in Africa have triggeredtwo exciting workshops in the last two decades. Thefirst real attempt to coordinate research in this fieldtook place in Nairobi in 1999, bringing together over60 interdisciplinary scientists from the region, whoreached the conclusion that considerable knowledgegaps still exist in the identification and quantificationof the mineral and chemical forms of certain nutri-tional and toxic trace elements entering water and thefood chain (Davies and Schlüter, 2002). It was noted bythe Nairobi Workshop that natural trace element abun-dances can vary by up to three orders of magnitudethrough a combination of geological processes carriedto extremes in tropical Africa (weathering, leaching,eluviation), as well as through other environmental fac-tors. Despite the obvious need for detailed knowledge,in whatever country or locality within Africa, up to 80percent of the continent’s land surface is still unknownin terms of relevant geochemical data (Davies, 2008).Perhaps, the first stage in bridging these knowledgegaps is the production of geochemical maps not onlyof those chemical elements of known biological sig-nificance but also of PHEs and those with potentialeconomic value.
Another outcome of this first workshop was the con-stitution of the “East and Southern Africa Associationof Medical Geology” (ESAAMEG) as a branch of the
“International Working Group on Medical Geology”(IWGMG), which was itself established in Athens inJune 1997. This has now been reconstituted to the“International Medical Geology Association” (IMGA,www.medicalgeology.org).
The second African workshop, “GEOMED 2001”,was held in Lusaka, Zambia, in 2001 (Cerutiet al., 2001). A main part of that meeting wasa short course and seminar, titled “Metals, Healthand the Environment”, held under the auspices ofthe International Geological Correlation Programme(IGCP), Project 454: Medical Geology. An extensivesyllabus of about 300 pages was produced, coveringmany aspects of the subject. Following the short courseand seminar was a 1-day workshop on “The Role ofGeomedicine in the 21st Century”, at which manyresearchers presented ongoing work in several Africancountries (Ceruti et al., 2001). A massive stride hasbeen made since, in explaining a number of revelationscoming out of these workshops, though admittedlymore needs to be done.
The phenomenal growth in interest in medical geol-ogy has continued since these two workshops (e g.Finkelman et al., 2007; Selinus et al., 2008), withmany geology departments around the continent nowconcluding plans for the inclusion of the subject intheir postgraduate curricula. This is a welcome sign onboth sides of what has often been an unbridged chasmbetween geology and health in Africa.
Current Status of Research on MedicalGeology in Africa
This section attempts to summarise the present stateof knowledge based on work done and studies thatare ongoing in Africa on medical geology. The needto address the types of data needed for drawing upmeaningful correlations between patterns of trace ele-ment distribution and environmental diseases in humidtropical settings is strongly emphasised throughout.
Nutrient Deficiencies and Excesses
Fluorine
It is now well established that fluoride mineralisationtakes place mostly in geologically unstable areas and

Medical Geology in Africa 205
has been associated with rifting and rise of fluorinefrom the lower crust or the upper mantle. Accordingly,most of the cases of environmental health conditionsinvolving dietary fluorine imbalance are reported forpopulations living within the African rift zones andassociated volcanic centres (Davies, 2008). Excessivefluorine (mainly in the form of fluoride) is present inparts of the hydrological system and the biosphere,including soils and food crops.
In the East African Rift Valley, for instance, fluo-ride in groundwater, lakes and rivers is derived mainlyfrom mixing with fluids from hot springs and volcanicgases, which can contain concentrations of severaltens to hundreds of milligrams per litre. The high-est natural fluoride concentration ever found in water,2,800 mg l−1 (Bakshi, 1974), was in Lake Nakuru inthe Kenya Rift Valley.
However, the occurrence of high-fluoride ground-waters (and health problems) has also been reportedin areas of crystalline bedrock (especially granite) andsedimentary basins (Edmunds, 2008). Examples ofsuch granitic areas can be found in Ghana, parts ofTanzania and Malawi. Sedimentary basins with high-fluoride groundwaters occur in Senegal and parts ofNorth Africa (Edmunds, 2008).
Fluoride in minor amounts (around 1.3 ppm indrinking water) reduces dental decay and enhances theproper development of the bone (Table 2). A simi-lar level of fluoride intake may also be beneficial toanimals. When the amount of fluoride consumed iseither too low or much too high, undesirable physi-ological consequences appear, such as dental caries,mottled staining of the teeth and malformed bonestructure in man and animals (Fendall and Grounds,1965).
Health conditions arising from nutritional fluo-ride imbalance have been reported from severalother African countries, including Ethiopia, Tanzania,Nigeria and Zimbabwe. Though most reported casesof fluorosis are among residents of high-fluoride areas,there exist a significant number of individuals aroundthe Rift Valley zones and other volcanic centres withfluorosis from exposure to relatively low levels of flu-oride (Manji et al., 1986). An explanation for thiswould almost certainly invoke interplay of metabolicand nutritional factors. Essentially, the metabolic argu-ment for the epidemiology of fluorosis is based on thechemistry of the fluoride ion, which largely determinesits bioavailability in mammals. But this question, and
that of whether fluorosis is the cause or the result ofmetabolic dysfunction, is still open-ended and couldform the basis of research that would greatly benefitfrom a complete geochemical baseline map of fluorinefor Africa.
Iodine
Iodine was the first trace element to be recognised asessential for humans. It is required by adult mammalsfor proper functioning of the thyroid gland (Laurberg,2009). Trace amounts of the order of 0.0004 weightpercent must be established and maintained through-out the life of the animal as a result of ingestingsmall quantities of the element from drinking waterand various feed inputs.
Volcanic emanations and sea salt are among themost important associations of iodine, but additionalsources are formation waters and fluid inclusions.Traverses from the Moroccan coast, for instance, showthat strong soil-iodine enrichment is limited to about100–200 km from the coast (Johnson, 2003). However,some would say that the link between iodine in soilsand distance from the coast is not that strong (see e.g.Fuge, 2005).
Africa is characterised by huge differences in ele-vation, the continent having undergone a complex tec-tonic episode. The mountainous areas thus constitutea barrier to the transport of iodine to central continen-tal areas. The leaching of iodine originally supplied byvolcanic activity, from acid mineralised soils, is alsoan important determinant of the element’s geographi-cal distribution. Thus, the most notorious goitre areasin Africa are the lee sides of high-altitude areas suchas the Kerio district in the Kenya Rift Valley, whichrecords the highest goitre prevalence in the region (72percent of children have goitre; Hanegraaf and McGill,1974) and where the soil has been depleted by leachingby heavy iodine-poor rain.
Many of the iodine-deficient regions of the worldhave already been identified and the widespread occur-rence of goitre and related conditions firmly estab-lished. These are collectively referred to as iodinedeficiency disorders (IDD) and have been recog-nised as serious problems in several areas in Africa.Consequently, much work has been carried out onthe aetiology and geographical distribution of thesediseases within the region.

206 T.C. Davies
Although Africa ranks third among regions ofthe world most affected by IDD, after the WesternPacific and South-East Asia, the toll of IDD in Africahas been enormous. The estimated population at riskis 220 million, of whom 95 million are goitrous(WHO/UNICEF/ICCIDD, 1993). But, thanks to acombination of efforts over the last two decades, thespectre of IDD in Africa is now diminishing. Manyrecent articles have already looked at the advancesmade in the elimination of IDD in Africa (e.g. Kavishe,1996; Davies, 1994a). As advocated by the 1990“World Summit for Children”, the 1992 “InternationalConference on the Assistance to the African Child”(ICAAC) and the 1992 “Global Plan of Action ofthe International Conference on Nutrition” (ICN), theestablishment of universal salt iodisation programmeshas been by far the leading approach, although in somecountries targeted iodised oil and iodisation of waterhave been used as short-term measures. These effortshave resulted in what is generally considered to be asuccess story. But, there is another side of the coin!
Expanding the Spectrum of IDD
There is now ample evidence to suggest that iodinesupplementation programmes in Africa, however sys-tematic and far-reaching, are unlikely to produce afoolproof solution, as they have done in other partsof the world. Among possible militating factors tosalt iodisation programmes are the potential role of“goitrogens”, substances present in the African diet(Davies, 1994a) and the development of “thyrotoxi-cosis”, from application of excessive levels of iodinesupplementation (Bourdoux et al., 1996).
The Possible Role of Goitrogens
The physiological and biochemical relationshipsbetween iodine and goitrogens in relation to thyroidfunction are still unclear. However, the goitrogeniceffect of vegetables such as Brassica (e.g. kale or“sukumawiki” (in Kenya), cabbage, radish, broccoli)has now been well established (Michajlovskij, 1964)and could be due to a depression of the thyroid hor-mone formation, which causes a decrease in the cir-culating thyroid hormone. This leads to increased thy-roid stimulating hormone (TSH) secretion and thyroidenlargement as a compensating mechanism.
Other goitrogens that may directly or indirectlyaccount for some of the goitre cases in Africa includethe univalent complex ions, thiocyanate (SCN−) andfluoroborate, (BF4
−), whose ionic sizes are similarto that of iodide; these may competitively inhibitthe active transport of iodide both in the thyroidand in the extrathyroidal iodine-concentrating tissues(Davies, 1994a).
Thiocyanate is present in cassava (Manihot utilis-sima), which is consumed in large quantities by severalAfrican tribes. The goitrogenic activity of thiocyanatefound in cassava has been demonstrated on severaloccasions, such as on the Idjwi Island, Lake Kivu,Republic of Congo, where cassava is a common foodstaple (Thilly et al., 1977). It decreases the penetra-tion of iodide into the thyroid (Delange et al., 1973).It is therefore possible that if consumers of cassavaor kale are living in marginally iodine-deficient envi-ronments, or have congenital biosynthetic defects intheir thyroids, these goitrogens may play a role in thedevelopment of goitre.
Similarly, the fluoroborate ion is thought to bepresent in natural waters in parts of the African RiftValley (Davies, 1994b). This univalent ion has a simi-lar size to that of iodide and its goitrogenic propertieshave been reported by Langer and Greer (1977). If theimportance of the BF4
− species in quantitative termscan be established, it will have far-reaching implica-tions in the discussion of goitre endemia in the RiftValley areas of Africa.
Thyrotoxicosis
The term “thyrotoxicosis” refers to the hypermetabolicclinical syndrome resulting from serum elevations inthyroid hormone levels, specifically free thyroxine(T4), triiodothyroxine (T3) or both. Hyperthyroidismis a type of thyrotoxicosis in which accelerated thy-roid hormone biosynthesis and secretion by the thy-roid gland produce thyrotoxicosis. However, hyper-thyroidism and thyrotoxicosis are not synonymous. InAfrica, most cases of thyrotoxicosis can be ascribedto hyperthyroidism from the application of too-highlevels of iodine supplementation.
In Kivu, Zaire (now the Democratic Republic ofCongo, DRC), clinical providers noted thyrotoxico-sis in 191 individuals with goitre after introduction ofiodised salt (as much as 148 mg kg−1 iodine) in an areawith previously severe iodine deficiency (Bourdoux

Medical Geology in Africa 207
et al., 1996). In these individuals, the urinary iodinelevel increased from a median of 0.13 to 1.89 mcmoll−1, but only a few of these exhibited any minor clin-ical signs. Sometimes, the individuals needed antithy-roid drug treatment. Iodine-induced thyrotoxicosis hadalso occurred in Zimbabwe in a moderate to severeiodine-deficient area after introduction of iodised salt(30–90 mg iodine kg−1) (Bourdoux et al., 1996). Itis often difficult to clinically recognise the sometimeslife-threatening thyrotoxicosis.
No attentive consideration of local nutritional con-ditions, eating habits and medical assistance is appliedwhen deciding the increase in the salt iodisation level.Iodine prophylaxis programmes in Africa sometimesapply a salt iodisation level 5–10 times greater thanthat applied in Europe, i.e. 20–40 mg kg−1 (EuSalt,2009). The effects of high levels of iodine supplemen-tation have never been tested and are likely unsafe forsome segments of the treated population. Internationalagencies may also need to implement monitoring pro-cedures as well as reconsider the salt iodisation levelrecommended for African countries.
Selenium as a Co-factor in IDD
Selenium, as selenocysteine, is an integral componentof two important enzymes – glutathione peroxidaseand type I 5′-iodothyronine deiodinase – that arepresent in many tissues, including the thyroid glandwhere they play an indispensable role in thyroid hor-mone synthesis. Glutathione peroxidase catalyses thebreakdown of hydrogen peroxide, thereby protectingagainst oxidative damage. Iodothyronine deiodinasecatalyses the deiodination of thyroxine to triiodothy-ronine, a more potent thyroid hormone. Iodine isnot an integral component of any enzyme, but it isan integral component of thyroxine and triiodothy-ronine. Concurrent selenium and iodine deficienciesmay result in a modified thyroid hormone metabolismin animals (Arthur et al., 1987; Arthur et al., 1991;Vanderpas et al., 1990). Selenium and iodine are thuslinked biochemically because both are involved inthyroid hormone production.
What then are the clinical consequences of seleniumdeficiency? Though suspected correlations abound(hypothyroid cretinism, suppressed growth factors injuveniles, increased diffusion rate of HIV-1), conclu-sive evidence for linking specific disorders with sele-nium deficiency is lacking for Africa. Although this
essential trace element is a highly probable co-factorin myxoedematous cretinism (Goyens et al., 1987;Thilly et al., 1993), the administration of selenium toiodine-deficient and selenium-deficient schoolchildrenand myxoedematous cretins in the DRC resulted in adecompensation of the thyroid hormone synthesis thatwas particularly apparent in the cretin subjects (Thillyet al., 1991; Vanderpas et al., 1993).
Selenium and the Diffusion Rate of HIV-1 inSouthern Africa
There are many reasons why dietary selenium may beinfluencing the diffusion of HIV-1 in southern Africa.Selenium in vitro blocks HIV-1 replication (Hori et al.,1997). It is also clear that selenium plays key roles inthe operation of the immune system, as mentioned pre-viously (Section “Selenium as a Co-factor in IDD”).Taylor and his co-workers (Taylor, 1997; Taylor et al.,1997) have demonstrated that HIV-1 encodes for theselenium-containing protein, glutathione peroxidase.This means that the virus cannot be replicated with-out competing with its host for this element. However,there appears to be a dietary selenium threshold. Aboveit, the human immune system is effective enough toavoid HIV-1 infection. Below it, the immune system isso weakened by selenium deficiency that on exposure,infection is possible, if not probable.
The Role of Nutrient Deficiency in EndemicOsteoarthritis (Mseleni Joint Disease)
Unusually high incidences of dwarfism and endemicosteoarthritis, termed Mseleni joint disease (MJD),afflict up to 25 percent of the local population of adultsliving on the sandy coastal plain of Maputaland inSouth Africa (Ceruti et al., 2003). Maputaland, withan area of about 50 km by 100 km, is located on thenortheast corner of South Africa.
MJD is a rare disease which begins with stiffnessand pain in the joints and progresses to varying degreesof disability, with some of the afflicted requiring aidin walking and others without the ability to walk atall. The disease is typified by a combination of mul-tiple epiphyseal dysplasia, polyarticular osteoarthritisand protrusion acetabuli, with earlier stages of MJDdisplaying osteoarthritis and advanced cases typified

208 T.C. Davies
by severe joint surface irregularity. Medical studieshave, until recently, been unable to determine conclu-sively the aetiology of MJD or the dwarfism, but workat the University of Cape Town (Ceruti et al., 1999)has indicated the possible role of environmental fac-tors, in particular extremely variable concentrationsof available nutrient elements, as causative factors.This suggests the possibility of the existence of iso-lated pockets of land where deficiencies (e.g. availablesoil calcium, potassium, phosphorus, zinc and cop-per) may be acute. Plant growth trials in the Mseleniarea, using a subtractive element technique, confirmedthese deficiencies in maize (Zea mays) for phospho-rus, potassium, calcium, magnesium, copper and zinc(Ceruti et al., 2003).
Environmental Exposure to Cerium andEndomyocardial Fibrosis
In the late 1980s, medical workers from India noteda strong link between endomyocardial fibrosis (EMF),a fatal coronary heart condition in children through-out the tropics, and enhanced environmental levels ofcerium, related to the presence of monazite sands inKerala province (Smith, 2000).
In a collaborative study, Ugandan scientists fromMulago Hospital, the Institute for Child Health,Makerere University, and colleagues from the BritishGeological Survey have investigated whether similarenvironmental exposure could account for the occur-rence of endemic EMF in Uganda (Masembe et al.,1999). Case–control studies performed at MulagoHospital, Kampala, indicate a high incidence of EMFamong patients from Mukono and Luwero districtsover the past 40 years. Model calculations based on thedata collected in this work (Smith et al., 1998) indicatethat the most important exposure route is through theingestion of soil-bound cerium as a result of either theinadvertent oral ingestion of soil or the habitual eatingof soil (geophagy).
Is Nutrient Deficiency a Causal Factor forGeophagy?
Geophagy – the involuntary or sometimes the delib-erate eating of earth – is extremely common amongtraditional African societies and has been recognised
since ancient times. Among the many groups activein geophagy research in Africa are the School ofPhysical and Mineral Sciences, University of Limpopo(South Africa), researching under a sub-component ofIGCP project 545: “Clays and Clay Minerals of Africa:Geneses and Palaeoenvironmental Considerations,Mineralogy, Geochemistry and Applications” (Ekosseand de Jager, 2008) and the Department of Geologyand Mining, University of Jos, Nigeria (Davies et al.,2008a, 2008b). Building on earlier work by the BritishGeological Survey in Uganda (Smith, 2000), the workof these groups is directed specifically at (a) increasingour understanding of the risks and benefits associatedwith soil ingestion (deliberate and/or inadvertent); (b)determining the bioavailability of a particular contam-inative source, so that this is taken into account duringsite-specific risk assessment; and (c) determining howthe practice can be carried out in a safe way.
The reasons why soils are being deliberatelyconsumed can be difficult to establish, but knowncausative explanations include the use of soil duringfamine, as a food detoxifier, as a pharmaceutical andfor neuropsychiatric and psychological (comforting)reasons (Abrahams, 2005). It remains a matter of con-jecture whether ingestion of soil actually satisfies anutritional deficiency. Nevertheless, soils do have thepotential to supply mineral nutrients, especially iron,where the ingestion of soil can account for a majorproportion of the recommended daily intake.
Typical quantities of soil eaten by practisinggeophagics in Kenya in the order of 20 g per dayhave been recorded (Smith, 2000). Although the eatingof such large quantities of soil increases exposure toessential trace nutrients, it also significantly increasesexposure to potentially toxic trace elements and bio-logical pathogens. The former is particularly likelyin mineralised areas, associated with mineral extrac-tion, or polluted urban environments, where levels ofpotentially toxic trace elements are high.
Geogenic Dust
Worries about African population exposed to partic-ulate matter (PM) in ambient air, especially in cities,continue to grow. While the impact of dust from indus-trial processes on human health is well recognisedand widely regulated, less attention has been paid to

Medical Geology in Africa 209
dust from geogenic sources and to less visually obvi-ous finer particulates. This is probably partly becauseresearch is in many respects at an early stage andbecause of practical difficulties of observing, moni-toring and sampling diffuse aerosols in the complexlymoving atmospheric column (B. Marker, personalcommunication).
It is thought that the greater proportion of particulateload in the African urban atmosphere is from geogenicsources (e.g. Davies, 2008), and these may cause moretoxicity problems in humans than dust componentsfrom other sources. Known sources of atmosphericdust in Africa include the following: (i) Harmattandust sometimes tinged with radioactive particles (suchas dust blown from Niger Republic across northernNigeria); (ii) mines and quarries; (iii) treatment plants;(iv) solid waste disposal sites; (v) unpaved roads; (vi)disturbed land; (vii) construction sites (viii) sawdustand (ix) particulates from all types of combustion.
Exposed soils are eroded by the wind and wind-borne particles, wherever these are exposed for anylength of time in dry conditions, giving rise to aerosolscontaining dust ranging from very fine particulates tosilt grade material. Once in the air-stream, dust can becarried for very long distances before it is deposited onland or in water. For instance, it is now well establishedthat dust from North Africa reaches the Americasand northern Europe depending on weather conditions(B. Marker, personal communication).
Dust also arises from point sources such as erupt-ing volcanoes, fires and events such as atmosphericnuclear tests. Deposits of material that have not beenstabilised, for instance, tips and lagoons containingmineral wastes, in dry conditions, also give rise to dust.
Most roads in rural environments in Africa aremade of “murram” (untarred or non-tarmac); hence,dust admixed with toxic metal particulates (e.g. leadand arsenic) as well as other pathogens are freelyinhaled, causing asthma and other respiratory disor-ders (Table 1). We also know that long-term exposureto airborne particulate matter for years or decadesis associated with elevated total, cardiovascular andinfant mortality (e.g. Delfino et al., 2005). Dust stormsfrom the Sahara also come with toxic inorganic par-ticulates and other pathogens, which could stressthe respiratory system when inhaled (Policard andCollet, 1952; Prospero, 1999). Therefore, the controlof dust and reduction of risks is of importance tosociety.
Asbestos
Asbestos is the general industrial term encom-passing six different natural fibrous silicates.Amosite [grunerite, (Fe,Mg)7Si8O22(OH)2], croci-dolite [riebeckite, Na2(Fe,Mg)3Fe2Si8O22(OH)2],tremolite [Ca2Mg5Si8O22OH2], anthophyllite[(Mg,Fe)7Si8O22(OH)2] and actinolite [Ca2(Fe,Mg)5
Si8O22(OH)2], all belonging to the amphibole group,while chrysotile [(Mg6(Si4O10)(OH)8] is a serpentine.
These minerals were exploited largely in the pastcentury in industrial applications because of their ver-satile and unique properties. Applications include theiruse in insulation, pipe lagging, roofing and brake lin-ings. Nowadays, asbestos is associated with its potencyto cause asbestosis, a debilitating and often fatallung disease, and malignancies such as lung cancerand pleural mesothelioma, which may appear sev-eral decades after exposure. It is noteworthy that astrong synergistic effect between cigarette smoke andasbestos has been proven for lung cancer but not formesothelioma (Kane, 1996).
Asbestos refinement and use is being restricted pro-gressively or banned by several countries, includingthe entire European Union, which banned asbestos usein 2005. Conversely, despite all available evidence onthe occupational hazards related to asbestos exposure,asbestos is still being produced and used in Africancountries as well as a number of other developingcountries (Vogel, 2005).
The mining of amphibole asbestos is almost com-pletely confined to South Africa. Crocidolite andamosite, locally abundant and mined asbestos miner-als, occur in metamorphosed Precambrian sedimentarystrata (banded ironstones) in the Transvaal Supergroup.About 75 percent of the asbestos mineral production isused in the manufacture of asbestos-containing cementpipe.
Silica
Silicosis, the most ancient occupational disease, is notcaused by all types of silica, but only by a subset ofits crystalline polymorphs, namely quartz, tridymiteand cristobalite. The high-pressure forms, coesite andstishovite, are less toxic and may even be inert. Lungcancer (IARC, 1997) and some autoimmune diseaseshave also been associated with exposure to silica. In

210 T.C. Davies
spite of a massive body of work since the early 1950son the pathogenicity of silica-related diseases, there isno consensus on the mechanism of action of crystallinesilica particles at the molecular level.
Silicon is a component of diatomite (diatomaceousearth), a deposit mined and processed in Algeria,Ethiopia, Kenya and South Africa. It is used in fil-ters, as a filler and sometimes as a mild abrasive. Thedust from the processing and handling of diatomite isvery dangerous to humans and can cause serious andfatal illness, not only in those with heavy occupationalexposure but also in people who live near the indus-trial site or even simply in the same household with anexposed worker. During calcining in particular, highlyreactive, free crystalline silica (tridymite, cristobalite)is produced, resulting in silicosis. The illnesses includenodular pulmonary fibrosis (silicosis), secondary heartdisease, lung cancer and bronchitis. The general termto describe lung disease due to inhalation of inorganicdusts is “pneumoconiosis”, defined as the accumula-tion of dust in the lungs and the tissue reactions to itspresence.
Other Mineral Dusts
Other mineral dusts that may cause adverse pul-monary responses but have not been officially reportedas human carcinogens include coal (coal workers’pneumoconiosis (CWP), reviewed recently in Huanget al., 2006), kaolinite, talc (talcosis) and iron oxides(siderosis). The aetiology of diseases that follow theinhalation of such minerals is often not well defined,because epidemiological studies are complicated byco-exposure to other minerals such as quartz andasbestos (Ross et al., 1993).
Volcanoes produce nano- to micron-sized particles,including crystalline silica, that may have toxic poten-tial. The particles of volcanic ash are fragmented uponeruption, producing fresh, reactive surfaces that are notoxidised – a rarity in the natural environment.
Potentially Harmful Elements (PHEs)from Mining Operations
Arsenic
Large tracts of the African Precambrian (espe-cially the greenstone belts) contain metal sulphide
mineralisation and have released considerable quan-tities of arsenic into aquifers and the surficialenvironment not only through the natural pro-cesses of weathering, erosion and transportation,but also through mining and processing of metalsulphide ores. For instance, arsenic in groundwa-ter from mineralised Proterozoic basement rocksof Burkina Faso has directly affected the qual-ity of drinking water (Smedley et al., 2007).Gold mining (e.g. in Ghana and South Africa),metal sulphide mining (e.g. in South Africa andZimbabwe) and coal mining (e.g. in South Africa)have also released considerable amounts of arsenicinto waterways mainly through acid mine drainage(AMD).
Arsenic, a metalloid, is not an abundant elementin the Earth’s crust, only approximately 2 mg kg−1.It has a strong association with sulphide-bearing min-erals. Oxidative weathering, such as is common inhumid tropical environments in Africa, results in for-mation of arsenite [As(III)] and arsenate [As(IV)]. pHand Eh are the dominant controls on mobility, speci-ation and solubility. Sorption by oxides and hydrox-ides of iron, aluminium and manganese limits arsenicconcentration and controls its mobility and bioac-cessibility. Recent studies suggest that some organicforms are highly toxic. However, in spite of decadesof research on arsenic chemistry, detailed mecha-nisms of the element’s toxicity are still not yet wellunderstood.
Human exposure occurs primarily through inges-tion of water and food, although airborne particu-lates containing arsenic may be locally important.Environmental arsenic exposure is a causal factorin human carcinogenesis and numerous non-cancerhealth disorders. Chronic exposure symptoms mostcommonly include skin disorders such as hyperker-atosis, hyperpigmentation, peripheral arteriosclerosis(“black foot disease”) and skin malignancies; otherailments like internal cancers may also occur. All ofthese disorders are known in populations consumingwater with 100–1,000 μg l−1 arsenic (Reeder et al.,2006). The present WHO guideline value for arsenic is10 μg l−1 (WHO, 2004) although many countries con-tinue to use the pre-1993 value of 50 μg l−1 (WHO,1993) as their national standard. In reality, however, thelevel at which toxicity symptoms appear may dependon other factors as well, such as the presence of the ele-ment selenium, co-exposure to which is held to reducetoxicity of arsenic.

Medical Geology in Africa 211
Arsenic in Mine Waters
A major concern confronting land management agen-cies in Africa is the generation of arsenic-rich aciddrainage from both abandoned and active metalliferousmines and from naturally occurring sulphide-bearinggeological units.
Extreme examples with drainage acidities (belowpH 1.0) are relatively rare, but AMD with a pH of0.52 was encountered at Iron Duke mine near Mazowe,Zimbabwe, in February 1994 during an investigationof the environmental geochemistry of mine waters inthe Harare, Shamva and Midlands greenstone beltsof Zimbabwe. Arsenic values of up to 72 mg l−1,recorded at Iron Duke, constitute the highest dissolvedarsenic concentration published to date for mine watersworldwide (Williams and Smith, 2000). This site pro-vides a valuable opportunity for studies of acutely acidmine waters and may assist in validating and refiningmodels for such systems.
Mine waste remediation, extraction techniques,including buffering methods to control AMD (e.g.Breward and Williams, 1994), and modelling havebeen undertaken by many and are amply described inthe literature.
Mercury Exposure in Small-Scale Gold Panning
Mercury is released into the environment during arti-sanal gold mining in a variety of ways. When it isused to amalgamate gold, some escape directly intowater bodies as elemental mercury droplets or as coat-ings of mercury adsorbed onto sediment grains. Themercury that forms the amalgam with gold is emittedinto the atmosphere when the amalgam is heated – if afume hood or retort is used. Naturally occurring mer-cury in soils and sediments that are eroded by sluicingand dredging becomes remobilised and bioavailablein receiving waters (Telmer and Veiga, 2008). Wherea combination of cyanide and mercury is used, theformation of water-soluble cyano-mercuric complexesenhances transport and bioavailability. However, thefate of mercury in any of these processes as well asthe interactions of cyanide and mercury are still poorlyunderstood (Telmer et al., 2006).
Increasing health problems associated with mercurycontamination, as a result of its use as an amalgamagent by small-scale gold miners, have been reportedin many African countries during the past two decades
(Ghana (Tschakert and Singha, 2007); Kenya (Ogolaet al., 2002); South Africa (Eisler, 2003); Zimbabwe(Bose-O’Reilly et al., 2008); etc). Approximately 2tons of mercury is used for each ton of gold recovered.Less efficient operations may use even more. Withglobal gold production by small-scale miners now ata rate of thousands of tons per annum, the design andimplementation of appropriate methods for monitoringmercury contamination in areas of alluvial gold min-ing are urgently required. The growth of independentsmall-scale gold mining provides employment andgenerates wealth, but economic gains are frequentlyoffset by health degradation and the destruction of vitalindustries such as fishing.
In Africa, problems due to mercury and arsenic con-tamination associated with gold mining are a result oflack of environmental concern (or lack of enforcementof regulations) and, in some cases, inappropriate min-ing and operating practices. Geochemical surveys priorto operation and close monitoring during mining cou-pled with good planning and working procedures canminimise contamination, while remediation schemescan also be devised and monitored by the applicationof sound geochemical science (Breward and Williams,1994).
Radiation and Radon Gas
Radon is a colourless, radioactive gas formed natu-rally by the radioactive decay of uranium that occursin all rocks and soils. There is a direct link betweenthe levels of radon generated at the surface andthe underlying rocks and soils. Radon generated inshales and granite can reach the surface via faults andfractures.
Variations in radon levels are evident between dif-ferent parts of the African continent and beyond.Country average for Egypt is given as 9 Bq m−3
(UNSCEAR, 2000) but can be much higher in the otheruranium-producing countries.
South Africa has Africa’s largest identified uraniumresources (currently estimated at over 241,000 metrictons; Mudd and Diesendorf, 2008), followed by Niger,Namibia and Gabon. Uranium has also been foundin Algeria, Botswana, the Central African Republic,Chad, the DRC, Egypt, Guinea, Lesotho, Madagascar,Malawi, Mali, Mauritania, Morocco, Nigeria, Somalia,Tanzania, Togo and Zambia. However, under cur-rent economic conditions, it is unlikely that any of

212 T.C. Davies
these deposits will be fully exploited in the immediatefuture.
Uranium occurs in a variety of ores, often inassociation with other minerals such as gold, phos-phate and copper, and may be mined by open-cast,underground or in situ leach methods, dependingon the circumstances. South Africa produces ura-nium concentrates as a by-product of gold miningand copper mining and possesses uranium conver-sion and enrichment facilities. Uranium is chiefly usedas a fuel in nuclear reactors for the production ofelectricity.
The processes involved in radon gas generation andits movement to the surface and into buildings arecomplex. These include interactions between rocks,soils and groundwaters. It is important to determinethe natural levels of radon produced from rocks andsoils as these will provide essential data indicatingthe potential for high levels of radon entering build-ings. Transport of radon-containing soil air into a homecan be through cracks in solid floors and walls belowconstruction level; through gaps in suspended con-crete and timber floors and around service pipes; andthrough crawl spaces, cavities in walls, constructionjoints and small cracks or pores in hollow-block walls.The design, construction and ventilation of the homeaffect indoor radon levels.
The principal basis for present concern about radonand its decay products focuses on exposures resultingfrom industrial processes – primarily the mining andmilling of uranium – that increase the accessibility ofradon to the outdoor atmosphere or to indoor environ-ments, leading to the incidence of lung cancer. A largebody of epidemiological data have accumulated overseveral decades relating to studies of the incidence oflung cancer in miners, and risk estimates have beenderived from this data (National Academy of Sciences(NAS) 1998), but most of these studies have involvedsubjects outside Africa.
An ongoing activity is the investigation of healthimpacts of uranium exploration in the Poli regionof northern Cameroon (F. Toteu, personal communi-cation). These deposits, hosted by Late Proterozoicgranitoid, are being explored by a private company. Noinformation is yet available on the possible impact thatexploration activities may be having on the health ofnearby residents, but reports abound of miscarriages inpregnancy and growth defects in children that may bedue to uranium exposure.
Similarly, the environmental and health impactsfrom exploration and mining activities in two ura-nium prospects in Zambia are currently being assessed(O. Sikazwe, personal communication). One occur-rence of uranium mineralisation is in southern Zambiaand is located within Karoo sandstones, but here,exploration work is not yet at an advanced stage.The second uranium mineralisation is in north-westernZambia, where uranium is associated with copper; andhere, mining is ongoing.
Kaposi’s Sarcoma and Podoconiosis
The clinical picture described by Kaposi in 1872 (citedby England, 1961) is now quite familiar. Sarcoma andpodoconiosis remained a curiosity of dermatology formany years in Europe and America, until about half acentury ago, when it became evident that it was a com-mon tumour of the skin throughout Africa, especiallyin the moist tropical regions, and comparatively rare inthe drier sandy areas. Ninety percent of cases occur inmales and the lesions are most commonly found in theextremities, especially on the feet and legs.
Many theories of the aetiology of endemic Kaposi’ssarcoma (KS) have been advanced, among which is ageographically determined environmental factor. Thisnodular condition is believed to arise in the lym-phatic endothelium and is associated with chroniclymphoedema. As such, KS bears a superficial resem-blance to podoconiosis (non-filarial elephantiasis). Thegeographical prevalence of both conditions in highlandareas of moderate rainfall in proximity to volcanoessuggests a pathogenetic relationship to exposure tovolcanic soils. The geographical endemicity of KSin the Congo–Nile watershed (western branch of theEast African Rift System) and Nigeria–Cameroon bor-der (Benue Trough and Cameroon Volcanic Line) isparticularly striking (Ziegler, 1993).
Podoconiosis too is largely endemic in Africa, espe-cially among populations living in areas of heavy expo-sure to volcanic clay minerals (Price, 1990). Theseiron-oxide-rich kaolinitic soils overlie regions of alka-line basalt associated with volcanism of the majorAfrican intercontinental rift systems. Podoconiosis ischaracterised microscopically by neo-volcanic sub-micron mineral particles (mainly aluminium, silicon,titanium and iron) stored in the phagolysosomes of

Medical Geology in Africa 213
Fig. 2 A view of the lower left leg and foot of a patient withpodoconiosis. There is thick diffuse hyperkeratotic swelling con-fined to the lowest part of the leg, ankle and foot. The calf abovethe knee was almost normal. (Source: Itakura, 1995)
macrophages within lymphoid tissues of the lowerlimbs. This pathogenesis is consistent with the theorythat ultra-fine clay minerals from the soil are absorbedthrough the feet (Gomes and Silva, 2007). The result-ing chronic lymphatic irritation, inflammation and col-lagenesis cause obstruction and lymphoedema of theaffected limb (Fig. 2). The geographical proximity ofendemic KS to areas containing volcanic clay miner-als, its lympho-endothelial origin, predilection for thefeet and legs and its prevalence among rural dwellingpeasants and cultivators suggest a common aetiol-ogy, namely chronic dermal exposure to volcanic clayminerals.
Trace Elements in Soils and Plants –Implications for Wildlife Nutrition
The soils of Africa are complex. A unique combinationof pedogenetic and hydrological factors brings aboutmineral imbalances that are of consequence to crop,livestock and wildlife development. The soil representsa likely candidate as an environmental reservoir formany reasons, such as its potential role in the trans-mission of “prion” diseases (Mathiason et al., 2006;Schramm et al., 2006).
In the area of the Kenya Rift Valley around thecity of Nakuru (east of Lake Victoria), mineral prob-lems in soils have led to copper deficiency in wheat(Pinkerton, 1967) and copper and cobalt deficienciesin cattle (Hudson, 1944; Howard, 1970). At LakeNakuru National Park in Kenya, the elevated pH of
soils has been linked with the high molybdenum con-tent of several plant species (Maskall and Thornton,1992). Molybdenum-induced copper deficiency hasbeen reported in other wild animals including Grant’sgazelle (Gazelle granti) from the Kenya Rift Valley;in this case the plant molybdenum content rangedfrom 0.5 to 5.6 μg−1 (Hedger et al., 1964). Cases of“molybdenosis” (molybdenum toxicity), a disease inruminants (stiffness of legs, loss of hair) feeding onforage containing more than 10–20 mg kg−1 molyb-denum, have been reported from Kenya (McDowell,1992).
Low concentrations of copper and cobalt havealso been reported in soils developed on volcanicash and lake sediments in the Kenya Rift Valley(e.g. Chamberlin, 1959; Nyandat and Ochieng, 1976;Maskall and Thornton, 1991). Ruminants requirecobalt in order to synthesise vitamin B12. Cobaltdeficiency arises on soils of diverse geological ori-gin and climatic conditions, including coarse volcanicsoils around the town of Nakuru in the Kenya RiftValley, where the disease is referred to by the localname of “nakuruitis”. The most appropriate scientificdesignation for the condition is enzootic marasmus(McDowell, 1992). In this region, sheep and cattlewere unable to thrive unless they were periodicallymoved to “healthy” areas. Ruminants remaining inthe deficiency areas stopped eating, became weak andemaciated and usually died. Because diseased ani-mals could be cured by a change to healthy ground,it was rightly assumed that this was a nutritional defi-ciency disease. Cobalt deficiency in ruminants can becured or prevented by treatment of the soils or pas-tures with cobalt-containing fertilisers or by direct oraladministration of cobalt to the animal (Underwood,1981).
Working in an area of north-eastern Zimbabwe,Ndiweni and Finch (1995) have provided evidence tosuggest that supplementation of cattle with vitamin Eand selenium may optimise resistance to “mastitis” (aninflammation of the udder in cattle, with implicationsfor reproductive health), by enhancing the functions ofresident macrophage and lymphocyte populations.
Perhaps, worth mentioning too is the dispropor-tionate growth of body parts observed in juve-nile members of a population around the “coltan”(columbite/tantalite) mines in the Republic of Rwanda(W. Pohl, personal communication). A connection withexcess of some toxic element from coltan mining

214 T.C. Davies
getting into the food chain via the soil is suspected,but conclusive evidence is still lacking.
Africa Geochemical Database
For medical geology to succeed in Africa, an obviousfirst step would be the preparation of a high-qualitygeochemical database for the entire region, prefer-ably in conformity with guidelines laid down in the“Global Geochemical Baselines Initiative” (Darnleyet al., 1995).
At present, complete geochemical databases do notexist for any of the countries of Africa. Some formof conventional geochemical coverage (i.e. samplescollected and analysed by various methods in a lab-oratory) exists for a percentage of the surface areaof some countries such as Uganda and South Africa.However, there is considerable variation between datasets because sample media, methods of sample collec-tion and preparation, extraction and analytical tech-niques and levels of quality control were generallydecided according to perceived mineral explorationtargets of each country and a desire to minimise costs.As a result of this diversity, numerical values can onlybe compared within areas where consistent methodsand standards have been applied. Variation betweendata sets with respect to the assemblage of elementsalso makes it difficult to compare such data sets oruse them as a basis for studying processes operating inthe region’s surficial environment. In addition, few ele-ments of environmental importance have been deter-mined in past survey work. To find ways to overcomethese problems, or at least prevent their perpetuationinto the future, is one major reason for advocating acomprehensive database (Plant et al., 2000).
Data obtained from a geochemical database forAfrica will have a range of environmental applica-tions: they will provide quantitative information onnatural levels of the chemical elements over differentgeological environments in the region, which may beused to assess the effects of past, present and futurehuman influence; they will have an important contribu-tion to make in land use planning issues; the data willalso have applications in mineral exploration, resourceevaluation, geological mapping and research into thefundamental processes of crustal evolution and oreformation. In addition, such a compilation will facil-itate the modelling of environmental systems linked
to issues of formulating environmental managementand legislative control mechanisms (Plant et al., 2000).Most importantly, an African geochemical databasewill be invaluable in identifying areas where deficien-cies or potentially toxic levels of chemical elementsmay present risk to human and animal health or tolivestock or crops. It can be used for tracing exposureroutes for toxicants in soils and groundwater.
Work on the construction of a formal geochemi-cal database for Nigeria started off in 2008, led bythe Nigeria Geological Survey Agency in collabora-tion with the British Geological Survey (C. Johnson,personal communication). The main source of finan-cial support for this project is the World Bank.Reconnaissance surveys in 2008 were followed by astrategic workshop in Kaduna, northern Nigeria, inJanuary 2009. Preparation for detailed drainage andsoil surveys is in progress.
Future Perspectives
Rapid development of medical geology followed con-cretisation and formalisation of the study by theInternational Medical Geology Association (IMGA)meeting in Uppsala in 2000, when it was agreedby international consensus that the former name of“geomedicine” be replaced by “medical geology”, aterm that was deemed more likely to gain accep-tance by the medical profession. Several short courseshave since been organised worldwide and a vari-ety of awareness campaigns mounted to promote thestudy.
The countries of Africa are also experiencing anunprecedented growth in this field. Because of thecontinent’s unique geo-environmental situation, it isconsidered likely that the discovery of remarkable cor-relations between Earth materials and processes andhuman health will continue into the next decades,as research activities in this emerging area of studyproliferate. Modern geo-analytical techniques offerpromise of developing innovative solutions to preventor minimise exposure to potentially deleterious naturalmaterials and geological processes.
Today, an important question lies in how we canmap geochemical information and correlate this withenvironmental epidemiology and disease registry data.Present medical registry records are still inadequate

Medical Geology in Africa 215
in most African countries, bedevilling efforts in pro-viding evidence required for substantiating suspectedcorrelations. But as efforts in medical record-keepingimprove across the continent, research in medical geol-ogy would in turn also gather pace, spurning theemergence of further exciting revelations in this field.One of the most challenging problems for the futurewill be the understanding and characterising of theenvironmental and natural factors that contribute toemerging and re-emerging infectious diseases.
In the above-stated context, it is thought that Africawill benefit immensely from a complete geochemicalmap of the entire region for all non-gaseous elementsand other chemical parameters in pertinent environ-mental media, based on agreed guidelines. For now,although some geochemical mapping is being under-taken by geological surveys of some African countries,few are using the internationally agreed standard meth-ods as set forth in the “Global Geochemical Baselines”initiative (Darnley et al., 1995). Countries such asSierra Leone, Tanzania and Uganda simply lack theanalytical infrastructure and funding for such a high-precision and systematic exercise. As such, earliergeochemical surveys show many possible intrinsic dif-ferences in data sets for any given element, whichhinder or do not justify the assembly of most exist-ing data into broader regional compilations. However,as analytical capacity continues to improve and col-laborative links strengthened with high-performanceregional laboratories, these gaps will soon begin todisappear.
Monitoring of the levels and compositions of dustemissions is now widely undertaken in relation toindustry, for instance within factories, processingplants and mining and quarrying operations (Fanninget al., 2009). However, even in these relatively con-strained settings, it has, until recently, been challengingto then discriminate between particles from differentsources within mixtures, emissions or deposited dust.This remains an important area for future research.
What do we know about CWP in coal miningregions of Africa (especially South Africa)? Naidooet al. (2004) have examined radiographic outcomesamong South African coal miners, but much moreinformation is needed to understand the bigger pic-ture, such as whether or not some physico-chemicalparameters play a role in the observed differences inthe prevalence of CWP among the various coal minesin Africa.
Is there a tangible correlation between dust inhala-tion and the incidence of meningitis in Africa(A. Konare, personal communication)? Satellites arenow being used to monitor the movement of huge dustclouds moving across oceans that carry pathogenicmicrobes, kill coral and cause asthma. However, animportant additional step in elucidating the role ofnatural dust as a contributor of disease would be tofacilitate cooperation among medical professionals,geologists, climatologists and microbiologists. Thiswould assist in the characterisation of the proper-ties of geogenic particulates, their dispersal and thetoxicological pathways of infectious agents they maytransport.
In spite of the large-scale monitoring by remotesensing in tracking the dispersal of dust clouds, it is notgenerally possible, at present, to investigate the three-dimensional structure and variations within dust cloudsto any extent. Here is scope for more work at boththe local and regional levels to improve research tech-niques. Also, few studies have been published on thehealth effects caused by long-term inhalation of dustsgenerated in desert areas.
During small-scale gold mining activities in Africa,miners often use a combination of cyanide with mer-cury to amalgamate the gold. Cyanide dissolves notonly gold but also mercury, forming cyano-mercurycomplexes. These complexes are easily mobilised byrain and often, due to poor containment practices,quickly reach stream waters. It is expected that water-soluble mercury cyanide is either more bioavailableor easier to be biomethylated than elemental mercury(Telmer and Veiga, 2008). This possibility deservesmore attention, but indirect evidence collected bythe “Global Mercury Project Team” in Zimbabwe,Indonesia and Brazil (Telmer and Veiga, 2008) sug-gests this is the case.
Conclusion
Africa represents a natural field laboratory for studiesin medical geology, since the majority of its peo-ple live close to the land, depending on food anddrinking water sources in their immediate vicinity.Again, extreme conditions of weathering, leaching andeluviation in a humid, tropical setting have led toa marked redistribution of elements, both nutritional

216 T.C. Davies
and toxic, in the surficial environment, carving outdistinct zones of element excesses and deficiencies.These factors enhance the credibility of correlationsdrawn between certain environmental diseases andthe biochemical, biophysical or geochemical inter-actions within the bedrock–groundwater–soil–foodcrop–human/animal tissue continuum.
Drawing up such correlations, however, relies onthe availability of very high-quality analytical datafor element concentrations and their distribution inenvironmental samples. The content of certain criti-cal elements (sometimes down to microgram per litrelevel) needs to be accurately known. But the need forquality assurance still bedevils analytical work in manyAfrican geochemical laboratories. There are too fewtechnicians with sufficient expertise for proper instal-lation, maintenance and repair of today’s analyticalinstruments.
One important consequence of the rather poor geo-chemical database is the fact that many environmentaldiseases that result from excess or deficiency of certainkey elements are poorly diagnosed. The productionof a high-precision geochemical map of Africa wouldbe a cost-effective method of indirectly investigatingthe chemical composition of crops; and rural com-munities in Africa will offer a particularly valuableopportunity for examining the relationship betweengeochemistry and health. Such baseline data wouldaid in the understanding of the hydrological, chemicaland biological processes that determine the behaviourof chemical elements in this part of the Earth’s sur-face, in relation to how they may affect the life ofman and animals. Significant correlations could thenbe conveyed to the medical profession, to heightenawareness of the huge potential significance that fac-tors of the geo-environment can have on disease cau-sation and thereby serve to broaden the diagnosticspectrum.
References
Abdelouas A (2006) Uranium tailings: Geochemistry, mineral-ogy and environmental impact. ELEMENTS 2(6):335–341,Mineralogical Society of America.
Abrahams PW (2005) Geophagy and the involuntary ingestionof soil. In O Selinus, B Alloway, JA Centeno, RB Finkelman,R Fuge, U Lindh, P Smedley (eds) Essentials of Medical
Geology (Chapter 17, pp. 435–458). Amsterdam: ElsevierAcademic Press.
Allard P, Baxter P, Halbwachs M, Kasareka M, KomorowskiJC, Joron JL (2003) The most destructive effusive eruptionin modern history: Nyiragongo 2003. Geophys Res Abstr5:11970–11970.
Arthur JR, Nicol F, Boyne R, Allen KGJ, Hayes JD, BeckettGJ (1987) Old and new roles for selenium. In DD Hemphill(ed) Trace Substances in Environmental Health (Vol. XXI,pp. 487–498). Columbia, MO: University of Missouri Press.
Arthur JR, Nicol F, Beckett G (1991) The role of selenium inthyroid hormone metabolism and effects of selenium defi-ciency on thyroid hormone and iodine metabolism. BiolTrace Element Res 33:37–43.
Bakshi AK (1974) Dental conditions and dental health. In LCVogel, AS Müller, RS Odingo, Z Onyango, A de Geus (eds)Health and Disease in Kenya (pp. 519–522). Nairobi, Kenya:East African Literature Bureau.
Bose-O’Reilly S, Lettmeier B, Gothe RM, Beinhoff C, SiebertU, Drasch G (2008) Mercury as a serious health hazard forchildren in gold mining areas. Environ Res 107(1):89–97.
Bourdoux PP, Ermans AM, Mukalay wa Mukalay A, FilettiS, Vigneri R (1996) Iodine-induced thyrotoxicosis in Kivu,Zaire (now Democratic Republic of the Congo). Lancet 347(9000):552–553.
Breward N, Williams M (1994) Arsenic and mercury pollutionin gold mining. Mining Environ Manag:25–27.
Ceruti PO, Davies TC, Selinus O (2001) GEOMED 2001.Medical geology: The African perspective. EPISODES24(4):268–270.
Ceruti PO, Fey M, Pooley J (2003) Soil nutrient deficien-cies (Mseleni Joint Disease) and dwarfism in Maputaland,South Africa. In HCW Skinner, AR Berger (eds) Geologyand Health: Closing the Gap (Chapter 24, pp. 151–154).New York: Oxford University Press.
Ceruti P, Pooley J, Fey M (1999) Do Environmental FactorsPlay a Role in the Aetiology of Mseleni Joint Disease? ProcXV Meeting Int Epidem Assoc II: 355. Florence, Italy, 31August–04 September.
Chamberlin GT (1959) Trace elements in some East Africansoils and plants: 1. Cobalt, beryllium, lead, nickel and zinc.East African Agric J 25:12–125.
Churchyard GJ, Ehrlich R, teWaterNaude JM, Pemba L, DekkerK, Vermeijs M, White N, Myers J (2004) Silicosis preva-lence and exposure-response relations in South African goldminers. Occup Environ Med 61:811–816.
Darnley AG, Björklung A, Bølviken B et al. (1995) AGlobal Geochemical Database for Environmental andResource Management: Recommendations for InternationalGeochemical Mapping. Earth Science Rep 19. Paris:UNESCO Publishing.
Davies TC (1994a) Combating iodine deficiency disorders inKenya: The need for a multidisciplinary approach. Int JEnviron Health Res 4:236–243.
Davies TC (1994b) The construction of regional maps show-ing the distribution of iodine in natural waters of Kenya inrelation to the epidemiology of iodine deficiency disorders.Project proposal document; UNICEF Kenya Country Office,12 p. Kenya: University of Nairobi.
Davies TC (1996) Geomedicine in Kenya. J Africa Earth Sci23(4):577–591.

Medical Geology in Africa 217
Davies TC (2008) Environmental health impacts of East AfricanRift volcanism. Environ Geochem Health 30(4):325–338.
Davies TC. Schlüter T (2002) Current status of research ingeomedicine in East and Southern Africa. Environ GeochemHealth 24:99–102.
Davies TC, Solomon AO, Lar P, Abrahams PW (2008a) A socio-economic study of geophagy in the Jos Plateau, Nigeria.Abstract Vol. 38. First International Conference on Humanand Enzootic Geophagia in Southern Africa, Bloemfontein,South Africa, 22–24 October, 2008; 64 p.
Davies TC, Solomon AO, Lar P, Abrahams PW (2008b)Mineralogy and geochemistry of geophagic materials con-sumed in the Jos Plateau, Nigeria. Abstract Vol. 27. FirstInternational Conference on Human and Enzootic Geophagiain Southern Africa, Bloemfontein, South Africa, 22–24October, 2008; 64 p.
Delange F, van der Velden M, Ermans AM (1973) Evidence ofan antithyroid action of cassava in man and animals. Chroniccassava toxicity. Int Res Centre Monograph IDRC-OIO C.London.
Delfino R, Sioutas C, Malik S (2005) Potential role of ultra-fine particles in associations between airborne particle massand cardiovascular health. Environ Health Perspect 113:934–946.
Derry CW, Bourne DE, Sayed AR (1990) The relationshipbetween the hardness of treated water and cardiovascular dis-ease mortality in South African urban areas. South AfricanMed J 77(10):522–524.
Edmunds WM (2008) Groundwater in Africa: Palaeowater, cli-mate and modern recharge. In S Adelana, A MacDonald,T Alemayehu, C Tindimugaya (eds) Applied GroundwaterStudies in Africa (pp. 305–322). London: Taylor andFrancis.
Eisler R (2003) Health risks of gold miners: A synoptic review.Environ Geochem Health 25(3):325–345.
Ekosse G-I, de Jager L (2008) Introduction. Abstract Vol.1–8, First International Conference on Human and EnzooticGeophagia in Southern Africa, Bloemfontein, South Africa,22–24 October, 2008; 64 p.
England NWJ (1961) Histological determination of three casesof Kaposi’s sarcoma in West Africans: One showing metas-tasis in an inguinal node. Trans Roy Soc Trop Med Hygiene55:301.
European Salt Producers’ Association (EuSalt) (2009) EuSaltPosition Paper on Fortification. Brussels, 5 p. Also at:www.eusalt.com.
Fanning EW, Froines JR, Utell MJ, Lippmann M, Oberdörster G,Frampton M, Godleski J, Larson TV (2009) Particulate mat-ter (PM) research centres (1999–2005) and the role of inter-disciplinary centre-based research. Environ Health Perspect117(2):167–174.
Fendall NRE, Grounds TG (1965) The incidence and epidemi-ology of disease in Kenya, Part I: Some diseases of socialsignificance. J Trop Med Hygiene 68:77–84.
Finkelman RB, Selinus O, Centeno JA (eds) (2007) Medicalgeology in developing countries, Part I. Special Issue,Environ Geochem Health 29(2): 81–167.
Fuge R (2005) Soils and iodine deficiency. In O Selinus,B Alloway, JA Centeno, RB Finkelman, R Fuge, U Lindh, PSmedley (eds) Essentials of Medical Geology (pp. 417–433).Amsterdam: Elsevier Academic Press.
Gomes CSF, Silva JBP (2007) Minerals and clay minerals inmedical geology. Appl Clay Sci 36(1–3):4–21.
Goyens P, Golstein J, Nsombola B, Vis H, Dumont JE(1987) Selenium deficiency as a possible co-factor in thepathogenesis of myxoedematous endemic cretinism. ActaEndocrinol 114:497–502.
Hanegraaf TAC, McGill PE (1974) Thyroid diseases: Populationbased studies of endemic goiter. In LC Vogel, AS Müller,RS Odingo, A de Geus(eds) Health and Disease in Kenya(pp. 395–403). Nairobi, Kenya: East Africa LiteratureBureau.
Hedger RS, Howard DA, Burdin M.L (1964) The occurrence ingoats and sheep of a disease closely similar to swayback. VetRecord 76:493–497.
Hori K, Hatfield D, Mandarelli F, Lee BJ, Clouse KA (1997)Selenium supplementation suppresses tumour necrosis fac-tor alpha induced human immunodeficiency virus type 1replication in vitro. AIDS Res. Hum Retroviruses 13(15):1325–1332.
Howard DA (1970) The effects of copper and cobalt treatmenton the weight gains and blood constituents of cattle in Kenya.Vet Record 87:771–774.
Hudson JR (1944) Notes on animal diseases, 13: Deficiencydiseases. East African Agric J 10:51–55.
Huang X, Gordon T, Rom WN, Finkelman RB (2006)Interaction of iron and calcium minerals in coals and theirroles in coal dust-induced health and environmental prob-lems. In N Sahai, MAA Schoonen (eds) Medical Mineralogyand Geochemistry, Reviews in Mineralogy & Geochemistry(Vol. 64, pp. 153–178). Virginia: The Mineralogical Societyof America.
IARC (International Agency for Research on Cancer) (1997)Silica. IARC Monograph 68 on the Evaluation of theCarcinogenic Risk of Chemicals to Humans. Geneva: WHO.
Itakura H (1995) Idiopathic elephantiasis. In W Doerr, G Seifert(eds) Tropical Pathology (2nd ed., pp. 1328–1331). Berlin,Heidelberg, New York: Springer.
James W, Berger T, Elston D (2005) Andrews’ Diseases of theSkin: Clinical Dermatology, (10th ed.). Oxford, UK: WBSaunders.
Joffe N (1964) Siderosis in the Bantu. Brit J Radiol 37:200–209.Johnson CC (2003) The Geochemistry of Iodine and Its
Application to Environmental Strategies for Reducingthe Risks from Iodine Deficiency Disorders (IDD).Report CR/03/057 N. British Geological Survey, Keyworth,Nottingham, UK, 54 p.
Kane AB (1996) Mechanisms of mineral fibre carcinogene-sis. In AB Kane, P Boffetta, R Saracci, JD Wilburn (eds)Mechanisms of Fibre Carcinogenesis (Vol. 140, pp. 11–35).Int Agency Res Cancer Sci Publ.
Kavishe FP (1996) Can Africa Meet the Goal ofEliminating Iodine-Deficiency Disorders by the Year2000? www.unu.edu/unupress/foo/8F173e/8F173E0n.htmDownloaded 01 June, 2009.
Langer P, Greer MA (1977) Antithyroid Substances andNaturally Occurring Goitrogens. S Karger, AG Basel, 178 p.
Lanigan C (1989) Lake Nyos disaster. Brit Med J299(6692):183.
Laurberg P (2009) Thyroid function: Thyroid hormones, iodineand the brain – an important concern. Nature Revs Endocrin5(9):475–476.

218 T.C. Davies
Leary WP (1985) Content of magnesium in drinking water anddeaths from ischemic heart disease in white South Africans.Magnesium 5:150–153.
Manji F, Baelum V, Fejeskov O (1986) Dental fluorosis in anarea of Kenya with 2 ppm fluoride in drinking water. J DentRes 65:659–662.
Maskall JE, Thornton I (1991) Trace element geochemistry ofsoils and plants in Kenyan conservation areas and impli-cations for wildlife nutrition. Environ Geochem Health 13:93–107.
Maskall JE, Thornton I (1992) Geochemistry and wildlife nutri-tion: Factors affecting trace element uptake from soils toplants. Trace Subst Environ Health XXV:217–232.
Masembe V, Mayanya-Kizza H, Freers J, Smith B, HamptonC, Tiberindwa JV, Rutakingirwa M, Chenery S, Cook J,Styles M, Tomkins A, Brown C (1999) Low environmentalcerium and high magnesium: Are they likely risk factors forendomyocardial fibrosis in Uganda? Abstract Volume, Eastand Southern Africa Regional Workshop on Geomedicine,Nairobi, Kenya, p. 13.
Mathiason CK, Powers JG, Dahmes SJ, Osborn DA, Miller KV,Warren RJ, Mason GL, Hays SA, Hayes-Klug J, Seelig DM,Wild MA, Wolfe LL, Spraker TR, Miller MW, Sigurdson CJ,Telling GC, Hoover EA (2006) Infectious prions in the salivaand blood of deer with chronic wasting disease. Science314:133–136.
Mcculloch J (2003) Asbestos mining in southern Africa. Int JOccup Environ Health 9:230–235.
McDowell LR (1992) Cobalt. In LR McDowell (ed) Mineralsin animal and human nutrition (pp. 205–223). New York:Academy Press.
Michajlovskij N (1964) Nahrungsmittel als Rhodanidträger. In JPodoba, P Langer (eds) Naturally Occurring Goitrogens andThyroid Function (pp. 38–48). Bratislava: Slovak Academyof Sciences.
Mudd GM, Diesendorf M (2008) Sustainability of uraniummining and milling: towards quantifying resources and eco-efficiency. Environ Sci Technol 42:2624–2630.
Naidoo RN, Robins TG, Solomon A, White N, Franzblau A(2004) Radiographic outcomes among South African coalminers. Int Arch Occup Environ Health 77:471–481.
NAS (National Academy of Sciences) (1998) Health Effects ofExposure to Radon (BEIRVI). Washington, DC: NationalAcademy of Sciences.
Ndiweni N, Finch JM (1995) Effects of in vitro supplementa-tion of bovine mammary gland macrophages and peripheralblood lymphocytes with α-tocopherol and sodium selenite:implications for udder defences. Vet Immunol Immunopath47(1–2):111–121.
Nyandat NN, Ochieng PN (1976) Copper content and availabil-ity of arable and range areas of Kenya. East African Agric J42:1–7.
Ogola JS, Mitullah WV, Omulo MA (2002) Impact of gold min-ing on the environment and human health: A case studyin the Migori gold belt, Kenya. Environ Geochem Health24:141–158.
Pinkerton A (1967) Copper deficiency of wheat in the rift valley,Kenya. J Soil Sci 18:18–26.
Plant J, Smith D, Smith B, Williams L (2000) Environmentalgeochemistry at the global scale. J Geol Soc Lond 157:837–849.
Policard A, Collet A (1952) Deposition of silicosis dust in thelungs of the inhabitants of the Saharan regions. Arch IndustHygiene Occup Med 5:527–534.
Price EW (1990) Podoconiosis/Non-filarial Elephantiasis.New York: Oxford University Press, 131 p.
Prospero JM (1999) Long-term measurements of the transportof African mineral dust to the southeastern United States:Implications for regional air quality. J Geophys Res 104:(15)917–(15) 927.
Reeder RJ, Schoonen MAA, Lanzirotti A (2006) Metal speci-ation and its role in bioaccessibility and bioavailability. InN Sahai, MAA Schoonen (eds) Medical Mineralogy andGeochemistry, Reviews in Mineralogy and Geochemistry(Vol. 64(3), pp. 71–77). Washington, DC: GeochemicalSociety of America.
Ross M, Nolan RP, Langer AM, Cooper WC (1993) Healtheffects of mineral dusts other than asbestos. In GD Guthrie,BT Mossman (eds) Health Effects of Mineral Dusts, Reviewsin Mineralogy (Vol. 64,pp. 361–407). Washington, DC:Geochemical Society of America.
Schramm PT, Johnson CJ, Mathews NE, McKenzie D, Aiken JMPederson JA (2006) Potential role of soil in the transmissionof prion disease. In N Sahai, MAA Schoonen (eds) MedicalMineralogy and Geochemistry, Reviews in Mineralogy andGeochemistry (Vol. 64(3),pp. 71–77). Washington, DC:Geochemical Society of America.
Selinus O, Finkelman RB, Centeno JA (eds) (2008) Medicalgeology in developing countries, Part II. Special Issue,Environ Geochem Health 30(4):305–389.
Shike M (2006) Modern Nutrition in Health and Disease.Baltimore, MD: Lippincott Williams and Wilkins, 2069 p.
Skinner HCW, Berger AR (eds) (2003) Geology and Health –Closing the Gap. Oxford: Oxford University Press, 192 p.
Smedley PL, Knudsen J and Maiga D (2007) Arsenic ingroundwater from mineralized proterozoic basement rocksof Burkina Faso. Appl Geochem 22(5):1074–1092.
Smith B (2000) Exposure to soil. Geosci Develop 6:12.Smith B, Chenery SRN, Cook JM, Styles MT, Tiberindwa JV,
Hampton C, Freers J, Rutkingirwa M, Sserunjogi L, TomkinsAM, Brown CJ (1998) Geochemical and environmentalfactors controlling exposure to cerium and magnesium inUganda. J Geochem Explor 65:1–15.
Taylor EW (1997) Selenium and viral diseases: Facts andhypotheses. J Orthomol Med 12(4):227–239.
Taylor EW, Bhat A, Nadimpalli RG, Zhang W, KececiogluJ (1997) HIV encodes a sequence overlapping env gp41with highly significant similarity to selenium-dependentglutathione peroxidases. J AIDS Human Retrovirol 15:393–394.
Telmer K, Stapper D, Costa MPF, Ribeiro C, Veiga MM (2006)Knowledge gaps in Mercury Pollution from Gold Mining.In Book of Abstracts of the 8th International Conference onMercury as a Global Pollutant. Madison, Wisconsin, USA,06–11 August, 2006.
Telmer KH, Veiga MM (2008) World Emissions of Mercuryfrom Artisanal and Small Scale Gold Mining and theKnowledge Gaps About Them. Report to the World Bank onthe “Global Mercury Project”. New York: World Bank.
Thilly, CH, Delange F, Ramioul L, Lagasse R, Luvivila K,Ermans AM (1977) Strategy of goiter and cretinism controlin Central Africa. Intern J Epidemiology 6:43.

Medical Geology in Africa 219
Thilly CH, Vanderpas JB, Bebe N, Ntambue K, Contempre B,Swennen B, Moreno-Reyes R, Bourdoux P, Delange F (1991)Iodine deficiency: Other trace elements and goitrogenicfactors in the etiopathogeny of iodine deficiency disorders(IDD). Biol Trace Elements Res 32:229–243.
Thilly CH, Swennen B, Bourdoux P, Ntambue K, Moreno-Reyes R, Gillies J, Vanderpas JB (1993) The epidemiologyof iodine-deficiency disorders in relation to goitrogenic fac-tors and thyroid-stimulating hormone regulation. Am J ClinNutr Supp 57:267S–270S.
Tschakert P, Singha K (2007) Contaminated identities: Mercuryand marginalisation in Ghana’s artisanal mining sector.Geoforum 38(6):1304–1321.
Underwood EJ (1981) The Mineral Nutrition of Livestock.London: Commonwealth Agricultural Bureau, 180 pp.
UNSCEAR (United Nations Scientific Committee on the Effectsof Atomic Radiation) (2000) Sources, Effects and Risks ofIonizing Radiation. New York: United Nations.
Utiger RD (1998) Kashin-Beck disease – Expanding thespectrum of iodine-deficiency disorders. New Eng J Med339:1156–1158.
Vanderpas JB, Contempre B, Duale NL, Goossens W, Bebe N,Thorpe R, Ntambue K, Dumont J, Thilly CH, Diplock AT(1990) Iodine and selenium deficiency associated with sele-nium in northern Zaire (now the Democratic Republic of theCongo). Am J Clin Nutr 52:1087–1093.
Vanderpas JB, Contempre B, Duale NL, Deckx H, Bebe N,Longombe AO, Thilly CH, Diplock AT, Dumont J (1993)Selenium deficiency mitigates hypothyroxinemia in iodinedeficient subject. Am J Clin Nutr Supp 57:271S–275S.
Vogel L (2005) Special report on asbestos in the world. Healthand safety department newsletters, ETUI-REHS 27:7–21.
Wapnick AA, Lynch SR, Seftel HC, Charlton RW, Bothwell TH(1971) The effect of siderosis and ascorbic acid depletion onbone metabolism, with special reference to osteoporosis inthe Bantu. Brit J Nutr 25:367–376.
Williams T, Smith B (2000) Hydrochemical characteristics ofacute acid mine drainage at Iron Duke Mine, Mazowe,Zimbabwe. Environ Geol 39:272–278.
World Health Organisation (WHO) (1993) Guidelines forDrinking-Water Quality. Geneva: WHO.
World Health Organisation (WHO) (2004) Guidelines forDrinking-Water Quality, 3rd Edition. Geneva: WHO.
World Health Organisation (WHO) (2007) Assessment of IodineDeficiency Disorders and Monitoring Their Elimination: AGuide for Programme Managers (3rd ed.). Geneva: WHO.
World Health Organisation (WHO) (2008) The Top Ten Causesof Death. Fact Sheet No 310/November 2008. Geneva:WHO.
WHO/UNICEF/ICCIDD (1993) Global Prevalence of IodineDeficiency Disorders. MDIS Working Paper No. 1. Geneva:WHO.
Xenakis JJ (2004) Today’s Slow-motion Genocide in DafurRecalls Lightning Quick Genocide in Rwanda in 1994.www.generationaldynamics.com.
Ziegler JL (1993) Endemic Kaposi’s Sarcoma in Africais Associated with Exposure to Volcanic Clay Soils.International Conference on Environmental Geochemistryand Health in Developing countries, Abstract Volume, TheGeological Society, London, UK 72 p.

Medical Geology in Russia and the NIS
Iosif F. Volfson, Evgeny G. Farrakhov, Anatoly P. Pronin, Ospan B. Beiseyev,Almas O. Beiseyev, Maxim A. Bogdasarov, Alla V. Oderova, Igor G. Pechenkin,Alexey E. Khitrov, Oxana L. Pikhur, Julia V. Plotkina, Olga V. Frank-Kamenetskaya,Elena V. Rosseeva, Olga A. Denisova, Georgy E. Chernogoryuk, Natalia Baranovskaya,Leonid P. Rikhvanov, Igor M. Petrov, Armen K. Saghatelyan, Lilit V. Sahakyan,Olga V. Menchinskaya, Tamara D. Zangiyeva, Murat Z. Kajtukov, Zukhra H. Uzdenova,and Anastassia L. Dorozhko
Abstract Systematic and regular epidemiologicalstudies on endemic diseases and the natural envi-ronment in Russia and NIS are scarce and sporadic.However, there have been some studies of the linksbetween health of the population and the geologicalbackground. Information on fluorine, iodine, arsenic,selenium, and other elements’ behavior in natural envi-ronment and their effect on human health is presentedin this chapter and is the first attempt to synthesize theinterdisciplinary knowledge on some geological fac-tors which affect human health in Russia and NIS.Also anthropogenic factors are mentioned, however, ofgeological origin.
Currently, the most important areas of the study in thefield of Medical Geology in Russia – NIS are
• Geological and geochemical aspects of medicalgeology in terms of modeling and mapping of thespreading of endemic diseases, toxic elements, suchas uranium, fluoride, radon, arsenic, in subsurface,geosphere, and the atmosphere, and its effect onhuman health.
• Urban and mining medical geology.• Crystal chemistry and crystal genesis of biogenic
minerals of different origin.• The therapeutic usage of the minerals in terms
of biological functions of the elements metals inmedicine and industry, and economic minerals inmedicine.
I.F. Volfson et al. (�)Russian Geological Society, h.10, st. 2-d Roshchenskaya,Moscow 115191, Russiae-mail: [email protected]
This chapter, written by leading experts of Russiaand NIS, will be of interest to a wide audience of geol-ogists, geochemists, physicians, as well as historians.
Keywords Geochemical anomalies · Human health ·Russia and NIS · Arsenic · Fluorine · Iodine ·Selenium · Radon · Mining
The International Medical Geology Association wasestablished in 2005. The Regional Division of Russia-NIS was established in March 2006 at the annualmeeting of the Russian Geological Society MedicalGeology Division (MGD ROSGEO). The found-ing of the IMGA (International Medical GeologyAssociation) Regional Division of Russia-NIS (IMGARD Russia-NIS) was organized through cooperationbetween the MGD ROSGEO and the IMGA council.Since 2005, MGD ROSGEO has maintained an orga-nization to promote contact between the IMGA and theNIS medical geology communities.
IMGA RD RUSSIA – NIS is a voluntary associationof scientists – geologists, geochemists, mineralogists,geophysicists, physicians, chemists, biologists, micro-biologists, medical scientists, and others who study theeffects on human health of geological processes, mate-rials (minerals, ores, volcanic emissions, atmosphericdust, water, and soils), and other natural effects. Thepurpose of IMGA RD RUSSIA – NIS is to bringtogether specialists, scientists, and practitioners work-ing in different areas of knowledge, to unite theirefforts, and to encourage collaboration on this rapidlydeveloping field of the science. The main purposeof IMGA RD RUSSIA – NIS activities is to sup-port the studies in the field of medical geology inthe Russian Federation and Newly Independent States.Scientists from NIS are occupied in many fields of
221O. Selinus et al. (eds.), Medical Geology, International Year of Planet Earth,DOI 10.1007/978-90-481-3430-4_9, © Springer Science+Business Media B.V. 2010

222 I.F. Volfson et al.
medical geology. Some results of these studies havebeen introduced to the users on the IMGA web site andto the IMGA Medical Geology Newsletter.
Currently, the most important areas of the study inthe field of Medical Geology in Russia – NIS are
• Geological and geochemical aspects of medicalgeology in term of mechanisms of element concen-trations as a base for the modeling and mappingof the spreading of endemic diseases including thestudy of toxic elements, such as uranium, fluoride,radon, arsenic, in subsurface geospheres, and theatmosphere, and the effect on human health.
• Urban- and mining medical geology.• Crystal chemistry and crystal genesis of biogenic
minerals of different origin.• The therapeutic usage of the minerals in terms of
biological functions in medicine and industry, andeconomic minerals in medicine.
History
Iosif F. Volfson, Evgeny G. Farrakhov,Ospan B. Beiseyev, Almas O. Beiseyev,and Maxim A. Bogdasarov
The first applications of medical geology in Russiawere on the use of medical properties of different min-erals and rocks. In ancient times minerals and rockswere used as a medical treatment among the populationof the highlands, while in lower areas mainly plantswere used for healing purposes. Different branches ofmedicine had their specific medicines and traditionsfor treatment created during ancient times, reflectinggeographical and geological properties of the differentareas (for example, Tibetan, Eastern, West-European)(Pelymskij, 2008).
Russia and later the Commonwealth of NewlyIndependent States adopted the experience of peo-ple of the Near East, the Middle East, the Far East,and Western Europe; and a vast knowledge was accu-mulated during long periods of time. The researchof prominent scientists of the Middle Ages such asAvicenna, Biruni, and others was characterized bydetailed investigations of minerals, including studiesof their physical, chemical, and medical properties.
Avicenna in his famous book “Canon of AesculapianScience” (11th century) recommended the use ofmore than 30 minerals for medical treatment anddescribed the recipes of many medical preparationsfrom these minerals. Biruni published his medievalstudy of semiprecious stones for medical use in hisbook “Congregation of the Lore for Cognition of theValuables. The Mineralogy”, including medical infor-mation for about 450 minerals and natural chemicalcompounds (Yushkin, 2003, 2004a, 2004b; Beiseev,2004).
The history of pharmacopeia in Russia began withthe introduction of Christianity, in the epoch of PrinceVladimir (10th century). The first literature on med-ical properties of minerals can be found in “Izbornik”by Svyatoslav (1073), in “Vetrogrady” (15th–17th cen-tury), in “Torgovaja kniga” (“Trade book”, 16th–17thcentury), and in “Azbukovnik” (17th–19th century).The pharmacy came to Russia much later, at the begin-ning of the 17th century, and was widely spread by thetime of Peter the Great. There were many drugstoresin the 16th century, where it was possible to buy suchcures, as salpeter, potash, rosin, sulfur, borax, mer-cury, verdigris, wax, as well as jewels – , sapphire andruby, which were used for preparation of medicines(Pelymskij, 2008).
Some examples of domestic mineral recipeswere
Emerald: “Who often look at the emerald, then humaneye is strengthened, protected and healthy. Andbesides emerald brings a cheer to whom whocarries it”.
Turquoise: “After it is grinded, take it, and it helps frombite of snake”.
Quartz: “Crystal-stone to grind and stirred with freshhoney, that mother’s milk multiplies” (Yushkin,2004a, 2004b).
These recipes correspond almost to the recipesof medieval lapidaries (British Bishop Renskij 11thcentury, Arabic scientists Tabib and Shirazi – 12thcentury) (Walters, 1996).
At the beginning of the 17th century these phar-maceutical recipes were prescribed to the Russianarmy.
The Russian scientist V.M. Severgin playedan important role in the development of thepharmaceutical chemistry and mineral use for medical

Medical Geology in Russia and the NIS 223
purposes. In 1798 he translated the book of “Naturalhistory” by Plinij the Senior, which contained informa-tion about minerals, including their medical properties.He then for the first time established the term “escu-lapian mineralogy” (medical geology) in everyday life.
The traditions of “esculapian mineralogy” in NISare still alive and getting stronger every year. Forexample, scientists and doctors from the states ofCentral Asia and Kazakhstan currently make signif-icant contributions with the use of natural mineralsand their mixtures that possess valuable properties forhuman health. These minerals are used in cosmetics,in preventive medicine and treatment of different dis-eases, such as skin lesions, and many diseases of inter-nal organs, traumas, and fractures, and to treat damagesfrom ecological catastrophes. At present almost 500known minerals are used in medicine, more than 350are well defined in the territory of NIS and particu-larly in Kazakhstan. Among these are ore minerals andeconomic minerals such as clays, shungites, flints, zeo-lites, salts, and others (Beiseev, 2004; Volfson, 2004;Volfson et al., 2010; Florinsky, 2010).
The successful use of bentonite clays in medicinein medieval times was shown by Avicenna in hisbook “Canon of Esculapian Science” (11th century).He recommended its use as an efficient cure for thetreatment of the diseases of the gastrointestinal tract,mouth, drinking water detoxication, and filtering. Atthe present time our contemporaries successfully usedbentonite clay as preventive measures and treatment ofcaries and various manifestations of dermatitis, and inmaking complex medical preparations (Kariev, 2007).
For centuries, mumie (mumie, or shilajit, a natu-ral dark mineral substance found in rock crevices ataltitudes of 2,000–5,000 m high in the mountainousregions of Asia) has been known to possess an arrayof uses related to health and longevity. Specifically,mumie shows benefits to both the human metabolicand immune systems and has had big success amongthe population. Resources of this mineral, consistingof organic material, formed by bacteria living on rocksand excrements of animals are significant in SouthKazakhstan, Central Asia, in the Altai Mountains.Research in mumie has revealed a large variety offree amino acids (from 0.03 to 3.55%) dominated byamino-acetic acid and glutamic acid (6.07–99.75% and0.02–19.96%), respectively, and also a large amountof all amino acids, as well as elements such as S, C,H, Al, Mo, P, Hg, Cu, S, and Mn from which the
antimicrobial and other important properties of mumieare dependent (Frolova and Kiseleva, 1996; Savinykh,2003; Volfson et al., 2010). The ability of mumie toactivate phagocyte activity of human leukocytes andto promote healing of wounds and fractured bones hasbeen revealed (Schepetkin et al., 2002; Ghosal, 2006).There is a contemporary theory on the endogenic gen-esis of mumie as a result of degassing of Earth alongabyssal structures (Savinykh, 2006).
Another popular and efficient geological materialis the Kola shungites (shungites are pre-Cambriancarbon-rich, silicate rocks known from deposits inthe north-western part of lake Onega, near the cityof Petrozavodsk in Karelia, north of St. Petersburg,Russia). Shungites are extremely rich in carbon, withcarbon accounting for 98% in vein shungites. The useof this material for medical treatments dates back toPeter the Great. Resting after a long march in one ofthe Kola counties, Tsar Peter, after advice from thelocal population, took a bath and drank water drainedfrom outcrops of the shungite rocks. He felt reliefand the impression was so strong that he located thefirst Russian spa resort there. The active use of theKola shungites as antibacterial treatment for waterpurification in the Russian army also became possi-ble after an edict of Tsar Peter. One of the reasonsfor the success of Tsar Peter in the battle of Poltavain 1709 against Swedish troops was the possibilityto purify drinking water by means of natural shun-gite (Rysyev, 2001). This has continued to this day.Scientists of Saint-Petersburg University in collabo-ration with experts of the City enterprise Vodokanal(water supplier) have confirmed antibacterial prop-erties of the Kola shungites. They proved antago-nism of bacteria in shungite rocks to test cultures ofpathogenic microorganisms (Charykova et al., 2006).Serious investigations of shungites mineralogical andgeochemical features were carried out by Russian sci-entists in collaboration with foreign scientists (Busecket al., 1997).
During the following years of the Russian empire,as well as in modern Russia and NIS, valuable expe-rience of water- and mud cure has been developed,based on the experience from the late Middle Ages.Examples include the water- and mud cure resortscreated in Moscow by the German doctor ChristianLoder in 19th century, the resorts of the RussianCaucasian mineral waters Essentuki and Pyatigorsk,the resort Borzhomi in Georgia, the resort Archman

224 I.F. Volfson et al.
in Turkmenia, the resort Arzni in Armenia, and manyothers. It should be noted that there are now 273 suchsites of mineral waters in the NIS. They are usedfor treating patients suffering from cardiovascular dis-eases, for whom carbonate waters are most helpful;such waters are currently found at 57 sites. Thereare 38 locations of sulfide waters which are used forpatients with diseases of joints and spine, as well as forpatients with diseases of the peripheral nervous system(Tsarfis, 1985, 1991; Volfson et al., 2010).
Endemic Disease Areas in Russia and NIS
Iosif F. Volfson, Evgeny G. Farrakhov,Anatoly P. Pronin, Alla V. Oderova,Igor G. Pechenkin,and Alexey E. Khitrov
It is important to note that systematic and regularepidemiological studies on endemic diseases and thenatural environment in Russia and NIS are scarceand sporadic. The reason could be the low densityof the population in much of the regions and accord-ingly quite complicated conditions for epidemiologicalresearch. On the other hand, intensive industrializationhas resulted in increasing density of the populationin large industrial centers, where people are subjectto effects of high concentrations of anthropogeniccontaminants. This also requires greater efforts indetermining the origin of anomalous concentrations ofelements in the natural environment as well as theirspeciation. However, there have been some studies onthe links between the health of the population and thegeological background. Valuable information on flu-orine, iodine, arsenic, selenium, and other elementsin the natural environment and their effect on humanhealth has been obtained (Ermakov, 1992; Skal’ny,1999; Agadzhanjan et al., 2001; Golovin et al., 2004;Saet et al., 1990). Some results of these studies will beintroduced in this chapter.
Society develops and exists in contact and inter-action with naturally occurring elements and min-erals; and there is an obvious relationship betweenthe health of the people and the different geolog-ical backgrounds that they live in (Avtsyn, 1972;Aggett and Rose, 1987; Abrahams, 2002; Hough,
2007; Peeters, 1987; Persinger, 1987; Yushkin, 2004a,2004b). A. P. Vinogradov (Vinogradov, 1938, 1939;Vinogradov, 1964) revealed a relationship betweenthe concentrations of certain elements in the envi-ronment and health problems of humans and ani-mals. He introduced a biogeochemical hypothesison the formation of the disease discussing bio-geochemical provinces and biogeochemical endemic-ity. As demonstrated by the publications issued bythe Biogeochemical Laboratory headed long agoby Vinogradov and his follower V. V. Kovalskylater in 1970s, relatively enhanced background lev-els (2–3 times above the clarke values), may causeserious health problems. The concept of geochem-ical endemicity was proposed in 1998 (Golovinet al., 2004). Geochemical endemicity depends on theparameters and features of regional backgrounds hav-ing enhanced or deficient contents of elements relativetheir clarke values.
The Kashin–Beck (Urov) disease is a diseasemainly caused by geochemistry. This serious dis-ease (deforming osteochondroarthritis) is located inEastern Siberia (Transbaikalia), China, and Korea.Some researchers believe that it is caused by toxicityof phosphorous and manganese that suppresses cal-cium activity in humans and results in a critically lowCa/P ratio in bone tissues. However, most researchersare in favor of the hypothesis of selenium deficiency.The areas within these territories promote formationof increased concentrations of these elements in soils(Saet et al., 1990; Kravchenko, 1998; Golovin et al.,2004).
Another example is manganese which can be foundin elevated contents in sedimentary geological envi-ronments of the East-European platform. Manganeseis actively absorbed by plants and is capable of enter-ing into organisms through the food chain. Manganeseis one of the essential elements, both for animals,and humans. It plays an important role in the pro-cess of formation of tissues and bones, in the processof growth, and in lipid and carbohydrates metabolismand it is necessary for the reproductive function. Themain path of intake for manganese is the respiratoryand gastrointestinal tract. The degree of absorption ofmanganese entering by inhalation is unknown, but inthe gastrointestinal tract not more than 5% is taken up(Revich, 2001; Aggett and Rose, 1987). A special roleof manganese is noted as a pathogenic factor on theorigin of goiter (Agadzhanjan et al., 2001). Manganese

Medical Geology in Russia and the NIS 225
poisoning is caused mainly by the chronic effect of itsoxides, which cause manganese toxicosis. The chronicresults of this poisoning are effects on the central ner-vous system. Bronchial asthma, pneumonia, allergy ofthe upper respiratory tract, eczema, and dermatitis areconnected with overexposure to manganese (Revich,2001).
Manganese was found in partially burnt wood ofaspen and birch at excavations of the medieval lay-ers in the ancient settlement of Moscow. This fire-wood was broadly used by the inhabitants for heatingand cooking as well as in technological processes.Probably the concentration of manganese in fire-wood exceeded the upper limited concentrations andcould lead to serious health problems of the popula-tion. The content of manganese in bones of Moscowresidents of the medieval period was as high as10 mg/100 g. The common people had 30–70 mg/100 g
in their bones (Aleksandrovskaia and Aleksandrovskij,2003).
Figure 1 shows the areas of endemic diseases causedby environmental factors in Russia and NIS. By usingmodern methods of treatment of geological, geochemi-cal, and geophysical information we have also revealedabyssal fractures which control halos of helium andfluorine as well as strontium, bromine, and lithium inwater-bearing formations of sedimentary rocks of theEast European platform (Pronin, 1997; Pronin et al.,1997; Klimas and Mališauskas, 2008; Farrakhov et al.,2008).
There have also been found three interre-lated ore-forming systems playing a significantrole in epigenetic ore formation within the bor-ders of the Central Asian metal-bearing andoil-bearing sedimentary basins (Grushevoy andPechenkin, 2003; Pechenkin et al., 2005): catagenetic
Fig. 1 Areas of endemic diseases in Russia and NIS

226 I.F. Volfson et al.
(stadial), exfiltration, and infiltration. Each systemforms specific geochemistry and hence epidemio-logical settings (Grushevoy and Pechenkin, 2003;Pechenkin and Pechenkin, 2005; Pechenkin et al.,2005; Volfson et al., 2006). On the basis of thisresearch a relationship between the distribution of U,Se, As, F, Br, B, Rn, and potential endemic diseaseshas been established.
Fluorine
Oxana L. Pikhur, Julia V. Plotkina,Olga V. Frank-Kamenetskaya,and Elena V. Rosseeva
Introduction
Fluorosis can be found all over Russia and NIS andadjacent territories of the Baltic States particularly inLithuania (Narbutaite et al., 2007). The most seriousfluorosis is found in Ukraine, Azerbaijan, Moldova,and in Kazakhstan (Admakin, 1999) (Fig. 1). Fluorineis also identified in groundwaters in the Central Regionof Russia.
In Ukraine fluorosis is widespread in theTranscarpathian region, in the Poltava territory.
Investigation of 25,595 rural people in the Republicof Kazakhstan has been carried out and has shownvarious diseases of hard tooth tissues, among whichfluorosis dominated. Interesting regional distributionsof fluorosis have been found. The absence of mod-ern technologies in the treatment of fluorosis, the poortechnical equipment, and the low level of prophylacticwork are serious. It is worth mentioning that in areaswith hot climate, acute fluorosis can be observed withcontents of fluorine in drinking water of 0.5–0.7 mg/l(Esembaeva, 2006).
More than 90% of the population of Russia donot get fluorine in necessary amounts (Revich, 2001;Kuz’mina, 1999; Kuz’mina and Smirnova, 2001).Fluorine is particularly low in surface drinking watersupplies in the Kol’skij and Karel’skij region (theKola Peninsula), in the Archangelsk region, in theLeningrad region, in the Republic of Komi, and inNorth Kaukasus. Fluorine deficiency in water is amatter of concern for dental diseases such as tooth
decay and caries (experienced by 60% of the pop-ulation). On the other hand excess of fluorine ingroundwater has caused fluorosis among children inthe Upper Volga region and in the Volga region, partic-ularly in Nizhny Novgorod, in the capital of Republicof Chuvashia Cheboksary, Republic of MordoviaSaransk, and elsewhere. In the region east of Moscowfluorine haloes with a concentration of more than0.16 mg/l are revealed in melting water from snow(Fig. 2). Concentrations of fluorine (over 19 mg/l) andbromine (125 mg/l) (more than 10 times the maximumlimited concentration of 1.5 mg/l) are found in ground-water within the Kaluga volcanic structure and withina number of similar geological structures in the East-European platform which are covered by Paleozoicsedimentary deposits (Pronin et al., 1997).
Fluoride Content in Drinking Waterand Dental Morbidity in Different Regionsof Russia
Drinking water is one of the main sources of fluoridefor humans (Smith, 1988; Freatherstone, 1993; WHOTechnical Report Series, 1994; Edmunds and Smedley,2005). Fluoride concentration in drinking water inRussia varies from 0.01 to 2.90 ppm. Epidemiologicaldental studies of the Russian populations allow usto draw conclusions about dental morbidity and thenecessity of dental treatment of patients of certain agegroups (6, 12, 15, 35–44, 65 years and older) in dif-ferent Russian regions (Pachomov, 1982; Admakin,1999; Kuz’mina, 1999; Kolesnik, 1997; Sherbo, 2002).Results of dental investigations of populations from 56cities can be found in Table 1.
Chemical Composition of Teeth Enameland Hair of Citizens in Centers of NorthWest Russia
The chemical composition of teeth enamel and hairof persons of different age groups living in centersof North-West region of Russia (Saint Petersburg,Apatites, Monchegorsk) has been studied usingICP-MS.
The deterioration of the environment in indus-trial cities steadily increases the abundance of human

Medical Geology in Russia and the NIS 227
Fig. 2 Map of fluorinedistribution in melting waterfrom snow 1993 in Moscowand surroundings. Samplingsite with higher concentrationof fluorine in snow water.Concentration of F (mg/l)
Table 1 Fluoride content in drinking water and dental diseases of 12-year-old residents of Russian regions
No. Region (n – number of persons)
Fluoride indrinking water(ppm)
Frequency ofteeth caries
Intensity of teethcaries (indexCFE)a
Frequency ofteeth fluorosis
1 Arkhangelskaya region, Arkhangelsk city (49) 0.15 76 2.04 02 Republic Adygeya, Maikop city (47) 0.07 79 3.24 23 Astrakhanskaya region, Astrakhan’ city (100) 0.16 74 3.19 24 Republic Bashkortostan, Ufa city (50) 0.28 84 2.60 45 Bryansky region, Bryansk city (102) 0.18 66 1.96 46 Republic Buryatia, Ulan-Ude city (49) 0.48 76 2.00 127 Volgogradskaya region, Volgograd city (50) 0.22 70 2.42 28 Voronezhskaya region, Voronezh city (101) 0.25 90 3.87 59 Dagestan Republic, Buinaksk city (101) 0.20 84 3.49 8
10 Ingushetia Republic, Nazran’ city (50) 0.17 94 3.58 811 Irkutskaya region, Irkutsk city (50) 0.21 82 2.38 012 Kabardino-Balkaria Republic, Nal’chik city
(77)0.41 70 3.12 1
13 Kalmykia Republic, Elista city (50) 0.32 66 1.82 014 Kaluzhskaya region, Kaluga city (83) 0.22 68 1.79 115 Republic Karelia, Petrozavodsk city (50) 0.08 70 1.94 616 Republic Karelia, Nadvoitsy village (50) 0.90 74 2.56 4417 Kemerovskaya region, Kemerovo city (54) 0.30–0.50 86 3.26 018 Krasnodarsky land, Krasnodar city (50) 0.42–0.54 90 3.34 419 Krasnoyarsky land, Krasnoyarsk city (50) 0.13 74 3.50 020 Kurskaya region, Kursk city (50) 0.41 66 1.72 821 Lipetskaya region, Lipetsk city (50) 0.20 82 3.32 0

228 I.F. Volfson et al.
Table 1 (continued)
No. Region (n – number of persons)
Fluoride indrinking water(ppm)
Frequency ofteeth caries
Intensity of teethcaries (indexCFE)a
Frequency ofteeth fluorosis
22 Moscow (1161) 0.16–0.22 82 3.59 323 Moscow region, Mozhaisk city (50) 0.41–0.61 68 3.10 1024 Moscow region, Podolsk city (30) 1.2 60 1.07 3225 Moscow region, Odintsovo city (30) 1.80 37 0.50 7426 Moscow region, Zheleznodorozhny city (30) 1.0 53 1.30 627 Murmanskaya region, Murmansk city (50) 0.10 76 2.38 428 Murmanskaya region, Monchegorsk city (50) 0.20 84 2.90 829 Murmanskaya region, Apatity city (50) 0.65 82 2.38 1030 Nizhegorodskaya region, Nizhny Novgorod
city (201)0.10–0.50 96 4.43 0
31 Nizhegorodskaya region, Arzamas city (200) 0.86–1.2 37 1.50 532 Novosibirskaya region, Novosibirsk city (50) 0.17 90 3.34 033 Omskaya region, Omsk city (50) 0.25 86 3.10 034 Penzenskaya region, Penza city (103) 0.41 69 2.32 035 Penzenskaya region, Serdobsk city (50) 2.85–2.90 46 0.92 7836 Permskaya region, Perm’ city (50) 0.50 72 2.20 037 Primorsky land, Vladivostok city (50) 0.11 91 3.48 038 Rostovskaya region, Rostov-na-Donu city (50) 0.28 78 1.66 439 Samarskaya region, Samara city (52) 0.52–1.3 88 3.67 640 Saint-Petersburg City (120) 0.04 77 1.94 041 Sakhalinskaya region, Yuzhno Sakhalinsk city
(110)0.1–0.2 84 3.36 0
42 Sverdlovskaya region, Ekaterinburg city (87) 0.70 85 3.42 043 Smolenskaya region, Smolensk city (50) 0.28–0.35 76 2.06 244 Tatarstan Republic, Kazan’ city (101) 0.16 82 3.11 045 Tverskaya region, Tver’ city (140) 0.79–2.00 84 2.36 7246 Tomskaya region, Tomsk city (100) 0.08–0.29 74 1.97 047 Tul’skaya region Tula, city (75) 0.26–0.28 49 3.64 348 Tuva Republic, Kyzyl city (50) 0.22 74 2.52 649 Tyumen region, Tumen’ city (105) 0.15 76 2.90 050 Udmurtia Republic, Izhevsk city (50) 0.12 86 3.22 451 Khabarovsky land, Khabarovsk city (49) 0.15 89 4.00 252 Khanty-Mansiisky region, Khanty-Mansiisk
city (100)0.19 87 3.71 0
53 Khanty-Mansiisky region, Nizhnevartovsk city(52)
0.10 90 4.54 0
54 Chelyabinskaya region, Chelyabinsk city (50) 0.15 58 1.56 055 Chitinskaya region, Chita city (50) 0.30 70 1.50 056 Yaroslavskaya region, Yaroslavl’ city (50) 0.14–0.17 80 2.37 2aIndex CFE: sum of caries (component «C»), filling (component «F»), extracted (component «E») teeth of examined person. IndexCFE in group = �CFEpersonal/n, where n – number of persons. (Kolesnik, 1997; Kuz’mina, 1999; Nikolishin, 1989; Pikhur, 2003)
dental diseases. Teeth caries is one of the most impor-tant dentistry problems because of its wide distri-bution (Zyryanov, 1981; Breus, 1981). During thepast 10–15 years the frequency of dental diseasesassociated with non-caries lesions has dramaticallyincreased. Thus the early diagnostics of these dis-eases and their prevention is now a very important
issue. Major and trace elements in the dental enamelof healthy and sick patients have been extensivelyinvestigated by many authors (Breus, 1981; Elliott,1994; Dowker et al., 1999). However, papers devotedto complex investigations of the chemical composi-tion of dental hard tissues of persons of a single agegroup and living permanently in regions with different

Medical Geology in Russia and the NIS 229
environmental conditions are scarce. It is therefore notpossible in Russia to analyze the resistance of den-tal hard tissues to disease depending on environmentalconditions.
It is, however, well known that environmentalchanges influence the chemical composition of hair insome respect, and therefore hair, in contrast to teeth,is more available for research and is thus more widelyused as an indicator of changing environmental condi-tions. For instance, humans living in areas chronicallyexposed to volcanic emissions show high concentra-tions of essential and nonessential trace metals in scalphair. It is suggested that this type of exposure may be asharmful as living close to industrial facilities (Amaralet al., 2008). The relations between the hair compo-sition and diseases have been studied in Russia morethan the composition of human dental hard tissues.
One investigation has, however, been a detailedinvestigation of the chemical composition of dentalenamel and hair of persons of different age groupspermanently living in centers of North-West regionof Russia (Saint Petersburg, Apatites, Monchegorsk)and the comparative analysis of environmental influ-ence on chemical composition of human dental hardtissue and hair. In order to exclude the effect of agechanges on the composition of the hard tissues sam-ples of hard tissues are used, obtained from personsof different age groups: I – 10–15 years, II – 16–30,III – 31–45, IV – 45–65 years. Teeth were sampledby medical evidence (chronic parodontitis, orthodon-tic causes). The enamel samples were prepared as apowder. Samples of hair were represented with a lengthof about 5–7 cm. ICP-MS has been used to determinethe chemical composition (Larina, 2006). In order todetermine the differences between chemical composi-tions of teeth and hair from different regions clusteranalysis was used (Soshnikova et al., 2007). The con-centration of major elements (Sa, R, Na, Mg) of thestudied enamel samples (Table 2) is typical for thehuman teeth hard tissue (Frank-Kamenetskaya et al.,2004; Dowker, 1999; Elliott, 1997). The result of clus-ter analysis of the investigated samples has not allowedthe classification of samples into well-defined groups.
The significant distinctions of chemical composi-tion of teeth enamel of inhabitants from different citiesare apparent. The variations in concentration of Fe, V,Mo, Ta, Ag (in St. Petersburg), Ni, Cr, Ba, Mo (inApatity) are probably connected to working conditionsin industries.
Cluster analysis (Fig. 3, Tamashevich andMakhnach, 2004) confirms the differences in trace ele-ments concentration of teeth enamel of Kola Peninsulaand St. Petersburg inhabitants. Teeth of inhabitants ofMonchegorsk of age groups II and IV are closest tothe composition of enamel. The grouping of samplesin cluster at high D values reflects essential influenceof endogenous factors on trace element compositionof human teeth enamel.
The results of the investigations on chemical com-position of hair of inhabitants from different regions(Table 3) demonstrate that calcium is the major ele-ment of hair ash residue. Calcium contents varyfrom 0.02 to 0.13 wt.% with a maximum in thehair of St.Petersburg inhabitants. Furthermore, the cal-cium content of human hair decreases with increasingpatient age.
The result of the cluster analysis shows (Figs. 3and 4) significant differences in trace element com-position of hair samples from inhabitants of differentage groups living in North-West centers of Russia. AtD = 26% three clusters corresponding to hair sam-ples of inhabitants from St. Petersburg, Apatity, andMonchegorsk are observed. The results demonstratethe smaller variability of the chemical compositionof the hair of the inhabitants of cities of the KolaPeninsula compared to St. Petersburg. It is impor-tant to note that inside of the second and the thirdclusters, corresponding to Apatity and Monchegorsk,successive grouping of samples occurs by the way ofreduction of resident’s age. At the following stage ofclusterization (at D = 46%) the grouping of the sec-ond and the third clusters in one cluster is observed,which reflects the similarity of a chemical compo-sition of the hair of the inhabitants from the KolaPeninsula towns in contrast to hair samples fromSt. Petersburg.
The results of the investigation of teeth enamel andhair of inhabitants from St. Petersburg, Apatity, andMonchegorsk demonstrate the difference of their traceelement composition. Differences in chemical compo-sition of the investigated tissues of the inhabitants fromKola Peninsula (Apatity and Monchegorsk) are less incomparison to St. Petersburg inhabitants. Furthermorethe chemical composition of hair and especially dentalenamel samples of inhabitants from St. Petersburg isvery heterogeneous. This can probably be explained byinfluences of many factors (social, physical, chemical,biological, and other).

230 I.F. Volfson et al.
Table 2 Chemical composition of enamel of inhabitants from different industrial centers (mas.%)
Element St. Petersburg Monchegorsk Apatity
Age group 16–30 45–65 16–30 45–65 16–30 45–65
Ca 35.66 34.66 35.38 34.02 32.02 31.80P 17.32 16.71 17.41 17.02 16.36 15.62Na 0.63 0.73 0.50 0.63 0.58 0.52Mg 0.24 0.37 0.18 0.32 0.22 0.27Zn 3,000.00 1,800.00 4,300.00 4,600.00 3,200.00 1,800.00Sr 828.00 457.00 1,300.00 742.00 1,200.00 533.00K 3,071.00 2,656.00 1,245.00 1,992.00 1,743.00 4,067.00Fe 9,092.63 839.32 1,468.81 307.75 0.00 0.00Ti 131.89 3,177.35 3,357.20 3,417.15 3,417.15 2,817.65Cu 189.00 78.50 35.90 6.20 30.80 63.40Ni 130.00 10.00 37.80 26.90 1,700.00 60.90Al 0.00 0.00 0.00 0.00 0.00 1,005.53W 615.00 93.20 90.20 79.90 107.00 122.00Co 530.00 10.70 22.00 21.30 16.50 25.90Cr 147.00 20.20 45.30 <10.00 750.00 <10.00Mn 30.98 15.49 38.72 46.47 54.21 38.72Pb 19.20 51.70 <10.00 28.10 39.00 36.60Zr 17.40 38.90 18.90 <10.00 <10.00 <10.00Ba 52.90 25.90 19.50 30.50 <10.00 135.00Sn 33.20 6.20 10.70 11.00 20.00 6.50Mo 17.70 2.40 <1.00 <1.00 14.00 <1.00Ga <0.50 <0.50 <0.50 <0.50 <0.50 2.10Be <0.30 <0.30 0.47 0.47 <0.30 3.20Rb 3.20 <0.30 1.40 3.40 0.99 15.50Y <0.10 0.15 <0.10 <0.10 <0.10 <0.10Nb 2.00 1.10 <0.10 <0.10 6.70 <0.10Ag 3.900 0.000 0.000 0.110 0.000 0.000Cd <0.10 <0.10 <0.10 <0.10 8.50 <0.10In 0.09 0.36 0.03 <0.01 0.06 0.23Sb 0.24 3.80 <0.10 <0.10 <0.10 <0.10I 0.63 3.60 1.50 0.18 <0.10 0.53Cs 0.07 0.22 0.08 0.07 <0.05 <0.05La 6.90 2.90 <0.10 <0.10 <0.10 <0.10Ce 15.40 5.40 <0.10 <0.10 <0.10 <0.10Pr 1.20 0.63 <0.10 <0.10 <0.10 <0.10Nd 2.30 1.90 <0.10 <0.10 <0.10 <0.10Sm <0.10 0.28 <0.10 <0.10 <0.10 <0.10Eu <0.01 0.03 <0.01 <0.01 <0.01 0.03Gd 0.05 0.21 <0.01 <0.01 <0.01 <0.01Tb <0.01 0.02 <0.01 <0.01 <0.01 <0.01Dy <0.01 0.03 <0.01 <0.01 <0.01 <0.01Ho 0.02 0.03 <0.01 <0.01 <0.01 <0.01Hf 0.08 0.19 0.07 <0.05 <0.05 <0.05Ta 7.50 1.20 1.30 1.10 1.60 2.60Th <0.01 0.40 <0.01 <0.01 <0.01 <0.01
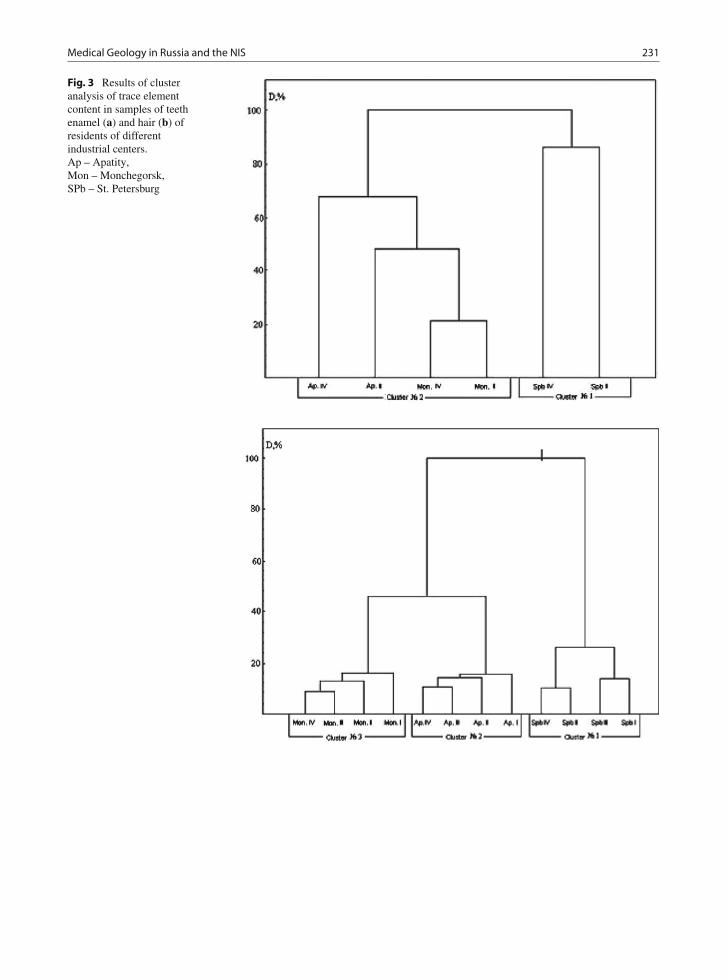
Medical Geology in Russia and the NIS 231
Fig. 3 Results of clusteranalysis of trace elementcontent in samples of teethenamel (a) and hair (b) ofresidents of differentindustrial centers.Ap – Apatity,Mon – Monchegorsk,SPb – St. Petersburg

232 I.F. Volfson et al.
Table 3 Element composition of hair of inhabitants from different regions (mas.%∗104)
Element St. Petersburg Monchegorsk Apatity
Age group 10–15 16–30 31–45 45–65 10–15 16–30 31–45 45–65 10–15 16–30 31–45 45–65
Ca 1,254 1,210 1,230 1,213 268 216 252 220 369 310 330 290Na 285 367 320 298 210 275 244 235 324 453 344 335Zn 210 161 177 165 176 155 165 150 172 149 168 148K 69 167 143 105 169 184 182 175 243 291 282 275Mg 126.0 119.0 120.5 120.0 32.1 25.8 24.5 24.0 45.8 40.3 38.5 38Cu 15.1 7.8 12.2 7.2 11.3 10.0 11.0 10.2 9.7 8.7 8.0 8.2Fe 23.1 19.1 21.3 19.8 13.4 8.6 11.6 9.2 21.3 17.5 20.1 18.1Al 15.3 14.3 15.0 14.8 9.4 7.3 9.2 8.8 12.6 10.7 12.0 11.8Si 24.1 24.1 24.3 24.0 7.5 7.8 8.2 8.0 13.1 13.3 14.3 14.0Sr 6.42 6.41 5.24 6.17 0.60 0.29 0.56 0.50 3.01 2.31 2.80 2.60B 1.10 1.05 1.34 1.20 2.27 3.00 2.70 2.60 1.28 1.52 1.70 1.64Ba 3.90 3.80 3.80 3.98 0.93 1.36 1.32 1.20 1.23 1.53 1.72 1.62Pb 0.48 0.36 1.20 0.45 1.90 1.80 3.64 2.31 0.93 0.84 2.18 1.52Sb 0.40 0.30 0.32 0.30 0.56 0.31 0.52 0.45 0.57 0.34 0.52 0.47Se 0.31 0.22 0.30 0.23 0.42 0.40 0.50 0.40 0.60 0.52 0.68 0.63Ni 0.75 0.22 0.61 0.33 1.05 0.60 0.90 0.80 0.86 0.52 0.62 0.56Mn 0.80 0.78 1.01 0.78 0.51 0.62 0.74 0.60 0.60 0.75 0.95 0.80Mo 0.05 0.02 0.01 0.01 <0.1 <0.1 <0.1 <0.1 0.1 0.1 0.1 0.1Co 0.03 0.01 0.02 0.02 <0.1 <0.1 <0.1 <0.1 <0.1 <0.1 <0.1 <0.1As 0.38 0.34 0.32 0.46 0.24 0.30 0.38 0.36 0.44 0.42 0.48 0.46Sn 0.5 0.4 0.4 0.4 0.8 0.7 0.8 0.8 0.8 0.7 0.8 0.8Ag 0.4 0.5 0.4 0.4 0.7 0.8 0.7 0.7 0.7 0.8 0.7 0.7Cd 0.12 0.11 0.12 0.11 0.16 0.17 0.16 0.16 0.13 0.15 0.15 0.18Cr 0.010 0.016 0.010 0.013 0.012 0.016 0.014 0.015 0.014 0.015 0.014 0.018
Fig. 4 Distribution of ioduriain children in Tomsk region
Medical Geology in Russia and the NIS 233
Iodine: Trace Elements and Diseasesof the Thyroid Gland in the Populationin Tomsk Region
Olga A. Denisova, NataliaBaranovskaya, Leonid P. Rikhvanov,and Georgy Chernogoryuk
The problem of iodine∗deficiency disorders (IDD) issignificant in Russia. Goiter, of mild-and-moderatedegree, is recorded in most regions of the RussianFederation (Dedov and Sviridenko, 2001). WestSiberia has moderate iodine deficiency. Areas of severeIDD are to be found in the Smolensk region, beyondand near the polar circle, near the Urals and south ofKrasnoyarsk region where the estimated incidence ofgoiter in children of prepubertal age is 38.6%, com-pared to 93% in teenagers. Iodine-deficiency studiesin Nizhny Novgorod have revealed goiter in 6.38–18% of all children, with levels of iodine ranging from92.7 to 18.8 mcg/l. The data have confirmed a strongcorrelation between iodine contents in water and theseverity of goiter and prevalence of hypothyreosis. Inalmost all districts goiter frequency in children variedfrom 30.1 to 76.8% which fell into the high degree ofendemia (Kravetz et al., 2000).
The epidemiological data and level of ioduria doesnot correspond to the distribution of iodine in soils,plants, and water in the region (Volkotrub et al., 2000).This implies a possible effect of other factors on goi-ter development. An investigation has been carried out(Rihvanov, 2005; Denisova et al., 2008) on the eco-logical and geochemical factors controlling the thyroidpathology in Tomsk region to reveal the imbalanceof trace element levels in the thyroid gland in differ-ent forms of thyroid pathology. The research materialwas a database of the Tomsk regional endocrinolog-ical register from 2001 till 2005. It contains data forabout 18,500 patients with various diseases of the thy-roid gland. The level of morbidity of diffuse non-toxicgoiter, Graves’s disease, and nodular goiter in variousdistricts of Tomsk region has been studied. The inci-dence of thyroid pathology over this period has beenanalyzed in different parts of the region and comparedwith the regional mean findings.
Geochemical data consisted of 2,100 measurementsof 24 elements determined by neutron activation analy-sis (Na, Ca, Sc, Cr, Fe, Co, Zn, Br, Rb, Ag, Sb, Au, La,
Th, U, Hf, Se, Hg, Ce, Sm, Eu, Yb, and Lu) in soils.Over a 5-year period of observation the incidence ofnodular goiter, diffuse non-toxic goiter, Hashimoto’sdisease, and acquired hypothyreosis has increased by43–52%. A high incidence rate of all these diseasesis noted in the Tomsk district. The Aleksandrovsky,Bakcharsky, Teguldetsky, and Kozhevnikovsky dis-tricts are areas with lower incidence rates of all studiedthyroid diseases. The area has been divided in threezones due to ecological, climatic, and geographicalcharacteristics (Fig. 5). The first group is around thecity of Tomsk which is exposed to anthropogenicfactors (fuel and oil industries and nuclear fuel indus-tries). The number of people with diseases is highesthere.
The second group includes the districts to the northof 58◦. It is affected by cold climate and the pathologylevel is medium in these districts. The third group ismainly an agrarian district with low disease rate. Thecontent of iodine in soils does not correlate with thethyroid disease level. Strong positive associations wererevealed between the chrome content in soil and nodu-lar goiter and between the chrome content in soil andGraves’s disease. The chrome content in the soils ofthis area exceeds the median contents in world soilswith 1.5–2 times (Fig. 6).
The southern part of Tomsk region was studiedin detail and this is a densely populated part of theregion. The main industrial activities are concentratedto this region. The highest incidences (except for nodu-lar goiter) were found in the northeastern part of thedistrict in the wind direction from the industrial activi-ties, the Tomsk-Seversk Industrial Agglomeration. Theincidence of thyroid diseases is low in the southwesternarea which is mainly agricultural. There is no signifi-cant correlation between the level of iodine in drinkingwater and diseases here. The iodine content in thesoutheastern part is high but the incidence of nodulargoiter in this part is also high. Statistically significantassociations have been found between a diffuse non-toxic goiter and the elements Cr, Br, La, U, Fe of thesouthern part of Tomsk region (Fig. 7).
Elements were analyzed by neutron activation in 97patients with different thyroid nodules. Among themeight patients had undergone surgery for cancer. Forthe rest of the patients, 41 had surgery for nodularcolloid goiter, 30 for benign adenomas, and 18 forHashimoto’s disease. The age of patients ranged from20 to 75 years. For a control group 11 thyroid glands

234 I.F. Volfson et al.
Fig. 5 The zoning of Tomskregion by the sum of indexesof thyroid pathology
Fig. 6 The correlationbetween chromiumconcentrations in soils andthyroid pathology in Tomskregion
were taken during autopsies of people. The criteria forincluding the patients were a resident of the Tomskregion for not less than 20 years. All groups of thyroiddiseases (Table 4) differ significantly from the controlin that they have increased accumulation of sodiumand iron and decreased levels of calcium and selenium.In thyroid carcinoma and Hashimoto’s disease a muchgreater increase of chromium was observed. Probablyboth deficiency and excess of this element play a role.
The studies confirmed literature data about theprotective role of selenium in the development ofthyroid pathology (Veldanova, 2000). Deficiency ofthis trace element was observed in all forms of thyroidpathology, particularly in carcinoma. In patients withcarcinoma its concentration was significantly lowercompared not only with the control but also withthe group of patients with nodular colloid goiter. Theincrease of its deficiency versus the excess of many

Medical Geology in Russia and the NIS 235
Fig. 7 The correlationbetween elementconcentrations and thyroidpathology in the southern partof the Tomsk region
Table 4 Chemical elements in the thyroid gland with different forms of pathology and control, mg/kg (mean)
Forms of the thyroid pathology
ElementNodular colloidgoiter
Benignadenoma
Hashimoto’sdisease
Thyroidcarcinoma Control
Na 3,113∗ 3,305∗ 2,733∗ 2,600 1,326Ca 2,904∗ 1,850∗ 2,011∗ 2,785∗ 5,383Sc <0.002 0.004∗ 0.006 0.006 0.009Cr 0.63 0.46 0.76∗ 1.03 0.34Fe 301∗ 410∗ 256∗ 301∗ 103Co 0.07 0.1036 0.087 0.064 0.095Zn 91 96 85 97.4 88Br 5.71∗ 14∗ 5.34∗ 6.6∗ 2.9Rb 2.02 3.3 3.87∗ 1.0 1.15Sb 0.06 0.0414 0.1269∗ 0.054 0.04Au 0.01 0.009 0.012 0.01 0.01La 0.25 0.21 0.24 0.31 0.26Sm 0.06∗ 0.05 0.04 0.08∗ 0.04Th 0.02 <0.005 0.022 0.018 <0.005U <0.1 0.20 0.21 <0.1 <0.1Hf 0.02 0.022 0.013 0.014 0.012Se 1.69∗ 1.63∗ 1.62∗ 1.49∗ 2.8Hg 0.35∗ 0.3∗ 0.22 0.71∗ 0.16
Note: ∗ – significantly different from the control (p < 0.05)
other trace elements is observed at the age of riskfor the development of thyroid pathology at ages of41–55.
In all patients (except patients with carcinoma) thelevels of selenium in the thyroid tissue correlate pos-itively with the levels of Zn and Ca. The level of

236 I.F. Volfson et al.
these elements in the thyroid tissue correlates nega-tively with the iron level in nearly all groups. Besides,in some groups negative correlations between seleniumconcentration and those of bromine, cobalt, chrome,mercury, antimony, and thorium were found. Theremay be two explanations of these correlations. Eitherselenium acts as antagonist for the above-mentionedtrace elements or these trace elements substitute forselenium. It is possible that via this mechanism ofselenium substitution a known negative role of cer-tain elements in regard to the thyroid gland is found.Selenium deficiency is accompanied with the accu-mulation of many nonessential elements. Bromine inparticular is the most powerful competitor of iodinein the enzymes (Kudo et al., 2006). The unfavorableeffect of mercury and cobalt on the thyroid glandwas also revealed (Ellingsen et al., 2000; Veldanova,2000). The positive associations of selenium with thesetrace elements can be explained by formation of com-plexes with them as well as their common sourcesand chains of technogenic migration (Glazovsky,1982). By substituting for and combining with sele-nium they aggravate its deficiency which worsensthe thyroid metabolism and hormonal synthesis, andresults in the decrease of cell resistance to oxidantstress.
Thus, iodine deficiency depends on both anthro-pogenic and natural geochemical factors in the Tomskregion. This information may give an opportunityto predict thyroid pathology in the population andto plan for preventive measures. Goiter multiele-ment imbalances necessitate the correction of thebodys microelement profile not only with iodine.It is necessary to plan for nutrition recommen-dations for selenium and calcium. Correction ofchromium deficiency would, however, be difficultbecause of an excessive level of this element in thethyroid gland. In Tomsk there are institutes collab-orating and carrying out research in medical geol-ogy, for example, in the hospital and departments ofSiberian State Medical University and the Geoecologyand Geochemistry Department of Tomsk PolytechnicUniversity. There are plans for studying the influenceof geochemistry on morbidity, monitoring of iodinedeficiency in the region, microelement composition ofthe environment, and creating regional databases onthe microelement composition of human organs andtissues.
Selenium and Strontium
Iosif F. Volfson
Selenium is a trace element with very low crustal abun-dance (Fordyce, 2005; Taylor and McLennan, 1985;Frankenberger and Benson, 1994). Phosphatic rocks,organic-rich black shales, coals, and sulfide mineral-ization, as well as other sedimentary rocks are impor-tant seleniferous sources (Fleming, 1980). Seleniumoccurs in soils in the form of selenites (Se4+), selenates(Se6+), selenides (Se2–), and elemental selenium (Se0).The form of Se is dependent on pH and redox condi-tions of soils and type of underlying rocks (Kabata-Pendias, 1998). The main natural source of seleniumis from food (Fordyce, 2005; Skal’ny, 1999; Skal’nyand Kudrin, 2000). Selenium is accumulated in thekidneys, liver, marrow, myocardium, pancreas, lungs,skin, and hair. The normal adult daily demand is 20–100 μg of selenium. At parental feeding, the humanorganism must uptake no less than 30 μg seleniumdaily, because it is essential for the metabolism (WHO,1987, 1996). Deficiency of selenium occurs if the dailyintake of this element is 5 μg or less. The threshold ofselenium toxicity is 5 mg/day. Current recommenda-tions of the World Health Organization (WHO, 1987,1996) concerning the daily Se uptake are 30 μg forfemales and 40 μg for males. In Russia, the value isestablished at 63 μg (Ermakov, 2004). Selenium is animportant element that has multiple defensive func-tions in the human organism, strengthens the immunedefense, and increases the life time of humans.
Both the Keshan disease (named after the KeshanCounty afflicted by this disease), which is manifestedas degeneration of the heart muscle and chronic car-diomyopathy, and the Kashin–Beck disease (or Urovdisease in Russia), which is manifested as dystrophyof muscles, endemic osteoarthropathy, oncologic dis-ease, and iodine deficiency (goiter) are conditioned bylow contents of selenium in the food chain (Chen et al.,1980; Fordyce, 2005). In addition, the deficit of sele-nium in animals leads to the “white muscle disease,”which is characterized by the dystrophy of muscles,necrosis of liver, and deficit of protein (James et al.,1989).
An excess Se concentration has been detected insome regions of Yakutia, Tuva, and the southern Urals.Selenium toxicosis is recorded among animal and

Medical Geology in Russia and the NIS 237
human population and is conditioned by the surplusuptake of this element together with plants (Astragalus,Stanlea, Happlopappus, and others), which serve as Seaccumulators. Such selenium toxicosis is manifestedas the “alkaline disease.” The main manifestations ofselenium excess are unstable emotional conditions;garlic scent from mouth and skin (due to the formationof dimethyl selenide); nausea and retching; abnormal-ities of the function of liver; erythema of skin; rhinitis,bronchoalveolitis, and edema of lungs (due to breath-ing the selenium vapor); hair loss; and nail fragility(Hough, 2007; Selinus and Frank, 2000; Ermakov,2004; Fordyce, 2005).
Calcium, phosphorus, and iodine are a group of ele-ments, the efficiency of which in the body dependson selenium. Disorder of phosphorus and leachingof calcium from the bones under acute deficiency ofselenium in the food chain provokes the developmentof ostheoarthropatic disorders (Urov or Kashin–Beckdisease) (Chen et al., 1980).
In Russia, selenium-deficiency belts are found inthe northwestern and eastern regions, such as Yakutiaand Transbaikalia. In Russia and NIS much interestis focused on selenium as an essential element andits effect on humans. Regions deficient in seleniumare Transbaikalia, Karelia (the Kola Peninsula), theLeningrad region, and the Republic of Udmurtia. TheMoscow area and other areas of the Central part ofRussia are characterized as a belt of selenium defi-ciency. The deficiency of selenium in humans is causedby low concentrations of selenium in water, soil, andfood (Hough, 2007).
The endemic Urov disease (Kashin–Beck disease)was for the first time described in Transbaikalia andlater identified in the China and Kazakhstan high-lands (Vinogradov, 1938; Vinogradov, 1939; Kovalsky,1979). There the deficiency of iodine and seleniumwas revealed in soil and thus in the food chain.The Gazimurozavodsky and Uletovsky areas in theTransbaikalia region are considered to be endemic inselenium and related cardiovascular diseases, retarda-tion of growth, and osteopathy (osteoarthritis deformasendemica) (Ermakov, 1992, 2002, 2004).
The significance of strontium for the spreading ofan endemic disease such as the Kashin–Beck (or Urov)disease is a subject of discussion between Russian andforeign scientists (Allander, 1994; Vinogradov, 1939,1964; Chan et al., 1998; Cabrera et al., 1999; Fordyce,
2005; Kovalsky, 1974, 1977). As was shown above,recent studies of the essentiality of selenium reveal astrong dependence between the four essential elementsSe, I, P, and Ca in the human body and the spreading ofsome endemic and somatic (cardiovascular, oncolog-ical, endocrine, bone, etc.) diseases (Fordyce, 2005).Because of high contents of strontium in groundwaterand surface waters, the Transbaikalia region is moresusceptible to the Urov endemic (Kashin–Beck) dis-ease and osteoporosis (increased fragility of bone sys-tem) in comparison to other areas of the world (Avtsyn,1972; Vinogradov, 1939, 1964; Kovalsky, 1974, 1977).Since strontium, an analogue of calcium, replacesCa in bone tissues, endemic osteoarthropathy (boneossification) is quite possible (Avtsyn, 1972; Avtsynet al., 1991; Kovalsky, 1974, 1977; Kravchenko, 1998;Golovin et al., 2004). The Sr/Ca ratio in the endemicarea at the Urov basin river is more than 36 timeshigher than in chernozem soils. In addition to theKashin–Beck disease by excessive strontium in soilsand waters (up to 5.5 × 10⁻³%) and low calcium(<3 × 10⁻⁴%), cobalt and iodine in the food chainin clayish and sandy soils of the endemic areas arerepresented by goiter, vitamin D-resistant form of rick-ets as well as chondrodystrophy in children and bonefragility (ossification) (Vinogradov, 1939; Kovalsky,1974).
Arsenic
Igor M. Petrov and Iosif F. Volfson
Introduction
Arsenic (As) is an element detected in low concentra-tions in virtually every part of the environment. Smallquantities of arsenic (about 0.1 mg) are always foundin the human body. Arsenic is concentrated in thelungs, liver, skin, nails, and small intestine (Versieck,1985; Finkelman et al., 1999; Mandal and Suzuki,2002; Smedley and Kinniburgh, 2005). The esti-mated safe dose of arsenic is 12–25 μg/day (Nielsen,2000). Arsenic is efficient as a hormone material andactivator. Arsenic seems to indirectly stimulate the

238 I.F. Volfson et al.
function of the hypophysis. In small doses (less than0.1 mg), As2O3 is efficient as a remedy (Paul and Paul,2002). Using small quantities of this element, one canreduce basal metabolism and oxygen consumption andenhance the assimilation of fat and formation of newred blood corpuscles in the bone marrow. In accor-dance to W. Paul and H. Paul (Paul and Paul, 2002) anArabic physician (850–923 AD) recommended As2O3
as a healing remedy in cases of blood deficiency, neu-rosis, and skin diseases. As-rich mineral waters arealso efficiently used in cases of chlorosis, rachitis, neu-ralgia, nervous asthma, body weight reduction due tothe basedow-type disease, physical debility, and ner-vous conditions of inanition (Paul and Paul, 2002).Arsenic can concentrate in the human body due to theshortage of selenium and, thus, promote the deficiencyof selenium. Antagonists of As are S, P, Se, vitaminsC and E, and amino acids. Arsenic blocks the intake ofZn, Se, vitamins A, C (ascorbic acid), and E, and aminoacids (Skal’ny, 1999; Agadjanyan et al., 2001). It isknown that a single dose of 0.1 g of As2O3 can havea deadly effect, but the sensitivity of human organ-ism for As2O3 fluctuates very much. For instance,mountain climbers in the Tyrol used to eat bread withlard or butter containing traces of metallic arsenic topromote appetite, produce rosy complexion, and pre-vent altitude sickness (Paul and Paul, 2002; Bentleyand Chasteen, 2002). Most cases of human toxicityfrom arsenic have been associated with exposure toinorganic arsenic. Inorganic trivalent arsenate (As3+)is 2–10 times more toxic than pentavalent arsenate(As5+).
High contents of arsenic are found in water, soil,and air in regions of sulfide deposits. There are someareas in Russia and NIS which are known to behigh in arsenic: the Central and South Urals, the FarEast, the Fergana Valley as well as areas of youngorogeny and volcanic activity – the Caucasus, theKamchatka Peninsula, the East-European platform, theWest-Siberian platform, the Scythian-Turan plates, andother (Fig. 8). But there are few epidemiological stud-ies in Russia and NIS on arsenic. It has been possibleto forecast unfavorable regions in Russia and NIS. Asignificant health concern is the enormous deterioratedareas of metallurgy industries in Russia, Kazakhstan,Tadzhikistan, and Armenia, providing enormousamounts of arsenic oxides, formed by roasting of gold-bearing ores and released into the atmosphere, soil, andgroundwater.
Arsenic Emissions of Russian Metallurgyand Its Environmental Impact
Arsenic danger for human health is clearly underes-timated in Russia especially considering the harmfulindustrial emissions of the element. This section willpay attention to the gaseous metallurgical emissionscontaining arsenic mainly in the form of trioxide(As2O3), which originates from roasting and smelt-ing of copper, zinc, lead, gold, and other concentratesof nonferrous and precious metals. Regular monitor-ing of arsenic pollution is not conducted in Russia;data on the arsenic content in the atmosphere in largeindustrial cities are not available (permissible level ofarsenic trioxide content in air is 0.3 mg/m3). Arsenicprecipitated from air is accumulated in soil and snowand is transferred to surface and groundwater and isfinally found in crops and food, grown near metallur-gical industries (in private gardens and farms and pri-vate homestead lands). The content of arsenic in oresranges from 0.01% in copper–nickel ores to 1.5–2% ingold–arsenic ores (Table 5).
Copper and copper–zinc ores are characterized byintermediate arsenic contents (0.05–0.3%), and sim-ilar contents are characteristic also for copper andzinc concentrates obtained from the ores. However,because of the large volumes of concentrate pro-cessing, the amount of arsenic from the Ural coppersmelters is considerable (900–1,000 tonnes per yearfrom our estimates). A large part of this arsenic goesdirectly into the atmosphere. It is estimated that arsenicfrom each Ural smelter emitted into the atmosphereranged from 100 to 300 tonnes per year until (Petrovet al., 2007). The maximum arsenic emissions are fromJSC Svyatogor, Krasnouralsk, Sverdlovsk regions. Inrecent years, however, some smelter operators haverealized that it is necessary to reduce the atmo-spheric emissions. For instance the reconstruction atSUMZ (Revda, Sverdlovsk region) resulted in consid-erably lower arsenic atmospheric emissions – from 310tonnes in 1993 to 14 tonnes in 2004.
It should be noted, however, that most of the Uralsmelters have operated for many years (more than80–90 years) and have caused catastrophic arsenic pol-lution of the natural environment in these regions.For instance, Karabashmed (former Karabash cop-per smelter in the Soviet era) operating since 1907,its arsenic atmospheric emission totaled about 96,000

Medical Geology in Russia and the NIS 239
Fig. 8 Distribution of arsenic in Russia
Table 5 Arsenic content in some ore deposits in Russia
Deposit Ore type Degree of development Operator Arsenic content, %
Nezhdaninskoe Au Mined Nezhdaninskoe Zoloto (Polyus) 1.72Maiskoe Au Being prepared 0.64–0.97Dzhusinskoe Cu Standby 0.25Uzel’ginskoe Cu-Zn Mined Uchaly GOK 0.21–0.39Kotsel’vaara-Kammikivi Cu-Ni Mined Pechenganickel (Norilsk Nickel) 0.18Priorskoe Cu-Zn Standby 0.18Podol’skoe Cu Standby 0.11–0.23Molodezhnoe Cu-Zn Mined Uchaly GOK 0.1–0.3Uchaly Cu-Zn Mined Uchaly GOK 0.1–0.2Gai Cu-Zn Mined Gai GOK 0.1–0.15Pokrovskoe Au Mined Peter Hambro Mining 0.08Burgachanskoe Sn Standby 0.08Zapolyarnoe Cu-Ni Mined Pechenganickel (Norilsk Nickel) 0.066Krasnogorskoe Pb-Zn Standby 0.06Novo-Shemurskoe Cu-Zn Being prepared UMMC 0.035–0.05Vostok Cu-Ni Mined Pechenganickel (Norilsk Nickel) 0.01Semiletka Cu-Ni Mined Pechenganickel (Norilsk Nickel) 0.01

240 I.F. Volfson et al.
Fig. 9 The territories of Russia, polluted with arsenic frommining-metallurgical activities. Areas of technological pollutionof arsenic: 1 – Karabash, 2 – Verkhny Ufalei, 3 – Kirovgrad , 4 –Revda, 5 – Rezh, 6 – Plast, 7 – Krasnouralsk, 8 – Mednogorsk,9 – Vladikavkaz, 10 – Monchegorsk, 11 – Novosibirsk, 12 –
Svirsk. Natural objects with arsenic in high content: 13 –Chelyabinsk territory, Uzelginskoye cooper and zinc deposit,14 – Orenburg territory, Dzhusinskoye cooper and zinc deposit,15 – Amur territory, Pokrovskoye gold deposit, 16 – Republic ofSakha – Yakutia, Nezhdaninskoye gold deposit
tonnes! Statistics of arsenic atmospheric emission ofthe industry is seen in Figs. 9 and 10. The highestvolume of emission are from 1970s to 1980s. By nowthe levels have decreased significantly but neverthelessremains considerable (Petrov et al., 2007).
The ecological situation in Karabash city(Chelyabinsk region), adjacent to the smelter issimply catastrophic. For instance, in 2001 the mor-tality rate in the city was 20.7 per 1,000 persons(compared to 15.4 in Russia as a whole); in 2005, thefigure slightly decreased to 18.8 (15.2 in Russia). Thefrequency of neoplasms of the adult population of thecity is 1.18 times higher compared to the baseline,endocrine system diseases – 1.56 times, hemopathies –2.85 times, and congenital abnormalities – 1.4 times.Cases of birth of infants without kidneys haveoccurred. In 2004, neonatal mortality in Karabash citywas 20.2 per 1,000 infants (Revich, 2001).
Mednogorsk copper smelter (Orenburg region) pro-duces annual atmospheric emissions of around 50tonnes arsenic, accompanied by other pollutants.Investigations in 2,000 revealed 1,555 cancer patientsper 10,000 persons (and 226 patients died of cancer).Neonatal mortality in the city is 1.5–2 times higherthan in Orenburg region as a whole. Note that healthhazard in cities, where copper smelters are located, arecaused by a spectrum of toxic components in additionto arsenic, for instance, lead, sulfur compounds, etc.(Belan, 2005a, 2005b, 2005c, 2007). Arsenic emissionlevels at Russian industries manufacturing zinc, lead,and tin metals are lower compared to copper smeltersand ranges 0.05–0.6 tonnes per annum (Belan, 2005a,2005b, 2005c; Gaev et al., 2006; Petrov, 2008).
The “leader” in arsenic atmospheric emission is theNovosibirsk tin combine (NOK), processing tin con-centrates from Far East, containing 1–6% As. The

Medical Geology in Russia and the NIS 241
Fig. 10 Average annual arsenic emission for the period ofthe Karabash copper smelter operation. Source: «InfoMine»on the basis of data from web-site of Karabash city(http://www.karabash.ru/)
combine is located in Novosibirsk city with a pop-ulation above 1 million inhabitants. Outside the citythe combinate stores arsenic-containing cakes, origi-nated from the tin concentrate processing. By now,about 6,000 m3 has been stored, and the dump does notmeet modern requirements. The ground at the NOKdump, now used for buildings, contained on the sur-face 589 mg/kg As (the permissible level is 10 mg/kg)(Revich, 2001).
Arsenic containing zinc concentrates, with up to0.1% As, are processed by the plant Electrozinc(Vladikavkaz, North Ossetia-Alania). At the presenttime the arsenic atmospheric emission of the plant isbelow 0.1 tonnes per annum. In recent years, instead ofprocessing lead concentrates (also containing As), theplant is involved in battery scrap processing, also envi-ronmentally dangerous. Electrozinc has been operatingfor about 100 years but has paid attention to environ-mental protection only in recent years. In Vladikavkazcity, in addition to atmospheric emission, environmen-tal hazards are also caused by solid wastes producedby Electrozinc (and Pobedit plant), covering around 40Ha in the city. These wastes contain more than 8,000tonnes arsenic. In dry season, the waste dumps activelypollute the atmosphere and soils with arsenic overlarge areas. The ecological situation in Vladikavkazis also considered to be close to catastrophic. In thecity, where around a half of North Ossetia’s populationlives, birth of infants with congenital abnormalities
is 65–69 per 1,000 infants. Neonatal mortality in thecity is now above 20 (per 1,000). (Menchinskaya andZangiyeva, 2007).
Because of larger volumes of nickel ore process-ing, compared to the Ural smelters, other nickelcombinates in Russia – Norilsk, Pechneganickel,Severonickel – produce large arsenic atmosphericemissions. However, reliable data on the combinates’emission are not available, except data on arsenic con-tent in dust atmospheric emission of Severonickel – 7–11 tonnes per year. Among other places with increasedarsenic content in the natural environment are roastingplants (Plast city, Chelyabinsk region) processing dustsfrom nonferrous metallurgy activities (containing up to70% As) and As-containing wastes of gold mining overthe whole of Russia. From 1950s to 1990s the indus-trial atmospheric emission was up to 100 tonnes peryear but in recent years, after introducing wet clean-ing of exhaust gases, the emission decreased to 7–10tonnes per year.
Investigations have shown arsenic in hair andnails of the whole population of Novotroitsk settle-ment, where a roasting plant was located. Arsenicis also found in mince and berries, collected nearby.Concerning cancer, Plast city is among the lead-ers in the Chelyabinsk region. Arsenic atmosphericemissions are also generated from ferrous metallurgy.Arsenic is contained in coke (5–7 ppm) and iron oresinter (up to 20 ppm) is used in iron production. Inthe process, large amounts of arsenic are transferredto gaseous phase in the form of As compounds, butmonitoring of arsenic atmospheric emission of ferrousmetallurgy industries is not conducted. Besides arsenicatmospheric emissions, health hazards are producedby technogenic arsenic, accumulated in the form ofcompounds in tailing ponds, metallurgical wastes, ashdumps, etc. For instance the content of arsenic in efflu-ents of some concentrators is as high as 400 mg/l.Concentration tailings containing pyrite with arsenicare actively oxidized in the tailing ponds that cantransfer arsenic to groundwater. The largest tailingponds containing pyrite-bearing tailings are found atJSC Gai GOK (Orenburg region), JSC Ychaly GOK,and JSC Bashkir copper–sulfur combine (JSC BCSC,Bashkortostan) (Belan, 2000, 2005a, 2005b, 2005c,2007; Petrov, 2008). Large sources of arsenic pollutioncan be found in wastes of the Angarsk metallurgi-cal plant, Irkutsk region. The plant manufactured theso-called “white arsenic” in 1934–1949. The arsenic

242 I.F. Volfson et al.
pollution sources are the plant ruins and wastes ofarsenopyrite cinders (around 130 kt). Areas of dan-gerous soil pollution stretches along the water storagebasin shore (about 9 km long and 3–3.5 km wide). Inthis area, As content in the soils is 300 times abovethe permissible level. This arsenic penetrates into thegroundwater: drilling reveal arsenic at a depth of 20 mclose to a permeable aquifer.
In conclusion arsenic and health in Russia is cru-cially important. Besides a need for permanent mon-itoring of arsenic in atmosphere, water, and soil, onekey problem is the introduction of effective tech-nologies for gas cleaning, as well as processing ofAs-containing materials, and the building of reliablestorage facilities for As-containing wastes. Of spe-cial importance is the need for a research program onthe impacts of arsenic and its compounds on humanhealth.
Medical Geology in Connectionto Mining
Armen K. Saghatelyan, Lilit V.Sahakyan, Olga V. Menchinskaya,Tamara D. Zangiyeva, M.Z. Kajtukov,and Z.H. Uzdenova
Medical Geology in Armenia and Mining
The assessment of the impact of the mining industry onthe environment and on trophic chains and humans wasperformed at the Kajaran copper–molybdenum depositlocated in south Armenia. Monitoring of heavy metalpollution of the soils of Armenia’s regions (Grigoryanand Saghatelyan, 1990) has shown that Mo, Cu, Pb,and a number of other metals in Armenia have highnatural background values often exceeding the estab-lished maximum acceptable concentrations (MAC) forthese elements. When assessing anthropogenic pol-lution, it is also necessary to consider the elementconcentrations in the geological environment. Thusassessments should include the elements in both thenatural and the anthropogenic environment.
An example of such an approach is the situationaround the Kajaran deposit. The deposit is situated
in the boundaries of the ore region identified byV. Kovalsky (Kovalsky, 1974) as a biogeochemicalprovince enriched by Mo and Cu. The concept of “bio-geochemical province” was suggested by Vinogradovas a biogeochemical region based on the homogene-ity of life and geochemistry. According to Vinogradov“Deficiency or the excess of an element in the envi-ronment vs. the accepted Clark value, induces changesin the flora and fauna of the given region or bio-geochemical province” (Vinogradov, 1938). To obtaina generalized characteristic of the geochemical sit-uation of Armenia’s ore regions, Saghatelyan stud-ied the element composition of alluvial formationsbecause the composition of such a matrix reflectstypomorphic components and their contents in thebiogeochemical province (Saghatelyan, 2004). For cer-tain ore regions, ranked series of natural associationsof chemical elements have been calculated throughstandardizing element contents by their backgroundcontents. For the Kajaran ore region, the followingrange of typomorphic elements was established: Mo–Cu–Sn–Pb–Zn–Mn–Be. As seen from the series, it isdominated by the two basic ore elements of the Kajarancopper–molybdenum deposit. The deposit is huge witha reserve of over 1 billion tons of ore, containing about8% of the global reserves of Mo. The deposit wasmined for copper as far back as the 1850–1860s. In1951 the Zangezur mining and dressing plant was con-structed and has been operating with daily output andtreatment up to 24,000 tons of ore containing 0.055%of Mo and 0.21% of Cu. Besides base elements, Re,Se, Te, Au, Ag, Pb, Zn, Bi, Cd, Sb, As, Co, Ni, Hg arealso found in the ore.
The mining and dressing plant is a dominant enter-prise at the city of Kajaran. Studying the city’ssoil pollution concerning heavy metals (Saghatelyanet al., 2008b) the background-standardized meanhas been reported: Mo(29.8)–Cu(5.1)–Pb(2.2)–Co(1.7)–Zn(1.4)–Mn(1.2).
In brackets, the ratio of excess vs. the backgroundis given. This clearly demonstrates the anthropogenicimpact on the natural background which is impor-tant to know when establishing values of maximumpollution. To identify the risks connected with anthro-pogenic pollution the same has been done for drinkingwater and the food chain. The risk factors are shown inFig. 11.
During a period of time, mining waste wasdeposited in three tailing dams located close to the

Medical Geology in Russia and the NIS 243
IDENTIFYING RISK FACTORS
SOIL
Tailingrepository
Atmospheric
Irrigation
Agriculturalcrops
Vegetablediet
MilkDrinkingwater
POPULATION
WATER AIR FOOD CHAINS
Thecity
Fig. 11 Identification of riskfactors to the population(dotted line indicatessignificant risk factors)
city. In the 1980s the tailing dams were re-cultivatedand covered with a 30-cm soil layer. After the for-mer USSR disintegration and the following social andeconomic crisis the tailing dams were abandoned andgradually local people started using them for agricul-tural purposes as pastures and for home gardening.Studies of the former tailing dams indicate that insome places the recultivation layer has been eroded andthe material is actively weathered and is transportedas dust into the city. Thus the tailings are pollutionsources adding to the quarry, the mining, and the dress-ing plant. Ecological and geochemical assessments ofthe contents of heavy metals in the soils of the tail-ings indicate high contents of Mo, Cu, V, Hg, As.The analysis of agricultural crops growing in theseareas (Saghatelyan et al., 2007a, b) indicate MAC-exceeding contents of Cu, Mo, Pb, Ni, Cr, Hg in thebasic dietary products such as potatoes, beans, beet,herbs. A substantial part of the tailing repositories areused as pastures (Fig. 12) and the analysis of the fod-der plants shows excessive contents of many elementsvs. MAC. In particular, in the most widespread grass-clover (Trifolium pretense L.) Mo, Ni, Cr, Hg showed131.0, 6.3, 20.2, 28.8 time excess vs. MAC. In order tomonitor further migration of heavy metals in the foodchain also the quality of milk of the cows grazing onthe studied site have been studied. The results showexcessive Pb, Hg, As.
This herd of cows grazing on the Voghchi tailingrepository site indicates that many families living in thecity of Kajaran regularly consume agricultural crops
high in toxic elements. Studies of drinking water sup-plied to the city indicate no excess of heavy metalsabove the accepted standards.
The major air pollutant in the city is from dust. Thedust load in the city shows a season-dependent varia-tion: the mean deposition in winter is 101.7 kg/sq km,in summer – 418 kg/sq.km reaching 800 kg/sq.km ineastern and western parts of the city. The main ele-ments are Mo(7.5)–Cu, Zn(4.1)–Ni(3.3)–Pb(2.6)–Mn(1.1).In brackets, the ratio of the excess vs. the backgroundis given. Also Hg, As, Cd were found, posing an addi-tional risk factor for public health (Saghatelyan et al.,2008a).
The assessment of risk factors indicates that thecitizens are exposed to a heavy load of environmen-tal pollution with heavy metals that can enter thebody through respiratory tracts and the food chain. Toestablish the impact level on humans, children wereselected as the most sensitive risk group in the pop-ulation (Saghatelyan et al., 2007a, b). Hair samplesof 12 children of preschool age were collected. Theresults of hair analyses compared to biologically allow-able levels (Skal’ny and Kudrin, 2000) are shown inFig. 13.
Based on the biological role of microelements andtheir involvement practically in all biological processesrunning in the human organism, to express all patho-logic processes induced by microelement deficiency,excess, or disbalance, a notion called “microelemento-sis” was introduced (Avtsyn et al., 1991). BAL deter-mines lower and upper limits of standard contents of

244 I.F. Volfson et al.
Fig. 12 Herd of cows grazing on the Voghchi tailing repositorysite
elements in the organism. The research has providedevidence of significant risk factors to the public healthas a result of the operation of the Kajaran mining anddressing plant. The considerable excess of heavy metalcontents in the hair of children vs. biologically allow-able levels is an alarming fact supporting the urgencyof public health protection actions.
Health Effects of Tungsten–MolybdenumMining
Russia is one of the few countries in the worldthat is self-supported with metals but this has alsocaused widespread effects on the environment andhuman health by mining and processing. In this sec-tion the effects on the environment and on humanhealth in Tyrnyauz (Republic Kabardino-Balkaria) arediscussed using the technology of ECOSCAN. TheECOSCAN technology was developed in IMGRE forsuch projects in the early 1990s (Menchinskaya andZangieva, 2004). It is based on the exposure of connec-tion between environmental geochemical parametersand epidemiological markers of disturbance in popu-lation’s health. Ecological assessment of environmentcan be supplemented by modeling and calculating theecological hazards on given habitats, as well as recom-mendations for rehabilitation of the disturbed naturalhabitats and preventive medical measures for recover-ing the population’s health. The ECOSCAN technologyuses geochemical and epidemiological data to assess
the health impacts. Data for fertile women and childrenof 0–14 years were used in this work.
Tyrnyauz is a tungsten–molybdenum depositincluding elements such as Cu, Bi, As, Ag, Sn, Zn, Se,Te, Re, Ge, Ga, Cd, and In. Before 1994 Tyrnyauz wassecond in order in Russia concerning air pollution butis now shut down. The industrial activities are locatedon a slope 300 m above the city. Detailed geochemicalsamples of soil (A and B layers), sediments, surfacewater, and plants have been carried out (a total of829 samples). As a result of data treatment of the soilsampling it was detected that 30% of the examinedterritory was heavily contaminated, many times morethan limited permissible concentrations (LPC) forseveral of the elements. Forty percent of the soil wasslightly contaminated, and only 30% of the territoryis characterized by background dispersion of theelements, not exceeding LPC.
The analysis found three genetically differ-ent groups of elements: technogenic, natural, andurbanogenic. The first group includes ore elementsand related elements such as W, Mo, Cu, Bi, As,Sn, Zn, Ag, and Ge (high concentration and generaldispersion). The maximum is in the areas of the tailingdepots or in the central part of the city (W 1,500 ppm,Mo > 300 ppm, Cu < 8,000 ppm, As < 6,000 ppm,Bi > 80 ppm, Sn > 100 ppm, Ge 15 ppm). IncreasedAg values (0.15–10.0 ppm) are typical for areas oftailing deposits and for the part of the city intendedfor building. Unfortunately, it is only possible toestimate how many times the concentrations exceednormal values for As, Cu, and Sn. For Cu, As, andSn, LPC is exceeded 240, 3,000, and 22 times,respectively.
The second group of elements is Cr, Co, Ni, V,and B. These reflect the natural geochemical back-ground in the area. Increased concentrations are foundin the valleys and increase when moving away fromthe city. Pb is typical for the third group. Its concentra-tions are very low in the ore and also in the tailings.However, increased concentrations of Pb, exceedingLPC 2–3 times, are typical for the housing areas witha maximum of 5,000 ppm.
Hydrochemical results from Bucksun river after theOre Mining and Processing Enterprise (OM&PE) hadstopped did not detect any high values of the main pol-lutants. The composition of water was analyzed for 73elements at the analytical centre of IMGRE (Instituteof Mineralogy, Geochemistry and Crystal Chemistry

Medical Geology in Russia and the NIS 245
Girls
KR
–1
KR
–4
KR
–5
KR
–6
KR
–12
KR
–13
Cumg/kg
35.0
30.0
25.0
20.0
15.0
10.0
5.0
0.0
KR
–16
KR
–17
KR
–2
KR
–3
KR
–14
KR
–15
Boys
0.40.40.50.5
Cdmg/kg
0.20.20.30.3
0.0
KR
-1
KR
-4
KR
-5
KR
-6
KR
-12
KR
-13
KR
-18
KR
-17
KR
-2
KR
-3
KR
-14
KR
-15
0.10.1
Girls Boys
Momg/kg
0.4
0.4
0.2
0.2
0.3
0.3
0.0
0.1
0.1
KR
-1
KR
-4
KR
-5
KR
-6
KR
-12
KR
-13
KR
-18
KR
-17
KR
-2
KR
-3
KR
-14
KR
-15
Girls Boys
Asmg/kg
1.61.8
1.41.21.00.80.60.40.20.0
KR
-1
KR
-4
KR
-5
KR
-6
KR
-12
KR
-13
KR
-18
KR
-17
KR
-2
KR
-3
KR
-14
KR
-15
Girls Boys
Pbmg/kg
6.0
7.0
2.0
1.0
3.0
4.0
5.0
0.0
KR
-1
KR
-4
KR
-5
KR
-6
KR
-12
KR
-13
KR
-18
KR
-17
KR
-2
KR
-3
KR
-14
KR
-15
Girls Boys
Nimg/kg
6.0
7.0
2.0
3.0
4.0
5.0
0.0
1.0
KR
-1
KR
-4
KR
-5
KR
-6
KR
-12
KR
-13
KR
-18
KR
-17
KR
-2
KR
-3
KR
-14
KR
-15
Girls Boys
a
c d
f
g
e
Girls
KR
–1
KR
–4
KR
–5
KR
–6
KR
–12
KR
–13
Hgmg/kg1.2
1.0
0.8
0.6
0.4
0.2
0.0
KR
–16
KR
–17
KR
–2
KR
–3
KR
–14
KR
–15
Boys
b
Fig. 13 (a–g). The contents of heavy metals in the hair of children living in the city of Kajaran. Biologically allowable levels:Lower limit of BAL (__); Upper limit of BAL ( - - )
of Rare Elements). Analysis of drinking water was alsodone. All the elements are related to the second—thirddanger class (classification of elements, based on haz-ard degree for human, accepted in Russia) except for
those elements which have no danger class (Ga, Cs,La, etc.). Concentrations exceed LPC only for Li andB. Maximum levels for Li (by 6 times) and V (by 2.6times) were found in drinking water. Also high levels

246 I.F. Volfson et al.
of Mo were found in drinking water. All samples alsohave high iron levels.
For biogeochemical sampling, trees (poplars) werechosen as they are spread widely in the region. Twenty-one leaf samples were taken. The distance between thesamples was 500 m inside the city and 1,000 m outside.All the samples have high concentrations of Mo (20–30 ppm) and W (10 ppm), on the right bank of Bucksunopposite the OPF (Ore-Processing Factory). The high-est concentrations (1,500 ppm) are for Zn and B. HighZn is typical for urban areas. High V (<1,500 ppm) istypical for the all the valley and is explained by turma-linization and high V in granites located in the valley.There are also high levels of Pb and Cu.
Health Aspects
The most sensitive persons to xenobiotics (a chem-ical compound, drug, pesticide, or carcinogen thatis foreign to a living organism) are fertile womenand children. An indication of the bad environmen-tal conditions is pathological changes in people’shealth. The emphasis is on detection of the ecology-depended pathology. Examples of indexes are perinataland infant mortality, miscarriages, inherent defects,childish malignant growths.
The analysis of the health indexes of Tyrnyauz wasdone by medical data from the Elbrus district in therepublic Kabardino-Balcaria which includes Tyrnyauz.The indexes of 1997 and 1999 were used (Bolshakovet al., 1999). The examined group included fertilewomen and 1-year-old children. The perinatal mortal-ity rate is divided into two groups: the perinatal deathand death on the 1st week of life (28th week of thepregnancy – 7th day of life). In 2 years the perina-tal mortality increased five times (Table 6). During thesame time the neonatal mortality rate increased threetimes. The causes of mortality are inherent defects and
Table 6 Data on perinatal mortality
Year of birth Year 1997 Year 1999
Number of childrenborn
348 283
Prematurely born 6.1% 8.1%Perinatal mortality 3.5% 20.1%Early neonatal
mortality3.5% 11.5%
anomalies of developing. Examination of the fetusesdetected inherent defects such as unencephalopathy(2), enteric athrasy (1), and hydrocephaly (1). All thefetuses were aborted. There was also a tendency ofincrease of the extra-genital pathology and complexpregnancy (Kulakov et al., 1996).
Ecological Hazards Affecting People’s Health
Ecological hazards were calculated in the examinedareas according to the method of the EnvironmentProtection Agency (EPA) in the United States. Thismethod is based on counting the hazard index for peo-ple’s health when non-cancerogenic matters affect it.The main pathways of xenobiotics are ingestion andinhalation. An assessment of the consequence of thedose was made for the most toxic elements enteringthe organism. Low sensitivity of the spectral analy-sis did, however, not allow for the full picture of thesoil arsenic. Only areas with >100 ppm were detected(more than 50 times of limit permissible concentration[LPC]) covering a third of the area.
During the assessment of the carcinogenic effects, itis assumed that xenobiotics cause hazards only whenexceeding safe effect limits. Such doses are markedby EPA as reference doses (RfD) or reference con-centrations (RfC). Non carcinogenig hazards were cal-culated for Mo. RfD was taken from the site of IRIS(Integrated Risk Information System – EPA’s Officeof Research and Development, National Center forEnvironmental Assessment) – http://epa.gov/iris/
Hazard Quotient for the non-cancerogenic mattersis calculated as a ratio: HQ = C/RfC or HQ = D/RfD.HQ for Mo = 6.4.
In the State Epidemiological Control criteria of thehealth hazard value it is recommended to calculate thehazard twice: by the RfC/RfD and by Russian hygienicstandards, and in case of big differences to use stricterstandards. Using this Russian system to calculate HQfor Mo resulted in HQ = 2.6. The same calculation wasmade also for V. Using the IRIS standard gave HQ= 14.2; using the Russian system gave HQ = 51.2.In case of V the Russian standard is stricter. Whenchemical matters enter the organism simultaneouslyin the same way Hazard Index – HI = ∑
HIi shouldbe calculated. Using stricter standards this gave HI =57.6.

Medical Geology in Russia and the NIS 247
Conclusions
Geochemical research of the Tyrnyauz tungsten–molybdenum industrial complex shows significanttechnogenic pollution connected with dumps anddrains by the factory during a long time (since 1940).Main pollutants are As, W, Mo, Zn, Pb, Cu with max-imum levels of 6,000, 1,500, 300, 3,000, 5,000, and8,000 ppm, respectively. Arsenic pollution with soilconcentrations over 100 ppm covers third of the ter-ritory. W pollution covers all the territory and theaverage concentration is higher than 40 times its Clarkvalue. In the Bucksun River Li exceeds LPC, in drink-ing water – Li and B exceeds LPC, but this is connectedwith the natural geochemical background.
Assessment by “dose–effect” has some problemscaused by the very restricted experimental data base.Absence of Russian and international standards of Wdoes not allow for estimating the hazard. Absence ofdata related to air As concentrations does not allowfor calculating carcinogenic hazards, but the presenceof As in high concentrations in soil and bottom sedi-ments allows us to link it with serious inherent defectsdetected during the perinatal period. Nevertheless, cal-culated hazard assessment even for non-main hazardfactors detected exceeds the safety limit. The calcu-lated hazard index for non carcinogenic chemicals ishigh and implicates that the hazard should not beignored. In the authors view, the most rational coursesfor improvement of the health status in the region arefollowing measures: elimination of the harmful traceelements and their toxic metabolites, deletion of thedetected xenobiotic toxic affects, changes in people’sallergic, immunologic, and somatic status, and deletionof extra-sensitive reactions.
Natural Radon Distribution in Soils,Influence on Living Organisms, andRadon Safety Measures in Russia
Anastassia L. Dorozhko
Introduction
Many people within Russia and NIS were moved inthe 19th–20th century to prison camps and institutions
of repression which also included harsh mining areas.The hard forced labor of the miners and disas-trous ecological conditions in underground miningwere used as alternatives for punishment for differentcrimes, including antiauthority actions. One exampleis the rebels of the Decembrists in Saint-Petersburgin 1825 who protested against the Tsars autocracyand were sentenced to these terrible conditions. Mostof the rebellions were exiled in remote regions ofTransbaikalia, to silver mines where the prisoners weresubject to unfavorable environment. The most serioushealth danger of the Transbaikalia’s miners and pris-oners was radon. In addition to this, also dust from thelead-, silver-, cadmium-, and zinc mines.
There are many high radon areas within Russiaand NIS. For example, the Alpine and Himalayantectonic belt, Mongolia and Okhotsk tectonic belt,Big Caucasian ridge, Kopet-Dag ridge, Kazakh andTurkmen Caspian region, the Thuran Plate region aswell as tectonic blocks of the East European Platform(Pechenkin and Pechenkin, 1996) (Figs. 14, 15, 16,17, and 18). Radon is also typical for the regions withuranium deposits. At the copper- and molybdenumKadzharan mine (Armenia) and in Akchatau miningcounty (deposit of tungsten Central Kazakhstan) highradon can, for example, be found in local schoolsand daycare centers (Revich, 2001; Saghatelyan et al.,2008).
The general population is exposed to radiation fromnatural radioactive nuclides. The most important arepotassium-40 and nuclides of the uranium and tho-rium series. Based on estimates of the average externalgamma-radiation in Finland and Sweden, the annualeffective dose per person related to various sourcesof radon is as follows: 0.2 mSv (millisievert) frompotassium in the body, 0.3 mSv cosmic radiation,and 0.5 mSv from nuclides of the uranium and tho-rium series. Domestic radon accounts for an annualeffective dose of 2 mSv from inhalation estimated at100 Bq/m3.
Radon has effective half-life T1/2 = 3.825 days, withα-radiation. There are three forms of radon: actinon(219Rn), thoron (220Rn), and radon (222Rn), but the useof the term refers specifically to radon-222 (222Rn).All of them are members of the natural radioactiveseries. Radon contributes up to two-thirds of the dosefrom natural sources. It is believed that radon accountsfor 40% dose of the irradiation received by populationfrom natural sources of radiation. It is important to note

248 I.F. Volfson et al.
Fig. 14 Tyrnyauzore-processing enterprise
that this gas represents the second most important riskfactor for lung cancer after smoking. The annual mor-tality rate due to radon irradiation from lung cancer is13,000 persons in the United States, around 3,000 inEngland, and more than 20,000 in India. In Russia, thisrate can be even higher (Bogdasarov, 2008). Negativeand positive (in small dose) impacts of natural radon onhumans, animals health, and plants have been studiedall over the world (Komov and Frolov, 2004; Appleton,2005; Låg, 1987, 1990).
According to radiation safety norms acceptedin Russia, average annual radon volumetric activ-ity (VA) should be no more 200 Bk/m3 (Volfsonand Bakhur, 2007). Otherwise, buildings requireanti-radon protection, which is aimed at underpin-ning and installation of additional ventilation sys-tems in basements. This measure is absolutely nec-essary, because the influence of domestic radonon human health has been confidently confirmed.In human organism, which intakes radon in theform of aerosols and accumulates it in bronchi andalveolus, a detrimental effect is induced on lungstissue.
Despite the many negative aspects, radon is broadlyused in medical practice (Tsarfis, 1991; Finkelman,2008). Radioactive waters are divided into four groupsbased on radon activity (kBq/l): very weak – 0.75,weak – 1.5, medium – 7.5, and high – above 7.5. Firstof all, the radon-containing water of natural sources
is used for radon baths, which have a healing effect.Radon decay produces new, short-lived isotopes. Ofspecial interest for medicinal purposes are the short-life products of radon decay. Together with mineralsand salts, these decay products induce intrinsic trans-mutation in the organism of a sick person. The so-called active pellicle formed on the human body duringradon bath acts for around 3 h, rendering beneficialeffect on human organism. Radon baths can be pre-pared from water saturated with radon. The radon bathscan render a dualistic influence on the human organ-ism, e.g., reduction of the uric acid concentration inblood and hematogenic organs, metabolism disorders,diseases of peripheral nervous system, gynecologicaland skin diseases, hypertensions and overactivity ofthyroid gland, and problems of locomotor apparatusand joints, on the one hand, and promotion of anti-inflammatory and analgesic action, prophylaxis andtreatment of cardiovascular diseases on the other hand(Tsarfis, 1991).
High radon concentrations are detected in nitrogen-and oxygen-rich mineral and carbonic acid waters.Sources of natural mineral water containing radon,broadly used as SPAs, are widespread all over theworld. The most famous among them are Choltubo(Georgia), Jalal Abad (Kyrgyzstan), Baranovichi(Belarus), Baden-Baden (Germany), Karlovy Vary andIoahimov (Czech Republic), and Belokurikha (Russia)(Volfson et al., 2010).

Medical Geology in Russia and the NIS 249
Fig. 15 Dispersion of W, Mo, Bi, Sn, and Ge in soil of the Tyrnyauz area, ppm

250 I.F. Volfson et al.
Fig. 16 Dispersion of as in soils of the Tyrnyauz area, ppm
Fig. 17 Dispersion of Pb in soils of the Tyrnyauz area, ppm
Fig. 18 Areas of high radon in indoor air and groundwater

Medical Geology in Russia and the NIS 251
Natural Radon Distribution and RadonSafety Measures in Russia
The effects of natural radon on the population caughtthe attention of Russian scientists for the first time inthe beginning of the 1980s. The WHO pays increasedattention to the radon problem (WHO, 1996; Komovand Frolov, 2004). Until recently there has been nomedical multifactorial statistical research in Russia onthe correlation between radon concentration in housesand cancer. The most significant research has recentlybeen carried out at the Institute of Industrial Ecologyin Yekaterinburg. The research has been carried outin houses with different radon concentrations in threecities including Pervouralsk, Karpinsk, and Lermontov(the Lermontov city has a uranium mine). Two groupsof people were chosen in each city (112–237 peo-ple in each group): a group of healthy people anda group of people with lung cancer. The health ofeach participant was studied for 25 factors. Amongthem were radon volumetric activity (VA) and thoron(thorium emanation) equilibrium volumetric activity(EVA), which were constantly measured in dwellingsfor more than a month. Factors as smoking, age, gen-der, and chronic illnesses were highly ranked in allthree regions. In Lermontov which is situated in an areaof high concentration of uranium in bedrock, work-ing exposure to radon was another important factor.If the sum of all studied factors contributing to can-cer is 100%, the share of natural radioactive sourcescausing lung cancer will be 0.5% in Pervouralsk, 1% inKarpinsk, and 10% in Lermontov. Despite the fact thatthese cities are located in “dangerous radon zones,” theradon concentration level in dwellings in these areascannot be a cause of lung cancer. Nevertheless, pre-ventive measures of radon danger are necessary, espe-cially in such megalopolises as Moscow. Accordingto radiation safety norms in Russia an average annualradon EVA should be no more than 100 Bk/m3 whendesigning new dwellings and 200 Bk/m3 in old onesotherwise installation of additional ventilation systemsin basements are required. The only criteria to mea-sure radon safety on building land used in Russiais radon flux density (RFD) at the surface, whichshould be measured before a foundation pit is dug.This measure may not be correct because RFD atthe bottom of a foundation pit can differ from thatat the surface. According to the sanitary code, radon
building protection should be carried out if the aver-age of RFD is more than 80 mBk/m2 on the sur-face, and for industrial buildings if it is more than250 mBk/m2.
RFD is a very variable factor and can vary withinsmall homogeneous areas for no apparent reason. RFDspace distribution is logarithmically normal and itsfluctuation in clayey soils can be as high as 270mBk/m2. In addition, it has been proven that RFD mea-sured in soil depends on the season. The most constantradon flux is observed during summer time. The mostsignificant RFD fluctuations take place in autumn andspring due to frequent rains which temporarily blockradon flux. RFD flaring (more than 500 mBk/m2) canbe observed at this time, probably due to radon fluxredistribution caused by uneven soil moisture. Besidesthat, greater RFD value (up to 1,000 mBk/m2) canbe registered during air pressure falls. Therefore, theRFD value is determined by uranium concentrationin soil and underlying rocks, and radon diffusion aswell as convection processes associated with soil airflows caused by weather changes. Thus, single RFDmeasuring on the surface is not enough for a reliableestimation of radon safety.
Research has been carried out on RFD data dur-ing 8 years in Moscow (Dorozhko and Makarov, 2007;Miklyaev, 2008; Ziangirov et al., 1999; Miklyaev andZiangirov, 2004). Four hundred sample points in theseareas vary from 6 to 1,583 mBk/m2, with a normalinterval of 10–40 mBk/m2. Geodynamic active zonesare characterized by fissures and porosity of rock andsuch zones can serve as pipes not only for radon butalso for radium. In the Moscow region Jurassic clayis the most radioactive geological agent and after thatin descending order are Quaternary clay, glacifluvialclay and loam, covering loam, carboniferous limestoneand cretaceous, and Quaternary sands. In analyzingthe RFD distribution within Moscow, four areas areidentified which differ in distribution and intensityof anomalies (Fig. 19). In this figure the correlationbetween RFD values and Quaternary rocks with differ-ent lithologic characteristics in Moscow territory canbe seen.
The most intensive area of RFD intensity I is mainlyassociated with covering loams in the northern partwhich are Quaternary. The least intensive area II ofRFD intensity is associated with prevalent glacifluvialsands. Area III is characterized by average RFD inten-sity and in general is associated with Moscow river

252 I.F. Volfson et al.
Fig. 19 Correlation between RFD values and quaternary rockswith different lithologic characteristics in Moscow territory: 1 –isolines of RFD with section 10 mBk/m2 s; 2 – area boundaries;
3 – axes of anomalies; 4–7 – pleistocene–holocene rocks: 4 –covering loam, 5 – moraine clay, 6 – alluvial sands, 7 –fluvioglacial sands; 8 – rivers; 9 – points with high RFD values
valley. Intensive area IV with a prevailing maximumvalue of RFD intensity (up to 115 mBk/m2) is asso-ciated with loams, except the eastern part where theanomaly (max = 73 mBk/m2s) is found in the area ofalluvium (Miklyaev and Ziangirov, 2004). There is aclear correlation between RFD intensity and radioac-tive composition of near-surface soil, but no corre-lation with pre-Quaternary rocks. However, this doesnot explain the presence of several anomalies withhigh RFD values on the general background of highor low RFD values caused by lithology. Therefore astudy was carried out on the correlation between theRFD field and structural, geomorphological and geo-dynamic characteristics. The geomorphological mapof Moscow is used for this. Different crustal blocks
are identified on this map as well as structurallineaments (Fig. 20). Area I is associated with theRublev-Yauzskaya (RYa) zone, and the majority of theRFD maximum values are found in the area of bound-aries between regional geoblocks, as well as othergeodynamic active zones. Maximum RFD values thatare found on a certain distance from such zones can beexplained as follows:
1. Exposure of underground geodynamic active zones,as well as other heterogeneities on the surfacecan be widespread, and this dispersion dependson depth and morphology of these heterogeneities.This explains the fact that radon maximum valuesare found some distance from the zones;

Medical Geology in Russia and the NIS 253
Fig. 20 Structural geomorphological map of Moscowwith RFD anomalies: KD – Klinsko-Dmitrovsky geoblock,MM – Moskovsko-Mescherky geoblock, NF – Narofominskygeoblock, RYa – Rublev-Yauzskaya regional zone, MR –
Moskvoretskaya regional zone. C – central geoblock, T –Teplostansky geoblock. 1 – points with RFD values more than50 mBk/m2 s, 2 – area boundaries, 3 – axes of anomalies, 4 –regional geoblock boundaries
2. Radon (or radium), as an element soluble inwater, can be transferred by groundwater somedistance from its original source (zones of extensivejointing).
Area II can be associated with Moscow-Meschersky(MM) regional geoblock. One of the longest axesof RFD anomalies, which passes through the areas
IV, III, and II, coincides with the boundaries of thelow block considered to be an earth crust stretch-ing zone. Area III is characterized by local RFDanomalies belonging to the Moscow river valley. Thisarea can be associated with the Moscow regional struc-tural zone, which is characterized by the lowest abso-lute heights and continued tendency to depression ofthe Moscow river valley structure. The majority of the

254 I.F. Volfson et al.
RFD maximum values in this area are found near blockboundaries.
The most interesting area IV almost entirely coin-cides with the Teplostansky (T) block, the highestblock in the research area. The north boundary of areaIV is of most interest, because it almost coincideswith the north boundary of Podmoskovny ancient rift,which is 800–1,500 m deep, and a pre-Jurassic flex-ure (Dorozhko and Makarov, 2007). This structure isnot observed in modern relief and is considered inac-tive. The anomalies do not coincide with the directionof neither blocks boundaries, however, they are sub-parallel to the ancient rift boundary. It is assumedthat these axes mirror the deep heterogeneity of thesedimentary cover.
As a conclusion the localization and intensity ofradon anomalies on the surface are not evenly dis-tributed. The primarily high or low RFD values withineach areas are conformable with near-surface soilscontaining radium and do not depend on deep pre-Quaternary rocks. The boundaries between areas withdifferent RFD distribution coincide to some extentwith the boundaries between regional geoblocks.Together with the lithologic composition of near-surface soils, neotectonic divisions of the earth′s crustalso play an important role in the RFD distribution.Future forecast of the most important radon zones ispossible if it is based on the knowledge of neotectonicstructures and geodynamic active zones.
Acknowledgments The authors thank D.V. Rundkvist (V.I.Vernadsky State Geological Museum of Russian Academy ofSciences, Russia), I.V. Florinsky (Institute for Mathematicalproblems of Biology of Russian Academy of Sciences,Russia), L.N. Belan (Bashkir State University, Russia),W. Paul (Miner’s Christian Mission, Celifodina, Spokane,USA) for fruitful discussions and materials, H.C.W. Skinner(Departments of Geology and Geophysics and Orthopaedicsand Rehabilitation, Yale University, New Haven, USA),M.I. Savinykh (Sibdalmumie, Novokuznetsk, Russia) fora useful suggestion, as well as N.A. Serper and I.E.Lyubimova (Fedorovsky All-Russian Research Institute forMineral Resources, Moscow, Russia) for librarian assistance.
References
Abrahams PW (2002) Soils: their implications to human health.Sci Total Environ 291:1–32.
Admakin OI (1999) Dental Morbidity of Residents on DifferentClimatic-Geographical Regions of Russia. Moscow. 256 p(in Russian).
Agadzhanjan NA, Veldanova MV, Skal’nyj AV (2001)Ecological portrait of man and role of microelements.Moscow, Russia: KMK Publisher (in Russian).
Aggett PJ, Rose S (1987) Soil and congenital malformations.Experientia 43:104–108.
Aleksandrovskaia EI, Aleksandrovskij AL (2003) Historical andGeographical Anthropochemistry. Moscow, Russia: RASIG–NGA-Nature (in Russian).
Allander E (1994) Kashin-Beck disease: an analysis of researchand public health activities based on a bibliography 1849–1992. Scand J Rheumatol 23(S99):1–36.
Amaral AFS, Arruda M, Cabral S, Rodrigues AS (2008)Essential and non-essential trace metals in scalp hair of menchronically exposed to volcanogenic metals in the Azores,Portugal. Environ Int 34:1104–1108.
Appleton JD (2005) Radon in air and water. In O Selinus, BAlloway, JA Centeno, RB Finkelman, R Fuge, U Lindh, PSmedley (eds) Essentials of Medical Geology: Impacts ofthe Natural Environment on Public Health (pp. 227–262).Amsterdam, the Netherlands: Elsevier.
Avtsyn AP (1972) Introduction in Geographical Pathology.Moscow, USSR: Medicina (in Russian).
Avtsyn AP, Zhavoronkov AA, Rish MA, Strochkova LS(1991) Human Microelementoses: Etiology, Classification,Organopathology. Moscow, USSR: Medicina (in Russian).
Beiseev AO (2004) Ore Formations of Natural MedicalMinerals, their Properties, Resources in Kazakhstan andProspects of use for Manufacture of Medical Products andProducts of Medical Purpose Ph.D. Thesis. Almaty,Kazakhstan: Satpaev Kazakh National TechniqueUniversity (in Russian with English abstract).
Belan LN (2007) Geoenvironmental Essentials of Naturaland Technological Ecosystems of Mining Areas ofBashkortostan. Ph.D. Thesis. Bashkir State University,Ufa (in Russian).
Belan LN (2005a) Environmental and Hydro GeochemicalCondition of the Territory of Mining Enterprises (bythe example of JSC BCSC) Vestnik of Voronezh StateUniversity, 2, Voronezh, 173–177 (in Russian with Englishabstract).
Belan LN (2005b) Medical and Biological Habits of MiningAreas. Vestnik of Orenburg State University, 5, Orenburg,112–118 (in Russian with English abstract).
Belan LN (2005c) Environmental and geochemical condition ofmining areas of the Bashkir trans-Ural. Vestnik of OrenburgState University, 6, Orenburg, 113–117 (in Russian withEnglish abstract).
Belan LN (2000) Noninfectious Pathology and Environmentaland Geochemical Habits of Mining Areas. Proceedings ofUSC RAS, Ufa, 34–35 (in Russian).
Bentley R, Chasteen TG (2002) Arsenic curiosa and humanity.Chem Educat 7:51–60.
Bogdasarov AA (2008) Radon Curiosa. Advantages andDisadvantages of Invisible Sly. JSC “BrestskayaTipographya”, Brest (Republic of Belarus). 64 p (inRussian).
Bolshakov AM, Krutjko VN, Pucillo EV (1999) Assessmentand Control of Environment Effect Hazards on the Peoples’Health. Moscow, Editorial URSS, p. 256.
Breus VE (1981) Ca, P and F concentration in human teethenamel. Stomatology 6:52–54.

Medical Geology in Russia and the NIS 255
Buseck PR, Galdobina LP, Kovalevski VV, Rozhkova NN,Valley JW, Zaidenberg AZ (1997) Shungites–the C-richrocks of Karelia, Russia. Can Mineral 35:1363–1378.
Cabrera WE, Schrooten I, Debroe ME, D’Haese PC (1999)Strontium and bone. J Bone Miner Res 14:661–668.
Chan S, Gerson B, Subramaniam S (1998) The role of copper,molybdenum, selenium, and zinc in nutrition and health. ClinLab Med 18:673–685.
Charykova MV, Bornyakova II, Polekhovskii YS, Charykov NA,Kustova EV, Arapov OV (2006) Chemical composition ofextracts from shungite and “shungite water”. Russ J ApplChem 79:29–33.
Chen X, Yang G, Chen J, Chen X, Wen Z, Ge K (1980) Studieson the relations of selenium and Keshan disease. Biol TraceElem Res 2:91–107.
Criteria of Assessment of the Population’s Health Hazards forPredominated Environment Elements-Pollutants: MethodicalRecommendations. M.: Sisyn Scientific Research Institute ofHuman Ecology and Environmental Hygiene RAMS (2001)Sechenov Moscow Medicine Academy, Centre of the StateEpidemiology Control in Moscow.
Dedov I, Sviridenko I (2001) Strategy of eliminating iodine-deficiency diseases in the Russian federation. ProblEndocrinol 48:3–12 (in Russian with English abstract).
Denisova O, Chernogorjuk G, Rikhvanov L, Baranovskaja N(2008) Ecogeochemical factors and diseases of a thyroidgland of the population in Tomsk region In Proceedings ofthe 33rd International Geological Congress, Oslo, Norway,Aug. 6–14, 2008. X-CD Technologies (CD-ROM).
Dorozhko A, Makarov V (2007) The distribution of naturalradon in the Moscow region. Medical Geology Newsletter,10.
Dowker SEP, Anderson P, Elliott JC, Gao XJ (1999) Crystalchemistry and dissolution of calcium phosphate in dentalenamel. Mineral Mag 63(6):791–800. 7.
Edmunds M, Smedley P (2005) Fluoride in natural waters. InO Selinus, B Alloway, JA Centeno, RB Finkelman, R Fuge,U Lindh, P Smedley (eds) Essentials of Medical Geology:Impacts of the Natural Environment on Public Health (pp.301–329). Amsterdam, Netherlands: Elsevier.
Ellingsen DG, Efskind J, Haung E et al (2000) Effects oflow mercury vapour exposure on the thyroid function inchloralkali workers J Appl Toxicol 20:483–489.
Elliott JC (1997) Structure, Crystal Chemistry and Densityof Enamel Apatites. Dental En. Wily, Chichester (CibaFoundation Symposium 205), 54–72.
Elliott JC (1994) Structure and Chemistry of the Apatites andOther Calcium Orthophosphates. Amsterdam, Netherlands:Elsevier, 398 p.
Ermakov VV (1992) Biogeochemical regioning problems andthe biogeochemical selenium provinces in the former USSR.Biol Trace Elem Res 33(3):171–185.
Ermakov VV (2004). Biogeochemistry of selenium and its rolein prevention of endemic diseases of man. Vestnik Otdelenianauk o Zemle RAN, 22. http://www.scgis.ru/russian/cp1251/h_dgggms/1-2004/scpub-4.pdf (in Russian, withEnglish abstract).
Ermakov VV (2002) Urov Kashin-Beck disease: Ecological andEnvironmental Aspects/Mengen- und Spurenelemente. 21(pp. S. 899–909), Leipzig: Schubert-Verlag.
Esembaeva S (2006) The Prevalence of Non Caries Damages ofHard Teeth Tissues at Population of Rural Areas of Republic
of Kazakhstan. Vestnik of Youzhno-KazakhstanskoiMedicinskoi Academii, 2 (28) (in Russian with Kazakh andEnglish abstract).
Farrakhov E, Miletenko N, Pechenkin I, Pronin A, Volfson I,Beiseyev O, Bogdasarov M, Komov I (2008) Sedimentarybasins: Medical and geological aspects of the studies InProceedings of the 33rd International Geological Congress,Oslo, Norway, Aug. 6–14, 2008. X-CD Technologies (CD-ROM).
Finkelman RB (2008) Health benefits of geological materialsand geologic processes. In International Medical GeologyAssociation, Short course on medical geology, the 33rdInternational geological congress, Oslo, Norway, Aug. 10,2008 (CD-ROM).
Finkelman RB, Belkin HE, Zheng B (1999) Health impactsof domestic coal use in China. Proc Natl Acad Sci96:3427–3431.
Fleming GA (1980) Essential micronutrients II: Iodine and sele-nium. In BE Davis (ed) Applied Soil Trace Elements (pp199–234). New York: John Wiley & Sons.
Florinsky IV (ed) (2010) Man and the Geosphere. Hauppauge,NY: Nova Science Publishers (in press).
Fluorides and oral health (1994) WHO Technical Report Series,No 846, Geneva. 37 p.
Fordyce F (2005) Selenium deficiency and toxicity in theenvironment. In O Selinus, B Alloway, JA Centeno, R.Finkelman, R Fuge, U Lindh, P Smedley (eds) Essentials ofMedical Geology: Impacts of the Natural Environment onPublic Health (pp. 373–415). Amsterdam, the Netherlands:Elsevier.
Frankenberger WT, Benson S (eds) (1994) Selenium in theEnvironment. New York, NY: Marcel Dekker.
Frank-Kamenetskaya OV, Golubtsov VV, Pikhur OL, ZorinaML, Plotkina YV (2004) Non-stoichiometric apatite ofhuman teeth hard tissues. Age changes. Proc All-RussMineral Soc 5:120–130, 6.
Freatherstone JD (1993) Prevention and reversal of dentalcaries: Role of low level fluoride. Community Dent OralEpidemiol: 280.
Frolova LN, Kiseleva TL (1996) Structure of chemical com-pounds, methods of analysis and process control chem-ical composition of mumijo and methods for determin-ing its authenticity and quality (a review) Pharm Chem J30(8). Translated from Khimiko-Farmatsevticheskii Zhurnal,30(8):49–53, August, 1996. Original article submitted July25, 1995.
Gaev AY, Albakasov DA, Gatskov VG, Belan LN, Blinov SM,Mikhailov YV, Alferova NS (2006) Geoenvironmental Tasksof Mining Areas (by the example of Orenburg territory, theSouth Urals). Vestnik of Orenburg State University, 6, 77–84(in Russian).
Ghosal S (2006) Shilajit in Perspective. Oxford, UK: AlphaScience International.
Glazovsky N (1982) Technogenic substance streams inbiosphere (4th ed.). In The Mining Operations andGeochemistry of Natural Ecosystems. Moscow: Science (inRussian).
Golovin AA, Krinochkin LA, Pevzner VS (2004) Geochemicalspecialization of bedrock and soil as indicator of regionalgeochemical endemicity. Geologija 48:22–28.
Grigoryan SV, Saghatelyan AK (1990) Monitoring of HeavyMetal Pollution of the Soils of Armenia’s Industrial Regions.
256 I.F. Volfson et al.
Abstract Book of the Conference “Ecological Problemsof Living Nature Protection”, Moscow, 116–117 (inRussian).
Grushevoy GV, Pechenkin IG (2003) Metallogeny ofUranium-Bearing Sedimentary Basins of the CentralAsia. Moscow, Russia: Fedorovsky All-Russian ResearchInstitute for Mineral Resources (in Russian, with Englishabstract).
Hough RL (2007) Soil and human health: An epidemiologicalreview. Eur J Soil Sci 58:1200–1212.
James LF, Panter KE, Mayland HF, Miller MR, Baker DC(1989) Selenium poisoning in livestock: a review andprogress. In LW Jacobs (ed) Selenium in Agriculture andthe Environment (pp. 123–131). Madison, WI: Soil ScienceSociety of America.
Kabata-Pendias A (1998) Geochemistry of selenium. J EnvironPathol Toxicol Oncol17(3–4):137–177
Kariev AR (2007) Medical aspects of Tadzhikistan’ bentoniteapplication. In V Gavrilenko, E Panova (eds) Proceedingsof the 2nd International Symposium “Bio-inert Interaction:Life and Stone”, Saint Petersburg, Russia, June 26–29, 2007(pp. 124–126). Saint Petersburg, Russia: Saint PetersburgUniversity Press (in Russian).
Klimas A, Mališauskas A (2008) Boron, fluoride, strontiumand lithium anomalies in fresh groundwater of Lithuania.Geologija 50:114–124
Kolesnik AG (1997) Fluoride Monitoring on Dentistry. Moscow.119 p (in Russian).
Komov IL, Frolov OS (2004) Methods and Facilities for theAssessment of the Radon-Hazard Potential. Kiev, Ukraine:Logos.
Kovalsky VV (1979) Geochemical ecology and problemsof health. Phil Trans Roy Soc Lond Series B Biol Sci288:185–191.
Kovalsky VV (1977) Geochemische Ökologie, Biogeochemie.Berlin: Deutscher.
Kovalsky VV (1974) Geochemical Ecology. Moscow: Nauka (inRussian).
Kravchenko SM (1998) Environmental impact on the toleranceof hydroxylapatite of human bone: setting up a problem.In IV Melnikov (ed) Mineralogical Studies in HandlingEnvironmental Problems: Proceedings of the Conferenceon Ecomineralogy, Moscow, Russia, Jan. 29–30, 1996(pp. 97–105). Moscow, Russia: Institute of Geology ofOre Deposits, Petrography, Mineralogy and Geochemistry,Russian Academy of Sciences (in Russian).
Kravetz E, Gratsianova N, Oleynik O et al (2000) State of chil-dren and teenagers health with the thyroid pathology. RussianPediatric J 80:14–16.
Kudo Y, Yamauchi K, Fukazawa H et al (2006) In vitro andin vivo analysis of the thyroid system-disrupting activitiesof brominated phenolic and phenol compounds in Xenopuslaevis. Toxicol Sci 92:87–95.
Kulakov VI, Karetnikova NA, Stigar AM (1996) Searchingthe ways of introwomb correction of the inherent defects.Russian Bulletin of Perinatalogy and Pediatry No 3 (inRussian).
Kuz’mina EM, Smirnova TA (2001) Fluorides on ClinicalDentistry. Moscow. 32 p (in Russian).
Kuz’mina EM (1999) Dental Morbidity of Russia Residents.Moscow. 228 p (in Russian).
Låg J (ed) (1990) Geomedicine. Boca Raton, FL: CRC Press.Låg J (1987) Soil properties of special interest in connection
with health problems. Experientia 43:63–67.Larina OV (2006) Treatment and Recovery of Hair. Moscow,
Etherna. 288 p.Mandal BK, Suzuki KT (2002) Arsenic round the world: A
review. Talanta 58:201–235Menchinskaya O, Zangiyeva T (2007) Ecological and medical
habitat quality assessment. International Medical GeologyAssociation Medical Geology Newsletter, Newsletter NO.11, ISSN 1651-525, September 2007, pp. 16–18.
Menchinskaya OV, Zangieva TD (2004) Technology ECOSCANin Ecological-Geochemical Assessment of MetallurgicCenters Territories. Applying Geochemistry, No 5, M.:IMGRE, p. 178–188 (in Russian)
Miklyaev P (2008) Causes of space-time fluctuations of soilradon flux density. Proceedings of the 33rd InternationalGeological Congress, Oslo, Norway, 6–14 August, 2008(#10-94140). http://www.x-cd.com (CD-ROM).
Miklyaev PS, Ziangirov RS (2004) Regularity of radonvolatilization from soils into the atmosphere on the territoryof Moscow. J Geoecology 3:244–250
Narbutaite J, Vehkalahti MM, Milciuviene S (2007) Dentalfluorosis and dental caries among 12-yr-old children fromhigh- and low-fluoride areas in Lithuania. Eur J Oral Sci115:137–142.
Nielsen FH (2000) Possibly essential trace elements. In JDBogden, LM Klevay (eds) Clinical Nutrition of the EssentialTrace Elements and Minerals: The Guide for HealthProfessionals (pp. 11–36). Totowa, NJ: Humana Press.
Nikolishin AK (1989) Teeth Fluorosis. Moscow. 45 p (inRussian).
Pachomov GN (1982) First Prevention on Dentistry. Moscow.240 p.
Patching SG, Gardiner PHE (1999) Recent developments in sele-nium metabolism and chemical speciation: A review. J TraceElem Med Biol 13:193–214.
Paul W, Paul H (2002) Mineralogical and Bio-geo-chemicalResearch Works 1949–1959 (A contribution to mining engi-neering and health research). Oakesdale, WA: Arts & CraftsBook Bindery & Publishing.
Pechenkin IG, Volfson IF, Sysoev AN, Pechenkin VG,Grushevoy GV (2005) Metallogeny of the uranium-bearingsedimentary basins. In J Mao, FP Bierlein (eds) MineralDeposit Research: Meeting the Global Challenge (pp. 307–310). Berlin, Germany: Springer.
Pechenkin IG, Pechenkin VG (1996) Metallogeny of the turanplate sedimentary cover. Lithol Min Res 31:325–332.
Pechenkin VG, Pechenkin IG (2005) Exfiltrative mineralizationin the Bukan-tau ore district (Central Kyzyl Kum region,Uzbekistan)./Lithol Miner Resour 40(5):462–471.
Peeters E-G (1987) The possible influence of the components ofthe soil and the lithosphere on the development and growthof neoplasms. Experientia 43:74–81.
Pelymskij (2008) Minerals on Medicine History, Representedin the Exposition of Lomonosov MGU Earth SciencesMuseum. Proceedings of Readings from Lomonosov.Museology Section, 34–37. Lomonosov MGU Publisher.
Persinger MA (1987) Geopsychology and geopsychopathology:Mental processes and disorders associated with geochemicaland geophysical factors. Experientia 43:92–104.

Medical Geology in Russia and the NIS 257
Petrov I (2008) Sulphuric acid research in Russia/CIS, Infomine,Report, 2008.
Petrov I, Burstein M, Volfson I (2007) Exposure in the East:curing Russia’s. A Report from Infomine on Health-RelatedProblems and Arsenic Pollution by Russian Smelters.Mining Environmental Management, January 2007:8–9
Pikhur OL (2003) Influence of Chemical Composition ofDrinking Water at Condition Hard Teeth Tissues. St.Petersburg. 21 p.
Pronin AP, Bashorin VN, Zvonilkin BD (1997) Geological fea-tures and fluid activity of the Kaluga ring structure. TransRuss Acad Sci–Earth Sci Sec 356:960–964.
Pronin AP (1997) Using a Helium Method in theGeoenvironmental Research and Protection of the Earth’sBowels. Moscow, Russia: Geoinformmark (in Russian).
Revich BA (2001) Environmental Pollution and Human Health.Introduction to Environmental Epidemiology. Moscow,Russia: MNEPU (in Russian).
Rihvanov L, Yazikov Ye, Suhih Yu et al (2005) EcogeochemicalFeatures of Natural Environments of Tomsk District andDiseases of the Population. Italics, Tomsk (in Russian).
Rysyev OA (2001) Shungite–The Stone of Health. SaintPetersburg, Russia: Tessa (in Russian).
Saet YE, Revich BA, Janin EP (1990) EnvironmentalGeochemistry. Moscow, Russia: NEDRA (in Russian).
Saghatelyan AK, Gevorgyan V Sh, Arevshatyan SG, SahakyanLV (2008a) Ecological and Geochemical Assessment ofEnvironmental State of the City of Kajaran. Yerevan, Editionof the Center for Ecological-Noosphere Studies NAS RA) (inRussian and Armenian).
Saghatelyan AK, Arevshatyan SH, Sahakyan LV (2008b)Mercury in urban ecosystem as a risk factor. Mater ofInternational Geological Congress (Abstract CD-ROM),Oslo, August 6–14, 1204902
Saghatelyan AK, Arevshatyan SH, Sahakyan LV (2007a) Heavymetals in system “soil-farm produce-organism” withinthe area of environmental impact of ore-mining produc-tion. Geophysical Research Abstracts CD-ROM of EGUGeneral Assembly 2007, Vol. 9, Vienna, April 15–20, 2007,EGU2007-A-00765
Saghatelyan AK, Gevorkyan VSh, Arevshatyan SH, SahakyanLV (2007b) Assessing environmental impact of mining pro-duction and revealing risk groups in children. Mater ofInternational Youth Scientific Conference “Mountain Areas-Ecological Problems of Cities”, 29–30 May, 2007, Yerevan,Edition of the Center for Ecological-Noosphere Studies NASRA, 63–77
Saghatelyan AK (2004) The Peculiarities of Heavy MetalsDistribution on Armenia’s Territory. Yerevan, Publisher:Center for Ecological-Noosphere Studies NAS RA) (inRussian).
Savinykh MI (2006) Classification of shilajit ore deposits.Izvestiya Vuzov, Geologia i Razvedka. 5:39–41 (in Russian,with English abstract).
Savinykh MI (2003) Regularities of Displacement, FormationCondition and Classification of Shilajit Ore Deposits. PHdthesis (in Russian).
Schepetkin I, Khlebnikov A, Kwon BS (2002) Medical drugsfrom humus matter: focus on mumie. Drug Dev Res57:140–159.
Selinus O, Frank A (2000) Medical geology. In L Möller(ed) Environmental Medicine (pp. 164–183). Stockholm:ArbSkNämnden.
Severgin V (ed) (1819) Plinij the senior (Plinij Kai the Second)natural history of fossilized bodies. Proceedings of RussianAcademy of Sciences, St. Petersburg, p. 364.
Sherbo AP (2002) Environment and Health: Approaches at RiskMark. St.Petersburg. 246 p.
Skal’ny AV, Kudrin AV (2000) Radiation, Microelements,Anti-Oxidants and immunity. Moscow: Lir Make (inRussian).
Skal’ny AV (1999) Human Microelementoses (Diagnosis andTherapy). Moscow, Russia: KMK Press (in Russian).
Smedley P, Kinniburgh DG (2005) Arsenic in groundwater andthe environment: In O Selinus, B Alloway, JA Centeno, RBFinkelman, R Fuge, U Lindh, P Smedley (eds) Essentialsof Medical Geology: Impacts of the Natural Environmenton Public Health (pp. 263–299). Amsterdam, Netherlands:Elsevier.
Smith GE (1988) Fluoride and fluoridation. Soc Sci Med26(4):451–462.
Soshnikova LA, Narbutaite, J, Vehkalahti, MM, Milciuviene S(2007) Dental fluorosis and dental caries among 12-yr-oldchildren from high- and low-fluoride areas in Lithuania. EurJ Oral Sci 115:137–142.
Tamashevich VN, Makhnach LA (2004) Multivariate StatisticAnalysis. Minsk, BGEU. 162 p.
Taylor SR, McLennan SM (1985) The Continental Crust:Its Composition and Evolution. Oxford, England:Hackwell.
Tsallagova LV (1999) Reproductive Health of Women Workingin the Industrial Sphere. Principles of Rehabilitation. Med.Sc. Doctor Dissertation. M., p. 315 (in Russian) .
Tsarfis PG (ed) (1991) Resorts, 2 Vols. Moscow, USSR:Profizdat (in Russian).
Tsarfis PG (1985) Nature and Health: Treatment andRehabilitation by Natural Factors. Moscow, USSR: MirPublishers.
Veldanova M (2000) Effect of some goitrogenic factors of envi-ronments on endemic goiter. Trace Elem Med 1:17–25 (inRussian).
Versieck J (1985) Trace elements in human body flu-ids and tissues. Critical Rev Clin Lab Sci 22:97–184.
Vinogradov AP (1938) Biogeochemical provinces andendemies. Comptes Rendus de l’Académie des Sciences del’URSS 18:283–286 (in Russian).
Vinogradov AP (1939) Geochemical research in the field ofUrov endemy invasion. Comptes Rendus de l’Académie desSciences de l’URSS 23:67–71 (in Russian).
Vinogradov AP (1964) Provinces biogéochimiques et leur rôledans l’évolution organique. In U Colombo, GD Hobson(eds) Advances in Organic Geochemistry: Proceedings ofthe International Meeting, Milan, Italy, 1962 (pp. 317–338).New York: Macmillan.
Volfson IF, Paul W, Pechenkin IG (2010) Geochemical anoma-lies: Sickness and health. In IV Florinsky (ed) Man and theGeosphere. Hauppauge, NY: Nova Science Publishers (inpress).
Volfson IF, Bakhur AE (2007) Medical radiogeology. ANRI48:25–33 (in Russian).

258 I.F. Volfson et al.
Volfson IF, Pechenkin IG, Kremkova EV (2006) Medical geol-ogy of today: Targets and the ways of their realization. InEG Panova, VV Gavrilenko (eds) Bio-inert Interactions: Lifeand Stone (pp. 107–123). Saint Petersburg, Russia: SaintPetersburg University Press (in Russian).
Volfson IF (2004) Medical and biological aspects of the studyand application of biologically active flints of the Russianplatform. In V Gavrilenko, E Panova (eds) Proceedings ofthe 2nd International Symposium “Bio-inert Interaction: Lifeand Stone”, Saint Petersburg, Russia, June 23–25, 2004(pp. 157–160). Saint Petersburg, Russia: Saint PetersburgUniversity Press (in Russian, with English abstract).
Volkotrub L, Karavaev N, Zinchenko N et al (2000)Hygienic aspects of iodine-deficiency diseases. Hygiene andSanitation 102:28–31
Walters RJL (1996) The Power of Gemstones. London, UK:Carlton Books.
World Health Organization (1996) Trace Elements in HumanNutrition and Health. Geneva, Switzerland: World HealthOrganization.
World Health Organization (1987) Environmental HealthCriterion 58-Selenium. Geneva, Switzerland: World HealthOrganization.
Yushkin NP (2004a) World of minerals and humanhealth. Vestnik Otdelenia nauk o Zemle RAN, 22,http://www.scgis.ru/russian/cp1251/h_dgggms/1-2004/scpub-1.pdf (in Russian).
Yushkin NP (2004b) Mineral Factors of the HumanHealth: Concepts of Medical Mineralogy. Zapiski VMO(Proceedings of the Russian Mineralogical Society)PtCXXXIII, No 4 (in Russian with English abstract).
Yushkin NP (2003) Human health effects of “table” minerals.In N Kamata (ed) Proceedings, 1st International Symposiumof the Kanazawa University 21st century COE program,Kanazawa, Japan, March 17–18, 2003, (Vol. 1, pp. 261–265).Kanazawa, Japan: Kanazawa University.
Zyryanov BN (1981) Extreme North Medical-GeographicFeatures Influence on Teeth Tissues State and Teeth CariesMorbidity Among Aboriginal Population and Immigrants.Ph.D. Thesis. Moscow. 20 p (in Russian).

Medical Geology in Europe
Olle Selinus, Mark Cave, Anne Kousa, Eiliv Steinnes, Jaques Varet,and Eduardo Ferreira da Silva
Abstract Medical geology or earth and health has along history in Europe. Also the newer developmentof medical geology has a firm base in Europe. Healthproblems associated with geologic material and geo-logic processes occur quite frequently in Europe. Theproblems associated with the geologic environment inEurope are generally chronic, caused by long-term,low-level exposures. Examples are exposure to traceelements such as fluorine, arsenic, radon, mineral dustand naturally occurring organic compounds in drink-ing water. The chapter provides the history of medicalgeology in Europe, many examples of these environ-mental health problems and a look into the future.
Keywords Europe · Portugal · France · UK · Sweden ·Finland · Norway · Arsenic · Asbestos · Dusts · BEN ·Iodine · Fluorine · Radon · Cardiovascular diseases
History in Europe
Medical geology or earth and health has a long historyin Europe. The Greek philosopher Hippocrates (400B.C.) is considered to be the founder of medical geol-ogy. He recognized that environmental factors affectedthe distribution of disease. He noted in his treatise,On Airs, Waters, and Places, that under certain cir-cumstances, water “comes from soil which producesthermal waters, such as those having iron, copper, sil-ver, gold, sulphur, alum, bitumen, or nitre”, and suchwater is “bad for every purpose”. Vitruvius, a Roman
O. Selinus (�)Geological Survey of Sweden, Uppsala SE-751 28, Sweden
architect in the last century B.C. recognized potentialhealth dangers related to mining, noting that the waterand pollution near mines posed negative health threats.Later in the first century A.D., the Greek physicianGalen reaffirmed the potential danger of mining activ-ities when he noted that acid mists are often associatedwith the extraction of Cu from the ground (Bowmanet al., 2003).
The use of heavy metals in everyday ancient soci-ety introduced the negative affects of toxicity-relatedproblems. During the Roman Empire it has been esti-mated that the annual production of Pb approached80,000 tonnes. During the Roman Empire Pb usageexceeded 550 g per person per year but the main useswere for plumbing, architecture and shipbuilding. Leadsalts were used to preserve fruits and vegetables andPb was also added to wine to stop further fermenta-tion and to add colour or bouquet. Large amounts ofPb usage in the daily life of Roman aristocracy had anumber of negative health implications, including: epi-demics of plumbism and saturnine gout, high incidenceof sterility and stillbirths as well as mental incom-petence. Physiological profiles of Roman Emperorsdating between 50 B.C. and 250 B.C. suggest that themajority of individuals suffered from Pb poisoning. Inturn, it is generally believed that a contributing factorto the fall of the Roman Empire, in 476 A.D., may havebeen the result of the excessive use of Pb.
Besides Pb other heavy metals such as Hg, Cu andAs were also widely used in Roman and pre-Romantimes. For instance, Hg was used during the RomanEmpire to ease the pain of teething infants as well asin the recovery of Au and Ag, a method also widelyused in Egypt in the twelfth century and in Centraland South America in the sixteenth century. Mercurywas also used to treat syphilis during the sixteenth
259O. Selinus et al. (eds.), Medical Geology, International Year of Planet Earth,DOI 10.1007/978-90-481-3430-4_10, © Springer Science+Business Media B.V. 2010

260 O. Selinus et al.
century and in the felting process in the 1800s. Greeks,Romans, Arabs and Peruvians used As for therapeuticpurposes, since small doses were thought to improvethe complexion; however, it has also long been used asa poison.
Formal recognition of the medical geology sub-discipline appears to reside with Zeiss who first intro-duced the term “geomedicine” in 1931 and at the timeconsidered it synonymous with “geographic medicine”which was defined as a “a branch of medicine wheregeographical and cartographical methods are used topresent medical research results”. In the 1970s Lågin Norway redefined the term geomedicine as “thescience dealing with the influence of ordinary envi-ronmental factors on the geographic distribution ofhealth problems in man and animals” (Låg, 1990).Early in the 1970’s initiative was taken in several coun-tries to organize activities in medical geology. In USA,Canada and Great Britain investigations on the rela-tion between geochemistry and health were carried out.Geochemistry has for a long time also a strong posi-tion in the former Soviet Union, and basic knowledgein this science is applied in medical connections.
In 1997 an International Union of GeologicalSciences working group on medical geology wasestablished. Since then there has been a rapid devel-opment of this field. Discussions focused on the orga-nization and the feasibility of preparing a new textbookon medical geology. In September 2000, about 50 peo-ple participated in a meeting and workshop in Uppsala,Sweden. A 2-day seminar was held on medical geology“The Geochemical Environment and Human Health”resulting in a proceedings volume (Skinner and Berger,2003). In 2006 the International Medical GeologyAssociation, IMGA was established (Selinus et al.,2008).
Medical Geology Issues in Europe
Arsenic
Arsenic and arsenic-containing compounds are humancarcinogens. Exposure to arsenic may occur throughseveral anthropogenic processes, including miningresidues, pesticides, pharmaceuticals, glass and micro-electronics, but the most prevalent sources of exposuretoday are natural sources. Exposure to arsenic occurs
via the oral route (ingestion), inhalation and dermalcontact. Drinking water contaminated by naturallyoccurring arsenic remains a major public health prob-lem (Centeno et al., 2002). The source of arsenic isgeological, the element being present in many rock-forming minerals. There is growing concern aboutthe toxicity of arsenic and the health effects causedby exposure to low levels in the geochemical envi-ronment. The danger to human health due to arsenicpoisoning has been recognized by World HealthOrganization (WHO) and the provisional guidelinevalue for arsenic in drinking water has been low-ered from 50 to 10 μg L−1 (WHO, 1993). Acuteand chronic arsenic exposure via drinking water hasbeen reported in many countries (Centeno et al., 2007).Among the countries that have well-documented casestudies of arsenic poisoning are several countries inEurope, for example, UK, Hungary, Romania, Sweden,Slovakia. The common symptoms of chronic arsenicpoisoning are depigmentation, keratosis and hyperker-atosis (Smedley and Kinniburgh, 2005; Centeno et al.,2002). Figure 1 shows an overview of arsenic in streamwater in Europe from the FOREGS atlas (Salminenet al., 2005).
Asbestos
Asbestos and natural asbestiform compounds areamong the most significant fibrous minerals withimplications for health. The major forms of asbestosextracted commercially were chrysotile (whiteasbestos) and the asbestiform amphiboles crocidolite(blue asbestos), amosite (brown or grey asbestos),anthophyllite asbestos and tremolite. Elevated expo-sures to asbestos are known to be associated withasbestosis. It is generally thought that the asbestiformamphiboles are more carcinogenic than chrysotileasbestos, with lower level exposures of the formerassociated with increased risk of mesothelioma andlung cancer.
Asbestiform compounds may be present in soilsor rocks from which they can be dispersed to adja-cent human populations. In general, the risks posedby exposure to dusts containing naturally occurringasbestos have not been as thoroughly investigated ordescribed as those arising in occupational contexts.The relationship is best established in certain regionsin Turkey, where inhabitants are exposed to erionite,

Medical Geology in Europe 261
Fig. 1 Arsenic in streamwater Europe (figure from theFOREGS atlas, Salminenet al. 2005). These maps ofEurope in black and white canbe seen in colour at thefollowing website: http://www.gsf.fi/publ/foreg satlas/map_compare.html
a form of fibrous zeolite, present in the volcanic tuffsused as building stone. Exposure to erionite fibres,which circulate through the houses and streets ofaffected villages, has been linked to markedly elevatedrates of mesothelioma. In one village, the incidencerates are many times higher than expected comparedwith the general population. In some zeolite-rich vil-lages, malignant mesotheliomas are responsible formore than 50% of the total deaths (Dogan et al., 2008).
A number of fibrous minerals, including antho-phyllite and tremolite, have also been identified inthe soils of Mediterranean and central Europe and
Turkey. Inhaled materials from these sources havebeen linked to pleural plaques in neighbouring agri-cultural communities. A common exposure pathway isthrough the domestic production and use of productsmade from local soils. One such product is the white-wash made from “luto soil” in the Metsovo region ofGreece. Analysis of samples of the whitewash materialrevealed high levels of asbestiform minerals, particu-larly, tremolite. Radiographic screening has detectedpleural calcifications in almost half of inhabitants insome northwestern Greece villages with no knownoccupational exposure to asbestos fibres. In the early

262 O. Selinus et al.
1980s, the incidence of mesothelioma deaths in theMetsovo region was about 300 times greater thanexpected in a non-exposed population. High preva-lence of pleural calcifications have also been reportedfor inhabitants of several rural regions of northeasternCorsica, Turkey and Cyprus where whitewash contain-ing tremolite asbestos has been used. Another fibrousmineral from the soil, sepiolite, has also been linked topleural calcification in Bulgarian populations. An asso-ciation has also been reported between mesotheliomaand volcanic dust containing fluoro-edenite, a fibrousamphibole chemically similar to tremolite, in a regionof Sicily (Dogan et al., 2008).
Dust Particles of Geological Origin
These are a widely dispersed component of theEarth’s atmosphere, often forming extensive plumesthat derive from volcanoes, dust storms, long-rangetransport episodes of desert dust and displacementthrough natural processes such as landslides and earth-quakes. These phenomena occur on all the majorcontinents, including mobilization of Saharan dust toEurope. The elements and compounds which are trans-ported by dust phenomena and which may potentiallyimpact on human health are diverse and include tracemetals and metalloids, radioactive elements, fluoride,silicates, natural asbestiform compounds and alkalisalts. Natural dust events may act to disperse pathogensand bioallergens, and the health implications ofsuch phenomena – often occurring over considerabledistances – have only recently been acknowledged.Geogenic dusts also have indirect socio-economicimpacts on health, with ongoing effects on waterquality, food production and infrastructure, such astransport networks (Derbyshire, 2005).
Dominant sources of natural dusts around the worldare largely in or adjacent to the major drylands of thenorthern hemisphere. World dust emissions from dry-land terrains may reach as much as 5 billion tons/year.The greatest of these includes a broad swathe ofland across North Africa, The Middle East, north-westIndia and central and eastern Asia – from the westernSahara to the Yellow Sea. Africa is regarded as thegreatest single source of minerogenic dust on Earth.This affects Europe significantly, especially southernEurope but also most other parts of the continent areaffected (Fig. 2).
Fig. 2 Dust cloud in Cyprus 2008. Photo O Selinus
Balkan Endemic Nephropathy (BEN)
Balkan endemic nephropathy(BEN) is a serious kid-ney disease that occurs in clusters of rural villageslocated in tributary valleys of the Danube River inthe Balkan Peninsula (the former Yugoslavia, Romaniaand Bulgaria). It is believed that at least 25,000 per-sons are suffering from BEN or are suspected of havingthe disease and that the total number of people atrisk may exceed 100,000. BEN was first describedas a distinct medical entity in 1956, but it may haveexisted undescribed for many centuries. Work by theU.S. Geological Survey (USGS) and others in theearly 1990s noted the close correlation between thelocation of the affected villages and the occurrenceof coal deposits, specifically lignites deposited in thePliocene Epoch 5.3–1.6 million years ago. Furtherresearch showed that the well water in affected villageshas measurable amounts of organic compounds suchas polycyclic aromatic hydrocarbons (PAHs) and aro-matic amines that may be toxic. The nearby Pliocenelignite deposits are unusual in that these coals releaselarge amounts of organic substances when leachedwith water or other polar solvents. These coal deposits,therefore, could be a source of toxic organic com-pounds such as those found in the well water fromthe affected villages. Consumption of well water con-taminated with toxic organic compounds derived fromthe coal may be implicated in the onset of BEN. Thestudy of BEN demonstrates the value of close work-ing relations between the geoscience and medicinecommunities. Medical geology research is needed

Medical Geology in Europe 263
to study whether these cancers are caused by toxicorganic compounds leached from coal. Coal depositsare present worldwide and several direct links betweencoal combustion and disease in humans have beendocumented. Studies of BEN indicate that contamina-tion resulting directly from coal deposits could affecthuman health in susceptible population groups. It hasbeen found that this is the case also in Greece, Turkeyand Portugal in Europe. (Feder et al., 1991; Orem et al.,1999; Orem et al., 2007; Tatu et al., 1998).
Iodine
Prior to about 1950 iodine deficiency disease (IDD)had affected virtually every country in the world.However, since the problem is known to be essentiallydue to the lack of iodine in the diet, it has been possibleto introduce schemes for the mass treatment of affectedpopulations such as the addition of iodine to the dietthrough the use of iodized salt and bread, injectionsof iodized oil or the addition of iodine to irrigationwaters resulting in the alleviation of the symptoms inmany countries. It was noted in the 1970s that IDDhad been effectively eradicated in the developed worldand endemic goitre was described as a disease of thepoor being largely confined to third world countries.However, it is important to point out that in the 1990siodine deficiency has been reported to occur in sev-eral affluent countries in western Europe, probablyas a result of dietary changes, suggesting that suchchanges could cause the re-introduction of IDD inmany countries.
Many of the areas affected by iodine deficiencyare remote from marine influence. Many of the areashighlighted are the mountainous regions and their rainshadow areas such as the European Alps region. In allof these situations IDD can be explained according tothe classic explanations of low iodine supply and hencelow iodine availability. However, many endemias arenot explicable in these simplistic terms and severalcountries and regions which are close to the coast havebeen known to suffer from IDD problems. For examplelarge regions of the United Kingdom are known to havehistories of IDD, despite the strong maritime influenceon the country. In some endemias the involvement ofthe sulphur-containing goitrogens has been invoked asa reason. Some of these may derive from geological
sources and be incorporated into drinking water orfood, while others occur naturally in vegetables suchas those of the Brassica genus.
There are many examples of limestone-associatedendemias occurring in the UK and Ireland with lime-stone regions of north Yorkshire being historicallyrenowned for its severe goitre and cretinism prob-lems. Similarly County Tipperary in Ireland, underlainby Carboniferous Limestone, was historically one ofthe major areas of IDD in that country. One of themost well-documented areas of IDD in the UK is theDerbyshire region of northern England, an area thatis between 150 and 180 km from the west coast, inthe direction of the prevailing wind. Here endemicgoitre was rife, being known as “Derbyshire Neck”,with the endemia being confined to areas underlainby limestone bedrock. Analyses of soil in the formergoitrous region have shown that iodine concentrationsrange up to 26 mg kg−1, with a mean value of 8.2 mgkg−1. Similarly, an area of north Oxfordshire, England,where endemic goitre was prevalent and where iodinedeficiency problems in school children were recordedas recently as the 1950s, is underlain by limestone andsoil iodine ranges between 5 and 10 mg kg−1. IDDoccurs in these limestone areas despite relatively highiodine in soils, which would imply that iodine is notbioavailable. Soils over the limestones would generallybe well drained and circumneutral to alkaline in nature.In these conditions any soluble soil iodine is likely tobe present as the iodate anion. It has been shown thatiodate uptake through plant roots is more limited thanthe uptake of iodide so that in neutral to alkaline soilsroot uptake of iodine may be low.
The distribution of IDD reflects the geochemistryof iodine and with large areas of iodine deficiencyoccurring in central continental regions, mountainousand rain shadow areas, this distribution fits in with theclassical explanation of IDD being governed by theexternal supply of iodine from the marine environmentvia the atmosphere. However, the geochemistry ofiodine is more complex than this simplistic approach,and from a closer scrutiny of the distribution of IDD itis apparent that, in many cases, iodine deficiency prob-lems are related to the bioavailability of iodine in soilsand are not related directly to the external supply ofiodine.
Figure 3 shows an overview of Iodine in soil inEurope from the FOREGS atlas (Salminen et al.,2005)

264 O. Selinus et al.
Fig. 3 Iodine in soil in Europe (figure from the FOREGS atlas, Salminen et al. 2005)
Fluorine
Fluorine is an essential element in the human diet.Deficiency in fluorine has long been linked to theincidence of dental caries and the use of fluoride tooth-pastes and mouthwashes has been widely advocatedin mitigating dental health problems. Fluoridationof water supplies to augment naturally low fluo-ride concentrations is also undertaken in some coun-tries. However, despite the essentiality of fluorine in
humans, optimal doses appear to fall within a nar-row range. Chronic ingestion of high doses has beenlinked to the development of dental fluorosis, andin extreme cases, skeletal fluorosis. High doses havealso been linked to cancer, although the associationis not well established. Drinking water is particularlysensitive in this respect because large variations in flu-oride concentration exist in water supplies in differentareas. Concentrations in natural waters span more thanfour orders of magnitude, although values typically liein the 0.1–10 mg L−1 range. Where concentrations

Medical Geology in Europe 265
are high, drinking water can constitute the dominantsource of fluorine in the human diet. Concentrationsin drinking water of around 1 mg L−1 are often takento be optimal. However, chronic use of drinking waterwith concentrations above about 1.5 mg L−1 is con-sidered to be detrimental to health. The WHO (1993)guideline value for fluoride in drinking water is 1.5 mgL−1.
A common situation in many aquifers is toencounter increasing fluoride concentrations in thegroundwaters down the flow gradient. This situationarises initially as a result of continuous dissolutionof fluoride from minerals in the carbonate aquifers,up to the limit of fluorite solubility, followed byion-exchange reactions involving removal of calcium.The phenomenon is particularly well illustrated inthe Jurassic Lincolnshire Limestone aquifer of easternEngland.
In many aquifers, the evolution of groundwaterdown the flow gradient has taken place over cen-turies or millennia, with water being abstracted hav-ing had significant opportunity for equilibration withhost aquifer minerals. The accumulation of fluoridein water is ultimately limited by mineral solubility.In groundwaters where calcium is abundant, fluorideconcentrations are limited by saturation with the min-eral fluorite. In cases where calcium concentrations arelow, or where calcium is removed by ion exchange,fluoride may build up to excessive and dangerousconcentrations. Given these key controls on fluorideoccurrence and distribution, it is possible to anticipatebroadly where areas of regionally high-fluoride con-centrations are likely to exist. Such an understandingof the fluoride occurrence is important for the man-agement of the fluoride-related epidemiological prob-lems. Water-supply programmes in potentially high-fluoride areas should have geological and hydrologicalguidance, including chemical analyses and geologicalmaps.
Cardiovascular Diseases (CVD)
In Europe, water hardness is often expressed in termsof degrees of hardness. One French degree is equiv-alent to 10 mg L−1 as CaCO3, one German degreeto 17.8 mg L−1as CaCO3 and one English of Clarkdegree to 14.3 mg L−1as CaCO3. One German degree
of hardness (dH) is equal to 1 mg of calcium oxide(CaO) or 0.72 mg of magnesium oxide (MgO) per100 mL of water. Despite the wide usage of theterm, the property of hardness is difficult to defineexactly. Water hardness is not caused by a single sub-stance but by a variety of dissolved polyvalent metallicions, predominantly calcium and magnesium, althoughother ions, for example, aluminium, barium, iron, man-ganese, strontium and zinc, also contribute. The sourceof the metallic ions is typically sedimentary rocks, themost common being limestone (CaCO3) and dolomite(CaMg(CO3)2).
One of the most comprehensive studies of the geo-graphic variations in cardiovascular mortality was theBritish Regional Heart Study. The first phase of thisstudy (Pocock et al., 1980) applied multiple regres-sion analysis to the geographical variations in CVDfor men and women aged 35–74 in 253 urban areasin England, Wales and Scotland for the period 1969–1973. The investigation showed that the effect ofwater hardness was non-linear, being much greaterin the range from very soft to medium-hard waterthan from medium to very hard water. The adjustedSMR decreased steadily in moving from a hardnessof 10 to 170 mg L−1but changed little between 170and 290 mg L−1or greater. After adjustment, CVDin areas with very soft water, around 25 mg L−1,was estimated to be 10–15% higher than in areaswith medium-hard water, around 170 mg L−1, whileany further increase in hardness beyond 170 mgL−1did not additionally lower CVD mortality. Hence,it appeared that the maximum effect on CVD was prin-cipally between the very soft and medium-hard waters.Importantly, adjusting for climatic and socio-economicdifferences considerably reduced the apparent magni-tude of the effect of water hardness (Pocock et al.,1980).
A problem with correlation studies such as theBritish Regional Heart Study is the failure of muchof the research to consider the causal mechanismthat links independent variables to the disease out-come. Also, many of the calibrated models pre-sented in the literature are socially blind in includ-ing only variables pertaining to the physical envi-ronment, often a large number of water qualityelements.
A more detailed overview on cardiovascular dis-eases in Sweden and Finland can be seen later in thischapter.

266 O. Selinus et al.
Radon
Radon is a natural radioactive gas produced by theradioactive decay of radium, which in turn is derivedfrom the radioactive decay of uranium. Uranium isfound in small quantities in all soils and rocks,although the amount varies from place to place. Radondecays to form radioactive particles that can enter thebody by inhalation. Inhalation of the short-lived decayproducts of radon has been linked to an increase inthe risk of developing cancers of the respiratory tract,especially of the lungs. Breathing radon in the indoorair of homes contributes to about 20,000 lung cancerdeaths each year in the United States and 2,000–3,000in the UK. In Sweden 400 people die every year ofradon. Only smoking causes more lung cancer deaths.
Geology is the most important factor controlling thesource and distribution of radon. Relatively high levelsof radon emissions are associated with particular typesof bedrock and unconsolidated deposits, for examplesome, but not all, granites, phosphatic rocks and shalesrich in organic materials. The release of radon fromrocks and soils is controlled largely by the types ofminerals in which uranium and radium occur. Onceradon gas is released from minerals, its migration tothe surface is controlled by the transmission character-istics of the bedrock and soil; the nature of the carrierfluids, including carbon dioxide gas and groundwa-ter; meteorological factors such as barometric pressure,wind, relative humidity and rainfall; as well as soilpermeability, drainage and moisture content.
Examples from Specific EuropeanRegions
Health Issues at the British GeologicalSurvey in the UK
The geology of Great Britain is varied and complexand gives rise to the wide variety of landscapes foundacross the islands. For its size, the geology of the UKis probably one of the most complex in the world.In the twenty-first century, the interaction of humanswith geology in the UK is perhaps lower than in thepast. Drinking water comes from treated public sup-plies, not from local boreholes, and much of the foodeaten is supplied by large retail outlets and is not grown
locally. With concerns about genetic modification offoodstuffs, chemical pollution and contamination offood and the desire for the ultimate in freshness thereis, however, a small but significant cohort of the pop-ulation that grow their own fruit and vegetables inback gardens and allotments. In the UK, allotmentsare small parcels of land rented to individuals usuallyfor the purpose of growing food crops. There is no setstandard size but the most common plot is c. 250 m2
and there are probably of the order of 300,000 plotsin cultivation in the UK. For this section of the pop-ulation, the geology underlying their soils may wellhave a significant effect on their health and well-being.The other large cohort of the population which comeinto contact with the soil environment and are perhapsmore vulnerable to health problems are children. Playactivities in gardens and parks can bring children incontact with soil and its subsequent oral ingestion dueto hand-to-mouth activity.
Interestingly, it is the concern of government withthe contamination of land from anthropogenic activitysuch as industrial, mining and waste disposal activ-ities that has brought the natural geochemistry tothe fore. In 1987 the Interdepartmental Committeeon the Redevelopment of Contaminated Land setout trigger values for a number of contaminants insoils including potentially toxic metals. These indi-cated concentrations of acceptable and unacceptablerisk. More recently (Department for the EnvironmentFood and Rural Affairs and the Environment Agency,2002) new guidelines known as CLEA (ContaminatedLand Exposure Assessment) superseded the ICRCLvalues by more comprehensive soil guideline values(SGV) based on toxicology and human exposure tosoil contamination under different land use scenar-ios. The SGV are indicators for “intervention” eitherin the form of further detailed risk assessment and/orremediation. Legislation relating to the identificationof contaminated land and the suitability of land forredevelopment has led local authorities to apply theprinciples specified in CLEA and in certain areas of theUK where the concentrations of some potentially toxicmetals in soils, of which arsenic was most common,were causing some concerns. Over a similar timescalethere was increasing interest in the natural geochem-istry of the UK driven, in the first instance, by theneed to identify mineral resources. Stream sedimentgeochemical surveys of the UK (Johnson et al., 2005)were showing clear patterns of potentially harmful

Medical Geology in Europe 267
elements (PHE) at elevated concentrations. Subsequentsoil mapping (Johnson et al., 2005) aimed more atenvironment and health investigations showed that thepatterns for arsenic could be linked to the geologyof the underlying parent material and were geogenicrather than man-made phenomena. A recent publica-tion (Appleton et al., 2008) has combined the streamsediment and soil data to produce a national scaleUK estimate of soil arsenic concentrations. This studyshowed that the largest areas with the highest con-centrations (>30 mg kg−1) occur in the English LakeDistrict, western Wales, the northeast midlands goinginto the north midlands and southwest England.
The British Geological Survey has carried out anumber of studies (Cave et al., 2003; Palumbo-Roeet al., 2005; Wragg, 2005; Cave et al., 2007; Wragget al., 2007) investigating the human bioaccessibil-ity of arsenic in soils with elevated arsenic from theNE midlands and in SW England. The investigationshave been based on an in vitro physiologically basedextraction test (PBET) which mimics the physical andchemical environment of the human stomach and theupper intestine. The test measures the bioaccessibil-ity of the arsenic in the soil (the amount of arsenicliberated into solution from the soil during the PBETtest). The NW midland soils developed over iron stoneparent materials were found to have <10% of theirtotal arsenic content in bioaccessible form. In SWEngland where the arsenic was associated with naturalmineralization, total concentrations generally higherthan in NW midlands, especially where mining activi-ties were carried out, had higher bioaccessible arsenic(c.10–20%). Geochemical testing including sequen-tial extractions shows that the bioaccessible arsenicis associated with carbonates and fine-grained Fe/Mnoxy-hydroxides whereas the unavailable fraction isoften bound to highly crystalline Fe oxides (goethite,hematite). The studies of the ironstone soils haveshown that the bioaccessible fraction of arsenic inthese soils is unlikely to be a health risk and that in themineralized areas in the southwest especially wherethe highest total arsenic concentrations occur therecould be potential health risks. It has been shown thathumans living in a high arsenic area in SW England dohave elevated As in urine (Kavanagh et al., 1997).
To illustrate the potential problems with arsenic inthe UK, the BGS recently completed a geochemicalsoil survey of the river Tamar catchment in the southwest of the UK (Rawlins et al., 2003). Figure 4 shows
the location and the geology of the catchment alongwith the areas where mining activity has taken place.Figure 5 shows the concentration of arsenic in soilinterpolated from chemical analysis of 450 samplestaken over the catchment. Clearly, large proportion hassoil concentrations exceeding the current UK soil SGVof 20 mg kg−1. The very high concentrations of arsenicfound in the south of the area coincide with the locationof the Devon Great Consols arsenic mine which fin-ished operation in 1930. Work is currently under way,using the archive of soils collected from this area, tomeasure and map the bioacessibility of the arsenic inthe soil.
Medical Geology in Portugal
Mainland Portugal is located in the western edgeof Europe between latitudes 37 and 42◦N. The lat-itude, together with the orography, and the proxim-ity to the Atlantic Ocean are considered to be thekey factors conditioning the climate. The northernpart of the country is mountainous, with 90% of theland above 400 m, while rolling plains prevail inthe south, where 60% of the land is below 400 m.The geology is considerably diverse and complex.Briefly, the country can be divided into two largeunits: the Hesperian Massif and the Epi-Hercyniancover. The Hesperian Massif, occupying more thanhalf the country, is of Precambrian and Palaeozoicages. Granitoids and a flysch-type series of schistsand greywackes are the dominant lithologies. The Epi-Hercynian cover includes the western and southernMeso-cenozoic margins and the basins of Tejo andSado rivers. Limestones, marls, shales, sandstones andconglomerates are very common.
Soil Geochemical Atlas of Portugal
The relevance of geochemical mapping as a methodof providing multi-element databases documenting thepresent surface environment is now generally recog-nized. The continental area of Portugal is now entirelycovered by a soil geochemical survey (1 site/135 km2),taking as the sampling media topsoils (upper mineralhorizons, A) and organic horizons (humus, O). Themain purpose was to obtain baseline levels of several

268 O. Selinus et al.
220000 230000 240000 250000
7000
080
000
9000
010
0000
1100
00
0 5 10 15 20
Kilometers
Devon
Cornwall
Nor
th A
tlant
ic
Simplified solid geologyof the Tamar catchment
Areas of metalliferousmining
Intrusive igneous lithologies
Carboniferous strata
Devonian strata
Undifferentiated igneous rocks
Bude Formationsandstone & mudstone
Crackington Formationsandstone & mudstone
Lower Carboniferousmudstone & chert
Upper Devonianmudstone
Fig. 4 Location and geology of the Tamar catchment in the UK (Rawlins et al. 2003)
elements in Portuguese soils, leading to a completecoverage of continental Portugal with a low-densitygeochemical survey. The sampling and analytical pro-gramme was performed according to internationalrecommendations (IGCP Project 259 “InternationalGeochemical Mapping”). The compilation of all data(nearly 45,000 individual data) in an organized wayled to the production of the first Soil GeochemicalAtlas of Portugal. In this Atlas it is possible to find foreach chemical element a set of information statistics,maps of spatial distribution, among other informationof geochemical and environmental interest. Amongother findings the soil survey identified (1) strongregional differences within the geochemical baseline,(2) relationships between the geochemical patternsand lithology, soil type and mineral occurrences, (3)areas with low concentration of many elements orwhere concentrations of potentially harmful elements
are high and (4) the influence of anthropogenic factors.These data are also of interest for geochemical explo-ration purposes in the sense that they may constitutea general framework for normalizing existing soil andstream sediment surveys which are sparse all over thecountry (Inácio et al., 2008).
Some identified health problems in Portugal relatedto geogenic and anthropogenic sources.
Arsenic
It is well known that the risk associated with As expo-sition is a fact and can affect populations in particularurban regions or with significant drop in water levels incertain geological formations. The highest values of Asare related with some mineralizations normally asso-ciated with the contact of granites and metasediments

Medical Geology in Europe 269
220000 230000 240000 250000
7000
080
000
9000
010
0000
1100
00
/
0 5 10 15 20
Kilometers
Surface soils
As (mg/kg)519 - 14,800
162 - 518
87.1 - 161
42.1 - 87
22.4 - 42
16.6 - 22.3
15 - 16.5
13.8 - 14.9
11.6 - 13.7
6.8 - 11.5
99th
95th
90th
75th
50th
25th
15th
10th
5thP
erce
ntile
s
Devon
Cornwall
Dartm
oor
Fig. 5 Soil arsenic geochemical map of the Tamar catchment (Rawlins et al., 2003)
(Reis et al., 2005). The Soil Geochemical Atlas ofPortugal revealed that the highest values are located inthe Central Iberian Zone and are related to a graniticbasement, associated with the contact between gran-ites and metasediments. Drinking water contaminatedby naturally occurring arsenic minerals was identifiedin several areas of the Central-North region of Portugal(Fig. 6).
Arsenic was reported in high levels in soils throughatmosphere deposition and As containing water aroundsome industrial areas due to mining and smelt-ing activity. Human exposure risk to environmentalarsenic was evaluated by combining drinking waterand atmospheric deposition, assessed tap water anal-ysis and a moss biomonitoring survey. The Portuguesesurvey was developed during 2002 as part of the
activities of the UNECE ICP Vegetation Program andreported, for the first time, the concentration of arsenicat a national scale (Figueira et al., 2007).
Asbestos
Data on the incidence of occupational asbestos-relateddiseases in Portugal are only available for the period1985–1993. During this time 71 cases of asbestos-related diseases were recorded. In 1992, six deathsfrom asbestos-related diseases were registered. In 2003the Social Affairs Ministry reported that there were161 cases of asbestos-related diseases as well as manymore cases of pulmonary complications due to theinhalation of asbestos dusts. Since the implementation

270 O. Selinus et al.
1
11
19
37
55
81
266
Percentile As (mg / kg)
Min25%50%
75%
90%
95%
98%
Máx
100 km
Fig. 6 Spatial distribution map of As in the A horizons plottedby kriging using a variographic model (Inácio et al., 2008)
of the EU Asbestos Directive, industry has been replac-ing asbestos with safer alternatives such as PVA andcellulose (Kasan-Allen, 2006).
Fluoride
Fluorosis is a widespread disease related to inges-tion of high levels of fluorine through water and food.Although sometimes of anthropogenic origin, high lev-els of fluorine are generally related to natural sources.The problem of fluorosis related to volcanic activity,which releases magmatic fluorine generally as hydro-gen fluorine through volcanic degassing, was first rec-ognized in Japan where this pathology was called “Asovolcano disease” (Kawahara, 1971) due to the fact thatfluorosis was widespread in the population living at thefoot of this volcano. The major pathway of magmaticfluorine to humans is in the form of fluoride ion (F−),through consumption of contaminated vegetables anddrinking water. Contamination occur either throughdirect uptake of gaseous HF or through rainwater’s and
volcanic ashes. The direct effects of volcanogenic flu-oride on human populations are less well recorded.In the village of Ribeira Quente (São Miguel Islandin the Azores, Portugal), which is located only 5 kmfrom the caldera of Furnas volcano there are a numberof incidences of dental fluorosis in the local popu-lation, shown by the mottling of teeth, which is theresult of high levels of fluoride in the groundwatersthat until recently supplied the village with drinkingwater (Baxter and Baubron, 1999). To investigate thesource of this, lichens were collected from the area andused as biomonitors. The results shown that gaseousvolcanogenic fluoride is released through the soil intothe environment in the Furnas Caldera. These gaseousvolcanogenic fluoride are the most likely source of thehigh levels of fluoride in the groundwaters. The mainconduits controlling the release of the gases are faultsand ring structures associated with the formation ofcraters. This study has shown that lichens may be usedto detect fluoride which is diffusing through the soil(Notcutt and Davies, 1999).
Lead
Subtoxic levels of lead (Pb) during pregnancy can beresponsible for intrauterine delays in foetal develop-ment and thus increased risk of morbidity and mortal-ity of newborns. Identified most vulnerable individualsshould not live in conditions that expose them to newlyevidenced hazardous Pb levels and those potentiallyexposed need to be identified through blood Pb screen-ing, preferably targeted instead of universal (FátimaReis et al., 2008). The project “Foetal exposure to lead”as determined by human and environmental biomark-ers, investigation of influence on human reproduc-tive outcomes and autonomic nervous system in rats(FEXHEBIO) is a multidisciplinary project, involvingseveral national institutions, aiming (i) to assess humanexposure to environmental lead through the determina-tion of lead relative bioavailability and bioassessibility;(ii) to determine human exposure to lead through bloodlead levels (BLL) in umbilical cord; only blood will beused as human sample media; (iii) to test the followinghypothesis: (1) umbilical cord BLL of concern are pos-itively associated with higher environmental levels oflead, determined in mosses collected in residence areasof corresponding women, and (2) there is a positive

Medical Geology in Europe 271
association between human exposure to lead and expo-sure to subtoxic levels of lead during pregnancy; (iv)to investigate the putative effect of lead exposure dur-ing the prenatal period in the activity of the autonomicnervous system in rats.
Radon
By far, radon is known to be the main contributor toexposure from natural background radiation. Radonis a radioactive gas that occurs in rocks, soils, airand water in variable concentrations and is consid-ered an environmental health hazard. Because thisradioactive gas is considered to be the second lead-ing cause of lung cancer (first is smoking), mostEuropean countries have adopted a number of reg-ulations to identify radon-prone areas. From 1987to 1992, the Radiological Protection and NuclearSafety Department (DPRSN) of the Nuclear andTechnological Institute (ITN) carried out in Portugal anational wide radon survey. In the framework of thatstudy, indoor radon measurements were first carriedout in dwellings located in technologically enhancednaturally radioactive zones and it was later enlargedto the entire country (Faísca et al., 1992). The mea-surements were performed on a statistical basis of onedetector for 2,000 inhabitants and the detectors dis-tribution were performed in order to cover, wheneverpossible, rural and urban areas, in a total of 4,200measurements. Indoor radon concentration levels areaffected not only by the underlying geological com-position, but also by soil permeability and porosity,the occurrence of rock cracks, pressure differencesbetween the gas in the soil and at the surface and otherkinds of parameters related to the construction typeof the buildings, ventilation rates and living habits ofthe inhabitants (Pereira et al., 2003). A new approachis being developed in order to obtain indoor radonrisk maps through the use of geostatistic simulationtechniques. This is being done by using radon dataalready available for Portugal (4,800 results) and inte-grating data from new sampling campaigns, aiming agood cover of the Portuguese territory. On the basisof geology, in situ gamma-ray measurements (rocks,soils and water) and emanometry techniques a method-ology for the elaboration of small-scale radon riskmapping (1:5,000 scale) was proposed (Pereira andNeves, 2005).
Radon concentrations in groundwater are highlyvariable and are mainly related with geological fac-tors. The radon concentrations in groundwater fromthe Hesperian massif of Central Portugal were eval-uated by Pereira et al. (2007). A survey carried outbetween Viseu (north limit) and Nisa (south limit)showed that the radon concentrations are disperse overa wide range of variation, between a minimum of19 and a maximum of 8,830 Bq.L−1. In general, thevariability in radon concentrations is high, with thehighest variance detected in the Beiras granite sam-ple set which also displays the highest absolute values,often above 1,000 Bq.L−1(16%). This value is the limitrecommended by the European Union (recommen-dation 2001/928/Euratom) for water used for humanconsumption. In general, within each lithology, thehighest values relate to waters that percolate throughU-enriched faults that crosscut not only the igneousrocks but also the metasedimentary ones.
Uranium
In granites of the Centre of Portugal, uranium miner-alizations are known since the early twentieth centuryand several deposits were extracted for radium and ura-nium production. The mining and milling works ofradioactive ores originated a large amount of residuesaccumulated in spoil heaps and tailings piles. Thesesolid residues contain high concentrations of radionu-clides belonging mainly to the uranium decay series(Carvalho et al., 2005a; Carvalho and Oliveira, 2007).In Portugal the recent closure of uranium mines (2001)has raised concerns regarding the possible chemicaland radiological (from 238U daughters alpha-emittingradionuclides) effects on the health of the populationsliving around the mining areas. During the last fewyears, the radioactive contamination of this region hasbeen investigated in a systematic manner (Carvalhoet al., 2005a). In particular, a detailed investigation onthe exposure of human populations to uranium miningand milling wastes was performed in the frameworkof a multidisciplinary project MinUrar – Uraniummines and their wastes: health effects in a Portuguesepopulation (Falcão et al., 2005; Carvalho et al., 2007).
Carvalho et al. (2007) studied the enhancementof radioactivity in selected freshwater ecosystems(Vouga, Dão, Távora and Mondego rivers) and con-clude that, in spite of the large number of uranium

272 O. Selinus et al.
mines exploited in this region, there is no widespreadand lasting accumulation of radionuclides in the water-sheds of the studied rivers. The overall results offish analyses show an enhancement of radionuclideconcentrations in fish from Mondego river, collectedin the area receiving the discharges from Ribeira daPantanha. Depending on the radionuclide, concentra-tions in fish generally are 2–10 times above naturallyoccurring concentrations in fish from the other rivers ofthe region. However, according to currently acceptedradiological safety standards, these concentrations donot pose a significant radiological risk to human con-sumers and to aquatic fauna.
The contamination of agricultural soils in the ruralarea of Cunha Baixa (Mangualde, Central Portugal)due to irrigation with U-contaminated water and theconsequent phyto-accumulation in food crops associ-ated with dietary exposure to U has also been investi-gated (Neves and Abreu, 2009).
Volcanic Soils and Related Health Problems
Volcanic regions are important scenarios for the studyof heavy metal contents in soils and the effects ofthose on living organisms because (a) they are denselyinhabited in some areas of the Earth; (b) soils effec-tively retain chemicals acting as a reservoir affectingagriculture; (c) the volcanic islands are more closedgeochemical systems than continental land; (d) lit-tle has been said concerning natural pollution relatedespecially with volcanic activity. Studies carried out inS. Miguel Island (Azores) showed that
(i) inhabitants of the São Miguel Island (Azores)revealed that humans living chronically exposedto volcanic emissions show high concentrationsof essential and non-essential trace metals in scalphair (Amaral et al., 2008).
(ii) humans present high incidence of chronic bron-chitis and some cancer types, which maybe related to volcanic emissions (Amaral andRodrigues, 2007). Baxter et al. (1999) demon-strated a probable health hazard associated withground gas emissions in Furnas (São Miguel).According to the Direcção-Geral de Saúde thecancer mortality in the Azores (1999–2201) washigher than in Madeira Island and Portugal main-land. Amaral et al. (2006) suggest that the much
higher rates of lip, oral cavity and pharynx can-cer, and breast cancer in Furnas may be partiallyexplained by the chronic exposure to environmen-tal factors resulting from volcanic activity, suchas hazardous gases, trace elements and radon.Since the cancer chemopreventive role of Se hasbeen well documented, the authors also speculateto a possible association between the low con-centrations of Se, the high concentrations of Cd,which is carcinogen, and Pb, which is a probablecarcinogen, and some of the cancers found pre-viously (Viegas-Crespo et al., 2000; Pavão et al.,2006).
(iii) the high Mn/Mg ratio in animals and humans(blood) can also be the cause of ataxia. Someresearchers are trying to establish the associationof abnormal Mn/Mg ratio to the Machado–Josephneurodegenerative disease, with a high incidencein Azores (Purdey, 2004).
(iv) cattle population in the Azores Island revealeddeficiencies of micronutrients. There were sig-nificant differences in the levels of glutathioneperoxidase (enzyme indicator of the levels of Sein the body) in populations of cattle with andwithout problems of enzootic hematuria and acutefoetus by the common (Pinto et al., 2000). Alsothe studies demonstrated that there is a high mor-tality rate and a quite high incidence rate of cancerin the cattle (Carvalho et al., 2005b, 2006).
The results show that an association between theincidence of cancer and the concentrations of essentialand toxic elements in volcanic soils (and consequentlyin the agricultural product deriving from those soils)can exist. The possibility of other health problemscannot be neglected, namely respiratory diseases as aresult of the aerial transport of soil particles enrichedin toxic elements. Although some of these associa-tions are speculative, they should be investigated andso, according to toxicologists and epidemiologists,it is necessary to have a detailed knowledge of thephysico-chemical characteristics of soils and the globaldistribution of the element concentrations.
Beneficial Effects of Geological Materials
In Portugal balneology and hot springs therapy as apart of preventative medicine is widely recognized

Medical Geology in Europe 273
and encouraged. Medical prescriptions are given forthe treatment of a wide range of health problems uti-lizing mineral waters. In Portugal different chemicalclasses of hot springs have been recognized (sim-ple, chloride, hydrogen carbonate, sulphate, carbondioxide, iron, sulphur, acid and radioactive). Eachclass of hot spring is reputed to be effective in treat-ing a wide range of health problems such as burns,skin diseases (psoriasis), respiratory diseases (asthma,rhinitis), hypertension, diabetes, gout, muscle aches,arthritis.
In addition to hot springs, geological materials suchas mud and sand are actually investigated regardingtheir application in pelotherapy, mud therapy or fan-gotherapy. Beach sand baths in Porto Santo Island,Portugal, are popular therapeutic practice. Gomes andSilva (2006) believe that essential elements in the car-bonate and clay-rich sands are incorporated into thebodies of the people covered by the sand by percuta-neous mechanisms. Porto Santo, rather appreciated byvery many tourists, has been considered as a naturalhealth resort due to the healing assets of their naturalresources, utilized in thalassotherapy centres and spas.
Presently, there is much scientific information onthe assets or properties of clay minerals that justifytheir incorporation in pharmaceutical formulations andcosmetics as well. Gomes and Silva (2007) design anddevelop clay-based products, in the form of creams,ointments or lotions with balsamic or curative prop-erties, which could be used for topical applications inbalneotherapy, dermopharmacy and dermocosmetics.Also, there is some investigation regarding the process-ing or maturation that is required for the improvementof volcanic mud or fango properties.
Slovakia
In Slovakia, as well as in many other countries,Medical Geology issues are being addressed by geo-logical projects financed from the state budget. Onesuch project being conducted by the Geological Surveyof the Slovak Republic is the evaluation of potentialinfluence of geochemical environment on the healthstate of population in the region of the Spišsko-Gemerské Rudohorie Mts. (Rapant and Krcmova,2008). The aim of the project is to verify methodi-cal principles of evaluation of the influence of either
excess or deficiency of chemical elements withingeological environment on the health of the popu-lation in one of the most contaminated regions ofthe Slovak Republic. Methodological interconnectionsof geochemical and medical data and their furthermutual assessment have been developed, aiming at thefinal analysis of environmental and medical risks. Amethodology has also been developed for evaluatingand systematically mapping of environmental healthrisks from harmful elements in Slovak groundwa-ters. Applying national geochemical databases Rapantand Krcmova (2008) have dealt with the feasibil-ity of calculating and visualizing health risk fromarsenic groundwater contamination. Potential healthrisks have been assessed based on existing geochem-ical data in accordance with present methodologicalprocedures established for human health risk assess-ment. Screening analysis has been used to estimatethe contribution to total chronic risk from groundwatercontamination by potentially toxic elements includ-ing As, Ba, Cd, Cu, Hg, Pb, Sb, Se and Zn. Theseresults point out a significant contribution of arsenicto total risk in about 10% of the Slovak territory. Theareas characterized with high health risk levels aremainly geogenically contaminated. High carcinogenicrisk was determined in 34 of 79 districts and in 528 of2,924 municipalities.
The environmental risk, defined as the possibil-ity of impairment of biotic or abiotic componentsof the environment, derived from geological sourceshas also been estimated for the whole of Europe.The assessment was based on data obtained from theGeochemical Atlas of Europe (De Vos and Tarvainen,2006; Salminen et al., 2005). The assessment methodwas based on the calculation of two-step environmen-tal risk index values (IER) for individually analysedwater, soil and sediment samples. Environmental riskquotients are first calculated for each analysed chem-ical element or compound that exceeds the limit forrisk values, and their sum is then calculated. The riskat each site was defined and classified as negligible,low, medium, high, very high or extremely high. Theresults are presented as risk maps covering the 26countries of Europe. The calculated maps delineateregions where highly elevated concentrations pose arisk to the environment, or where the action limitsfor soil, sediment or water contamination should berevised using the high local baseline (Rapant et al.,2008).

274 O. Selinus et al.
Sweden
In Sweden, research started in the 1960s on coro-nary heart disease and water hardness (Nerbrand et al.,1992). Later, a large study was carried out on diabetestype 1 in children, which resulted in evidence for acorrelation between high contents of Zn in drinkingwater and this type of diabetes (Haglund et al., 1996).In the following some examples on medical geologyresearch in Sweden are presented. They are just a fewexamples undertaken as a close collaboration betweengeochemists and medical scientists, epidemiologists,toxicologists, veterinarians, etc. Activities have alsobeen carried out with the Royal Swedish Academyof Sciences which resulted in a special publication oftheir journal AMBIO (AMBIO, 2007).
In the 1980s, when thousands of moose died inSweden, close collaboration between veterinarians andgeochemists showed that this disease was the resultof liming of acidified areas (Selinus and Frank, 1999;Selinus et al., 1996). The liming mobilizes molyb-denum in bedrock and soils, causing a disturbedCu/Mo ratio which is critical for the health of rumi-nants. In connection with a new type of moose dis-ease of unknown etiology in southwestern Sweden,re-examinations of tissue metal concentrations wereperformed in 1988 and 1992. Decreased hepatic Cuconcentrations in 1988 and 1992 (30 and 50%, respec-tively) were observed in comparison with the corre-sponding value in 1982. Decrease of other essentialand toxic metal concentrations was noted in the liversuch as Cr (80%), Fe, Zn, Pb, Cd. In the kidneys,decreases of Ca, Mg, Mn indicate severe metabolicdisturbances (The Cd concentration in the kidneysdecreased by about 30%.) (Fig. 7).
Decreasing metal concentrations in organ tissues ofthe moose, after such a short period of 5–6 years indi-cate changes in the concentration of metals via plantsin the upper soil surface layer. Thus, the moose appearsto be a sensitive monitor of environmental changes.In ruminants, the utilization and availability of Cu infeed is greatly influenced by interactions between Cu,Mo and S. Increased Mo concentrations with respect toCu in the feed causes secondary copper deficiency inruminants with clinical signs in close agreement withthe signs reported to relate to the unknown moose dis-ease. When livers from yearlings, collected in 1982and 1992, were analysed for Mo, increased hepatic Mo
Fig. 7 Moose
concentrations were found in northern and southerndistricts of Älvsborg County (24 and 21%, respec-tively) during the 10 years between sample collections(Frank et al., 1994).
When pH in soils decreases, Mo becomes less avail-able to plants and its uptake diminishes. Nonetheless,the increased Mo uptake by plants in the strongly acid-ified region is difficult to explain. A small pH increasein the environment causes a marked increase of Mouptake by plants (Mills and Davis, 1987). Thus, theresults evidently indicate elevated pH in the soils. Theintensive liming of lakes, wetlands, fields and pasturesin the western part of Sweden during the later 1980s,and to some extent the liming of forest areas duringrecent years, is suggested as a possible explanationof increased hepatic Mo concentrations in this excep-tionally acidified region. This side effect of limingand its harmful consequences for domestic and wildruminants appears to have been overlooked.
Cardiovascular Studies in Sweden
In Sweden, three case–control studies have been con-ducted during the last decades. First, the relationbetween death from acute myocardial infarction (AMI)and the level of magnesium and calcium in drink-ing water was examined among men, using mortalityregisters (Rubenowitz et al., 1996). A few years latera study with a similar design was made comprisingwomen (Rubenowitz et al., 1999). The studies wereconducted in a part of southern Sweden, in a relativelysmall geographic area where there was a great differ-ence between and within the municipalities regarding

Medical Geology in Europe 275
magnesium and calcium content in drinking water. Theadvantage with this limited study area was that thepossible risk of such confounding factors as climate,geographical, cultural and socio-economic differenceswas minimized.
A prospective interview study was conducted inthe same area, where men and women who sufferedfrom AMI during the years 1994–1996 were com-pared with population controls (Rubenowitz et al.,2000). The results showed that magnesium in drink-ing water protected against death from AMI, but thetotal incidence was not affected. In particular, thenumber of deaths outside hospitals was lower in thequartile with high magnesium levels. This supportsthe hypothesis that magnesium prevents sudden deathfrom AMI rather than all CHD deaths. The mecha-nisms that could explain these findings are discussedbelow.
The data collected in the Swedish case–control stud-ies can be used to estimate the impact of water magne-sium on the incidence of myocardial infarction in thestudy population. If everyone in the male study basewere to drink water from the highest quartile (≥9.8 mgL−1), the decrease in mortality from AMI would beabout 19%. This means that the age-specific inci-dence of death from myocardial infarction in the studyarea would change from about 350/100,000 year−1 to285/100,000 year−1. The decrease of the incidence permg L−1magnesium can be calculated to be approx-imately 10/100,000 year−1, which is an even largerdecrease than estimated. For women, the correspond-ing decrease in mortality from AMI would be about25% if everyone were to drink water from the high-est quartile (≥9.9 mg L−1). The age-specific mortalityamong women in the study area would change fromabout 92/100,000 year−1 to 69/100,000 year−1.
Multiple Sclerosis
Multiple sclerosis (MS) is a chronic neurologicalillness that affects nerve cells in the central ner-vous system (CNS) belonging to a group of illnessescalled autoimmune diseases where the immune systemattacks the body’s own tissue. There is a general beliefthat the epidemiological patterns of MS vary withgeography. Present research in Sweden has focused onpossible links between MS and geochemistry.
In a recent study the Swedish MS-register was used,which includes almost all MS-patients in Sweden, spa-tially distributed census data, geochemical data fromsoil (till), stream water and groundwater. All data werespatially re-allocated to post code areas, the smallestspatial administrative unit in Sweden. Analysis indi-cates that a geographical pattern could be found withhigher prevalence of MS in parts of the county. Nonorth–south or east–west gradient of the prevalencewas found. However, visual interpretation of preva-lence measures is strongly biased towards large postcode areas, masking the variation of prevalence mea-sures of small areas. Multivariate and univariate anal-yses (zinc) were performed on geochemical data andprevalence of MS. But no statistically significant cor-relations were found. One important conclusion drawnis that administrative divisions (i.e. parishes, post codeareas, etc.) are less appropriate for this kind of study.Divisions with respect to natural (geographical) bor-ders such as catchment areas would be more useful forwhen combining epidemiological data with geophys-ical data. The use of average values over districts isproblematic. A high density of sampling in an areadoes not necessarily mean that the calculated meanvalue is representative for the whole area.
One study has also started, continuing the describedone, looking into MS and acid sulphate soils in Swedenand Finland.
Morbus Gaucher’s Disease
Gaucher’s disease (GD) is a lipidosis; a disorder ofthe lipid metabolism depending on a deficiency of anenzyme, beta-glucosidase. The first symptom of GDis an enlargement of the spleen, which often beginsas early as the first year of life and proceeds rapidly.The heaviest spleen reported in a patient with GD hada weight of 12 kg; that is, 100 times the weight of anormal spleen.
Researchers have made a survey of the occurrenceof GD in all Sweden and found 55 cases. The inci-dence of GD is 13 times higher in northern Swedenthan in southern. Gaucher’s disease is inherited withan autosomal, recessive gene. It is assumed that theGD gene does not occur in any other family in thesame area. Furthermore, the assumption is made thatthe GD gene has been created by a mutation in a ger-minal cell of the man in generation 1. The son of this

276 O. Selinus et al.
man, in generation II, is the first carrier of the GD gene,the first CD heterozygote. It is important to keep it inmind that if a gene of recessive type is created in anindividual living in a certain geographical area, it willtake at least four generations or about 100 years untilthe first individual with the manifest disease is horn inthat family. At that time it might be the case that mostmembers of the family have moved to other districts ofthe country. If the incidence of a disease is high in acertain geographical area, there is, as a matter of fact,a possibility that the responsible gene was created bya mutation 100 years or several hundred years ago inquite another part of the country. Of importance forthe discussion is the fact that in such districts wherethe rate of marriages between near relatives is high,the incidence of recessive diseases existing in the dis-trict is also high. In many parts of northern Sweden therate of such cousin marriages has been unusually highduring several hundred years.
In order to discover the places where the GD ances-tors lived five generations ago, researchers went tothe parish records. Of the 176 forefathers in this“generation of the grandparents’ grandparents”, 96lived in the little village of Överkalix at the Kalixriver. The interest was then directed to Överkalixas the district where the GD mutation could pos-sibly have taken place, possibly in several differentfamilies.
A study of 30 Swedish families with theNorrbottnian type of Gaucher’s disease provides evi-dence for two clusters of the gene, one close toÖverkalix in the northern part of the county ofNorrbotten and the other in the vicinity of Arvidsjaurin the southern part of the same county. The gene forGaucher’s disease in Överkalix appeared later than thatin Arvidsjaur. A founder moving from Arvidsjaur toÖverkalix during the seventeenth century or two differ-ent mutations are the most likely explanations of thisfinding.
In collaboration with the Geological Survey ofSweden a possible cause of the disease in these areaswas found. In the beginning of the seventeenth cen-tury an intensive mining was carried out in Nasafjällin the high mountain areas in northern Sweden. Aslong as these heavy metals lie biologically inactive inore bodies, they are harmless to man, but when theyare mined and refined a genetical risk can occur espe-cially in the harsh environmental conditions such asin Nasafjäll where there also were furnaces and toxic
fumes. The hypothesis is that such heavy metals mightbe the mutagen agent responsible for the mutationcausing GD in northern Sweden (Hillborg, 1978).
Radon
Radon-222 in dwellings is the dominant source ofexposure to ionizing radiation in most countries.Nationwide measurement programmes suggest that theaverage radon concentration in Sweden is about 2.7pCi L−1 (100 Bq m−3), a level that appears higherthan those in many other countries. Current standardsin Sweden correspond to about 3.8 pCi L−1 (140 Bqm−3) for new houses and 10.8 pCi L−1 (400 Bq m−3)for existing houses, whereas in the United States therecommended level at which action should be taken is4 pCi L−1 (148 Bq m−3). In Sweden it is estimated thatabout 400 people die every year because of radon.
Arsenic
Around the world arsenic in drinking water hasbecome a major issue concerning serious health prob-lems. Arsenic is an element found naturally in rocksand soil, also in Sweden. As a rule, however, yields arevery low. SGU has examined arsenic levels in waterfrom the individual, rock drilled wells throughout thecountry. The risk of elevated levels is, not surpris-ingly, in areas where the bedrock is arsenic rich. Theconcentrations of arsenic in the Swedish bedrock andsoil are generally low. Elevated and high arsenic lev-els are, however, found in quite many with sulphiderocks and also older sedimentary rocks. In these areasthe groundwater may also have elevated arsenic levels.
Several local studies have been carried out in recentyears on arsenic in groundwater. The geological surveyis now in a joint project with the Swedish RadiationProtection Authority (SSI) analysing arsenic levels inwell water from 750 wells from all over Sweden.Arsenic concentrations are generally low, below ornear detection limits, but elevated levels can occuralmost everywhere. In areas where bedrock or soil hashigh levels of arsenic, it is more common with ele-vated arsenic levels in well water. However, it is notalways the case that an arsenic-rich bedrock meanselevated arsenic levels in water. The highest concen-trations are found in northern Sweden up to 800 μgL−1 (the guideline value is 10) (Selinus et al., 2005).

Medical Geology in Europe 277
Geomedical Investigations in Norway
In Norway problems related to the geographical distri-bution of trace elements in nature have been known fora long time in human as well as veterinary medicine.As an example the connection between iodine defi-ciency and goiter, most prevalent in areas situated farfrom the ocean, was known already a 100 years ago inman as well as in animals (Løken, 1912). A numberof investigations have been performed over the yearson deficiency problems in animal husbandry related tolow abundance of essential trace elements in pasturesoils. Essential trace elements such as cobalt, cop-per, selenium and molybdenum have been subject toconsiderable problems in areas where the natural abun-dances are sub-optimal, particularly in sheep. Many ofthese findings are described in the textbook edited by J.Låg (1990) and in proceedings of numerous symposiaarranged by the Norwegian Academy of Science andLetters, e.g. Låg (1992) and Steinnes (2004).
Ever since the elimination of goiter by adding iodideto table salt, however, no well-documented geomedicalproblems have been shown in the human population ofNorway. A number of investigations have been carriedout in order to elucidate possible connections betweennatural factors and disease in humans, and in somecases statistically significant correlations have beenfound. Still these findings remain as hypotheses untilthe present time.
In the 1970s some interesting occurrences ofextremely high concentrations of toxic metals suchas Pb and Cu were observed in natural soils inseveral places in Norway (Låg et al., 1974). Theywere observed spot-wise where ore minerals had beenexposed to weathering and the released metals hadbeen supplied to the surface by groundwater move-ment. This purely natural phenomenon is found to bemore common in some areas than others, but untilpresent no associated problems in human or animalhealth have been disclosed.
Problems in Veterinary Medicine
Problems related to natural deficiency or excess ofgiven essential elements have been well documentedin Norway, most frequently with Co, Cu and Moand Se. In many cases these problems appear more
frequently in some geographical areas than elsewherein the country.
Cobalt deficiency in sheep was recognized already60 years ago (Ender, 1946). Ruminants are partic-ularly sensitive to inadequate supply of this metal,which they need for the synthesis of vitamin B12. Inspite of the great attention to this problem amongNorwegian veterinary scientists (Ulvund and Øverås,1980; Ulvund, 1995; Sivertsen and Plassen, 2004) andthe countermeasures introduced, the problem is stillevident in some geographical areas, particularly in thesouthwest.
Because of metabolic interaction the elementsCu and Mo are interdependent in ruminant animals(Frøslie, 1990). Although Mo is not particularly toxicper se, an excess supply of molybdenum may lead tocopper deficiency in sheep and cattle. On the contraryCu poisoning may occur in sheep even at normal cop-per levels in the feed if the intake of molybdenum islow. Problems in Norway related to the Cu/Mo bal-ance in sheep have been discussed in several papers(Frøslie, 1977; Frøslie and Norheim, 1977; Søli, 1980;Frøslie et al., 1983). The main problem here seems tobe associated with low levels of Mo in natural pas-tures (Frøslie et al., 1983). Since Mo uptake in plantsincreases with increasing pH whereas the Cu uptake isless influenced by pH, the largely acidic soils in manynatural pasture areas in Norway may accentuate theproblems observed in sheep.
Problems related to Se and vitamin E deficiencyare also well known in Norway (Frøslie et al., 1980).There are appreciable regional differences in Se sta-tus within the country, most clearly demonstrated insheep (Sivertsen and Plassen, 2004). Winter-fed lac-tating cows, however, were found to have an adequateplasma level of vitamin E and a marginal to adequatelevel of Se (Sivertsen et al., 2005).
One particular development followed closely inNorway with respect to possible trace element imbal-ances is the rapid development of organic farming(Steinnes, 2004). Organic farmers are dependent onapproaches different from those used in conventionalagriculture in order to compensate for deficienciesof essential nutrients in the soil and may thereforebe more vulnerable to geomedical problems in theirlivestock. Govasmark et al. (2005), in a study ofthe animal nutritional status of Cu, Mo and Co at27 Norwegian dairy and sheep farms, found that theherbage concentrations of these micronutrients were

278 O. Selinus et al.
not sufficient to meet the dietary needs of ruminantsand concluded that extra supplements were required.
From the early 1990s a high frequency of bone frac-tures in moose (Alces alces) was reported from thecounties of Aust-Agder and Vest-Agder in southernNorway (Ytrehus et al., 1999). The fractures were seenmost often in young, growing animals and occurredeight times more frequently in these counties than inreference populations in other counties farther north.Since the southernmost part of the country suffers fromproblems related to transboundary air pollution fromother parts of Europe, such as extensive acidificationof soils and fresh waters and contamination with heavymetals, it was speculated that the problems in moosemight be connected with effects of air pollution. It wasfound, however, that the high frequency of bone frac-tures in southern Norway was not associated with traceelement imbalances, but may have resulted from inad-equate nutrition following general overcrowding andhigh pressure on feed resources.
Possible Geomedical Associations in HumanMedicine
At the Geological Survey of Norway geomedicalresearch has been carried out since 1971. This activityhas included multi-element countrywide geochemicalmapping and correlating spatial distributions of geo-chemical and other types of natural data with theepidemiology of endemic human diseases. An exam-ple of this work is a comparison of the composition ofdrinking water from main water works all over Norwaywith the geographical distributions of various typesof cancer and other diseases (Flaten and Bølviken,1991). Interesting regional distributions of elementswere disclosed, and in some cases statistically signif-icant correlations were evident between chemical andcorresponding epidemiological data on a geographicalbasis. A novel method for spatially moving correla-tion was developed (Bølviken et al., 1997a). By theapplication of this method several geomedical asso-ciations were revealed, among them (Bølviken et al.,2003) significant correlations for rates of multiple scle-rosis versus Rn in indoor air (positive) and atmosphericdeposition of marine salts (inverse). By extending theirstudies to literature data from China (Bølviken et al.,1997b) these scientists observed strong associations
for rates of nasopharyngeal carcinoma versus the soilcontents of Th and U (positive) and Mg (inverse).
Geochemical Studies in Norway of PotentialWorldwide Significance to Human Health
Professor J. Låg was probably one of the very firstscientists to realize the possible importance of theoceans as a significant source of elements to soils incoastal areas, and he was the first to demonstrate thisexperimentally. Based on an extensive collection offorest soils from different parts of southern and cen-tral Norway (Låg, 1968), he was able to show thatexchangeable concentrations of Na and Mg in the sur-face soil depended strongly on the distance from theocean and the corresponding chemical compositionof precipitation. The same soil material was stud-ied with respect to the halogens Cl, Br and I (Lågand Steinnes, 1976) and Se (Låg and Steinnes, 1974;1978). A distinct and regular decrease with increas-ing distance from the ocean was also evident for theseelements, and this finding was later confirmed in atransect study of natural surface soils in northernmostNorway (Steinnes and Frontasyeva, 2002) and in a sep-arate study of Norwegian agricultural soils (Wu andLåg, 1988). Interestingly the I/Cl ratio in the soil wasmore than 1,000 times that in ocean water. The mainreason for this is apparently the enrichment of iodineat the ocean surface caused by biogenic emission ofCH3I (Yoshida and Muramatsu, 1995). Consideringthe current distribution of iodine deficiency disordersworldwide (Fordyce, 2005), it is striking that the prob-lem areas are mostly confined to areas located atsignificant distances from the nearest ocean. Possiblythe marine supply of iodine from ocean to land is muchmore important to human health than what has beengenerally assumed so far.
Extension of the trace element studies of the above-mentioned forest soils to selenium, a geographicaldistribution similar to that of iodine was evident indi-cating that the ocean might be a significant source evenfor Se (Låg and Steinnes, 1974; 1978). This seemedvery unlikely, considering the fact that the Se concen-tration in seawater is only around 0.1 μg L−1. Later,however (Cooke and Bruland, 1987), it has been shownthat biogenic emissions of volatile compounds suchas dimethylselenide lead to enhanced Se concentra-tions in the marine atmosphere, which may explain the

Medical Geology in Europe 279
above findings in Norwegian soils. Again this biogeo-chemical cycling could be of geomedical importancein some areas of the world with naturally low seleniumin the bedrock.
Medical Geology in Finland
Geographical variation of occurrence of certain non-communicable diseases has been reported in Finland.Goiter, dental caries, multiple sclerosis, cardiovascu-lar diseases, diabetes and Parkinson’s disease amongothers are examples of those diseases (Adlercreutz,1928; Pärkö, 1990; Sumelahti et al., 2000; Kannisto,1947: Karvonen et al., 2002; Rytkönen et al., 2001;Havulinna et al., 2008). The etiology of diseasesis usually multifactorial resulting from several bio-logic, behavioural, genetic and also environmental riskfactors. For example, certain geological risk factors,which are fairly stable, may have a meaningful rolein the etiology and regional variation of certain non-communicable diseases. Several studies of the asso-ciations of the conceivable risk factors of geologicalenvironment on human health have been carried out inFinland during the past decades.
Iodine and Fluoride
Adlercreutz (1928) was probably among the first whopresented the hypothesis about the geographical asso-ciation of iodine in drinking water with the occurrenceof goiter in Finland (Adlercreutz, 1928). In the 1950sgoiter was common in Finland, especially in easternpart of the country where the intake of iodine was low(Lamberg, 1986). At present, deficiency of iodine iscontrolled by iodization of table salt.
Fluoride is a naturally occurring element that isessential to human health in small doses but is harmfulin excess (Plant et al., 1996). The highest average fluo-rine contents in Finland are found in rapakivi granitesin southeastern and southwestern parts of the coun-try. Fluoride anomalies in groundwater reflect the highfluorine content of bedrock in rapakivi area (Lahermoand Backman, 2000). Pärkö (1990) reported that cariesprevalence was lower in rapakivi area where fluoridecontent in drinking water was higher than in controlarea. Naturally higher fluoride concentrations in drink-ing water have consistently associated lower cariesrates. In contrast, the exposure to natural fluoride in
well water was associated with the increased risk ofhip fracture among women (Kurttio et al., 1999). Theassociation of fluoride in drinking water with coro-nary heart disease (CHD) occurrence has also studiedin Finland. Luoma et al. (1983) reported that fluorideintake was inversely associated with risk of myocardialinfarction (MI) in men. They suggested that fluorideconcentrations at the level of 1 mg L−1 in householdwater were beneficial. Finnish studies also suggestthat the geographical pattern of coronary heart disease(CHD) in Finland is consistent with the concentra-tion of fluoride content in well water (Kousa andNikkarinen, 1997; Kaipio et al., 2004). The authorssuggest that one mechanism could be that fluoride pre-vents dental infections, which in turn reduces mortalityfrom CHD (Kaipio et al., 2004). However, the widelyused toothpaste with fluoride may influence to results.
Arsenic
Arsenic is considered one of the most toxic naturallyoccurring elements. Some evidence for an increasedrisk of bladder cancer associated with arsenic expo-sure from drilled wells 2–9 years before the diagnosishas been reported in Finland (Kurttio et al., 1999).The association between arsenic exposure and kidneycancer risk was not found. Locally high arsenic con-centrations in deep groundwater, soils and bedrockmay pose a risk to public health and the environ-ment in the Pirkanmaa region in southern part of thecountry. About 23 % of the 965 wells exceeded thelimit value of 10 μg L−1 (Backman et al., 2006). Thearsenic content of hair correlated well with the past andchronic arsenic exposure. About 10 μg L−1 increasein the arsenic concentration of the drinking water or10–20 μg day−1 increase in arsenic exposure corre-sponded to a 0.1 mg kg−1 increase in hair arsenic(Kurttio et al., 1998). Muscle cramps, mainly in thelegs, were associated with elevated arsenic exposure indrinking water (Kurttio et al., 1998).
Selenium
Selenium concentration in soil and groundwater isexceptionally low for geochemical reasons in Finland(Koljonen, 1975; Alfthan et al., 1995; Lahermo et al.,1998; Tarvainen et al., 2001). Mortality from cancer(Salonen et al., 1985) and cardiovascular diseases has

280 O. Selinus et al.
been associated with a low serum selenium concentra-tion in Finland (Salonen et al., 1982). Eastern Finlandis a low selenium area (Tarvainen et al., 2001) withhigh copper content in drinking water (Punsar et al.,1975). The data of Finnish study indicate synergisticeffect of high serum copper, low serum selenium con-tent and low-density lipoprotein (LDL) cholesterol inatherogenesis (Salonen et al., 1991). Efficient intake ofselenium is ensured by supplementing sodium selenateto all agricultural fertilizers used in Finland since 1984(Ministry of Agriculture and Forestry, 1984).
Asbestos
Occurrences of asbestos minerals and their environ-mental impact have been studied in eastern Finland(Nikkarinen et al., 2001). Asbestos mineral here isanthophyllite and this was mined from 1918 to 1975.Kokki et al. (2001) found an increased risk of lung can-cer around the former asbestos mine using a methodcalled SMASH (small area statistics on health) devel-oped by the Finnish Cancer Registry and the NationalInstitute for Health and Welfare (THL).
Natural Radiation
The risk of lung cancer due to indoor radon inFinland has been studied. Results of the studiesdid not indicate increased risk of lung cancer fromdomestic radon exposure (Auvinen et al., 1996;Piispanen, 2000). However, collaborative analysisof individual data from 13 case–control studies(including Finnish study) suggested that residentialradon accounts for about 9% of deaths from lungcancer and about 2% of all deaths from cancer inEurope (Darby et al., 2005). The map of the indoorradon in Finland is available in the web site of TheRadiation and Nuclear Safety Authority (STUK)(http://www.stuk.fi/sateilytietoa/sateily_ymparistossa/radon/kartat/fi_FI/radon_koko_suomi_3_2008/). Theassociation between well water radioactivity andrisk of cancers of the urinary organs has also beenstudied in Finland (Kurttio et al., 2006). The authorsconcluded that even though ingested radionuclidesfrom wells drilled in bedrock are a source of radiationexposure, they are not associated with a substan-tially increased risk of bladder or kidney cancers in
concentrations occurring in drilled wells. The mapanimations of the spatial and temporal variations ofthe incidence of a number of common cancer formsin Finland (Pukkala and Patama, 2008) and in theNordic countries (Pukkala et al., 2007) are avail-able from the web page of Finnish Cancer Registry(www.cancerregistry.fi).
Calcium, Magnesium and Water Hardness
The geographical variation of the occurrence of coro-nary heart disease (CHD) is well known over 60 yearsin Finland (Kannisto, 1947; Karvonen et al., 2002) andit has been studied also from the perspective of medi-cal geology in Finland (Fig. 8). Punsar and Karvonen(1979) studied mortality from CHD and water qualityin two rural areas in western and eastern Finland. Theysuggest that CHD may be associated with low concen-trations of magnesium and chromium in the drinkingwater, but definite relationship between water qualityand sudden death was not found. Kaipio et al. (2004)found that in rural Finland CHD mortality declinedwith increasing magnesium concentration in drink-ing water, but slightly increased with calcium content.Piispanen (1993) found that in the western part ofFinland with the low cardiovascular disease (CVD)mortality, the hardness and magnesium concentrationin well water were markedly higher than in the easternpart of the country.
During the last 10 years, the Geological Survey ofFinland (GTK) and the National Institute for Healthand Welfare (THL) (former National Public HealthInstitute KTL) have carried out studies of the spatialvariation of the incidences of acute myocardial infarc-tion (AMI) and childhood type 1 diabetes (T1DM)in relation to the geochemistry of local groundwaterin rural Finland. Results of recent studies suggestedthat water hardness, especially regionally high concen-tration of magnesium was associated with decreasedAMI incidence in Finland (Kousa et al., 2004a, b,2008) (Table 1). The high concentration of calciumin relation to magnesium concentration was associatedwith increased incidence of AMI (Kousa et al., 2006)(Fig. 9, Table 1). The geological circumstances havea great impact in well water quality in rural areas.The magnesium concentration in water, especially inFinland, is lower than in most other countries due to

Medical Geology in Europe 281
Fig. 8 The incidence of acutemyocardial infarction in menaged 35–74 years in ruralFinland (Source: THL. GTK)
Table 1 The estimated regression coefficients of Mg, Ca andCa/Mg ratio on the incidence of the first acute myocardialinfarction among Finnish men in 1983, 1988 and 1993 (pooleddata)
Element Posterior mean (%) 95% HDRa
Mg mg/lb − 4.9 − 8.8, − 0.9Ca mg/lb 0.9 − 0.1, 2.1Ca/Mgc 3.1 0.5, 5.7a Highest density regionsb Full spatial modelc A separate spatial model
geological circumstances (Lahermo et al., 1990).Although Finnish groundwater is in general soft, allstudies including those with a different study designconducted in Finland have suggested the associationof soft ground (drinking) water, low in Mg, with anincreased risk of CHD.
Moltchanova et al. (2004) studied the associationbetween spatial variation of type 1 diabetes and itsputative environmental risk factors such as zinc andnitrates. Results of the ecological study did not show

282 O. Selinus et al.
Fig. 9 Ca/Mg ratio in localgroundwater in rural Finland
clear spatial association between zinc or nitrates andthe incidence of childhood type 1 diabetes at thepopulation level in Finland (Moltchanova et al., 2004).The geographical association between type 2 diabetesin young adults and magnesium, calcium and waterhardness is the topic of ongoing collaboration study ofGTK and THL.
Bayesian spatial statistics and GeographicalInformation Systems (GIS) were applied to estimate
the regional patterns of the incidence of AMI anddiabetes and geochemical elements in groundwater. Aspecial feature of these studies is that 10 × 10 km gridcells were used when defining the study areas insteadof administrative areas. The geographical associationbetween the incidence of AMI and diabetes withgeochemical elements of groundwater was for the firsttime studied using flexible geographical scale withoutadministrative boundaries at a whole country level

Medical Geology in Europe 283
(excluding Lapland and Åland). In Finland, every resi-dent has a unique personal identification number (ID).ID numbers assigned at birth enabled the location ofindividuals according to map coordinates of the placeof residence at the time of diagnosis. Developmentof GIS enables a researcher to link data from severaldatabases.
Ecological and Health Risk Assessment –Multidisciplinary Network
Environmental risk assessment methods are increas-ingly applied to investigate small- and large-scale envi-ronmental problems and their impact on human health.GTK, the Finnish Environment Institute (SYKE), THL(former KTL) and the University of Eastern Finland(former the University of Kuopio) have founded theEnvironmental Risk Assessment Centre (ERAC) toconduct scientific research and to develop new projects(http://www.eracnet.fi). The ERAC is based on mul-tidisciplinary networking and co-operation, rangingfrom geochemistry, geology, biogeochemistry andecology to environmental sciences, toxicology, epi-demiology, risk analysis and the political sciences.One objective of ERAC, in co-ordination with TheFinnish Cancer Registry, is to investigate relationshipsbetween cancer incidence and metal concentrations insoil. Another multidisciplinary project, FINMERAC(Integrated Risk Assessment of Metals in Finland),aims to improve methodology of health risk assess-ment for metals. The general model of metal risksdeveloped by FINMERAC is described in Fig. 10.Two metal industry areas and one mining target areaare selected examples of environmental pollution, thusproviding different challenges for risk assessment andmanagement (Nikkarinen et al., 2008).
ERAC network offers also environmental riskassessment education (ERAC edu). Environmentalrisk assessment education is implemented viaresearch network (GTK, THL and the Universityof Eastern Finland) and with help of bothnational and international experts. Primary tar-get group is researchers, experts, municipalofficials, industrial experts and postgraduate stu-dents located in eastern Finland. Applicableenvironmental risk assessment postgraduate andsupplementary education is offered to target groups(http://risk.eracnet.fi/edu/index.php/ERAC_Edu).
Geology and Health: The French Case
Due to a diversified geology and a long history, theFrench case is probably emblematic for a view of geol-ogy and health issues in western Europe. The presentcontribution is based on a recent survey published bythe French geological survey (BRGM) in the springissue of the biannual journal Geosciences, dominantlypublished in French with extended abstracts and fig-ure captions in English. This allows us to considerthe case seen through geological and hydrogeologicalapproaches, but also considering anthropogenic effects(pollution) affecting bedrock, soil and groundwater, aswell as beneficial aspects of geology and mineralogyon human health.
Located in the western part of Europe, Francerepresents in itself a good part of geology andhealth questions as the geology is quite diversified,with anciently eroded metamorphic basement, well-developed Mesozoic sedimentary basins, alpine oro-genic zones as well as quaternary volcanic districts.If Corsica and overseas areas and territories are alsoconsidered, this diversity is increased with active vol-canoes (in French West Indies and Reunion Islands)and vast tropical forest areas of French Guyana. Inaddition to natural effects on health from geology,one should also consider the case of pollution inducedby former human activities, which have modified thesoil composition and induced other types of healtheffects. Groundwater is also worth examination initself, as it displays all categories from health caringthermal springs to toxic waters of either natural oranthropogenic origin.
In a recent issue of Geosciences (N◦5, March 2007),a wide coverage of the subject was presented in a 110pages edition covering geology and health issue in gen-eral with a focus on French cases. This presentation isan updated summary of this issue and offers to Englishreaders a renewed and coherent entry in the subject ofa west-European perspective for medical geology.
Hard Rock Geology and Related Health Issues
The oldest geological formations of Proterozoic andPalaeozoic ages are generally the richest in health-bearing minerals and metals. A quick look at thenumerous maps of the Geochemical Atlas of Europe(GTK – FOREGs, 2005 and 2006) show how most

284 O. Selinus et al.
Fig. 10 The general model ofmetal risks (Nikkarinen et al.,2008)
metals possibly toxic for health (Al, As, Cd, Sn, Sb,Hg, Ti, Pb and U) are exposed at relatively high con-centrations in the French basement areas of Britain andMassif Central (Fig. 11).
More specifically, health effects from geologicalsources can be expected or even documented in thefollowing regions:
– lead in the SE border of Massif Central (Cevennesmetallogenic province);
– arsenic in eastern Massif Central and southernBrittany;
– uranium in a few natural or formerly exploited sitesin Brittany and Massif Central.
Besides these metals, radon and asbestos need spe-cific considerations:
– Radon is emitted from granitic environments (morespecifically leuco-granites), and areas where radonrisk is identified by French health authorities
(Research Institute for Radioactive Safety (Perrin,2007) correspond with the granitic basementregions (Figs.12, 13 and 14).
– Asbestos occurs naturally in metamorphic environ-ments which are found in Britanny, Massif Central,the Alps and in Corsica (Fig. 15). Theses sites arestudied by the French Institute of Sanitary Survey(Billon-Galland et al., 2007).
The sedimentary basins do not generally generateany health risks for the population, except for thePermo–Triassic early cover where uranium- as well asfluorine- and lithium (southern rim of Paris basin)-richdeposits may occur.
The volcanic districts of Massif Central do not dis-play geochemical anomalies of concern for health. Ofcourse, this is not the case for active volcanic districtsin the overseas islands of Réunion and Guadeloupe.The Piton de Fournaise is frequently emitting basalticflows, and when winds blow, sulphurous gases reach

Medical Geology in Europe 285
Fig. 11 a–e maps showingthe high values in As, Pb, Ta,U and Zr found in Frenchbasement regions from thegeochemical survey of Europe(FOREGS, Salminen et al.,2004, 2005). These maps ofEurope in black and white canbe seen in colour at thefollowing website:http://www.gsf.fi/publ/foregsatlas/map_compare.html
neighbouring villages, as observed during the sum-mer 2006 eruption. The less accessible Soufriereof Guadeloupe also emits chlorine gases, imposingrestriction of access for visitors due to health risks: forsafety reasons the top of the volcano is not accessibleto tourists.
Polluted Soils and Health Effects from FormerHuman Activities
France, as in most west-European industrial areas, isrich in former industrial sites. On such sites whereindustrial processes concerning heavy metals or toxic
components have been used for tens or hundreds ofyears, including historical periods for which the healthand safety regulations were not as strict as now, onecan expect effects of these activities on the under-lying and surrounding natural environment. This isthe reason why a detailed and exhaustive inventoryof the former industrial sites has been undertakenat France national on regional and local levels. Thisallowed producing a database now accessible to thepublic and very regularly used for planning purposes,Fig. 15.
Polluted areas need to be known and eventually sur-veyed, as pollutants in soils and waters are clearlysubject to alteration through a variety of mechanisms,

286 O. Selinus et al.
Fig. 11 (continued)
among them transport by water, sorption, degrada-tion and redox reactions. Using mathematical modelsaccounting for all these mechanisms is a complexundertaking. First, the biogeochemical conditions atthe site must be determined so as to ascertain whetherbiodegradation can occur. For example, chlorinatedsolvents need reducing conditions, whereas hydro-carbon and PAHs require oxygen and nitrates. Onceidentified, the source of pollution must be removed andthe plume must be monitored in order to determine theplume movement and to calculate the mass balance.More or less complex predictive models are then used
to estimate the future extension of the plume (Atteiaand Saada, 2007).
Another issue is the storage of industrial and domes-tic wastes. In France as in many other Europeancountries, storage remains one of the main methodsfor waste management. An in-depth study was carriedout in 2002 under the guidance of concerned publicagencies, aimed at assessing the impact of munici-pal solid waste disposal sites on health. A quantitativehealth risk assessment method was developed andapplied, showing that – from existing data – the presentsituation was not alarming, but that conditions of

Medical Geology in Europe 287
Fig. 11 (continued)
monitoring must be improved due to information gaps,especially concerning leachates (Dor and Guyonnet,2007).
The Case of Groundwater
The case of groundwater is the most important in termsof health effects, as water is a large part of humanneeds, either for drinking or as preserving or cookingagent. Therefore, norms of quality have been definedby health authorities in France and in the EuropeanUnion. These norms concern the following elements:
Al, As, B, Ba, Cd, Cr, Cu, F, Fe, Hg, Mn, Ni, Pb, Sb,Se and NH4+.
As shown by Blum et al. (2007), some toxic orundesirable elements for human health may occur innatural groundwater in France with values exceed-ing the standards for quality set by French as wellas European regulations. This applies in particularfor arsenic, antimony, selenium, nickel and fluorine.Therefore, a research programme is developed in orderto identify natural high concentrations of these ele-ments and to understand the phenomena implyingthe dissolution of these elements in groundwater. Theobjective of these studies is to develop management

288 O. Selinus et al.
Fig. 11 (continued)
tools for concerned agencies to comply with theEuropean water framework directive, which defines the“proper chemical state” of groundwater, and with theNational Health Environment Plan, in particular forlocating new catchments for producing drinking water.
In particular, BRGM coordinated the EuropeanBRIDGE project (2005–2006), which allowed elab-orating the criteria necessary to define the goodchemical state of groundwater. At national level, thezones at risk from background geochemistry highin trace elements in ground and surface water were
precisely mapped in the Rhone-Mediterranean andCorsica regions.
Of course, natural geochemistry is not the onlyharmful subject in terms of health effects of ground-water. Due to intensive human impact, whether dueto industry, agriculture or even transport, pollutedgroundwater is certainly the most worrying for sanitarypolicies. The question of lead (Glorennec et al., 2007)can be considered as presently mastered due to theintroduction of unleaded fuels in Europe (Fig. 16), butthe mercury issue is not yet solved in French Guyana,

Medical Geology in Europe 289
Fig. 11 (continued)
due to gold illegal extraction (so-called orpaillage),with health effects on Indian tribes consuming carni-vore fishes. But in continental France, it is certainly theeffects of intensive agriculture on groundwater whichis the most harmful. The case of nitrates is particularlysevere as the tendencies for nitrate contents in ground-water are not yet oriented towards a decay but mostlystill increasing in the most concerned areas such asBrittany (pork feeding) and Beauce plain south of Paris(agriculture).
In such conditions, the protection of groundwater ingeneral, and the protection of capture areas in particu-lar (Figs. 17, 18) is a critical issue for hydrogeology.
Various Uses of Geological ProductsBeneficial to Human Health
When considering the case of geology and health issue,one has the tendency to only focus on the effects deteri-orating the health, neglecting all the positive effects ofgeology on human health. Certainly the most positiveand unevidenced effect of geology on human health isthe role of geology in mountain building. The health-iest conditions are frequently found in altitude, andliving in mountain regions, or benefiting from moun-tains for holidays is certainly one of the most beneficialeffects of geology on health. Similarly, the natural

290 O. Selinus et al.
Fig. 12 Natural geological structures and processes of exposure to radon gas emissions
Fig. 13 Average concentration of radon in the air of housing in French departments (IRSN, 2008)

Medical Geology in Europe 291
Fig. 14 Location of formerasbestos mines in France(BRGM, 2005)
filter offered by soils and porous rocks in the percola-tion of surface polluted waters in the aquifers is alsoa very important contribution of geology to health.Considering the large proportion of groundwater inthe drinking water production in France, and the verypositive effect of groundwater sources on prices of dis-tributed waters, this is also certainly another major –although underestimated by the economy – contribu-tion of geology to human health.
Besides these general cases, there are more specif-ically identified contributions of geology to health.These are the thermal springs and waters, used in ther-mal stations recognized as such by health and sanitaryauthorities (and refunded as such by the French pub-lic social security system), or simply consumed ascommercially labelled mineral waters. As shown byRoques (2007) there are nearly 100 thermal stationsin metropolitan France (Fig. 19), with documented
effects on rheumatism, respiratory diseases, dermatol-ogy, neurology, stomach or urinal diseases, gynaecol-ogy and development troubles, etc. More than 100,000jobs are offered for these health cares.
Health and geology would not be complete with-out a word on the direct role of solid minerals onhealth, which are used in pharmacy. As shown bydes Ylouses, many mineral elements enter medicalproducts, whether as active principles or recipients.This is the case for alkaline elements such as lithium(maniacal depressions), sodium (physiologic serum)and potassium (cardiovascular), but also earth-alkalineas magnesium (nervous system), calcium (bonesand teeths) or barium (radiology), transition ele-ments as titanium (UV filter), chromium (metabolismof glucoses), manganese (antiseptic solutions), iron(blood), cobalt (vitamin B2), copper (antiseptic, cellu-lar defence), zinc (enzymes metabolism) and elements

292 O. Selinus et al.
Fig. 15 The database for potentially polluted soils developed by BRGM allows all interested parties to have a free access to allpotentially polluted sites in France, as the inventory is almost completed (http://basias.brgm.fr/)
such as boron (buffering agent), aluminium and carbon(gastro-intestinal protection), silicon (dental creams),sulphur (protein structures, bones, articulations, etc.),fluor (bones and teeths), chloride (blood equilibrium),iodine (thyroid metabolism, antiseptic). The need forvery pure elements and minerals used for medicaland pharmaceutical applications is a challenge forgeologists and mineralogists.
European Databases
In the 1970s and 1980s regional or national geochem-ical mapping projects were carried out in many coun-tries. However, due to lack of standards the results werenot satisfactory, thus standardization for geochemicalmapping was particularly needed. The InternationalGeochemical Mapping Project was accepted as partof the International Geological Correlation Program(IGCP259) in 1988. Plans for a Global Geochemical
Mapping Project using wide-spaced sampling was thenaccepted as the IGCP360 project entitled “GlobalGeochemical Baselines” in 1995. The major resultingaspects of the project were to determine the natu-ral global distribution of various chemical elementsand compounds and the present state of pollutionin the surface environment, delineate areas and geo-chemical provinces especially enriched in elementsof economical importance and provide data on theregional distribution of compounds that are linkedto human and animal health. As one further stepthe “Geochemical Atlas of Europe” was carried outby the Geological Surveys of the European Union(EuroGeoSurveys).
The European survey covered 26 countries andprovided information in different sample media ofthe near-surface environment (topsoil, subsoil, humus,stream sediment, stream water and floodplain sed-iment). This was the first multi-national project,performed with a harmonized sampling, samplepreparation and analytical methodology, producing

Medical Geology in Europe 293
Fig. 16 Evolution of lead in the air in metropolitan France, 1990–2005. Observe the decrease of the road transport source (Source:OTEPA 2006)
high-quality compatible data sets across national bor-ders. Over 60 determinants were determined, 400maps plotted and interpreted, most for total and aquaregia extractable concentrations. The first phase of theproject was completed, and the results published ina two-volume set, which is also freely available forviewing and downloading. Also the whole databasecan be downloaded free of charge (Salminen et al.,2005).
Another example of database is the Baltic soil sur-vey covering total concentrations of major and selectedtrace elements in arable soils from 10 countries aroundthe Baltic Sea. Agricultural soils were collected from10 European countries over a 1,800,000 km2 area sur-rounding the Baltic Sea. Large differences between
element concentrations and variations can be observedfor most elements when the different countries arecompared. The database can be downloaded for free(Reimann et al., 2003).
In addition, the big Kola Ecogeochemistry Projectshould be mentioned. This is an EnvironmentalInvestigation in Arctic Europe. The KolaEcogeochemistry Project is concerned with regionalmapping of heavy metals and radioactivity pollutionof terrestrial and aquatic ecosystems of an area of188,000 km2 in the Barents Region, sulphur and traceelement deposition, the impact of major industrialactivity in the western Kola Peninsula, and the degra-dation of a particularly vulnerable arctic environment(Reimann et al., 1998).

294 O. Selinus et al.
Fig. 17 Block diagram showing the major issues of groundwater protection (BRGM, 2008)
Fig. 18 Status of measurestaken for protection of thequality of water sourcesprotection by departments inFrance (Source: FrenchMinistry of health)

Medical Geology in Europe 295
Fig. 19 Map of thermal stations in metropolitan France (BRGM, 2008)
Publications and Outreach in Europe
Information and news on medical geology has beenpublished in many journals and books.
Some few selected examples from Europe can bementioned.
On of the first important books in the subject waspublished in Norway in 1990 “Geomedicine” editedby J. Låg (1990). This book covers many aspects ofgeology and health.
A book on Medical Geology has been publishedby Elsevier (Academic Press) in 2005. O. Selinus ischief editor and there are six associate editors (fourfrom Europe): Brian Alloway, Jose Centeno, BobFinkelman, Ron Fuge, Ulf Lindh and Pauline Smedley(Selinus et al., 2005). There are almost 60 distin-guished authors from all around the world. About 50%are geoscientists and about 50% are medics, veterinar-ians and other public health scientists. In November2005 Essentials of Medical Geology was recognized

296 O. Selinus et al.
as a “Highly Commended” title in the Public Healthcategory by the British Medical Association, a veryprestigious acknowledgement. The book was also citedas one of the best published books in Public Health in2005. They bestow awards upon publications “whichare deemed to best fulfil the criteria of clinical accuracyand currency and which maintain a high standard ofdesign and production”. Essentials of Medical Geologyalso won a second prestigious reward in January 2006.The book has now thus been recognized in both com-munities for which it was intended.
Environmental Medicine, a book published in2000 at the Karolinska Institute, Sweden, included achapter on medical geology. This book is used forcourses for medical students at the Karolinska Instituteand elsewhere. The BGS magazine, Earthwise, haspublished a thematic issue on Geology and Health(Earthwise, 2001). A book, “Geology to Health”,edited by A.R. Berger and C. Skinner published byOxford University Press, covered all the presenta-tions given at the meeting in Uppsala, Sweden in2000 (Skinner and Berger, 2000). A special vol-ume of the Journal of BRGM (Geological Survey ofFrance) on Medical Geology was published in 2007(Geosciences et Sante, 2007). Two special issues inJournal of Environmental Geochemistry and Healthon medical geology in developing countries have beenpublished (Medical Geology in Developing Countries2007, 2008). These include several European authors.
The Future of Medical Geologyin Europe
The International Medical Geology Association(IMGA) was launched in January 2006 with at presentone European chair and two European councillors(UK and Turkey). The association is the umbrellafor regional divisions around the world. Amongthe divisions are those for Europe, Russia and NISand southern Mediterranean. It is always risky toanticipate what the future holds. Nevertheless, we areconfident that the future for medical geology still lookspromising, notwithstanding the already rapid growthof the sub-discipline. The book, Essentials of MedicalGeology, has received an overwhelmingly positiveresponse. The reviews have been uniformly positiveand the first printing has nearly sold out in less than
a year. We anticipate that the book will stimulate theteaching of medical geology in colleges and universi-ties. The International Medical Geology Associationshould provide a stable platform for the exchange ofideas and dissemination of information. The raft ofother medical geology activities enumerated aboveshould maintain enthusiasm and momentum for thenext few years. After that the medical geologist willhave to demonstrate that what we have to offer willindeed benefit society by helping to improve thequality of life for people around the world.
References
Alfthan G, Wang D, Aro A, Soveri J (1995) The geochemistry ofselenium in groundwaters in Finland. The Sci Total Environ162:93–103.
Adlercreutz E (1928) Orientierende Untersuchung über dieVerbreitung des Kropfes in Finnland und über derenZusammenhang mit dem Jodvorkommen im Wasser. ActaMed Scand 69:1–45.
Amaral AFS, Arruda M, Cabral S, Rodrigues AS, (2008)Essential and non-essential trace metals in scalp hair of menchronically exposed to volcanogenic metals in the Azores,Portugal. Environ Internat 34:1104–1108.
Amaral AFS, Rodrigues AS (2007) Chronic exposure to vol-canic environments and chronic bronchitis incidence in theAzores, Portugal. Environmen Res 103:419–423.
Amaral A, Rodrigues V, Oliveira J, Pinto C, Carneiro V,Sanbento R, Cunha R, Rodrigues A (2006) Chronic exposureto volcanic environments and cancer incidence in the Azores,Portugal. Sci Total Environ 367:123–128.
AMBIO (2007) Special issue on medical geology. 36(1).Appleton JD, Rawlins B, Thornton I (2008) National-scale
estimation of potentially harmful element ambient back-ground concentrations in topsoil using parent material clas-sified soil:stream-sediment relationships. Appl Geochem 23:2596–2611.
Atteia O, Saada A, (2007) Etude des risques sur les sites pollués:le rôle des processus naturels. Géosciences 5:52 à 57.
Auvinen A, Mäkeläinen I, Hakama M, Castrén O, Pukkala E,Reisbacka H et al. (1996) Indoor radon exposure and risk oflung cancer: a nested case-control study in Finland. J NatlCancer Inst 88:966–972.
Backman B, Luoma S, Ruskeeniemi T, Karttunen V, TalikkaM, Kaija J (2006) Natural Occurrence of Arsenic in thePirkanmaa region in Finland. Espoo: Geological Survey ofFinland, Miscellaneous Publications. Geological Survey ofFinland
Baxter PJ, Baubron JC (1999) Health hazards and disaster poten-tial of ground gas emissions at Furnas Volcano, São Miguel,the Azores. J Volcanol Geotherm Res 92(1–2):219.
Baxter PJ, Baubron JC, Coutinho R (1999) Health hazards anddisaster potential of ground gas emissions at Furnas vol-cano, São Miguel, Azores. J Volcanol Geotherm Res 92:95–106.

Medical Geology in Europe 297
Blum L, Chery L, Legrand H (2007) L’eau souterraineest-elle toujours potable à l’état naturel? Géosciences5:58 à 67.
Billon-Galland MA, Daniau C, Martinon L, Pascal M, (2007)L’amiante dans l’environnement en France: de l’expositionau risque. Géosciences 5:30 à 39.
Bølviken B, Nilsen R, Ukkelberg Å (1997a) A new methodfor spatially moving correlation analysis in geomedicine.Environ Geochem Health 19:143–153.
Bølviken B, Flaten TP, Zheng C, (1997b) Relations betweennasopharyngeal carcinoma and magnesium and other alka-line earth elements in soils in China. Med Hypotheses48:21–25.
Bølviken B, Celius EG, Nilsen R, Strand T (2003) Radon: Apossible risk factor in multiple sclerosis. Neuroepidemiology22:87–94.
Bowman C, Bobrowski PT, Selinus O (2003) Medical Geology:New relevance in the Earth Sciences. Episodes 26(4):270–278.
Carvalho FP, Madruga MJ, Reis MC, Alves JG, Oliveira JM,Gouveia J, Silva L, (2005a) Radioactive survey in formeruranium mining areas in Portugal. In International Workshopon Environmental Contamination from Uranium ProductionFacilities and Remediation Measures, 11e13 February 2004,Lisbon. International Atomic Energy Agency, Vienna, pp.29–40.
Carvalho T, Vala H, Pinto C, Pinho M, Peleteiro MC(2005b) Immunohistochemical Studies of Epithelial CellProliferation and p53 Mutation in Bovine Ocular SquamousCell Carcinoma. Vet Pathol 42:66–73.
Carvalho T, Pinto C, Peleteiro MC (2006) Urinary bladderlesions in bovine enzootic haematuria. J Comp Pathol134:336–346T. doi:10.1016/j.jcpa.2006.01.001
Carvalho FP, Oliveira JM (2007). Alpha emitters from uraniummining in the environment. J Radioanal Nucl Chem 274:167–174.
Carvalho FP, Oliveira JM, Lopes I, Batista A, (2007)Radionuclides from past uranium mining in rivers ofPortugal. J Environ Radioact 98:298–314.
Cave M, Taylor H, Wragg J (2007) Estimation of the bioaccessi-ble arsenic fraction in soils using near infrared spectroscopy.J Environ Sci Health, Part A 42:1293–1301.
Cave MR, Wragg J, Palumbo B, Klinck, BA (2003)Measurement of the Bioaccessibility of Arsenic in UK soils.Environment Agency P5-062/TRI.
Centeno JA, Mullick FG, Martinez L, Gibb H, Longfellow D,Thompson C (2002) Chronic arsenic toxicity: An introduc-tion and overview. Histopathology 41(2):324–326.
Centeno JA, Tseng CH, van der Voet GB, Finkelman RB (2007)Global Impacts of Geogenic Arsenic – A Medical GeologyResearch Case. Ambio 36(1):78–81.
Cooke, TD, Bruland KW (1987) Aquatic chemistry of sele-nium: Evidence of biomethylation. Environ Sci Technol 21:1214–1219.
Darby S, Hill D, Auvinen A, Barros-Dios JM, Baysson H,Bochicchio F, Deo H, Falk R, Forastiere F, Hakama M,Heid I, Kreienbrock L, Kreutzer M, Lagarde F, MäkeläinenI, Muirhead C, Obereigner W, Pershagen G, Ruano-RavinaA, Ruosteenoja E, Schaffrath-Rosario A, Tirmarche M,Tomasek L, Whitley E, Wichmann H-E, Doll R (2005)Radon in homes and lung cancer risk: Collaborative
analysis of individual data from 13 European case-controlstudies. Br Med J 330:223–226.
Department for the Environment Food and Rural Affairsand the Environment Agency (2002) Assessment ofrisks to human health from land contamination: Anoverview of the soil guideline values and related research,CLR7.
Derbyshire E (2005) Natural aerosolic mineral dusts and humanhealth: Potential effects. In O Selinus, B Alloway, JACenteno, RB Finkelman, R Fuge, U Lindh, P Smedley(eds) Essentials of Medical Geology (820 p). Elsevier:Amsterdam.
De Vos, W, Tarvainen, T, (Chief eds) (2006) GeochemicalAtlas of Europe. Part 2: Interpretation of Geochemical maps,additional tables, figures, maps and related publications.690 p.
Dogan AU, Doga M, Hoskins JA (2008) Erionite series miner-als: Mineralogical and carcinogenic properties. En GeochemHealth 30(4):367–381.
Dor F, Guyonnet D (2007) L’évaluation des risques sanitaires:Application au stockage des déchets ménagers. Géosciences5:100 à 105.
Earthwise (2001) Geology and health. British GeologicalSurvey. Issue 17.
Medical Geology in Developing Countries (2007) Two specialissues of Environmental Geochemistry and HealthVol 29, No2 and Vol 30 No 4 2008.
Ender F (1946) The significance of cobalt deficiency as a causeof disease in cattle and sheep elucidated by therapeutic exper-iments. Norsk Vet Tidskr 58:313 (In Norwegian, Englishsummary).
Faísca MC, Teixeira MMGR, Bettencourt AO, (1992) Indoorradon concentrations in Portugal – a national survey.Radiation Protection Dosimetry 45:465–467.
Falcão JM, Carvalho FP, Leite MM, Alarcão M, CordeiroE, Ribeiro J (2005). MINURAR project d’uranium minesand their residues: Health effects in a Portuguese popula-tion. Scientific Report I (in Portuguese), Report Publishedby INSA, INETI, ITN. Available from: <www.itn.pt>.and<www.insa.pt>.
Fátima Reis M, Segurado S, Brantes A, Simões HT, MelimJM, GeraldesV Miguel JP (2008) Ethics issues expe-rienced in HBM within Portuguese health surveillanceand research projects. Environmen Health 7(Suppl 1):S5doi:10.1186/1476-069X-7-S1-S5.
Feder GL, Radovanovic Z, Finkelman RB (1991) Relationshipbetween weathered coal deposits and the etiology of Balkanendemic nephropathy. Kidney International 40(Suppl. 34):s-9–s-11.
Figueira R, Sérgio C, Leal Lopes J, Sousa AJ (2007) Detectionof exposition risk to arsenic in Portugal assessed by air depo-sition in biomonitors and water contamination. Int J HygEnviron-Health 210:393–397.
Flaten TP, Bølviken T, (1991) Geographical associationsbetween drinking water chemistry and morbidity of can-cer and some other diseases in Norway. Sci Total Environ102:75–100.
Fordyce F (2005) Selenium deficiency and toxicity in theenvironment. In O Selinus, B Alloway, JA Centeno, RBFinkelman, R Fuge, U Lindh, P Smedley (eds) Essentialsof Medical Geology–Impacts of the Natural Environment

298 O. Selinus et al.
on Public Health (pp. 373–415). Elsevier – Academic Press,London.
Frank A, Galgan V, Petersson L (1994) Secondary copper defi-ciency, chromium deficiency and trace element imbalance inthe moose (Alces alces L.): Effect of anthropogenic activity.Ambio 23(4–5).
Frøslie A (1977) Copper status in sheep in Norway. Norsk VetTidskr 89:71–79 (In Norwegian, English summary).
Frøslie A (1990) Problems on deficiency and excess of mineralsin animal nutrition. In Låg J(ed) Geomedicine (pp. 37–59).Boca Raton: CRC Press.
Frøslie A, Norheim G (1977) Concentrations of molybdenumand zinc in liver in relation to copper accumulation in normaland copper poisoned sheep. Acta Vet Scand 17:307–315.
Frøslie A, Karlsen JT, Rygge J (1980) Selenium in animalnutrition in Norway. Acta Agric Scand 30:17–25.
Frøslie A, Norheim G, Søli NE (1983) Levels of copper, molyb-denum, zinc and sulphur in concentrates and mineral feedingstuffs in relation to chronic copper poisoning in sheep inNorway. Acta Agric Scand 33:261–267.
Geosciences et sante (2007). Special issue of Geosciences No 5,March 2007. BRGM. 118 pp.
Glorennec P, Guyonnet D, Laperche V (2007) Plomb et santé.Géosciences n5:40 à 45.
Gomes CSF, Silva JBP (2006) Minerals and Human Health:Benefits and Risks/ Os Minerais e a Saúde Humana:Benefícios e Riscos/ (published a bilingual Portuguese andEnglish). In C Gomes, J Silva (eds) Litografia da Maia. Maia.300 p.
Gomes CSF Silva JBP (2007) Minerals and clay minerals inmedical geology. Appl Clay Sci 36:4–21.
Gomes CSF Silva JBP (2006) Published a bilingual (Portugueseand English) book entitled “Os Minerais e a Saúde Humana:Benefícios e Riscos/Minerals and Human Health: Benefitsand Risks that presents a fair balance of both positive andnegative effects of minerals on human health. Gomes CSFSilva JBP (eds) 316 p.
Govasmark E, Steen A, Bakken AK, Strøm T, Hansen S,Bernhoft A (2005) Copper, molybdenum and cobalt inherbage and ruminants from organic farms in Norway. ActaAgr Scand Section A:21–30.
Haglund B, Ryckenberg K, Selinus O, Dahlqvist G (1996)Evidence of a relationship between childhood-onset type 1diabetes and low groundwater concentration of Zinc. DiabCare 19(8) August 1996.
Havulinna AS, Tienari PJ, Marttila RJ, Martikainen KK,Eriksson JG, Taskinen O, Moltchanova E, Karvonen M(2008) Geographical variation of medicated parkinson-ism in Finland during 1995 to 2000. Mov Disord 23(7):1024–1031.
Hillborg PO (1978) Gauchers disease in Sweden and itshypothetical dependance on metal anomalies in the soil.Geomedical Aspects in Present and Future Research.Symposium at the Norwegian Academy of Science andLetters, pp. 173–181.
Inácio M, Pereira V, Pinto M, (2008) The soil geochemical atlasof Portugal: Overview and applications. J Geochem Explor98:22–33.
Johnson CC, Breward N, Ander EL, Allt L (2005) G-BASE: Baseline geochemical mapping of Great Britain andNorthern Ireland. Geochem ExplorEnviron Anal 5:1–13.
Kaipio J, Näyhä S, Valtonen V (2004) Fluoride in the drinkingwater and the geographical variation of coronary heart dis-ease in Finland. Eur J Cardiovasc Prev Rehabil 11(1):56–62.
Kannisto V (1947) The causes of death as demographical fac-tors in Finland. [In Finnish, English summary]. Helsinki.Kansantaloudellisia tutkimuksia-Economic studies XV.
Karvonen M, Moltchanova E, Viik-Kajander M, MoltchanovV, Rytkönen M, Kousa A, Tuomilehto J (2002) Regionalinequality in the risk of acute myocardial infarction inFinland: A Case Study of 35- to 74-Year-Old Men. HeartDrug 2:51–60.
Kasan-Allen L (2006) Asbestos – The Human cost of corporategreed. GUE/NGL European United Left/Nordic green Left.European Parliamentary Group, Brussels: 43p.
Kavanagh P, Farago M, Thornton I, Elliott P, Goessler W IrgolicKJ (1997) Urinary arsenic concentrations in a high arsenicarea of south west England. Occup Environ Med 54:840.
Kawahara S (1971) Odontological observations of Mt. Aso-volcano disease. Fluoride 4:172–175.
Kokki E, Ranta J, Penttinen A, Pukkala E, Pekkanen J (2001)Small area estimation of incidence of cancer around a knownsource of exposure with fine resolution data. Occup EnvironMed 58(5):315–320.
Koljonen T (1975) The behavior of selenium in Finnish soils.Annales Agriculturae Fenniae 14: 240–247.
Kousa A, Nikkarinen M (1997) Geochemical environment inareas of low and high coronary heart disease mortality.Geological Survey of Finland. Special Paper 23:137–148.
Kousa A, Moltchanova E, Viik-Kajander M, RytkönenM, Tuomilehto J, Tarvainen T, Karvonen M (2004a)Geochemistry of ground water and the incidence of acutemyocardial infarction in Finland. J Epidemiol CommunityHealth 58(2):136–139.
Kousa A, Moltchanova E, Taskinen O, Nikkarinen M,Tuomilehto J, Karvonen M, (2004b) Geographical variationof Acute Myocardial Infarction (AMI) and geochemistry oflocal groundwater: Application of medical geology. GFF, Vol126, part 1.
Kousa A, Havulinna AS, Moltchanova E, TaskinenO, Nikkarinen M, Eriksson J, Karvonen M (2006)Calcium:magnesium ratio in local groundwater andincidence of acute myocardial infarction among males inrural Finland. Environ Health Perspect 114(5):730–734.
Kousa A, Havulinna AS, Moltchanova E, Taskinen O,Nikkarinen M, Salomaa V, Karvonen M (2008) Magnesiumin well water and the spatial variation of AMI incidence inrural Finland. Appl Geochem 23:632–640.
Kurttio P, Komulainen H, Hakala E, Kahelin H, Pekkanen J(1998) Urinary excretion of arsenic species after exposureto arsenic present in drinking water. Arch Environ ContamToxicol 34(3):297–305.
Kurttio P, Pukkala E, Kahelin H, Auvinen A, Pekkanen J(1999) Arsenic concentrations in well water and risk of blad-der and kidney cancer in Finland. Environ Health Perspect107(9):705–710.
Kurttio P, Salonen L, Ilus T, Pekkanen J, Pukkala E, AuvinenA (2006) Well water radioactivity and risk of cancers of theurinary organs. Environ Res 102(3):333–338.
Kurttio P, Salonen L, Ilus T, Pekkanen J, Pukkala E, AuvinenA (2006) Well water radioactivity and risk of cancers of theurinary organs. Environ Res 102(3):333–338.

Medical Geology in Europe 299
Lahermo P, Alfthan G, Wang D (1998) Selenium and arsenic inthe environment in Finland. J Environ Pathol Toxicol Oncol17(3–4):205–216.
Lahermo P, Ilmasti M, Juntunen R, Taka M (1990) The geo-chemical atlas of Finland, Part 1. The hydrogeochemicalmapping of Finnish groundwater. Geological Survey ofFinland, Espoo.
Lahermo P, Backman B (2000) The occurrence and geo-chemistry of fluorides with special reference to naturalwaters in Finland. Geological Survey of Finland. Report ofInvestigation 149. 40p.
Lamberg BA (1986) Endemic goitre in Finland and changesduring 30 years of iodine prophylaxis. Endocrinol Exp20(1):35–47.
Luoma H, Aromaa A, Helminen S, Murtomaa H, Kiviluoto L,Punsar S, Knekt P (1983) Risk of myocardial infarction inFinnish men in relation to fluoride, magnesium and calciumconcentration in drinking water. Acta Med Scand 213:171–176.
Løken, A (1912) Goiter. Norsk Vet Tidskr 24:178 (InNorwegian).
Låg J (1968) Relationships between the chemical composition ofthe precipitation and the contents of exchangeable ions in thehumus layer of natural soils. Acta Agric Scand 18:148–152.
Låg J (ed) (1990) Geomedicine (278 p.). Boca Raton, USA: CRCPress.
Låg J (ed) (1992) Chemical climatology and geomedical prob-lems (226 p.). Oslo: The Norwegian Academy of Science andLetters.
Låg J, Steinnes E (1974) Soil selenium in relation to precipita-tion. Ambio 3:237–238.
Låg J, Steinnes E, (1976) Regional distribution of halogensin humus layers of Norwegian forest soils. Geoderma 16:317–325.
Låg J, Steinnes E (1978) Regional distribution of selenium andarsenic in humus layers of Norwegian forest soils. Geoderma20: 3–14.
Låg J, Hvatum OØ, Bølviken B (1974) Some naturally heavy-metal poisoned areas of interest in prospecting, soil science,and geomedicine. Norges Geol Unders 304:73–96.
Mills CF, Davis GK (1987) Molybdenum. In W Mertz (ed) TraceElements in Human and Animal Nutrition (Vol. 1, pp. 429–457). New York: Academic Press, Inc.
Ministry of Agriculture and Forestry (1984) Proposal foramounts of selenium to be added into fertilizers. WorkingGroup Report. No. 7, Helsinki (in Finnish).
Moltchanova E, Rytkönen M, Kousa A, Viik-Kajander M,Karvonen M (2004) Zinc and nitrate in the ground waterand the incidence of type 1 diabetes in Finland. Diabet Med21:256–261.
Nerbrand CH, Svärdsudd K, Ek J, Tibblin G (1992)Cardiovascular mortality and morbidity in seven counties inSweden in relation to water hardness and geological settings.Europ heart j 13:721–727.
Neves O, Abreu MM (2009) Are uranium-contaminated soil andirrigation water a risk for human vegetables consumers? Astudy case with Solanum tuberosum L., Phaseolus vulgaris L.and Lactuca sativa L. Ecotoxicology DOI 10.1007/s10646-009-0376-4.
Nikkarinen M, Aatos S, Teräsvuori E (2001) Asbestin esi-intyminen ja sen vaikutus ympäristöön Tuusniemellä,
Outokummussa, Kaavilla ja Heinävedellä. In Finnish.Summary: Occurrences of asbestos minerals and their envi-ronmental impact in the area of municipalities of Tuusniemi,Outokumpu, Kaavi and Heinävesi, eastern Finland. Reportof Investigation 152. Espoo:Geological Survey of Finland.41 p.
Nikkarinen M, Kollanus V, Ahtoniemi P, Kauppila T, HolmaA, Räisänen ML, Makkonen S, Tuomisto JT (eds) (2008)Metallien yhdennetty kohdekohtainen riskinarviointi. InFinnish. Abstract: Integrated site-specific risk assessment ofmetals. University of Kuopio, Department of EnvironmentalScience: Seminar Publications 3/2008. 401 p.
Notcutt G, Davies F (1999) Biomonitoring of volcanogenicfluoride, Furnas Caldera, São Miguel, Azores. J VolcanolGeotherm Res 92:209–214.
Orem WH, Feder GL, Finkelman RB (1999) A possible linkbetween Balkan endemic nephropathy and the leaching oftoxic organic compounds from Pliocene lignite by ground-water: preliminary investigation. Int Jour Coal Geol 40(2–3):237–252.
Orem W, Tatu C, Pavlovic N, Bunnell J, Lerch H, Paunescu V,Ordodi V, Flores D, Corum M, Bates A (2007, February)Health effects of toxic organic substances from coal: Toward“panendemic” nephropathy. Ambio 36(1):98–102.
Palumbo-Roe B, Cave MR, Klinck BA, Wragg J, Taylor H,O’Donnell K, Shaw RA (2005) Bioaccessibility of arsenic insoils developed over Jurassic ironstones in eastern England.Environ Geochem Health 27:121–130.
Pavão ML, Figueiredo T, Santos V, Lopes PA, Ferin R,Santos MC, Nève J, Viegas-Crespo AM (2006) Wholeblood glutathione peroxidase and erythrocyte superoxidedismutase activities, serum trace elements (Se, Cu, Zn)and cardiovascular risk factors in subjects from the cityof Ponta Delgada (Island of San Miguel, The Azores′Archipelago, Portugal). Biomarkers 11(5):460–471. (doi:10.1080/13547500600625828).
Pereira AJSC, e Neves, LJPF, Gonçalves CVM (2007)Radon in groundwater from the Hesperian massif (CentralPortugal). XXXV IAH Congress, International Associationof Hydrologists, Lisbon, Abstract book, Ribeiro L, ChambelA, Condesso de Melo MT (eds) p.190.
Pereira AJSC, Neves LJPF, Godinho MM, Dias JMM (2003)Natural radioactivity in Portugal: influencing geological fac-tors and implications for land use planning. Radioprotecção2(2–3):109–120.
Pereira AJSC, e Neves LJPF (2005) – Radon risk maps: thePortuguese experience. Annual Meeting of the GeologicalSociety, Salt Lake City, Abstracts with Programs, vol. 37 (7),p. 354.
Perrin J (2007) La géologie du radon. Géosciences 5:22 à 23.Piispanen R (1993) Water hardness and cardiovascular mortality
in Finland. Environ Geochem Health 15:201–208.Piispanen R (2000) Radon and lung cancer in Finland: Are
there signs of radiation hormesis? Environ Geochem Health22(2):113–130.
Pinto CA, Lima R, Louza AC, Almeida V, Melo M, Vaz Y,Neto Fonseca I, Lauren DR, Smith BL (2000) Brackenfern-induced bovine enzootic haematuria in São MiguelIsland, Azores Bracken-fern: Toxicity, Biology and Control:Proceedings of IV International Bracken 99. Conference.pp. 136–140.

300 O. Selinus et al.
Purdey M (2004). The Pathogenesis of Machado JosephDisease: A High Manganese/Low Magnesium Initiated CAGExpansion Mutation in Susceptible Genotypes? J Am CollNutr 23(6):715S–729S.
Plant JA, Baldock W, Smith B (1996) The role of geochemistryin environmental and epidemiological studies in developingcountries. In JD Appleton et al. (ed) EnvironmentalGeochemistry and Health with special reference to devel-oping countries. A review. Geological Society SpecialPublication 113: 7–22 London.
Pocock SJ, Shaper AG, Cook DG, Packham RF, LaceyRF, Powell P, Russell PF (1980) British regional heartstudy: Geographic variations in cardiovascular mortality,and the role of water quality. Br Med J 24;280(6226):1243–1249.
Pukkala E, Patama T (2008) Small-area based map ani-mations of cancer incidence in the Finland, 1957–2006.Finnish Cancer Registry http://astra.cancer.fi/cancermaps/suomi19572006/en/.
Pukkala E, Patama T, Engholm G, Ólafsdóttir GH, Bray F,Talbäck M, Pasanen K (2007) Small-area based map anima-tions of cancer incidence in the Nordic countries, 1971–2003.Nordic Cancer Union http://astra.cancer.fi/cancermaps/Nordic.
Punsar S, Erämetsä O, Karvonen MJ, Ryhänen A, Hilska P,Vornamo H (1975) Coronary heart disease and drinkingwater. A search in two Finnish male cohorts for epidemio-logic evidence of a water factor. J Chron Dis 28:259–287.
Punsar S, Karvonen MJ (1979) Drinking water quality andsudden death: Observations from West and East Finland.Cardiology 64(1):24–34.
Pärkö A (1990) Longitudinal study of dental caries prevalenceand incidence in the rapakivi (high fluoride) and olivine dia-base (low fluoride) areas of Laitila, Finland. Proc Finn DentSoc 86(2):103–106.
Rapant S, Krcmova K, (2008) Environmental and health riskestimation for potentially toxic elements in groundwater inSlovakia. European Geologist 25. June 2008. pp. 13–16.
Rapant S, Salminen R, Tarvainen T, Krcmová1 K, Cvecˇková1 V(2008) Application of a risk assessment method to Europe-wide geochemical baseline data. Geochem Explor EnvironAnal 8(3–4):291–299.
Rawlins BG, O’Donnell K, Ingham M (2003) Geochemical sur-vey of the Tamar catchment (south-west England). BritishGeological Survey, CR/03/027.
Reimann C, Ääräs M, Chekushin V et al. (1998) EnvironmentalGeochemical Atlas of the Central Barents Region. SpecialPublication, NGU-GTK-CKE. Geological Survey ofNorway, Trondheim.
Reimann C, Siewers U, Tarvainen T et al. (2003) AgriculturalSoils in Northern Europe: A Geochemical Atlas.Geologisches Jahrbuch, Sonderhefte, Reihe D, Heft SD5. Schweizerbart’sche Verlagsbuchhandlung, Stuttgart.
Roques CF (2007) Le thermalisme, la médecine que la Terrenous a donnée. Géosciences 5:74 à 79.
Reis AP, Sousa AJ, Ferreira da Silva E, Cardoso Fonseca E,(2005) Application of geostatistical methods to arsenic datafrom soil samples of the Cova dos Mouros mine (VilaVerde-Portugal). Environ Geochem Health 27:259–270.
Rubenowitz E, Axelsson G, Rylander R (1996) Magnesium indrinking water and death from acute myocardial infarction.Am J Epidemiol 143:456–462.
Rubenowitz E, Axelsson G, Rylander R (1999) Magnesium andcalcium in drinking water and death from acute myocardialinfarction in women. Epidemiology 10:31–36.
Rubenowitz E, Molin I, Axelsson G, Rylander R (2000)Magnesium in drinking water in relation to morbidity andmortality from acute myocardial infarction. Epidemiology11:416–421.
Rytkönen M, Ranta J, Tuomilehto J, Karvonen M (2001)Bayesian analysis of geographical variation in the inci-dence of Type I diabetes in Finland. Diabetologia 44(Suppl3):B37–B44.
Salminen R (Chief ed), Batista MJ, Bidovec M, Demetriades A,De Vivo B, De Vos W, Duris M,Gilucis A, GregorauskieneV, Halamic J, Heitzmann P, Lima A, Jordan G, Klaver G,Klein P, Lis J, Locutura J, Marsina K, Mazreku A, O’ConnorPJ, Olsson SÅ, Ottesen R-T, Petersell V, Plant JA, Reeder S,Salpeteur I, Sandström H, Siewers U, Steenfelt A, TarvainenT (2005) Geochemical Atlas of Europe. Part 1 – BackgroundInformation, Methodology and Maps. Geological Survey ofFinland, Espoo.
Salonen JT, Alfthan G, Huttunen JK, Pikkarainen J, PuskaP (1982) Association between cardiovascular death andmyocardial infarction and serum selenium in a matched-pairlongitudinal study. Lancet 24;2(8291):175–179.
Salonen JT, Salonen R, Lappetelainen R et al. (1985) Riskof cancer in relation to serum concentrations of seleniumand vitamins A and E: Matched case-control analysis ofprospective data. Br Med J 290:417–490.
Salonen JT, Salonen R, Seppänen K, Kantola M, Suntioinen S,Korpela H (1991) Interactions of serum copper, selenium,and low density lipoprotein cholesterol in atherogenesis. BrMed J 302:756–760.
Selinus O, Frank A, (1999) Medical geology. In L Möller (ed):Environmental medicine (pp. 164–183). Stockholm: JointIndustrial Safety Council.
Selinus OC, Frank A, Galgan V (1996) Biogeochemistry andmetal biology – an integrated Swedish approach for metalrelated health effects. In D Appleton, R Fuge, J McCall(ed) Environmental Geochemistry and Health in DevelopingCountries Special Publication (Vol. 113, pp. 81–89). London:Geological Society. , Chapman and Hall.
Selinus O, Alloway B, Centeno JA, Finkelman RB, Fuge R,Lindh U, Smedley P (eds) (2005) Essentials of MedicalGeology (820 p). Amsterdam: Elsevier.
Selinus O, Alloway B, Centeno JA, Finkelman (2008) The med-ical geology revolution – the evolution of an IUGS initiative.Episodes 30(4).
Sivertsen T, Plassen C (2004) Hepatic cobalt and copper levelsin lambs in Norway. Acta Vet Scand 45:69–77.
Sivertsen T, Øvernes G, Østerås O, Nymoen U, Lunder N(2005) Plasma vitamin E and blood selenium concen-trations in Norwegian dairy cows: Reginal differencesand relations to feeding and health. Acta vet Scand 46:177–191.
Skinner C, Berger A (eds) (2003) Geology and Public Health –Closing the Gap. Oxford: Oxford Press.

Medical Geology in Europe 301
Smedley P, Kinniburgh DG (2005) Arsenic in groundwa-ter and the environment. In O Selinus, B Alloway, JACenteno, RB Finkelman, R Fuge, U Lindh, P Smedley(eds), Essentials of Medical Geology (820 p). Amsterdam:Elsevier.
Steinnes E (ed) (2004) Geomedical aspects of organic farm-ing (138 p.). Oslo: The Norwegian Academy of Science andLetters.
Steinnes E, Frontasyeva MV (2002) Marine gradients of halo-gens in soil studied by epithermal neutron activation analysis.J Radioanal Nucl Chem 253:173–177.
Søli NE (1980) Chronic copper poisoning in sheep. Nord VetMed 32:75–89.
Sumelahti M-L, Tienari PJ, Wikström J, Palo J, HakamaM (2000) Regional and temporal variation in the inci-dence of multiple sclerosis in Finland 1979–1993.Neuroepidemiology 19:67–75.
Tarvainen T, Lahermo P, Hatakka T, Huikuri P, IlmastiM, Juntunen R, Karhu J, Kortelainen N, Nikkarinen M,Väisänen U (2001) Chemical composition of well water inFinland – main results of the “One thousand wells” project.In S Autio (ed) Geological Survey of Finland, CurrentReseasrch 1999–2000. Special Paper 31: 57–76.
Tatu CA, Orem WH, Finkelman RB, Feder GL, (1998) The eti-ology of Balkan Endemic Nephropathy: Still more questionsthan answers. Environ Health Pers 106(11):689–700.
Ulvund MJ (1995) Cobalt/vitamin B-12 deficiency in sheep.Norsk Veterinærtidskr. 107, 489–501 (In Norwegian, Englishsummary).
Ulvund MJ Øverås J (1980) Chronic hepatitis in lambs inNorway, a condition resembling ovine white liver disease inNew Zealand. N Z Vet J 28:19.
Varet J (2007) Tribune – Volcanisme et santé. Géosciences 5:110à 111.
Viegas-Crespo AM, Pavfio ML, Paulo O, Santos V, SantosMC, Nève J (2000) Trace element status (Se, Cu, Zn) andserum lipid profile in Portuguese subjects of San MiguelIsland from Azores’archipelago. J Trace Elements Med Biol14:1–5.
WHO (1993) Guidelines of drinking-water quality. Volume1: Recommendations. – 2nd ed. Geneva: World HealthOrganization.
Wragg J (2005) A study of the relationship betweenarsenic bioaccessibility and its solid phase distribution inWellingborough soils. Nottingham.
Wragg J, Cave M, Nathanail P (2007) A Study of the relationshipbetween arsenic bioaccessibility and its solid-phase distribu-tion in soils from Wellingborough, UK. J Environ Sci Health,Part A, Vol. 42, 1303–1315.
Wu X, Låg J (1988) Selenium in Norwegian farmland soils. Actaargic Scand 38:271–276.
Yoshida S, Muramatsu Y (1995) Determination of organic, inor-ganic, and particulate iodine in the coastal atmosphere ofJapan. J Radioanal Nucl Chem – Articles 196, 295–302.
Ytrehus B, Skagemo H, Stuve G, Siversen T, Handeland K,Vikøren T (1999) Osteoporesis, bone mineralization, and sta-tus of selected trace elements in two populations of moosecalves in Norway. J Wildlife Diseases 35, 204–211.

Medical Geology in China: Then and Now
Zheng Baoshan, Wang Binbin, and Robert B. Finkelman
Abstract The impact of the natural environment onhuman health has been a subject of study in Chinafor at least 5,000 years. China’s varied geology andgeography and its large population living off the landhave resulted in the presence of virtually every knownenvironmental health problem and some of the mostserious medical geology problems. Fluorosis in Chinahas been caused by drinking fluoride-rich waters, burn-ing coal briquettes using fluorine-rich clay binders,and eating high-fluorine salt. Iodine deficiency disor-ders such as goiter and cretinism were common incentral China but the introduction of iodized salt hasgreatly reduced these health problems. Arsenic poison-ing has been widespread in China, mainly caused bydrinking arsenic-rich groundwater but burning arsenic-rich coals and metal mining have also contributed tothis problem. Selenium deficiency that is believed tobe a causative factor in Keshan disease and Kashin-Beck disease was widespread in a zone from north-east China to Tibet. Human selenosis, thallium poi-soning, and various respiratory problems caused byexposure to minerals have also been reported fromChina.
Keywords China · Keshan disease · Kashin-Beck dis-ease · Selenium · Fluorine · Arsenic · Dusts · Thallium ·Respiratory problems · Coal · IDD
Z. Baoshan (�)The State Key Laboratory of Environmental GeochemistryInstitute of Geochemistry, Chinese Academy of Sciences,Guiyang 55002, P. R. Chinae-mail: [email protected]
Introduction
China’s Natural Environment, Lifestyle,and Their Relation to GeochemicalDiseases
China is a vast country embracing a wide varia-tion of topography, climatic conditions, rocks andsoil types, animals, and plants. China’s land area isabout 9.6 million km2, with distances of 5,500 kmfrom north to south and 5,200 km from east towest. In eastern China, alluvial plains formed by theHeilongjiang River, Liaohe River, Haihe River, YellowRiver, Huaihe River, Yangtze River, and Pearl River aredistributed from north to south with average altitudeof 200 m. The alluvial plains are home to two-thirdsof China’s 1.3 billion people and are the traditionalChinese agricultural areas.
In western China, there are more prominent moun-tains, plateaus, and basins. The Junggar Basin, TurpanBasin, and Tarim Basin are located in the TianshanMountains in the northwest. The Turpan Basin hasthe most arid, hot climate in China, and the AidingLake in the basin has the lowest elevation (155 mbelow sea level). In the middle of the Tarim Basin isChina’s largest and the world’s third largest desert, theTaklimakan Desert.
In western China there is the largest and highestplateau in China, Qinghai-Tibet Plateau, known asthe “Roof of the World” with an average altitude ofmore than 4,000 m. To the southeast of the Qinghai-Tibet Plateau, there is the Yunnan-Guizhou Plateauwith average elevations from 1,000 to 2,000 m and theSichuan Basin surrounded by mountains. The SichuanBasin, with altitudes up to 500 m and the best climatic
303O. Selinus et al. (eds.), Medical Geology, International Year of Planet Earth,DOI 10.1007/978-90-481-3430-4_11, © Springer Science+Business Media B.V. 2010

304 Z. Baoshan et al.
conditions for agricultural development, is the mostdensely populated area in western China. Northeastof the Qinghai-Tibet Plateau is the Loess Plateau andInner Mongolia plateau, with altitudes between 500and 1,500 m. The surface of the Loess Plateau is aloose accumulation of loess with a thickness of a fewhundred meters and has the most serious soil erosionproblems in China. There are low hills, mountains,and the ramps of transitions from plateaus to plainsbetween China’s eastern plains and western mountains.
Separated by the Qinghai-Tibet Plateau, the warmand humid air from the Pacific Ocean forms the areawith the Chinese mainland’s largest annual rainfall inwestern Sichuan Province and the area with the world’slargest annual rainfall (more than 10,000 mm annual)in the western slope of the Qinghai-Tibet Plateau.For this reason, the world’s major rivers, includingthe Yangtze River, the Yellow River, Mekong River,Salween River, Brahmaputra River, and Ganges River,originate in the Qinghai-Tibet Plateau.
The geology of China is impressively diverse. Thesoutheast coastal region is a large area of granitebedrock and the eastern plains are covered by riveralluvium with a thickness of more than 1,000 m.From compression by the India plate, geothermal areasformed in Yunnan Province and Tibet in southwestChina. From compression by the Pacific plate, geother-mal areas formed in Taiwan Province, Fujian Province,and Guangdong Province. A large number of geother-mal hot springs and some active volcanoes occur inthese areas. There are also some hot springs distributedalong some major faults in mainland China.
Due to a variety of different geological processes,some elements harmful to human health are enriched insome rocks, soils, surface, and groundwater and someelements necessary for human survival are depleted insome rocks, soils, surface and groundwater. These ele-ments, both harmful and useful, could be taken up byplants and animals and ultimately by humans. Fromthe late Neolithic period, 8,000 years ago to the late1970s, the period of China’s reform and opening up,the majority of Chinese people had always lived asettled farming life, drinking the local water and eat-ing crops grown on the land. Poor nutrition combinedwith exposure to harmful elements or to the defi-ciency of essential elements has led to a wide range ofenvironmental health problems affecting hundreds ofmillions of people, perhaps the most serious examplesof medical geology problems in the world.
Early Medical Geology Research in China
Foreign doctors and missionaries were the first toconduct studies of medical geology in China usingmodern scientific ideas and methods. Kashin-Beckdisease (KBD) is an endemic osteoarticular disorder.Following the Japanese occupation of Northeast Chinain 1931, the Japanese government sent medical work-ers to study KBD in northeast China. Keshan disease(KD) is a cardiovascular disease of unknown etiol-ogy and long common in northeast China. In 1936,the Japanese government sent medical researchers toinvestigate the disease, conduct a detailed descriptionof the disease, and named the disease “Keshan disease”(Sokoloff, 1989; Chinese Science Press, 1990).
In 1930, Anderson, an American doctor workingin China reported 398 cases of dental fluorosis inthe Xiaotangshan hot spring area in Beijing. In 1946,Oliver Lyth, a doctor working in a church-run hospitalreported endemic fluorosis in the Shimenkan area inWeining County, Guizhou Province, which is China’sfirst report of skeletal fluorosis. He also was the firstto report fluorosis from coal combustion, although atthat time he thought that the disease was induced bydrinking water (Lyth, 1946).
In 1926, Bernard E. Read and George K. How,working in the Department of pharmacology, PekingUnion Medical College, measured the concentrationsof iodine, arsenic, calcium, iron, and sulfur in sea-weed used in Chinese medicines. The results showedthat iodine concentrations ranged from 0.21 to 1.23%that proved reasonable for treatment of iodine defi-ciency disorders. During the period of late 1920s,William H. Adolph and Shen-Chao Ch’en, workingin the Department of Chemistry, Yenching University,conducted a systemic determination of iodine in drink-ing water and foodstuff in iodine deficiency diseases(IDD) and control areas in North China. These wereChina’s first studies of IDD (Adolph and Ch’en, 1930;Read and How, 1927).
Development of Medical Geologyin China
In a modern sense the object of medical geology isthe study of the impacts of geological materials and

Medical Geology in China: Then and Now 305
geological processes on animal and human health. Inthis sense, the earliest discussion of medical geologyin China began in the China University of Science andTechnology in the early 1960s. Li Changsheng, still astudent at that time, began to study the relationshipbetween different chemical compositions of crustalrocks and the health of residents. The study was limitedto theoretical discussion and speculation. In 1961, onthe basis of extensive investigations, Yu Weihan, pro-fessor of Harbin Medical University, pointed out thatKD was a biogeochemical disease due to the lack ofcertain minerals, amino acids, or vitamins in the diet.
In 1959, 1964, and 1970, the incidence of KD inChina was exceptionally high, with ratios all higherthan 40/100,000 and with an annual mortality of morethan 2,000. To address this problem a large numberof research institutions and researchers focused theirattention on KD. With the expansion of the research,studies on KBD, endemic fluorosis, and endemic goiterwere also carried out. In these institutions there werescholars engaged in epidemiology, pathology, toxicol-ogy, nutrition, and scholars engaged in the geology,geochemistry, and geography. In China, the researchwas referred to as endemic studies by scholars frommedical profession, as medical geology by geolo-gists, as medical geography or chemical geographyby geographers, and as environmental geochemistry orgeochemistry and health and disease by geochemists.Now all of these studies can be attributed to the scopeof medical geology.
Endemic Diseases in China
During the past 60 years, in order to control endemicdiseases, the Chinese government has made greatefforts and the incidence of endemic diseases andmortality rates have been significantly reduced. Witheconomic development, living standards and nutri-tional status of residents in endemic areas have greatlyimproved and the trace element-related diseases suchas KD and KBD have been almost eradicated. Nowthere are cases of KBD in only some areas in Tibet.Iodine deficiency diseases have been well controlledby the policy of nationwide use of iodized salt.In drinking water fluorosis areas, government-fundedconstruction of public drinking water facilities has pro-vided low-fluoride drinking water for local residents.
In areas of coal combustion fluorosis, government-funded stoves have discharged harmful gases outsidethe houses and greatly reduced the dangers of fluorosis.Although the situation has greatly improved, problemscaused by long-term endemic hazards remain and arestill very serious for these environmental health issuesthat have been recognized for thousands of years.
Understanding the RelationshipBetween Disease and the NaturalEnvironment by the Ancient Chinese
The ancient Chinese people noted the relationshipbetween some diseases and climate, soil, water, anddiet and also found that certain diseases were prevalentin particular areas. Modern Chinese medicine focuseson the effects of geological materials and processes onhuman and animal health, including two harmful dis-eases – endemic fluorosis and iodine deficiency thatare widely distributed and have long been known anddescribed by ancient Chinese people who studied thenatural characteristics, distribution, causes, treatments,and prevention of these diseases.
Records of Iodine Deficiency Disordersand Endemic Fluorosis in AncientChinese Books
Jiaguwen is a kind of inscription carved on bones ortortoise shells used by shaman to predict good or badfortune during the Shang and Zhou dynasties 3,000years ago. Since 1899, a large number of these oraclebones have been unearthed in the suburbs of AnyangCity, once the capital of the Shang Dynasty (16th cen-tury BC–11th century BC), in Henan Province, China.More than a hundred thousand oracle bones have beenunearthed, in which about 4,500 different words werediscovered and 1,700 of them have been interpreted, inwhich “Ying” was included.
“Ying” is a person’s neck bump, the expression ofendemic goiter due to the lack of iodine in the diet. TheChinese word “Ying” consists of two parts: one partindicates a disease and the other part is the descriptionof the image of the bump of a patient’s neck.

306 Z. Baoshan et al.
There are four very important books on Chinesetraditional medicine, and “Huang Di Nei Jing” (475BCE–AD 220) is one devoted to the cause and pre-vention of diseases. “Huang Di Nei Jing” consists oftwo parts: “Su Wen” and “Lingshu.” In many parts “SuWen” involves the relationship between diseases andwater quality, soil, and climate [Huang Di Nei Jing].
The book was likely to have been started duringthe Warring States period (475–221 BCE). The orig-inal author is not known. Over the next 1,000 years,this book had gone through various amendments andadditions by scholars. But its main part may have beenformed in the Warring States-Eastern Han Dynastyperiod (475 BCE–AD 220), since Zhang Zhongjing,a person living in the late Han Dynasty, first quotedthis book but the version he quoted has been lost.The widely used version was finalized in the years1057–1067.
“Lu Shi Chun Qiu” (239 BCE) also known as “LuLan” is the first book with a clear description ofthe relationship between drinking water and health inChina. This book was collectively completed under theorganization of Lu Buwei, the prime minister of theQin State during the late Warring States Period (circa221 BCE). This book was finished in the year 239BCE, the eve of the unification of China by the QinState. The following words are written in the chapterof “Jin Shu”: “More people of bald, and iodine defi-ciency lives in the place with light (mineral deficient)water; more people of swollen feet and crippled legslive in the place with heavy (mineral surplus) water;more healthy and beautiful people live in the place withsweet water; more people with dermatosis live in theplace with spicy water; and more people with ricketsand humpbacks live in the place with bitter water” (LuBu Wei, circa 221 BCE).
In ancient China, the so-called light and heavy waterrefers to the difference in the amount of minerals in thewater. Generally the water in the upper reaches of theriver and in mountainous areas is called light water, anddownstream river water and water in plains or coastalareas is called heavy water. Sweet water has a slightlysweet taste and is uncontaminated, generally with goodwater quality and low salinity. Spicy water might havebeen seriously polluted by organic matter and sewage.Bitter water must come from saline areas with a highdegree of mineralization.
The above passage in “Lu Shi Chun Qiu” canbe interpreted as follows: in areas with low-salinitydrinking water and early human hair loss, thyroid
disease is common; in areas with high-salinity watermore people suffered joint swelling and lameness; inareas with good water quality people are beautiful andnoble; in areas with severely polluted water people areprone to skin abscesses; and people drinking brack-ish water tend to have rickets and “humpbacks.” If weaccept that the symptoms of swollen feet, crippled legs,rickets, and “humpbacks” recorded in the book “Lu ShiChun Qiu” to be a description of skeletal fluorosis, thisbook is the earliest Chinese medical book recordingthis disease.
“Huai Nan Zi” (180–123 BCE) is a book of col-lective works later than “Huang Di Nei Jing.” LiuAn (180–123 BCE) was the King of the HuainanState in the Han Dynasty. He is said to have invitedthousands of scholars to jointly prepare a book enti-tled “Hong Lie,” now only 21 papers from it called“inside the book” have been handed down to form thebook “Huai Nan Zi” (Liu An, 180–123 BCE). In thebook, there are a lot of descriptions of the relation-ship between people’s appearance, health status, andgeographical conditions, drinking water, food, climate,and season. In one of the papers called “falling-shapedarticles,” it is recorded “. . .More ‘Ying’ in dangerousareas, more die in hot areas and more long lives incold areas. . .” Translated into modern Chinese, thosewords can be interpreted as living in the mountainareas, people easily suffer from thyroid disease, peo-ple living in hot climate regions will die at youngages, while in a cold climate region, people livelonger.
Zhang Hua (AD 232–300), a minister in the WesternJin Dynasty, was known as a knowledgeable person.In his book “Bo Wu Zhi,” he wrote that people livingin the mountains easily suffered from thyroid diseasebecause they drank spring water that did not flow. Thedisease was prevalent in mountain areas in west HubeiProvince. People living along the Yangtze River didnot have that disease due to thin soil layers with lowcontent of salt (Zhang Hua, AD 232–300).
Lu Wenchao from Qing Dynasty did not agree withZhang Hua and explained that only people living in thesouth had that disease because there was black-coloredwater in the south and not because the water did notflow. He pointed out that the disease was due to thequalities of water and soils but not static spring andwell water.
Based on modern scientific knowledge, both argu-ments are partially correct, but contain errors based onspeculation.

Medical Geology in China: Then and Now 307
What Zhang Hua saw, that thyroid disease iscommon in the mountains areas or thin soil areas,especially the “halogen-free” soil area, is completelycorrect. Iodine is very easy to move with air and water,therefore is very low in mountains areas with serioussoil erosion by leaching, where the plants also havelow contents of iodine that leads to the prevalence ofthe disease.
It is remarkable that, 1,800 years ago, the ancientChinese considered the relationship between iodinedeficiency diseases and soils. Only in recent timeshas it been confirmed that the direct cause of iodinedeficiency disorders is lack of iodine in soils.
Ji Kang (AD 223–262) was a writer, philosopher,and musician who lived in the Three Kingdoms period(AD 220–280). He noted that the teeth of a lot of peo-ple who lived in Shanxi Province were yellow andrecorded this discovery in his book, “Yang Sheng Lun”(The Health Theory). It is now considered the ear-liest record of endemic fluorosis in ancient China.According to the statistics in 2000, 7.4% of the totalpopulation (2.43 million) of the people in ShanxiProvince are still suffering from fluorosis becauseof high-fluorine groundwater, one of largest endemicfluorosis areas in China (Ji Kang, AD 223–262).
The book, “Zhu Bing Yuan Hou Lun” (Source ofthe Disease), was published by Chao Yuanfang, theformer imperial doctor of the Sui Dynasty in 610.This book summarized the previous ancient Chinesemedical descriptions of various diseases and treatmentexperiences including “Ying.” It was written in thebook that the disease was common in the people wholived many years in mountains areas, spring areas, orareas with a black soils rich in humus materials (ChaoYuanfang, 610).
Prevention and Treatment of EndemicDiseases in Ancient China
In contrast to fluorosis, endemic goiter can be treatedand prevented. The ancient Chinese may have foundways to treat goiter at a very early age. The earli-est written record is the medical book “Qian Jin YaoFang,” written by the famous physician Sun Simiao(581–682). The book discusses hundreds of kinds ofdiseases and collected more than 10,000 prescriptionsfor the treatment of various diseases. To treat thyroiddisease, drugs including deer and sheep thyroid, sea-weed, sea clams, and oysters were listed in the book
(Ge Hong, 284–364). Wang Tao, generally lived in thesame era of Sun Simiao and recorded in his medicalbook “Wai Tai Mi Yao” similar drugs. Those treat-ments clearly formed prior to the completion of thosebooks (Sun Simiao, 581–682).
Zhang Zihe (about 1156–1228) in the Jin Dynastywrote a book named “Ru Men Shi Qin,” featuring diag-nosis and treatment of a variety of diseases. In the partdiscussing “Ying,” he pointed out that it can be curedby drinking the water dipping from any two of the threekinds of seafood, kelp, algae, and seaweed. In fact, thismethod not only can treat patients who have been suf-fering from endemic goiter but also adds iodine for thepeople living in the same iodine deficiency environ-ment and can help prevent iodine deficiency diseases.Since seafood are all natural foods and not chemicalsthat people, who lack sufficient scientific knowledge,are afraid of, that approach is still regarded as a read-ily acceptable method to prevent diseases in iodinedeficiency areas (Zhang Zihe, 1156–1228).
Medical Geology in China Today
Fluoride-Related Diseases
Geology and Geochemistry of Dentaland Skeletal Fluorosis
China has one of the world’s most serious fluorosisissues, an issue that has afflicted this region for quitesome time. In 1976, a number of Paleolithic humanfossils dating 10 million years ago were unearthed inXujiayou Village, Yang Gao County, Shanxi Province.Brown stains and spot-like depression defects werefound in the five human fossil teeth showing the typicalfeatures of dental fluorosis. The discovery of ancienthuman teeth fluorosis is in a county where Ji Kang(AD 223–262) reported that “People living in ShanxiProvince have yellow teeth” (Ji Kang, AD 223–262).This region is still a serious fluorosis area. Until the1990s, the fluoride content of drinking water in gen-eral had been higher than 4 mg/L and reached as highas 9.5 mg/L in some individual wells. In recent years,on the basis of government funding, local residents nolonger use the high-fluorine groundwater.
According to the available information endemic flu-orosis is prevalent in all provinces, municipalities, andautonomous regions in China, except for Shanghai.

308 Z. Baoshan et al.
Excluding fluorosis from tea drinking, of all 2,221counties in China there are 1,297 fluorosis prevalentcounties with the population of nearly 650 millionpeople, almost half of the 1.3 billion population ofChina.
Data released by China’s Ministry of Health in 2007indicate that the number of dental and skeletal fluoro-sis cases caused by drinking fluorine-rich water were21 million and 1.3 million, respectively, representing1.59 and 0.10% of China’s population. There weremore than 118,000 villages with the prevalence rates ofdental fluorosis over 30% and with a total populationof 84 million, accounting for 6.35% of China’s pop-ulation and 11.54% of the rural population in Chinaat that time. Of these, fluorine mobilized by domesticcoal combustion caused dental fluorosis in more than16 million people and skeletal fluorosis in 1.8 millionpeople. These two types of dental fluorosis and skele-tal fluorosis patients totaled more than 37 million and3 million, respectively, with nearly 160,000 villageshaving rates of dental fluorosis prevalence over 30%(Ministry of Health, P. R. China, 2009).
There are also an estimated one million people withfluorosis caused by drinking fluorine-bearing brick tea,popular in Tibet, Qinghai, Xinjiang and parts of InnerMongolia in western China.
Relationship Between Fluorosis Rates and Levelsof Fluoride Exposure
Correctly understanding the above data entails under-standing the survey and statistical methods ofChinese endemic fluorosis. In medical geology, thisis the bridge connecting epidemiology and the earthsciences.
A national survey was conducted in the 1970s. Inthe regions with fluoride content in drinking waterhigher than 1.0 mg/L, dental fluorosis was identified ifthe following symptoms occur: teeth have lost lustrousglaze and have a chalky appearance; the enamel is lightyellow, yellow, brown and black in color or has stripes,light points, and plaques; and the teeth have enameldefects. Since it is impossible to use X-ray machinesto inspect all the suspected population, skeletal fluoro-sis was determined mainly by clinical examinations. Influorine exposure areas, skeletal fluorosis was definedas long as the patient demonstrated one or more ofthe following symptoms: damaged shoulder, elbow andknee, curved spine, or “humpback.”
The investigation was carried out on children aged8–12. At present, the population of a village in Chinais around 500–1,000, and of children aged 8–12 in avillage is generally about 40–80. If the prevalence rateof dental fluorosis in children is over 30%, this villageis classified as an endemic village and the rate of den-tal fluorosis in children represents the rate of the wholepopulation of the village, and accordingly, the numberof patients of the village is calculated. In accordancewith the management approach of China’s endemicdisease, any county or province that has endemic vil-lages is defined as an endemic county or province.Obviously, the population of an endemic province isgreater than that of a county and much greater than thatof a village.
Fluorosis from Drinking Water
This type of drinking water fluorosis is caused byexcessive intake of fluorine through drinking waterwith high fluorine. Enrichment of fluorine in ground-water can form by leaching the fluorine from highfluorine-bearing rocks that the groundwater flowsthrough. The more fully the water and rock interacts,the higher fluoride concentration.
Fluorosis from High Fluoride in Shallow Water
High-fluoride shallow water is widely distributed andis the source of the most serious endemic fluorosisproblem in China. In this type of fluorosis, the preva-lence can reach 30% (definition limit of an endemicfluorosis region) when fluoride content of drinkingwater exceeds 1 mg/L. In China, the highest fluoridecontent in these regions can be as high as 32 mg/L.
Characteristics of those regions are arid, semi-aridclimate, hot summers with concentrated rainfalls, andcold and dry winters with little rainfall and intensiveevaporation. Major cations in the water are potassium,sodium, and calcium released by rock weathering,forming a partial alkaline condition making fluorinemore susceptible to leaching. Fluorine enters into theshallow groundwater by mixing of surface water andgroundwater and is concentrated by evaporation andcondensation in the shallow water by the dry climate,resulting in high-fluoride shallow water.
In China, this type of fluorosis occurs wildlyfrom northwest to the northeast, mainly in the InnerMongolia Autonomous Region, the central area
Medical Geology in China: Then and Now 309
of Heilongjiang Province, the central and westernareas in Jilin Province, northern Liaoning Province,Hebei Province, Beijing, western Shandong Province,northern Henan Province, Shanxi Province, ShaanxiProvince, Ningxia Autonomous Region, GansuProvince, and Xinjiang Autonomous Region. The dis-tribution of this type of fluorosis is strictly controlledby topography.
During the past three decades, as economic develop-ment increased, the nutritional status of residents hasgreatly improved and the resilience of the body towardfluoride has also increased. Particularly, more andmore people use bottled mineral water, purified water,and soft drinks. Many young people have given upagriculture and farm work and work seasonally in thecities or in coastal areas. Therefore, the consumptionof high-fluorine groundwater has significantly declinedand the dose–response relationship has also changed,for the ratio of fluorosis has declined at the same levelof fluoride content of drinking water.
Since the beginning of this century, the Chinesegovernment has invested a lot of money annually tohelp local residents of dental fluorosis regions improvethe quality of drinking water. The main measuresare looking for low-fluoride water sources includ-ing low-fluoride surface water, deep groundwater orgroundwater in adjacent areas in the endemic fluo-rosis regions, and government-funded construction ofpublic water supply systems. Centralized facilities forfluoride removal methods of drinking water have beenconstructed in a few areas because low-fluoride watercould not be found and adopted.
By 2007, the drinking water of more than 55,000villages had been changed to low-fluoride water. Ofthe population of 84 million that used high-fluoridedrinking water in the past, more than 42 million nowuse low-fluoride drinking water. Because of the pol-icy that villages with very high fluoride contents ofdrinking water change water sources, now most vil-lages have water supplies with fluoride concentrationof 1–2 mg/L. Therefore, we can say that China hasbasically eliminated the conditions resulting in skeletalfluorosis and will completely solve the drinking waterfluorosis in the near future.
Fluorosis from High-Fluoride Geological Bodies
High-fluoride surface water and groundwater can formfrom contact with high-fluorine rocks, sediments, or
ore bodies. These high-fluoride geological bodiesinclude volcanic rocks, granites, alkaline rocks, alka-line salt lake sediments, and mineralized zones offluorite. A wide range of fluorine-rich granites aredistributed in southeastern China, and a large num-ber of fluorite ore deposits are distributed in ZhejiangProvince, Guangxi Autonomous Region, and HenanProvince. High-fluorine surface water and groundwa-ter from these areas has resulted in fluorosis in partof the local population. In the areas of WudalianchiVolcano Group in Heilongjiang Province, ChangbaiVolcanoes in Liaoning Province, Arshan Volcanoesin Inner Mongolia Autonomous Region, DatongVolcanic Group in Shanxi Province, and TengchongVolcanoes in Yunnan Province, water-soluble fluorine-rich magma and ash had been ejected during volcanicactivities and formed into volcanic rocks and tuff.From contact with these rocks high-fluoride surfacewater and groundwater has been formed resulting inmany cases of fluorosis. Fluorosis in fluorite minesin Henan Province, Zhejiang Province, and GuangxiProvince has also been reported.
Fluorosis from Volcanic Hot Springsand Geothermal Regions
A large number of hot magma, volcanic ash, vol-canic gases, and geothermal fluids, which containa great amount of activated fluorine, was releasedby volcanic and geothermal activities. Higher tem-peratures in volcanoes and geothermal crustal areascaused accelerated interactions between groundwaterand rocks and a higher amount of fluorine released intogroundwater.
The world’s first report of fluorosis was from theVesuvius volcano area in Italy. China’s initial reportsof this type of fluorosis were from Xiaotangshan hotspring in the suburb of Beijing and Xiongyue andTanggangzi hot spring areas in Liaoning Province.
In history, there had been volcanic activitiesin Wudalianchi area in Heilongjiang Province,Changbaishan area in Jilin Province, Arshan area inInner Mongolia Autonomous Region, Datong area inShanxi Province, Tengchong area in Yunnan Province,and Datun area in Taiwan, China. Now only volca-noes in Datun area in Taiwan are still active. There arehigh-fluoride surface water and groundwater in areasaffected by all of the above volcanoes.

310 Z. Baoshan et al.
Fluorosis from Coal Combustion
In 1982, an investigation of fluorosis in GuizhouProvince was conducted by the Institute of Geography,Chinese Academy of Sciences. They reported that alarge amount of gas and dust containing fluoride wasreleased by coal combustion and quickly combinedwith vapor in the air to form an aerosol or a hydrofluo-ric acid mist, which adhered to the surface of corn andchili. They also pointed out that fluorine concentrationsin the soils in the fluorosis area were higher than thosein other areas, which might potentially affect fluorineconcentrations in local foodstuff. The authors demon-strated that fluorine concentrations in fresh corn fromZhijin County, Bijie County, and Guiyang City were3.60, 2.75, and 5.35 mg/kg, respectively. Those val-ues are higher than the world average value and maybe important in that foodstuff alone can induce dentalfluorosis (Li et al., 1982).
Etiological Significance of the Clay in Fluorosisfrom Coal Combustion
Fluorosis caused by indoor coal combustion is onlyprevalent in China and is a very severe health prob-lem. China defines coal combustion-type fluorosis asan endemic disease and assigns the government healthsystem to be charge of it. In fact, this disease is nei-ther a traditional endemic disease nor a general “publicnuisance.” If a harmful element is distributed in thesurface water, groundwater, foodstuff, and air of a spe-cific area and has to be absorbed by residents duringtheir everyday life, the disease induced by this ele-ment is endemic. If this element enters surface water,groundwater, foodstuff, and air by human activities, thedisease induced by this element is a “public nuisance.”
Zhou Daixing, from the Health and EpidemicPrevention Station of Qiannan Autonomous District,first noticed the relationship to clay. In the secondnational symposium on endemic fluorosis in 1985, hepointed out that the difference in the degrees of fluo-rosis of adjacent areas using the same coal is causedby the difference in fluorine concentrations in clay thatwas mixed with coal for combustion and suggested notto use high-fluoride clay to mix with coal (Zhou et al.,1993).
A similar conclusion was obtained from the inves-tigation in Zhijin County, Guizhou Province (Zheng,
1992). It was pointed out that the harm from fuel madeby coal mixed with clay was larger than from the coalalone and the amount of fluorine released from claywas two times more than that from the coal.
Research in collaboration with the U.S. GeologySurvey on fluorine and other elements in coal and coalash found that there was a positive correlation betweenthe concentrations of fluorine and potassium. Becausepotassium is mainly distributed in clay minerals in coaland coal combustion products, it can be inferred thatfluorine is also distributed in the clay minerals in thecoal and coal ash and the contents of fluorine increasewith increasing proportions of clay (Finkelman et al.,2002).
Recently, Wu et al. (2004) demonstrated that coalmixed with clay to form briquettes used as fuel wasvery common and that the clay was the main sourceof fluorine causing fluorosis. Based on a survey on theenvironment and living conditions of fluorosis areas, itwas found that local residents had to use the mixtureof coal powder and clay as their fuel because the coalpowder was cheaper than lump coal.
In recent years, with the improvement in economicconditions, the conditions of fluorosis have greatlychanged and the prevalence has gradually decreased.Now all the villages have been able to use electricenergy and the usage of bio-energy sources (straw,biogas) has increased. Local residents have usedgovernment-funded stoves with chimneys for heatingand cooking, and the use of stoves without chim-neys has been decreasing. Now the staple food of theresidents is rice, and corn is primarily used for live-stock feed, which greatly reduces the fluoride intakeof the residents. However, for the time being, fluorine-contaminated peppers are the main source of fluorineintake (Sun et al., 2005).
Fluoride Caused by High-Fluorine Salt
Liu Ziyue et al. (1982) reported a case of salt-inducingfluorosis in Yushan Town, Pengshui County, SichuanProvince (Liu et al., 1982). There are three sources forsalt in China: sea salt, lake salt, and rock salt. Sea saltwas used in the southeast coastal areas and the centralregion, and with a large number of salt lakes in north-west, the principal salt used by people in this area islake salt.

Medical Geology in China: Then and Now 311
Rock salt and brines from Triassic rocks are richunderground in the Zigong County in central SichuanProvince. More than 2,000 years ago, local residentsbegan to extract and heat underground brine to makesalt. This salt was called “well salt” and used in muchof southwest China. Fluorine concentration is low insalt rocks of the Triassic and is only 1 mg/kg inproduced salt. So there is no health risk to use this salt.
The salinity of the Cambrian strata is significantlylower than that of the Triassic. A phosphate layer withhigh fluorine content (1–3%) is beneath the Cambrianstrata. So salt brine from the Yushan factory has lowersalinity but a higher fluorine content than that of thebrine in Zigong County. In the production process, inorder to fully use the heat released from coal com-bustion, exhaust gas from coal combustion is directlycontacted with brine to preheat it, therefore exhaust flu-orine from coal combustion was absorbed by the brineand further increased its fluorine content. It is clear thatin the pre-condensed stage, concentrations of NaCl andfluorine increase 30 and 113%, respectively, obviouslydue to the adsorption of fluorine by brine in contactwith exhausted gas from coal combustion.
Salt production from the Yushan Factory is limitedand only supplies some towns in Qianjiang County andPengshui County, where fluorosis from coal combus-tion occurs. Xiaochang Village in Pengshui County isthe most severe fluorosis area in China, with 100%dental fluorosis. Therefore, the majority of fluorosisin this area is the mutual results of indoor coal com-bustion and high-fluoride salt. In 1985, the Yushansalt factory was closed due to the high-fluoride saltproducts and the health risk of high-fluoride salt is nolonger an issue (Zhang, 1986, 1992).
Prevention of Dental Caries by DrinkingWater Fluoridation in China
Based on the data of the third epidemiological inves-tigation on oral health in China conducted in 2005,dental caries of 12, 35–44, 65–75 years old residentsof China are 28.9, 64.2, and 71.8%, respectively, withnumbers of decayed teeth per person of 0.54, 2.42, and3.22, of which 10.7, 23.3, and 8.2% has been cured,respectively. The situation of milk teeth of childrenis worse, with 66.0% of ratio of dental caries in 5-year-old children, with 3.5 decayed teeth per person,of which only 2.8% has been cured.
In the 1965, an experiment of tap water fluoridationwas conducted in Guangzhou, China, but did not yieldany reliable results, and was stopped in 1983. Sincethen, research on drinking water fluoridation in Chinahas faced great challenges. Now there are no drink-ing water fluoridation systems in any communities inChina.
In order to implement drinking water fluoridationto prevent dental caries, since 1995 Zheng Baoshan,Wang Binbin et al. have conducted research on therelationship between fluorine concentrations in drink-ing water and dental health in China (Wang et al.,2004a, 2005). In this project, the relationship betweenfluorine content in drinking water, food, and dentalhealth of residents in 50 large cities in China was eval-uated. The effects of fluorine intake by weather as wellas gender were also studied.
Through this study it was found that the generalconcentrations of fluorine in drinking water in cities inChina were low. Fluorine contents in drinking waterwere lower than 0.3 mg/L in 70% of the cities andlower than 0.5 mg/L in 90% of the cities. Shanghaihad the highest fluorine content (0.667 mg/L) but itstill not exceeded the recommended range from WHO(0.5–1.0 mg/L) (WHO, 1996a).
Fluorine concentrations in food were low and didnot have much variation between cities. Fluorine con-tents in rice and flour were lower than the test limit,which indicates that the intake of fluorine for Chinesepeople was not from foodstuff generally.
Drinking water was the main source of fluorineintake for Chinese residents, in the range from 0 to4 mg/L, indicating that the definitive factor in thedifference in fluorine intake comes from tap water(Fig. 1).
0
1
2
3
4
5
6
0 1 2 3 4 5F Conc in Tap Water(mg/L)
F C
onc
in U
rine
(m
g/L
) y = 1.3293x + 0.2011R2 = 0.96
Fig. 1 The relation between fluorine concentrations in tap waterand in urine of local residents of the investigated cities andvillages

312 Z. Baoshan et al.
The relation between fluorine concentration indrinking water and dental index did not have a goodlinear relationship. The following two conclusions canbe drawn from this study: with the increasing fluorineconcentrations in drinking water in the safe range, den-tal caries can be limited and reduced; dental caries wasnot determined by fluorine alone, but eating habits,conditions of sanitation, living conditions, etc. couldalso affect its prevalence.
Medical Geology of Iodine in China
Iodine Deficiency Disorders (IDD) in China
Since most parts of China are far away from the sea,it is difficult for wind and rain to bring iodine fromthe ocean into the Chinese mainland. Also, becauseChina is a mountainous and hilly country, rainfall notonly does not add iodine but leaches some iodine fromthe soils. Therefore, China has the most serious prob-lem of iodine deficiency disorders in the world. Thereare 375 million people living in iodine-deficient areas,accounting for 47% of the world’s at-risk populationand there are about 35 million people with iodinedeficiency disorders in China.
In addition to Shanghai, all of the provinces andautonomous regions had endemic iodine deficiency.The most serious areas were interior mountains, areaswith serious soil erosion by groundwater and surfacewater flowing along steep slopes, plus peat swampareas, and limestone areas.
Endemic Cretinism in China
In iodine deficiency areas, a serious shortage of iodineintake by pregnant women will harm the develop-ment of the nervous system of the fetus and newborninfants will likely suffer from cretinism and relatedhealth problems. Patients with endemic cretinism arefound in every area that has serious iodine deficiencydisorders in China. During 1962–1983, an investiga-tion on endemic cretinism in China was conducted(Institute of Epidemiological Diseases in XinjiangUigur Autonomous Region, 1984). The survey wascarried out in 25 provinces and autonomous regions tocheck a population of more than 750,000 people. Thesurvey found a goiter prevalence rate of 24.92% on
average, with a range of 11.1–50.8% and a cretinismprevalence rate of 3.15% with a range of 0.04–13.6%.
The more severe the goiter problem the higher theincidence of cretinism. According to the survey therelationship between iodine deficiency endemic goiterand cretinism prevalence rates resulted in one cre-tinism patient in every 75.83 endemic goiter patients.Based on this ratio, there were 35 million endemicgoiter patients and approximately 460,000 patientswith cretinism in China prior to the implementationof salt iodization in iodine deficiency endemic areas(Institute of Epidemiological Diseases in XinjiangUigur Autonomous Region, 1984).
Stanbury (1996), a leading expert on iodine defi-ciency disorders, deemed that cretinism appeared inthe region when daily iodine intake was less than20 μg, with a prevalence threshold of 25 μg, andan epidemic threshold of endemic goiter was 50 μg.China’s findings were consistent with this.
It was found from the research on the relation-ship between iodine concentrations of drinking waterand iodine deficiency disorders in China that iodinecontents in drinking water for the residents living inendemic cretinism areas are mostly less than 1.5 μg/Land that there is very little prevalence of cretinismin the areas with iodine content in drinking water isgreater than 3 μg/L.
It was found that the iodine contents of salt hada significant impact on the prevalence of iodine defi-ciency diseases. Before 1966, there was endemic goiterbut no cretinism in the south and southeast areas inGuizhou Province, but after 1966, cretinism existedwith the ratio of 6.3% in children in endemic villagesin this region, and the maximum ratio reached 22.8%.The only change of iodine nutritional status of resi-dents in this region was the change in the source ofedible salt. In the past, edible salt in this region waswell salt from Sichuan Province with 1,600 μg/kg ofiodine. In the 1950s, edible salt in this region changedinto sea salt or well salt with iodine concentrationslower than 200 μg/kg (Institute of EpidemiologicalDiseases in Xinjiang Uigur Autonomous Region,1984).
Endemic Goiter Induced by Iodine Exposure
From the survey on the relationship between the uri-nary iodine concentrations of the Chinese population

Medical Geology in China: Then and Now 313
and goiter prevalence, it was found that the prevalencerate of endemic goiter increased when the intake ofiodine was lower or higher than the needed amount.Although the main hazard in China is iodine deficiencydisorder, there are also goiter hazard problems causedby excess iodine exposure in underground water andfood.
Endemic goiter was reported in Hokkaido, Japan in1965, due to the excessive consumption of algae bythe fishermen. In the 1980s, the prevalence of goitercaused by excess iodine from eating seaweed impreg-nated with “seaweed salt” was reported in the coastalarea of Shandong Province, China.
Endemic goiter caused by iodine exposure in drink-ing water has been found only in China. The areas withexcess iodine exposure in drinking water in China aredelineated by iodine contents higher than 150 μg/Land median urinary iodine concentrations of childrengreater than 400 μg/L. The delineation of areas withendemic goiter induced by excess iodine exposure isiodine contents in drinking water higher than 300 μg/Land median urinary iodine concentrations of residentsgreater than 800 μg/L and an incidence of endemicgoiter greater than 5%.
The iodine exposure region in China is located inlow areas in the North China plain and inland basinsin Shanxi Province and Inner Mongolia AutonomousRegion. The geochemistry and formation of water withhigh iodine needs further research. Now the supply ofiodized salt has been stopped in areas where iodinecontents in drinking water are higher than 150 μg/L(Shen et al., 2007).
Prevention of IDD by Salt Iodization
In China, the supply of iodized salt was conductedin serious iodine deficiency areas since the 1950s.Confirmed by the national survey of IDD, by 1988,the total number of IDD patients had dropped from 35million to less than 8 million (Prevention of endemicdiseases for forty years in China, 1990).
In response to the World Health Organization call-ing for universal salt iodization, in 1991, the Chinesegovernment formally committed to the internationalcommunity to use universal salt iodization to achievethe goal of complete elimination of iodine deficiencydisorders by 2000.
By the implementation of universal salt iodiza-tion, China has basically achieved the goal of elimi-nating iodine deficiency disorders. By 2007, iodizedsalt was consumed by 94.13% of the populationof China and the total number of patients withendemic goiter had dropped to about 6 million peo-ple with 122,000 patients with endemic cretinism.There are no new patients of endemic cretinism inthe areas covered by iodized salt. Because of thenational salt iodization program, the average IQ levelof Chinese newborn children increased 11–12 points(Ministry of Health of the People’s Republic of China,2009).
At present, patients with endemic goiter are mainlydistributed in the Tibet Autonomous Region, XinjiangAutonomous Region, Hainan Province, and QinghaiProvince that are enriched with accessible depositsof lake salt, rock salt, well salt, or sea salt resourcesthat the local residents use instead of the more costlycommercial iodized salt. In these areas the control ofiodine deficiency disorders is difficult and in somecases children are still born with cretinism.
IDD and Geochemistry of Iodinein Guizhou Province, China
Guizhou Province in southwest China is a mountainousprovince enriched with limestone and coal and is farfrom the sea, with the area of 174,700 km2 and the pop-ulation of 40 million. There are 87 counties and citiesin Guizhou Province, including 36 endemic fluorosiscounties with 10 million patients. IDD was prevalentin 57 counties in the southwest of the province. In1982, there were 2.09 million patients suffered fromendemic goiter, and 0.21 million cretinism patients insome endemic areas (Prevention of endemic diseasesfor forty years in China, 1990).
In Guizhou Province there were no IDD areas in theendemic fluorosis areas and no fluorosis areas in theendemic IDD areas. The reasons for this phenomenonare still not clear. Though one explanation may be thedifference in the distribution of coal resources, coaluse patterns and habits, the main food crops, and thebedrock. Communities using high-iodine coals appearto have lower incidence of IDD than communitiesusing wood as their main energy source (Wang et al.,2004b).

314 Z. Baoshan et al.
Medical Geology of Arsenic in China
The Chinese people long ago discovered the arsenic-containing minerals realgar and orpiment and appliedthem in traditional medicine. Production of arsenicby arsenopyrite calcination method was also foundso early that some historical and literary works hadrecorded a lot of suicide and murder cases usingarsenic. The Shimen Arsenic mine in Hunan Provinceis the largest arsenic mine in China and has been minedfor at least 1,500 years.
Arsenosis caused by drinking high-arsenic ground-water has been common in dry areas of Inner MongoliaAutonomous Region, Shanxi Province, and XinjiangAutonomous Region in China. In Taiwan, arsenosisand blackfoot disease have been common due to drink-ing high-arsenic water. Indoor combustion of high-arsenic coal under poor ventilation conditions, com-mon in some areas in Guizhou Province, has causedcoal combustion-type arsenosis. Large-scale mining ofnon-ferrous metals and gold has caused severe arseniccontamination and arsenic poisoning of miners andresidents in and around mining areas. Recently, thepotential hazards of arsenic poisoning by traditionalChinese medicine methods used to treat diseases havereceived a lot of attention.
Studies have shown that the high ratio of lung can-cer in workers of Gejiu tin mine in Yunnan Provincewas induced by the combined effects of arsenic andradon in the underground mine dusts. Studies on theexposure of arsenic and its relation with a variety ofcancers in the blackfoot disease area in Taiwan eventu-ally led to a worldwide correction on arsenic standardsin drinking water. In the research of the world’s onlycoal combustion-type arsenosis, coal with arsenic con-tents up to 3.5% with an unprecedented organic formhas been found. In China, the experiment on leukemiatreatment by using arsenic trioxide was a great successand significantly increased the cure rates of a kind ofleukemia.
Present Situation of Endemic Arsenosisin Mainland China
In accordance with a survey co-funded by the ChineseMinistry of Science and UNICEF completed in 2003,arsenosis from drinking was prevalent in 40 counties
or cities in eight provinces or municipalities and thepopulation exposed to arsenic concentrations in drink-ing water higher than 0.05 mg/L is more than 500,000people, including 7,821 people identified as arsenosispatients. Arsenosis from coal combustion was preva-lent in eight counties or cities in Guizhou Provinceand Shaanxi Province, where arsenic contents in coalhad been higher than 100 mg/kg, and coal was burnedwithout indoor chimneys (Jin et al., 2003).
A second survey conducted during 2003–2005 (Yuet al., 2007) indicated that the actual prevalence ofarsenosis from drinking water was 500,000–600,000people who were drinking water with arsenic contenthigher than 0.05 mg/L, and about 10,000 arseno-sis patients, including about 1,000 serious arsenosispatients.
In the above surveys, the diagnostic criterion in theinvestigation of arsenosis was “The diagnostic crite-ria of endemic arsenosis WS/T 211-2001” (Standardof diagnosis for endemic arsenism, 2009). These stan-dards require that arsenosis patients have an excessiveamount of arsenic exposure history and that thereare no other reasons for the skin pigmentation anddepigmentation or palmoplantar hyperkeratosis.
Arsenosis from Drinking Water in MainlandChina
Arsenosis in Xinjiang Uigur Autonomous Region
Drinking water arsenosis in mainland China wasfirst found in Xinjiang Autonomous Region and wasreported by Wang et al. (1982). The drinking waterarsenosis area in Xinjiang Autonomous Region islocated in the alluvial fan in the southwest JunggarBasin, an arid inland basin, and in the north of theTianshan Mountains. Along the east–west direction,there is a 250 km long zone of high-arsenic water fromwest of Ebi Lake to the east of the Manas River.
In the Xinjiang Autonomous Region, high-arsenicwater zones also form around natural perennial orseasonal water swamps or lakes. There are simi-lar phenomena around a number of artificial reser-voirs for agricultural irrigation purposes. The high-arsenic groundwater in Xinjiang Autonomous Regionis reduced groundwater, rich in humic acid, associatedwith methane, with high pH. High-arsenic groundwa-ter in Xinjiang Autonomous is usually high in fluorine,

Medical Geology in China: Then and Now 315
but the highest arsenic groundwater does not have thehighest fluoride content.
After finding arsenosis in drinking water in XinjiangAutonomous Region, the most affected villages weremoved to safe places, with low-arsenic water sup-ply systems. However, there are still villages witharsenic concentrations in drinking water higher than0.05 mg/L, with the maximum of 0.09 mg/L.
A number of investigations on the relationshipbetween arsenic concentrations in drinking water andratios of arsenosis in arsenosis areas were conductedby Wang Lianfang in Xinjiang Autonomous Region(Wang et al., 1982). Arsenosis areas in XinjiangAutonomous Region are located in very arid regions.Under the hot, dry weather conditions, the amount ofdrinking water of local residents is very large, withan average of 4 L per person per day. At such a highquantity of drinking water, no clinical arsenosis existswith the arsenic concentrations in drinking waterbelow 0.13 mg/L.
Arsenosis in Inner Mongolia Autonomous Region
There are two kinds of arsenosis in Inner Mongolia:one is induced by arsenic contamination of surfacewater and groundwater by high-arsenic minerals andthe other is induced by high-arsenic groundwater inarid inland rivers’ alluvial plains.
Chifeng City in Kosk Teng County in eastern InnerMongolia is arid and hot in summer and cold in win-ter. The arsenosis village is located on the slope of amountain with arsenopyrite deposits. Arsenic releasedfrom arsenopyrite weathering moved into groundwa-ter and formed high-arsenic springs in some placesand contaminated some wells of the village. It can beclearly observed that the closer the well, the higherlevel of arsenic in the well water. Years ago, the staffof a geological survey had been poisoned by mis-takenly drinking from a high-arsenic fountain. Basedon investigations, concentrations of arsenic in 34 wellwater samples in the village were in the range of 0.16–0.45 mg/L, with an average of 0.31 ± 0.21 mg/Land maximum of 0.45 mg/L. There were 22 minorarsenosis cases out of 45 people tested (Gao, 1990).
Drinking Water Arsenosis in Shanxi Province
In Shanxi Province, high-arsenic groundwater is dis-tributed along alluvial plains in arid inland basins,
including the Datong Basin in the north and theJinzhong Basin in central Shanxi Province. The aver-age depths of high-arsenic groundwater are in therange of 20–50 m, with the maximum of more than 100m. Concentrations of arsenic in well water in Heigadavillage in Yinshan County had reached 4.35 mg/L, thehighest record in mainland China, and this well hasbeen sealed.
High-Arsenic Drinking Water Related toBlackfoot Disease in Taiwan, China
In a confined area located at the southwestern coast ofTaiwan, there is a high prevalence of a unique periph-eral vascular disease (Tseng, 1989; Tseng, 2002). Thedisease is known as blackfoot disease (BFD) after itscharacteristic progression from numbness or coldnessof one or more extremities, to intermittent claudication,and finally to gangrene and spontaneous amputation(Tseng, 1989; Tseng, 2002). Extensive epidemiologic(Tseng, 1989) and pathological (Yeh and How, 1963)studies and water analyses (Chen et al., 1962; Kuo,1964) have been carried out since the 1950s and theetiology of BFD has been linked to the drinking ofartesian well water. Although arsenic has been sug-gested as the most probable cause of the disease, someinvestigators favored other potential etiologic factorssuch as humic substances (Lu et al., 1978). Despite thecontroversies over its real etiology, BFD has declineddramatically two to three decades after the implemen-tation of tap water supply and termination of the use ofgroundwater for drinking in the endemic areas (Tseng,2002).
Since the early 20th century, sporadic cases ofa strange disease involving the lower extremitieshave occurred, which was characterized by progres-sive blackish discoloration of the skin extending fromthe toes gradually upward toward the ankles (Tseng,1989; Tseng, 2002). The patients also suffered fromnumbness or coldness of the extremities and intermit-tent claudication before the development of gangrene.Ulceration might also be found in the patients. Thelesions might progress to spontaneous amputation insome cases or surgical amputation was required forsaving lives. In rare cases, the fingers might also beinvolved (Yeh and How, 1963).
Most of the patients resided in a confined arealocated along the southwestern coast of Taiwan.

316 Z. Baoshan et al.
More than 72% of the cases occurred in Hsueh-ChiaTownship and Pei-Men Village of Tai-Nan Countyand Pu-Tai Township and Yii-Chu Village of Chia-Yi County. These areas were called the “old endemicareas.” Some cases were also found in the so-callednew endemic areas located on the periphery of the “oldendemic areas.” These “new endemic areas” were con-fined to the counties of Yun-Ling, Chia-Yii, Tai-Nan,and Ping-Tung. A total of more than 1,600 cases hadbeen discovered up to 1980s. In a survey carried outfrom 1984 to 1985, a total of 1,220 prevalent cases(690 men and 530 women) were found in the “oldendemic areas.”
The prognosis of BFD is relatively poor after theonset of clinical symptoms. In a series of 1,300 cases,68% of the patients underwent spontaneous or surgi-cal amputation. Failure of the amputation wound toheal was common and reamputation rate was as highas 23.3%. The annual death rate of the cases was 4.84per 100 patient-years and the mean age at death wasabout 62 years (Lo et al., 1977).
Blackfoot disease is prevalent in alluvial plainsalong the southwest coast of Taiwan. The most seriousfour villages are located at the both sides of BazhangxiRiver flowing from the Central Mountains to the south-west coast. Blackfoot disease endemic area is near theocean, with high salinity of shallow groundwater thatis not suitable for drinking, and since the beginningof the last century deep artesian water resources havebeen utilized. Depths of the artesian water are gen-erally between 100 and 280 m. The artesian water isrich in organic lacustrine sediments, can ignite due tohigh methane content, and has a hydrogen sulfide odor.The concentrations of arsenic in the artesian water arehigher than 0.35 mg/L. All of the blackfoot patientshave histories of drinking artesian water. No new casesof blackfoot patients have occurred since the change ofwater sources in 1970s.
Extensive epidemiologic studies favor arsenic as themost probable cause (Tseng, 1989; Tseng et al., 1996,1997). The median arsenic concentration of the arte-sian well water in these BFD-hyperendemic villagesranged from 0.70 to 0.93 mg/L (Kuo, 1964; Chenet al., 1962), while the shallow well water in otherareas had arsenic contents between non-detectable and0.30 mg/L with a median of 0.04 mg/L (Chen et al.,1962). A survey of the arsenic contents of 83,563 wellsall over Taiwan showed that 29.1% of the wells inBFD-endemic areas had an arsenic content greater than
0.05 mg/L and 5.2% greater than 0.35 mg/L with thehighest value being 2.5 mg/L. In other areas of Taiwan,only 5.7% of the wells had an arsenic content greaterthan 0.05 mg/L and 0.3% greater than 0.35 mg/L (Loet al., 1977).
Because of the finding of high arsenic content inthe artesian well water, Tseng (1989) evaluated theassociation between the arsenic concentration in wellwater and the prevalence of BFD in the endemicvillages (Tseng et al., 1997). A dose–response rela-tionship between them was demonstrated in differentage groups. This study suggested that the prevalenceof BFD increased with increasing arsenic concentra-tions of the well water, which could not be explainedby the age difference (Tseng, 2002, 2005).
Arsenosis from Coal Combustion
Endemic arsenosis caused by indoor combustion ofhigh-arsenic coal was confirmed in Xingren County,Guizhou Province, China in 1977 (Jin, unpublished)then more new cases in Xingyi City, Anlong County(Zhou et al., 1993), Zhijin Country (Sun et al., 1984),and Kaiyang County (Ke, 1980), all in GuizhouProvince (Fig. 2), were reported (Yu et al., 2007; Zhenget al., 1996; Zeng et al., 1995). In 2004 Li Yue et al.reported similar arsenosis in south Shaanxi Province
Fig. 2 Location of endemic arsenosis area in Guizhou Province,China

Medical Geology in China: Then and Now 317
where local farmers burned “stone coal” with higharsenic contents in stoves without chimneys (Li et al.,2004; Liu et al., 2002).
From a survey completed in 2003, there were 142villages in Guizhou Province and Shaanxi Provinceusing coal containing arsenic higher than 100 mg/kg.More than 2,400 patients (most in Guizhou Province)were found out of nearly 31,000 people tested (Jinet al., 2003).
Coal has been produced and used in GuizhouProvince for the past 100 years. After the productionand utilization of high-As coal, arsenosis became anepidemic disease. The earliest-known arsenosis casewas found in 1953 and was called “Laizi disease,” thehigh-As coal was called “Laizi coal,” but the local resi-dents did not know that the so-called Laizi disease wascaused by arsenic exposure (Zheng et al., 1996, 1999).
All high-As coals belong to the upper layer of theLongtan Group and are located in shallow stratigraphicpositions. They are commonly high in ash and sulfurand are not considered worthy for commercial min-ing. However, many village people collect this coalfor everyday use. The majority of high-As coals werefound in areas of gold mineralization, but there area few high-As coals not located in the area of goldmineralization (Wang et al., 2006).
The practice of using high-As coals indoor withouta chimney and good ventilation leads to As pollutionof indoor air as well as pollution of crops and/or otherfoodstuff such as chili peppers which are preserved anddried indoors over the coal fires. The residents’ inges-tion of excessive As from polluted indoor air, food,and water was the major cause of arsenosis (Finkelmanet al., 1999).
The coals related to the arsenic poisoning have low,moderate, to high ash contents, 9–56 wt% (550◦Cdetermination), but are extremely enriched in arsenicand other trace elements. The coals have As concen-trations typically >100 ppm, commonly >1,000 ppm,and in a few selected cases >30,000 ppm (3 wt%) on awhole coal, as-determined basis. The coals that have3 wt% As are exceptional, as As contents that highare usually restricted to metalliferous samples from oredeposits. The highest concentration of As in coal was35,000 ppm with much of the arsenic in organic asso-ciation (Belkin et al., 1997). The coals are also highlyenriched in Sb (up to 370 ppm), Hg (up to 45 ppm), andAu (up to 570 ppb); U is also high in some samples (upto 65 ppm). An examination of the regional distribution
of trace element concentrations and general geochem-ical relationships documents the highly variable natureof trace element enrichment (Belkin et al., 2008).
Concentrations of As in coal vary sharply, even inthe same layer, for example, coal with several thousandmilligrams per kilogram As may be only a few metersaway from coal with only several hundred milligramsper kilogram and tens of meters away from coal witharsenic in the range of 10–20 mg/kg.
Zheng et al. (2005) have shown that the higher theAs content in the coal and the longer the coal is used,the higher the As in urine and hair and the higherthe incidence of the arsenosis. There is a good dose–response relationship between the As exposure and theratio of arsenosis and but it is much more complicatedthan that of drinking water arsenosis.
Arsenosis Induced by Mining
During the past century, because of growing demandof non-ferrous metals and their compounds, more andmore tailings and sludge have been generated by min-ing and smelting of these mineral resources and havebecome a source of serious arsenic pollution.
Almost all of the non-ferrous metal mines are asso-ciated with a large amount of arsenic. Exploitation ofevery ton of non-ferrous metals, the associated arsenicwill be more than 1 ton. For example, exploitation of1 ton of mercury will bring 8.36 tons arsenic into thesurface environment.
By the end of 2003, 1,392 million tons of arsenichad been extracted accompanied by the exploitation ofvarious non-ferrous metals and pyrite. Less than 30%of the arsenic has been recycled in the production pro-cess and about 100 million tons of arsenic moved intothe surface environment in the forms of tailings andwaste. Serious arsenic contamination has been causedby mismanagement, including 50, 25, and 10 tons ofarsenic pollutions in Guangxi Autonomous Region,Yunnan Province, and Hunan Province, respectively.
According to incomplete statistics, from 1974 to2005, due to arsenic contamination of drinking watersources by this residue, 9 cases of arsenosis events hadoccurred, resulting in about 2,300 arsenosis patientsand 6 deaths. Arsenic contaminated water and soilcaused three incidents resulting in more than 600arsenosis patients, 2 deaths, and the death of a largenumber of cattle and fish. Inadvertent use of arsenic

318 Z. Baoshan et al.
polluted sacks to load rice, 884 students and teachers ofa primary school had developed acute arsenosis. Somearsenic residues can release arsine when exposed withacid and water, and sometimes even when exposed tomoisture. In recent years, five arsinic-induced incidentshave occurred with nearly 200 patients and 5 deaths inYunnan Province, Guangxi Autonomous Region, andHebei Province. In total, there had been 17 arsenic-induced incidents with more than 3,000 patients and12 deaths from 1974 to 2005 (Xiao et al., 2008).
Medical Geology of Selenium
Selenium is essential to human health in trace amountsbut harmful in excess. The safe intake range forhumans is from 40 to 400 μg/day (WHO, 1996b; Yanget al., 1983). Food is the main source of selenium forhumans. Geology exerts a fundamental control on theconcentrations of selenium in soils, crops, and animals.Both the lowest and the highest concentrations and theflux of Se in the environment are reported in China(Wang and Gao, 2001). As a result, both endemicselenium deficiency and selenosis occurred in China.
Health Impacts of Selenium Deficiency
A low-Se belt, with Se contents in soil less than0.125 mg/kg, stretching from Heilongjiang Province
of Northeast China to Yunnan Province of southwestChina was identified during the intensive geochemi-cal surveys in 1980s in China. Lots of epidemiologicaldata on the human diseases such as Kashin-Beck dis-ease (KBD) and Keshan disease (KD) in this low-Sebelt were obtained from the 1960s to 1970s. The datashowed a close correlation between the concentrationof selenium in the environment and the prevalence ofthe two diseases (Figs. 3 and 4) (Li et al., 2009; Tanet al., 1989, 2002). KBD and KD, especially KD, werelater characterized as Se-responsive human diseases.
Selenium Deficiency and Keshan Disease (KD)
KD is a cardiovascular disease of unknown etiol-ogy and long common in northeast China. This dis-ease manifests as an acute insufficiency of the heartfunction or as a chronic moderate-to-severe heartenlargement and can result in death. The disease wasso severe in China that a special government officewas established to coordinate the nationwide effortsagainst the disease in the 1950s. In the 1950s and1960s, large-scale epidemiological investigations werelaunched in the provinces affected by Keshan dis-ease, including Heilongjiang, Jilin, Liaoning, Hebei,Shandong, Henan, Inner Mongolia, Shanxi, Shaanxi,Gansu, Sichuan, Yunnan, and Tibet. About eight mil-lion people lived in the affected villages in the country
Fig. 3 Soil seleniumdistribution in China (low-Se:<0.125 mg/kg; marginal:0.125–0.175 mg/kg;Se-adequate:0.175–3.0 mg/kg. Exi andZiyang are the Se-excessiveareas where local soil Secontent are higher than3.0 mg/kg and have inducedselenosis) (Li et al., 2009; Tanet al., 1989)

Medical Geology in China: Then and Now 319
Fig. 4 Areas distribution of KD and KBD in China (by disease-affected counties) (Tan et al., 2002)
and thousands of people died of Keshan disease everyyear.
During the field investigations in HeilongjiangProvince in 1968–1970, the interdisciplinary team vis-ited several horse farms. It was found that all the horsefarms located in the areas affected by Keshan diseasesuffered from an animal disease known as white mus-cle disease. At that time, white muscle disease hadbeen recognized as a myopathy of livestock due to defi-ciency of a trace element, selenium, and supplementsof Se to the livestock effectively prevented the disease(Muth et al., 1958; Muth, 1963). Given the under-standing that soil Se mainly existed in the forms ofselenate or selenite, two highly soluble salts, and hencecould be easily leached from the soils, water sampleswere collected from the affected and unaffected vil-lages in Keshan County for chemical analysis. Theresults indicated that Se contents in the samples fromthe affected areas were lower than those from the unaf-fected areas (<0.2 vs. >0.5 μg /L) (Tan et al., 1989).Based on the preliminary observations that (i) Keshandisease mainly occurred in the areas with strong leach-ing effect, (ii) Se could be leached from soils easily,
and (iii) white muscle disease existed with Keshan dis-ease in the affected areas, Se deficiency emerged asthe most likely cause of Keshan disease. When thisidea was presented in a workshop held in ShangzhiCounty in Heilongjiang in 1971, Se received greatattention, especially from a group of nutritionists fromthe Chinese Academy of Medical Sciences. Preventionexperiments were almost immediately launched to testthe hypothesis in the same year.
Preventive experiments supplementing Se in the dietwere conducted in most of the provinces affected byKeshan disease in the 1970s and 1980s. Selenium con-taining tablets or supplements were adopted to directlyincrease Se doses in the diets, or Se fertilizer wasapplied to the soil to increase the Se content in the food(Tan and Hu, 1989).
Selenium Deficiency and Kashin-Beck Disease(KDB)
Kashin-Beck disease is an endemic osteoarticular dis-order. Skeletal remains indicate that the disorder goes

320 Z. Baoshan et al.
Fig. 5 A Kashin-Beck disease patient with a person of normalheight
back at least to the 16th century and perhaps as faras the Bronze Age. In 1934, a Chinese scholar ZhangFengshu found many patients with joint swelling livingalong the railway from Shenyang City to TumenjiangCity, northeast China. In 1935, Takamori, a Japanesedoctor conducted research on those patients and provedthat the disease was KDB.
KBD is characterized by chronic disabling degen-erative osteoarthrosis affecting the peripheral jointsand the spine with apoptosis of the hyaline cartilagetissues. Impairment of movement in the extremitiesis commonly followed by bone development distur-bances such as shortened fingers and toes and in moreextreme cases, dwarfism (Tan and Hu, 1989) (Fig. 5).
Etiological Research on KD and KBD
Although there is a great deal of evidence to sup-port the theory that selenium deficiency induces KDand KBD, there are alternative theories. The evidencesupporting selenium deficiency include the following:
the areas in China where KD and KBD were preva-lent, selenium is significantly low in soil, food crops,surface water, and groundwater; in the KD and KBDareas, white muscle disease, proved to be induced byselenium deficiency, is prevalent in animals and thisdisease can be prevented by using feed supplement ofselenium; selenium contents in hair, serum, and urineof KD and KBD patients are significantly lower thanthe control group; and the incidence of KD and KBDin people can be greatly reduced by adding selenium totheir diets.
Views questioning selenium deficiency inducingKD and KBD include the following: in the low-selenium areas, not all of the soil, plants, surface water,and groundwater have low contents of selenium, andnot all hair, serum, and urine of the residents havelower selenium contents than those of adjacent areas;due to the relatively stable geological conditions in arather long period, ratios of diseases induced by geo-logical conditions should be stable in different years.However, the occurrence of both KD and KBD is muchhigher in some years than in others; although seleniumsupplementation was conducted in parts of the endemicareas, since 1987 the ratios of KD and KBD in allendemic areas have greatly decreased and the existenceof selenium in geological environment has not changedduring that period.
Based on the above-mentioned facts, multi-factormechanisms for the inducement of KD and KBD havebeen formed: in the areas of selenium deficiency, res-idents cannot get enough selenium from foodstuff anddrinking water, so the people are selenium deficient,with symptoms of low selenium contents in serum,urine, and hair; in the state of selenium deficiency, thesubjects are invaded by different groups of biologicalfactors, such as coxsackie virus or T-2 toxin producedby fusarium, and suffer from different diseases such asKD or KBD; cold, dampness, carbon monoxide poi-soning, and poor nutritional status may be reasons foracute KD and KBD.
Past and Present Hazards of KD and KBD
KD has been prevalent in 309 counties or cities in 15provinces in China, with a population of 76.7 millionpeople. From 1959 to 1983, the average annual deathsdue to KD were more than 1000. Based on clinicalsymptoms, KD is divided into acute KD, sub-acute

Medical Geology in China: Then and Now 321
KD, chronic KD, and latent KD. Death is mainlycaused by acute KD and sub-acute KD, and usuallypatients will die a half-day to 1 day after onset.
KD characteristically had outbreaks in certain years.In the years of 1959, 1964, and 1970, the incidencerates were two to three times the average. In the winterof 1943, there was an explosive KD outbreak in LongTown, Beian City, Heilongjiang Province, and about450 people from more than 2,000 families died within48 days, sometimes as many as 70–80 deaths a day.
There were 490 people living in DingjiaweiziVillage, Kedong County, Heilongjiang Province,where the epidemic KD occurred in 1944. By the endof 1949, the population had reduced to seven. Dueto the prevalence of KD in Buteha County in InnerMongolia in 1937, 14 out of total 24 families died.In Hebei Province, 68 out of 125 people living inSuojiayingzi Village, Guyuan County and 45 out of 51people living Shangchang Village, Fengning Countydied from KD in 1945. KD risks are more serious toyoung women. In 1952, only a 45-year-old womansurvived from KD in Xixin Village, Keshan County.Due to KD, four wives of a 60-year-old man and twowives of his brothers had died. Death from serious KDaccounted for 46.6% of deaths in KD prevalent areas.
KBD has been prevalent in 31 million people in7,840 villages of 297 counties in 14 provinces inChina. There were 1.8 million KBD patients in Chinain 1990. The ratios of KBD are 20 and 50% for res-idents and adolescent of endemic areas, respectively.In some particular areas, the ratios can reach 100%.The major hazard of KBD is the loss of ability towork (Prevention of endemic diseases for forty yearsin China, 1990).
Since the reform and opening of China, tremendouschanges have taken place in the social and economicstatus and nutritional and health status of the resi-dents. Mobility of the population has greatly increased.Sources of food and drinking water have been morediverse and the dependence on local drinking waterand food has been decreasing. Key factors leadingto the prevalence of endemic diseases have changedand because of the government’s financial support,KD and KBD in China are now basically under con-trol. There are now 3,000 latent KD patients and10,000 chronic KD patients in China and cases ofdeath from KD have been very rare. According to2008 data, there were 720,000 KBD patients in Chinaof which 28,000 patients were under the age of 13.
KBD usually occurs in the age of 7–8 years, andthe symptoms may continue for life. Therefore, ratiosin children under the age of 13 years old can betterreflect the prevalence of the disease. During the past20 years, KBD disease has been showing a decline andthere are only a small number of new patients in theTibet Autonomous Region, Qinghai Province, GansuProvince, and Shaanxi Province. KD and KBD mayno longer be a serious public health problem in China(Sun, 2009).
Selenium Deficiencies and Cancer
Low selenium levels were also observed in biologi-cal samples such as hair, urine, blood, or serum frompatients with various cancers, including liver can-cer, lung caner, galactophore cancer, esophagealcancer, nasopharyngeal cancer, cervical cancer, coloncancer, gastric cancer, cardiovascular disease, diabetesmellitus, cataract and hearing loss, arsenic-associatedskin lesions, and endemic goiter and cretinism. Itindicates that some relationships exist between thesediseases and selenium but that the low selenium lev-els may be a contributing factor though the exactcauses are not clear. Even so, many epidemiologicaland clinical studies have demonstrated that dietary sup-plementation of selenium could reduce the prevalenceof above diseases (Chen and Wong, 2009; Yu et al.,1990, 1997).
Selenosis in China
Intake of excessive selenium can cause selenosis inhuman and animals. Human selenosis in WesternHubei Province could be traced to 1923. A total of 477cases of human selenosis were reported from 1923 to1987 and 70% of the cases occurred between 1959 and1963. Ninety percent of the patients were located inthe towns of Shadi, Xintang, and Shuanghe in EnshiDistrict and the other patients were distributed betweenLaiwu Town in Enshi, Nantan, and Houmen Towns inBadong County and Shatuo Town in Xuanen County(National Environmental Protection Agency, 1994).
Among them, Yutangba in Shuanghe Town sufferedfrom the most serious endemic selenosis. Studies showthat the endemic selenosis in Western Hubei Province
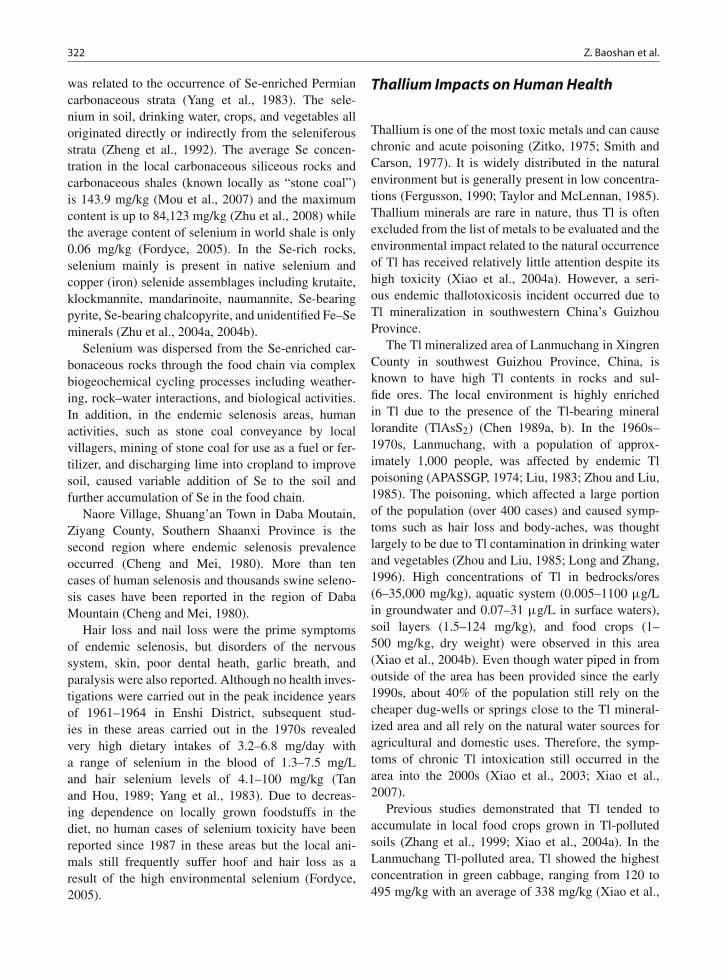
322 Z. Baoshan et al.
was related to the occurrence of Se-enriched Permiancarbonaceous strata (Yang et al., 1983). The sele-nium in soil, drinking water, crops, and vegetables alloriginated directly or indirectly from the seleniferousstrata (Zheng et al., 1992). The average Se concen-tration in the local carbonaceous siliceous rocks andcarbonaceous shales (known locally as “stone coal”)is 143.9 mg/kg (Mou et al., 2007) and the maximumcontent is up to 84,123 mg/kg (Zhu et al., 2008) whilethe average content of selenium in world shale is only0.06 mg/kg (Fordyce, 2005). In the Se-rich rocks,selenium mainly is present in native selenium andcopper (iron) selenide assemblages including krutaite,klockmannite, mandarinoite, naumannite, Se-bearingpyrite, Se-bearing chalcopyrite, and unidentified Fe–Seminerals (Zhu et al., 2004a, 2004b).
Selenium was dispersed from the Se-enriched car-bonaceous rocks through the food chain via complexbiogeochemical cycling processes including weather-ing, rock–water interactions, and biological activities.In addition, in the endemic selenosis areas, humanactivities, such as stone coal conveyance by localvillagers, mining of stone coal for use as a fuel or fer-tilizer, and discharging lime into cropland to improvesoil, caused variable addition of Se to the soil andfurther accumulation of Se in the food chain.
Naore Village, Shuang’an Town in Daba Moutain,Ziyang County, Southern Shaanxi Province is thesecond region where endemic selenosis prevalenceoccurred (Cheng and Mei, 1980). More than tencases of human selenosis and thousands swine seleno-sis cases have been reported in the region of DabaMountain (Cheng and Mei, 1980).
Hair loss and nail loss were the prime symptomsof endemic selenosis, but disorders of the nervoussystem, skin, poor dental heath, garlic breath, andparalysis were also reported. Although no health inves-tigations were carried out in the peak incidence yearsof 1961–1964 in Enshi District, subsequent stud-ies in these areas carried out in the 1970s revealedvery high dietary intakes of 3.2–6.8 mg/day witha range of selenium in the blood of 1.3–7.5 mg/Land hair selenium levels of 4.1–100 mg/kg (Tanand Hou, 1989; Yang et al., 1983). Due to decreas-ing dependence on locally grown foodstuffs in thediet, no human cases of selenium toxicity have beenreported since 1987 in these areas but the local ani-mals still frequently suffer hoof and hair loss as aresult of the high environmental selenium (Fordyce,2005).
Thallium Impacts on Human Health
Thallium is one of the most toxic metals and can causechronic and acute poisoning (Zitko, 1975; Smith andCarson, 1977). It is widely distributed in the naturalenvironment but is generally present in low concentra-tions (Fergusson, 1990; Taylor and McLennan, 1985).Thallium minerals are rare in nature, thus Tl is oftenexcluded from the list of metals to be evaluated and theenvironmental impact related to the natural occurrenceof Tl has received relatively little attention despite itshigh toxicity (Xiao et al., 2004a). However, a seri-ous endemic thallotoxicosis incident occurred due toTl mineralization in southwestern China’s GuizhouProvince.
The Tl mineralized area of Lanmuchang in XingrenCounty in southwest Guizhou Province, China, isknown to have high Tl contents in rocks and sul-fide ores. The local environment is highly enrichedin Tl due to the presence of the Tl-bearing minerallorandite (TlAsS2) (Chen 1989a, b). In the 1960s–1970s, Lanmuchang, with a population of approx-imately 1,000 people, was affected by endemic Tlpoisoning (APASSGP, 1974; Liu, 1983; Zhou and Liu,1985). The poisoning, which affected a large portionof the population (over 400 cases) and caused symp-toms such as hair loss and body-aches, was thoughtlargely to be due to Tl contamination in drinking waterand vegetables (Zhou and Liu, 1985; Long and Zhang,1996). High concentrations of Tl in bedrocks/ores(6–35,000 mg/kg), aquatic system (0.005–1100 μg/Lin groundwater and 0.07–31 μg/L in surface waters),soil layers (1.5–124 mg/kg), and food crops (1–500 mg/kg, dry weight) were observed in this area(Xiao et al., 2004b). Even though water piped in fromoutside of the area has been provided since the early1990s, about 40% of the population still rely on thecheaper dug-wells or springs close to the Tl mineral-ized area and all rely on the natural water sources foragricultural and domestic uses. Therefore, the symp-toms of chronic Tl intoxication still occurred in thearea into the 2000s (Xiao et al., 2003; Xiao et al.,2007).
Previous studies demonstrated that Tl tended toaccumulate in local food crops grown in Tl-pollutedsoils (Zhang et al., 1999; Xiao et al., 2004a). In theLanmuchang Tl-polluted area, Tl showed the highestconcentration in green cabbage, ranging from 120 to495 mg/kg with an average of 338 mg/kg (Xiao et al.,

Medical Geology in China: Then and Now 323
2004a). The high accumulation of Tl in the local foodcrops clearly implied that Tl in the soil can easilytransfer to crops. The daily intake of 1.9 mg/day Tlfrom consumption of the food crops was estimated forthe local adult inhabitant in Lanmuchang (Xiao et al.,2004b). This high ingestion rate of Tl is 1,000 timeshigher than the world average daily intake (2 μg/day)as indicated by Sabbioni et al. and also far abovethe element’s “oral reference dose” of 0.056 mg/day(Sabbioni et al., 1984).
Medical Geology of Cancer in China
Unusually high mortality from esophageal cancer inthe mountain areas in western Henan Province inHenan Province was 30.89 times that of YunnanProvince and 2.21 times that of China (EditorialCommittee for the Atlas of Cancer mortality inPeople’s Republic of China, 1979). Comparing thecontents of various elements in rock, soil, water, andfood in the region in Henan Province with the highratio of esophageal cancer with those of a controlregion, it was found that levels of cadmium and beryl-lium were higher than the control area and the level ofmolybdenum was lower than that of the control area.However, subsequent studies confirmed that this dif-ference was caused by different rock backgrounds andhas no link to the high incidence of esophageal can-cer. Esophageal cancer had been found in areas withcoal containing more harmful volatile organic compo-nents, but later it was found that in the control regionresidents were using the same coal. Some researchersbelieved that high incidences of esophageal cancerwere induced by the habits of eating sauerkraut andhot food, but could not confirm it.
Since the 1980s, due to the experiment ofesophageal cancer prevention by a large-scale sup-plement of selenium and vitamins, mortality rates ofesophageal cancer have dropped dramatically in thetest area. But at the same time, as the reform and open-ing up of China and the improvement of nutrition andhealth status, mortality rates of esophageal cancer inother areas in China have also significantly decreased.Therefore, it cannot be proven that the deficiency ofselenium and vitamins can induce high incidence ofesophageal cancer.
The ratio of nasopharyngeal cancer in GuangdongProvince has been 21.45 times that of Gansu Provinceand 3.79 times that of China. Nasopharyngeal cancer is
very rare in other parts of the world, but the incidencerate in some areas in Guangdong, Guangxi, and FujianProvinces has reached the high level of 20–50/100,000.This region happens to be a granite region rich inradioactive elements and Yangjiang City, GuangdongProvince has the highest radioactive background inChina. In this area, the distribution of high mortal-ities of nasopharyngeal cancer strongly matches thegranite distribution and the distribution of high-levelradioactive radon. Therefore some people thought thatatmospheric radioactive particles based on the high-level radioactive background had led to high incidenceof nasopharyngeal cancer. But in other areas with high-level radioactive backgrounds in the world, there isno high incidence of nasopharyngeal cancer, so thisassumption could not be confirmed (Ho, 1978; Loet al., 1996).
In accordance with the general law of the prevalenceof lung cancer in the development stage of industri-alization, the mortality of lung cancer in urban areasshould be higher than that in rural areas and thatin economically developed regions should be higherthan that in undeveloped areas. But mortalities oflung cancer in tin miners in Gejiu County and farm-ers in Xuanwei County, Yunnan Province, has beenvery high. A study confirmed that mortality of lungcancer in tin miners was related with mine dustsand radon in the air of underground workplace, andhigh mortality of lung cancer in farmers in XuanweiCounty was related with indoor heating and cookingwithout chimneys with coal containing high volatiles,which was also supported by the fact that the ratioof lung cancer of women was higher than men. Ithas been discovered recently that coal used in areasof high ratios of lung cancer contained high lev-els of silica particles, which were dispersed in theindoor air during the process of coal combustion, andlong-term living in such indoor environment wouldinduce high incidences of lung cancer (Large et al.,2009).
The relationship between selenium deficiency andvarious types of cancer has been of widespread concernin China. It is found that selenium levels in the bloodof cancer patients are lower than that of control popu-lation. However, in selenium deficiency areas in China(endemic KD and KBD areas), there is no type ofcancer with mortality higher than in other areas. Thisobservation supports the view that the low intake ofselenium does not cause cancer but in the developmentprocess of a cancer a large amount of selenium is

324 Z. Baoshan et al.
consumed or the excretion of selenium is acceleratedthus the lack of selenium in cancer patients is induced.
Generally, regional differences of cancer incidence,prevalence, and death rates do exist. The reasons forthese differences are various, including variation ingeological materials and geological process. However,determination of how geological materials and geo-logical processes impacts the course of cancer wouldrequire a large number of detailed multi-disciplinarycollaborative research projects.
Other Medical Geology Issues in China
Jiashi Disease
The main symptoms of Jiashi disease are extremelylow birth rate in disease areas, diarrhea, hepatomegaly,hypoglycemia, low blood pressure, and seasonal lowpotassium contents in blood. The disease is prevalentin Jiashi County and Yuepuhu County in the westernTarim Basin in Xinjiang Autonomous Region, withan area of about 500 km2. In the 1950s, there weremore than 200 farmers living in the Halahuqi Farm anddrinking local well water in the disease area and noneof women of childbearing age had been pregnant. In1975, they started to use drinking water from outsideand by 1983 almost all of women of childbearing agehad children (Wu et al., 1990).
The etiology of Jiashi disease is unclear and thetwo main hypotheses are “environmental geochem-istry cause” and “gossypol cause.” The environmentalgeochemistry cause is based on the observation thatJiashi disease is epidemic in a specific geochemi-cal environment. The prevalence of Jiashi disease isstrictly limited by landscapes and only occurs in thetail of the alluvial fan and the low-lying areas ofKezi River Alluvial Plain, where the land saliniza-tion is serious and drinking water is highly saline.This disease does not occur in the upper alluvial fanand high-lying areas of Kezi River Alluvial Plain, andareas of adjacent Yerqiang River flows parallel to KeziRiver.
Analysis of well water in endemic areas of Jiashidisease showed that salinity, sulfate, magnesium,sodium, and calcium contents, pH, and Eh were signif-icantly higher than non-endemic areas, but manganeseand zinc contents were lower than non-endemic area.
Salinity of the typical drinking water in the endemicareas was higher than 10 g/L. It was suggested that thespecial chemical composition of the drinking water ledto the prevalence of Jiashi disease (Shi and Sun, 2008).
The gossypol cause is based on the fact that localresidents had the habits of eating cottonseed oil whichcontaining 0.42–0.97% of gossypol. Excessive intakeof gossypol will poison male reproductive system andinduce sperm reduction or complete disappearance.Therefore, women of childbearing age were unable tobear children. The hypothesis of gossypol cause wasalso supported by the fact that the ratios of Jiashidisease increased with the increase of gossypol intake.
However, no Jiashi disease occurred in other areaswhere people were also eating cottonseed oil inXinjiang Autonomous Region. Since the 1980s, whenthe local people stopped eating cottonseed oil anddrinking the local water, Jiashi disease has beendespairing. But the real factor inducing this disease isstill unknown (Wu et al., 1990).
Pazi Disease
Pazi disease is a chronic, multiple, and symmetri-cal arthropathy of bone and joint prevalent in Dayi,Guanghan, Neijiang, Zizhong, and Ziyang Counties inthe western Sichuan Basin. Pazi disease and Kashin-Beck disease are similar in clinical symptoms, but dif-ferent in pathological changes and population regions.Symptoms are reduced if patients emigrate from theendemic area. Healthy people can suffer from this dis-ease if they move into the endemic area for as shortas short as 1 year. Etiology of the disease is stillunknown, and there are no targeted prevention andcontrol measures (Zhu et al., 1992).
Respiratory Problems
Excess or deficiency of trace elements is just oneaspect of medical geology. Exposure to mineral grainsin airborne dust can also cause health problems.Exposure to silica, asbestos, pyrite, clays, and otherminerals is known to cause various respiratory prob-lems. Tian et al. (2008) and Large et al. (2008) havepostulated that fine-grained silica mobilized by coal

Medical Geology in China: Then and Now 325
combustion may be the cause for the exceptionallyhigh incidence of lung cancer in Xuan Wei County,Yunnan Province. Derbyshire (2005) has discussed thehealth impacts of silica-rich dust blowing down theHexi corridor from northwest China to the populouseast coast.
Some 440,000 coal miners in China are suffer-ing from Coal Workers Pneumoconiosis (Black LungDisease) and an estimated 140,000 minors have diedof this problem since the 1950s (www.people.com.cn;March 18, 2005). Huang et al. (2004) have demon-strated a strong correlation between the incidence ofblack lung disease in the United States and the amountof pyrite in the coal. This finding indicates that reducedexposure to respirable pyrite should reduce the inci-dence of black lung disease.
References
Adolph WH, Ch’en Shen-Chao (1930) Iodine in nutrition inNorth China. Chin J Physiol 1(4):437–448.
APASSGP (Autonomous Prefecture Anti-epidemic Stationof Southwest Guizhou Province, Environmental GeologyLaboratory, Institute of Geochemistry, Chinese Academy ofSciences), 1974, Thallium enrichment in an ecological cir-culation – a case report of natural thallotoxicosis. EnvironHealth 2:12–15 (in Chinese).
Belkin HE, Zheng B, Zhou D, Finkelman RB (1997) Preliminaryresults on the Geochemistry and Mineralogy of Arsenicin Mineralized Coals from Endemic Arsenosis in GuizhouProvince, P.R. China: Proceedings of the Fourteenth AnnualInternational Pittsburgh Coal Conference and Workshop.CD-ROM p. 1–20.
Belkin HE, Zheng B, Zhou D, Finkelman RB (2008) Chronicarsenic poisoning from domestic combustion of coal in ruralChina: A case study of the relationship between earth materi-als and human health. In B de Vivo, HE Belkin, A Lima (ed)Environmental Geochemistry: Site Characterization, DataAnalysis and Case Histories (Chapter 17, pp. 401–426).Amsterdam: Elsevier.
Chao Yuanfang (610) Zhu Bing Yuan Hou Lun.Chen D (1989a) Discovery and research of lorandite in China.
Acta Mineralogica Sinica 9:141–142 (in Chinese withEnglish abstract).
Chen D (1989b) Discovery of Tl ore bodies associated witha mercury ore deposit and its mineralization mechanism.J Guizhou Inst Technol 18:1–19 (in Chinese with Englishabstract).
Chen KP, Wu HY, Wu TC (1962) Epidemiologic studies onblackfoot disease in Taiwan: III. Physicochemical character-istics of drinking water in endemic blackfoot disease areas.Memoirs College Med Natl Taiwan Univ 8:115–129.
Chen TF, Wong YS (2009) Selenocystine induces reactive oxy-gen species- mediated apoptosis in human cancer cells.Biomed Pharmacother 63:105–113.
Cheng JY Mei ZQ (1980) Initial investigation on selenosisregion in Ziyang County, Shannxi Province. Shaanxi J AgriSci 6:17–20 (in Chinese with English abstract).
Derbyshire E (2005) Natural aerosolic mineral dusts and humanhealth. In Selinus O, Alloway BJ, Centeno JA, FinkelmanRB, Fuge R, Lindh U, Smedley P (eds). (2005) Essentialsof Medical Geology Impacts of the Natural Environment onPublic Health, Elsevier Academic Press, 459–480.
Editorial Committee for the Atlas of Cancer mortality inPeople’s Republic of China (1979) Atlas of Cancer mor-tality in the People’s Republic of China. China Map Press.Shanghai, China (in Chinese with English abstract).
Fergusson JE (1990) The heavy elements: chemistry, environ-mental impact and health effects (614 p). Oxford: PergamonPress.
Finkelman RB, Belkin HE, Zheng B (1999). Health impacts ofdomestic coal use in China. Proceedings National Academyof Science, USA. 96, p 3427–3431.
Finkelman RB, Orem W, Castranova V et al. (2002) Healthimpacts of coal and coal use: possible solutions. Int J CoalGeol 50(4):425–443.
Fordyce F (2005) Selenium deficiency and toxicity in theenvironment. In O Selinus, BJ Alloway, JA Centeno, RBFinkelman, R Fuge, U Lindh, Smedley P (eds) (2005)Essentials of Medical Geology Impacts of the NaturalEnvironment on Public Health (pp. 373–415). ElsevierAcademic Press.
Gao H (1990) First discovery of endemic arsenosis in InnerMongolia Autonomous Region. Research on EndemicDisease Prevention in Inner Mongolia Autonomous Region15 (4): 1(in Chinese).
Ge Hong (284–AD364) Zhou Hou Bei Ji Fang.Ho JHC (1978) An epidemiologic and clinical study of
nasopharyngeal carcinoma. Int J Radiat Oncol Biol Phys 4:183–205.
Huang Di Nei Jing (475 BCE–AD 220) Author unknown.Huang X, Li W, Attfield MD, Nadas A, Frenkel K,
Finkelman RB (2004) Mapping and prediction of CoalWorkers’ Pneumoconiosis with bioavailable iron contentin bituminous coals. Environ Health Perspect 113(8):964–968.
Institute of Epidemiological Diseases in Xinjiang UigurAutonomous Region (1984) Progress in research on endemiccretinism. The People’s Press of Xinjiang Uigur AutonomousRegion, Urumuchi.
Ji Kang (223–262) Yang Sheng Lun (Healthy Theory).Jin Y, Liang C, He G, Cao J, Ma F, Wang H, Ying B, Ji R (2003)
A Study on distribution of endemic arsenism in China. J HygRes 32(6):519–540 (in Chinese with English abstract).
Ke C (1980) Investigation report of arsenosis caused by domesticcoal. J Environ Sci (in Chinese) 4:12–14.
Kuo TL (1964) Arsenic content of artesian well water in endemicarea of chronic arsenic poisoning. Reports of Instituteof Pathology, Taipei, Taiwan: National Taiwan UniversityCollege of Medicine, 4;20:7–13.
Large, David J, Kelly, Shona, Spiro, Baruch, Tian, Linwei,Longyi, Shao, Finkelman, Robert, Zhang, Mingquan,Somerfield, Chris, Plint, Steve, Ali, Yasmin, Zhou, Yiping(2009) Silica-volatile interaction and the geological cause ofthe Xuan Wei lung cancer epidemic. Environ Sci Tech DOI:10.1021/es902033j

326 Z. Baoshan et al.
Li R, Tan J, Wang W et al. (1982) Discussion on fluorosisinduced by foodstuff in Guizhou Province. Chin J Med62(7):425–428.
Li SJ, Li W, Hu X, Yang LS, Ruodeng X (2009) Soil seleniumconcentration and Kashin-Beck disease prevalence in Tibet,China. Front Environ Sci Eng China 3:62–68.
Li Y, Bai G, Zheng L et al. (2004) Investigation on the relationbetween coal pollution and endemic arsenosis in the south ofShaanxi Province. Chin J Endem Dis 23(6):262–265.
Liu An (180–123) BCE, Huai Nan Zi.Liu J (1983) Report of 4 cases of neuroetinopathy by chronic
thallium poisoning. Chin J Thaumat Occup Ophthal Dis 1:22–23 (in Chinese).
Liu J, Zheng B, Aposhian HV et al. (2002) Chronic poison-ing from burning high-arsenic-containing coal in Guizhou,China. Environ Health Persp 110(2):119–122.
Liu Z, Wu D, Chen K, Liu S, Li Z (1982) High fluoride saltinduced endemic fluorosis. Chin J Dis Prev 16(4):204–208.
Lo KW, Cheung ST, Leung SF, et al. (1996) Hypermethylationof the p16 gene in nasopharyngeal carcinoma. Cancer Res56:2721–2725.
Lo MC, Hsen YC, Lin BK (1977) Arsenic content of under-ground water in Taiwan: Second report. Taichung, Taiwan:Taiwan Provincial Institute of Environmental Sanitation1–21.
Long J, Zhang Z (1996) Studies on environmental effect ofthallium in exploration resources in southwestern area ofGuizhou. Conserv Utiliz Min Resour 3:47–49.
Lu FJ, Tsai MH, Ling KH (1978) Studies on fluorescent com-pounds in drinking water of areas endemic for blackfootdisease. 3. Isolation and identification of fluorescent com-pounds. J Formosan Med Assoc 77:68–76.
Lyth O (1946) Endemic fluorosis in Kweichow, China. TheLancet 16:233–235.
Lu Bu Wei etc. Circa 221 BCE, Lu Shi Chun Qiu.Ministry of Health, P.R.China (2009) http://www.moh.gov.cn/
publicfiles//business/htmlfiles/wsb/index.htmMou SH, Hu QT, Yan L (2007) Progress of researches on on
endemic selenosis in Enshi District, Hubei Province. Chin JPub Health 23(1):95–96 (in Chinese).
Muth OH (1963) White muscle disease, a selenium-responsivemyopathy. J Am Vet Med Assoc 142:272–277.
Muth OH, Oldfield JE, Remmert LF et al. (1958) Effects ofselenium and vitamin E on white muscle disease. Science128:1090.
National Environmental Protection Agency, Chinese Academyof Sciences, National Education Committee (eds) (1994) Theatlas of soil environmental background value in the people’sRepublic of China. Beijing: Chinese Environmental SciencePress. (In Chinese).
Prevention of endemic diseases for forty years in China (1990).Beijing: Chinese Environmental Science Press.
Read BE How GK (1927) The iodine, arsenic, iron, calcium andsulphur content of Chinese medical algae. Chin J Physiol1(2):99–108.
Sabbioni E, Ceotz L, Bignoli G (1984) Health and environmentalimplications of trace metals released from coal-fired powerplants: an assessment study of the situation in the EuropeanCommunity. Sci Total Environ 40:141–154.
Shen H, Zhang S, Liu S et al. (2007) Study on the geographic dis-tribution of national high water Iodine areas and the contours
of water Iodine in high Iodine areas. Chin J Endemiol26(6):658–661.
Shi T, Sun Y (2008) Analysis on the distribution of endemic dis-eases and the urgency of safe water supplies. West ExplorEng (5):82–84.
Smith IC, Carson BL (1977) Trace metals in the environment.Volume 1 – Thallium (p. 307). Michigan: Ann Arbor SciencePublishers Inc.
Sokoloff L (1989) The history of Kashin-Beck disease.New York State J Med 89:343–351.
Stanbury JB (1996) Iodine deficiency and Iodine deficiency dis-orders. In EE Ziegler, LJ Filer (eds) Present knowledge innutrition 7th edn. Washington D.C. USA. Wen Zhimei, ChenJunshi (Trans.) (1998) Modern Nutrition 7th edn. Beijing:People’s Medical publishing House.
Standard of diagnosis for endemic arsenism WS/T 211-2001http://www.moh.gov.cn/cmsresources/zwgkzt/wsbz/dfbbz/dfb/dfbwsbz/nr/149.gif
Sun B, Nie G, Zhang Y, Mai Z (1984) Investigation report ofa chronic arsenosis. Collection of data of the Sanitation andAnti-epidemic Station of Guizhou Province (in Chinese) 4,284–289.
Sun D (2009) Prospect of endemic disease control in China. ChinJ Endemiol 28(1):3–6.
Sun D, Zhao X, Chen X (2005) Investigation on endemicfluorosis in China. Beijing: People’s Health Press.
Sun Simiao (581–682) Qian Jin Yao Fang.Tan JA et al. (eds) (1989) The Atlas of Endemic Diseases
and Their Environments in the People’s Republic of China.Beijing: Science Press.
Tan JA, Hou S (1989) Environmental selenium and health prob-lems in China, In J Tan et al. (eds) Environmental Seleniumand Health. Beijing: People Health Press.
Tan JA, Zhu WY, Wang WY et al. (2002) Selenium in soil andendemic diseases in China. Sci Total Environ 284:227–235.
Taylor SR, McLennan SM (1985) The continental crust; itscomposition and evolution; an examination of the geochem-ical record preserved in sedimentary rocks (312 p.). Oxford:Blackwell Scientific Publishing.
Tian LW, Dai S F, Wang JF, Huang YC, Ho SC, Zhou Y, LucasD, Koshland CP (2008) Nanoquartz in Late Permian C1 coaland the high incidence of female lung cancer in the PearlRiver Origin area: a retrospective cohort study. BMC PublicHealth, 8, doi:10.1186/1471-2458-8-398.
Tseng CH (2002) An overview on peripheral vascular dis-ease in blackfoot disease hyperendemic villages in Taiwan.Angiology 53:529–537.
Tseng C-H (2005) Black foot disease and arsenic: A never-ending story. J Environ Sci Health 23:55–74.
Tseng CH, Chong CK, Chen CJ, Tai TY (1996) Dose-response relationship between peripheral vascular diseaseand ingested inorganic arsenic among residents in black-foot disease endemic villages in Taiwan. Atherosclerosis20:125–133.
Tseng CH, Chong CK, Chen CJ, Tai TY (1997) Lipid profileand peripheral vascular disease in arseniasis-hyperendemicvillages in Taiwan. Angiology 48:321–335.
Tseng WP (1989) Blackfoot disease in Taiwan: A 30-yearfollow-up study. Angiology 40:547–558.
Wang B, Zheng B, Zhai C, Yu G, Liu X (2004a) Relationshipbetween Fluorine in drinking water and dental health of
Medical Geology in China: Then and Now 327
residents in some large cities in China. Environ Int 30:1067–1073.
Wang B, Finkelman RB, Belkin HE, Palmer CA (2004b) A pos-sible health benefit of coal combustion. Abstracts of the 21stAnnual Meeting of the Society for Organic Petrology, Vol.21, p. 196–198.
Wang B, Zheng B, Wang H, Pinyakun, Tao Y (2005) Dentalcaries in fluorine exposure areas in China. Environ GeochemHealth 27(4):285–288.
Wang L, Liu H, Xu X et al. (1982) Investigation report onendemic chronic arsenosis areas. Prev Cont Res Bull 1(1):1–7 (in Chinese).
Wang M, Zheng B, Wang B, Li S, Wu D, Hu J (2006) Arsenicconcentrations in Chinese coals. Sci Total Environ 357:96–102.
Wang ZJ, Gao YX (2001) Biogeochemical cycling of seleniumin Chinese environments. Appl Geochem 16:1345–1351.
WHO (1996a) Guidelines for drinking water quality. HealthCriteria and Other Supporting Information. Geneva: WorldHealth Organization.
WHO (1996b) Trace Elements in Human Nutrition and Health.Geneva: World Health Organization.
Wu D, Zheng B, Wang A (2004) New understanding onthe source of coal combustion type fluorosis in GuizhouProvince. China J Endemiol 23(2):135–137.
Wu J, Deng G, Wang L et al. (1990) Discussions on etiology ofJiashi disease. J Environ Health 7(2):87–88 (in Chinese withEnglish abstract).
Xiao T, Boyle D, Guha J, Rouleau A, Hong Y, Zheng B (2003)Groundwater-related thallium transfer processes and theirimpacts on the ecosystem: Southwest Guizhou Province,China. Appl Geochem 18:675–691.
Xiao T, Guha J, Boyle D, Liu CQ, Chen J (2004a) Environmentalconcerns related to high thallium levels in soils and thal-lium uptake by plants in southwest Guizhou, China. Sci TotalEnviron 318:223–244.
Xiao T, Guha J, Boyle D, Liu CQ, Zheng B, Wilson GC, RouleauA, Chen J (2004b) Naturally occurring thallium: a hiddengeoenvironmental health hazard? Environ Int 30:501–507.
Xiao X, Chen T, Liao, Xiaoyong, Wu B, Yan X, Zhai L, XieH, Wang L (2008) Regional distribution of Arsenic con-tained minerals and Arsenic pollution in China. GeographRes 27(1):201–212 (in Chinese).
Xiao T, Guha J, Boyle D, Liu CQ, Zheng B, Wilson GC, RouleauA, Ning Z, He L (2007) Potential health risk in areas of highnatural concentrations of thallium and importance of urinescreening. Appl Geochem 22:919–929.
Yang G Wang, S Zhou R et al. (1983) Endemic selenium intoxi-cation of humans in China. Am J Clin Nutr 37:872–881.
Yeh S, How SW (1963) A pathological study on the blackfootdisease in Taiwan. Reports, Institute of Pathology, NationalTaiwan University, 14:25–73.
Yu G, Sun D, Zheng Y (2007) Health effects of exposure to nat-ural arsenic in groundwater and coal in China: An overviewof occurrence. Environ Health Persp 115(4):636–642.
Yu SY, Mao BL, Xiao P et al. (1990) Intervention trial withselenium for the prevention of lung cancer among tin min-
ers in Yunnan, China a pilot study. Biolog Trace Elem Res24:105–108.
Yu SY, Zhu YJ, Li WG (1997) Protective role of seleniumagainst hepatitis B virus and primary liver cancer in Qidong.Biolog Trace Elem Res 56:117–124.
Zeng W, Hou S, Ye S (1995) Skin changes by chronic arseno-sis in 395 patients with black foot disease Research reportfrom the Institute of Pathology, Taiwan National University.16:33–40 (in Chinese).
Zhang Hua (232–300) Bo Wu Zhi.Zhang Y (1986) Reasons for endemic fluorosis in areas supplied
with salt from Yushan salt Factory. Chin J Endemiol 5(1):72–73.
Zhang Y (1992) Research report on coal combustion type fluo-rosis in Fuling area. Chin J Endemiol 11(3):179–182.
Zhang Zihe circa (1156–1228) Ru Men Shi Qin.Zhang Z, Chen G, Zheng BG, Chen YC, Hu J (1999)
Contaminative markers of TI-mining district from the highcontents of Tl, Hg and As of urine hair and nail in thevillagers. China Environ Sci 19:481–484.
Zheng B (1992) Research on endemic fluorosis and indus-trial fluorine pollution (pp. 151–194). Beijing: ChineseEnvironmental Science Press.
Zheng B, Hong Y, Zhao W et al. (1992) The Se-rich carbona-ceous siliceous rock and endemic selenosis in south-westHubei, China. Chinese Sci Bull 37:1725–1729.
Zheng B, Yu X, Zhang J, Zhou D (1996) Environmentalgeochemistry of coal and endemic arsenism in SouthwestGuizhou, China. Abstracts of 30th International GeologicalCongress Beijing, China. p. 410.
Zheng B, Zhang J, Ding Z, Yu X, Wang A, Zhou D, Mao D, SuH (1999) Issues of health and disease relating to coal use insouthwestern China. Int J Coal Geol 40: 119–132.
Zheng, B, Wang B, Ding Z, Zhou D, Zhou Y, Zhou C, Chen C,Finkelman RB (2005) Endemic arsenosis caused by indoorcombustion of high-As coal in Guizhou Province, P.R. China,Environ Geochem Health 27:521–528.
Zhou DX, Liu DN (1985) Chronic thallium poisoning in a ruralarea of Guizhou Province. China. J Environ Health 48:14–18.
Zhou D, Liu D, Zhu S, Li B, Jin D, Zhou Y, Lu X, Ha X, ZhouC (1993) Investigation of chronic arsenism caused by pollu-tion of high arsenic coal. J Chin Prev Med (in Chinese withEnglish abstract) 27:147–150.
Zhu JM, Li SH, Zuo W et al. (2004a) Modes of occurrence ofselenium in black Se-rich rocks of Yutangba. Geochimica33:634–640 (in Chinese with English abstract).
Zhu JM, Zuo W, Liang XB et al. (2004b) Occurrence of nativeselenium in Yutangba and its environmental implications.Appl Geochem 19:461–467.
Zhu JM, Wang N, Li SH et al. (2008) Distribution and transportof selenium in Yutangba, China: Impact of human activities.Sci Total Environ 392:252–261.
Zhu Yuhui et al. (1992) Endemic Disease, China MedicalEncyclopedia. Shanghai: Shanghai Science and TechnologyPress.
Zitko V (1975) Toxicity and pollution potential of thallium. SciTotal Environ 4:185–192.

Medical Geology in Japan
Hisashi Nirei, Kunio Furuno, and Takashi Kusuda
Abstract The relationship between medical treat-ment and geology in Japan has an old history.However, the distribution of man-made strata deservesspecial mentioning in the geology of the JapaneseArchipelago. The population density of Japan is high,and the man-made strata abruptly increased due toconsequences of high economic growth, mass produc-tion, and mass consumption. Therefore this chapterdescribes the background and the different methodsused in solving environmental problems linked to man-made pollution, the geological environment, and healthin Japan.
Geo-pollution in Japan is an anthropogenic subter-ranean pollution. The geo-pollution does not mean“chemical hazards” caused by geological factors, thatis, the distribution of natural elements and constituentsand processes. Pollutants from geo-pollution sitesare often harmful for health. Therefore geo-pollutionis an integrated part of medical geology, studyingthe effects of our natural environment including theanthropogenic impact and processes in the naturalenvironment.
Also hot springs are included in the concept. Heavymetals and other constituents in hot spring waters canbe very useful for health but sometimes also toxicfor human health. Japan’s hot and cold springs havebeen utilized for bathing from ancient times mainlyfor medical and convalescent purposes. The uniquemethodologies for using springs have taken root as
H. Nirei (�)Japan Branch of the International Medical GeologyAssociation, 1277, Kamauchiya, Motoyahagi, Katori City,Chiba Prefecture, 287-0025 Japane-mail: [email protected]
part of Japanese culture. The word onsen is knownworldwide as a term that generally describes the cul-ture originating from the unique utilization of hot andcold springs in Japan. The different properties of hotsprings are described in this chapter.
Keywords Japan · Hot springs · Kogai ·Geo-pollution · Balneotherapy · Cadmium · Mercury ·Man-made strata
General Introduction
The relationship between medical treatment and geol-ogy in Japan has a surprisingly old history. Japan is anisland arc and each of the geological factors that cre-ated the current chain of volcanic islands of Japan hasspecial characteristics. Accordingly, each geologicalage created deposits such as metal deposits, petroleum,and coal. Mountain ranges formed around the seriesof volcanoes with altitudes of 2,000 m, reaching aheight above sea level of 3,000 m at the center of thearchipelago. Inland basins formed among the mountainranges. Volcanic ejecta covered the volcanoes. Coastalplains spread along the coastlines during the Holocene.Around the coastal plains and inland basins, multipleterraces and terrace deposits formed as the islands wereuplifted gradually from the Middle Pleistocene.
The distribution of man-made strata deserves spe-cial mentioning in the geology of the JapaneseArchipelago. The population density of Japan is high,and the man-made strata abruptly increased due toconsequences of high economic growth, mass produc-tion, and mass consumption. The space for factory andhomes were developed into not only plateaus but land
329O. Selinus et al. (eds.), Medical Geology, International Year of Planet Earth,DOI 10.1007/978-90-481-3430-4_12, © Springer Science+Business Media B.V. 2010

330 H. Nirei et al.
where filled into the ocean to provide waste disposalsites and surplus soil dump sites.
The lives of the Japanese people have been affectedby many elements from the natural resources of theJapanese Archipelago in metal mines, oil fields, natu-ral gas fields, hot springs, and groundwater. To discussJapan’s medical geology, one cannot ignore the diversegeological origins of the Japanese islands and nor theenormous human impact on the geological environ-ment (Minato et al., 1977).
Two major divisions can be made when consideringproblems relating to geology and health in Japan. Onedivision is the benefits and harmful effects on organ-isms from natural geology, starting with the healthof people. The other division is geo-pollution of thegeological environment caused by the pollution fromhuman activities.
After the collapse of the Tokugawa shogunate(1867–1868) and the opening of Japan to the world,the new Meiji government adopted the strategy fukokukyohei (“enrich the country, strengthen the military”)to catch up on the Western European powers, includ-ing accelerated mine development and smelting. Asa result, pollution increased. The development of theAshio copper mine is an example. Modern elementaryschool textbooks portray the actions of the nationalassemblyman Shozo Tanaka who directly petitionedthe Meiji emperor to protest the health afflictions ofmany farmers due to pollution despite being subjectto absolute imperial rule. Such pollution by primaryindustries continued through the end of World War II.Although health afflictions also occurred prior to andduring the war from the manufacture of gas bombs,no protests could be made under the imperial militaryregime.
After World War II, Japan’s standard of livingimproved from 1955 to 1975 due to high economicgrowth and income doubling. On the other hand,chemical hazards accompanying mass production andmass consumption endangered the lives of humans.Pollution was the typical hazard. In particular, courtbattles among victims, defendants, and the governmenthave continued for many years in regard to the fourmajor diseases caused by pollution in Japan result-ing from factory wastewater, mine wastewater, andtoxic discharges from industrial complexes that causedmany deaths and health victims. Although the gov-ernment reports continuous progress toward solutions,new judicial decisions reveal unresolved issues.
Further, health afflictions due to poisons releasedduring weapon manufacturing and industrial opera-tions were not taken seriously prior to and duringthe war. Under military rule there was no considera-tion regarding pollution of the geological environment.Toxic substances of that period and toxic substancesdischarged from factories during the high economicgrowth period directly after the end of World War IIstill remain in the environment today.
Two major environmental problems appeared in thewake of efforts to implement anti-pollution measures.First, when the discharge of toxic substances into theatmosphere, ocean, and rivers by factories such ascoastal industrial complexes were regulated, the toxicsubstances were buried in fields and mountains asindustrial waste. Toxic substances reside in Japan’sfields and mountains like time bombs.
Second, the mode of discharge of pollution haschanged as economic growth and concentrated pop-ulations in cities have driven changes in land utiliza-tion. Stock raising, which causes nitrate–nitrogen con-tamination of groundwater and offensive odors, wasforced by growing cities to move to remote locations.Drainage from livestock facilities was then administra-tively prohibited based on fears of increased water pol-lution in rivers, lakes, and marshes. Inevitably, subsur-face disposal was carried out. Groundwater pollutionby nitrate–nitrogen is occurring in many locations.
After the high economic growth period duringwhich the surface discharge by factories producingtoxic substances was deterred, the next generationof factories grouped in groundwater recharge regionssuch as inland plateaus and hilly regions to formleading-edge industries revolving around semiconduc-tor manufacturing. Then, local governments beganpermitting subsurface disposal of factory wastewaterin the competition to attract semiconductor manufac-turing and other enterprises. Volatile organic com-pounds (VOCs) such as tetrachloroethylene (PCE)and trichloroethylene (TCE), indispensable as cleaningsolutions for semiconductors, were disposed with fac-tory wastewater by subsurface disposal in groundwaterrecharge regions such as plateaus and hilly regions.Volatile organic compounds such as tetrachloroethy-lene and trichloroethylene have now been detected ingroundwater around inland industrial parks.
It has become important to investigate and cleangeological strata contaminated by volatile organiccompounds to provide clean groundwater resources

Medical Geology in Japan 331
and prevent health afflictions resulting from breathingpolluted ground air created when PCB, etc., in per-sistent organic pollutants (POPs) and volatile organiccompounds (VOCs) in the polluted strata ascend to theground surface. Medical geology (Selinus et al., 2005)also includes Japan’s radon hot springs and hydrogensulfide hot springs formed by the chain of volcanicislands. Although both substances in their gaseousforms are harmful to human bodies, radon hot springsare popular with terminal-stage cancer patients. Sucheffects are also topics of medical geology.
The concept of geo-pollution science and thegeo-stratigraphic unit investigation methods has beenestablished from the necessity to scientifically elu-cidate pollution hazards of the geological environ-ment and from a viewpoint of environmental resourceswhere a polluted environment is reclaimed to addvalue. This scientific concept is being adapted to theinvestigations of the pollution of soils and groundwa-ter, starting with the geo-pollution occurring in eachage and the geo-pollution from waste disposal sites.
Although investigations of geo-pollution have con-tributed to the development of environmental busi-nesses, negative contributions have also appearedbecause pollution problems became a major socialproblem when toxic substances caused serious healtheffects. Accordingly, analysis of the toxic substancescausing health effects is regarded as important.However, analysis measurements are being relied uponexcessively, and rumors are occurring relating to theextent of pollution. One aspect of such rumors isthe encouragement of pernicious environmental busi-nesses.
The determination of locations for sample collec-tion and the methods for collecting samples duringinvestigations fall short of clarifying the actual stateof the pollution. That is, collection locations are meshintersections of several meters. Further, methods forcollecting analysis samples in the depth directiondo so without regard to the behavior and state ofexistence of diverse contaminants. Uniform samplecollection methods with such an analysis measure-ment mentality have been used by the central govern-ment, therefore indicating trends of pollution diffusingand moving into deeper layers at geo-pollution sitesnationwide.
Hot springs represent an important benefit ofnatural geology related to human health deserv-ing special mention. The Japanese have effectively
utilized hot springs from ancient times for treat-ment, convalescence, and recreation. Therapeutichot springs for treatment include both bathing anddrinking.
Medical effects of therapeutic hot springs differ bythe spring quality type determined by chemical compo-nents in the water. Therapeutic springs provide lastingbodily warmth retention effects and health mainte-nance effects. Generally, the temperature of the hotspring water affects whether the hot spring is usedfor convalescence or recreation. Simple springs hav-ing high temperatures and clarity are preferred atlarge leisure resorts with hot spring facilities. Menand women have used public baths from ancientages with customarily mixed-gender bathing, and thatcustom continues today. Monkeys are also knownto enjoy hot springs. Hot springs are utilized alsofor treatment of racing horses. The existence of theJapanese Archipelago as a varying entity positionedon the continental margin has provided various metaldeposits from ancient geological ages. From ancienttimes, daimyo lords seeking power in each provinceneeded military capital to assert supremacy, drivingthe development of metal deposits starting with gold.For a time, Japan was world renown for its goldproduction, and even Marco Polo describes a coun-try of gold, Cipangu, in the travels of Marco Polo.However, health afflictions due to various heavy metalsreferred to as mineral pollution also have been knownfrom ancient times as side effects of metal resourcedevelopment.
Loess is carried from the Asian continent by pre-vailing westerlies to settle on the Japanese Archipelagolying in an arc on the eastern edge of the Asian conti-nent. Sedimentary strata of loess are confirmed in theterraces of the Japanese Islands, and this phenomenonof loess reaching Japan from the continent has contin-ued since geological ages. In recent years, the indus-trialization accompanying the economic developmentof east Asian countries is producing combustion soot,NOX, SOX, and the like. These pollutants are carried tothe Japanese Archipelago to afflict human health andobstruct the growth of trees.
The geological origins and the human activitiesachieving abrupt economic development in the vol-canic island arc forming the Japanese Archipelagodescribed above provide many medical geologicalresearch topics centered on the harmful effects ofgeo-pollution and the benefits of hot springs.

332 H. Nirei et al.
Concept of Geo-pollution
Geo-pollution is an anthropogenic subterranean pol-lution. The geo-pollution does not mean “chemicalhazards” caused by geological factors, that is, thedistribution of natural elements and constituents andprocesses. Pollutants from geo-pollution sites are oftenharmful for health. Therefore geo-pollution is an inte-grated part of medical geology, studying the effects ofour natural environment including the anthropogenicimpact and processes in the natural environment. Alsohot springs are included in the concept. Heavy metalsand other constituents in hot spring waters can be veryuseful for health but sometimes also toxic for humanhealth.
Compound Pollution from Three DifferentTypes of Pollution in the GeologicalEnvironment
“Geo-pollution” in Japan is a compound subterranean(underground) pollution comprising three types ofunderground pollution: “strata pollution,” e.g., topsoil pollution, “groundwater pollution,” and “groundair/gas pollution.” These three types have a complexinteraction with each other. Most geo-pollution casesare not only contained within surface strata such asman-made strata or top soil layers, but also the pollu-tants usually spread into deeper layers. Consequently,an examination and cleanup of a single medium is notsufficient to solve the problem (Fig. 1) (Nirei et al.,1994).
Strata Pollution
Strata pollution typically involves heavy metals(e.g., lead, cadmium, hexavalent chromium, arsenic),volatile organic compounds (VOCs, such as tetra-chloroethylene (PCE), and trichloroethylene (TCE)),agricultural chemicals, and dioxins. Heavy metalpollution is often found in former sites of chem-ical factories or plating factories in urban areasand near waste disposal sites or old mines in sub-urbs. Organochlorinated substances once used in largequantity as a degreasing solvent and cleaner bysemiconductor factories, mechanical manufacturing,
Fig. 1 Schematic model of geo-pollution
and metal processing are found in the areas near thosefacilities all over Japan. Pollution with agriculturalchemicals is common in golf courses as well as inthe areas adjacent to farm land. These chemicals tendnot to stay in the surface layers including soil layersand regularly seep into groundwater in aquifer. Dioxinpollution occurs in the strata under and around wasteincineration facilities.
Groundwater Pollution
Groundwater pollution threatens one of the mostimportant water sources in our country. As is thecase of soil layer pollution, typical pollutants includeheavy metals, organochlorinated substances, and agri-cultural chemicals. There are many incidents of ele-vated nitrate–nitrogen levels in groundwater all overJapan, caused by excessive fertilization and drainagefrom livestock farming. Compared to other under-ground mediums, groundwater flows and moves thecontaminants much faster, spreading the pollution towider areas within a short period of time. Accordingly,groundwater pollution requires prompt determinationof pollution mechanisms to develop containment andcleanup plans in time.

Medical Geology in Japan 333
Ground-Air Pollution
Ground-air pollution occurs when pollutants such asorganochlorines, hydrocarbons, and methyl mercuryare volatilized and released from polluted surfacelayers and groundwater, and diffuse into ground airinside soil particles or in underground openings. Asevere case of ground-air pollution can even causeatmospheric pollution. In other cases, surface cropwas damaged or killed due to ground air pollutionwith methane released from landfills and natural gasfield.
Two Types of Investigation Methodsin Japan
Geo-stratigraphic Unit InvestigationMethod
This method investigates the geo-stratigraphic unit,chronological unit, and material unit where thepollution originates (pollution source unit contain-ing pollutants). In order to determine the pollu-tion source unit and geo-pollution mechanism, thismethod investigates the physical property of the pol-lutants as well as the relationship between chrono-logical unit and material unit. When taking samplesfor analysis, the geo-stratigraphic unit investigationmethod pays close attention to the unit boundariesas well as sedimentary structure within the geo-stratigraphic unit. This method elucidates the inter-relation between pollutants and the geo-stratigraphicunit and can ultimately determine the pollutionsource and strata pollution mechanisms (Nirei et al.,2008).
A Unit-Independent InvestigationMethod
A unit-independent investigation method (e.g., adoptedin Japanese Soil Contamination Countermeasure Act)takes analytical samples based on a predefined depth(such as 5 cm, 0.5 m, 1 m, 2 m,. . ., 10 m), withoutreference to pollution source units or unit boundaries.
This type of examination cannot determine the geo-pollution mechanisms and sometimes even fails tolocate the pollution source. Furthermore, the samplingand analysis methods are regulated and specified byeach manual, which does not take site-specific cir-cumstances into account. As a result, there are moreand more cases of secondary pollution where boringfor sample extraction causes further spreading of thepollution.
Important Role of Geo-Stratigraphic UnitInvestigation Method
Careful definition and description of the sequenceof deposition of man-made strata, alongside types ofmaterials, help to establish boundaries between unitsthat are crucial to the penetration of geo-pollutants andplanning of strategies for investigation and remedia-tion, i.e., geo-stratigraphic unit investigation methodof man-made strata on geo-pollution site. The methodcan prevent such incidents on investigation and reme-diation.
The Diagnostic Standard for Cleanupon the Geo-Pollution Sites
We conduct the assessment based on our Geo-pollutionRemediation Evaluation Standard. The standard ratesthe progress of remediation from level 0 (no examina-tion of geo-pollution conducted) to level 6 (completeremoval of pollution) (Table 1).
Each evaluation standard uses the environmentalquality standards for health in Japan and the geo-stratigraphic unit investigation method.
Environmental Quality Standardsfor Health in Japan
From the viewpoint of geo-pollution science in med-ical geology, we can give an explanation about envi-ronmental quality standards for health. The environ-mental quality standards are enacted by the BasicEnvironment Act. In other words, the environmen-tal quality standards for air, environmental quality

334 H. Nirei et al.
Table 1 Geo-pollution Remediation Evaluation Standard (defined by the geo-pollution control agency, Japan)
Eco-Level Phase Status Description
Black 0 Pre-investigation stage No investigation activities to determine if there is pollutionRed 1 Identification of pollution Investigation is conducted to determine the existence of
pollutionOrange 2 Investigation of pollution
mechanismInvestigation is in progress to determine pollution mechanism
Yellow 3 Determination of pollutionmechanism
Pollution mechanism is determined and verified with data
Bronze 4 Remediation in progress Pollution mechanism is determined, but pollutants are foundeither in soil, groundwater, or ground air or in higherconcentration than specified by the national environmentalquality standards
Silver 5 Partial completion of remediation Pollutants are still present, but their concentration is reduced tothe level that meets the national environmental qualitystandards
Gold 6 Complete removal of pollutants Pollutants are completely removed from the site
standards for water including groundwater, environ-mental quality standards for soil pollution, and envi-ronmental quality standards for noise are establishedas the standards to be appropriately followed to protecthuman health and conserve the living environment. Inparticular, what needs attention with respect to stratapollution that constitutes the concept of geo-pollutionis that there are two sets of quality standards; one isthe environmental quality standards for soil as per theBasic Environment Law versus the target substancesor quality standards as per the Soil ContaminationCountermeasures Act.
Each environmental quality standard may be basedon drinking water quality standards, except for envi-ronmental quality standards for air quality and envi-ronmental quality standards for noise.
Drinking Water Quality Standards(DWQS)
The fundamental principle of the current DWQS isbased on the standards that were revised in responseto the amendment to the guidelines for drinking waterquality of the World Health Organization (WHO),in May 2003, about 10 years after the previousamendment. Legally binding standards are shown inTable 2.
Table 2 Drinking water quality standards (mainly inorganicconstituents) (April 2009) (by Water Supply Law)
Items Standard values
Common bacteria 100 per 1 mLE. coli Not to be detectedCadmium 0.01 mg/LMercury 0.0005 mg/LSelenium 0.01 mg/LLead 0.01 mg/LArsenic 0.01 mg/LChromium (VI) 0.05 mg/LCyanide ion and cyanogens
chloride0.01 mg/L as
cyanideNitrate and nitrite 10 mg/L as nitrogenFluoride 0.8 mg/LBoron 1.0 mg/LZinc 1.0 mg/LAluminum 0.2 mg/LIron 0.3 mg/LCopper 1.0 mg/LSodium 200 mg/LManganese 0.05 mg/LChloride ion 200 mg/LCalcium, magnesium
(hardness)300 mg/L
Total residue 500 mg/LAnionic surface active
agent0.2 mg/L
pH Value 5.8 ∼ 8.6Taste Not abnormalOdor Not abnormalColor 5 degreeTurbidity 2 degree
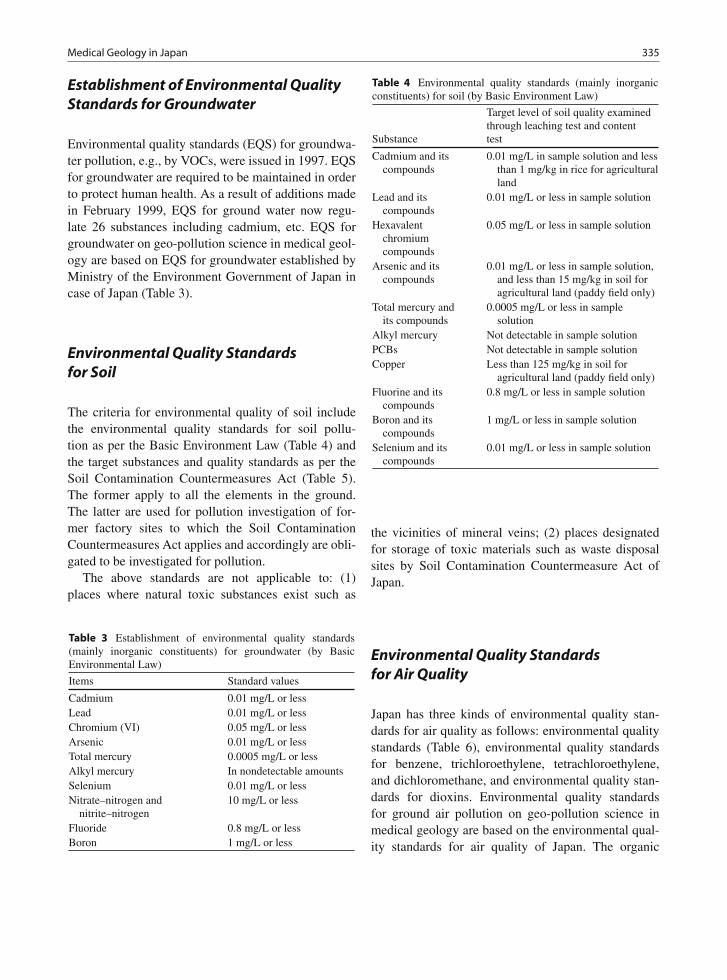
Medical Geology in Japan 335
Establishment of Environmental QualityStandards for Groundwater
Environmental quality standards (EQS) for groundwa-ter pollution, e.g., by VOCs, were issued in 1997. EQSfor groundwater are required to be maintained in orderto protect human health. As a result of additions madein February 1999, EQS for ground water now regu-late 26 substances including cadmium, etc. EQS forgroundwater on geo-pollution science in medical geol-ogy are based on EQS for groundwater established byMinistry of the Environment Government of Japan incase of Japan (Table 3).
Environmental Quality Standardsfor Soil
The criteria for environmental quality of soil includethe environmental quality standards for soil pollu-tion as per the Basic Environment Law (Table 4) andthe target substances and quality standards as per theSoil Contamination Countermeasures Act (Table 5).The former apply to all the elements in the ground.The latter are used for pollution investigation of for-mer factory sites to which the Soil ContaminationCountermeasures Act applies and accordingly are obli-gated to be investigated for pollution.
The above standards are not applicable to: (1)places where natural toxic substances exist such as
Table 3 Establishment of environmental quality standards(mainly inorganic constituents) for groundwater (by BasicEnvironmental Law)
Items Standard values
Cadmium 0.01 mg/L or lessLead 0.01 mg/L or lessChromium (VI) 0.05 mg/L or lessArsenic 0.01 mg/L or lessTotal mercury 0.0005 mg/L or lessAlkyl mercury In nondetectable amountsSelenium 0.01 mg/L or lessNitrate–nitrogen and
nitrite–nitrogen10 mg/L or less
Fluoride 0.8 mg/L or lessBoron 1 mg/L or less
Table 4 Environmental quality standards (mainly inorganicconstituents) for soil (by Basic Environment Law)
Substance
Target level of soil quality examinedthrough leaching test and contenttest
Cadmium and itscompounds
0.01 mg/L in sample solution and lessthan 1 mg/kg in rice for agriculturalland
Lead and itscompounds
0.01 mg/L or less in sample solution
Hexavalentchromiumcompounds
0.05 mg/L or less in sample solution
Arsenic and itscompounds
0.01 mg/L or less in sample solution,and less than 15 mg/kg in soil foragricultural land (paddy field only)
Total mercury andits compounds
0.0005 mg/L or less in samplesolution
Alkyl mercury Not detectable in sample solutionPCBs Not detectable in sample solutionCopper Less than 125 mg/kg in soil for
agricultural land (paddy field only)Fluorine and its
compounds0.8 mg/L or less in sample solution
Boron and itscompounds
1 mg/L or less in sample solution
Selenium and itscompounds
0.01 mg/L or less in sample solution
the vicinities of mineral veins; (2) places designatedfor storage of toxic materials such as waste disposalsites by Soil Contamination Countermeasure Act ofJapan.
Environmental Quality Standardsfor Air Quality
Japan has three kinds of environmental quality stan-dards for air quality as follows: environmental qualitystandards (Table 6), environmental quality standardsfor benzene, trichloroethylene, tetrachloroethylene,and dichloromethane, and environmental quality stan-dards for dioxins. Environmental quality standardsfor ground air pollution on geo-pollution science inmedical geology are based on the environmental qual-ity standards for air quality of Japan. The organic

336 H. Nirei et al.
Table 5 Target substances and quality standards (mainly inorganic constituents) for soil (by Soil Contamination CountermeasuresAct)
Designation standard (Article 5 of the Act)
Designated hazardous substances (Article 2 of the Act)
Soil Concentration Standard (riskfor direct ingestion) (leachingmethod by 1 mol/L HCL)
Soil Leachate Standard (riskof ingestion fromgroundwater, etc.)
Cadmium and its compounds Class 2(heavy metals, etc.)
150 mg/kg ≤0.01 mg/L
Hexavalent chromiumcompounds
250 mg/kg ≤0.05 mg/L
Total mercury and its compounds 15 mg/kg ≤0.0005 mg/LAlkyl mercury Less than detection limitSelenium and its compounds 150 mg/kg 0.01 mg/LLead and its compounds 150 mg/kg 0.01 mg/LArsenic and its compounds 150 mg/kg 0.01 mg/LFluorine and its compounds 4,000 mg/kg 0.8 mg/LBoron and its compounds 4,000 mg/kg 1 mg/LPCBOrganic phosphorus compounds
Class 3(agrochemicals and
PCBs)
Less than detection limitLess than detection limit
Table 6 Environmental quality standards for air (by Basic Environmental Law)
Substance Environmental conditions Measuring method
Sulfur dioxide The daily average for hourly values shall notexceed 0.04 ppm, and hourly values shall notexceed 0.1 ppm (notification on May 16, 1973)
Conductometric method or ultraviolet fluorescencemethod
Carbon monoxide The daily average for hourly values shall notexceed 10 ppm, and average of hourly values forany consecutive 8-hour period shall not exceed20 ppm (notification on May 8, 1973)
Nondispersive infrared analyzer method
Suspendedparticulate matter
The daily average for hourly values shall notexceed 0.10 mg/m3, and hourly values shall notexceed 0.20 mg/m3 (notification on May 8,1973)
Weight concentration measuring methods based onfiltration collection, or light scattering method;or piezoelectric microbalance method; orBeta-ray attenuation method that yields valueshaving a linear relation with the values of theabove methods
Nitrogen dioxide The daily average for hourly values shall be withinthe 0.04–0.06 ppm zone or below that zone(notification on July 11, 1978)
Colorimetry employing Saltzman reagent (withSaltzman’s coefficient being 0.84) orchemiluminescent method using ozone
Photochemicaloxidants
Hourly values shall not exceed 0.06 ppm(notification on May 8, 1973)
Absorption spectrophotometry using a neutralpotassium iodide solution; coulometry;ultraviolet absorption spectrometry; orchemiluminescent method using ethylene
pollutant standards are not covered here because theyare purely anthropogenic.
Suspended particulate matter is defined as airborneparticles with a diameter smaller than or equal to10 μm. Photochemical oxidants are oxidizing sub-stances such as ozone and peroxiacetyl nitrateproduced by photochemical reactions by BasicEnvironmental Law.
Some Problems on EnvironmentalQuality Standards of Japan from the ViewPoint of Medical Geology
Japan’s environmental quality standards for ground-water and for soil are based on Japan’s drinking waterquality standards (DWQS). DWQS is the standard

Medical Geology in Japan 337
that was revised in response to the amendment ofthe guidelines for drinking water quality of the WorldHealth Organization (WHO). In other words, as theJapanese EQS for ground water and for soil basicallyuse the DWQS. The EQS for groundwater and for soilare often revised according to the amendment on theguideline of WHO.
In terms of medical geology, using the uniformlyrevised system of quality standard has posed a limit onmaintaining the lifestyle of the people who have livedin the Japanese archipelago. This may be shown in thefollowing examples: Although the upper limit of fluo-rine and its compounds specified by the environmentalquality standards is 0.8 mg/L or less, the typical con-centration may be 1.3 mg/L or more in the seawater insome areas.
Although the upper limit of boron and its com-pounds specified by the environmental quality stan-dards for groundwater and for soil pollution is 1 mg/Lor less, they may exist in concentration of 3–4 mg/L inthe seawater and also in the river water or groundwater.
In addition, since the Japanese archipelago is vol-canic, there are many areas where the concentrationof arsenic exceeds the environmental quality standardsfor groundwater or for soil pollution for arsenic. Thoseelements are major ones that enhance the medicaleffects of a hot spa.
On the other hand, there is no risk evaluation forcomposite pollution of hazardous elements. The stan-dard values tend to be used for economic benefits suchas sale of land because the health risk of a singleelement is emphasized in the environmental standard.
Furthermore, since the pollution investiga-tion method specified by the Soil ContaminationCountermeasures Act of Japan is based on an unit-independent investigation method [e.g., sample foranalysis is taken based on specified depth (such as5 cm, 0.5 m, 1 m, 2 m . . . 10 m], without reference topollution source units or unit boundaries, no preciseevaluation of pollution can be made. Therefore, nopollution remediation evaluation can be made by thediagnostic standard for cleanup on the geo-pollutionsites. Economic evaluations related to pollution reme-diation also turn out to be insufficiently supported byscientific facts.
As “geo-pollution” is a compound subsurface pol-lution comprised of three types of underground pollu-tion: “strata pollution,” i.e., top soil pollution, “ground-water pollution,” and “ground air/gas pollution,” the
environmental quality standards for air, environmen-tal quality standards for water including groundwater,and environmental quality standards for soil pollutionshould be comprehensively checked and evaluated toprotect human health.
Specific Health Problems by ChemicalToxic Materials in Japan
Four Severe Health Problems in JapaneseHistory, Kogai
Kogai
The word “kogai” is used in Japan. Although diffi-cult to define, Japanese dictionary “Kojien” (1973)defines kogai as “a man-made disaster suffered byregional inhabitants caused by activities of private andpublic enterprises.” According to Miyamoto (1970),“Although the word ‘kogai’ has been used since themiddle of the Meiji era in laws and ordinances, cit-izens were not familiar with the word. Factories ofheavy and chemical industries were constructed suc-cessively from the 1950s and the population becameconcentrated in major metropolitan areas of Japan’spacific coast. Kogai occurred explosively during thisindustrialization and urbanization.” Kogai is written bythe characters koh, which means public, and gai, whichmeans harm (thus, “public pollution”). Although kogaidoes harm health by pollution, wrongdoers and victimsalways exist in all cases of kogai. On this point, thephrase “public pollution” does not fit.
The History of Kogai
After the Meiji Restoration, the Ashio Copper Mine(Tochigi Prefecture) was privatized, and mineral pol-lution caused harm in the Watarase River basin. Fuelduring smelting caused smoke exhaust, mining pollu-tion gases (having a main component of sulfur diox-ide) were produced during the smelting, and drainageincluded mineral pollution (having a main componentof metal ions such as copper ions). These contaminantscaused considerable harm in the nearby environment.Mountains were stripped, ayu fish of the WataraseRiver died in large numbers (1885), rice plants began

338 H. Nirei et al.
to die where they stood, and the farmers revolted.Shozo Tanaka is famous for actively leading the farm-ers’ movement at this time. Later, this movementwould be referred to as the origin of Japan’s kogaimovement.
The Seven Major Types of Kogai
The Basic Law for Environmental Pollution estab-lished the following seven items which are referred toas the Seven Major Types of Kogai (air pollution, waterpollution, soil pollution, noise, vibrations, offensiveodors and land subsidence).
The Four Big Kogai
The following are general remarks regarding the so-called Four Big Kogai.
The Minamata Disease
Minamata Bay in Kumamoto Prefecture (methyl mer-cury: water pollution, strata pollution, and the fish foodchain).
Details of the occurrence: The Minamata dis-ease is a neurological syndrome suffered by ahuman from his intake of methyl mercury originat-ing from inorganic mercury (mercury sulfate) used bya Japanese Nitrogenous Fertilizer Company (presentChisso Corporation) as a catalyzer for acetaldehydeproduction. The disease is considered to be causedby liquid waste dumped into the ocean by this com-pany. Unnatural deaths of cats and crows occurredaround the Minamata Bay in Kumamoto Prefecture.Thereafter, inhabitants reported neurological symp-toms and deaths occurred.
Symptoms: Methyl mercury is not readily decom-posed in the human body and is deposited in innerorgans and the brain. In particular its accumulationin the brain causes various central neurological disor-ders such as perception disorder, motor disorder, gaitdisorder, impaired hearing, speech disorder, restrictedvision, and quadriplegia (Fig. 2). Because it is eas-ily absorbed and not readily discharged, methyl mer-cury is a highly bioaccumulative substance. In otherwords, even though its concentration in the water isvery small, it can be highly concentrated in fish andeventually toxicity will appear.
Fig. 2 An old fisherman of Minamata disease. The fingersabnormally became stiff. Dead in 1971. (Photographed byKuwabara Shisei in 1970)
For instance, it was reported that fish lived for 10 ofdays in a solution of low methyl mercury concentrationof 0.003–0.0003 mg/L without showing any harm buthad in its body an accumulated level of methyl mercuryseveral thousands of times higher than that in the water.Serious symptoms appeared in the fishermen and catsthat ate the fish.
Countermeasures: Production of acetaldehyde start-ed in 1932. Chisso stopped acetaldehyde production in1963 (Fig. 3).
The Kumamoto Minamata Disease trial relatedto health damage by methyl mercury intake startedin 1953 and still continues in 2009. The court thatexamined the Minamata disease case issued a rulingthat Chisso pays damages of 16–18 million yen toevery Minamata disease patient on March 20, 2009.But the case is not totally closed because there aregroups of patients who still continue the case againstthe Tokyo head office of Chisso or negotiate bythemselves with Chisso.
The Niigata Minamata Disease (Second MinamataDisease)
Agano River basin in Niigata Prefecture (methyl mer-cury: water pollution, strata pollution, and the fish foodchain)
The same ailments as the Minamata disease ofKumamoto Prefecture were confirmed downstream ofthe Agano River in Niigata Prefecture. The disease wastherefore referred to as the second Minamata disease.Methyl mercury flowing into the river accumulated infish and shellfish, accumulated in human bodies byingestion, and resulted in the disease.
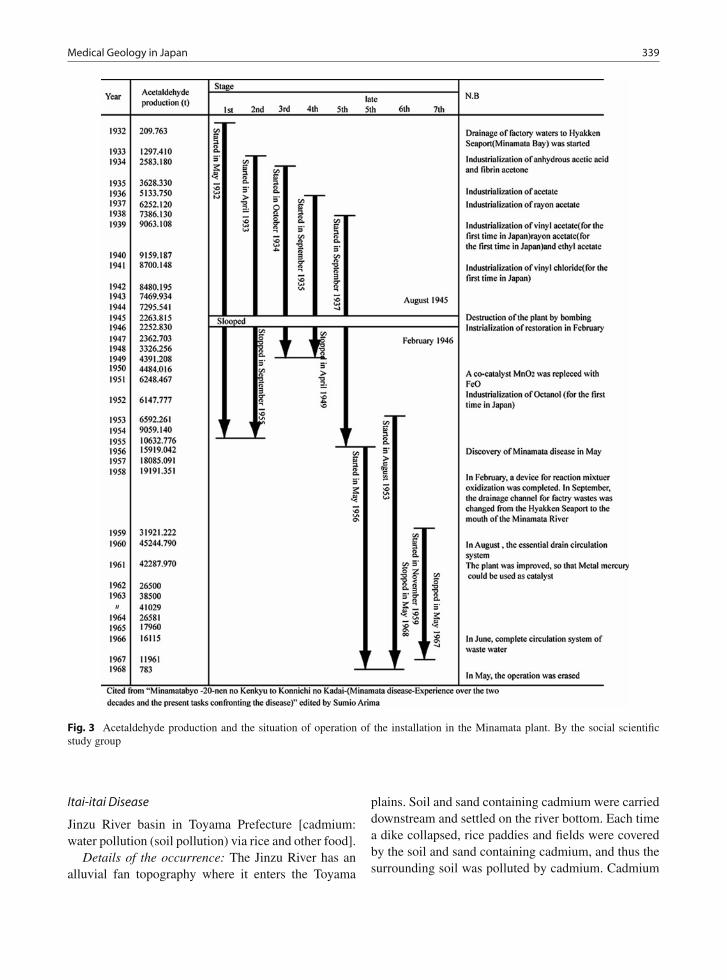
Medical Geology in Japan 339
Fig. 3 Acetaldehyde production and the situation of operation of the installation in the Minamata plant. By the social scientificstudy group
Itai-itai Disease
Jinzu River basin in Toyama Prefecture [cadmium:water pollution (soil pollution) via rice and other food].
Details of the occurrence: The Jinzu River has analluvial fan topography where it enters the Toyama
plains. Soil and sand containing cadmium were carrieddownstream and settled on the river bottom. Each timea dike collapsed, rice paddies and fields were coveredby the soil and sand containing cadmium, and thus thesurrounding soil was polluted by cadmium. Cadmium

340 H. Nirei et al.
accumulated in farm produce such as rice. Inhabitantsalso utilized the polluted river water as drinking waterand irrigation water. Cadmium thereby accumulatedin the bodies of inhabitants and resulted in the Itai-itaidisease.
Symptoms: The disease mainly affects women.Complaints begin with pain in all parts of the bodysuch as pain in the lower back, backaches, pain in thelimbs, arthralgia, and ache of the pubic bone. The paingradually worsens and finally cracks occur in bones.Then, bones break all over the body and the victim suf-fers, gasps, and debilitates until death, while lamenting“Itai-itai” which means, “It hurts, it hurts.” Becausebones lose calcium and become fragile, bone atro-phy progresses and bones all over the body becomefragile (Fig. 4). The body height shrinks 10–30 cm.One case is an autopsy which revealed bone breaksin 72 locations in the entire body. The disease locallydrew attention as a rare disease from around 1935 (Dr.Shigejirou Hagino). In 1957, the Itai-itai disease min-eral pollution theory (Noboru Hagino) was publishedand proposed that “the Itai-itai disease is brought aboutby heavy metals such as zinc and lead contained in thewater of the Jinzu River.” In 1961, the Itai-itai diseasecadmium theory was published by Noboru Hagino andKinichi Yoshioka.
Countermeasures: By provisions of the Farm LandLaw, removal of polluted soil having more than a cer-tain concentration, covering topsoil with soil, inspec-tion of cadmium concentrations of rice, designation
Fig. 4 69-year-old woman suffers from Itai-itai disease and hadlong-standing osteomalacia. This pelvic X-ray shows the sym-metrical radiolucent “Looser Zones”, which are characteristicosteomalacia, on the concave aspect of the femora (arrows).(Provided by Dr. Aoshima Keiko in 2010)
of regions, and destruction of rice having more thana certain concentration.
Each of the kogai diseases has been tried in court,and even today disputes continue among victims,enterprises, and the government regarding the scopeof victims, the scope of relief, and methods thereof.A prompt solution is desired in all cases as the ages ofthe victims increase. In addition to the Big-Four Kogai,many other trials are being held relating to kogai.
Yokkaichi Asthma (Atmospheric Pollution MainlyDue to Sulfur Oxide)
In 1960, the Yokkaichi Kombinat industrial complexwas constructed and began operations in the City ofYokkaichi in Mie Prefecture. This project was accom-panied by the increase of air pollution. Complaints ofdifficulties in breathing and throat pain were reported,and the number of asthma patients rapidly increased.Sulfur oxide (SOx) and nitrogen oxide (NOx) dis-charged by the industrial complex were identified ascauses.
The Important Role to Solve Kogaifrom the Viewpoint of Medical Geology
From a viewpoint of medical geology, it must be saidthat countermeasures encompassing the geosphere forsuch kogai have been insufficient.
Countermeasures are partial removal of pollutedstrata and covering polluted strata with unpollutedstrata and are not final solutions. The substances ofthe pollution remain and continue to pollute the geo-sphere. For such regions, it is necessary to re-elucidatethe mechanism of the geo-pollution, clean up the pol-lutants from the geosphere, and restore the geologicalenvironment.
To solve kogai problems, a medical geologicalviewpoint is very important to focus on substancescausing kogai, exposure accumulation of the body, andeffects on health.
It has recently become clear that problems involv-ing asbestos are causing serious harm. Kogai problems,including those involving asbestos and the like, havenot been concluded. Some arguments consider thatkogai problems are environmental problems and gener-ally cannot be resolved. Others point out that, contraryto recent environmental theories, that all inhabitantsare both wrongdoers and victims, the victims are

Medical Geology in Japan 341
consistently the weak, and the essence of the environ-mental problem has not changed from the age of kogai(Miyamoto, 2006).
The kogai research institutes and kogai centersin various places are now changing their names toenvironmental research institutes and environmentalresearch centers in national goverment and local gov-ernments.
Health Problems Due to Geo-Pollutionof Chemical Toxic Material in Japan
Geo-pollution sites with volatile organic compounds(VOCs), e.g., organic chlorinated substances, once
used in large quantity as a degreasing solvent andcleaner by semiconductor factories, metal process-ing, and laundering are found in areas close to thesefacilities all over Japan. VOCs used by the facilitiesare mainly dense non-aqueous phase liquid (DNAPL)such as tetrachloroethylene (PCE) and trichloroethy-lene (TCE). Geo-pollution caused by these can beseen in the polluted stratum plume, polluted ground-water plume, and the polluted ground air plume(Fig. 5).
Tetrachloroethylene (PCE) (EQS for ground water :0.01mg/L), trichloroethylene (TCE) (EQS for groundwater : 0.03 mg/L), and 1,1,1-trichloroethane (TCA)(EQS for ground water : 1mg/L) are dehalogenated andresults in the occurrence of many new pollutants such
Fig. 5 Polluted strata plume,polluted groundwater plumeand polluted ground air plumein VOCs (e.g., organicchlorinated substances)geo-pollution site

342 H. Nirei et al.
as dichloroethylene (DCE) and vinyl chloride (VC) atgeo-pollution sites. Vogel and MaCarty (1985) provedexperimentally the conversion of PCE to TCE, DCE,and VC by anaerobic biotransformation, i.e., PCE isthe oldest pollutant and VC the youngest, and alsoconversion of TCA to 1,1-dichloroethylene (1,1-DCE)(EQS for ground water : 0.02mg/L). As a result ofthe transformation ranging from PCE to VC, we cansay that the pollutions show four-dimensional pollut-ing behaviors that take time and space into account,regarding to each plume at site. The same transforma-tion is revealed in each pollution plume concerningstrata and groundwater (Fig. 6a,b) and ground air
(Fig. 7a,b) at the VOCs geo-pollution sites in Japan.It is important to understand that all the build up stagesof the transformation of CAHs (chlorinated aliphatichydrocarbons) and the toxic levels are different in eachtransformation stage.
There are two kinds of these pollution types. Onetype is that all the pores in sediments of strata are filledup. The other type is that the grains of sediments in thestrata are coated with DNAPL resulting in remainingor residual DNAPL among the grains. Sometimes thefront of the plume seeps out as spring water, causingsurface water pollution, resulting in deformed carps inthe pond water polluted by PCE and TCE (Fig. 8).
Fig. 6 (a) Plumes of pollutants built up from PCE and TCE in groundwater (Nirei et al., 1994); (b) plumes of pollutants built upfrom TCA in groundwater (Nirei et. al., 1994)
Fig. 7 (a) Plumes of pollutants built up from PCE and TCE in ground air (Nirei et al., 1994); (b) plumes of pollutants built up fromTCA in ground air (Nirei et al.,1994)

Medical Geology in Japan 343
Fig. 8 Deformed carps
Toxic gaseous CAHs in groundwater and on thegrain surfaces in the vadose zone lead to ground airpollution (Figs. 9 and 10), the gasses flow from thegeosphere to the atmosphere during low pressure, e.g.,when typhoons affect geo-pollution sites. Some typesof flies love to inhale TCE gas (EQS for air: 0.2mg/m3)resulting in death.
Breathing of Land
Polluted ground air may move upward to the surface,pollute the air where human beings are living and causehealth problems. Especially, the polluted ground aircomes from geo-pollution sites such as waste disposalsites, surplus soil-dumped sites, and industrial factorysites. In order to study how to monitor the pollution of
the air as well as climate variations, a monitoring sys-tem has been established near a landfill site of wastes.This is also for the purpose of managing geo-pollutionhazards. As the ground air flows are controlled by thegeo-stratigraphic units on solid material, we observethe solid material in the boring core samples indetail.
As a way of analyzing ground air flows, we havearranged a geo-pollution management system of obser-vation wells for monitoring groundwater and tubes formonitoring ground air pressures, and gas concentra-tions as well as gas sampling. The detailed relationbetween the induced airflow and atmospheric pumpingis not clarified, but we can show breathing with shortcycles (Fig. 9) and deep breathing of land with longcycles (Fig. 10).
We can also conclude that the PCE-polluted groundair (EQS for air: 0.2mg/m3), with high concentrationincreases from the PCE-contaminated regions to thesurface as the atmospheric pressure decreases during,for example, typhoons. (Fig. 11).
Hot Springs and Mineral Springs
Introduction of Spas
Japan’s hot and cold springs have been utilized forbathing from ancient times mainly for medical andconvalescent purposes. The unique methodologies forusing springs have taken root as part of Japanese
Fig. 9 The breathing of wastedisposal site with short cycle(Kinjo et al., 2006)

344 H. Nirei et al.
Fig. 10 The deep breathing of waste disposal site (Kinjo et al., 2006)
Fig. 11 Toxic gas blowing up from underground through a welltube at the time of a typhoon. The grass leaves bend upward bythe wind force of the toxic gas (Photo by Nirei)
culture. The word onsen is known worldwide as aterm that generally describes the culture originatingfrom the unique utilization of hot and cold springs inJapan.
The Hot Spring Law enacted in 1948 defines a hotspring with any of the following three conditions:
(1) Water welling up from the spa has a temperatureof at least 25◦C.
(2) The total amount of dissolved substances in 1 kg ofwater is at least 1 g (excluding natural gas havinghydrocarbons as the main component).
(3) The water contains at least the amount definedby law of at least 1 out of 18 types of inherentcomponent such as free carbon dioxide.
The History of Hot Springs
The Kojiki (712) and the Nihon Shoki (720) werecompiled in the eighth century and are known asJapan’s oldest books. Both of these volumes indi-cate that hot springs were utilized as early as theseventh century. Utilization of hot springs in thisperiod was mainly for purifying the bodies of per-sons with high status. However, probably peopleliving near spas also commonly made use of hotsprings.
Buddhism spread in the Kamakura and Nanbokuchoperiods (the twelfth to fourteenth centuries) andencouraged bathing to prevent illness and bring hap-piness. At Nara’s Todaiji Temple, for example, waterwas boiled in a large caldron to make a steam bath inwhich bathing was performed from the viewpoint ofmedical treatment by the priests, poor people, sick per-sons, prisoners, and others to prevent illness and bringhappiness. Such bathing for medical treatment, calledyusegyo in Japanese, developed into spa treatments. Itis said that spa treatments sought the medicinal effectssimilar to the Scandinavian sauna effects obtained bysweating in spas and stone baths (steam baths). Hot

Medical Geology in Japan 345
spring bathing further spread as a means for treatmentfrom the Muromachi period (the fourteenth to fifteenthcenturies). The Ikaho Onsen and the Kusatsu Onsenare two famous examples of modern resorts that beganas small hot spring towns providing spa treatments.
When the Tokugawa shogunate (1603–1867) andthe isolationism thereby ended, the new Meiji gov-ernment was born and the country was opened toEurope and the United States. Knowledge of west-ern medicine spread with the increased exposure toWestern European culture. Hot spring treatments wererediscovered from the viewpoint of western medicineby foreign doctors and notably hot spring medicalscientists from Germany. In the early Showa period(1926–1989), domestic research of hot spring treat-ments advanced and included the establishment ofhot springs research institutes at national universi-ties. Further, modes of traveling changed greatly dueto marked developments in transportation. As hotsprings began to be used for tourism as well as healthtreatments, the types of visitors to hot springs alsochanged.
The definition of hot springs was clarified with theenactment of the Hot Springs Law in 1948. The lawwas intended to protect hot springs, prevent disas-ters caused by the combustible natural gas from hotsprings, realize the proper utilization of hot springs,and contribute to the promotion of public welfare. Theofficial designation of national hot spring health resortsbegan in 1954 to promote recreational use. There are91 national hot spring health resorts as of 2008.
Although the number of registered spas was 1,518in 1962, the Furusato Sosei project from 1988 to1989 awarded grants of 100 million yen to municipalgovernments. Such grants encouraged municipal gov-ernments to develop hot springs and the number of hotsprings had grown to 3,139 in 2007.
Methodologies of Hot Springs
Development of Hot Spring Facilities
The names of places where hot springs are locatedinclude Deer Springs, Monkey Springs, and CraneSprings, suggesting that wild animals have utilizedthe medical effects of hot springs as well as humans.Accordingly, it is natural that humans also use naturalpools of hot water welling up from hot springs. Even
today, some spas utilize pools of hot water withoutpermanent tub walls.
Spas of ancient times were covered outdoor bathsused for bathing by inhabitants, religious uses, the con-valescence of warlords, and the treatment of injuries toDaimyo (feudal lords) and men.
From the Meiji period, inns boasting indoor bathsenjoyed a higher status than other inns without indoorbaths. Sightseeing trips and short-term stays increasedas spas developed, and bathers started to prefer innswith indoor baths. The development and enlargementof such inns led to the prosperity of modern spas(Fig. 12). During and after the period of rapid eco-nomic growth following the World War II, spas beganto be utilized more for tourism than for medical treat-ment. As tourism increased, open-air baths (rotenburo)resembling natural outdoor pools increased in additionto indoor bathing areas in response to the preferencesof customers. Public baths unrelated to the inn busi-ness also began installing outdoor baths. Footbathsalso became popular for bathing the feet up to theankles to treat fatigue.
Today, condominiums, villas, and other establish-ments are adding hot springs facilities, and the amountof hot water in the entire Japanese Archipelago isdrying up due to excessive development.
Hot Water Supply Methods
Hot water supply methods include the following twotypes:
Fig. 12 The model indoor hot springs resort Dogo Onsen(Arima type hot spring), Ehime Prefecture

346 H. Nirei et al.
(1) Flow-through type. The flow-through type refersto feeding a constant flow rate of hot spring waterinto the bathing container such that the same vol-ume overflows from the edge of the bath. In somenatural bathing tubs, fresh hot spring water entersfrom the bottom and sides.
(2) Circulated filtration type. In the circulated filtra-tion type, the hot spring water flows into thebathing container and is then drawn out fromthe bottom, passed through a filter, heater, etc.,before being once again fed into the bathing con-tainer from the side walls and/or from above. It iscommon to add a disinfectant in this method.
Although the spring source water normally is in areduced state directly after welling up (or being drawnup) from underground, artificial processing such as dis-infection and circulation changes the water into anoxidized state. Therefore, users favor immersion in afresh hot spring of the flow-through type to obtainthe intended hot spring effects. However, sanitationproblems such as microbe propagation arise in thecase where the replenishment of water in the bathingcontainer is poor due to difficulties securing the nec-essary amount of hot water. Recognized merits of thecirculation type include solving such problems andpreventing the exhaustion of hot water resources. Onthe other hand, microbe propagation may occur dueto poor management of facilities even when using thecirculation method. In one example in Hyuga City ofMiyazaki Prefecture in 2002, Legionella bacteria at ahot spring facility caused the death of seven people.
Bathing Customs
Today, although men and women generally bathe inseparate baths in Japan, mixed-gender bathing withstrangers in unsegregated baths is called konyoku. Thisancient custom continues in many spas. In bathingareas where hot water wells up and collects in a nat-ural pool, little thought is given to separating bathsfor men and women. Mixed bathing has been prac-ticed since ancient times where men and women, nakedexcept for a towel, bathe together without bathing suits(Fig. 13). This natural custom seems to have beenestablished without sexual awareness. Although menand women often can be seen enjoying conversationsat spas with unseparated bathing, the custom of mixed
Fig. 13 Men and women bathing together in the Yugura Onsen(Green tuff type hot spring), Oku-Aizu district, FukushimaPrefecture
bathing is not the norm nowadays, and many womenshy away from mixed bathing. Therefore, it is commonto provide bathing facilities just for women.
Balneotherapy
Medical effects of bathing in hot springs include phys-ical effects of heat, buoyancy, and pressure on thehuman body, effects from absorbing substances con-tained in the water through the skin; stimulation effectsfrom the substances absorbed into the body; and bod-ily modulation effects such as regulating the nervoussystem and adjusting internal secretion functions bystimulation from repeatedly entering the hot spring. Inaddition to bathing, one may visit a spa for a changeof air during the vacation season. Bathing methods athot springs may include immersing the body in waterbaths, being buried in warm sand baths, or relaxing insteam baths. Drinking the spring water is practiced insome locations but is not widespread.
Bathing
Bathing in Japan is carried out by immersing theunclothed body in a bathing container full of hot waterat about 40◦C. The bathing area is entered after wash-ing the body outside of the bath. Mental effects ofbathing include a sense of relaxation, and direct effectsinclude thermal effects from the hot water, physicaleffects, effects from substances contained in the water,and modulation effects.

Medical Geology in Japan 347
Bathing Methods
Bathing methods can be divided into (a) full immersionbathing, (b) partial bathing, and (c) special bathing.
Full Immersion Bathing
In this bathing method, the entire body is stretched outand immersed in a tub. Bathing is generally practicedin a hot spring of about 41◦C. Alternatively, bathingmay be performed for short durations at high temper-atures of 43◦C or more, or in baths of relatively lowtemperatures of about 37◦C for longer periods of time.Bathing may be performed in combination with jetdouches, whirlpool baths, bubble baths, and the liketo apply a flow of water to the body to obtain massageeffects by physical means.
Partial Bathing
In this method, part of the body is immersed in thehot spring, or water is poured over a part of the body.Partial baths include rinsing baths, waterfall baths,footbaths, and the like.
(i) Rinsing bath: The body is dowsed with hot watermainly prior to bathing. This method is performedto cleanse the body and prevent a rise in bloodpressure when bathing.
(ii) Waterfall bath: Hot water falls from above tostrike the shoulders, the neck, and the lower backto produce massage effects.
(iii) Footbath: Only the feet or portions of the legsbelow the knee are immersed in hot water. Effectsinclude improvement of blood flow.
Special Bathing
This method includes bathing not in hot water of ahot spring but in a mud bath, sand bath, bedrock bath(Fig. 14), or a hot spring steam bath (Fig. 15).
Fig. 14 Bedrock bathing facilities used by terminal-stage can-cer patients in the Tamagawa Onsen (Green tuff type hot spring),Akita Prefecture
Fig. 15 Treatment of hemorrhoids by moxibustion after treatment by steam bath at Miyanoshita, Hakone (Toto Bunso and Roka,1811)

348 H. Nirei et al.
The Tamagawa Onsen in Akita Prefecture is famousfor its bedrock bath and is utilized by terminal-stagecancer patients. Hokutolite ore of the Tamagawa Onsencontains radium. Some consider the radioactivity tobe effective for the treatment of cancer. Hokutolite isdesignated as a special natural treasure.
Contrary to the general opinion that exposure tolow concentrations of radiation should be avoided asmuch as possible, there is a theory (the hormesis effect)that low concentrations of radiation rather improveimmunity functions. However, neither the benefits ofradioactive springs on human bodies nor the hormesiseffect have been proven scientifically. It may be thatevaluations of low-concentration exposure may reverseviews on the risks and benefits of radioactive springs.Accordingly, contributions of research from a view-point of medical geology are becoming important forthe evaluation of low-concentration exposure in eachregion.
Hot spring steam bathing was practiced during theEdo period. Other treatments such as moxibustion forhemorrhoids and the like were performed in combina-tion with hot spring steam baths (Fig. 15).
Drinking
In some cases, drinking the water of hot springs mayproduce effects on the stomach and intestines or on theentire body. However, drinking is not possible in somecases depending on the symptoms and the spring qual-ities. Prior to drinking hot spring water, it is necessaryto confirm permits for drinking, ascertain indications,and contraindications for drinking, observe warnings,and drink only the appropriate amount of the appropri-ate hot spring.
Medical Effects of Bathing and Drinking
Indications and contraindications for hot spring waterare shown in Table 7
Hot Spring Types and Geology in Japan
Hot springs are classified into the following threemajor divisions by geological development of theJapanese Islands Archipelago (Fig. 16) (Sakai and Oki,1978)
The following reference numbers identify the spasin the text:
1 Arima, 2 Seikan Tunnel, 3 Moritake, 4 Isobe,5 Yashio, 6 Nakagawa, 7 Hakone, 8 Noboribetsu, 9Nagashima.
Arima Type Hot Springs
The Arima region (Fig. 16(1)) lies in the Rokkofault zone predominantly in the east–northeast/west–northwest directions where granodiorite of thePaleogene period (60 million years ago) intrudes intothe existing rhyolitic volcanic rock. The hot springwaters can be classified into carbon dioxide cold waterand neutral salt water.
(1) Carbon dioxide water: Chlorine ion concentrationof 10–30 ppm with carbonic acid content reaching2,000 ppm.
(2) Neutral salt water: Chlorine ion concentrationof 5,000 ppm or more, reaching twice that ofseawater.
Green Tuff Hot Springs
The Green Tuff orogenic movement occurred mainlydue to volcanic activity on the ocean floor on the seaof Japan side of the Japanese Archipelago during theNeogene and early Miocene periods (24 million yearsago). During the tectonic movement called the GreenTuff Geo-syncline, much volcanic ejecta, sand, andmud were thickly deposited in sedimentary regions.Green Tuff was formed by volcanic ejecta creating clayminerals such as chlorite and zeolite by diagenesis andalteration.
After the peak of volcanic activity, springs appearedon the ocean floor. Sulfide ores of useful metals such ascopper, lead, zinc, gold, and silver were formed. Thistype of ore is called black ore or kuroko and is knownas a metal deposit unique to the Green Tuff distribu-tion region on the sea of Japan side. The lower portionis characteristically accompanied by large amounts ofgypsum, i.e., calcium sulfate (CaSO4·2H2O) and anhy-drite (CaSO4). This composition was formed whenmagnesium and sodium in seawater replaced the cal-cium in rocks, which was eluted into the seawater ascalcium ions. The calcium ions formed calcium sulfate.

Medical Geology in Japan 349
Tab
le7
Tabl
eof
bene
fits
ofho
tspr
ings
bysp
ring
qual
ities
(Jap
anes
eSo
ciet
yof
Hot
Spri
ngSc
ienc
es,2
005)
Cla
ssifi
catio
n of
T
hera
peut
ic S
prin
g W
ater
s by
Che
mic
al
Cha
ract
eris
tics
Indi
catio
nsB
athi
ng .
Con
trai
ndic
atio
nsB
athi
ng×
D
rinki
ng
Cut
Scald
chronic dermatosis
Children infirmness
Chronic gynopathy
Chronic digestive organs disease
Menstrual disorder
Anemia
Chronic constipation
Constipation
Chronic gallbladder disease
Gallstone disease
Hepatopathy
Arteriosclerosis
Hypertension
Swelling
Obesity
Diabetes
Neuralgia Myalgia Arthralgia
Kidney disease
Hyperthyroidism
Diarrhea
Elderly xeroderma
Skin, mucous hyper-reactiveespecially light sensitivity
Gout
Acute disease Active tuberculosis Malignant tumor Heavy cardiopathy Respiratory failure Renal insufficiency hemorrhagic disease pregnancy Early and late stage
Sim
ple
ther
mal
wat
ers
Car
bond
ioxa
ted
wat
ers
Alk
alin
e E
arth
y H
ydro
genc
arbo
nate
sprin
gs
Sod
ium
hy
drog
enca
rbon
ate
sprin
gs
salt
wat
er
Sal
t wat
er w
ith m
ore
than
1m
g/L
Iodi
ne io
n
Sul
phat
e w
ater
s(E
xcep
t sod
ium
sul
phat
e w
ater
s)
Sod
ium
sul
phat
e w
ater
s
Iron
spr
ings
and
C
oppe
r ba
arin
g Ir
on
sprin
gs
Sul
phur
wat
ers
Sim
ple
acid
sul
phur
th
erm
al w
ater
s (H
ydro
gen
sulp
her
type
)A
cid
sprin
gs a
nd
Alu
min
um io
n be
arin
g sp
ring
Rad
ioac
tive
wat
ers
Frozen shoulder Motor paralysis Stiff joints Contusion Sprain Hemorrhoid sensitivity to cold Illnessrecovery (keep health)
:: D
rinki
ng
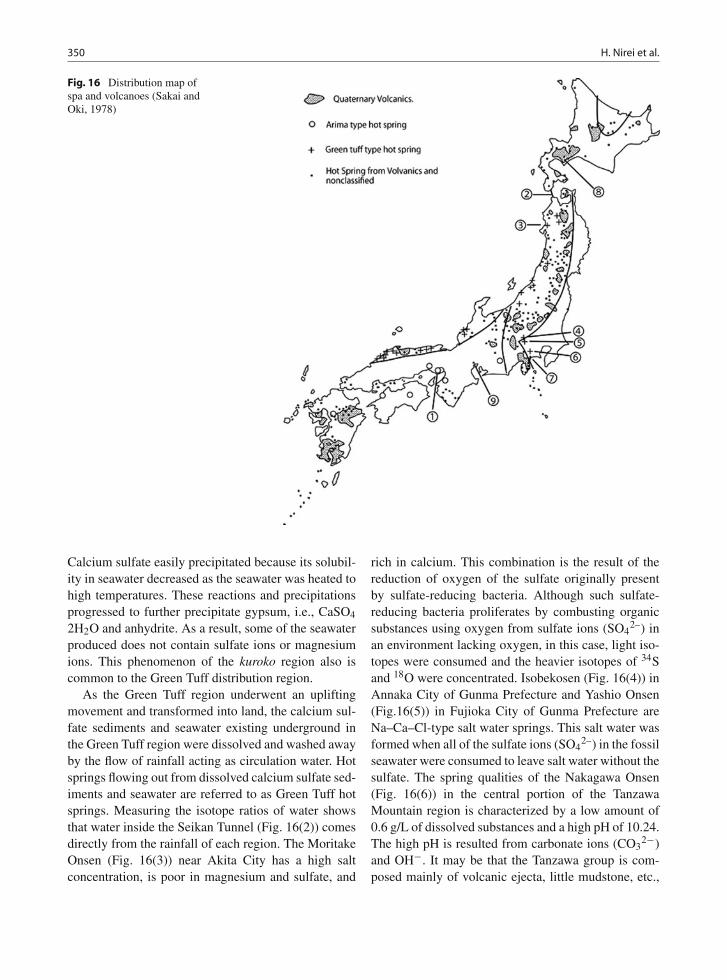
350 H. Nirei et al.
Fig. 16 Distribution map ofspa and volcanoes (Sakai andOki, 1978)
Calcium sulfate easily precipitated because its solubil-ity in seawater decreased as the seawater was heated tohigh temperatures. These reactions and precipitationsprogressed to further precipitate gypsum, i.e., CaSO4
2H2O and anhydrite. As a result, some of the seawaterproduced does not contain sulfate ions or magnesiumions. This phenomenon of the kuroko region also iscommon to the Green Tuff distribution region.
As the Green Tuff region underwent an upliftingmovement and transformed into land, the calcium sul-fate sediments and seawater existing underground inthe Green Tuff region were dissolved and washed awayby the flow of rainfall acting as circulation water. Hotsprings flowing out from dissolved calcium sulfate sed-iments and seawater are referred to as Green Tuff hotsprings. Measuring the isotope ratios of water showsthat water inside the Seikan Tunnel (Fig. 16(2)) comesdirectly from the rainfall of each region. The MoritakeOnsen (Fig. 16(3)) near Akita City has a high saltconcentration, is poor in magnesium and sulfate, and
rich in calcium. This combination is the result of thereduction of oxygen of the sulfate originally presentby sulfate-reducing bacteria. Although such sulfate-reducing bacteria proliferates by combusting organicsubstances using oxygen from sulfate ions (SO4
2–) inan environment lacking oxygen, in this case, light iso-topes were consumed and the heavier isotopes of 34Sand 18O were concentrated. Isobekosen (Fig. 16(4)) inAnnaka City of Gunma Prefecture and Yashio Onsen(Fig.16(5)) in Fujioka City of Gunma Prefecture areNa–Ca–Cl-type salt water springs. This salt water wasformed when all of the sulfate ions (SO4
2–) in the fossilseawater were consumed to leave salt water without thesulfate. The spring qualities of the Nakagawa Onsen(Fig. 16(6)) in the central portion of the TanzawaMountain region is characterized by a low amount of0.6 g/L of dissolved substances and a high pH of 10.24.The high pH is resulted from carbonate ions (CO3
2−)and OH−. It may be that the Tanzawa group is com-posed mainly of volcanic ejecta, little mudstone, etc.,

Medical Geology in Japan 351
and therefore little carbon dioxide, and so the water didnot become acidic and formed alkaline simple thermalwaters.
Volcanic Activity of the Quaternary Period
Hot springs having thermal energy from volcanic activ-ity as the source of heat are called volcanic hot springs.Geothermal energy is carried to the earth’s surface byfluids due to the geological structure and hydrogeolog-ical structure of the volcanic belt and the surroundingregion. The Hakone Onsen (Fig. 16(7)) of the Hakonevolcano will be described as an example.
Thermal Structure of the Hakone Volcano
Looking at the distribution of the ground ther-mal structure of the Hakone volcano at a heightabove sea level of 0 m, the central portion of the
caldera is hot and temperatures decrease outwardin a concentric-circular configuration. Owakudani,Sounzan, and Yunohanasawa are located in the calderaof Hakone volcano. Hirogawara includes a high-temperature region corresponding to the Yugawaravolcano. The Yumoto Onsen at the eastern edge of theHakone caldera gushes forth from Neogenic Hayakawavolcanic breccia and the Yugashima strata forming thefoundation of the Hakone volcano. The source of heatof the Yumoto Onsen depends on the volcanic activityof the Hakone volcano (Figs.17 and 18).
Spring Qualities by Sub-Zones
Many types of spring qualities exist in hot springsaround a large volcano. For example, 12 types ofwater have been identified for the Noboribetsu Onsen(Fig. 16(8)) and 14 types have been identified for theHakone Onsen including acidic water, alkaline water,and common salt water.
Fig. 17 Thermal structure ofthe Hakone volcano at the sealevel (Oki and Hirano, 1970)(a) isotherm, (b) caldera, (c)solfatara

352 H. Nirei et al.
Fig. 18 East–west crosssection of Hakone illustratinggeological structure andisothermal profile. WT: watertable, Aq: aquifer, BR:basement rocks, (Oki andHirano, 1970)
Fig. 19 Spring qualities bysub-zones (Oki and Hirano,1970)
Hakone can be divided into four sub-zones bythe solution ratios of Cl−, SO4
2−,and HCO3−
(Fig. 19).Zone 1: Shallow hot springs with acidic sulfate water
in the fumarolic area. The amount and temperatureof water spring up vary with the amount of rainfall.
Zone 2: Hot springs with neutral alkaline earthy hydro-carbononate water reserved in the Hakone volcanoejecta at the bottom of the caldera. HCO3– is sup-plied by decomposition of plant fossils in betweenvolcanic deposits.
Zone 3: Hot springs with high-temperature salt waterflowing downstream in three directions towardHayakawa canyon from 300 m underground belowthe sulfurous gas spouts of the hillside on the easternside of the Kamiyama central volcanic crater.
Zone 4: Hot springs with common salt/sodium hydro-gencarbonate water/sulfate water formed by various
proportions of the high-temperature common saltwater of zone 3 mixing with the deep-layer ground-water of zone 2.
Zone 1: acidic sulfate watersZone 2: neutral alkaline earthy hydrocarbononate
waterZone 3: high-temperature common salt waterZone 4: common salt/sodium hydrogencarbonate
water/sulfate water formed by various proportionsof the high-temperature common salt water of zone3 mixing with the deep-layer groundwater of zone 2(Oki et al., 1978)
Origin of Common Salt Springs
D.E. White (1957) focused on the H2O–NaCl high-temperature high-pressure experiments of Olander and

Medical Geology in Japan 353
Fig. 20 Genetic model ofHakone hydrothermal system(Oki and Hirano, 1970)
Liander (1950) showing that common salt moves inwater vapor and considered that common salt waterin the deep portions of volcanoes is the infant stage.Figure 20 is a genetic model of the Hakone Onsen.When common salt water ascends to the ground sur-face (temperature and pressure decrease), common saltremains in the liquid phase and highly volatile CO2 andH2S are produced and spouted as gas.
(a) Repeated processes of vaporization and concentra-tion of volcanic steam resulting in concentration ofvolatile components such as H2S and CO2
(b) Sodium chloride water (zone 3)(c) Super critical gases (steam) with NaCl
Hydrothermal Systems and Steam-DominantSystems
Distinctive features of hydrothermal systems includebeing formed where water is easily supplied. Silicasinter, calcite, zeolite minerals, etc., are formed byhydrothermal alterations of common salt water. Thepaths of hot water are blocked due to crystallizationof alteration minerals over long periods of time, the
proportion of the liquid phase decreases, and a steam-dominant system is formed. Distinctive features ofsteam-dominant systems include acidic sulfate waterhaving few chlorides and a pH of 2–3. Where the hotspring gushes forth, silica sinter, carbonate, and silicateprecipitates are non-existent or poor in content.
Non-Volcanic Hot Springs
The underground temperature increases about 3◦Cevery 100 m downward. Although drilling 1,500 mshould yield hot water of about 45◦C, the temperaturedrops as the water is drawn up, and there are not manyexamples of springs welling up at 42◦C or higher.The Nagashima Onsen (Fig. 16(9)) in Mie Prefectureobtains hot water of 60◦C from a depth of 1,540 m,but generally, non-volcanic hot springs do not exceed42◦C and heat must be provided.
References
Japanese Society of Hot Spring Sciences (2005) Introduction toHot Spring Sciences – An Invitation to Hot Springs (Vol. 48,pp. 41–52, p. 128.). Tokyo: Corona Publishing Co., Ltd.
Kinjo Y, Kusuda T, Nirei H (2006) The beginning studythat will contribute to elucidate the behavior of ground

354 H. Nirei et al.
air flows due to VOCs (pp. 97–102). The Proceedingsof the Sixteenth Symposium on Geo-environments andGeo-technics, Japanese Society of Geo-pollution Science,Medical Geology and Urban Geology (PMUG).
Shinmuta I (ed) (1973) Kogai (p. 792). “Kojien”. Tokyo:Iwanami Press.
Minato M (ed) (1977) Japan and Its Nature (p. 220). Tokyo:Heibonsya.
Miyamoto K (1970) Kogai and Resident’s Campaign (p. 319).Tokyo: Jichitaikenkyusha.
Miyamoto K (2006) Toward Sustainble Society-Kogai is notOver. (p. 220). Tokyo:Iwanami press.
Nirei H, Satoh K, Suzuki Y, Furuno K (1994) Geo-pollutionunits application of geological concepts in environmetalstudies. J Geol Soc Japan 100:425–435.
Nirei H, Maker BM, Sakunas J, Furuno K (2008) Stratigraphicalclassification of man-made strata and two types of geo-pollution mechanism (pp. 27–34). The Proceedings ofInternational Symposium on Geo-pollution, Japan Branchof IUGS Commission on Geociences for EnvironmentalManagement.
Oki Y, Aramaki S, Nakamura K, Hakamata K (1978) Volcanoesof Hakone, Izu and Oshima. Bull Hot Spring Res InsKanagawa Pref 9(5):88.
Oki Y, Hirano T (1970) Geothermal system of Hakone volcano.U.N. symposium on the Development and Utilization ofGeothermal Resources, Pisa. Geothermics Spec Issue 2(2):1.
Olander A, Liander H (1950) Acta Chem.Stand 4:1437.Sakai H, Oki Y (1978) Hot Spring Type and Geology in Japan
(Vol 48(1), pp. 41–52). “Kagaku”. Tokyo: Iwanami Press.Selinus O, Alloway B, Centeno AJ, Finkelman BR, Lindh U,
Fuge R, Smedley P (2005) Essentials of Medical Geology -Impact of the Natural Environment on Public Health (p. 812).Amsterdam: Elsevier.
Toto Bunso and Roka (1811) Sawada H (trans.) (1975) SevenHot Springs of Hakone (p. 75). Hakone Town Office.
Vogel TM, MacCarty LP (1985) Bio-transformation of tetra-chloroethylene to Trichloroethylene, Dichloroethylene,VinylChloride, and Carbon Dioxide under MethanogenicConditios. Appl Environ Microbiol 49(5):1080–1083.
White DE (1957) Thermal waters of volcanic origin. Bull GeolSoc Amer 68:1637–1658.

Medical Geology in Hellas: The Lavrion EnvironmentalPollution Study
Alecos Demetriades
Abstract The large volume and areal extent of met-allurgical processing wastes in the Lavrion urban area,and their subsequent movement by aerial and fluvialprocesses, as well as by human activities resulted inthe contamination of overburden materials, includingresidual and alluvial soil. The bioaccessibility of con-taminants, such as Pb and As, is verified by the highconcentrations of Pb in blood and deciduous teeth,and As in urine of children and adults alike. Thepresent work, apart from the review of all availabledata and information, studied in detail every possi-ble aspect of the Lavrion environment, i.e. overburdenmaterials (including residual and alluvial soil), housedust, lithology, metallurgical processing wastes, andproduced a multitude of geochemical distribution andother thematic maps, leading to risk assessment and theproduction of an environmental management plan forthe rehabilitation of contaminated surficial materials.Although cost-effective solutions were proposed, noaction has as yet been taken by the relevant authorities.
Keywords Geochemistry · Health · Soil · House dust ·Lead · Arsenic · Blood · Teeth · Urine · Lavrion ·Greece
Introduction
Lavrion (37◦ 42′ 38′′ N, 24◦ 3′′ 11′′ E), with a pop-ulation of about 10,000 people, is a town, situated in
A. Demetriades (�)Institute of Geology and Mineral Exploration, 1 Spirou LouisStreet, Entrance C, Olympic Village, Acharnae, Gr-136 77,Hellase-mail: [email protected]
the eastern part of Lavreotiki Peninsula, and is approx-imately 40 km to the southeast of Athens, and 55 kmby road (Fig. 1). Because of its rich mineral wealth,consisting of polymetallic sulphides and iron ore(Marinos and Petrascheck, 1956; I.G.M.E. WorkingGroup, 1987; Vourlakos, 1992; Katerinopoulos andZissimopoulou, 1994; Skarpelis, 2007a,b; Voudouriset al., 2008; Skarpelis and Argyraki, 2009), it was thecentre of considerable mining and smelting activitiesfrom ancient to recent times (Conophagos, 1980). Thefirst mining and smelting activities in the LavreotikiPeninsula began early in history according to theclassical Hellene historian Xenophon (c. 430–350BC); lead isotope studies of ancient artefacts indi-cate that mining of argentiferous galena began between3500 and 3000 BC (Manthos, 1990; Dermatis, 1994).Moreover, archaeological excavations at Thorikon, asettlement to the north of Lavrion, confirmed the exis-tence of mining activities as early as 3000 BC (Gelaudeet al., 1996). Mining and smelting activities continuedintermittently until the 1st century AD, since Pausanias(active c. 143–176 AD), a 2nd century Hellene geog-rapher, reported that the Athenian silver mines in theLavreotiki Peninsula were completely forgotten by histime. It appears, however, that silver from Lavreotikiand Pangaeon (Macedonia, N.E. Hellas) was used inthe 6th century AD during the building of Saint SofiaChurch in Constantinople.
The peak of mining and smelting activities wasbetween the 6th and 4th centuries BC, and especiallyduring the 5th century BC, the Golden Age of Athensor Pericles (Conophagos, 1980). The revenue from themines was used first to build in 483 BC the largeAthenian fleet, which defeated the Persians at the navalbattle of Salamis in 480 BC, and subsequently financedthe construction of the renowned monuments seen
355O. Selinus et al. (eds.), Medical Geology, International Year of Planet Earth,DOI 10.1007/978-90-481-3430-4_13, © Springer Science+Business Media B.V. 2010

356 A. Demetriades
Fig. 1 Map of Hellasshowing Lavreotiki Peninsulain relation to Athens. Insetshows the location of theLavrion urban area
today on the Acropolis of Athens, the Parthenon, theErechtheum, etc.
The recent mining and smelting history began in1865 and ended in 1989 AD with the closure ofthe smelter. During this period Lavrion was the cen-tre of ore beneficiation and smelting activities, whichproduced large volumes of hazardous metallurgicalprocessing wastes, including pyrite, slag, flotation sandand other coarser materials. Houses, schools, parks,playgrounds, shops and roads are either situated on orare very close to these wastes. Further, the wastes areused by the local inhabitants, private companies andthe Municipality for a variety of purposes, e.g. slag ashard core on roads, school yards, the new port facili-ties, infilling of foundations of buildings, covering ofdirt roads by sand-blast material made from slag, theflotation sands as building material for houses. Duringtheir loading, transportation and unloading, fine dustis released into the ambient air and made available fortransportation by wind. The strong northeasterly windsblowing in the area, almost throughout the year, trans-port fine- to medium-grained metallurgical processingwastes to distant places. Deposition of these materials,with high toxic element contents, and their subse-quent mixing with residual and alluvial soil caused thealteration of the chemical composition of surface soil.
Because of the adverse industrial conditions inLavrion, and the known medical effects of lead
poisoning on humans, three cross-sectional epi-demiological and other medical studies were carriedout in the 1980s (Drossos et al., 1982; Benetou-Marantidou et al., 1985; Nakos, 1985; Hatzakis et al.,1987; Maravelias et al., 1989; Eikmann et al., 1991;Makropoulos et al., 1991, 1992a, b; Kafourou et al.,1997). Other human tissue studies included childdeciduous teeth (Stavrakis et al., 1994a) and urine(Demetriades et al., 2008). The effects on plants werealso investigated (Nakos, 1979a, b; Chronopoulos andChronopoulou-Sereli, 1986a, b, 1991; Chronopoulou-Sereli and Chronopoulos, 1991a, b; Xenidis et al.,1997; NTUA, 1999), as well as on animals (Spaiset al., 1987).
The Institute of Geology and Mineral Explorationwith the waning down of the mineral exploration effortin Hellas began in the late 1980s environmental impactstudies. Because of the mineral exploration projects,carried out in the Lavreotiki Peninsula, there was evi-dence of widespread contamination of surface materi-als (soil and stream sediment). In 1989 it was decided,therefore, to carry out, during 1990–1992, urban geo-chemical surveys in Lavrion and Aghios Constantinos,a village approximately 4 km to the WNW ofLavrion (Demetriades, 1992; Hadjigeorgiou-Stravrakisand Vergou-Vichou, 1992; Hadjigeorgiou-Stravrakiset al., 1993; Stavrakis et al., 1994a). Samples of gar-den soil (n=153), road dust (n=137) and house dust

Medical Geology in Hellas: The Lavrion Environmental Pollution Study 357
(n=128) were collected from Lavrion and analysedby atomic absorption spectrophotometry, following ahot aqua regia extraction, for As, Cd, Cu, Fe, Pb andZn, and Hg by a dual-beam Hg-spectrometer (Robbins,1973; Pöppelbaum and Van den Boom, 1980a, b).Also, deciduous teeth were collected in 1991 fromLavrion primary school age children (n=82) to assessPb absorption and to compare results with other indus-trial and natural background areas (Stavrakis et al.,1994a). In 1992 the project was extended to coverthe whole Lavreotiki Peninsula with the collectionof surface soil (n=698) and rock samples (n=136)(Stavrakis et al., 1994b; Demetriades et al., 1994a, b, c,1996a, b, 2004). Another soil geochemical study inpart of the Lavreotiki peninsula was carried out byKorre (1997) and Korre and Durucan (1995a, b).
Finally, the most comprehensive environmentalimpact study ever carried in an urban–sub-urban envi-ronment was co-financed by the European Communityand the Hellenic State through the LIFE programmewith the title Soil Rehabilitation in the Municipalityof Lavrion (Contract No: 93/GR/A14/GR/4576). Theproject began in 1994 and was completed in 1999with the submission of a massive six-volume report(Demetriades, 1999a, b, c, d, e; NTUA, 1999), aswell as other site or subject-specific reports and papers(Demetriades and Stavrakis, 1995a, b; Demetriadeset al., 1997, 1998). Some of these results will bedescribed in this chapter.
Lithology
Regional and local stratigraphy and geological struc-ture are described by Marinos and Petrascheck(1956), the I.G.M.E. Working Group (1987), Papadeas(1991), Leleu (1966, 1969), Leleu and Neumann(1969), Photiades (2003), Photiades and Carras (2001),Photiades and Saccani (2006), Photiades et al. (2004),Baziotis et al. (2008) and Skarpelis et al. (2008) andthey should be consulted. For the purpose of the geo-chemical study it suffices to know broadly the mainrock units occurring in the Lavrion urban area, i.e.
• Marble with schist intercalations,• Schist with marble intercalations,• Schistose-gneiss,• Prasinite (metamorphosed mafic igneous rock), and
• Sandstone, conglomerate and alluvial deposits ofQuaternary to Recent age.
Outcrops of iron and “iron calamine” mineralisationare found in the study area. Marinos and Petrascheck(1956) also referred to the occurrence of small out-crops with galena [PbS] at Kiprianos and Nichtochorihills (Fig. 2). They also mentioned the existence of anoutcrop of granodiorite porphyry (eurite) at Kiprianos.
The area extent of the different rock units is tab-ulated in Table 1. Marble is the dominant rock type,covering 86.22% of the solid geology, followed byschist (13.24%).
Chemical Composition of Parent Rocks
One of the aims of the Lavrion urban geochemicalproject was to determine the background and baselinevariation of elements. An indeed difficult objective,since residual soil in the Lavrion urban area is contam-inated by toxic elements, as is described below. Theonly natural geological medium amenable to study nat-ural background and baseline variation is surface rock.Rock outcrop mapping during the compilation of the1:5,000 scale lithological map (Fig. 2) has shown thatthere were enough outcrops, well distributed over thewhole study area, to compile lithogeochemical maps(Demetriades and Vergou-Vichou, 1999a; Demetriadeset al., 1999a). Therefore, rock chip samples were col-lected from 140 outcrops and analysed for major andtrace elements by different AAS analytical methods(SiO2, Al2O3, Fe2O3, CaO, MgO, K2O, Na2O, TiO2,P2O5, Ag, As, Ba, Cd, Co, Cr, Cu, Li, Mn, Mo, Ni, Pb,Sb, Sr, V, Zn and LOI) and by aqua regia and deter-mination by ICP-AES for Ag, B, Be, Bi, Hg, La, Mo,S, Sb, Sn and U. Because of a high detection limit andpoor analytical precision for some of the above deter-minants, analytical data from the Lavreotiki Peninsularegional rock geochemical survey were used, e.g.another 15 samples added for Ag and Mo (n=155), andonly 48 rock samples for B, Be, Bi, Hg, La, S, Sb, Snand U.
The abundance of elements occurring in rocks ofthe Lavrion urban area (entry All rocks, Table 2) iscompared to the mean concentration in rocks of theupper continental crust (Levinson, 1980; Taylor andMcLennan, 1995; Wedepohl, 1995; Reimann et al.,

358 A. Demetriades
Lithological mapLavrion urban area
Quaternary and Recent formationsSchist with marble intercalationsSchistose-gneissMarble with schist intercalationsPrasinite (metamorphic mafic rock) Iron mineralisation (Fe)Altered marble (ankeritisation, etc.)Probable boundaries
Lavrionharbour
Kiprianos
AghiaParaskevi
AghiosAndreas
Santorineika
PrassiniAlepou
Perdika
Thorikon
Kavodokanos
Neapoli
Nichtochori
Fougara
Komobil
Noria
VilanoiraPanormos
0 m 250 m 500 m
Fe
Fe
Fig. 2 Lithological map, Lavrion urban area, Hellas (from Demetriades et al., 1999c, Map 2.2; p.2.2; reduced from the originalcolour map at a scale of 1:5,000) (Mapped by A. Demetriades and K. Vergou-Vichou (1997))
1998). This comparison shows that the Lavrion urbanarea rocks are naturally
• enriched in As>Sb>Cd>Ag>Hg>Ni>Ca>Pb>Zn>P>Mn>Cr>Co>Cu>Ba>S>U and
• depleted in Fe>Mo>Li>Sr>La>Ti>Al>V>K>B
with respect to their abundance in rocks of the uppercontinental crust. Calcium enrichment is explained by
the widespread occurrence of marble. Enrichment withrespect to other elements, the majority of which areclassified as toxic (given in bold), is either due tomineralisation or lithology. It is noted that the termsdepletion and enrichment are used for mean elementconcentrations below and above the Global rock mean,respectively.
Since, each rock has a different chemical compo-sition, mean element concentrations in marble, schist,

Medical Geology in Hellas: The Lavrion Environmental Pollution Study 359
Table 1 Area covered by different rock units, Lavrion urbanarea
Rock unit Area (m2) Area (%)
Marble with schistintercalations
6,238,189.48 86.22
Schist with marbleintercalations
957,995.00 13.24
Schistose-gneiss 9,713.00 0.13Prasinite (altered
metamorphosed mafic rock)27,301.00 0.38
Iron mineralisation 1,831.00 0.03Total area of solid geology 7,235,029.48 100.00Altered marble 555,173.00 8.90Quaternary formations 2,161,342.00 29.87
Source: Data from Demetriades et al., 1999c, Table 2.1, p. 16
prasinite and sandstone of the Lavrion urban area arecompared to their respective Global rock-type meanstabulated by Reimann et al. (1998). This comparisonis made to show geochemical differences between thedifferent Lavrion urban area rocks and their respectiveGlobal rock averages.
All four rock types are enriched in Cd, Cu, Mn, Pand Pb, which are elements associated with the poly-metallic sulphide mineralisation, and depleted withrespect to K and V (Table 3). Moreover, marble andschist are enriched in Ag, As, Co, Hg, Ni and Zn, ele-ments also associated with base metal mineralisation.It is, therefore, quite apparent that mineralisation isthe cause of enrichment of all rocks occurring in theLavrion urban area, with respect to major and minorore elements.
Prasinite, metamorphosed diabasic lava, wasexpected to be enriched in Fe, Ti, V, Cr, Ni andCo, because of its mafic, and locally ultramafic,mineralogy, but it is peculiarly depleted with respectto all these elements, possibly due to its alteration. Thecalcium enrichment is explained by its mineralogy,but the abnormal Li level is a local peculiarity, forthis is an element normally enriched in granite andpegmatite, as well as in shale and schist, but not inmafic rocks.
Metallurgical Processing Wastes
Metallurgical processing of ore-grade materials from1865 to 1989 produced a considerable amount of wastematerials, which cover a large part of the Lavrion urbanarea (Fig. 3). Ancient wastes that may have existed
are completely masked. Residual soil has been con-taminated to a variable degree, and constitutes todaythe greatest hazard, since it covers the greatest areain Lavrion (74.91% of study area, Table 4). Sinceuncontaminated soil is only found in a few places,and the natural landscape has been altered consider-ably by deposition of metallurgical wastes, and theirsubsequent moving about by the local inhabitants, andimportation of garden soil from other parts of Hellas,the term “overburden” is preferred for it describes thelocal situation perfectly well. Overburden is definedby Jackson (1997, p. 457) as the loose soil, silt, sand,gravel, or other unconsolidated material overlyingbedrock, either transported or formed in place.
Three main categories of metallurgical processingwastes occur in the Lavrion urban area:
• beneficiation/flotation residues or tailings (they willbe referred to in the text as either flotation residuesor flotation tailings),
• pyritiferous tailings, and• slag (lumpy and pelletised).
These three main types of metallurgical processingwastes have been subdivided further into other sub-categories, depending on their proportion mixed withother wastes or materials, i.e.
• disseminated slag,• sand-blast material from slag and pelletised slag,• beneficiation/flotation sand with disseminated
pyrite,• disseminated slag and coarse-grained beneficia-
tion/flotation residues,• beneficiation/flotation sand and coarse-grained
materials, and• beneficiation/flotation residues and disseminated
slag.
The surface area of the metallurgical processingwastes and contaminated overburden, including resid-ual soil, are tabulated in Table 4.
Chemical Composition of MetallurgicalProcessing Wastes
The metallurgical processing wastes, as tabulated inTable 4, cover a large part of the Lavrion urbanarea, and presently they are the major primary source

360 A. Demetriades
Table 2 Statistical parameters of element concentrations inrock, overburden and metallurgical processing wastes inLavrion, Global rock mean of upper continental crust (Reimann
et al., 1998). Enrichment/depletion index of Lavrion rocks withrespect to Global rock mean. Median values of Lavrion overbur-den and metallurgical wastes are given for comparison purposes
Lavrion rocks (n=140)1, overburden, including residual soil (n=224)2, and metallurgicalprocessing wastes (n=62)
All rocks (n = 140) (values in ppm)
Overburden(ppm)
Metallurgicalwastes(ppm)
Element Minimum Maximum MeanStandarddeviation Median Median Median
Global rockmean ofuppercontinentalcrust(ppm)
Enrichment/depletionindex ofLavrion rockswith respect toGlobal rockmean
Ag∗ < 0.5 41.00 0.89 3.63 0.50 12.06 18.90 0.055 16.18Al < 50 75,152.00 19,267.00 21,375.00 8,044.00 32,315.00 20,074.00 77,440.000 0.25As < 0.5 1,032.00 62.80 172.40 15.60 1,290.00 2,492.00 2.000 31.40B∗∗ 0.25 5.24 0.52 0.87 0.25 136.00 42.97 17.000 0.03Ba 40.00 108,000.00 1,067.00 9,110.00 210.00 479.00 243.00 668.000 1.60Be∗∗ < 0.5 Below detection limit 1.01 0.50 3.100 −Bi∗∗ < 0.5 Below detection limit 11.00 2.50 0.120 −Ca 50.00 390,938.00 217,301.00 125,319.00 220.13 93,625.00 102,603.00 29,450.00 7.38Cd < 1.0 41.00 1.89 5.02 0.50 38.00 20.62 0.102 18.53Co < 1.0 104.00 26.90 26.10 20.50 16.00 23.83 11.600 2.32Cr < 1.0 610.00 100.40 145.90 20.00 183.00 73.18 35.000 2.87Cu 3.00 225.00 32.80 31.00 25.00 186.00 630.50 14.300 2.29Fe 979.00 107,016.00 23,790.00 20,660.00 19,515.00 44,771.00 234,500.00 30,890.000 0.77Hg∗∗ < 1.0 7.77 0.69 1.05 0.50 0.14 2.35 0.056 12.32K < 83 31,795.00 5,841.00 7,552.00 8,044.00 9,770.00 7,100.00 28,650.000 0.20La∗∗ < 2.0 30.69 10.21 6.47 8.86 22.70 27.32 32.300 0.32Li < 1.0 106.00 9.10 12.10 5.00 17.40 14.50 22.000 0.41Mn 100.00 25,000.00 1,831.00 2,635.00 1,200.00 2,189.00 9,398.00 527.000 3.47Mo∗ < 0.5 11.00 0.83 1.16 0.50 4.90 3.57 1.400 0.59Ni < 1.0 1,600.00 168.30 252.20 54.50 127.00 38.52 18.600 9.05P 44.00 8,510.00 2,381.00 1,904.00 1,855.00 992.00 1,103.00 665.000 3.58Pb < 1.0 1,850.00 76.85 209.06 22.00 7,305.00 20,750.00 17.000 4.52S∗∗ 100.00 3,000.00 1,100.00 600.00 1,200.00 12,690.00 20,581.19 953.000 1.15Sb∗∗ < 5.0 71.04 6.94 12.05 2.50 121.00 189.00 0.310 22.39Sn∗∗ < 5.0 Below detection limit 18.50 27.71 2.000 −Sr < 1.0 800.00 121.00 129.00 98.00 118.00 178.69 316.000 0.38Ti < 120.0 7,014.00 920.00 1,401.00 300.00 2,162.00 737.70 3,117.000 0.30U∗∗ 2.50 6.06 2.75 0.85 2.50 3.00 2.50 2.500 1.10V < 1.0 71.00 13.10 13.00 9.00 75.00 46.30 53.000 0.25Zn < 6.0 5,200.00 210.60 599.60 57.00 6,668.00 39,800.00 52.000 4.05
Source: Data from Demetriades and Vergou-Vichou, 1999a, Table 4.1, p. 941Rock: ∗Ag, Mo (n=155); ∗∗B, Be, Bi, Hg, La, S, Sb, Sn, U (n=48)2Overburden: B, Bi, Hg, S, Sn, U (n=50) and Sb (n=90)
of contamination of the surface environment. It is,therefore, significant to understand their environmen-tal impact and implications to the quality of life of thelocal population. Their geographical distribution andthe area they cover are shown in Fig. 3. Their chem-istry was studied by the collection of representative
samples from the main metallurgical processing wastecategories, i.e.
• slag (n=21),• sand-blast material or wastes (n=8),• earthy material within slag (or slag earth) (n=7),

Medical Geology in Hellas: The Lavrion Environmental Pollution Study 361
Table 3 Comparison of mean element concentrations ofLavrion urban area rocks to Global rock-type means. Elementsenriched in all rock types are displayed in bold letters and thosethat are depleted are italicised and underlined. (Elements belowdetection limit are Be, Bi, Sn and U and are not considered)
Process Marble Schist Prasinite∗ Sandstone
Enrichment Ag, Al, As,Ba, Cd,Co, Cr,Cu, Fe,Hg, La,Mn, Mo,Ni, P,Pb, S, Ti,U, Zn
Ag, As, Ca,Cd, Co,Cr, Cu,Hg, Mn,Ni, P, Pb,Zn
Ca, Cd,Cu,Li,Mn, P,Pb
Ba, Ca,Cd,Co, Cr,Cu,Fe,Mn,Ni, P,Pb, Sr,Zn
Depletion B, Ca, K,Li, Sr, V
Al, B, Ba,Fe, K, La,Li, Mo, S,Sr, Ti, V
Al, Ba,Co, Cr,Fe, K,Ni, Sr,Ti, V,Zn
Al, K, Li,Ti, V
Source: Data from Demetriades and Vergou-Vichou, 1999a,Table 4.2, p. 95∗Prasinite mineralogy: albite [NaAlSi3O8], pennine [H8(Mg,Fe)5Al2Si3O8], epidote [H2O.4CaO.3(Al,Fe)2O3.6SiO2],clinozoisite [HCa2(Al,Fe)3Si3O13], actinolite [Ca2(Mg,Fe)5(OH)2(Si4O11)2], hornblende {(Ca,Na)2–3(Mg,Fe2+,Fe3+,Al)5(OH)2.[(Si,Al)8O22]}, glaucophane [Na(Al,Fe,Mg)(SiO3)2]and leucoxene FeO·TiO2 (Marinos and Petrascheck,1956)
• beneficiation/flotation residues or tailings (n=8),• pyrite tailings (n=12), and• pyritiferous sand (n=6).
Aqua regia extractable concentrations of elements(Ag, Al, As, B, Ba, Be, Bi, Ca, Cd, Ce, Co, Cr, Cu, Fe,Ga, Ge, Hg, In, K, La, Li, Mg, Mn, Mo, Na, Nb, Ni, P,Pb, Rb, S, Sb, Sc, Se, Sn, Sr, Ta, Te, Th, Ti, U, V, W,Y, Zn and Zr) in samples of metallurgical processingwastes were determined by ICP-AES.
It must be appreciated that the metallurgical wastesin the Lavrion urban area are the products of overhundred years of ore processing. Apart from differ-ences in the mineralogy of processed ore, changesmade in the metallurgical methods resulted in the pro-duction of wastes of different chemical composition.The detailed study of their chemistry verified the exis-tence of distinct chemical differences among the sixmajor metallurgical waste categories, but also withineach one (Demetriades and Vergou-Vichou, 1999b).The spatial chemical variation has been depicted, ingeneral terms, by the geographical presentation ofresults (Demetriades et al., 1999b).
Slag heaps are distinguished into four differ-ent types in terms of their chemical composition(Fig. 3), i.e.
1. Fougara, Panormos and Neapoli are characterisedby comparatively high levels in Al, (B), Ba, Be,(Cr), K, La, Li, Ni, Sb, Sn, Sr and Ti; B is enrichedin slag samples from Fougara and Panormos, andCr from Fougara and Neapoli.
2. Eastern part of Aghia Paraskevi and the beachsection of Komobil-Kiprianos are characterised bycomparatively high levels in Al, Ba, (Be), Cr, K, La,Li, Mo, Ni, Sb, Sn, Sr, Ti and V; Be is only enrichedin slag samples from Komobil-Kiprianos.
1. South and southeast of Aghia Paraskevi are charac-terised by comparatively high contents in Al, Fe, K,Mo, Sn, Sr and Ti.
2. Kavodokanos and Kiprianos (western part in themetallurgical plant) are characterised by compara-tively high levels in (Ag), Cu, Fe, Hg, Mn, Mo, Sand Zn; Ag is only enriched in slag samples fromKavodokanos.
Apart from the chemical differences, slag heaps can,in fact, be distinguished in the field as well. The lumpyslag to the south of Aghia Paraskevi, behind the oldiron pier of the former French Mining Company, iscomparatively more weathered than slag from othersites (Fig. 3). Directly on its top store rooms of thesame company have been built for the storage of pyrite,and presently they are in ruins. The lumpy slag of theheaps about Fougara hill, Panormos and Neapoli isweathered to a variable degree and should be of simi-lar or slightly later age than that to the south of AghiaParaskevi. The remaining slag heaps are of youngerage, and not so weathered.
Sand-blast material comprises comminuted slag andfine pelletised slag. It is only found in the Kavodokanosarea (Fig. 3). Although chemically similar to theKavodokanos slag, it appears that there is a changein its chemical composition, when slag is fine- tomedium-grained by either metallurgical process orcrushing, i.e. it is enriched, in comparison to normallumpy slag, with respect to most elements, e.g. Ag, As,B, Be, Ca, Cd, Cr, Cu, Fe, Hg, Mo, Ni, Pb, S, Sb, Sn, Vand Zn. The earthy material within slag (slag earth) isalso enriched; the Fougara slag earth is enriched withrespect to Ag, Ba, Cd, Co, Cr, Cu, Hg, Ni, Pb, Sb and

362 A. Demetriades
7000 8000
–5000
–4000
–3000
–2000
Beneficiation/flotation residuesLumpy slagLumpy and pelletised slagDisseminated slagSand-blast material from slagBenef. sand + disseminated pyPyritiferous tailingsDisseminated slag & benef. residuesBenef.sand & coarse-grained resids.Beneficiation resids. & dissem. slagContaminated overburden (incl. soil)
Lavrionharbour
Kiprianos
AghiaParaskevi
AghiosAndreas
Santorineika
PrassiniAlepou
Perdika
Thorikon
Kavodokanos
Neapoli
Nichtochori
Fougara
Komobil
Noria
VilanoiraPanormos
Metallurgical processing wastesand contaminated overburden
Lavrion urban area
0m 250m 500m
Fig. 3 Map of metallurgical processing wastes and contam-inated overburden, including residual soil (from Demetriadeset al., 1999f, Fig. 2.3, p.2.3; reduced from the original colour
map at a scale of 1:5,000) (Mapped by A. Demetriades andK. Vergou-Vichou (1997))
V, and the Kavodokanos slag earth in Ag, As, Cd, Co,Cr, Cu, Hg, Ni, Pb, Sb and V.
Pyrite tailings can also be distinguished chemicallyinto four broad categories:
(i) The Nichtochori-Komobil tailings, which wereproduced by the Mediterranean Mines company
from 1953 to 1963, are characterised by high lev-els in Ag, As, Bi, Co, Fe, K, S, Sb, Sn and V andare weathered to a variable extent.
(ii) The Kavodokanos-Kiprianos-Santorineika pyrite-tailings are characterised by high levels in Al, Ca,Cd, (Cr), Cu, Fe, (Hg), La, Li, Mn, (Ni), P, Sr andZn; Cr is only enriched in pyrite samples from

Medical Geology in Hellas: The Lavrion Environmental Pollution Study 363
Table 4 Area covered by different types of metallurgical pro-cessing wastes and contaminated soil in the Lavrion urban area
Metallurgical processingwastes Area (m2) Area (%)
Beneficiation/flotation residuesor tailings
474,211.83 6.55
Lumpy slag 397,568.97 5.50Lumpy and pelletised slag 135,764.79 1.88Disseminated slag 145,008.07 2.00Sand-blast material from slag
and pelletised slag105,813.29 1.46
Beneficiation/flotation sandswith disseminated pyrite
305,047.01 4.22
Pyritiferousbeneficiation/flotationresidues
209,029.94 2.89
Disseminated slag andcoarse-grainedbeneficiation/flotationresidues
17,492.64 0.24
Beneficiation/flotation sandsand coarse-grained materials
23,279.59 0.32
Beneficiation/flotation residueswith disseminated slag
2,169.52 0.03
Contaminated overburden(including residual soil)
5,419,643.83 74.91
Total area 7,235,029.48 100.00
Source: Data from Demetriades et al., 1999 g, Table 2.3, p. 19
Kavodokanos and Hg and Ni are only enriched inpyrite samples from Kavodokanos and Kiprianos.
(iii) The Thorikon Gulf beach pyrite tailings are char-acterised by high levels in As, Bi, Co, Fe, Mnand S.
(iv) The Thorikon inland (Komobil) pyrite tailings arecharacterised by high levels in Ag, Al, B, Ba, Cd,Cr, Hg, K, La, Li, Ni, P, Sb, Sn, Ti, V and Zn.
The Kavodokanos pyrite tailings are the mostweathered. All pyrite tailings produce acid drainageand are, therefore, potentially hazardous for pollutinggroundwater resources.
Flotation residues are chemically distinguished intothe large mass extending from Noria to PrassiniAlepou and Santorineika to the outskirts of Kiprianosand the smaller heap at Kavodokanos. The formeris characterised by high levels in Al, Cr, K, Li,Mo, Ni, Ti and V and the latter in Ag, As, Ba,Bi, Cd, Cu, Fe, Hg, La, Mn, S, Sb, Sn, Sr, U andZn. Their different chemical composition is attributedto differences in the original processed ore and itsgangue.
Table 5 summarises the chemical features of themetallurgical processing wastes. In the same table aregiven, for comparison purposes, the median rock andoverburden (including residual soil) values. This com-parison definitely shows that the metallurgical wastesare the major source of contamination of overbur-den materials, including residual soil. For a moredetailed description the report should be consulted(Demetriades and Vergou-Vichou, 1999b; Demetriadeset al., 1999b).
It is finally concluded that the metallurgical process-ing wastes have high toxic element concentrations (As,Be, Cd, Cu, Hg, Pb, Sb, Zn). Their wide distributionin the Lavrion urban area, i.e. covering approximately1.8 km2 of the 7.24 km2 studied in this project, whichrepresents about 25% of the total area, and their trans-portation by aerial, fluvial and anthropogenic means,resulted in the contamination of overburden materials,including residual and alluvial soil. The first prioritymust, therefore, be the rehabilitation of areas coveredby metallurgical processing wastes, as it will be shownbelow.
Land Use
The Lavrion urban area, covered by this study, extendsfrom the residential part of the town into its outskirts,which are either agricultural or forested. The differentland use types were mapped in detail by field map-ping at a scale of 1:5,000. Aerial photography wasused only for the exact delimitation of areas coveredby forest and olive groves. Land use is an importantparameter in the exposure assessment to environmen-tal contaminants, and also the “soil” rehabilitationplan. For the same purpose other environmental man-agement thematic maps were prepared, such as (a)property characterisation map and (b) map of urbancontrol zones.
The original mapping of land use types had about50 categories, which were later reduced to 30 by com-bining similar categories. Land use categories wereclassified into two broad groups (Table 6):
1. residential area, tillage, forest and open space and2. industrial, commercial.
Both groups have 15 categories each. Areas cov-ered by each land use category are tabulated in Table 6.

364 A. Demetriades
Table 5 Statistical parameters of element concentrations in metallurgical processing wastes, rock and overburden in Lavrion.Median values of rock and overburden are given for comparison purposes
All metallurgical processing wastes (n=62) (values in ppm)Rock(n=140)∗
Overburden(n=224)∗∗
Elements Minimum Maximum MeanStandarddeviation
Coefficient ofvariation (%) Median
Median(ppm)
Median(ppm)
Ag 3.20 96.00 33.80 28.22 83.49 18.90 0.50 12.06Al 1,118.00 38,071.00 18,998.00 10,302.00 54.23 20,074.00 8,044.00 32,315.00As 283.00 26,063.00 4,593.00 5,383.00 117.20 2492.00 15.60 1,290.00B < 5.00 667.07 61.78 102.80 166.40 42.97 0.25 136.00Ba 27.70 2,059.00 368.20 419.00 113.80 243.00 210.00 479.00Be < 1.00 1.28 0.64 0.26 40.63 0.50 − 1.01Bi < 5.00 56.85 6.83 10.82 158.31 2.50 − 11.00Ca 7,456.00 229,340.00 99,995.00 39,454.00 39.46 102,603.00 220.13 93,625.00Cd 116.59 580.84 74.80 116.59 155.87 20.62 0.50 38.00Co 2.98 83.95 26.35 15.96 60.57 23.83 20.50 16.00Cr 8.11 299.15 83.47 59.98 71.86 73.18 20.00 183.00Cu 184.00 8,700.00 1,172.90 1,362.60 116.17 630.50 25.00 186.00Fe 35,000.00 380,000.00 217,081.00 89,238.00 41.11 234,500.00 19,515.00 44,771.00Hg < 1.00 10.20 2.58 1.73 67.05 2.35 0.50 0.14K 993.00 13,408.00 6,942.00 3,911.00 56.34 7,100.00 8,044.00 9,770.00La < 2.00 47.25 25.13 11.64 46.32 27.32 8.86 22.70Li < 1.00 25.83 12.18 7.17 58.87 14.50 5.00 17.40Mn 182.00 35,354.00 11,913.00 9,925.00 83.31 9,398.00 1,200.00 2,189.00Mo < 1.00 111.08 9.25 19.01 205.51 3.57 0.50 4.90Ni 5.47 205.22 51.36 40.36 78.58 38.52 54.50 127.00P < 10.00 2,117.00 1,011.00 515.13 50.95 1,103.00 1,855.00 992.00Pb 3,800.00 85,200.00 24,450.97 18,085.37 73.97 20,750.00 22.00 7,305.00S 1,972.06 341,731.68 48,394.57 73,380.14 151.63 20,581.19 1,200.00 12,690.00Sb 183.30 851.00 229.50 183.30 79.87 189.00 2.50 121.00Sn 5.68 332.25 37.54 43.67 116.36 27.71 − 18.50Sr 150.80 798.60 210.60 150.80 71.61 178.69 98.00 118.00Ti < 10.00 2,031.00 799.80 682.50 85.33 737.70 300.00 2,162.00U < 5.00 12.46 3.21 1.85 57.63 2.50 2.50 3.00V < 2.00 104.24 44.42 23.83 53.65 46.30 9.00 75.00Zn 1,500.00 98,000.00 41,194.00 25,332.00 61.50 39,800.00 57.00 6,668.00
Source: from Demetriades and Vergou-Vichou, 1999b, Table 5.1, p. 128∗Rock: Ag, Mo (n=155); B, Be, Bi, Hg, La, S, Sb, Sn, U (n=48); ∗∗Overburden: B, Bi, Hg, S, Sn, U (n=50) and Sb (n=90)
Open space with or without bushes and scattered treescover 53.86% of the study area. Together with theareas occupied by pine forest (5.15%), open space withtrees (1.54%), olive groves (6.08%), vineyards (1.7%),vegetables (0.2%) and wheat fields (0.16%) make up68.69% of the total area. All industries cover 16.82%of the total area, and only about 14.5% is utilised forresidential and recreational purposes. Hence, the agri-cultural part dominates the study area, followed by theindustrial, and the residential/recreational section ofthe town covers the smallest area.
A large part of the residential and recreational areaof Lavrion is situated over contaminated soil, flotationresidues and slag. Vineyards are mainly grown over theflotation residues, as is a large part of the olive groves.
These statistics are not very encouraging, since localinhabitants live, work and play in the most hazardousareas.
Lead and Arsenic in Rock, Overburdenand House Dust and Consequencesto Health
The geochemical distribution of Pb in samples of rock,overburden (including residual soil) and house dustand As in overburden will be discussed, since these arethe only two elements which were analysed in humantissue samples (Pb in blood and deciduous teeth; As inurine).

Medical Geology in Hellas: The Lavrion Environmental Pollution Study 365
Table 6 Area covered by the different land use categories inthe Lavrion urban area
Land use category Area (m2) Area (%)
1. Residential area, tillage, forest, open spaceHouse without a garden, shop,
church481,186.45 6.65
House with a garden 416,639.21 5.76School 44,613.16 0.62Playground 6,724.61 0.09Park 40,872.01 0.57Football pitch, sports field 39,537.31 0.55Olive grove 439,975.42 6.08Vineyard 123,200.04 1.70Vegetables 14,681.36 0.20Wheat 11,222.18 0.16Pine forest 372,498.46 5.15Open space with trees (olive
and fig trees, etc.)111,722.65 1.54
Open space with trees(bushes)
3,896,642.50 53.86
Archaeological site 4,243.66 0.06Cemetery 13,537.25 0.19
2. Industrial, commercialOre treatment plant and
storeroom273,223.46 3.78
Smoke duct 23,358.94 0.32Sand-blasting units with slag 2,436.98 0.03Lead-acid battery factory 41,403.68 0.57Factory (ammunition, weapons,
matches), storerooms437,996.98 6.05
Petrol station, garage andmotor repairs
12,190.98 0.17
Iron converter industry andtrading
119,636.64 1.65
Aluminium converter industries 3,060.38 0.04Cotton weaving industries 119,232.05 1.65Other industries, storage sites 9,906.59 0.14Building materials storehouses 27,099.37 0.38Port installations 141,574.90 1.96Marble quarry 4,659.13 0.06Old mining works 1,057.41 0.01Municipal waste site 895.72 0.01
Total area 7,235,029.48 100.00
Source: Data from Demetriades et al., 1999 g, Table 2.4, p. 21
Toxic Effects of Lead
Trace amounts of Pb appear to be essential to thehealth of some animals, but it has never been shownas necessary in human biochemistry (Mervyn, 1985,1986; Manousakis, 1992). Hippocrates (460–377 BC),the father of medicine, together with other Hellenephilosophers and physicians, Aristotle (384–322 BC),Dioskourides (1st century BC) and Galenus (128–200
AD), has observed the effects of acute and chronicintoxication of Pb poisoning and described the clas-sic symptoms of abdominal convulsions, constipation,anaemia and paralysis. Gaius Plinius Secundus, theclassical Roman author (23–79 AD), mentioned thetoxic effects of Pb and that vapours, released duringsmelting of Pb ore, should not be inhaled for they aredangerous and could cause death to humans and ani-mals. He also warned about the danger to pregnantwomen in case of exposure; he advised the ones work-ing in the treatment of “red Pb,” crocoite (PbCrO4),to protect themselves by wearing masks from animalorgans. It appears, therefore, that ancient Hellenes andRomans knew that Pb poisoning (plumbism) was adisease contracted by workers in Pb mines and ore pro-cessing. Later medical practitioners, such as Paracelsus(1493–1541 AD), described the toxic effects of Pb atthe work place. Lead apparently is the first toxic metalto receive so much attention by the medical professionfrom ancient to modern times.
The toxic effects of Pb are well documented, andespecially for children who are more susceptible toPb poisoning than adults (Kazantzis, 1973; Mervyn,1985; Thornton and Culbard, 1987; Trattler, 1987;Briskin and Marcus, 1990; Ferguson, 1990; Reaganand Silbergeld, 1990; Manousakis, 1992; Wixson andDavies, 1994; US EPA, 1998). Inorganic Pb is notmetabolised but is directly absorbed, distributed indifferent parts of the human body and excreted. Therate depends on its chemical and physical form, andon the physiological characteristics of the exposedperson (e.g. nutritional status and age). Once inthe blood, Pb is primarily distributed among threecompartments:
• blood,• soft tissue (kidney, bone marrow, liver and brain),
and• mineralising tissue (bones and teeth).
Absorption via the gastrointestinal track, followingingestion, is highly dependent upon the levels of cal-cium, iron, fats and proteins. Long-term exposure toinorganic Pb compounds is known to affect the centralnervous system, peripheral nerves and kidneys. Highlevels of Pb in the human body have the followingeffects (Mervyn, 1980, 1985; Manousakis, 1992):
• reduction of vitamin D. If Pb is removed, however,by some means from the human body, then vitaminD is restored to normal level.

366 A. Demetriades
• decrease in the amount of iron. Lead inhibits thesynthesis of haem and haemoglobin, as well as theactivity of certain enzymes. In fact, anaemia is oftenthe first sign of Pb intoxication.
• reduction in the amount of calcium and phospho-rus. This antagonistic relationship between Pb and(Ca+P) works in the opposite way too. Calcium andphosphorus decrease the gastrointestinal absorptionof Pb and aids in its elimination. Some authorssuggest that people living in Pb high-risk environ-ments they should drink additional quantities ofmilk. There is, however, contradictory evidence inthe use of milk to counteract absorption of Pb andother toxic elements. Trattler (1987) states that milkas a source of calcium is associated with increasedPb levels and is not advised. He proposes alterna-tives, such as calcium orotate, calcium lactate orbone meal, and inorganic forms of phosphorus.
The US Environmental Protection Agency (USEPA, 1998, p. 5) stresses that it is important to doc-ument even exposure to low levels of Pb, because chil-dren can be permanently affected. Low-level exposureof children to Pb can cause
• nervous system and kidney damage;• learning disabilities, attention deficit disorder and
decreased intelligence;• speech, language and behaviour problems;• poor muscle co-ordination;• decreased muscle and bone growth; and• hearing damage.
While low-level exposure is most common, expo-sure to high levels of Pb can have devastating effectson children, including seizures, unconsciousness and,in some cases, death.
Although children are especially susceptible to Pbexposure, it can also be dangerous to adults. In adults,high Pb levels can cause
• increased chance of illness during pregnancy;• harm to foetus, including brain damage or death;• fertility problems (in men and women);• high blood pressure;• digestive problems;• nerve disorders;• memory and concentration problems, and• muscle and joint pain.
Distribution of Lead (Pb) in Rocks
Parent rocks of the Lavrion urban area mainly consistof marble, schist, schistose-gneiss, prasinite, calcare-ous sandstone and conglomerate (Fig. 2). Fault brecciaand outcrops of polymetallic and iron mineralisationare of minor significance, since they occur at a fewlocations. Marble and schist are the dominant rocktypes (Table 1). Statistical parameters of Pb concentra-tions in different rocks, occurring in the Lavrion studyarea, are tabulated in Table 7 and displayed in Fig. 4.
Marble has the greatest variation in Pb (0.5–1,850 ppm; coefficient of variation, Cv, 362.2%),
Table 7 Statistical parameters of lead (ppm Pb) concentrations in samples of rocks (marble, schist, schistose-gneiss,prasinite, sandstone and conglomerate), Lavrion urban area
Statisticalparameters
All rocktypes Conglomerate Marble Prasinite Sandstone Schist Schistose-gneiss
General rock-typemean∗
17.0 − 5.0 4.0 10.0 22.0 −
Number of samples 140 3 88 4 6 33 4Detection limit 1.0 1.0 1.0 1.0 1.0 1.0 1.0Minimum 0.5 37 0.5 0.5 22 8 6Maximum 1,850.00 1,040.00 1,850.00 60 58 810 54Mean 76.85 602.33 54.61 19.63 35.67 111.82 18.75Median 22 730 18 9 31 39 7.5First quartile 11.5 − 10 3.25 24 16.5 6Third quartile 54 − 39.5 36 48 72.25 31.5Standard deviation 209.06 513.54 197.81 27.32 14.76 192.58 23.54Coefficient of
variation (%)272.03 85.26 362.2 139.23 41.38 172.22 125.56
Source: Data from Demetriades et al., 1999 h, Table 3.1, p. 67∗Reimann et al. (1998)

Medical Geology in Hellas: The Lavrion Environmental Pollution Study 367
Rock typeP
b (p
pm)
All rocks Conglo-merate
Fault-breccia
Fe-minerals Marble Prasinite Sandstone Schist Schistose-gneiss
0
500
1000
1500
2000Fig. 4 Multiple boxplotshowing the statisticaldistribution of lead (Pb) indifferent rock types occurringin the Lavrion urban area(from Demetriades et al.,1999 h, Fig. 3.1, p.67); referto Table 7 for statistics
with a mean of 54.6 ppm and a median of 18 ppm.High Pb levels in marble occur in areas whereit is altered (ankeritised) and slightly mineralised(calamine). Schist has also highly variable Pb concen-trations (8–810 ppm; Cv=172.22%) and more anoma-lous values than marble, as indicated by the mean,median, first and third quartiles (Table 7; Fig. 4).Geochemically anomalous Pb levels in schist occurnear its contact with altered marble. It is noted thatbase metal mineralisation occurs at the contact ofmarble and schist and is mainly hosted in marble.Schistose-gneiss (6–54 ppm Pb; Cv =125.56%), prasi-nite (0.50–60 ppm Pb; Cv =139.23%) and calcareoussandstone (22–58 ppm Pb; Cv=41.38%) do not haveexcessive Pb concentrations. The only deviation is byconglomerate (37–1,040 ppm Pb; Cv=85.26%), whichlocally contains altered mineralised marble pebbles.
From the geochemical exploration point of view,only marble and schist exhibit anomalous Pb concen-trations (Fig. 5a). The outliers of the boxplot (Fig. 4)display this characteristic (Kürzl, 1988; O’Connoret al., 1988; Reimann et al., 2008), i.e. for marble thereare outlying anomalous values >83.75 ppm Pb and forschist >155.88 ppm Pb. A major northeast to southwesttrending geochemical anomaly extends from AghiosAndreas to Noria and a minor one in the PrassiniAlepou area. Slightly elevated Pb contents occur aboutFougara hill and Kiprianos. The marble in these areasis oxidised to a variable degree. Lead levels in rocksamples from other parts of the Lavrion urban areaare within the local geochemical background range(0.5–22 ppm Pb).
Distribution of Lead (Pb) in MetallurgicalProcessing Wastes
The statistical distribution of Pb in samples of met-allurgical processing wastes is tabulated in Table 8and displayed in Fig. 6. Pyrite tailings, pyritiferoussand and slag, show the greatest variation in Pb lev-els, because of differences in the chemical compo-sition of the primary ore and metallurgical process-ing method, i.e. pyrite tailings 9,800–85,200 ppm Pb(Cv=52.65%) with a mean and median of 47,042 and45,400 ppm Pb, respectively; pyritiferous sand with avariation from 3,800 to 41,200 ppm Pb (Cv=89.08%)and a mean of 19,130 and median of 16,765 ppm Pband slag with values between 5,000 and 51,200 ppmPb (Cv=72.09%). The narrowest range is shownby the flotation residues (18,500–28,100 ppm Pb;Cv=12.54%). Sand-blast material, whish is crushedslag, and the earthy material within slag have highermean and median values with respect to slag. This isexplained by the finer grain size of these materials.
Distribution of Lead (Pb) in Overburden
Figure 5b shows the spatial distribution of total Pbin overburden, including residual soil. The dominantfeatures, governing the spatial distribution of Pb in theLavrion surface environment, are the heaps of metal-lurgical processing wastes, i.e. flotation residues, pyrite
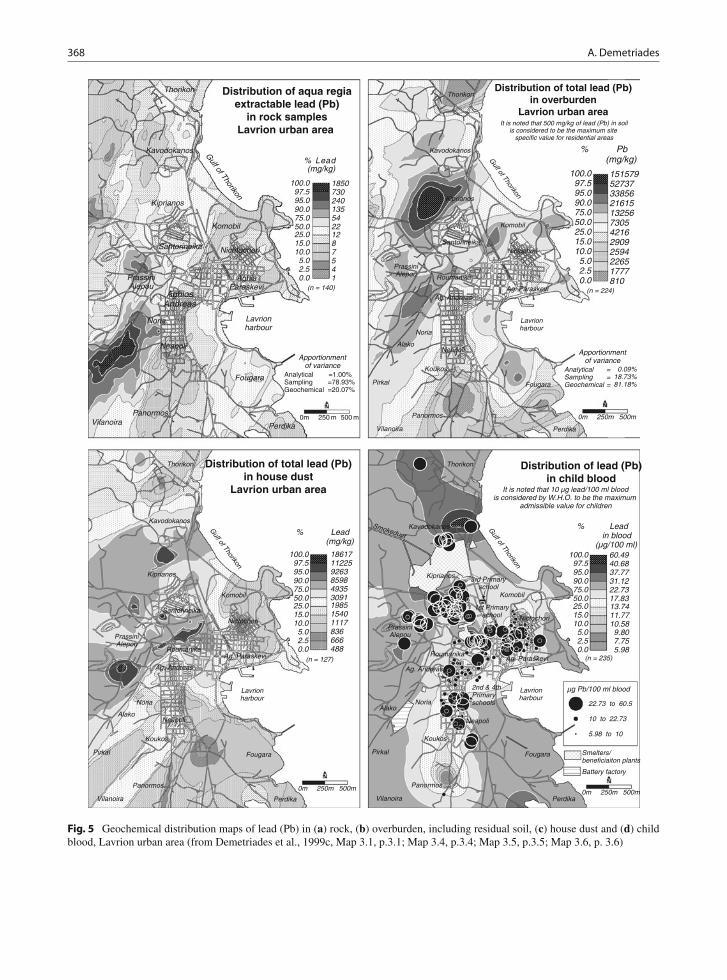
368 A. Demetriades
(n = 224)
15157952737338562161513256730542162909259422651777810
100.097.595.090.075.050.025.015.010.05.02.50.0
% Pb (mg/kg)
It is noted that 500 mg/kg of lead (Pb) in soilis considered to be the maximum site
specific value for residential areas
Distribution of total lead (Pb)in overburden
Lavrion urban area
0m 250m 500m
Lavrionharbour
Gulf of Thorikon
Vilanoira Perdika
Panormos
Pirkal
Koukos
Fougara
Noria
PrassiniAlepou
Komobil
Kiprianos
Kavodokanos
Thorikon
AlakoNeapoli
Ag. Andreas
Roumanika
Ag. Paraskevi
NictochoriSantorineika
AnalyticalSamplingGeochemical
===
0.09%18.73%81.18%
Apportionmentof variance
5.02.50.0
25.015.010.0
90.075.050.0
100.097.595.0
836666488
198515401117
859849353091
18617112259263
% Lead (mg/kg)
(n = 127)
Lavrionharbour
Gulf of Thorikon
Vilanoira Perdika
Panormos
Pirkal
Koukos
Fougara
Noria
PrassiniAlepou
Komobil
Kiprianos
Kavodokanos
Thorikon
AlakoNeapoli
Ag. Andreas
RoumanikaAg. Paraskevi
Nictochori
Santorineika
0m 250m 500m
Distribution of total lead (Pb)in house dust
Lavrion urban area
µg Pb/100 ml blood
22.73 to 60.5
10 to 22.73
5.98 to 10
5.02.50.0
25.015.010.0
90.075.050.0
100.097.595.0
9.807.755.98
13.7411.7710.58
31.1222.7317.83
60.4940.6837.77
% Lead in blood (µg/100 ml)
Battery factory
Smelters/beneficiaiton plants
3rd Primaryschool
1st Primaryschool
2nd & 4thPrimaryschools
Lavrionharbour
Gulf of Thorikon
Vilanoira Perdika
Panormos
Pirkal
Koukos
Fougara
Noria
PrassiniAlepou
Komobil
Kiprianos
SmokeductKavodokanos
Thorikon
Alako
Neapoli
Ag. Andreas
RoumanikaAg. Paraskevi
Nictochori
It is noted that 10 µg lead/100 ml bloodis considered by W.H.O. to be the maximum
admissible value for children
Distribution of lead (Pb)in child blood
0m 250m 500m
(n = 235)
0m 250 m 500 m
5.02.50.0
25.015.010.0
90.075.050.0
100.097.595.0
541
1287
1355422
1850730240
% Lead (mg/kg)
Lavrionharbour
Kiprianos
AghiaParaskevi
AghiosAndreas
Santorineika
PrassiniAlepou
Perdika
Thorikon
Kavodokanos
Neapoli
Nichtochori
Fougara
Komobil
Noria
VilanoiraPanormos
Gulf of Thorikon
Distribution of aqua regiaextractable lead (Pb)
in rock samplesLavrion urban area
(n = 140)
Analytical =1.00%Sampling =78.93%Geochemical =20.07%
Apportionmentof variance
Fig. 5 Geochemical distribution maps of lead (Pb) in (a) rock, (b) overburden, including residual soil, (c) house dust and (d) childblood, Lavrion urban area (from Demetriades et al., 1999c, Map 3.1, p.3.1; Map 3.4, p.3.4; Map 3.5, p.3.5; Map 3.6, p. 3.6)

Medical Geology in Hellas: The Lavrion Environmental Pollution Study 369
Table 8 Statistical parameters of aqua regia extractable lead (Pb) concentrations in samples of metallurgical processing wastes,Lavrion urban area (values in ppm or mg/kg)
Statistical parametersFlotationresidues
Pyritiferoussand
Pyritetailings
Sand-blastmaterial Slag
Earthy materialwithin slag
Number of samples 8 6 12 8 21 7Detection limit 1 1 1 1 1 1Minimum 18500 3800 9800 12300 5000 5080Maximum 28100 41200 85200 32800 51200 30800Mean 24537.5 19130 47041.7 19700 16495.2 19482.9Median 24950 16765 45400 17250 11800 18500First quartile 23050 3850 24650 14600 8575 15050Third quartile 26850 32400 70400 24400 21550 26500Standard deviation 3077.5 17041.8 24769.8 7741.4 11892 8757.5Coefficient of variation (%) 12.5 89.1 52.7 39.3 72.1 44.9
Source: Data from Demetriades et al., 1999c, Map 3.2, p. 3.2
Metallurgical waste
Pb
(ppm
)
Flotationresidues
Py-sand Pyritetailings
Sand-blast Slag Slag-earth0
20000
40000
60000
80000
100000
Fig. 6 Multiple boxplot showing the statistical distribution oflead (Pb) in samples from the different types of metallurgicalprocessing wastes in the Lavrion urban area (from Demetriadeset al., 1999 h, Fig. 3.2 , p. 68); refer to Table 8 for statistics
tailings and slag (Fig. 3). Their dominant orientationsare northeast to southwest, and northwest to southeast.
Lead concentrations vary from 810 to 151,579 ppm,with a mean of 11,578 ppm, median of 7,305 ppm anda coefficient of variation of 133.79%, which indicatesthe great variability of Pb in overburden. It is quiteapparent that high Pb contents in overburden materials,including residual soil, are mainly due to metallurgicalprocessing activities. Emissions from smelters and theenormous amount of metallurgical wastes, deposited inthe Lavrion urban area, and subsequent transportationof fine-grained fractions by aeolian processes (defla-tion) have contaminated even the remotest sites in thestudy area.
The greatest concentrations of Pb occur in areascovered by the metallurgical processing wastes. Thesmelter and its surrounding area (Kiprianos) have thehighest Pb contents (21,615–151,579 ppm). The next
area with high Pb levels occurs over the flotationresidues (13,256–33,856 ppm) and extends from Alakoin the south to Prassini Alepou and Kiprianos to thenorth (Fig. 5b). The area is inhabited and there are alsoagricultural activities (vegetables, olive groves, vines)and animal husbandry.
Distribution of Lead (Pb) in House Dust
Figure 5c illustrates the distribution of total Pb in housedust. The highest Pb concentrations in indoor dustoccur in houses situated over metallurgical processingwastes and, especially, the flotation residues or tailings.It is indeed very disturbing to have total Pb contentsin Lavrion homes varying from 488 to 18,617 ppm(mean=4,006 ppm Pb; median=3,091 ppm Pb). Thenotched box-and-whisker plot (Fig. 7) shows that there
Sample type
Pb
(ppm
)
Rock Met-Waste Overburden House dust0
40000
80000
120000
160000
Fig. 7 Lead (Pb) contents in samples of rock (n=140), metallur-gical processing wastes (n=62), overburden (n=224) and housedust (n=127), Lavrion urban area (from Demetriades et al.,1999 h, Fig. 3.11, p. 91)

370 A. Demetriades
is a trend of higher to lower Pb concentrations fromthe metallurgical wastes to overburden materials andhouse dust.
There appears to be a spatial relationship betweentotal Pb in overburden (Fig. 5b) and house dust samples(Fig. 5c). Linear regression analysis of logarithmically(base 10) transformed Pb concentrations shows alsothat there is a strong linear correlation with a coeffi-cient of 0.7 (Fig. 8). The coefficient of determination,R2% statistic, indicates that the fitted model explainsabout 49% of the variability of total Pb in the twosample media. In Tables 9 and 10 are tabulated the cal-culated regression and analysis of variance parameters,respectively. The equation of the fitted model is givenbelow:
log10 Pb in house dust = 0.781202 + (0.711294
× log10 Pb in overburden)
Log Pb (ppm) in overburden
2.5 3.0 3.5 4.0 4.52.5
3.0
3.5
4.0
4.5
Log
Pb
(ppm
) in
hou
se d
ust
Fig. 8 Scatter plot of log10 Pb contents in house dust andoverburden samples (n=126), linear regression line and 95%confidence limits (dotted lines) (from Demetriades et al., 1999 h,Fig. 3.3, p.70)
Table 9 Linear regression analysis of house dust and overbur-den total lead (Pb) contents (n=126 pairs)
Parameter Value EstimateStandarderror t statistic p value
InterceptSlope
0.781200.71129
0.248910.06514
3.1385110.92020
0.00210.0000
Correlationcoefficient, R
R 2%Standard error
of estimate
0.700
49.0240.232
Source: Data from Demetriades et al., 1999 h, Table 3.2, p. 70
Table 10 One-way analysis of variance of house dust andoverburden total lead (Pb) concentrations (n=126 pairs)
SourceSum ofsquares
Degrees offreedom
Meansquare F ratio p value
ModelResidual
6.391556.64614
1124
6.391550.05360
119.25 0.0000
Total(corr.)
13.03770 125
Source: Data from Demetriades et al., 1999 h, Table 3.3, p. 70
Since, the p value in the ANOVA table (Table 10)is less than 0.01, there is a statistically significant rela-tionship between total Pb in house dust and total Pbin overburden materials at the 99% confidence level.Hence, the above equation may be used to predict totalhouse dust-Pb concentrations from total overburden Pbin areas where there are no house dust samples.
Distribution of Blood-Lead in Children
Figure 5d shows the actual and interpolated blood-Pb(b-Pb) contents in 235 nursery and primary school agechildren in the Lavrion urban area, provided by themedical researchers of the last cross-sectional epidemi-ological study, which was carried out from 1 to 25March 1988 (Makropoulos et al., 1991, 1992a, b).
Blood-Pb concentrations vary from 5.98 to60.49 μg/100 ml, with a mean of 19.43 μg/100 mland a median of 17.83 μg/100 ml (Cv=43.44%).An astounding 95% of the children have b-Pb levelsexceeding 10 μg/100 ml, the level of “concern” (USEPA, 1986, 1998; ATSDR, 1988). This is indeedworrying, but not unexpected, when overburden inthe Lavrion urban area has total Pb concentrationsvarying from 810 to 151,579 ppm (Fig. 5b) andhouse dust 488 to 18,617 ppm (Fig. 5c). Makropouloset al. (1991) collected samples of floor dust, sand pitmaterial and surface soil from the second and fourthprimary schools, the school furthest away from thesmelter (about 1,500 m); lead contents in the differentmaterials were
• 3,780 ppm Pb in floor dust;• 253 ppm Pb in sand pit material; and• 10,283 ppm Pb in surface soil outside the school.
Makropoulos et al. (1991) did not realise the signif-icance of Pb concentrations in floor dust and surface

Medical Geology in Hellas: The Lavrion Environmental Pollution Study 371
soil samples from the second and fourth primaryschool, which is at a distance of approximately 1,500 mfrom the smelter at Kiprianos, but are situated in con-taminated areas. Using the regression equation above,and the concentration of 10,283.27 ppm Pb determinedon soil outside the school, a value of 4,315 ppm Pbhas been calculated for school dust. This value dif-fers by approximately 14% from the analytical valueof 3,780 ppm Pb, which is an acceptable difference,after considering analytical and sampling errors, andthe linear correlation coefficient of 0.7. A direct rela-tionship between surface “soil” and house dust or floordust is thus verified, within the limits of acceptableerror variation.
As it has been pointed out by many researchers,soil-Pb and house dust-Pb contribute much more toblood-Pb than does air Pb (Yankel et al., 1977; Schmittet al., 1979; Roels et al., 1980; Brunekreef et al., 1981;Culbard et al., 1983; Duggan, 1983; Brockhaus et al.,1988; Reagan and Silbergeld, 1990; Thornton et al.,1990; Cotter-Howells and Thornton, 1991; Fergusonand Marsh, 1993; Watt et al., 1993; Ferguson et al.,1998). Hence, the geostatistical interpolation of actualb-Pb values (Fig. 5d) was based on the knowledge ofPb distribution in surficial materials, i.e. metallurgi-cal processing wastes (Fig. 5a), overburden materials(Fig. 5b) and house dust (Fig. 5c).
High b-Pb concentrations in children are found inthe areas where there are metallurgical processingwastes. Houses are either built on or very close tothese wastes. Further, overburden materials, includingresidual soil, and house dust are highly contaminated(Figs. 5b and 5c). These confounding factors play asignificant role in the high b-Pb levels of Lavrionchildren, found in different areas, e.g.
• in the Prassini Alepou area they are attributedto the fact that houses are built on flotationtailings;
• to the south of the disused ore washing plant (cen-tral part of the map) they are mainly ascribed to(a) aeolian transportation of fine-grained flotationtailings and (b) contaminated soil;
• to the north of the smelter in the Kavodokanosarea they may be due to (a) contaminated soil, (b)smelter wastes and (c) father working at the smelter;
• the single high b-Pb value on the coastal road inthe Kavodokanos area is most likely due to (a)
contaminated soil and (b) proximity to metallurgicalwaste heaps; and
• the single high b-Pb value in the Thorikon area(north part of the map) is definitely attributed to (a)contaminated soil and (b) proximity to a metallurgi-cal waste heap.
It is quite apparent from the above description thatcontaminated soil and the metallurgical processingwastes play a significant role in the b-Pb contentsof Lavrion children. There is clearly a correlationbetween the distribution of total Pb in overburden(Fig. 5b) and b-Pb (Fig. 5d). Generally, low b-Pblevels in children are found in areas where “soil” isnot intensely contaminated, e.g. (a) Panormos-Koukos-Neapoli-Aghios Andreas area, (b) Aghia Paraskevi-Nichtochori area and (c) the area directly north ofSantorineika.
High Pb levels in overburden and house dust, thecomponents in direct contact with children, are verysignificant to elevated b-Pb contents, when such mate-rials are inhaled or ingested by children. Althoughsoil pica for Lavrion children was mentioned by med-ical researchers (Maravelias et al., 1989), they didnot realise its importance and persisted to explainobserved high b-Pb levels in children to smelter emis-sions (Makropoulos et al., 1991). Recent studies onsoil pica behaviour of children have shown that somechildren may ingest up to 25–60 g of soil during a sin-gle day (Calabrese et al., 1997). The US EPA on theother hand, for purposes of estimating potential healthrisks on children, assumed that most children ingestrelatively small quantities of soil (e.g. <100 mg/day),while the upper 95th percentile are estimated to ingest200 mg/day on average (US EPA, 1996). As Calabreseet al. (1997) pointed out, soil ingestion studies nor-mally last for about a week or less and, therefore, it isnot possible to obtain a clear understanding of intra-individual variability in soil ingestion activity. Theirmodel, however, which is based on their long expe-rience in soil ingestion studies on children (Stanekand Calabrese, 1995) indicates that for 1–2 days/year:
• 62% of children will ingest >1 g of soil,• 42% of children will ingest >5 g of soil, and• 33% of children will ingest >10 g of soil (Calabrese
et al., 1997).

372 A. Demetriades
Their conclusions are
(a) for the majority of children, soil pica may occuronly on a few days of the year, but much morefrequently for others;
(b) soil pica, although highly variable, is an expectedactivity in a normal population of young children,rather than an unusual activity in a small subset ofthe population, and
(c) the implications of soil pica are significant for riskassessment.
In Lavrion, a moderate to strong northeasterly windis blowing almost throughout the whole year. Thecomparatively dry climate for most months aids trans-portation of dust by wind. Fugitive dust, which is dustreleased from soil by the action of wind, with or with-out the assistance of mechanical disturbance (Fergusonet al., 1998) is a major hazard in Lavrion. At the headheight of a young child, fugitive dust appears to beconsiderable, for it was experienced on the face of thesampling team during kneeling down for overburdensampling. Particles of less than 10 μm diameter arenormally assumed to be respirable; larger particles aretrapped in the upper respiratory tract, from where theyare expectorated or swallowed (Ferguson et al., 1998).In a study of Pb exposure in young children from dustand soil in the United Kingdom, Thornton et al. (1990)estimated Pb uptake by a young child to be 36 μgPb/day, of which 1 μg was by inhalation and 35 μgby ingestion.
It is quite apparent from the above discussion thatPb contents in “soil” and “dust” are important toexposure assessment of young children in Lavrion.
Lead (Pb) in Deciduous Teeth
Deciduous teeth were collected in 1991 from 82Lavrion children of 6–12 years old in order to assessPb absorption and to compare the results with non-industrial areas. The teeth were analysed for Pb at theDepartment of Anatomy of the University of Bergenin Norway. Lead concentrations in deciduous teethof Lavrion children vary from 0.97 to 153.26 μg/gwith a mean of 9.88 μg/g (Stavrakis et al., 1994a).The pre-industrial deciduous teeth Pb contents in chil-dren, of the same age range as Lavrion, vary from0.20 to 4.37 μg/g with a mean 0.91 μg/g (Fosse andWesenberg, 1981). Typical Pb levels in deciduous teeth
vary from <0.1 to 50 μg/g (Ferguson, 1990). The con-clusion is that Pb is in a bioaccessible form, as isshown by the comparatively high concentrations in thedeciduous teeth of Lavrion children.
Toxic Effects of Arsenic
Arsenic in minute amounts is an essential elementfor some organisms, even humans, but in excess ishighly toxic with teratogenic properties (Gough et al.,1979; Mervyn, 1985, 1986; Reimann et al., 1998;Chappell et al., 1999). Toxicity depends on the valencestate of As compounds, e.g. As5+ compounds areless toxic than As3+. Uptake of high arsenic con-centrations causes gastrointestinal problems, whichare accompanied by diarrhoea together with bloodloss, and is followed by the destruction of capil-lary vessels and inflammation of intestinal walls. Asa consequence of this rapid loss of liquids, circula-tory insufficiency appears, which if not treated couldcause death after a shock. Inflammation of lungs anddyspnoea is caused by acute inhalation of arsenicalcompounds.
With chronic exposure to arsenic, which could bethe case in Lavrion, the more common effects includegradual loss of strength, diarrhoea or constipation, pig-mentation and scaling of skin, which may undergomalignant changes, nervous manifestations markedby paralysis and confusion, degeneration of fatty tis-sue, anaemia and development of characteristic streaksacross the fingernails.
Food is considered to be the most important sourceof arsenic exposure to the human population. In adults,the daily total intake of arsenic from food is estimatedto be less than 200 μg. This value depends mainly onthe amount of sea food consumed. The largest part ofthis arsenic is in an organic form. In water, arsenicpredominantly exists in an inorganic form.
More information on the toxic effects of arsenic canbe found in the literature, as for example in Chappellet al. (1999).
Distribution of Arsenic (As) in Rocks
Arsenic was determined on only 48 rock samples fromthe 140 collected. Its statistical parameters and distri-bution are tabulated in Table 11 and shown in Fig. 9.

Medical Geology in Hellas: The Lavrion Environmental Pollution Study 373
Table 11 Statistical parameters of aqua regia extractablearsenic (ppm As) in all rock types, marble and schist, Lavrionurban area
Statistical parameters All rocks Marble Schist
Global rock-type mean∗ 2.00 1.50 13.00Number of samples 48 37 10Detection limit 5.00 5.00 5.00Minimum 2.50 2.50 5.02Maximum 1,032.39 1032.39 42.61Mean 62.82 76.27 18.71Median 15.56 12.77 19.76First quartile 6.91 5.73 10.35Third quartile 29.01 30.06 24.13Standard deviation 172.39 194.82 11.03Coefficient of variation (%) 274.52 255.45 58.97
Source: Data from Demetriades and Vergou-Vichou, 1999c,Table 4.2A, p. 20∗From Reimann et al. (1998)
Marble has the great variation with values rangingfrom <5 to 1,032 ppm As, with mean and median of76.27 and 12.77 ppm As, respectively. Schist has val-ues varying from 5.02 to 42.61 ppm As, with a mean of18.71 and a median of 19.76 ppm As. Anomalous Asconcentrations occur in marble and are found in areaswhere the marble is altered.
Distribution of Arsenic (As) inMetallurgical Wastes
Arsenic levels are considerably high and very variablein samples from the different types of metallurgicalprocessing wastes, i.e. from 283 to 26,063 ppm(Table 12, Fig. 10). The widest variation of As values
Rock type
As
(ppm
)
All rocks Marble Prasinite Schist0
20406080
100120140160
Fig. 9 Multiple boxplot of the distribution of aqua regiaextractable arsenic (As) in different rock types occurring inthe Lavrion urban area. Note that the category “All rocks” and“Marble” have four anomalous samples over 160 ppm As (i.e.218, 377, 544 and 1032 ppm) (from Demetriades and Vergou-Vichou, 1999c, Fig. 4.2A, p. 20); refer to Table 11 for statistics
is found in flotation residues (2,470–26,063 ppm), fol-lowed by pyritiferous sand (3,875–14,440 ppm), pyritetailings (2,893–14,747 ppm) and slag earth (684–15,907 ppm). Slag (283–6,236 ppm As) and sand-blast material (854–2,243 ppm As) have comparativelylower As contents.
Slag, apart from one sample high in As fromKavodokanos (Fig. 3), has the lowest values. Arsenic isenriched in slag earth and sand-blast material in com-parison to samples of slag, a feature already noted forPb, and is explained by the fact that these materials arefiner grained.
Pyrite tailings of the Nichtochori-Komobil areahave higher As contents than the ones at Kavodokanos,Kiprianos and Santorineika (Fig. 3). Pyritiferoussand samples from the beach, between Komobil
Table 12 Statistical parameters of aqua regia extractable arsenic (As) concentrations in samples of metallurgical processingwastes, Lavrion urban area (values in ppm or mg/kg)
Statistical parametersFlotationresidues
Pyritiferoussand
Pyritetailings
Sand-blastmaterial Slag
Earthy materialwithin slag
Number of samples 8 6 12 8 21 7Detection limit 5.0 5.0 5.0 5.0 5.0 5.0Minimum 2469.9 3874.9 2892.6 853.9 282.5 684.1Maximum 26063.3 14440.1 14747.2 2243.2 6136.4 15906.8Mean 9415.9 7225.2 7325.3 1710.3 929.3 6427.4Median 4633.0 4740.9 5214.8 1803.5 512.6 3793.4First quartile 2913.9 4306.5 4281.7 1387.8 399.8 2692.8Third quartile 15850.2 11247.6 10358.5 2101.2 791.8 11610.6Standard deviation 8853.5 4479.4 4078.5 488.5 1268.3 5955.3Coefficient of variation (%) 94.0 62.0 55.7 28.6 136.5 92.7
Source: Data from Demetriades et al., 1999b, Map 5.3, p. 5.3

374 A. Demetriades
Metallurgical waste
As
(ppm
)
Flotationresidues
Py-sand Pyritetailings
Sand-blast Slag Slag-earth0
5000
10000
15000
20000
25000
30000
Fig. 10 Multiple boxplot of the statistical distribution of arsenic(As) in samples from the different types of metallurgical pro-cessing wastes in the Lavrion urban area (from Demetriades andVergou-Vichou, 1999b, Fig. 5.3, p. 104); refer to Table 12 forstatistics
and Kiprianos, have comparatively higher As lev-els compared to the ones further inland. Arsenicconcentrations in samples of flotation residues fromKavodokanos have considerably higher than thosefrom Noria-Prassini Alepou-Santorineika. These dif-ferences in the levels of arsenic are mainly due to thechemical composition of the processed primary ore.
Distribution of Arsenic (As) in Overburdenand House Dust
Arsenic in overburden samples varies from 50 to24,000 ppm, with a mean of 2,494 ppm (s=±3,558 ppm; Cv=142.66%) and a median of1,290 ppm (n=224) (Fig. 11). Whereas in house dustsamples from Lavrion homes As levels vary from 130to 3,820 ppm with a mean of 5,435 (s=±507.1 ppm;Cv=9.33%) and a median of 400 ppm (n=127).
Major geochemical anomalies in overburden sam-ples, with As concentrations above 1,290 ppm, haveNE-SW and NW-SE trends and occur over andin the immediate neighbourhood of the flotationresidues (Noria-Prassini Alepou-Santorineika), pyritif-erous wastes (Komobil, Nichtochori) and slag/sand-blast material (at Fougara, Aghia Paraskevi, within thesmelter area at Kiprianos and Kavodokanos) (Fig. 11).The strongest geochemical anomalies >6,000–24,000As occur over the pyrite tailings and pyritiferoussand from Nichtochori to Komobil and Kiprianos, andwithin the premises of the smelter. Distinct haloesextend about the geochemical anomalies down to
380 ppm As, although even lower levels, to 50 ppm As,may be attributed to aerial dispersion from the smeltersand metallurgical wastes.
It is apparent from the spatial and statistical distribu-tion of As in different sample types (Fig. 12) that themetallurgical processing wastes are the major sourceof contamination of overburden samples. The contri-bution of As from rock samples, as is also the casefor all elements, is totally masked by its higher con-centrations in metallurgical wastes. Both sample types,metallurgical wastes and overburden, contribute to thecontamination of house dust.
If a contamination index for As in overburden andhouse dust samples is estimated, with respect to itsmedian in parent rocks, this ratio varies from 3.2 to1,538.5 in overburden samples and from 8.3 to 244.9 inhouse dust samples. These values show the very highcontamination of overburden and house dust samplesby As.
Mobility of As is generally moderate under oxi-dising, acid and neutral to alkaline conditions, andvery low under reducing conditions (Levinson, 1980;Hoffman, 1986; Reimann et al., 1998). Ferguson(1990), however, states that an increase in pH, as forexample by liming, increases the mobility of arsenitesalts, presumably by bringing about a change fromaluminium [AlAsO4] and iron [FeAsO4] arsenatesto calcium arsenates [Ca3(AsO4)2]. If this is thecase, then Lavrion has a significant problem. Anotherimportant issue is the long residence time of As insoil, which according to Ferguson (1990) is 2,000years.
It is quite apparent from the above description thatAs levels in Lavrion overburden materials are abnor-mally high and may be hazardous to biota in general.Toxicity, as in all cases, depends on the concentrationof easily soluble and bioaccessible part of As, and notits total content in soil, an aspect that will be discussedbelow.
Distribution of Arsenic (As) in Urine
Eikmann et al. (1991) investigated in 1988 twoindustrial areas in Hellas, Lavrion and Elefsina-Aspropyrgos, and a background reference town,Loutraki, which is a spa town on the Bay of Corinthwith no heavy or light industrial pollution. The indus-trial area of Elefsina-Aspropyrgos to the west ofAthens is characterised by steel industry, refineries,

Medical Geology in Hellas: The Lavrion Environmental Pollution Study 375
(n = 224)
2400014000110006000223012907755803802009650
100.097.595.090.075.050.025.015.010.0
5.02.50.0
% As (mg/kg)
Lavrionharbour
Gulf of Thorikon
Vilanoira Perdika
Panormos
Pirkal
Koukos
Fougara
Noria
PrassiniAlepou
Komobil
Kiprianos
Kavodokanos
Thorikon
AlakoNeapoli
Ag. Andreas
Roumanika
Ag. Paraskevi
NictochoriSantorineika
AnalyticalSamplingGeochemical
===
0.39% 1.34%98.27%
Apportionmentof variance
Distribution of arsenic (As)in overburden
Lavrion urban area
0m 250m 500m
Fig. 11 Geochemicaldistribution map of arsenic(As) in samples ofoverburden, including residualsoil (from Demetriades et al.,1999d, Map 6.3, p. 6.3)
a waste oil combustion plant and factories producinglead alkyls; an additional form of pollution is the emis-sions from traffic on the national highway betweenAthens and the Peloponnese.
Table 13 shows the arsenic concentrations in24 hour urine (24 h) of workers from the Lavrion leadsmelter and Alako battery factory, and the Aspropyrgosrefinery. The urine-As values of Aspropyrgos workersare well below the recommended limit of 40 μg/24 h,whereas those of the Lavrion workers exceed it, i.e.70.6% of the smelter workers and 45.2% of the batteryfactory workers.
In Table 14 are tabulated the urine-As concen-trations in children from Lavrion, Aspropyrgos andLoutraki. The children from Aspropyrgos and Loutrakishow approximately similar mean and median
urine-As excretion values, whereas those fromLavrion are higher by more than two times. Thefrequency distribution of individual urine-As valuesshows once again the tendencies observed in the work-ers (Table 13). About 8.4% of Lavrion children haveAs excretion values above the recommended limit of20 μg/24 h; the As excretion values of Aspropyrgosand Loutraki children, with only one exception in eachcase, are below the recommended limit.
Ten years later, on the 19th November 1998, morn-ing urine was collected from 65 Lavrion inhabitants,and the samples were analysed at the Institute ofAnalytical Chemistry of the University Karl-Franzensin Graz, Austria. Evaluation of results is based on thelimit of 100 μg As/l urine, which is considered tobe the maximum exposure for working adults (Caroli

376 A. Demetriades
Sample type
As
(ppm
)
Rock Met-Waste Overburden House dust0
5000
10000
15000
20000
25000
30000
Fig. 12 Multiple notched box-and-whisker plot comparing thearsenic (As) statistical distribution in different sample types,rock (n=48), metallurgical wastes (n=62), overburden (n=224)and house dust (n=127) (from Demetriades and Vergou-Vichou,1999d, Fig. 6.3, p. 142)
et al., 1994). It appears that 37% of the 65 Lavrioninhabitants have urine-As concentrations above thislimit.
The results show that there are high concentrationsof As in urine in the areas of Prassini Alepou (23.7–1,279 μg As/l, mean 229.5 and median 58.4 μg As/l)and Kavodokanos (29.7–831.5 μg As/l, mean 210.8,median 192.7 μg As/l), where the inhabitants are indirect contact with the metallurgical processing wastes(Table 15, Fig. 13). In some areas there are elevatedAs contents in urine in one or two samples, whichaffect the statistical distribution, e.g. at Roumanika oneurine sample has a concentration of 1,095 μg As/l, atNichtochori there is also one sample with 448 μg As/land at Aghia Paraskevi there are two samples with 244and 285.6 μg As/l.
The residential areas with the lowest urine-As con-centrations are Kiprianos (10.2–28.5 μg As/l, mean18.3, median 17.5 μg As/l) and Neapoli (19.5–59.0 μgAs/l, mean 42.9, median 45.4 μg As/l), which have avery small amount of metallurgical processing wastes,
Table 13 Arsenic concentration in adult urine (μg/24 h) from workers of different factories in Lavrion and Aspropyrgos, anindustrial town
Town/industry N Mean Median95thpercentile Range
Frequency<40 μg/24 h
Frequency>40 μg/24 h
Lavrion lead smelter 34 77.42 73.15 191.7 1.84–192.95 10 (29.4%) 24 (70.6%)Lavrion battery factory 31 43.97 36.69 121.6 8.54–173.12 17 (54.8%) 14 (45.2%)Aspropyrgos refinery 25 14.17 14.23 25 1.70–26.54 25 (100%) 0 (0.0%)
Source: Data from Eikmann et al., 1991, Tables 1 and 2, p. 464
Table 14 Arsenic concentration in child urine (μg/24 h) from Lavrion, Aspropyrgos (industrial town) andLoutraki (a spa town)
Town N Mean Median95thpercentile Range
Frequency<20 μg/24 h
Frequency>20 μg/24 h
Lavrion 261 8.59 5.76 65.9 0.53–77.23 239 (91.6%) 22 (8.4%)Aspropyrgos 128 3.58 2.69 18.2 0.24–20.42 127 (99.2%) 1 (0.8%)Loutraki 193 4.03 2.83 22.3 0.62–34.84 192 (99.5%) 1 (0.5%)
Source: Data from Eikmann et al., 1991, Tables 3 and 4, p. 465
Table 15 Arsenic (As) in urine samples from different residential areas in Lavrion (values in μg As/l)
Statistical parametersAghiaParaskevi
PrassiniAlepou Kavodokanos Kiprianos Neapoli Nichtochori Roumanika
Number of samples 7 18 17 7 6 6 4Minimum 12.0 23.7 29.7 10.2 19.5 13.9 9.7Maximum 285.6 1279.0 831.5 28.5 59.0 448.0 1095.0Mean 106.8 229.5 210.8 18.3 42.9 98.0 291.0Median 50.3 58.4 192.7 17.5 45.4 24.3 29.7First quartile 16.3 29.2 72.4 15.7 32.8 15.6 16.6Third quartile 212.7 161.5 289.0 20.5 55.6 62.0 565.5Standard deviation 114.6 368.7 192.0 5.6 15.8 172.4 536.1Coefficient of variation (%) 107.3 160.6 91.1 30.5 36.8 175.9 184.2
Source: Data from Demetriades et al., 2008, Table 6, p. 594

Medical Geology in Hellas: The Lavrion Environmental Pollution Study 377
AghiaParaskevi
PrasiniAlepou
Kavodokanos Kiprianos Neapoli Nichtochori Roumanika0
300
600
900
1200
1500
Living placeA
s (µ
g/l)
in u
rine
100 µg As/l urine
Fig. 13 Multiple boxplotshowing the statisticaldistribution of urine-As in65 people living in differentresidential areas of Lavrion(from Demetriades et al.,2008, Fig. 11, p. 620); referto Table 15 for statistics
mainly slag at Kiprianos, or none at all as is the case ofNeapoli.
The high As concentrations in the urine of Lavrioninhabitants show that it is still bioaccessible for uptake9 years after the closure of the smelter complex.Therefore, the sources of the hazard still exist, andthese are the metallurgical processing wastes and con-taminated overburden materials, including residual andalluvial soil.
Development of an EnvironmentalManagement Plan
Besides assessing the contamination of overburdenmaterials that are in direct contact with the Lavrioninhabitants, and especially children, the final objec-tive of the LIFE project “Soil Rehabilitation in theMunicipality of Lavrion” was to develop an Integratedenvironmental management scheme for improving theliving conditions in Lavrion. After considering exist-ing information, and data generated in the project, twoaims were defined by Nikolaidis et al. (1999a):
1. The primary aim is to gradually minimise humanexposure to toxic elements through
• surgical remediation based on cost-benefitanalysis,
• lifestyle changes through education,• legislative action for land use changes,• health and safety guidelines, and
• elimination of consumption of contaminatedcrops and groundwater; the latter is not used fordrinking, but is utilised for irrigation purposes.
2. The secondary aim is to protect groundwaterresources and biota and to rehabilitate surface soil.Given the high degree of contamination of the
Lavrion urban area and its extent, i.e. almost cov-ering the whole study area of 7 km2, the integratedenvironmental management plan focused exclusivelyon the primary aim. Ten years later not even theitems of this objective were implemented by the localauthorities. It was stressed that implementation of therecommendations to achieve the primary aim will beto partially protect groundwater resources and biotaand the rehabilitation of “soil” to protect human recep-tors, and especially children. Therefore, the primaryaim of the proposed action plan was related to theimpacts due to “direct human exposure” to contam-inants, than to the “mobility” of contaminants fromsoil to other receptors. This distinction was consid-ered extremely important to comprehend, because itdetermined the type of analysis conducted, namely arisk-based analysis, rather than a deterministic fate andtransport exposure analysis.
Development of Site-Specific Soil ActionLevels
To formulate site-specific soil action levels (SALs)for Lavrion, one needs to take into considerationestablished risk assessment methodologies and local

378 A. Demetriades
conditions, such as the geochemical background con-centration of elements. Figure 5c presents the extentof Pb contamination of overburden materials, includ-ing residual soil, in the Lavrion urban area. TotalPb concentrations in surficial soil range from 810to 151,579 ppm, with a mean of 11,578 ppm and amedian of 7,305 ppm. These results suggest exten-sive soil contamination and lack of locations to collectbackground samples. Based on this premise, it wasdecided, as described above, to collect samples fromthe underlying bedrock to establish the local back-ground conditions (Fig. 5a). A total of 140 bedrocksamples were collected and analysed for 25 major andtrace elements. In addition, 39 duplicate rock sampleswere analysed for 44 major and trace elements. Theresults of selected elements, considered to be toxic, arepresented in Table 16. It is stressed that the Lavrionarea bedrock, because of the different mineralisingevents, is enriched in heavy metals, compared to otherareas without mineralisation. The median values of theelements tabulated in Table 16 were taken to representbackground levels.
The European Union (Ferguson et al., 1998) andthe US (US EPA, 1996) risk assessment guidelines forestablishing site-specific screening action levels werereviewed. The general guidelines are similar in nature;the difference is that US EPA has developed specificequations that can be used in environmental impactassessment. It was, therefore, decided to follow the US
Table 16 Toxic elements “background concentrations” inbedrock samples from Lavrion (n=39)
Toxic element concentration in ppm
Element Minimum Maximum Mean Median
Antimony 5 71 6 5Arsenic 2.5 540 42 11Barium 3 4087 244 78Beryllium − − − −Cadmium 1 41 2 1Chromium, total 1 610 100 20Silver 0.5 41 1 0.5Manganese 100 25000 1830 1200Copper 3 225 33 25Lead 1 1850 77 22Mercury 1 8 1 1Nickel 1 1600 168 55Vanadium 1 71 13 9Zinc 6 5200 211 57
Source: Data from Nikolaidis et al., 1999a, Table 1, p. 77
EPA risk assessment methodology for the followingreasons:
(a) it is published,(b) it is risk based,(c) it is similar to EU’s,(d) it has accessible data through the web page of US
EPA’s Integrated Risk Information System (IRIS)(http://cfpub.epa.gov/ncea/iris/),
(e) it is site-specific adaptable, and(f) it is continuously updated, as more data become
available.
The methodology differentiates between carcinogenand non-carcinogens. In general, arsenic and berylliumare the carcinogenic elements, and the rest of the heavymetals are considered to be non-carcinogenic. US EPAestablishes SALs for carcinogenic elements, allowing arisk of one-in-a-million (10–6, i.e. one additional can-cer for every million people) for each element, and ahazard index of one for the non-carcinogenic elements.The equation accounts for ingestion and inhalation ofparticulates. Dermal absorption was not considered,since very limited data are available.
Soil action levels were developed for residen-tial/recreational and industrial land uses in Lavrion andare presented in Table 17.
Using the residential or industrial SALs contamina-tion indices can be estimated. For this purpose ten toxicelements were considered, i.e. As, Ba, Be, Cd, Cr, Cu,Ni, Pb, V and Zn. The following equation was usedto calculate the contamination index for soil used forresidential and recreational purposes:
Contamination Index (CI) = [As/25 + Ba/5,500
+ Be/2 + Cd/40 + Cr/140 + Cu/2,300
+ Ni/1,500 + Pb/500 + V/550
+ Zn/20,000] − 10
For each overburden sample individual values ofeach element are divided by its respective soil actionvalue; the procedure results in an element ratio inwhich the baseline level is represented by the num-ber 1, i.e. when the actual concentration of an ele-ment is equal to its soil action level. Thus, elementratios >1 depict contamination. To estimate the totalcontamination at each sampling site, the element ratiosare summed up, and from the sum is subtracted the

Medical Geology in Hellas: The Lavrion Environmental Pollution Study 379
Table 17 Comparison of soil contamination levels with residential and industrial/commercial direct exposure SoilAction Levels (SALs) for Lavrion (n=50)
Lavrion Soil Samples
Element (ppm) Minimum Maximum Mean MedianResidential SALs(ppm)
Industrial SALs(ppm)
Antimony 28 567 192 151 30 800Arsenic 50 24,000 2,494 1,290 25 25Barium 64 4,555 663 479 5,500 140,000Beryllium 0.2 2.7 1.1 1 2 2Cadmium 4 925 68 38 40 1,000Chromium, total 2 1,083 264 183 140 140Chromium, trivalent − − − − 20,000 500,000Chromium, hexavalent − − − − 140 140Copper 43 4,445 357 186 2,300 60,000Lead 810 151,579 11,578 7,305 500 1,000Mercury∗ 1∗ 728∗ 189∗ 117∗ 20∗ 600∗Nickel 40 591 141 127 1,500 40,000Vanadium 26 325 86 75 550 14,000Zinc 591 76,310 10,872 6,668 20,000 610,000
Source: Data from Nikolaidis et al., 1999a, Table 2, p. 77∗Values of mercury in ng/g or μg/kg or ppb
sum of baseline levels, which in this case is 10, sinceten elements are considered. This is a procedure usedin mineral exploration for the compilation of total geo-chemical anomaly maps (Sainsbury et al., 1970; Siegel,1974). A map was subsequently plotted showing thetotal contamination of overburden, including resid-ual soil (Fig. 14). Contamination indices above zerodenote contamination. The contamination index mapshows that the whole Lavrion urban and sub-urban areais contaminated up to 1,121 times. This is, of course,expected, because at least two elements, Pb and As,have no values below their respective SALs.
Development of Conceptual Site Modeland Methodology for Remediation
A Conceptual Site Model (CSM) that is consistentwith the primary aim of the integrated environmen-tal management plan for the Lavrion urban area ispresented in Fig. 15. The model conforms with the his-tory of the area. Mining and metallurgical activitiesof the past 5,000 years, and especially the inten-sive metallurgical activities since 1865 in the Lavrionurban and sub-urban area, have left a large volume of“hazardous wastes” that constitute the primary pollu-tion source. Anthropogenic, aeolian and fluvial pro-cesses have spread this contamination and have formed
the secondary pollution source that is the present daysurface soil. The adverse human health effects areattributed to direct exposure (inhalation of dust parti-cles and ingestion of soil and dust) and consumptionof locally produced agricultural and animal husbandryproducts (e.g. green vegetables, fruit, milk, meat, wine,olive oil).
Surgical remediation is a methodology for ranking(in a quantitative manner) contaminated areas, whichneed to be remediated. Typically, this prioritisation isconducted through a cost–benefit analysis. The param-eters that need to be considered in such an analysis arethe following:
• degree of risk (potential impact),• sources of contamination,• exposure route (inhalation, ingestion, etc.),• land use type,• population affected,• remedial technologies and their effectiveness,• feasibility of implementation of technology (it
might be technically viable, but politically impos-sible), and
• social costs and benefits of remediation.
Thirty different land use categories (Table 6) and 11with different contaminants and geochemical charac-teristics (Table 4) were used.

380 A. Demetriades
1121719465284121664330211580
100.097.595.090.075.050.025.015.010.0
5.02.50.0
Lavrionharbour
Gulf of Thorikon
V ilanoira Perdika
Panormos
P irkal
Koukos
Fougara
Noria
P rassiniAlepou
Komobil
K iprianos
Kavodokanos
Thorikon
AlakoNeapoli
Ag. Andreas
R oumanika
Ag. Paraskevi
NictochoriS antorineika
C .I.=[As/25+Ba/5500+Be/2+C d/40+C r/140+C u/2300+ Ni/1500+Pb/500+V/550+Zn/20000] - 10
Distribution of Contamination Index(As+Ba+Be+Cd+Cr+Cu+Ni+Pb+V+Zn)in overburden using the residential
soil action levels for the Lavrion urban area
% C .I.
0m 250m 500m
(n = 224)
Fig. 14 Map showing thedistribution of contaminationindex for soil using thedeveloped residential soilaction levels for Lavrion(from Demetriades et al.,1999e, Map 1.6, p. 1.6)
For each land use category, over each source ofcontamination, two indices were developed:
• a benefit index, BI, of benefits obtained from reme-diating the area, and
• a cost index, CI, of costs relating to various tech-nologies that can remediate the area to the requiredclean-up level to obtain the corresponding benefits.
The ratio of cost to benefit index, CI/BI ratio, wasused to rank the areas in terms of priority for remedi-ation. The lower the ratio, the higher is the priority forremediation.
The benefit index is defined as follows:
BIi = EIi × SBIi
where
EIi is the exposure index of area i andSBIi is the social benefit index of area i.
The cost index is defined as follows:
CIi = (FIj/DEj) × SCIiwhere
FIj is the financial investment of using technology j,DEj is the degree of effectiveness of technology j andSCIi is the social cost index.

Medical Geology in Hellas: The Lavrion Environmental Pollution Study 381
Main sourcesof
environmentalcontamination
in Lavrion:-
(1)Flotation/
beneficiationresidues
(2)Fine-grainedmaterial fromslag heaps
andpyritiferous
tailings
(3)
soil
Contamination ofatmosphere
Wind1
3
4
2Water
Meat
Milk
Direct intake/uptake from soil
Direct intake/uptake from soil
Contamination of soilwater
Contamination ofgroundwater
Skin
Inhalation
Uptake by plants
Intake by animals
Solublecontaminants
Potable water supply
PathwayPrimarysource
Secondarysource
Finalreceptor
Intake byhumans
Actual dose equivalent tothe weight ofeach person
Aerial
cont.
Ingestion, inhalation,dermal contact with soil
Contaminated
Fig. 15 Conceptual site model for the contamination of the Lavrion urban area (Compilation by A. Demetriades; from Tristán et al.,1999a, Fig. 11.1, p. 319)
Spatially resolved hazard and exposure assessmentswere performed as part of this EU LIFE project(Tristán et al., 1998, 1999a, b, 2000). The methodolo-gies used to assess direct exposure of the populationto environmental pollutants included both quantita-tive and semi-quantitative approaches. The quantitativeapproach employed the Integrated Exposure UptakeBioKinetic (IEUBK) (US EPA, 1994) and HumanExposure from Soil Pollutants (HESP) (Shell, 1994a,b) models to predict the spatially resolved blood-lead(b-Pb) concentrations in children and to compare themwith measured epidemiological data. This approachprovided an insight to the spatial and biomedicalfactors that affect blood-Pb concentrations, and alsoa measure of uncertainty by producing probabilistichazard maps (Tristán et al., 1999a, b, 2000). Thesemi-quantitative approach used a multi-criteria eval-uation (Eastman, 1997) for the development of aspatially resolved exposure index. In this approach,continuous criteria (factors) and Boolean constraints
are standardised to a common numeric range and thencombined in a weighted linear fashion to produce theexposure index. Some criteria have discrete categories– constraints (e.g. area with metal-related industry orsite overlying Quaternary deposits) – and others arecontinuous (e.g. proximity to wastes or roads). Theeight factors that were defined are
(1) lead concentration in overburden/soil;(2) degree of dustiness of metallurgical waste;(3) proximity to metallurgical wastes;(4) proximity to current or previous stacks;(5) proximity to roads;(6) proximity to rivers;(7) proximity to lead industry, and(8) degree of exposure of children.
The two constraints include
(1) area with metal-related industry and(2) area over Quaternary to Recent deposits.

382 A. Demetriades
Exposure index was estimated on a grid of 50×50m, which is the grid used for the geostatistical inter-polation (kriging) of total lead concentrations in over-burden/soil samples (Demetriades et al., 1998; Tristánet al., 1999a, b). Other criteria were obtained from theavailable digital thematic maps, i.e. lithology (Fig. 2),metallurgical processing wastes (Fig. 3), land use map(Table 6), town plan and stacks. A value for the degreeof dustiness was estimated for the different types ofmetallurgical processing residues, based on availableinformation. Weights were assigned to the ten criteria(lead concentration in overburden, degree of dustinessof waste, proximity to smelter wastes, proximity to cur-rent or previous stacks, proximity to roads, proximity
to rivers, proximity to lead industry, time of expo-sure of children, area with metal-related industry andover Quaternary/Recent deposits). This complex set ofinformation was processed by the Idrisi R© GIS usingthe Weighted Factors in Linear Combination module(Eastman, 1997) for estimation of the exposure index(Tristán et al., 1998, 1999a, b, 2000). The original arbi-trary exposure index scale of 0–255 was reduced topercent (0–100) for the purposes of the environmentalmanagement scheme (Fig. 16).
As it is shown in Fig. 16 there is no 50 × 50 mblock with zero child exposure to contaminants in theLavrion urban and sub-urban area. Most blocks haveexposure levels between 25 and 50% (i.e. 1,914 blocks,
* Number of blocks(50 x 50 m) = 2960
Degree of child exposureto contaminants
Lavrion urban area
1009075502520100
3 (0.1%)69 (2.3%)
872 (29.5%)1914 (64.7%)
82 (2.8%)20 (0.7%)
0 (0%)
No. of Exposureblocks* degree %
(%)
0m 250m 500m
Lavrionharbour
Gulf of Thorikon
Vilanoira Perdika
Panormos
Pirkal
Koukos
Fougara
Noria
PrassiniAlepou
Komobil
Kiprianos
Kavodokanos
Thorikon
AlakoNeapoli
Ag. Andreas
Roumanika
Ag. Paraskevi
NictochoriSantorineika
Fig. 16 Map showing thedistribution of degree of childexposure to environmentalcontaminants, which wasdeveloped by the method ofweighted linear combination,Lavrion urban area (fromTristán et al., 1999b, Map11.17, p. 11.17)

Medical Geology in Hellas: The Lavrion Environmental Pollution Study 383
representing 64.7% of the total number of blocks) andfrom 50 to 75% (i.e. 872 blocks, representing 29.5%of the total number of blocks). These are indeed verydisturbing figures, since most residential areas, wherechildren live and play are considered to be hazardousto their health.
To begin with 12 technologies were considered asviable remedial alternatives for this project. The list isnot, of course, exhaustive, because other technologiesdo exist. The technologies evaluated are imminentlyapplicable to the solution of the Lavrion contaminationproblem, by combining acceptable efficiency and lowcost. Most of the technologies mentioned below weretested as part of this project (Kontopoulos et al., 1995;NTUA, 1999), i.e.
• Coverage with asphalt• Paving• Vegetation• Clean soil coverage (60 cm) and vegetation• Geomembrane cover including vegetation of the
upper layer• Compacted clay cover including vegetation of the
upper layer• Addition of limestone and coverage with clean soil
(30 cm) and vegetation• Chemical stabilisation with biological sludge and
vegetation• Chemical stabilisation with biological sludge and
phosphates and vegetation• Chemical stabilisation with biological sludge and
fly ash and vegetation• Chemical stabilisation with compost and fly ash and
vegetation• Chemical stabilisation with compost and phos-
phates and vegetation
The degree of effectiveness of the various remedialtechnologies was considered in the Lavrion project.Applicability of each technology depends on thechemical characteristics of contaminated material andon the actual or planned land use of the particularsite. Application of impermeable covers and additionof limestone are appropriate for sulphide-containingwastes (pyrite and pyritiferous sands). Chemical stabil-isation techniques are suitable for calcareous flotationtailings and “soil”. Asphalt and paving can be appliedonly in urban and industrial areas.
Coverage with clean soil is in principle a techniqueapplicable to all types of contaminated material, except
the pyritiferous wastes, although even this type ofwaste can be covered temporarily to prevent the aerialtransportation of contaminants. By covering contami-nated areas with clean soil to an acceptable thickness,the risk for direct exposure of the population is min-imised. The major constraint for this technique is theavailability of clean soil in the Lavreotiki Peninsula.To illustrate the needs, it is simply mentioned thatmore than 4 million cubic metres of clean soil wouldbe required to cover the surface of 7.2 km2, whichwas examined within the framework of the present EULIFE project. With respect to the coverage by onlyvegetation without prior stabilisation, it is an optionwith uncertain efficiency, and it largely depends onthe level of contamination. It was found, however, tobe totally unsuccessful on the highly contaminatedflotation residues (NTUA, 1999).
Finally, four remedial technologies were consideredto be cost-effective and practical, i.e.
• Clean soil coverage (60 cm) and vegetation for theareas with the different types of slag, contaminatedresidual and alluvial soil;
• Compacted clay cover including vegetation of theupper layer for the areas covered by pyrite tailings;
• Addition of limestone and coverage with clean soil(30 cm) and vegetation for the areas covered bypyritiferous sand; and
• Chemical stabilisation with biological sludge andphosphates and vegetation for the areas covered bythe flotation/beneficiation residues.
Figure 17 shows the remedial technology to beapplied at each 50×50 m block, depending on the typeof waste to be remediated. The cost per square metrewas estimated using 1999 prices of materials. The totalcost at the end of 1999 was 58.18 million Euro. Ithas been estimated that about 30% of the area is cov-ered by buildings and tar roads. Therefore, the actualcost is reduced to about 42 million Euro (1 Euro wasequivalent to 330 drachmas in 1999).
Discussion and Conclusions
In this study it has been shown that overburden mate-rials, including residual and alluvial soil, have beencontaminated to an extremely high degree by met-allurgical processing activities. Although mining and
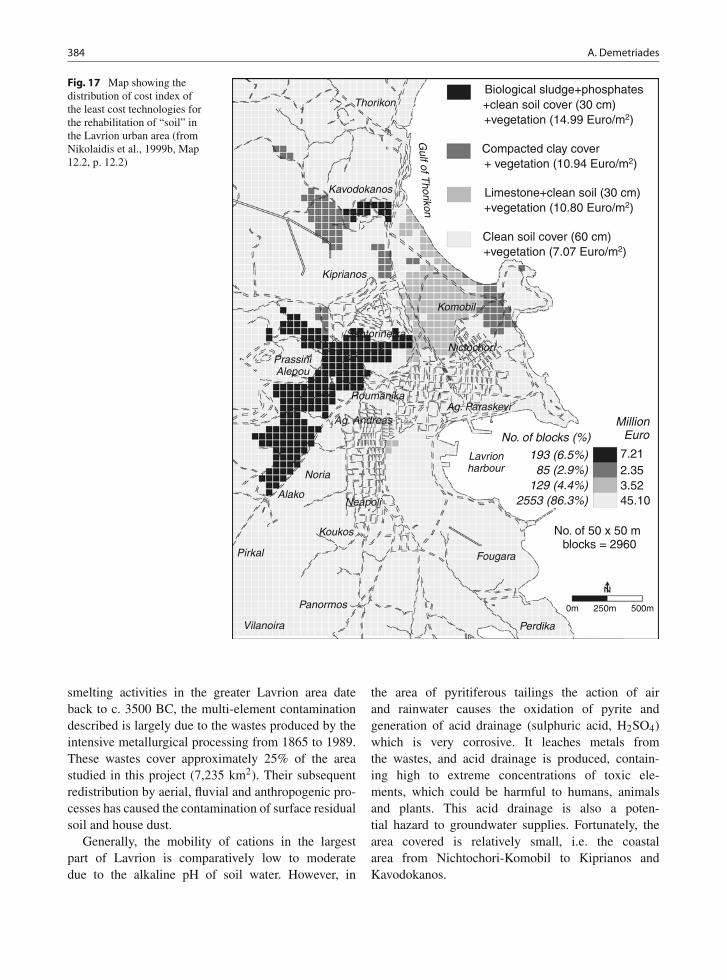
384 A. Demetriades
No. of 50 x 50 m blocks = 2960
7.212.353.5245.10
193 (6.5%)85 (2.9%)
129 (4.4%)2553 (86.3%)
MillionEuroNo. of blocks (%)
Biological sludge+phosphates+clean soil cover (30 cm)+vegetation (14.99 Euro/m2)
Compacted clay cover+ vegetation (10.94 Euro/m2)
Limestone+clean soil (30 cm)+vegetation (10.80 Euro/m2)
Clean soil cover (60 cm)+vegetation (7.07 Euro/m2)
Lavrionharbour
Gulf of T
horikon
Vilanoira Perdika
Panormos
Pirkal
Koukos
Fougara
Noria
PrassiniAlepou
Komobil
Kiprianos
Kavodokanos
Thorikon
AlakoNeapoli
Ag. Andreas
RoumanikaAg. Paraskevi
NictochoriSantorineika
0m 250m 500m
Fig. 17 Map showing thedistribution of cost index ofthe least cost technologies forthe rehabilitation of “soil” inthe Lavrion urban area (fromNikolaidis et al., 1999b, Map12.2, p. 12.2)
smelting activities in the greater Lavrion area dateback to c. 3500 BC, the multi-element contaminationdescribed is largely due to the wastes produced by theintensive metallurgical processing from 1865 to 1989.These wastes cover approximately 25% of the areastudied in this project (7,235 km2). Their subsequentredistribution by aerial, fluvial and anthropogenic pro-cesses has caused the contamination of surface residualsoil and house dust.
Generally, the mobility of cations in the largestpart of Lavrion is comparatively low to moderatedue to the alkaline pH of soil water. However, in
the area of pyritiferous tailings the action of airand rainwater causes the oxidation of pyrite andgeneration of acid drainage (sulphuric acid, H2SO4)which is very corrosive. It leaches metals fromthe wastes, and acid drainage is produced, contain-ing high to extreme concentrations of toxic ele-ments, which could be harmful to humans, animalsand plants. This acid drainage is also a poten-tial hazard to groundwater supplies. Fortunately, thearea covered is relatively small, i.e. the coastalarea from Nichtochori-Komobil to Kiprianos andKavodokanos.

Medical Geology in Hellas: The Lavrion Environmental Pollution Study 385
The extreme multi-element soil contamination inLavrion can be said that it is a permanent feature,since the residence time of heavy elements in soilis very high, i.e. As 2,000 years, Hg 920 years,Cd 280 years and Pb 400–3,000 years (Ferguson,1990).
Since Lavrion has many peculiarities with respectto its contamination characteristics, site-specific SoilAction Levels were produced (Nikolaidis et al., 1999a)and used for the estimation of the contamination indexfor As, Ba, Be, Cd, Cr, Cu, Ni, Pb, V and Zn (Fig. 14).Barium, Ni and V have values below the estimated site-specific Soil Action Levels for Lavrion, whereas theconcentrations of Pb and As in all Lavrion overbur-den samples are well above their respective SALs of500 ppm Pb and 25 ppm As. The other elements havea smaller proportion of samples exceeding their SALs,i.e. Be (∼2.5%), Cu (∼2.5%), Zn (∼20%), Cd (∼50%)and Cr (∼70%). Apart from the extreme contaminationof overburden materials, including residual soil, it isdisturbing to have house dust values varying from 488to 18,617 ppm Pb and As from 130 to 3,820 ppm.
Calculation of soil lead clean-up levels requires asite-specific lead risk assessment model, which estab-lishes a relationship between the levels of lead insoil and blood-lead. In the case of Lavrion such rela-tionships are not necessary, since there are availableepidemiological data showing that children and adultshave high concentrations of (a) Pb in blood, (b) Asin urine and (c) Pb in deciduous teeth. These datafrom human tissues show, therefore, that Pb and Asare in bioaccessible forms, and remedial actions mustbe taken to reduce exposure to acceptable levels.Although this study was completed at the end of 1999,and the six-volume report submitted in 2000 to theLavrion urban authorities and the Hellenic Ministryof Environment, with concrete cost-effective proposalsfor remediation of soil, not a single action was takenup to now. The situation remains the same with housesand schools built on metallurgical processing wastes,and children and adults alike exposed to the sameenvironmental contaminants. It is, therefore, stressedthat we are obliged to offer better and healthier livingconditions to the new generation. Otherwise, it is math-ematically certain that in the not too distant future wemay resort to extreme solutions, because the remedi-ation of “soil” would be more costly than moving thewhole population of Lavrion and Lavreotiki Peninsulato another more suitable area.
Acknowledgements This chapter is published by permissionof the General Director of the Hellenic Institute of Geologyand Mineral Exploration. The results come from the LIFEprogramme, contract number 93/GR/A14/GR/4576, which wasco-financed by the European Commission and the Hellenic State.Without the assistance of the many scientists, technical and othersupporting staff this project would have not been completed.They are all sincerely thanked for their contributions.
References
ATSDR (Agency for Toxic Substances and Disease Registry)(1988) The nature and extent of lead poisoning in childrenin the United States: A report to Congress. US Public HealthService, Atlanta.
Baziotis I, Proyer A, Mposkos E (2008) High-pressure/low-temperature metamorphism of basalts in Lavrion (Greece):Implications for the preservation of peak metamorphicassemblages in blueschists and greenschists. Eur J Mineral21(1):133–148.
Benetou-Marantidou A, Nalou S, Micheloyiannis I (1985) Theuse of a battery of tests for the estimation of neurologicaleffects of lead in children. In TD Lekkas (ed) InternationalConference Heavy Metals in the Environment (Vol. 1,September, pp. 204–209). New Orleans, Edinburgh: CEPConsultants.
Briskin J, Marcus A (1990) Goals and implications of EPA’s newdrinking water standard for lead. In DD Hemphill (ed) Tracesubstances in environmental health – XXII. Supplement tovolume 12 of Environmental Geochemistry and Health (pp.33–50). Columbia: University of Missouri.
Brockhaus A, Collet W, Dolgner R, Engelke R, Ewers U, FrierI, Jermann E, Krämer U, Turfeld N, Winneke G (1988)Exposure ot lead and cadmium of children living in differentareas of North-West Germany: Results of biological moni-toring studies, 1982–1986. Int Arch Occup Environ Health60:211–222.
Brunekreef B, Veenstra SJ, Bierksteker K, Boleij JS (1981) TheArnhem lead study I. Lead uptake by 1- to 3-year-old chil-dren living in the vicinity of a secondary lead smelter inArnhem, The Netherlands. Environ Res 25:441–448.
Calabrese EJ, Stanek EJ, James RC, Roberts SM (1997) Soilingestion: A concern for acute toxicity in children. EnvironHealth Persp 105:1354–1358.
Caroli S, Alimonti A, Coni E, Petrucci F, Senofonte O, ViolanteN (1994) The assessment of reference values for elements inhuman and biological tissues and fluids: A systematic review.Crit Rev Anal Chem 24(5–6):363–398.
Chappell WR, Abernathy CO, Calderon RL (eds) (1999) ArsenicExposure and Health Effects (416 pp.). Amsterdam: Elsevier.
Chronopoulos J, Chronopoulou-Sereli C (1986a) Scwermetall-toleranz von Crocus sieberi, Arisarum vulgare undCyclamen graecum in Lavrion (Attika). Verhandlungen derGesellschaft für Ökologie (Hohenheim 1984), XIV, 357–360(text in German with a synopsis in English).
Chronopoulos J, Chronopoulou-Sereli C (1986b) Vegetationaldevelopment of halophytes to heavy metals in industrial

386 A. Demetriades
regions in Lavrion (Attika). Landschaft u. Stadt 18(1):42–45(text in German with a summary in English).
Chronopoulos J, Chronopoulou-Sereli C (1991) Effects of themining-metallurgical activity on the natural vegetation ofLavreotiki. In Abstracts of 1st Scientific Conference onGeosciences and the Environment. University of Patras,Dept. of Geology, Patras, p. 147.
Chronopoulou-Sereli C, Chronopoulos J (1991a) Untersuch-ungen über die Pb-belastung der vegetation in Lavreotiki(Attika). In S Riewenherm, H Lieth (eds) Verhandlungender gesellschaft für Ökologie (Osnabrück 1989), XIX/III,223–228 (text in German with a summary in English).
Chronopoulou-Sereli C, Chronopoulos J (1991b) Unweltbe-lastung der Stadt Lavrion (Attika) und Umgebung durch einBleinhüttenwerk. Natur und Landschaft 66(9):442–443 (textin German with a summary in English).
Conophagos EC (1980) Le Laurium antique et la techniqueGrecque de la production deo l’argent. National TechnicalUniversity, Athens, 458 pp. (in French).
Cotter-Howells, Thornton I (1991) Sources and pathways ofenvironmental lead to children in a Derbyshire mining vil-lage. Environ Geochem Health 13:127–135.
Culbard E, Thornton I, Watt J, Moorcroft S, Brooks K,Thompson M (1983) Metal contamination of dusts and soilsin urban and rural households in the United Kingdom. InDD Hemphill (ed) Trace Substances in EnvironmentalHealth – XVII. University of Missouri, Columbia,pp. 236–241.
Demetriades A (1992) Development of integrated collaborativeresearch programmes between the U.K. (BGS) and Greece(IGME). Environmental Geochemistry, Lavreotiki peninsula,and Multidisciplinary data interpretation, Eastern Macedoniaand Thrace. Vol. 1: Text, 165 pp.; Vol. 2: Maps, diagrams andtables, 128 pp. Institute of Geology and Mineral Exploration(IGME), Athena, Hellas, Open File Report E-6700 (inEnglish).
Demetriades A (ed) (1999a) Geochemical atlas of the Lavrionurban area for environmental protection and planning.Volume 1: Explanatory text. Project “Soil rehabilitationin the Municipality of Lavrion”, EU LIFE programmeContract No.: 93/GR/A14/GR/4576. Institute of Geologyand Mineral Exploration, Athena, Hellas, Open file reportE-8272, 365 pp.
Demetriades A (ed) (1999b) Geochemical Atlas of the Lavrionurban area for environmental protection and planning.Volume 2: Geochemical atlas. Project “Soil rehabilitationin the Municipality of Lavrion”, EU LIFE programmeContract No.: 93/GR/A14/GR/4576. Institute of Geologyand Mineral Exploration, Athena, Hellas, Open file reportE-8272, 210 pp.
Demetriades A (ed) (1999c) Geochemical Atlas of the LavrionUrban Area for Environmental Protection and Planning.Volume 1A: Figures and Tables. Project “Soil rehabilita-tion in the Municipality of Lavrion”, EU LIFE programmeContract No.: 93/GR/A14/GR/4576. Open File Report,Institute of Geology and Mineral Exploration, Athena,Hellas, 210 pp.
Demetriades A (ed) (1999d) Geochemical Atlas of the LavrionUrban Area for Environmental Protection and Planning.Volume 1B: Appendix reports. Project “Soil rehabilitation inthe Municipality of Lavrion”, EU LIFE programme Contract
No.: 93/GR/A14/GR/4576. Open File Report, Institute ofGeology and Mineral Exploration, Athena, Hellas, 176 pp.
Demetriades A (ed) (1999e) Environmental management planfor the rehabilitation of soil in the Lavrion Urban Area.Project “Soil rehabilitation in the Municipality of Lavrion”,EU LIFE programme Contract No.: 93/GR/A14/GR/4576.Open File Report, Institute of Geology and MineralExploration, Athena, Hellas, Volume 4, 155 pp.
Demetriades A, Stavrakis P (1995a) Risk assessment and reha-bilitation of contaminated soil at the Phenikodhassos inLavrion. Institute of Geology and Mineral Exploration,Athena, Hellas, Open file report E-7489, 38 pp. (text in Greekwith a summary in English).
Demetriades A, Stavrakis P (1995b) The release of toxic ele-ments from the Lavrion slags. Institute of Geology andMineral Exploration, Athena, Hellas, Open file report E-7610, 46 pp. (text in Greek with a summary in English).
Demetriades A, Vergou-Vichou K (1999a) Geochemistry ofparent rocks. In A Demetriades (ed) Geochemical atlasof the Lavrion urban area for environmental protec-tion and planning. Project “Soil rehabilitation in theMunicipality of Lavrion”, EU LIFE programme ContractNo.: 93/GR/A14/GR/4576. Institute of Geology and MineralExploration, Athena, Hellas, Open file report E-8272,Volume 1 – Explanatory text, Chapter 4, 92–100.
Demetriades A, Vergou-Vichou K (1999b) Chemistry ofmetallurgical processing wastes. In A Demetriades (ed)Geochemical atlas of the Lavrion urban area for environ-mental protection and planning. Project “Soil rehabilita-tion in the Municipality of Lavrion”, EU LIFE programmeContract No.: 93/GR/A14/GR/4576. Institute of Geologyand Mineral Exploration, Athena, Hellas, Open file reportE-8272, Volume 1 – Explanatory text, 101–128.
Demetriades A, Vergou-Vichou K (1999c) Geochemistry ofparent rocks. In A Demetriades (ed) Geochemical atlasof the Lavrion urban area for environmental protec-tion and planning. Project “Soil rehabilitation in theMunicipality of Lavrion”, EU LIFE programme ContractNo.: 93/GR/A14/GR/4576. Institute of Geology and MineralExploration, Athena, Hellas, Open file report E-8272,Volume 1A – Figures and Tables, Appendix 2A, 18–38.
Demetriades A, Vergou-Vichou K (1999d) Geochemistry ofoverburden. In A. Demetriades (ed) Geochemical atlasof the Lavrion urban area for environmental protec-tion and planning. Project “Soil rehabilitation in theMunicipality of Lavrion”, EU LIFE programme ContractNo.: 93/GR/A14/GR/4576. Institute of Geology and MineralExploration, Athena, Hellas, Open file report E-8272,Volume 1 – Explanatory text, Chapter 6, 129–189.
Demetriades A, Stavrakis P, Vergou-Vichou K (1994a) Mapsof the environmental geochemistry study of Lavreotikipeninsula. Environmental Geochemistry Study – LavreotikiPeninsula. Institute of Geology and Mineral Exploration,Athena, Hellas. Open File Report E-7424, Vol. 2, 36 pp. (inGreek with an English summary).
Demetriades A, Stavrakis P, Vergou-Vichou K (1994b)Environmental soil geochemical survey of Lavreotiki penin-sula Attiki. Environmental Geochemistry Study – LavreotikiPeninsula. Institute of Geology and Mineral Exploration,Athena, Hellas. Open File Report E-7424, Vol. 3, 147 pp.(in Greek with an English summary).
Medical Geology in Hellas: The Lavrion Environmental Pollution Study 387
Demetriades A, Vergou-Vichou K, Stavrakis P (1994c)Orientation soil geochemical survey in the Lavreotiki penin-sula Attiki. Environmental Geochemistry Study – LavreotikiPeninsula. Institute of Geology and Mineral Exploration,Athena, Hellas. Open File Report E-7424, Vol. 6, 64 pp. (inGreek with an English summary).
Demetriades A, Stavrakis P, Vergou-Vichou K (1996a)Contamination of surface soil of the Lavreotiki peninsula(Attiki, Greece) by mining and smelting activities. MinerWealth 98:7–15.
Demetriades A, Stavrakis P, Vergou-Vichou K, MakropoulosV, Vlachoyiannis N, Fosse G (1996b) Lead in the surfacesoil of Lavreotiki peninsula (Attiki, Greece) and its effectson human health. In Aug Anagnostopoulos, Ph Day, DNicholls (eds) Proceedings Third International Conferenceon Environmental Pollution. Aristotelean University ofThessaloniki, Thessaloniki, Hellas, 143–146.
Demetriades A, Stavrakis P, Vergou-Vichou K (1997)Exploration geochemistry in environmental impact assess-ment: Examples from Greece. In PG Marinos, GC Koukis,GC Tsiambaos, GC Stournaras (eds) Engineering Geologyand the Environment (Vol. 2, pp. 1757–1762). Rotterdam:Balkema.
Demetriades A, Vergou-Vichou K, Stavrakis P (1999a)Geochemistry of parent rocks. In A Demetriades (ed)Geochemical atlas of the Lavrion urban area for environ-mental protection and planning. Project “Soil rehabilita-tion in the Municipality of Lavrion”, EU LIFE programmeContract No.: 93/GR/A14/GR/4576. Institute of Geologyand Mineral Exploration, Athena, Hellas, Open file reportE-8272, Volume 2 – Geochemical atlas, Chapter 4, 4.2–4.30.
Demetriades A, Vergou-Vichou K, Stavrakis P (1999b)Chemistry of metallurgical processing wastes. In ADemetriades (ed) Geochemical atlas of the Lavrion urbanarea for environmental protection and planning. Project “Soilrehabilitation in the Municipality of Lavrion”, EU LIFEprogramme Contract No.: 93/GR/A14/GR/4576. Institute ofGeology and Mineral Exploration, Athena, Hellas, Open filereport E-8272, Volume 2 – Geochemical atlas, Chapter 5,5.1–5.30.
Demetriades A, Vergou-Vichou K, Stavrakis P (1999c)Distribution of lead in the Lavrion urban area. In ADemetriades (ed) Geochemical atlas of the Lavrion urbanarea for environmental protection and planning. Project “Soilrehabilitation in the Municipality of Lavrion”, EU LIFEprogramme Contract No.: 93/GR/A14/GR/4576. Institute ofGeology and Mineral Exploration, Athena, Hellas, Open filereport E-8272, Volume 2 – Geochemical atlas, Chapter 3,3.1–3.20.
Demetriades A, Vergou-Vichou K, Stavrakis P (1999d)Geochemistry of overburden. In A Demetriades (ed)Geochemical atlas of the Lavrion urban area for environ-mental protection and planning. Project “Soil rehabilita-tion in the Municipality of Lavrion”, EU LIFE programmeContract No.: 93/GR/A14/GR/4576. Institute of Geologyand Mineral Exploration, Athena, Hellas, Open file reportE-8272, Volume 2 – Geochemical atlas, Chapter 6, 6.1–6.30.
Demetriades A, Vergou-Vichou K, Stavrakis P (1999e) Locationmap, mining & regional geochemical maps of Lavreotikipeninsula and composite geochemical maps of Lavrion urbanarea. In A Demetriades (ed) Geochemical atlas of the Lavrion
urban area for environmental protection and planning.Project “Soil rehabilitation in the Municipality of Lavrion”,EU LIFE programme Contract No.: 93/GR/A14/GR/4576.Institute of Geology and Mineral Exploration, Athena,Hellas, Open file report E-8272, Volume 2 – Geochemicalatlas, Chapter 1, 1.1–1.6.
Demetriades A, Vergou-Vichou K, Stavrakis P, VassiliadesE (1999f) General thematic maps of the Lavrion urbanenvironment. In A Demetriades (ed) Geochemical atlasof the Lavrion urban area for environmental protec-tion and planning. Project “Soil rehabilitation in theMunicipality of Lavrion”, EU LIFE programme ContractNo.: 93/GR/A14/GR/4576. Institute of Geology and MineralExploration, Athena, Hellas, Open file report E-8272,Volume 2 – Geochemical atlas, 2.1–2.16.
Demetriades A, Vergou-Vichou K, Vassiliades E (1999 g)General thematic maps of the Lavrion urban area: Digitaltopography, Lithology, Metallurgical processing residues &contaminated soil, Soil and House dust pH. In A Demetriades(ed) Geochemical atlas of the Lavrion urban area for envi-ronmental protection and planning. Project “Soil rehabilita-tion in the Municipality of Lavrion”, EU LIFE programmeContract No.: 93/GR/A14/GR/4576. Institute of Geologyand Mineral Exploration, Athena, Hellas, Open file reportE-8272, Volume 1 – Explanatory text, 14–27.
Demetriades A, Vergou-Vichou K, Vlachoyiannis N (1999 h)Distribution of lead in the Lavrion urban environment. InA Demetriades (ed) Geochemical atlas of the Lavrion urbanarea for environmental protection and planning. Project “Soilrehabilitation in the Municipality of Lavrion”, EU LIFEprogramme Contract No.: 93/GR/A14/GR/4576. Institute ofGeology and Mineral Exploration, Athena, Hellas, Open filereport E-8272, Volume 1 – Explanatory text, Chapter 3,63–91.
Demetriades A, Vassiliades E, Tristán E, Rosenbaum MS,Ramsey MH (1998) Child blood lead content as a basis forrisk assessment of the metallurgical processing residues andcontaminated soil in Lavrion Attiki. Institute of Geologyand Mineral Exploration, Athena, Hellas. Open File ReportE7977 (text in Greek and English).
Demetriades A, Vergou K, Tsompos P, Stefouli M (2004) Theutilisation of the contamination results of Lavreotiki penin-sula in land use planning. Proceedings of the 10th Scientificof S.E. Attiki, Kalivia Thorikon Attiki, 28 November – 1December 2002. Society of Studies of South-east Attiki,Kalivia Thorikon, Hellas, 149–177 (text in Greek).
Demetriades A, Vergou K, Vlachoyiannis N (2008) The contam-ination of Lavreotiki peninsula and the urban environment ofLavrion from the mining-metallurgical wastes and the effectson the health of the local population. Proceedings of the9th Scientific Meeting of S.E. Attiki, Lavrion Attiki, 13–16April 2000. Society of Studies of South-east Attiki, KaliviaThorikon, Hellas, 573–624 (text in Greek).
Dermatis GN (1994) Landscape and monuments of Lavreotiki.Municipality of Lavreotiki, Lavrion, 298 pp. (text in Greek).
Drossos Ch, Papadopoulou-Ntafioti Z, Mavroidis K,Michalodimitriadis D, Salamalikis L, Gounaris A, VaronosD (1982) Environmental contamination by lead in Greece.Paediatrics, Athena, Hellas, 45, 114–124 (text in Greek).
Duggan MJ (1983) Contribution of lead in dust to children’sblood lead level. Environ Health Perspect 50:371–381.

388 A. Demetriades
Eastman JR (1997) Idrisi for Windows (version 2.0) (1997).Clark University, Massachusetts.
Eikmann Th, Michels S, Makropoulos V, Krieger Th, EinbrodtHJ, Tsomi K (1991) Cross sectional epidemiological studyon arsenic excretion in urine of children and workers inGreece. Gordon and Breach Science Publ. Toxicol EnvironChem 31–32:461–466.
Ferguson C, Marsh J (1993) Assessing human health risksfrom ingestion of contaminated soil. Land Contam Reclamat1:177–185.
Ferguson C, Darmendrail D, Freier K, Jensen BK, JensenJ, Kasamas H, Urzelai A, Vegter J (eds) (1998) RiskAssessment for Contaminated Sites in Europe, Vol. 1,Scientific Basis (165 pp.). Nottingham, UK: LQM Press.
Ferguson JE (1990) The heavy elements: Chemistry,Environmental Impact and Health Effects (614 pp.).Oxford: Pergamon Press.
Fosse G, Wesenberg GBR (1981) Lead, cadmium, zinc andcopper in deciduous teeth of Norwegian children in thepre-industrial age. Int J Environ Stud 16:163–170.
Gelaude P, Kalmthout PV, Rewitzer C (1996) Laurion – Theminerals in the ancient slags (195 pp.). Nijmegen, TheNetherlands: Janssen Print.
Gough LP, Shacklette HT, Case AA (1979) Element concentra-tions toxic to plants, animals and man. US Geological SurveyBulletin, 1466, 80 pp.
Hadjigeorgiou-Stravrakis P, Vergou-Vichou K (1992)Environmental geochemistry study of the Lavrion andAyios Constantinos (Kamariza) area in Attica. Institute ofGeology and Mineral Exploration, Athena, Hellas, OpenFile Report E6778, 33 pp. (in Greek with an Englishsummary).
Hadjigeorgiou-Stravrakis P, Vergou-Vichou K, Demetriades A(1993) The contribution of geochemical exploration in thestudy of interior and exterior quality of the Lavrion and AyiosConstantinos (Kamariza) urban areas Attiki. In ProceedingsHeleco’93, First International Exhibition and Conference ofEnvironmental Technology for the Mediterranean Region.Technical Chamber of Greece, Athena, Hellas, Vol. II, 301–313 (in Greek with an English abstract).
Hatzakis A, Kokkevi A, Katsouyanni K, Maravelias C,Salaminios F, Kalandidi A, Koutselinis A, Stefanis K,Trichopoulos D (1987) Psychometric intelligence and atten-tional performance deficits in lead-exposed children. In SELindberg, TC Hutchinson (eds) International ConferenceHeavy Metals in the Environment, New Orleans, September.CEP Consultants, Edinburgh, Vol. 1, 204–209.
Hoffman SJ (1986) Soil sampling. In WK Fletcher, SJ Hoffman,MB Mehrtens, AJ Sinclair, I Thompson (eds) Explorationgeochemistry: Design and interpretation of soil surveys.Reviews in Economic Geology, Vol. 3. Society of EconomicGeologists, Univ. of Texas, El Paso, Texas, 39–77.
IGME Working Group (1987) Exploration results in Lavrionfor the location of mixed sulphide mineralisation (geology-ore deposits-prefeasibility study). Institute of Geology andMineral Exploration, Athena, Hellas, Open File ReportE6411, 124 pp. (in Greek).
Jackson JA (ed) (1997) Glossary of geology. AmericanGeological Institute, Alexandria, Va., 769 pp.
Kafourou A, Touloumi G, Makropoulos V, Loutradi A,Papanagiotou A, Hatzakis A (1997) Effects of lead on the
somatic growth of children. Arch Environ Health 52(5):377–383.
Katerinopoulos A, Zissimopoulou E (1994) Minerals of theLavrion mines. The Greek Association of Mineral and FossilCollectors, Athena, Hellas, 304 pp.
Kazantzis G (1973) Metal contaminants in the environment.Practitioner 210:482–489.
Kontopoulos K, Komnitsas A, Xenidis A, Papassiopi N (1995)Environmental characterisation of the sulphidic tailings inLavrion. Miner Eng 8(10):1209–1919.
Korre A, Durucan S (1995a) The application of geographicinformation systems to the analysis and mapping of heavymetal contamination around Lavrio mine workings. APCOMXXV Conference, Brisbane, 579–585.
Korre A, Durucan S (1995b) Assessment of soil contamination.In Environmental Management in the Minerals Industries(ENVIRO-MIN), Med-Campus C035, 5.1–5.19.
Korre A (1997) A Methodology for the Statistical and SpatialAnalysis of Soil Contamination in GIS. Unpublished Ph.D.thesis. University of London (Imperial College of Science,Technology and Medicine), 205 pp.
Kürzl H (1988) Exploratory data analysis: Recent advances forthe interpretation of geochemical data. J Geochem Explor30(3):309–322.
Leleu M (1966) Données nouvelles sur la paléogéographie etles rapports des séries métallifères du Laurium (Attique,Grèce). Comptes Rendus de l′Académie des sciences, Paris,262:2008–2011.
Leleu M (1969) Essai d’interprétation thermodynamique enmétallogénie: les minéralisations karstiques du Laurium(Grece). Bulletin Bureau de Recherche Géologiques etMinières (BRGM), 2e s., 4, 1–66.
Leleu M, Neumann M (1969) L’âge des formationsd’Attique (Grèce): du Paléozoïque au Mésozoïque.Comptes Rendus de l′Académie des sciences, Paris, 268:1361–1363.
Levinson AA (1980) Introduction to Exploration Geochemistry(924 pp.). Wilmette, Illinois, USA: Applied Publishing Ltd.
Makropoulos V, Konteye C, Eikmann Th, Einbrodt HJ, HatzakisA, Papanagiotou G (1991) Cross-sectional epidemiologicalstudy on the lead burden of children and workers in Greece.Gordon and Breach Science Publ., U.K. Toxicol EnvironChem 31–32:467–477.
Makropoulos W, Stilianakis N, Eikmann Th, Einbrodt HJ,Hatzakis A, Nikolau-Papanagiotou A (1992a) Cross-sectional epidemiological study of the effect of various pol-lutants on the health of children in Greece. Fresenius EnvironBull 1:117–122.
Makropoulos W, Jakobi K, Stilianakis N, Vlachogiannis N,Pesch T, Tambakis S (1992b) Blood and cadmium burdenin pregnant women, newborns and schoolage children inLavrion (Greece). Wissenschaft und Umweit 3:221–224 (inGerman with an abstract in English).
Manousakis G (1992) Trace Elements in Human Health(204 pp.). Thessaloniki, Greece: Kiriakidis Brothers. (text inGreek).
Manthos GK (1990) Mining and Metallurgical Lavrion(168 pp.). Lavrion, Hellas: Municipality of Lavrion. (text inGreek).
Maravelias C, Hatzakis A, Katsouyanni K, Trichopoulos D,Koutselinis A, Ewers U, Brockhaus A (1989) Exposure to

Medical Geology in Hellas: The Lavrion Environmental Pollution Study 389
lead and cadmium of children living near a lead smelter atLavrion, Greece. Sci Total Environ 84:61–70.
Marinos GP, Petrascheck WE (1956) Laurium. (In Greek with anextended abstract in English). Geological and GeophysicalResearch, IV, no. 1. Institute for Geology and SubsurfaceResearch, Athena, Hellas, 246 pp.
Mervyn L (1985) The dictionary of minerals. The CompleteGuide to Minerals and Mineral Therapy (224 pp.).Wellingborough, UK: Thorsons Publishing Group.
Mervyn L (1986) Thorsons Complete Guide to Vitaminsand Minerals (336 pp.). Wellingborough, UK: ThorsonsPublishing Group.
Nakos G (1979a) Environmental contamination by lead: The fateof lead in soil and its effects on Pinus halepensis. Ministryof Agriculture, Hellenic Forestry Research Institute, ReportNo. 105, Athena, Hellas, 34 pp. (in Greek with an Englishsummary).
Nakos G (1979b) Lead pollution: Fate of lead in the soil and itseffects on Pinus halepensis. Plant Soil 53:427–443.
Nakos S (1985) Blood Lead Levels and Renal TubularFunction in Children Living in an Area Polluted with Lead.Unpublished Ph.D. thesis. University of Ioannina, Hellas,97 pp. (in Greek with English summary).
Nikolaidis N, Demetriades A, Vergou-Vichou K, VassiliadesE, Papassiopi N, Theodoratos P, Varelidis N, Zamani A(1999a) Environmental management plan for the rehabili-tation of soil in the Lavrion urban area. In A Demetriades(ed) Environmental management plan for the rehabilitationof soil in the Lavrion urban area. Project “Soil rehabilita-tion in the Municipality of Lavrion”, EU LIFE programmeContract No.: 93/GR/A14/GR/4576. Institute of Geologyand Mineral Exploration, Athena, Hellas, Open file reportE-8272, Volume 4, 72–121.
Nikolaidis N, Demetriades A, Vergou-Vichou K, Vassiliades E,Papassiopi N, Theodoratos P, Varelidis N, Zamani A (1999b)Environmental management and planning. In A Demetriades(ed) Environmental management plan for the rehabilitationof soil in the Lavrion urban area. Project “Soil rehabilita-tion in the Municipality of Lavrion”, EU LIFE programmeContract No.: 93/GR/A14/GR/4576. Institute of Geologyand Mineral Exploration, Athena, Hellas, Open file reportE-8272, Volume 2 – Geochemical Atlas, 12.1–12.6.
NTUA (1999) Environmental Characterisation of Lavrion Site –Development of remediation techniques. Volume 3. Project“Soil rehabilitation in the Municipality of Lavrion”, EU LIFEprogramme Contract No.: 93/GR/A14/GR/4576. NationalTechnical University of Athens, Athena, Hellas. Open FileReport, 174 pp.
O’Connor PJ, Reimann C, Kürzl H (1988) A GeochemicalSurvey of Inishowen, Co. Donegal. Geological Survey ofIreland, Dublin.
Papadeas GD (1991) Recent considerations for the geological-tectonic evolution of the metamorphic rocks in Attikiand Variskia mineralization. Proc Acad Athens 66:331–370.
Photiades A (2003) Geological structure of the Lavreotikiarea (Attica, Greece). In A Demetriades (ed) LavreotikiExcursion Guide, 29th August 2003, Excursion leaders ADemetriades, A Photiades and C Panagopoulos, 7th BiennialS.G.A. Meeting “Mineral Exploration and SustainableDevelopment, August 24–28, 2003, Athena, Hellas, 13–18.
Photiades A, Carras N (2001) Stratigraphy and geological struc-ture of the Lavrion area (Attica, Greece). Bull Geol SocGreece 34(1):103–109.
Photiades A, Carras N, Mavridou F (2004) GeologicalMap of Greece in Scale 1:50.000 “Lavrion-Makronisos”Sheet. Athena, Hellas: Institute of Geology and MineralExploration.
Photiades A, Saccani M (2006) Geochemistry and tectonomag-matic significance of HP/LT metaophiolites of the Attic-Cycladic zone in the Lavrion area (Attica, Greece). Ofioliti31(2):89–102.
Pöppelbaum M, Van den Boom G (1980a) Prospecting for hid-den ore deposits. A method for determining mercury (Hg)concentrations in hard rock. In W Ernst, JH Hohnholz,HR Lang, KH Jacob, SV Wahl (eds) Natural Resourcesand Development, a Biannual Collection of Recent GermanContributions Concerning the Exploration and Exploitationof Natural Resources (Vol. 11, pp. 68–77). Tübingen,Germany: Institute of Scientific Co-operation.
Pöppelbaum M, Van den Boom G (1980b) Eine Methode zurBestimmung der Quecksilbergehalter in Festgesteinen. GeolJb Hannover D37:5–14.
Reagan PL, Silbergeld EK (1990) Establishing a health basedstandard for lead in residential soils. In DD Hemphill(ed) Trace Substances in Environmental Health – XXII.Supplement to Volume 12 of Environmental Geochemistryand Health (pp. 199–238). Columbia: University of Missouri.
Reimann C, Äyräs M, Chekushin V, Bogatyrev I, Boyd R, CaritatP de, Dutter R, Finne TE, Halleraker JH, Jæger Ø, KashulinaG, Lehto O, Niskavaara H, Pavlov V, Räisänen ML, StrandT, Volden T (1998) Environmental Geochemical Atlas ofthe Central Barents Region. Geological Survey of Norway,Trondheim, 745 pp.
Reimann C, Filzmoser P, Garrett RG, Dutter R (2008) StatisticalData Analysis Explained – Applied Environmental Statisticswith R (343 pp.). Chichester, UK: J. Wiley & Sons, Ltd.
Robbins JC (1973) Zeeman spectrometer for measurement ofatmospheric mercury vapour. In MJ Jones (ed) GeochemicalExploration 1972 (pp. 315–323). London: Institution ofMining & Metallurgy.
Roels HA, Buchet JP, Lauwerys RR, Bruaux P, Claeys-ThoreauF, Lafontaine A, Verduyn G (1980) Exposure to lead bythe oral and the pulmonary routes of children living inthe vicinity of a primary lead smelter. Environ Res 22:81–99.
Sainsbury CL, Hudson T, Kachadoorian R, Richards D (1970)Geology, mineral deposits, and geochemical and radiometricanomalies, Serpentine Hot Springs Area, Seward Peninsula,Alaska. U.S. Geological Survey Bulletin, 1312-H, H1-H19.
Schmitt N, Philion JJ, Larsen AA, Harnadek M, Lynch AJ(1979) Surface soil as a potential source of lead exposure foryoung children. Can Med J 121:1474–1478.
Siegel FR (1974) Applied Geochemistry (353 pp.). New York: J.Wiley & Sons.
Shell (1994a) Human exposure to soil pollutants, version 2.10a(HESP). Shell Internationale Petroleum Maatschappij B.V.The Hague, The Netherlands.
Shell (1994b) Human exposure to soil pollutants, version 2.10a(HESP). The concepts of HESP-Reference manual. ShellInternationale Petroleum Maatschappij B.V. The Hague, TheNetherlands.

390 A. Demetriades
Skarpelis N (2007a) The Lavrion deposit (SE Attica,Greece): Geology, mineralogy and minor elements chem-istry. Neues Jahrbuch für Mineralogie Abhandlungen 183:227–249.
Skarpelis N (2007b) Lavrion: Ancient silver mines in a youngextensional structural domain. In G Lister, M Forster, URing (eds) Inside the Aegean Metamorphic Core Complexes.J Virt Explor, Electronic Edition, ISSN 1441-8142, 27 pp,paper 8.
Skarpelis N, Argyraki A (2009) Geology and Origin ofSupergene Ore at the Lavrion Pb-Ag-Zn Deposit, Attica,Greece. Resour Geol 59(1):1–14.
Skarpelis N, Tsikouras B, Pe-Piper G (2008) The Mioceneigneous rocks in the Basal Unit of Lavrion (SE Attica,Greece): petrology and geodynamic implications. Geol Mag145:1–15.
Stavrakis P, Vergou-Vichou K, Fosse G, Makropoulos V,Demetriades A, Vlachoyiannis N (1994a) A multidisci-plinary study on the effects of environmental contaminationon the human population of the Lavrion urban area, Hellas.In SP Varnavas (ed) Environmental Contamination. 6thInternational Conference, Delphi, Greece, CEP Consultants,Edinburgh, 20–22.
Stavrakis P, Demetriades A, Vergou-Vichou K (1994b)Environmental impact assessment in the Lavreotiki peninsulaAttiki. Institute of Geology and Mineral Exploration, Athena,Hellas. Open File Report E7424, Vol. 1, 44 pp. (in Greek withan English summary).
Spais AG, Omirou A, Argiroudis S, Roubies N (1987) Leadpoisoning in thoroughbred foals and mares of a stud estab-lished in the mining area of Lavrion. 4th Hellenic VeterinaryCongress. Book of abstracts (in Greek). Hellenic VeterinaryMedical Society, Athena, Hellas.
Stanek EJ, III, Calabrese EJ (1995) Daily estimates ofsoil ingestion in children. Environ Health Persp 103:276–285.
Taylor SR, McLennan SM (1995) The geochemical evolution ofthe continental crust. Rev Geophys 33:241–265.
Thornton I, Culbard E (eds) (1987) Lead in the HomeEnvironment (224 pp.). Northwood, UK: Science ReviewsLtd.
Thornton I, Davies DJA, Watt JM, Quinn MJ (1990) Lead expo-sure in young children from dust and soil in the UnitedKingdom. Environ Health Perspect 89:55–60.
Trattler R (1987) Better Health Through Natural Healing(624 pp.). Wellingborough, Northamptonsire, UK: ThorsonsPublishing Group.
Tristán E, Rosenbaum MS, Ramsey MH (1998) Evaluation ofchild exposure to lead in Lavrion as a basis for risk assess-ment, Part II. In A Demetriades, E Vassiliades, E Tristán,MS Rosenbaum, MH Ramsey (eds) Technical Report,Child blood lead contents as a basis for risk assessmentof the metallurgical processing residues and contaminatedsoil in Lavrion Attiki. Institute of Geology and MineralExploration, Athena, Hellas, Open File Report 7977-E,69 pp.
Tristán E, Ramsey MH, Thornton I, Kazantzis G, RosenbaumMS, Demetriades A, Vassiliades E, Vergou-Vichou K(1999a) Spatially resolved hazard and exposure assessments.In A Demetriades (ed) Geochemical atlas of the Lavrion
urban area for environmental protection and planning.Project “Soil rehabilitation in the Municipality of Lavrion”,EU LIFE programme Contract No.: 93/GR/A14/GR/4576.Institute of Geology and Mineral Exploration, Athena,Hellas, Open file report E-8272, Volume 1 – Explanatorytext, Chapter 11, 311–349.
Tristán E, Ramsey MH, Thornton I, Kazantzis G, RosenbaumMS, Demetriades A, Vassiliades E (1999b) Risk assessment.In A Demetriades (ed) Geochemical atlas of the Lavrionurban area for environmental protection and planning.Project “Soil rehabilitation in the Municipality of Lavrion”,EU LIFE programme Contract No.: 93/GR/A14/GR/4576.Institute of Geology and Mineral Exploration, Athena,Hellas, Open file report E-8272, Volume 2 – GeochemicalAtlas, Chapter 11, 11.1–11.18.
Tristán E, Demetriades A, Ramsey MH, Rosenbaum MS,Stavrakis P, Thornton I, Vassiliades E, Vergou-Vichou K(2000) Spatially resolved hazard and exposure assessments:An example of lead in soil at Lavrion, Greece. Environ ResSection A, 82:33–45.
US EPA (United States Environmental Protection Agency)(1994) Integrated Exposure Uptake Biokinetic Modelfor Lead in Children (version 0.99d). Washington, DC:Environmental Protection Agency.
US EPA (United States Environmental Protection Agency)(1986) Carcinogen Risk Assessment Guidelines. 51 FR33992. Washington, DC: Environmental Protection Agency.
US EPA (United States Environmental Protection Agency)(1996) Exposure Factors Handbook. Washington, DC:Environmental Protection Agency.
US EPA (United States Environmental Protection Agency)(1998) Lead in Your Home: A Parent’s ReferenceGuide. EPA 747-B-98-002, (70 pp.). Washington, DC:Environmental Protection Agency.
Voudouris P, Melfos V, Spry PG, Bonsall TA, Tarkian M,Solomos Ch (2008) Carbonate-replacement Pb–Zn–Ag±Aumineralization in the Kamariza area, Lavrion, Greece:Mineralogy and thermochemical conditions of formation.Mineral Petrol 94(1–2):85–106.
Vourlakos N (1992) The minerals of Lavreotiki and the mineralcomponents of its rocks. Library of the Society of LavreotikiStudies, Lavrion, Publication No. 5, 31 pp. (text in Greek).
Watt JM, Thornton I, Cotter-Howells J (1993) Physical evi-dence suggesting the transfer of soil Pb into young childrenvia hand to mouth activity. Appl Geochem Suppl. Issue2:269–272.
Wedepohl KH (1995) The composition of the continental crust.Geochim Cosmochim Acta 59:1217–1232.
Wixson BG, Davies BE (1994) Lead in soil – Recommendedguidelines. Science and Technology Letters, Northwood,Middlesex, UK, 132 pp.
Xenidis A, Komnitsas K, Papassiopi N, Kontopoulos A (1997)Environmental implications of mining activities in Lavrion.In PG Marinos, GC Koukis, GC Tsiambaos, GC Stournaras(eds) Engineering Geology and the Environment (Vol. 3, pp.2575–2580). Rotterdam: A.A. Balkema.
Yankel AJ, Von Linden IH, Walter SD (1977) The SilverValley study: The relationship between childhood blood lev-els and environmental exposure. J Air Pollut Cont Assoc 27:763–767.

Index
AAcid sulfate soils, 124–126Africa, 23, 69, 184, 192, 199–216, 262Argentina, 14, 72, 79–81, 84, 87, 94, 97Arsenic, 13–14, 19, 21, 36–37, 60–63, 65–66, 68, 80–87,
142–149, 176–182, 196, 210–211, 216, 237–242, 247,259–260, 279, 314–317, 335–336, 372–379, 385
Asbestos, 16–17, 112–114, 209, 260–262, 269–270, 280, 284Australia, 107–130
BBalkan Endemic Nephropathy (BEN), 15–16, 262–263Balneotherapy, 346–348Bangladesh, 175–177, 180–182, 196Biomarkers, 48–49Black lung disease, 22, 325Blood, 8, 14, 19–21, 30–31, 42, 53, 67–68, 82, 88–94, 101, 111,
137, 148, 152, 169, 190, 192, 194, 270, 324, 347, 364–366,370, 385
Brazil, 23, 79–80, 84–87, 89–92, 94–95, 100–101, 193, 215
CCadmium, 19, 29–54, 334–336, 339–340, 378–379Canada, 2–3, 5–7, 10, 12, 21–22, 38, 260Cancer, 2, 10, 12, 14–16, 20, 51, 70–71, 80, 93, 101, 113–114,
127, 148–149, 162–164, 166, 194, 209, 240, 248, 251, 264,271–272, 278–280, 321, 323–324, 348, 378
Cardiovascular diseases, 121, 138, 143, 176, 203, 224, 248,265, 279
Caribbean, 32–35, 59–73, 129Central America, 32, 59–73China, 111, 177, 237, 303–325Coal, 4–5, 15, 22, 87, 110, 137, 143, 187, 202, 210, 215,
262–263, 308, 310–311, 313–314, 316–317, 322–324, 329Colombia, 33, 72, 79, 95, 97–98Cuba, 32–33, 61, 68–69, 72
DDiabetes, 14, 31–32, 48–49, 51–52, 62, 127, 195, 273–274,
280–282, 321Diagnoses, 199Diet, 23, 31–32, 42–43, 51–53, 129, 148, 156–157, 169–170,
193, 206, 243, 263–265, 305, 322
Diseases, 13, 15–16, 51, 62, 101, 112, 121–122, 130, 136–138,179, 182, 194–196, 199–200, 216, 228, 240, 269, 279, 306,312, 318
Dusts, 12, 16–17, 137–138, 210–215, 260, 269, 314, 323
EEl Salvador, 59, 65–66, 72Europe, 38, 100, 207, 209, 212, 259–296, 345
FFinland, 38, 93, 247, 265, 275, 279–283, 296Fluorine, 2–9, 64–66, 94, 204–205, 226, 264–265, 310–311,
336Fluorosis, 3–9, 69, 157–158, 186–188, 226, 305–310France, 51, 100, 283, 285–287, 289, 291–296
GGeochemical anomalies, 29, 196, 221, 284, 374Geochemical factors, 233, 236Geochemistry, 3, 6–7, 22–23, 35–36, 150, 189, 191–192, 211,
236, 263, 275, 288, 296, 324, 355–385Geophagia, 68, 98, 124, 168–171Geophagy, 79–80, 95–98, 124, 127–129, 170, 202, 208Geo-pollution, 330–335, 337, 340–343Greece, 261, 263, 385
HHealth, 1, 3, 19, 31–32, 79, 108–110, 120, 139–145, 194, 248,
280–281, 290, 298, 310, 324–325, 339, 357–387Heavy metals, 18–19, 22–23, 68, 243, 245, 276, 285, 331–332,
378Hot springs, 118, 143, 162, 164, 272–273, 304, 309, 329–332,
343–353House dust, 68, 356, 364–377, 384–385Human health, 1, 13, 21–23, 36, 88, 109–110, 116, 121,
124–126, 145, 152, 223–226, 246, 264, 281, 289–292, 318,331, 334, 379
IIndia, 65, 177–181, 185–196, 262, 304Iodine, 69, 135, 149–156, 178, 189–191, 205, 207, 233–234,
264, 305–307, 312–313Iodine deficiency disorders (IDD), 149–150, 152, 154, 156, 183,
189–191, 201–202, 205–206, 263, 278, 304–307, 312–313Iran, 136–140, 143–145, 148–160, 162–165, 168–170, 193
O. Selinus et al. (eds.), Medical Geology, International Year of Planet Earth, 391DOI 10.1007/978-90-481-3430-4, c© Springer Science+Business Media B.V. 2010

392 Index
Iraq, 135–138, 140–143, 150, 152–154Israel, 154–155, 160, 162, 166–167
JJamaica, 29–54, 61, 67–69Japan, 14, 30, 40, 42, 50–51, 270, 313, 329–353Jordan, 152, 154–155, 160, 162, 165–166
KKashin–Beck disease (KBD), 236–237, 304–305, 318–321,
323–324Keshan disease (KD), 236, 304–305, 318–321, 323Kogai, 337–341
LLavrion, 355–385Lead, 7, 20, 67, 85–92, 259, 270–271, 334–336, 364–379
MMercury, 20, 92–93, 211, 215, 259–260, 334, 378–379Metals, 9, 14, 18–23, 36, 68, 80, 87–88, 101, 110–117,
120–125, 137, 175–176, 194–196, 200, 204, 221, 229, 238,240, 242–245, 259–260, 262, 266–267, 272, 274, 276–278,283–285, 295, 314, 317, 322, 331–332, 336, 340, 348, 378,384
Mexico, 2, 59–65, 70–73, 80–81Mining, 10–11, 13, 16, 19–22, 60–63, 68, 80, 84, 86–87, 90,
92, 94, 109–113, 115–116, 120, 136–137, 143–145, 162,166, 194, 200, 202–203, 208–215, 222, 239–240, 242–247,259–260, 266–269, 271, 276, 283, 314, 317–318, 322,337–338, 355–356, 361, 365, 379, 383–384
NNepal, 177, 181–182Nicaragua, 33, 59–60, 65–66, 72–73Norway, 260, 277–279, 295, 372
OOceania, 107–130Organic compounds, 15–16, 122, 203, 262–263, 330–332, 341
PPakistan, 175–177, 182, 184–186, 190Podoconiosis, 192–193, 203, 212–213Portugal, 263, 267–273Proteinuria, 30, 53–54
RRadiation, 10–12, 35–36, 69–70, 72, 101, 162–168, 193–194,
203, 211–212, 247–248, 251, 271, 276, 280, 348Radon, 2, 9–12, 69–72, 162, 211–212, 247–254, 266, 271, 276,
284Respiratory problems, 120, 140, 324–325Risk communication, 95, 98–101Russia and NIS, 223–226, 237–238, 247, 296
SSaudi Arabia, 137–138, 150, 152, 155, 161–162,
166–168, 170Selenium, 22–23, 29, 31, 69, 93–94, 155, 191–192, 202, 207,
210, 213, 224, 234–238, 277–280, 287–288, 318–324,334–336
Sickness country, 109–112Soil, 38, 42, 49, 70, 72, 91, 98, 124–130, 168, 170, 194,
267–269, 318, 333–337, 339–340, 357, 377–379, 381, 385South America, 33, 79–102, 259Sri Lanka, 175–176, 182–184, 186, 189–191, 193–195Sweden, 31, 247, 260, 265–266, 274–276, 296
TTeeth, 2–4, 6–7, 37–38, 65, 157, 160–161, 185–187, 201, 205,
226–232, 270, 307–308, 311, 356–357, 364–365, 372, 385Thallium, 322–323Therapy, 67, 97, 142, 169–170, 201, 272–273, 346
UUK, 51–52, 260, 263, 266–268, 296United States, 2–4, 10–11, 13–17, 21–23, 30, 39, 51–52, 100,
107, 246, 248, 266, 276, 325, 345Uptake, 30, 38–39, 42, 51–53, 116, 153, 155, 236–237, 263,
270, 274, 277, 372, 377, 381Urine, 19–20, 30–32, 40, 42–45, 48–50, 53–54, 61–64, 83,
85–87, 137, 195, 267, 311, 317, 320–321, 356, 364,374–377, 385
Uruguay, 79–80, 86, 88–89, 100–101
VVector-borne diseases, 124Volcanic eruptions, 5, 17–18, 33, 61, 72, 84, 107, 116–118,
121–122
YYemen, 143, 150, 152, 155–156, 161–162, 168