Mechanisms of Transition from Normal to Reentrant Electrical Activity in a Model of Rabbit Atrial...
20
Mechanisms of Transition from Normal to Reentrant Electrical Activity in a Model of Rabbit Atrial Tissue: Interaction of Tissue Heterogeneity and Anisotropy Oleg V. Aslanidi, † Mark R. Boyett, ‡ * Halina Dobrzynski, ‡ Jue Li, ‡ and Henggui Zhang † * † Biological Physics Group, School of Physics and Astronomy, and ‡ Cardiovascular Research Group, Faculty of Medical and Human Sciences, University of Manchester, Manchester, United Kingdom ABSTRACT Experimental evidence suggests that regional differences in action potential (AP) morphology can provide a substrate for initiation and maintenance of reentrant arrhythmias in the right atrium (RA), but the relationships between the complex electrophysiological and anatomical organization of the RA and the genesis of reentry are unclear. In this study, a biophysically detailed three-dimensional computer model of the right atrial tissue was constructed to study the role of tissue heterogeneity and anisotropy in arrhythmogenesis. The model of Lindblad et al. for a rabbit atrial cell was modified to incorporate experimental data on regional differences in several ionic currents (primarily, I Na , I CaL , I K1 , I to , and I sus ) between the crista termi- nalis and pectinate muscle cells. The modified model was validated by its ability to reproduce the AP properties measured exper- imentally. The anatomical model of the rabbit RA (including tissue geometry and fiber orientation) was based on a recent histological reconstruction. Simulations with the resultant electrophysiologically and anatomically detailed three-dimensional model show that complex organization of the RA tissue causes breakdown of regular AP conduction patterns at high pacing rates (>11.75 Hz): as the AP in the crista terminalis cells is longer, and electrotonic coupling transverse to fibers of the crista terminalis is weak, high-frequency pacing at the border between the crista terminalis and pectinate muscles results in a unidirectional conduction block toward the crista terminalis and generation of reentry. Contributions of the tissue heterogeneity and anisotropy to reentry initiation mechanisms are quantified by measuring action potential duration (APD) gradients at the border between the crista terminalis and pectinate muscles: the APD gradients are high in areas where both heterogeneity and anisotropy are high, such that intrinsic APD differences are not diminished by electrotonic interactions. Thus, our detailed computer model recon- structs complex electrical activity in the RA, and provides new insights into the mechanisms of transition from focal atrial tachy- cardia into reentry. INTRODUCTION Cardiac arrhythmias, such as atrial flutter and fibrillation (AF), are associated with irregular high-frequency electrical activity in the heart (1,2). Both experimental and computa- tional evidence supports the idea that such arrhythmias can be sustained by a number of reentrant activation waves (3,4), but mechanisms of reentry initiation in the atria are poorly understood. Experimental data demonstrate that cardiac (primarily, atrial) tissues with large regional differ- ences in electrical properties are more vulnerable to reentry (5,6), which may result from unidirectional conduction block in regions with longer refractoriness. However, details of the relationship between tissue anatomical structure, anisotropy, electrical heterogeneity, and vulnerability to reentry are diffi- cult to dissect experimentally. Biophysically and anatomically detailed computational models have been successfully used to dissect the mecha- nisms of complex cardiac dynamics observed in experiments (3,7,8), but the majority of these computer simulation studies have focused on spiral wave breakup due to dynamic rather than naturally existing electrophysiological or anatomical heterogeneities. Interactions of structure-dependent hetero- geneity with electrical activation patterns have been consid- ered only in simplified two-dimensional models (9,10). Relationships between structure and function of the atria have long been recognized (11–13). It has been proposed that the complex branching anatomy of the crista terminalis and pectinate muscle bundles in the right atrium (RA) can provide a substrate for reentrant activity during AF. Primarily, the thick bundle of crista terminalis can act as a conduction barrier leading to initiation of atrial reentry (6). However, echocardiographic clinical data suggest that the block within the crista terminalis is functional in nature (14–16), and hence, factors other than the bundle structure must be considered—such as different action potential morphologies within the crista terminalis and the rest of the RA (17,18). The RA is characterized by significant regional differ- ences in action potential (AP) morphology, which are due to variations in the density of several ionic currents (17– 21). An organized distribution of AP morphology with the longest action potential duration (APD) near the sinoatrial (SA) node and decreasing APD along the conduction pathway has been reported (17,22): the crista terminalis is the first to be activated by the AP arriving from the SA node, and the activation then spreads to the pectinate Submitted May 23, 2008, and accepted for publication September 29, 2008. *Correspondence: [email protected]; mark.boyett@manchester. ac.uk Editor: Michael D. Stern. Ó 2009 by the Biophysical Society 0006-3495/09/02/0798/20 $2.00 doi: 10.1016/j.bpj.2008.09.057 798 Biophysical Journal Volume 96 February 2009 798–817
-
Upload
independent -
Category
Documents
-
view
1 -
download
0
Transcript of Mechanisms of Transition from Normal to Reentrant Electrical Activity in a Model of Rabbit Atrial...
Mechanisms of Transition from Normal to Reentrant Electrical Activityin a Model of Rabbit Atrial Tissue: Interaction of Tissue Heterogeneityand Anisotropy
Oleg V. Aslanidi,† Mark R. Boyett,‡* Halina Dobrzynski,‡ Jue Li,‡ and Henggui Zhang†*†Biological Physics Group, School of Physics and Astronomy, and ‡Cardiovascular Research Group, Faculty of Medical and Human Sciences,University of Manchester, Manchester, United Kingdom
ABSTRACT Experimental evidence suggests that regional differences in action potential (AP) morphology can providea substrate for initiation and maintenance of reentrant arrhythmias in the right atrium (RA), but the relationships between thecomplex electrophysiological and anatomical organization of the RA and the genesis of reentry are unclear. In this study,a biophysically detailed three-dimensional computer model of the right atrial tissue was constructed to study the role of tissueheterogeneity and anisotropy in arrhythmogenesis. The model of Lindblad et al. for a rabbit atrial cell was modified to incorporateexperimental data on regional differences in several ionic currents (primarily, INa, ICaL, IK1, Ito, and Isus) between the crista termi-nalis and pectinate muscle cells. The modified model was validated by its ability to reproduce the AP properties measured exper-imentally. The anatomical model of the rabbit RA (including tissue geometry and fiber orientation) was based on a recenthistological reconstruction. Simulations with the resultant electrophysiologically and anatomically detailed three-dimensionalmodel show that complex organization of the RA tissue causes breakdown of regular AP conduction patterns at high pacing rates(>11.75 Hz): as the AP in the crista terminalis cells is longer, and electrotonic coupling transverse to fibers of the crista terminalisis weak, high-frequency pacing at the border between the crista terminalis and pectinate muscles results in a unidirectionalconduction block toward the crista terminalis and generation of reentry. Contributions of the tissue heterogeneity and anisotropyto reentry initiation mechanisms are quantified by measuring action potential duration (APD) gradients at the border between thecrista terminalis and pectinate muscles: the APD gradients are high in areas where both heterogeneity and anisotropy are high,such that intrinsic APD differences are not diminished by electrotonic interactions. Thus, our detailed computer model recon-structs complex electrical activity in the RA, and provides new insights into the mechanisms of transition from focal atrial tachy-cardia into reentry.
798 Biophysical Journal Volume 96 February 2009 798–817
INTRODUCTION
Cardiac arrhythmias, such as atrial flutter and fibrillation
(AF), are associated with irregular high-frequency electrical
activity in the heart (1,2). Both experimental and computa-
tional evidence supports the idea that such arrhythmias can
be sustained by a number of reentrant activation waves
(3,4), but mechanisms of reentry initiation in the atria are
poorly understood. Experimental data demonstrate that
cardiac (primarily, atrial) tissues with large regional differ-
ences in electrical properties are more vulnerable to reentry
(5,6), which may result from unidirectional conduction block
in regions with longer refractoriness. However, details of the
relationship between tissue anatomical structure, anisotropy,
electrical heterogeneity, and vulnerability to reentry are diffi-
cult to dissect experimentally.
Biophysically and anatomically detailed computational
models have been successfully used to dissect the mecha-
nisms of complex cardiac dynamics observed in experiments
(3,7,8), but the majority of these computer simulation studies
have focused on spiral wave breakup due to dynamic rather
than naturally existing electrophysiological or anatomical
Submitted May 23, 2008, and accepted for publication September 29, 2008.
*Correspondence: [email protected]; mark.boyett@manchester.
ac.uk
Editor: Michael D. Stern.
� 2009 by the Biophysical Society
0006-3495/09/02/0798/20 $2.00
heterogeneities. Interactions of structure-dependent hetero-
geneity with electrical activation patterns have been consid-
ered only in simplified two-dimensional models (9,10).
Relationships between structure and function of the atria
have long been recognized (11–13). It has been proposed
that the complex branching anatomy of the crista terminalis
and pectinate muscle bundles in the right atrium (RA) can
provide a substrate for reentrant activity during AF.
Primarily, the thick bundle of crista terminalis can act as
a conduction barrier leading to initiation of atrial reentry
(6). However, echocardiographic clinical data suggest that
the block within the crista terminalis is functional in nature
(14–16), and hence, factors other than the bundle structure
must be considered—such as different action potential
morphologies within the crista terminalis and the rest of
the RA (17,18).
The RA is characterized by significant regional differ-
ences in action potential (AP) morphology, which are due
to variations in the density of several ionic currents (17–
21). An organized distribution of AP morphology with the
longest action potential duration (APD) near the sinoatrial
(SA) node and decreasing APD along the conduction
pathway has been reported (17,22): the crista terminalis is
the first to be activated by the AP arriving from the SA
node, and the activation then spreads to the pectinate
doi: 10.1016/j.bpj.2008.09.057
Mechanisms of Reentry in Atrial Tissue 799
muscles; the AP of the crista terminalis is longer than that of
the pectinate muscles (17,22).
The aim of this study is to construct and study a detailed
computer model combining the anatomy of the rabbit RA
(23) and electrophysiological differences between its major
structurally distinct regions (18). A generic rabbit atrial AP
model (24) is modified based on extant voltage-clamp data-
sets recorded for several ionic currents from rabbit crista
terminalis and pectinate muscle cells (18). The bundle struc-
ture of the RA is accounted for by anisotropic gap junction
conductance along and transverse to the experimentally iden-
tified fibers of the crista terminalis and pectinate muscles
(23). The resultant three-dimensional model is used to study
the role of complex tissue organization in transition from
normal to reentrant electrical activity in the RA subjected
to high rate pacing.
MODEL DEVELOPMENT
The dynamics of electrical activation in cardiac tissues can
be described by the following nonlinear partial differential
equation (7,8,25):
vV
vt¼ V$DVV � Iion
Cm
: (1)
Here V (mV) is the membrane potential, V is a spatial
gradient operator defined within the tissue geometry, and
t is time (s). D is a tensor of diffusion coefficients (mm2
ms�1) that characterizes electrotonic spread of voltage via
gap junctional coupling, Cm (pF) is the cell membrane capac-
itance, and Iion is the total membrane ionic current (pA).
Families of electrophysiologically detailed cardiac cell
models have been developed to describe the voltage- and
time-dependent current, Iion (26). Such models are normally
based on experimentally measured voltage-clamp datasets
for individual ionic currents (Naþ, Ca2þ, Kþ), and allow
simulations of the AP morphology and rate-dependence.
A model describing the total ionic current for a rabbit atrial
cell has been developed by Lindblad et al. (24). While it can
accurately reproduce the whole cell voltage-clamp data on
which it has been based, and provides feasible morphologies
of the rabbit atrial AP, the model has several limitations.
Primarily, the model uses hybrid experimental datasets re-
corded from cells in the rabbit left atrium (27,28), the SA
node (29,30), and ventricles (31,32). Secondly, the model
does not account for regional differences in the electrical
properties of atrial cells. As APs in right and left atrial cells
are different (19), comparison of APs simulated with the
model (24) to those recorded experimentally from rabbit right
atrial cells of the crista terminalis and pectinate muscles (18)
demonstrates substantial differences in their morphology—
primarily, the AP shape, duration, the resting membrane
potential, and the AP overshoot. These differences are illus-
trated in Fig. 1 and Table 1.
The aim of this study is to develop a new family of AP
models for the rabbit right atrium that 1), is based on avail-
able experimental data obtained from rabbit RA cells; and 2),
incorporates details of regional differences in the RA cell
A
B
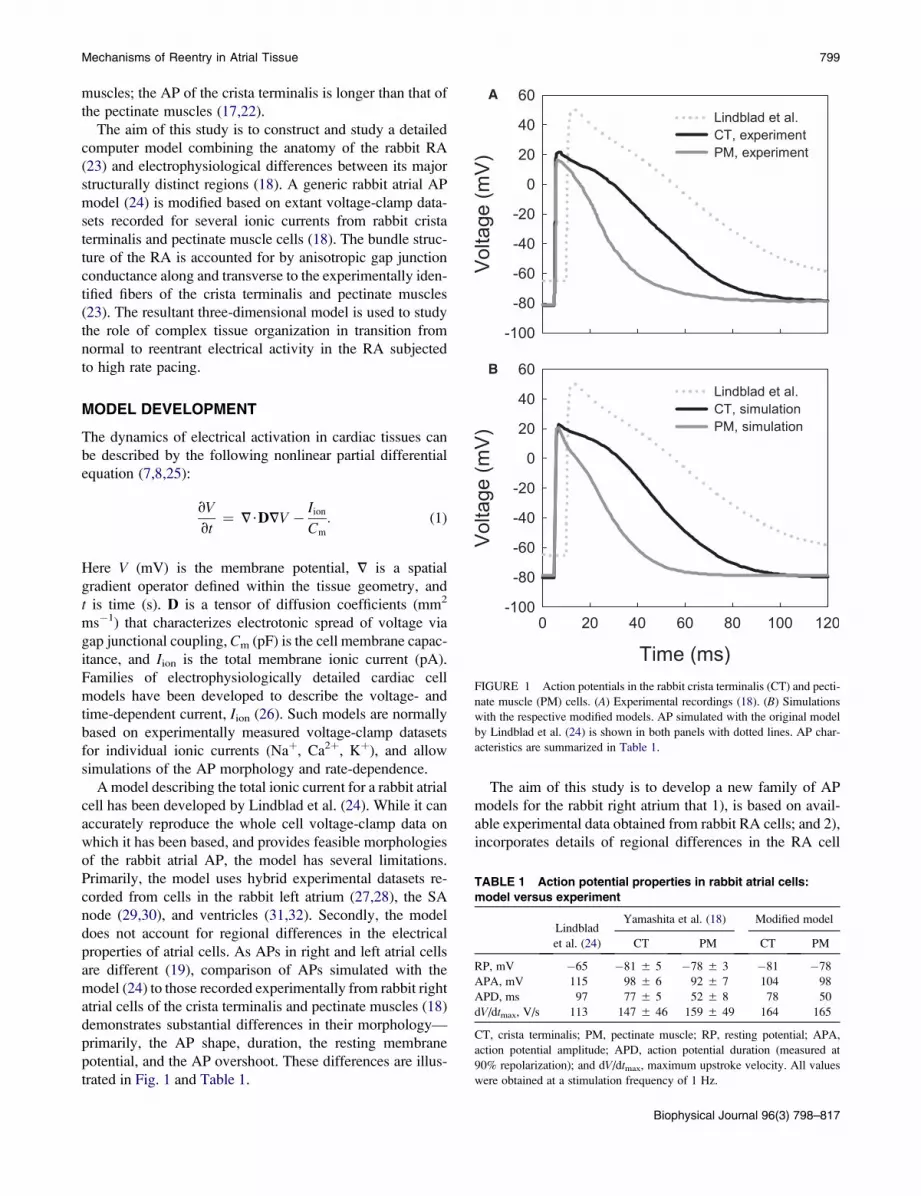
FIGURE 1 Action potentials in the rabbit crista terminalis (CT) and pecti-
nate muscle (PM) cells. (A) Experimental recordings (18). (B) Simulations
with the respective modified models. AP simulated with the original model
by Lindblad et al. (24) is shown in both panels with dotted lines. AP char-
acteristics are summarized in Table 1.
TABLE 1 Action potential properties in rabbit atrial cells:
model versus experiment
Lindblad
et al. (24)
Yamashita et al. (18) Modified model
CT PM CT PM
RP, mV �65 �81 5 5 �78 5 3 �81 �78
APA, mV 115 98 5 6 92 5 7 104 98
APD, ms 97 77 5 5 52 5 8 78 50
dV/dtmax, V/s 113 147 5 46 159 5 49 164 165
CT, crista terminalis; PM, pectinate muscle; RP, resting potential; APA,
action potential amplitude; APD, action potential duration (measured at
90% repolarization); and dV/dtmax, maximum upstroke velocity. All values
were obtained at a stimulation frequency of 1 Hz.
Biophysical Journal 96(3) 798–817
800 Aslanidi et al.
electrical properties. Hence, the model by Lindblad et al. (24)
was modified based on relevant experimental data for the
kinetics and current densities of several major ionic currents
determining the AP properties of rabbit RA cells. Yamashita
et al. (18) provided voltage-clamp datasets for several ionic
currents (L-type Ca2þ current, ICaL, transient outward
current, Ito, and inward rectifier Kþ current, IK1) varying
between the crista terminalis and pectinate muscle cells,
and Ko et al. reported new data on the kinetics of ICaL (33)
and the fast Naþ current, INa (34). Conductances and kinetics
of these currents were modified to simulate their correct time
course, current density, and current-voltage (I-V) relation-
ships reported in the experiments. Below we describe details
of such modifications made for each individual current.
Fast Naþ current, INa
The fast Naþ current responsible for the initial depolarization
of the AP is difficult to measure experimentally. The only
available experimental dataset from rabbit atria, used by
the model of Lindblad et al. (24), has been obtained under
nonphysiological conditions (primarily, low temperature,
17�C). Hence, whereas steady-state characteristics of INa in
the model are reliable, its highly temperature-dependent
kinetics can be improved. A nonphysiologically high AP
overshot, which is ~þ50 mV compared to þ20 mV
measured in experiments (18), is an indicator of inadequate
kinetics of INa in the model of Lindblad et al. (24). Hence,
we modified the INa kinetics based on the recent experi-
mental data from rabbit atrial cells (34), and compared the
results to experimental voltage-clamp measurements from
peripheral rabbit SA node cells (35) adjacent to the crista
terminalis.
The I-V relationship for INa simulated with the original
model by Lindblad et al. (24) is significantly different from
the experimental data from Honjo et al. (35) at positive
membrane voltages (Fig. 2 A). The difference can be cor-
rected by reformulating the inactivation kinetics of INa based
on the experimental measurements of Ko et al. (34)—
primarily by decreasing the inactivation time constants, th1
and th2, by 0.2 and 2.5 ms, respectively (Fig. 2 B). These
changes improved the match between the simulated I-V rela-
Biophysical Journal 96(3) 798–817
tionship and experimental data (35), and resulted in a reduc-
tion of the AP overshoot to the physiological value of ~þ20
mV (18). Changes in the inactivation kinetics also produced
a maximum upstroke velocity of ~165 V/s, which is consis-
tent with the experimental data of Yamashita et al. (18). The
modified formulation for INa was used in both the crista ter-
minalis and pectinate muscle cell models, as no evidence for
regional heterogeneity in INa in the RA has been reported.
L-type Ca2þ current, ICa,L
The sustained inward L-type Ca2þ current supports the AP
plateau and provides a trigger for the intracellular Ca2þ-
induced Ca2þ release. The description of ICa,L in the model
by Lindblad et al. (24) was based on experimental data ob-
tained from rabbit SA node cells (29) and ventricular cells
(32). Comparing the I-V relationships for ICa,L simulated
with the model and measured in experiments by Yamashita
et al. (18) shows significant differences in the current density
(Fig. 3), which is ~50% lower in the model. In addition,
the I-V relationship simulated with the model is shifted
by ~þ10 mV in comparison to the experimental ones.
Hence, we reformulated the steady-state characteristics of
ICa,L (primarily, shifted the steady-state activation and inac-
tivation curves along with the respective time constants)
based on the experimental data of Ko et al. (33), and adjusted
the maximum current conductance of ICa,L to produce I-V
relationships consistent with the experimental measurements
(18). As Yamashita et al. (18) reported different currents
densities in rabbit crista terminalis and pectinate muscle
cells, the ICa,L conductance in the model was adjusted differ-
entially (increased by 180 and 220%, respectively), resulting
in the I-V relationships consistent with the experimental
measurements for these two cell types (Fig. 3). These modi-
fications improved the overall shape of the APs simulated by
the model.
Inward rectifier Kþ current, IK1
The inward rectifier supplies a functionally important Kþ
current that strongly influences the resting membrane poten-
tial. Description of IK1 in the model by Lindblad et al. (24)
utilized a combination of experimental data obtained from
A B
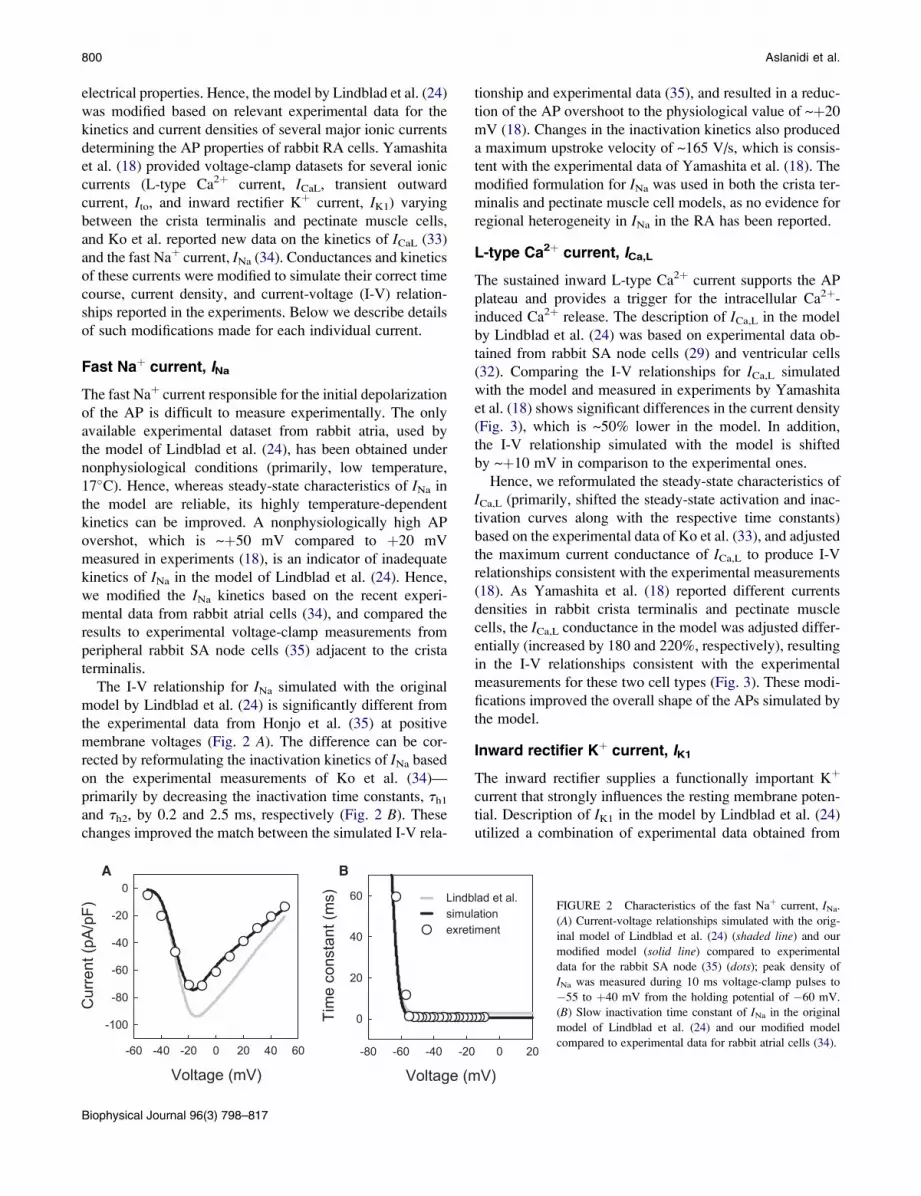
FIGURE 2 Characteristics of the fast Naþ current, INa.
(A) Current-voltage relationships simulated with the orig-
inal model of Lindblad et al. (24) (shaded line) and our
modified model (solid line) compared to experimental
data for the rabbit SA node (35) (dots); peak density of
INa was measured during 10 ms voltage-clamp pulses to
�55 to þ40 mV from the holding potential of �60 mV.
(B) Slow inactivation time constant of INa in the original
model of Lindblad et al. (24) and our modified model
compared to experimental data for rabbit atrial cells (34).
Mechanisms of Reentry in Atrial Tissue 801
A B
C D
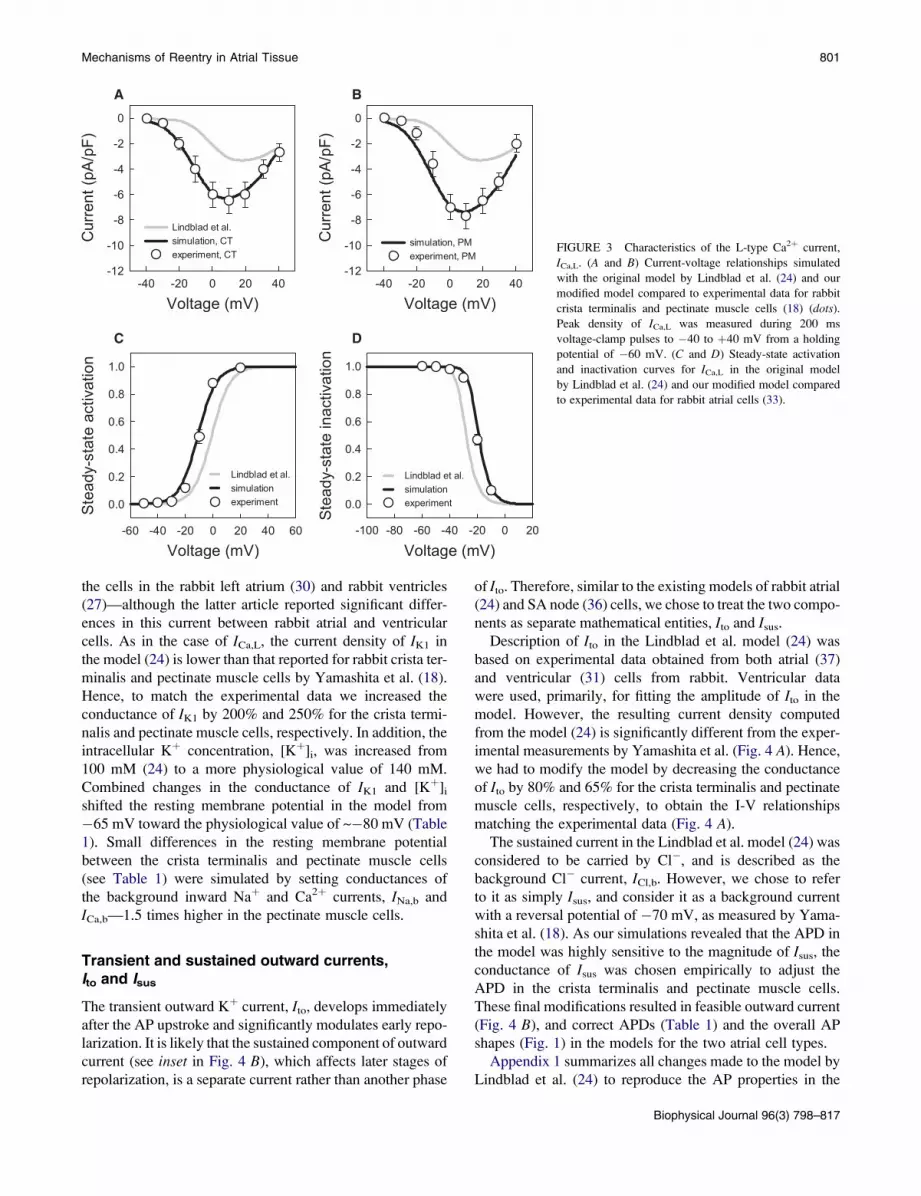
FIGURE 3 Characteristics of the L-type Ca2þ current,
ICa,L. (A and B) Current-voltage relationships simulated
with the original model by Lindblad et al. (24) and our
modified model compared to experimental data for rabbit
crista terminalis and pectinate muscle cells (18) (dots).
Peak density of ICa,L was measured during 200 ms
voltage-clamp pulses to �40 to þ40 mV from a holding
potential of �60 mV. (C and D) Steady-state activation
and inactivation curves for ICa,L in the original model
by Lindblad et al. (24) and our modified model compared
to experimental data for rabbit atrial cells (33).
the cells in the rabbit left atrium (30) and rabbit ventricles
(27)—although the latter article reported significant differ-
ences in this current between rabbit atrial and ventricular
cells. As in the case of ICa,L, the current density of IK1 in
the model (24) is lower than that reported for rabbit crista ter-
minalis and pectinate muscle cells by Yamashita et al. (18).
Hence, to match the experimental data we increased the
conductance of IK1 by 200% and 250% for the crista termi-
nalis and pectinate muscle cells, respectively. In addition, the
intracellular Kþ concentration, [Kþ]i, was increased from
100 mM (24) to a more physiological value of 140 mM.
Combined changes in the conductance of IK1 and [Kþ]i
shifted the resting membrane potential in the model from
�65 mV toward the physiological value of ~�80 mV (Table
1). Small differences in the resting membrane potential
between the crista terminalis and pectinate muscle cells
(see Table 1) were simulated by setting conductances of
the background inward Naþ and Ca2þ currents, INa,b and
ICa,b—1.5 times higher in the pectinate muscle cells.
Transient and sustained outward currents,Ito and Isus
The transient outward Kþ current, Ito, develops immediately
after the AP upstroke and significantly modulates early repo-
larization. It is likely that the sustained component of outward
current (see inset in Fig. 4 B), which affects later stages of
repolarization, is a separate current rather than another phase
of Ito. Therefore, similar to the existing models of rabbit atrial
(24) and SA node (36) cells, we chose to treat the two compo-
nents as separate mathematical entities, Ito and Isus.
Description of Ito in the Lindblad et al. model (24) was
based on experimental data obtained from both atrial (37)
and ventricular (31) cells from rabbit. Ventricular data
were used, primarily, for fitting the amplitude of Ito in the
model. However, the resulting current density computed
from the model (24) is significantly different from the exper-
imental measurements by Yamashita et al. (Fig. 4 A). Hence,
we had to modify the model by decreasing the conductance
of Ito by 80% and 65% for the crista terminalis and pectinate
muscle cells, respectively, to obtain the I-V relationships
matching the experimental data (Fig. 4 A).
The sustained current in the Lindblad et al. model (24) was
considered to be carried by Cl�, and is described as the
background Cl� current, ICl,b. However, we chose to refer
to it as simply Isus, and consider it as a background current
with a reversal potential of �70 mV, as measured by Yama-
shita et al. (18). As our simulations revealed that the APD in
the model was highly sensitive to the magnitude of Isus, the
conductance of Isus was chosen empirically to adjust the
APD in the crista terminalis and pectinate muscle cells.
These final modifications resulted in feasible outward current
(Fig. 4 B), and correct APDs (Table 1) and the overall AP
shapes (Fig. 1) in the models for the two atrial cell types.
Appendix 1 summarizes all changes made to the model by
Lindblad et al. (24) to reproduce the AP properties in the
Biophysical Journal 96(3) 798–817
802 Aslanidi et al.
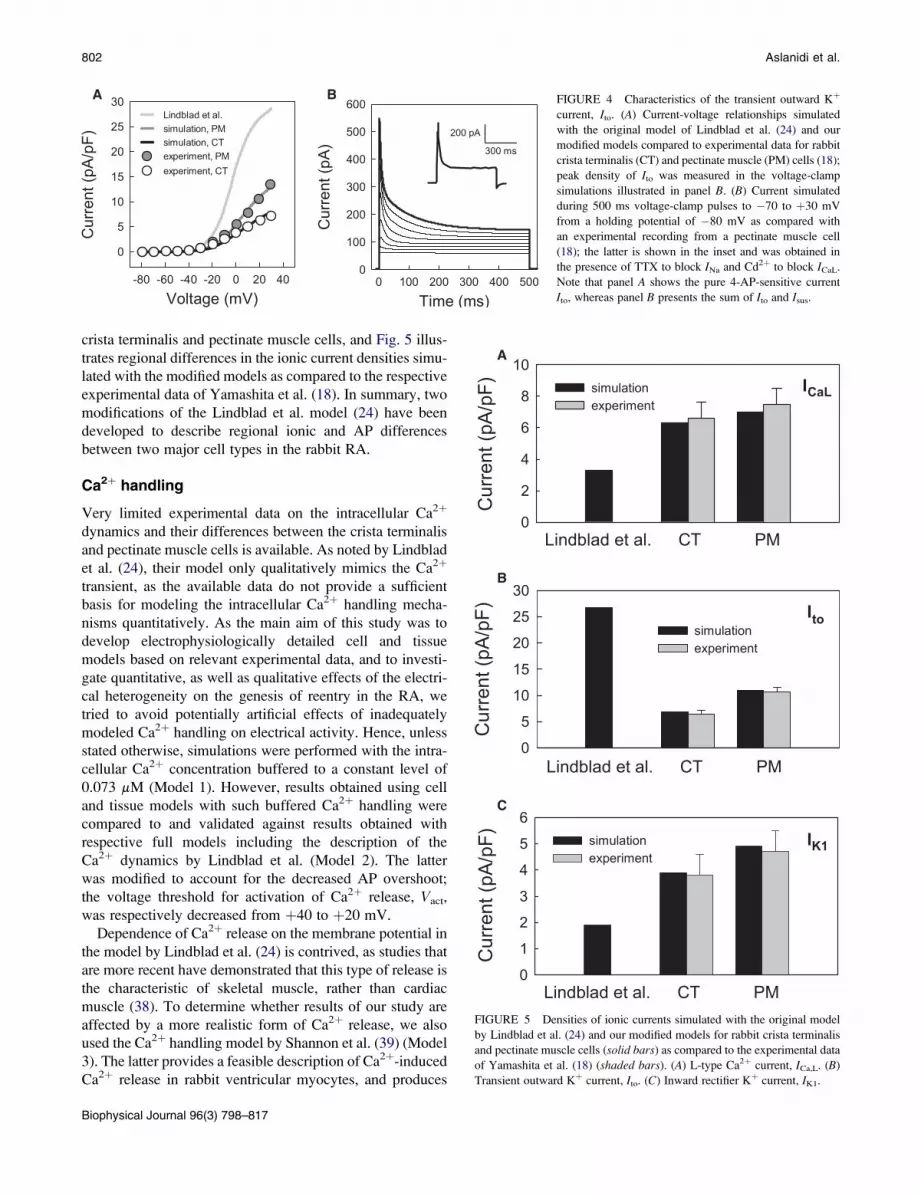
A B FIGURE 4 Characteristics of the transient outward Kþ
current, Ito. (A) Current-voltage relationships simulated
with the original model of Lindblad et al. (24) and our
modified models compared to experimental data for rabbit
crista terminalis (CT) and pectinate muscle (PM) cells (18);
peak density of Ito was measured in the voltage-clamp
simulations illustrated in panel B. (B) Current simulated
during 500 ms voltage-clamp pulses to �70 to þ30 mV
from a holding potential of �80 mV as compared with
an experimental recording from a pectinate muscle cell
(18); the latter is shown in the inset and was obtained in
the presence of TTX to block INa and Cd2þ to block ICaL.
Note that panel A shows the pure 4-AP-sensitive current
Ito, whereas panel B presents the sum of Ito and Isus.
crista terminalis and pectinate muscle cells, and Fig. 5 illus-
trates regional differences in the ionic current densities simu-
lated with the modified models as compared to the respective
experimental data of Yamashita et al. (18). In summary, two
modifications of the Lindblad et al. model (24) have been
developed to describe regional ionic and AP differences
between two major cell types in the rabbit RA.
Ca2þ handling
Very limited experimental data on the intracellular Ca2þ
dynamics and their differences between the crista terminalis
and pectinate muscle cells is available. As noted by Lindblad
et al. (24), their model only qualitatively mimics the Ca2þ
transient, as the available data do not provide a sufficient
basis for modeling the intracellular Ca2þ handling mecha-
nisms quantitatively. As the main aim of this study was to
develop electrophysiologically detailed cell and tissue
models based on relevant experimental data, and to investi-
gate quantitative, as well as qualitative effects of the electri-
cal heterogeneity on the genesis of reentry in the RA, we
tried to avoid potentially artificial effects of inadequately
modeled Ca2þ handling on electrical activity. Hence, unless
stated otherwise, simulations were performed with the intra-
cellular Ca2þ concentration buffered to a constant level of
0.073 mM (Model 1). However, results obtained using cell
and tissue models with such buffered Ca2þ handling were
compared to and validated against results obtained with
respective full models including the description of the
Ca2þ dynamics by Lindblad et al. (Model 2). The latter
was modified to account for the decreased AP overshoot;
the voltage threshold for activation of Ca2þ release, Vact,
was respectively decreased from þ40 to þ20 mV.
Dependence of Ca2þ release on the membrane potential in
the model by Lindblad et al. (24) is contrived, as studies that
are more recent have demonstrated that this type of release is
the characteristic of skeletal muscle, rather than cardiac
muscle (38). To determine whether results of our study are
affected by a more realistic form of Ca2þ release, we also
used the Ca2þ handling model by Shannon et al. (39) (Model
3). The latter provides a feasible description of Ca2þ-induced
Ca2þ release in rabbit ventricular myocytes, and produces
Biophysical Journal 96(3) 798–817
A
B
C
FIGURE 5 Densities of ionic currents simulated with the original model
by Lindblad et al. (24) and our modified models for rabbit crista terminalis
and pectinate muscle cells (solid bars) as compared to the experimental data
of Yamashita et al. (18) (shaded bars). (A) L-type Ca2þ current, ICa,L. (B)
Transient outward Kþ current, Ito. (C) Inward rectifier Kþ current, IK1.
Mechanisms of Reentry in Atrial Tissue 803
long Ca2þ transients (~500 ms) characteristic of this cell
type. We used Ca2þ handling equations and parameters by
Shannon et al. (39) as downloaded from http://www.
cellml.org, but rescaled cell volumes and the magnitude of
Ca2þ uptake (pump) and release fluxes, Jpump,SR and Jrel,SR,
to produce shorter Ca2þ transients (~100 ms) characteristic
of rabbit atrial myocytes (40,41). Primarily, the whole cell
volume, Volcell, (and hence, volumes of all intracellular
compartments) was halved, and rate constants of Jpump,SR
and Jrel,SR (Vmax and ks, respectively) were increased 15-
and fivefold, respectively. Note that all ionic currents in
ventricular myocytes can be considered as consisting of
two fractions that flow through the sarcolemma and junc-
tional clefts, respectively (39). Such consideration is invalid
in case of atrial myocytes due to the lack of T-tubule system
(42). Hence, we considered all ionic currents in Model 3 as
purely sarcolemmal currents, with the current responsible
for Ca2þ-induced Ca2þ release, ICa,L, flowing into the cell
at specialized junctional sites close to ryanodine receptors
(42,43).
Full kinetic equations for the alternative formulations of
the Ca2þ handling models by Lindblad et al. (24) and Shan-
non et al. (39) are presented in Appendices 2 and 3.
Other ion concentrations
Similar to buffering the intracellular Ca2þ concentration,
concentrations of Naþ and Kþ in Model 1 were buffered to
constant levels ([Naþ]i ¼ 8.4 mM and [Kþ]i ¼ 140 mM)
to avoid effects of slow concentration drifts on electrical
activity. However, in Model 2 and Model 3 full dynamic
variations of the intracellular ionic concentrations, as
described by Lindblad et al. (24) and Shannon et al. (39),
were used. Respective kinetic equations are presented in
Appendices 2 and 3. Hence, in the model with buffered
Ca2þ (Model 1), all ion concentrations are buffered, whereas
in models with full Ca2þ handling (Models 2 and 3), the
concentrations are dynamic. Initial values for all concentra-
tions (as well as other kinetic variables) in the latter case
were determined as steady-state values at the end of 10 s
pacing at physiological rate of 500 ms.
Three-dimensional tissue model
The developed single cell models were incorporated into
a detailed three-dimensional tissue model describing the
complex anatomical structure of the rabbit RA tissue (Fig. 6).
In cardiac tissue, cylindrical cells are aligned parallel to
each other, and excitation is conducted faster along the fibers
than across them (2,44–46). Primarily, the RA tissue has
a characteristic pattern of fibers arranged along the bundles
of the crista terminalis and pectinate muscles, which
provides a fast pathway for activation spread from the SA
node into the RA. Detailed three-dimensional anatomical
structure of the rabbit RA has been reconstructed recently
based on a combination of histological and immunohisto-
chemical experiments (23). Its geometry presents a high-
resolution (40 mm), regular Cartesian grid of 210 � 45 �240 points; for each point a flag variable identifies whether
it belongs to the crista terminalis or pectinate muscle. Fiber
orientation has been measured histologically at the epicardial
and endocardial surfaces of the RA. As these two patterns are
similar to each other, and the rabbit atrial tissue is very thin,
we assume that the fiber orientation does not change through
the depth of the tissue. Details of the fiber alignment along
the bundles of the crista terminalis and pectinate muscles
are illustrated in Fig. 6, B and C.
Values of the diffusion coefficients along and transverse to
the fibers in our model are Djj ¼ 5 mm2 ms�1 and Dt ¼0.5 mm2 ms�1 (corresponding to integral gap junctional
conductances of 500 nS and 50 nS), respectively. Such diffu-
sion coefficients produce intraatrial conduction velocities of
~0.6 and 0.2 m/s in parallel and transverse to the fiber direc-
tion. This is in good agreement with respective experimental
measurements of 0.5–0.8 and 0.15–0.45 m/s (44–46).
Combinations of the fiber orientation vectors with the diffu-
sion coefficients give components of the tensor D at each
grid point (7,25).
Equation 1 was solved on the geometry grid using a finite-
difference partial differential equation solver based on the
explicit Euler method with time and space steps, Dt ¼0.005 ms and Dx ¼ 0.04 mm, respectively. Computer code
implementing the partial differential equation solver was
parallelized under MPI and executed on the IBM BlueGene
supercomputer (Edinburgh, UK). A single run of the code
simulating 1 s of activity on 128 CPUs took ~6 h. Thus,
a high-resolution model incorporating detailed tissue
anatomy, fiber orientation, and electrical heterogeneity
within the rabbit RA has been constructed and implemented.
SIMULATIONS
Fig. 1 illustrates simulated action potentials in the crista
terminalis and pectinate muscle cells, as compared to the
respective experimental recordings (18). Not only the AP
shapes, but all major AP characteristics are consistent with
the experimental data shown in Table 1: the new models
accurately reproduce the AP duration, overshoot, maximum
upstroke velocity, and the resting membrane potential, as
observed in experiments by Yamashita et al. (18). Impor-
tantly, the original model by Lindblad et al. (24) was modi-
fied only to incorporate available experimental data on
kinetics of several ionic currents in the crista terminalis
and pectinate muscle cells (18,33,34), but this ultimately
resulted in accurate reconstruction of the experimentally
measured AP properties in these two cell types.
Transition from normal propagation to reentry
Computer simulations with the three-dimensional model
reproduce essential features of patterns of electrical activity
Biophysical Journal 96(3) 798–817
804 Aslanidi et al.
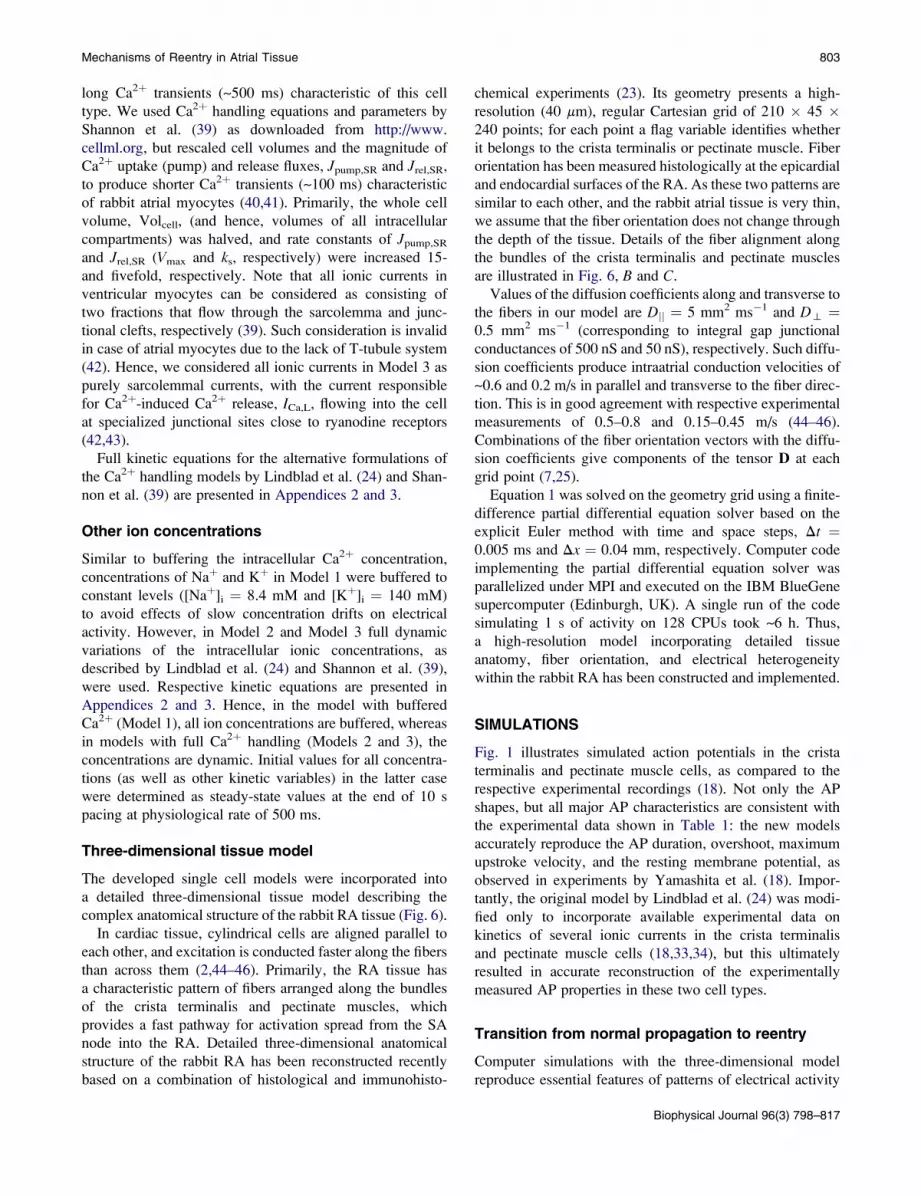
A B C FIGURE 6 Reconstructed anatomy
of rabbit RA tissue. (A) Three-
dimensional tissue geometry with the
thick bundle of crista terminalis (CT,
crossing the tissue vertically) and
smaller pectinate muscles (PM, branch-
ing to the left) shown with arrows.
Approximate positions of the superior
vena cava (SVC) and the inferior vena
cava (IVC) are indicated. Note that holes
in the tissue geometry are not physical
defects of the RA, but simply areas occu-
pied by connective tissue as identified by
histological methods (23). (B) Fiber
orientations in the semitransparent tissue
shown with short solid lines. (C) Super-
position of the tissue geometry and fiber
orientation illustrating fiber alignment
along the bundles of the crista terminalis
and pectinate muscles.
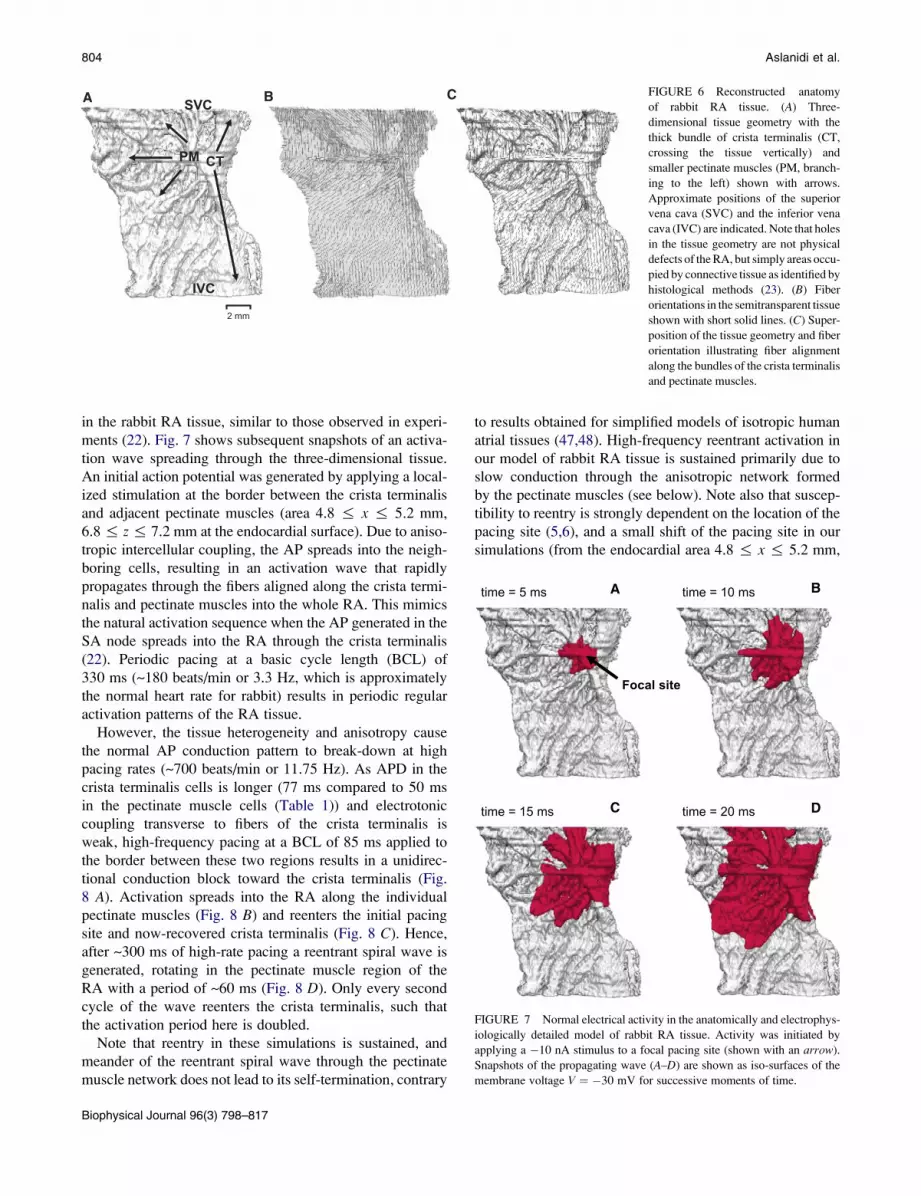
in the rabbit RA tissue, similar to those observed in experi-
ments (22). Fig. 7 shows subsequent snapshots of an activa-
tion wave spreading through the three-dimensional tissue.
An initial action potential was generated by applying a local-
ized stimulation at the border between the crista terminalis
and adjacent pectinate muscles (area 4.8 % x % 5.2 mm,
6.8 % z % 7.2 mm at the endocardial surface). Due to aniso-
tropic intercellular coupling, the AP spreads into the neigh-
boring cells, resulting in an activation wave that rapidly
propagates through the fibers aligned along the crista termi-
nalis and pectinate muscles into the whole RA. This mimics
the natural activation sequence when the AP generated in the
SA node spreads into the RA through the crista terminalis
(22). Periodic pacing at a basic cycle length (BCL) of
330 ms (~180 beats/min or 3.3 Hz, which is approximately
the normal heart rate for rabbit) results in periodic regular
activation patterns of the RA tissue.
However, the tissue heterogeneity and anisotropy cause
the normal AP conduction pattern to break-down at high
pacing rates (~700 beats/min or 11.75 Hz). As APD in the
crista terminalis cells is longer (77 ms compared to 50 ms
in the pectinate muscle cells (Table 1)) and electrotonic
coupling transverse to fibers of the crista terminalis is
weak, high-frequency pacing at a BCL of 85 ms applied to
the border between these two regions results in a unidirec-
tional conduction block toward the crista terminalis (Fig.
8 A). Activation spreads into the RA along the individual
pectinate muscles (Fig. 8 B) and reenters the initial pacing
site and now-recovered crista terminalis (Fig. 8 C). Hence,
after ~300 ms of high-rate pacing a reentrant spiral wave is
generated, rotating in the pectinate muscle region of the
RA with a period of ~60 ms (Fig. 8 D). Only every second
cycle of the wave reenters the crista terminalis, such that
the activation period here is doubled.
Note that reentry in these simulations is sustained, and
meander of the reentrant spiral wave through the pectinate
muscle network does not lead to its self-termination, contrary
Biophysical Journal 96(3) 798–817
to results obtained for simplified models of isotropic human
atrial tissues (47,48). High-frequency reentrant activation in
our model of rabbit RA tissue is sustained primarily due to
slow conduction through the anisotropic network formed
by the pectinate muscles (see below). Note also that suscep-
tibility to reentry is strongly dependent on the location of the
pacing site (5,6), and a small shift of the pacing site in our
simulations (from the endocardial area 4.8 % x % 5.2 mm,
A B
C D
FIGURE 7 Normal electrical activity in the anatomically and electrophys-
iologically detailed model of rabbit RA tissue. Activity was initiated by
applying a �10 nA stimulus to a focal pacing site (shown with an arrow).
Snapshots of the propagating wave (A–D) are shown as iso-surfaces of the
membrane voltage V ¼ �30 mV for successive moments of time.
Mechanisms of Reentry in Atrial Tissue 805
6.8 % z % 7.2 mm, to the area 4.4 % x % 4.8 mm, 6.8 %z % 7.2 mm) can result in failure to initiate reentry.
However, a much more extensive study will be required to
search the whole range of such locations, as well as stimula-
tion frequencies.
Mechanisms of reentry initiation
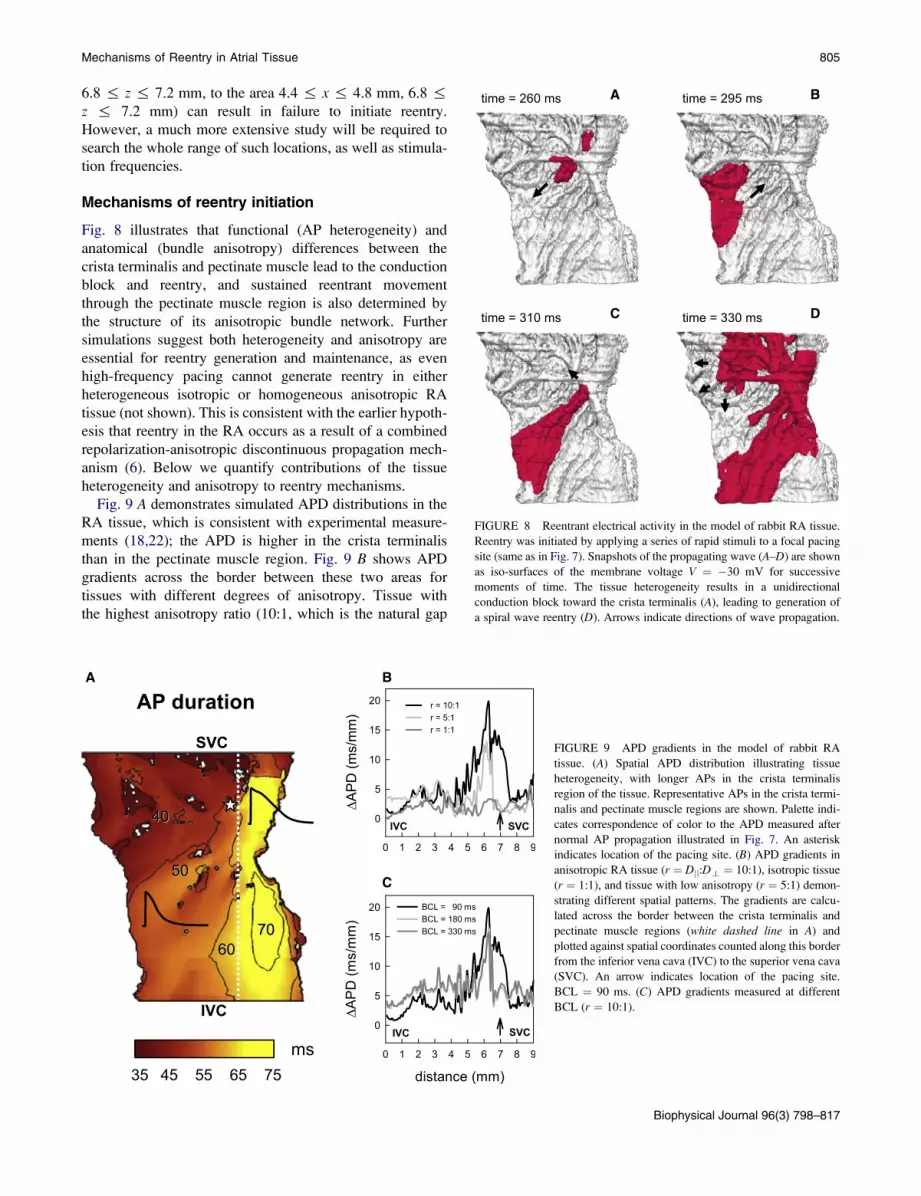
Fig. 8 illustrates that functional (AP heterogeneity) and
anatomical (bundle anisotropy) differences between the
crista terminalis and pectinate muscle lead to the conduction
block and reentry, and sustained reentrant movement
through the pectinate muscle region is also determined by
the structure of its anisotropic bundle network. Further
simulations suggest both heterogeneity and anisotropy are
essential for reentry generation and maintenance, as even
high-frequency pacing cannot generate reentry in either
heterogeneous isotropic or homogeneous anisotropic RA
tissue (not shown). This is consistent with the earlier hypoth-
esis that reentry in the RA occurs as a result of a combined
repolarization-anisotropic discontinuous propagation mech-
anism (6). Below we quantify contributions of the tissue
heterogeneity and anisotropy to reentry mechanisms.
Fig. 9 A demonstrates simulated APD distributions in the
RA tissue, which is consistent with experimental measure-
ments (18,22); the APD is higher in the crista terminalis
than in the pectinate muscle region. Fig. 9 B shows APD
gradients across the border between these two areas for
tissues with different degrees of anisotropy. Tissue with
the highest anisotropy ratio (10:1, which is the natural gap
A B
C D
FIGURE 8 Reentrant electrical activity in the model of rabbit RA tissue.
Reentry was initiated by applying a series of rapid stimuli to a focal pacing
site (same as in Fig. 7). Snapshots of the propagating wave (A–D) are shown
as iso-surfaces of the membrane voltage V ¼ �30 mV for successive
moments of time. The tissue heterogeneity results in a unidirectional
conduction block toward the crista terminalis (A), leading to generation of
a spiral wave reentry (D). Arrows indicate directions of wave propagation.
A B
C
FIGURE 9 APD gradients in the model of rabbit RA
tissue. (A) Spatial APD distribution illustrating tissue
heterogeneity, with longer APs in the crista terminalis
region of the tissue. Representative APs in the crista termi-
nalis and pectinate muscle regions are shown. Palette indi-
cates correspondence of color to the APD measured after
normal AP propagation illustrated in Fig. 7. An asterisk
indicates location of the pacing site. (B) APD gradients in
anisotropic RA tissue (r ¼ Djj:Dt ¼ 10:1), isotropic tissue
(r ¼ 1:1), and tissue with low anisotropy (r ¼ 5:1) demon-
strating different spatial patterns. The gradients are calcu-
lated across the border between the crista terminalis and
pectinate muscle regions (white dashed line in A) and
plotted against spatial coordinates counted along this border
from the inferior vena cava (IVC) to the superior vena cava
(SVC). An arrow indicates location of the pacing site.
BCL ¼ 90 ms. (C) APD gradients measured at different
BCL (r ¼ 10:1).
Biophysical Journal 96(3) 798–817
806 Aslanidi et al.
junctional anisotropy of the RA bundles (44–46)) shows the
highest APD gradients of up to ~20 ms/mm, whereas in
isotropic tissue the APD gradients are modulated by the elec-
trotonic coupling and reduced to ~1–3 ms/mm. Increase of
the APD gradient at higher anisotropy ratios (Fig. 9 B) can
be explained by weaker coupling transverse to the crista ter-
minalis, which results in weaker modulation of the spatial
APD distribution by the electrotonic interactions. Fig. 9 Cshows that the magnitude of the APD gradients also
increases at higher pacing rates. Hence, only anisotropic
RA tissue paced at a high rate generates APD gradients large
enough to produce conduction block in the crista terminalis.
Note that the conduction block in our simulations was
achieved primarily by pacing the tissue close to the site
that produced the highest APD gradient (Fig. 9, B and C).
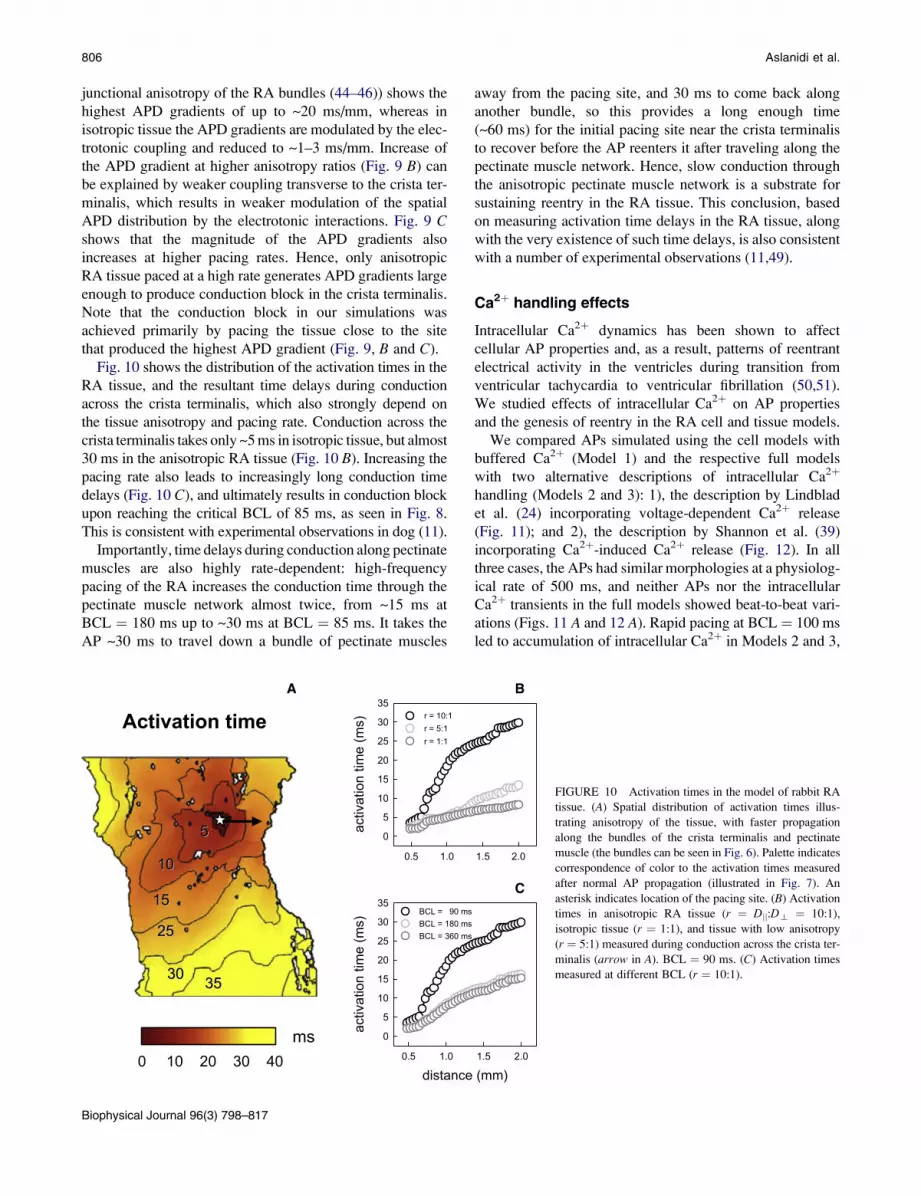
Fig. 10 shows the distribution of the activation times in the
RA tissue, and the resultant time delays during conduction
across the crista terminalis, which also strongly depend on
the tissue anisotropy and pacing rate. Conduction across the
crista terminalis takes only ~5 ms in isotropic tissue, but almost
30 ms in the anisotropic RA tissue (Fig. 10 B). Increasing the
pacing rate also leads to increasingly long conduction time
delays (Fig. 10 C), and ultimately results in conduction block
upon reaching the critical BCL of 85 ms, as seen in Fig. 8.
This is consistent with experimental observations in dog (11).
Importantly, time delays during conduction along pectinate
muscles are also highly rate-dependent: high-frequency
pacing of the RA increases the conduction time through the
pectinate muscle network almost twice, from ~15 ms at
BCL ¼ 180 ms up to ~30 ms at BCL ¼ 85 ms. It takes the
AP ~30 ms to travel down a bundle of pectinate muscles
Biophysical Journal 96(3) 798–817
away from the pacing site, and 30 ms to come back along
another bundle, so this provides a long enough time
(~60 ms) for the initial pacing site near the crista terminalis
to recover before the AP reenters it after traveling along the
pectinate muscle network. Hence, slow conduction through
the anisotropic pectinate muscle network is a substrate for
sustaining reentry in the RA tissue. This conclusion, based
on measuring activation time delays in the RA tissue, along
with the very existence of such time delays, is also consistent
with a number of experimental observations (11,49).
Ca2þ handling effects
Intracellular Ca2þ dynamics has been shown to affect
cellular AP properties and, as a result, patterns of reentrant
electrical activity in the ventricles during transition from
ventricular tachycardia to ventricular fibrillation (50,51).
We studied effects of intracellular Ca2þ on AP properties
and the genesis of reentry in the RA cell and tissue models.
We compared APs simulated using the cell models with
buffered Ca2þ (Model 1) and the respective full models
with two alternative descriptions of intracellular Ca2þ
handling (Models 2 and 3): 1), the description by Lindblad
et al. (24) incorporating voltage-dependent Ca2þ release
(Fig. 11); and 2), the description by Shannon et al. (39)
incorporating Ca2þ-induced Ca2þ release (Fig. 12). In all
three cases, the APs had similar morphologies at a physiolog-
ical rate of 500 ms, and neither APs nor the intracellular
Ca2þ transients in the full models showed beat-to-beat vari-
ations (Figs. 11 A and 12 A). Rapid pacing at BCL ¼ 100 ms
led to accumulation of intracellular Ca2þ in Models 2 and 3,
Activation time
distance (mm)0.5 1.0 1.5 2.0
activ
atio
n tim
e (m
s)
0
5
10
15
20
25
30
35BCL = 90 msBCL = 180 msBCL = 360 ms
0.5 1.0 1.5 2.0
activ
atio
n tim
e (m
s)
0
5
10
15
20
25
30
35r = 10:1r = 5:1r = 1:1
A B
C
55
1010
1515
2525
30303535
0 10 20 30 40ms
FIGURE 10 Activation times in the model of rabbit RA
tissue. (A) Spatial distribution of activation times illus-
trating anisotropy of the tissue, with faster propagation
along the bundles of the crista terminalis and pectinate
muscle (the bundles can be seen in Fig. 6). Palette indicates
correspondence of color to the activation times measured
after normal AP propagation (illustrated in Fig. 7). An
asterisk indicates location of the pacing site. (B) Activation
times in anisotropic RA tissue (r ¼ Djj:Dt ¼ 10:1),
isotropic tissue (r ¼ 1:1), and tissue with low anisotropy
(r ¼ 5:1) measured during conduction across the crista ter-
minalis (arrow in A). BCL ¼ 90 ms. (C) Activation times
measured at different BCL (r ¼ 10:1).
Mechanisms of Reentry in Atrial Tissue 807
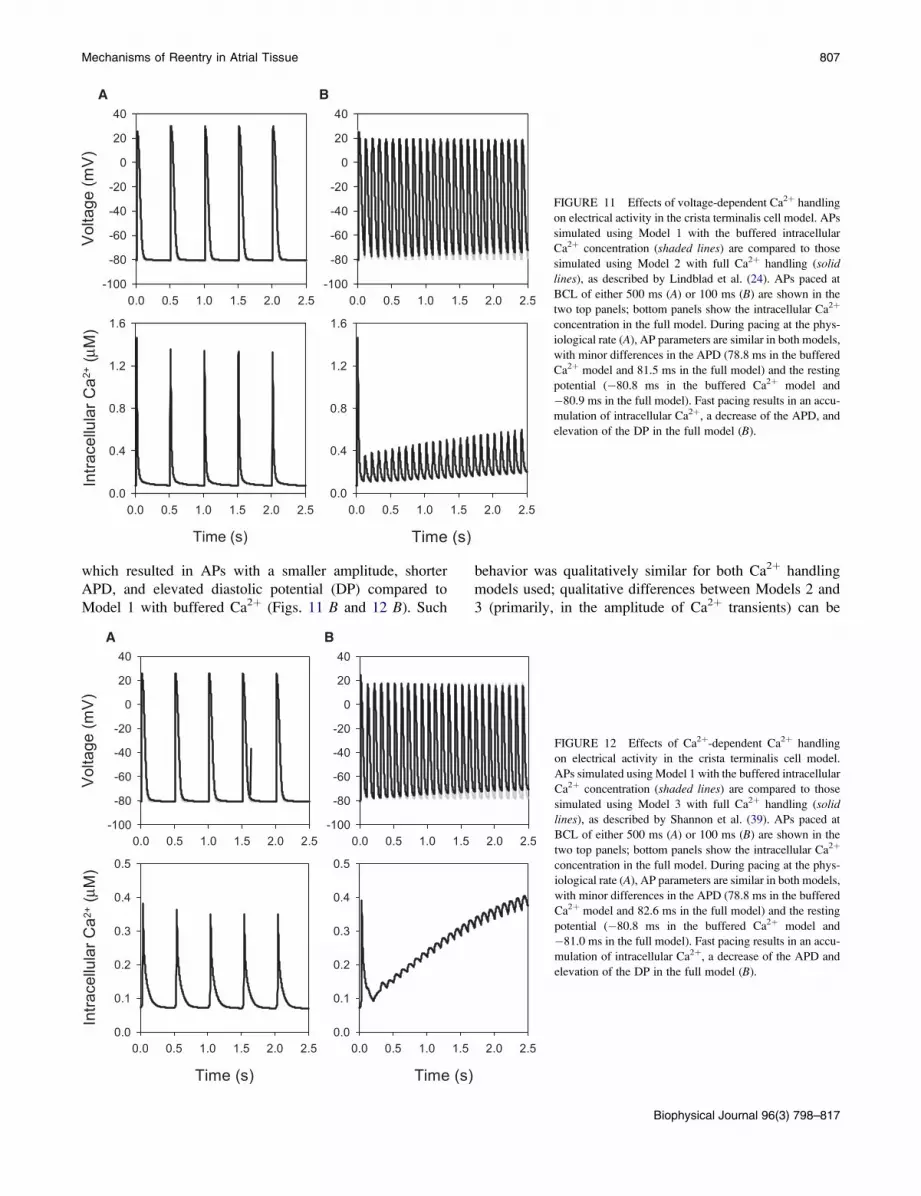
A B
FIGURE 11 Effects of voltage-dependent Ca2þ handling
on electrical activity in the crista terminalis cell model. APs
simulated using Model 1 with the buffered intracellular
Ca2þ concentration (shaded lines) are compared to those
simulated using Model 2 with full Ca2þ handling (solid
lines), as described by Lindblad et al. (24). APs paced at
BCL of either 500 ms (A) or 100 ms (B) are shown in the
two top panels; bottom panels show the intracellular Ca2þ
concentration in the full model. During pacing at the phys-
iological rate (A), AP parameters are similar in both models,
with minor differences in the APD (78.8 ms in the buffered
Ca2þ model and 81.5 ms in the full model) and the resting
potential (�80.8 ms in the buffered Ca2þ model and
�80.9 ms in the full model). Fast pacing results in an accu-
mulation of intracellular Ca2þ, a decrease of the APD, and
elevation of the DP in the full model (B).
which resulted in APs with a smaller amplitude, shorter
APD, and elevated diastolic potential (DP) compared to
Model 1 with buffered Ca2þ (Figs. 11 B and 12 B). Such
behavior was qualitatively similar for both Ca2þ handling
models used; qualitative differences between Models 2 and
3 (primarily, in the amplitude of Ca2þ transients) can be
A B
FIGURE 12 Effects of Ca2þ-dependent Ca2þ handling
on electrical activity in the crista terminalis cell model.
APs simulated using Model 1 with the buffered intracellular
Ca2þ concentration (shaded lines) are compared to those
simulated using Model 3 with full Ca2þ handling (solidlines), as described by Shannon et al. (39). APs paced at
BCL of either 500 ms (A) or 100 ms (B) are shown in the
two top panels; bottom panels show the intracellular Ca2þ
concentration in the full model. During pacing at the phys-
iological rate (A), AP parameters are similar in both models,
with minor differences in the APD (78.8 ms in the buffered
Ca2þ model and 82.6 ms in the full model) and the resting
potential (�80.8 ms in the buffered Ca2þ model and
�81.0 ms in the full model). Fast pacing results in an accu-
mulation of intracellular Ca2þ, a decrease of the APD and
elevation of the DP in the full model (B).
Biophysical Journal 96(3) 798–817
808 Aslanidi et al.
explained by greater Ca2þ release in the voltage-dependent
Model 2. Note that accumulation of intracellular Ca2þ and
elevation of the DP has been observed during rapid pacing
in ventricular cells (51).
Importantly, genesis of reentry initiation was similar in the
RA tissue models with and without Ca2þ handling: in all
cases, reentry occurred due to a combination of the tissue
electrical heterogeneity and anisotropy between the crista
terminalis and pectinate muscles (Fig. 13); the initiation
mechanism was not affected by Ca2þ handling. Note that
reentry in the tissue model with buffered Ca2þ (Model 1)
was sustained, whereas in the full models (Models 2 and
3) it was transient and self-terminated after several cycles
of rotation, as observed previously in two-dimensional
model human atrial tissue models (47,48). This can be ex-
plained by emergence of conduction block areas within the
tissue due to local elevations of intracellular Ca2þ (51,52),
which leaves the spiral wave no space for rotation.
DISCUSSION
The main aims of this study were to:
1. Develop a new family of AP models for the atrial cells of
the crista terminalis and pectinate muscles, which incor-
porate experimental data on heterogeneous electrical
properties of the rabbit RA (18).
2. Develop a three-dimensional electrophysiologically and
anatomically detailed computer model of the rabbit RA,
which accounts for the electrical heterogeneities and fiber
orientations in the distinctive regions of the crista termi-
nalis and pectinate muscles (23).
3. Use the three-dimensional model to investigate the effects
of atrial electrical heterogeneity and anatomical complexity
on the genesis of reentrant excitation in the RA.
These aims were successfully achieved. The resultant model
reconstructs complex electrical activity in the rabbit RA, and
provides insights into the mechanisms of transition from rapid
focal activity to reentry due to atrial heterogeneity and anisot-
ropy. Combined effects of intrinsic APD differences between
the crista terminalis and pectinate muscles and conduction
discontinuities due to their anisotropic bundle structure are iden-
tified as the substrate for such a transition, and slow conduction
through the pectinate muscle network is a substrate for sustaining
reentry in the RA tissue. Below we discuss major achievements,
as well as limitations of the study, and compare its results and
conclusions with AF mechanisms reported in other studies.
Single cell model
A new family of models for action potentials in rabbit atrial
cells of the crista terminalis and pectinate muscles has been
developed based on modifications of the model of Lindblad
et al. (24). This is the first successful incorporation of
detailed electrical heterogeneity of the rabbit RA into a math-
ematical model. The models, along with our previous models
Biophysical Journal 96(3) 798–817
for the heterogeneous SA node (36) and ventricular myo-
cytes (53), provide an important step toward our final goal
of developing a model for the whole rabbit heart, which
will account for details of its electrophysiological heteroge-
neity and anatomical complexity (54).
The new models for the rabbit crista terminalis and pecti-
nate muscle cells have several advantages compared to
earlier models of rabbit atrial cells (24,41) in terms of phys-
iological detail and relevance. The Hilgemann-Noble model
(41) was based on experimental data from multicellular
tissue and did not reflect the true features of electrical activity
in a single atrial myocyte. Although the ion channel kinetics
and conductances in the Hilgemann-Noble model were later
rescaled for a single cell (55), the model still had inevitable
limitations as several ion channels had not been identified at
that time (including the rapid and slow delayed rectifier Kþ
channels and the 4-AP sensitive transient outward Kþ
channel). A more recent model of Lindblad et al. (24) was
developed mainly based on experimental data from single
myocytes, but from a mixed source of different cell types
and species. Another disadvantage of the Lindblad et al.
model is that it does not address regional differences in the
electrical properties of atrial cells (such as the differences
between the crista terminalis and pectinate muscle cells).
Although the AP simulated by the model of Lindblad et al.
resembles the generic form of the rabbit atrial AP, its charac-
teristics (such as APA, APD, RP, and maximum upstroke
velocity; see Table 1) are significantly different from exper-
imental values. The models developed in this study not only
update the description of several ionic currents and, as a result
the AP characteristics, in the model by Lindblad et al., but
also incorporate the electrical heterogeneity of the rabbit RA.
AP rate-dependence
Experimental data on the AP rate-dependence in rabbit RA
cells is limited. Yamashita et al. (18) provided AP recordings
from the rabbit crista terminalis and pectinate muscle cells
only at BCLs of 100 and 1000 ms, while Qi et al. (19) re-
corded APs from the rabbit crista terminalis at BCLs of
500 and 2000 ms. Hence, detailed restitution properties of
these two cell types cannot be validated due to lack of exper-
imental measurements. However, simulation results can be
compared to experimental data for the rabbit crista terminalis
cell paced at several commonly used (either fast or slow)
rates. APD values measured from the experimental AP
recordings (18,19) at BCLs of 100, 500, 1000, and
2000 ms were ~70, 80, 77, and 75 ms. These are in excellent
agreement with the respective values of 71.4, 79.2, 77.8, and
74.4 ms calculated from our crista terminalis cell model.
Sustained outward current
Simulations show that AP properties (primarily, APD) of the
crista terminalis and pectinate muscle cells can be modulated
by the sustained component of the outward current, Isus.
Mechanisms of Reentry in Atrial Tissue 809
Hence, the conductance and reversal potential of Isus in the
respective models were adjusted to reproduce experimental
measurements (18). Notably, while the original model of Lind-
blad et al. (24) implemented Isus as a background Cl� current,
the modifications consider it nonselective, with a reversal
potential Esus of �70 mV. In electrophysiological terms, the
current can be interpreted as a sum of two separate currents,
the background Kþ current, IK,b, with a reversal potential of
~�85 mV (which corresponds to the Kþ equilibrium potential,
EK), and the background Cl� current, ICl,b, with a reversal
potential of ~�40 mV (Cl� equilibrium potential, ECl).
Such consideration is valid, as the background currents are
linear; hence, Isus ¼ gsus(V–Esus) ¼ gK,b(V–EK) þ gCl,b
(V–ECl) ¼ (gK,bþgCl,b)(V–(gK,bEKþgCl,bECl)/(gK,bþgCl,b)),
where gsus ¼ gK,bþgCl,b and Esus ¼ (gK,bEKþgCl,bECl)/
(gK,bþgCl,b). Substituting numerical values for the reversal
potentials gives (1þg)(–70) ¼ (–85 þ g(–40)), where g ¼gCl,b/gK,b. Solving the latter equation produces the value
g ¼ 0.5 and the resulting relations gsus ¼ 3.0gCl,b ¼ 1.5 gK,b.
Hence, the nonselective background current defined in
our model as Isus ¼ gsus(Vþ70) could be a sum of two
ion-specific currents, the background Kþ current IK,b ¼
time = 330 ms
BA
DC
time = 265 ms time = 295 ms
time = 310 ms
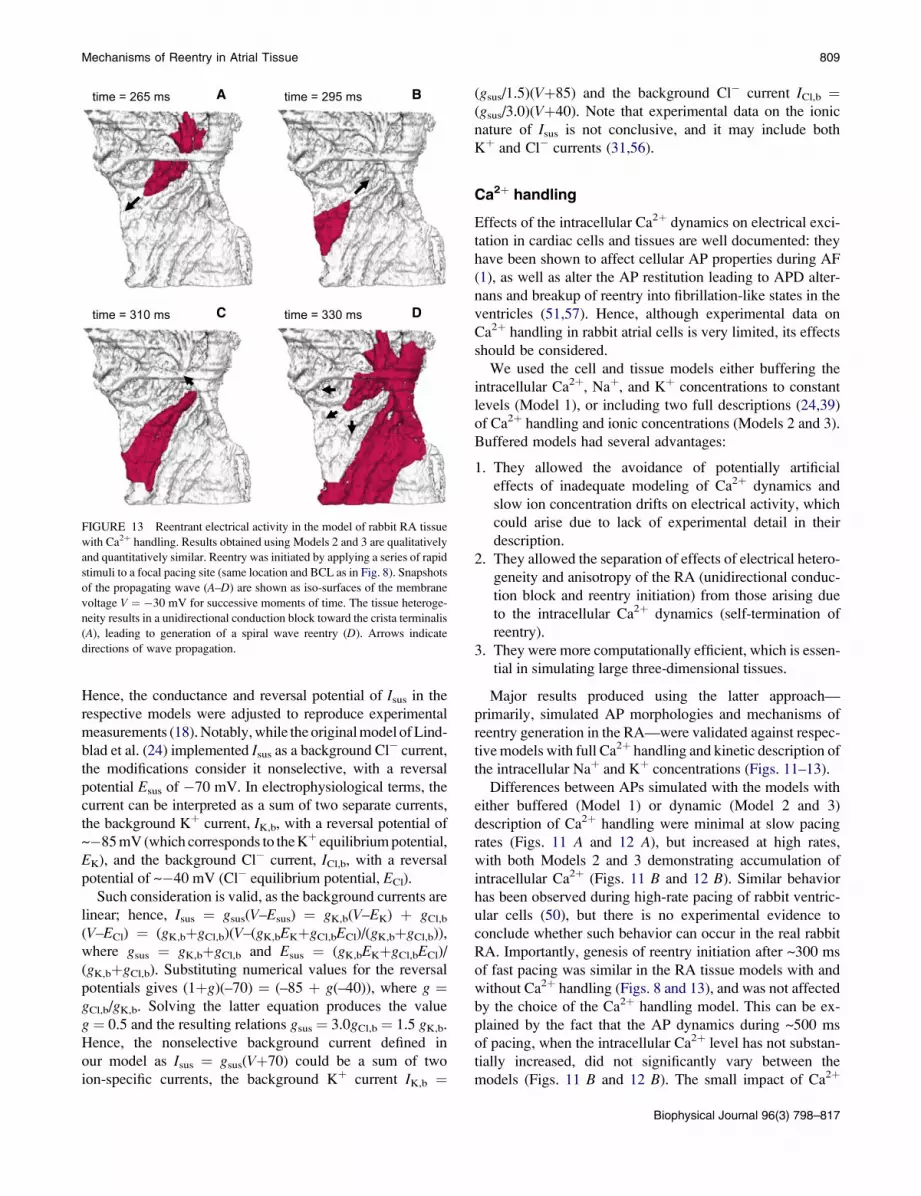
FIGURE 13 Reentrant electrical activity in the model of rabbit RA tissue
with Ca2þ handling. Results obtained using Models 2 and 3 are qualitatively
and quantitatively similar. Reentry was initiated by applying a series of rapid
stimuli to a focal pacing site (same location and BCL as in Fig. 8). Snapshots
of the propagating wave (A–D) are shown as iso-surfaces of the membrane
voltage V ¼ �30 mV for successive moments of time. The tissue heteroge-
neity results in a unidirectional conduction block toward the crista terminalis
(A), leading to generation of a spiral wave reentry (D). Arrows indicate
directions of wave propagation.
(gsus/1.5)(Vþ85) and the background Cl� current ICl,b ¼(gsus/3.0)(Vþ40). Note that experimental data on the ionic
nature of Isus is not conclusive, and it may include both
Kþ and Cl� currents (31,56).
Ca2þ handling
Effects of the intracellular Ca2þ dynamics on electrical exci-
tation in cardiac cells and tissues are well documented: they
have been shown to affect cellular AP properties during AF
(1), as well as alter the AP restitution leading to APD alter-
nans and breakup of reentry into fibrillation-like states in the
ventricles (51,57). Hence, although experimental data on
Ca2þ handling in rabbit atrial cells is very limited, its effects
should be considered.
We used the cell and tissue models either buffering the
intracellular Ca2þ, Naþ, and Kþ concentrations to constant
levels (Model 1), or including two full descriptions (24,39)
of Ca2þ handling and ionic concentrations (Models 2 and 3).
Buffered models had several advantages:
1. They allowed the avoidance of potentially artificial
effects of inadequate modeling of Ca2þ dynamics and
slow ion concentration drifts on electrical activity, which
could arise due to lack of experimental detail in their
description.
2. They allowed the separation of effects of electrical hetero-
geneity and anisotropy of the RA (unidirectional conduc-
tion block and reentry initiation) from those arising due
to the intracellular Ca2þ dynamics (self-termination of
reentry).
3. They were more computationally efficient, which is essen-
tial in simulating large three-dimensional tissues.
Major results produced using the latter approach—
primarily, simulated AP morphologies and mechanisms of
reentry generation in the RA—were validated against respec-
tive models with full Ca2þ handling and kinetic description of
the intracellular Naþ and Kþ concentrations (Figs. 11–13).
Differences between APs simulated with the models with
either buffered (Model 1) or dynamic (Model 2 and 3)
description of Ca2þ handling were minimal at slow pacing
rates (Figs. 11 A and 12 A), but increased at high rates,
with both Models 2 and 3 demonstrating accumulation of
intracellular Ca2þ (Figs. 11 B and 12 B). Similar behavior
has been observed during high-rate pacing of rabbit ventric-
ular cells (50), but there is no experimental evidence to
conclude whether such behavior can occur in the real rabbit
RA. Importantly, genesis of reentry initiation after ~300 ms
of fast pacing was similar in the RA tissue models with and
without Ca2þ handling (Figs. 8 and 13), and was not affected
by the choice of the Ca2þ handling model. This can be ex-
plained by the fact that the AP dynamics during ~500 ms
of pacing, when the intracellular Ca2þ level has not substan-
tially increased, did not significantly vary between the
models (Figs. 11 B and 12 B). The small impact of Ca2þ
Biophysical Journal 96(3) 798–817
810 Aslanidi et al.
handling on electrical activity in the rabbit RA in comparison
to ventricular tissues (50–52) may be due to the relatively
short Ca2þ transient in the rabbit atrial cell (40,41).
Hence, our simulations demonstrate that while Ca2þ
dynamics may be important for sustaining reentry, it does
not play a significant role in the mechanism of reentry initi-
ation considered in this study, which is based primarily on
electrical heterogeneity and anisotropy within the RA, and
develops within ~300 ms of fast pacing (Figs. 8 and 13).
Experimental evidence shows that Ca2þ handling can be
important in triggering ectopic focal activity in the atrium,
primarily in the pulmonary vein region of the left atrium
(58), but mechanisms of such ectopic activity are beyond
the scope of this study.
Note also that the original model by Lindblad et al. (24)
does not consider Ca2þ-dependent inactivation of the
L-type Ca2þ current, ICa,L. In the absence of detailed quanti-
tative information on ICa,L inactivation in rabbit atrial cells,
we were also unable to include a description of this phenom-
enon in our models. However, we considered an alternative
version of our models with a description of Ca2þ-dependent
inactivation of ICa,L based on the model of Shannon et al.
(39) for a rabbit ventricular cell. Models with such a hybrid
description of ICa,L produced results similar to those illus-
trated in Fig. 13. Hence, Ca2þ-dependent inactivation of
ICa,L may have little impact on APs in rabbit atrial cells;
however, a more accurate description of this current will
be required (subject to available experimental data) to vali-
date such a conclusion.
Three-dimensional tissue model
This study presents three-dimensional tissue simulations of
electrical excitation in the RA of the rabbit heart. This is
the first model of the RA tissue incorporating detailed
anatomical structure, fiber orientation, and electrical hetero-
geneity of distinctive regions of the crista terminalis and
pectinate muscles. The presented three-dimensional model
for the RA tissue distinguishes itself from other simplified
(10,47) and detailed anatomical (59–61) models of atria in
the following aspects: 1), finer spatial resolution and, as
a result, more accurate anatomical structures; 2), inclusion
of fiber orientation; and 3), more physiologically relevant
cellular models and electrical heterogeneity. AP conduction
patterns simulated with the model are consistent with exper-
imental data. Primarily, the APD and activation time distri-
butions (Figs. 9 and 10) are comparable with respective
experimental measurements (see Fig. 6 in (22)) not only
qualitatively, but also quantitatively. Differences between
the simulations and experimental data (22) are observed
mainly close to the pacing site, which can be explained by
the fact that in experiments the AP was not paced, but
entered the RA from the adjacent SA node.
Hence, our detailed three-dimensional model provides
a potentially powerful tool for studying effects of the RA tissue
Biophysical Journal 96(3) 798–817
anatomy on electrical activation patterns during functional
impacts of physiological or pharmacological interventions.
Limitations
Limitations of cardiac cell and tissue models are well docu-
mented (2,24–26). In our single cell model development, we
modified the equations for INa, ICa,L, IK1, Ito and Isus in the
model of Lindblad et al. (24) based on available experi-
mental data (18,33,34). For other ion channels, as well as
Ca2þ handling, due to the lack of experimental data concern-
ing differences between the crista terminalis and pectinate
muscle cells, we used equations and parameters from the
original model of Lindblad et al. and assumed no difference
between these two cell types. Note that each of the two
single-cell models was used in the whole crista terminalis
and pectinate muscle regions, respectively, even for cells
that cannot be anatomically identified as belonging to the
respective bundles. Note also that the three-dimensional
anatomical tissue model is only a portion of the whole atria
of the rabbit. Other anatomical structures, such as the SA
node, Bachmann’s bundle, valves (e.g., tricuspid valve),
and orifices of blood vessels are not included in the current
model, but may play a role in initiation and maintenance
of atrial reentry and fibrillation.
Mechanisms of AF
AF is the most common cardiac arrhythmia. Although not
fatal in itself, AF may lead to more serious conditions such
as stroke, impaired cardiac output, and ventricular tachy-
cardia. The mechanisms underlying AF are not completely
understood, although functional reentry has been implicated
in its initiation and maintenance (4).
Several studies described transition from periodic AP prop-
agation into AF during rapid pacing of sheep atria (49,62). A
pacing rate threshold for this transition (a breakdown
frequency) was found to be ~6.5 Hz in the sheep RA (49).
AF generation was preceded by highly increased activation-
time delays in both the crista terminalis and pectinate muscles,
similar to our simulations (Fig. 9). Our simulations also
provide a possible mechanism for such a transition from
normal rhythm to AF—conduction block due to large intrinsic
APD gradients between the crista terminalis and pectinate
muscles, with their anisotropic bundle structure insuring
that the gradients are not diminished by electrotonic interac-
tions. Note that although the breakdown frequency for our
model is higher (~11.75 Hz), the difference can be explained
by proportionally shorter APD in rabbit: 77 ms in the rabbit
crista terminalis compared to ~150 ms in the sheep (62).
The relationship between the structure of the crista termi-
nalis and pectinate muscle bundles and conduction block
leading to reentry and AF in the RA has long been recog-
nized (11–13). Primarily, several intracardiac echocardiog-
raphy studies have suggested that atrial arrhythmias are
due to a functional conduction block within the crista
Biophysical Journal 96(3) 798–817
Mechanisms of Reentry in Atrial Tissue 811
terminalis (14–16). However, Spach et al. (6,17) showed that
functional repolarization inhomogeneities interact with
anisotropic discontinuous propagation to create a conduction
barrier in the canine RA. Primarily, APD differences
between the crista terminalis and the rest of RA were facili-
tated by slow conduction through the crista terminalis in the
transverse direction, i.e., due to the tissue anisotropy
(compare to Figs. 9 and 10). Note that enhancement of the
APD gradients has also been demonstrated experimentally
during conduction transverse to anisotropic bundles of
ventricular tissue (63), and theoretically during conduction
in a heterogeneous tissue divided by a simple geometric
obstacle (9).
Interactions between tissue anisotropy and repolarization
heterogeneity have also been used to explain mechanisms
of micro-reentry in closed loops formed by the complex
network of pectinate muscles (6). Our simulations quantify
contributions of heterogeneity and anisotropy to the mecha-
nisms of reentry initiation at high pacing rates, and demon-
strate the genesis of macroscopic reentry in the entire RA
tissue due to 1), the crista terminalis acting as a (functional
and anatomical) conductive barrier where intrinsic APD
gradients are not diminished by electrotonic interactions;
and 2), pectinate muscles forming an anisotropic network of
slow conductive pathways capable of sustaining circulation
in the RA. Exact areas of the crista terminalis susceptible to
conduction block can be localized by measuring the spatial
distribution of the APD gradients in the RA tissue.
It has also been suggested that an organized distribution of
AP morphology, with the longest APD near the SA node and
decreasing APD along the conduction pathway into the RA
(17,22), can provide a protective mechanism to ensure
synchronized atrial contractions by preventing reentrant
activity from entering the SA node. As shown in our simula-
tions, only every second cycle of the atrial reentry can activate
the crista terminalis (due to its longer APD and refractory
period), and hence the activation frequency in the crista termi-
nalis is half that in the rest of the RA. This result demonstrates
that, paradoxically, the crista terminalis can also act as
a conductive barrier protecting the adjacent SA node from
sustained high-frequency excitation (such as reentry or AF)
in the adjacent RA. Hence, the next step of our model devel-
opment will be to include the detailed anatomy (23) and
cellular electrophysiology (36) of the SA node tissue to study
the interaction of the pacemaker with atrial reentry.
APPENDIX 1: ELECTOPHYSIOLOGICAL MODELEQUATIONS
General equations
dV
dt¼ �Iion
Cm
:
Itot ¼ INa þ ICa;L þ ICa;T þ Ito þ Isus þ IK;r þ IK;s þ IK1
þ INaCa þ INaK þ INa;b þ ICa;b þ ICa;p:
Fast Naþ current
INa ¼ gNam3h�Naþ
�o
VF2
RT
eðV�ENaÞF=RT � 1
eVF=RT � 1:
dm
dt¼ mN � m
tm
:
mN ¼am
am þ bm
; tm ¼1:0
am þ bm
:
am ¼460:0ðV þ 44:4Þ
1� e�ðVþ 44:4Þ=12:673; bm ¼ 18400:0e�ðVþ 44:4Þ=12:673:
h ¼ 0:635h1 þ 0:365h2:
dh1
dt¼ h1N � h1
th1
;dh2
dt¼ h2N � h2
th2
:
h1N ¼ h2N ¼ah
ah þ bh
:
ah ¼ 44:9e�ðVþ 66:9Þ=5:57; bh ¼1491:0
1 þ 323:3e�ðVþ 94:6Þ=12:9:
th1¼ 0:03
1 þ eðVþ 40:0Þ=6:0þ 0:00015:
th2¼ 0:12
1 þ eðVþ 55:0Þ=2:0þ 0:00045:
L-type Ca2þ current
ICa;L ¼ gCa;L
�dLfL þ
1:0
1 þ e�ðV�23Þ=12:0
��V � ECa;L
�
ddL
dt¼ dLN � dL
tdL
:
dLN ¼1:0
1 þ e�ðVþ 10:95Þ=6:6; tdL
¼ 1:0
adLþ bdL
:
adL¼ 16:72ðV þ 45:0Þ
1� e�ðVþ 45:0Þ=2:5þ 50:0ðV þ 10Þ
1� e�ðVþ 10Þ=4:808;
bdL¼ 4:48ðV þ 5:0Þ
eðVþ 5:0Þ=2:5 � 1:
dfL
dt¼ fLN � fL
tfL
:
812 Aslanidi et al.
fLN ¼afL
afL þ bfL
; tfL ¼1:0
afL þ bfL
:
afL ¼8:49ðV þ 18:0ÞeðV þ 18:0Þ=4:0 � 1
; bfL ¼67:922
1 þ e�ðVþ 18:0Þ=4:0:
T-type Ca2þ current
ICa;T ¼ gCa;TdTfTðV � ECa;TÞ:
ddT
dt¼ dTN � dT
tdT
:
dTN ¼1:0
1 þ e�ðVþ 23:0Þ=6:1; tdT
¼ 1:0
adTþ bdT
:
adT¼ 674:173e�ðVþ 23:0Þ=30:0; bdT
¼ 674:173eðVþ 23:0Þ=30:0:
dfT
dt¼ fTN � fT
tfT
:
fTN ¼afT
afT þ bfT
; tfT ¼1:0
afT þ bfT
:
afT ¼ 9:637e�ðV þ 75:0Þ=83:33; bfT ¼ 9:637eðVþ 75:0Þ=15:38:
Transient outward Kþ current
Ito ¼ gtor�0:59s3
1 þ 0:41s32
��0:6s6
3 þ 0:4�ðV � EKÞ:
dr
dt¼ rN � r
tr
:
rN ¼1:0
1 þ e�ðVþ 15:0Þ=5:633; tr ¼
1:0
ar þ br
þ 0:0004:
ar ¼ 386:6eV=12:0; br ¼ 8:011e�V=7:2:
ds1
dt¼ s1N � s1
ts1
;ds2
dt¼ s2N � s2
ts2
:
s1N ¼ s2N ¼1:0
1 þ eðVþ 28:29Þ=7:06:
ts1¼ 0:189
1 þ eðVþ 32:8Þ=0:1þ 0:0204:
ts2¼ 0:189
1 þ eðVþ 32:8Þ=0:1þ 0:45e�ðV�13:54Þ=13:97:
ds3
dt¼ s3N � s3
ts3
:
Biophysical Journal 96(3) 798–817
s3N ¼�
1:0
1 þ eðVþ 50:67Þ=27:38þ 0:666
=1:666:
ts3¼ 7:5
1 þ eðV þ 23:0Þ=0:5þ 0:5:
Sustained outward current
Isus ¼ gsusðV � EsusÞ:
Fast delayed rectifier Kþ current
IK;r ¼ gK;rpapiðV � EKÞ:
dpa
dt¼ paN � pa
tpa
:
paN ¼1:0
1 þ e�ðVþ 5:1Þ=7:4; tpa
¼ 1:0
apa þ bpa
:
apa ¼ 9:0e�V=25:371; bpa¼ 1:3e�V=13:026:
dpi
dt¼ piN � pi
tpi
:
piN ¼api
apiþ bpi
; tpi¼ 1:0
apiþ bpi
:
api¼ 100:0e�V=54:645; bpi
¼ 656:0eV=106:157:
Slow delayed rectifier Kþ current
IK;s ¼ gK;snðV � EKÞ:
dn
dt¼ nN � n
tn
:
nN ¼1:0
1 þ e�ðVþ 0:9Þ=13:8; tn ¼
1:0
an þ bn
þ 0:060:
an ¼ 1:66eV=69:452; bn ¼ 0:3e�V=21:826:
Inward rectifier Kþ current
IK1 ¼ gK1
� �Kþ�
o
Km;K1 þ�Kþ�
o
�3V � EK
1 þ e1:393ðV�EK þ 3:6ÞF=RT:
Mechanisms of Reentry in Atrial Tissue 813
Naþ-Ca2þ exchanger current
Naþ-Kþ pump current
INaK ¼ INaK
� �Naþ
�1:5
K1:5 þ�Naþ
�1:5
�
�� �
Kþ�
o
Km;K þ�Kþ�
o
�1:6
1:5 þ e�ðVþ 60Þ=40:
Ca2þ pump current
ICa;p ¼ ICa;p
�Ca2þ �
i�Ca2þ �
iþ 0:0002
:
Background currents
INa;b ¼ gNa;bðV � ENaÞ; ICa;b ¼ gCa;bðV � ECaÞ:
Equilibrium potentials
ENa ¼RT
Fln
�Naþ
�o�
Naþ�
i
;EK ¼RT
Fln
�Kþ�
o�Kþ�
i
;
ECa ¼RT
2Fln
�Ca2þ �
o�Ca2þ �
i
:
APPENDIX 2: IONIC CONCENTRATIONEQUATIONS (MODEL 2)
Intracellular Naþ and Kþ concentrations
d½Naþ �i
dt¼ �INa þ INa;b þ 3INaK þ 3INaCa
VoliF:
d½Kþ �idt
¼ �Ito þ IK1 þ IK;r þ IK;s � 2INaK
VoliF:
Intracellular Ca2þ handling
d½Ca2þ �i
dt¼ �ICa;L þ ICa;T þ ICa;p þ ICa;b� 2INaCa þ Iup� Irel
VolCaF
� F½Ca2þ �i:
d½Ca2þ �up
dt¼ � Iup � Itr
2VolupF;
d½Ca2þ �rel
dt¼ � Itr � Irel
2VolrelF� 31:0
dOCalse
dt:
Itr ¼�
Ca2þ �up��Ca2þ �
rel
�2FVolrel
ttr
;
Irel ¼ arel
�F2
F2 þ 0:250
�2��Ca2þ �
rel��Ca2þ �
i
�:
dOCalse
dt¼ 480:0½Ca
2þ �relð1� OCalseÞ � 400:0OCalse:
kact ¼ 203:8
� �Ca2þ �
i�Ca2þ �
iþKM;rel
�4
þ 24:0eðV�VactÞ=12:5:
kinact ¼ 339:6
� �Ca2þ �
i�Ca2þ �
iþKM;rel
�4
þ 33:96:
_F1 ¼ krecovF3 � kactF1; _F2 ¼ kactF1 � kinactF2;
_F3 ¼ kinactF2 � krecovF3:
Intracellular Ca2þ buffering
F½Ca2þ �i¼ 0:080
dOTnCa
dtþ 0:160
dOTnMgCa
dtþ 0:045
dOC
dt:
dOC
dt¼ 200; 000:0½Ca
2þ �ið1� OCÞ � 476:0OC:
INaCa ¼ kNaCa
�Naþ
�3
i
�Ca2þ �
oegNaCaVF=RT �
�Naþ
�3
o
�Ca2þ �
ieðgNaCa�1ÞVF=RT
1 þ dNaCa
�Naþ
�3
i
�Ca2þ �
oþ�Naþ
�3
o
�Ca2þ �
i
� :
Iup ¼ Iup
�Ca2þ �
i=Kcy;Ca � K2
xcs
�Ca2þ �
up=Ksr;Ca�
Ca2þ �iþKcy;Ca
�=Kcy;Ca þ Kxcs
�Ca2þ �
upþKsr;Ca
�=Ksr;Ca
:
Biophysical Journal 96(3) 798–817
814 Aslanidi et al.
dOTnCa
dt¼ 78; 400:0½Ca
2þ �ið1� OTnCaÞ � 392:0OTnCa:
dOTnMgCa
dt¼ 200; 000:0½Ca
2þ �i�1� OTnMgCa � OTnMgMg
�� 6:6OTnMgCa:
dOTnMgMg
dt¼ 2; 000:0½Mg
2þ �i�1� OTnMgCa � OTnMgMg
�� 666:0OTnMgMg:
APPENDIX 3: IONIC CONCENTRATIONEQUATIONS (MODEL 3)
Intracellular Naþ concentration
d½Naþ �i
dt¼ 1:6386
½Naþ �SL � ½Na
þ �iVolcyt
:
d½Naþ �SL
dt¼ �INa þ INa;b þ 3INaK þ 3INaCa
VolSLF
� 1:6386½Na
þ �SL � ½Naþ �i
VolSL
� dNaSL;buf :
dNaSL;buf ¼ 0:1½Naþ �SL
�1:65� ½Na
þ �SL
�
� 1:0½Naþ �SL;
d½Naþ �SL;buf
dt
¼ dNaSL;buf :
Intracellular Ca2þ handling
d½Ca2þ �i
dt¼ �VolSR
Volcyt
Jpump;SR þJCa;SL-cyt
Volcyt
� dCacyt;bound:
d½Ca2þ �SL
dt¼ �ICa;T þ ICa;b þ ICa;p � 2INaCa
2VolSLF
þ JCa;jct-SL � JCa;SL-cyt
VolSL
� dCaSL;bound:
d½Ca2þ �jct
dt¼ � ICa;L
2VoljctFþ VolSL
Voljct
Jrel;SR þVolcyt
Voljct
Jleak;SR
� JCa;jct-SL
Voljct
� dCajct;bound:
d½Ca2þ �SR
dt¼ Jpump;SR �
�Jrel;SR þ
Volcyt
VolSR
Jleak;SR
�
� dCaCQSN:
Biophysical Journal 96(3) 798–817
JCa;jct-SL ¼ 0:8241½Ca
2þ �jct � ½Ca2þ �SL
�;
JCa;SL-cyt ¼ 3:7243�½Ca
2þ �SL � ½Ca2þ �i
�:
Jpump;SR ¼ Vmax
Volcyt
VolSR�½Ca
2þ �i=Km;f
�H��½Ca
2þ �SR=Km;r
�H
1:0 þ�½Ca
2þ �i=Km;f
�Hþ�½Ca
2þ �SR=Km;r
�H:
Jrel;SR ¼ ksO½Ca
2þ �SR � ½Ca2þ �jct
�;
Jleak;SR ¼ kleak;SR
½Ca
2þ �SR � ½Ca2þ �jct
�:
kCa-SR ¼ MaxSR �MaxSR �MinSR
1:0 þ�EC50-SR=½Ca
2þ �SR
�2:5;
ko;Ca-SR ¼ko;Ca
kCa-SR
; ki;Ca-SR ¼ ki;CakCa-SR:
dR
dt¼
ki;mRI � ki;Ca-SR½Ca2þ �jctR
�
�
ko;Ca-SR½Ca2þ �2jctR� ko;mO
�:
dO
dt¼
ko;Ca-SR½Ca2þ �2jctR� ko;mO
�
�
ki;Ca-SR½Ca2þ �jctO� ki;mI
�:
dI
dt¼
ki;Ca-SR½Ca2þ �jctO� ki;mI
�
�
ko;mI � ko;Ca-SR½Ca2þ �2jctRI
�:
dRI
dt¼
ko;mI � ko;Ca-SR½Ca2þ �2jctRI
�
�
ki;mRI � ki;Ca-SR½Ca2þ �jctR
�:
Intracellular Ca2þ buffering
dCacyt;bound ¼ dCaTRPN þ dCaTRPN;Ca-Mg þ dMgTRPN;Ca-Mg
þ dCaCMDN þ dCaMSN þ dCaSR-B:
dCajct;bound ¼ dCajct;SL-B þ dCajct;SL-H;
dCaSL;bound ¼ dCaSL;SL-B þ dCaSL;SL-H:
dCaTRPN ¼ 32; 700:0½Ca2þ �i
�0:07� ½Ca
2þ �TRPN
�� 19:6½Ca
2þ �TRPN:
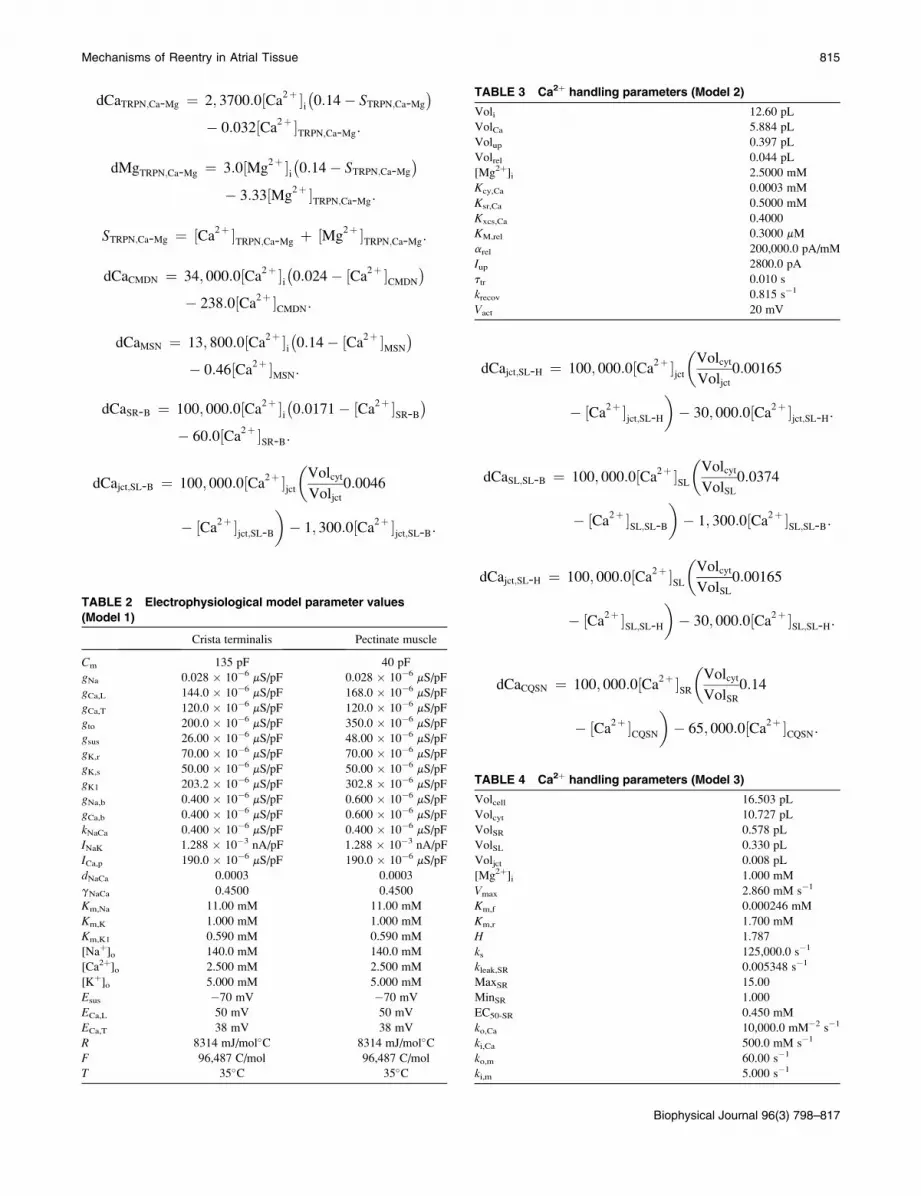
Mechanisms of Reentry in Atrial Tissue 815
dCaTRPN;Ca-Mg ¼ 2; 3700:0½Ca2þ �i
�0:14� STRPN;Ca-Mg
�� 0:032½Ca
2þ �TRPN;Ca-Mg:
dMgTRPN;Ca-Mg ¼ 3:0½Mg2þ �i
�0:14� STRPN;Ca-Mg
�� 3:33½Mg
2þ �TRPN;Ca-Mg:
STRPN;Ca-Mg ¼ ½Ca2þ �TRPN;Ca-Mg þ ½Mg
2þ �TRPN;Ca-Mg:
dCaCMDN ¼ 34; 000:0½Ca2þ �i
�0:024� ½Ca
2þ �CMDN
�� 238:0½Ca
2þ �CMDN:
dCaMSN ¼ 13; 800:0½Ca2þ �i
�0:14� ½Ca
2þ �MSN
�� 0:46½Ca
2þ �MSN:
dCaSR-B ¼ 100; 000:0½Ca2þ �i
�0:0171� ½Ca
2þ �SR-B
�� 60:0½Ca
2þ �SR-B:
dCajct;SL-B ¼ 100; 000:0½Ca2þ �jct
�Volcyt
Voljct
0:0046
� ½Ca2þ �jct;SL-B
�� 1; 300:0½Ca
2þ �jct;SL-B:
TABLE 2 Electrophysiological model parameter values
(Model 1)
Crista terminalis Pectinate muscle
Cm 135 pF 40 pF
gNa 0.028 � 10�6 mS/pF 0.028 � 10�6 mS/pF
gCa,L 144.0 � 10�6 mS/pF 168.0 � 10�6 mS/pF
gCa,T 120.0 � 10�6 mS/pF 120.0 � 10�6 mS/pF
gto 200.0 � 10�6 mS/pF 350.0 � 10�6 mS/pF
gsus 26.00 � 10�6 mS/pF 48.00 � 10�6 mS/pF
gK,r 70.00 � 10�6 mS/pF 70.00 � 10�6 mS/pF
gK,s 50.00 � 10�6 mS/pF 50.00 � 10�6 mS/pF
gK1 203.2 � 10�6 mS/pF 302.8 � 10�6 mS/pF
gNa,b 0.400 � 10�6 mS/pF 0.600 � 10�6 mS/pF
gCa,b 0.400 � 10�6 mS/pF 0.600 � 10�6 mS/pF
kNaCa 0.400 � 10�6 mS/pF 0.400 � 10�6 mS/pF
INaK 1.288 � 10�3 nA/pF 1.288 � 10�3 nA/pF
ICa,p 190.0 � 10�6 mS/pF 190.0 � 10�6 mS/pF
dNaCa 0.0003 0.0003
gNaCa 0.4500 0.4500
Km,Na 11.00 mM 11.00 mM
Km,K 1.000 mM 1.000 mM
Km,K1 0.590 mM 0.590 mM
[Naþ]o 140.0 mM 140.0 mM
[Ca2þ]o 2.500 mM 2.500 mM
[Kþ]o 5.000 mM 5.000 mM
Esus �70 mV �70 mV
ECa,L 50 mV 50 mV
ECa,T 38 mV 38 mV
R 8314 mJ/mol�C 8314 mJ/mol�CF 96,487 C/mol 96,487 C/mol
T 35�C 35�C
dCajct;SL-H ¼ 100; 000:0½Ca2þ �jct
�Volcyt
Voljct
0:00165
� ½Ca2þ �jct;SL-H
�� 30; 000:0½Ca
2þ �jct;SL-H:
dCaSL;SL-B ¼ 100; 000:0½Ca2þ �SL
�Volcyt
VolSL
0:0374
� ½Ca2þ �SL;SL-B
�� 1; 300:0½Ca
2þ �SL;SL-B:
dCajct;SL-H ¼ 100; 000:0½Ca2þ �SL
�Volcyt
VolSL
0:00165
� ½Ca2þ �SL;SL-H
�� 30; 000:0½Ca
2þ �SL;SL-H:
dCaCQSN ¼ 100; 000:0½Ca2þ �SR
�Volcyt
VolSR
0:14
� ½Ca2þ �CQSN
�� 65; 000:0½Ca
2þ �CQSN:
TABLE 3 Ca2þ handling parameters (Model 2)
Voli 12.60 pL
VolCa 5.884 pL
Volup 0.397 pL
Volrel 0.044 pL
[Mg2þ]i 2.5000 mM
Kcy,Ca 0.0003 mM
Ksr,Ca 0.5000 mM
Kxcs,Ca 0.4000
KM,rel 0.3000 mM
arel 200,000.0 pA/mM
Iup 2800.0 pA
ttr 0.010 s
krecov 0.815 s�1
Vact 20 mV
TABLE 4 Ca2þ handling parameters (Model 3)
Volcell 16.503 pL
Volcyt 10.727 pL
VolSR 0.578 pL
VolSL 0.330 pL
Voljct 0.008 pL
[Mg2þ]i 1.000 mM
Vmax 2.860 mM s�1
Km,f 0.000246 mM
Km,r 1.700 mM
H 1.787
ks 125,000.0 s�1
kleak,SR 0.005348 s�1
MaxSR 15.00
MinSR 1.000
EC50-SR 0.450 mM
ko,Ca 10,000.0 mM�2 s�1
ki,Ca 500.0 mM s�1
ko,m 60.00 s�1
ki,m 5.000 s�1
Biophysical Journal 96(3) 798–817
816 Aslanidi et al.
d½Ca2þ �X
dt¼ dCaX;
d½Mg2þ �TPRN;Ca-Mg
dt¼ dMgTPRN;Ca-Mg:
Parameter values for all models are listed in Tables 2–4.
This work was supported by a project grant (No. BBS/B/1678X) from the
Biotechnology and Biological Sciences Research Council of the United
Kingdom.
REFERENCES
1. Nattel, S., A. Shiroshita-Takeshita, B. J. Brundel, and L. Rivard. 2005.Mechanisms of atrial fibrillation: lessons from animal models. Prog.Cardiovasc. Dis. 48:9–28.
2. Zipes, D. P., and J. Jalife, editors. (2004). Cardiac Electrophysiology:From Cell to Bedside. Sanders, Philadelphia.
3. Gray, R. A., A. M. Pertsov, and J. Jalife. 1998. Spatial and temporalorganization during cardiac fibrillation. Nature. 392:75–78.
4. Jalife, J., O. Berenfeld, and M. Mansour. 2002. Mother rotors and fibril-latory conduction: a mechanism of atrial fibrillation. Cardiovasc. Res.54:204–216.
5. Allessie, M. A., F. I. Bonke, and F. T. G. Schopmann. 1976. Circusmovement in rabbit atrial muscle as a mechanism of tachycardia. II.The role of nonuniform recovery of excitability in the occurrence ofunidirectional block studied with multiple microelectrodes. Circ. Res.39:168–177.
6. Spach, M. S., P. C. Dolber, and J. F. Heidlage. 1989. Interaction of inho-mogeneities of repolarization with anisotropic propagation in dog atria:a mechanism for both preventing and initiating reentry. Circ. Res.65:1612–1631.
7. Qu, Z. L., K. Kil, F. G. Xie, A. Garfinkel, and J. N. Weiss. 2000.Scroll wave dynamics in a three-dimensional cardiac tissue model: ro-les of restitution, thickness, and fiber rotation. Biophys. J. 78:2761–2775.
8. Benson, A. P., O. V. Aslanidi, H. Zhang, and A. V. Holden. 2008. Thecanine virtual ventricles: a platform for dissecting pharmacologicaleffects on propagating and arrhythmogenesis. Prog. Biophys. Mol.Biol. 96:187–208.
9. Sampson, K. J., and C. S. Henriquez. 2002. Interplay of ionic and struc-tural heterogeneity on functional action potential duration gradients:implications for arrhythmogenesis. Chaos. 12:819–828.
10. Kuo, S. R., and N. A. Trayanova. 2006. Action potential morphologyheterogeneity in the atrium and its effect on atrial reentry: a two-dimen-sional and quasi-three-dimensional study. Philos. Trans. A. 364:1349–1366.
11. Spach, M. S., W. T. Miller, P. C. Dolber, M. Kootsey, J. R. Sommer,et al. 1982. The functional role of structural complexities in the propa-gation of depolarization in the atrium of the dog: cardiac conductiondisturbances due to discontinuities of effective axial resistivity. Circ.Res. 50:175–191.
12. Yamashita, T., H. Inoue, A. Nozaki, and T. Sugimoto. 1992. Role ofanatomical architecture in sustained atrial reentry and double potentials.Am. Heart J. 124:938–946.
13. Ho, S. Y., R. H. Anderson, and D. Sanchez-Quintana. 2002. Atrialstructure and fibers: morphologic bases of atrial conduction. Cardio-vasc. Res. 54:325–336.
14. Kalman, J. M., J. E. Olgin, M. R. Karch, M. Hamdan, R. J. Lee, et al.1998. ‘‘Cristal tachycardias’’: origin of right atrial tachycardias from thecrista terminalis identified by intracardiac echocardiography. J. Am.Coll. Cardiol. 31:451–459.
15. Schumacher, B., W. Jung, H. Schmidt, C. Fischenbeck, T. Lewalter,et al. 1999. Transverse conduction capabilities of the crista terminalisin patients with atrial flutter and atrial fibrillation. J. Am. Coll. Cardiol.34:363–373.
Biophysical Journal 96(3) 798–817
16. Yamabe, H., I. Misumi, H. Fukushima, K. Ueno, Y. Kimura, et al. 2002.
Conduction properties of the crista terminalis and its influence on theright atrial activation sequence in patients with typical atrial flutter.
Pacing Clin. Electrophysiol. 25:132–141.
17. Spach, M. S., P. C. Dolber, and P. A. W. Anderson. 1989. Multipleregional differences in cellular properties that regulate repolarization
and contraction in the right atrium of adult and newborn dogs. Circ.Res. 65:1594–1611.
18. Yamashita, T., T. Nakajima, H. Hazama, E. Hamada, Y. Murakawa,
et al. 1995. Regional differences in transient outward current density
and inhomogeneities of repolarization in rabbit right atrium. Circula-tion. 92:3061–3069.
19. Qi, A., J. A. Yueng-Lai-Wah, J. Xiao, and C. R. Kerr. 1994. Regional
differences in rabbit atrial repolarization: importance of transientoutward current. Am. J. Physiol. 266:H643–H649.
20. Feng, J., L. Yue, Z. Wang, and S. Nattel. 1998. Ionic mechanisms of
regional action potential heterogeneity in the canine right atrium.Circ. Res. 83:541–551.
21. Ramirez, R., S. Nattel, and M. Courtemanche. 2000. Mathematical anal-
ysis of canine atrial action potentials: rate, regional factors, and electri-
cal remodeling. Am. J. Physiol. 279:H1767–H1785.
22. Boyett, M. R., H. Honjo, M. Yamamoto, M. R. Nikmaram, R. Niwa,
et al. 1999. Downward gradient in action potential duration along
conduction path in and around the sinoatrial node. Am. J. Physiol.276:H686–H698.
23. Dobrzynski, H., J. Li, J. Tellez, I. D. Greener, V. P. Nikolski, et al.
2005. Computer three-dimensional reconstruction of the sinoatrialnode. Circulation. 111:846–854.
24. Lindblad, D. S., C. R. Murphey, J. W. Clark, and W. R. Giles. 1996.
A model of the action potential and underlying membrane currentsin a rabbit atrial cell. Am. J. Physiol. 271:H1666–H1696.
25. Panfilov, A. V., and J. P. Keener. 1995. Re-entry in three-dimensional
Fitzhugh-Nagumo medium with rotational anisotropy. Physica D.84:545–552.
26. Noble, D., and Y. Rudy. 2001. Models of cardiac ventricular action
potentials: iterative interaction between experiment and simulation.
Philos. Trans. A. 359:1127–1142.
27. Giles, W. R., and Y. Imaizumi. 1988. Comparison of potassium currentsin rabbit atrial and ventricular cells. J. Physiol. 405:123–145.
28. Habuchi, Y., X. Han, and W. R. Giles. 1995. Comparison of the
hyperpolarization-activated and delayed rectifier currents in rabbitatrioventricular and sinoatrial node. Heart Vessels. 9 (Suppl ):203–
206.
29. Hagiwara, N., H. Irisawa, and M. Kameyama. 1988. Contribution oftwo types of calcium currents to the pacemaker potentials of rabbit
SA node cells. J. Physiol. 395:233–253.
30. Muraki, K., Y. Imaizumi, M. Watanabe, Y. Habuchi, and W. R. Giles.1995. Delayed rectifier Kþ current in rabbit atrial myocytes. Am. J.Physiol. 269:H524–H532.
31. Fedida, D., and W. R. Giles. 1991. Regional variations in action poten-tials and transient outward current in myocytes isolated from rabbit left
ventricle. J. Physiol. 442:191–209.
32. Kawano, S., and M. Hiraoka. 1991. Transient outward currents and
action potential alterations in rabbit ventricular myocytes. J. Mol.Cell. Cardiol. 23:681–693.
33. Ko, J. H., W. S. Park, and Y. E. Earm. 2005. The protein kinase inhib-
itor, staurosporine, inhibits L-type Ca2þ current in rabbit atrial myo-cytes. Biochem. Biophys. Res. Commun. 329:531–537.
34. Ko, J. H., W. S. Park, S. J. Kim, and Y. E. Earm. 2006. Slowing the
inactivation of voltage-dependent sodium channels by staurosporine,the protein kinase C inhibitor, in rabbit atrial myocytes. Eur. J. Pharma-col. 534:48–54.
35. Honjo, H., M. R. Boyett, I. Kodama, and J. Toyama. 1996. Correlationbetween electrical activity and the size of rabbit sino-atrial node cells.
J. Physiol. 496:795–808.
Mechanisms of Reentry in Atrial Tissue 817
36. Zhang, H., A. V. Holden, I. Kodama, H. Honjo, M. Lei, et al. 2000.Mathematical models of action potentials in the periphery and centerof the rabbit sinoatrial node. Am. J. Physiol. 279:H397–H421.
37. Fedida, D., Y. Shimoni, and W. R. Giles. 1990. Alpha-adrenergicmodulation of the transient outward current in rabbit atrial myocytes.J. Physiol. 423:257–277.
38. Griffiths, H., and K. T. MacLeod. 2003. The voltage-sensitive releasemechanism of excitation contraction coupling in rabbit cardiac muscleis explained by calcium-induced calcium release. J. Gen. Physiol.121:353–373.
39. Shannon, T. R., F. Wang, J. Puglisi, C. Weber, and D. M. Bers. 2004. Amathematical treatment of integrated Ca dynamics within the ventricularmyocyte. Biophys. J. 87:3351–3371.
40. Endoh, M. 1999. Muscarinic regulation of Ca2þ signaling in mamma-lian atrial and ventricular myocardium. Eur. J. Pharmacol. 375:177–196.
41. Hilgemann, D. W., and D. Noble. 1987. Excitation-contraction couplingand extracellular calcium transients in rabbit atrium: reconstruction ofbasic cellular mechanisms. Proc. R. Soc. Lond. B. Biol. Sci. 230:163–205.
42. Blatter, L. A., J. Kockskamper, K. A. Sheehan, A. V. Zima, J. Huser,et al. 2003. Local calcium gradients during excitation-contractioncoupling and alternans in atrial myocytes. J. Physiol. 546:19–31.
43. Woo, S. -H., L. Cleeman, and M. Morad. 2002. Ca2þ current-gatedfocal and local Ca2þ release in rat atrial myocytes: evidence from rapid2-D confocal imaging. J. Physiol. 543:439–453.
44. Yamamoto, M., H. Honjo, R. Niwa, and I. Kodama. 1998. Low-frequency extracellular potentials recorded from the sinoatrial node.Cardiovasc. Res. 39:360–372.
45. Litchenberg, W. H., L. W. Norman, A. K. Holwell, K. L. Martin,K. W. Hewett, et al. 2000. The rate and anisotropy of impulse propa-gation in the postnatal terminal crest are correlated with remodeling ofCx43 gap junction pattern. Cardiovasc. Res. 45:379–387.
46. de Groot, J. R., T. Veenstra, A. O. Verkerk, R. Wilders, J. P. Smits, et al.2003. Conduction slowing by the gap junctional uncoupler carbenoxo-lone. Cardiovasc. Res. 60:288–297.
47. Pandit, S. V., O. Berenfeld, J. M. B. Anumonwo, R. M. Zaritski,J. Kneller, et al. 2005. Ionic determinants of functional reentry in a2-D model of human atrial cells during simulated chronic atrial fibrilla-tion. Biophys. J. 88:3806–3821.
48. Simitev, R. D., and V. N. Biktashev. 2006. Conditions for propagationand block of excitation in an asymptotic model of atrial tissue. Biophys.J. 90:2258–2269.
49. Berenfeld, O., A. V. Zaitsev, S. F. Mironov, A. M. Pertsov, and J. Jalife.2002. Frequency-dependent breakdown of wave propagation into fibril-latory conduction across the pectinate muscle network in the isolatedsheep right atrium. Circ. Res. 90:1173–1180.
50. Lakatta, E. G., and T. Guarnieri. 1993. Spontaneous myocardial calciumoscillations: are they linked to ventricular fibrillation? J. Cardiovasc.Electrophysiol. 4:473–489.
51. Chudin, E., J. Goldhaber, A. Garfinkel, J. Weiss, and B. Kogan. 1999.Intracellular Ca2þ dynamics and the stability of ventricular tachycardia.Biophys. J. 77:2930–2941.
52. Bondarenko, V. E., and R. L. Rasmusson. 2007. Simulations of propa-gated mouse ventricular action potentials: effects of molecular heteroge-neity. Am. J. Physiol. 293:H1816–H1832.
53. Aslanidi, O. V., R. N. Sleiman, H. Williamson, M. R. Boyett, and H.Zhang. 2007. Modeling conduction through the Purkinje-ventricularjunction and the short-QT syndrome associated with HERG mutationin the rabbit ventricles. IEEE Comp. Cardiol. 34:241–244.
54. Boyett, M. R., J. Li, S. Inada, H. Dobrzynski, J. E. Schneider, et al.2005. Imaging the heart: computer three-dimensional anatomic modelsof the heart. J. Electrocardiol. 38:113–120.
55. Winslow, R. L., A. Varghese, D. Noble, C. Adlakha, and A. Hoythya.1993. Generation and propagation of ectopic beats induced by spatiallylocalized Na-K pump inhibition in atrial network models. Proc. R. Soc.Lond. B. Biol. Sci. 254:55–61.
56. Duan, D. Y., B. Fermini, and S. Nattel. 1992. Sustained outward currentobserved after Ito1 inactivation in rabbit atrial myocytes is a novel Cl�
current. Am. J. Physiol. 263:H1967–H1971.
57. Goldhaber, J. I., L. H. Xie, T. Duong, C. Motter, K. Khuu, et al. 2005.Action potential duration restitution and alternans in rabbit ventricularmyocytes: the key role of intracellular calcium cycling. Circ. Res.96:459–466.
58. Chou, C. C., B. L. Nguyen, A. Y. Tan, P. C. Chang, H. L. Lee, et al.2008. Intracellular calcium dynamics and acetylcholine-induced trig-gered activity in the pulmonary veins of dogs with pacing-induced heartfailure. Heart Rhythm. 5:1170–1177.
59. Harrild, D., and C. Henriquez. 2000. A computer model of normalconduction in the human atria. Circ. Res. 87:E25–E36.
60. Seemann, G., C. Hoper, F. B. Sachse, O. Dossel, A. V. Holden, et al.2006. Heterogeneous three-dimensional anatomical and electrophysio-logical model of human atria. Philos. Trans. A. 364:1465–1481.
61. Virag, N., O. Blanc, and L. Kappenberger, editors. (2001). ComputerSimulation and Experimental Assessment of Cardiac Electrophysi-ology. Futura Publishing, New York.
62. Gray, R. A., A. M. Pertsov, and J. Jalife. 1996. Incomplete reentry andepicardial breakthrough patterns during atrial fibrillation in the sheepheart. Circulation. 94:2649–2661.
63. Osaka, T., I. Kodama, N. Tsuboi, J. Toyama, and K. Yamada. 1987.Effects of activation sequence and anisotropic cellular geometry onthe repolarization phase of action potential of dog ventricular muscles.Circulation. 76:226–236.
Biophysical Journal 96(3) 798–817