Mechanisms of calcium sequestration during facilitation at active zones of an amphibian...
12
Journal of Theoretical Biology 247 (2007) 230–241 Mechanisms of calcium sequestration during facilitation at active zones of an amphibian neuromuscular junction M.R. Bennett a, , L. Farnell b , W.G. Gibson b , P. Dickens a a The Neurobiology Laboratory, Department of Physiology, The Institute for Biomedical Research, University of Sydney, New South Wales 2006, Australia b The School of Mathematics and Statistics, University of Sydney, New South Wales 2006, Australia Received 11 May 2006; received in revised form 16 March 2007; accepted 18 March 2007 Available online 24 March 2007 Abstract The calcium transients ðD½Ca 2þ i Þ at active zones of amphibian (Bufo marinus) motor-nerve terminals that accompany impulses, visualized using a low-affinity calcium indicator injected into the terminal, are described and the pathways of subsequent sequestration of the residual calcium determined, allowing development of a quantitative model of the sequestering processes. Blocking the endoplasmic reticulum calcium pump with thapsigargin did not affect D½Ca 2þ i for a single impulse but increased its amplitude during short trains. Blocking the uptake of calcium by mitochondria with CCCP had little effect on D½Ca 2þ i of a single impulse but greatly increased its amplitude during short trains. This present compartmental model is compatible with our previous Monte Carlo diffusion model of Ca 2þ sequestration during facilitation [Bennett, M.R., Farnell, L., Gibson, W.G., 2004. The facilitated probability of quantal secretion within an array of calcium channels of an active zone at the amphibian neuromuscular junction. Biophys. J. 86(5), 2674–2690], with the single plasmalemma pump in that model now replaced by separate pumps for the plasmalemma and endoplasmic reticulum, as well as the introduction of a mitochondrial uniporter. r 2007 Published by Elsevier Ltd. Keywords: Calcium; Facilitation; Low-affinity calcium indicator; Sequestration; Mitochondria; Endoplasmic reticulum 1. Introduction The different phases of increased efficacy of transmitter release at synapses were first clearly delineated at the amphibian (frog) neuromuscular junction by Magleby and Zengel (1975, 1976). They consist of four components: the first (F1) and second (F2) components of facilitation which decay with time constants of 60 and 400 ms, respec- tively, augmentation, which decays with a time constant of about 7 s; and potentiation, which decays with a time constant that ranges from tens of seconds to minutes (Zengel and Magleby, 1982). The residual Ca 2þ hypothesis for the increased efficacy of transmitter release (Katz and Miledi, 1968) suggests that the temporal aspects of cytosolic Ca 2þ sequestration after nerve-terminal impulses should likewise follow these four different phases. At- tempts to determine this possibility rely mostly on exposing the junction to different methyl ester forms of either the fast calcium buffer BAPTA or the relatively slower acting buffer EGTA. BAPTA does not affect the size of the endplate potential at the amphibian neuromuscular junc- tion (Tanabe and Kijima, 1992). This suggests that exocytosis is triggered by Ca 2þ entry at the vesicle docking sites in the microdomains rather than by the net calcium in the submembraneous zone within 30 nm from the pre- synaptic membrane, arising from calcium entry that would be chelated by BAPTA (Bennett et al., 2000a). However, BAPTA does remove the F1 phase of facilitation (com- pletely, according to Tanabe and Kijima, 1992; by 60% according to Suzuki et al., 2000), suggesting that the decline of Ca 2þ in the submembraneous zone, due to this ion diffusing into the rest of the terminal and being removed by the mitochondrial uniporter and to a lesser extent by the endoplasmic reticulum calcium pump, provides the residual Ca 2þ that drives the F1 phase of facilitation. Presumably, the buffer is primarily responsible for removing Ca 2þ from the submembraneous region, and ARTICLE IN PRESS www.elsevier.com/locate/yjtbi 0022-5193/$ - see front matter r 2007 Published by Elsevier Ltd. doi:10.1016/j.jtbi.2007.03.022 Corresponding author. Tel.: +61 2 9351 2034; fax: +61 2 9351 3910. E-mail address: [email protected] (M.R. Bennett).
Transcript of Mechanisms of calcium sequestration during facilitation at active zones of an amphibian...
ARTICLE IN PRESS
0022-5193/$ - se
doi:10.1016/j.jtb
�CorrespondE-mail addr
Journal of Theoretical Biology 247 (2007) 230–241
www.elsevier.com/locate/yjtbi
Mechanisms of calcium sequestration during facilitation at active zonesof an amphibian neuromuscular junction
M.R. Bennetta,�, L. Farnellb, W.G. Gibsonb, P. Dickensa
aThe Neurobiology Laboratory, Department of Physiology, The Institute for Biomedical Research, University of Sydney, New South Wales 2006, AustraliabThe School of Mathematics and Statistics, University of Sydney, New South Wales 2006, Australia
Received 11 May 2006; received in revised form 16 March 2007; accepted 18 March 2007
Available online 24 March 2007
Abstract
The calcium transients ðD½Ca2þ�iÞ at active zones of amphibian (Bufo marinus) motor-nerve terminals that accompany impulses,
visualized using a low-affinity calcium indicator injected into the terminal, are described and the pathways of subsequent sequestration of
the residual calcium determined, allowing development of a quantitative model of the sequestering processes. Blocking the endoplasmic
reticulum calcium pump with thapsigargin did not affect D½Ca2þ�i for a single impulse but increased its amplitude during short trains.
Blocking the uptake of calcium by mitochondria with CCCP had little effect on D½Ca2þ�i of a single impulse but greatly increased its
amplitude during short trains. This present compartmental model is compatible with our previous Monte Carlo diffusion model of Ca2þ
sequestration during facilitation [Bennett, M.R., Farnell, L., Gibson, W.G., 2004. The facilitated probability of quantal secretion within
an array of calcium channels of an active zone at the amphibian neuromuscular junction. Biophys. J. 86(5), 2674–2690], with the single
plasmalemma pump in that model now replaced by separate pumps for the plasmalemma and endoplasmic reticulum, as well as the
introduction of a mitochondrial uniporter.
r 2007 Published by Elsevier Ltd.
Keywords: Calcium; Facilitation; Low-affinity calcium indicator; Sequestration; Mitochondria; Endoplasmic reticulum
1. Introduction
The different phases of increased efficacy of transmitterrelease at synapses were first clearly delineated at theamphibian (frog) neuromuscular junction by Magleby andZengel (1975, 1976). They consist of four components: thefirst (F1) and second (F2) components of facilitation whichdecay with time constants of �60 and �400ms, respec-tively, augmentation, which decays with a time constant ofabout 7 s; and potentiation, which decays with a timeconstant that ranges from tens of seconds to minutes(Zengel and Magleby, 1982). The residual Ca2þ hypothesisfor the increased efficacy of transmitter release (Katz andMiledi, 1968) suggests that the temporal aspects ofcytosolic Ca2þ sequestration after nerve-terminal impulsesshould likewise follow these four different phases. At-tempts to determine this possibility rely mostly on exposing
e front matter r 2007 Published by Elsevier Ltd.
i.2007.03.022
ing author. Tel.: +612 9351 2034; fax: +61 2 9351 3910.
ess: [email protected] (M.R. Bennett).
the junction to different methyl ester forms of either thefast calcium buffer BAPTA or the relatively slower actingbuffer EGTA. BAPTA does not affect the size of theendplate potential at the amphibian neuromuscular junc-tion (Tanabe and Kijima, 1992). This suggests thatexocytosis is triggered by Ca2þ entry at the vesicle dockingsites in the microdomains rather than by the net calcium inthe submembraneous zone within 30 nm from the pre-synaptic membrane, arising from calcium entry that wouldbe chelated by BAPTA (Bennett et al., 2000a). However,BAPTA does remove the F1 phase of facilitation (com-pletely, according to Tanabe and Kijima, 1992; by 60%according to Suzuki et al., 2000), suggesting that thedecline of Ca2þ in the submembraneous zone, due to thision diffusing into the rest of the terminal and beingremoved by the mitochondrial uniporter and to a lesserextent by the endoplasmic reticulum calcium pump,provides the residual Ca2þ that drives the F1 phase offacilitation. Presumably, the buffer is primarily responsiblefor removing Ca2þ from the submembraneous region, and

ARTICLE IN PRESS
Fig. 1. Calcium concentration in a motor-nerve terminal branch following
a single impulse. Images of Oregon-Green 488 BAPTA-5N (OG-5N)
fluorescence in a section of a terminal branch as shown in both frame scan
(a) and line scan (b) modes. (a) Shows the fluorescence along this portion
of the terminal branch, with the transverse scan line position indicated by
the line ending in arrow heads. (b) Shows the average fluorescence change
over scans plotted against time. The vertical line indicates the moment of
stimulation.
M.R. Bennett et al. / Journal of Theoretical Biology 247 (2007) 230–241 231
that as it releases this, the mitochondria/endoplasmicreticulum come into play.
Clearly, the Ca2þ that collects in the submembraneouszone does not act effectively on the exocytotic protein fortimes greater than about 10ms (Bennett et al., 2000b), sincethis protein has too low an affinity to be affected at longertimes by those relatively low concentrations of Ca2þ (Kd ofabout 10225mM)—see Schneggenburger and Neher (2000)as well as Bollmann et al. (2000). This necessitates theaction of separate facilitation molecules with relatively highaffinities (Zucker, 1999) that act in synergy with theexocytosis molecule. Such a modified residual Ca2þ
hypothesis states that the Ca2þ still present some tens ofmilliseconds after an impulse acts on different moleculesthan the exocytotic molecule to facilitate release by thelatter (Tang et al., 2000). Such a model has recently beenshown to give a quantitative account of F1 and F2facilitation (Bennett et al., 2004). In the present work, wehave further developed this model of Ca2þ sequestrationand applied it to experimental observations on the Ca2þ
transients observed in toad motor-nerve terminals duringdifferent protocols of stimulation and following interrup-tion of different Ca2þ sequestering pathways.
2. Methods
2.1. Experimental methods
2.1.1. Preparation and solutions
Experiments were performed on the lumbricalis digiti Vmuscle (Ecker, 1889) of the cane toad Bufo marinus. Thetoads were collected from their natural environment innortheastern Australia and experimented on within 6weeks of collection. Animals were between 40 and 70mmin length and killed by double-pithing. Muscles weredissected from the hind limb with up to 1 cm of nerveattached and pinned on a silicone elastomer (SYLGARD;Dow Corning, Midland, MI) bed in an organ bath.Ringer’s solution containing (in mM): NaCl 111.2, KCl2.5, NaH2PO4 1.5, NaHCO3 16.3, glucose 7.8, MgCl2 1.2,and CaCl2 1.8mM, bubbled with a gas mixture of 95% O2
and 5% CO2, constantly perfused the organ bath at a rateof 3ml/min. The motor nerve was stimulated by applyingbrief (0.08ms) suprathreshold depolarizing pulses througha suction electrode. To prevent muscle contractionduring motor nerve impalements or electrical stimulation,d-tubocurarine chloride (o10mg l�1; Sigma, St. Louis,MO) was added to the bath. The temperature wasmaintained at �18 �C.
2.1.2. Calcium imaging of nerve terminals
Motor nerves were filled with the calcium-sensitive dyeOregon Green 488 BAPTA-5N (OG-5N) by ionophoreticinjection as described previously (Macleod et al., 2001).Briefly, the tapered portion of a microelectrode was filledwith a 3mM solution of the dye in 130–150mM KCl andthe barrel of the microelectrode was filled with 150mM
KCl. The final electrode resistance was between 200 and350MO. The microelectrodes were used to impale motornerves within 100 mm of the last node of Ranvier of theterminal to be examined, and current ðo0:6 nAÞ wasapplied for periods of o15min. The resting membranepotential of the axon was required to be stable and morepolarized than �60mV at the end of the injection. OG-5Nfluorescence was imaged using a Leica TCS 4D confocalmicroscope (Wetzlar, Germany) with a 40� water-dippingobjective (0.80 numerical aperture; Leica). The dye wasexcited with the 488 nm line from an argon–krypton laserand emitted fluorescence was filtered with a 515 nm long-pass filter. The line scan mode of the confocal microscopewas used to record Ca2þ responses to motor nervestimulation. The temporal resolution of the line scan wasbetween 0.5 and 2ms (depending on the particular confocalsettings). A light emitting diode connected to the stimu-lator and positioned near the microscope condenserreported the exact timing of a stimulus as a bright line onthe scan. For recording of single pulses, up to 120 scanswere collected and the motor nerve was stimulated duringeach scan (Fig. 1b). The interval between each pulse was2 s. Single pulse frames were collected in groups of 30 andthe preparation was rested for 45min and refocussedbetween each group. A bleach control group of 30 scanswas collected without stimulation for each experiment. Inexperiments involving trains of pulses up to five consecu-tive frames were used to record the transient. The secondand third linescan frames were timed to coincide,respectively, with the first and last pulses in a train. Inthis way, the first few pulses of a train and the fluorescence
ARTICLE IN PRESSM.R. Bennett et al. / Journal of Theoretical Biology 247 (2007) 230–241232
decay after stimulation were recorded with high temporalresolution, and the excitation shutter was closed for mostof the stimulus train, thereby minimizing bleachingand phototoxicity. Up to 20 individual recordings (sepa-rated by at least 2min) were taken, along with four or fivebleach controls. Although the low affinity of OG-5N issuch as to introduce noise into the recordings, this waspreferred to the distortions introduced into the changesin Ca2þ using low-noise high-affinity calcium indicators(see Section 4).
2.1.3. Data analysis
Linescan data were analysed using NIH Image software.Pixel intensity was summed along a line encompassing theterminal fluorescence for each line in a scan. The averagebackground value was determined from a region of thescan containing no terminal. The appropriate backgroundvalue was then subtracted from the measured terminalfluorescence. Each scan was corrected for bleach asdetermined by the control scans, and normalized to theirprestimulation level of fluorescence. Scans were thenaveraged and are presented as DF=F , where F is theprestimulation level of fluorescence and DF is the change inthe level of fluorescence.
The conversion from fluorescence ratio DF=F to calciumtransient D½Ca2þ�i can be found starting from the standardrelation (Grynkiewicz et al., 1985):
½Ca2þ�i ¼ Kd
Fi � Fmin
Fmax � F i
, (1)
where Fi, Fmin and Fmax are the measured fluorescence atCa2þ concentrations ½Ca2þ�i, zero, and saturation, respec-tively, and Kd is the dissociation constant for indicatorbinding. It follows by straightforward manipulation that(David et al., 1997)
½Ca2þ�i ¼ Kd
ðDF=F restÞ þ 1� ð1=bÞðFmax=F restÞ � ðDF=FrestÞ � 1
, (2)
where
b �Frest
Fmin¼
Kd þ ðFmax=FminÞ½Ca2þ�rest
Kd þ ½Ca2þ�rest
. (3)
DF=Frest (� DF=F ) is the measured fluorescence and theequilibrium ½Ca2þ�i, ½Ca
2þ�rest is related to Frest by
½Ca2þ�rest ¼ Kd
1� ð1=bÞðFmax=FrestÞ � 1
. (4)
The change in ½Ca2þ�i, D½Ca2þ�i ¼ ½Ca2þ�i � ½Ca
2þ�rest is
then found to be
D½Ca2þ�i
¼ Kd
ðDF=F restÞ½ðFmax=F restÞ � ð1=bÞ�½ðFmax=FrestÞ � ðDF=FrestÞ � 1�½ðFmax=F restÞ � 1�
.
ð5Þ
Provided DF5Fmax, which is certainly the case for theresults reported here, this can be approximated by
D½Ca2þ�i ¼ aDF
Frest
� �, (6)
where a is a constant given by
a ¼ Kd
ðFmax=FrestÞ � ð1=bÞ
½ðFmax=FrestÞ � 1�2, (7)
showing that D½Ca2þ�i is directly proportional to thefluorescence change.David et al. (1997) give the Kd range as 30270mM and
the Fmax=Fmin range as 30–70, leading to an a in the range0:5422:52mM. The value a ¼ 2mM has been used for theconversions in the present work.D½Ca2þ�i transients were fitted with exponential curves
using the Igor Pro software least-squares curve fittingfunction. The Ca2þ decay following a single stimulus wasfitted with an equation of the form
D½Ca2þ�i ¼ C expð�t=tÞ, (8)
where C and t are constants and the decay following shorttrains of pulses was fitted with the equation
D½Ca2þ�i ¼ C1 expð�t=t1Þ þ C2 expð�t=t2Þ þ C3, (9)
where Ci and ti, i ¼ 1; 2; 3, are constants.
2.1.4. Reagents
The hexapotassium salt form of OG-5N was purchasedfrom Molecular Probes (Eugene, OR). Sodium orthovana-date, CCCP (carbonyl cyanide m-chlorophenylhydrozone)and thapsigargin were purchased from Sigma. Thapsigar-gin and CCCP were both bath applied from 1mM stocksolutions in DMSO and EtOH, respectively.
2.2. Mathematical model
The terminal is modelled as 4 volumetric compartments,representing the external medium, the cytosol, the endo-plasmic reticulum and the mitochondria (Fig. 2). The freecalcium concentration in each of these compartments is,respectively, x0 ¼ ½Ca
2þ�ext, x1 ¼ ½Ca
2þ�cyt, x2 ¼ ½Ca
2þ�mito
and x3 ¼ ½Ca2þ�retic. The various Ca2þ fluxes occurring
between these compartments are shown in Fig. 2; inaddition, there are Ca2þ buffers in the cytosol and in theendoplasmic reticulum. On the time scale considered here,diffusion can be neglected and each compartment is treatedas being spatially homogeneous. Previous modelling ofsimilar systems includes Sala and Hernandez-Cruz (1990),Kargacin and Fay (1991), Nowycky and Pinter (1993), Frieland Tsien (1994), Friel (1995), Gunter and Gunter (1994)and David (1999).The rate of change of free Ca2þ in the cytosol can be
written as a sum of contributions from the Ca2þ fluxes in

ARTICLE IN PRESS
Fig. 2. Schematic diagram of the terminal showing the four compart-
ments: external medium, cytosol, endoplasmic reticulum and mitochon-
dria. The various Ca2þ fluxes between these compartments are represented
by arrows. The cytosol and the endoplasmic reticulum each contain
endogenous buffers, B1 and B2, respectively.
M.R. Bennett et al. / Journal of Theoretical Biology 247 (2007) 230–241 233
and out of each compartment, plus a buffering term:
dx1
dt¼
dx1
dt
� �plasmalemma
þdx1
dt
� �mitochondria
þdx1
dt
� �reticulum
þdx1
dt
� �buffer
. ð10Þ
The plasmalemma contribution is
dx1
dt
� �plasmalemma
¼ Fpðx1Þ � �A1x1
K1 þ x1
þ A2ðx0 � x1Þ þ A3HðtÞ, ð11Þ
where the first term is due to the outward pump and thesecond to the inward leak (Kargacin and Fay, 1991); thethird is the contribution from the Ca2þ influx due tostimulation of the cell, HðtÞ being equal to 1 duringCa2þ influx and zero otherwise. The mitochondrialcontribution is
dx1
dt
� �mitochondria
¼ Fmðx1;x2Þ � �A4 x2
1
K24 þ x2
1
þA5 x2
K5 þ x2,
(12)
where the first term is due to the uniporter taking Ca2þ intothe mitochondria and the second term to the Na/Caexchanger taking Ca2þ out (Gunter and Gunter, 1994). Thereticulum contribution is
dx1
dt
� �reticulum
¼ F rðx1; x3Þ � �A6 x2
1
K26 þ x2
1
þ A7ðx3 � x1Þ,
(13)
where the first term is due to the pump into the reticulumand the second to the outward leak (Kargacin and Fay,1991).
There are two buffers in the model: B1 in the cytosol andB2 in the reticulum. They each obey first-order kinetics:
Bi þ Ca$kþi
k�i
CaBi; i ¼ 1; 2, (14)
where k�i are forward and reverse rate constants. Defining
Fb;iðwi;xjÞ � k�i wi � kþi ð½BTi � � wiÞxj, (15)
where wi is the ½CaBi� and ½BTi � is the total concentration of
buffer Bi, the contribution of B1 to the rate of Ca2þ changein the cytosol is
dx1
dt
� �buffer
¼ Fb;1ðw1;x1Þ. (16)
The concentration change of bound buffer in the cytosol isgoverned by
dw1
dt¼ �F b;1ðw1;x1Þ. (17)
It follows from the above that the change in free Ca2þ inthe mitochondria is governed by
dx2
dt¼ �
1
n2F mðx1;x2Þ, (18)
where n2 is the ratio of the volume of the mitochondria tothat of the cytosol and in the reticulum it is governed by
dx3
dt¼ �
1
n1F rðx1; x3Þ þ Fb;2ðw2; x3Þ, (19)
where n1 is the ratio of the volume of the reticulum to thatof the cytosol. The bound buffer concentration in thereticulum satisfies
dw2
dt¼ �F b;2ðw2;x1Þ. (20)
The concentration of Ca2þ in the cytosol, x1 ¼ ½Ca2þ�cyt, is
now found by solving simultaneously the differentialequations (10)–(13) and (16)–(20), subject to the initialconditions xi ¼ xe
i , i ¼ 1; 2; 3, where xei are the resting levels
of Ca2þ in each compartment before stimulation com-mences.Although the above 4-compartment model is the most
complete representation of the system, it is more illuminat-ing to build up to it gradually by considering a sequence ofmodels, starting from the simplest 2-compartment one.Thus, we define three models
Model A. 2 compartments: cytosol and exterior; Model B. 3 compartments: mitochondria, cytosol andexterior;
Model C. 4 compartments: endoplasmic reticulum,mitochondria, cytosol and exterior.
Model C is described by the full set of equations; reducingthese by removing all variables and equations referring tothe reticulum then describes Model B and further reductionby removing all reference to the mitochondria leaves adescription of Model A.
ARTICLE IN PRESS
Table 3
Values of the parameters used in the numerical calculations for the case of
Model C where there are four compartments (external medium, cytosol,
mitochondria and endoplasmic reticulum)
Quantity Symbol Value Notes
Cytosol
Pump rate A �1 Adjusted
M.R. Bennett et al. / Journal of Theoretical Biology 247 (2007) 230–241234
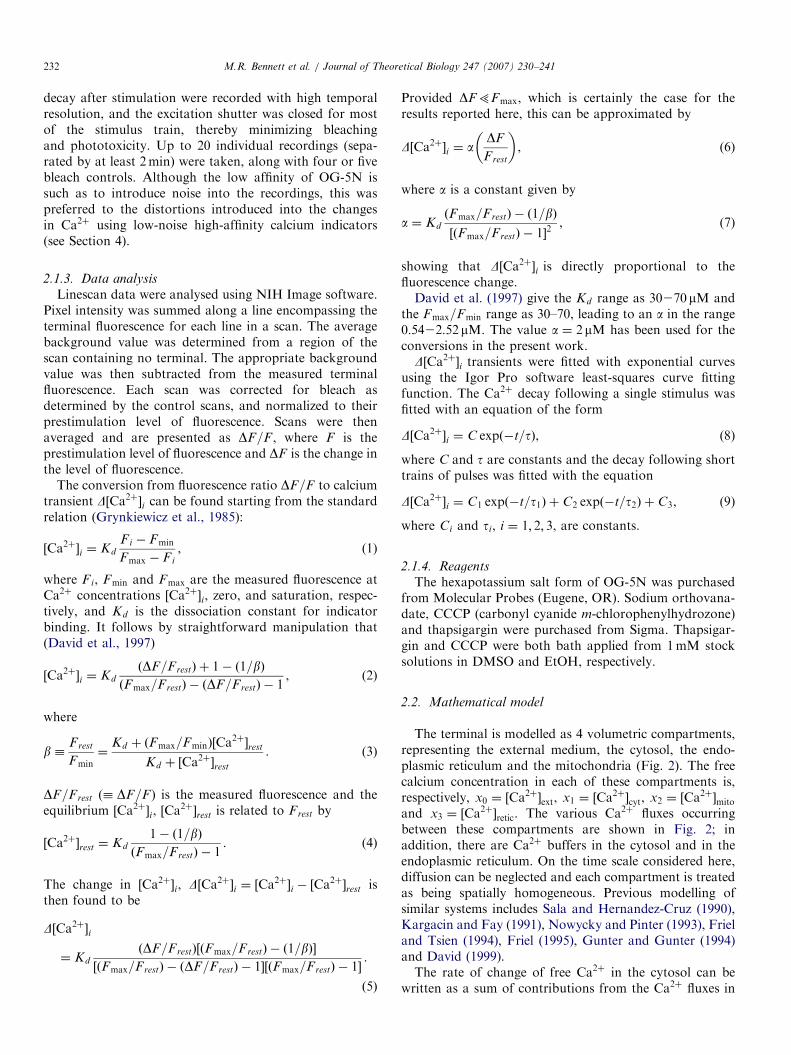
2.2.1. Parameter choice
The parameter values used in the calculation are given inTables 1–3. The values for Model A (Table 1) areessentially those used in Bennett et al. (2004), except thatthe fixed and mobile buffers have been combined and theplasmalemma pump rate and Ca2þ influx rate have beenadjusted to fit the experimental data. The volume of the
Table 1
Values of the parameters used in the numerical calculations for the case of
Model A where there are two compartments (external medium and
cytosol) separated by the plasmalemma
Quantity Symbol Value Notes
External ½Ca2þ� x0 2mM
Cytosol
Terminal volume 3:5mm3 See text
Equilibrium ½Ca2þ� xe1 0:1mM Nowycky and
Pinter (1993)
Pump rate A1 3000mMs�1 Adjusted
Pump dissociation
constant
K1 0:2mM Kargacin and Fay
(1991)
Leak rate A2 (Balanced)
Ca2þ influx rate A3 ðmMms�1Þ Varied—see text
Ca2þ influx time per
pulse
t2 � t1 3.5ms See text
Buffer
Total concentration Bt1 5100mM Bennett et al.
(2004)
On rate kþ1 500mM�1 s�1 Bennett et al.
(2004)
Off rate k�1 5000 s�1 Bennett et al.
(2004)
Dissociation constant k�1 =kþ1 10mM Bennett et al.
(2004)
A value for A2 was obtained by balancing the leak rate and the pump rate
at equilibrium.
Table 2
Values of the parameters used in the numerical calculations for the case of
Model B where there are three compartments (external medium, cytosol
and mitochondria)
Quantity Symbol Value Notes
Cytosol
Pump rate A1 1200mMs�1 Adjusted
Mitochondria
Density n2 0:1 pgmm�3 See text
Equilibrium
½Ca2þ�
xe2 0
Uniporter rate A4 5:45� 105 mMs�1 Adjusted
Uniporter
dissociation
constant
K4 15mM Gunter and
Gunter
(1994)
Na/Ca exchange
rate
A5 228mMs�1 Adjusted
Na/Ca exchange
dissociation
constant
K5 8:1 nmolmg�1 Gunter and
Gunter
(1994)
For the cytosol, only the pump rate has changed—the remaining
parameter values are as for Model A (Table 1).
1 800mMs
Mitochondria
Uniporter rate A4 3:64� 105 mMs�1 Adjusted
Na/Ca exchange
rate
A5 114mMs�1 Adjusted
Endoplasmic
reticulum
Volume fraction n1 0.06 Kargacin
and Fay
(1991)
Equilibrium ½Ca2þ� xe3 250mM See text
Pump rate A6 1800mMs�1 Adjusted
Pump dissociation
constant
K6 0:66mM See text
Leak rate A7 (Balanced)
Buffer
Total
concentrationBt2 7500mM See text
On rate kþ2 10mM�1 s�1 See text
Off rate k�2 5000 s�1 See text
Dissociation
constantk�2 =kþ2 500mM See text
For the cytosol, only the pump rate has changed—the remaining
parameter values are as for Model A (Table 1). For the Mitochondria,
the Uniporter rate and the Na/Ca exchange rate have been changed—the
remaining parameter values are as for Model B (Table 2). A value for A7
was obtained by balancing the leak rate and the pump rate at equilibrium.
terminal is that of a cylinder of diameter 1:5mm and length2mm, this approximating the appropriate region of thenerve terminal. The addition of the mitochondrial com-partment (Model B, Table 2) means that the cytosolic Ca2þ
is now being removed both by the plasmalemma pump andthe uniporter, and this necessitates an adjustment of theserates, as well as that of the Na/Ca exchanger. The furtheraddition of the endoplasmic reticulum (Model C, Table 3)means that further adjustment is necessary in order toincorporate this new source of cytosolic Ca2þ removal.The parameter values for the mitochondria are from
Gunter and Gunter (1994), with the uniporter and pump(Na/Ca exchanger) rates increased to agree with the presentexperimental data. The density corresponds to the mito-chondrial mass forming 10% of the terminal mass, which iswithin the experimental range (Ishihara et al., 1997; Hiraiet al., 2001).Parameter values for the endoplasmic reticulum are not
well established. Bygrave and Benedetti (1996) cite theliterature as giving a range 1022000mM for the free Ca2þ
concentration, though later this is narrowed to1002500mM (Laude et al., 2005); we have used anintermediate value of 250mM. The pump dissociationconstant, K6, was given as 0:22mM by Kargacin and Fay(1991), but Lytton et al. (1992) give 1:1mM for SERCA3

ARTICLE IN PRESS
Fig. 3. Observed D½Ca2þ�i during different trains of impulses: (a) 100
impulses at 20Hz; (b) 6 impulses at 50Hz; (c) 100 impulses at 50Hz; (d) 30
impulses at 50Hz. The vertical scale bar gives D½Ca2þ�i ; the conversion
from fluorescence used Eq. (6) with a ¼ 2mM. The horizontal lines give
the period of stimulation; in (a) and (c) the lines are broken indicating that
the middle period of stimulation has been omitted in order to display the
individual D½Ca2þ�i for each pulse on an appropriate time base. The
breaks in the recordings are a result of experimental procedure—a limited
number of frames (4 or 5) had to cover the whole timecourse, so the data
for the longer trains are less complete.
M.R. Bennett et al. / Journal of Theoretical Biology 247 (2007) 230–241 235
which is the most likely form of ATPase in non-musclecells; again, we have chosen an intermediate valueð0:66mMÞ. The dissociation constant for Ca2þ binding tothe ER buffer could range from 250 to 1000mM (Milneret al., 1992) and the value 500mM has been used, with k�2being chosen to agree with this value. Using an inter-mediate value for the concentration of Ca2þ bound to thebuffer of 2500mM (range 100025000mM: Bygrave andBenedetti, 1996) gives 7500mM as the estimate of bufferconcentration.
Because of the uncertainty in some of the ER parametervalues we did a number of runs, using values over themaximum ranges given above, to check parameter sensi-tivity. Changing the buffer dissociation constant or theequilibrium ½Ca2þ� level had only a small effect; increasingthe total buffer concentration also had a small effect, butdecreasing it too much reduced agreement, particularly inthose experiments where the mitochondrial uptake wasblocked. Reducing the pumping rate into the ER did notgive the desired change when the pump was blocked; on theother hand, increasing it substantially gave the wrong timedependence to the rising phase of the Ca2þ transient. Otherparameters listed as ‘‘adjusted’’ in the tables wereessentially chosen to give the correct amplitude changeswhen the mitochondria and/or the ER contributions tocytosolic ½Ca2þ� were blocked. Ca2þ input, either as asingle impulse or as a train of impulses, is approximated bya rectangular step function of duration 3.5ms, this beingthe approximate duration of an action potential. Thestandard input is 50,000 ions per impulse, corresponding toa concentration increase of 6:78mMms�1. This input hasbeen varied to allow for the differences in experimentalpreparations as stated in the figure captions.
3. Results
3.1. D½Ca2þ�i following an impulse or short trains of
impulses
Calcium concentration changes at a site along the lengthof a terminal branch following a single impulse weredetermined using a low affinity indicator (OG-5N) and linescans (Fig. 1a). The ½Ca2þ�i transient, D½Ca2þ�i, declinedexponentially with a time constant of 119� 16ms (�SEM;n ¼ 7; Fig. 1b). In order to determine if the size andtemporal characteristics of this transient were dependenton the position on the terminal branch where the recordingwas made, measurements were made of D½Ca2þ�i at severaldifferent positions (up to 50mm apart) along a terminalbranch and found to be very similar.
D½Ca2þ�i for different protocols of stimulation wasexamined, with both the peak amplitude reached duringthe trains and the rate of recovery at the ends of the trainsbeing determined. Fig. 3 shows the changes duringstimulation of a terminal with long trains of 100 impulsesat 20Hz (Fig. 3a) or 100 impulses at 50Hz (Fig. 3c) orshorter trains of either 6 impulses at 50Hz (Fig. 3b) or 30
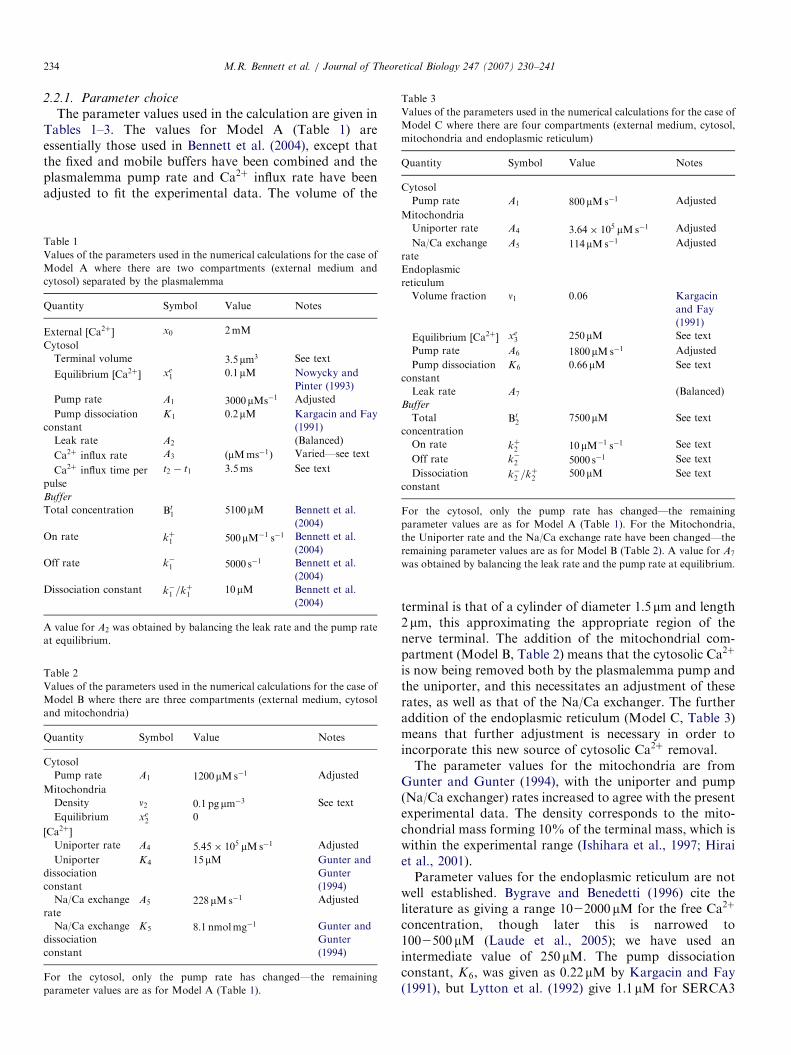
impulses at 50Hz (Fig. 3d). Eq. (9) was fitted to thedecaying portion of the experimental data of Fig. 3,resulting in values for t1 of 60ms and for t2 of 310ms. TheCa2þ sequestration models were then used to calculate thetheoretical D½Ca2þ�i for each of these stimulation protocolsand the results are shown in Fig. 4, with panels a–d in eachcase corresponding to panels a–d in Fig. 3. The lines are thetheoretical results and the open circles are experimentalvalues taken from Fig. 3. The calculations were performedfor each of the three models, A, B and C, as defined in theSection 2, using parameters from Tables 1–3, respectively.All three models are in reasonable agreement with theexperimental data, though the 2-compartment model(Model A) does not always fit the tail of D½Ca2þ�i(Fig. 4a). The poorer fit of Model C can be attributed toits having to fit a wider range of data than the other twomodels; that is, it has to also fit data coming fromexperiments in which the mitochondrial uniporter isblocked and in which the endoplasmic pump is blocked.
3.2. Calcium sequestration by mitochondria
The possibility that the mitochondrial uniporter re-moved Ca2þ from the cytosol during the stimulationprotocols used was examined by depolarizing the mito-chondria with CCCP (1–2mM) in four different preparations.
ARTICLE IN PRESS
5000 5500 6000
0
0.2
0.4
[Ca2+]/
µM
0 200 400 600
0
0.1
0.2
0.3
0.4
0.5
[Ca2+]/
µM
2000 2500 3000
0
0.2
0.4
0.6
[Ca2+]/
µM
0 500 1000 1500
0
0.1
0.2
0.3
0.4
0.5
time/ms
[Ca2+]/
µM
5000 5500 6000
0
0.2
0.4
0 200 400 600
0
0.1
0.2
0.3
0.4
0.5
2000 2500 3000
0
0.2
0.4
0.6
0 500 1000 1500
0
0.1
0.2
0.3
0.4
0.5
time/ms
5000 5500 6000
0
0.2
0.4
0 200 400 600
0
0.1
0.2
0.3
0.4
0.5
2000 2500 3000
0
0.2
0.4
0.6
0 500 1000 15000
0.1
0.2
0.3
0.4
0.5
time/ms
Model A Model B Model C
Fig. 4. Comparison between theoretical and observed ½Ca2þ�i during different trains of impulses. In each case, panels (a–d) are for the corresponding
experimental results in Fig. 3, with the open circles showing experimental points and the solid lines giving the theoretical results. The first column uses the
two-compartment model (Model A), the second column uses the three-compartment model (Model B) and the third column uses the full four-
compartment model (Model C). In the theoretical curves the background ½Ca2þ� has been subtracted. In panels (a) and (b) the basic Ca2þ input rate of
50,000 ions per impulse has been multiplied by 2.5, 2 and 1.8 for Models A, B and C, respectively. In panels (c) and (d) the corresponding multiplicative
factors are 2.5, 1.1 and 0.9. The RMS deviations between the experimental and theoretical results for Model A are 0.0825, 0.0237, 0.0672 and 0.0477 for
panels (a), (b), (c) and (d), respectively; for Model B the corresponding numbers are 0.0566, 0.0193, 0.0745 and 0.0356; for Model C they are 0.0602,
0.0185, 0.1276 and 0.0378. Note that the time scales in (a–d) are different.
M.R. Bennett et al. / Journal of Theoretical Biology 247 (2007) 230–241236
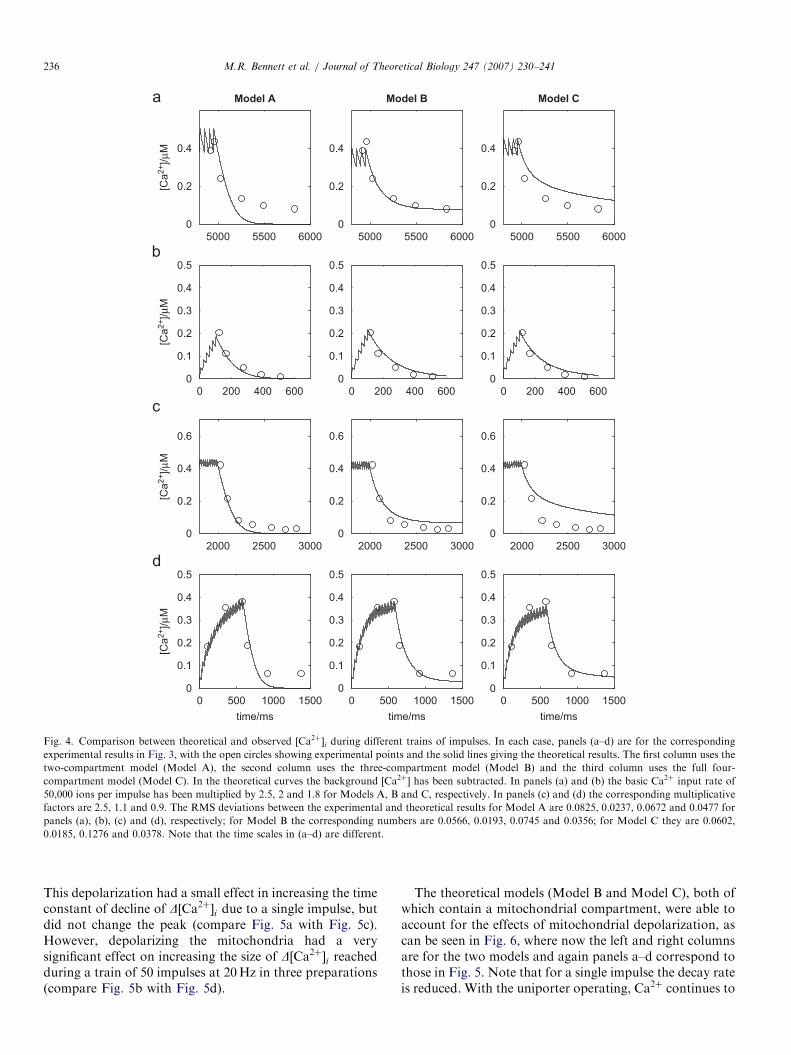
This depolarization had a small effect in increasing the timeconstant of decline of D½Ca2þ�i due to a single impulse, butdid not change the peak (compare Fig. 5a with Fig. 5c).However, depolarizing the mitochondria had a verysignificant effect on increasing the size of D½Ca2þ�i reachedduring a train of 50 impulses at 20Hz in three preparations(compare Fig. 5b with Fig. 5d).
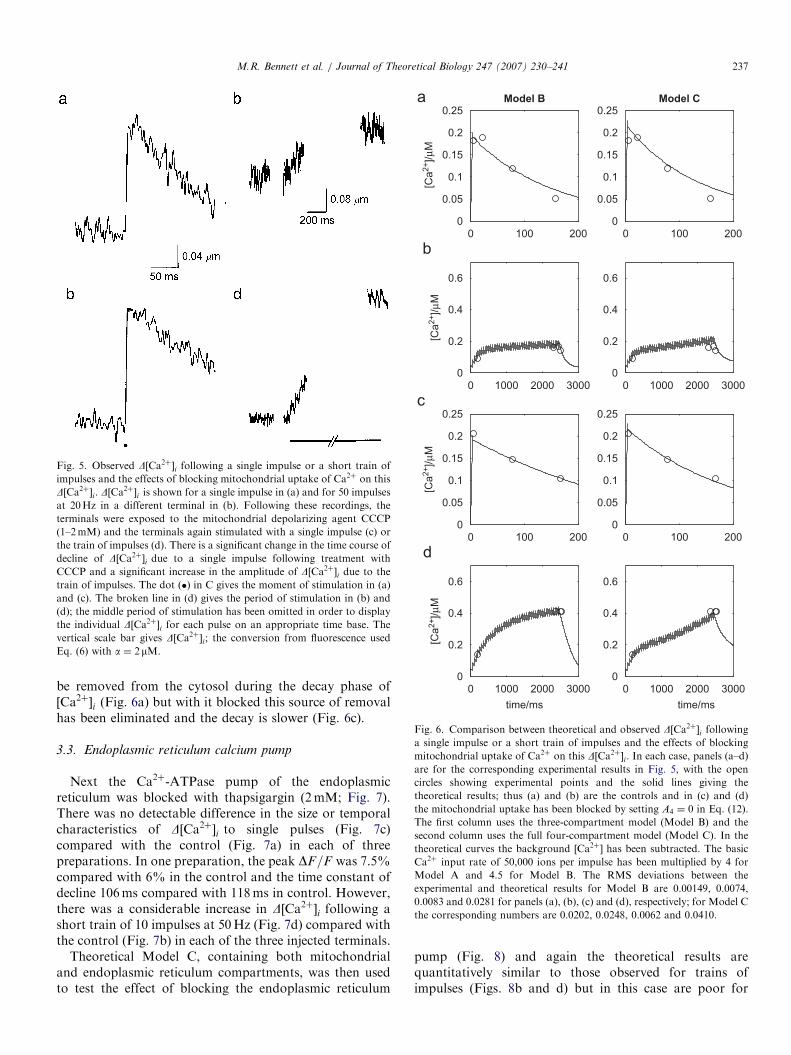
The theoretical models (Model B and Model C), both ofwhich contain a mitochondrial compartment, were able toaccount for the effects of mitochondrial depolarization, ascan be seen in Fig. 6, where now the left and right columnsare for the two models and again panels a–d correspond tothose in Fig. 5. Note that for a single impulse the decay rateis reduced. With the uniporter operating, Ca2þ continues to
ARTICLE IN PRESS
Fig. 5. Observed D½Ca2þ�i following a single impulse or a short train of
impulses and the effects of blocking mitochondrial uptake of Ca2þ on this
D½Ca2þ�i. D½Ca2þ�i is shown for a single impulse in (a) and for 50 impulses
at 20Hz in a different terminal in (b). Following these recordings, the
terminals were exposed to the mitochondrial depolarizing agent CCCP
(1–2mM) and the terminals again stimulated with a single impulse (c) or
the train of impulses (d). There is a significant change in the time course of
decline of D½Ca2þ�i due to a single impulse following treatment with
CCCP and a significant increase in the amplitude of D½Ca2þ�i due to the
train of impulses. The dot ðÞ in C gives the moment of stimulation in (a)
and (c). The broken line in (d) gives the period of stimulation in (b) and
(d); the middle period of stimulation has been omitted in order to display
the individual D½Ca2þ�i for each pulse on an appropriate time base. The
vertical scale bar gives D½Ca2þ�i; the conversion from fluorescence used
Eq. (6) with a ¼ 2mM.
0 100 200
0
0.05
0.1
0.15
0.2
0.25
[Ca2+]/
µM
0 1000 2000 3000
0
0.2
0.4
0.6
[Ca2+]/
µM
0 100 200
0
0.05
0.1
0.15
0.2
0.25
[Ca2+]/
µM
0 1000 2000 3000
0
0.2
0.4
0.6
time/ms
[Ca2+]/
µM
0 100 200
0
0.05
0.1
0.15
0.2
0.25
0 1000 2000 3000
0
0.2
0.4
0.6
0 100 200
0
0.05
0.1
0.15
0.2
0.25
0 1000 2000 3000
0
0.2
0.4
0.6
time/ms
Model B Model C
Fig. 6. Comparison between theoretical and observed D½Ca2þ�i followinga single impulse or a short train of impulses and the effects of blocking
mitochondrial uptake of Ca2þ on this D½Ca2þ�i. In each case, panels (a–d)
are for the corresponding experimental results in Fig. 5, with the open
circles showing experimental points and the solid lines giving the
theoretical results; thus (a) and (b) are the controls and in (c) and (d)
the mitochondrial uptake has been blocked by setting A4 ¼ 0 in Eq. (12).
The first column uses the three-compartment model (Model B) and the
second column uses the full four-compartment model (Model C). In the
theoretical curves the background ½Ca2þ� has been subtracted. The basic
Ca2þ input rate of 50,000 ions per impulse has been multiplied by 4 for
Model A and 4.5 for Model B. The RMS deviations between the
experimental and theoretical results for Model B are 0.00149, 0.0074,
0.0083 and 0.0281 for panels (a), (b), (c) and (d), respectively; for Model C
the corresponding numbers are 0.0202, 0.0248, 0.0062 and 0.0410.
M.R. Bennett et al. / Journal of Theoretical Biology 247 (2007) 230–241 237
be removed from the cytosol during the decay phase of½Ca2þ�i (Fig. 6a) but with it blocked this source of removalhas been eliminated and the decay is slower (Fig. 6c).
3.3. Endoplasmic reticulum calcium pump
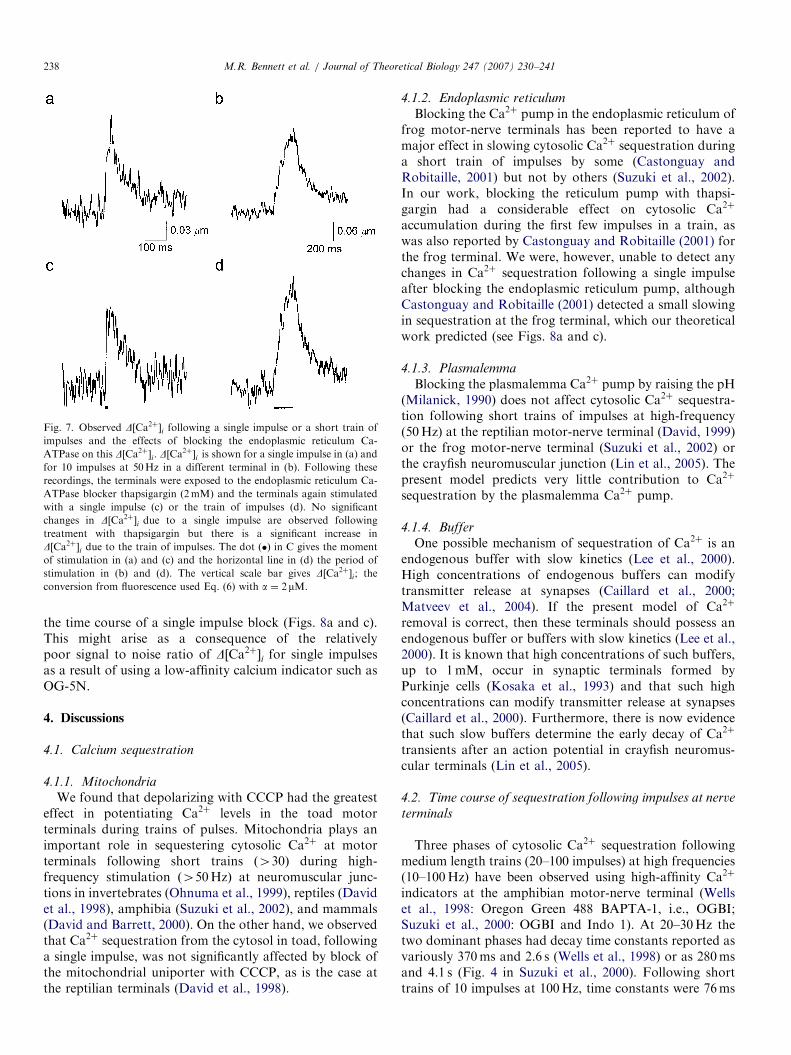
Next the Ca2þ-ATPase pump of the endoplasmicreticulum was blocked with thapsigargin (2mM; Fig. 7).There was no detectable difference in the size or temporalcharacteristics of D½Ca2þ�i to single pulses (Fig. 7c)compared with the control (Fig. 7a) in each of threepreparations. In one preparation, the peak DF=F was 7.5%compared with 6% in the control and the time constant ofdecline 106ms compared with 118ms in control. However,there was a considerable increase in D½Ca2þ�i following ashort train of 10 impulses at 50Hz (Fig. 7d) compared withthe control (Fig. 7b) in each of the three injected terminals.
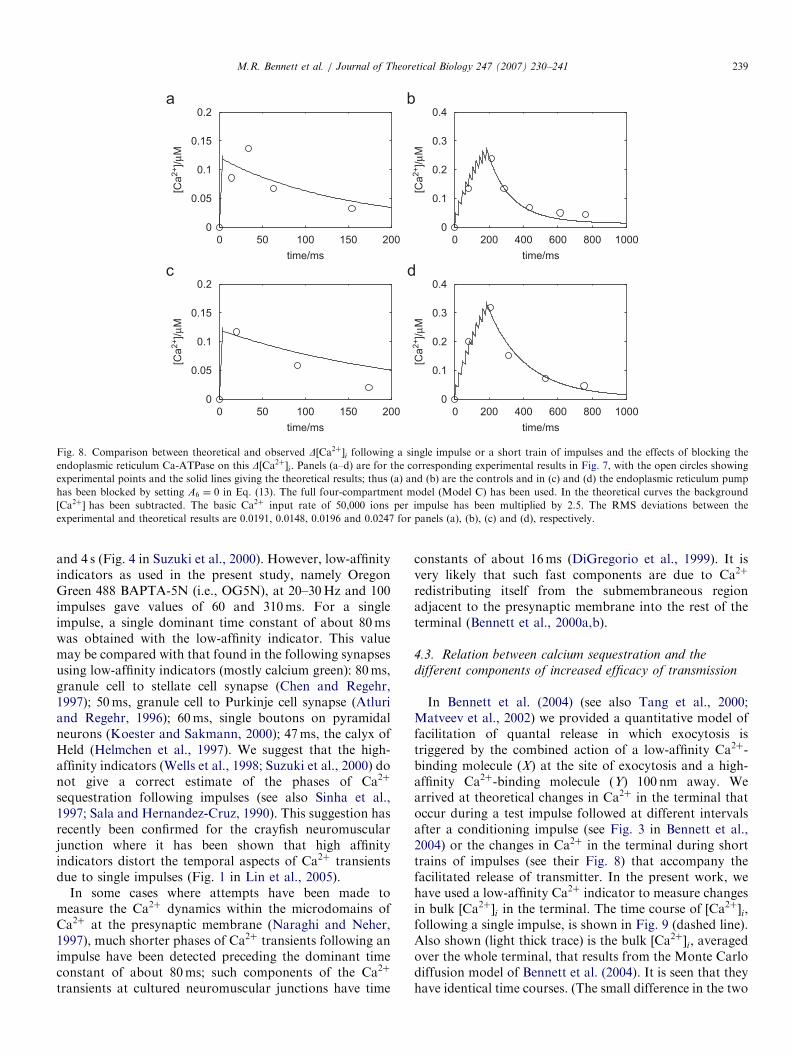
Theoretical Model C, containing both mitochondrialand endoplasmic reticulum compartments, was then usedto test the effect of blocking the endoplasmic reticulum
pump (Fig. 8) and again the theoretical results arequantitatively similar to those observed for trains ofimpulses (Figs. 8b and d) but in this case are poor for
ARTICLE IN PRESS
Fig. 7. Observed D½Ca2þ�i following a single impulse or a short train of
impulses and the effects of blocking the endoplasmic reticulum Ca-
ATPase on this D½Ca2þ�i. D½Ca2þ�i is shown for a single impulse in (a) and
for 10 impulses at 50Hz in a different terminal in (b). Following these
recordings, the terminals were exposed to the endoplasmic reticulum Ca-
ATPase blocker thapsigargin (2mM) and the terminals again stimulated
with a single impulse (c) or the train of impulses (d). No significant
changes in D½Ca2þ�i due to a single impulse are observed following
treatment with thapsigargin but there is a significant increase in
D½Ca2þ�i due to the train of impulses. The dot ðÞ in C gives the moment
of stimulation in (a) and (c) and the horizontal line in (d) the period of
stimulation in (b) and (d). The vertical scale bar gives D½Ca2þ�i; the
conversion from fluorescence used Eq. (6) with a ¼ 2mM.
M.R. Bennett et al. / Journal of Theoretical Biology 247 (2007) 230–241238
the time course of a single impulse block (Figs. 8a and c).This might arise as a consequence of the relativelypoor signal to noise ratio of D½Ca2þ�i for single impulsesas a result of using a low-affinity calcium indicator such asOG-5N.
4. Discussions
4.1. Calcium sequestration
4.1.1. Mitochondria
We found that depolarizing with CCCP had the greatesteffect in potentiating Ca2þ levels in the toad motorterminals during trains of pulses. Mitochondria plays animportant role in sequestering cytosolic Ca2þ at motorterminals following short trains ð430Þ during high-frequency stimulation ð450HzÞ at neuromuscular junc-tions in invertebrates (Ohnuma et al., 1999), reptiles (Davidet al., 1998), amphibia (Suzuki et al., 2002), and mammals(David and Barrett, 2000). On the other hand, we observedthat Ca2þ sequestration from the cytosol in toad, followinga single impulse, was not significantly affected by block ofthe mitochondrial uniporter with CCCP, as is the case atthe reptilian terminals (David et al., 1998).
4.1.2. Endoplasmic reticulum
Blocking the Ca2þ pump in the endoplasmic reticulum offrog motor-nerve terminals has been reported to have amajor effect in slowing cytosolic Ca2þ sequestration duringa short train of impulses by some (Castonguay andRobitaille, 2001) but not by others (Suzuki et al., 2002).In our work, blocking the reticulum pump with thapsi-gargin had a considerable effect on cytosolic Ca2þ
accumulation during the first few impulses in a train, aswas also reported by Castonguay and Robitaille (2001) forthe frog terminal. We were, however, unable to detect anychanges in Ca2þ sequestration following a single impulseafter blocking the endoplasmic reticulum pump, althoughCastonguay and Robitaille (2001) detected a small slowingin sequestration at the frog terminal, which our theoreticalwork predicted (see Figs. 8a and c).
4.1.3. Plasmalemma
Blocking the plasmalemma Ca2þ pump by raising the pH(Milanick, 1990) does not affect cytosolic Ca2þ sequestra-tion following short trains of impulses at high-frequency(50Hz) at the reptilian motor-nerve terminal (David, 1999)or the frog motor-nerve terminal (Suzuki et al., 2002) orthe crayfish neuromuscular junction (Lin et al., 2005). Thepresent model predicts very little contribution to Ca2þ
sequestration by the plasmalemma Ca2þ pump.
4.1.4. Buffer
One possible mechanism of sequestration of Ca2þ is anendogenous buffer with slow kinetics (Lee et al., 2000).High concentrations of endogenous buffers can modifytransmitter release at synapses (Caillard et al., 2000;Matveev et al., 2004). If the present model of Ca2þ
removal is correct, then these terminals should possess anendogenous buffer or buffers with slow kinetics (Lee et al.,2000). It is known that high concentrations of such buffers,up to 1mM, occur in synaptic terminals formed byPurkinje cells (Kosaka et al., 1993) and that such highconcentrations can modify transmitter release at synapses(Caillard et al., 2000). Furthermore, there is now evidencethat such slow buffers determine the early decay of Ca2þ
transients after an action potential in crayfish neuromus-cular terminals (Lin et al., 2005).
4.2. Time course of sequestration following impulses at nerve
terminals
Three phases of cytosolic Ca2þ sequestration followingmedium length trains (20–100 impulses) at high frequencies(10–100Hz) have been observed using high-affinity Ca2þ
indicators at the amphibian motor-nerve terminal (Wellset al., 1998: Oregon Green 488 BAPTA-1, i.e., OGBI;Suzuki et al., 2000: OGBI and Indo 1). At 20–30Hz thetwo dominant phases had decay time constants reported asvariously 370ms and 2.6 s (Wells et al., 1998) or as 280msand 4.1 s (Fig. 4 in Suzuki et al., 2000). Following shorttrains of 10 impulses at 100Hz, time constants were 76ms
ARTICLE IN PRESS
0 50 100 150 200
0
0.05
0.1
0.15
0.2
time/ms
[Ca2+]/
µM
0 200 400 600 800 1000
0
0.1
0.2
0.3
0.4
time/ms
[Ca2+]/
µM0 50 100 150 200
0
0.05
0.1
0.15
0.2
time/ms
[Ca2+]/
µM
0 200 400 600 800 1000
0
0.1
0.2
0.3
0.4
time/ms[Ca2+]/
µM
Fig. 8. Comparison between theoretical and observed D½Ca2þ�i following a single impulse or a short train of impulses and the effects of blocking the
endoplasmic reticulum Ca-ATPase on this D½Ca2þ�i. Panels (a–d) are for the corresponding experimental results in Fig. 7, with the open circles showing
experimental points and the solid lines giving the theoretical results; thus (a) and (b) are the controls and in (c) and (d) the endoplasmic reticulum pump
has been blocked by setting A6 ¼ 0 in Eq. (13). The full four-compartment model (Model C) has been used. In the theoretical curves the background
½Ca2þ� has been subtracted. The basic Ca2þ input rate of 50,000 ions per impulse has been multiplied by 2.5. The RMS deviations between the
experimental and theoretical results are 0.0191, 0.0148, 0.0196 and 0.0247 for panels (a), (b), (c) and (d), respectively.
M.R. Bennett et al. / Journal of Theoretical Biology 247 (2007) 230–241 239
and 4 s (Fig. 4 in Suzuki et al., 2000). However, low-affinityindicators as used in the present study, namely OregonGreen 488 BAPTA-5N (i.e., OG5N), at 20–30Hz and 100impulses gave values of 60 and 310ms. For a singleimpulse, a single dominant time constant of about 80mswas obtained with the low-affinity indicator. This valuemay be compared with that found in the following synapsesusing low-affinity indicators (mostly calcium green): 80ms,granule cell to stellate cell synapse (Chen and Regehr,1997); 50ms, granule cell to Purkinje cell synapse (Atluriand Regehr, 1996); 60ms, single boutons on pyramidalneurons (Koester and Sakmann, 2000); 47ms, the calyx ofHeld (Helmchen et al., 1997). We suggest that the high-affinity indicators (Wells et al., 1998; Suzuki et al., 2000) donot give a correct estimate of the phases of Ca2þ
sequestration following impulses (see also Sinha et al.,1997; Sala and Hernandez-Cruz, 1990). This suggestion hasrecently been confirmed for the crayfish neuromuscularjunction where it has been shown that high affinityindicators distort the temporal aspects of Ca2þ transientsdue to single impulses (Fig. 1 in Lin et al., 2005).
In some cases where attempts have been made tomeasure the Ca2þ dynamics within the microdomains ofCa2þ at the presynaptic membrane (Naraghi and Neher,1997), much shorter phases of Ca2þ transients following animpulse have been detected preceding the dominant timeconstant of about 80ms; such components of the Ca2þ
transients at cultured neuromuscular junctions have time
constants of about 16ms (DiGregorio et al., 1999). It isvery likely that such fast components are due to Ca2þ
redistributing itself from the submembraneous regionadjacent to the presynaptic membrane into the rest of theterminal (Bennett et al., 2000a,b).
4.3. Relation between calcium sequestration and the
different components of increased efficacy of transmission
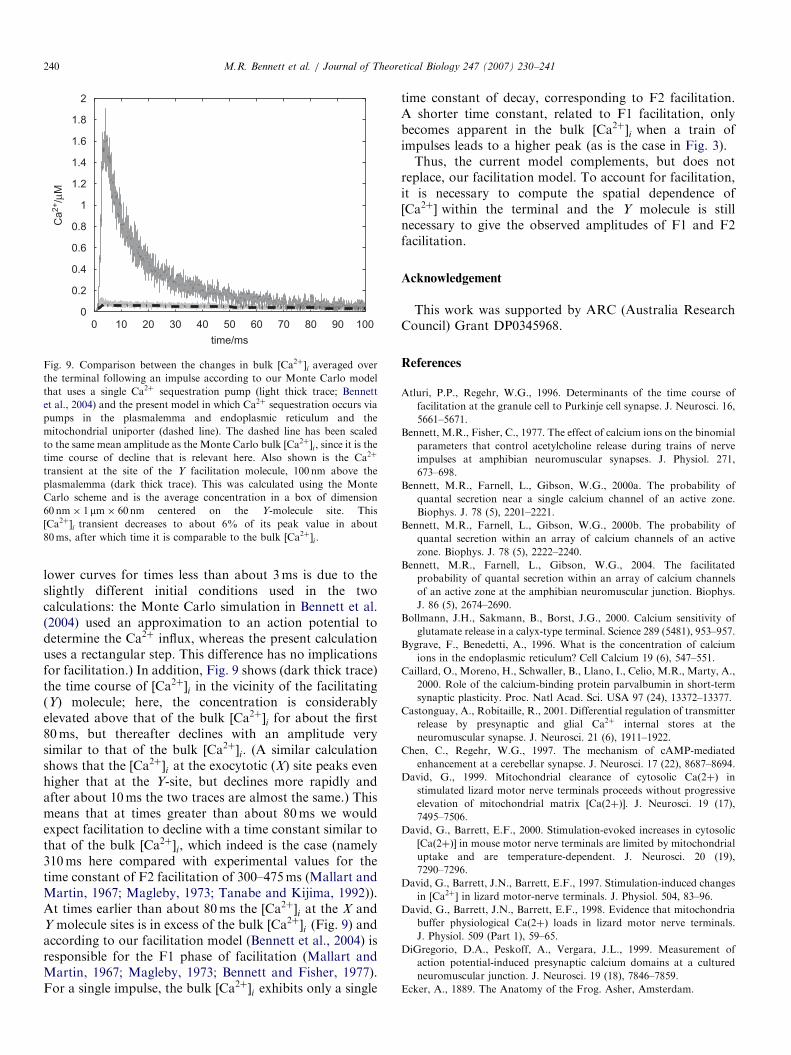
In Bennett et al. (2004) (see also Tang et al., 2000;Matveev et al., 2002) we provided a quantitative model offacilitation of quantal release in which exocytosis istriggered by the combined action of a low-affinity Ca2þ-binding molecule (X) at the site of exocytosis and a high-affinity Ca2þ-binding molecule (Y) 100 nm away. Wearrived at theoretical changes in Ca2þ in the terminal thatoccur during a test impulse followed at different intervalsafter a conditioning impulse (see Fig. 3 in Bennett et al.,2004) or the changes in Ca2þ in the terminal during shorttrains of impulses (see their Fig. 8) that accompany thefacilitated release of transmitter. In the present work, wehave used a low-affinity Ca2þ indicator to measure changesin bulk ½Ca2þ�i in the terminal. The time course of ½Ca2þ�i,following a single impulse, is shown in Fig. 9 (dashed line).Also shown (light thick trace) is the bulk ½Ca2þ�i, averagedover the whole terminal, that results from the Monte Carlodiffusion model of Bennett et al. (2004). It is seen that theyhave identical time courses. (The small difference in the two
ARTICLE IN PRESS
0 10 20 30 40 50 60 70 80 90 100
0
0.2
0.4
0.6
0.8
1
1.2
1.4
1.6
1.8
2
time/ms
Ca2+/µM
Fig. 9. Comparison between the changes in bulk ½Ca2þ�i averaged over
the terminal following an impulse according to our Monte Carlo model
that uses a single Ca2þ sequestration pump (light thick trace; Bennett
et al., 2004) and the present model in which Ca2þ sequestration occurs via
pumps in the plasmalemma and endoplasmic reticulum and the
mitochondrial uniporter (dashed line). The dashed line has been scaled
to the same mean amplitude as the Monte Carlo bulk ½Ca2þ�i , since it is the
time course of decline that is relevant here. Also shown is the Ca2þ
transient at the site of the Y facilitation molecule, 100 nm above the
plasmalemma (dark thick trace). This was calculated using the Monte
Carlo scheme and is the average concentration in a box of dimension
60 nm� 1mm� 60nm centered on the Y-molecule site. This
½Ca2þ�i transient decreases to about 6% of its peak value in about
80ms, after which time it is comparable to the bulk ½Ca2þ�i .
M.R. Bennett et al. / Journal of Theoretical Biology 247 (2007) 230–241240
lower curves for times less than about 3ms is due to theslightly different initial conditions used in the twocalculations: the Monte Carlo simulation in Bennett et al.(2004) used an approximation to an action potential todetermine the Ca2þ influx, whereas the present calculationuses a rectangular step. This difference has no implicationsfor facilitation.) In addition, Fig. 9 shows (dark thick trace)the time course of ½Ca2þ�i in the vicinity of the facilitating(Y) molecule; here, the concentration is considerablyelevated above that of the bulk ½Ca2þ�i for about the first80ms, but thereafter declines with an amplitude verysimilar to that of the bulk ½Ca2þ�i. (A similar calculationshows that the ½Ca2þ�i at the exocytotic (X) site peaks evenhigher that at the Y-site, but declines more rapidly andafter about 10ms the two traces are almost the same.) Thismeans that at times greater than about 80ms we wouldexpect facilitation to decline with a time constant similar tothat of the bulk ½Ca2þ�i, which indeed is the case (namely310ms here compared with experimental values for thetime constant of F2 facilitation of 300–475ms (Mallart andMartin, 1967; Magleby, 1973; Tanabe and Kijima, 1992)).At times earlier than about 80ms the ½Ca2þ�i at the X andY molecule sites is in excess of the bulk ½Ca2þ�i (Fig. 9) andaccording to our facilitation model (Bennett et al., 2004) isresponsible for the F1 phase of facilitation (Mallart andMartin, 1967; Magleby, 1973; Bennett and Fisher, 1977).For a single impulse, the bulk ½Ca2þ�i exhibits only a single
time constant of decay, corresponding to F2 facilitation.A shorter time constant, related to F1 facilitation, onlybecomes apparent in the bulk ½Ca2þ�i when a train ofimpulses leads to a higher peak (as is the case in Fig. 3).Thus, the current model complements, but does not
replace, our facilitation model. To account for facilitation,it is necessary to compute the spatial dependence of½Ca2þ� within the terminal and the Y molecule is stillnecessary to give the observed amplitudes of F1 and F2facilitation.
Acknowledgement
This work was supported by ARC (Australia ResearchCouncil) Grant DP0345968.
References
Atluri, P.P., Regehr, W.G., 1996. Determinants of the time course of
facilitation at the granule cell to Purkinje cell synapse. J. Neurosci. 16,
5661–5671.
Bennett, M.R., Fisher, C., 1977. The effect of calcium ions on the binomial
parameters that control acetylcholine release during trains of nerve
impulses at amphibian neuromuscular synapses. J. Physiol. 271,
673–698.
Bennett, M.R., Farnell, L., Gibson, W.G., 2000a. The probability of
quantal secretion near a single calcium channel of an active zone.
Biophys. J. 78 (5), 2201–2221.
Bennett, M.R., Farnell, L., Gibson, W.G., 2000b. The probability of
quantal secretion within an array of calcium channels of an active
zone. Biophys. J. 78 (5), 2222–2240.
Bennett, M.R., Farnell, L., Gibson, W.G., 2004. The facilitated
probability of quantal secretion within an array of calcium channels
of an active zone at the amphibian neuromuscular junction. Biophys.
J. 86 (5), 2674–2690.
Bollmann, J.H., Sakmann, B., Borst, J.G., 2000. Calcium sensitivity of
glutamate release in a calyx-type terminal. Science 289 (5481), 953–957.
Bygrave, F., Benedetti, A., 1996. What is the concentration of calcium
ions in the endoplasmic reticulum? Cell Calcium 19 (6), 547–551.
Caillard, O., Moreno, H., Schwaller, B., Llano, I., Celio, M.R., Marty, A.,
2000. Role of the calcium-binding protein parvalbumin in short-term
synaptic plasticity. Proc. Natl Acad. Sci. USA 97 (24), 13372–13377.
Castonguay, A., Robitaille, R., 2001. Differential regulation of transmitter
release by presynaptic and glial Ca2þ internal stores at the
neuromuscular synapse. J. Neurosci. 21 (6), 1911–1922.
Chen, C., Regehr, W.G., 1997. The mechanism of cAMP-mediated
enhancement at a cerebellar synapse. J. Neurosci. 17 (22), 8687–8694.
David, G., 1999. Mitochondrial clearance of cytosolic Cað2þÞ in
stimulated lizard motor nerve terminals proceeds without progressive
elevation of mitochondrial matrix ½Cað2þÞ�. J. Neurosci. 19 (17),
7495–7506.
David, G., Barrett, E.F., 2000. Stimulation-evoked increases in cytosolic
½Cað2þÞ� in mouse motor nerve terminals are limited by mitochondrial
uptake and are temperature-dependent. J. Neurosci. 20 (19),
7290–7296.
David, G., Barrett, J.N., Barrett, E.F., 1997. Stimulation-induced changes
in ½Ca2þ� in lizard motor-nerve terminals. J. Physiol. 504, 83–96.
David, G., Barrett, J.N., Barrett, E.F., 1998. Evidence that mitochondria
buffer physiological Cað2þÞ loads in lizard motor nerve terminals.
J. Physiol. 509 (Part 1), 59–65.
DiGregorio, D.A., Peskoff, A., Vergara, J.L., 1999. Measurement of
action potential-induced presynaptic calcium domains at a cultured
neuromuscular junction. J. Neurosci. 19 (18), 7846–7859.
Ecker, A., 1889. The Anatomy of the Frog. Asher, Amsterdam.
ARTICLE IN PRESSM.R. Bennett et al. / Journal of Theoretical Biology 247 (2007) 230–241 241
Friel, D.D., 1995. ½Ca2þ�i oscillations in sympathetic neurons: an
experimental test of a theoretical model. Biophys. J. 68 (5), 1752–1766.
Friel, D.D., Tsien, R.W., 1994. An FCCP-sensitive Ca2þ store in bullfrog
sympathetic neurons and its participation in stimulus-evoked changes
in ½Ca2þ�i . J. Neurosci. 14 (7), 4007–4024.
Grynkiewicz, G., Poenie, M., Tsien, R.Y., 1985. A new generation of Ca2þ
indicators with greatly improved fluorescence properties. J. Biol.
Chem. 260 (6), 3440–3450.
Gunter, K.K., Gunter, T.E., 1994. Transport of calcium by mitochondria.
J. Bioenerg. Biomembr. 26 (5), 471–485.
Helmchen, F., Borst, J.G., Sakmann, B., 1997. Calcium dynamics
associated with a single action potential in a CNS presynaptic
terminal. Biophys. J. 72 (3), 1458–1471.
Hirai, K., Aliev, G., Nuomura, A., Fujioka, H., Russell, R.L., Atwood,
C.S., Johnson, A.B., Kress, Y., Vinters, H.V., Tabaton, M.,
Shimohama, S., Cash, A.D., Siedlak, S.L., Harris, P.L.R., Jones,
P.K., Petersen, R.B., Perry, G., Smith, M.A., 2001. Mitochondrial
abnormalities in Alzeimer’s disease. J. Neurosci. 21 (9), 3017–3023.
Ishihara, A., Hayashi, S., Roy, R.R., Tamada, Y., Ohira, Y., Edgerton,
V.R., Ibata, Y., 1997. Mitochondrial density of ventral horn neurons
in the rat spinal cord. Acta Anat. 160, 248–253.
Kargacin, G., Fay, F.S., 1991. Ca2þ movement in smooth muscle cells
studied with one- and two-dimensional diffusion models. Biophys.
J. 60, 1088–1100.
Katz, B., Miledi, R., 1968. The role of calcium in neuromuscular
facilitation. J. Physiol. 195 (2), 481–492.
Koester, H.J., Sakmann, B., 2000. Calcium dynamics associated with
action potentials in single nerve terminals of pyramidal cells in layer 2/
3 of the young rat neocortex. J. Physiol. 529 (Part 3), 625–646.
Kosaka, T., Kosaka, K., Nakayama, T., Hunziker, W., Heizmann, C.W.,
1993. Axons and axon terminals of cerebellar purkinje cells and basket
cells have higher levels of parvalbumin immunoreactivity than somata
and dendrites: quantitative analysis by immunogold labeling. Exp.
Brain Res. 93 (3), 483–491.
Laude, A., Tovey, S., Dedos, S., Potter, B., Lummis, S., Taylor, C., 2005.
Rapid functional assays of recombinant IP3 receptors. Cell Calcium
38, 45–51.
Lee, S.H., Rosenmund, C., Schwaller, B., Neher, E., 2000. Differences in
Ca2þ buffering properties between excitatory and inhibitory hippo-
campal neurons from the rat. J. Physiol. 525 (Part 2), 405–418.
Lin, J.-W., Fu, Q., Allana, T., 2005. Probing the endogenous Ca2þ buffers
at the presynaptic terminals of the crayfish neuromuscular junction.
J. Neurophys. 99, 377–386.
Lytton, J., Westlin, M., Burk, S., Shull, G., MacLennan, D., 1992.
Functional comparisons between isoforms of the sarcoplamic or
endoplasmic reticulum family of calcium pumps. J. Biol. Chem. 267
(20), 14483–14489.
Macleod, G.T., Dickens, P.A., Bennett, M.R., 2001. Formation and
function of synapses with respect to schwann cells at the end of motor
nerve terminal branches on mature amphibian (bufo marinus) muscle.
J. Neurosci. 21 (7), 2380–2392.
Magleby, D.L., Zengel, J.E., 1976. Stimulation-induced factors which
affect augmentation and potentiation of trasmitter release at the
neuromuscular junction. J. Physiol. 260 (3), 687–717.
Magleby, K.L., 1973. The effect of repetitive stimulation on facilitation of
transmitter release at the frog neuromuscular junction. J. Physiol. 234,
327–352.
Magleby, K.L., Zengel, J.E., 1975. A quantitative description of tetanic
and post-tetanic potentiation of transmitter release at the frog
neuromuscular junction. J. Physiol. 245 (1), 183–208.
Mallart, A., Martin, A.R., 1967. Two components of facilitation at the
neuromuscular junction of the frog. J. Physiol. 191 (1), 19P–20P.
Matveev, V., Sherman, A., Zucker, R.S., 2002. New and corrected
simulations of synaptic facilitation. Biophys. J. 83, 1368–1373.
Matveev, V., Zucker, R.S., Sherman, A., 2004. Facilitation through buffer
saturation: constraints on endogenous buffering properties. Biophys.
J. 86 (5), 2691–2709.
Milanick, M.A., 1990. Proton fluxes associated with the Ca pump in
human red blood cells. Am. J. Physiol. 258 (3 Part 1), C552–C562.
Milner, R., Famulski, K., Michalak, M., 1992. Calcium bonding proteins
in the sarcoplasmic/endoplasmic reticulum of muscle and nonmuscle
cells. Mol. Cell. Biochem. 112, 1–13.
Naraghi, M., Neher, E., 1997. Linearized buffered Ca2þ diffusion in
microdomains and its implications for calculation of ½Ca2þ� at the
mouth of a calcium channel. J. Neurosci. 17 (18), 6961–6973.
Nowycky, M.C., Pinter, M.J., 1993. Time courses of calcium and calcium-
bound buffers following calcium influx in a model cell. Biophys. J. 64,
77–91.
Ohnuma, K., Kazawa, T., Ogawa, S., Suzuki, N., Miwa, A., Kijima, H.,
1999. Cooperative Ca2þ removal from presynaptic terminals
of the spiny lobster neuromuscular junction. Biophys. J. 76 (4),
1819–1834.
Sala, F., Hernandez-Cruz, A., 1990. Calcium diffusion modeling in a
spherical neuron: relevance of buffering properties. Biophys. J. 57 (2),
313–324.
Schneggenburger, R., Neher, E., 2000. Intracellular calcium dependence of
transmitter release rates at a fast central synapse. Nature 406 (6798),
889–893.
Sinha, S.R., Wu, L.G., Saggau, P., 1997. Presynaptic calcium dynamics
and transmitter release evoked by single action potentials at
mammalian central synapses. Biophys. J. 72 (2 Part 1), 637–651.
Suzuki, S., Osanai, M., Murase, M., Suzuki, N., Ito, K., Shirasaki, T.,
Narita, K., Ohnuma, K., Kuba, K., Kijima, H., 2000. Ca2þ dynamics
at the frog motor nerve terminal. Pfluegers Arch. Eur. J. Physiol. 440
(3), 351–365.
Suzuki, S., Osanai, M., Mitsumoto, N., Akita, T., Narita, K., Kijima, H.,
Kuba, K., 2002. Ca(2+)-dependent Ca(2+) clearance via mitochon-
drial uptake and plasmalemmal extrusion in frog motor nerve
terminals. J. Neurophys. 87 (4), 1816–1823.
Tanabe, N., Kijima, H., 1992. Ca(2+)-dependent and -independent
components of transmitter release at the frog neuromuscular junction.
J. Physiol. 455, 271–289.
Tang, Y., Schlumpberger, T., Kim, T., Lueker, M., Zucker, R.S., 2000.
Effects of mobile buffers on facilitation: experimental and computa-
tional studies. Biophys. J. 78 (6), 2735–2751.
Wells, B.S., Gan, J.B., Macleod, G.T., Lin, Y.Q., Bennett, M.R., 1998.
Calcium transients at different sites along single branches of
amphibian motor-nerve terminals during trains of impulses. Proc.
Aust. Neurosci. Soc. 9, 137.
Zengel, J.E., Magleby, K.L., 1982. Augmentation and facilitation of
transmitter release. J. Gen. Physiol. 80, 583–611.
Zucker, R.S., 1999. Calcium- and activity-dependent synaptic plasticity.
Curr. Opinion Neurobiol. 9 (3), 305–313.