Mechanisms of Acute Inflammatory Control by Phagocytes - ERA
434
Mechanisms of Acute Inflammatory Control by Phagocytes by Aja M. Rieger A thesis submitted in partial fulfillment of the requirements for the degree of Doctor of Philosophy in Physiology, Cell and Developmental Biology Department of Biological Sciences University of Alberta © Aja M. Rieger, 2014
-
Upload
khangminh22 -
Category
Documents
-
view
2 -
download
0
Transcript of Mechanisms of Acute Inflammatory Control by Phagocytes - ERA

Mechanisms of Acute Inflammatory Control by Phagocytes
by
Aja M. Rieger
A thesis submitted in partial fulfillment of the requirements for the degree of
Doctor of Philosophy
in
Physiology, Cell and Developmental Biology
Department of Biological Sciences University of Alberta
© Aja M. Rieger, 2014
Abstract
Phagocytosis is an important, evolutionarily conserved mechanism integral to
immune defense and homeostasis. Phagocytosis is initiated by the interaction of
receptors on the surface of phagocytes with ligands on large particles, generally
over 1 μm. Receptor ligation results in actin polymerization, which subsequently
leads to particle internalization. The main objective of my thesis research was to
characterize functional phagocytic responses at inflammatory sites, where various
responses are involved in the clearance of pathogens, dying or senescent cells, and
in tissue repair/ wound healing. While this balance is well understood in mammals,
much less is known in lower vertebrates.
In accordance with mammals, I found that differentiation along the
macrophage pathway resulted in increases in phagocytic capacity, with mature
macrophage having the greatest capacity. Interestingly, activation resulted in
differential regulation of phagocytosis in monocytes and mature macrophages.
Within these subsets there was also differential regulation of phagolysosome fusion
and the production of reactive oxygen species (ROS). The activation of specific
phagocytic responses at distinct stages of differentiation suggests that these
responses may allow specialization of host immunity requirements within
specialized niches.
When phagocytic responses to inflammatory or homeostatic responses were
studied, I found that teleost fish displayed divergent responses following
phagocytosis, which is consistent with observations in mice. However, I found
significant differences between these species with regards to the level of
responsiveness to zymosan and apoptotic bodies, the identity of infiltrating
leukocytes, their rate of infiltration, and the kinetics and strength of resulting
antimicrobial responses. The primary differences were noted in the neutrophilic
responses. Importantly, I found that activated murine, but not teleost, neutrophils
possess the capacity to internalize apoptotic cells, resulting in decreased neutrophil
ROS production. This may play an important part in the recently identified anti-
inflammatory activity that mammalian neutrophils display during the resolution
phase of inflammation.
Goldfish responses were partially regulated by soluble factors. However, no
changes were noted in canonical mammalian factors, leading to identification of a
novel role for a unique teleost receptor- soluble colony stimulating factor-1
receptor (sCSF-1R). Soluble CSF-1 receptor was originally described as a regulator
of macrophage proliferation. Soluble CSF-1R is highly upregulated following
interaction with apoptotic cells, resulting in reduced cellular infiltration,
phagocytosis, ROS production, expression of pro-inflammatory factors, and
downstream antimicrobial responses. The effects sCSF-1R mirrored several of
those induced by apoptotic cells, suggesting that sCSF-1R may be a central player
in the regulation of anti-inflammatory responses induced by apoptotic cells.
These observations were then applied to the study of an Aeromonas infection.
Aeromonas is a highly virulent fish pathogen with devastating effects on the fish
farming industry. It has been previously shown that increases in the production of
reactive intermediates by host immune cells cause significant cytotoxicity at the
infection site, but have limited protective effects against this catalase-producing
bacterium. I found that Aeromonas veronii infection promotes systemic expression
of sCSF-1R. However, unlike other pathogen models, sCSF-1R was unable to
inhibit inflammation at the A. veronii challenge site and had no impact on the
production of ROS in vitro or in vivo. Importantly though, I found that the
increased systemic expression of sCSF-1R in A. veronii infected fish appears to
decrease proliferative activity among cells in the hematopoietic compartment,
which is further coupled to a decrease in CSF-1 expression in kidney hematopoietic
tissues.
Overall, the data presented here places the CSF-1 system and its regulator
sCSF-1R at the center of both the induction and regulation of inflammation in
teleost fish, with the effects of this system impacting the macrophage-lineage cells
as well as the neutrophilic and potentially lymphocytic cells.
Preface
This thesis is an original work by Aja M. Rieger. The research project, of
which this thesis is a part, received research ethics approval from the University of
Alberta Research Ethics Board as part of an NSERC Discovery Grant entitled
"Comparative biology of phagocytic antimicrobial responses" awarded to Dr.
Daniel R. Barreda, held from 2008-2013 and 2013-2018:
1. Comparative biology of fish phagocytic antimicrobial responses;
Protocol # 706.
2. Comparative biology of phagocytic antimicrobial responses in mice;
Protocol # 760.
Some of the research conducted in this thesis was part of collaborations with
local and international groups, leading to publication. Details for each chapter are
outlined below:
Chapter 1: Portions of this chapter have been previously published in: Rieger
AM and Barreda DR. 2011. Antimicrobial mechanisms of fish leukocytes. Dev
Comp Immunol 35: 1238-45. And Rieger AM, Hanington PC, Belosevic M and
Barreda DR. 2014. Control of CSF-1 induced inflammation in teleost fish by a
soluble form of the CSF-1 receptor. Fish Shellfish Immunol pii: S1050-
4648(14)00105-3. For both manuscripts, I contributed to the design of the review,
manuscript composition, and figure design. P.C. Hanington contributed to a portion
of the manuscript composition. M. Belosevic contributed to manuscript editing.
D.R. Barreda was the supervisory author, and assisted in manuscripts composition
and editing.
Chapter 3: A version of this chapter has been previously published in: Rieger
AM, Hall BE and Barreda DR. 2010. Macrophage activation differentially
modulates particle binding, phagocytosis and downstream antimicrobial
mechanisms. Dev Comp Immunol 34: 1144-59. I was responsible for the
experimental design, data collection and analysis, and manuscript composition.
B.E. Hall (Amnis Corporation, part of EMD Millipore) assisted in design of
analysis templates and contributed to manuscript editing. D.R. Barreda was the
supervisory author, and assisted in experimental design and manuscript
composition.
Chapter 4: A version of this chapter has been previously published in: Rieger
AM, Konowalchuk JD, Grayfer L, Katzenback BA, Havixbeck JJ, Kiemele MD,
Belosevic M, Barreda DR. 2012. Fish and mammalian phagocytes differentially
regulate pro-inflammatory and homeostatic responses in vivo. PLoS One 7: e47070.
I was responsible for experimental design, data collection and analysis, and
manuscript composition. J.D. Konowalchuk assisted with data collection from
murine experiments. L. Grayfer assisted with Q-PCR experimental design. B.A.
Katzenback assisted with neutrophil identification and analysis. J.J. Havixbeck
assisted with manuscript editing. M.D. Kiemele assisted in flow cytometry
staining. M. Belosevic and D.R. Barreda were supervisory authors, and assisted in
experimental design and manuscript editing.
Chapters 5 and 6: Portions of these chapters has been previously published
in: Rieger AM, Konowalchuk JD, Havixbeck JJ, Robbins JS, Smith MK, Lund JM,
Barreda DR. 2013. A soluble form of the CSF-1 receptor contributes to the
inhibition of inflammation in a teleost fish. Dev Comp Immunol 39: 438-46. I was
responsible for experimental design, data collection and analysis, portions of the
manuscript composition, and manuscript editing. J.D. Konowalchuk and J.J.
Havixbeck were involved in data collection and manuscript editing. J.S. Robbins
was responsible for the generation of recombinant sCSF-1R. M.K. Smith assisted
in sample processing and manuscript editing. J.M. Lund provided preliminary data
that guided this line of research and assisted in manuscript editing. D.R. Barreda
was the supervisory author, and assisted in experimental design, manuscript
composition, and manuscript editing.
Chapter 8: A portion of this chapter has been previously published in: Rieger
AM, Hanington PC, Belosevic M and Barreda DR. 2014. Control of CSF-1
induced inflammation in teleost fish by a soluble form of the CSF-1 receptor. Fish
Shellfish Immunol pii: S1050-4648(14)00105-3. I contributed to the design of the
review, manuscript composition, and figure design. P.C. Hanington contributed to
a portion of the manuscript composition. M. Belosevic contributed to manuscript
editing. D.R. Barreda was the supervisory author, and assisted in manuscripts
composition and editing.
Appendix I: A version of this chapter has been previously published in:
Rieger AM, Hall BE, Luong Le T, Schang LM, Barreda DR. 2010. Conventional
apoptosis assays using propidium iodide generate a significant number of false
positives that prevent accurate assessment of cell death. J Immunol Methods 358:
81-92. And Rieger AM, Nelson KL, Konowalchuk JD, Barreda DR. 2011.
Modified AnnexinV/Propidium Iodide apoptosis assay for accurate assessment of
cell death. J Vis Exp 50: pii: 2597. I was responsible for experimental design, data
collection and analysis, video performance, and manuscript composition for both
papers. B.E. Hall (Amnis Corporation, part of EMD Millipore) assisted in design of
analysis templates and contributed to manuscript editing. T. Luong Le preformed
all viral infections. L.M. Schang assisted in experimental design of viral work and
participated in manuscript editing. K.L. Nelson assisted in compiling figures for the
JoVE publication and assisted in manuscript editing. J.D. Konowalchuk assisted in
data collection, manuscript editing, and video performance. D.R. Barreda was the
supervisory author for both papers, and assisted in experimental design and
manuscript editing.

Acknowledgements
This journey has been a fantastic and rewarding experience that would not
have been possible without the guidance, support, and encouragement of many
individuals. I appreciate everything you have done for me over the past 5 and a bit
years and would not be where I am today without you.
Firstly, I would like to thank my supervisor Dr. Dan Barreda. Dan, you have
provided me with excellent advice, suggestions, and opportunities, while allowing
me to grow as a scientist. Thank you for always being there to bounce ideas off of
and supporting (and funding) my research ideas, even when they sounded crazy at
the start. I have been spoiled in your lab and will be hard pressed to find another
lab with the same resources, mentorship, and atmosphere. It has truly been a
pleasure to work with you.
I would also like to thank my committee members, Dr. Mike (Miodrag)
Belosevic and Dr. Luis Schang. Your guidance, comments, and input have been
integral to the shaping of my research. I would also like to extend an extra thanks
to Mike for being like a co-supervisor, always being available for pop-ins from
across the hall or a beer at the Faculty Club. The science chats we have had
inspired me to be creative in my research and your curiosity and love of science is
truly infectious. I would also like to thank my defense and candidacy examination
members: Dr. Lisa Cameron, Dr. Christine Szymanski, Dr. Ben Willing, and Dr.
Jesús Lamas for thought-provoking and interesting discussions and challenging
questions. Finally, Dr. Allen Shostak, thank you for providing highly valuable
statistical advice.

To my lab mates throughout my degree: you kept it real! My Ph.D.
experience would not have been nearly as much fun without having you at my side.
A special thanks to Moira Kiemele, Matthew Smith, Jeffrey Konowalchuk, Jeffrey
Havixbeck, and Mike Wong, as well as to my colleagues from the center wing
gang- you’ve all been a pleasure to work closely with, talk science with, and for
being fantastic friends in and out of the lab. Thank you for making Bio Sci a
magical place.
I have also had the opportunity to collaborate with a number of scientists
throughout the course of my degree. Dr. J. Oriol Sunyer, Dr. David Parra, and Dr.
Fumio Takizawa (UPenn); Dr. Miki Nakao and Takahiro Nagasawa (Kyushu
University); Dr. John Chang and Joshua Pemberton (U of A); Dr. A. Dean Befus
and Dr. Tae Chul Moon (U of A); Dr. Mike Belosevic and Belosevic lab members
(Dr. Leon Grayfer, Dr. Barbara Katzenback, Dr. Fumihiko Katakura; U of A); Dr.
Luis Schang (U of A), you have all provided me with the opportunity to broaden
my research and understanding of other research areas.
Finally, to my family and friends, especially my parents, thank you for your
undying support and encouragement, for keeping me sane and levelheaded, and for
helping wherever possible. I’d like to give a special thank you to Keith Heslinga-
your engineering logic helped me to think outside of the box and inspired some
truly imaginative ideas and solutions throughout my degree, and your constant
cheer-leading pushed me to be the best scientist I could be. To Azalia and Quince-
your smiles make even the longest, most frustrating days better.
Table of Contents
Chapter 1: Introduction and Literature Review 1.1 Introduction 1
1.2 Objectives of thesis 3
1.2.1 Outline of thesis 3
1.3 Literature review 4 1.3.1 Introduction 4 1.3.2 Antimicrobial defense mechanisms of fish leukocytes 5
1.3.2.1 Intracellular mechanisms 8 1.3.2.1.1 Respiratory burst 8 1.3.2.1.2 Nitric oxide 12 1.3.2.1.3 Phagolysosome fusion 15
1.3.2.2 Extracellular mechanisms 16 1.3.2.2.1 Neutrophil degranulation and extracellular traps 16 1.3.2.2.2 Antimicrobial peptides 18
1.3.2.3 The phagocytes: neutrophils, monocytes, macrophages, and B cells 19
1.3.3 Phagocytes and the acute inflammatory response 21 1.3.3.1 Phase I: Resident macrophages recruit inflammatory
neutrophils 21 1.3.3.2 Phase II: Recruitment of classical monocytes 23 1.3.3.3 Phase III: Termination of neutrophil recruitment by
phagocyte signals 25 1.3.3.4 Phase IV: Return to homeostasis 28
1.3.4 Soluble mediators of acute inflammation and resolution 29 1.3.4.1 Chemokines 29
1.3.4.1.1 CCL-1 30 1.3.4.1.2 CXCL-8 (IL-8) 30
1.3.4.2 Pro-inflammatory mediators 32 1.3.4.2.1 TNF-α 32 1.3.4.2.2 IL-1β 34 1.3.4.2.3 IL-12 36 1.3.4.2.4 IFNγ 37 1.3.4.2.5 CSF-1 38
1.3.4.2.5.a Evolutionary conservation of CSF-1 and CSF-1R 40
1.3.4.2.5.b Control of CSF-1 activity 42 1.3.4.2.5.c Identification of soluble CSF-1 receptor
in teleost fish 44 1.3.4.2.5.d Molecular characterization of CSF-1-sCSF-1R
interactions 45
1.3.4.3 Anti-inflammatory/ resolution mediators 46 1.3.4.3.1 TGF-β 46 1.3.4.3.2 IL-10 48 1.3.4.3.3 Vascular endothelial growth factor (VEGF) 50 1.3.4.3.4 Suppressor of cytokine signaling 3 (SOCS3) 51
1.3.5 Aeromonas spp. 52 1.3.5.1 Aeromonas species: overview of genus 52 1.3.5.2 Aeromonas infections in fish 53
1.3.5.2.1 Transmission of Aeromonas 55 1.3.5.2.2 Identification of Aeromonas species 56 1.3.5.2.3 Control of Aeromonas infections in fish 57
1.3.5.3 Aeromonas in other organisms 58 1.3.5.4 Immune evasion and infection strategies of Aeromonas
species 60
1.4 Summary 62
1.5 References 65
Chapter 2: Materials and Methods 2.1 Animals 110
2.1.1 Fish 110 2.1.2 Mice 110
2.2 Fish serum 111 2.3 Generation of specific reagents 111
2.3.1 Macrophage activating factor (MAF) 111 2.3.2 Labeled zymosan particles 112
2.3.2.1 FITC 112 2.3.2.2 APC 112
2.3.3 Apoptotic cells 113 2.3.4 Recombinant sCSF-1R 113 2.3.5 Polyclonal anti-CSF-1R antibody 115
2.4 Pathogens and pathogen mimics 116
2.4.1 Aeromonas veronii 116 2.4.2 Aeromonas salmonicida A449 116 2.4.3 Zymosan 117 2.4.4 Lipopolysaccharide 117
2.5 Intraperitoneal injections 118
2.5.1 Zymosan 118 2.5.2 Apoptotic cells 118
2.5.3 Recombinant sCSF-1R 119 2.6 Isolation of primary fish cells 119
2.6.1 Primary kidney leukocytes 119 2.6.1.1 Mononuclear cells 120 2.6.1.2 Neutrophils 120
2.6.2 Peritoneal lavage 120
2.7 Fish primary cell culture 121 2.7.1 Culture media 121 2.7.2 Primary kidney macrophages 122
2.8 Fish cell lines 123
2.8.1 Catfish 3B11 cells 123
2.9 Isolation of primary mammalian cells 123 2.9.1 Peritoneal lavage 123 2.9.2 Splenocytes 123
2.10 Mammalian cell lines 124
2.10.1 Jurkat T cells 124 2.10.2 RAW 264.7 macrophages 124
2.11 Cytochemical staining 125
2.11.1 Hema3 125 2.11.2 Sudan Black 125
2.12 Flow cytometric staining 126
2.12.1 Antibody labeling 126 2.12.2 Flow cytometry-based fluorescent in situ hybridization 126
2.13 Cell bioassays 128
2.13.1 Phagocytosis 128 2.13.1.1 Light microscopy 128 2.13.1.2 Confocal fluorescent microscopy 128 2.13.1.3 Flow cytometry 129 2.13.1.4 ImageStream 129
2.13.2 Respiratory burst 130 2.13.3 Nitric oxide production 130 2.13.4 Phagolysosome fusion 131 2.13.5 Gentamicin protection assay 132 2.13.6 Arginase assay 132 2.13.7 Survivability assay 133 2.13.8 Trans-well assay 134 2.13.9 Cellular infiltration 135 2.13.10 Chemotaxis assay 135
2.13.11 In vivo BrdU proliferation assay 136
2.14 Quantitative PCR 137 2.14.1 RNA isolation 137
2.14.1.1 Trizol method 137 2.14.1.2 Qiagen RNeasy kit 138
2.14.2 cDNA synthesis 139 2.14.3 Primers 139 2.14.4 Quantitative PCR conditions 140
2.15 Detection of sCSF-1R transcripts 140
2.16 Detection of sCSF-1R protein 141 2.17 Analysis 141
2.18 References 158 Chapter 3: Goldfish macrophages possess potent phagocytic responses and antimicrobial defenses 3.1 Introduction 160
3.2 Results 162
3.2.1 Current methods have limitations for detecting phagocytosis 162
3.2.2 Multi-spectral imaging flow cytometry can help to overcome the limits of previous assays, while maintaining their strengths 164
3.2.3 RAW 264.7 macrophage activation preferentially enhances binding and not internalization of zymosan 166
3.2.4 Goldfish PKMs differentially upregulate phagocytosis in response to activation with host and pathogen derived factors 167
3.2.5 PKM mature macrophages and not monocytes display an increased capacity for the production of reactive oxygen species following activation 169
3.2.6 PKM monocytes and mature macrophages display a differential capacity for phagolysosome fusion under basal and immune challenged conditions 171
3.3 Discussion 175
3.4 References 193
Chapter 4: Goldfish phagocytes display divergent responses to pro-inflammatory and homeostatic stimuli in vivo 4.1 Introduction 198
4.2 Results 200
4.2.1 Teleost phagocytes reduce pro-inflammatory responses following apoptotic cell internalization 200
4.2.2 Zymosan differentially induces cellular infiltration in mice and teleost fish 203
4.2.3 Apoptotic cells differentially control cellular infiltration in mice and teleost fish 204
4.2.4 Apoptotic cells reduce teleost pro-inflammatory responses in vivo in a time dependent manner 206
4.2.5 Apoptotic cells reduce pro-inflammatory responses in mice to a lesser extent than in goldfish 206
4.2.6 Murine, but not teleost, neutrophils phagocytose apoptotic cells, which actively reduce pro-inflammatory ROS production in a contact dependent manner 207
4.3 Discussion 210
4.4 References 233 Chapter 5: Apoptotic cells induce expression of non-classical soluble factors in goldfish macrophages 5.1 Introduction 238
5.2 Results 241
5.2.1 Apoptotic cells contribute to the production of non-classical inhibitor(s) of macrophage antimicrobial responses by goldfish PKM 241
5.2.2 Apoptotic cells selectively induce expression of a soluble CSF-1R in goldfish macrophages in vitro 244
5.2.3 Soluble CSF-1R does not affect PKM viability, phagocytosis, nor production of reactive oxygen intermediates in resting macrophages 245
5.2.4 Apoptotic cells selectively induce up-regulation of goldfish sCSF-1R expression in vivo, which coincides with increased macrophage numbers at an inflammatory site 246
5.2.5 Expression of sCSF-1R throughout a time-course of acute inflammation correlates with CSF-1R expression and the presence of apoptotic cells 247
5.3 Discussion 248
5.4 References 258 Chapter 6: The soluble form of the CSF-1 receptor contributes to the inhibition of inflammation in a teleost fish 6.1 Introduction 262
6.2 Results 263
6.2.1 Soluble CSF-1R contributes to amelioration of goldfish leukocyte infiltration responses in vivo 263
6.2.2 Soluble CSF-1 receptor decreases pro-inflammatory phagocytic responses similarly to apoptotic cells 265
6.2.3 Cytokine expression is differentially affected by sCSF-1R and apoptotic cells 267
6.2.4 Soluble CSF-1R affects cytokine expression in a dose-dependent manner 269
6.2.5 Neutrophil chemotaxis but not ROS production is impacted by sCSF-1R 270
6.3 Discussion 271
6.4 References 288 Chapter 7: Aeromonas infections induce high levels of soluble CSF-1R expression and impact hematopoietic cell production 7.1 Introduction 292
7.2 Results 294
7.2.1 Isolates obtained from furuncles were typed by sequence analysis 294
7.2.2 Naturally infected goldfish have increased expression of sCSF-1R within the furuncle and peripheral tissues 295
7.2.3 Addition of sCSF-1R does not abrogate Aeromonas– induced inflammatory responses 296
7.2.4 Induced infection with Aeromonas veronii isolates
also results in increased sCSF-1R expression 297 7.2.5 Goldfish with natural or induced A. veronii
infection have significant reductions in proliferation within the hematopoietic compartment 298
7.3 Discussion 298
7.4 References 314 Chapter 8: General Discussion 8.1 Overview of findings 317
8.2 Evolution of inflammatory control mechanisms 322
8.2.1 Apoptotic cells vs. exosomes 327 8.3 Soluble CSF-1R and self-renewing macrophages: potential
for inflammatory control 329
8.4 Aeromonas-driven modulation of the inflammatory response: implications for host defense 331
8.5 Future directions 333
8.5.1 Neutrophil-driven inflammatory control in goldfish 333
8.5.2 Does sCSF-1R promote long-term survival of Aeromonas within host tissue? 334
8.5.3 Detection of sCSF-1R outside of teleosts 335 8.6 Relevance 336
8.6.1 To basic biology 336 8.6.2 To aquaculture 337 8.6.3 To medicine 337
8.7 Summary 337
8.8 References 342 Appendix I: Conventional apoptosis assays using propidium iodide generate a significant number of false positives that prevent accurate assessment of cell death
AI.1 Introduction 348 AI.2 Materials and Methods 351
AI.2.1 Animals 351 AI.2.2 Primary cells 351 AI.2.3 Cell lines 353 AI.2.4 Nuclear stains 353
AI.2.4.1 BrdU staining 353 AI.2.4.2 Propidium iodide staining 353 AI.2.4.3 DAPI staining 354 AI.2.4.4 DRAQ5 staining 354
AI.2.5 RNase treatment to remove false positive events 354 AI.2.6 Modified Annexin V/PI staining protocol to reduce
false positive events 354 AI.2.7 Viral infection 355 AI.2.8 Acquisition and analysis- ImageStream 356 AI.2.9 Acquisition and analysis- flow cytometry 357 AI.2.10 Statistics 357
AI.3 Results 357 AI.3.1 Propidium iodide stains outside of nuclear area
in fixed cells 357 AI.3.2 False positive PI staining is detected in both
unfixed primary cells and cell lines 359 AI.3.3 RNase removes false positive staining but only
in fixed cells 360 AI.3.4 Modified Annexin V/PI protocol significantly
reduces the number of false positive PI events 360 AI.3.5 Virus infection increase dsRNA content in cells
and is detected as cell death 362 AI.3.6 Modified protocol allows multivariate dissection
of cellular processes 363 AI.4 Discussion 364 AI.5 Protocol 368 AI.6 References 382 Appendix II: X-FISH: the use of RNA-based probes in flow cytometry for differentiating cellular populations based on RNA expression patterns
AII.1 Introduction 385 AII.2 Materials and Methods 386
AII.2.1 Animals 386 AII.2.2 Cell lines 387 AII.2.3 Goldfish primary kidney macrophage cultures 387 AII.2.4 cDNA synthesis 388 AII.2.5 PCR amplification of genes of interest and
cloning 388 AII.2.6 Identification of positive clones 389 AII.2.7 Probe synthesis 389 AII.2.8 Hybridization 389 AII.2.9 Detection and analysis 390 AII.2.10 Intracellular cytokine staining 391
AII.3 Results 391 AII.3.1 X-FISH detects specific RNA species within
the cytoplasm 391 AII.3.2 RNA probes match expression patterns of
antibody markers 393 AII.3.3 X-FISH can distinguish between cells in mixed
populations and measure changes in activation in each subpopulation 394
AII.4 Discussion 394 AII.5 Protocol 396 AII.6 References 406
List of Tables
Table 1.1. Mammalian Toll-like receptors and major ligands. Table 2.1. Composition of 10xPBS-/-. Table 2.2. Composition of carbonate buffer. Table 2.3. Composition of incomplete MGFL-15 media. Table 2.4. Composition of nucleic acid precursor solution. Table 2.5. Composition of 10x Hank’s Balanced Salt solution. Table 2.6. Composition of hybridization buffer. Table 2.7. Composition of SSC buffer. Table 2.8. Composition of 2x Laemlli buffer. Table 2.9. Primers used in cDNA synthesis. Table 2.10. Primers used in Aeromonas spp. detection Table 2.11. Primers used to design flow cytometry-based in situ hybridization probes. Table 2.12. Primers used in reverse transcriptase PCR for sCSF-1R expression. Table 2.13. Primers used in quantitative PCR analysis. -------------- Table AII.1. Primer sequences.
List of Figures
Figure 1.1. Roles of phagocytes in the acute inflammatory response. Figure 1.2. Known effects of CSF-1 and sCSF-1R on goldfish macrophage inflammatory responses. Figure 2.1. Serial dilutions of recombinant sCSF-1R. Figure 2.2. Aeromonas veronii growth curve. Figure 3.1. Current assays have caveats that limit accurate quantification of phagocytosis. Figure 3.2. Novel assay overcomes caveats from current methods by providing spatial resolution and high throughput quantification of phagocytosis. Figure 3.3. LPS activation increases surface binding, but not internalization, of zymosan particles. Figure 3.4. Monocytes and mature macrophages are the predominant phagocytic populations in mixed PKM cultures and differentially upregulate phagocytosis in response to activation. Figure 3.5. The kinetics of respiratory burst production in mixed PKM cultures parallels the increase in mature macrophage but not monocyte phagocytic responses. Figure 3.6. Evaluation of macrophage phagolysosome fusion using a novel imaging flow cytometry-based approach. Figure 3.7. Application of phagolysosome fusion evaluation approach to a comparative macrophage model system. Figure 3.8. Phagolysosome fusion follows the kinetics of phagocytosis. Figure 4.1. Cycloheximide primarily induces apoptosis in treated cells and can be effectively removed from apoptotic cell preparations. Figure 4.2. Two distinct sources of apoptotic cells repress goldfish macrophage respiratory burst to equivalent levels. Figure 4.3. Apoptotic cells significantly reduce inflammatory respiratory burst responses of goldfish primary macrophages.
Figure 4.4. Apoptotic cells do not induce nitric oxide responses. Figure 4.5. In vivo administration of zymosan induces a marked infiltration of leukocytes that is linked to high levels of respiratory burst. Figure 4.6. Gating strategy for cell subpopulations isolated from murine peritoneum. Figure 4.7. Characterization of goldfish peritoneal myeloid cells. Figure 4.8. Pro-inflammatory (zymosan) and homeostatic (apoptotic cells) stimuli differentially impact leukocyte infiltration profiles in goldfish and mice. Figure 4.9. In vivo administration of apoptotic cells leads to a more dramatic reduction of pro-inflammatory respiratory burst responses in teleost fish compared to mice. Figure 4.10. Goldfish myeloid cell respiratory burst responses are most affected by the presence of apoptotic cells. Figure 4.11. Mean fluorescence intensity of teleost and murine phagocytes. Figure 4.12. Murine neutrophil respiratory burst antimicrobial responses are most greatly affected by the presence of apoptotic cells. Figure 4.13. Apoptotic cells downregulate murine neutrophil ROS production in a contact dependent manner. Figure 5.1. Soluble factors regulate macrophage responses to apoptotic bodies. Figure 5.2. Characterization of soluble CSF-1R expression in goldfish primary kidney macrophages. Figure 5.3. Impact of recombinant sCSF-1R on resting goldfish primary macrophages. Figure 5.4. Impact of recombinant sCSF-1R on activated goldfish primary macrophages. Figure 5.5. Expression of soluble CSF-1R during an inflammatory response in vivo. Figure 5.6. Expression of soluble CSF-1R in vivo matches increases in apoptotic cell death. Figure 5.7. Cytokine gene expression kinetics during acute zymosan peritonitis.
Figure 6.1. Recombinant sCSF-1R but not recombinant EPO receptor affect inflammatory processes. Figure 6.2. Recombinant sCSF-1R affects inflammatory leukocyte infiltration in vivo. Figure 6.3. Soluble CSF-1R and apoptotic cells down-regulate pro-inflammatory phagocytic responses. Figure 6.4. Soluble CSF-1R does not shift macrophages towards an alternative pathway phenotype. Figure 6.5. Soluble CSF-1R dramatically decreases inflammatory cytokine expression. Figure 6.6. Both apoptotic cells and sCSF-1R have a limited impact on anti-inflammatory cytokine expression. Figure 6.7. Soluble CSF-1R has dose-dependent effects on important pro- and anti-inflammatory factors. Figure 6.8. Soluble products produced by macrophages in the presence of sCSF-1R affect neutrophil chemotaxis and killing capacity but not ROS production. Figure 6.9. Neutrophil chemotaxis is decreased by macrophage soluble factors produced in the presence of sCSF-1R. Figure 6.10. Neutrophil killing, but not ROS, responses are affected by soluble products produced by macrophages activated in the presence of sCSF-1R. Figure 7.1. Presentation of naturally occurring Aeromonas infection. Figure 7.2. Sequence analysis of isolated bacterial clones. Figure 7.3. Soluble CSF-1R expression is increased in furuncle and peripheral tissues. Figure 7.4. Soluble CSF-1R increases do not occur in a Mycobacterium marinum infection. Figure 7.5. Soluble CSF-1R does not reduce Aeromonas veronii-induced ROS production. Figure 7.6. Soluble CSF-1R does not reduce Aeromonas-induced cellular infiltration or ROS production in vivo.
Figure 7.7. Representative images of goldfish with induced Aeromonas veronii infection. Figure 7.8. Expression of sCSF-1R in the furuncle and kidney of goldfish with induced Aeromonas veronii infection. Figure 7.9. Aeromonas infection reduces proliferation within the kidney. Figure 8.1. Summary of roles of CSF-1 and sCSF-1R in homeostasis, inflammation and the resolution of inflammatory processes. Figure 8.2. Evolution of phagocyte control of inflammation following internalization of apoptotic cells. Figure 8.3. Phagocyte-driven control of inflammation by apoptotic cells. ---------------- Figure AI.1. Propidium iodide stains outside of the nuclear area. Figure AI.2. Classification of true and false positive propidium iodide staining patterns. Figure AI.3. Primary cells and cell lines exhibit false-positive PI staining. Figure AI.4. False PI stain is more readily detected in large cells with a nuclear: cytoplasmic ratio less than 0.5. Figure AI.5. RNase treatment decreases false positive PI stain on fixed cells but not in unfixed cells. Figure AI.6. Modified Annexin V/PI protocol significantly reduces false positive PI staining while not affecting Annexin V or nuclear PI staining. Figure AI.7. Modified protocol allows further analysis of apoptotic and necrotic populations. Figure AII.1. X-FISH detects RNA expression in the cytoplasm specifically and sensitively. Figure AII.2. X-FISH detects changes in cytokine expression following activation in specific cell subpopulations.
List of abbreviations
AC apoptotic cell Aero Aeromonas AMP antimicrobial peptides ANOVA analysis of variance AnxV Annexin V APC allophycocyanin ATP adenosine tri-phosphate AVG Aeromonas veronii group BrdU bromolated deoxyuridine triphosphate nucleotides cAMP cyclic adenosine mono-phosphate CCM cell-conditioned media CD cluster of differentiation cDNA complementary DNA CFU colony forming units ChK chemokinesis CHX cycloheximide CSF-1 colony stimulating factor-1 CSF-1R colony stimulating factor-1 receptor DAMPs damage-associated molecular patterns DAPI 4’,6-diamidino-2-phenylidole DC dendritic cell DHR dihydrorhodamine DMEM Dulbecco’s modified Eagle media DNA deoxyribonucleic acid dsRNA double stranded ribonucleic acid FACS fluorescence activated cell sorter FBS fetal calf serum FITC fluorescein isothiocyanate Flow-FISH flow cytometry-based fluorescence in situ hybridization G-CSF granulocyte colony stimulating factor G-CSFR granulocyte-colony stimulating factor receptor GM-CSF granulocyte-macrophage colony stimulating factor HBSS Hank’s balanced salt solution HG hybridization group HSP heat shock protein ICAM intracellular adhesion molecule ICE caspase-1/IL-1β converting enzyme IFN interferon
IL interleukin iNOS inducible nitric oxide synthase kDa kilo-Dalton LB Luria-Bertani LDL low density lipoprotein LPS lipopolysaccharide LTBP latent TGF binding protein M-CSF macrophage-colony stimulating factor MAPK mitogen-activated protein kinase MAF macrophage activating factors MGFL-15 modified goldfish Leibovitz-15 mRNA messenger ribonucleic acid NETs neutrophil extracellular traps NF-κΒ nuclear factor-κΒ NK natural killer NLRs Nod-like receptors NO nitric oxide PAMPs pathogen-associated molecular patterns PBS phosphate buffered saline PCR polymerase chain reaction PE phycoerythrin PG prostaglandin PI propidium iodide PKC protein kinase C PKM primary kidney macrophages PMA phorbol myristate acetate polyI:C polyinosinic:polycytidylic acid PRR pattern recognition receptor Q-PCR quantitative polymerase chain reaction RNA ribonucleic acid ROS reactive oxygen species rsCSF-1R recombinant soluble colony stimulating-1 receptor SAS saturated ammonium sulfate sCSF-1R soluble colony stimulating factor-1 receptor SOCS suppressor of cytokine signaling SSC saline sodium-citrate T3SS type III secretion system TACE TNF-α converting enzyme TGF transforming growth factor Th helper T cell

TLRs Toll-like receptors TMS tricaine methane sulfonate TNF tumor necrosis factor TSA tryptic soy agar TSB tryptic soy broth VCAM vascular cell adhesion molecule VEGF vascular endothelial growth factor VHSV viral haemorrhagic septicemia virus Zy zymosan

1
Chapter 1. Introduction and Literature Review1
1.1. Introduction
Since Metchnikoff’s seminal discovery of phagocytosis in 1882, phagocytes
have become widely appreciated for their critical role in immune defenses.
Phagocytic cells are found in all branches of the animal kingdom. Professional
phagocytes are integral to the maintenance of tissue homeostasis and turnover,
embryogenesis and organogenesis, recognition and clearance of pathogens,
initiation and resolution of inflammatory processes, and activation of immune cells
through the production of bioactive molecules and presentation of antigens.
The initiation and resolution of inflammation by phagocytes is central to both
wound healing and defense against pathogens. In mammalian immunology, it is
widely accepted that phagocytes, macrophages in particular, are capable of
internalizing pathogenic and homeostatic self particles, leading to induction of
divergent macrophage responses. Following internalization of pathogens,
phagocytes produce an array of inflammatory mediators that activate pro-
inflammatory immune processes. Internalization of pathogens also increases
Portions of this chapter have been previously published:
Rieger AM and Barreda DR. 2011. Antimicrobial mechanisms of fish leukocytes.
Dev Comp Immunol 35: 1238-45.
Rieger AM, Hanington PC, Belosevic M and Barreda DR. 2014. Control of CSF-1
induced inflammation in teleost fish by a soluble form of the CSF-1 receptor. Fish
Shellfish Immunol pii: S1050-4648(14)00105-3.
2
production of microbicidal products, which is integral to preventing pathogen
dissemination. Conversely, phagocytosis of homeostatic, self particles (eg.
apoptotic cells) results in activation of anti-inflammatory processes. This involves
changes in the types of soluble factors produced and, generally, a decrease in
phagocytic and microbicidal activities. Further, phagocytosis of apoptotic cells
induces a switch in macrophage activity, which is important to resolving
inflammatory processes and promoting wound healing. While this process is well
understood in mammalian models, little is known about responses in lower
vertebrates.
Non-classical immune models have been particularly important in informing
the evolution of immune responses and in identifying novel immune responses/
pathways/ molecules. This is highlighted by the discovery of phagocytosis in
starfish larva (Elie Metchnikoff; 1908 Nobel Prize in physiology or medicine), Toll
receptors in Drosophila (Jules Hoffman; 2011 Nobel Prize in physiology or
medicine), and phagocytic B cells in fish and amphibians. All of these discoveries
lead to the identification of these novel activities in mammalian immune defenses.
In my thesis, I employ a comparative approach to dissecting roles of phagocytes in
the initiation and resolution of inflammation. Teleosts (bony fish) are one of the
earliest vertebrate classes that possess functional innate and adaptive immune
components similar to those found in mammals. Teleosts are part of an large
family, containing over 30,000 identified species. Most teleost immune studies,
however, have focused on gene identification and expression. Using a goldfish
model system, my thesis work focused on the characterization of the functional
3
responses of phagocytes and their antimicrobial defenses in the initiation and
resolution of inflammatory processes.
1.2. Objectives of thesis
The main objective of my thesis research was to characterize functional
phagocyte responses that occur at inflammatory sites, where various responses are
involved in the clearance of pathogens, dying or senescent cells, and in tissue
repair/ wound healing. The specific aims of my research were (1) investigate the
responses of goldfish and murine phagocytes to pathogenic vs. homeostatic stimuli;
(2) characterize the contributions of sCSF-1R as a homeostatic stimulus; and (3)
elucidate the role of sCSF-1R in an in vivo model of Aeromonas veronii infection.
1.2.1. Outline of thesis
This thesis is comprised of 8 chapters. The first chapter is a literature review
focusing on the antimicrobial defenses of phagocytes and the roles these have in an
inflammatory response. Specifically, this chapter will outline important steps of an
acute inflammatory response (from induction to resolution) and the roles of
phagocytes in the various stages. Chapter 2 provides detailed descriptions of the
methodologies employed throughout this thesis. In Chapter 3, I examine the
phagocytic responses of teleost macrophages to pathogenic stimuli and the impact
on the induction of antimicrobial defenses. Chapter 4 describes the responses of
goldfish and murine phagocytes (macrophages and neutrophils) to pathogenic and
homeostatic stimuli in vivo. Chapter 5 identifies soluble colony stimulating factor-1
4
receptor (sCSF-1R) as a potential soluble homeostatic mediator in goldfish and
examines expression of this receptor. In Chapter 6, I investigate the role of sCSF-
1R in regulating acute inflammatory responses in vivo. Chapter 7 examines in
importance of sCSF-1R in the context of an Aeromonas veronii infection. Finally,
in Chapter 8, I provide an overview of my findings and describe a model of
inflammatory control in bony fish. This chapter also suggests future directions for
this work and describes the relevance of my findings.
1.3. Literature review: The role of phagocytes in the induction
and resolution of acute inflammatory responses
1.3.1. Introduction
Inflammation is a tightly regulated process that occurs following tissue injury
or pathogenic insult. It is a complex biological process involved in the repair of
damaged tissue or clearing infection. The end goal of inflammation is the
restoration of tissue homeostasis. The classical signs of acute inflammation are
redness, heat, swelling, pain, and loss of function.
A hallmark of inflammation is the clustering of monocytes, macrophages,
neutrophils, and dendritic cells at inflammatory foci, initiated by the production of
inflammatory cytokines and chemokines (1). These foci maintain immune cells in
close contact and promote the crosstalk necessary for tight regulation and
integration of immune responses. Within these foci, antimicrobial products are
important mediators of immune cell function and contribute to the promotion and
resolution of inflammation at distinct stages of the antimicrobial response.
5
Antimicrobial responses are critical components of the innate immune system.
Many of these responses are conserved through evolution, pointing to the
importance of these responses in providing protection against infection and in
limiting dissemination of pathogens. The phagocytic leukocytes in fish are armed
with an array of intracellular and extracellular antimicrobial defenses that are
generally induced by the internalization of pathogens or by the presence of pro-
inflammatory immune products or pathogen products and provide protection
against diverse pathogens. Further, products of antimicrobial responses are also
integral in shaping protective immune responses and in resolution of inflammatory
processes through their concentration dependent, divergent effects on immune
cells.
1.3.2. Antimicrobial defense mechanisms of fish leukocytes
The innate immune system provides a critical first line of defense against
invading pathogens. Multi-parametric recognition of pathogen associated
molecular patterns (PAMPs) based on well-established receptor families (e.g.
TLRs, NLRs) effectively defines microbial intruders and ultimately leads to
activation of cell armamentarium designed to kill infiltrating pathogens.
Antimicrobial responses are tailored to the type of pathogen, as well as to the
location of the pathogen (internalized or external to the cell). Because of their
potency and efficiency, these primordial immune defenses have been largely
conserved through evolution. For lower vertebrate species like the teleost fish,
these innate antimicrobial responses are particularly critical for host survival in
6
light of the reduced repertoire of classical adaptive responses compared to those of
mammalian species.
Antimicrobial defenses can be divided into two main categories: intracellular
and extracellular. Intracellular defense mechanisms are designed to provide
protection against pathogens found within membrane-enclosed structures. These
defenses are not limited to killing pathogens that have been internalized (e.g.
though phagocytosis), but also provide protection against pathogens that actively
enter immune cells as a mechanism of protection from humoral defense
mechanisms. In the following section, I highlight the role of mechanisms based on
superoxide and nitric oxide production, as well as phagolysosome fusion for the
effective establishment of a toxic degradative environment within teleost fish
leukocytes. These soluble products are efficient antimicrobial agents, but their
modes of action are generally non-specific (2-4). As such, they can be highly toxic
to host cells as well. Targeted production and release of these antimicrobial
molecules into membrane-enclosed structures ensures reduced damage to host
phagocytes, while also sequestering the pathogen within a specialized degradative
environment.
Extracellular defense mechanisms provide complementary strategies to those
described above. Extracellular defenses are targeted towards pathogens within the
extracellular space, providing a means for the innate immune system to effectively
clear pathogens that have escaped internalization or those that are too large to be
internalized. These responses are generally activated by the presence of microbial
products or inflammatory mediators and result in the release of antimicrobial

7
factors into the extracellular space. While reactive oxygen and nitrogen
intermediates can also be produced extracellularly and thus be considered
extracellular defense mechanisms, this chapter will focus on the antimicrobial
contributions provided by degranulation of neutrophilic granules, formation of
neutrophil extracellular traps, and antimicrobial peptides as representative
strategies for the effective defenses against extracellular pathogens. Unlike
intracellular defenses, products in neutrophilic granules and antimicrobial peptides
are more specifically targeted towards microorganisms and cause little damage to
healthy host cells (5, 6).
The mechanisms and effectiveness of teleost cellular responses against
microbial challenge are well documented for classical professional phagocytes such
as monocytes, macrophages, and neutrophils. These provide clear examples of the
potent intracellular (7-9) and extracellular (10-13) antimicrobial strategies available
to the teleost host. There is also increasing evidence that non-classical cells such
as B-lymphocytes may fill important roles in early teleost antimicrobial defenses. B
cells have recently been described to be phagocytic and to effectively mediate
killing of phagocytosed bacteria (14-16). Furthermore, phagocytic B cells appear to
represent a significant proportion of the phagocytic blood leukocytes in trout,
suggesting significant contributions for phagocytic B cells in teleost host defense
(14). It remains unclear whether the presence of phagocytic B cells reflects a
requirement for specialization from a lower vertebrate group that relies heavily on
innate defense mechanisms for pathogen clearance. Alternatively, this may point to
8
novel innate mechanisms that have remained conserved within specialized niches
in higher vertebrates (17).
1.3.2.1. Intracellular mechanisms
1.3.2.1.1. Respiratory burst
The respiratory burst was first described in mammalian leukocytes in the
1930’s when it was noted that phagocytosis was associated with increased oxygen
consumption (18). It was subsequently found that this increased oxygen
consumption- or respiratory burst- resulted in the formation of superoxide anion
(19) and that this process was catalyzed by NADPH-oxidase, a multi-component
enzyme that assembled on the inner surface of the plasma membrane following
appropriate activation (20). In mammalian phagocytes, the NADPH-oxidase
consists of the catalytic membrane-associated flavocytochrome b588, which is a
heterodimer gp91phox (also known as Nox2; phox for phagocyte oxidase) and
p22phox (21, 22). The remaining three components of NADPH-oxidase – p40phox,
p47phox, and p67phox remain complexed in the cytosol until appropriate stimulation
is received (22), thereby providing an important control strategy for NADPH-
oxidase activation in resting cells.
Phagocyte NADPH-oxidase has only begun to be characterized in teleost
fish. Cloning, sequencing and phylogenetic analysis NADPH-oxidase has been
described in several teleost fish species, including rainbow trout (23), Japanese
pufferfish (24), carp (25), Atlantic salmon (26), zebrafish, medaka, and pufferfish
(27, 28). Phylogenetic analysis indicates that the radiation of NADPH-oxidase
9
components occurred in a common teleost/ mammalian ancestor (25) and have
evolved separately, leading to a clustering of all fish components separate from
mammals (26).
Although the evolutionary divergence observed for NADPH-oxidase has led
to a relatively low sequence homology between fish and mammals, the functional
domains remain highly homologous (23-26). Fish phox subunits contain all
essential interaction and activation domains required for correct assembly and
function of the mammalian NADPH-oxidase complex, as well as the motifs
required for the production of reactive oxygen intermediates (ROI) (23-25).
Importantly, fish NADPH-oxidase components have been shown to have a similar
expression pattern to that of mammals, suggesting that fish and mammal NADPH-
oxidase may have similar modes of activation and functional activities (24-26).
Recent studies on the functional induction of the respiratory burst response
suggest an important role for inflammatory cytokines (7, 29). These include
inflammatory cytokines such as tumor necrosis factor (TNF) α-1 and -2 (30, 31),
interferon (IFN) γ (32-35), colony stimulating factor-1 (CSF-1) (36) and
interleukin (IL)-8 (37). Interestingly, recent reports suggest that in some teleost fish
TNF-α does not directly activate phagocytes but instead activates endothelial cells,
leading to an indirect activation of phagocytes (38, 39). For example, direct
stimulation of gilthead seabream (39) or carp (38) phagocytes with either TNF-α 1
or 2 fails to induce the respiratory burst.
Respiratory burst responses in fish can also be strongly activated by PAMPs.
Most of these studies have focused on LPS, which has been shown to induce
10
respiratory burst in goldfish (7, 40), rainbow trout (23, 41), Atlantic salmon, and
gilthead seabream (42). Other PAMPs that have been shown to induce respiratory
burst, including CpG ODN in gilthead seabream (42, 43), poly I:C in rainbow trout
(23), flagellin in gilthead seabream (42), MDP in gilthead seabream (42) and β-
glucans including zymosan in rainbow trout (23) and Saccharomyces cerevisiae in
gilthead seabream (8). Important pathogens of teleost fish have also been shown to
induce potent respiratory burst responses, including Aeromonas spp. in goldfish
(44) and carp (45), and Vibrio anguillarum in gilthead seabream (46) infections.
Following stimulation, NADPH-oxidase is activated through three sequential steps:
[1.] activation of protein kinase C (PKC), [2.] phosphorylation of p47phox, which
likely results in its translocation to the cell membrane, and [3.] the production of
reactive oxygen intermediates by NADPH-oxidase (26). While activation pathways
are conserved across teleost fish species, the kinetics and strength of respiratory
burst show differences across those fish species studied. For example, a report by
Nikoskelainen et al. (2006) (47) showed that the magnitude of respiratory burst in
Atlantic cod blood leukocytes following activation with opsonized or non-
opsonized zymosan was at least double that of rainbow trout blood cells, and has
faster induction kinetics. Another study that compared respiratory burst responses
of carp and ayu neutrophils found that ayu neutrophils spontaneously activated
respiratory burst that was not further enhanced by priming (48). In contrast, carp
neutrophils displayed low levels of respiratory burst in resting cells that was
enhanced in the presence of inflammatory stimuli (48). Despite a high level of
conservation in NADPH-oxidase components and similarities in the stimulatory
11
factors that induce this response cross teleost fish, disparate responses exist. It will
be interesting to determine if these observations point to divergent responses
between various fish species and reflect a differential dependence on this
mechanism for host defenses. Alternatively, these observations may highlight a
differential level of responsiveness across fish that is partially driven through the
specific requirements and challenges that face each species within its chosen
ecological niche.
Significant heterogeneity can also be observed across leukocyte populations
within a single fish species. Recent work has examined the activation of respiratory
burst in goldfish primary kidney macrophage (PKM) cultures (7, 29). These in
vitro derived cells have been previously shown to contain three distinct
subpopulations that correspond to progressively more differentiated stages across
the macrophage lineage (early progenitors, monocytes and mature macrophages)
(7, 29). Interestingly, these three cellular subpopulations have distinct kinetics in
the priming of respiratory burst reflecting potential differences in the intrinsic
regulatory mechanisms among these cell types (7, 29). Early progenitors in sorted
and mixed populations showed a limited capacity for respiratory burst response
that was not affected by activation. In contrast, monocytes have an early induction
of respiratory burst that was not maintained with prolonged activation with
MAF/LPS. TNF-α-2 appears to be a key factor in activating respiratory burst in
PKM monocytes populations (31). In contrast to PKM monocytes, PKM mature
macrophages have a low early induction of respiratory burst that is greatly
enhanced by prolonged activation. Interestingly, in the mature macrophage
12
populations but not the monocyte population, the kinetics of respiratory burst
induction parallel the kinetics of phagocytosis. This suggests that in goldfish PKM,
similar to mammalian monocytes and macrophages (49-52), phagocytosis and
respiratory burst may be complementary but not interdependent antimicrobial
mechanisms. Further demonstration of the heterogeneity of respiratory burst
responses within a single species comes from zebrafish studies. Production of
reactive oxygen species in zebrafish leukocytes was found to vary significantly
throughout the day, with the highest levels being produced at dawn, suggesting that
respiratory burst in zebrafish may be at least partially regulated by circadian
rhythms (53). Thus, much remains to be defined, despite our improved
understanding of respiratory burst responses in teleost fish in recent years. In light
of the available results, it will be particularly interesting to go beyond the intrinsic
mechanisms that regulate these responses at the cellular level, and assess the
differential cross-talk that exists between respiratory burst mechanisms and other
antimicrobial host responses across distinct cellular niches.
1.3.2.1.2. Nitric oxide
Nitric oxide (NO) is an important molecule involved in diverse
physiological processes, including vasorelaxation, neuronal communications,
inhibition of cell proliferation, and intracellular signaling. NO also has potent toxic
effects and, as such, is an important component of the arsenal available to animal
hosts for effective antimicrobial defenses. NO is formed by the oxidation of l-
arginine to l-citrulline by NO synthase (NOS) (54). Three forms of NOS have been
13
identified in mammals: neuronal (nNOS), endothelial (eNOS) and inducible
(iNOS) (55). Of these three, only iNOS has been shown to be involved in immune
defense.
Within fishes, iNOS was first identified in the goldfish (56) and has been
further characterized in carp (57) and rainbow trout (58). iNOS sequences have
also been identified in zebrafish (59), small spotted catshark (60), and scup (61).
The identified carp iNOS protein has 57% similarity with human iNOS and
contains putative binding sites for heme, tetrahydobiopterin calmodulin, flavine
mononucleotide, flavine adenine dinucleotide and NADPH, all of which represent
important sites in mammalian iNOS (57). In addition to iNOS gene expression, its
activity has been demonstrated in teleost phagocytes, including heterophillic
granulocytes, neutrophils and macrophages (57, 62).
Induction of teleost iNOS transcription appears to involve NF-κB (57) and,
similar to mammalian iNOS, is induced mainly after stimuli with cytokines or
PAMPs. iNOS transcription is only induced in activated cells and results in the
production of NO. Studies in goldfish, carp and turbot have identified IFN-γ, TNF-
α, CSF-1, and the IL-6 family member M17 as the major pro-inflammatory
cytokines inducing iNOS expression and contributing to NO production (30-32, 35,
36, 63-66). Many of these cytokines synergize with LPS to induce high levels of
NO. However, as noted previously, the effects of some cytokines may be indirect,
as studies in carp have shown that TNF-α does not induce nitric oxide production
in carp head kidney leukocytes but again activates epithelial cells (38).
In addition to inflammatory cytokines, modified transferrin, a non-cytokine
14
serum protein, also potently induces NO responses in macrophages. Modified
transferrin or transferrin-like proteins have been identified in many species and
may constitute a highly conserved pathway for activating NO responses (67).
Furthermore, transferrin and transferrin-derived synthetic proteins have been
shown to induce highly conserved responses in murine and fish macrophages,
pointing to an important conserved antimicrobial role of modified transferrin in
both lower and higher vertebrates (68, 69). Full-length transferrin does not appear
to be immunologically active and must be cleaved in order to induce NO responses
in fish (67). Transferrin is cleaved by enzymes, such as elastase, released from
cellular damage and/or necrosis at the inflammatory site, resulting in a truncated
transferrin that significantly enhances the ability of macrophages to produce NO in
response to pathogens or pathogen products (70). In several fish species, including
salmon (71), goldfish, (72) and carp (73), several transferrin variants are expressed
that may have differential abilities to induce NO production (74). These results,
combined with earlier observations, suggest that polymorphisms in transferrin may
be linked to resistance against pathogens.
Nitric oxide has been shown to have potent antimicrobial effects against a
number of relevant fish pathogens (75-77). For example, nitric oxide was found to
significantly impact the replication of viral haemorrhagic septicemia virus (VHSV)
when examined in vitro using a turbot fibroblast cell line (TV-1) and kidney
macrophages (75). However, similar to products from respiratory burst responses,
NO is not specifically targeted to microorganisms and also has the potential to be
toxic to host tissues in high concentrations. Because of this, the production of NO
15
must be tightly regulated. One of the primary mechanisms for controlling NO
production is through the production of anti-inflammatory cytokines such as
transforming growth factor (TGF)-β (78). Recent work has also shown that
increased cyclic AMP (cAMP) levels leads to reduced NO production (79, 80),
pointing to an important role of this second messenger in modulating fish
antimicrobial responses. The antioxidant glutathione has also been shown to play a
protective role against nitrosative stress, especially in carp phagocytes that contain
higher levels of glutathione compared to other peripheral blood leukocytes (81). In
addition, carp neutrophils have been shown to upregulate gene expression of the
enzymes involved in the glutathione redox cycle following stimulation with LPS,
which results in further protection against the detrimental effects of NO products
following immune challenge (81).
1.3.2.1.3. Phagolysosome fusion
Phagolysosome fusion is a critical component for the degradation of
phagocytosed microorganisms (82). Following internalization, lysosomes migrate
towards and fuse with the phagosome resulting in the release of acidic and
enzymatic lysosomal contents into the phagosome and subsequent degradation of
phagolysosome contents. Phagolysosome fusion has been shown to occur in
rainbow trout B cells, (14) as well as in goldfish monocytes and mature
macrophages (7). I have recently reported that both monocytes and mature
macrophages acquire the capacity for phagolysosome fusion that parallels their
capacity for phagocytosis (7). Importantly, although I found increased
16
phagolysosome fusion in activated monocytes/macrophages, I observed a direct
correlation between these phagocytosis and phagolysosome fusion processes. In
other words, within cellular groups mediating phagocytosis there was no relative
increase in phagolysosome fusion as a result of cellular activation (7).
Interestingly, monocytes displayed a greater capacity for phagolysosome fusion
compared to mature macrophages (7). It is possible that terminal differentiation
into macrophages leads to a decreased intracellular degradative capacity that allows
for increased efficiency during antigen presentation events. This would be
consistent with observations on mammalian dendritic cells, which have a decreased
capacity for lysosomal proteolysis but an increased ability for antigen presentation
following maturation (83).
1.3.2.2. Extracellular mechanisms
1.3.2.2.1. Neutrophil degranulation and extracellular traps
As one of the first cells at sites of inflammation, neutrophils are armed with
a wide arsenal of intracellular and extracellular antimicrobial tools that are integral
to the early defenses against pathogens. Of all the phagocytic leukocytes, they
possess the greatest repertoire of extracellular antimicrobial mechanisms and, as
such, highlight the important contributions of extracellular mechanisms to host
defenses.
One of the primary extracellular defense mechanisms of neutrophils is the
targeted degranulation of cytoplasmic granules containing preformed mediators.
Mammalian neutrophilic granules have been shown to contain a variety of
17
antimicrobial products that include enzymes such as myeloperoxidase, acidic
hydrolases, metalloproteinase, proteinase-3, cathepsin G and elastase, and
antimicrobial peptides such as lactoferrin and cathlicidin (5). While granular
contents of teleost neutrophils have not been as thoroughly described, an assay has
been recently developed to quantitate myeloperoxidase degranulation in fish
neutrophils (84). Using this assay, teleost neutrophils have been shown to
degranulate in response to various mitogens, zymosan, and Aeromonas
salmonicida (12, 44, 84). These responses are not affected by the presence of
cytochalasin B suggesting that potent degranulation does not require prior
phagocytic events. Though protein analysis and functional studies are only starting
to dissect these mechanisms, teleost fish have been shown to express homologues
of proteinase-3, cathepsin G, elastase and azurocidin, suggesting that teleost
neutrophils possess the potential to produce these classical granule contents (85).
However, more work must be done to confirm that these enzymes are expressed at
the protein level within the neutrophil granules, to confirm that these enzymes are
functional, and to determine their relative contributions to the effector mechanisms
mounted against invading pathogens.
Degranulation in mammalian neutrophils has recently been shown to also
result in the release of chromatin, and is associated with the formation of
extracellular fibers that trap bacteria (86). These mammalian neutrophil
extracellular traps, or NETs, bind microorganisms, degrade virulence factors,
prevent dissemination and kill bacteria by maintaining a high local concentration of
antimicrobial granule components (86). The production of NETs by teleost
18
neutrophils has been recently described in both zebrafish and fathead minnows (10,
87). Similar to mammalian NETs, fish NETs are composed of neutrophil granule
proteins associated with DNA fibers, but not cytoskeleton (10, 86, 87). However,
much remains to be learned about the contribution of different neutrophilic granule
classes to the composition of teleost NETs, as well as the ability of these NETs to
prevent pathogen spread, to contain the diffusion of potentially tissue damaging
factors, and to kill invading microorganisms.
1.3.2.2.2. Antimicrobial peptides
Antimicrobial peptides (AMPs) are an important innate immune defense
because of their broad-spectrum antimicrobial activity (88). AMPs are one of the
most primordial antimicrobial defense mechanisms, having been isolated from
microorganisms, insects and other invertebrates, plants, amphibians, birds, fish,
and mammals (89). Teleost fish express a number of AMPs in tissues that are
important for immune defenses including kidney, spleen, intestine, gills, skin and
epidermal mucous, blood, reproductive organs, and eyes. The recent identification
of AMP expression in professional phagocytes and other leukocytes is of particular
interest (11, 13). Head kidney primary leukocytes from rainbow trout, for example,
express beta-defensins omDB-1 and omDB-3 following stimulation with poly I:C
(90), suggesting a role for beta-defensins in leukocyte antimicrobial defenses.
Further, two potent AMPs, hepcidin and piscidin, were found to be highly
expressed in acidophilic granulocytes (functionally equivalent to neutrophils) but
not monocytes/macrophages or lymphocytes of gilthead seabream (11, 13).
19
Expression of AMPs by granulocytes is upregulated after treatment with mitogens,
PAMPs or particulate antigens both in vitro and in vivo (11), suggesting that
neutrophil activation also increases antimicrobial killing potential through AMP
production. Intriguingly, it appears that piscidins may play a role in both
intracellular and extracellular killing of bacteria as piscidins are also delivered to
bacteria-containing phagosomes (13). Though relatively little work has been done
in this area, it appears that immune cell expression of AMPs may represent an
important innate antimicrobial defense in teleost fish.
1.3.2.3. The phagocytes: neutrophils, monocytes, macrophages, and B cells
Neutrophils are one of the first cell types to arrive in inflammatory sites and
are a critical component of teleost innate immune defenses. Neutrophils are armed
with an impressive antimicrobial armamentarium that looks to limit dissemination
of a broad range of pathogens. They also display a broad repertoire of intracellular
and extracellular antimicrobial defenses. Interestingly, many antimicrobial
mechanisms of fish neutrophils are utilized both as intracellular and extracellular
defenses. A prime example is the strong respiratory burst (25, 91) and nitric oxide
(12, 92) responses of teleost neutrophils. Unlike the predominantly intracellular
responses in macrophages, ROS and NO responses in neutrophils can occur
potently both intracellularly and extracellularly (12, 93), providing protection
against both phagocytosed and extracellular pathogens. Another example of
overlapping intracellular and extracellular defenses lies in the antimicrobial and
cytotoxic substances stored in neutrophilic granules (5, 11, 13). Granular contents
20
can either be degranulated into the extracellular space, as described above, or
released within the phagosome, where they exert potent antimicrobial actions. The
dual roles of neutrophil antimicrobial mechanisms provide neutrophils with potent
killing capabilities against a wide range of pathogens, both intracellular and
extracellular, without requiring numerous distinct mechanisms.
Monocytes/ macrophages of teleost fish are highly phagocytic cells and, as
such, possess potent intracellular antimicrobial defenses. Both cell types have been
shown to be variably capable of producing reactive oxygen and nitrogen
intermediates and phagolysosome fusion, and appear to rely on distinct
antimicrobial defenses. Monocytes have been shown to have a relatively short
respiratory burst response following activation (7, 29) and lack a nitric oxide
response (29), which may be compensated for by having greater capacity of
phagolysosome fusion than do macrophages (7). This is unlike mature
macrophages, which have a prolonged respiratory burst (7, 29) and potent nitric
oxide responses (40, 64, 65) following activation, but a more limited capacity for
phagolysosome fusion. Based on this, it appears that macrophages may rely
predominantly on ROS and NO for antimicrobial defenses, while monocytes may
kill predominantly through phagolysosome fusion. These differences may reflect
segregation of function between monocytes and macrophages in immune defense
(antigen presentation vs. pathogen killing) or differences in developmental stage.
These differences may also make monocytes and macrophages variably susceptible
to pathogen infection/ escape and may lead to preferential targeting of one cellular
subset by pathogens.
21
B cells are the most recently described phagocytic cells in teleost fish and,
consequently, relatively little work has been done on antimicrobial defenses of B
cells. However, it is evident that B cells phagocytosis leads to phagolysosome
fusion and results in killing of phagocytosed microorganisms (14). Additional work
is needed to characterize downstream antimicrobial responses in these potentially
central contributors to fish innate antimicrobial defenses.
1.3.3. Phagocytes and acute inflammatory responses
This section of the literature review will focus on our current understanding
of inflammatory processes in mammalian systems. This is overviewed in Figure
1.1. These processes in fish will be discussed in the data chapters of this thesis.
1.3.3.1. Phase I: Resident macrophages recruit inflammatory neutrophils
The initiation of inflammatory responses starts with the recognition of
molecular alarm signals that are generated by tissue damage or pathogens being
recognized by antigen presenting cells such as resident tissue macrophages and
dendritic cells. These signals include damage-associated molecular patterns
(DAMPs) and pathogen-associated molecular patterns (PAMPs) (94-98). Tissue
damage and/or infection generally cause disruption of cell membranes or necrotic
cell death, leading to release of intracellular components= the DAMPs (99).
Common DAMPs include HMGB1 (100-104), DNA/ chromatin/ nucleosomes
(105-108), heat shock proteins (109-113), and adenosine and ATP (114-118).
DAMPs can also be generated by the breakdown of extracellular components
caused by the release of intracellular proteases and hydrolases. Similar to the
22
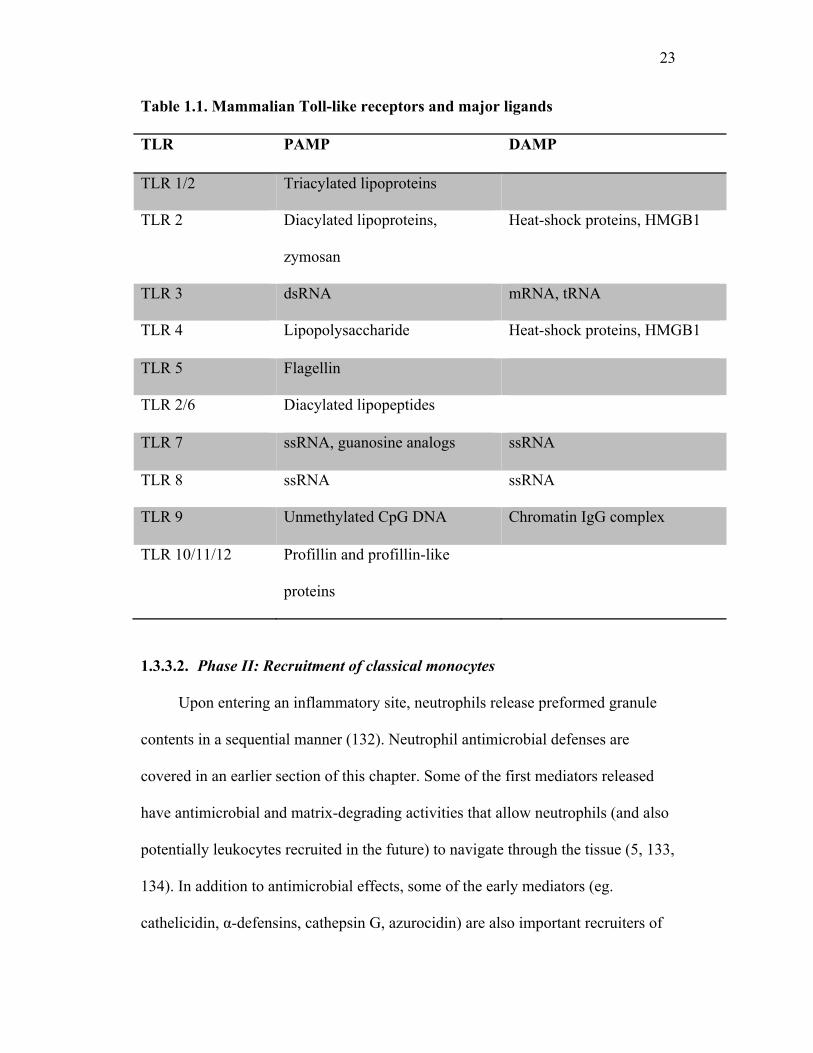
recognition of PAMPs, DAMPs are recognized by pattern recognition receptors
such as Toll-like receptors (TLRs; see inserted Table 1.1 below) (99, 119-121).
These signals are received by patrolling, steady-state non-classical monocytes,
found on the luminal side of the endothelium (122), resulting in a rapid entry into
the damaged site. It is thought currently that these cells are important for the
subsequent initiation of the inflammatory cascade, as their entry into the site
coincides with an increase in their expression of antimicrobial peptides, pattern
recognition receptors, scavenger receptors, antigen presentation receptors,
cytokines, and chemokines, all important components of pathogen/injury detection
and immune activation (123). DAMP, PAMP, and monocyte-derived signals also
activate the resident tissue macrophages.
Activation of resident macrophages and patrolling monocytes results in the
production of an array of neutrophil-recruiting chemokines, importantly CXCL1,
CXCL2, CXCL5, and CXCL8 (124-128). Interestingly, macrophage production of
chemokines can also be induced by the presence of ROS, in the absence of any
receptor ligation (129). This may be an important signal for macrophages that there
is currently tissue injury/ pathogenic insult that they have not yet detected by
pattern recognition receptors. Neutrophils are also strongly chemotactic to other
agents such as complement component C5a, leukotriene B4, and platelet activating
factor, largely derived from tissue resident cells (130). Adhesion and entry of
neutrophils into the inflammatory site is dependent on endothelial expression of P-
selectin, intercellular adhesion molecule 1 (ICAM1) and ICAM2 (131). These
receptors are bound by CD11b-CD18 expressed by neutrophils (131).
23
Table 1.1. Mammalian Toll-like receptors and major ligands
TLR PAMP DAMP
TLR 1/2 Triacylated lipoproteins
TLR 2 Diacylated lipoproteins,
zymosan
Heat-shock proteins, HMGB1
TLR 3 dsRNA mRNA, tRNA
TLR 4 Lipopolysaccharide Heat-shock proteins, HMGB1
TLR 5 Flagellin
TLR 2/6 Diacylated lipopeptides
TLR 7 ssRNA, guanosine analogs ssRNA
TLR 8 ssRNA ssRNA
TLR 9 Unmethylated CpG DNA Chromatin IgG complex
TLR 10/11/12 Profillin and profillin-like
proteins
1.3.3.2. Phase II: Recruitment of classical monocytes
Upon entering an inflammatory site, neutrophils release preformed granule
contents in a sequential manner (132). Neutrophil antimicrobial defenses are
covered in an earlier section of this chapter. Some of the first mediators released
have antimicrobial and matrix-degrading activities that allow neutrophils (and also
potentially leukocytes recruited in the future) to navigate through the tissue (5, 133,
134). In addition to antimicrobial effects, some of the early mediators (eg.
cathelicidin, α-defensins, cathepsin G, azurocidin) are also important recruiters of
24
monocytes (135-137). These mediators are particularly important for the rapid
recruitment of classical monocytes (138-140). Monocytes extravasate into the site
of inflammation following interaction with endothelial cell-expressed E-selectin,
vascular cell adhesion molecule 1 (VCAM1), and CCL2 (131).
While neutrophilic granule proteins begin initial recruitment of classical
inflammatory monocytes, many monocyte chemoattractants require de novo
synthesis. An important mediator in the switch from neutrophil recruitment to
monocyte recruitment is IL-6. Activation of neutrophils results in shedding of IL-
6Rα, a soluble receptor that binds IL-6 produced by macrophages and endothelial
cells (130). The IL-6-IL-6Rα complex is then bound by gp130 on endothelial cells
(141), resulting in IL-6-trans-signalling and upregulation of VCAM1 and CCL2 on
endothelial cells (142, 143).
Neutrophil granule products also activate cells within close proximity, such
as resident macrophages, to produce factors that promote recruitment of
monocytes. CCL3, CCL6, CCL9, CCL15, and CCL23 produced by macrophages
are all known chemoattractants for monocytes (130). Expression of these
chemokines, especially CCL3, have been shown to be induced by azurocidin, a
neutrophil granule component (144). However, many of the chemokines are
produced by macrophages in a pro-form and require processing by neutrophil
proteases to become fully active (145). Finally, appropriately activated neutrophils
are also able to produce CCL3, CCL4, and CCL20 (146-148).
25
1.3.3.3. Phase III: Termination of neutrophil recruitment by phagocyte signals
Within the site of injury/infection, macrophages, neutrophil, and monocytes
collaborate to remove the noxious stimuli (ie. pathogen). The mechanisms used for
this are described in Section 1.3.2 of this chapter. After the inflammatory stimulus
has been cleared, the process of resolution must begin to prevent excess tissue
damage and initiate wound healing, the initial steps towards a return to
homeostasis. This process is not merely a termination of inflammation but is an
active process that occurs through several steps.
1. Decrease neutrophil recruitment
Lipid mediators are important to both the initiation of inflammation and the
induction of resolution, and the change between these two states appears to involve
a “switch” in the lipid mediators found within an inflammatory site (coined ‘lipid-
mediator class switch’) (149). During the initiation of inflammation, endothelial
cells, monocytes, macrophages and neutrophils generate prostaglandins and
leukotrienes that increase inflammation (150). The switch between inflammation
and resolution occurs as prostaglandin E2 (PGE2) and PGD2 promote the synthesis
of pro-resolution molecules such as lipoxins (151, 152). Neutrophils play an
important role in lipid-mediator class switching through interactions with platelets
and epithelial cells (151, 152). One such lipoxin, lipoxin A4, is involved in
inhibiting neutrophil entry (153) and decreasing neutrophil ROS production, NF-
κΒ translocation, and inflammatory cytokine and chemokine synthesis (154).
Resolvins and protectins, other important pro-resolution mediators (155), have
been shown to increase expression of CCR5 on spent neutrophils (156), thereby
26
promoting the clearance of pro-inflammatory chemoattractants CCL3 and CCL5,
and terminating inflammatory cell influx.
2. Induction of apoptosis
Neutrophils are naturally short-lived cells. Signals within an inflammatory
site play a large role in instructing neutrophil apoptosis. Upon entering an
inflammatory site, neutrophils receive survival signals such as IL-1β, granulocyte-
colony stimulating factor (G-CSF) and granulocyte-macrophage colony stimulating
factor (GM-CSF) from macrophages, delaying the onset of apoptosis (157).
Macrophages, however, also produce signals that reduce neutrophil lifespan, such
as tumor necrosis factor, which induces neutrophil apoptosis at high levels of
expression (158). Monocytes and macrophages also have membrane-bound TNF
on their surface that similarly induces neutrophil apoptosis, promoting the
resolution of inflammation (159, 160).
During an inflammatory response, there is also the generation of a large pool
of inflammatory macrophages, thought to be derived from inflammatory
monocytes (161). Unlike resident tissue macrophages, these cells do not remain
within the site for long spans of time. However, these cells do not undergo
apoptosis within the inflammatory site, but instead emigrate to the draining lymph
node quickly during the resolution process (162). It is thought that this emigration
and subsequent antigen presentation within the lymph node is an important
component in activating downstream adaptive responses towards antigens from the
inflamed site (162).
27
3. Phagocytosis of apoptotic neutrophils
During apoptotic cell death, neutrophils release a series of “find me” signals
including S19 ribosomal protein, split tyrosyl-tRNA synthetase, thrombospondin 1,
lysophosphatidylcholine, ATP and UTP, and CX3CL1 (130, 163-165). Apoptotic
cells also have changes in membrane composition, including negative surface
charges, which also recruit scavenging cells to the apoptotic cells (166). A critical
component of resolution is the clearance of apoptotic cells; inefficient clearance
may lead to loss of cellular integrity, leakage of cellular contents, and activation of
immune responses to antigens derived from apoptotic cells (167). Within an
inflammatory site, this is largely accomplished by professional phagocytes-
macrophages and immature dendritic cells (167).
Unlike “find me” signals, which are diffusible soluble factors, “eat me”
signals are displayed on the surface of apoptotic cells early in the apoptotic cascade
and signal phagocytes to clear that cell (168, 169). The most well recognized “eat
me” signal is exposure phosphatidylserine from the inner membrane leaflet to the
outer membrane surface (170, 171). Other common “eat me” signals include
changes in the charge of surface glycoproteins and lipids from the addition of
sugars, binding of thrombospondin or complement component C1q to the apoptotic
cell surface, expression of ICAM3, and expression of oxidized low-density
lipoprotein (LDL)-like moiety (171-173). These “eat me” signals are recognized by
various receptors on the phagocyte: lectins (bind altered sugars) (174), vitronectin
receptor (thrombospondin) (175), scavenger receptors (oxidized LDL-like
28
moieties) (174), CD14 (ICAM3) (176), CD91/LRP1 (C1q) (177, 178) are some
examples. Internalization of apoptotic cells appears to depend on the type of cell
about to be engulfed, the combination of signals the phagocyte receives, and the
activation state of the phagocyte (169, 179-181). Once the phagocyte receives the
appropriate collection of signals, the phagocytic process ensues as with pathogens:
pseudopods are extended around the apoptotic cell, the apoptotic cell is internalized
into a phagosome, and the contents of the phagosome are broken down (167).
1.3.3.4. Phase IV: Return to homeostasis
Phagocytosis of apoptotic cells was originally thought to be immunologically
“silent” (182) because there was no induction of inflammatory responses. As such,
to differentiate phagocytosis of apoptotic cells from pathogens, this process has
been occasionally termed ‘efferocytosis’ (meaning “carrying the corpse to the
grave”) (183). While there is no induction of inflammatory processes following
apoptotic cell phagocytosis, there is a well-documented increase in anti-
inflammatory cytokines transforming growth factor β (TGF-β) and IL-10 (162,
184, 185). This occurs in combination with a decrease in pro-inflammatory
mediators (TNFα, IL-6, CXCL-8, IL-12, IL-23, PGE2, leukotriene C4,
thromboxane B2) and antimicrobial factors (ROS and NO) (162, 184-193). In
addition to anti-inflammatory factors, resolution processes also trigger the release
of vascular endothelial growth factor (VEGF) and other growth factors that are
critical to repair (130). However, many of the soluble mediators of resolution also
decrease antimicrobial defenses of phagocytes, which may promote pathogen
29
persistence (194, 195). Consequently, the timing of resolution events is crucial for
the outcome: initiation too early may prolong infection and delayed initiation may
cause excess damage to host tissues.
1.3.4. Soluble mediators of acute inflammation and resolution
Cytokines are small, soluble immune mediators that are important in cell
signaling. Broadly, these mediators can be classified into interleukins
(lymphokines and monokines), interferons, colony stimulating factors and
chemokines, each with specific roles within an immune response. A wide range of
cells produce cytokines, including leukocytes, endothelial cells, fibroblasts, and
stromal cells. While numerous cytokines are involved in mediating acute
inflammatory and subsequent resolution responses, for the purposes of this chapter,
I will review the mediators that are studied throughout this thesis. I will also
highlight the fish species these cytokines have been currently identified in. This
does not exclude existence of the cytokines in other species.
1.3.4.1. Chemokines
Chemokines are a class of around 50 polypeptides that have a conserved
tertiary structure (196). They are separated into 4 main classes, depending on the
location of key cysteine residues that participate in disulfide binding: C, CC, CXC,
CX3C (196). Chemokines are also identified based on their capacity to promote
chemotaxis of leukocytes (197).
30
1.3.4.1.1. CCL-1
CCL-1 is a small glycoprotein. It is a strong chemoattractant, primarily for
monocytes, NK cells, immature B cells and dendritic cells, depending on the
expression of its cognate receptor CCR8 (198-200). This chemokine has been
linked to several important diseases, including neuropathic pain (201, 202), atopic
dermatitis (203), allergy/ allergic asthma (204, 205), and type I diabetes (206)
In goldfish, CCL-1 is stimulated by the presence of recombinant
Trypanosoma carassii heat-shock protein (HSP) 70 (207), recombinant CSF-1
(36), and recombinant interferon (IFN)-γ (32). The expression patterns of CCL-1
are also affected by seasonal changes and human chorionic gonadotrophin (208).
1.3.4.1.2. CXCL-8 (IL-8)
CXCL-8 (IL-8) was the first chemokine described. It is known for an ability
to attract neutrophils (209, 210). CXCL-8 is generated following cleavage of a 20
amino acid leader sequence from a 99 amino acid precursor (211, 212). This
protein is then processed extracellularly, resulting in increased activity (211, 212).
CXCL-8 and the other CXCL chemokines, in addition to be strong attractants for
neutrophils, also induce neutrophil shape change, transient increases in neutrophil
intracellular free Ca2+ concentration, upregulation of adhesion molecules,
formation of bioactive lipids, and respiratory burst induction (213). In vivo, this
chemokine induces exudation of neutrophils from the plasma and a large
accumulation of neutrophils in the injection site (214). Interestingly, the effects of
CXCL-8 are unusually long in vivo, thought to be due to resistance of inactivation
31
and binding to matrix glycosaminoglycans (215). CXCL-8 has also been described
to be weakly chemotactic for basophils in vitro, but not for eosinophils or
monocytes (210, 216, 217). While some reports have suggested that CXCL-8 may
also attract lymphocytes (218), this has been disputed (219) and is not supported by
human studies (220). Binding studies have revealed that there are two receptors for
CXCL-8: IL-8R1 (or IL-8RA) and IL-8R2 (or IL-8RB) (127, 221, 222). IL-8R1,
the IL-8 selective receptor, is detectable in a variety of cells types, including
leukocytes, lymphocytes, and fibroblasts (223). IL-8R2 is restricted to monocytes
and myeloid cell lines (223).
CXCL-8 was originally found in culture supernatants of human blood
monocytes (209). It has since been found that endothelial cells, fibroblasts,
keratinocytes, synovial cells, chondrocytes, epithelial cells, tumor cells, and even
neutrophils can produce active CXCL-8 (215, 222). Within these cell types, IL-1
and TNF induce CXCL-8 expression (215, 222). In monocytes and macrophages,
CXCL-8 expression can be induced by IL-7, GM-CSF, IL-3, lectins, immune
complexes and bacteria, adherence, and changes in oxygen partial pressure (215,
222).
CXCL-8 has been identified in multiple fish species (224-228). Like
mammalian CXCL-8, piscine CXCL-8 is a potent chemoattractant for neutrophils
(37, 229). Some fish species also express multiple isoforms of CXCL-8. For
example, carp have two identified isoforms that have distinct expression patterns;
both are chemotactic (230). Rainbow trout have recently been shown to have at
least 10 variants (231). In goldfish, similar to CCL-1, CXCL-8 expression is
32
induced by recombinant Trypanosoma carassii heat-shock protein (HSP) 70 (207),
recombinant CSF-1 (36), recombinant interferon (IFN)-γ (32), and seasonal
changes (208). Expression is reduced by recombinant IL-10 (232). In Arctic char,
CXCL-8 expression is induced by Aeromonas salmonicida subsp. achromogenes
(233).
1.3.4.2. Pro-inflammatory mediators
1.3.4.2.1. TNF-α
Tumor necrosis factor (TNF)-α is a potent inflammatory cytokine with
pleiotropic effects. TNF-α plays a major role in host defense and the initiation of
acute inflammation (234) and is largely produced by activated macrophages. TNF-
α was originally discovered in 1975 as a cytotoxic factor produced by macrophages
(235, 236). In the original descriptions, TNF-α expression was induced by the
presence of endotoxin (LPS), resulting in the induction of necrosis in tumor cells
(hence the name tumor necrosis factor) (235, 236). TNF-α is primarily produced as
a homo-trimeric trans-membrane protein (237, 238). To produce soluble TNF-α,
the membrane-bound version is cleaved by the metalloproteinase TNF-α
converting enzyme (TACE, also known as ADAM17) (239). Both versions are
biologically active (240).
TNF-α expression is induced in response to LPS and other bacterial products,
and IL-1. While this cytokine has broad physiological effects, in the immune
system it is known to promote chemotaxis of neutrophils, monocytes and
macrophages (241, 242), enhance phagocytosis (243-245), and prime cells for ROS
33
and NO production (246, 247). TNF-α has two cognate receptors- TNFR1 and
TNFR2- that trimerize around the ligand (248, 249). TNFR1 is expressed in most
tissues and appears to be activated by either the soluble or membrane bound forms
of TNF-α (250, 251). TNFR2 is found on immune cells and appears to largely
respond to membrane-bound TNF-α (250, 251). While there has been some
controversy involving the roles of these two receptors, the prevailing thought is
that TNFR1 is the central receptor for signal propagation while TNFR2 plays a
smaller role in binding but is involved in redistribution of TNF-α ligand (252-254).
However, it has also been reported that ligation of TNFR1 results in apoptosis
while TNFR2 ligation results in survival and induction of proliferation (255). There
is also evidence that TNFR2 may be involved in activation of T cells (256, 257)
and in tumor suppression (258).
Ligation of TNFR results in the recruitment of the adaptor protein TRADD,
ultimately resulting in the initiation of 3 potential pathways: activation of NF-κΒ,
activation of MAPK pathways, or activation of apoptotic pathways (253, 259). The
NF-κΒ pathway mediates transcription of proteins involved in cell survival and
proliferation, inflammation, and anti-apoptotic factors (260, 261). The MAPK
pathways generally promote cell differentiation and proliferation (262). Activation
of apoptotic pathways involves signaling through death-domain-containing
membrane proteins, resulting in caspase activation (263).
TNF-α has been found in several fish species, including Japanese flounder
(264), rainbow trout (265), catfish (266), carp (267), and goldfish (31). In trout,
carp and goldfish, multiple isoforms of TNF-α have been reported (31, 267-269).

34
In fish, TNF-α has been reported to upregulate expression of immune genes
including IL-1β and CXCL-8, rapid recruitment of phagocytes, increased
phagocytosis, and priming of ROS and NO responses (31, 270, 271).
1.3.4.2.2. IL-1β
The interleukin-1 family consists of 11 cytokines, which are central of the
regulation of immune and inflammatory processes (272). Discovery of this family
started with studies on fever, leading IL-1 to initially be called “endogenous
pyrogen” (273). I will focus solely on IL-1β.
IL-1β is produced largely by myeloid cells (monocytes, macrophages,
dendritic cells) (274) and is important in mediating inflammatory responses (275).
IL-1β is produced as a pro-peptide that must be cleaved in order to become
biologically active. It is currently believed that myeloid cells, following activation
by pathogens or pathogen derived factors (ie. PAMPs), induce the expression of
pro-IL-1β (276). The pro-form is then cleaved by caspase-1/ IL-1β converting
enzyme (ICE), leading to release of active IL-1β (277, 278). Release may be
accomplished through a variety of mechanisms, including exocytosis,
microvesicular budding, export through specific transporters, or cellular lysis
(279). IL-1β is recognized by its cognate receptor IL-1R. The receptor is
structurally related to TLR structure and employs similar downstream signaling
pathways (280). Binding of IL-1β to IL-1R is competitively inhibited by IL-1
receptor antagonist (IL-1Ra) (281).
35
IL-1β has a very broad range of physiological effects and targets most cell
types in the body (extensively reviewed (272, 274-276)). In terms of inflammatory
effects, IL-1β is known to in induce synthesis of lipid mediators such as PGE2,
induce synthesis of thromboxane, promote chemotaxis of T and B cells, enhance
basophil histamine release and eosinophil degranulation, upregulate synthesis of
type I interferons, and increase expression of leukocyte adherence receptors on
endothelial surfaces (272, 274-276, 282). Given its wide range of effects and target
cells, it in not surprising that IL-1β has been implicated in a number of pathological
conditions, including autoimmune/ auto-inflammatory disease (282, 283), cardiac
disease (284), neurodegenerative diseases (285), rheumatoid arthritis (282), and
type 2 diabetes (282). It has also become a therapeutic target for various
inflammatory conditions.
In fish, IL-1β has been found in various species (286-291). Similar to
mammalian IL-1β, fish IL-1β also contributes to inflammatory processes by
enhancing antibody responses to Aeromonas hydrophila (292) and resistance to
Aeromonas salmonicida and Aeromonas hydrophila (293, 294), enhancing MHCII
β chain expression (295), increasing COX-2 expression (295), promoting
proliferation (295), and increasing phagocytic responses (294, 295). Other studies
have also shown increases in ROS production (294). Similar to other cytokines,
certain species of fish possess multiple isoforms of IL-1β. In carp, these transcripts
have been termed IL-1β1 and IL-1β2 (286). Both IL-1β1 and 2 are expressed
following immune challenge, thought IL-1β1 tends to be more greatly expressed
(286).
36
1.3.4.2.3. IL-12
IL-12 is an important pro-inflammatory involved in both innate and adaptive
immune responses (296). The IL-12 family consists of 4 cytokines: IL-12, IL-23,
IL-27, and IL-35 (297, 298). Each IL-12 member is a heterodimeric cytokine
composed of two separate subunits: an α-chain (p19, p28, and p35) and a β-chain
(p40) (297, 299). This section will focus solely on IL-12p70, formed by IL-12p35
and IL-12p40 (300-302).
Macrophages and dendritic cells are the primary producers of IL-12
following activation with PAMPs (296, 303). This signal is further augmented by
secondary pro-inflammatory stimuli (ie. TNF- α, IL-6) (302, 304, 305). IL-12 is
important for the differentiation of T cell to Th1 cells (298, 303, 306) and also
enhances NK responses (307). In addition to activating Th1 and NK responses, IL-
12 stimulates the production of TNF-α (308) and reduces the suppression of IFN-γ
responses (301).
In fish, IL-12 has received relatively less attention than other cytokines and
remains poorly elucidated. Genes for p35 (single gene) and p40 (multiple genes:
p40a, p40b, p40c) have been identified in some fish species (309-315). Functional
analyses has shown that IL-12 can induce IFN-γ production by rainbow trout head
kidney leukocytes (315). More work is still needed to determine the role of fish IL-
12 in T cell development.
1.3.4.2.4. IFN-γ
37
Interferon gamma (IFN-γ) is a pro-inflammatory pleiotropic cytokine with
anti-viral properties (316). IFN-γ is an important activator of macrophages, leading
to its moniker of ‘macrophage activating factor’. The primary producers of IFN-γ
are activated Th1 CD4+ cells, CD8+ T cells, and NK cells (317-319), though
myeloid cells can also secrete IFN-γ. Activation of cells by IFN-γ produces a
variety of effects, including increased antigen presentation and lysosome activity in
macrophages, activation of iNOS, differentiation of Th1 cells, promotion of
cytotoxic CD8+ and NK activity, promotion of leukocyte extravasation, and
induction of increased expression of MHCI and MHCII (320). IFN-γ also augments
host defense against a variety of intracellular pathogens besides viruses (Listeria
monocytogenes, and Leishmania major, for example) (321-326). The biological
effects of IFN-γ are exerted following binding to its cognate receptor, a
heterodimer of IFNGR1 and IFNGR2 (327).
It was first suspected that fish possess IFN-γ after experiments demonstrated
the presence of a macrophage activating factor with actions similar to mammalian
IFN-γ (328). Since then, IFN-γ has been sequenced in various fish species (32, 35,
329). In goldfish, recombinant IFN-γ has been shown to induce ROS and NO
responses, enhance macrophage phagocytosis, and increase expression of pro-
inflammatory cytokines (32).
In addition to IFN-γ, goldfish also express another isoform, called IFN-γrel
(for IFN-γ related) (34). Similar to IFN-γ, IFN-γrel increases ROS production,
though the priming was much shorter in duration than that achieved with IFN-γ
(34). Further, IFN-γrel induces a much more potent increase in phagocytosis, iNOS
38
expression and NO production than IFN-γ does (34). Both IFN-γ and IFN-γrel also
increase expression of a number of pro-inflammatory cytokines, though the gene
expression patterns of monocytes activated with IFN-γ or IFN-γrel were quite
different (34).
1.3.4.2.5. CSF-1
Colony-stimulating factor -1 (CSF-1) or macrophage colony-stimulating
factor (M-CSF) is the principal regulator of the survival, proliferation, and
differentiation of macrophages and their precursors (330-332). As such,
macrophages are the main target for this protein (333-336). Outside of the female
reproductive tract, where CSF-1 expression is governed through a separate
promoter, the high affinity tyrosine kinase CSF-1 receptor (CSF-1R) is exclusively
found in cells of the macrophage lineage (337, 338). As such, CSF-1R expression
is an excellent marker for the identification of macrophages and their
hematopoietic progenitors (337, 338). Further, it has also been shown that the level
of CSF-1R progressively increases from primitive hematopoietic precursors to
monocytes and further increases upon terminal maturation to macrophages (335).
Ligation of CSF-1R by CSF-1 promotes proliferation of macrophage
progenitor populations and increases expression of several other macrophage
differentiation antigens (339-341). In addition, CSF-1 is also a central regulator of
macrophage function. It promotes monocyte and macrophage activation through
contributions to chemotactic, phagocytic, and killing activities (342-348). Further,
it increases production of plasminogen activator (349, 350), prostaglandin E2 (351),
39
reactive oxygen (348, 352, 353) and reactive nitrogen intermediates (354, 355), in
addition to several cytokines including G-CSF, GM-CSF, IL-1, IL-6, IL-8, IL-18,
TNF-α, and interferon (356-363).
In addition to its primary role in the maintenance of macrophage populations
and their function, CSF-1 activity is also relevant to other cells and tissues. This
has been illuminated by studies of CSF-1R knockout (KO) and CSf1op/CSf1op
mice. The latter lacks active CSF-1 production due to a null mutation in the CSF-1
gene-coding region, which results in the generation of a biologically inactive
truncated form of the cytokine (364, 365). CSf1op/CSf1op mice have a severe
deficiency of tissue macrophages, as well as deficiency in bone-resorbing
osteoclasts, absence of teeth, abnormal bone remodeling, and osteopetrosis (364,
365). They also exhibit abnormal breast development, decreased fertility, low body
weight, and shortened life-span, which can be largely reversed through expression
of CSF-1 or injections with recombinant CSF-1 early during development (364,
365). Importantly, unlike CSF-1R KO models, the CSf1op/CSf1op mouse does not
suffer from the confounding effects based on inhibition of IL-34, a ligand that has
been recently shown to bind similar regions on the CSF-1R as CSF-1 with similar
binding affinity (334). Together, these studies identify CSF-1 contributions to
immunity and inflammation, bone metabolism, atherogenesis, lipoprotein
clearance, development, and reproduction (331, 334, 335, 366-369).
Because of the broad range of CSF-1 activity, it has served as the basis for
several clinical trials aimed at therapeutic antimicrobial applications, and
amelioration of autoimmune disorders, cancer and inflammatory diseases (370).
40
Recombinant human CSF-1 (rh-CSF-1) treatment alone or in combination with
other cytokines effectively increased the numbers and activation of monocytes and
macrophages, enhanced antibody-dependent cellular cytotoxicity (ADCC) and
antibody-independent tumor cell cytolysis, promoted macrophage antimicrobial
phagocytic and killing activities, and lowered platelet numbers and cholesterol
levels (355, 366, 370). Further, administration of rh-CSF-1also proved effective in
the control of invasive fungal infections in patients undergoing bone marrow
transplantation, through significant reduction in mortality rates when given in
combination with standard antifungal treatments (371). Acute myeloid leukemia
(AML) patients have also benefited from CSF-1 treatment, as shown by reduced
incidence and shortened duration of febrile neutropenia and thrombopenia
following chemotherapy, as well as shortening the period required to finish three
courses of intensive consolidation therapy (355).
1.3.4.2.5.a. Evolutionary conservation of CSF-1 and CSF-1R
The CSF-1 / CSF-1R axis has been well conserved across evolution. Among
mammals, homologs for CSF-1 have been described in humans, chimpanzees,
rhesus monkeys, cattle, dogs, mice, and rats. CSF-1R is also well conserved among
higher vertebrates. Homologs for CSF-1R have been described in humans,
chimpanzees, rhesus monkeys, cattle, dogs, mice, and rats.
Transcripts for CSF-1 have been identified in birds (372), amphibians (373)
and fish (374, 375). CSF-1R has been identified in birds (372) and a number of fish
species including zebrafish (376), goldfish (377), rainbow trout (378), Atlantic
41
salmon (379), pufferfish (380) and the gilthead sea bream (347). Functional
characterization of CSF-1 activity has shown similar effects on macrophage
systems. In chicken and Xenopus, CSF-1 promoted growth and survival of primary
bone marrow-derived cultures (372, 373). In goldfish, CSF-1 macrophage
expression was positively modulated by TNFα-2, rgIFNγ but not rgTGFβ (31, 32,
34, 78). In vitro macrophage treatment with CSF-1, in turn, increased the
expression of IL-8, CCL-1, TNFα-1, TNFα-2, IL-1β1, IL-1β2, IL-12-p35, IL-12-
p40, IFN, IL-10, and iNOS A and B (36). It also led to expression of TGF-β at later
time points (36). Functionally, goldfish CSF-1 enhances macrophage proliferation
and differentiation from hematopoietic precursors, chemotaxis, phagocytosis and
production of antimicrobial reactive oxygen and nitrogen intermediates (36, 65,
374). In vivo, goldfish CSF-1 administration led to an increase in the number of
circulating monocytes in the bloodstream (379).
Despite the functional similarities observed when comparing goldfish CSF-1
with mammalian CSF-1 (36), goldfish CSF-1 varies from its mammalian
counterpart in a number of ways. Goldfish CSF-1 is composed of 199 amino acids
making it significantly smaller than the secreted glycoprotein or the secreted/matrix
bound proteoglycan form of mammalian CSF-1, and most similar to the membrane
bound glycosylated form of the molecule (381). Interestingly, all mammalian
CSF-1 isoforms were shown to be functional as long as they possessed the first 150
amino acids found in the N-terminal of the CSF-1 protein, the region shown to be
required for proper folding (382). This region has the most similarity to goldfish
CSF-1.
42
Non-immunological roles have also been described for CSF-1 in lower
vertebrates. In chickens, CSF-1 activity has been linked to the promotion of
embryo development (383). In zebrafish, the presence of the c-fms gene, which
encodes the CSF-1R, contributes to postembryonic pigment patterning through
neural crest xanthophore precursor maintenance and development of a population
of adult melanocytes (376, 384).
1.3.4.2.5.b. Control of CSF-1 activity
CSF-1 is synthesized by a variety of cell types including endothelial cells,
bone marrow stromal cells, osteoblasts, fibroblasts, keratinocytes, thymic epithelial
cells, astrocytes, myoblasts, endothelial cells, mesothelial cells, endometrial gland
cells and the placenta-trophoblast decidual stroma (335, 366, 385). The normal
range for serum CSF-1 concentration is between 150-500 U/mL or 3-8 ng/mL
(381, 386-389). Maximum stimulation of CSF-1-mediated proliferation can be
observed at 250 pM, but proliferation can be detected at concentrations as low as 1
pM, as is the case for bone-marrow colony-forming cells (390). CSF-1 activity is
also well known to increase during inflammatory conditions. Inflammatory
cytokines including TNF-α (391), IL-1 (341, 392), IFN-γ (393, 394), and GM-CSF
(395) have been shown to up-regulate expression of CSF-1. Activation of
endothelial cells, T- and B-lymphocytes, fibroblasts, chondrocytes, and mesangial
cells also leads to increased CSF-1 production. Thus, unlike other colony-
stimulating factors like G-CSF and GM-CSF, which are primarily expressed during
periods of crisis, CSF-1 is ubiquitously expressed under steady state conditions,
43
can be upregulated dramatically within local microenvironments based on unique
physiological requirements, and also serves a critical role during infection and
injury. Thus, a number of mechanisms have evolved to effectively control the
magnitude and duration of CSF-1 activity.
As with other cytokines, CSF-1 can be regulated though its expression and
that of its cognate receptor. Its mRNA also contains AU- rich sequences in the 3’
non-coding region that confers transcript instability (396-398). CSF-1 protein has a
short half-life and can be effectively cleared through internalization and
degradation of ligand-receptor complexes, where CSF-1 receptor-mediated
internalization is followed by intracellular destruction of the growth factor (333,
399). The degradation process is partially mediated through the action of the
ubiquitin-protein ligase c-Cbl, which is recruited to the plasma membrane upon
receptor activation (400-402). Association of c-Cbl with the receptor then leads to
ubiquitination, followed by ligand:receptor complex internalization and
degradation. Removal of circulating CSF-1 is accomplished primarily through the
action of liver and splenic macrophages, which efficiently remove over 90% of the
circulating CSF-1, much of the remaining circulating CSF-1 is filtered through the
kidney (333, 399).
1.3.4.2.5.c. Identification of a soluble CSF-1 receptor in teleost fish
Insights from the mammalian models described above indicate that CSF-1
activity is tightly controlled through mechanisms regulating gene expression of
CSF-1 and its receptor, metabolic processing, receptor-mediated endocytosis, as

44
well as inhibition of CSF-1R signaling. The original studies into the mechanisms
that control the growth of self-renewing macrophage populations in goldfish
identified an additional mechanism for the regulation of CSF-1 activity - through
the production of a novel soluble form of the CSF-1 receptor (377). In short,
goldfish primary macrophages derived from kidney hematopoietic tissues (PKM)
had been observed to grow spontaneously in vitro in response to endogenous
macrophage growth factors (29, 403, 404). Preliminary examinations suggested the
presence of a CSF-1-like molecule in culture supernatants. Analysis of 26,000
clones from two PKM cDNA libraries yielded the CSF-1 membrane-bound
receptor transcript (377). Interestingly, we also identified a unique transcript
encoding only for the ligand-binding portion of the CSF-1R. Sequence analysis
revealed that this unique transcript was derived from a full-length mRNA species
containing a start codon, signal peptide, stop codon, poly-adenylation signals, and a
poly-A tail. This short transcript was preferentially expressed during a period of
PKM development associated with a decrease in proliferation and differentiation
events, decreased growth factor activity in culture supernatants, and marked
phenotypic changes that culminated in apoptotic cell death (the senescence phase
of PKM development) (377, 403).
Protein expression of the unique transcript in an insect-based system
confirmed that it encoded for a soluble form of the CSF-1R (sCSF-1R), which
inhibited PKM proliferation at nanomolar concentrations. Moreover, generation of
antibodies against recombinant sCSF-1R identified native sCSF-1R in supernatants
of PKM senescent phase cultures, suggesting the presence of an endogenous
45
mechanism temporally regulating sCSF-1R release during goldfish macrophage
development. Further, the native protein was detected in goldfish serum (377),
which suggested that this protein might also play a role in systemic regulation in
addition to its role in regulating proliferation within the hematopoietic
compartment.
1.3.4.2.5.d. Molecular characterization of CSF-1-sCSF-1R interactions
Unlike mammalian macrophages which rely on other cells to produce CSF-1
(405), goldfish monocytes and macrophages are capable of producing CSF-1
themselves. CSF-1 then acts in an autocrine fashion, inducing further proliferation
and differentiation of myeloid cells (374). The teleost approach to myeloid
proliferation and differentiation implies that a unique regulatory process must exist
in fish to properly control myelopoiesis. This regulatory role was the initial
function hypothesized for the soluble CSF-1 receptor (sCSF-1R). As described
above, functional assessments supported the idea that sCSF-1R negatively
regulated myelopoiesis. Addition of the soluble receptor to early myeloid cultures
abrogated proliferation and differentiation of monocytes and macrophages induced
by cell conditioned medium-induced or recombinant goldfish CSF-1 in vitro (377).
Furthermore, this inhibitory effect on myelopoiesis was also observed when
recombinant goldfish CSF-1 (rgfCSF-1) action was blocked using an anti-gfCSF-1
polyclonal antibody (374). Both of these myelopoiesis-blocking mechanisms
derive from a prevention of proper CSF-1 function.
46
Cross-linking studies demonstrated that goldfish CSF-1 forms a dimer under
native conditions, and that this dimer is recognized by the soluble CSF-1 receptor
(374). Although the mechanism by which CSF-1 function is prevented by sCSF-1R
is currently unknown, the soluble receptor possesses the relevant binding regions
for CSF-1 interaction. Thus, the current working hypothesis describes a
competitive model where sCSF-1R interacts with CSF-1, preventing CSF-1 from
properly engaging the cell surface form of the CSF-1R, thereby disrupting CSF-1
signaling and downstream effects on teleost macrophages. Overall, the presence of
CSF-1, CSF-1R, and sCSF-1R in goldfish provides an opportunity for the
establishment of a control loop for the regulation of macrophage numbers (Figure
1.2).
1.3.4.3. Anti-inflammatory/ resolution mediators
1.3.4.3.1. TGF-β
TGF-β is a member of a cytokine/ growth factor superfamily with at least 40
members (406). There are currently 3 known isoforms in mammals: TGF-β1, TGF-
β2, and TGF-β3. While these three isoforms have partially overlapping functions,
they are produced within distinct tissues by different cells types (407). TGF-β is
secreted in a latent form, complexed with latent TGF-β binding protein (LTBP) and
latency-associated protein (LAP) (407). LAP is necessary for TGF-β secretion,
prevents engagement of TGF-β with its cognate receptors, and maintains a readily
accessible extracellular store of TGF-β (408). LTBPs are thought to maintain
proper folding of TGF-β and target it to extracellular structures (407). Dissociation
47
of TGF-β from the latency complex is thought to involve proteolytic and non-
proteolytic processes and interactions with various cells (408-411). TGF-β binds a
complex of multiple TGF-β serine/threonine kinase receptor chains (412-414),
leading to signaling through the SMAD pathway (415). This pathway is complex
and likely varies across cell types and activation states, allowing the wide array of
TGF-β responses to occur.
In the immune system, TGF-β has a complex role, dependent on
concentration, target cell type, activation/ differentiation state of the target cell, and
the milieu of soluble factors. TGF-β has been shown to inhibit proliferation and
induce apoptosis in lymphocytes (407, 416). It is also important in downregulating
NK cell activity and IFN-γ production (417, 418). Further, TGF-β inhibits naïve T
cell responses, while inhibiting functions of only Th1 memory T cells (419).
Another potential mechanism by which TGF-β decreases Th1 responses is through
the enhancement of CD4+Foxp3+ T-regulatory cells (420). TGF-β also induces
antibody class switching and maturation of B cells (421).
TGF-β also has numerous roles on phagocytes. In dendritic cells, it has been
shown to affect antigen presentation ability, decrease MHC class II expression,
affect differentiation, and reduce IL-1β and TNF-α expression (422). In monocytes,
TGF-β is thought to drive cells towards an alternatively activated/M2/ myeloid
suppressor cell state of activation (423). In the macrophage populations, TGF-β
ablates ROS and NO production, reduces binding of TNF-α and IFN-γ by
decreasing receptor expression, and reduces antimicrobial responses (246, 424,
425). Finally, TGF-β1 knockout mice have an excessive inflammatory response,
48
extensive organ infiltration by macrophages and lymphocytes, and
cardiopulmonary complications (426-429). In addition, these mice also tend to
develop severe autoimmune diseases (430, 431), pointing to the importance of this
cytokine. TGF-β2 and TGF-β3 knockout mice have severe developmental defects
that result in death (432).
Interestingly, TGF-β also has some pro-inflammatory functions, especially at
low concentrations. Resting monocytes have been shown to upregulate expression
of IL-1β, TNF-α, and IL-6 following treatment with TGF-β (433-435). However,
the addition of LPS diminishes these responses (436, 437). TGF-β has also been
shown to be chemotactic at low doses to both monocytes and neutrophils (434,
435, 438, 439), and has been shown to not affect phagocytic responses (440).
In fish, TGF-β was first identified in trout (288, 441, 442), and has
subsequently been found in other species, including carp (443), sea bream (444),
striped bass and hybrid tilapia (445), and goldfish (78). In goldfish, recombinant
TGF-β has been shown to decrease NO responses in macrophages and induce
proliferation of a fibroblast cell line (78).
1.3.4.3.2. IL-10
IL-10 is an anti-inflammatory cytokine that is central to preventing
pathologies due to inflammation and autoimmune diseases (446-448). This
includes inflammatory-induced pathologies caused by a variety of infections (ie.
Mycobacterium, Toxoplasma gondii, and viral infections) (449-457). Because of its
potent effects on inflammatory responses, several pathogens induce IL-10 as an
49
immune evasion mechanism (456, 458-460), which generally leads to increased
pathogen accumulation, decreased killing, and enhanced growth of infiltrating
pathogens (461-463). IL-10 knockout mice highlight the importance of this
cytokine in regulating immunity; these mice develop inflammatory bowel disease
in response to their natural flora and have an exaggerated response to microbial
challenges (464).
IL-10 production is induced in macrophages and dendritic cells in vitro
following activation with certain PAMPs (465-468). In vivo, it has been shown that
dendritic cells, macrophages, neutrophils and various lymphocytes (Th1,Th2,
Th17, Treg, B cell) populations can produce IL-10 (457, 469-473). Eosinophils,
epithelial cells, keratinocytes, mesangial cells, NK cells and tumor cells can also
produce IL-10 (474). It is generally thought that IL-10 acts predominantly on
monocyte lineage cells, which then alter responses of other cells (ie. lymphocytes)
through changing expression patterns of various monocyte lineage-derived
cytokines, primarily TNF-α (465, 475-478). IL-10 has also been shown to decrease
macrophage ROS and, to a lower extent, NO responses (475, 478) and decrease
expression of MHCII (479). To induce signaling, IL-10 forms a homodimer (480,
481) that binds to a receptor complex consisting of a ligand binding (IL10R1) and
accessory receptor subunit (IL10R2) (482-485). This results in signaling through
the Jak-Stat pathway (486).
In fish, IL-10 has been identified in puffer fish (487), trout (488), zebrafish
(489), carp (490), goldfish (232), sea bass (491), and cod (492). In goldfish,
recombinant IL-10 has been shown to decrease gene expression of TNF-α1, TNF-
50
α2, IL-1β1, IL-10, CXCL-8, and NADPH oxidase component p47 in activated
monocytes, combined with a large increase in suppressor of cytokine signaling-3
(SOCS3) gene expression (232). In splenocytes, recombinant IL-10 reduced IFN-γ
expression (232). Finally, pre-treatment with IL-10 diminished monocyte ROS
responses to Aeromonas salmonicida (232).
1.3.4.3.3. Vascular endothelial growth factor (VEGF)
Vascular endothelial growth factor (VEGF) is one of the most potent
inducers of angiogenesis (493). This family contains multiple members: VEGF-A,
VEGF-B, VEGF-C, VEGF-D, and placenta growth factor. VEGF-A is the most
well known of the family and will be the focus of this section. VEGF-B is
important in preventing apoptotic cell death, maintaining newly formed blood
vessels (494-496). VEGF-C and VEGF-D are important for lymphangiogenesis
(the process by which new lymphatic vessels are formed) (497-499). Placenta
growth factor is important to embryogenesis (500, 501).
VEGF-A is produced by macrophages following activation with pro-
inflammatory agonists (502-505). This protein increases vascular permeability,
stimulates angiogenesis, and enhances neutrophil and monocyte recruitment (506-
509). Because of these properties, VEGF may be considered a mediator of
inflammation, and increased expression is linked to a number of diseases including
obesity, autoimmunity, and cancer (510). However, in spite of its involvement in
inflammatory processes, it is included in this section because it is an integral part
of wound healing (511). Binding of VEGF-A to its cognate receptor VEGFR1 or
51
VEGFR2 causes receptor dimerization, resulting in trans-phosphorylation and
signaling (512, 513).
In fish, VEGF-A has been found in zebrafish (514), where it is also important
for angiogenesis (515). A sequence has also been identified in trout, though this
has not yet been published (Raino, J., unpublished; gene accession number
AJ17301).
1.3.4.3.4. Suppressor of cytokine signaling 3 (SOCS3)
Tight control of cytokine release and responses is necessary for immune
defenses, appropriate activation and differentiation of immune cells, and
prevention of inflammation-induced pathologies (516). Members of the suppressor
of cytokine signaling (SOCS) family are key to this process through their
regulation of STAT signaling pathways (517). This family consists of 8 members
(SOCS1, SOCS2, SOCS3, SOCS4, SOCS5, SOCS6, SOCS7, and CIS (cytokine-
inducible SH2 protein) (517). There are four main mechanisms by which SOCS
can inhibit signaling: [1.] block recruitment of STATs to the cytokine receptor by
masking STAT binding sites; [2.] target proteins for degradation via ubiquitination;
[3.] bind JAKs, inhibiting their kinase; and [4.] target JAKs for degradation (518).
In vivo, loss of SOCS3 has dramatic effects on placental development and
inflammation. SOCS3 knockout mice are embryonic lethal, due to increased STAT
and MAP kinase activity (519, 520). As such, various Cre models have been
employed to study this gene in vivo (reviewed in (516)). These studies have shown
that loss of SOCS3 results in severe inflammatory disease (521).
52
In fish, SOCS3 has been identified in zebrafish (522), fugu (522), trout (523),
three-spined stickleback (524), Japanese medaka (524), channel catfish (525), and
carp (526). While studies still need to be done on the function of SOCS3 in
regulating inflammatory responses in fish, in zebrafish SOCS3 has been shown to
be important in nerve regeneration (527, 528) and in the modulation of the
somatotrophic axis (529).
1.3.5. Aeromonas spp.
1.3.5.1. Aeromonas species: overview of genus
Aeromonads are ubiquitous pathogens known to cause disease in
poikilothermic and homeothermic animals (530). From 1943, when the genus
Aeromonas was created, to the mid-1970’s, aeromonads were classified into two
main groups based on growth characteristics and biochemical features (531). The
fist group, the mesophilic group, contained motile isolates that grew well between
35-37oC and caused disease in humans. The second group, the psychrophilic group,
contained non-motile isolates that grew optimally between 22-25oC and caused
disease in fish. From the mid-1970’s to mid-1980’s, there was significant interest
to redefine the groups based on DNA relatedness, leading to the creation DNA
hybridization groups (HG) (532). These hybridization groups were represented by
reference strains and each was given a number (eg. A. hydrophila= HG1). This lead
to the creation of 12 HG’s, containing both defined and unnamed species of
Aeromonas (532), which were then separated by phenotypic markers leading to the
proposal of new species (533).
53
Since the advent of DNA sequencing in the 1980’s, there has been a 450%
increase in the number of published, valid bacterial species (534). A similar trend
in growth has occurred within the Aeromonas family, with 7 new species being
described since 2002. Currently, there at 24 published Aeromonas species, though
not all of these are recognized in ‘Bergey’s Manual of Systemic Bacteriology’
(535). Of these, this chapter will focus on diseases caused by A. salmonicida, A.
hydrophila, and A. veronii. All three of these species are known to cause disease in
fish, with A. salmonicida being the predominant isolate from fish infections (535).
Further, A. hydrophila and A. veronii bv. sobria, with A. caviae, cause the majority
of human diseases, found in greater than 85% of human diseases attributed to
aeromonads (536).
1.3.5.2. Aeromonas infections in fish
Of the identified Aeromonas species, several have been isolated from fish.
The most common reported are A. veronii bv. sobria, A. bestarium, A. salmonicida,
A. hydrophila, A. sobria, A. encheleia, A. allosaccharophila, and A. jandaei (537).
Of these isolates, all A. hydrophila and A. bestarium isolates, and most A.
salmonicida and A. veronii isolates were found to be pathogenic in carp, causing
septicemia (537). Furthermore, the dominant isolate found in carp (A. veronii bv.
sobria) was isolated from both healthy and diseased fish (537). Aeromonas has
been shown to be the causative agent of furunculosis in fish, a worldwide disease
(reported in Scotland, France, Norway, Iceland, Spain, United States of America,
Canada, Japan, Chile, and Australia) (538-542). Aeromonas infections in fish have
54
caused large economic losses to the aquaculture sector due to mass fish death (538-
542).
Furunculosis is one of the oldest documented fish diseases, first described in
1894 by Emmerich and Weibel (originally named Bacillus salmonicida, Bacterium
salmonicida, Bacterium trutta) (543, 544). Further, it was the first fish disease that
demonstrated Koch’s postulates (540, 542). While furunculosis was originally
thought to only affect salmonids, it has since been characterized in a variety of fish
species including Atlantic cod, halibut, turbot, Artic char, lamprey, carp, goldfish,
and eel (539-542, 545-547). Common early symptoms of Aeromonas infection
include lethargy, decreased appetite, and skin hyperpigmentation. As the infection
progresses, fish may then develop furuncules or ulcers, exophthalmia, septicaemia,
petequia, anemia, ascites, and haemorrhages in the muscle, gills, fins, nares, vent
and internal organs (540-542). However, not all infected fish develop furuncles and
may not even show clinical signs of infection (539). Healthy carrier fish can pose
particular problems in aquaculture, as they are able to shed Aeromonas into the
water at a high level (105-106 CFU/fish/hour) (539, 541, 542). It is estimated that
up to 80% of farmed trout carry Aeromonas (548). Outbreaks of furunculosis tend
to occur under stressful conditions (change in water temperature, poor water
quality, improper handling) or during spawning season (539, 541, 542, 548).
In goldfish, Aeromonas infections are known as ‘goldfish ulcer disease’, with
the dominant species studied being Aeromonas salmonicida subsp. salmonicida
(543, 544). This disease was first described in 1969 (549). It has been shown that
A. salmonicida preferentially binds to mucus and dead/damaged cells of the dermis
55
(543, 544). As the infection progresses, the infected area begins to appear white,
followed by hemorrhages beneath the scales (543, 544). This is followed by
sloughing of the scales, necrosis of the dermis, and degeneration of the muscles
(543, 544). There is also a marked infiltration of leukocytes to the site if infection
(acidophilic, basophilic, and heterophylic granulocytes, lymphocytes, monocytes
and macrophages) that is maintained for at least 21 days (543, 544). Septicemia is
most likely to occur in fish with well-developed lesions (543, 544). Finally, the
causative bacteria are most easily isolated from the peripheral margins of the
lesions (543, 544).
1.3.5.2.1. Transmission of Aeromonas
Aeromonas infections are generally transmitted horizontally either through
physical contact or the shedding of bacteria into the water column (550, 551).
Large aggregations of fish in pools, including in fish farms, may aid in
transmission of the bacteria (552). Furunculosis can also be transmitted through
ingestion of salmon (543, 544). There is also evidence of perbranchial and
percutaneous routes of infection (553, 554). Goldfish developed ulcers following
exposure to Aeromonas in the water or after scarification (removal of a patch of
scales and swabbing exposed dermis) (543, 544). Removal of mucus also aids in
infection (543, 544). The importance of these steps if highlighted by Takahashi et
al (1975) (555) who showed that the most severe goldfish ulcerative disease
occurred in fish whose dermis had been eroded by ectoparasites or handling.
56
Aeromonas can also be dispersed at least 100 cm in aerosolized droplets, allowing
spread between nearby bodies of water (556). While Aeromonas is present within
the ovaries and testes of infected fish, there is currently no evidence supporting
vertical transmission of this pathogen.
1.3.5.2.2. Identification of Aeromonas species
Correct identification of causative agents of ichthyopathology is essential for
determining the etiology of disease and for establishing appropriate treatment. In
Aeromonas outbreaks, it is essential that this process be fast and reliable to
minimize the impact of the infection. Phenotypic and biochemical methods of
identification allow discrimination between three main groups: the “Aeromonas
hydrophila complex” (A. hydrophila, A. bestarium, A. salmonicida, A. popoffii), the
“Aeromonas caviae complex” (A. caviae, A. media, A. eucrenophila), and the
“Aeromonas sobria complex” (A. sobria, A. veronii, A. jandaei, A. trota) (557-
562). Generally, Aeromonas species are characterized phenotypically as a Gram-
negative bacilli that can grow at 0% sodium chloride but not 6%; they are generally
cytochrome oxidase positive, ferment glucose, and do not produce acid from
inositol (557-562). For a comprehensive review of biochemical and phenotypical
properties of Aeromonas species, please reference Abbott, S.L. et al (2003) (558).
Most identification is now done by PCR and sequence analysis, with 16S
rRNA, gyrB, and rpoD most commonly used in these analyses. Importantly, these
techniques can be used to identify Aeromonas species in bacterial cultures, from
57
various fish tissues (kidney, spleen, blood, feces, skin, liver, intestine), and from
the water (537, 538, 546, 548, 562-564).
1.3.5.2.3. Control of Aeromonas infections in fish
Since aeromonads are able to infect a wide variety of hosts from diverse
habitats, this pathogen is found ubiquitously throughout the environment. In
aquaculture, the most significant risks of infection are associated with migration of
anadromous fish into aquaculture water supplies, infected fish culture stations near
uncontaminated stations, and sharing of equipment or personnel between stations
(565). Main mechanisms to prevent disease include ultraviolet irradiation or
ozonation of incoming water, fallowing of net pen sites, and education of personnel
(566-568). Topical disinfections and antibiotic regimens have also been shown to
prevent or minimize disease (569). Intraperitoneal immunization with Aeromonas
salmonicida emulsified in oil adjuvants or water has been shown to provide long-
lasting protection and may induce immunity in water temperatures as low as 2oC
(570, 571). This is of particular importance to fisheries in colder climates.
However, the mineral oil vaccine may produce an increased degree of adhesions
between internal organs and the abdominal wall near the site of injection, which
may decrease growth rate (572). While vaccination is only currently done with A.
salmonicida, it is thought that immunization of fishes with other Aeromonas strains
may also be realistic (573). There is also a range of treatment options available,
depending on the species of fish.
58
1.3.5.3. Aeromonas in other organisms
In humans, Aeromonas infections fall into four broad categories: [1.]
gastrointestinal tract disorders; [2.] wound and soft tissue infections; [3.] blood-
borne disease; and [4.] a miscellaneous category of the less frequently encountered
syndromes (535). The scope of the infections in humans caused by aeromonads is
quite broad, ranging from mild disorders such as acute gastroenteritis, to life-
threatening disorders like septicemia, necrotizing fasciitis, and myonecrosis (574).
Other, less frequent infections include intra-abdominal problems (peritonitis),
ocular disease, bone and joint infections, respiratory infections, and urogenital
infections (535). Spikes in Aeromonas infections are common following natural
disasters. For example, following the 2004 tsunami in Thailand, of the 305
survivors with skin and soft tissue infections, Aeromonas was the most commonly
identified pathogen, making up over 20% of the 614 isolates identified (575). There
are also increases in Aeromonas infections that coincide with warmer times of year
(spring, summer) when water temperatures elevate, likely allowing increased
concentrations of Aeromonas in freshwater environments and domestic water
supplies (576, 577). It has been noted that 40-67% of extra-intestinal Aeromonas
infections (ie. septicemia) occur in the summer season (578-580). However,
immune-compromised individuals and trauma patients are at the greatest risk for
Aeromonas infections, with healthy individuals having a comparatively low
infection and mortality rate (535).
In addition to fish and humans, aeromonads are commonly isolated from
other vertebrate and invertebrate hosts. For example, a recent study found
59
Aeromonas within the gastrointestinal tracts of 5-10% of healthy sheep, cattle and
horses (581). Infections in other animals range from ulcerative stomatitis in snakes
and lizards, ‘red leg’ disease in frogs, septicemia in dogs, septic arthritis in calves,
seminal vesiculitis in bulls, and a variety of diseases in seals (582-584).
It has recently been found that Aeromonas is one of two microbial species
found within the intestinal tract of medicinal leeches (585, 586). Using this model,
several classes of genes involved in intestinal colonization have been identified,
including bacterial cell surface modifications, regulatory factors, amino acid and
phosphate transporters, and genes involved in a type III secretion system (T3SS)
(586). Further, genetic manipulations of Aeromonas veronii have identified genes
encoding Braun’s major outer membrane lipoprotein or a gene encoding a
cytoplasmic membrane component of a T3SS result in a 10,000- to 25,000-fold
decrease in colonization (586, 587). Seven other colonization mutants have also
been identified, though the genes involved resulting in this phenotype are currently
unknown (586), and may potentially allow the uncovering of other genes involved
in colonization of gastrointestinal tracts of susceptible hosts.
1.3.5.4. Immune evasion and infection strategies of Aeromonas species
Murine studies have shown that most Aeromonas strains are poorly
phagocytosed by a macrophage cell line (588). Of the 26 strains studied, A. veronii
and A. hydrophila were among the least efficiently phagocytosed (588), even
though aeromonads induce high levels of pro-inflammatory cytokines known to
increase phagocytic responses, namely TNF-α, IL-1β, and IL-6 (589). When the
60
internalized bacteria were studied using a killing assay, it was found that
internalized bacteria replicate within the macrophage cells for 3 hours post-
infection in 31% of strains studied, suggesting aeromonads possess evasion
mechanisms against intracellular killing processes (588). This may be due to the
expression of catalase genes, which protect against reactive oxygen killing
mechanisms and are necessary for proliferation and persistence within the intestinal
tract of the medicinal leech (590). Further, Aeromonas veronii is known to induce
apoptosis in murine macrophages (591), which may be another evasion
mechanism.
Through studies of human wound infections, it is currently thought that
infection requires local attachment, followed by degradation of tissues, and
invasion into deeper tissues (535). This process may be aided by severe
inflammation at the site of infection. Aeromonas species have been shown to have
an elaborate range of microbial proteases, such as metalloproteases, serine
proteases, and aminopeptidases, that can degrade proteins found in serum and
connective tissues (ie. albumin, fibrinogen, elastin, collagen) (592-595). While this
degradation promotes tissue invasion, it also provides essential energy sources for
replication (535). Depletion of nutrients within a local area creates a protein density
gradient, with protein concentration increasing away from the area of colonization.
Most aeromonads are extremely chemotactic towards amino acids, proteins, and
mucins (595), and such chemotactic responses trigger rapid migration into
subcutaneous tissues in motile aeromonads.
Aeromonads also posses a wide range of enterotoxigenic factors that fall into
61
broad categories of cytolytic toxins with hemolytic activity and cytotonic
enterotoxins (596, 597). The best characterized is the pore forming toxin β-
hemolysin, also called Bernheimer’s aerolysin, found in A. hydrophila, A. veronii,
and other species (598, 599). A second family of β-hemolysins, similar to HlyA
hemolysin of Vibrio cholerae, has been found ubiquitously expressed in A.
hydrophila, as well as in A. veronii (12%) (599, 600). Finally, Aeromonas also
express Act, a cytotoxic enterotoxin. This toxin is a type II secreted pore-forming
toxin with hemolytic activity (601). Act has also been shown to induce elevated
levels of TNF-α, IL-1β, and IL-6 (602). In terms of cytotonic enterotoxins, at least
two have been identified: heat-labile Alt and heat-stable Ast (601). In Aeromonas
veronii, a vacuolating toxin has been identified that appears to be a non-hemolytic
serine protease that induces apoptosis (603). Aeromonas species have also been
reported to express invasins, though only a fraction of strains are characterized as
invasive within the intestinal system (604). Finally, A. veronii possess a type III
secretion system (T3SS) that aids in colonization in the medicinal leech (586). The
A. veronii T3SS has been shown to inactivate innate immune cells in a highly
localized manner (587). It is thought that AexU and AexT, two ADP-ribosylating
toxins and effectors of the T3SS, impart these effects (605, 606). Both these toxins
have been shown to be necessary for virulence in mice and fish, respectively. Both
these effectors have been identified in A. veronii (607).
When isolates from human septicemia were further analyzed, it was
discovered that 90% of infections are caused by a small subset of genospecies
(608). Studies have shown that bacteria most associated with blood-borne disease
62
belong to specific sero-groups: O:11, O:16, O:18, and O:34, implying LPS
structure and O-antigens are important to systemic disease (608). Further, the most
bacteremic Aeromonas isolates are resistant to the lytic effects of complement
(608-610). This may be due to the LPS architecture or the possession of S layers
(608-610). Resistance to complement lysis has been linked to rapid degradation of
complement component C3b, preventing formation of the membrane attack
complex (609, 610).
1.4. Summary
Inflammation is an important part of host defense, necessary for wound
healing and defense against pathogens. This process, however, must be tightly
regulated in order to prevent immune-mediated injury to host tissues while still
permitting clearance of pathogenic insults. Phagocytes are central to this process
and are involved in both the initiation and resolution of inflammatory processes.
Depending on the encountered stimuli, phagocytes interface with leukocytes,
directing responses through a variety of mechanisms, including the production of
soluble mediators. While this process is fairly well understood in mammalian
models, there is currently limited knowledge on these responses in lower
vertebrates. By examining unique mechanisms of inflammatory control employed
by teleost macrophages, we will gain important knowledge on the evolution of host
defenses. Further, utilizing these models may allow us to discover novel
mechanisms that may be unique to teleosts or not yet identified in mammals,
allowing a deeper understanding of the immune system.
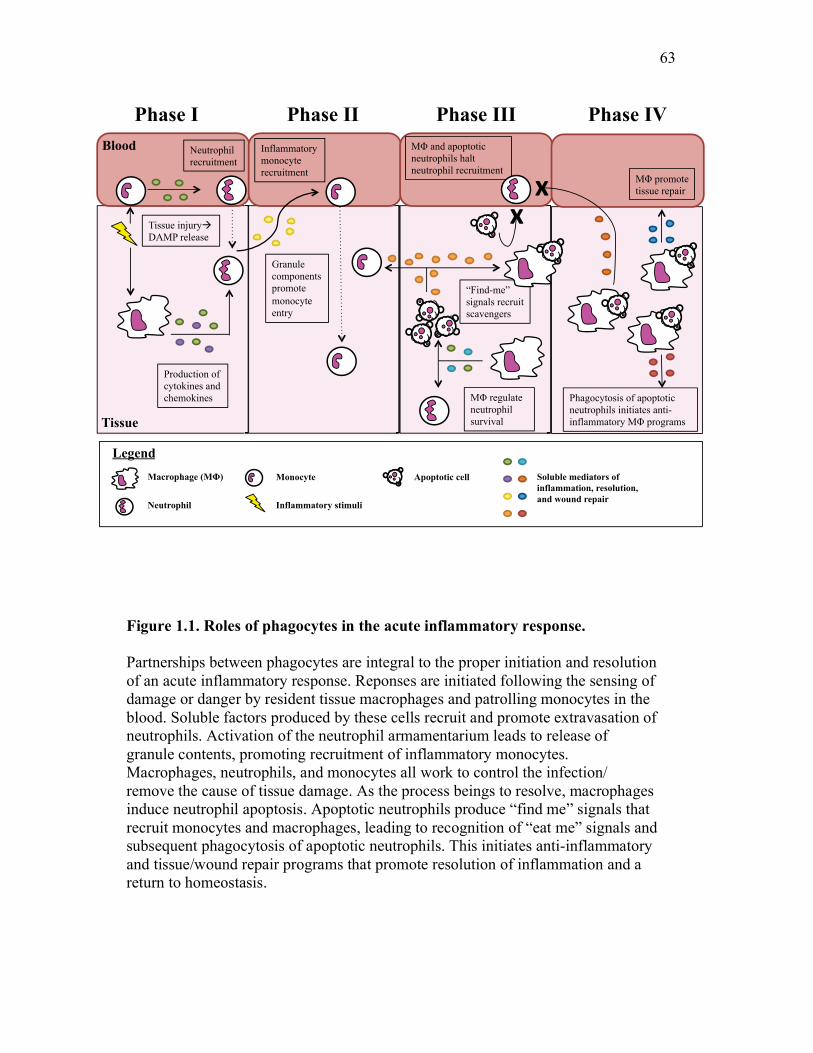
63
Tissue injury DAMP release
Tissue
Blood Neutrophil recruitment
Production of cytokines and chemokines
Inflammatory monocyte recruitment
Granule components promote monocyte entry
Phase I Phase II Phase III Phase IV
MΦ regulate neutrophil survival
“Find-me” signals recruit scavengers
MΦ and apoptotic neutrophils halt neutrophil recruitment
MΦ promote tissue repair
Phagocytosis of apoptotic neutrophils initiates anti-inflammatory MΦ programs
Legend
Inflammatory stimuli
Macrophage (MΦ)
Neutrophil
Monocyte Apoptotic cell Soluble mediators of inflammation, resolution, and wound repair
Figure 1.1. Roles of phagocytes in the acute inflammatory response. Partnerships between phagocytes are integral to the proper initiation and resolution of an acute inflammatory response. Reponses are initiated following the sensing of damage or danger by resident tissue macrophages and patrolling monocytes in the blood. Soluble factors produced by these cells recruit and promote extravasation of neutrophils. Activation of the neutrophil armamentarium leads to release of granule contents, promoting recruitment of inflammatory monocytes. Macrophages, neutrophils, and monocytes all work to control the infection/ remove the cause of tissue damage. As the process beings to resolve, macrophages induce neutrophil apoptosis. Apoptotic neutrophils produce “find me” signals that recruit monocytes and macrophages, leading to recognition of “eat me” signals and subsequent phagocytosis of apoptotic neutrophils. This initiates anti-inflammatory and tissue/wound repair programs that promote resolution of inflammation and a return to homeostasis.
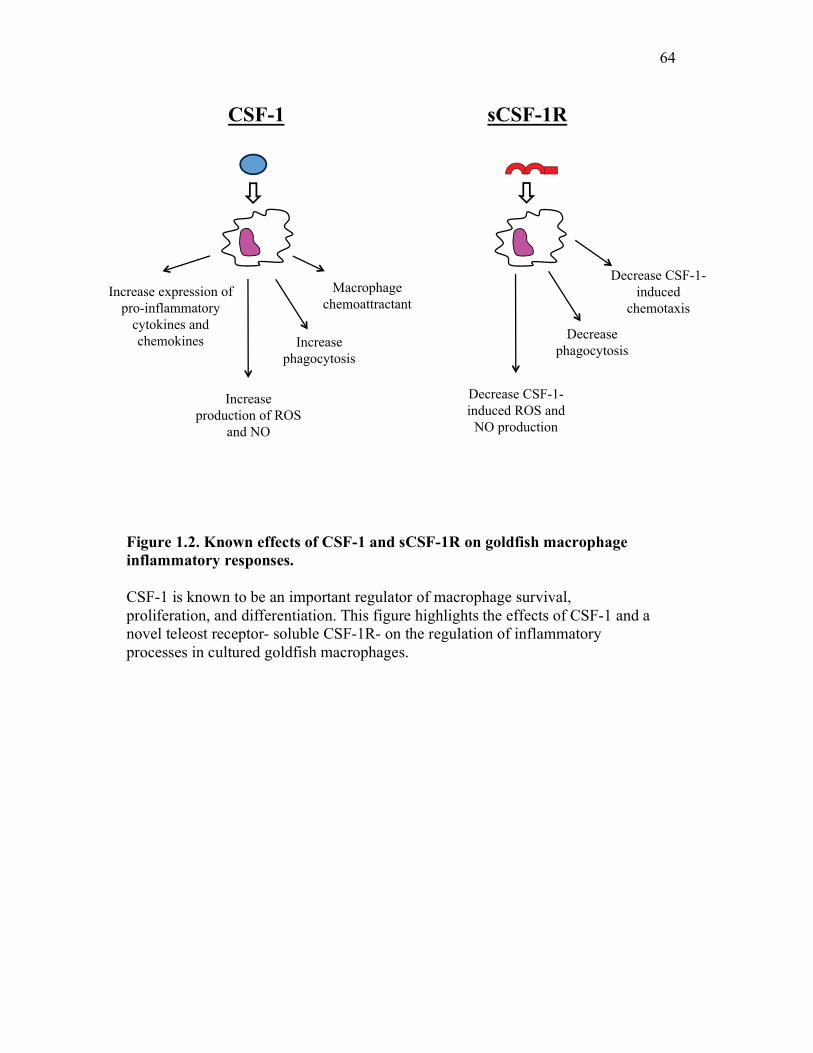
64
CSF-1 sCSF-1R
Increase expression of pro-inflammatory
cytokines and chemokines
Increase production of ROS
and NO
Increase phagocytosis
Macrophage chemoattractant
Decrease CSF-1-induced ROS and
NO production
Decrease CSF-1-induced
chemotaxis
Decrease phagocytosis
Figure 1.2. Known effects of CSF-1 and sCSF-1R on goldfish macrophage inflammatory responses. CSF-1 is known to be an important regulator of macrophage survival, proliferation, and differentiation. This figure highlights the effects of CSF-1 and a novel teleost receptor- soluble CSF-1R- on the regulation of inflammatory processes in cultured goldfish macrophages.
65
1.5. References
1. Silva, M.T. 2009. When two is better than one: macrophages and neutrophils work in concert in innate immunity as complementary and cooperative partners of a myeloid phagocyte system. J Leukoc Biol.
2. Morel, F., Doussiere, J., and Vignais, P.V. 1991. The superoxide-generating oxidase of phagocytic cells. Physiological, molecular and pathological aspects. Eur J Biochem 201:523-546.
3. Nathan, C.F., and Hibbs, J.B., Jr. 1991. Role of nitric oxide synthesis in macrophage antimicrobial activity. Curr Opin Immunol 3:65-70.
4. Stuart, L.M., and Ezekowitz, R.A. 2005. Phagocytosis: elegant complexity. Immunity 22:539-550.
5. Faurschou, M., and Borregaard, N. 2003. Neutrophil granules and secretory vesicles in inflammation. Microbes Infect 5:1317-1327.
6. Zasloff, M. 1992. Antibiotic peptides as mediators of innate immunity. Curr Opin Immunol 4:3-7.
7. Rieger, A.M., Hall, B.E., and Barreda, D.R. 2010. Macrophage activation differentially modulates particle binding, phagocytosis and downstream antimicrobial mechanisms. Dev Comp Immunol 34:1144-1159.
8. Cuesta, A., Rodriguez, A., Salinas, I., Meseguer, J., and Esteban, M.A. 2007. Early local and systemic innate immune responses in the teleost gilthead seabream after intraperitoneal injection of whole yeast cells. Fish Shellfish Immunol 22:242-251.
9. do Vale, A., Afonso, A., and Silva, M.T. 2002. The professional phagocytes of sea bass (Dicentrarchus labrax L.): cytochemical characterisation of neutrophils and macrophages in the normal and inflamed peritoneal cavity. Fish Shellfish Immunol 13:183-198.
10. Palic, D., Ostojic, J., Andreasen, C.B., and Roth, J.A. 2007. Fish cast NETs: neutrophil extracellular traps are released from fish neutrophils. Dev Comp Immunol 31:805-816.
11. Cuesta, A., Meseguer, J., and Esteban, M.A. 2008. The antimicrobial peptide hepcidin exerts an important role in the innate immunity against bacteria in the bony fish gilthead seabream. Mol Immunol 45:2333-2342.
12. Forlenza, M., Scharsack, J.P., Kachamakova, N.M., Taverne-Thiele, A.J., Rombout, J.H., and Wiegertjes, G.F. 2008. Differential contribution of neutrophilic granulocytes and macrophages to nitrosative stress in a host-parasite animal model. Mol Immunol 45:3178-3189.
13. Mulero, I., Noga, E.J., Meseguer, J., Garcia-Ayala, A., and Mulero, V. 2008. The antimicrobial peptides piscidins are stored in the granules of professional phagocytic granulocytes of fish and are delivered to the bacteria-containing phagosome upon phagocytosis. Dev Comp Immunol 32:1531-1538.
14. Li, J., Barreda, D.R., Zhang, Y.A., Boshra, H., Gelman, A.E., Lapatra, S., Tort, L., and Sunyer, J.O. 2006. B lymphocytes from early vertebrates have potent phagocytic and microbicidal abilities. Nat Immunol 7:1116-1124.
66
15. Overland, H.S., Pettersen, E.F., Ronneseth, A., and Wergeland, H.I. 2010. Phagocytosis by B-cells and neutrophils in Atlantic salmon (Salmo salar L.) and Atlantic cod (Gadus morhua L.). Fish Shellfish Immunol 28:193-204.
16. Zhang, Y.A., Salinas, I., Li, J., Parra, D., Bjork, S., Xu, Z., LaPatra, S.E., Bartholomew, J., and Sunyer, J.O. 2010. IgT, a primitive immunoglobulin class specialized in mucosal immunity. Nat Immunol 11:827-835.
17. Parra, D., Rieger, A.M., Li, J., Zhang, Y.A., Randall, L.M., Hunter, C.A., Barreda, D.R., and Sunyer, J.O. 2012. Pivotal advance: peritoneal cavity B-1 B cells have phagocytic and microbicidal capacities and present phagocytosed antigen to CD4+ T cells. J Leukoc Biol 91:525-536.
18. Baldridge, C.W., and Gerard, R.W. 1933. The extra respiration of phagocytosis. Am J Physiol 103:235-236.
19. Babior, B.M., Kipnes, R.S., and Curnutte, J.T. 1973. Biological defense mechanisms. The production by leukocytes of superoxide, a potential bactericidal agent. J Clin Invest 52:741-744.
20. Briggs, R.T., Drath, D.B., Karnovsky, M.L., and Karnovsky, M.J. 1975. Localization of NADH oxidase on the surface of human polymorphonuclear leukocytes by a new cytochemical method. J Cell Biol 67:566-586.
21. Robinson, J.M. 2009. Phagocytic leukocytes and reactive oxygen species. Histochem Cell Biol 131:465-469.
22. Babior, B.M. 1999. NADPH oxidase: an update. Blood 93:1464-1476. 23. Boltana, S., Donate, C., Goetz, F.W., MacKenzie, S., and Balasch, J.C.
2009. Characterization and expression of NADPH oxidase in LPS-, poly(I:C)- and zymosan-stimulated trout (Oncorhynchus mykiss W.) macrophages. Fish Shellfish Immunol 26:651-661.
24. Inoue, Y., Suenaga, Y., Yoshiura, Y., Moritomo, T., Ototake, M., and Nakanishi, T. 2004. Molecular cloning and sequencing of Japanese pufferfish (Takifugu rubripes) NADPH oxidase cDNAs. Dev Comp Immunol 28:911-925.
25. Mayumi, M., Takeda, Y., Hoshiko, M., Serada, K., Murata, M., Moritomo, T., Takizawa, F., Kobayashi, I., Araki, K., Nakanishi, T., et al. 2008. Characterization of teleost phagocyte NADPH oxidase: molecular cloning and expression analysis of carp (Cyprinus carpio) phagocyte NADPH oxidase. Mol Immunol 45:1720-1731.
26. Olavarria, V.H., Gallardo, L., Figueroa, J.E., and Mulero, V. 2010. Lipopolysaccharide primes the respiratory burst of Atlantic salmon SHK-1 cells through protein kinase C-mediated phosphorylation of p47phox. Dev Comp Immunol.
27. Kawahara, T., and Lambeth, J.D. 2007. Molecular evolution of Phox-related regulatory subunits for NADPH oxidase enzymes. BMC Evol Biol 7:178.
28. Kawahara, T., Quinn, M.T., and Lambeth, J.D. 2007. Molecular evolution of the reactive oxygen-generating NADPH oxidase (Nox/Duox) family of enzymes. BMC Evol Biol 7:109.
67
29. Neumann, N.F., Barreda, D.R., and Belosevic, M. 2000. Generation and functional analysis of distinct macrophage sub-populations from goldfish (Carassius auratus L.) kidney leukocyte cultures. Fish Shellfish Immunol 10:1-20.
30. Grayfer, L., and Belosevic, M. 2009. Molecular characterization of tumor necrosis factor receptors 1 and 2 of the goldfish (Carassius aurutus L.). Mol Immunol 46:2190-2199.
31. Grayfer, L., Walsh, J.G., and Belosevic, M. 2008. Characterization and functional analysis of goldfish (Carassius auratus L.) tumor necrosis factor-alpha. Dev Comp Immunol 32:532-543.
32. Grayfer, L., and Belosevic, M. 2009. Molecular characterization, expression and functional analysis of goldfish (Carassius aurutus L.) interferon gamma. Dev Comp Immunol 33:235-246.
33. Zou, J., Carrington, A., Collet, B., Dijkstra, J.M., Yoshiura, Y., Bols, N., and Secombes, C. 2005. Identification and bioactivities of IFN-gamma in rainbow trout Oncorhynchus mykiss: the first Th1-type cytokine characterized functionally in fish. J Immunol 175:2484-2494.
34. Grayfer, L., Garcia, E.G., and Belosevic, M. 2010. Comparison of macrophage antimicrobial responses induced by type II interferons of the goldfish (Carassius auratus L.). J Biol Chem 285:23537-23547.
35. Arts, J.A., Tijhaar, E.J., Chadzinska, M., Savelkoul, H.F., and Verburg-van Kemenade, B.M. 2010. Functional analysis of carp interferon-gamma: evolutionary conservation of classical phagocyte activation. Fish Shellfish Immunol 29:793-802.
36. Grayfer, L., Hanington, P.C., and Belosevic, M. 2009. Macrophage colony-stimulating factor (CSF-1) induces pro-inflammatory gene expression and enhances antimicrobial responses of goldfish (Carassius auratus L.) macrophages. Fish Shellfish Immunol 26:406-413.
37. Harun, N.O., Zou, J., Zhang, Y.A., Nie, P., and Secombes, C.J. 2008. The biological effects of rainbow trout (Oncorhynchus mykiss) recombinant interleukin-8. Dev Comp Immunol 32:673-681.
38. Forlenza, M., Magez, S., Scharsack, J.P., Westphal, A., Savelkoul, H.F., and Wiegertjes, G.F. 2009. Receptor-mediated and lectin-like activities of carp (Cyprinus carpio) TNF-alpha. J Immunol 183:5319-5332.
39. Roca, F.J., Mulero, I., Lopez-Munoz, A., Sepulcre, M.P., Renshaw, S.A., Meseguer, J., and Mulero, V. 2008. Evolution of the inflammatory response in vertebrates: fish TNF-alpha is a powerful activator of endothelial cells but hardly activates phagocytes. J Immunol 181:5071-5081.
40. Stafford, J.L., Galvez, F., Goss, G.G., and Belosevic, M. 2002. Induction of nitric oxide and respiratory burst response in activated goldfish macrophages requires potassium channel activity. Dev Comp Immunol 26:445-459.
41. Nya, E.J., and Austin, B. 2010. Use of bacterial lipopolysaccharide (LPS) as an immunostimulant for the control of Aeromonas hydrophila infections in rainbow trout Oncorhynchus mykiss (Walbaum). J Appl Microbiol 108:686-694.
68
42. Sepulcre, M.P., Lopez-Castejon, G., Meseguer, J., and Mulero, V. 2007. The activation of gilthead seabream professional phagocytes by different PAMPs underlines the behavioural diversity of the main innate immune cells of bony fish. Mol Immunol 44:2009-2016.
43. Cuesta, A., Salinas, I., Esteban, M.A., and Meseguer, J. 2008. Unmethylated CpG motifs mimicking bacterial DNA triggers the local and systemic innate immune parameters and expression of immune-relevant genes in gilthead seabream. Fish Shellfish Immunol 25:617-624.
44. Katzenback, B.A., and Belosevic, M. 2009. Isolation and functional characterization of neutrophil-like cells, from goldfish (Carassius auratus L.) kidney. Dev Comp Immunol 33:601-611.
45. Ardo, L., Jeney, Z., Adams, A., and Jeney, G. 2010. Immune responses of resistant and sensitive common carp families following experimental challenge with Aeromonas hydrophila. Fish Shellfish Immunol 29:111-116.
46. Chaves-Pozo, E., Munoz, P., Lopez-Munoz, A., Pelegrin, P., Garcia Ayala, A., Mulero, V., and Meseguer, J. 2005. Early innate immune response and redistribution of inflammatory cells in the bony fish gilthead seabream experimentally infected with Vibrio anguillarum. Cell Tissue Res 320:61-68.
47. Nikoskelainen, S., Kjellsen, O., Lilius, E.M., and Schroder, M.B. 2006. Respiratory burst activity of Atlantic cod (Gadus morhua L.) blood phagocytes differs markedly from that of rainbow trout. Fish Shellfish Immunol 21:199-208.
48. Serada, K., Moritomo, T., Teshirogi, K., Itou, T., Shibashi, T., Inoue, Y., and Nakanishi, T. 2005. Comparison of respiratory burst activity of inflammatory neutrophils in ayu (Plecoglossus altivelis) and carp (Cyprinus carpio). Fish Shellfish Immunol 19:363-373.
49. Sasada, M., and Johnston, R.B., Jr. 1980. Macrophage microbicidal activity. Correlation between phagocytosis-associated oxidative metabolism and the killing of Candida by macrophages. J Exp Med 152:85-98.
50. Nakagawara, A., DeSantis, N.M., Nogueira, N., and Nathan, C.F. 1982. Lymphokines enhance the capacity of human monocytes to secret reactive oxygen intermediates. J Clin Invest 70:1042-1048.
51. Watson, R.W., Redmond, H.P., and Bouchier-Hayes, D. 1994. Role of endotoxin in mononuclear phagocyte-mediated inflammatory responses. J Leukoc Biol 56:95-103.
52. Landmann, R., Scherer, F., Schumann, R., Link, S., Sansano, S., and Zimmerli, W. 1995. LPS directly induces oxygen radical production in human monocytes via LPS binding protein and CD14. J Leukoc Biol 57:440-449.
53. Kaplan, J.E., Chrenek, R.D., Morash, J.G., Ruksznis, C.M., and Hannum, L.G. 2008. Rhythmic patterns in phagocytosis and the production of reactive oxygen species by zebrafish leukocytes. Comp Biochem Physiol A Mol Integr Physiol 151:726-730.
54. MacMicking, J., Xie, Q.W., and Nathan, C. 1997. Nitric oxide and macrophage function. Annu Rev Immunol 15:323-350.
69
55. Knowles, R.G., and Moncada, S. 1994. Nitric oxide synthases in mammals. Biochem J 298 ( Pt 2):249-258.
56. Laing, K.J., Grabowski, P.S., Belosevic, M., and Secombes, C.J. 1996. A partial sequence for nitric oxide synthase from a goldfish (Carassius auratus) macrophage cell line. Immunol Cell Biol 74:374-379.
57. Saeij, J.P., Stet, R.J., Groeneveld, A., Verburg-van Kemenade, L.B., van Muiswinkel, W.B., and Wiegertjes, G.F. 2000. Molecular and functional characterization of a fish inducible-type nitric oxide synthase. Immunogenetics 51:339-346.
58. Wang, T., Ward, M., Grabowski, P., and Secombes, C.J. 2001. Molecular cloning, gene organization and expression of rainbow trout (Oncorhynchus mykiss) inducible nitric oxide synthase (iNOS) gene. Biochem J 358:747-755.
59. Lepiller, S., Franche, N., Solary, E., Chluba, J., and Laurens, V. 2009. Comparative analysis of zebrafish nos2a and nos2b genes. Gene 445:58-65.
60. Reddick, J.I., Goostrey, A., and Secombes, C.J. 2006. Cloning of iNOS in the small spotted catshark (Scyliorhinus canicula). Dev Comp Immunol 30:1009-1022.
61. Cox, R.L., Mariano, T., Heck, D.E., Laskin, J.D., and Stegeman, J.J. 2001. Nitric oxide synthase sequences in the marine fish Stenotomus chrysops and the sea urchin Arbacia punctulata, and phylogenetic analysis of nitric oxide synthase calmodulin-binding domains. Comp Biochem Physiol B Biochem Mol Biol 130:479-491.
62. Barroso, J.B., Carreras, A., Esteban, F.J., Peinado, M.A., Martinez-Lara, E., Valderrama, R., Jimenez, A., Rodrigo, J., and Lupianez, J.A. 2000. Molecular and kinetic characterization and cell type location of inducible nitric oxide synthase in fish. Am J Physiol Regul Integr Comp Physiol 279:R650-656.
63. Ordas, M.C., Costa, M.M., Roca, F.J., Lopez-Castejon, G., Mulero, V., Meseguer, J., Figueras, A., and Novoa, B. 2007. Turbot TNFalpha gene: molecular characterization and biological activity of the recombinant protein. Mol Immunol 44:389-400.
64. Hanington, P.C., and Belosevic, M. 2007. Interleukin-6 family cytokine M17 induces differentiation and nitric oxide response of goldfish (Carassius auratus L.) macrophages. Dev Comp Immunol 31:817-829.
65. Hanington, P.C., Hitchen, S.J., Beamish, L.A., and Belosevic, M. 2009. Macrophage colony stimulating factor (CSF-1) is a central growth factor of goldfish macrophages. Fish Shellfish Immunol 26:1-9.
66. Tafalla, C., and Novoa, B. 2000. Requirements for nitric oxide production by turbot (Scophthalmus maximus) head kidney macrophages. Dev Comp Immunol 24:623-631.
67. Stafford, J.L., Neumann, N.F., and Belosevic, M. 2001. Products of proteolytic cleavage of transferrin induce nitric oxide response of goldfish macrophages. Dev Comp Immunol 25:101-115.
70
68. Stafford, J.L., Wilson, E.C., and Belosevic, M. 2004. Recombinant transferrin induces nitric oxide response in goldfish and murine macrophages. Fish Shellfish Immunol 17:171-185.
69. Haddad, G., and Belosevic, M. 2009. Transferrin-derived synthetic peptide induces highly conserved pro-inflammatory responses of macrophages. Mol Immunol 46:576-586.
70. Stafford, J.L., and Belosevic, M. 2003. Transferrin and the innate immune response of fish: identification of a novel mechanism of macrophage activation. Dev Comp Immunol 27:539-554.
71. Ford, M.J. 2001. Molecular evolution of transferrin: evidence for positive selection in salmonids. Mol Biol Evol 18:639-647.
72. Yang, L., Zhou, L., and Gui, J.F. 2004. Molecular basis of transferrin polymorphism in goldfish (Carassius auratus). Genetica 121:303-313.
73. Valenta, M., Stratil, A., Slechtova, V., Kalal, L., and Slechta, V. 1976. Polymorphism of transferrin in carp (Cyprinus carpio L.): genetic determination, isolation, and partial characterization. Biochem Genet 14:27-45.
74. Jurecka, P., Irnazarow, I., Stafford, J.L., Ruszczyk, A., Taverne, N., Belosevic, M., Savelkoul, H.F., and Wiegertjes, G.F. 2009. The induction of nitric oxide response of carp macrophages by transferrin is influenced by the allelic diversity of the molecule. Fish Shellfish Immunol 26:632-638.
75. Tafalla, C., Figueras, A., and Novoa, B. 1999. Role of nitric oxide on the replication of viral haemorrhagic septicemia virus (VHSV), a fish rhabdovirus. Vet Immunol Immunopathol 72:249-256.
76. Campos-Perez, J.J., Ellis, A.E., and Secombes, C.J. 2000. Toxicity of nitric oxide and peroxynitrite to bacterial pathogens of fish. Dis Aquat Organ 43:109-115.
77. Forlenza, M., Nakao, M., Wibowo, I., Joerink, M., Arts, J.A., Savelkoul, H.F., and Wiegertjes, G.F. 2009. Nitric oxide hinders antibody clearance from the surface of Trypanoplasma borreli and increases susceptibility to complement-mediated lysis. Mol Immunol 46:3188-3197.
78. Haddad, G., Hanington, P.C., Wilson, E.C., Grayfer, L., and Belosevic, M. 2008. Molecular and functional characterization of goldfish (Carassius auratus L.) transforming growth factor beta. Dev Comp Immunol 32:654-663.
79. Pietsch, C., Vogt, R., Neumann, N., and Kloas, W. 2008. Production of nitric oxide by carp (Cyprinus carpio L.) kidney leukocytes is regulated by cyclic 3',5'-adenosine monophosphate. Comp Biochem Physiol A Mol Integr Physiol 150:58-65.
80. Joerink, M., Savelkoul, H.F., and Wiegertjes, G.F. 2006. Evolutionary conservation of alternative activation of macrophages: structural and functional characterization of arginase 1 and 2 in carp (Cyprinus carpio L.). Mol Immunol 43:1116-1128.
81. Saeij, J.P., van Muiswinkel, W.B., van de Meent, M., Amaral, C., and Wiegertjes, G.F. 2003. Different capacities of carp leukocytes to encounter
71
nitric oxide-mediated stress: a role for the intracellular reduced glutathione pool. Dev Comp Immunol 27:555-568.
82. Jutras, I., and Desjardins, M. 2005. Phagocytosis: at the crossroads of innate and adaptive immunity. Annu Rev Cell Dev Biol 21:511-527.
83. Delamarre, L., Pack, M., Chang, H., Mellman, I., and Trombetta, E.S. 2005. Differential lysosomal proteolysis in antigen-presenting cells determines antigen fate. Science 307:1630-1634.
84. Palic, D., Andreasen, C.B., Menzel, B.W., and Roth, J.A. 2005. A rapid, direct assay to measure degranulation of primary granules in neutrophils from kidney of fathead minnow (Pimephales promelas Rafinesque, 1820). Fish Shellfish Immunol 19:217-227.
85. Wernersson, S., Reimer, J.M., Poorafshar, M., Karlson, U., Wermenstam, N., Bengten, E., Wilson, M., Pilstrom, L., and Hellman, L. 2006. Granzyme-like sequences in bony fish shed light on the emergence of hematopoietic serine proteases during vertebrate evolution. Dev Comp Immunol 30:901-918.
86. Brinkmann, V., Reichard, U., Goosmann, C., Fauler, B., Uhlemann, Y., Weiss, D.S., Weinrauch, Y., and Zychlinsky, A. 2004. Neutrophil extracellular traps kill bacteria. Science 303:1532-1535.
87. Palic, D., Andreasen, C.B., Ostojic, J., Tell, R.M., and Roth, J.A. 2007. Zebrafish (Danio rerio) whole kidney assays to measure neutrophil extracellular trap release and degranulation of primary granules. J Immunol Methods 319:87-97.
88. Noga, E.J., Silphaduang, U., Park, N.G., Seo, J.K., Stephenson, J., and Kozlowicz, S. 2009. Piscidin 4, a novel member of the piscidin family of antimicrobial peptides. Comp Biochem Physiol B Biochem Mol Biol 152:299-305.
89. Jenssen, H., Hamill, P., and Hancock, R.E. 2006. Peptide antimicrobial agents. Clin Microbiol Rev 19:491-511.
90. Casadei, E., Wang, T., Zou, J., Gonzalez Vecino, J.L., Wadsworth, S., and Secombes, C.J. 2009. Characterization of three novel beta-defensin antimicrobial peptides in rainbow trout (Oncorhynchus mykiss). Mol Immunol 46:3358-3366.
91. Moritomo, T., Serata, K., Teshirogi, K., Aikawa, H., Inoue, Y., Itou, T., and Nakanishi, T. 2003. Flow cytometric analysis of the neutrophil respiratory burst of ayu, Plecoglossus altivelis: comparison with other fresh water fish. Fish Shellfish Immunol 15:29-38.
92. Scharsack, J.P., Steinhagen, D., Kleczka, C., Schmidt, J.O., Korting, W., Michael, R.D., Leibold, W., and Schuberth, H.J. 2003. Head kidney neutrophils of carp (Cyprinus carpio L.) are functionally modulated by the haemoflagellateTrypanoplasma borreli. Fish Shellfish Immunol 14:389-403.
93. Leiro, J., Iglesias, R., Parama, A., Sanmartin, M.L., and Ubeira, F.M. 2001. Effect of Tetramicra brevifilum (Microspora) infection on respiratory-burst responses of turbot (Scophthalmus maximus L.) phagocytes. Fish Shellfish Immunol 11:639-652.
72
94. Janeway, C.A., Jr. 1989. Approaching the asymptote? Evolution and revolution in immunology. Cold Spring Harb Symp Quant Biol 54 Pt 1:1-13.
95. Matzinger, P. 2002. An innate sense of danger. Ann N Y Acad Sci 961:341-342.
96. Matzinger, P. 2002. The danger model: a renewed sense of self. Science 296:301-305.
97. Matzinger, P. 2007. Friendly and dangerous signals: is the tissue in control? Nat Immunol 8:11-13.
98. Matzinger, P. 2012. The evolution of the danger theory. Interview by Lauren Constable, Commissioning Editor. Expert Rev Clin Immunol 8:311-317.
99. Kono, H., and Rock, K.L. 2008. How dying cells alert the immune system to danger. Nat Rev Immunol 8:279-289.
100. Lotze, M.T., and Tracey, K.J. 2005. High-mobility group box 1 protein (HMGB1): nuclear weapon in the immune arsenal. Nat Rev Immunol 5:331-342.
101. Scaffidi, P., Misteli, T., and Bianchi, M.E. 2002. Release of chromatin protein HMGB1 by necrotic cells triggers inflammation. Nature 418:191-195.
102. Rovere-Querini, P., Capobianco, A., Scaffidi, P., Valentinis, B., Catalanotti, F., Giazzon, M., Dumitriu, I.E., Muller, S., Iannacone, M., Traversari, C., et al. 2004. HMGB1 is an endogenous immune adjuvant released by necrotic cells. EMBO Rep 5:825-830.
103. Andersson, U., Wang, H., Palmblad, K., Aveberger, A.C., Bloom, O., Erlandsson-Harris, H., Janson, A., Kokkola, R., Zhang, M., Yang, H., et al. 2000. High mobility group 1 protein (HMG-1) stimulates proinflammatory cytokine synthesis in human monocytes. J Exp Med 192:565-570.
104. Orlova, V.V., Choi, E.Y., Xie, C., Chavakis, E., Bierhaus, A., Ihanus, E., Ballantyne, C.M., Gahmberg, C.G., Bianchi, M.E., Nawroth, P.P., et al. 2007. A novel pathway of HMGB1-mediated inflammatory cell recruitment that requires Mac-1-integrin. EMBO J 26:1129-1139.
105. Ishii, K.J., Suzuki, K., Coban, C., Takeshita, F., Itoh, Y., Matoba, H., Kohn, L.D., and Klinman, D.M. 2001. Genomic DNA released by dying cells induces the maturation of APCs. J Immunol 167:2602-2607.
106. Decker, P., Singh-Jasuja, H., Haager, S., Kotter, I., and Rammensee, H.G. 2005. Nucleosome, the main autoantigen in systemic lupus erythematosus, induces direct dendritic cell activation via a MyD88-independent pathway: consequences on inflammation. J Immunol 174:3326-3334.
107. Ronnefarth, V.M., Erbacher, A.I., Lamkemeyer, T., Madlung, J., Nordheim, A., Rammensee, H.G., and Decker, P. 2006. TLR2/TLR4-independent neutrophil activation and recruitment upon endocytosis of nucleosomes reveals a new pathway of innate immunity in systemic lupus erythematosus. J Immunol 177:7740-7749.
108. Boule, M.W., Broughton, C., Mackay, F., Akira, S., Marshak-Rothstein, A., and Rifkin, I.R. 2004. Toll-like receptor 9-dependent and -independent
73
dendritic cell activation by chromatin-immunoglobulin G complexes. J Exp Med 199:1631-1640.
109. Feng, H., Zeng, Y., Graner, M.W., Likhacheva, A., and Katsanis, E. 2003. Exogenous stress proteins enhance the immunogenicity of apoptotic tumor cells and stimulate antitumor immunity. Blood 101:245-252.
110. Basu, S., and Srivastava, P.K. 2000. Heat shock proteins: the fountainhead of innate and adaptive immune responses. Cell Stress Chaperones 5:443-451.
111. Asea, A., Kabingu, E., Stevenson, M.A., and Calderwood, S.K. 2000. HSP70 peptidembearing and peptide-negative preparations act as chaperokines. Cell Stress Chaperones 5:425-431.
112. Wallin, R.P., Lundqvist, A., More, S.H., von Bonin, A., Kiessling, R., and Ljunggren, H.G. 2002. Heat-shock proteins as activators of the innate immune system. Trends Immunol 23:130-135.
113. Schmitt, E., Gehrmann, M., Brunet, M., Multhoff, G., and Garrido, C. 2007. Intracellular and extracellular functions of heat shock proteins: repercussions in cancer therapy. J Leukoc Biol 81:15-27.
114. Cronstein, B.N., Daguma, L., Nichols, D., Hutchison, A.J., and Williams, M. 1990. The adenosine/neutrophil paradox resolved: human neutrophils possess both A1 and A2 receptors that promote chemotaxis and inhibit O2 generation, respectively. J Clin Invest 85:1150-1157.
115. Poelstra, K., Heynen, E.R., Baller, J.F., Hardonk, M.J., and Bakker, W.W. 1992. Modulation of anti-Thy1 nephritis in the rat by adenine nucleotides. Evidence for an anti-inflammatory role for nucleotidases. Lab Invest 66:555-563.
116. Bours, M.J., Swennen, E.L., Di Virgilio, F., Cronstein, B.N., and Dagnelie, P.C. 2006. Adenosine 5'-triphosphate and adenosine as endogenous signaling molecules in immunity and inflammation. Pharmacol Ther 112:358-404.
117. Fredholm, B.B. 2007. Adenosine, an endogenous distress signal, modulates tissue damage and repair. Cell Death Differ 14:1315-1323.
118. la Sala, A., Ferrari, D., Corinti, S., Cavani, A., Di Virgilio, F., and Girolomoni, G. 2001. Extracellular ATP induces a distorted maturation of dendritic cells and inhibits their capacity to initiate Th1 responses. J Immunol 166:1611-1617.
119. Medzhitov, R., Preston-Hurlburt, P., and Janeway, C.A., Jr. 1997. A human homologue of the Drosophila Toll protein signals activation of adaptive immunity. Nature 388:394-397.
120. Medzhitov, R. 2007. Recognition of microorganisms and activation of the immune response. Nature 449:819-826.
121. Medzhitov, R. 2007. TLR-mediated innate immune recognition. Semin Immunol 19:1-2.
122. Auffray, C., Fogg, D., Garfa, M., Elain, G., Join-Lambert, O., Kayal, S., Sarnacki, S., Cumano, A., Lauvau, G., and Geissmann, F. 2007. Monitoring of blood vessels and tissues by a population of monocytes with patrolling behavior. Science 317:666-670.
74
123. Auffray, C., Sieweke, M.H., and Geissmann, F. 2009. Blood monocytes: development, heterogeneity, and relationship with dendritic cells. Annu Rev Immunol 27:669-692.
124. Lin, M., Carlson, E., Diaconu, E., and Pearlman, E. 2007. CXCL1/KC and CXCL5/LIX are selectively produced by corneal fibroblasts and mediate neutrophil infiltration to the corneal stroma in LPS keratitis. J Leukoc Biol 81:786-792.
125. Scapini, P., Morini, M., Tecchio, C., Minghelli, S., Di Carlo, E., Tanghetti, E., Albini, A., Lowell, C., Berton, G., Noonan, D.M., et al. 2004. CXCL1/macrophage inflammatory protein-2-induced angiogenesis in vivo is mediated by neutrophil-derived vascular endothelial growth factor-A. J Immunol 172:5034-5040.
126. Moser, B., Clark-Lewis, I., Zwahlen, R., and Baggiolini, M. 1990. Neutrophil-activating properties of the melanoma growth-stimulatory activity. J Exp Med 171:1797-1802.
127. Schumacher, C., Clark-Lewis, I., Baggiolini, M., and Moser, B. 1992. High- and low-affinity binding of GRO alpha and neutrophil-activating peptide 2 to interleukin 8 receptors on human neutrophils. Proc Natl Acad Sci U S A 89:10542-10546.
128. de Oliveira, S., Reyes-Aldasoro, C.C., Candel, S., Renshaw, S.A., Mulero, V., and Calado, A. 2013. Cxcl8 (IL-8) mediates neutrophil recruitment and behavior in the zebrafish inflammatory response. J Immunol 190:4349-4359.
129. Yamamoto, S., Shimizu, S., Kiyonaka, S., Takahashi, N., Wajima, T., Hara, Y., Negoro, T., Hiroi, T., Kiuchi, Y., Okada, T., et al. 2008. TRPM2-mediated Ca2+influx induces chemokine production in monocytes that aggravates inflammatory neutrophil infiltration. Nat Med 14:738-747.
130. Soehnlein, O., and Lindbom, L. 2010. Phagocyte partnership during the onset and resolution of inflammation. Nat Rev Immunol 10:427-439.
131. Ley, K., Laudanna, C., Cybulsky, M.I., and Nourshargh, S. 2007. Getting to the site of inflammation: the leukocyte adhesion cascade updated. Nat Rev Immunol 7:678-689.
132. Lacy, P., and Eitzen, G. 2008. Control of granule exocytosis in neutrophils. Front Biosci 13:5559-5570.
133. Borregaard, N., and Cowland, J.B. 1997. Granules of the human neutrophilic polymorphonuclear leukocyte. Blood 89:3503-3521.
134. Borregaard, N. 1997. Development of neutrophil granule diversity. Ann N Y Acad Sci 832:62-68.
135. Yang, D., de la Rosa, G., Tewary, P., and Oppenheim, J.J. 2009. Alarmins link neutrophils and dendritic cells. Trends Immunol 30:531-537.
136. Yang, D., Chen, Q., Chertov, O., and Oppenheim, J.J. 2000. Human neutrophil defensins selectively chemoattract naive T and immature dendritic cells. J Leukoc Biol 68:9-14.
137. Chertov, O., Ueda, H., Xu, L.L., Tani, K., Murphy, W.J., Wang, J.M., Howard, O.M., Sayers, T.J., and Oppenheim, J.J. 1997. Identification of human neutrophil-derived cathepsin G and azurocidin/CAP37 as
75
chemoattractants for mononuclear cells and neutrophils. J Exp Med 186:739-747.
138. Soehnlein, O., Zernecke, A., Eriksson, E.E., Rothfuchs, A.G., Pham, C.T., Herwald, H., Bidzhekov, K., Rottenberg, M.E., Weber, C., and Lindbom, L. 2008. Neutrophil secretion products pave the way for inflammatory monocytes. Blood 112:1461-1471.
139. Soehnlein, O. 2009. An elegant defense: how neutrophils shape the immune response. Trends Immunol 30:511-512.
140. Soehnlein, O., Lindbom, L., and Weber, C. 2009. Mechanisms underlying neutrophil-mediated monocyte recruitment. Blood 114:4613-4623.
141. Taga, T., Hibi, M., Hirata, Y., Yamasaki, K., Yasukawa, K., Matsuda, T., Hirano, T., and Kishimoto, T. 1989. Interleukin-6 triggers the association of its receptor with a possible signal transducer, gp130. Cell 58:573-581.
142. Romano, M., Sironi, M., Toniatti, C., Polentarutti, N., Fruscella, P., Ghezzi, P., Faggioni, R., Luini, W., van Hinsbergh, V., Sozzani, S., et al. 1997. Role of IL-6 and its soluble receptor in induction of chemokines and leukocyte recruitment. Immunity 6:315-325.
143. Hurst, S.M., Wilkinson, T.S., McLoughlin, R.M., Jones, S., Horiuchi, S., Yamamoto, N., Rose-John, S., Fuller, G.M., Topley, N., and Jones, S.A. 2001. Il-6 and its soluble receptor orchestrate a temporal switch in the pattern of leukocyte recruitment seen during acute inflammation. Immunity 14:705-714.
144. Pahlman, L.I., Morgelin, M., Eckert, J., Johansson, L., Russell, W., Riesbeck, K., Soehnlein, O., Lindbom, L., Norrby-Teglund, A., Schumann, R.R., et al. 2006. Streptococcal M protein: a multipotent and powerful inducer of inflammation. J Immunol 177:1221-1228.
145. Berahovich, R.D., Miao, Z., Wang, Y., Premack, B., Howard, M.C., and Schall, T.J. 2005. Proteolytic activation of alternative CCR1 ligands in inflammation. J Immunol 174:7341-7351.
146. Kasama, T., Strieter, R.M., Standiford, T.J., Burdick, M.D., and Kunkel, S.L. 1993. Expression and regulation of human neutrophil-derived macrophage inflammatory protein 1 alpha. J Exp Med 178:63-72.
147. Pelletier, M., Maggi, L., Micheletti, A., Lazzeri, E., Tamassia, N., Costantini, C., Cosmi, L., Lunardi, C., Annunziato, F., Romagnani, S., et al. 2010. Evidence for a cross-talk between human neutrophils and Th17 cells. Blood 115:335-343.
148. Scapini, P., Laudanna, C., Pinardi, C., Allavena, P., Mantovani, A., Sozzani, S., and Cassatella, M.A. 2001. Neutrophils produce biologically active macrophage inflammatory protein-3alpha (MIP-3alpha)/CCL20 and MIP-3beta/CCL19. Eur J Immunol 31:1981-1988.
149. Levy, B.D., Clish, C.B., Schmidt, B., Gronert, K., and Serhan, C.N. 2001. Lipid mediator class switching during acute inflammation: signals in resolution. Nat Immunol 2:612-619.
150. Funk, C.D. 2001. Prostaglandins and leukotrienes: advances in eicosanoid biology. Science 294:1871-1875.
76
151. Serhan, C.N., Chiang, N., and Van Dyke, T.E. 2008. Resolving inflammation: dual anti-inflammatory and pro-resolution lipid mediators. Nat Rev Immunol 8:349-361.
152. Serhan, C.N., Yacoubian, S., and Yang, R. 2008. Anti-inflammatory and proresolving lipid mediators. Annu Rev Pathol 3:279-312.
153. Maddox, J.F., Hachicha, M., Takano, T., Petasis, N.A., Fokin, V.V., and Serhan, C.N. 1997. Lipoxin A4 stable analogs are potent mimetics that stimulate human monocytes and THP-1 cells via a G-protein-linked lipoxin A4 receptor. J Biol Chem 272:6972-6978.
154. Chiang, N., Serhan, C.N., Dahlen, S.E., Drazen, J.M., Hay, D.W., Rovati, G.E., Shimizu, T., Yokomizo, T., and Brink, C. 2006. The lipoxin receptor ALX: potent ligand-specific and stereoselective actions in vivo. Pharmacol Rev 58:463-487.
155. Schwab, J.M., Chiang, N., Arita, M., and Serhan, C.N. 2007. Resolvin E1 and protectin D1 activate inflammation-resolution programmes. Nature 447:869-874.
156. Ariel, A., Fredman, G., Sun, Y.P., Kantarci, A., Van Dyke, T.E., Luster, A.D., and Serhan, C.N. 2006. Apoptotic neutrophils and T cells sequester chemokines during immune response resolution through modulation of CCR5 expression. Nat Immunol 7:1209-1216.
157. Kantari, C., Pederzoli-Ribeil, M., and Witko-Sarsat, V. 2008. The role of neutrophils and monocytes in innate immunity. Contrib Microbiol 15:118-146.
158. van den Berg, J.M., Weyer, S., Weening, J.J., Roos, D., and Kuijpers, T.W. 2001. Divergent effects of tumor necrosis factor alpha on apoptosis of human neutrophils. J Leukoc Biol 69:467-473.
159. Allenbach, C., Zufferey, C., Perez, C., Launois, P., Mueller, C., and Tacchini-Cottier, F. 2006. Macrophages induce neutrophil apoptosis through membrane TNF, a process amplified by Leishmania major. J Immunol 176:6656-6664.
160. Meszaros, A.J., Reichner, J.S., and Albina, J.E. 2000. Macrophage-induced neutrophil apoptosis. J Immunol 165:435-441.
161. Rosen, H., and Gordon, S. 1990. Adoptive transfer of fluorescence-labeled cells shows that resident peritoneal macrophages are able to migrate into specialized lymphoid organs and inflammatory sites in the mouse. Eur J Immunol 20:1251-1258.
162. Bellingan, G.J., Caldwell, H., Howie, S.E., Dransfield, I., and Haslett, C. 1996. In vivo fate of the inflammatory macrophage during the resolution of inflammation: inflammatory macrophages do not die locally, but emigrate to the draining lymph nodes. J Immunol 157:2577-2585.
163. Lauber, K., Bohn, E., Krober, S.M., Xiao, Y.J., Blumenthal, S.G., Lindemann, R.K., Marini, P., Wiedig, C., Zobywalski, A., Baksh, S., et al. 2003. Apoptotic cells induce migration of phagocytes via caspase-3-mediated release of a lipid attraction signal. Cell 113:717-730.
164. Elliott, M.R., Chekeni, F.B., Trampont, P.C., Lazarowski, E.R., Kadl, A., Walk, S.F., Park, D., Woodson, R.I., Ostankovich, M., Sharma, P., et al.

77
2009. Nucleotides released by apoptotic cells act as a find-me signal to promote phagocytic clearance. Nature 461:282-286.
165. Truman, L.A., Ford, C.A., Pasikowska, M., Pound, J.D., Wilkinson, S.J., Dumitriu, I.E., Melville, L., Melrose, L.A., Ogden, C.A., Nibbs, R., et al. 2008. CX3CL1/fractalkine is released from apoptotic lymphocytes to stimulate macrophage chemotaxis. Blood 112:5026-5036.
166. Zhao, M., Song, B., Pu, J., Wada, T., Reid, B., Tai, G., Wang, F., Guo, A., Walczysko, P., Gu, Y., et al. 2006. Electrical signals control wound healing through phosphatidylinositol-3-OH kinase-gamma and PTEN. Nature 442:457-460.
167. Ravichandran, K.S., and Lorenz, U. 2007. Engulfment of apoptotic cells: signals for a good meal. Nat Rev Immunol 7:964-974.
168. Henson, P.M., Bratton, D.L., and Fadok, V.A. 2001. Apoptotic cell removal. Curr Biol 11:R795-805.
169. Savill, J., Dransfield, I., Gregory, C., and Haslett, C. 2002. A blast from the past: clearance of apoptotic cells regulates immune responses. Nat Rev Immunol 2:965-975.
170. Fadok, V.A., Bratton, D.L., Frasch, S.C., Warner, M.L., and Henson, P.M. 1998. The role of phosphatidylserine in recognition of apoptotic cells by phagocytes. Cell Death Differ 5:551-562.
171. Fadok, V.A., Warner, M.L., Bratton, D.L., and Henson, P.M. 1998. CD36 is required for phagocytosis of apoptotic cells by human macrophages that use either a phosphatidylserine receptor or the vitronectin receptor (alpha v beta 3). J Immunol 161:6250-6257.
172. Devitt, A., Moffatt, O.D., Raykundalia, C., Capra, J.D., Simmons, D.L., and Gregory, C.D. 1998. Human CD14 mediates recognition and phagocytosis of apoptotic cells. Nature 392:505-509.
173. Schlegel, R.A., Krahling, S., Callahan, M.K., and Williamson, P. 1999. CD14 is a component of multiple recognition systems used by macrophages to phagocytose apoptotic lymphocytes. Cell Death Differ 6:583-592.
174. Ezekowitz, R.A., Sastry, K., Bailly, P., and Warner, A. 1990. Molecular characterization of the human macrophage mannose receptor: demonstration of multiple carbohydrate recognition-like domains and phagocytosis of yeasts in Cos-1 cells. J Exp Med 172:1785-1794.
175. Savill, J., Dransfield, I., Hogg, N., and Haslett, C. 1990. Vitronectin receptor-mediated phagocytosis of cells undergoing apoptosis. Nature 343:170-173.
176. Gregory, C.D., Devitt, A., and Moffatt, O. 1998. Roles of ICAM-3 and CD14 in the recognition and phagocytosis of apoptotic cells by macrophages. Biochem Soc Trans 26:644-649.
177. Gardai, S.J., McPhillips, K.A., Frasch, S.C., Janssen, W.J., Starefeldt, A., Murphy-Ullrich, J.E., Bratton, D.L., Oldenborg, P.A., Michalak, M., and Henson, P.M. 2005. Cell-surface calreticulin initiates clearance of viable or apoptotic cells through trans-activation of LRP on the phagocyte. Cell 123:321-334.
78
178. Ogden, C.A., deCathelineau, A., Hoffmann, P.R., Bratton, D., Ghebrehiwet, B., Fadok, V.A., and Henson, P.M. 2001. C1q and mannose binding lectin engagement of cell surface calreticulin and CD91 initiates macropinocytosis and uptake of apoptotic cells. J Exp Med 194:781-795.
179. Fadok, V.A., Savill, J.S., Haslett, C., Bratton, D.L., Doherty, D.E., Campbell, P.A., and Henson, P.M. 1992. Different populations of macrophages use either the vitronectin receptor or the phosphatidylserine receptor to recognize and remove apoptotic cells. J Immunol 149:4029-4035.
180. Fadok, V.A., Voelker, D.R., Campbell, P.A., Cohen, J.J., Bratton, D.L., and Henson, P.M. 1992. Exposure of phosphatidylserine on the surface of apoptotic lymphocytes triggers specific recognition and removal by macrophages. J Immunol 148:2207-2216.
181. Pradhan, D., Krahling, S., Williamson, P., and Schlegel, R.A. 1997. Multiple systems for recognition of apoptotic lymphocytes by macrophages. Mol Biol Cell 8:767-778.
182. Henson, P.M. 2005. Dampening inflammation. Nat Immunol 6:1179-1181. 183. Vandivier, R.W., Henson, P.M., and Douglas, I.S. 2006. Burying the dead:
the impact of failed apoptotic cell removal (efferocytosis) on chronic inflammatory lung disease. Chest 129:1673-1682.
184. Voll, R.E., Herrmann, M., Roth, E.A., Stach, C., Kalden, J.R., and Girkontaite, I. 1997. Immunosuppressive effects of apoptotic cells. Nature 390:350-351.
185. Fadok, V.A., Bratton, D.L., Konowal, A., Freed, P.W., Westcott, J.Y., and Henson, P.M. 1998. Macrophages that have ingested apoptotic cells in vitro inhibit proinflammatory cytokine production through autocrine/paracrine mechanisms involving TGF-beta, PGE2, and PAF. J Clin Invest 101:890-898.
186. Maderna, P., and Godson, C. 2003. Phagocytosis of apoptotic cells and the resolution of inflammation. Biochim Biophys Acta 1639:141-151.
187. Weigert, A., Jennewein, C., and Brune, B. 2009. The liaison between apoptotic cells and macrophages--the end programs the beginning. Biol Chem 390:379-390.
188. Tassiulas, I., Park-Min, K.H., Hu, Y., Kellerman, L., Mevorach, D., and Ivashkiv, L.B. 2007. Apoptotic cells inhibit LPS-induced cytokine and chemokine production and IFN responses in macrophages. Hum Immunol 68:156-164.
189. Bianchi, S.M., Prince, L.R., McPhillips, K., Allen, L., Marriott, H.M., Taylor, G.W., Hellewell, P.G., Sabroe, I., Dockrell, D.H., Henson, P.W., et al. 2008. Impairment of apoptotic cell engulfment by pyocyanin, a toxic metabolite of Pseudomonas aeruginosa. Am J Respir Crit Care Med 177:35-43.
190. Anderson, H.A., Englert, R., Gursel, I., and Shacter, E. 2002. Oxidative stress inhibits the phagocytosis of apoptotic cells that have externalized phosphatidylserine. Cell Death Differ 9:616-625.
79
191. Serinkan, B.F., Gambelli, F., Potapovich, A.I., Babu, H., Di Giuseppe, M., Ortiz, L.A., Fabisiak, J.P., and Kagan, V.E. 2005. Apoptotic cells quench reactive oxygen and nitrogen species and modulate TNF-alpha/TGF-beta1 balance in activated macrophages: involvement of phosphatidylserine-dependent and -independent pathways. Cell Death Differ 12:1141-1144.
192. Kim, S., Elkon, K.B., and Ma, X. 2004. Transcriptional suppression of interleukin-12 gene expression following phagocytosis of apoptotic cells. Immunity 21:643-653.
193. Stark, M.A., Huo, Y., Burcin, T.L., Morris, M.A., Olson, T.S., and Ley, K. 2005. Phagocytosis of apoptotic neutrophils regulates granulopoiesis via IL-23 and IL-17. Immunity 22:285-294.
194. Freire-de-Lima, C.G., Nascimento, D.O., Soares, M.B., Bozza, P.T., Castro-Faria-Neto, H.C., de Mello, F.G., DosReis, G.A., and Lopes, M.F. 2000. Uptake of apoptotic cells drives the growth of a pathogenic trypanosome in macrophages. Nature 403:199-203.
195. Medeiros, A.I., Serezani, C.H., Lee, S.P., and Peters-Golden, M. 2009. Efferocytosis impairs pulmonary macrophage and lung antibacterial function via PGE2/EP2 signaling. J Exp Med 206:61-68.
196. White, G.E., Iqbal, A.J., and Greaves, D.R. 2013. CC chemokine receptors and chronic inflammation--therapeutic opportunities and pharmacological challenges. Pharmacol Rev 65:47-89.
197. Baggiolini, M., Dewald, B., and Moser, B. 1994. Interleukin-8 and related chemotactic cytokines--CXC and CC chemokines. Adv Immunol 55:97-179.
198. Miller, M.D., and Krangel, M.S. 1992. The human cytokine I-309 is a monocyte chemoattractant. Proc Natl Acad Sci U S A 89:2950-2954.
199. Roos, R.S., Loetscher, M., Legler, D.F., Clark-Lewis, I., Baggiolini, M., and Moser, B. 1997. Identification of CCR8, the receptor for the human CC chemokine I-309. J Biol Chem 272:17251-17254.
200. Luo, Y., Laning, J., Devi, S., Mak, J., Schall, T.J., and Dorf, M.E. 1994. Biologic activities of the murine beta-chemokine TCA3. J Immunol 153:4616-4624.
201. Akimoto, N., Honda, K., Uta, D., Beppu, K., Ushijima, Y., Matsuzaki, Y., Nakashima, S., Kido, M.A., Imoto, K., Takano, Y., et al. 2013. CCL-1 in the spinal cord contributes to neuropathic pain induced by nerve injury. Cell Death Dis 4:e679.
202. Akimoto, N., Ifuku, M., Mori, Y., and Noda, M. 2013. Effects of chemokine (C-C motif) ligand 1 on microglial function. Biochem Biophys Res Commun 436:455-461.
203. Kim, H.O., Cho, S.I., Chung, B.Y., Ahn, H.K., Park, C.W., and Lee, C.H. 2012. Expression of CCL1 and CCL18 in atopic dermatitis and psoriasis. Clin Exp Dermatol 37:521-526.
204. Bishop, B., and Lloyd, C.M. 2003. CC chemokine ligand 1 promotes recruitment of eosinophils but not Th2 cells during the development of allergic airways disease. J Immunol 170:4810-4817.
80
205. Montes-Vizuet, R., Vega-Miranda, A., Valencia-Maqueda, E., Negrete-Garcia, M.C., Velasquez, J.R., and Teran, L.M. 2006. CC chemokine ligand 1 is released into the airways of atopic asthmatics. Eur Respir J 28:59-67.
206. Cantor, J., and Haskins, K. 2007. Recruitment and activation of macrophages by pathogenic CD4 T cells in type 1 diabetes: evidence for involvement of CCR8 and CCL1. J Immunol 179:5760-5767.
207. Oladiran, A., and Belosevic, M. 2009. Trypanosoma carassii hsp70 increases expression of inflammatory cytokines and chemokines in macrophages of the goldfish (Carassius auratus L.). Dev Comp Immunol 33:1128-1136.
208. Zhong, H., Zhou, Y., Yu, F., Xiao, J., Gan, X., and Zhang, M. 2014. Seasonal changes and human chorionic gonadotrophin (hCG) effects on innate immune genes expression in goldfish (Carassius auratus). Fish Shellfish Immunol 38:303-310.
209. Yoshimura, T., Matsushima, K., Tanaka, S., Robinson, E.A., Appella, E., Oppenheim, J.J., and Leonard, E.J. 1987. Purification of a human monocyte-derived neutrophil chemotactic factor that has peptide sequence similarity to other host defense cytokines. Proc Natl Acad Sci U S A 84:9233-9237.
210. Yoshimura, T., Matsushima, K., Oppenheim, J.J., and Leonard, E.J. 1987. Neutrophil chemotactic factor produced by lipopolysaccharide (LPS)-stimulated human blood mononuclear leukocytes: partial characterization and separation from interleukin 1 (IL 1). J Immunol 139:788-793.
211. Clark-Lewis, I., Schumacher, C., Baggiolini, M., and Moser, B. 1991. Structure-activity relationships of interleukin-8 determined using chemically synthesized analogs. Critical role of NH2-terminal residues and evidence for uncoupling of neutrophil chemotaxis, exocytosis, and receptor binding activities. J Biol Chem 266:23128-23134.
212. Clark-Lewis, I., Moser, B., Walz, A., Baggiolini, M., Scott, G.J., and Aebersold, R. 1991. Chemical synthesis, purification, and characterization of two inflammatory proteins, neutrophil activating peptide 1 (interleukin-8) and neutrophil activating peptide. Biochemistry 30:3128-3135.
213. Baggiolini, M., Imboden, P., and Detmers, P. 1992. Neutrophil activation and the effects of interleukin-8/neutrophil-activating peptide 1 (IL-8/NAP-1). Cytokines 4:1-17.
214. Colditz, I., Zwahlen, R., Dewald, B., and Baggiolini, M. 1989. In vivo inflammatory activity of neutrophil-activating factor, a novel chemotactic peptide derived from human monocytes. Am J Pathol 134:755-760.
215. Baggiolini, M., Loetscher, P., and Moser, B. 1995. Interleukin-8 and the chemokine family. Int J Immunopharmacol 17:103-108.
216. Leonard, E.J., Skeel, A., Yoshimura, T., Noer, K., Kutvirt, S., and Van Epps, D. 1990. Leukocyte specificity and binding of human neutrophil attractant/activation protein-1. J Immunol 144:1323-1330.
217. Krieger, M., Brunner, T., Bischoff, S.C., von Tscharner, V., Walz, A., Moser, B., Baggiolini, M., and Dahinden, C.A. 1992. Activation of human basophils through the IL-8 receptor. J Immunol 149:2662-2667.
81
218. Larsen, C.G., Anderson, A.O., Appella, E., Oppenheim, J.J., and Matsushima, K. 1989. The neutrophil-activating protein (NAP-1) is also chemotactic for T lymphocytes. Science 243:1464-1466.
219. Taub, D.D., Conlon, K., Lloyd, A.R., Oppenheim, J.J., and Kelvin, D.J. 1993. Preferential migration of activated CD4+ and CD8+ T cells in response to MIP-1 alpha and MIP-1 beta. Science 260:355-358.
220. Leonard, E.J., Yoshimura, T., Tanaka, S., and Raffeld, M. 1991. Neutrophil recruitment by intradermally injected neutrophil attractant/activation protein-1. J Invest Dermatol 96:690-694.
221. Moser, B., Schumacher, C., von Tscharner, V., Clark-Lewis, I., and Baggiolini, M. 1991. Neutrophil-activating peptide 2 and gro/melanoma growth-stimulatory activity interact with neutrophil-activating peptide 1/interleukin 8 receptors on human neutrophils. J Biol Chem 266:10666-10671.
222. Baggiolini, M., and Dahinden, C.A. 1994. CC chemokines in allergic inflammation. Immunol Today 15:127-133.
223. Moser, B., Barella, L., Mattei, S., Schumacher, C., Boulay, F., Colombo, M.P., and Baggiolini, M. 1993. Expression of transcripts for two interleukin 8 receptors in human phagocytes, lymphocytes and melanoma cells. Biochem J 294 ( Pt 1):285-292.
224. Corripio-Miyar, Y., Bird, S., Tsamopoulos, K., and Secombes, C.J. 2007. Cloning and expression analysis of two pro-inflammatory cytokines, IL-1 beta and IL-8, in haddock (Melanogrammus aeglefinus). Mol Immunol 44:1361-1373.
225. Huising, M.O., Stolte, E., Flik, G., Savelkoul, H.F., and Verburg-van Kemenade, B.M. 2003. CXC chemokines and leukocyte chemotaxis in common carp (Cyprinus carpio L.). Dev Comp Immunol 27:875-888.
226. Laing, K.J., Bols, N., and Secombes, C.J. 2002. A CXC chemokine sequence isolated from the rainbow trout Oncorhynchus mykiss resembles the closely related interferon-gamma-inducible chemokines CXCL9, CXCL10 and CXCL11. Eur Cytokine Netw 13:462-473.
227. Laing, K.J., Zou, J.J., Wang, T., Bols, N., Hirono, I., Aoki, T., and Secombes, C.J. 2002. Identification and analysis of an interleukin 8-like molecule in rainbow trout Oncorhynchus mykiss. Dev Comp Immunol 26:433-444.
228. Lee, E.Y., Park, H.H., Kim, Y.T., and Choi, T.J. 2001. Cloning and sequence analysis of the interleukin-8 gene from flounder (Paralichthys olivaceous). Gene 274:237-243.
229. Zhonghua, C., Chunpin, G., Yong, Z., Kezhi, X., and Yaou, Z. 2008. Cloning and bioactivity analysis of a CXC ligand in black seabream Acanthopagrus schlegeli: the evolutionary clues of ELR+CXC chemokines. BMC Immunol 9:66.
230. van der Aa, L.M., Chadzinska, M., Tijhaar, E., Boudinot, P., and Verburg-van Kemenade, B.M. 2010. CXCL8 chemokines in teleost fish: two lineages with distinct expression profiles during early phases of inflammation. PLoS One 5:e12384.
82
231. Rebl, A., Rebl, H., Korytar, T., Goldammer, T., and Seyfert, H.M. 2014. The proximal promoter of a novel interleukin-8-encoding gene in rainbow trout (Oncorhynchus mykiss) is strongly induced by CEBPA, but not NF-kappaB p65. Dev Comp Immunol.
232. Grayfer, L., Hodgkinson, J.W., Hitchen, S.J., and Belosevic, M. 2011. Characterization and functional analysis of goldfish (Carassius auratus L.) interleukin-10. Mol Immunol 48:563-571.
233. Schwenteit, J.M., Breithaupt, A., Teifke, J.P., Koppang, E.O., Bornscheuer, U.T., Fischer, U., and Gudmundsdottir, B.K. 2013. Innate and adaptive immune responses of Arctic charr (Salvelinus alpinus, L.) during infection with Aeromonas salmonicida subsp. achromogenes and the effect of the AsaP1 toxin. Fish Shellfish Immunol 35:866-873.
234. Tracey, D., Klareskog, L., Sasso, E.H., Salfeld, J.G., and Tak, P.P. 2008. Tumor necrosis factor antagonist mechanisms of action: a comprehensive review. Pharmacol Ther 117:244-279.
235. Helson, L., Green, S., Carswell, E., and Old, L.J. 1975. Effect of tumour necrosis factor on cultured human melanoma cells. Nature 258:731-732.
236. Carswell, E.A., Old, L.J., Kassel, R.L., Green, S., Fiore, N., and Williamson, B. 1975. An endotoxin-induced serum factor that causes necrosis of tumors. Proc Natl Acad Sci U S A 72:3666-3670.
237. Kriegler, M., Perez, C., DeFay, K., Albert, I., and Lu, S.D. 1988. A novel form of TNF/cachectin is a cell surface cytotoxic transmembrane protein: ramifications for the complex physiology of TNF. Cell 53:45-53.
238. Tang, P., Hung, M.C., and Klostergaard, J. 1996. Human pro-tumor necrosis factor is a homotrimer. Biochemistry 35:8216-8225.
239. Black, R.A., Rauch, C.T., Kozlosky, C.J., Peschon, J.J., Slack, J.L., Wolfson, M.F., Castner, B.J., Stocking, K.L., Reddy, P., Srinivasan, S., et al. 1997. A metalloproteinase disintegrin that releases tumour-necrosis factor-alpha from cells. Nature 385:729-733.
240. Palladino, M.A., Bahjat, F.R., Theodorakis, E.A., and Moldawer, L.L. 2003. Anti-TNF-alpha therapies: the next generation. Nat Rev Drug Discov 2:736-746.
241. Ming, W.J., Bersani, L., and Mantovani, A. 1987. Tumor necrosis factor is chemotactic for monocytes and polymorphonuclear leukocytes. J Immunol 138:1469-1474.
242. Yonemaru, M., Stephens, K.E., Ishizaka, A., Zheng, H., Hogue, R.S., Crowley, J.J., Hatherill, J.R., and Raffin, T.A. 1989. Effects of tumor necrosis factor on PMN chemotaxis, chemiluminescence, and elastase activity. J Lab Clin Med 114:674-681.
243. Klebanoff, S.J., Vadas, M.A., Harlan, J.M., Sparks, L.H., Gamble, J.R., Agosti, J.M., and Waltersdorph, A.M. 1986. Stimulation of neutrophils by tumor necrosis factor. J Immunol 136:4220-4225.
244. Lohmann-Matthes, M.L., Luttig, B., and Hockertz, S. 1991. Involvement of membrane-associated TNF in the killing of Leishmania donovani parasites by macrophages. Behring Inst Mitt:125-132.
83
245. van Strijp, J.A., van der Tol, M.E., Miltenburg, L.A., van Kessel, K.P., and Verhoef, J. 1991. Tumour necrosis factor triggers granulocytes to internalize complement-coated virus particles. Immunology 73:77-82.
246. Ding, A.H., Nathan, C.F., and Stuehr, D.J. 1988. Release of reactive nitrogen intermediates and reactive oxygen intermediates from mouse peritoneal macrophages. Comparison of activating cytokines and evidence for independent production. J Immunol 141:2407-2412.
247. Neumann, M., and Kownatzki, E. 1989. The effect of adherence on the generation of reactive oxygen species by human neutrophilic granulocytes. Agents Actions 26:183-185.
248. Banner, D.W., D'Arcy, A., Janes, W., Gentz, R., Schoenfeld, H.J., Broger, C., Loetscher, H., and Lesslauer, W. 1993. Crystal structure of the soluble human 55 kd TNF receptor-human TNF beta complex: implications for TNF receptor activation. Cell 73:431-445.
249. Eck, M.J., Beutler, B., Kuo, G., Merryweather, J.P., and Sprang, S.R. 1988. Crystallization of trimeric recombinant human tumor necrosis factor (cachectin). J Biol Chem 263:12816-12819.
250. Grell, M., Douni, E., Wajant, H., Lohden, M., Clauss, M., Maxeiner, B., Georgopoulos, S., Lesslauer, W., Kollias, G., Pfizenmaier, K., et al. 1995. The transmembrane form of tumor necrosis factor is the prime activating ligand of the 80 kDa tumor necrosis factor receptor. Cell 83:793-802.
251. Grell, M. 1995. Tumor necrosis factor (TNF) receptors in cellular signaling of soluble and membrane-expressed TNF. J Inflamm 47:8-17.
252. Dranoff, G. 2004. Cytokines in cancer pathogenesis and cancer therapy. Nat Rev Cancer 4:11-22.
253. Chen, G., and Goeddel, D.V. 2002. TNF-R1 signaling: a beautiful pathway. Science 296:1634-1635.
254. Wallach, D., Varfolomeev, E.E., Malinin, N.L., Goltsev, Y.V., Kovalenko, A.V., and Boldin, M.P. 1999. Tumor necrosis factor receptor and Fas signaling mechanisms. Annu Rev Immunol 17:331-367.
255. Mukhopadhyay, A., Suttles, J., Stout, R.D., and Aggarwal, B.B. 2001. Genetic deletion of the tumor necrosis factor receptor p60 or p80 abrogates ligand-mediated activation of nuclear factor-kappa B and of mitogen-activated protein kinases in macrophages. J Biol Chem 276:31906-31912.
256. Kim, E.Y., and Teh, H.S. 2004. Critical role of TNF receptor type-2 (p75) as a costimulator for IL-2 induction and T cell survival: a functional link to CD28. J Immunol 173:4500-4509.
257. Kim, E.Y., Priatel, J.J., Teh, S.J., and Teh, H.S. 2006. TNF receptor type 2 (p75) functions as a costimulator for antigen-driven T cell responses in vivo. J Immunol 176:1026-1035.
258. Zhao, X., Mohaupt, M., Jiang, J., Liu, S., Li, B., and Qin, Z. 2007. Tumor necrosis factor receptor 2-mediated tumor suppression is nitric oxide dependent and involves angiostasis. Cancer Res 67:4443-4450.
259. Wajant, H., Pfizenmaier, K., and Scheurich, P. 2003. Tumor necrosis factor signaling. Cell Death Differ 10:45-65.
260. Baltimore, D. 2011. NF-kappaB is 25. Nat Immunol 12:683-685.
84
261. Smale, S.T. 2011. Hierarchies of NF-kappaB target-gene regulation. Nat Immunol 12:689-694.
262. McCubrey, J.A., Steelman, L.S., Chappell, W.H., Abrams, S.L., Wong, E.W., Chang, F., Lehmann, B., Terrian, D.M., Milella, M., Tafuri, A., et al. 2007. Roles of the Raf/MEK/ERK pathway in cell growth, malignant transformation and drug resistance. Biochim Biophys Acta 1773:1263-1284.
263. Gaur, U., and Aggarwal, B.B. 2003. Regulation of proliferation, survival and apoptosis by members of the TNF superfamily. Biochem Pharmacol 66:1403-1408.
264. Hirono, I., Nam, B.H., Kurobe, T., and Aoki, T. 2000. Molecular cloning, characterization, and expression of TNF cDNA and gene from Japanese flounder Paralychthys olivaceus. J Immunol 165:4423-4427.
265. Laing, K.J., Wang, T., Zou, J., Holland, J., Hong, S., Bols, N., Hirono, I., Aoki, T., and Secombes, C.J. 2001. Cloning and expression analysis of rainbow trout Oncorhynchus mykiss tumour necrosis factor-alpha. Eur J Biochem 268:1315-1322.
266. Zou, J., Secombes, C.J., Long, S., Miller, N., Clem, L.W., and Chinchar, V.G. 2003. Molecular identification and expression analysis of tumor necrosis factor in channel catfish (Ictalurus punctatus). Dev Comp Immunol 27:845-858.
267. Saeij, J.P., Stet, R.J., de Vries, B.J., van Muiswinkel, W.B., and Wiegertjes, G.F. 2003. Molecular and functional characterization of carp TNF: a link between TNF polymorphism and trypanotolerance? Dev Comp Immunol 27:29-41.
268. Zou, J., Wang, T., Hirono, I., Aoki, T., Inagawa, H., Honda, T., Soma, G.I., Ototake, M., Nakanishi, T., Ellis, A.E., et al. 2002. Differential expression of two tumor necrosis factor genes in rainbow trout, Oncorhynchus mykiss. Dev Comp Immunol 26:161-172.
269. Savan, R., and Sakai, M. 2004. Presence of multiple isoforms of TNF alpha in carp (Cyprinus carpio L.): genomic and expression analysis. Fish Shellfish Immunol 17:87-94.
270. Zou, J., Peddie, S., Scapigliati, G., Zhang, Y., Bols, N.C., Ellis, A.E., and Secombes, C.J. 2003. Functional characterisation of the recombinant tumor necrosis factors in rainbow trout, Oncorhynchus mykiss. Dev Comp Immunol 27:813-822.
271. Garcia-Castillo, J., Chaves-Pozo, E., Olivares, P., Pelegrin, P., Meseguer, J., and Mulero, V. 2004. The tumor necrosis factor alpha of the bony fish seabream exhibits the in vivo proinflammatory and proliferative activities of its mammalian counterparts, yet it functions in a species-specific manner. Cell Mol Life Sci 61:1331-1340.
272. Dinarello, C.A. 1994. The interleukin-1 family: 10 years of discovery. FASEB J 8:1314-1325.
273. Auron, P.E., Webb, A.C., Rosenwasser, L.J., Mucci, S.F., Rich, A., Wolff, S.M., and Dinarello, C.A. 1984. Nucleotide sequence of human monocyte interleukin 1 precursor cDNA. Proc Natl Acad Sci U S A 81:7907-7911.
274. Dinarello, C.A. 1988. Biology of interleukin 1. FASEB J 2:108-115.
85
275. Dinarello, C.A. 1996. Biologic basis for interleukin-1 in disease. Blood 87:2095-2147.
276. Dinarello, C.A. 1998. Interleukin-1 beta, interleukin-18, and the interleukin-1 beta converting enzyme. Ann N Y Acad Sci 856:1-11.
277. Contassot, E., Beer, H.D., and French, L.E. 2012. Interleukin-1, inflammasomes, autoinflammation and the skin. Swiss Med Wkly 142:w13590.
278. Sahoo, M., Ceballos-Olvera, I., del Barrio, L., and Re, F. 2011. Role of the inflammasome, IL-1beta, and IL-18 in bacterial infections. ScientificWorldJournal 11:2037-2050.
279. Eder, C. 2009. Mechanisms of interleukin-1beta release. Immunobiology 214:543-553.
280. O'Neill, L.A. 2000. The interleukin-1 receptor/Toll-like receptor superfamily: signal transduction during inflammation and host defense. Sci STKE 2000:re1.
281. Colotta, F., Re, F., Muzio, M., Bertini, R., Polentarutti, N., Sironi, M., Giri, J.G., Dower, S.K., Sims, J.E., and Mantovani, A. 1993. Interleukin-1 type II receptor: a decoy target for IL-1 that is regulated by IL-4. Science 261:472-475.
282. Dinarello, C.A. 2011. Interleukin-1 in the pathogenesis and treatment of inflammatory diseases. Blood 117:3720-3732.
283. Masters, S.L., Simon, A., Aksentijevich, I., and Kastner, D.L. 2009. Horror autoinflammaticus: the molecular pathophysiology of autoinflammatory disease (*). Annu Rev Immunol 27:621-668.
284. Bujak, M., and Frangogiannis, N.G. 2009. The role of IL-1 in the pathogenesis of heart disease. Arch Immunol Ther Exp (Warsz) 57:165-176.
285. Griffin, W.S., Sheng, J.G., Royston, M.C., Gentleman, S.M., McKenzie, J.E., Graham, D.I., Roberts, G.W., and Mrak, R.E. 1998. Glial-neuronal interactions in Alzheimer's disease: the potential role of a 'cytokine cycle' in disease progression. Brain Pathol 8:65-72.
286. Engelsma, M.Y., Stet, R.J., Saeij, J.P., and Verburg-van Kemenade, B.M. 2003. Differential expression and haplotypic variation of two interleukin-1beta genes in the common carp (Cyprinus carpio L.). Cytokine 22:21-32.
287. Ellsaesser, C.F., and Clem, L.W. 1994. Functionally distinct high and low molecular weight species of channel catfish and mouse IL-1. Cytokine 6:10-20.
288. Secombes, C., Zou, J., Daniels, G., Cunningham, C., Koussounadis, A., and Kemp, G. 1998. Rainbow trout cytokine and cytokine receptor genes. Immunol Rev 166:333-340.
289. Sigel, M.M., Hamby, B.A., and Huggins, E.M., Jr. 1986. Phylogenetic studies on lymphokines. Fish lymphocytes respond to human IL-1 and epithelial cells produce an IL-1 like factor. Vet Immunol Immunopathol 12:47-58.
290. Hamby, B.A., Huggins, E.M., Jr., Lachman, L.B., Dinarello, C.A., and Sigel, M.M. 1986. Fish lymphocytes respond to human IL-1. Lymphokine Res 5:157-162.
86
291. Verburg-van Kemenade, B.M., Weyts, F.A., Debets, R., and Flik, G. 1995. Carp macrophages and neutrophilic granulocytes secrete an interleukin-1-like factor. Dev Comp Immunol 19:59-70.
292. Yin, Z., and Kwang, J. 2000. Carp interleukin-1 beta in the role of an immuno-adjuvant. Fish Shellfish Immunol 10:375-378.
293. Hong, S., Peddie, S., Campos-Perez, J.J., Zou, J., and Secombes, C.J. 2003. The effect of intraperitoneally administered recombinant IL-1beta on immune parameters and resistance to Aeromonas salmonicida in the rainbow trout (Oncorhynchus mykiss). Dev Comp Immunol 27:801-812.
294. Kono, T., Fujiki, K., Nakao, M., Yano, T., Endo, M., and Sakai, M. 2002. The immune responses of common carp, Cyprinus carpio L., injected with carp interleukin-1beta gene. J Interferon Cytokine Res 22:413-419.
295. Hong, S., Zou, J., Crampe, M., Peddie, S., Scapigliati, G., Bols, N., Cunningham, C., and Secombes, C.J. 2001. The production and bioactivity of rainbow trout (Oncorhynchus mykiss) recombinant IL-1 beta. Vet Immunol Immunopathol 81:1-14.
296. Liu, J., Cao, S., Herman, L.M., and Ma, X. 2003. Differential regulation of interleukin (IL)-12 p35 and p40 gene expression and interferon (IFN)-gamma-primed IL-12 production by IFN regulatory factor 1. J Exp Med 198:1265-1276.
297. Watford, W.T., Moriguchi, M., Morinobu, A., and O'Shea, J.J. 2003. The biology of IL-12: coordinating innate and adaptive immune responses. Cytokine Growth Factor Rev 14:361-368.
298. Vignali, D.A., and Kuchroo, V.K. 2012. IL-12 family cytokines: immunological playmakers. Nat Immunol 13:722-728.
299. van Wanrooij, R.L., Zwiers, A., Kraal, G., and Bouma, G. 2012. Genetic variations in interleukin-12 related genes in immune-mediated diseases. J Autoimmun 39:359-368.
300. Sieburth, D., Jabs, E.W., Warrington, J.A., Li, X., Lasota, J., LaForgia, S., Kelleher, K., Huebner, K., Wasmuth, J.J., and Wolf, S.F. 1992. Assignment of genes encoding a unique cytokine (IL12) composed of two unrelated subunits to chromosomes 3 and 5. Genomics 14:59-62.
301. Gately, M.K., Renzetti, L.M., Magram, J., Stern, A.S., Adorini, L., Gubler, U., and Presky, D.H. 1998. The interleukin-12/interleukin-12-receptor system: role in normal and pathologic immune responses. Annu Rev Immunol 16:495-521.
302. Zhang, S., and Wang, Q. 2008. Factors determining the formation and release of bioactive IL-12: regulatory mechanisms for IL-12p70 synthesis and inhibition. Biochem Biophys Res Commun 372:509-512.
303. Macatonia, S.E., Hsieh, C.S., Murphy, K.M., and O'Garra, A. 1993. Dendritic cells and macrophages are required for Th1 development of CD4+ T cells from alpha beta TCR transgenic mice: IL-12 substitution for macrophages to stimulate IFN-gamma production is IFN-gamma-dependent. Int Immunol 5:1119-1128.
87
304. Kang, B.Y., Kim, E., and Kim, T.S. 2005. Regulatory mechanisms and their therapeutic implications of interleukin-12 production in immune cells. Cell Signal 17:665-673.
305. Gee, K., Guzzo, C., Che Mat, N.F., Ma, W., and Kumar, A. 2009. The IL-12 family of cytokines in infection, inflammation and autoimmune disorders. Inflamm Allergy Drug Targets 8:40-52.
306. Hsieh, C.S., Macatonia, S.E., Tripp, C.S., Wolf, S.F., O'Garra, A., and Murphy, K.M. 1993. Development of TH1 CD4+ T cells through IL-12 produced by Listeria-induced macrophages. Science 260:547-549.
307. Wang, K.S., Frank, D.A., and Ritz, J. 2000. Interleukin-2 enhances the response of natural killer cells to interleukin-12 through up-regulation of the interleukin-12 receptor and STAT4. Blood 95:3183-3190.
308. Jana, M., Dasgupta, S., Saha, R.N., Liu, X., and Pahan, K. 2003. Induction of tumor necrosis factor-alpha (TNF-alpha) by interleukin-12 p40 monomer and homodimer in microglia and macrophages. J Neurochem 86:519-528.
309. Yoshiura, Y., Kiryu, I., Fujiwara, A., Suetake, H., Suzuki, Y., Nakanishi, T., and Ototake, M. 2003. Identification and characterization of Fugu orthologues of mammalian interleukin-12 subunits. Immunogenetics 55:296-306.
310. Huising, M.O., van Schijndel, J.E., Kruiswijk, C.P., Nabuurs, S.B., Savelkoul, H.F., Flik, G., and Verburg-van Kemenade, B.M. 2006. The presence of multiple and differentially regulated interleukin-12p40 genes in bony fishes signifies an expansion of the vertebrate heterodimeric cytokine family. Mol Immunol 43:1519-1533.
311. Nascimento, D.S., do Vale, A., Tomas, A.M., Zou, J., Secombes, C.J., and dos Santos, N.M. 2007. Cloning, promoter analysis and expression in response to bacterial exposure of sea bass (Dicentrarchus labrax L.) interleukin-12 p40 and p35 subunits. Mol Immunol 44:2277-2291.
312. Overgard, A.C., Nepstad, I., Nerland, A.H., and Patel, S. 2012. Characterisation and expression analysis of the Atlantic halibut (Hippoglossus hippoglossus L.) cytokines: IL-1beta, IL-6, IL-11, IL-12beta and IFNgamma. Mol Biol Rep 39:2201-2213.
313. Tsai, J.L., Priya, T.A., Hu, K.Y., Yan, H.Y., Shen, S.T., and Song, Y.L. 2014. Grouper interleukin-12, linked by an ancient disulfide-bond architecture, exhibits cytokine and chemokine activities. Fish Shellfish Immunol 36:27-37.
314. Wang, T., and Husain, M. 2014. The expanding repertoire of the IL-12 cytokine family in teleost fish: Identification of three paralogues each of the p35 and p40 genes in salmonids, and comparative analysis of their expression and modulation in Atlantic salmon Salmo salar. Dev Comp Immunol.
315. Wang, T., Husain, M., Hong, S., and Holland, J.W. 2014. Differential expression, modulation and bioactivity of distinct fish IL-12 isoforms: Implication towards the evolution of Th1-like immune responses. Eur J Immunol 44:1541-1551.

88
316. Wheelock, E.F. 1965. Interferon-Like Virus-Inhibitor Induced in Human Leukocytes by Phytohemagglutinin. Science 149:310-311.
317. Mosmann, T.R., and Coffman, R.L. 1989. TH1 and TH2 cells: different patterns of lymphokine secretion lead to different functional properties. Annu Rev Immunol 7:145-173.
318. Sad, S., Marcotte, R., and Mosmann, T.R. 1995. Cytokine-induced differentiation of precursor mouse CD8+ T cells into cytotoxic CD8+ T cells secreting Th1 or Th2 cytokines. Immunity 2:271-279.
319. Perussia, B. 1991. Lymphokine-activated killer cells, natural killer cells and cytokines. Curr Opin Immunol 3:49-55.
320. Schroder, K., Hertzog, P.J., Ravasi, T., and Hume, D.A. 2004. Interferon-gamma: an overview of signals, mechanisms and functions. J Leukoc Biol 75:163-189.
321. Belosevic, M., Davis, C.E., Meltzer, M.S., and Nacy, C.A. 1988. Regulation of activated macrophage antimicrobial activities. Identification of lymphokines that cooperate with IFN-gamma for induction of resistance to infection. J Immunol 141:890-896.
322. Kerr, I.M., and Stark, G.R. 1992. The antiviral effects of the interferons and their inhibition. J Interferon Res 12:237-240.
323. Krishnan, L., Guilbert, L.J., Wegmann, T.G., Belosevic, M., and Mosmann, T.R. 1996. T helper 1 response against Leishmania major in pregnant C57BL/6 mice increases implantation failure and fetal resorptions. Correlation with increased IFN-gamma and TNF and reduced IL-10 production by placental cells. J Immunol 156:653-662.
324. Staeheli, P. 1990. Interferon-induced proteins and the antiviral state. Adv Virus Res 38:147-200.
325. Stevenson, M.M., Tam, M.F., Belosevic, M., van der Meide, P.H., and Podoba, J.E. 1990. Role of endogenous gamma interferon in host response to infection with blood-stage Plasmodium chabaudi AS. Infect Immun 58:3225-3232.
326. Stevenson, M.M., Tam, M.F., and Nowotarski, M. 1990. Role of interferon-gamma and tumor necrosis factor in host resistance to Plasmodium chabaudi AS. Immunol Lett 25:115-121.
327. Ihle, J.N., and Kerr, I.M. 1995. Jaks and Stats in signaling by the cytokine receptor superfamily. Trends Genet 11:69-74.
328. Graham, S., and Secombes, C.J. 1988. The production of a macrophage-activating factor from rainbow trout Salmo gairdneri leucocytes. Immunology 65:293-297.
329. Zou, J., Yoshiura, Y., Dijkstra, J.M., Sakai, M., Ototake, M., and Secombes, C. 2004. Identification of an interferon gamma homologue in Fugu, Takifugu rubripes. Fish Shellfish Immunol 17:403-409.
330. Chitu, V., and Stanley, E.R. 2006. Colony-stimulating factor-1 in immunity and inflammation. Curr Opin Immunol 18:39-48.
331. Fixe, P., and Praloran, V. 1997. Macrophage colony-stimulating-factor (M-CSF or CSF-1) and its receptor: structure-function relationships. Eur Cytokine Netw 8:125-136.
89
332. Mossadegh-Keller, N., Sarrazin, S., Kandalla, P.K., Espinosa, L., Stanley, E.R., Nutt, S.L., Moore, J., and Sieweke, M.H. 2013. M-CSF instructs myeloid lineage fate in single haematopoietic stem cells. Nature 497:239-243.
333. Bartocci, A., Mastrogiannis, D.S., Migliorati, G., Stockert, R.J., Wolkoff, A.W., and Stanley, E.R. 1987. Macrophages specifically regulate the concentration of their own growth factor in the circulation. Proceedings of the National Academy of Sciences (USA) 84:6179-6183.
334. Hamilton, J.A., and Achuthan, A. 2013. Colony stimulating factors and myeloid cell biology in health and disease. Trends Immunol 34:81-89.
335. Stanley, E.R., Berg, K.L., Einstein, D.B., Lee, P.S., Pixley, F.J., Wang, Y., and Yeung, Y.G. 1997. Biology and action of colony--stimulating factor-1. Mol Reprod Dev 46:4-10.
336. Stanley, E.R., Guilbert, L.J., Tushinski, R.J., and Bartelmez, S.H. 1983. CSF-1--a mononuclear phagocyte lineage-specific hemopoietic growth factor. J Cell Biochem 21:151-159.
337. Barreda, D.R., Hanington, P.C., and Belosevic, M. 2004. Regulation of myeloid development and function by colony stimulating factors. Developmental and Comparative Immunology 28:509-554.
338. Ryan, G.R., Dai, X.M., Dominguez, M.G., Tong, W., Chuan, F., Chisholm, O., Russell, R.G., Pollard, J.W., and Stanley, E.R. 2001. Rescue of the colony-stimulating factor 1 (CSF-1)-nullizygous mouse (Csf1(op)/Csf1(op)) phenotype with a CSF-1 transgene and identification of sites of local CSF-1 synthesis. Blood 98:74-84.
339. Bot, F.J., van Eijk, L., Broeders, L., Aarden, L.A., and Lowenberg, B. 1989. Interleukin-6 synergizes with M-CSF in the formation of macrophage colonies from purified human marrow progenitor cells. Blood 73:435-437.
340. Bot, F.J., van Eijk, L., Schipper, P., Backx, B., and Lowenberg, B. 1990. Synergistic effects between GM-CSF and G-CSF or M-CSF on highly enriched human marrow progenitor cells. Leukemia 4:325-328.
341. Sweet, M.J., and Hume, D.A. 2003. CSF-1 as a regulator of macrophage activation and immune responses. Arch Immunol Ther Exp (Warsz) 51:169-177.
342. Bober, L.A., Grace, M.J., Pugliese-Sivo, C., Rojas-Triana, A., Sullivan, L.M., and Narula, S.K. 1995. The effects of colony stimulating factors on human monocyte cell function. Int J Immunopharmacol 17:385-392.
343. Karbassi, A., Becker, J.M., Foster, J.S., and Moore, R.N. 1987. Enhanced killing of Candida albicans by murine macrophages treated with macrophage colony-stimulating factor: evidence for augmented expression of mannose receptors. J Immunol 139:417-421.
344. Munn, D.H., and Cheung, N.K. 1990. Phagocytosis of tumor cells by human monocytes cultured in recombinant macrophage colony-stimulating factor. J Exp Med 172:231-237.
345. Munn, D.H., and Cheung, N.K. 1995. Antibody-independent phagocytosis of tumor cells by human monocyte-derived macrophages cultured in
90
recombinant macrophage colony-stimulating factor. Cancer Immunol Immunother 41:46-52.
346. Ralph, P., Warren, M.K., Nakoinz, I., Lee, M.T., Brindley, L., Sampson-Johannes, A., Kawasaki, E.S., Ladner, M.B., Strickler, J.E., Boosman, A., et al. 1986. Biological properties and molecular biology of the human macrophage growth factor, CSF-1. Immunobiology 172:194-204.
347. Roca, F.J., Sepulcre, M.A., Lopez-Castejon, G., Meseguer, J., and Mulero, V. 2006. The colony-stimulating factor-1 receptor is a specific marker of macrophages from the bony fish gilthead seabream. Mol Immunol 43:1418-1423.
348. Wing, E.J., Ampel, N.M., Waheed, A., and Shadduck, R.K. 1985. Macrophage colony-stimulating factor (M-CSF) enhances the capacity of murine macrophages to secrete oxygen reduction products. J Immunol 135:2052-2056.
349. Hamilton, J.A., Stanley, E.R., Burgess, A.W., and Shadduck, R.K. 1980. Stimulation of macrophage plasminogen activator activity by colony-stimulating factors. J Cell Physiol 103:435-445.
350. Lin, H.S., and Gordon, S. 1979. Secretion of plasminogen activator by bone marrow-derived mononuclear phagocytes and its enhancement by colony-stimulating factor. J Exp Med 150:231-245.
351. Kurland, J.I., Pelus, L.M., Ralph, P., Bockman, R.S., and Moore, M.A. 1979. Induction of prostaglandin E synthesis in normal and neoplastic macrophages: role for colony-stimulating factor(s) distinct from effects on myeloid progenitor cell proliferation. Proc Natl Acad Sci U S A 76:2326-2330.
352. Desai, G., Nassar, F., Brummer, E., and Stevens, D.A. 1995. Killing of Histoplasma capsulatum by macrophage colony stimulating factor-treated human monocyte-derived macrophages: role for reactive oxygen intermediates. J Med Microbiol 43:224-229.
353. Garcia Lloret, M.I., Rocha Ramirez, L.M., Ramirez, A., and Santos Preciado, J.I. 1992. Macrophage colony-stimulating factor enhances the respiratory burst of human monocytes in response to Entamoeba histolytica. Arch Med Res 23:139-141.
354. Meager, A. 1991. Cytokines. Englewood Cliffs, New Jersey: Prentice Hall. 355. Motoyoshi, K. 1998. Biological activities and clinical application of M-
CSF. Int J Hematol 67:109-122. 356. Curley, S.A., Roh, M.S., Kleinerman, E., and Klostergaard, J. 1990. Human
recombinant macrophage colony stimulating factor activates murine Kupffer cells to a cytotoxic state. Lymphokine Res 9:355-363.
357. James, S.L., Cook, K.W., and Lazdins, J.K. 1990. Activation of human monocyte-derived macrophages to kill schistosomula of Schistosoma mansoni in vitro. J Immunol 145:2686-2690.
358. Metcalf, D., and Nicola, N.A. 1985. Synthesis by mouse peritoneal cells of G-CSF, the differentiation inducer for myeloid leukemia cells: stimulation by endotoxin, M-CSF and multi-CSF. Leuk Res 9:35-50.
91
359. Moore, R.N., Oppenheim, J.J., Farrar, J.J., Carter, C.S., Jr., Waheed, A., and Shadduck, R.K. 1980. Production of lymphocyte-activating factor (Interleukin 1) by macrophages activated with colony-stimulating factors. J Immunol 125:1302-1305.
360. Motoyoshi, K., Suda, T., Kusumoto, K., Takaku, F., and Miura, Y. 1982. Granulocyte-macrophage colony-stimulating and binding activities of purified human urinary colony-stimulating factor to murine and human bone marrow cells. Blood 60:1378-1386.
361. Oster, W., Brach, M.A., Gruss, H.J., Mertelsmann, R., and Herrmann, F. 1992. Interleukin-1 beta (IL-1 beta) expression in human blood mononuclear phagocytes is differentially regulated by granulocyte-macrophage colony-stimulating factor (GM-CSF), M-CSF, and IL-3. Blood 79:1260-1265.
362. Warren, M.K., and Ralph, P. 1986. Macrophage growth factor CSF-1 stimulates human monocyte production of interferon, tumor necrosis factor, and colony stimulating activity. J Immunol 137:2281-2285.
363. Evans, R., Kamdar, S.J., Fuller, J.A., and Krupke, D.M. 1995. The potential role of the macrophage colony-stimulating factor, CSF-1, in inflammatory responses: characterization of macrophage cytokine gene expression. J Leukoc Biol 58:99-107.
364. Ogiku, M., Kono, H., Ishii, K., Hosomura, N., and Fujii, H. 2011. Role of macrophage colony-stimulating factor in polymicrobial sepsis according to studies using osteopetrotic (op/op) mice. J Surg Res 169:106-116.
365. Wiktor-Jedrzejczak, W., and Gordon, S. 1996. Cytokine regulation of the macrophage system using the colony stimulating factor-1 deficient op/op mouse. Physiological Reviews 76:927-947.
366. Moore, M.A.S. 1997. Macrophage colony-stimulating factor. In Colony-stimulating factors: Molecular and cellular biology. J.M. Garland, P.J. Quesenberry, and D.J. Hilton, editors. New York, N.Y.: Marcell Dekker. 255-289.
367. Fixe, P., and Praloran, V. 1998. M-CSF: haematopoietic growth factor or inflammatory cytokine? Cytokine 10:32-37.
368. Aharinejad, S., Salama, M., Paulus, P., Zins, K., Berger, A., and Singer, C.F. 2013. Elevated CSF1 serum concentration predicts poor overall survival in women with early breast cancer. Endocr Relat Cancer 20:777-783.
369. Pollard, J.W. 2009. Trophic macrophages in development and disease. Nat Rev Immunol 9:259-270.
370. Hume, D.A., and MacDonald, K.P. 2012. Therapeutic applications of macrophage colony-stimulating factor-1 (CSF-1) and antagonists of CSF-1 receptor (CSF-1R) signaling. Blood 119:1810-1820.
371. Nemunaitis, J. 1998. Use of macrophage colony-stimulating factor in the treatment of fungal infections. Clin Infect Dis 26:1279-1281.
372. Garceau, V., Smith, J., Paton, I.R., Davey, M., Fares, M.A., Sester, D.P., Burt, D.W., and Hume, D.A. 2010. Pivotal Advance: Avian colony-
92
stimulating factor 1 (CSF-1), interleukin-34 (IL-34), and CSF-1 receptor genes and gene products. J Leukoc Biol 87:753-764.
373. Grayfer, L., and Robert, J. 2013. Colony-stimulating factor-1-responsive macrophage precursors reside in the amphibian (Xenopus laevis) bone marrow rather than the hematopoietic subcapsular liver. J Innate Immun 5:531-542.
374. Hanington, P.C., Wang, T., Secombes, C.J., and Belosevic, M. 2007. Growth factors of lower vertebrates: characterization of goldfish (Carassius auratus L.) macrophage colony-stimulating factor-1. J Biol Chem 282:31865-31872.
375. Wang, T., Kono, T., Monte, M.M., Kuse, H., Costa, M.M., Korenaga, H., Maehr, T., Husain, M., Sakai, M., and Secombes, C.J. 2013. Identification of IL-34 in teleost fish: differential expression of rainbow trout IL-34, MCSF1 and MCSF2, ligands of the MCSF receptor. Mol Immunol 53:398-409.
376. Parichy, D.M., Ransom, D.G., Paw, B., Zon, L.I., and Johnson, S.L. 2000. An orthologue of the kit-related gene fms is required for development of neural crest-derived xanthophores and a subpopulation of adult melanocytes in the zebrafish, Danio rerio. Development 127:3031-3044.
377. Barreda, D.R., Hanington, P.C., Stafford, J.L., and Belosevic, M. 2005. A novel soluble form of the CSF-1 receptor inhibits proliferation of self-renewing macrophages of goldfish (Carassius auratus L.). Dev Comp Immunol 29:879-894.
378. Honda, T., Nishizawa, T., Uenobe, M., Kohchi, C., Kuroda, A., Ototake, M., Nakanishi, T., Yokomizo, Y., Takahashi, Y., Inagawa, H., et al. 2005. Molecular cloning and expression analysis of a macrophage-colony stimulating factor receptor-like gene from rainbow trout, Oncorhynchus mykiss. Mol Immunol 42:1-8.
379. !!! INVALID CITATION !!! 380. Pettersen, E.F., Ingerslev, H.C., Stavang, V., Egenberg, M., and Wergeland,
H.I. 2008. A highly phagocytic cell line TO from Atlantic salmon is CD83 positive and M-CSFR negative, indicating a dendritic-like cell type. Fish Shellfish Immunol 25:809-819.
381. Shadle, P.J., Allen, J.I., Geier, M.D., and Koths, K. 1989. Detection of endogenous macrophage colony-stimulating factor (M-CSF) in human blood. Exp Hematol 17:154-159.
382. Koths, K. 1997. Structure-function studies on human macrophage colony-stimulating factor (M-CSF). Mol Reprod Dev 46:31-37; discussion 37-38.
383. Shao, X., Kikuchi, K., Watari, E., Norose, Y., Araki, T., and Yokomuro, K. 1996. Changes in M-CSF-like activity during chicken embryonic development. Reprod Fertil Dev 8:103-109.
384. Parichy, D.M., and Turner, J.M. 2003. Temporal and cellular requirements for Fms signaling during zebrafish adult pigment pattern development. Development 130:817-833.
385. Callard, R.E., and A.J.H., G., editors. 1994. The Cytokine FactsBook. San Diego: Academic Press. 265 pp.
93
386. Das, S.K., Stanley, E.R., Guilbert, L.J., and Forman, L.W. 1981. Human colony-stimulating factor (CSF-1) radioimmunoassay: resolution of three subclasses of human colony-stimulating factors. Blood 58:630-641.
387. Gilbert, H.S., Praloran, V., and Stanley, E.R. 1989. Increased circulating CSF-1 (M-CSF) in myeloproliferative disease: association with myeloid metaplasia and peripheral bone marrow extension. Blood 74:1231-1234.
388. Hanamura, T., Motoyoshi, K., Yoshida, K., Saito, M., Miura, Y., Kawashima, T., Nishida, M., and Takaku, F. 1988. Quantitation and identification of human monocytic colony-stimulating factor in human serum by enzyme-linked immunosorbent assay. Blood 72:886-892.
389. Praloran, V. 1991. Structure, biosynthesis and biological roles of monocyte-macrophage colony stimulating factor (CSF-1 or M-CSF). Nouv Rev Fr Hematol 33:323-333.
390. Stanley, E.R., and Guilbert, L.J. 1981. Methods for the purification assay, characterization, and target cell binding of a colony stimulating factor (CSF-1). Journal of Immunological Methods 42:253-284.
391. Oster, W., Lindemann, A., Horn, S., Mertelsmann, R., and Herrmann, F. 1987. Tumor necrosis factor (TNF)-alpha but not TNF-beta induces secretion of colony stimulating factor for macrophages (CSF-1) by human monocytes. Blood 70:1700-1703.
392. Gruber, M.F., Webb, D.S., and Gerrard, T.L. 1992. Stimulation of human monocytes via CD45, CD44, and LFA-3 triggers macrophage-colony-stimulating factor production. Synergism with lipopolysaccharide and IL-1 beta. J Immunol 148:1113-1118.
393. Horiguchi, J., Warren, M.K., Ralph, P., and Kufe, D. 1986. Expression of the macrophage specific colony-stimulating factor (CSF-1) during human monocytic differentiation. Biochem Biophys Res Commun 141:924-930.
394. Oster, W., Lindemann, A., Mertelsmann, R., and Herrmann, F. 1988. Regulation of gene expression of M-, G-, GM-, and multi-CSF in normal and malignant hematopoietic cells. Blood Cells 14:443-462.
395. Horiguchi, J., Warren, M.K., and Kufe, D. 1987. Expression of the macrophage-specific colony-stimulating factor in human monocytes treated with granulocyte-macrophage colony-stimulating factor. Blood 69:1259-1261.
396. Bakheet, T., Frevel, M., Williams, B.R., Greer, W., and Khabar, K.S. 2001. ARED: human AU-rich element-containing mRNA database reveals an unexpectedly diverse functional repertoire of encoded proteins. Nucleic Acids Res 29:246-254.
397. Shaw, G., and Kamen, R. 1986. A conserved AU sequence from the 3' untranslated region of GM-CSF mRNA mediates selective mRNA degradation. Cell 46:659-667.
398. Woo, H.H., Baker, T., Laszlo, C., and Chambers, S.K. 2013. Nucleolin mediates microRNA-directed CSF-1 mRNA deadenylation but increases translation of CSF-1 mRNA. Mol Cell Proteomics 12:1661-1677.
399. Tushinski, R.J., Oliver, I.T., Guilbert, L.J., Tynan, P.W., Warner, J.R., and Stanley, E.R. 1982. Survival of mononuclear phagocytes depends of a
94
lineage specific growth factor that the differentiated cells selectively destroy. Cell 28:71-81.
400. Mancini, A., Koch, A., Wilms, R., and Tamura, T. 2002. c-Cbl associates directly with the C-terminal tail of the receptor for the macrophage colony-stimulating factor, c-Fms, and down-modulates this receptor but not the viral oncogene v-Fms. J Biol Chem 277:14635-14640.
401. Wang, Y., Yeung, Y.G., and Stanley, E.R. 1999. CSF-1 stimulated multiubiquitination of the CSF-1 receptor and of Cbl follows their tyrosine phosphorylation and association with other signaling proteins. Journal of Cellular Biochemistry 72:119-134.
402. Wilhelmsen, K., Burkhalter, S., and van der Geer, P. 2002. C-Cbl binds the CSF-1 receptor at tyrosine 973, a novel phosphorylation site in the receptor's carboxy-terminus. Oncogene 21:1079-1089.
403. Barreda, D.R., and Belosevic, M. 2001. Characterisation of growth enhancing factor production in different phases of in vitro fish macrophage development. Fish and Shellfish Immunology 11:169-185.
404. Neumann, N.F., Barreda, D., and Belosevic, M. 1998. Production of a macrophage growth factor(s) by a goldfish macrophage cell line and macrophages derived from goldfish kidney leukocytes. Dev Comp Immunol 22:417-432.
405. Pixley, F.J., and Stanley, E.R. 2004. CSF-1 regulation of the wandering macrophage: complexity in action. Trends Cell Biol 14:628-638.
406. Herpin, A., Lelong, C., and Favrel, P. 2004. Transforming growth factor-beta-related proteins: an ancestral and widespread superfamily of cytokines in metazoans. Dev Comp Immunol 28:461-485.
407. Govinden, R., and Bhoola, K.D. 2003. Genealogy, expression, and cellular function of transforming growth factor-beta. Pharmacol Ther 98:257-265.
408. Khalil, N. 1999. TGF-beta: from latent to active. Microbes Infect 1:1255-1263.
409. Gleizes, P.E., Munger, J.S., Nunes, I., Harpel, J.G., Mazzieri, R., Noguera, I., and Rifkin, D.B. 1997. TGF-beta latency: biological significance and mechanisms of activation. Stem Cells 15:190-197.
410. Munger, J.S., Harpel, J.G., Gleizes, P.E., Mazzieri, R., Nunes, I., and Rifkin, D.B. 1997. Latent transforming growth factor-beta: structural features and mechanisms of activation. Kidney Int 51:1376-1382.
411. Nunes, I., Gleizes, P.E., Metz, C.N., and Rifkin, D.B. 1997. Latent transforming growth factor-beta binding protein domains involved in activation and transglutaminase-dependent cross-linking of latent transforming growth factor-beta. J Cell Biol 136:1151-1163.
412. Hata, A., Shi, Y., and Massague, J. 1998. TGF-beta signaling and cancer: structural and functional consequences of mutations in Smads. Mol Med Today 4:257-262.
413. Massague, J. 1998. TGF-beta signal transduction. Annu Rev Biochem 67:753-791.
95
414. Massague, J., and Weis-Garcia, F. 1996. Serine/threonine kinase receptors: mediators of transforming growth factor beta family signals. Cancer Surv 27:41-64.
415. Kretzschmar, M., and Massague, J. 1998. SMADs: mediators and regulators of TGF-beta signaling. Curr Opin Genet Dev 8:103-111.
416. Sillett, H.K., Cruickshank, S.M., Southgate, J., and Trejdosiewicz, L.K. 2001. Transforming growth factor-beta promotes 'death by neglect' in post-activated human T cells. Immunology 102:310-316.
417. Bellone, G., Aste-Amezaga, M., Trinchieri, G., and Rodeck, U. 1995. Regulation of NK cell functions by TGF-beta 1. J Immunol 155:1066-1073.
418. Rook, A.H., Kehrl, J.H., Wakefield, L.M., Roberts, A.B., Sporn, M.B., Burlington, D.B., Lane, H.C., and Fauci, A.S. 1986. Effects of transforming growth factor beta on the functions of natural killer cells: depressed cytolytic activity and blunting of interferon responsiveness. J Immunol 136:3916-3920.
419. Ludviksson, B.R., Seegers, D., Resnick, A.S., and Strober, W. 2000. The effect of TGF-beta1 on immune responses of naive versus memory CD4+ Th1/Th2 T cells. Eur J Immunol 30:2101-2111.
420. Sica, A., and Bronte, V. 2007. Altered macrophage differentiation and immune dysfunction in tumor development. J Clin Invest 117:1155-1166.
421. Letterio, J.J., and Roberts, A.B. 1998. Regulation of immune responses by TGF-beta. Annu Rev Immunol 16:137-161.
422. Geissmann, F., Revy, P., Regnault, A., Lepelletier, Y., Dy, M., Brousse, N., Amigorena, S., Hermine, O., and Durandy, A. 1999. TGF-beta 1 prevents the noncognate maturation of human dendritic Langerhans cells. J Immunol 162:4567-4575.
423. Martinez, F.O., Sica, A., Mantovani, A., and Locati, M. 2008. Macrophage activation and polarization. Front Biosci 13:453-461.
424. Pinson, D.M., LeClaire, R.D., Lorsbach, R.B., Parmely, M.J., and Russell, S.W. 1992. Regulation by transforming growth factor-beta 1 of expression and function of the receptor for IFN-gamma on mouse macrophages. J Immunol 149:2028-2034.
425. Ding, A.H., and Porteu, F. 1992. Regulation of tumor necrosis factor receptors on phagocytes. Proc Soc Exp Biol Med 200:458-465.
426. Shull, M.M., Ormsby, I., Kier, A.B., Pawlowski, S., Diebold, R.J., Yin, M., Allen, R., Sidman, C., Proetzel, G., Calvin, D., et al. 1992. Targeted disruption of the mouse transforming growth factor-beta 1 gene results in multifocal inflammatory disease. Nature 359:693-699.
427. Kulkarni, A.B., and Karlsson, S. 1993. Transforming growth factor-beta 1 knockout mice. A mutation in one cytokine gene causes a dramatic inflammatory disease. Am J Pathol 143:3-9.
428. Kulkarni, A.B., Huh, C.G., Becker, D., Geiser, A., Lyght, M., Flanders, K.C., Roberts, A.B., Sporn, M.B., Ward, J.M., and Karlsson, S. 1993. Transforming growth factor beta 1 null mutation in mice causes excessive inflammatory response and early death. Proc Natl Acad Sci U S A 90:770-774.
96
429. Geiser, A.G., Letterio, J.J., Kulkarni, A.B., Karlsson, S., Roberts, A.B., and Sporn, M.B. 1993. Transforming growth factor beta 1 (TGF-beta 1) controls expression of major histocompatibility genes in the postnatal mouse: aberrant histocompatibility antigen expression in the pathogenesis of the TGF-beta 1 null mouse phenotype. Proc Natl Acad Sci U S A 90:9944-9948.
430. Yaswen, L., Kulkarni, A.B., Fredrickson, T., Mittleman, B., Schiffman, R., Payne, S., Longenecker, G., Mozes, E., and Karlsson, S. 1996. Autoimmune manifestations in the transforming growth factor-beta 1 knockout mouse. Blood 87:1439-1445.
431. Christ, M., McCartney-Francis, N.L., Kulkarni, A.B., Ward, J.M., Mizel, D.E., Mackall, C.L., Gress, R.E., Hines, K.L., Tian, H., Karlsson, S., et al. 1994. Immune dysregulation in TGF-beta 1-deficient mice. J Immunol 153:1936-1946.
432. Goumans, M.J., and Mummery, C. 2000. Functional analysis of the TGFbeta receptor/Smad pathway through gene ablation in mice. Int J Dev Biol 44:253-265.
433. McCartney-Francis, N., Mizel, D., Wong, H., Wahl, L., and Wahl, S. 1990. TGF-beta regulates production of growth factors and TGF-beta by human peripheral blood monocytes. Growth Factors 4:27-35.
434. Wahl, S.M., McCartney-Francis, N., Allen, J.B., Dougherty, E.B., and Dougherty, S.F. 1990. Macrophage production of TGF-beta and regulation by TGF-beta. Ann N Y Acad Sci 593:188-196.
435. Wiseman, D.M., Polverini, P.J., Kamp, D.W., and Leibovich, S.J. 1988. Transforming growth factor-beta (TGF beta) is chemotactic for human monocytes and induces their expression of angiogenic activity. Biochem Biophys Res Commun 157:793-800.
436. Chantry, D., Turner, M., Abney, E., and Feldmann, M. 1989. Modulation of cytokine production by transforming growth factor-beta. J Immunol 142:4295-4300.
437. Bogdan, C., Paik, J., Vodovotz, Y., and Nathan, C. 1992. Contrasting mechanisms for suppression of macrophage cytokine release by transforming growth factor-beta and interleukin-10. J Biol Chem 267:23301-23308.
438. Parekh, T., Saxena, B., Reibman, J., Cronstein, B.N., and Gold, L.I. 1994. Neutrophil chemotaxis in response to TGF-beta isoforms (TGF-beta 1, TGF-beta 2, TGF-beta 3) is mediated by fibronectin. J Immunol 152:2456-2466.
439. Reibman, J., Meixler, S., Lee, T.C., Gold, L.I., Cronstein, B.N., Haines, K.A., Kolasinski, S.L., and Weissmann, G. 1991. Transforming growth factor beta 1, a potent chemoattractant for human neutrophils, bypasses classic signal-transduction pathways. Proc Natl Acad Sci U S A 88:6805-6809.
440. Tsunawaki, S., Sporn, M., Ding, A., and Nathan, C. 1988. Deactivation of macrophages by transforming growth factor-beta. Nature 334:260-262.
97
441. Hardie, L.J., Laing, K.J., Daniels, G.D., Grabowski, P.S., Cunningham, C., and Secombes, C.J. 1998. Isolation of the first piscine transforming growth factor beta gene: analysis reveals tissue specific expression and a potential regulatory sequence in rainbow trout (Oncorhynchus mykiss). Cytokine 10:555-563.
442. Daniels, G.D., and Secombes, C.J. 1999. Genomic organisation of rainbow trout, Oncorhynchus mykiss TGF-beta. Dev Comp Immunol 23:139-147.
443. Zhan, Y., and Jimmy, K. 2000. Molecular isolation and characterisation of carp transforming growth factor beta 1 from activated leucocytes. Fish Shellfish Immunol 10:309-318.
444. Tafalla, C., Aranguren, R., Secombes, C.J., Castrillo, J.L., Novoa, B., and Figueras, A. 2003. Molecular characterisation of sea bream (Sparus aurata) transforming growth factor beta1. Fish Shellfish Immunol 14:405-421.
445. Harms, C.A., Howard, K.E., Wolf, J.C., Smith, S.A., and Kennedy-Stoskopf, S. 2003. Transforming growth factor-beta response to mycobacterial infection in striped bass Morone saxatilis and hybrid tilapia Oreochromis spp. Vet Immunol Immunopathol 95:155-163.
446. Hawrylowicz, C.M., and O'Garra, A. 2005. Potential role of interleukin-10-secreting regulatory T cells in allergy and asthma. Nat Rev Immunol 5:271-283.
447. O'Garra, A., Barrat, F.J., Castro, A.G., Vicari, A., and Hawrylowicz, C. 2008. Strategies for use of IL-10 or its antagonists in human disease. Immunol Rev 223:114-131.
448. Moore, K.W., de Waal Malefyt, R., Coffman, R.L., and O'Garra, A. 2001. Interleukin-10 and the interleukin-10 receptor. Annu Rev Immunol 19:683-765.
449. Bekker, L.G., Maartens, G., Steyn, L., and Kaplan, G. 1998. Selective increase in plasma tumor necrosis factor-alpha and concomitant clinical deterioration after initiating therapy in patients with severe tuberculosis. J Infect Dis 178:580-584.
450. Gazzinelli, R.T., Wysocka, M., Hieny, S., Scharton-Kersten, T., Cheever, A., Kuhn, R., Muller, W., Trinchieri, G., and Sher, A. 1996. In the absence of endogenous IL-10, mice acutely infected with Toxoplasma gondii succumb to a lethal immune response dependent on CD4+ T cells and accompanied by overproduction of IL-12, IFN-gamma and TNF-alpha. J Immunol 157:798-805.
451. Grau, G.E., Fajardo, L.F., Piguet, P.F., Allet, B., Lambert, P.H., and Vassalli, P. 1987. Tumor necrosis factor (cachectin) as an essential mediator in murine cerebral malaria. Science 237:1210-1212.
452. Magez, S., Stijlemans, B., Caljon, G., Eugster, H.P., and De Baetselier, P. 2002. Control of experimental Trypanosoma brucei infections occurs independently of lymphotoxin-alpha induction. Infect Immun 70:1342-1351.
453. Robinson, N., Wolke, M., Ernestus, K., and Plum, G. 2007. A mycobacterial gene involved in synthesis of an outer cell envelope lipid is a
98
key factor in prevention of phagosome maturation. Infect Immun 75:581-591.
454. Suvas, S., Azkur, A.K., Kim, B.S., Kumaraguru, U., and Rouse, B.T. 2004. CD4+CD25+ regulatory T cells control the severity of viral immunoinflammatory lesions. J Immunol 172:4123-4132.
455. Wilson, E.H., Wille-Reece, U., Dzierszinski, F., and Hunter, C.A. 2005. A critical role for IL-10 in limiting inflammation during toxoplasmic encephalitis. J Neuroimmunol 165:63-74.
456. Wu, Y., Wang, Q.H., Zheng, L., Feng, H., Liu, J., Ma, S.H., and Cao, Y.M. 2007. Plasmodium yoelii: distinct CD4(+)CD25(+) regulatory T cell responses during the early stages of infection in susceptible and resistant mice. Exp Parasitol 115:301-304.
457. McGuirk, P., McCann, C., and Mills, K.H. 2002. Pathogen-specific T regulatory 1 cells induced in the respiratory tract by a bacterial molecule that stimulates interleukin 10 production by dendritic cells: a novel strategy for evasion of protective T helper type 1 responses by Bordetella pertussis. J Exp Med 195:221-231.
458. Anderson, C.F., Mendez, S., and Sacks, D.L. 2005. Nonhealing infection despite Th1 polarization produced by a strain of Leishmania major in C57BL/6 mice. J Immunol 174:2934-2941.
459. Belkaid, Y., Hoffmann, K.F., Mendez, S., Kamhawi, S., Udey, M.C., Wynn, T.A., and Sacks, D.L. 2001. The role of interleukin (IL)-10 in the persistence of Leishmania major in the skin after healing and the therapeutic potential of anti-IL-10 receptor antibody for sterile cure. J Exp Med 194:1497-1506.
460. Roque, S., Nobrega, C., Appelberg, R., and Correia-Neves, M. 2007. IL-10 underlies distinct susceptibility of BALB/c and C57BL/6 mice to Mycobacterium avium infection and influences efficacy of antibiotic therapy. J Immunol 178:8028-8035.
461. Feng, C.G., Kullberg, M.C., Jankovic, D., Cheever, A.W., Caspar, P., Coffman, R.L., and Sher, A. 2002. Transgenic mice expressing human interleukin-10 in the antigen-presenting cell compartment show increased susceptibility to infection with Mycobacterium avium associated with decreased macrophage effector function and apoptosis. Infect Immun 70:6672-6679.
462. Groux, H., Cottrez, F., Rouleau, M., Mauze, S., Antonenko, S., Hurst, S., McNeil, T., Bigler, M., Roncarolo, M.G., and Coffman, R.L. 1999. A transgenic model to analyze the immunoregulatory role of IL-10 secreted by antigen-presenting cells. J Immunol 162:1723-1729.
463. Reed, S.G., Brownell, C.E., Russo, D.M., Silva, J.S., Grabstein, K.H., and Morrissey, P.J. 1994. IL-10 mediates susceptibility to Trypanosoma cruzi infection. J Immunol 153:3135-3140.
464. Sellon, R.K., Tonkonogy, S., Schultz, M., Dieleman, L.A., Grenther, W., Balish, E., Rennick, D.M., and Sartor, R.B. 1998. Resident enteric bacteria are necessary for development of spontaneous colitis and immune system activation in interleukin-10-deficient mice. Infect Immun 66:5224-5231.
99
465. Fiorentino, D.F., Zlotnik, A., Mosmann, T.R., Howard, M., and O'Garra, A. 1991. IL-10 inhibits cytokine production by activated macrophages. J Immunol 147:3815-3822.
466. de Waal Malefyt, R., Abrams, J., Bennett, B., Figdor, C.G., and de Vries, J.E. 1991. Interleukin 10(IL-10) inhibits cytokine synthesis by human monocytes: an autoregulatory role of IL-10 produced by monocytes. J Exp Med 174:1209-1220.
467. Boonstra, A., Rajsbaum, R., Holman, M., Marques, R., Asselin-Paturel, C., Pereira, J.P., Bates, E.E., Akira, S., Vieira, P., Liu, Y.J., et al. 2006. Macrophages and myeloid dendritic cells, but not plasmacytoid dendritic cells, produce IL-10 in response to MyD88- and TRIF-dependent TLR signals, and TLR-independent signals. J Immunol 177:7551-7558.
468. Chang, E.Y., Guo, B., Doyle, S.E., and Cheng, G. 2007. Cutting edge: involvement of the type I IFN production and signaling pathway in lipopolysaccharide-induced IL-10 production. J Immunol 178:6705-6709.
469. Rieger, A., and Bar-Or, A. 2008. B-cell-derived interleukin-10 in autoimmune disease: regulating the regulators. Nat Rev Immunol 8:486-487.
470. Akbari, O., DeKruyff, R.H., and Umetsu, D.T. 2001. Pulmonary dendritic cells producing IL-10 mediate tolerance induced by respiratory exposure to antigen. Nat Immunol 2:725-731.
471. Siewe, L., Bollati-Fogolin, M., Wickenhauser, C., Krieg, T., Muller, W., and Roers, A. 2006. Interleukin-10 derived from macrophages and/or neutrophils regulates the inflammatory response to LPS but not the response to CpG DNA. Eur J Immunol 36:3248-3255.
472. Fiorentino, D.F., Bond, M.W., and Mosmann, T.R. 1989. Two types of mouse T helper cell. IV. Th2 clones secrete a factor that inhibits cytokine production by Th1 clones. J Exp Med 170:2081-2095.
473. Saraiva, M., Christensen, J.R., Veldhoen, M., Murphy, T.L., Murphy, K.M., and O'Garra, A. 2009. Interleukin-10 production by Th1 cells requires interleukin-12-induced STAT4 transcription factor and ERK MAP kinase activation by high antigen dose. Immunity 31:209-219.
474. Saraiva, M., and O'Garra, A. 2010. The regulation of IL-10 production by immune cells. Nat Rev Immunol 10:170-181.
475. Oswald, I.P., Wynn, T.A., Sher, A., and James, S.L. 1992. Interleukin 10 inhibits macrophage microbicidal activity by blocking the endogenous production of tumor necrosis factor alpha required as a costimulatory factor for interferon gamma-induced activation. Proc Natl Acad Sci U S A 89:8676-8680.
476. Fiorentino, D.F., Zlotnik, A., Vieira, P., Mosmann, T.R., Howard, M., Moore, K.W., and O'Garra, A. 1991. IL-10 acts on the antigen-presenting cell to inhibit cytokine production by Th1 cells. J Immunol 146:3444-3451.
477. Ding, L., and Shevach, E.M. 1992. IL-10 inhibits mitogen-induced T cell proliferation by selectively inhibiting macrophage costimulatory function. J Immunol 148:3133-3139.
100
478. Bogdan, C., Vodovotz, Y., and Nathan, C. 1991. Macrophage deactivation by interleukin 10. J Exp Med 174:1549-1555.
479. de Waal Malefyt, R., Haanen, J., Spits, H., Roncarolo, M.G., te Velde, A., Figdor, C., Johnson, K., Kastelein, R., Yssel, H., and de Vries, J.E. 1991. Interleukin 10 (IL-10) and viral IL-10 strongly reduce antigen-specific human T cell proliferation by diminishing the antigen-presenting capacity of monocytes via downregulation of class II major histocompatibility complex expression. J Exp Med 174:915-924.
480. Walter, M.R., and Nagabhushan, T.L. 1995. Crystal structure of interleukin 10 reveals an interferon gamma-like fold. Biochemistry 34:12118-12125.
481. Syto, R., Murgolo, N.J., Braswell, E.H., Mui, P., Huang, E., and Windsor, W.T. 1998. Structural and biological stability of the human interleukin 10 homodimer. Biochemistry 37:16943-16951.
482. Kotenko, S.V., Krause, C.D., Izotova, L.S., Pollack, B.P., Wu, W., and Pestka, S. 1997. Identification and functional characterization of a second chain of the interleukin-10 receptor complex. EMBO J 16:5894-5903.
483. Liu, Y., Wei, S.H., Ho, A.S., de Waal Malefyt, R., and Moore, K.W. 1994. Expression cloning and characterization of a human IL-10 receptor. J Immunol 152:1821-1829.
484. Spencer, S.D., Di Marco, F., Hooley, J., Pitts-Meek, S., Bauer, M., Ryan, A.M., Sordat, B., Gibbs, V.C., and Aguet, M. 1998. The orphan receptor CRF2-4 is an essential subunit of the interleukin 10 receptor. J Exp Med 187:571-578.
485. Tan, J.C., Indelicato, S.R., Narula, S.K., Zavodny, P.J., and Chou, C.C. 1993. Characterization of interleukin-10 receptors on human and mouse cells. J Biol Chem 268:21053-21059.
486. Weber-Nordt, R.M., Riley, J.K., Greenlund, A.C., Moore, K.W., Darnell, J.E., and Schreiber, R.D. 1996. Stat3 recruitment by two distinct ligand-induced, tyrosine-phosphorylated docking sites in the interleukin-10 receptor intracellular domain. J Biol Chem 271:27954-27961.
487. Zou, J., Clark, M.S., and Secombes, C.J. 2003. Characterisation, expression and promoter analysis of an interleukin 10 homologue in the puffer fish, Fugu rubripes. Immunogenetics 55:325-335.
488. Inoue, Y., Kamota, S., Ito, K., Yoshiura, Y., Ototake, M., Moritomo, T., and Nakanishi, T. 2005. Molecular cloning and expression analysis of rainbow trout (Oncorhynchus mykiss) interleukin-10 cDNAs. Fish Shellfish Immunol 18:335-344.
489. Zhang, D.C., Shao, Y.Q., Huang, Y.Q., and Jiang, S.G. 2005. Cloning, characterization and expression analysis of interleukin-10 from the zebrafish (Danio rerion). J Biochem Mol Biol 38:571-576.
490. Savan, R., Igawa, D., and Sakai, M. 2003. Cloning, characterization and expression analysis of interleukin-10 from the common carp, Cyprinus carpio L. Eur J Biochem 270:4647-4654.
491. Pinto, R.D., Nascimento, D.S., Reis, M.I., do Vale, A., and Dos Santos, N.M. 2007. Molecular characterization, 3D modelling and expression
101
analysis of sea bass (Dicentrarchus labrax L.) interleukin-10. Mol Immunol 44:2056-2065.
492. Seppola, M., Larsen, A.N., Steiro, K., Robertsen, B., and Jensen, I. 2008. Characterisation and expression analysis of the interleukin genes, IL-1beta, IL-8 and IL-10, in Atlantic cod (Gadus morhua L.). Mol Immunol 45:887-897.
493. Cursiefen, C., Chen, L., Borges, L.P., Jackson, D., Cao, J., Radziejewski, C., D'Amore, P.A., Dana, M.R., Wiegand, S.J., and Streilein, J.W. 2004. VEGF-A stimulates lymphangiogenesis and hemangiogenesis in inflammatory neovascularization via macrophage recruitment. J Clin Invest 113:1040-1050.
494. Li, X., Lee, C., Tang, Z., Zhang, F., Arjunan, P., Li, Y., Hou, X., Kumar, A., and Dong, L. 2009. VEGF-B: a survival, or an angiogenic factor? Cell Adh Migr 3:322-327.
495. Zhang, F., Tang, Z., Hou, X., Lennartsson, J., Li, Y., Koch, A.W., Scotney, P., Lee, C., Arjunan, P., Dong, L., et al. 2009. VEGF-B is dispensable for blood vessel growth but critical for their survival, and VEGF-B targeting inhibits pathological angiogenesis. Proc Natl Acad Sci U S A 106:6152-6157.
496. Li, Y., Zhang, F., Nagai, N., Tang, Z., Zhang, S., Scotney, P., Lennartsson, J., Zhu, C., Qu, Y., Fang, C., et al. 2008. VEGF-B inhibits apoptosis via VEGFR-1-mediated suppression of the expression of BH3-only protein genes in mice and rats. J Clin Invest 118:913-923.
497. Kataru, R.P., Jung, K., Jang, C., Yang, H., Schwendener, R.A., Baik, J.E., Han, S.H., Alitalo, K., and Koh, G.Y. 2009. Critical role of CD11b+ macrophages and VEGF in inflammatory lymphangiogenesis, antigen clearance, and inflammation resolution. Blood 113:5650-5659.
498. Orlandini, M., Marconcini, L., Ferruzzi, R., and Oliviero, S. 1996. Identification of a c-fos-induced gene that is related to the platelet-derived growth factor/vascular endothelial growth factor family. Proc Natl Acad Sci U S A 93:11675-11680.
499. Yamada, Y., Nezu, J., Shimane, M., and Hirata, Y. 1997. Molecular cloning of a novel vascular endothelial growth factor, VEGF-D. Genomics 42:483-488.
500. Maglione, D., Guerriero, V., Viglietto, G., Ferraro, M.G., Aprelikova, O., Alitalo, K., Del Vecchio, S., Lei, K.J., Chou, J.Y., and Persico, M.G. 1993. Two alternative mRNAs coding for the angiogenic factor, placenta growth factor (PlGF), are transcribed from a single gene of chromosome 14. Oncogene 8:925-931.
501. Maglione, D., Guerriero, V., Rambaldi, M., Russo, G., and Persico, M.G. 1993. Translation of the placenta growth factor mRNA is severely affected by a small open reading frame localized in the 5' untranslated region. Growth Factors 8:141-152.
502. Kerjaschki, D. 2005. The crucial role of macrophages in lymphangiogenesis. J Clin Invest 115:2316-2319.
102
503. Maruyama, K., Asai, J., Ii, M., Thorne, T., Losordo, D.W., and D'Amore, P.A. 2007. Decreased macrophage number and activation lead to reduced lymphatic vessel formation and contribute to impaired diabetic wound healing. Am J Pathol 170:1178-1191.
504. Xiong, M., Elson, G., Legarda, D., and Leibovich, S.J. 1998. Production of vascular endothelial growth factor by murine macrophages: regulation by hypoxia, lactate, and the inducible nitric oxide synthase pathway. Am J Pathol 153:587-598.
505. Ramanathan, M., Giladi, A., and Leibovich, S.J. 2003. Regulation of vascular endothelial growth factor gene expression in murine macrophages by nitric oxide and hypoxia. Exp Biol Med (Maywood) 228:697-705.
506. Ferrara, N., and Davis-Smyth, T. 1997. The biology of vascular endothelial growth factor. Endocr Rev 18:4-25.
507. Ferrara, N., and Keyt, B. 1997. Vascular endothelial growth factor: basic biology and clinical implications. EXS 79:209-232.
508. Weis, S.M., and Cheresh, D.A. 2005. Pathophysiological consequences of VEGF-induced vascular permeability. Nature 437:497-504.
509. Zittermann, S.I., and Issekutz, A.C. 2006. Endothelial growth factors VEGF and bFGF differentially enhance monocyte and neutrophil recruitment to inflammation. J Leukoc Biol 80:247-257.
510. Shaik-Dasthagirisaheb, Y.B., Varvara, G., Murmura, G., Saggini, A., Potalivo, G., Caraffa, A., Antinolfi, P., Tete, S., Tripodi, D., Conti, F., et al. 2013. Vascular endothelial growth factor (VEGF), mast cells and inflammation. Int J Immunopathol Pharmacol 26:327-335.
511. Martino, M.M., Briquez, P.S., Guc, E., Tortelli, F., Kilarski, W.W., Metzger, S., Rice, J.J., Kuhn, G.A., Muller, R., Swartz, M.A., et al. 2014. Growth factors engineered for super-affinity to the extracellular matrix enhance tissue healing. Science 343:885-888.
512. Holmes, K., Roberts, O.L., Thomas, A.M., and Cross, M.J. 2007. Vascular endothelial growth factor receptor-2: structure, function, intracellular signalling and therapeutic inhibition. Cell Signal 19:2003-2012.
513. Karkkainen, M.J., and Petrova, T.V. 2000. Vascular endothelial growth factor receptors in the regulation of angiogenesis and lymphangiogenesis. Oncogene 19:5598-5605.
514. Nasevicius, A., Larson, J., and Ekker, S.C. 2000. Distinct requirements for zebrafish angiogenesis revealed by a VEGF-A morphant. Yeast 17:294-301.
515. Goishi, K., and Klagsbrun, M. 2004. Vascular endothelial growth factor and its receptors in embryonic zebrafish blood vessel development. Curr Top Dev Biol 62:127-152.
516. Carow, B., and Rottenberg, M.E. 2014. SOCS3, a Major Regulator of Infection and Inflammation. Front Immunol 5:58.
517. White, C.A., and Nicola, N.A. 2013. SOCS3: An essential physiological inhibitor of signaling by interleukin-6 and G-CSF family cytokines. JAKSTAT 2:e25045.
518. Yoshimura, A., Suzuki, M., Sakaguchi, R., Hanada, T., and Yasukawa, H. 2012. SOCS, Inflammation, and Autoimmunity. Front Immunol 3:20.
103
519. Marine, J.C., McKay, C., Wang, D., Topham, D.J., Parganas, E., Nakajima, H., Pendeville, H., Yasukawa, H., Sasaki, A., Yoshimura, A., et al. 1999. SOCS3 is essential in the regulation of fetal liver erythropoiesis. Cell 98:617-627.
520. Roberts, A.W., Robb, L., Rakar, S., Hartley, L., Cluse, L., Nicola, N.A., Metcalf, D., Hilton, D.J., and Alexander, W.S. 2001. Placental defects and embryonic lethality in mice lacking suppressor of cytokine signaling 3. Proc Natl Acad Sci U S A 98:9324-9329.
521. Croker, B.A., Metcalf, D., Robb, L., Wei, W., Mifsud, S., DiRago, L., Cluse, L.A., Sutherland, K.D., Hartley, L., Williams, E., et al. 2004. SOCS3 is a critical physiological negative regulator of G-CSF signaling and emergency granulopoiesis. Immunity 20:153-165.
522. Jin, H.J., Shao, J.Z., and Xiang, L.X. 2007. Identification and characterization of suppressor of cytokine signaling 3 (SOCS-3) homologues in teleost fish. Mol Immunol 44:1042-1051.
523. Wang, T., and Secombes, C.J. 2008. Rainbow trout suppressor of cytokine signalling (SOCS)-1, 2 and 3: molecular identification, expression and modulation. Mol Immunol 45:1449-1457.
524. Jin, H.J., Shao, J.Z., Xiang, L.X., Wang, H., and Sun, L.L. 2008. Global identification and comparative analysis of SOCS genes in fish: insights into the molecular evolution of SOCS family. Mol Immunol 45:1258-1268.
525. Chen, F., Lee, Y., Jiang, Y., Wang, S., Peatman, E., Abernathy, J., Liu, H., Liu, S., Kucuktas, H., Ke, C., et al. 2010. Identification and characterization of full-length cDNAs in channel catfish (Ictalurus punctatus) and blue catfish (Ictalurus furcatus). PLoS One 5:e11546.
526. Xiao, Z.G., Liu, H., Fu, J.P., Hu, W., Wang, Y.P., and Guo, Q.L. 2010. Cloning of common carp SOCS-3 gene and its expression during embryogenesis, GH-transgene and viral infection. Fish Shellfish Immunol 28:362-371.
527. Elsaeidi, F., Bemben, M.A., Zhao, X.F., and Goldman, D. 2014. Jak/Stat signaling stimulates zebrafish optic nerve regeneration and overcomes the inhibitory actions of Socs3 and Sfpq. J Neurosci 34:2632-2644.
528. Liang, J., Wang, D., Renaud, G., Wolfsberg, T.G., Wilson, A.F., and Burgess, S.M. 2012. The stat3/socs3a pathway is a key regulator of hair cell regeneration in zebrafish. [corrected]. J Neurosci 32:10662-10673.
529. Studzinski, A.L., Almeida, D.V., Lanes, C.F., Figueiredo Mde, A., and Marins, L.F. 2009. SOCS1 and SOCS3 are the main negative modulators of the somatotrophic axis in liver of homozygous GH-transgenic zebrafish (Danio rerio). Gen Comp Endocrinol 161:67-72.
530. Joseph, S.W., and Carnahan, A.M. 2000. Update on the genus Aeromonas. ASM News 66:218-223.
531. Janda, J.M., and Duffey, P.S. 1988. Mesophilic aeromonads in human disease: current taxonomy, laboratory identification, and infectious disease spectrum. Rev Infect Dis 10:980-997.
104
532. Popoff, M.Y., Coynault, C., Kiredjian, M., and Lemelin, M. 1981. Polynucleotide sequence relatedness among motile Aeromonas species. Curr. Microbiol. 5:109-114.
533. Carnahan, A.M. 1993. Aeromonas taxonomy: a sea of change. Med. Microbiol. Lett. 2:206-211.
534. Janda, J.M., and Abbott, S.L. 2007. 16S rRNA gene sequencing for bacterial identification in the diagnostic laboratory: pluses, perils, and pitfalls. J Clin Microbiol 45:2761-2764.
535. Janda, J.M., and Abbott, S.L. 2010. The genus Aeromonas: taxonomy, pathogenicity, and infection. Clin Microbiol Rev 23:35-73.
536. Janda, J.M., and Abbott, S.L. 1998. Evolving concepts regarding the genus Aeromonas: an expanding Panorama of species, disease presentations, and unanswered questions. Clin Infect Dis 27:332-344.
537. Kozinska, A. 2007. Dominant pathogenic species of mesophilic aeromonads isolated from diseased and healthy fish cultured in Poland. J Fish Dis 30:293-301.
538. Beaz-Hidalgo, R., Alperi, A., Bujan, N., Romalde, J.L., and Figueras, M.J. 2010. Comparison of phenotypical and genetic identification of Aeromonas strains isolated from diseased fish. Syst Appl Microbiol 33:149-153.
539. Noga, E. 2010. Fish disease: Willey-Blackwell. 540. Austin, B., and Autin, D. 2007. Bacterial fish pathogens, disease of farmed
and wild fish: Springer-Praxis. 541. Wiklund, T., and Dalsgaard, I. 1998. Occurrence and significance of
atypical Aeromonas salmonicida in non-salmonid and salmonid fish species: a review. Dis Aquat Organ 32:49-69.
542. Bernoth, E., Ellis, A., Midtlyng, P., Olivier, G., and Smith, P. 1997. Furunculosis Multidisciplinary Fish Disease Research: Academic Press.
543. Bullock, G.L., Cipriano, R.C., Snieszko, S.F., and United States. Division of Fishery Ecology Research. 1983. Furunculosis and other diseases caused by aeromonas salmonicida. Washington, D.C.: U.S. Dept. of the Interior, Fish and Wildlife Service, Division of Fishery Ecology Research. 29 p. pp.
544. Bullock, G.L., and U.S. Fish and Wildlife Service. 1990. Furunculosis and other diseases caused by Aeromonas salmonicida. Washington, DC: Dept. of the Interior Available from Publications Unit, U.S. Fish and Wildlife Service. 1 folded sheet (6 p.) pp.
545. Dalsgaard, I., Gudmundsdottir, B.K., Helgason, S., Hoie, S., Thoresen, O.F., Wichardt, U.P., and Wiklund, T. 1998. Identification of atypical Aeromonas salmonicida: inter-laboratory evaluation and harmonization of methods. J Appl Microbiol 84:999-1006.
546. Godoy, M., Gherardelli, V., Heisinger, A., Fernandez, J., Olmos, P., Ovalle, L., Ilardi, P., and Avendano-Herrera, R. 2010. First description of atypical furunculosis in freshwater farmed Atlantic salmon, Salmo salar L., in Chile. J Fish Dis 33:441-449.
547. Goldschmidt-Clermont, E., Hochwartner, O., Demarta, A., Caminada, A.P., and Frey, J. 2009. Outbreaks of an ulcerative and haemorrhagic disease in
105
Arctic char Salvelinus alpinus caused by Aeromonas salmonicida subsp. smithia. Dis Aquat Organ 86:81-86.
548. Gustafson, C.E., Thomas, C.J., and Trust, T.J. 1992. Detection of Aeromonas salmonicida from fish by using polymerase chain reaction amplification of the virulence surface array protein gene. Appl Environ Microbiol 58:3816-3825.
549. Mawdesley-Thomas, L.E. 1969. Furunculosis in the goldfish, Carassius auratus (L.). J Fish Biol 1.
550. Horne, J.H. 1928. Furunculosis in Trout and the Importance of Carriers in the Spread of the Disease. J Hyg (Lond) 28:67-78.
551. Scott, M. 1968. The pathogenicity of Aeromonas salmonicida (Griffin) in sea and brackish waters. J Gen Microbiol 50:321-327.
552. Johnsen, B.O., and Jensen, A.J. 1994. The spread of furunculosis in salmonids in Norwegian rivers. J Fish Biol 45.
553. Miyazaki, T. 1975. Histopathological studies on the furunculosis of the Amago. – II. Perbranchial infection. Fish Pathol 9:203-212.
554. Miyazaki, T. 1975. Histopathological studies on the furunculosis of the Amago. – III. Perbcutaneous infection. Fish Pathol 9:213-218.
555. Takahashi, K., Kawana, T., and Nakamura, T. 1975. Studies on ulcer disease in goldfish - III. Infection experiments. Fish Pathol 9:187-192.
556. Wooster, G.A., and Bowser, P.R. 1996. The aerobiological pathway of a fish pathogen: survival and dissemination of Aeromonas salmonicida in aerosols and its implications in fish health management. J World Aquaculture Soc 27:7-14.
557. Abbott, S.L., Seli, L.S., Catino, M., Jr., Hartley, M.A., and Janda, J.M. 1998. Misidentification of unusual Aeromonas species as members of the genus Vibrio: a continuing problem. J Clin Microbiol 36:1103-1104.
558. Abbott, S.L., Cheung, W.K., and Janda, J.M. 2003. The genus Aeromonas: biochemical characteristics, atypical reactions, and phenotypic identification schemes. J Clin Microbiol 41:2348-2357.
559. Abbott, S.L., Cheung, W.K., Kroske-Bystrom, S., Malekzadeh, T., and Janda, J.M. 1992. Identification of Aeromonas strains to the genospecies level in the clinical laboratory. J Clin Microbiol 30:1262-1266.
560. Borrell, N., Figueras, M.J., and Guarro, J. 1998. Phenotypic identification of Aeromonas genomospecies from clinical and environmental sources. Can J Microbiol 44:103-108.
561. Kozinska, A., Figueras, M.J., Chacon, M.R., and Soler, L. 2002. Phenotypic characteristics and pathogenicity of Aeromonas genomospecies isolated from common carp (Cyprinus carpio L.). J Appl Microbiol 93:1034-1041.
562. Martinez-Murcia, A.J., Soler, L., Saavedra, M.J., Chacon, M.R., Guarro, J., Stackebrandt, E., and Figueras, M.J. 2005. Phenotypic, genotypic, and phylogenetic discrepancies to differentiate Aeromonas salmonicida from Aeromonas bestiarum. Int Microbiol 8:259-269.
563. O'Brien, D., Mooney, J., Ryan, D., Powell, E., Hiney, M., Smith, P.R., and Powell, R. 1994. Detection of Aeromonas salmonicida, causal agent of
106
furunculosis in salmonid fish, from the tank effluent of hatchery-reared Atlantic salmon smolts. Appl Environ Microbiol 60:3874-3877.
564. Morgan, J.A., Rhodes, G., and Pickup, R.W. 1993. Survival of nonculturable Aeromonas salmonicida in lake water. Appl Environ Microbiol 59:874-880.
565. Jarp, J., Tangen, K., Willumsen, F.V., Djupvik, H.O., and Tveit, A.M. 1993. Risk factors for infections with Aeromonas salmonicida in Norwegian fresh water hatcheries. Dis Aquat Organ 17:81-86.
566. Bullock, G.L., and Stuckey, H.M. 1977. Ultraviolet treatment of water for destruction of five gram-negative bacteria pathogenic to fishes. J Fisheries Res Board Can 34:1244-1249.
567. Colberg, P.J., and Lingg, A.J. 1978. Effect of ozonation on microbial fish pathogens, ammonia, nitrate, nitrite, and BOD in simulated reuse hatchery water. . J Fisheries Rev Board Can 35:1290-1296.
568. Wedemeyer, G.A., and Nelson, N.C. 1977. Survival of two bacterial fish pathogens (Aeromonas salmonicida and the enteric redmouth bacterium) in ozonated, chlorinated, and untreated water. J Fisheries Res Board Can 34:429-432.
569. Cipriano, R.C., Ford, L.A., Smith, D.R., Schachte, J.H., and Petrie, C.J. 1997. Differences in detection of Aeromonas salmonicida in covertly infected salmonid fishes by the stress-inducible furunculosis test and culture-based assays. J Aqua Animal Health 9:108-113.
570. Lillehaug, A., Lunder, T., and Poppe, T.T. 1992. Field testing of adjuvanted furunculosis vaccines in Atlantic salmon, Salmo salar L. J Fish Dis 15:485-496.
571. Ellis, A.E. 1997. Immunization with bacterial antigens: furunculosis. Dev Biol Standards 90:107-116.
572. Midtlyng, P.J., and Lillehaug, A. 1998. Growth of Atlantic salmon Salmo salar after intraperitoneal administration of vaccines containing adjuvants. Dis Aquat Organ 32:91-97.
573. Paterson, W.D., Douey, D., and Desautels, D. 1980. Relationships between selected strains of typical and atypical Aeromonas salmonicida, Aeromonas hydrophila, and Haemophilus piscium. Can J Microbiol 26:588-598.
574. Janda, J.M., and Abbott, S.L. 1996. Human pathogens. West Sussex, England.: John Wiley & Sons Ltd.
575. Dixon, B. 2008. Natural disaster microbiology. Microbe 3:312-313. 576. Edberg, S.C., Browne, F.A., and Allen, M.J. 2007. Issues for microbial
regulation: Aeromonas as a model. Crit Rev Microbiol 33:89-100. 577. Khardori, N., and Fainstein, V. 1988. Aeromonas and Plesiomonas as
etiological agents. Annu Rev Microbiol 42:395-419. 578. Kelly, K.A., Koehler, J.M., and Ashdown, L.R. 1993. Spectrum of
extraintestinal disease due to Aeromonas species in tropical Queensland, Australia. Clin Infect Dis 16:574-579.
579. Llopis, F., Grau, I., Tubau, F., Cisnal, M., and Pallares, R. 2004. Epidemiological and clinical characteristics of bacteraemia caused by
107
Aeromonas spp. as compared with Escherichia coli and Pseudomonas aeruginosa. Scand J Infect Dis 36:335-341.
580. Tsai, M.S., Kuo, C.Y., Wang, M.C., Wu, H.C., Chien, C.C., and Liu, J.W. 2006. Clinical features and risk factors for mortality in Aeromonas bacteremic adults with hematologic malignancies. J Microbiol Immunol Infect 39:150-154.
581. Ceylan, E., Berktas, M., and Agaoglu, Z. 2009. The occurrence and antibiotic resistance of motile Aeromonas in livestock. Trop Anim Health Prod 41:199-204.
582. Thorton, S.M., Nolan, S., and Gulland, F.M. 1998. Bacterial isolates from California sea lions (Zalophus californicus), harbor seals (Phoca vitulina), and northern elephant seals (Mirounga angustirostris) admitted to a reha- bilitation center along the central California coast, 1994–1995. J. Zool. Wildl. Med. 29:171-176.
583. Moro, E.M., Weiss, R.D., Friedrich, R.S., de Vargas, A.C., Weiss, L.H., and Nunes, M.P. 1999. Aeromonas hydrophila isolated from cases of bovine seminal vesiculitis in south Brazil. J Vet Diagn Invest 11:189-191.
584. Gosling, P.J. 1996. Aeromonas species in disease of animals. West Sussex, England.: John Wiley & Sons Ltd.
585. Graf, J. 2000. Symbiosis of Aeromonas and Hirudo medicinalis, the medicinal leech. ASM News 66:147-153.
586. Silver, A.C., Rabinowitz, N.M., Kuffer, S., and Graf, J. 2007. Identification of Aeromonas veronii genes required for colonization of the medicinal leech, Hirudo verbana. J Bacteriol 189:6763-6772.
587. Silver, A.C., Kikuchi, Y., Fadl, A.A., Sha, J., Chopra, A.K., and Graf, J. 2007. Interaction between innate immune cells and a bacterial type III secretion system in mutualistic and pathogenic associations. Proc Natl Acad Sci U S A 104:9481-9486.
588. Krzyminska, S., Kaznowski, A., and Puk, M. 2008. Interaction of Aeromonas spp. human isolates with murine macrophages. New Microbiol 31:481-488.
589. Ko, W.C., Chiang, S.R., Yan, J.J., and Chuang, Y.C. 2005. Comparative pathogenicity of bacteraemic isolates of Aeromonas hydrophila and Klebsiella pneumoniae. Clin Microbiol Infect 11:553-558.
590. Rio, R.V., Anderegg, M., and Graf, J. 2007. Characterization of a catalase gene from Aeromonas veronii, the digestive-tract symbiont of the medicinal leech. Microbiology 153:1897-1906.
591. Krzyminska, S., Kaznowski, A., and Chodysz, M. 2009. Aeromonas spp. human isolates induce apoptosis of murine macrophages. Curr Microbiol 58:252-257.
592. Han, H.J., Taki, T., Kondo, H., Hirono, I., and Aoki, T. 2008. Pathogenic potential of a collagenase gene from Aeromonas veronii. Can J Microbiol 54:1-10.
593. Nitta, H., Imamura, T., Wada, Y., Irie, A., Kobayashi, H., Okamoto, K., and Baba, H. 2008. Production of C5a by ASP, a serine protease released from Aeromonas sobria. J Immunol 181:3602-3608.
108
594. Imamura, T., Nitta, H., Wada, Y., Kobayashi, H., and Okamoto, K. 2008. Impaired plasma clottability induction through fibrinogen degradation by ASP, a serine protease released from Aeromonas sobria. FEMS Microbiol Lett 284:35-42.
595. Janda, J.M. 1985. Biochemical and exoenzymatic properties of Aeromonas species. Diagn Microbiol Infect Dis 3:223-232.
596. Chopra, A.K., and Houston, C.W. 1999. Enterotoxins in Aeromonas-associated gastroenteritis. Microbes Infect 1:1129-1137.
597. Albert, M.J., Ansaruzzaman, M., Talukder, K.A., Chopra, A.K., Kuhn, I., Rahman, M., Faruque, A.S., Islam, M.S., Sack, R.B., and Mollby, R. 2000. Prevalence of enterotoxin genes in Aeromonas spp. isolated from children with diarrhea, healthy controls, and the environment. J Clin Microbiol 38:3785-3790.
598. Fujii, Y., Nomura, T., Yokoyama, R., Shinoda, S., and Okamoto, K. 2003. Studies of the mechanism of action of the aerolysin-like hemolysin of Aeromonas sobria in stimulating T84 cells to produce cyclic AMP. Infect Immun 71:1557-1560.
599. Heuzenroeder, M.W., Wong, C.Y., and Flower, R.L. 1999. Distribution of two hemolytic toxin genes in clinical and environmental isolates of Aeromonas spp.: correlation with virulence in a suckling mouse model. FEMS Microbiol Lett 174:131-136.
600. Wang, G., Clark, C.G., Liu, C., Pucknell, C., Munro, C.K., Kruk, T.M., Caldeira, R., Woodward, D.L., and Rodgers, F.G. 2003. Detection and characterization of the hemolysin genes in Aeromonas hydrophila and Aeromonas sobria by multiplex PCR. J Clin Microbiol 41:1048-1054.
601. Sha, J., Kozlova, E.V., and Chopra, A.K. 2002. Role of various enterotoxins in Aeromonas hydrophila-induced gastroenteritis: generation of enterotoxin gene-deficient mutants and evaluation of their enterotoxic activity. Infect Immun 70:1924-1935.
602. Chopra, A.K., Xu, X., Ribardo, D., Gonzalez, M., Kuhl, K., Peterson, J.W., and Houston, C.W. 2000. The cytotoxic enterotoxin of Aeromonas hydrophila induces proinflammatory cytokine production and activates arachidonic acid metabolism in macrophages. Infect Immun 68:2808-2818.
603. Martins, L.M., Catani, C.F., Falcon, R.M., Carbonell, G.V., Azzoni, A.A., and Yano, T. 2007. Induction of apoptosis in Vero cells by Aeromonas veronii biovar sobria vacuolating cytotoxic factor. FEMS Immunol Med Microbiol 49:197-204.
604. Couto, C.R., Oliveira, S.S., Queiroz, M.L., and Freitas-Almeida, A.C. 2007. Interactions of clinical and environmental Aeromonas isolates with Caco-2 and HT29 intestinal epithelial cells. Lett Appl Microbiol 45:405-410.
605. Sha, J., Wang, S.F., Suarez, G., Sierra, J.C., Fadl, A.A., Erova, T.E., Foltz, S.M., Khajanchi, B.K., Silver, A., Graf, J., et al. 2007. Further characterization of a type III secretion system (T3SS) and of a new effector protein from a clinical isolate of Aeromonas hydrophila--part I. Microb Pathog 43:127-146.
109
606. Braun, M., Stuber, K., Schlatter, Y., Wahli, T., Kuhnert, P., and Frey, J. 2002. Characterization of an ADP-ribosyltransferase toxin (AexT) from Aeromonas salmonicida subsp. salmonicida. J Bacteriol 184:1851-1858.
607. Silver, A.C., and Graf, J. 2009. Prevalence of genes encoding the type three secretion system and the effectors AexT and AexU in the Aeromonas veronii group. DNA Cell Biol 28:383-388.
608. Janda, J.M., Guthertz, L.S., Kokka, R.P., and Shimada, T. 1994. Aeromonas species in septicemia: laboratory characteristics and clinical observations. Clin Infect Dis 19:77-83.
609. Janda, J.M., Kokka, R.P., and Guthertz, L.S. 1994. The susceptibility of S-layer-positive and S-layer-negative Aeromonas strains to complement-mediated lysis. Microbiology 140 ( Pt 10):2899-2905.
610. Merino, S., Rubires, X., Aguilar, A., Alberti, S., Hernandez-Alles, S., Benedi, V.J., and Tomas, J.M. 1996. Mesophilic Aeromonas sp. serogroup O:11 resistance to complement-mediated killing. Infect Immun 64:5302-5309.
110
Chapter 2. Materials and Methods
2.1 Animals 2.1.1 Fish
Goldfish (Carassius auratus L.) 10–15 cm in length were purchased from
Mount Parnell (Mercersburg, PA) and obtained through Aquatic Imports (Calgary,
AB). Fish were maintained in the Aquatic Facility of the Department of Biological
Sciences, University of Alberta. The fish were held at 20oC in a continuous flow-
through water system on a simulated natural photoperiod. Fish were fed daily and
were acclimated for at least two weeks prior to use in the experiments. Fish were
monitored daily for any signs of disease and only fish that appeared to be healthy
were used, unless otherwise noted. Prior to handling, fish were sedated using
tricaine methane sulfonate (TMS) solution of 40-50 mg/L of water. When
necessary, individual fish were marked by fin clipping. Goldfish were terminated
via cervical dislocations using approved procedures. All efforts were made to
minimize animal stress and to ensure that termination procedures were efficiently
performed.
2.1.2 Mice
Five-to-nine week old C57BL/6 female mice (Mus musculus) were
maintained in a P-2-specific pathogen-free facility in the Biosciences Animal
Services Centre at the University of Alberta. The mice were held on a simulated
natural photoperiod, fed daily, and acclimated for at least 10 days before use.
All animals were maintained according to the guidelines of the Canadian
Council on Animal Care, and the University of Alberta Animal Care and Use
111
Committee approved protocols. Information on animal protocols and ethics
approvals can be found within the Preface. C57BL/6 mice were terminated via
cervical dislocations using approved procedures. All efforts were made to
minimize animal stress and to ensure that termination procedures were efficiently
performed.
2.2 Fish serum
Carp (Cyprinus carpio) were bled from the caudal vein every 4-6 weeks
using a 21-gauge needle attached to a 1 or 3 mL syringe, depending on fish size.
Blood was pooled and clotted overnight at 4oC. The next day, blood was
centrifuged for 30 minutes at 1000 x g at 4oC. Serum was collected and heat
inactivated at 56oC for 30 minutes. Serum was then filter sterilized using a 0.22 μm
filter, and frozen at -20oC until use in the experiments. Carp serum was used for the
cultivation of goldfish primary kidney macrophage (PKM) cultures.
Goldfish serum was collected from the caudal vein using a 23-gauge needle
attached to a 1 mL syringe into BD Vacutainer tubes with clot activator and gel for
serum separation (BD Biosciences, yellow cap tube). Following collection, tubes
were rested at room temperature for 10 minutes then spun at 485 x g for 10 minutes
at 4oC. Serum was collected and frozen at -20oC until use in the experiments.
2.3 Generation of specific reagents 2.3.1 Macrophage activating factor (MAF)
Goldfish total kidney leukocytes were seeded at a density of 2x10⁶/mL in
complete MGFL-15 media (containing serum and antibiotics; Table 2.3) with 10
112
μg/mL concanavlin A, 10 ng/mL phorbol myristate acetate (PMA) and 100 ng/mL
calcium ionophore (all from Sigma) for 6 hours at 20oC. Cells were then washed
three times with 1xPBS-/- (Table 2.1) and 20 mL of incomplete MGFL-15 media
(no serum, no antibiotics) was added to each T75 flask. Cells were incubated for 72
hours at 20oC. Supernatants were then collected, filtered with a 0.22 μm filter and
stored at -20oC for up to 6 months.
2.3.2 Labeled zymosan particles
2.3.2.1 FITC
Unlabeled zymosan particles (Molecular Probes) were labeled overnight
with 1 mg/mL fluorescein isothiocyanate (FITC, Sigma) with continuous
shaking on an electronic rocker at a low speed at 4oC in 500 μL carbonate buffer
(Table 2.2). After staining, zymosan-FITC was washed twice with 1xPBS-/- at
863 x g for 10 minutes at room temperature. Particles were stored at 4oC in the
dark until used and added directly to samples as needed. Stain was stable for 1
month.
2.3.2.2 APC
Unlabeled zymosan particles (Molecular Probes) were labeled overnight
with 75 μg /mL allophycocyanin (APC, Sigma) with continuous shaking at 4oC
in 1x PBS-/- (no magnesium, no calcium). To retain APC signal, zymosan had to
be stored in the APC solution. Prior to use, zymosan particles were washed
twice with 1xPBS-/- at 863 x g for 10 minutes at room temperature.
113
2.3.3 Apoptotic cells
Apoptotic cells were generated by incubating cells for 24 hours in the
presence of 10 μg/mL cycloheximide. Incubation temperature depended on the
species from which apoptotic cells were derived- 20oC for fish, 37oC/5% CO2 for
mouse. Treated cells were harvested, washed twice in 1x PBS-/- (spin at 311 x g for
10 minutes at 4oC) and stained overnight with 1.5 μg/mL wheat germ agglutinin
AlexaFluor 555 (Molecular Probes). Apoptotic cells were then washed twice in 1x
PBS-/- (spin at 393 x g for 10 minutes at 4oC). For murine experiments, apoptotic
cells were generated from primary total splenocytes. For goldfish experiments,
apoptotic cells were generated from catfish 3B11 B cells or primary goldfish
kidney leukocytes, as indicated. Catfish 3B11 B cells were selected in order to
maintain consistency across experiments, as clonal goldfish leukocytes are not
available. No difference was found in PKM responses when 3B11 cells were
compared with apoptotic cells derived from primary goldfish kidney leukocytes
(Figure 4.2). Catfish 3B11 cells were a gift from Dr. Melanie Wilson (University of
Mississippi Medical Center) and were generated following in vitro
lipopolysaccharide stimulation of catfish peripheral blood leukocytes with LPS (1,
2).
2.3.4 Recombinant sCSF-1R
Sf9 and KC1 insect cells were grown in serum free ESF 921 media
(Expression Systems). Cells were transfected at 95% confluency using Cellfectin
114
(Invitrogen) and 1 µg of the sCSF-1R expression plasmid, according to the
manufacturers specifications. After 24 hours, transfected cells were transferred to
T-25 flasks containing 10 µg/mL blasticidin (Invitrogen) and incubated for 4 days
to select for transfectants. Transfected cells were maintained in media containing
10 µg/mL of blasticidin throughout the experiments.
The recombinant protein was purified from the cell supernatants using the
MagneHisTM Protein Purification System (Promega). Transfected KC1 cells were
grown in T-75 flasks 1 day past confluency and supernatants were collected. One
mL of Ni-NTA particles was added to 50 mL of the collected supernatant and
mixed by inversion, followed by incubation at room temperature for 2 minutes.
Particles were then captured using a magnetic stand and the supernatant was
discarded. The particles were then washed 5 times with 3 mL of the wash buffer
(40 mM imidazole and 100 mM HEPES) containing 1 M sodium chloride to reduce
nonspecific binding. The bound protein was then eluted from the paramagnetic
particles using an imidazole gradient (25, 50, 100, 250 and 500 mM). Weakly
interacting proteins and other contaminating proteins were eluted at lower
concentrations of imidazole whereas the recombinant soluble CSF-1R eluted at
250-500 mM concentration of imidazole. Protein concentrators with a 3K MW cut
off (Thermo Scientific) were used following the manufacturers specifications. This
was effective at removing residual imidazole in addition to concentrating the
protein. Concentration of the rsCSF-1R was determined at 562 nm using a BCA
protein assay kit (Thermo Scientific) based on the manufacturers specifications.
Figure 2.1 shows a serial dilution of sCSF-1R as detected by Western blotting.
115
2.3.5 Polyclonal anti-CSF-1R antibody
The identification, expression and purification of a recombinant sCSF-1R
and the production of a rabbit polyclonal antibody against the sCSF-1R were
performed as previously described in (3). To purify antibodies from rabbit serum,
ice-cold saturated ammonium sulphate (SAS) was added to rabbit serum through a
drop-wise addition with continuous, gentle manual agitation to a final percentage
of 45% (v/v) SAS and incubated overnight at 4oC with rocking. Following
incubation, the solution was centrifuged at 10 000 x g for 30 minutes at 4oC, the
supernatant was aspirated and the pellet re- suspended in 20 mM sodium phosphate
buffer, pH 7.2. This solution was dialyzed against 4 L of 20 mM sodium phosphate
buffer pH 7.2 overnight to remove excess salts. The collected solution was then
applied to a Protein A column (GE Healthcare) following manufacturers
instructions. Briefly, the solution was applied to the column and allowed to pass
through. The column was then washed with 10 column volumes of 20 mM sodium
phosphate buffer, pH 7.2. Citric acid buffers of decreasing pH were applied to the
column to elute the bound IgG from the column. The addition of 1M Tris, pH 9
was added to each elution fraction to neutralize the acidity of the solution and
prevent antibody denaturation. IgG-containing fractions were pooled and dialyzed
for 72 hours in 1xPBS-/- at 4oC with constant mixing. Following dialysis, protein
concentration was measured by BCA assay (Pierce) according to manufacturers
specifications. Antibodies were filter sterilized (0.22 μm), and stored at -20oC until
use.
116
2.4 Pathogens and pathogen mimics
2.4.1 Aeromonas veronii
Aeromonas veronii was isolated from a naturally infected goldfish in the
Department of Biological Sciences Aquatic Facilities by swabbing a body furuncle
with a cotton swab and inoculating a tryptic soy agar (TSA) plate. Single colonies
were grown up and typed using the indicated primers (Table 2.11). Each tested
colony was identified to be Aeromonas veronii based on sequence analysis. A
single colony was used to inoculate tryptic soy broth to create a clonal glycerol
stock. The growth curve for A. veronii can be found in Figure 2.2. Heat killed A.
veronii was generated by incubating at 60oC for 45 minutes. Heat inactivated
cultures were spun down at 2640 x g for 10 minutes at 4oC. Ten mL of 1XPBS-/-
was then added to wash, and heat killed cultures were spun down again at 2640 x g
for 10 minutes at 4oC. Following heat inactivation, an aliquot of bacteria was
plated onto TSA plates to ensure that cultures had been adequately killed and no
cultures typically developed. Heat killed bacteria was stored at 4oC until use, for no
longer than 1 month.
2.4.2 Aeromonas salmonicida A449
Aeromonas salmonicida A449 was a gift from Dr. Miodrag Belosevic,
originally given by Dr. Jessica Boyd (NRC Institute, Halifax, Canada). Glycerol
stocks of A. salmonicida A449 stored at -80oC were used to streak tryptic soy agar
(TSA) + 20 μg/mL chloramphenicol (Sigma) plates and incubated at 18oC for 72
117
hours. Tryptic soy broth (TSB) + 20 μg/mL chloramphenicol was inoculated with a
single colony and grown at 18oC with rotation into log phase growth. Heat killed A.
salmonicida A449 was generated by incubating at 60oC for 45 minutes and washed
as described above. Following heat inactivation, an aliquot of bacteria was plated
onto TSA+ 20 μg/mL chloramphenicol plates to ensure that cultures had been
adequately killed and no cultures typically developed. Heat killed bacteria was
stored at 4oC until use, for no longer than 1 month. Bacteria were enumerated
based on the growth curve generated by Dr. Barbara Katzenback (Katzenback,
B.A., Ph.D. thesis).
2.4.3 Zymosan
Zymosan was used to induce acute, self-resolving peritonitis. Injectable (not
a particle) zymosan was purchased from Sigma and resuspended at a concentration
of 50 mg/mL in 1xPBS-/-. To resuspend, 4 mL of 1xPBS-/- was added to the
lyophilized stock. This was then vortexed for several minutes at a high speed. Once
bubbles had dissipated, another 1 mL of 1xPBS-/- was added to reach the final
concentration. Resuspended zymosan was stored at 4oC for no longer than 1 month.
2.4.4 Lipopolysaccharide
Lipopolysaccharide (LPS) is known to be a potent stimulator of immune
processes and was used in in vitro leukocyte activation assays. Murine cells were
activated with E. coli Ultrapure LPS (InVivogen) at 100 ng/mL. Goldfish cells
were activated with E. coli LPS (Sigma) at a concentration of 1 μg/mL. A higher
118
concentration was needed for goldfish assays as goldfish leukocytes are less
sensitive to LPS stimulation than murine cells (4). In order to adequately activate
goldfish cells, all LPS stimulations were also done in the presence of 25% MAF.
2.5 Intraperitoneal injections
Goldfish were lightly anesthetized with TMS. Goldfish were then removed
from water and placed on bench-coat. Intraperitoneal injections were done in the
soft area under the left pectoral fin. Goldfish were then returned to water and
allowed to recover. Goldfish were subsequently returned to tank with oxygenation.
Fish were monitored closely during and post all injection procedures.
Mice were ventrally injected in the lower left quadrant. In order to prevent
puncturing of the intestines with the needle, mice were inverted at a 45o angle
during injections. Following injection, mice were returned to cages and monitored
closely during and post all injection procedures.
2.5.1 Zymosan
Injectable zymosan was vortexed well prior to removal from vial. Zymosan
stock (5 mg/mL) was diluted 1:2 with 1xPBS-/- to create a 2.5 mg/mL diluted stock.
One hundred μL of diluted stock was aspirated in 25-gauge 1mL needles and all
bubbles were removed.
2.5.2 Apoptotic cells

119
Apoptotic cells were washed thoroughly and counted by haemacytometer.
Cells were resuspended at a concentration of 5x10⁷ cells/mL in 1xPBS-/-. One
hundred μL of apoptotic cell stock was aspirated in 25-gauge 1mL needles and all
bubbles were removed. Apoptotic cells were made fresh for each experiment.
2.5.3 Recombinant sCSF-1R
Recombinant sCSF-1R was stored at -20oC until use. Protein concentrations
were determined prior to freezing. Soluble CSF-1R was diluted in 1xPBS-/- in order
to have the required concentration in 100 μL of diluted stock. One hundred μL was
aspirated in 25-gauge 1mL needles and all bubbles were removed.
2.6 Isolation of primary fish cells
2.6.1 Primary kidney leukocytes
Goldfish were anesthetized with TMS and sacrificed by cervical dislocation.
The entire body kidney tissue was dissected and placed into a Petri dish containing
10 mL of cold incomplete medium (without serum). The kidney tissue was gently
homogenized using a wire mesh screen and collected by washing the screen with
incomplete MGFL-15. The cell suspension sat for 5 minutes to allow debris to
settle and the cells were collected into a new conical tube. Cells were spun at 311 x
g for 10 minutes at 4oC and the supernatant was decanted off. The pellets were
resuspended in 1-3 mL ACK Lysis buffer (Lonza), depending on kidney size, and
incubated at room temperature for 3 minutes. Ten mL incomplete MGFL-15 was
then added and cells were centrifuged at 311 x g for 10 minutes at 4oC. Cells were
120
then resuspended in complete MGFL-15 (with serum and antibiotics), counted
using a haemocytometer and used for various assays.
2.6.1.1 Mononuclear cells
Kidneys were homogenized as described above, in incomplete MGFL-15
containing heparin. As above, debris was settled out and cells were layered over
a 51% Percoll solution (51 mL Percoll, 10 mL 10 x HBSS, 39 mL incomplete
MGFL-15 medium) and centrifuged for 25 minutes at 400 x g at 4oC. Cells at
the 51% Percoll/medium interface were collected and transferred into a new
conical tube and washed twice with incomplete MGFL-15 media (centrifuge
311 x g at 4oC for 10 minutes).
2.6.1.2 Neutrophils
Goldfish kidney leukocytes were isolated as described above and layered
onto 51% Percoll and centrifuged at 400 x g for 25 minutes at 4oC. All the liquid
was decanted, leaving behind the red blood cell/neutrophil pellet found at the
bottom of the tube. The red blood cells were lysed using ACK Lysis buffer as
described above. Neutrophils were then washed twice (centrifuge 311 x g at 4oC
for 10 minutes) and used in downstream assays.
2.6.2 Peritoneal lavage
As with kidney isolations, goldfish were anesthetized with TMS and
sacrificed by cervical dislocation. A square incision was made around the left
121
pectoral fin, approximately 1 cm x 1 cm x 1cm, to create a flap. Ten mL of ice-cold
1xPBS-/- was injected into fish, 2 scales above the center-line approximately 2/3 of
the length of the fish using a blunted 18-gauge needle. Lavages were collected
from the pectoral fin flap into a 50 mL conical tube. To exclude changes in relative
adherence of resident peritoneal leukocytes following injections, control lavages
were performed using trypsin-EDTA added to the lavage medium. While no
differences were found in terms of cellular counts, cells lavaged using the trypsin-
EDTA displayed weaker DHR staining due to decreased functionality and, thus,
this was omitted in subsequent experiments.
To isolate subpopulations from lavage exudate, lavages were run over a 51%
Percoll gradient, as described above. Following centrifugation, buffy coats
containing mononuclear cells were collected into a separate tube. These cells and
the neutrophil pellets were washed once with serum-free media (centrifuge 311 x g
at 4oC for 10 minutes). Cells were then resuspended in complete MGFL-15 media
and used in downstream assays.
2.7 Fish primary cell culture
2.7.1 Culture media
The culture medium used for cultivation of goldfish primary kidney
macrophages- modified goldfish Lebovitz-15 (MGFL-15) has been previously
described (5). The composition of MGFL-15 is shown in Table 2.3. The
composition of the additives to the media is shown in Table 2.4 (nucleic acid
precursor solution) and Table 2.5 (10x Hanks Balanced Salt Solution). MEM non-
122
essential amino acid solution, MEM amino acid solution and MEM vitamin
solution were purchased from Gibco. Bovine insulin was purchased from Sigma.
Complete MGFL-15 medium contained 10% heat-inactivated fetal calf serum, 5%
heat-inactivated carp serum, 100 U/mL penicillin/100 μg/mL streptomycin and 100
μg/mL gentamicin.
2.7.2 Primary kidney macrophages
Kidneys were homogenized as described above, in incomplete MGFL-15
containing heparin. As above, debris was settled out and cells were layered over a
51% Percoll solution (51 mL Percoll, 10 mL 10 x HBSS, 39 mL incomplete
MGFL-15 medium) and centrifuged for 25 minutes at 400 x g at 4oC. Cells at the
51% Percoll/medium interface were collected and transferred into a new conical
tube and washed twice with incomplete MGFL-15 media. Primary kidney
macrophages (PKM) were generated by seeding isolated leukocytes and culturing
in 15 mL complete MGFL-15 media (MGFL-15 supplemented with 100 U/mL
penicillin, 100 μg/mL streptomycin, 100 μg/mL gentamicin, 10% newborn calf
serum (Gibco) and 5% carp serum) with 5 mL cell-conditioned media from
previous experiments and incubated for 6-9 days at 20oC (5, 6), until cultures
reached proliferative phase of growth. This growth phase is dominated by
significant proliferation of macrophage progenitors (typically 6-8 generations) and
differentiation into mature macrophages (7).
123
2.8 Fish cell lines
2.8.1 Catfish 3B11 cells
Catfish 3B11 B-cells were maintained in complete MGFL-15 at 27oC without
CO2. This cell line is non-adherent. Cells were passed upon reaching confluency,
generally every 2-3 days, at a 1:40 dilution in fresh complete MGFL-15 media.
2.9 Isolation of primary mammalian cells
2.9.1 Peritoneal lavage
Mice were sacrificed by cervical dislocation. Skin surrounding the peritoneal
cavity was removed, ensuring the peritoneal cavity remained intact. Ten mL of ice-
cold 1xPBS-/- was then injected using a blunt end 18-gauge needle. Peritoneal
cavity was massaged gently to detach cells and PBS was sucked back into the
needle.
To isolate cell subpopulations, murine lavages were run over a Ficoll (Histo-
Paque) gradient. This was centrifuged at 400 x g for 30 minutes at 4oC. Following
centrifugation, buffy coats containing mononuclear cells were collected into a
separate tube. These cells and the neutrophil pellets were washed with once with
serum-free media (centrifuge 311 x g at 4oC for 10 minutes). Cells were then
resuspended in complete media and plated in 6-well plates with 1x10⁶ cells in 2 mL
in each condition (responding cells).
2.9.2 Splenocytes
124
Mice were sacrificed by cervical dislocation. Spleens were removed and
homogenized using a wire mesh screen using ice cold incomplete DMEM (no
serum or antibiotics). As with goldfish kidneys, debris was settled and cells were
collected and spun down at 311 x g for 10 minutes at 4oC. Pellets were resuspended
in 1 mL ACK Lysis buffer for 1 minute and washed with incomplete 10 mL
DMEM. Cells were then centrifuged at 311 x g for 10 minutes at 4oC and were
then resuspended in complete DMEM and used to make apoptotic cells.
2.10 Mammalian cell lines
2.10.1 Jurkat T cells
Jurkat T cells were cultured in RPMI 1640 supplemented with 100 U/mL
penicillin/ 100 μg/mL streptomycin, 10% fetal calf serum, 1 mM sodium pyruvate,
and 1x non-essential amino acids (all from Gibco). These cells are non-adherent.
Cells were passaged every 2-3 days at a 1:10 dilution in complete RPMI 1640.
2.10.2 RAW 264.7 macrophages
RAW 264.7 macrophage cells were cultured in complete DMEM media
(DMEM with 10% fetal calf serum and 100 U/mL penicillin/ 100 μg/mL
streptomycin). Cell lines were cultured at 37oC/5% CO2 and passaged every 3-4
days, prior to reaching confluence. This is an adherent cell line. To pass cells,
media was decanted and the flask was washed thoroughly with 10 mL 1x PBS-/- to
remove remaining serum. One mL of trypsin-EDTA was then added and incubated
at 37oC/5% CO2 for 3 minutes. Cells were then detached by gently banging flask.
125
To inactivate trypsin, 10 mL of complete DMEM was added. Cells were then
collected into a 15 mL tube and centrifuged at 311 x g for 10 minutes at 4oC.
Pelleted cells were resuspended in 10 mL of fresh complete DMEM. One mL of
resuspended cells was added to a culture flask containing fresh complete DMEM.
2.11 Cytochemical staining
2.11.1 Hema3
One hundred thousand cells were spun onto glass slides at 55 x g for 6
minutes at room temperature using a cytocentrifuge (Shandon Instruments). Cells
were fixed by incubation in 70% methanol for 5 seconds. Cells were stained with
hematoxylin for 5 seconds and counter-stained with eosin for 1 second (all
components from Fisher Scientific). Slides were then rinsed with tap water and air-
dried prior observation using bright field microscopy. Photomicrographs were
generated using a DM1000 microscope (Leica) using a bright field 100x objective
(1000x magnification). Images were acquired using QCapture software.
2.11.2 Sudan Black
One hundred thousand cells were spun onto glass slides at 55 x g for 6
minutes at room temperature using a cytocentrifuge (Shandon Instruments). For
Sudan Black staining (Sigma), cells were fixed with a 75% gluteraldehyde: 25%
acetone fixative solution for one minute at 4oC. Slides were then rinsed well with
distilled water and stained with Sudan Black for 5 minutes with continuous, gentle
rocking. Slides were thoroughly rinsed with 70% ethanol to remove excess Sudan
126
Black staining and further rinsed in distilled water. Cells were counterstained with
Gill’s 3 solution (Sigma) for 5 minutes and rinsed with tap water for 2 minutes.
Slides were air-dried prior to observation using bright field microscopy.
Photomicrographs were generated using a DM1000 microscope (Leica) using a
bright field 100x objective (1000x magnification). Images were acquired using
QCapture software.
2.12 Flow cytometric staining
2.12.1 Antibody labeling
To distinguish murine leukocyte populations, cells were stained with a
combination of: CD11b-FITC/ Gr1-PE/ F4/80-APC or CD11b-PE-Cy7/ CD3-
FITC/ B220-PE/ NK1.1-APC (all from BD Biosciences). Prior to staining, cells
were blocked for 20 minutes with a solution of 1x PBS-/- with 10% calf serum. All
staining was done in a solution of 1x PBS-/- with 2% calf serum for 30 minutes at
room temperature in the dark. Antibodies were added according to the
manufacturer’s protocols. Goldfish leukocytes were stained with a polyclonal anti-
CSF-1R antibody that was produced and validated by the Belosevic lab (University
of Alberta) (8). Cells were stained with 1x PBS-/- with 2% calf serum and 0.05%
sodium azide. Following primary stain, goldfish cells were washed and stained
with an anti-rabbit-FITC secondary (Jackson ImmunoResearch).
2.12.2 Flow cytometry-based fluorescent in situ hybridization
127
A detailed description of this procedure, related data, and a full protocol can
be found in Appendix II. Briefly, desired genes were amplified by PCR and cloned
into TOPO TA plasmid (Invitrogen). Primer sequences for gene inserts can be
found in Table 2.12. Competent DH5α were transformed and plasmids were
isolated using a Miniprep kit (Qiagen). Plasmids were linearized with BamHI
(Invitrogen) for 1 hour at 37oC followed by purification with a PCR purification kit
(Qiagen). RNA probes were generated from linearized plasmids using T7 RNA
polymerase (Invitrogen), and labeled nucleotides (biotin-14-CTP (Invitrogen) or
fluorescein-12-UTP (Roche)) were used to distinguish between specific probes.
For hybridization, cells were fixed overnight in 2% formaldehyde at 4oC,
washed in incomplete media, and re-fixed in 70% ethanol at room temperature.
Cells were then spun down at 393 x g for 10 minutes at 4oC and all liquid was
decanted. Membranes were digested with proteinase K for 7 minutes at room
temperature. To stop the digestion, 1 mL of 2% formaldehyde was added for 10
minutes at 4oC. RNA probes were added to cells in hybridization buffer (Table 2.6)
and incubated at 60oC for 4 hours. Tubes were inverted every 30-60 minutes.
Excess hybridization buffer without probe was added and cells were incubated for
a further 45 minutes at 60oC. Cells were then washed using 2xSSC (Table 2.7),
0.1xSSC, and 1xPBS-/- (all centrifugations at 393 x g for 10 minutes at 4oC), and
subsequently stored in 2% formaldehyde O/N at 4oC. Staining with secondary
antibodies allowed detection of RNA probes (streptavidin-APC to detect biotin-14-
CTP; BD BioSciences or anti-fluorescein DyLight 488 to detect fluorescein-12-
UTP; Jackson ImmunoResearch). Levels of gene expression were then analyzed
128
using an ImageStream IS100 or mkII (Amnis Corporation, EMD Millipore) and a
FACSCanto II flow cytometer (BD Biosciences).
2.13 Cell bioassays
2.13.1 Phagocytosis
2.13.1.1 Light microscopy
RAW 264.7 macrophages were plated in 6-well plates at a concentration
of 5x10⁵ cells/mL. Cells were allowed to adhere overnight. Three μm latex
beads (Polysciences) were added at a ratio of 5:1 (zymosan: cells) and incubated
for the indicated times at 37oC/5% CO2. Cells were then stained by Hema3 stain
set as outlined above (Fisher Scientific) and counted by light microscopy. At
least 200 cells were counted.
2.13.1.2 Confocal fluorescent microscopy
RAW 264.7 macrophages were seeded onto sterilized glass coverslips in a
6-well plate at a concentration of 5x10⁵ cells/mL. Cells were allowed to adhere
overnight. Zymosan-FITC particles (Molecular Probes) were added at a ratio of
5:1 (zymosan: cells) and incubated for the indicated times at 37oC/5% CO2.
Cells were then fixed with 1% formaldehyde for 10 minutes on ice and washed
2 times with 1xPBS-/- (centrifuge at 393 x g at 4oC for 10 minutes). One hundred
ng/mL 4', 6-diamidino-2-phenylindole (DAPI; Molecular Probes) was added to
the mounting media and coverslips were mounted onto slides. Cells were
129
imaged using a Zeiss LSM 510 laser scanning confocal microscope. Images
were acquired at 40x/1.3. At least 100 cells were counted.
2.13.1.3 Flow cytometry
In order to evaluate our capacity to differentiate between phagocytic and
non-phagocytic cells in mixed populations, we took advantage of two well-
characterized cellular models: RAW 264.7 cells and Jurkat cells. RAW 264.7
cells were mixed with Jurkat T cells at a ratio of 1:1. Zymosan-FITC was added
to cells at a ratio of 3:1 or 5:1 (zymosan: total cells) and cells were incubated for
the indicated times at 37oC/5% CO2. Following phagocytosis, cells were washed
twice with 1xPBS-/- (no calcium, no magnesium) and labeled with anti-mouse
CD45-PE (BD Biosciences) for 30 minutes on ice. Anti-mouse CD45 allows
differentiation between RAW 264.7 macrophages (murine derived) and Jurkat T
cells (human derived) based on specificity for the murine, but not human, CD45.
Following staining, cells were washed twice with 1xPBS-/- (centrifuge at 311 x g
for 10 minutes at 4oC) and fixed with 1% formaldehyde for 10 minutes on ice
and data was acquired on a FACSCalibur (BD Biosciences). At least 20,000
cellular events were analyzed.
2.13.1.4 ImageStream
FITC labeled zymosan-A particles were added at a ratio of 3:1 or 5:1
(zymosan: cell) to 2x10⁶ cells. Mammalian cells were incubated for 2 hours at
37oC/5% CO2 in complete DMEM media. Teleost phagocytosis assays were
130
performed in incomplete MGFL-15 media (no serum) at 20oC. Following
phagocytosis, cells were fixed with 1% formaldehyde overnight at 4oC. Data
was acquired on an ImageStream IS100 or mkII (Amnis Corporation, EMD
Millipore). At least 10,000 cells were acquired.
2.13.2 Respiratory burst
This assay was performed as previously described (9, 10). Briefly, following
activation, cells were harvested and collected into 5 mL polystyrene round bottom
tubes (BD Falcon). Cells were washed twice with 1xPBS-/- (centrifuge at 311 x g
for 10 minutes at 4oC) then resuspended in 100 μL 1xPBS-/-. Dihydrorhodamine
(DHR, Molecular Probes) was added to cells at a final concentration of 10 μM and
incubated for 5 minutes to allow cells to take up the DHR. Phorbol 12-myristate
13-acetate (PMA; Sigma) was then added at a final concentration of 100 ng/mL.
This concentration of PMA has been shown to trigger ROS production in primed
fish cells (11). Cells were incubated for a further 30 minutes to allow oxidation of
DHR. For all murine experiments, incubations were done at 37oC/5%CO2. For all
goldfish experiments, incubations were done at 20oC. All samples were properly
staggered with respect to time to accommodate for the transient state of oxidized
DHR fluorescence. DHR fluorescence was not quenched by the presence of other
fluorochromes, including the wheat germ agglutinin or APC labels on
phagocytosed particles.
2.13.3 Nitric oxide production
131
Nitric oxide production was determined indirectly by the Griess reaction
(12). Ten thousand cells in 50 μL of complete MGFL-15 medium were added to
individual wells of a 96-well plate, followed by 50 μL of treatments also in
complete MGFL-15 medium. For all goldfish macrophage assays, plates were
incubated for 72 hours at 20oC. Following incubation, plates were centrifuged at
230 x g and 75 μL of cell media transferred to new wells of a 96-well plate. One
hundred μL of 1% sulfanilamide (dissolved in 2.5% H3PO4) was added to each
well, followed by 100 μL of 0.1% N-naphthyl-ethylenediamine (dissolved in 2.5%
H3PO4). The reaction was allowed to proceed for 2 minutes before plates were read
using a micro plate reader at a wavelength of 540 nm. The concentration of nitrate
produced by individual samples was determined using a standard curve that was
generated using sodium nitrate standard curve.
2.13.4 Phagolysosome fusion
In order to study fusion of lysosomes to phagosomes, cells were loaded with
0.25 μg dextran-FITC (Molecular Probes) for 45 minutes at 20oC (13). Cells were
washed twice in incomplete MGFL-15 media (no serum; centrifuge at 311 x g for
10 minutes at 4oC) followed by incubation in serum-containing media for 45
minutes at 20oC to allow dextran localization to the lysosomes. After this, 'dextran-
loaded' cells were incubated for 2 hours with 3 μm non-fluorescent latex beads
(Polysciences) at a 3:1 ratio (bead: cell). A lower bead ratio compared to
phagocytosis assays was used to reduce the number of beads internalized per cell to
provide more accurate quantification of phagolysosome fusion. Following
132
phagocytosis, cells were washed with 1xPBS-/- and fixed for 10 minutes on ice with
1% formaldehyde. Cells were then analyzed by confocal microscopy or with an
ImageStream IS100 (Amins Corportation, EMD Millipore).
2.13.5 Gentamicin protection assay
Bacteria (Aeromonas veronii for most assays) were grown into log phase
growth in tryptic soy broth at room temperature. Bacteria was then washed
thoroughly with 1xPBS-/- (centrifuge at 2640 x g for 10 minutes at room
temperature) and added to cells at a ratio of 100:1. All assays were done in 5 mL
round-bottom FACS tubes (BD Biosciences). Cells were incubated with bacteria
for 30 minutes at 20oC, then washed with incomplete MGFL-15 media (centrifuge
at 311 x g for 10 minutes at 4oC). Cells were then resuspended in 100 μL
incomplete MGFL-15 media containing 200 μg/mL gentamicin, added to the 100
μL cell suspension and incubated for 30 minutes at 20oC. After incubation, 2 mL of
incomplete media was added to dilute the gentamicin. At required time points, cells
were spun down at 311 x g for 10 minutes at 4oC. To lyse cells, media was
decanted and cells were resuspended in 90 μL MilliQ water with 0.1% Triton-X
100. Cells were vigorously flicked for 30 seconds then 10 μL of 10xPBS-/- was
then added to return solution of isotonic levels. The lysate was plated onto square
TSA plates following serial 10-fold dilutions. For each dilution, 10 μL was plated.
Colony formation was counted after 48 hours.
2.13.6 Arginase assay
133
The arginase assay was completed as previously described (14-16). Briefly,
macrophages were lysed in a 0.1% Triton X-100 buffer containing pepstain,
aprotinin and antipain. Equivalent volume of 10 mM MnCl2/ 50mM Tris-HCl/ pH
5.5 was added and samples were incubated for 7 minutes at 56oC to activate the
enzyme. One hundred μL of this solution was added to 100 μL of 0.5M
arginine/pH 9.7 and incubated for 2 hours at 37oC. The reaction was stopped by
adding 800 μL of acid mix (H3PO4: H2SO4: H2O, 1:3:7). Forty μL of α-
isonitrosopropiophenone in 100% ethanol was added to all samples and
concentration standards and incubated for 45 minutes at 100oC. After cooling for
10 minutes, the A540 was measured using a plate reader. Arginase activity was
calculated from the curve produced by concentration standards, generated with
each experiment.
2.13.7 Survivability assay
To assess survival of cells under oxidative conditions, PKMs exposed to
increasing concentration of rsCSF-1R were treated with 2 mM H2O2 for 2 hours.
Viability was determined by AnnexinV/ propidium iodide staining, as previously
described (17, 18). A thorough protocol can be found in Appendix I. In brief, cells
were harvested and washed twice in 1xAnnexinV binding buffer (BD Biosciences).
AnnexinV and PI were then added according to the manufacturers specifications
and incubated in the dark for 30 minutes at room temperature. Cells were then
washed well with 1xAnnexinV binding buffer and fixed with 1% formaldehyde for
10 minutes at 4oC. Cells were then treated with RNase for 30 minutes and 37oC,
134
washed twice with 1xPBS-/- (centrifuge at 393 x g for 10 minutes at 4oC) and
images were acquired using an ImageStream IS100 or mkII (Amnis Corporation,
EMD Millipore). When cells were analyzed on a FACSCanto II flow cytometer
(BD Biosciences), acquisition was done immediately following staining, without
fixation and RNase digestion.
2.13.8 Trans-well assay
To determine the role of soluble factors in mediating responses, trans-wells
(0.4 μm pore size, Corning) were used. These trans-wells permit free flow of
soluble factors but prevent cell transmigration and physical interactions with cells
across the barrier. Activator cells with various stimuli were added into the bottom
of a 6-well plate in 1 mL of complete MGFL-15 media. The bottom was used for
responding cells due to issues to trans-wells tearing during harvesting, resulting in
poor recovery. Trans-wells were then placed and 1 mL of media containing
responding cells was added into each trans-well. Cells were then incubated for 2
hours (at 18oC for goldfish cells; 37oC/5% CO2 for murine cells). Five μg/mL
zymosan was added to all murine cells during the incubation to maintain activation
achieved in vivo. Following incubation, responding cells were harvested and ROS
production was assayed with DHR. Since lymphocytes could not be efficiently
removed from mononuclear cells preparations without affecting cellular responses,
these cells were removed from the analysis through gating strategies. As such,
analyzed populations are referred to as ‘neutrophils’ and
‘monocytes/macrophages’.
135
2.13.9 Cellular infiltration
Animals were sacrificed after indicated time points and cells were harvested
by peritoneal lavage. To determine in vivo responses to apoptotic cells, goldfish
and C57BL/6 mice were injected with either 5x10⁶ apoptotic cells (in 100 μL of 1x
PBS -/-) and/or 2.5 mg zymosan (Sigma) in 100 μL of 1x PBS -/-for 24 hours. To
study the effects of pre-injection of apoptotic cells, animals were injected with
apoptotic cells at 0 hours, 2 hours, or 4 hours before zymosan (zymosan injection
defined time 0). Cells were counted using a haemocytometer. Within these time
points, changes in cellular numbers were largely associated with cellular
infiltration. Sub-populations were defined by expression of specific markers
(CD11c, Gr1, F4/80, CD3, B220, NK1.1; mice) or by a combination of size,
complexity, morphology and cytochemical staining (goldfish).
2.13.10 Chemotaxis assay
Proliferative PKM cultures were incubated with zymosan +/- increasing
concentrations of recombinant sCSF-1R or apoptotic cells (5:1 ratio) for 24 hours.
Supernatants were collected fresh for each experiment, filtered through a 0.22 μm
filter and 100 μL were applied to the bottom chamber of blind well leucite
chemotaxis chambers (Nucleoprobe).
Goldfish were injected with 2.5 mg zymosan (Sigma) and cells were
harvested after 24 hours. Neutrophils were isolated from peritoneal lavage cells by
layering over 51% Percoll as previously described (19, 20) and outlined above. Red

136
blood cells were lysed by ACK Lysis buffer (Lonza), typically in 3 mL for 5
minutes. Cell viability was confirmed with AnnexinV/PI staining; functionality
was confirmed by ROS production. Neutrophils (1x10⁶) were applied to the top
chamber of blind well leucite chemotaxis chambers. The top and bottom chambers
were separated by a 5 μm pore polycarbonate membrane (NeuroProbe). The
chemokinesis (ChK) control allowed for control of neutrophil chemotaxis to an
inflammatory stimulus in the absence of a chemotactic gradient and consisted of
zymosan-stimulated supernatants in both the upper and lower chambers of the
chemotaxis apparatus. Cells were then incubated for 1 hour at 20oC after which the
cell suspensions were aspirated from the top chamber. The filters removed, fixed in
methanol for 1 minute, stained with Gill’s Solution 3 (Sigma) for 1 minute and
then applied to a slide and fixed under a coverslip using Permount (Fisher
Scientific). Chemotactic activity was measured by counting cells found on the
underside of filters in 25 random fields of view (100x, oil immersion).
2.13.11 In vivo BrdU proliferation assay
Following treatment, goldfish were anesthetized and injected with 100 μL of
BrdU solution. The final concentration was adjusted to be 1 mg/g of fish, as
previously described (21). Goldfish were incubated for 1 hour in water from the
fish facilities. Goldfish were then terminated and kidneys were harvested and
processed as above. An aliquot of 1x10⁶ cells were then removed and fixed for a
minimum of 24 hours in 1% formaldehyde at 4oC. After fixation, cells were spun
down at 393 x g for 10 minutes at 4oC and resuspended in BrdU
137
fixation/permeabilization buffer according to the manufacturers’ protocol
(eBioscience) for 1 hour at 4oC. Cells were then washed once in FACS buffer at
(centrifuge at 393 x g for 10 minutes at 4oC) and resuspended in 100 μL FACS
buffer (1xPBS-/- supplemented with 2% calf serum) containing DNase I, followed
by a 1 hour incubation at 37oC. Cells were then washed once and stained with 5 μL
of anti-BrdU-FITC antibody (eBioscience) in 100 μL of FACS buffer for 1 hour at
room temperature. Cells were then washed twice with 2 mL FACS buffer
(centrifuge 393 x g for 10 minutes at 4oC) and acquired on a CANTO II (BD
Biosciences).
2.14 Quantitative PCR
2.14.1 RNA isolation
2.14.1.1 Trizol method
RNA was isolated from goldfish tissues using Trizol (Invitrogen)
according to the manufacturers specifications. Briefly, tissues were placed in 12
mL round-bottom tubes, flash frozen and stored at -80oC. The required amount
of Trizol was then added, depending on tissue size (generally 1 mL for kidney
and spleen; 2mL for furuncle tissue) and tissue was homogenized using blade
disruption. Following homogenization, the Trizol mixture was incubated in ice
for 10 minutes prior to addition of chloroform (0.1 mL/ 1mL Trizol) and volume
was transferred into a 1.5 mL microcentrifuge tube. Tubes were vigorously
vortexed, settled on ice for 5 minutes and then re-vortexed. Tubes were
centrifuged at 10,800 x g for 30 minutes in a refrigerated microcentrifuge at
138
4oC. The aqueous (clear) layer was extracted and transferred to a new 1.5 mL
microcentrifuge tube. One volume of isopropanol was added and tubes were
gently inverted and incubated at -20oC overnight. Samples were then
centrifuged at 10,800 x g for 60 minutes at 4oC to pellet the RNA. Supernatants
were aspirated, and the RNA pellet washed with 1 mL of 75% reagent grade
ethanol followed by centrifugation at 10,800 x g for 30 minutes at 4oC. Ethanol
was aspirated and pellets allowed to air-dry for 5 minutes. Nuclease-free water
was used to re-suspend the RNA pellet. The nucleic acid concentration was
quantified using a Nanodrop apparatus at an absorbance of 260 nm. Samples
were also read at absorbences of 230 nm and 280 nm to determine phenolic and
protein contamination.
2.14.1.2 Qiagen RNeasy kit
RNA was isolated from peritoneal lavage cells using a Qiagen RNeasy kit
(Qiagen) according to the manufacturers specifications. Briefly, cells were lysed
in Buffer RLT. One volume of 70% ethanol was added to the lysate and applied
to the spin column. Columns were spun at 8,000 x g for 15 seconds at room
temperature and washed with Buffer RW1. Columns were spun at 8,000 x g for
15 seconds at room temperature. Columns were then washed with Buffer RPE
and spun at 8,000 x g for 2 minutes at room temperature. The column was then
placed into a new 1.5 mL microcentrifuge tube and 30-50 μL of nuclease-free
water (Ambion) was added. To elute RNA, columns were spun at 8,000 x g for
1 minute room temperature. The nucleic acid concentration was quantified using
139
a Nanodrop apparatus at an absorbance of 260 nm. Samples were also read at
absorbences of 230 nm and 280 nm to determine phenolic and protein
contamination.
2.14.2 cDNA synthesis
cDNA synthesis performed using SMARTScribe Reverse Transcriptase
(Clontech) according to the manufacturer’s protocol using poly-dT. First strand
synthesis was cycled at 72oC for 3 minutes followed by 42oC for 60 minutes.
Second strand synthesis was completed as follows: 95oC for 30 seconds; 55oC for
30 seconds; 72oC for 15 minutes. RNA levels were quantified and normalized prior
to cDNA synthesis (2 mg for tissues; 200 ng for peritoneal lavages). Primers used
in cDNA synthesis reactions can be found in Table 2.10.
2.14.3 Primers
All primers used had been previously validated for use in goldfish. Briefly,
for Q-PCR, primers were validated by 1:2 serial dilutions of cDNA and creating a
standard curve, used in determining in the R2 value, y-intercept, and efficiency of
the primer set using the 7500 Fast software. All primer sets were chosen with an R2
value of 0.997 or higher, a y-intercept value of -3.0 to -3.2, and an efficiency of
85% or higher. Melt curves were analyzed to ensure a single melting peak, and
qPCR products were run on a gel, excised, and sequenced to ensure the correct
amplicon was being amplified. Q-PCR primers can be found in Table 2.14. For
140
RT-PCR, products were run on a gel, excised, and sequenced to ensure the correct
amplicon was being amplified.
2.14.4 Quantitative PCR conditions
Quantitative PCR was performed using an Applied Biosystems 7500 Fast
Real-Time PCR machine using SYBR green reagents. Elongation factor 1 alpha
(EF1α) was used as the endogenous control for all experiments. Thermocycling
conditions were: 95oC for 10 minutes followed by 40 cycles of 95oC for 15 seconds
and 60oC for 1 minute. A melting curve step was added to the end of this protocol.
Data were analyzed using the 7500 fast software (Applied Biosciences) and is
represented as the average of the samples with standard error shown. The RQ
values were normalized against control fish.
2.15 Detection of sCSF-1R transcripts
Target mRNA transcripts were amplified by adding 1 μL of cDNA template
to 40.3 μL of nuclease free water, 5 μL of Micah’s 10xPCR buffer (1 mM Tris-
HCl, pH 8.3, 500 mM KCl, 15 mM MgCl2, 0.01% w/v gelatin), 1.2 μL of 20 mM
primer solution, 0.8 μL of 25 mM dNTPs, and 0.5 μL of Taq polymerase.
Reactions were amplified in an Eppendorf Mastercycler Nexus Gradient
thermocycler. The general thermocycling program consisted of an initial
denaturation step of 94oC for 3 minutes, followed by 40 cycles of 95oC for 30
seconds; 55oC for 1 minute and 30 seconds; 72oC for 2 minutes, and a final
extension of 72oC for 5 minutes. Bands were visualized by running out on a 1%
141
agarose gel. Gels were then stained with an ethidium bromide solution for 30
minutes, followed by destaining in distilled water for 30 minutes. Gel images were
acquired using an AlphaImager 2200 (Alpha Innotech). Primer sequences can be
found in Table 2.13.
For densitometry analysis, files were uploaded in ImageJ and relative band
intensity was determined for sCSF-1R and β-actin. The ratio of β-actin to sCSF-1R
was determined for each set. RT-PCR was used for these assays, as selective Q-
PCR primers could not be developed for this transcript.
2.16 Detection of sCSF-1R protein
Samples were diluted 1:1 in 2x Laemmli buffer (Table 2.8) and boiled for 10
minutes. Proteins were separated under denaturing and reducing conditions on a
10% polyacrylamide (PAGE) gel. Proteins were transferred to a 0.2 μm
nitrocellulose membrane (BioRad) and blocked for 1 hour at room temperature in
5% milk/TBS-T. Membranes were then incubated with anti-CSF-1R (1:1000 in 5%
milk/TBS-T) overnight at 4oC with continuous rocking. Membranes were then
washed 3 times and incubated with goat-anti-rabbit HRP (1:50 000 in 5%
milk/TBS-T) for 1 hour at room temperature. Membranes were developed with
WesternBrightECL (advansta) to detect horseradish peroxidase (HRP) conjugated
antibodies according to the manufacturers specifications. Membranes were imaged
with film (Kodak).
2.17 Analysis
142
All confocal data was analyzed using Zen 2012 lite software (Zeiss). Flow
cytometry data was analyzed with FCS Express software v3 (DeNovo Software) or
FACSDiva v6.1.3 (BD Biosciences). ImageStream data was analyzed using IDEAS
v3 through v5 software (Amnis Corporation, EMD Millipore). Statistics were
performed on Prism 4 software (GraphPad Prism). For statistics involving two
comparisons a Students’ t-test was preformed. For statistics involving more than
two comparisons, a one-way ANOVA was used. For post-hoc analyses, a Tukey’s
test was used when all-pairwise analyses were desired. When only a comparison to
control was desired a Dunnet’s post-hoc test was used. For all one-way ANOVA
tests, all values were transformed by square roots for ensure equal variance in all
samples, fulfilling a requirement for the test to be preformed. For each assessment,
each experiment was assessed for a Trial effect. For statistics involving more than
two comparisons over time, a two-way ANOVA was used followed by a
Bonferroni post-hoc test. Similar to one-way ANOVA tests, all values were
transformed by square roots for ensure equal variance in all samples, fulfilling a
requirement for the test to be preformed. In addition, each experiment also
underwent an assessment for a Trial effect, a Time effect and a Trial X Time effect.
No Trial X Time effect was noted for any experiment.
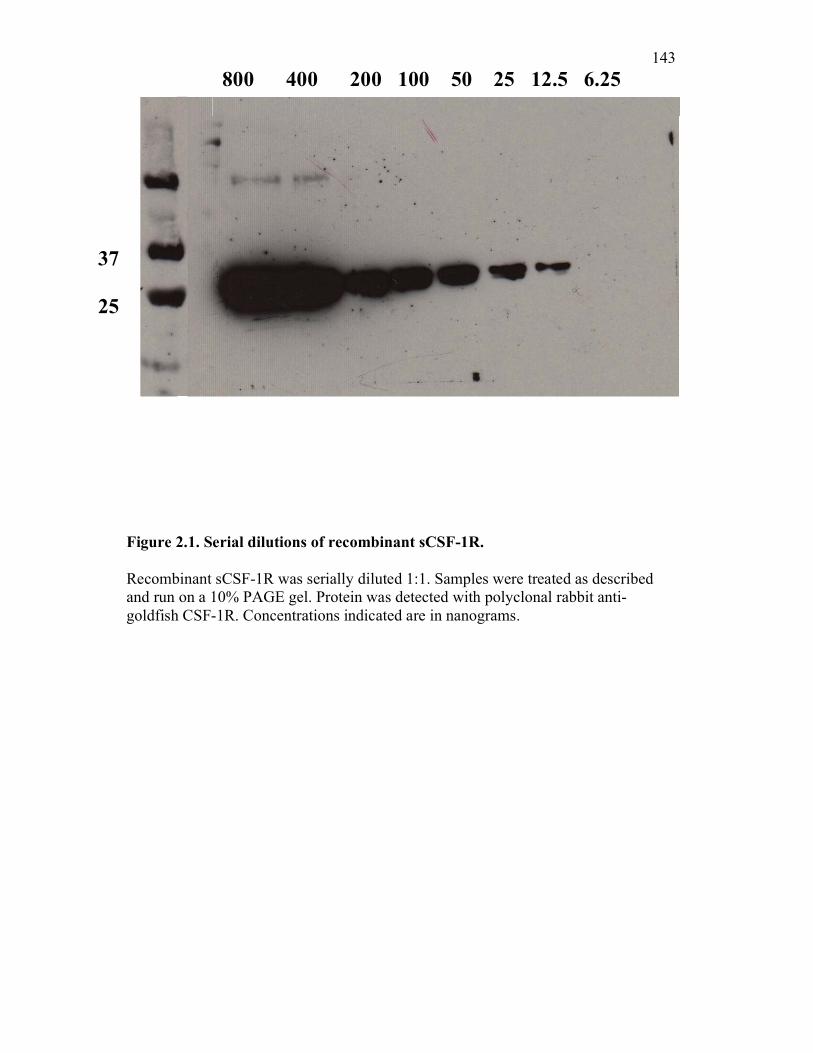
143
Figure 2.1. Serial dilutions of recombinant sCSF-1R. Recombinant sCSF-1R was serially diluted 1:1. Samples were treated as described and run on a 10% PAGE gel. Protein was detected with polyclonal rabbit anti-goldfish CSF-1R. Concentrations indicated are in nanograms.
800 400 200 100 50 25 12.5 6.25
25
37
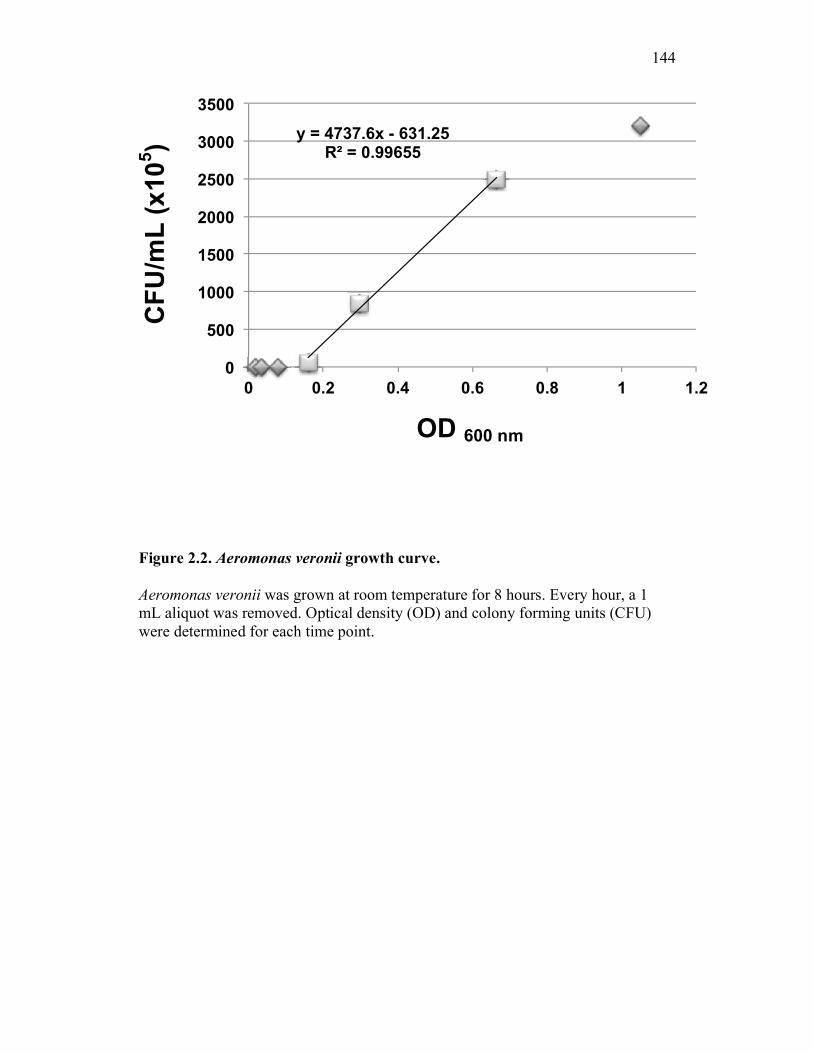
144
y = 4737.6x - 631.25 R² = 0.99655
0
500
1000
1500
2000
2500
3000
3500
0 0.2 0.4 0.6 0.8 1 1.2
Figure 2.2. Aeromonas veronii growth curve. Aeromonas veronii was grown at room temperature for 8 hours. Every hour, a 1 mL aliquot was removed. Optical density (OD) and colony forming units (CFU) were determined for each time point.
OD 600 nm
CFU
/mL
(x10
5 )
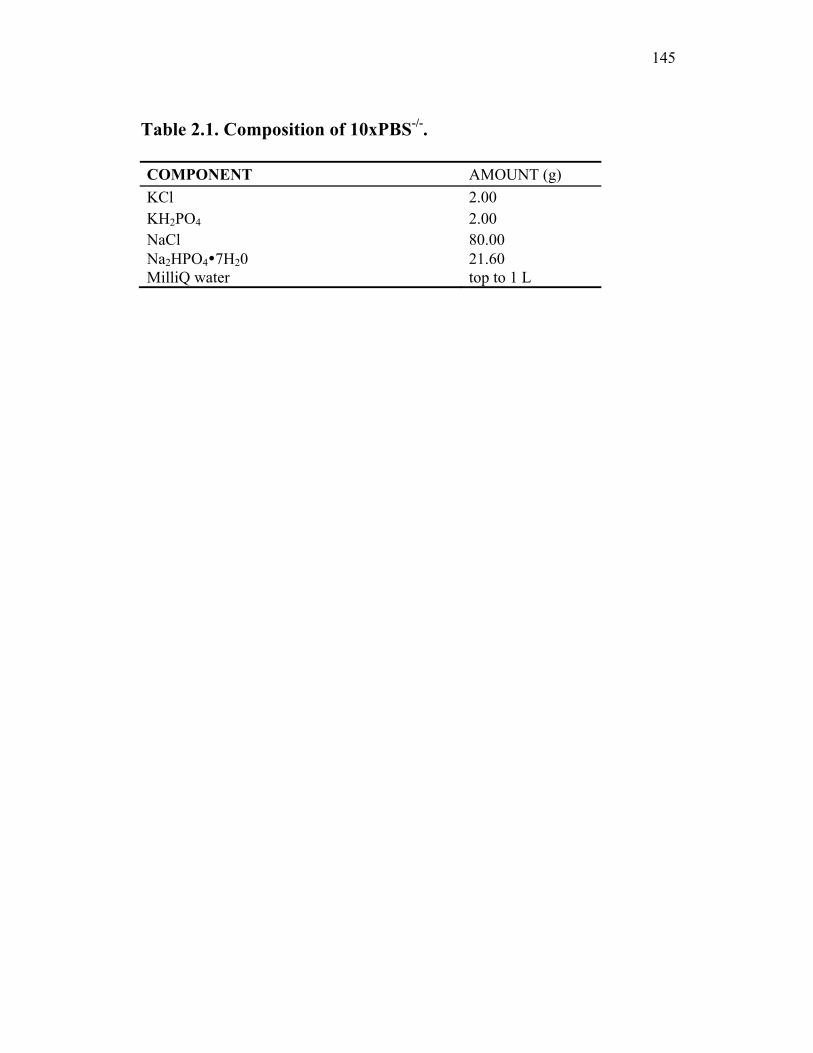
145
Table 2.1. Composition of 10xPBS-/-. COMPONENT AMOUNT (g) KCl 2.00 KH2PO4 2.00 NaCl 80.00 Na2HPO4 7H20 MilliQ water
21.60 top to 1 L
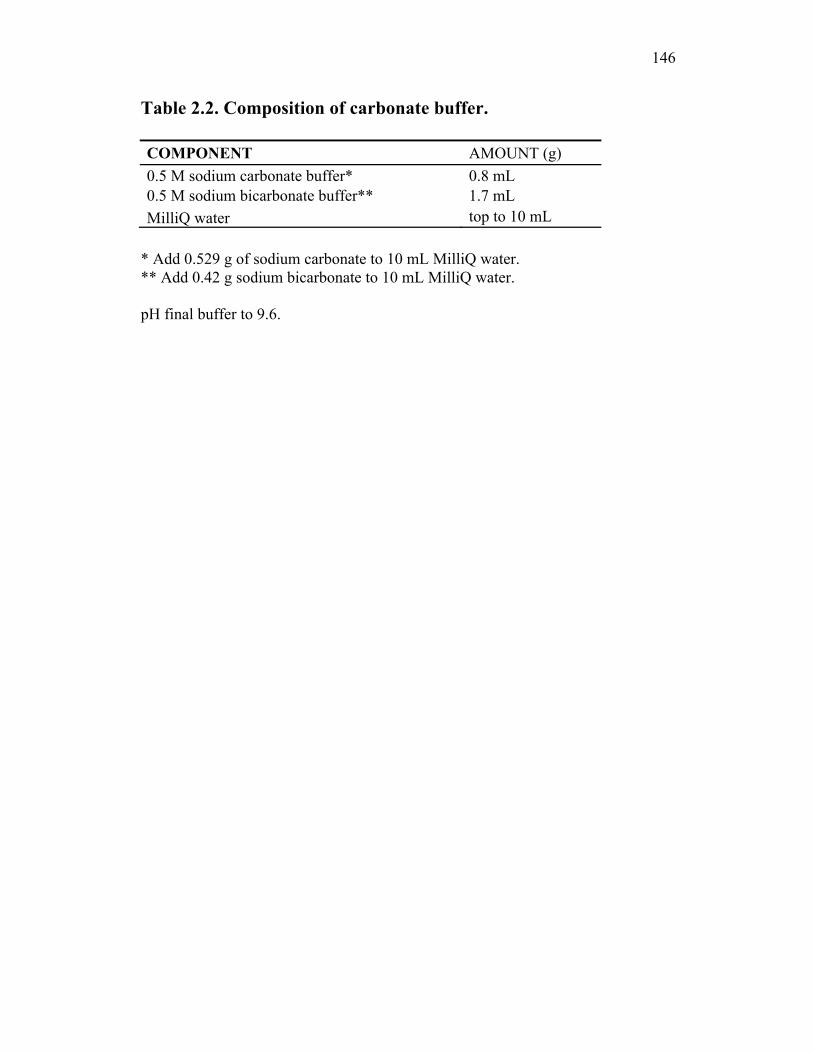
146
Table 2.2. Composition of carbonate buffer. COMPONENT AMOUNT (g) 0.5 M sodium carbonate buffer* 0.8 mL 0.5 M sodium bicarbonate buffer** 1.7 mL MilliQ water top to 10 mL
* Add 0.529 g of sodium carbonate to 10 mL MilliQ water. ** Add 0.42 g sodium bicarbonate to 10 mL MilliQ water. pH final buffer to 9.6.
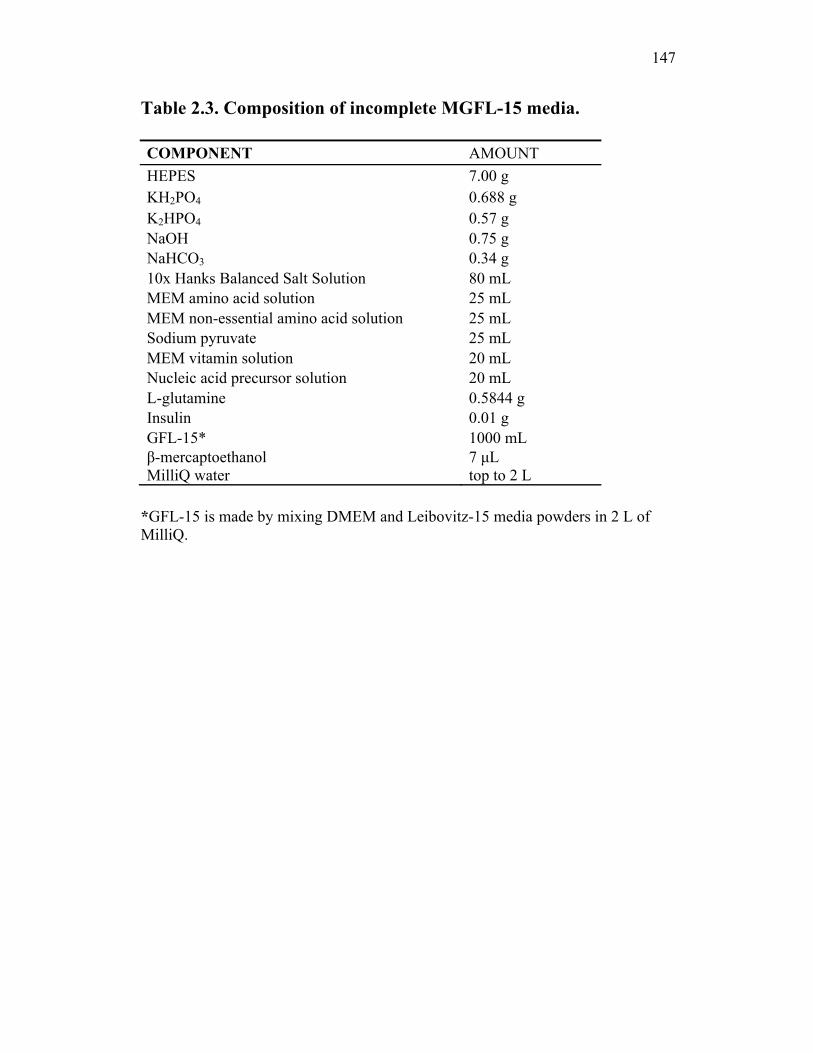
147
Table 2.3. Composition of incomplete MGFL-15 media. COMPONENT AMOUNT HEPES 7.00 g KH2PO4 0.688 g K2HPO4 0.57 g NaOH 0.75 g NaHCO3 0.34 g 10x Hanks Balanced Salt Solution 80 mL MEM amino acid solution 25 mL MEM non-essential amino acid solution 25 mL Sodium pyruvate 25 mL MEM vitamin solution 20 mL Nucleic acid precursor solution 20 mL L-glutamine 0.5844 g Insulin 0.01 g GFL-15* 1000 mL β-mercaptoethanol MilliQ water
7 μL top to 2 L
*GFL-15 is made by mixing DMEM and Leibovitz-15 media powders in 2 L of MilliQ.
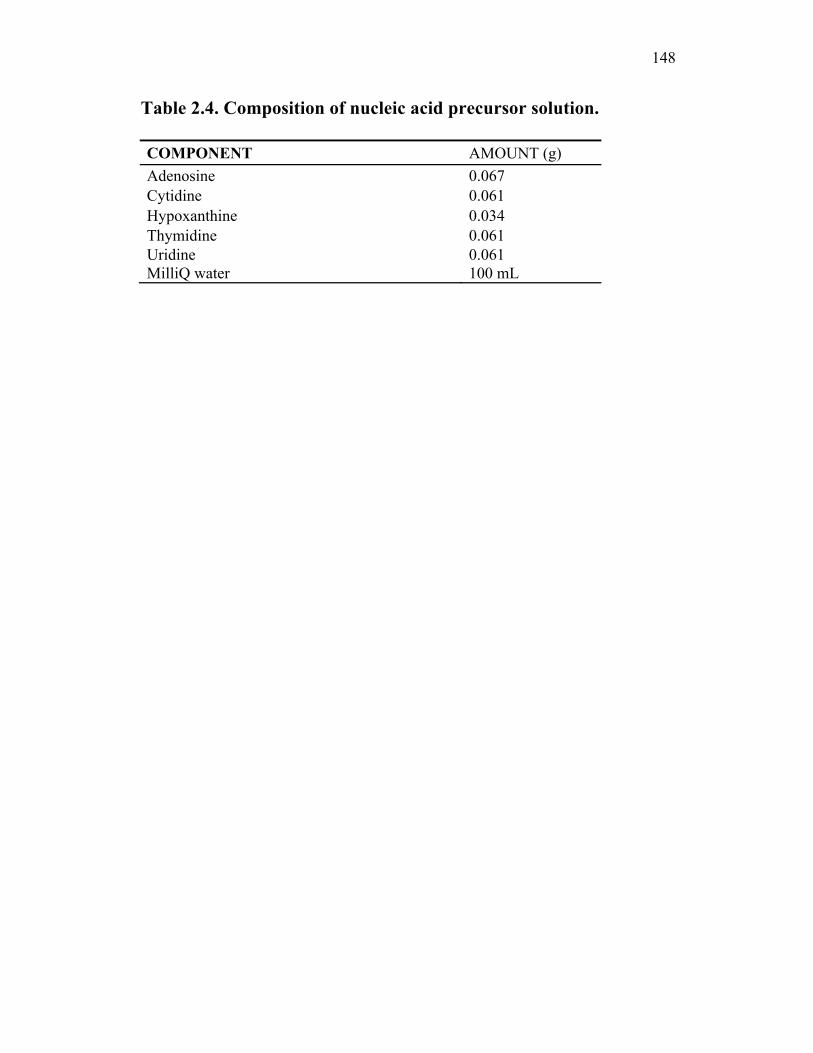
148
Table 2.4. Composition of nucleic acid precursor solution. COMPONENT AMOUNT (g) Adenosine 0.067 Cytidine 0.061 Hypoxanthine 0.034 Thymidine 0.061 Uridine MilliQ water
0.061 100 mL
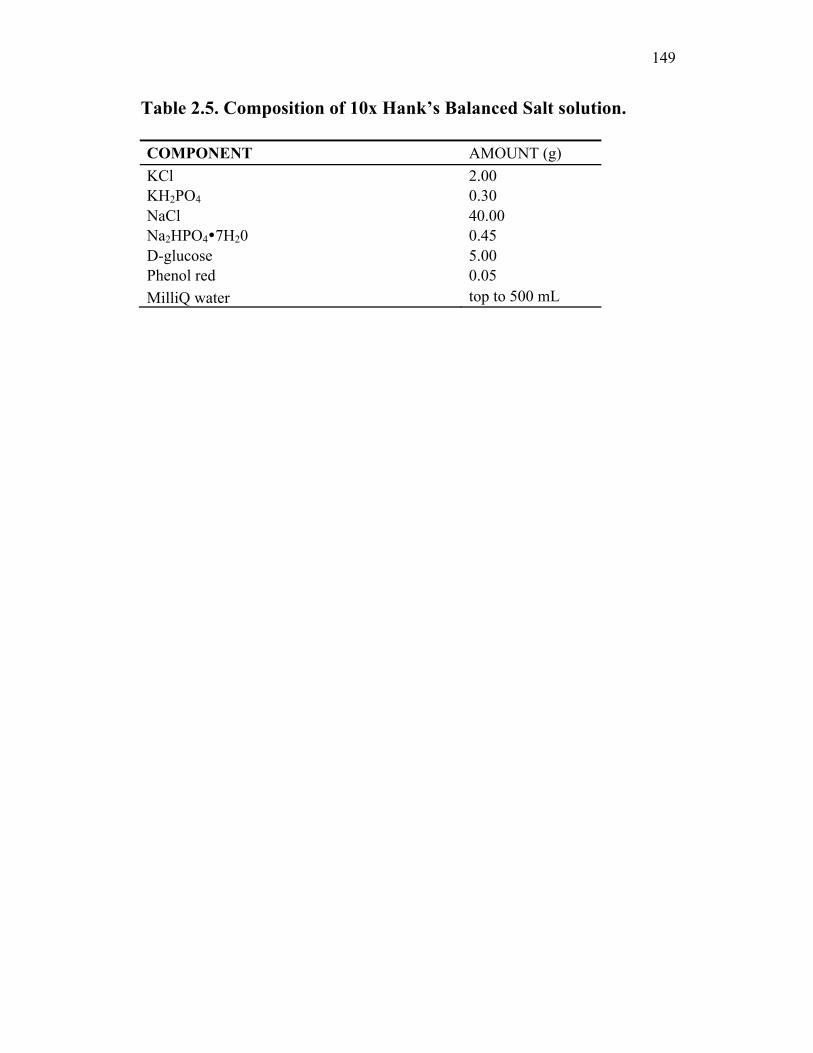
149
Table 2.5. Composition of 10x Hank’s Balanced Salt solution. COMPONENT AMOUNT (g) KCl 2.00 KH2PO4 0.30 NaCl 40.00 Na2HPO4 7H20 0.45 D-glucose 5.00 Phenol red 0.05 MilliQ water top to 500 mL
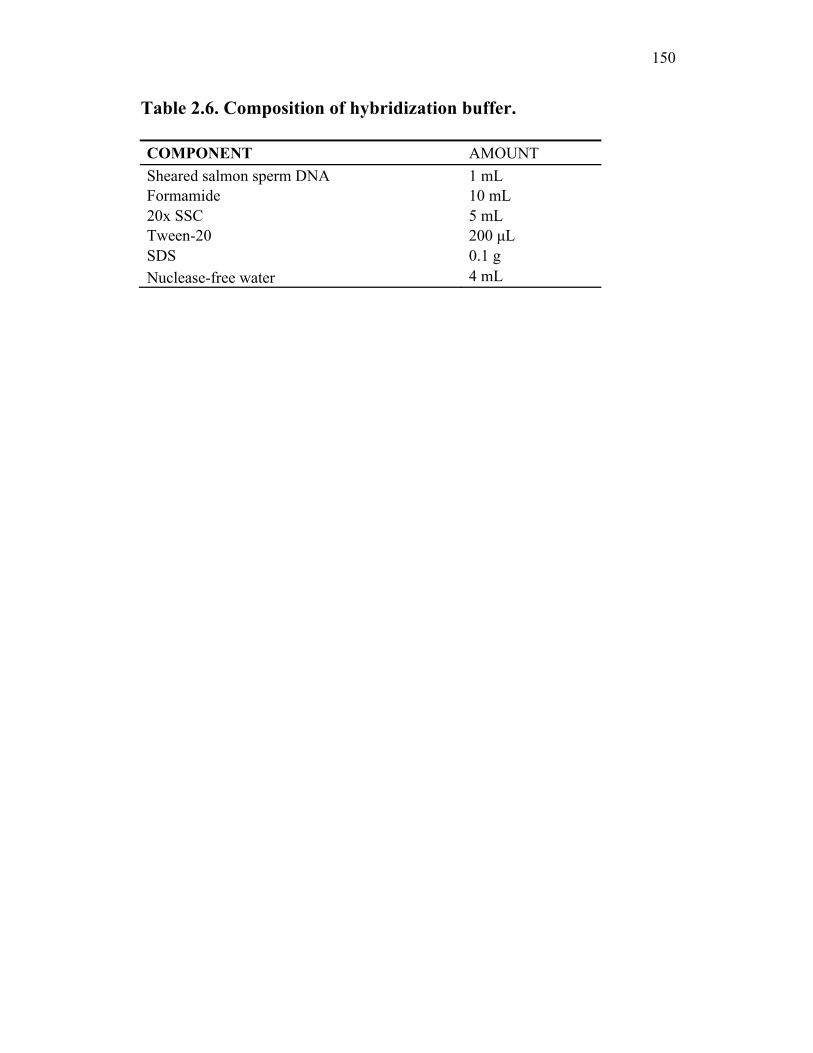
150
Table 2.6. Composition of hybridization buffer. COMPONENT AMOUNT Sheared salmon sperm DNA 1 mL Formamide 10 mL 20x SSC 5 mL Tween-20 200 μL SDS 0.1 g Nuclease-free water 4 mL
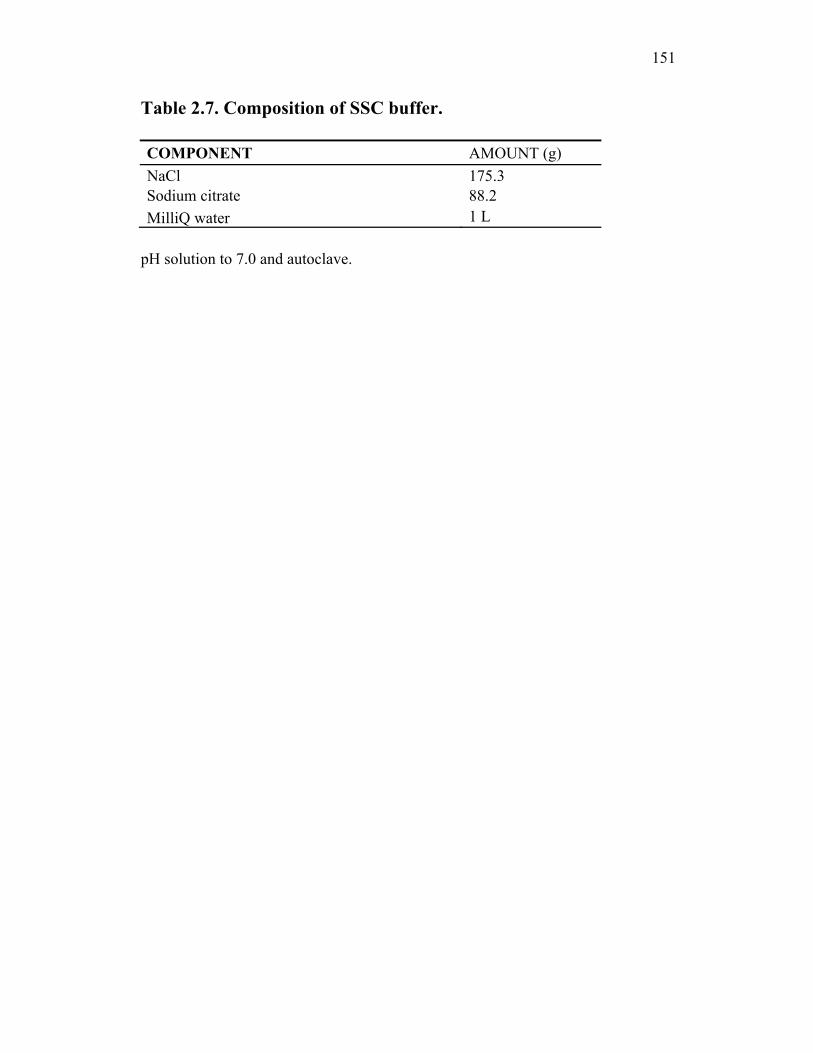
151
Table 2.7. Composition of SSC buffer. COMPONENT AMOUNT (g) NaCl 175.3 Sodium citrate 88.2 MilliQ water 1 L
pH solution to 7.0 and autoclave.

152
Table 2.8. Composition of 2x Laemmli buffer. COMPONENT AMOUNT SDS 0.4 g β-mercaptoethanol 1 mL Glycerol 2 mL 0.5 M Tris 2.5 mL Bromophenol blue pinch MilliQ water 10 mL
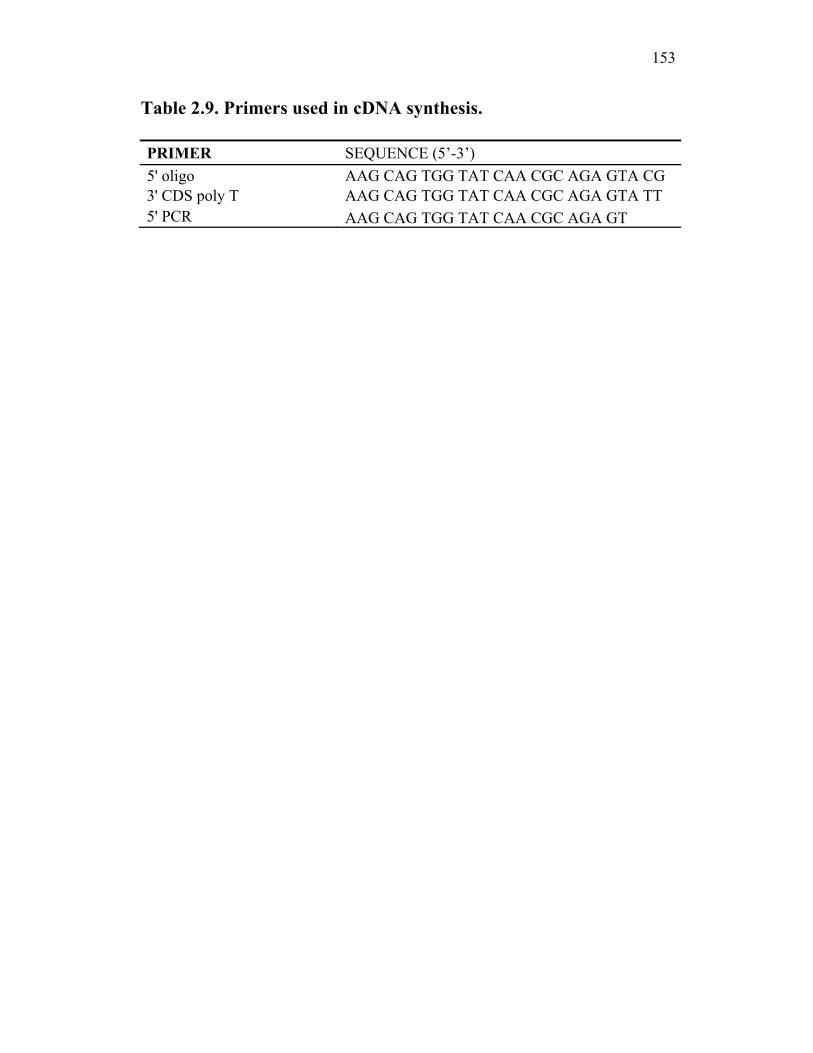
153
Table 2.9. Primers used in cDNA synthesis. PRIMER SEQUENCE (5’-3’) 5' oligo AAG CAG TGG TAT CAA CGC AGA GTA CG 3' CDS poly T AAG CAG TGG TAT CAA CGC AGA GTA TT 5' PCR AAG CAG TGG TAT CAA CGC AGA GT
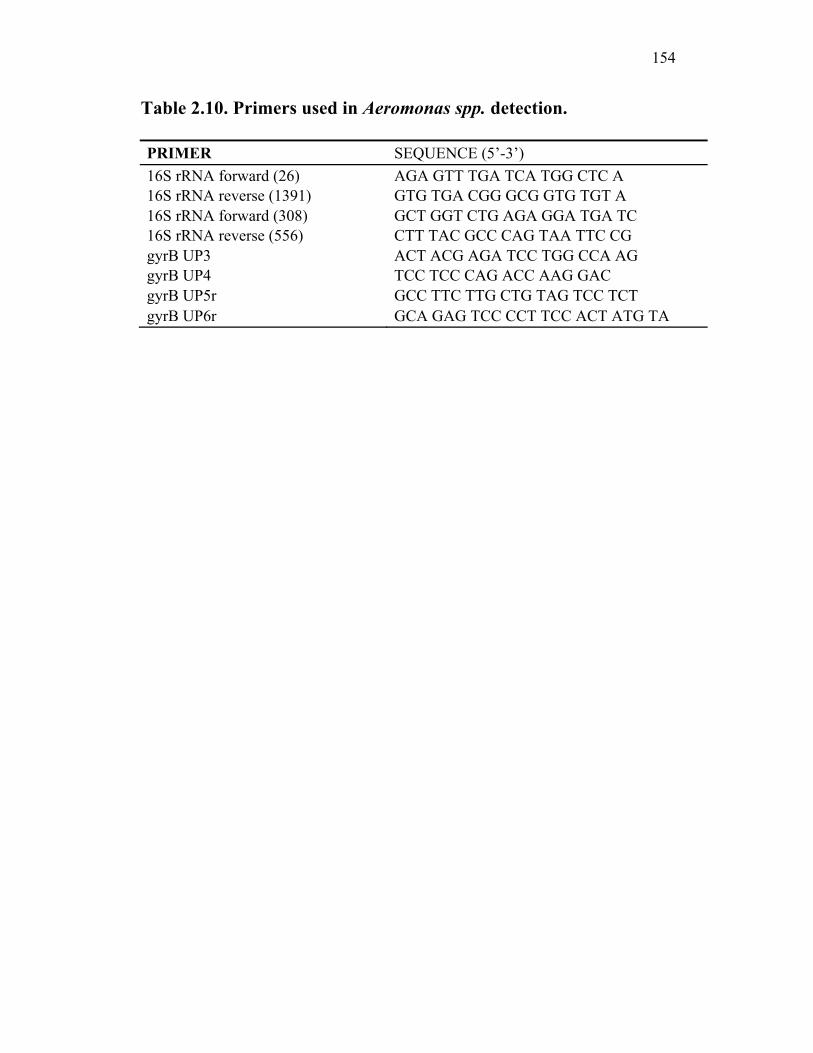
154
Table 2.10. Primers used in Aeromonas spp. detection. PRIMER SEQUENCE (5’-3’) 16S rRNA forward (26) AGA GTT TGA TCA TGG CTC A 16S rRNA reverse (1391) GTG TGA CGG GCG GTG TGT A 16S rRNA forward (308) GCT GGT CTG AGA GGA TGA TC 16S rRNA reverse (556) CTT TAC GCC CAG TAA TTC CG gyrB UP3 ACT ACG AGA TCC TGG CCA AG gyrB UP4 TCC TCC CAG ACC AAG GAC gyrB UP5r GCC TTC TTG CTG TAG TCC TCT gyrB UP6r GCA GAG TCC CCT TCC ACT ATG TA
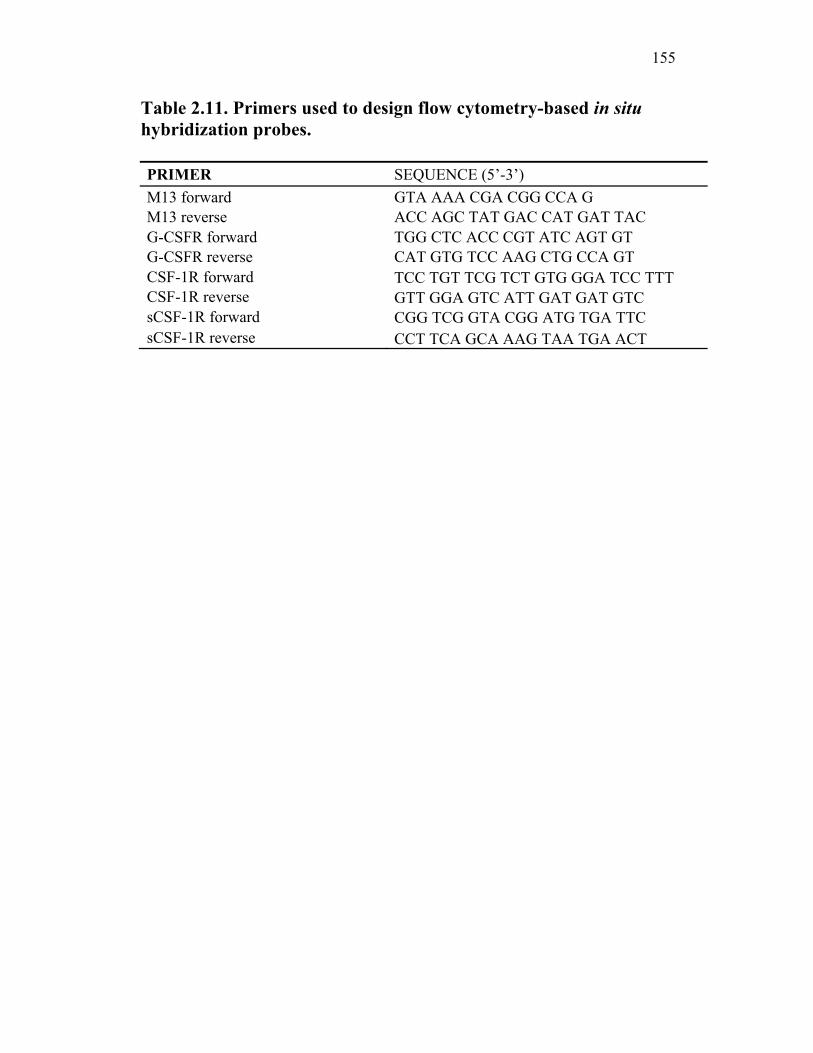
155
Table 2.11. Primers used to design flow cytometry-based in situ hybridization probes. PRIMER SEQUENCE (5’-3’) M13 forward GTA AAA CGA CGG CCA G M13 reverse ACC AGC TAT GAC CAT GAT TAC G-CSFR forward TGG CTC ACC CGT ATC AGT GT G-CSFR reverse CAT GTG TCC AAG CTG CCA GT CSF-1R forward TCC TGT TCG TCT GTG GGA TCC TTT CSF-1R reverse GTT GGA GTC ATT GAT GAT GTC sCSF-1R forward CGG TCG GTA CGG ATG TGA TTC sCSF-1R reverse CCT TCA GCA AAG TAA TGA ACT
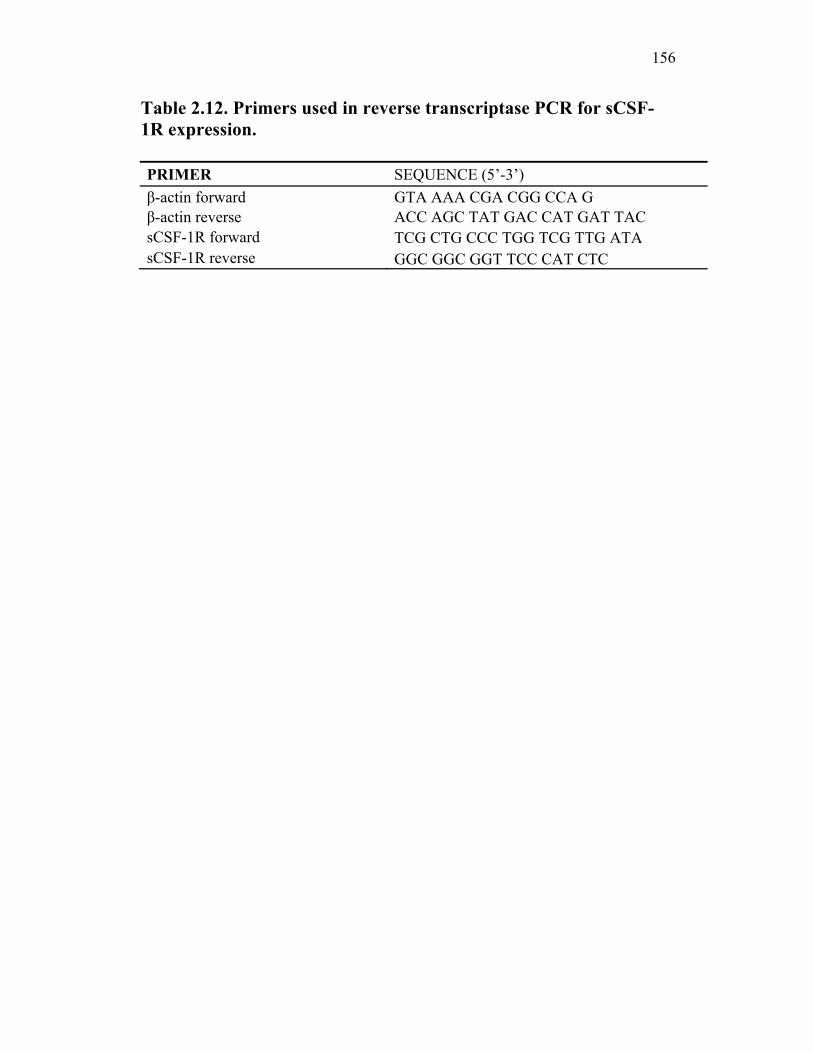
156
Table 2.12. Primers used in reverse transcriptase PCR for sCSF-1R expression. PRIMER SEQUENCE (5’-3’) β-actin forward GTA AAA CGA CGG CCA G β-actin reverse ACC AGC TAT GAC CAT GAT TAC sCSF-1R forward TCG CTG CCC TGG TCG TTG ATA sCSF-1R reverse GGC GGC GGT TCC CAT CTC
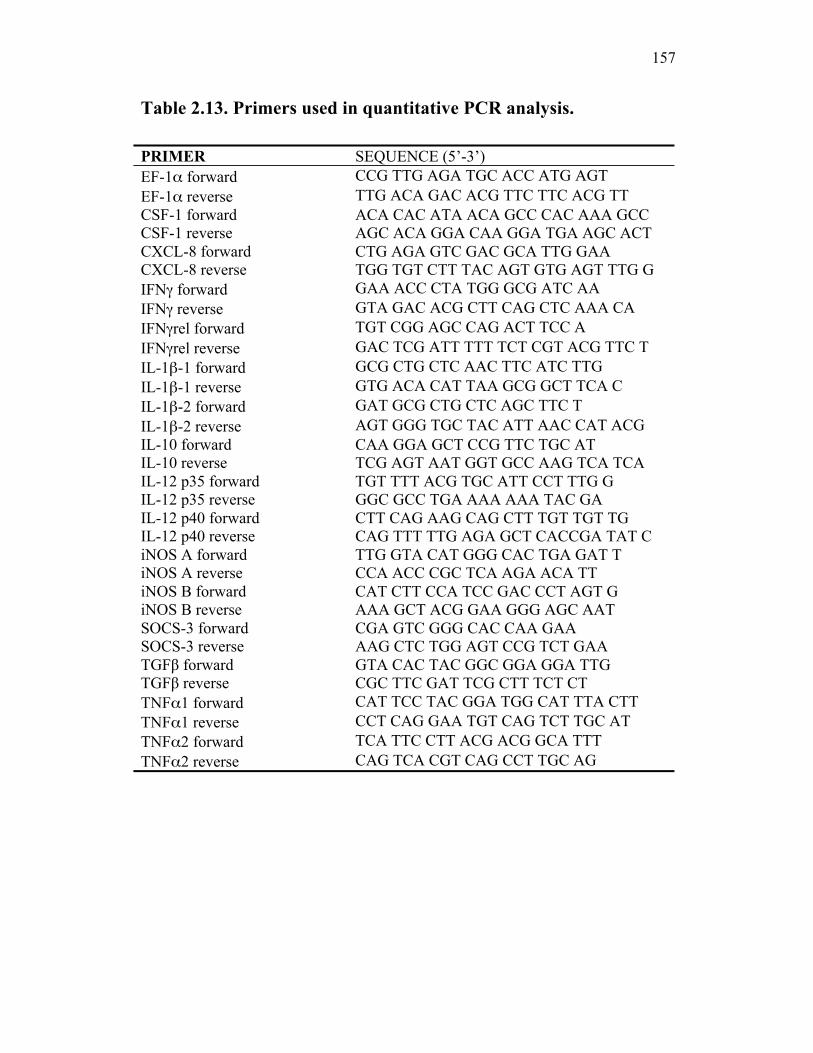
157
Table 2.13. Primers used in quantitative PCR analysis.
PRIMER SEQUENCE (5’-3’) EF-1α forward CCG TTG AGA TGC ACC ATG AGT EF-1α reverse TTG ACA GAC ACG TTC TTC ACG TT CSF-1 forward CSF-1 reverse CXCL-8 forward
ACA CAC ATA ACA GCC CAC AAA GCC AGC ACA GGA CAA GGA TGA AGC ACT CTG AGA GTC GAC GCA TTG GAA
CXCL-8 reverse TGG TGT CTT TAC AGT GTG AGT TTG G IFNγ forward GAA ACC CTA TGG GCG ATC AA IFNγ reverse GTA GAC ACG CTT CAG CTC AAA CA IFNγrel forward TGT CGG AGC CAG ACT TCC A IFNγrel reverse GAC TCG ATT TTT TCT CGT ACG TTC T IL-1β-1 forward GCG CTG CTC AAC TTC ATC TTG IL-1β-1 reverse GTG ACA CAT TAA GCG GCT TCA C IL-1β-2 forward GAT GCG CTG CTC AGC TTC T IL-1β-2 reverse AGT GGG TGC TAC ATT AAC CAT ACG IL-10 forward CAA GGA GCT CCG TTC TGC AT IL-10 reverse TCG AGT AAT GGT GCC AAG TCA TCA IL-12 p35 forward TGT TTT ACG TGC ATT CCT TTG G IL-12 p35 reverse GGC GCC TGA AAA AAA TAC GA IL-12 p40 forward CTT CAG AAG CAG CTT TGT TGT TG IL-12 p40 reverse CAG TTT TTG AGA GCT CACCGA TAT C iNOS A forward TTG GTA CAT GGG CAC TGA GAT T iNOS A reverse CCA ACC CGC TCA AGA ACA TT iNOS B forward CAT CTT CCA TCC GAC CCT AGT G iNOS B reverse AAA GCT ACG GAA GGG AGC AAT SOCS-3 forward CGA GTC GGG CAC CAA GAA SOCS-3 reverse AAG CTC TGG AGT CCG TCT GAA TGFβ forward GTA CAC TAC GGC GGA GGA TTG TGFβ reverse CGC TTC GAT TCG CTT TCT CT TNFα1 forward CAT TCC TAC GGA TGG CAT TTA CTT TNFα1 reverse CCT CAG GAA TGT CAG TCT TGC AT TNFα2 forward TCA TTC CTT ACG ACG GCA TTT TNFα2 reverse CAG TCA CGT CAG CCT TGC AG
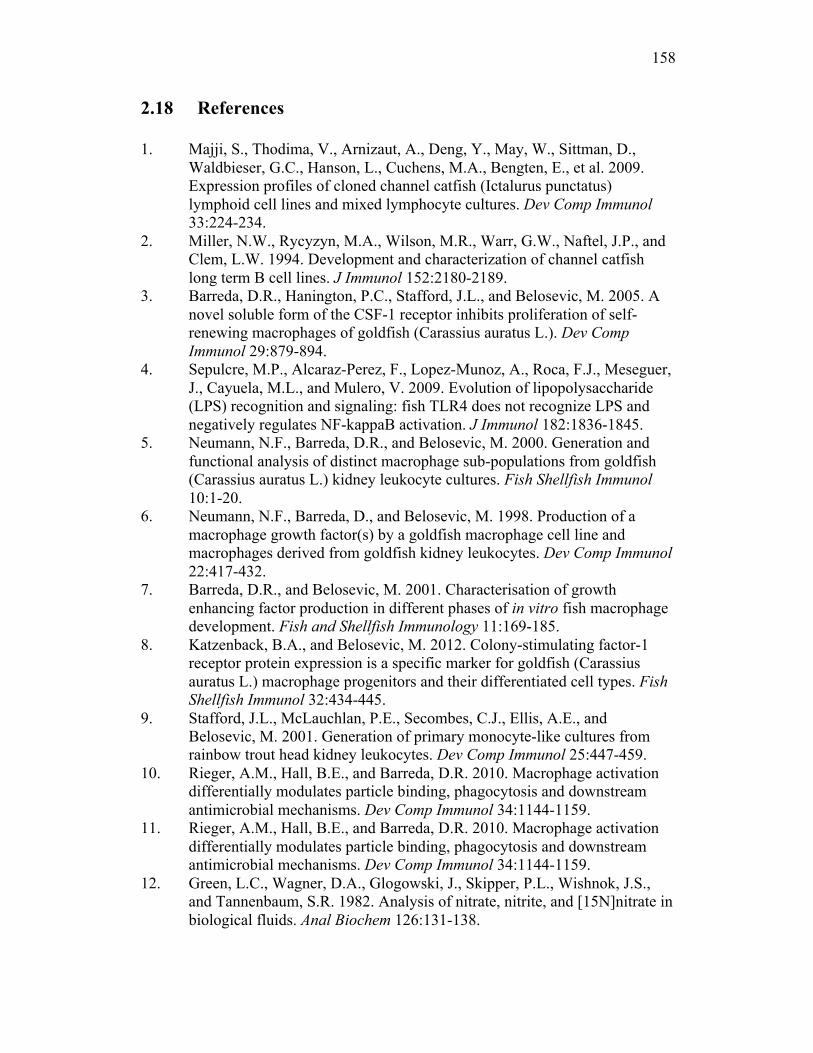
158
2.18 References
1. Majji, S., Thodima, V., Arnizaut, A., Deng, Y., May, W., Sittman, D., Waldbieser, G.C., Hanson, L., Cuchens, M.A., Bengten, E., et al. 2009. Expression profiles of cloned channel catfish (Ictalurus punctatus) lymphoid cell lines and mixed lymphocyte cultures. Dev Comp Immunol 33:224-234.
2. Miller, N.W., Rycyzyn, M.A., Wilson, M.R., Warr, G.W., Naftel, J.P., and Clem, L.W. 1994. Development and characterization of channel catfish long term B cell lines. J Immunol 152:2180-2189.
3. Barreda, D.R., Hanington, P.C., Stafford, J.L., and Belosevic, M. 2005. A novel soluble form of the CSF-1 receptor inhibits proliferation of self-renewing macrophages of goldfish (Carassius auratus L.). Dev Comp Immunol 29:879-894.
4. Sepulcre, M.P., Alcaraz-Perez, F., Lopez-Munoz, A., Roca, F.J., Meseguer, J., Cayuela, M.L., and Mulero, V. 2009. Evolution of lipopolysaccharide (LPS) recognition and signaling: fish TLR4 does not recognize LPS and negatively regulates NF-kappaB activation. J Immunol 182:1836-1845.
5. Neumann, N.F., Barreda, D.R., and Belosevic, M. 2000. Generation and functional analysis of distinct macrophage sub-populations from goldfish (Carassius auratus L.) kidney leukocyte cultures. Fish Shellfish Immunol 10:1-20.
6. Neumann, N.F., Barreda, D., and Belosevic, M. 1998. Production of a macrophage growth factor(s) by a goldfish macrophage cell line and macrophages derived from goldfish kidney leukocytes. Dev Comp Immunol 22:417-432.
7. Barreda, D.R., and Belosevic, M. 2001. Characterisation of growth enhancing factor production in different phases of in vitro fish macrophage development. Fish and Shellfish Immunology 11:169-185.
8. Katzenback, B.A., and Belosevic, M. 2012. Colony-stimulating factor-1 receptor protein expression is a specific marker for goldfish (Carassius auratus L.) macrophage progenitors and their differentiated cell types. Fish Shellfish Immunol 32:434-445.
9. Stafford, J.L., McLauchlan, P.E., Secombes, C.J., Ellis, A.E., and Belosevic, M. 2001. Generation of primary monocyte-like cultures from rainbow trout head kidney leukocytes. Dev Comp Immunol 25:447-459.
10. Rieger, A.M., Hall, B.E., and Barreda, D.R. 2010. Macrophage activation differentially modulates particle binding, phagocytosis and downstream antimicrobial mechanisms. Dev Comp Immunol 34:1144-1159.
11. Rieger, A.M., Hall, B.E., and Barreda, D.R. 2010. Macrophage activation differentially modulates particle binding, phagocytosis and downstream antimicrobial mechanisms. Dev Comp Immunol 34:1144-1159.
12. Green, L.C., Wagner, D.A., Glogowski, J., Skipper, P.L., Wishnok, J.S., and Tannenbaum, S.R. 1982. Analysis of nitrate, nitrite, and [15N]nitrate in biological fluids. Anal Biochem 126:131-138.
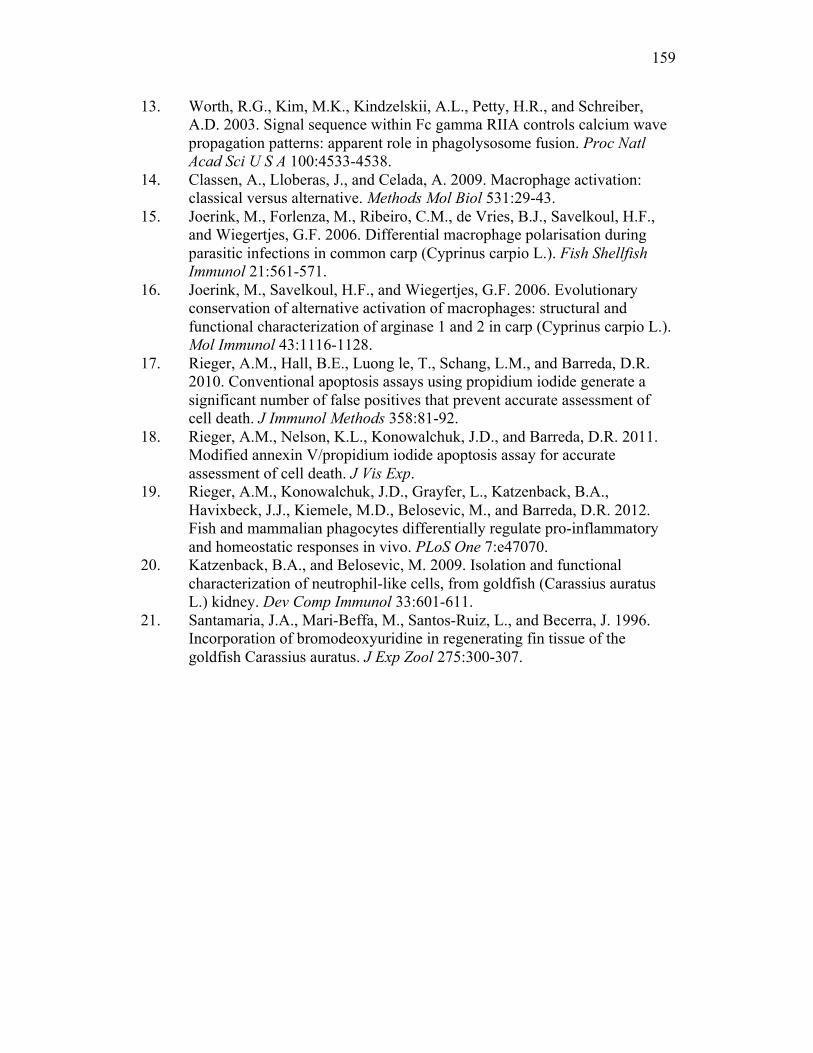
159
13. Worth, R.G., Kim, M.K., Kindzelskii, A.L., Petty, H.R., and Schreiber, A.D. 2003. Signal sequence within Fc gamma RIIA controls calcium wave propagation patterns: apparent role in phagolysosome fusion. Proc Natl Acad Sci U S A 100:4533-4538.
14. Classen, A., Lloberas, J., and Celada, A. 2009. Macrophage activation: classical versus alternative. Methods Mol Biol 531:29-43.
15. Joerink, M., Forlenza, M., Ribeiro, C.M., de Vries, B.J., Savelkoul, H.F., and Wiegertjes, G.F. 2006. Differential macrophage polarisation during parasitic infections in common carp (Cyprinus carpio L.). Fish Shellfish Immunol 21:561-571.
16. Joerink, M., Savelkoul, H.F., and Wiegertjes, G.F. 2006. Evolutionary conservation of alternative activation of macrophages: structural and functional characterization of arginase 1 and 2 in carp (Cyprinus carpio L.). Mol Immunol 43:1116-1128.
17. Rieger, A.M., Hall, B.E., Luong le, T., Schang, L.M., and Barreda, D.R. 2010. Conventional apoptosis assays using propidium iodide generate a significant number of false positives that prevent accurate assessment of cell death. J Immunol Methods 358:81-92.
18. Rieger, A.M., Nelson, K.L., Konowalchuk, J.D., and Barreda, D.R. 2011. Modified annexin V/propidium iodide apoptosis assay for accurate assessment of cell death. J Vis Exp.
19. Rieger, A.M., Konowalchuk, J.D., Grayfer, L., Katzenback, B.A., Havixbeck, J.J., Kiemele, M.D., Belosevic, M., and Barreda, D.R. 2012. Fish and mammalian phagocytes differentially regulate pro-inflammatory and homeostatic responses in vivo. PLoS One 7:e47070.
20. Katzenback, B.A., and Belosevic, M. 2009. Isolation and functional characterization of neutrophil-like cells, from goldfish (Carassius auratus L.) kidney. Dev Comp Immunol 33:601-611.
21. Santamaria, J.A., Mari-Beffa, M., Santos-Ruiz, L., and Becerra, J. 1996. Incorporation of bromodeoxyuridine in regenerating fin tissue of the goldfish Carassius auratus. J Exp Zool 275:300-307.
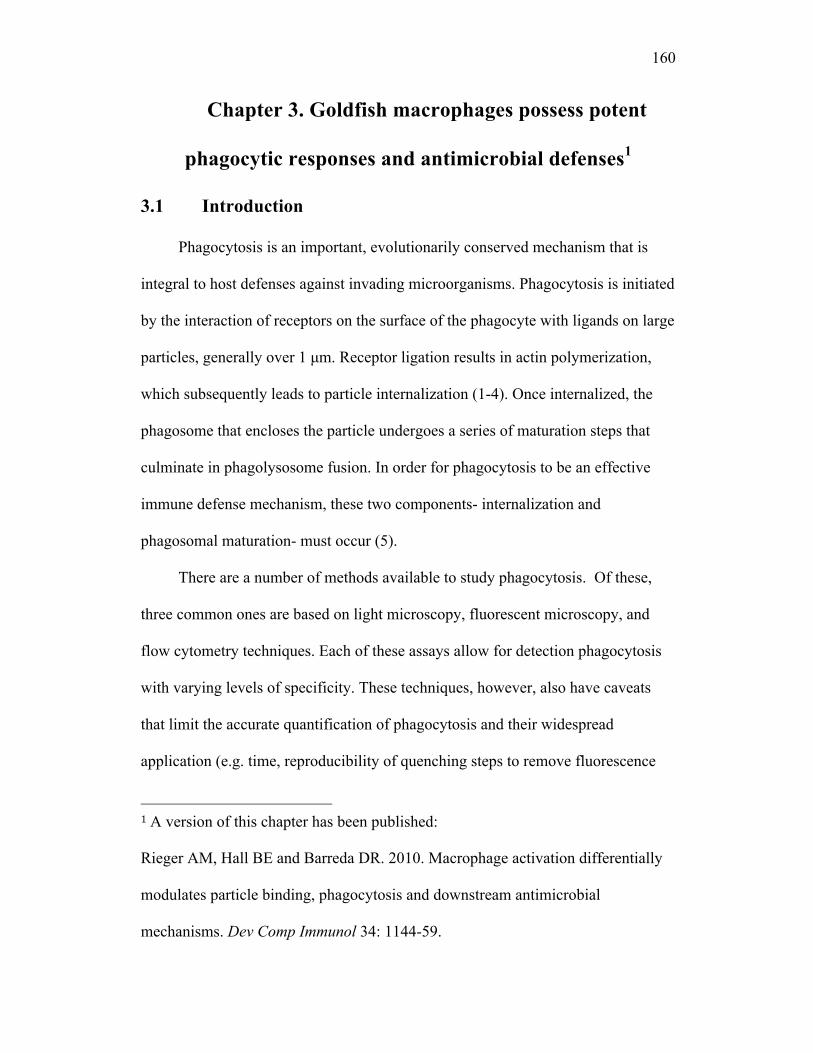
160
Chapter 3. Goldfish macrophages possess potent
phagocytic responses and antimicrobial defenses1
3.1 Introduction
Phagocytosis is an important, evolutionarily conserved mechanism that is
integral to host defenses against invading microorganisms. Phagocytosis is initiated
by the interaction of receptors on the surface of the phagocyte with ligands on large
particles, generally over 1 μm. Receptor ligation results in actin polymerization,
which subsequently leads to particle internalization (1-4). Once internalized, the
phagosome that encloses the particle undergoes a series of maturation steps that
culminate in phagolysosome fusion. In order for phagocytosis to be an effective
immune defense mechanism, these two components- internalization and
phagosomal maturation- must occur (5).
There are a number of methods available to study phagocytosis. Of these,
three common ones are based on light microscopy, fluorescent microscopy, and
flow cytometry techniques. Each of these assays allow for detection phagocytosis
with varying levels of specificity. These techniques, however, also have caveats
that limit the accurate quantification of phagocytosis and their widespread
application (e.g. time, reproducibility of quenching steps to remove fluorescence
A version of this chapter has been published:
Rieger AM, Hall BE and Barreda DR. 2010. Macrophage activation differentially
modulates particle binding, phagocytosis and downstream antimicrobial
mechanisms. Dev Comp Immunol 34: 1144-59.
161
from surface bound particles, and others) (6, 7). Microscopy-based assays are
largely limited by time requirements and low populations counts, which prevent
statistically robust evaluation of phagocytosis. Flow cytometry-based assays have
become increasingly popular due to the ability to analyze much higher cell counts
in a short period of time. These assays, however, lack the spatial resolution of
microscopy-based assays, which limit accurate quantification of internalized
particles.
Using an ImageStream multi-spectral imaging flow cytometer, a novel assay
was developed that incorporates the strengths of the previous assays, while
overcoming the weaknesses associated with both the microscopy and flow
cytometry assays. Analysis of phagocytic responses can be further enhanced by
incorporation of specific cellular markers, characterization of cellular morphology,
and an increased capacity for multivariate analysis. Images can be acquired at over
100 images/second, allowing analysis of a large population of cells.
This chapter describes the phagocytic capacity of goldfish primary kidney
macrophage (PKM) cells. While it has been previously reported that mixed
populations of these cultures are phagocytic, it is unclear which of the sub-
populations are responsible for this activity (8, 9). Further, it remains unclear if
these myeloid cells may display a differential capacity for phagocytosis and
downstream killing mechanisms during key steps along their differentiation
pathways. This chapter examines these questions among mixed populations of cells
to allow for cellular cross-talk and to minimize the need for isolation of individual
subpopulations, which is often associated with higher levels of basal activation.
162
The main objectives of this chapter were to (1) determine the predominant
phagocyte in PKM cultures, (2) assess the impact of activation on phagocytic
responses, including induction of downstream antimicrobial defense mechanisms,
and (3) quantify phagolysosome fusion within a mixed PKM culture.
3.2 Results
3.2.1 Current methods have limitations for detecting phagocytosis.
While a number of assays exist to study phagocytosis, each of these assays
has important limitations stemming from time constraints, low sample numbers
and/or lack of spatial resolution. I initially evaluated three phagocytosis assays
based on three commonly used platforms: (i) light microscopy, (ii) fluorescent
microscopy and (iii) conventional flow cytometry.
In a standard light microscopy phagocytosis assay, well-characterized
phagocytic RAW 264.7 macrophages were adhered to plate and incubated with
non-fluorescent 3 μm latex beads for 2 hours (Figure 3.1 A). Cells were
subsequently stained and phagocytosis was assessed using a compound light
microscope. While this assay is relatively easy to carry out, does not require
specialized equipment, and can distinguish between cells with internalized and
surface bound particles (this is limited to X-Y axis), two major limitations include
the number of cells that can be quantified (usually 200-300 cells) and the time that
it takes to manually count these cells and the particles within them.
Similarly to the light microscopy-based assay, in the fluorescence
microscopy-based assay, RAW 264.7 macrophage cells were adhered to coverslips
and incubated with zymosan-FITC for 3 hours (Figure 3.1 B). Zymosan particles
163
are composed of the cell wall of chemically or heat-killed Saccharomyces
cerevisiae, which makes them a relevant model of pathogenicity. Dectin-1 appears
to be the main receptor involved in the phagocytosis of these zymosan particles
(10). Phagocytosis was analyzed with a confocal fluorescence microscope. As with
the light microscopy-based assay, the fluorescence microscopy-based assay
allowed for differentiation between internalized and surface bound particles (also
limited to X-Y axis). This was further improved by use of the Z-stacking feature,
which is useful in determining particles that may be surface bound along the Z-
axis. However, this method requires more specialized equipment than the light
microscopy method and care must be exercised to prevent fluorochrome bleaching
of fluorescent particles and/or cells during analysis. Furthermore, because
relatively few cells are quantified, both light and fluorescence microscopy-based
methods lack the statistical robustness of assays that can analyze thousands of cells
in a population.
Using a flow cytometry-based phagocytosis assay, phagocytosis can be
studied in a statistically robust manner (over 10,000 cells can be analyzed in a few
minutes) and can be assessed in the context of a mixed population of cells. For this
study, phagocytic RAW 264.7 macrophages were co-incubated with Jurkat T cells,
a non-phagocytic human T cell line, and FITC-labeled zymosan (Figure 3.1 C).
Prior to acquisition, cells were stained with anti-mouse CD45-PE, which
selectively labels murine-derived RAW 264.7 macrophage cells but not human-
derived Jurkat cells. The level of phagocytosis in both the RAW 264.7 macrophage
and Jurkat T cell populations was quantified. While this assay allows analysis of a
164
large number of cells, there is no differentiation between cells with surface bound
particles and internalized particles because of the lack of spatial resolution
available through conventional flow cytometry. As such, the phagocytic population
encompasses cells with internalized particles as well as those with bound (non-
internalized) particles (Figure 3.1 D). Importantly, binding and internalization can
have drastically different immunity outcomes. For example, only internalized
pathogens within the maturing phagosome will be subjected to the potent
intracellular killing mechanisms that characterize the phagocytosis process.
3.2.2 Multi-spectral imaging flow cytometry can help to overcome the limits
of previous assays, while maintaining their strengths.
The ImageStream 100 and mkII multi-spectral imaging flow cytometers
combine features of both conventional flow cytometry and fluorescence
microscopy, produces simultaneous images of each cell (four (IS100) or six
(ISmkII) fluorescent channels, brightfield and side-scatter) and can image over 100
cells per second (11, 12). This allows for analysis of a population of cells in a
statistically robust manner within a few minutes.
RAW 264.7 macrophage and Jurkat T cells lines were co-incubated with
FITC-labeled zymosan for two hours, similarly to the flow cytometry-based
method. Following the incubation, cells were stained with anti-mouse CD45, which
selectively labels RAW 264.7 macrophages, as described above. Subsequently,
RAW 264.7 macrophage (CD45+) and Jurkat T cell (CD45-) populations were
analyzed for zymosan fluorescence and phagocytosis, and produced dot plot
165
profiles equivalent to those shown above (Figure 3.2 A). In conventional flow
cytometry, all cells in the FITC+ population would be considered phagocytic.
However, as shown in Figures 3.2 A and 3.1 D, this population includes cells with
internalized zymosan and as well as those with surface bound (i.e. non-
internalized) zymosan. Using IDEAS software, a mask was created to identify the
cellular membrane. This mask allowed differentiation between internalized (degree
of internalization greater than 0) and bound (degree of internalization less than 0)
zymosan particles in the X-Y axis (Figure 3.2 B). By gating on the population with
a positive degree of internalization, I was able to remove cells with surface-bound
particles from subsequent analysis, which was not possible with conventional flow
cytometry. The degree of focus of the zymosan particles was then analyzed to
remove surface bound zymosan in the Z-axis (Figure 3.2 C), a feature absent even
in microscopy-based assays, which only provide spatial resolution in the X-Y axis.
Zymosan bound outside of the X-Y plane of the cell image appears out of focus
relative to the stained nucleus (i.e. in front or behind the plasma membrane
boundaries of the cell [Z-axis]). While not as accurate as a confocal microscopy Z-
stack, this method still allows clear distinction between internalized and surface
bound (non-internalized) particles on the Z-axis because of digital-based
quantitation of relative object focus (particle versus cell nucleus). The population
of cells remaining after these two gating steps (X-Y axis and Z-axis) encompasses
those with “true” phagocytosis, as all particles are internalized (Figure 3.2 D). This
provides a more reliable approach for analysis of phagocytosis and generates
statistically robust analyses in a relatively short amount of time. There is minimal
166
fluorochrome bleaching when compared to fluorescent microcopy-based
approaches (and even superior to that found in flow cytometry) because of the
mechanics of signal acquisition within the flow cell. Once gates are defined,
IDEAS software can easily differentiate between internalized and bound particles.
Finally, this phagocytosis analysis can be coupled with evaluation of
morphological markers provided through the ImageStream platform (over 150
potential markers including size, nuclear morphology, nuclear: cytoplasmic ratios,
and others). This is particularly relevant for comparative animal model systems
where reagent availability (e.g. antibodies against surface or intracellular markers)
often lags significantly behind the availability for murine/human models.
Importantly, particle-binding events can also be quantified, thus providing an
additional important parameter for the characterization of phagocytic responses.
For example, this can provide a functional indicator of phagocytic receptor
expression at the cell surface. As such, this approach has the potential to allow for
more detailed characterization of phagocytic responses and the role that these
events have on host antimicrobial mechanisms.
3.2.3 RAW 264.7 macrophage activation preferentially enhances binding
and not internalization of zymosan.
Activation of RAW 264.7 macrophages has previously been shown to
increase phagocytosis (13, 14). As a first step in the validation of the ImageStream-
based phagocytosis assay I sought to examine if this increase in phagocytosis may
be partially due to an increased capacity for particle binding during the phagocytic
167
response. To this end, I studied the effect of LPS stimulation on surface binding
and internalization of zymosan particles in RAW 264.7 macrophages. RAW 264.7
cells were activated for 24 hrs with 100 ng/mL ultrapure E. coli LPS. Cells were
then incubated with either a 3:1 or 5:1 ratio of zymosan for 2 hours. Surface
binding and internalization were analyzed as described above. As expected, I found
that LPS stimulation resulted in an overall increase in the number zymosan-
positive cells (Figure 3.3). However, this increase in zymosan positivity was not
associated with “true” phagocytosis but a combinatorial effect of an increase in
both binding and internalization. In fact, surface binding was the primary
contributor to this increase following LPS-driven activation. The increase in
surface-binding appeared to be independent of the cell: zymosan ratio (Figure 3.3).
It is likely that increased binding was due to an upregulation of surface phagocytic
receptors during cellular activation. Alternatively, it may reflect increased
“stickiness” of cells following activation, largely due to the upregulation of
receptors involved in the phagocytic process.
3.2.4 Goldfish PKMs differentially upregulate phagocytosis in response to
activation with host and pathogen derived factors.
It has been previously shown that goldfish kidney-derived hematopoietic
progenitors develop along the macrophage lineage in vitro through three well
defined stages of differentiation: early progenitors, monocytes and mature
macrophages (8, 15). Each of these three unique primary kidney macrophage
(PKM) subpopulations displays unique forward- and side-scatter profiles,
168
morphological features, gene expression profiles and functional capacities (8, 15,
16). Based on conventional flow cytometry profiles these subpopulations are
defined as early progenitor cells (R1-gate), monocytes (R3-gate) and mature
macrophages (R2-gate) (15, 16). However, it was unknown the extent to which
each subset contributed to the phagocytic response. As such, I decided to examine
this antimicrobial response taking advantage of my novel imaging flow cytometer-
based assay. Firstly, ImageStream analysis identified these three PKM
subpopulations based on cellular area and side scatter intensity, consistent with
previous conventional flow cytometry-based analyses (Figure 3.4 A). In addition,
in situ morphological examination of cellular events in each of the ImageStream-
defined gates showed morphological features that were consistent with those of
FACS-sorted PKM subsets (15).
PKM cultures in the proliferative phase of growth were activated for 6- and
48-hours with macrophage activating factors (MAF) and 1 μg/mL E. coli LPS.
Following activation, cells were incubated with zymosan-FITC at a ratio of 5:1
(zymosan: cells) for 2 hours at 20oC. Phagocytosis was analyzed as described
above. I focused on true particle internalization events since my goal was to
correlate these with the activation of downstream intracellular antimicrobial
responses. Under basal levels of activation, monocytes and mature macrophages
were the predominant phagocytic populations, while early progenitor cells had very
low levels of phagocytosis under both basal and activated conditions (Figure 3.4
B). Mature macrophages displayed greater basal capacity for phagocytosis when
compared to the less differentiated monocytes (49% vs 34%, respectively).
169
Following 6-hours MAF/LPS activation, cells in the monocyte population
significantly increased their phagocytic capacity. This was further increased after
48-hours of activation. In contrast to monocytes, 6-hour MAF/LPS activation did
not significantly increase the capacity for phagocytosis among mature
macrophages above basal levels. However, after 48 hours of MAF/LPS activation
PKM mature macrophages significantly increased their phagocytic capacity by 136
percent. This increase was coupled with a significant increase in the phagocytic
index, which was not observed among cells of the monocyte population (Figure 3.4
C). Phagocytic index was defined as the measure of the average number of
particles ingested per phagocyte. As such, these results suggest a segregation of
phagocytic antimicrobial responses along the teleost macrophage lineage, and
highlight the potential for differential contributions of each of these macrophage
differentiation stages to host-pathogen interactions.
3.2.5 PKM mature macrophages and not monocytes display an increased
capacity for the production of reactive oxygen species following
activation.
Reactive oxygen species (ROS) have long been recognized as a crucial
component of host defense and provide a high degree of toxicity against
phagocytosed microorganisms (17). ROS production during the respiratory burst
can be detected using dihydrorhodamine (DHR), based on the oxidization of DHR
into fluorescent rhodamine (18). This provides a useful tool for the characterization
of the respiratory burst assays in phagocytic cells (e.g. mammalian neutrophils),
170
and has been shown to have a high degree of correlation with alternative
approaches such as the nitrobluetetrazolium (NBT) assay (18). The DHR assay has
also been successfully applied to study respiratory burst in teleost fish cells (19).
In control experiments, I examined the respiratory burst in mixed cultures of
LPS activated RAW 264.7 macrophages and Jurkat T cells. As shown previously
(20), I found that LPS activation led to an increased respiratory burst in RAW
264.7 macrophage, but not Jurkat T cells (Figure 3.5 A). Previous experiments
showed that sorted monocytes and mature macrophages from PKM in vitro
cultures had different kinetics of respiratory burst induction following activation
(15). However, these analyses were limited to FACS-sorted populations of cells. In
order to examine the potential for cross-talk among PKM subpopulations, I applied
the DHR assay to study the induction of ROS production in mixed PKM cultures.
Following activation with MAF/LPS for 6- or 48-hours, cells were loaded with
DHR and respiratory burst was triggered with PMA. Similarly to previous reports
on sorted populations (15), I found that monocytes in mixed PKM cultures had a
strong early activation of respiratory burst that was significantly reduced with
prolonged (48-hour) MAF/LPS stimulation (Figure 3.5 B). The original increase by
6 hours mirrored the relative capacity of this population to increase its phagocytic
capacity in response to MAF/LPS (see above). The mature macrophage population
had increased ROS production after 6-hour MAF/LPS stimulation that was further
increased after 48-hour activation. Importantly, higher basal levels of phagocytosis
among PKM mature macrophages were not associated with equivalent higher basal
levels of ROS production (Figure 3.4 B versus 3.5 B). This suggests that non-
171
activated teleost mature macrophages have an increased capacity for phagocytosis
compared to the less mature monocytes; however, this does not appear to be linked
to an increased basal capacity for killing through ROS-mediated mechanisms. In
contrast to PKM monocytes and mature macrophages, early progenitor cells had
low levels of ROS production that were not affected by MAF/LPS activation.
The similarity in the kinetics of ROS induction in both sorted and mixed cell
populations suggests that induction of protective anti-microbial responses in these
fish are intrinsically regulated by each of these two macrophage subsets. There was
no apparent crosstalk among these subsets under the conditions that were
examined. Interestingly, for the mature macrophage subset, the induction of anti-
microbial respiratory burst responses follows similar kinetics to that observed for
phagocytosis. In contrast, monocytes see a decrease in respiratory burst capacity
despite continued increase in phagocytosis from 6 to 48 hours. This suggests that
phagocytosis and respiratory burst may represent complementary but not
interdependent mechanisms among the antimicrobial armament available to cells of
the macrophage lineage in these teleost fish, drawing parallels to previously
defined phagocytic and antimicrobial responses of mammalian monocytes and
macrophages (21-24). This points to a strong conservation of these responses
across evolution.
3.2.6 PKM monocytes and mature macrophages display a differential
capacity for phagolysosome fusion under basal and immune
challenged conditions.
172
Phagolysosome fusion is a central contributor to the degradation of
internalized particles during a phagocytic response. Classically, phagolysosome
fusion has been studied by cell disruption followed by differential gradient
centrifugation to isolate highly purified phagolysosomes (25) or by confocal
microscopy (26). Recently, flow cytometry-based assays have been developed for
quantification of phagolysosomes in cell lysates (27). While this flow cytometry-
based approach can provide information on the composition and maturation of
phagosomes based on differential expression of markers, there is currently no assay
that allows quantitation of phagolysosomes within an intact cell. Herein, I show the
development of such an assay, taking advantage of the speed, spatial resolution and
detection sensitivity of the ImageStream multispectral imaging flow cytometry
system. As with the approaches described above, this assay can take advantage of
cellular markers (e.g. antibody, cytochemical, and/or morphological-based
markers) to define specific cellular subsets. This opens the door for the
examination of antimicrobial phagocytic events in mixed cell populations, and
thereby allows for the identification and characterization of paracrine cross-talk
events between defined cellular subsets.
Initial pulsing of cells with dextran-FITC allows detection of
phagolysosomes based on the high affinity of this molecule for acidic lysosomes
(28, 29). Briefly, in the absence of phagocytosis, lysosomes are distributed
throughout the cell leading to a punctuate staining pattern based on this staining
procedure. Upon internalization, lysosomes migrate towards the phagosome, fuse
with the phagosome and form a degradative phagolysosome. My approach is based
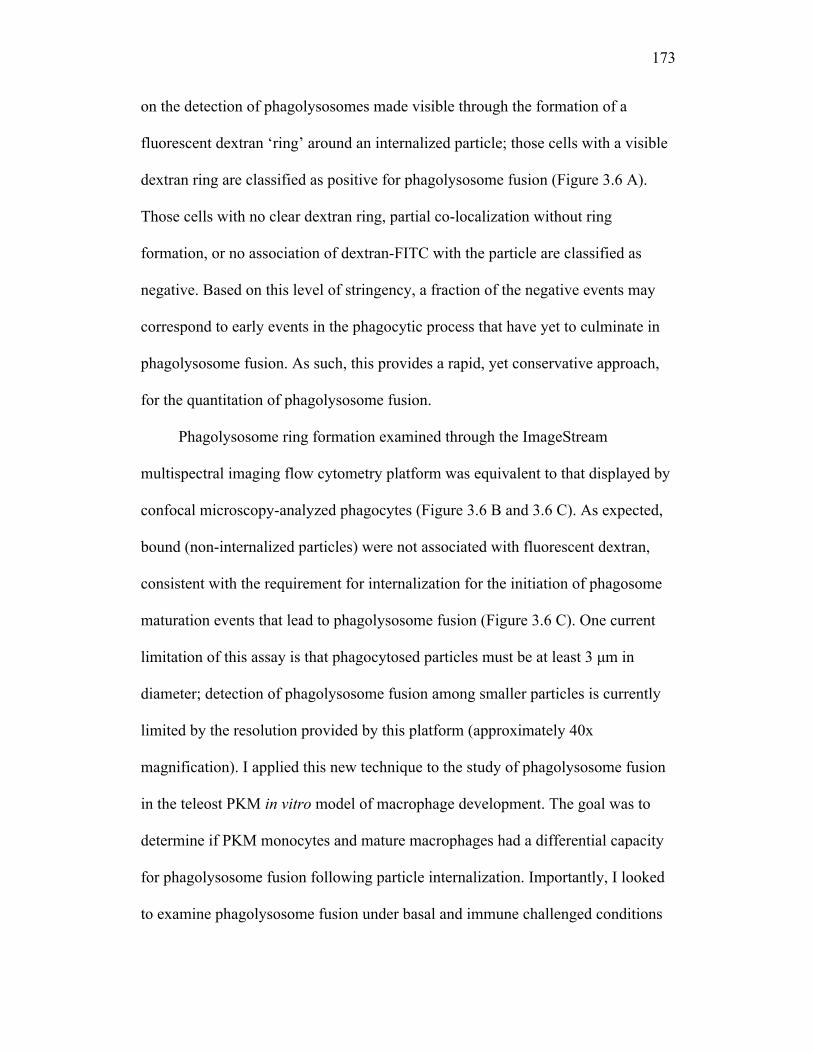
173
on the detection of phagolysosomes made visible through the formation of a
fluorescent dextran ‘ring’ around an internalized particle; those cells with a visible
dextran ring are classified as positive for phagolysosome fusion (Figure 3.6 A).
Those cells with no clear dextran ring, partial co-localization without ring
formation, or no association of dextran-FITC with the particle are classified as
negative. Based on this level of stringency, a fraction of the negative events may
correspond to early events in the phagocytic process that have yet to culminate in
phagolysosome fusion. As such, this provides a rapid, yet conservative approach,
for the quantitation of phagolysosome fusion.
Phagolysosome ring formation examined through the ImageStream
multispectral imaging flow cytometry platform was equivalent to that displayed by
confocal microscopy-analyzed phagocytes (Figure 3.6 B and 3.6 C). As expected,
bound (non-internalized particles) were not associated with fluorescent dextran,
consistent with the requirement for internalization for the initiation of phagosome
maturation events that lead to phagolysosome fusion (Figure 3.6 C). One current
limitation of this assay is that phagocytosed particles must be at least 3 μm in
diameter; detection of phagolysosome fusion among smaller particles is currently
limited by the resolution provided by this platform (approximately 40x
magnification). I applied this new technique to the study of phagolysosome fusion
in the teleost PKM in vitro model of macrophage development. The goal was to
determine if PKM monocytes and mature macrophages had a differential capacity
for phagolysosome fusion following particle internalization. Importantly, I looked
to examine phagolysosome fusion under basal and immune challenged conditions
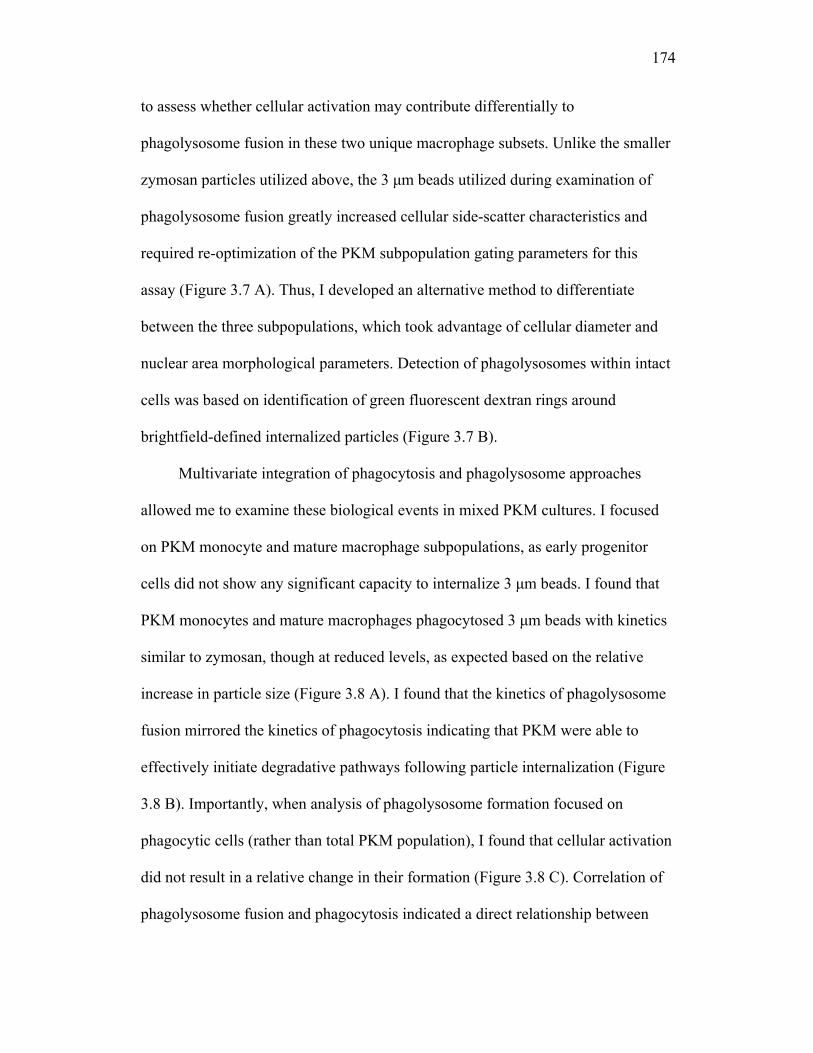
174
to assess whether cellular activation may contribute differentially to
phagolysosome fusion in these two unique macrophage subsets. Unlike the smaller
zymosan particles utilized above, the 3 μm beads utilized during examination of
phagolysosome fusion greatly increased cellular side-scatter characteristics and
required re-optimization of the PKM subpopulation gating parameters for this
assay (Figure 3.7 A). Thus, I developed an alternative method to differentiate
between the three subpopulations, which took advantage of cellular diameter and
nuclear area morphological parameters. Detection of phagolysosomes within intact
cells was based on identification of green fluorescent dextran rings around
brightfield-defined internalized particles (Figure 3.7 B).
Multivariate integration of phagocytosis and phagolysosome approaches
allowed me to examine these biological events in mixed PKM cultures. I focused
on PKM monocyte and mature macrophage subpopulations, as early progenitor
cells did not show any significant capacity to internalize 3 μm beads. I found that
PKM monocytes and mature macrophages phagocytosed 3 μm beads with kinetics
similar to zymosan, though at reduced levels, as expected based on the relative
increase in particle size (Figure 3.8 A). I found that the kinetics of phagolysosome
fusion mirrored the kinetics of phagocytosis indicating that PKM were able to
effectively initiate degradative pathways following particle internalization (Figure
3.8 B). Importantly, when analysis of phagolysosome formation focused on
phagocytic cells (rather than total PKM population), I found that cellular activation
did not result in a relative change in their formation (Figure 3.8 C). Correlation of
phagolysosome fusion and phagocytosis indicated a direct relationship between
175
these two processes (R2= 0.87). However, I found no change in response to cellular
activation, in both monocyte and mature macrophage PKM subpopulations.
Interestingly, the monocyte population had a greater capacity for phagolysosome
formation compared to the mature macrophage subset, as phagocytic monocytes
had a 1.5-fold greater incidence of phagolysosome fusion when compared to PKM
mature macrophages.
3.3 Discussion
The wide conservation of phagocytosis in metazoans highlights its critical
importance as a first line of defense against invading microbes. Pathogen
engagement of a finite set of receptors on the phagocyte cell surface leads to the
induction of phagocytic cascades, the activation of potent killing mechanisms, and
the rapid expansion of pro-inflammatory programs. Despite the importance of these
immune defense mechanisms to host integrity, current technologies have
significant limitations in their ability to accurately quantitate receptor binding and
particle internalization events during phagocytosis. This is particularly prominent
in comparative model systems where reagent availability, such as cellular markers,
has limited their characterization. In this chapter, I described a novel alternative for
the characterization of phagocytosis and downstream intracellular events. My
approach was based on a multi-spectral imaging flow cytometry platform and
allowed for accurate discrimination between internalized and surface-bound
particles. Rapid sample acquisition allowed the generation of robust data sets that
brought forward discrete changes in particle binding and internalization. This
176
opens the door for multi-parametric analysis of phagocytosis and downstream anti-
microbial responses within mixed cell populations and allows users to examine
segregation of responses following both binding and internalization steps during
the phagocytic cascade.
Macrophages provide a unique population of phagocytes known to efficiently
mount phagocytic antimicrobial responses at distinct tissue sites. In teleost fish,
macrophages have long been recognized as effective phagocytes (15, 30-37).
However, it has remained unclear whether the heterogeneity displayed within these
teleost macrophage populations may be a result of a differential capacity for
induction of phagocytic responses as cells mature from early hematopoietic
progenitors. To this end, I focused this chapter on a well-characterized goldfish
primary kidney macrophage (PKM) model, whose distinct stages of macrophage
maturation (early progenitors, monocytes, and mature macrophages) have been
previously defined based on morphological, cytochemical, gene expression, and
functional characteristics (15, 38-41). Utilizing my novel approach, I was able to
examine discrete functional events along the phagocytic cascade in a mixed
population of cells. This minimized the undesirable higher levels of basal
activation that are often found in highly manipulated (e.g. mechanically sorted)
populations of cells and allowed me to identify potential cross-talk between these
three distinct macrophage subsets. I found that both monocyte and mature
macrophage PKM subsets were highly phagocytic but had differential kinetics for
induction of phagocytosis in response to activation by pathogen- and host-derived
factors. Unlike the more differentiated subsets, early progenitors appeared to have a
177
very limited capacity for phagocytosis and induction of killing responses. This is
consistent with macrophage phagocytic responses in higher vertebrates where
phagocytosis appears to be associated with the more differentiated stages along the
macrophage pathway (42-45). I found that the greatest capacity for phagocytosis
displayed by the mature macrophage subset was most evident following
examination of its phagocytic index, and not simply that of the percent of
phagocytic cells.
The mature macrophage PKM subset displayed very good correlation
between phagocytosis, the induction of phagolysosome fusion, and the production
of reactive oxygen species (ROS). This was consistent with the induction of
effective degradative and killing mechanisms following pathogen internalization,
and likely reflects an increased impetus to tightly link antimicrobial mechanisms
following immune challenge. Interestingly, in the absence of MAF/LPS, I found
that mature macrophages had high basal levels of phagocytosis despite displaying a
low capacity for phagolysosome formation and ROS production. As such, my
results show the increased efficiency of PKM mature macrophages to couple
phagocytosis and downstream degradative/killing responses upon cell activation.
Unfortunately, these results also highlight intrinsic disadvantages to the original
uncoupling of these mechanisms under basal conditions. One could envision
situations in the early phases of pathogen infiltration where teleost tissue
macrophages may be able to efficiently internalize incoming pathogens, but lack
the capacity to initiate subsequent degradative and killing responses. This could
lead to an increased incidence of pathogen spread, particularly in the case of those
178
that can thrive within macrophages, as well as a decreased capacity to process
antigens required for effective antigen presentation (46, 47). Similar scenarios
could stem from host- or pathogen-driven events that promote anti-inflammatory
conditions. PKM monocytes also showed such disconnect between phagocytosis
and downstream intracellular degradative/killing events. In the context of increased
vulnerability to pathogen infiltration, however, this may be less relevant in vivo for
this population as monocytes entering an inflammatory site should be pre-activated
through growing interactions with chemokine gradients, activated vascular
epithelium, and an inflammatory milieu at the infection site (48). An alternative
hypothesis to the uncoupling of phagocytosis and downstream antimicrobial
mechanisms may reflect a host-evolved compartmentalization of macrophage
responses under basal and immune-challenged conditions. The low capacity to
couple phagocytosis and downstream inflammatory mechanisms among PKM
monocytes and mature macrophages may serve to promote homeostaticly relevant
(rather than antimicrobial focused) phagocytic events under basal conditions. In
one example, macrophages could effectively uptake spent host cells and contribute
to normal tissue turnover under controlled conditions that do not promote
inflammation and surrounding tissue damage (49, 50). This would provide a host-
driven strategy for effective segregation of antimicrobial and homeostatic roles
within the lower vertebrate macrophage compartment. It remains to be determined
whether both positive and negative implications of this uncoupling observed under
non-challenged conditions may be reflected in vivo.
179
The kinetics for phagocytosis and downstream degradative/killing responses
also differed between monocyte and mature macrophage PKM subsets upon
activation. This further suggests specialization within the macrophage lineage early
in evolution and may contribute to meeting specific requirements for each of these
populations within their specialized niches. The mature macrophage subset saw a
progressive increase in its capacity for phagocytosis, phagolysosome fusion, and
induction of the respiratory burst over a 48-hour activation period with MAF/LPS.
In contrast, monocytes displayed examples of uncoupling between phagocytosis
and downstream antimicrobial responses: although this PKM subset saw an
increased capacity for zymosan internalization over a 48-hour period, it also
showed a significant decrease in ROS production between 6 and 48 hours. Notably,
my current results are consistent with previous observations based on FACS-sorted
monocyte and mature macrophage PKM subpopulations (15). This study took
advantage of the more traditional NBT method for examination of ROS production.
It found that sorted monocytes displayed maximum ROS production after 6 hours
of MAF/LPS stimulation followed by a significant subsequent decrease by 48
hours. This de-priming effect was most notable in monocytes stimulated with LPS
only. In contrast, mature macrophages showed a progressive increase in ROS
producing capacity over the prolonged 48-hour observation period. One possibility
is that PKM monocytes have yet to develop the functional antimicrobial robustness
exhibited by cells of the more differentiated mature macrophage PKM subset.
Another possibility is that PKM monocytes may share some functional responses
to LPS with mammalian monocytes destined for a myeloid dendritic cell (DC)
180
phenotype. In mammals, monocytes progressing towards the myeloid DC
maturation path shift between a phagocytic internalization-focused phenotype in
the absence of LPS, to one geared for effective antigen processing/presentation
following LPS stimulation (51-54). It remains unclear whether such phenotype
may be partially reflected in PKM cultures.
As with ROS responses, phagolysosome fusion provides an important
mechanism for degradation of internalized pathogens (55, 56). In this chapter, I
also examined the differential capacity of phagocyte subsets to form
phagolysosomes following particle internalization. This novel approach also allows
for quantification of phagolysosome fusion among mixed populations of cells. I
found that both the monocyte and mature macrophage populations had an increased
proportion of cells with fused phagolysosomes following activation, which
followed the same proportional increase as phagocytosis in these populations. In
this context, it is clear that teleost fish macrophages acquire the capacity to form
phagolysosomes following activation, which parallels a progressive increase in
their capacity for pathogen internalization. However, when the phagolysosome
fusion was studied in the context of the phagocytic cells populations, I found that
activation had no effect on phagolysosome fusion on a per cell basis. In other
words, the increase in phagolysosome fusion following activation appeared to stem
from an overall increase in phagocytosis and was not due to a greater capacity of
individual activated phagocytic cells to form phagolysosomes. Further, I showed
that monocytes have an increased capacity for phagolysosome fusion compared to
mature macrophages. This is also in keeping with the idea that these monocytes
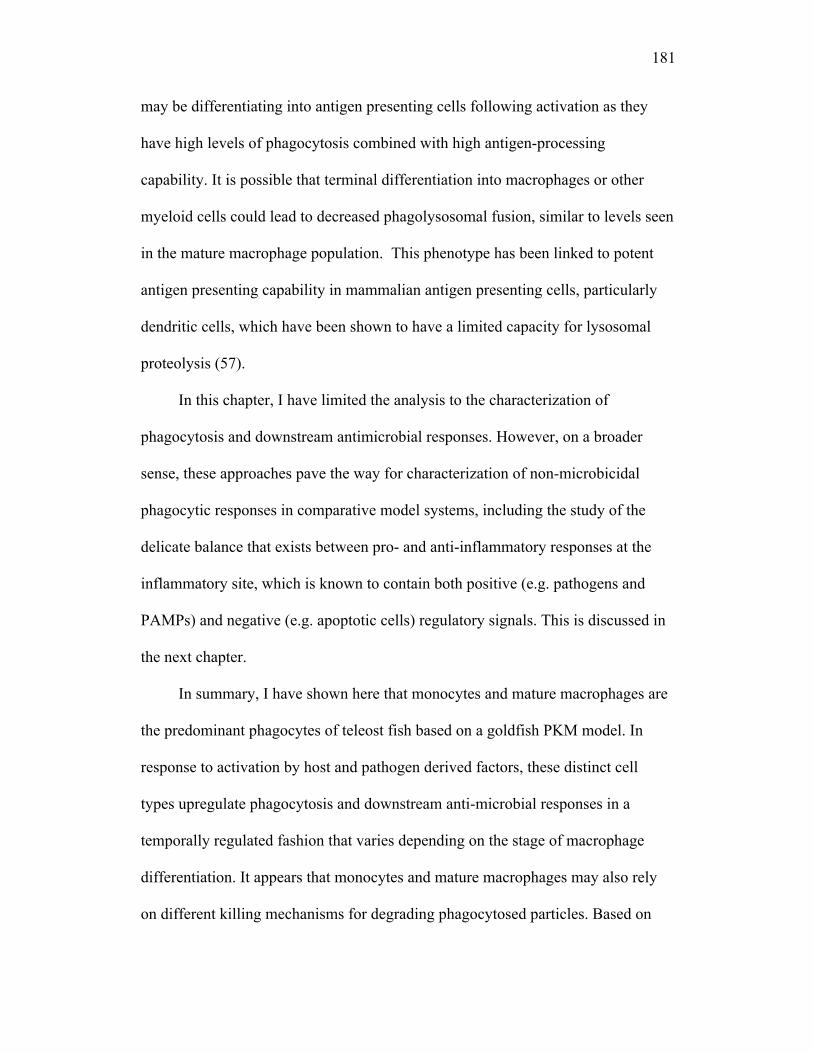
181
may be differentiating into antigen presenting cells following activation as they
have high levels of phagocytosis combined with high antigen-processing
capability. It is possible that terminal differentiation into macrophages or other
myeloid cells could lead to decreased phagolysosomal fusion, similar to levels seen
in the mature macrophage population. This phenotype has been linked to potent
antigen presenting capability in mammalian antigen presenting cells, particularly
dendritic cells, which have been shown to have a limited capacity for lysosomal
proteolysis (57).
In this chapter, I have limited the analysis to the characterization of
phagocytosis and downstream antimicrobial responses. However, on a broader
sense, these approaches pave the way for characterization of non-microbicidal
phagocytic responses in comparative model systems, including the study of the
delicate balance that exists between pro- and anti-inflammatory responses at the
inflammatory site, which is known to contain both positive (e.g. pathogens and
PAMPs) and negative (e.g. apoptotic cells) regulatory signals. This is discussed in
the next chapter.
In summary, I have shown here that monocytes and mature macrophages are
the predominant phagocytes of teleost fish based on a goldfish PKM model. In
response to activation by host and pathogen derived factors, these distinct cell
types upregulate phagocytosis and downstream anti-microbial responses in a
temporally regulated fashion that varies depending on the stage of macrophage
differentiation. It appears that monocytes and mature macrophages may also rely
on different killing mechanisms for degrading phagocytosed particles. Based on
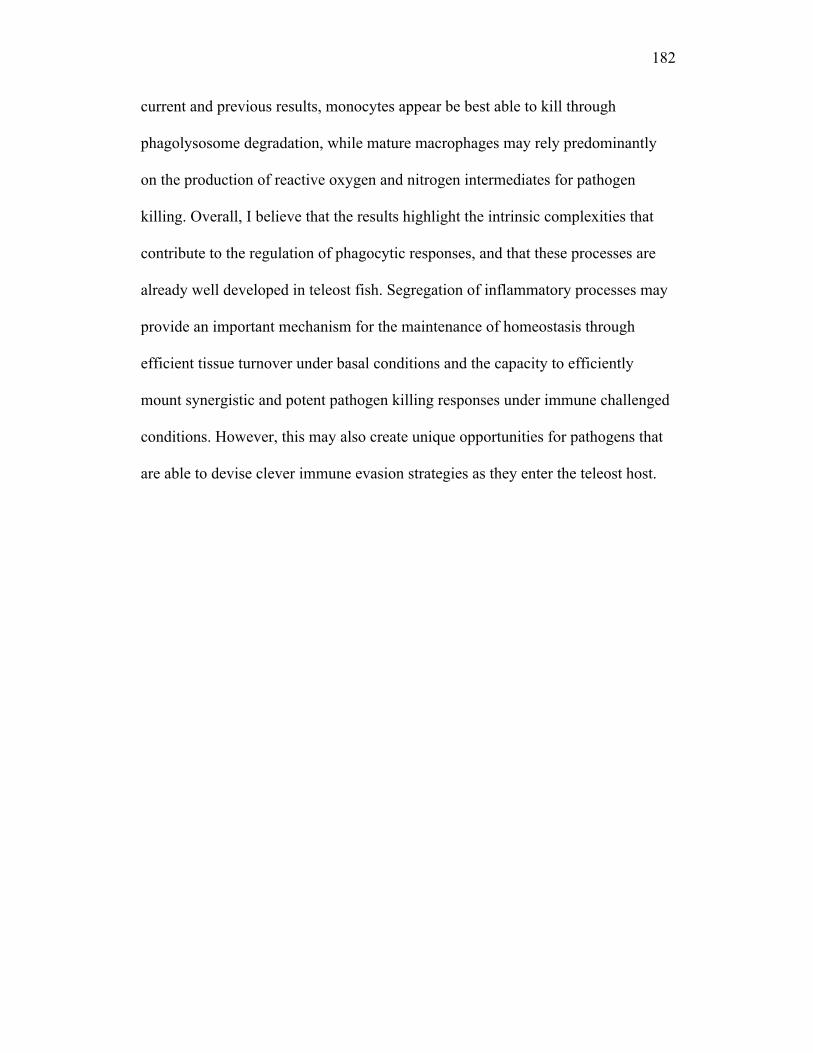
182
current and previous results, monocytes appear be best able to kill through
phagolysosome degradation, while mature macrophages may rely predominantly
on the production of reactive oxygen and nitrogen intermediates for pathogen
killing. Overall, I believe that the results highlight the intrinsic complexities that
contribute to the regulation of phagocytic responses, and that these processes are
already well developed in teleost fish. Segregation of inflammatory processes may
provide an important mechanism for the maintenance of homeostasis through
efficient tissue turnover under basal conditions and the capacity to efficiently
mount synergistic and potent pathogen killing responses under immune challenged
conditions. However, this may also create unique opportunities for pathogens that
are able to devise clever immune evasion strategies as they enter the teleost host.
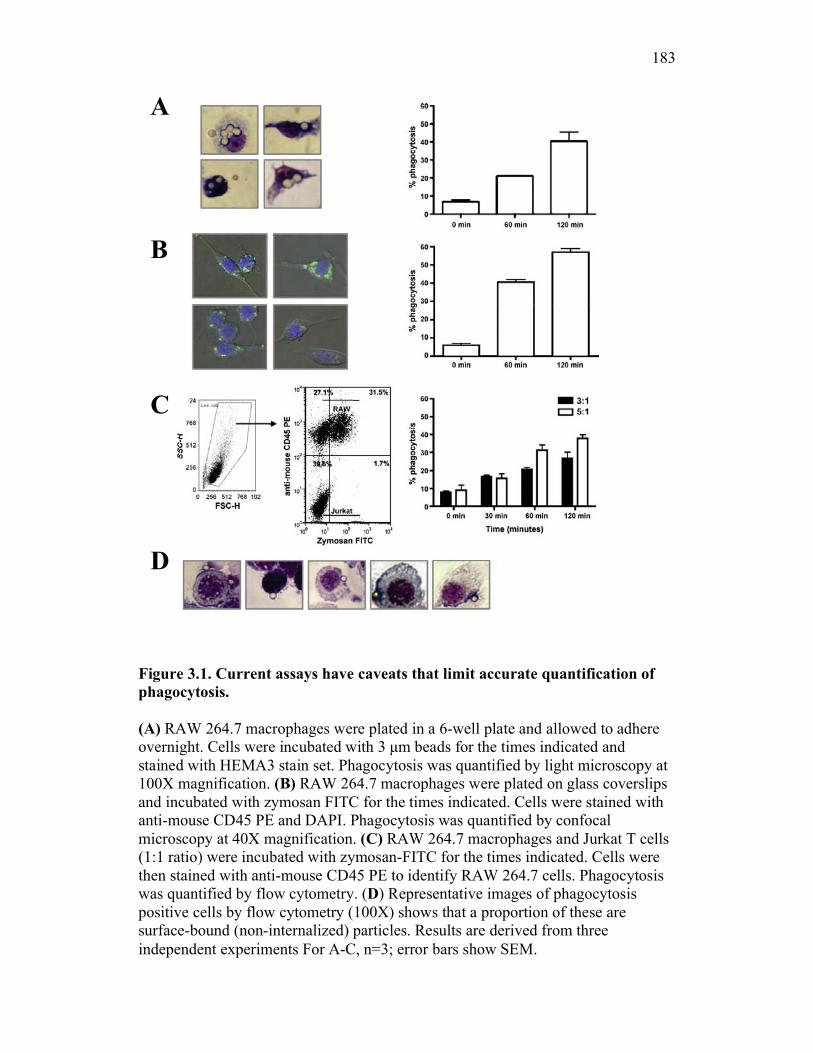
183
Figure 3.1. Current assays have caveats that limit accurate quantification of phagocytosis. (A) RAW 264.7 macrophages were plated in a 6-well plate and allowed to adhere overnight. Cells were incubated with 3 μm beads for the times indicated and stained with HEMA3 stain set. Phagocytosis was quantified by light microscopy at 100X magnification. (B) RAW 264.7 macrophages were plated on glass coverslips and incubated with zymosan FITC for the times indicated. Cells were stained with anti-mouse CD45 PE and DAPI. Phagocytosis was quantified by confocal microscopy at 40X magnification. (C) RAW 264.7 macrophages and Jurkat T cells (1:1 ratio) were incubated with zymosan-FITC for the times indicated. Cells were then stained with anti-mouse CD45 PE to identify RAW 264.7 cells. Phagocytosis was quantified by flow cytometry. (D) Representative images of phagocytosis positive cells by flow cytometry (100X) shows that a proportion of these are surface-bound (non-internalized) particles. Results are derived from three independent experiments For A-C, n=3; error bars show SEM.
A
D
C
B
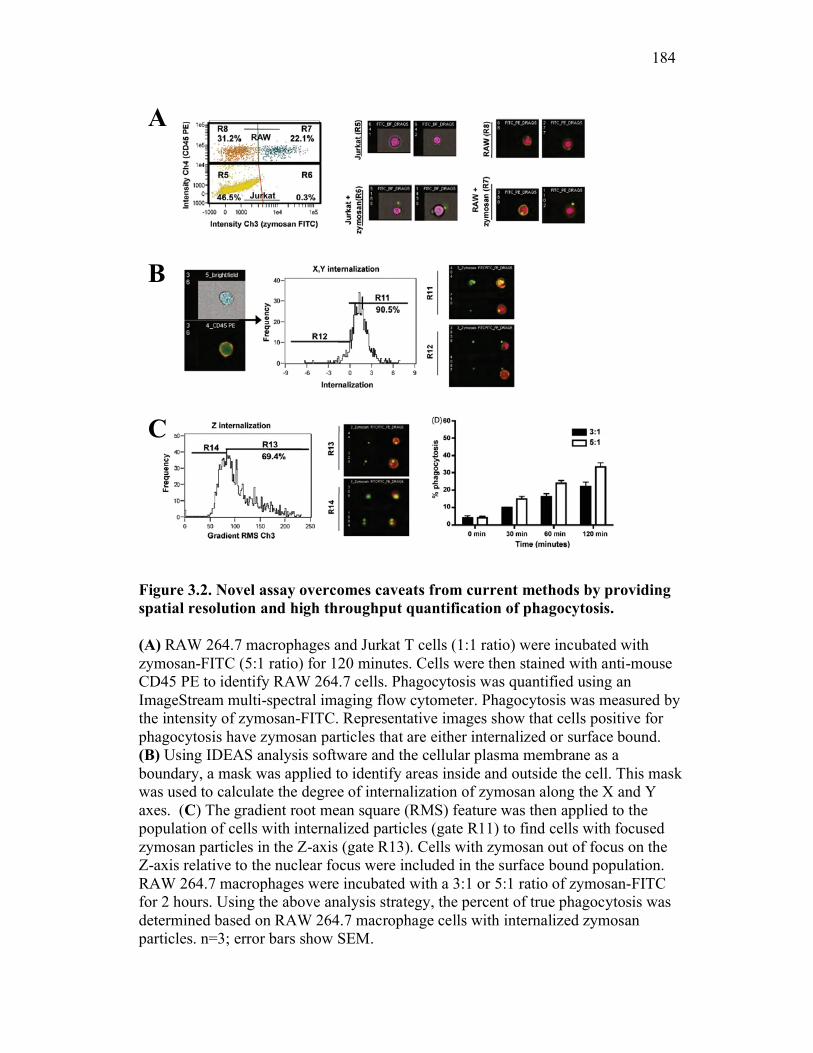
184
Figure 3.2. Novel assay overcomes caveats from current methods by providing spatial resolution and high throughput quantification of phagocytosis. (A) RAW 264.7 macrophages and Jurkat T cells (1:1 ratio) were incubated with zymosan-FITC (5:1 ratio) for 120 minutes. Cells were then stained with anti-mouse CD45 PE to identify RAW 264.7 cells. Phagocytosis was quantified using an ImageStream multi-spectral imaging flow cytometer. Phagocytosis was measured by the intensity of zymosan-FITC. Representative images show that cells positive for phagocytosis have zymosan particles that are either internalized or surface bound. (B) Using IDEAS analysis software and the cellular plasma membrane as a boundary, a mask was applied to identify areas inside and outside the cell. This mask was used to calculate the degree of internalization of zymosan along the X and Y axes. (C) The gradient root mean square (RMS) feature was then applied to the population of cells with internalized particles (gate R11) to find cells with focused zymosan particles in the Z-axis (gate R13). Cells with zymosan out of focus on the Z-axis relative to the nuclear focus were included in the surface bound population. RAW 264.7 macrophages were incubated with a 3:1 or 5:1 ratio of zymosan-FITC for 2 hours. Using the above analysis strategy, the percent of true phagocytosis was determined based on RAW 264.7 macrophage cells with internalized zymosan particles. n=3; error bars show SEM.
A
C
B
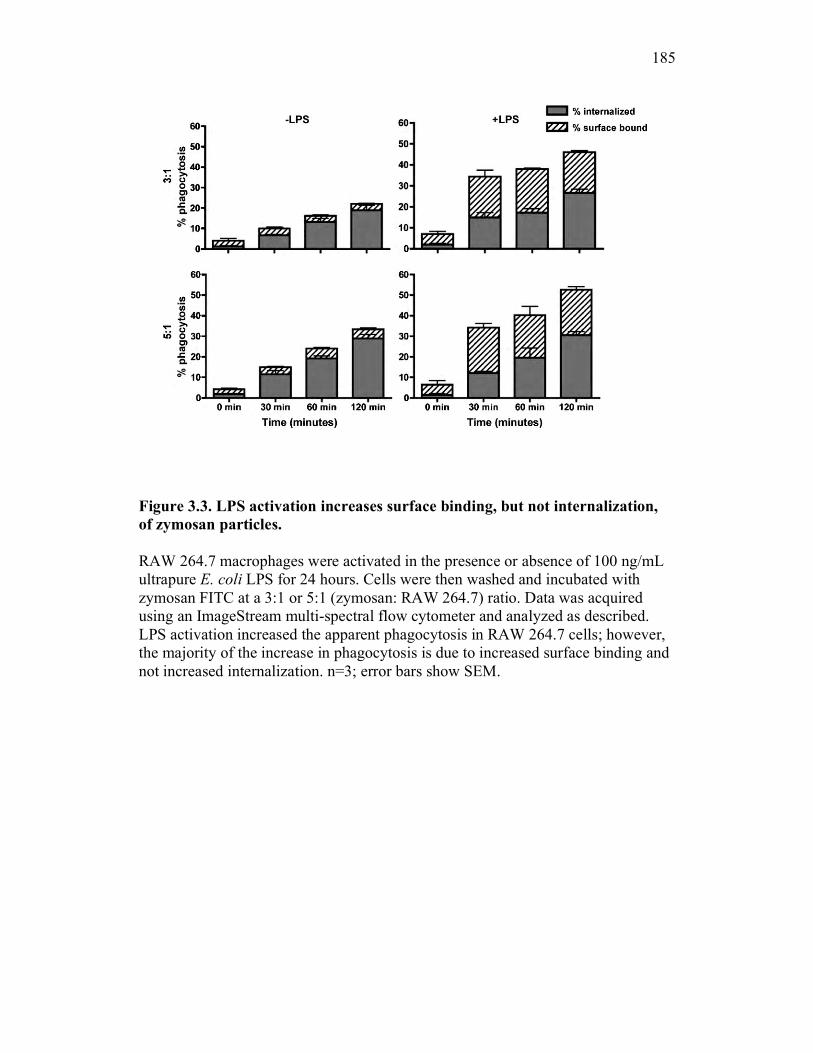
185
Figure 3.3. LPS activation increases surface binding, but not internalization, of zymosan particles. RAW 264.7 macrophages were activated in the presence or absence of 100 ng/mL ultrapure E. coli LPS for 24 hours. Cells were then washed and incubated with zymosan FITC at a 3:1 or 5:1 (zymosan: RAW 264.7) ratio. Data was acquired using an ImageStream multi-spectral flow cytometer and analyzed as described. LPS activation increased the apparent phagocytosis in RAW 264.7 cells; however, the majority of the increase in phagocytosis is due to increased surface binding and not increased internalization. n=3; error bars show SEM.
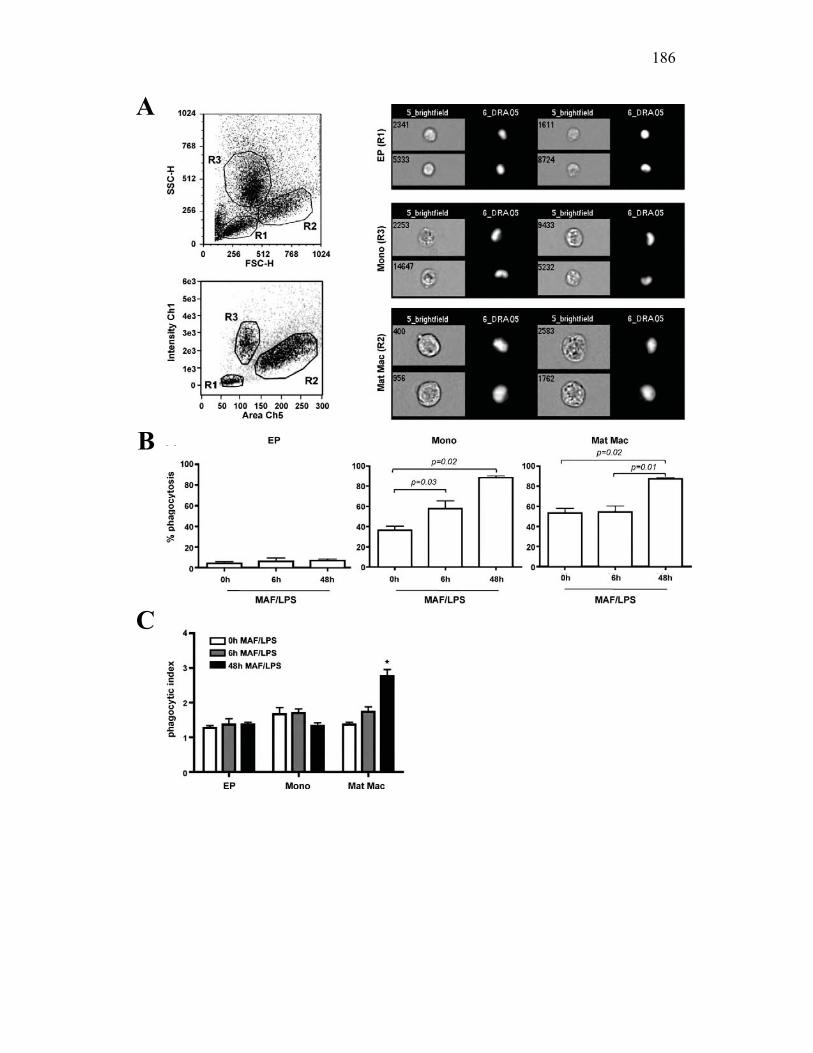
186
A
C
B
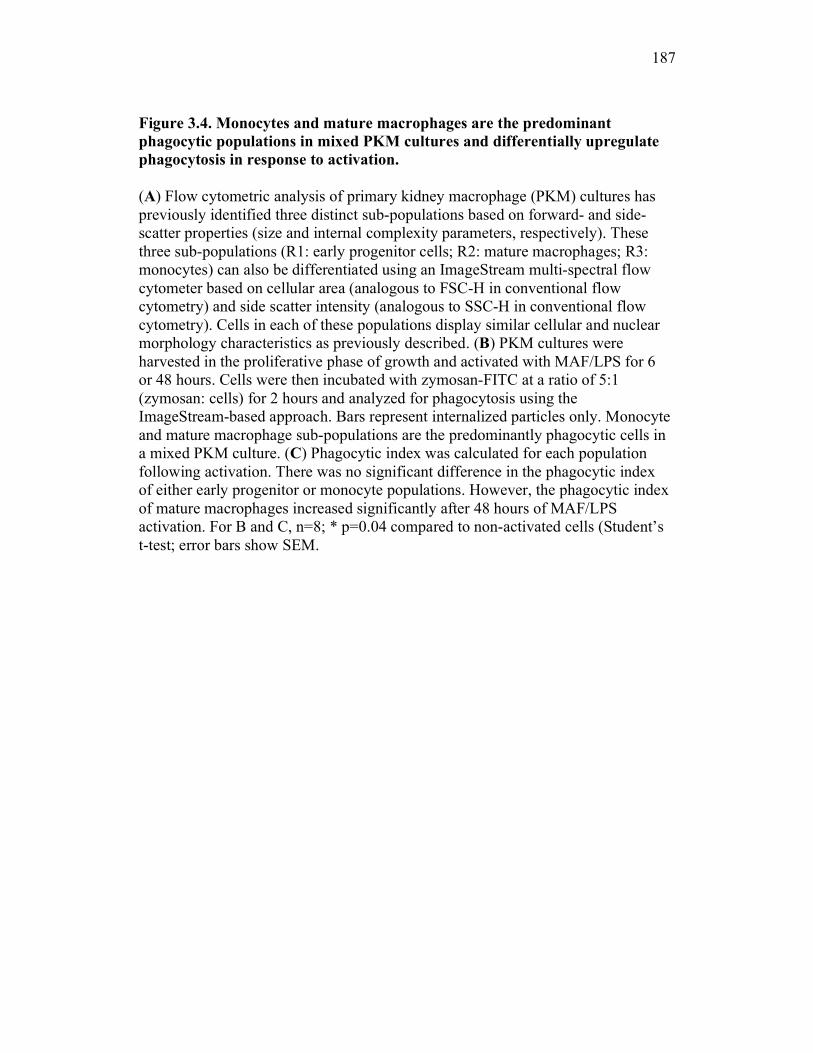
187
Figure 3.4. Monocytes and mature macrophages are the predominant phagocytic populations in mixed PKM cultures and differentially upregulate phagocytosis in response to activation. (A) Flow cytometric analysis of primary kidney macrophage (PKM) cultures has previously identified three distinct sub-populations based on forward- and side-scatter properties (size and internal complexity parameters, respectively). These three sub-populations (R1: early progenitor cells; R2: mature macrophages; R3: monocytes) can also be differentiated using an ImageStream multi-spectral flow cytometer based on cellular area (analogous to FSC-H in conventional flow cytometry) and side scatter intensity (analogous to SSC-H in conventional flow cytometry). Cells in each of these populations display similar cellular and nuclear morphology characteristics as previously described. (B) PKM cultures were harvested in the proliferative phase of growth and activated with MAF/LPS for 6 or 48 hours. Cells were then incubated with zymosan-FITC at a ratio of 5:1 (zymosan: cells) for 2 hours and analyzed for phagocytosis using the ImageStream-based approach. Bars represent internalized particles only. Monocyte and mature macrophage sub-populations are the predominantly phagocytic cells in a mixed PKM culture. (C) Phagocytic index was calculated for each population following activation. There was no significant difference in the phagocytic index of either early progenitor or monocyte populations. However, the phagocytic index of mature macrophages increased significantly after 48 hours of MAF/LPS activation. For B and C, n=8; * p=0.04 compared to non-activated cells (Student’s t-test; error bars show SEM.
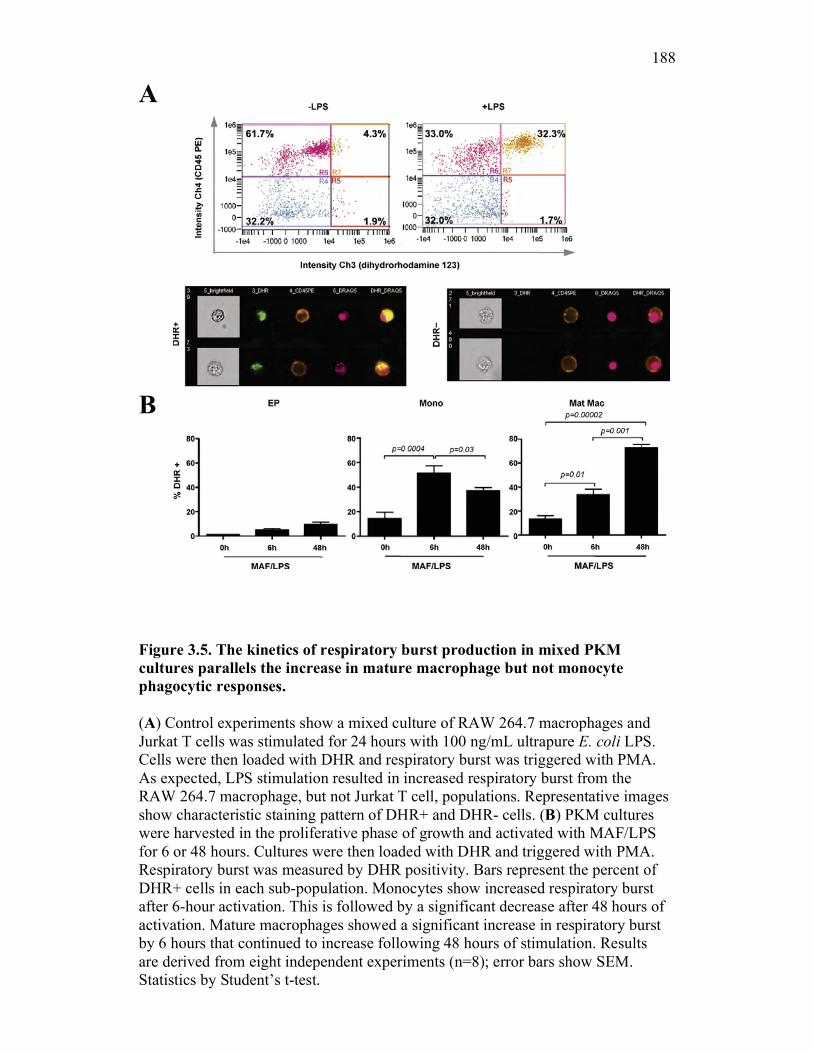
188
Figure 3.5. The kinetics of respiratory burst production in mixed PKM cultures parallels the increase in mature macrophage but not monocyte phagocytic responses. (A) Control experiments show a mixed culture of RAW 264.7 macrophages and Jurkat T cells was stimulated for 24 hours with 100 ng/mL ultrapure E. coli LPS. Cells were then loaded with DHR and respiratory burst was triggered with PMA. As expected, LPS stimulation resulted in increased respiratory burst from the RAW 264.7 macrophage, but not Jurkat T cell, populations. Representative images show characteristic staining pattern of DHR+ and DHR- cells. (B) PKM cultures were harvested in the proliferative phase of growth and activated with MAF/LPS for 6 or 48 hours. Cultures were then loaded with DHR and triggered with PMA. Respiratory burst was measured by DHR positivity. Bars represent the percent of DHR+ cells in each sub-population. Monocytes show increased respiratory burst after 6-hour activation. This is followed by a significant decrease after 48 hours of activation. Mature macrophages showed a significant increase in respiratory burst by 6 hours that continued to increase following 48 hours of stimulation. Results are derived from eight independent experiments (n=8); error bars show SEM. Statistics by Student’s t-test.
A
B
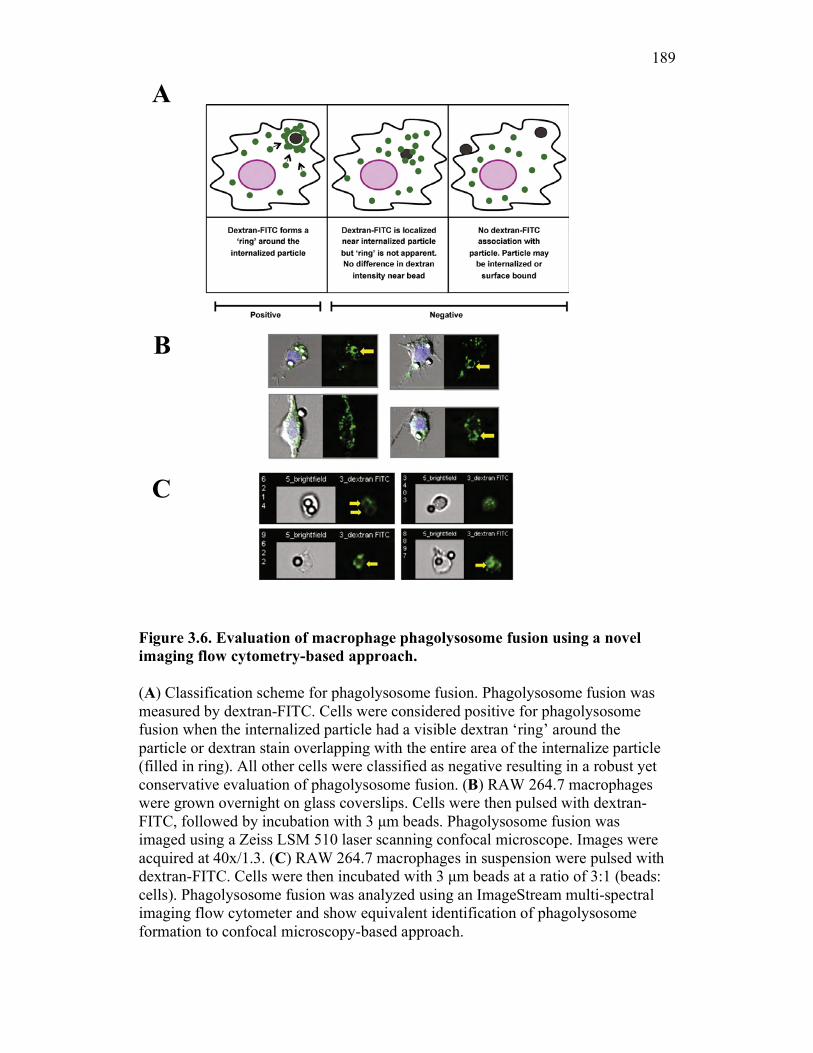
189
Figure 3.6. Evaluation of macrophage phagolysosome fusion using a novel imaging flow cytometry-based approach. (A) Classification scheme for phagolysosome fusion. Phagolysosome fusion was measured by dextran-FITC. Cells were considered positive for phagolysosome fusion when the internalized particle had a visible dextran ‘ring’ around the particle or dextran stain overlapping with the entire area of the internalize particle (filled in ring). All other cells were classified as negative resulting in a robust yet conservative evaluation of phagolysosome fusion. (B) RAW 264.7 macrophages were grown overnight on glass coverslips. Cells were then pulsed with dextran-FITC, followed by incubation with 3 μm beads. Phagolysosome fusion was imaged using a Zeiss LSM 510 laser scanning confocal microscope. Images were acquired at 40x/1.3. (C) RAW 264.7 macrophages in suspension were pulsed with dextran-FITC. Cells were then incubated with 3 μm beads at a ratio of 3:1 (beads: cells). Phagolysosome fusion was analyzed using an ImageStream multi-spectral imaging flow cytometer and show equivalent identification of phagolysosome formation to confocal microscopy-based approach.
A
C
B
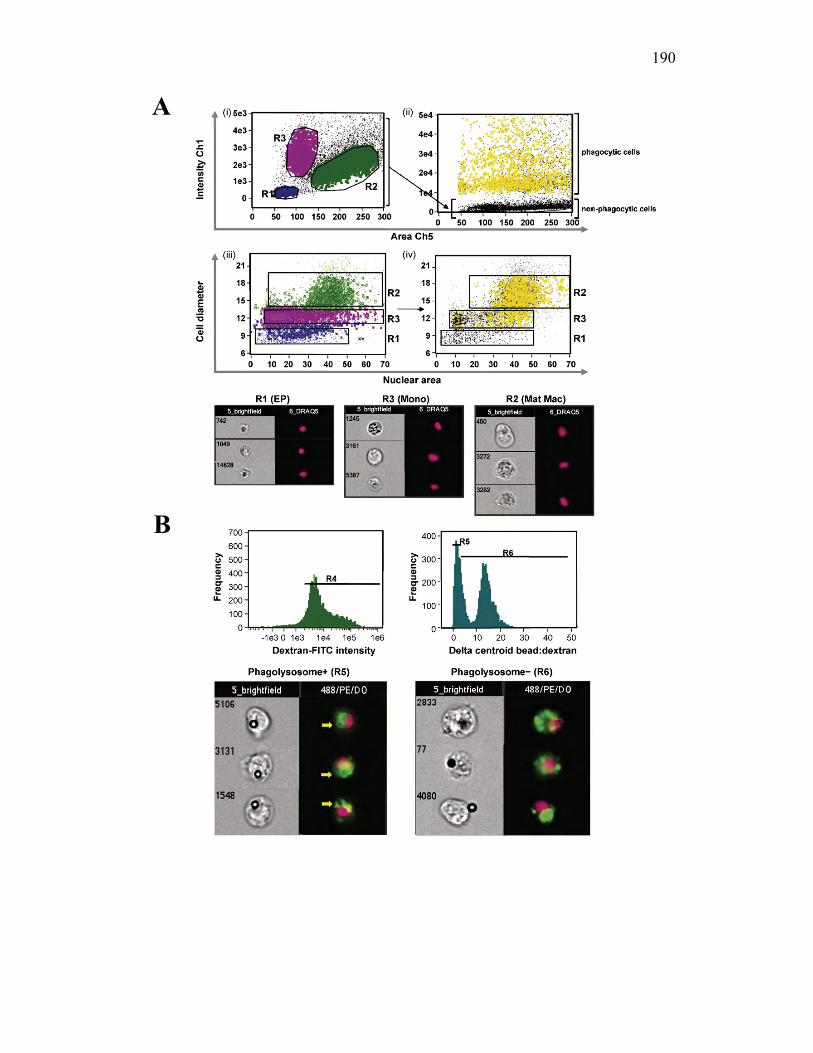
190
A
B
191
Figure 3.7. Application of phagolysosome fusion evaluation approach to a comparative macrophage model system. (A) Phagolysosome fusion was detected following ingestion of 3 μm particles. Under these conditions cellular side scatter properties changed significantly, preventing analysis of the three PKM sub-populations through the standard gating strategy. Expansion of y-axis demonstrates increased side-scatter (Intensity Ch1) characteristics for phagocytic cells (i, ii). To accommodate for this, I developed a new strategy based on cell diameter and nuclear area. Overlap between conventional and new gating strategies for PKM early progenitors (R1), monocytes (R3) and mature macrophages (R2) are shown by blue, purple, and green colors, respectively (i vs. iii). Overlap between conventional and new gating strategies for phagocytic and non-phagocytic cell populations is shown by black and yellow colors, respectively (ii vs. iv). Representative images from cells based on new gates are shown. Cell morphology analysis points to the effectiveness of this new gating strategy to differentiate between the three PKM subsets (early progenitors, monocytes and mature macrophages). (B) To quantify phagolysosome fusion, analysis was focused on those cells that stained with dextran-FITC. To identify and quantitate phagolysosome fusion, I developed a brightfield mask to identify beads and a green fluorescence mask to identify areas with high dextran-FITC intensity. Mathematical overlap between these two masks identified dextran-FITC rings around brightfield-defined beads. Representative images of positive and negative cells are shown. Note the capacity to differentiate between phagolysosome positive and negative events despite high FITC fluorescence in some phagolysosome negative cells.
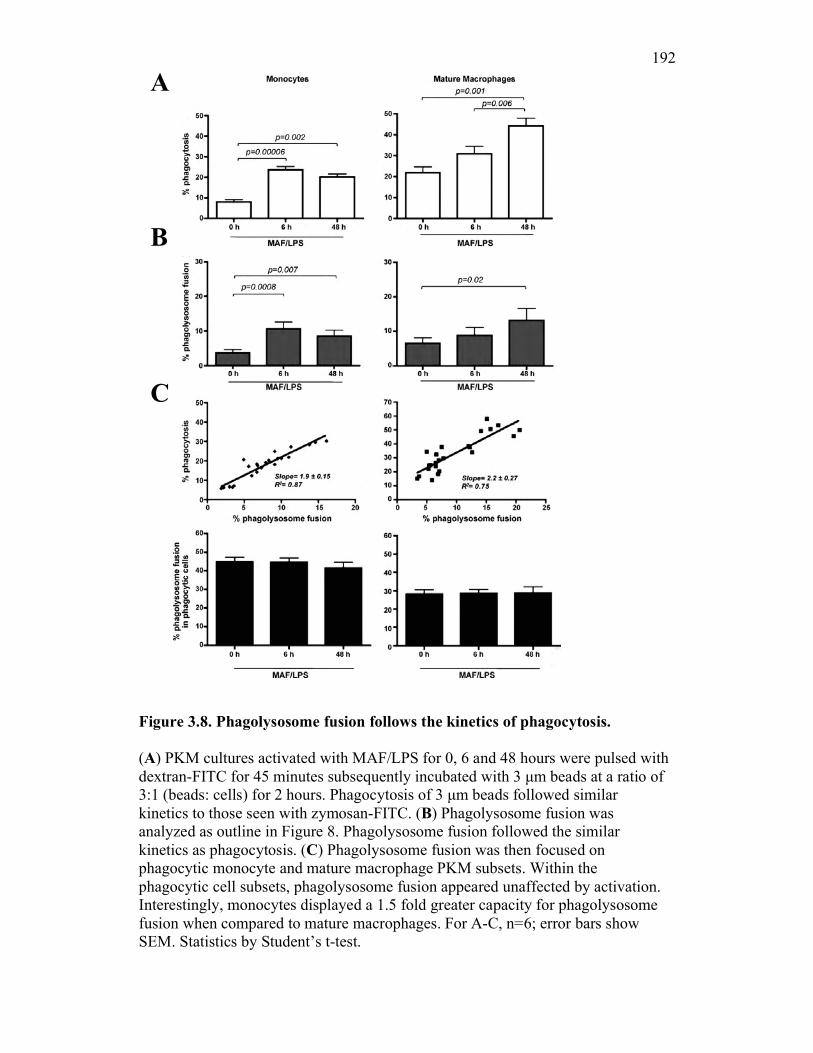
192
Figure 3.8. Phagolysosome fusion follows the kinetics of phagocytosis.
(A) PKM cultures activated with MAF/LPS for 0, 6 and 48 hours were pulsed with dextran-FITC for 45 minutes subsequently incubated with 3 μm beads at a ratio of 3:1 (beads: cells) for 2 hours. Phagocytosis of 3 μm beads followed similar kinetics to those seen with zymosan-FITC. (B) Phagolysosome fusion was analyzed as outline in Figure 8. Phagolysosome fusion followed the similar kinetics as phagocytosis. (C) Phagolysosome fusion was then focused on phagocytic monocyte and mature macrophage PKM subsets. Within the phagocytic cell subsets, phagolysosome fusion appeared unaffected by activation. Interestingly, monocytes displayed a 1.5 fold greater capacity for phagolysosome fusion when compared to mature macrophages. For A-C, n=6; error bars show SEM. Statistics by Student’s t-test.
A
C
B
193
3.4 References
1. Zigmond, S.H., and Hirsch, J.G. 1972. Effects of cytochalasin B on polymorphonuclear leucocyte locomotion, phagocytosis and glycolysis. Exp Cell Res 73:383-393.
2. Axline, S.G., and Reaven, E.P. 1974. Inhibition of phagocytosis and plasma membrane mobility of the cultivated macrophage by cytochalasin B. Role of subplasmalemmal microfilaments. J Cell Biol 62:647-659.
3. Greenberg, S., el Khoury, J., di Virgilio, F., Kaplan, E.M., and Silverstein, S.C. 1991. Ca(2+)-independent F-actin assembly and disassembly during Fc receptor-mediated phagocytosis in mouse macrophages. J Cell Biol 113:757-767.
4. Aderem, A., and Underhill, D.M. 1999. Mechanisms of phagocytosis in macrophages. Annu Rev Immunol 17:593-623.
5. Flannagan, R.S., Cosio, G., and Grinstein, S. 2009. Antimicrobial mechanisms of phagocytes and bacterial evasion strategies. Nat Rev Microbiol 7:355-366.
6. Drevets, D.A., and Campbell, P.A. 1991. Macrophage phagocytosis: use of fluorescence microscopy to distinguish between extracellular and intracellular bacteria. J Immunol Methods 142:31-38.
7. Hampton, M.B., and Winterbourn, C.C. 1999. Methods for quantifying phagocytosis and bacterial killing by human neutrophils. J Immunol Methods 232:15-22.
8. Neumann, N.F., Barreda, D., and Belosevic, M. 1998. Production of a macrophage growth factor(s) by a goldfish macrophage cell line and macrophages derived from goldfish kidney leukocytes. Dev Comp Immunol 22:417-432.
9. Grayfer, L., Walsh, J.G., and Belosevic, M. 2008. Characterization and functional analysis of goldfish (Carassius auratus L.) tumor necrosis factor-alpha. Dev Comp Immunol 32:532-543.
10. Diniz, S.N., Nomizo, R., Cisalpino, P.S., Teixeira, M.M., Brown, G.D., Mantovani, A., Gordon, S., Reis, L.F., and Dias, A.A. 2004. PTX3 function as an opsonin for the dectin-1-dependent internalization of zymosan by macrophages. J Leukoc Biol 75:649-656.
11. Henery, S., George, T., Hall, B., Basiji, D., Ortyn, W., and Morrissey, P. 2008. Quantitative image based apoptotic index measurement using multispectral imaging flow cytometry: a comparison with standard photometric methods. Apoptosis 13:1054-1063.
12. Zuba-Surma, E.K., Kucia, M., Abdel-Latif, A., Lillard, J.W., Jr., and Ratajczak, M.Z. 2007. The ImageStream System: a key step to a new era in imaging. Folia Histochem Cytobiol 45:279-290.
13. Ralph, P., Ito, M., Broxmeyer, H.E., and Nakoinz, I. 1978. Corticosteroids block newly induced but not constitutive functions of macrophage cell lines: myeloid colony-stimulating activity production, latex phagocytosis, and antibody-dependent lysis of RBC and tumor targets. J Immunol 121:300-303.
194
14. Wu, T.T., Chen, T.L., and Chen, R.M. 2009. Lipopolysaccharide triggers macrophage activation of inflammatory cytokine expression, chemotaxis, phagocytosis, and oxidative ability via a toll-like receptor 4-dependent pathway: validated by RNA interference. Toxicol Lett 191:195-202.
15. Neumann, N.F., Barreda, D.R., and Belosevic, M. 2000. Generation and functional analysis of distinct macrophage sub-populations from goldfish (Carassius auratus L.) kidney leukocyte cultures. Fish Shellfish Immunol 10:1-20.
16. Belosevic, M., Hanington, P.C., and Barreda, D.R. 2006. Development of goldfish macrophages in vitro. Fish Shellfish Immunol 20:152-171.
17. Morel, F., Doussiere, J., and Vignais, P.V. 1991. The superoxide-generating oxidase of phagocytic cells. Physiological, molecular and pathological aspects. Eur J Biochem 201:523-546.
18. Richardson, M.P., Ayliffe, M.J., Helbert, M., and Davies, E.G. 1998. A simple flow cytometry assay using dihydrorhodamine for the measurement of the neutrophil respiratory burst in whole blood: comparison with the quantitative nitrobluetetrazolium test. J Immunol Methods 219:187-193.
19. Stafford, J.L., McLauchlan, P.E., Secombes, C.J., Ellis, A.E., and Belosevic, M. 2001. Generation of primary monocyte-like cultures from rainbow trout head kidney leukocytes. Dev Comp Immunol 25:447-459.
20. Zughaier, S.M., Shafer, W.M., and Stephens, D.S. 2005. Antimicrobial peptides and endotoxin inhibit cytokine and nitric oxide release but amplify respiratory burst response in human and murine macrophages. Cell Microbiol 7:1251-1262.
21. Landmann, R., Scherer, F., Schumann, R., Link, S., Sansano, S., and Zimmerli, W. 1995. LPS directly induces oxygen radical production in human monocytes via LPS binding protein and CD14. J Leukoc Biol 57:440-449.
22. Nakagawara, A., DeSantis, N.M., Nogueira, N., and Nathan, C.F. 1982. Lymphokines enhance the capacity of human monocytes to secret reactive oxygen intermediates. J Clin Invest 70:1042-1048.
23. Sasada, M., and Johnston, R.B., Jr. 1980. Macrophage microbicidal activity. Correlation between phagocytosis-associated oxidative metabolism and the killing of Candida by macrophages. J Exp Med 152:85-98.
24. Watson, R.W., Redmond, H.P., and Bouchier-Hayes, D. 1994. Role of endotoxin in mononuclear phagocyte-mediated inflammatory responses. J Leukoc Biol 56:95-103.
25. Chakraborty, P., Sturgill-Koszycki, S., and Russell, D.G. 1994. Isolation and characterization of pathogen-containing phagosomes. Methods Cell Biol 45:261-276.
26. Zimmerli, S., Majeed, M., Gustavsson, M., Stendahl, O., Sanan, D.A., and Ernst, J.D. 1996. Phagosome-lysosome fusion is a calcium-independent event in macrophages. J Cell Biol 132:49-61.
27. Hmama, Z., Sendide, K., Talal, A., Garcia, R., Dobos, K., and Reiner, N.E. 2004. Quantitative analysis of phagolysosome fusion in intact cells: inhibition by mycobacterial lipoarabinomannan and rescue by an 1alpha,25-
195
dihydroxyvitamin D3-phosphoinositide 3-kinase pathway. J Cell Sci 117:2131-2140.
28. Ohkuma, S., Moriyama, Y., and Takano, T. 1982. Identification and characterization of a proton pump on lysosomes by fluorescein-isothiocyanate-dextran fluorescence. Proc Natl Acad Sci U S A 79:2758-2762.
29. Ohkuma, S., and Poole, B. 1978. Fluorescence probe measurement of the intralysosomal pH in living cells and the perturbation of pH by various agents. Proc Natl Acad Sci U S A 75:3327-3331.
30. Barnes, A.C., Guyot, C., Hansen, B.G., Horn, M.T., and Ellis, A.E. 2002. Antibody increases phagocytosis and killing of Lactococcus garvieae by rainbow trout (Oncorhynchus mykiss, L.) macrophages. Fish Shellfish Immunol 12:181-186.
31. Montero, J., Coll, J., Sevilla, N., Cuesta, A., Bols, N.C., and Tafalla, C. 2008. Interleukin 8 and CK-6 chemokines specifically attract rainbow trout (Oncorhynchus mykiss) RTS11 monocyte-macrophage cells and have variable effects on their immune functions. Dev Comp Immunol 32:1374-1384.
32. Zou, J., Peddie, S., Scapigliati, G., Zhang, Y., Bols, N.C., Ellis, A.E., and Secombes, C.J. 2003. Functional characterisation of the recombinant tumor necrosis factors in rainbow trout, Oncorhynchus mykiss. Dev Comp Immunol 27:813-822.
33. Hong, S., Peddie, S., Campos-Perez, J.J., Zou, J., and Secombes, C.J. 2003. The effect of intraperitoneally administered recombinant IL-1beta on immune parameters and resistance to Aeromonas salmonicida in the rainbow trout (Oncorhynchus mykiss). Dev Comp Immunol 27:801-812.
34. McKinney, E.C., and Flajnik, M.F. 1997. IgM-mediated opsonization and cytotoxicity in the shark. J Leukoc Biol 61:141-146.
35. Joerink, M., Ribeiro, C.M., Stet, R.J., Hermsen, T., Savelkoul, H.F., and Wiegertjes, G.F. 2006. Head kidney-derived macrophages of common carp (Cyprinus carpio L.) show plasticity and functional polarization upon differential stimulation. J Immunol 177:61-69.
36. Brattgjerd, S., and Evensen, O. 1996. A sequential light microscopic and ultrastructural study on the uptake and handling of Vibrio salmonicida in phagocytes of the head kidney in experimentally infected Atlantic salmon (Salmo salar L.). Vet Pathol 33:55-65.
37. Cerezuela, R., Cuesta, A., Meseguer, J., and Angeles Esteban, M. 2009. Effects of dietary vitamin D3 administration on innate immune parameters of seabream (Sparus aurata L.). Fish Shellfish Immunol 26:243-248.
38. Barreda, D.R., Hanington, P.C., Stafford, J.L., and Belosevic, M. 2005. A novel soluble form of the CSF-1 receptor inhibits proliferation of self-renewing macrophages of goldfish (Carassius auratus L.). Dev Comp Immunol 29:879-894.
39. Barreda, D.R., Neumann, N.F., and Belosevic, M. 2000. Flow cytometric analysis of PKH26-labeled goldfish kidney-derived macrophages. Dev Comp Immunol 24:395-406.
196
40. Barreda, D.R., and Belosevic, M. 2001. Characterisation of growth enhancing factor production in different phases of in vitro fish macrophage development. Fish Shellfish Immunol 11:169-185.
41. Barreda, D.R., Hanington, P.C., Walsh, C.K., Wong, P., and Belosevic, M. 2004. Differentially expressed genes that encode potential markers of goldfish macrophage development in vitro. Dev Comp Immunol 28:727-746.
42. Gordon, M.A., Jack, D.L., Dockrell, D.H., Lee, M.E., and Read, R.C. 2005. Gamma interferon enhances internalization and early nonoxidative killing of Salmonella enterica serovar Typhimurium by human macrophages and modifies cytokine responses. Infect Immun 73:3445-3452.
43. Perri, D., Shabani, F., Ziaeian, G., and Denomme, G.A. 2008. IFN-gamma treated monocyte/macrophage phagocytosis of red cells sensitized with IgG1 and IgG3 Anti-D containing identical immunoglobulin variable region genes. Transfus Apher Sci 39:37-44.
44. Katsura, Y., Tsuru, S., Noritake, M., Shinomiya, N., Kayashima, S., Motoyoshi, K., and Rokutanda, M. 1992. Effects of macrophage colony-stimulating factor on the activities of murine monocytes and peritoneal macrophages in vivo. Nat Immun 11:167-176.
45. Sunderkotter, C., Nikolic, T., Dillon, M.J., Van Rooijen, N., Stehling, M., Drevets, D.A., and Leenen, P.J. 2004. Subpopulations of mouse blood monocytes differ in maturation stage and inflammatory response. J Immunol 172:4410-4417.
46. Alvarez, M., Burn, T., Luo, Y., Pirofski, L.A., and Casadevall, A. 2009. The outcome of Cryptococcus neoformans intracellular pathogenesis in human monocytes. BMC Microbiol 9:51.
47. Kubica, M., Guzik, K., Koziel, J., Zarebski, M., Richter, W., Gajkowska, B., Golda, A., Maciag-Gudowska, A., Brix, K., Shaw, L., et al. 2008. A potential new pathway for Staphylococcus aureus dissemination: the silent survival of S. aureus phagocytosed by human monocyte-derived macrophages. PLoS One 3:e1409.
48. Serbina, N.V., Jia, T., Hohl, T.M., and Pamer, E.G. 2008. Monocyte-mediated defense against microbial pathogens. Annu Rev Immunol 26:421-452.
49. Paidassi, H., Tacnet-Delorme, P., Arlaud, G.J., and Frachet, P. 2009. How phagocytes track down and respond to apoptotic cells. Crit Rev Immunol 29:111-130.
50. Nakanishi, Y., Henson, P.M., and Shiratsuchi, A. 2009. Pattern recognition in phagocytic clearance of altered self. Adv Exp Med Biol 653:129-138.
51. Nayak, J.V., Hokey, D.A., Larregina, A., He, Y., Salter, R.D., Watkins, S.C., and Falo, L.D., Jr. 2006. Phagocytosis induces lysosome remodeling and regulated presentation of particulate antigens by activated dendritic cells. J Immunol 177:8493-8503.
52. Salter, R.D., and Watkins, S.C. 2006. Dynamic properties of antigen uptake and communication between dendritic cells. Immunol Res 36:211-220.
197
53. Blander, J.M. 2007. Signalling and phagocytosis in the orchestration of host defence. Cell Microbiol 9:290-299.
54. Zhou, L.J., and Tedder, T.F. 1996. CD14+ blood monocytes can differentiate into functionally mature CD83+ dendritic cells. Proc Natl Acad Sci U S A 93:2588-2592.
55. Ricevuti, G., Mazzone, A., Fossati, G., Mazzucchelli, I., Cavigliano, P.M., Pasotti, D., and Notario, A. 1993. Assay of phagocytic cell functions. Allerg Immunol (Paris) 25:55-66.
56. Jutras, I., and Desjardins, M. 2005. Phagocytosis: at the crossroads of innate and adaptive immunity. Annu Rev Cell Dev Biol 21:511-527.
57. Delamarre, L., Pack, M., Chang, H., Mellman, I., and Trombetta, E.S. 2005. Differential lysosomal proteolysis in antigen-presenting cells determines antigen fate. Science 307:1630-1634.
198
Chapter 4: Goldfish phagocytes display divergent
responses to pro-inflammatory and homeostatic stimuli in
vivo1
4.1 Introduction
Inflammation is a complex and highly regulated response to pathogen
infiltration and tissue damage. While this response is critical to pathogen clearance,
inflammatory processes can lead to substantial tissue injury if unchecked (1-3).
Thus, there has been a significant drive for co-evolution of regulatory programs to
minimize deleterious effects on surrounding tissues (4).
As a mechanism to control tissue damage, inflammation-associated apoptosis
triggers anti-inflammatory programs in mammals (4). In vitro studies have shown
that phagocytosis of apoptotic cells drives a decrease in pro-inflammatory
antimicrobial killing mechanisms (5-7). In vivo, apoptotic cells reduce
thioglycollate-induced leukocyte infiltration and promote the resolution of
thioglycollate or LPS-driven inflammation (8, 9). Further, in vitro and in vivo
studies have shown that the clearance of apoptotic cells within an inflammatory site
also promotes the production of anti-inflammatory immune mediators, notably
A version of this chapter has been published:
Rieger AM, Konowalchuk JD, Grayfer L, Katzenback BA, Havixbeck JJ, Kiemele
MD, Belosevic M, Barreda DR. 2012. Fish and mammalian phagocytes
differentially regulate pro-inflammatory and homeostatic responses in vivo. PLoS
One 7: e47070.
199
interleukin (IL)-10, transforming growth factor (TGF)-β, and platelet activating
factor, as well as a decrease in pro-inflammatory cytokines, including tumor
necrosis factor (TNF)-α, IL-6 IL-8, IL-12, IL-17, IL-23, prostaglandin E2,
leukotriene C4 and thromboxane B2 (10-17). The shift in the balance between
TNF-α and TGF-β contributes to the ‘quenching’ of reactive oxygen and nitrogen
species (18). Removal of the oxidative stress associated with ROS production
favors effective uptake of apoptotic cells and further promotes anti-inflammatory
programs (19, 20). Importantly, although continued ROS production can lead to
unnecessary tissue damage, premature neutrophilic apoptosis, and inhibition of
apoptotic cell uptake, NADPH oxidase also appears to play an important role in the
effective resolution of inflammation, by contributing to macrophage recognition
and clearance of activated neutrophils at sites of inflammation (21).
Phagocytes contribute to both pro-inflammatory and anti-inflammatory
(resolution) responses at infectious foci (11, 20-23). However, it remains unclear if
this dichotomy is a recent evolutionary development or whether the capacity to
balance between these two seemingly contradictory processes following
phagocytosis is a feature already displayed by lower vertebrate phagocytes. Recent
evolutionary developments may have provided novel strategies for the control of
inflammation, but may contribute to the development of inflammation-associated
diseases as new mechanisms look to integrate into existing immune regulatory
networks. Importantly, phagocytes are known to internalize pathogens, apoptotic
cells, or both at sites of inflammation, raising questions about the contributions of
individual phagocytes to the inflammatory process in vivo.
200
In this chapter, I examine the effects of homeostatic phagocytosis on the
regulation of pro-inflammatory antimicrobial responses. Using a comparative
model of zymosan-induced peritonitis, the impact of apoptotic cells on reactive
oxygen species (ROS) production was measured in vivo in both mice and fish.
Zymosan is a commonly used pathogen mimic that induces self-resolving
peritonitis in vivo (24-28). Previous in vitro and in vivo studies have shown that
zymosan phagocytosis results in activation of pro-inflammatory responses that
include induction of pro-inflammatory cytokines, production of reactive oxygen
and nitrogen intermediates, and increased infiltration of leukocytes, predominantly
neutrophils (28-34).
The main objectives of this chapter were (1) compare the kinetics of the
induction of inflammatory processes in mice and goldfish, (2) determine goldfish
macrophage responses to pathogenic and homeostatic particles and (3) examine the
conservation of functional phagocyte responses in the induction and resolution
stages of inflammation. Importantly, I chose to do these experiments using two
potential phagocytic particles: zymosan and apoptotic cells. This allowed a closer
examination of the balance of phagocyte responses within an inflammatory site that
would not be possible in systems where inflammation is induced by a soluble/ non-
particulate mediator (i.e. thioglycollate or LPS).
4.2 Results
4.2.1 Teleost phagocytes reduce pro-inflammatory responses following
apoptotic cell internalization.
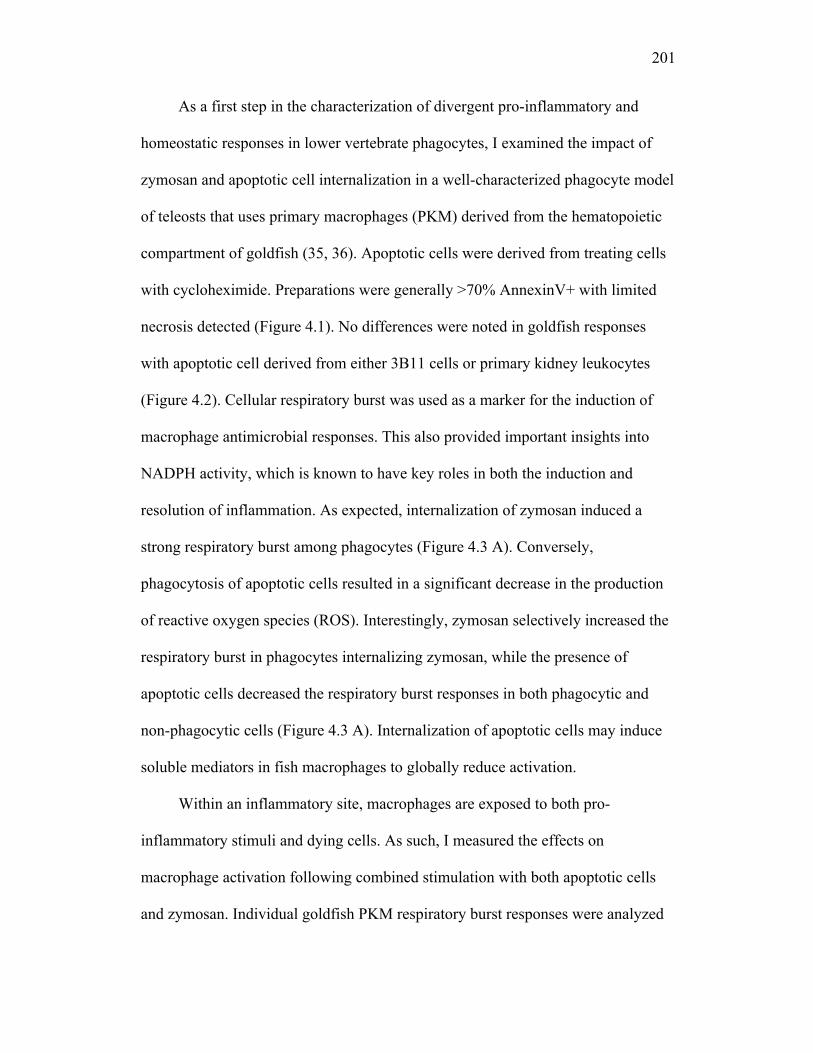
201
As a first step in the characterization of divergent pro-inflammatory and
homeostatic responses in lower vertebrate phagocytes, I examined the impact of
zymosan and apoptotic cell internalization in a well-characterized phagocyte model
of teleosts that uses primary macrophages (PKM) derived from the hematopoietic
compartment of goldfish (35, 36). Apoptotic cells were derived from treating cells
with cycloheximide. Preparations were generally >70% AnnexinV+ with limited
necrosis detected (Figure 4.1). No differences were noted in goldfish responses
with apoptotic cell derived from either 3B11 cells or primary kidney leukocytes
(Figure 4.2). Cellular respiratory burst was used as a marker for the induction of
macrophage antimicrobial responses. This also provided important insights into
NADPH activity, which is known to have key roles in both the induction and
resolution of inflammation. As expected, internalization of zymosan induced a
strong respiratory burst among phagocytes (Figure 4.3 A). Conversely,
phagocytosis of apoptotic cells resulted in a significant decrease in the production
of reactive oxygen species (ROS). Interestingly, zymosan selectively increased the
respiratory burst in phagocytes internalizing zymosan, while the presence of
apoptotic cells decreased the respiratory burst responses in both phagocytic and
non-phagocytic cells (Figure 4.3 A). Internalization of apoptotic cells may induce
soluble mediators in fish macrophages to globally reduce activation.
Within an inflammatory site, macrophages are exposed to both pro-
inflammatory stimuli and dying cells. As such, I measured the effects on
macrophage activation following combined stimulation with both apoptotic cells
and zymosan. Individual goldfish PKM respiratory burst responses were analyzed
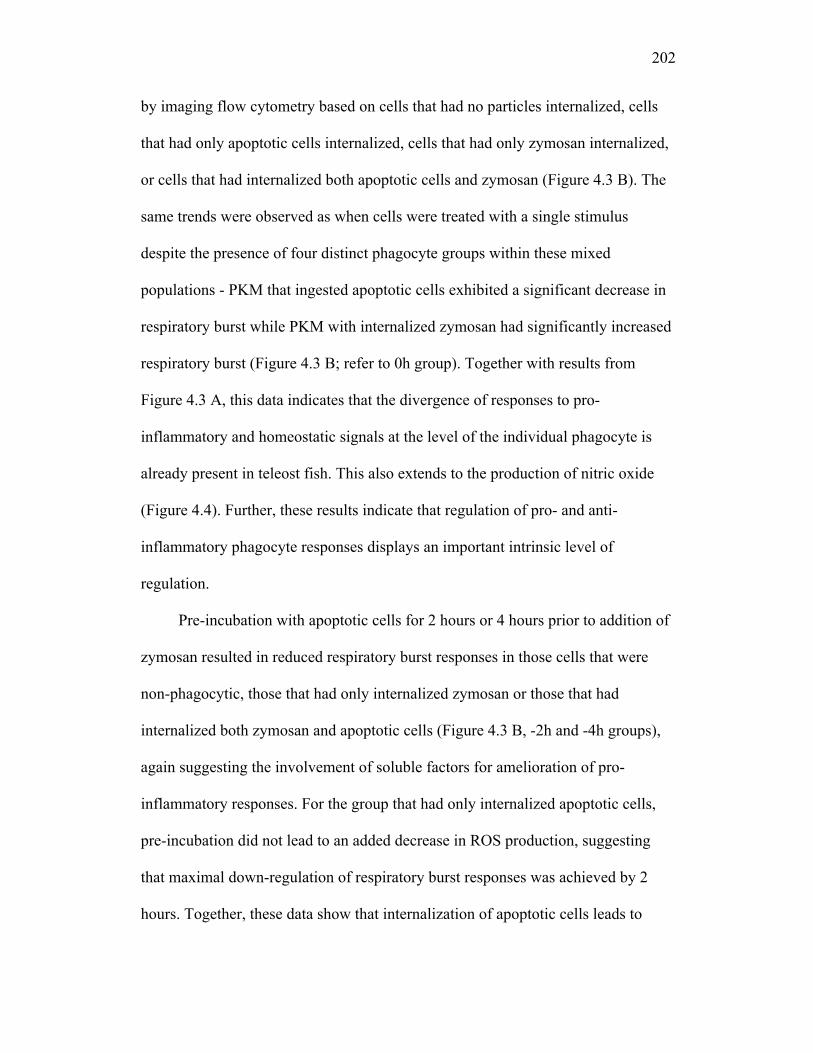
202
by imaging flow cytometry based on cells that had no particles internalized, cells
that had only apoptotic cells internalized, cells that had only zymosan internalized,
or cells that had internalized both apoptotic cells and zymosan (Figure 4.3 B). The
same trends were observed as when cells were treated with a single stimulus
despite the presence of four distinct phagocyte groups within these mixed
populations - PKM that ingested apoptotic cells exhibited a significant decrease in
respiratory burst while PKM with internalized zymosan had significantly increased
respiratory burst (Figure 4.3 B; refer to 0h group). Together with results from
Figure 4.3 A, this data indicates that the divergence of responses to pro-
inflammatory and homeostatic signals at the level of the individual phagocyte is
already present in teleost fish. This also extends to the production of nitric oxide
(Figure 4.4). Further, these results indicate that regulation of pro- and anti-
inflammatory phagocyte responses displays an important intrinsic level of
regulation.
Pre-incubation with apoptotic cells for 2 hours or 4 hours prior to addition of
zymosan resulted in reduced respiratory burst responses in those cells that were
non-phagocytic, those that had only internalized zymosan or those that had
internalized both zymosan and apoptotic cells (Figure 4.3 B, -2h and -4h groups),
again suggesting the involvement of soluble factors for amelioration of pro-
inflammatory responses. For the group that had only internalized apoptotic cells,
pre-incubation did not lead to an added decrease in ROS production, suggesting
that maximal down-regulation of respiratory burst responses was achieved by 2
hours. Together, these data show that internalization of apoptotic cells leads to
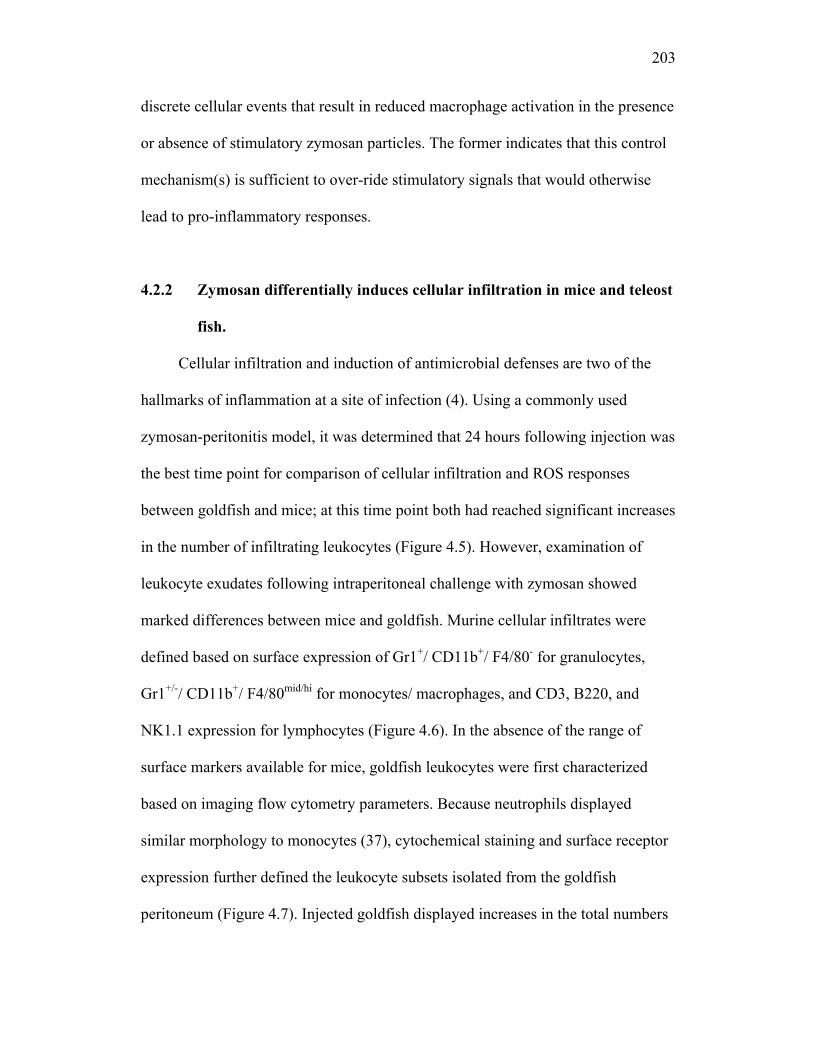
203
discrete cellular events that result in reduced macrophage activation in the presence
or absence of stimulatory zymosan particles. The former indicates that this control
mechanism(s) is sufficient to over-ride stimulatory signals that would otherwise
lead to pro-inflammatory responses.
4.2.2 Zymosan differentially induces cellular infiltration in mice and teleost
fish.
Cellular infiltration and induction of antimicrobial defenses are two of the
hallmarks of inflammation at a site of infection (4). Using a commonly used
zymosan-peritonitis model, it was determined that 24 hours following injection was
the best time point for comparison of cellular infiltration and ROS responses
between goldfish and mice; at this time point both had reached significant increases
in the number of infiltrating leukocytes (Figure 4.5). However, examination of
leukocyte exudates following intraperitoneal challenge with zymosan showed
marked differences between mice and goldfish. Murine cellular infiltrates were
defined based on surface expression of Gr1+/ CD11b+/ F4/80- for granulocytes,
Gr1+/-/ CD11b+/ F4/80mid/hi for monocytes/ macrophages, and CD3, B220, and
NK1.1 expression for lymphocytes (Figure 4.6). In the absence of the range of
surface markers available for mice, goldfish leukocytes were first characterized
based on imaging flow cytometry parameters. Because neutrophils displayed
similar morphology to monocytes (37), cytochemical staining and surface receptor
expression further defined the leukocyte subsets isolated from the goldfish
peritoneum (Figure 4.7). Injected goldfish displayed increases in the total numbers
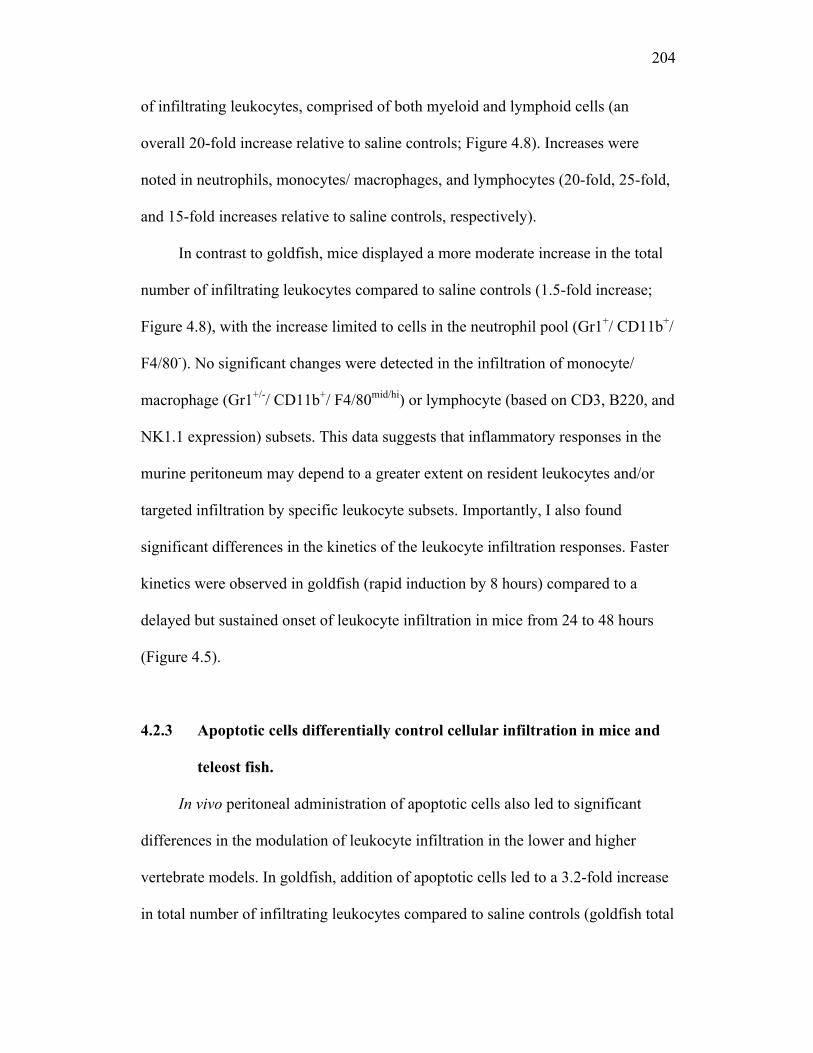
204
of infiltrating leukocytes, comprised of both myeloid and lymphoid cells (an
overall 20-fold increase relative to saline controls; Figure 4.8). Increases were
noted in neutrophils, monocytes/ macrophages, and lymphocytes (20-fold, 25-fold,
and 15-fold increases relative to saline controls, respectively).
In contrast to goldfish, mice displayed a more moderate increase in the total
number of infiltrating leukocytes compared to saline controls (1.5-fold increase;
Figure 4.8), with the increase limited to cells in the neutrophil pool (Gr1+/ CD11b+/
F4/80-). No significant changes were detected in the infiltration of monocyte/
macrophage (Gr1+/-/ CD11b+/ F4/80mid/hi) or lymphocyte (based on CD3, B220, and
NK1.1 expression) subsets. This data suggests that inflammatory responses in the
murine peritoneum may depend to a greater extent on resident leukocytes and/or
targeted infiltration by specific leukocyte subsets. Importantly, I also found
significant differences in the kinetics of the leukocyte infiltration responses. Faster
kinetics were observed in goldfish (rapid induction by 8 hours) compared to a
delayed but sustained onset of leukocyte infiltration in mice from 24 to 48 hours
(Figure 4.5).
4.2.3 Apoptotic cells differentially control cellular infiltration in mice and
teleost fish.
In vivo peritoneal administration of apoptotic cells also led to significant
differences in the modulation of leukocyte infiltration in the lower and higher
vertebrate models. In goldfish, addition of apoptotic cells led to a 3.2-fold increase
in total number of infiltrating leukocytes compared to saline controls (goldfish total
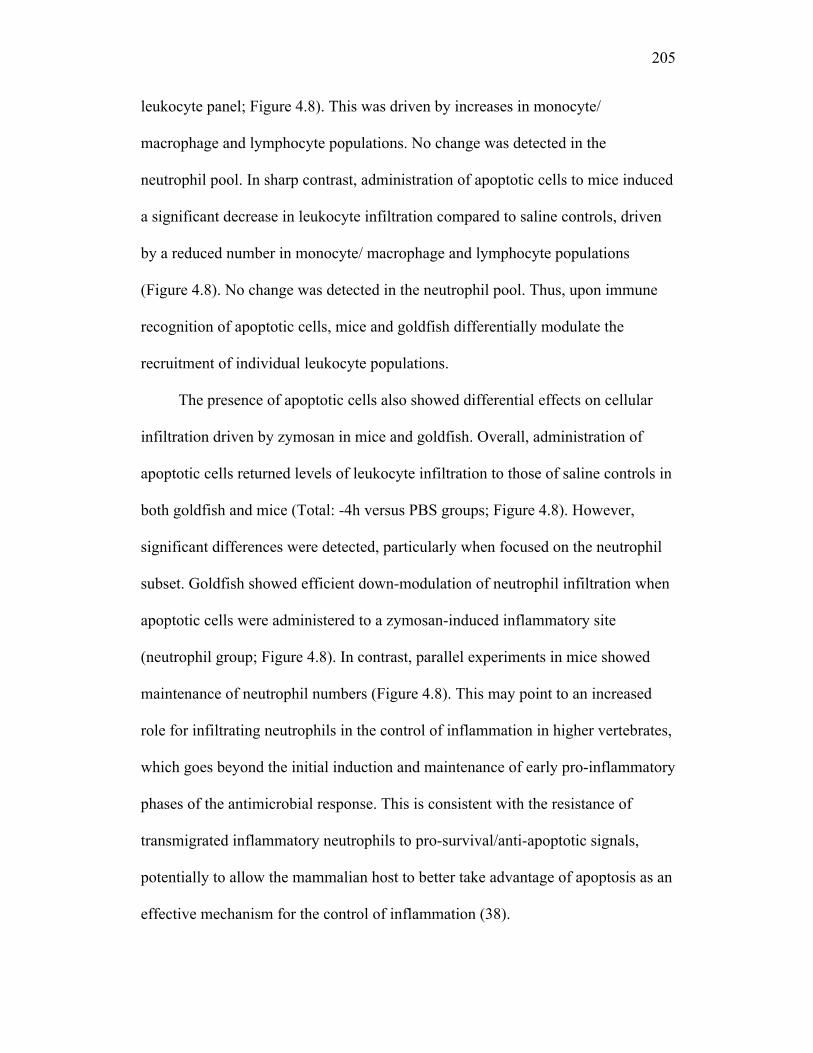
205
leukocyte panel; Figure 4.8). This was driven by increases in monocyte/
macrophage and lymphocyte populations. No change was detected in the
neutrophil pool. In sharp contrast, administration of apoptotic cells to mice induced
a significant decrease in leukocyte infiltration compared to saline controls, driven
by a reduced number in monocyte/ macrophage and lymphocyte populations
(Figure 4.8). No change was detected in the neutrophil pool. Thus, upon immune
recognition of apoptotic cells, mice and goldfish differentially modulate the
recruitment of individual leukocyte populations.
The presence of apoptotic cells also showed differential effects on cellular
infiltration driven by zymosan in mice and goldfish. Overall, administration of
apoptotic cells returned levels of leukocyte infiltration to those of saline controls in
both goldfish and mice (Total: -4h versus PBS groups; Figure 4.8). However,
significant differences were detected, particularly when focused on the neutrophil
subset. Goldfish showed efficient down-modulation of neutrophil infiltration when
apoptotic cells were administered to a zymosan-induced inflammatory site
(neutrophil group; Figure 4.8). In contrast, parallel experiments in mice showed
maintenance of neutrophil numbers (Figure 4.8). This may point to an increased
role for infiltrating neutrophils in the control of inflammation in higher vertebrates,
which goes beyond the initial induction and maintenance of early pro-inflammatory
phases of the antimicrobial response. This is consistent with the resistance of
transmigrated inflammatory neutrophils to pro-survival/anti-apoptotic signals,
potentially to allow the mammalian host to better take advantage of apoptosis as an
effective mechanism for the control of inflammation (38).
206
4.2.4 Apoptotic cells reduce teleost pro-inflammatory responses in vivo in a
time dependent manner.
Consistent with in vitro measurements, injection of zymosan led to
significant increases in respiratory burst in goldfish peritoneal cells (Figure 4.9).
Co-injection of apoptotic cells significantly decreased the respiratory burst relative
to the ‘zymosan only’ group. The respiratory burst response decreased in a time
dependent manner, with respiratory burst being almost undetectable at the -4h time
point despite the presence of zymosan. As expected, respiratory burst responses
predominantly occurred in the myeloid, and not lymphoid population (Figure 4.10).
Mean fluorescence intensity of myeloid cell DHR fluorescence shows a similar
trend (Figure 4.11, top). Interestingly, the decrease in respiratory burst responses
was more pronounced in vivo than in vitro (Figure 4.3B vs. Figure 4.9), suggesting
that teleost cells at an inflammatory site other than macrophages contribute to the
control of pro-inflammatory responses.
4.2.5 Apoptotic cells reduce pro-inflammatory responses in mice to a lesser
extent than in goldfish.
Although in vitro and in vivo studies of murine immune responses to either
zymosan (39, 40) or apoptotic cells (8, 10) have been examined independently, the
combined effects have not been thoroughly investigated. To this end, I injected
C57BL/6 mice intraperitoneally with zymosan and/or apoptotic cells. Similar to
goldfish, zymosan injections of mice resulted in respiratory burst activity in
207
peritoneal cells (Figure 4.9); however, basal responses were higher and zymosan-
induced responses were not as pronounced as those in goldfish (ie. relative increase
in ROS production in response to zymosan was much less pronounced in mice).
Mice injected with apoptotic cells also exhibited significantly reduced respiratory
burst response compared to those in the zymosan-injected group (Figure 4.9).
Again, the relative decrease was less pronounced than that observed in goldfish.
Interestingly, murine neutrophil populations demonstrated the greatest decrease in
ROS production, while the monocyte/macrophage subset showed mild reductions
in the respiratory burst (Figure 4.12 A). This decrease was further associated with a
shift in neutrophil ROS responses from ‘high’ levels to ‘low’/ ‘mid’ levels,
especially in neutrophils from mice injected with apoptotic cells 4 hours prior to
zymosan (Figure 4.12 B). A similar shift was noted in the monocyte/macrophage
population, although it was not as prominent as that of neutrophils. Mean
fluorescence intensity of neutrophil and monocyte/macrophage DHR fluorescence
shows a similar trend to these results (Figure 4.11, bottom).
4.2.6 Murine, but not teleost, neutrophils phagocytose apoptotic cells,
which actively reduce pro-inflammatory ROS production in a contact
dependent manner.
Mammalian macrophages are well known to internalize apoptotic cells and
subsequently down-regulate their pro-inflammatory responses (5-7). Similarly,
previous reports indicate that activated ex vivo human neutrophils possess the
capacity to phagocytose apoptotic cells, which results in a decrease in pro-
208
inflammatory neutrophil functions, including production of ROS (41). This
establishes macrophages and neutrophils as active contributors to homeostatic
responses at a mammalian inflammatory site. However, classical neutrophils
represent recent additions to the immune cell repertoire of metazoans and,
therefore, may have only recently acquired the capacity to contribute to both pro-
inflammatory and homeostatic responses in higher vertebrates. Therefore, I wished
to compare the relative capacity of murine and teleost neutrophils to internalize
apoptotic cells, and to determine if this subsequently decreased ROS production
through either contact dependent or soluble factor-mediated mechanisms. To this
end, goldfish and C57BL/6 mice were injected intraperitoneally with zymosan and
cells were harvested by peritoneal lavages 24 hours later. Using density gradient
centrifugation, isolated cells were separated into granulocyte and mononuclear
fractions in a manner that has been shown to result in a high level of purity in the
isolated populations (37). To determine the capacity of these leukocytes to
internalize apoptotic cells, cells were incubated with labeled species-specific
apoptotic cells for 2 hours and phagocytosis was analyzed. Consistent with murine
results, goldfish monocytes/ macrophages were efficient at internalizing apoptotic
cells (Figure 4.13 A). There was also limited surface binding capacity in both
goldfish myeloid populations. In sharp contrast, goldfish neutrophils displayed a
very limited capacity for their uptake (<0.6% phagocytosis) whereas murine
neutrophils displayed efficient internalization of apoptotic cells, equivalent to that
of murine monocytes/ macrophages.
209
To measure the effects of apoptotic cells on activated ex vivo neutrophils and
monocyte/ macrophage populations, cells were stimulated in vivo and isolated as
described above. Cells were then cultured for 2 hours in the presence of apoptotic
cells. To determine if the effect was contact dependent or mediated through soluble
factors, apoptotic cells were also added to 0.4 μm trans-wells alone or in
combination with various cell populations (Figure 4.13 B; bracketed groups). In the
trans-well conditions, only responding cells were present outside of the trans-well
(ie. no other factors were added to these cells). In goldfish, neutrophil ROS
production was unchanged in any of the experimental conditions, indicating that
neither contact dependent factors nor soluble mediators were present and affected
neutrophil responses (Figure 4.13 B, left panel). In contrast, direct contact with
apoptotic cells significantly reduced monocyte/ macrophage ROS production. This
suggests that the reduction in ROS production identified in the myeloid population
of Figure 4.10 was associated with a selective decrease in monocyte/macrophage
and not neutrophil ROS production. Interestingly, in spite of the limited ability of
neutrophil to phagocytose apoptotic cells, activated goldfish neutrophils cultured in
the presence of apoptotic cells produced soluble factor(s) that significantly
decreased monocyte/ macrophage ROS responses (bracketed N+AB group in
monocyte/macrophage analysis; Figure 4.13 B). This decrease is further enhanced
when the total peritoneal isolate was used, suggesting an additive role of soluble
factors from both neutrophils and mononuclear cells (bracketed Total+AB group in
monocyte/macrophage analysis; Figure 4.13 B).
210
In sharp contrast, isolated murine neutrophils significantly downregulated
their ROS responses in the presence of apoptotic cells (Figure 4.13 B, right panel),
similar to the responses observed following in vivo injection of apoptotic cells. The
downregulation of ROS was contact-dependent, as no changes in ROS were
observed when apoptotic cells alone, monocyte/macrophages plus apoptotic cells,
or total leukocytes plus apoptotic cells were added to the experimental trans-well.
This suggests that the decreases in neutrophil ROS measured in vivo were due to
direct contact between apoptotic cells and neutrophils within the peritoneum and
not soluble factors produced by other leukocytes at the site.
4.3 Discussion
Phagocytosis is a well-conserved innate defense mechanism that has served
as a robust platform for incorporation of novel layers of immunological control
(11, 20, 22, 23). For inflammatory processes of higher vertebrates, phagocytosis
represents a central node for the induction and resolution of inflammation. In this
chapter, I studied murine and teleost fish in vivo and in vitro models to assess the
evolutionary conservation of this inflammatory control axis.
Although I found some conservation of phagocyte functional responses, I
also found significant differences in the level and control of these responses to pro-
inflammatory and homeostatic internalization signals between goldfish and mice.
Fish mounted very robust, quick responses to zymosan that led to the recruitment
of several leukocyte populations. Addition of apoptotic cells resulted in a marked
suppression of these responses. In contrast, mice displayed more subtle responses
211
to both zymosan and apoptotic cells with targeted cellular recruitment and appeared
to rely more heavily on resident tissue subsets.
Two important characteristics of an inflammatory site are cellular infiltration
and induction of antimicrobial defenses (4). Goldfish exhibited significantly higher
cellular infiltration than mice following intraperitoneal challenge with zymosan
(20-fold increase vs 1.5 fold increase). In goldfish, this infiltrate was composed of
both lymphoid and myeloid cells, while murine leukocyte infiltration was
dominated by neutrophils. Furthermore, apoptotic cells inhibited infiltration of both
myeloid and lymphoid cells in goldfish. This is in sharp contrast to mice, where the
infiltrating macrophage and lymphocyte populations modestly decreased while
neutrophil infiltration was maintained in the presence of apoptotic cell stimuli.
Murine respiratory burst responses also displayed added cell specificity
compared to the teleost model. In mice, apoptotic cells preferentially caused a
decrease in neutrophil respiratory burst, whereas only a limited effect was evident
in macrophage responses. Murine respiratory burst responses also displayed faster
kinetics preceding the wave of leukocyte infiltration, suggesting a significant
contribution from resident peritoneal leukocytes. These results are consistent with
an evolutionary shift towards leukocyte specialization in mammals. This shift
appears to favor targeted induction of leukocyte infiltration (F4/80-/ Gr1+/ CD11b+
neutrophils in this model), and is increasingly reliant on local peritoneal leukocyte
populations for early activation of innate antimicrobial effector mechanisms. This
may be associated with evolving roles for specific leukocyte populations. For
example, teleost circulating lymphocyte pools contribute directly to innate
212
phagocytic responses (42-44), whereas mammalian lymphocytes display increased
specialization towards homeostatic tissue repair mechanisms (45-48) and adaptive
mechanisms of immunity (49-51).
These results also point to changing roles for neutrophils across evolution. In
both goldfish and mice, neutrophils are among the first leukocytes recruited to an
inflammatory site (52) and their loss from an inflammatory site is often considered
a key histological feature that signals the start to the resolution of inflammation
(53). The evolutionary origins of neutrophils may lie in their roles as novel
contributors for the induction of potent antimicrobial defenses. However, recent
studies highlight another role for mammalian neutrophils as contributors to
homeostatic responses at an inflammatory site. Within hours after entering an
inflammatory site, infiltrating neutrophils actively produce protective molecules,
such as lipoxins from arachidonic acid, which promote resolution of an
inflammatory response (coined ‘lipid mediator class- switching’) (53). My results
add to this paradigm and indicate that mammalian neutrophils display an increased
capacity to participate in the down-regulation of inflammation though contact
dependent interactions with apoptotic cells. This contact and subsequent
internalization of apoptotic cells significantly reduces not only neutrophilic ROS
production but also macrophage ROS production through a soluble factor-mediated
mechanism. While it is currently unknown which soluble factor(s) contribute to
this action, lipoxins have been shown to attenuate ROS production in a number of
cells including microglia (54), endothelial cells (55), and aggregated peripheral
blood leukocytes (56). Further, while the ability of neutrophils to internalize
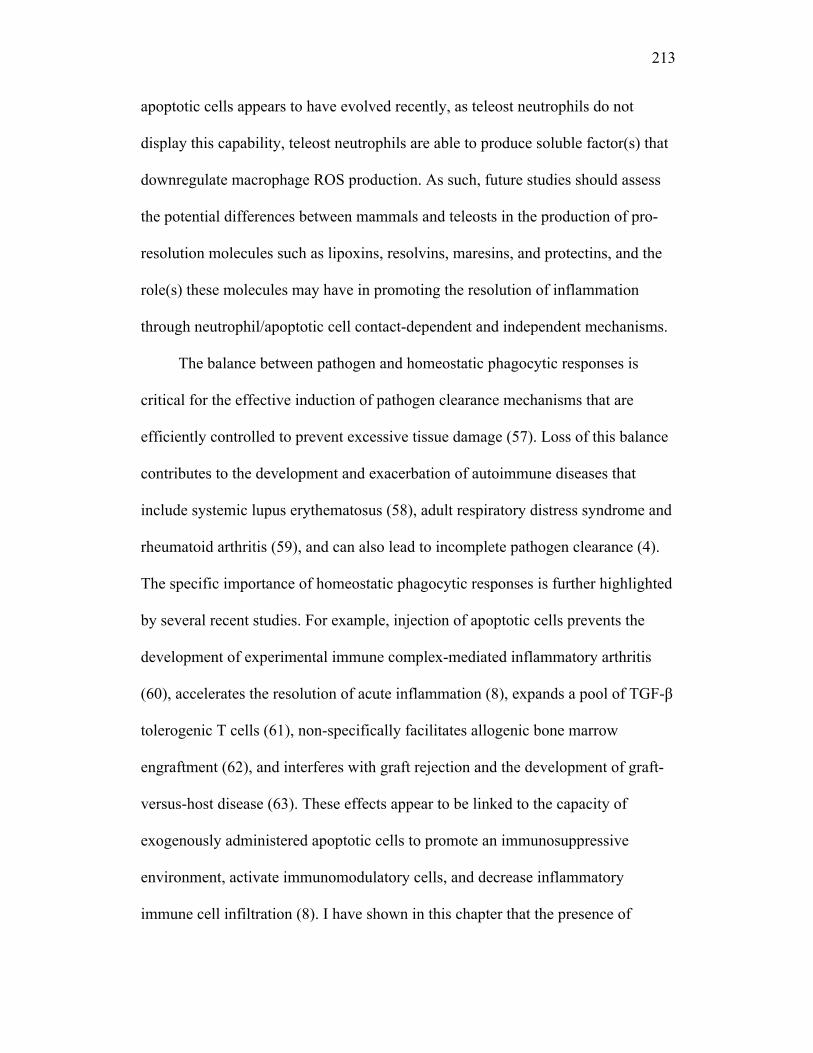
213
apoptotic cells appears to have evolved recently, as teleost neutrophils do not
display this capability, teleost neutrophils are able to produce soluble factor(s) that
downregulate macrophage ROS production. As such, future studies should assess
the potential differences between mammals and teleosts in the production of pro-
resolution molecules such as lipoxins, resolvins, maresins, and protectins, and the
role(s) these molecules may have in promoting the resolution of inflammation
through neutrophil/apoptotic cell contact-dependent and independent mechanisms.
The balance between pathogen and homeostatic phagocytic responses is
critical for the effective induction of pathogen clearance mechanisms that are
efficiently controlled to prevent excessive tissue damage (57). Loss of this balance
contributes to the development and exacerbation of autoimmune diseases that
include systemic lupus erythematosus (58), adult respiratory distress syndrome and
rheumatoid arthritis (59), and can also lead to incomplete pathogen clearance (4).
The specific importance of homeostatic phagocytic responses is further highlighted
by several recent studies. For example, injection of apoptotic cells prevents the
development of experimental immune complex-mediated inflammatory arthritis
(60), accelerates the resolution of acute inflammation (8), expands a pool of TGF-β
tolerogenic T cells (61), non-specifically facilitates allogenic bone marrow
engraftment (62), and interferes with graft rejection and the development of graft-
versus-host disease (63). These effects appear to be linked to the capacity of
exogenously administered apoptotic cells to promote an immunosuppressive
environment, activate immunomodulatory cells, and decrease inflammatory
immune cell infiltration (8). I have shown in this chapter that the presence of
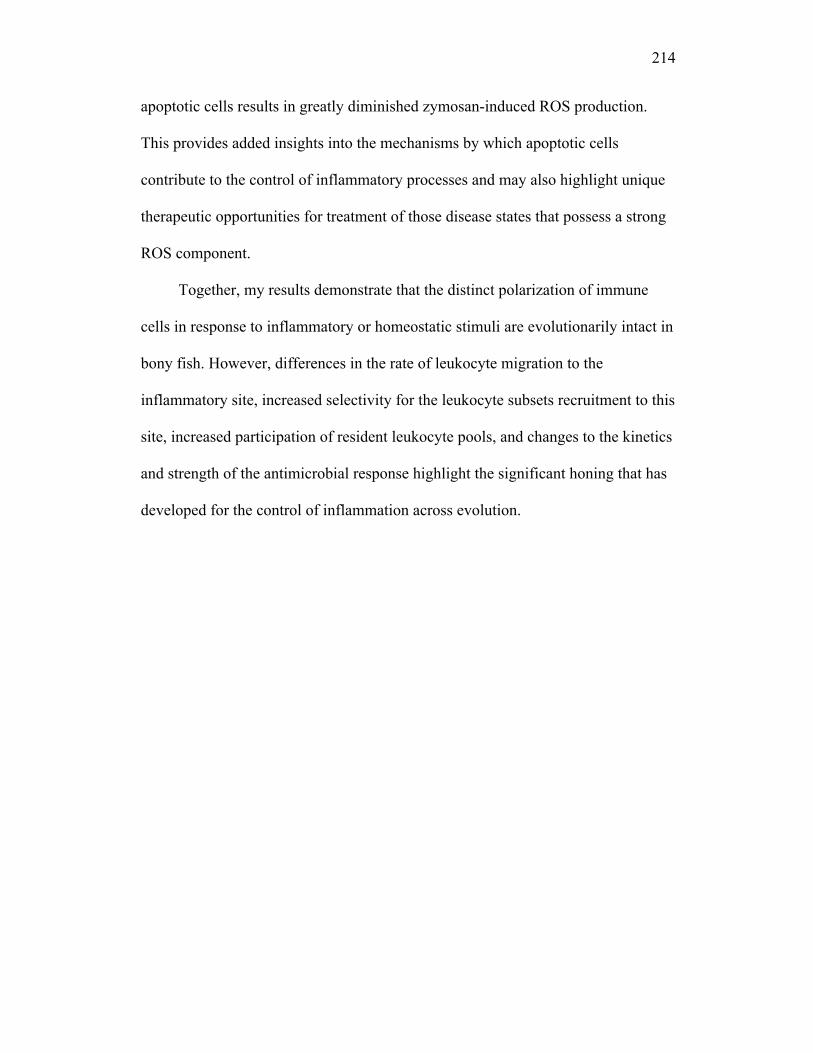
214
apoptotic cells results in greatly diminished zymosan-induced ROS production.
This provides added insights into the mechanisms by which apoptotic cells
contribute to the control of inflammatory processes and may also highlight unique
therapeutic opportunities for treatment of those disease states that possess a strong
ROS component.
Together, my results demonstrate that the distinct polarization of immune
cells in response to inflammatory or homeostatic stimuli are evolutionarily intact in
bony fish. However, differences in the rate of leukocyte migration to the
inflammatory site, increased selectivity for the leukocyte subsets recruitment to this
site, increased participation of resident leukocyte pools, and changes to the kinetics
and strength of the antimicrobial response highlight the significant honing that has
developed for the control of inflammation across evolution.
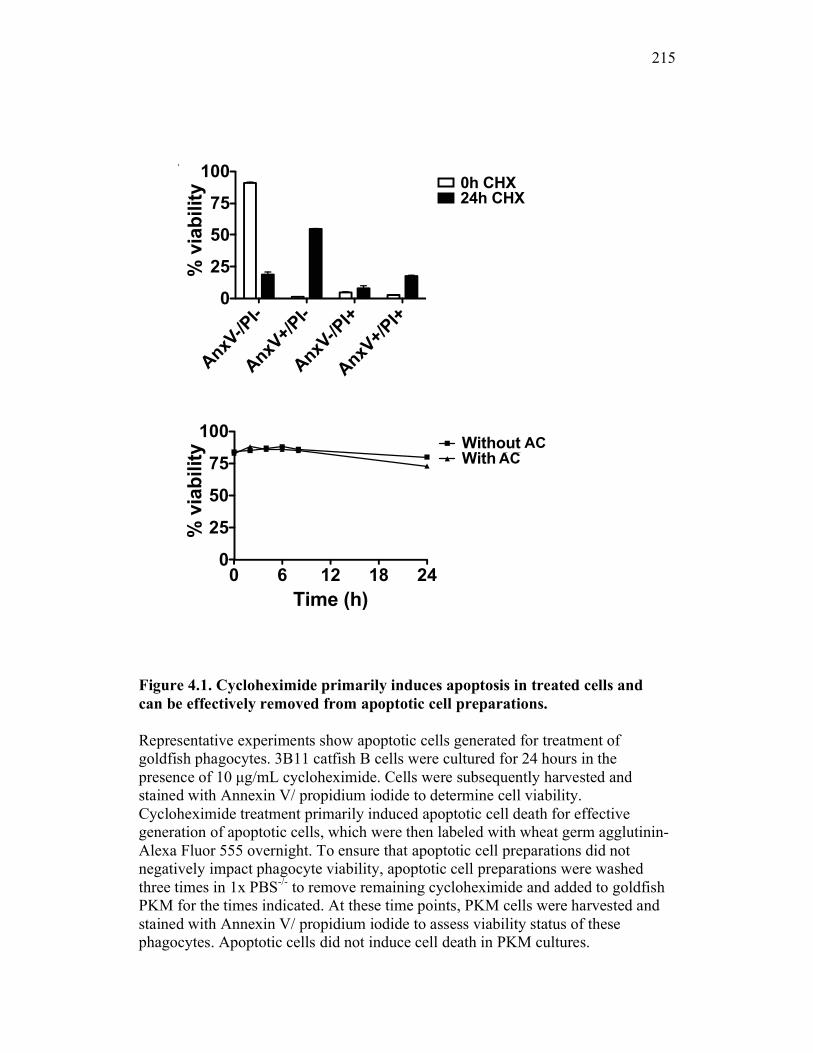
215
AnxV-/P
I-
AnxV+/P
I-
AnxV-/P
I+
AnxV+/P
I+0
25
50
75
100 0h CHX24h CHX
% v
iabi
lity
A
0 6 12 18 240
25
50
75
100 Without ABWith AB
Time (h)
% v
iabi
lity AC
AC
Figure 4.1. Cycloheximide primarily induces apoptosis in treated cells and can be effectively removed from apoptotic cell preparations. Representative experiments show apoptotic cells generated for treatment of goldfish phagocytes. 3B11 catfish B cells were cultured for 24 hours in the presence of 10 μg/mL cycloheximide. Cells were subsequently harvested and stained with Annexin V/ propidium iodide to determine cell viability. Cycloheximide treatment primarily induced apoptotic cell death for effective generation of apoptotic cells, which were then labeled with wheat germ agglutinin-Alexa Fluor 555 overnight. To ensure that apoptotic cell preparations did not negatively impact phagocyte viability, apoptotic cell preparations were washed three times in 1x PBS-/- to remove remaining cycloheximide and added to goldfish PKM for the times indicated. At these time points, PKM cells were harvested and stained with Annexin V/ propidium iodide to assess viability status of these phagocytes. Apoptotic cells did not induce cell death in PKM cultures.

216
No 3B11 Kidney0.0
0.5
1.0
1.5R
elat
ive
DH
R p
ositi
vity
Figure 4.2. Two distinct sources of apoptotic cells repress goldfish macrophage respiratory burst to equivalent levels. PKM cultures were incubated with apoptotic cells derived from 3B11 B cells or goldfish kidney leukocytes. Cells were incubated for 2 hours (5:1, particle: cell ratio) and respiratory burst was analyzed by DHR. There was no significant difference in PKM responses to 3B11-derived or kidney-derived apoptotic cells. n=4; *p<0.05 (One-way ANOVA; Tukey’s post-hoc); error bars show SEM.
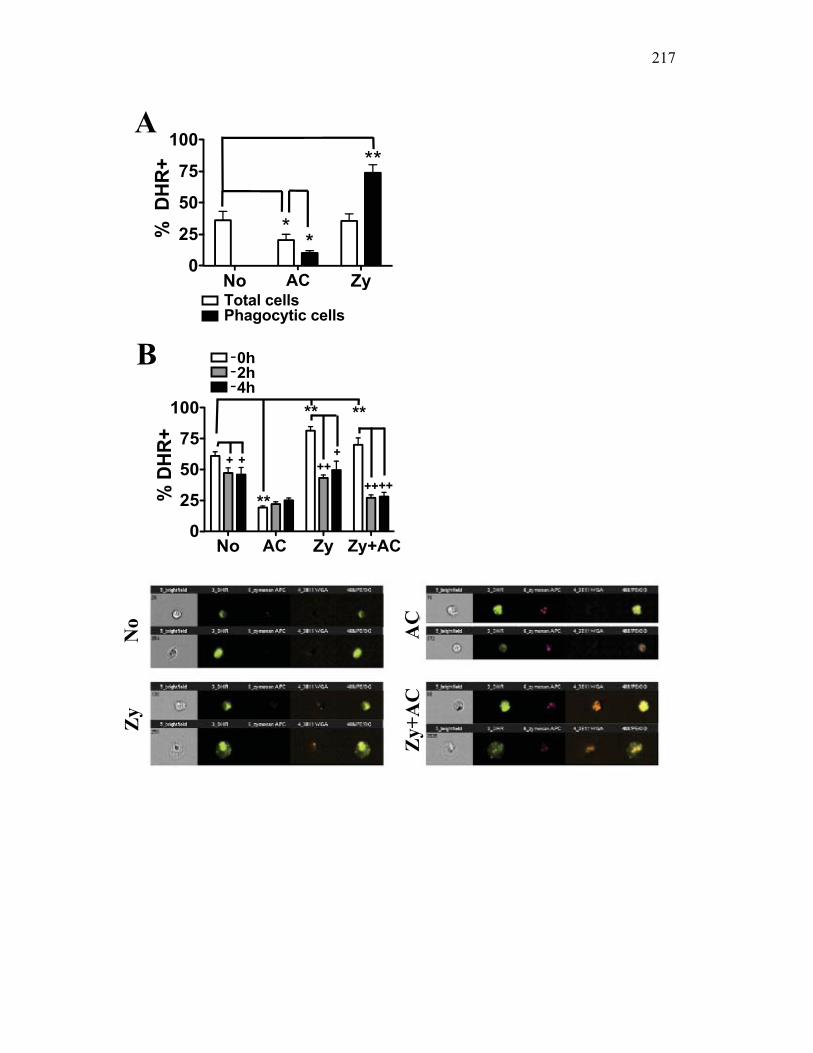
217
No AB Zy0
25
50
75
100%
DH
R+
Total cellsPhagocytic cells
A
* *
**
B
No AB Zy AB+Zy0
25
50
75
100
% D
HR+
**
** **
+ ++ + +
++ ++
2h4h
0h
AC
AC Zy+AC
y
No
Zy
AC
Z
y+A
C
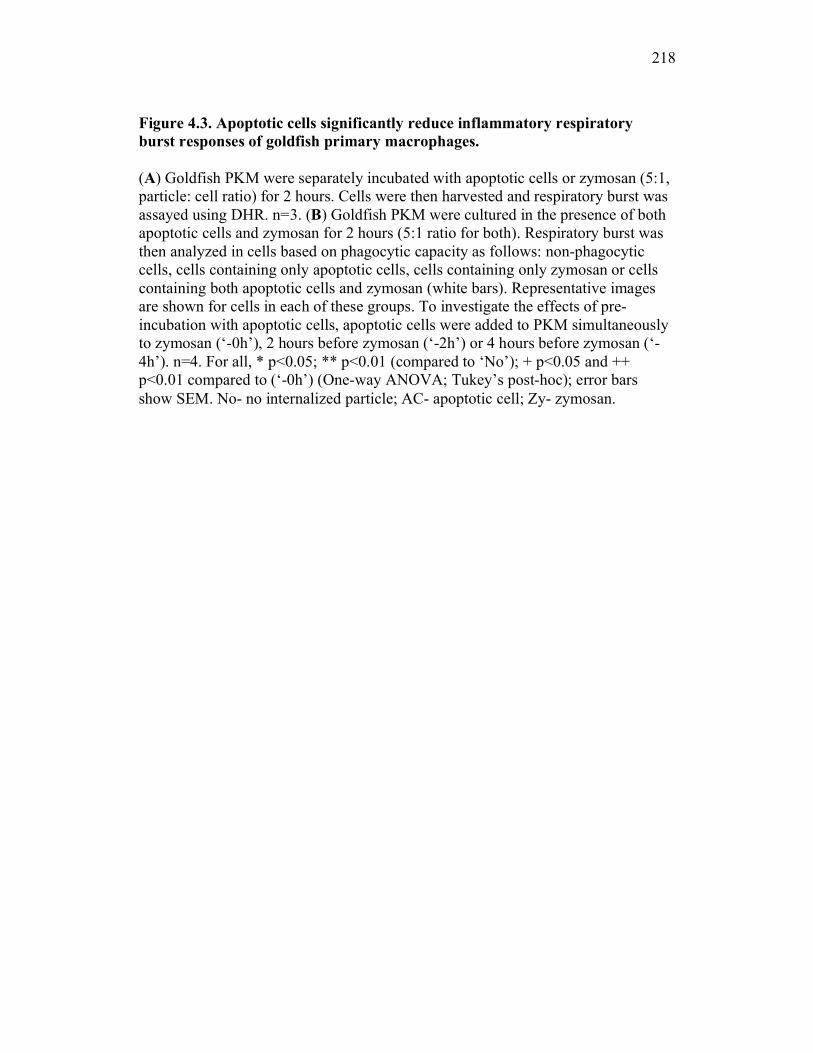
218
Figure 4.3. Apoptotic cells significantly reduce inflammatory respiratory burst responses of goldfish primary macrophages. (A) Goldfish PKM were separately incubated with apoptotic cells or zymosan (5:1, particle: cell ratio) for 2 hours. Cells were then harvested and respiratory burst was assayed using DHR. n=3. (B) Goldfish PKM were cultured in the presence of both apoptotic cells and zymosan for 2 hours (5:1 ratio for both). Respiratory burst was then analyzed in cells based on phagocytic capacity as follows: non-phagocytic cells, cells containing only apoptotic cells, cells containing only zymosan or cells containing both apoptotic cells and zymosan (white bars). Representative images are shown for cells in each of these groups. To investigate the effects of pre-incubation with apoptotic cells, apoptotic cells were added to PKM simultaneously to zymosan (‘-0h’), 2 hours before zymosan (‘-2h’) or 4 hours before zymosan (‘-4h’). n=4. For all, * p<0.05; ** p<0.01 (compared to ‘No’); + p<0.05 and ++ p<0.01 compared to (‘-0h’) (One-way ANOVA; Tukey’s post-hoc); error bars show SEM. No- no internalized particle; AC- apoptotic cell; Zy- zymosan.
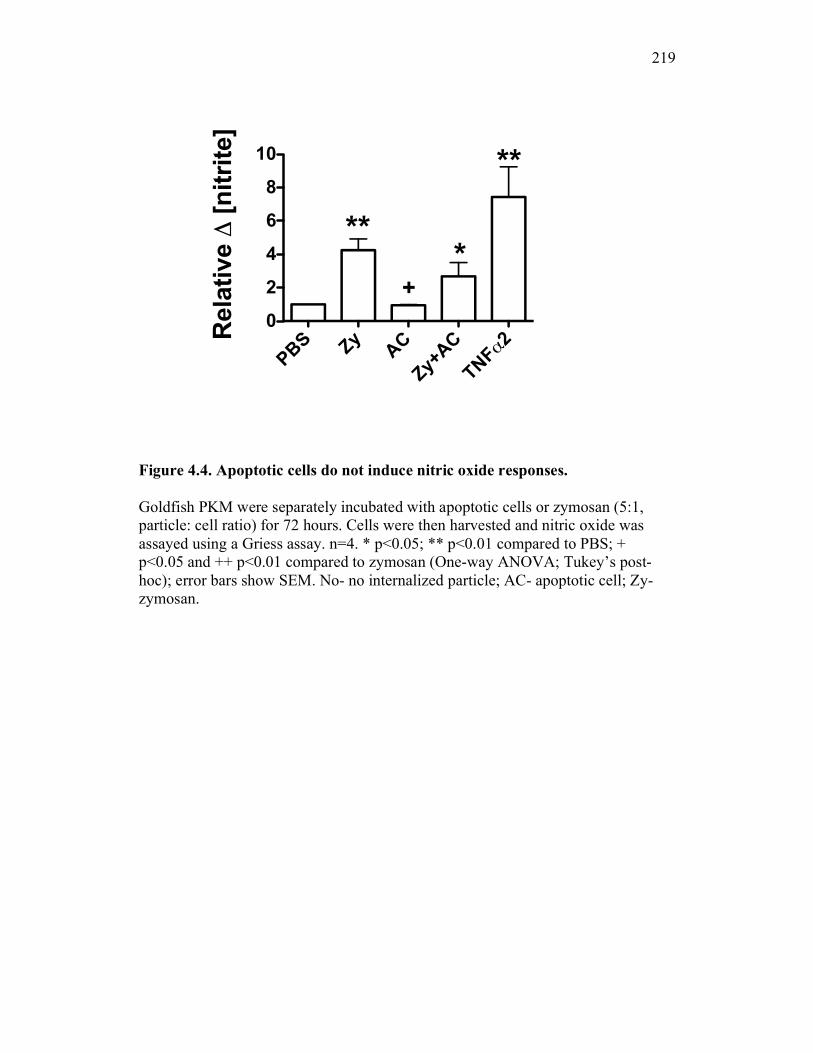
219
PBS Zy AC
Zy+AC
TNFα2
0
2
4
6
8
10
Rel
ativ
e Δ
[nitr
ite]
**+
**
*
Figure 4.4. Apoptotic cells do not induce nitric oxide responses. Goldfish PKM were separately incubated with apoptotic cells or zymosan (5:1, particle: cell ratio) for 72 hours. Cells were then harvested and nitric oxide was assayed using a Griess assay. n=4. * p<0.05; ** p<0.01 compared to PBS; + p<0.05 and ++ p<0.01 compared to zymosan (One-way ANOVA; Tukey’s post-hoc); error bars show SEM. No- no internalized particle; AC- apoptotic cell; Zy- zymosan.
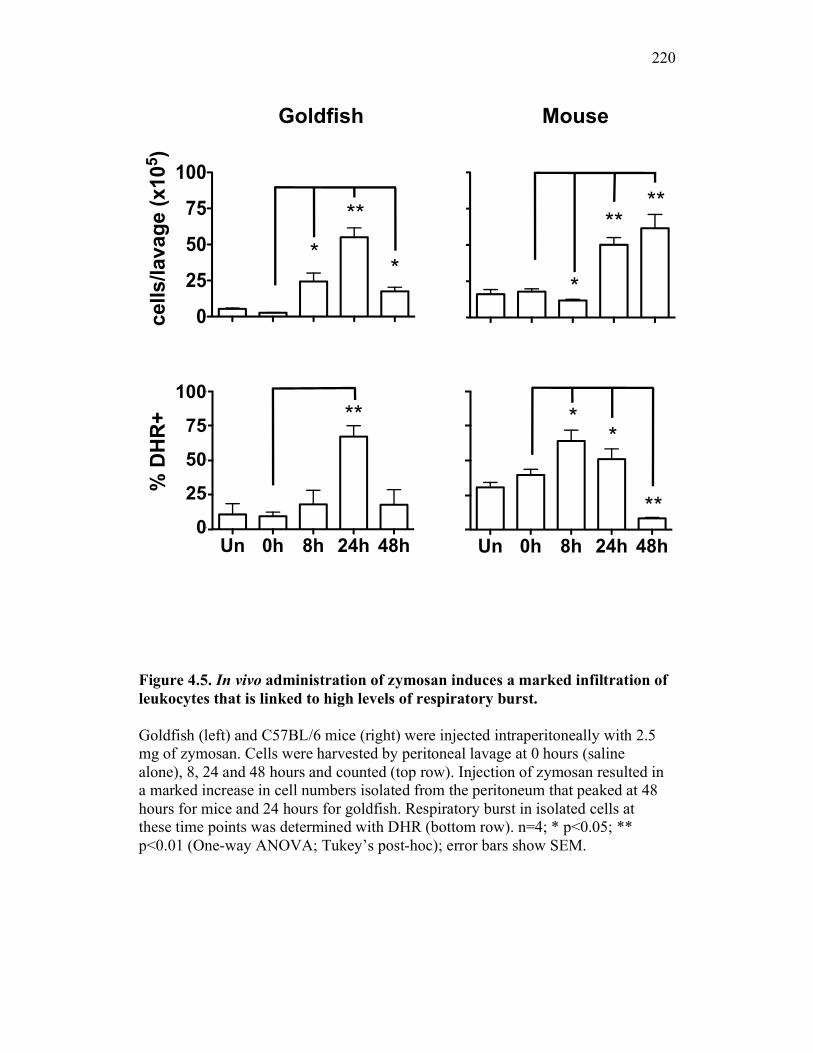
220
0
25
50
75
100
Mouse Goldfish
* *
**
Un 0h 8h 24h 48h
**
*
** **
Un 0h 8h 24h 48h
**
* *
cells
/lava
ge (x
105 )
% D
HR
+
0
25
50
75
100
Figure 4.5. In vivo administration of zymosan induces a marked infiltration of leukocytes that is linked to high levels of respiratory burst. Goldfish (left) and C57BL/6 mice (right) were injected intraperitoneally with 2.5 mg of zymosan. Cells were harvested by peritoneal lavage at 0 hours (saline alone), 8, 24 and 48 hours and counted (top row). Injection of zymosan resulted in a marked increase in cell numbers isolated from the peritoneum that peaked at 48 hours for mice and 24 hours for goldfish. Respiratory burst in isolated cells at these time points was determined with DHR (bottom row). n=4; * p<0.05; ** p<0.01 (One-way ANOVA; Tukey’s post-hoc); error bars show SEM.
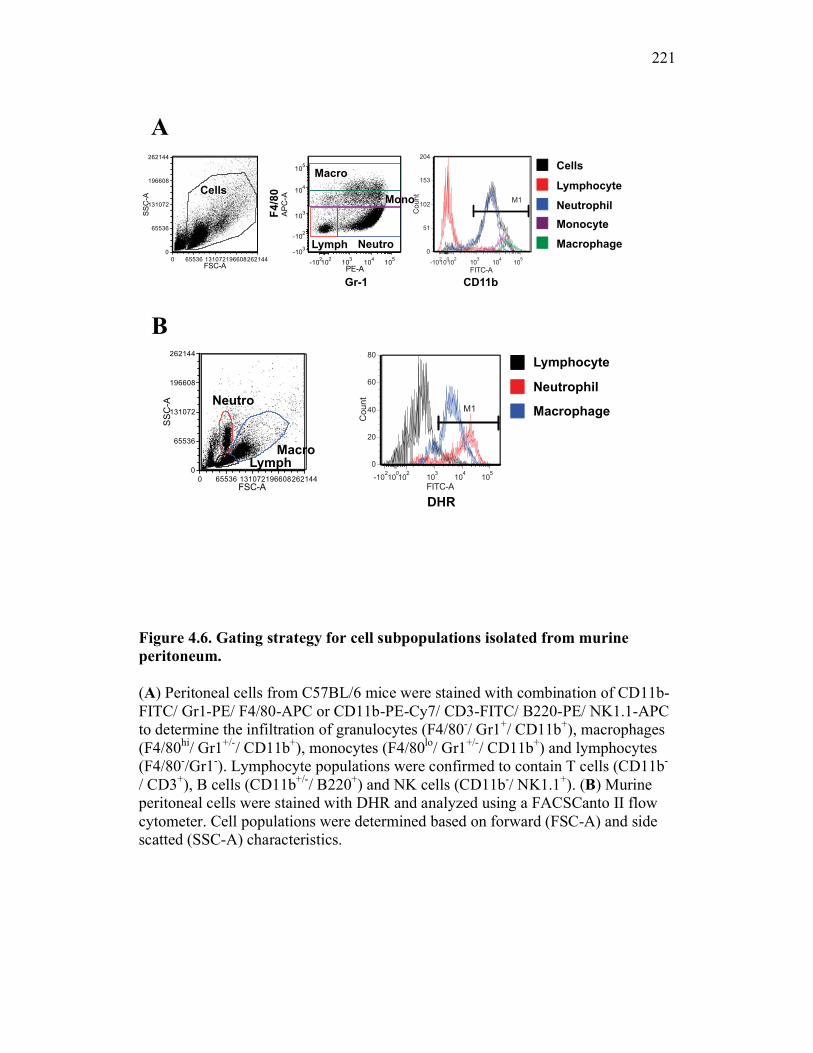
221
B
A
FSC-A
SS
C-A
0 65536 1310721966082621440
65536
131072
196608
262144
FITC-A
Cou
nt
-102100102 103 104 1050
51
102
153
204
M1
PE-A
AP
C-A
-102102 103 104 105-103
-102
103
104
105
Lymph Neutro
Mono
Macro
Gr-1 F4
/80
CD11b
Cells
Cells
Lymphocyte
Neutrophil Monocyte
Macrophage
FSC-A
SS
C-A
0 65536 1310721966082621440
65536
131072
196608
262144
FITC-A
Cou
nt
-102100102 103 104 1050
20
40
60
80
M1
Lymph
Neutro
Macro
DHR
Lymphocyte
Neutrophil
Macrophage
A
B
Figure 4.6. Gating strategy for cell subpopulations isolated from murine peritoneum. (A) Peritoneal cells from C57BL/6 mice were stained with combination of CD11b-FITC/ Gr1-PE/ F4/80-APC or CD11b-PE-Cy7/ CD3-FITC/ B220-PE/ NK1.1-APC to determine the infiltration of granulocytes (F4/80-/ Gr1+/ CD11b+), macrophages (F4/80hi/ Gr1+/-/ CD11b+), monocytes (F4/80lo/ Gr1+/-/ CD11b+) and lymphocytes (F4/80-/Gr1-). Lymphocyte populations were confirmed to contain T cells (CD11b-
/ CD3+), B cells (CD11b+/-/ B220+) and NK cells (CD11b-/ NK1.1+). (B) Murine peritoneal cells were stained with DHR and analyzed using a FACSCanto II flow cytometer. Cell populations were determined based on forward (FSC-A) and side scatted (SSC-A) characteristics.
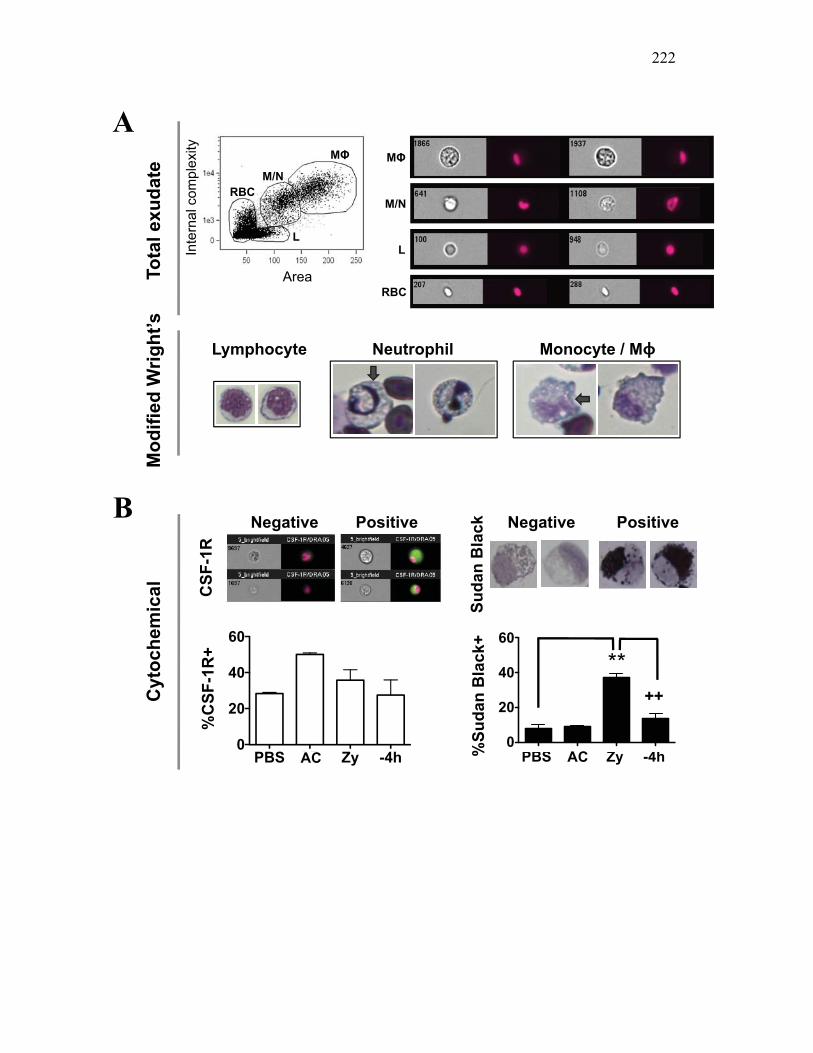
222
A
B
A
B
Neutrophil Monocyte / Mϕ
Mod
ified
Wrig
ht’s
C
ytoc
hem
ical
CSF
-1R
Negative Positive Negative Positive
Suda
n B
lack
Tota
l exu
date
Area
RBC
L
M/N
MΦ
RBC
L
M/N
MΦ
Inte
rnal
com
plex
ity
PBS AB Zy -4h0
20
40
60
0
20
40
60
PBS AB Zy -4h
** ++
%C
SF-1
R+
%Su
dan
Bla
ck+
Lymphocyte
AC AC
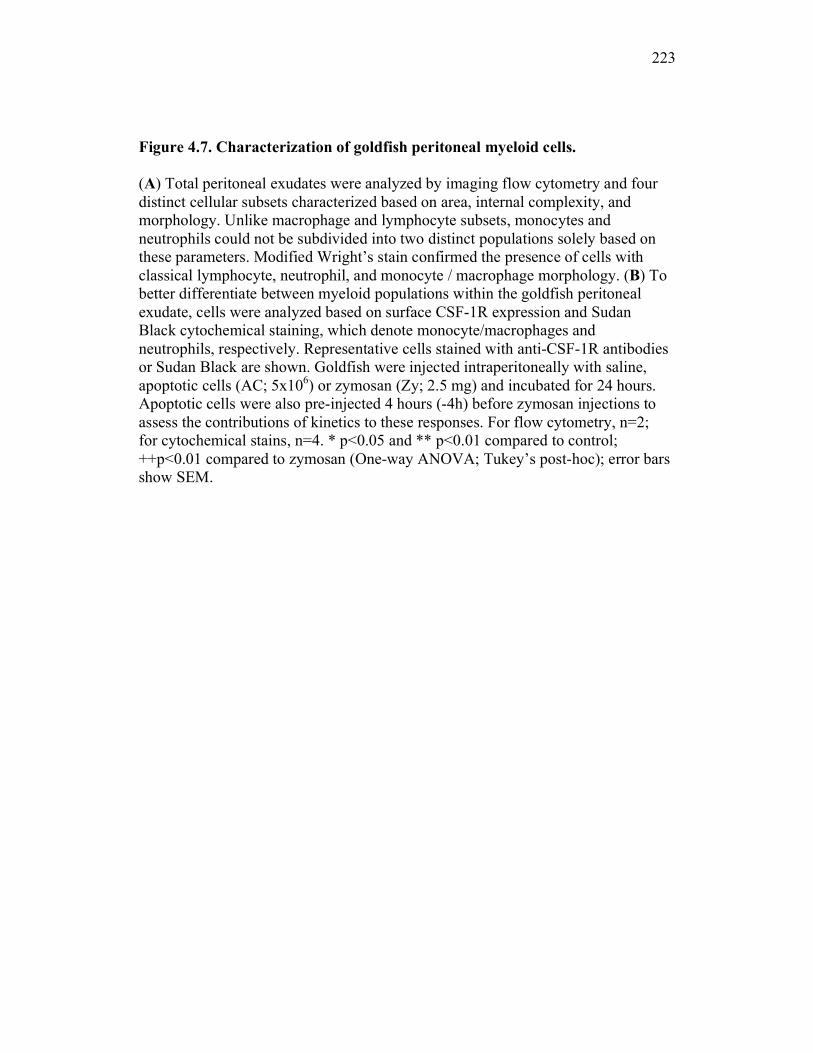
223
Figure 4.7. Characterization of goldfish peritoneal myeloid cells. (A) Total peritoneal exudates were analyzed by imaging flow cytometry and four distinct cellular subsets characterized based on area, internal complexity, and morphology. Unlike macrophage and lymphocyte subsets, monocytes and neutrophils could not be subdivided into two distinct populations solely based on these parameters. Modified Wright’s stain confirmed the presence of cells with classical lymphocyte, neutrophil, and monocyte / macrophage morphology. (B) To better differentiate between myeloid populations within the goldfish peritoneal exudate, cells were analyzed based on surface CSF-1R expression and Sudan Black cytochemical staining, which denote monocyte/macrophages and neutrophils, respectively. Representative cells stained with anti-CSF-1R antibodies or Sudan Black are shown. Goldfish were injected intraperitoneally with saline, apoptotic cells (AC; 5x10⁶) or zymosan (Zy; 2.5 mg) and incubated for 24 hours. Apoptotic cells were also pre-injected 4 hours (-4h) before zymosan injections to assess the contributions of kinetics to these responses. For flow cytometry, n=2; for cytochemical stains, n=4. * p<0.05 and ** p<0.01 compared to control; ++p<0.01 compared to zymosan (One-way ANOVA; Tukey’s post-hoc); error bars show SEM.
224
PBS AB Zy -4h0
20
40
60
80
PBS AB Zy -4h0
20
40
60
80
PBS A.B. Zy -4h0
10
20
30
40
cells
/lava
ge (x
105 )
PBS AB Zy -4h0
10
20
30
40
PBS A.B. Zy -4h0
10
20
30
40
cells
/lava
ge (x
105 )
PBS AB Zy -4h0
10
20
30
40
PBS A.B. Zy -4h0
10
20
30
40
cells
/lava
ge (x
105 )
PBS AB Zy -4h0
10
20
30
40
Mouse Goldfish
Neu
trop
hil
Mon
ocyt
e/Mϕ
Lym
phoc
yte
** **
*
* **
** **
++
**
** **
++
**
** **
++
+
cells
/lava
ge (x
105 )
Tota
l
*
** **
++ **
* +
AC AC
AC AC
AC AC
AC AC
225
Figure 4.8. Pro-inflammatory (zymosan) and homeostatic (apoptotic cells) stimuli differentially impact leukocyte infiltration profiles in goldfish and mice. Goldfish and C57BL/6 mice were injected intraperitoneally with saline, apoptotic cells (5x10⁶) or zymosan (2.5 mg). Apoptotic cells were also pre-injected 4 hours before zymosan injections. Goldfish leukocyte populations were defined by imaging flow cytometry (area, internal complexity, and morphology) and staining patterns with Sudan Black and an anti-CSF-1R antibody. Murine cells were defined based on surface markers for neutrophils (F4/80-/ Gr1+/ CD11b+), monocytes (F4/80lo/ Gr1+/-/ CD11b+), macrophages (F4/80hi/ Gr1+/-/ CD11b+) and lymphocytes (F4/80-/Gr1-; CD3, B220, NK1.1). n=4; * p<0.05 and ** p<0.01 compared to control; + p<0.05 and ++ p<0.01 compared to zymosan (One-way ANOVA; Tukey’s post-hoc); error bars show SEM. No- no internalized particle; AB- apoptotic body; Zy- zymosan.
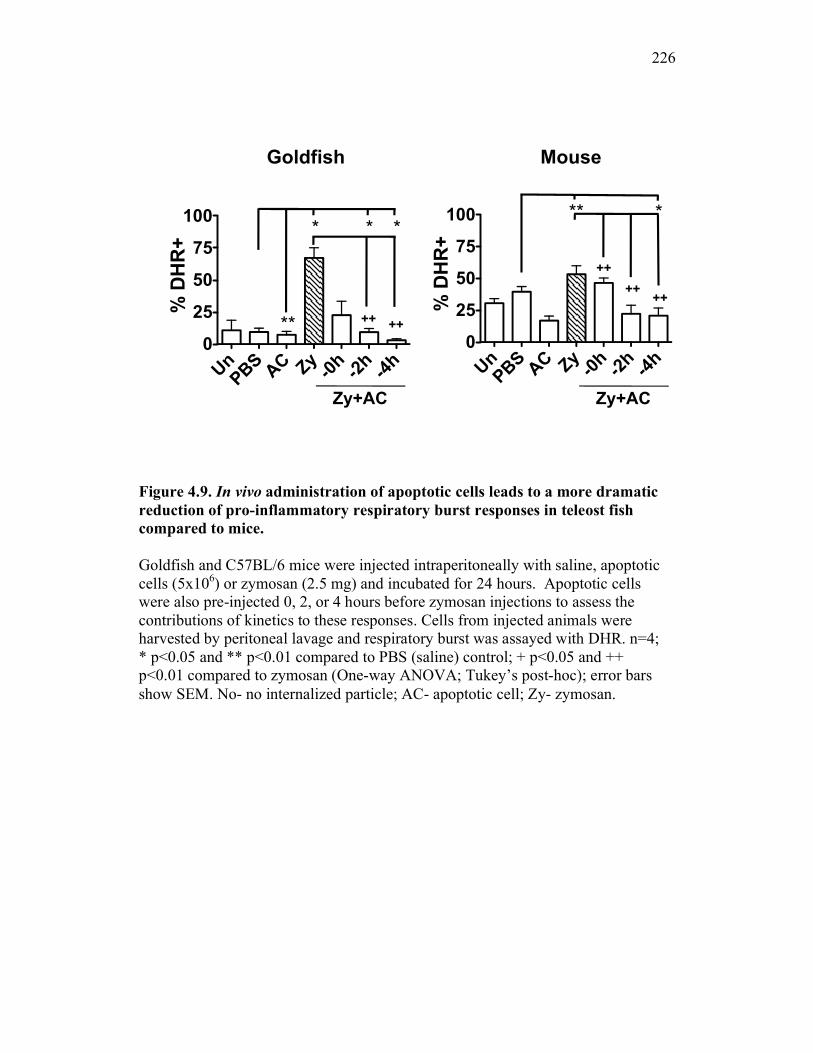
226
UnPBS AC Zy -0h -2h -4h
0
25
50
75
100
% D
HR
+
Zy+AC
**
* * *
++ ++
UnPBS AC Zy -0h -2h -4h
0
25
50
75
100
% D
HR
+
** *
++ ++
++
Zy+AC
Mouse Goldfish
Figure 4.9. In vivo administration of apoptotic cells leads to a more dramatic reduction of pro-inflammatory respiratory burst responses in teleost fish compared to mice. Goldfish and C57BL/6 mice were injected intraperitoneally with saline, apoptotic cells (5x10⁶) or zymosan (2.5 mg) and incubated for 24 hours. Apoptotic cells were also pre-injected 0, 2, or 4 hours before zymosan injections to assess the contributions of kinetics to these responses. Cells from injected animals were harvested by peritoneal lavage and respiratory burst was assayed with DHR. n=4; * p<0.05 and ** p<0.01 compared to PBS (saline) control; + p<0.05 and ++ p<0.01 compared to zymosan (One-way ANOVA; Tukey’s post-hoc); error bars show SEM. No- no internalized particle; AC- apoptotic cell; Zy- zymosan.
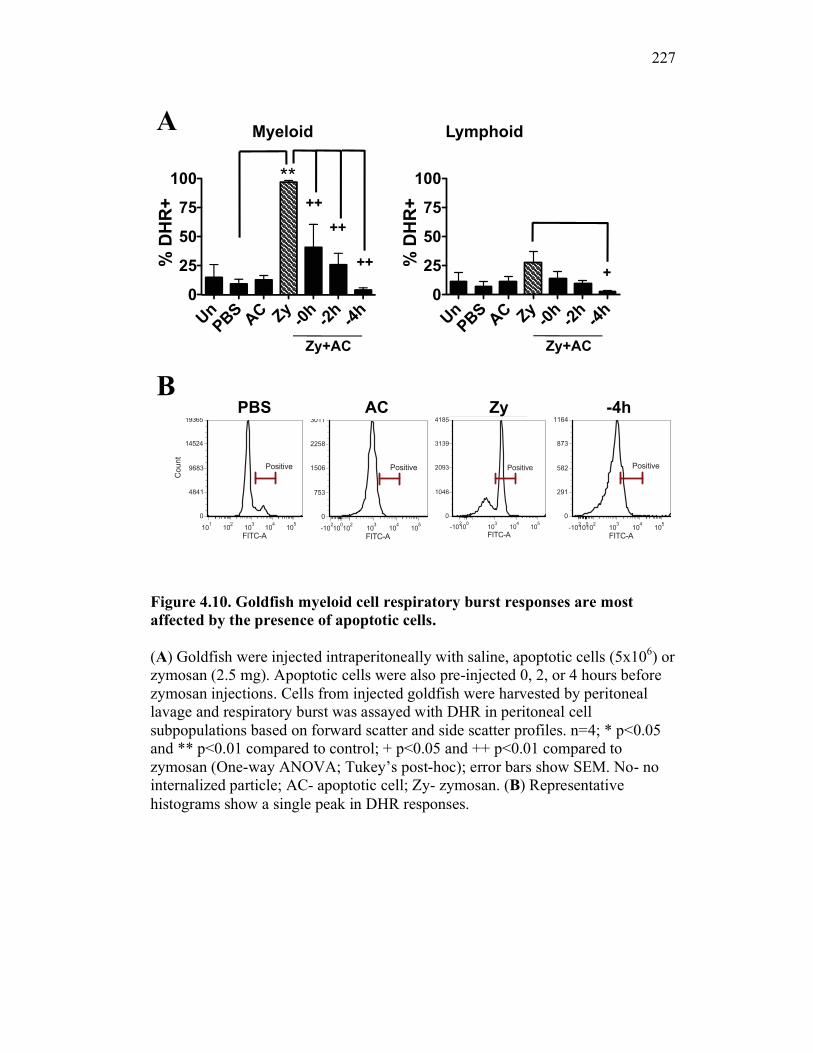
227
UnPBS AC Zy -0h -2h -4h
0
25
50
75
100%
DH
R+
UnPBS AC Zy -0h -2h -4h
0
25
50
75
100
% D
HR
+
FITC-A101 102 103 104 1050
4841
9683
14524
19365
Positive
A
B Zy+AC Zy+AC
Myeloid Lymphoid
** ++
++
++ +
Cou
nt
FITC-A-102100102 103 104 1050
753
1506
2258
3011
Positive
FITC-A-102100 103 104 105
0
1046
2093
3139
4185
Positive
FITC-A-102100102 103 104 105
0
291
582
873
1164
Positive
Zy -4h AC PBS
Figure 4.10. Goldfish myeloid cell respiratory burst responses are most affected by the presence of apoptotic cells. (A) Goldfish were injected intraperitoneally with saline, apoptotic cells (5x10⁶) or zymosan (2.5 mg). Apoptotic cells were also pre-injected 0, 2, or 4 hours before zymosan injections. Cells from injected goldfish were harvested by peritoneal lavage and respiratory burst was assayed with DHR in peritoneal cell subpopulations based on forward scatter and side scatter profiles. n=4; * p<0.05 and ** p<0.01 compared to control; + p<0.05 and ++ p<0.01 compared to zymosan (One-way ANOVA; Tukey’s post-hoc); error bars show SEM. No- no internalized particle; AC- apoptotic cell; Zy- zymosan. (B) Representative histograms show a single peak in DHR responses.
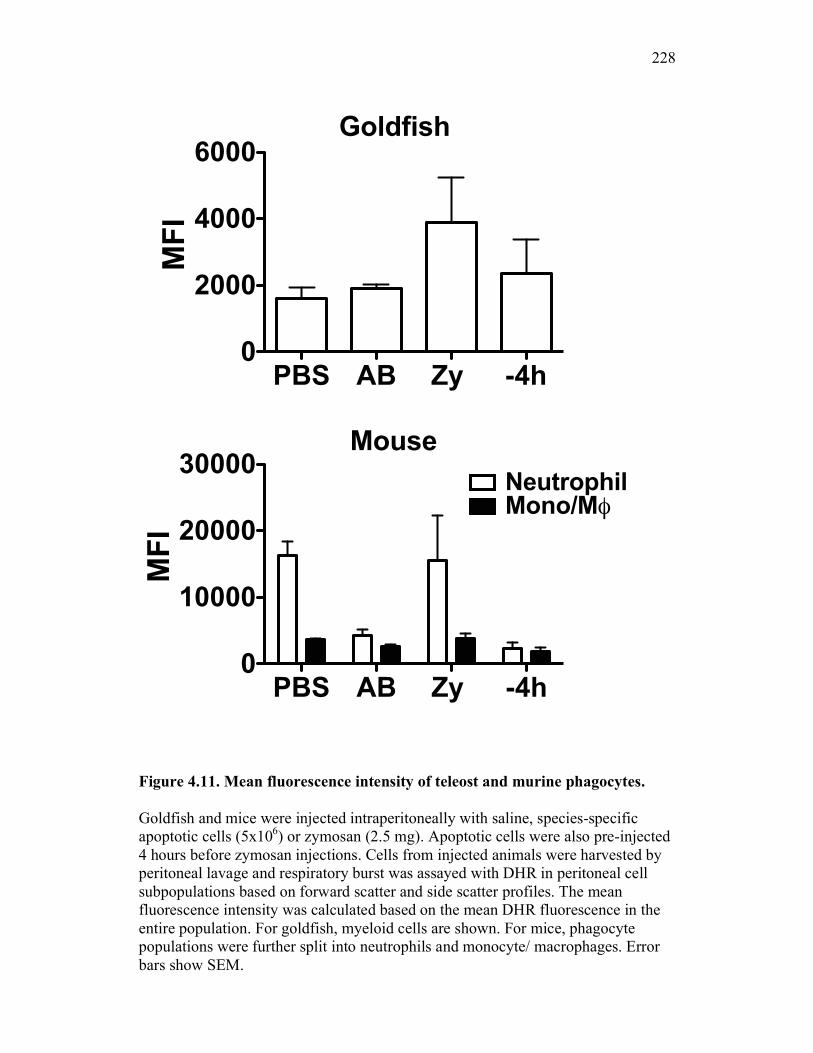
228
Figure 4.11. Mean fluorescence intensity of teleost and murine phagocytes. Goldfish and mice were injected intraperitoneally with saline, species-specific apoptotic cells (5x10⁶) or zymosan (2.5 mg). Apoptotic cells were also pre-injected 4 hours before zymosan injections. Cells from injected animals were harvested by peritoneal lavage and respiratory burst was assayed with DHR in peritoneal cell subpopulations based on forward scatter and side scatter profiles. The mean fluorescence intensity was calculated based on the mean DHR fluorescence in the entire population. For goldfish, myeloid cells are shown. For mice, phagocyte populations were further split into neutrophils and monocyte/ macrophages. Error bars show SEM.
PBS AB Zy -4h0
2000
4000
6000M
FI
PBS AB Zy -4h0
10000
20000
30000 NeutrophilMono/Mφ
MFI
Goldfish
Mouse
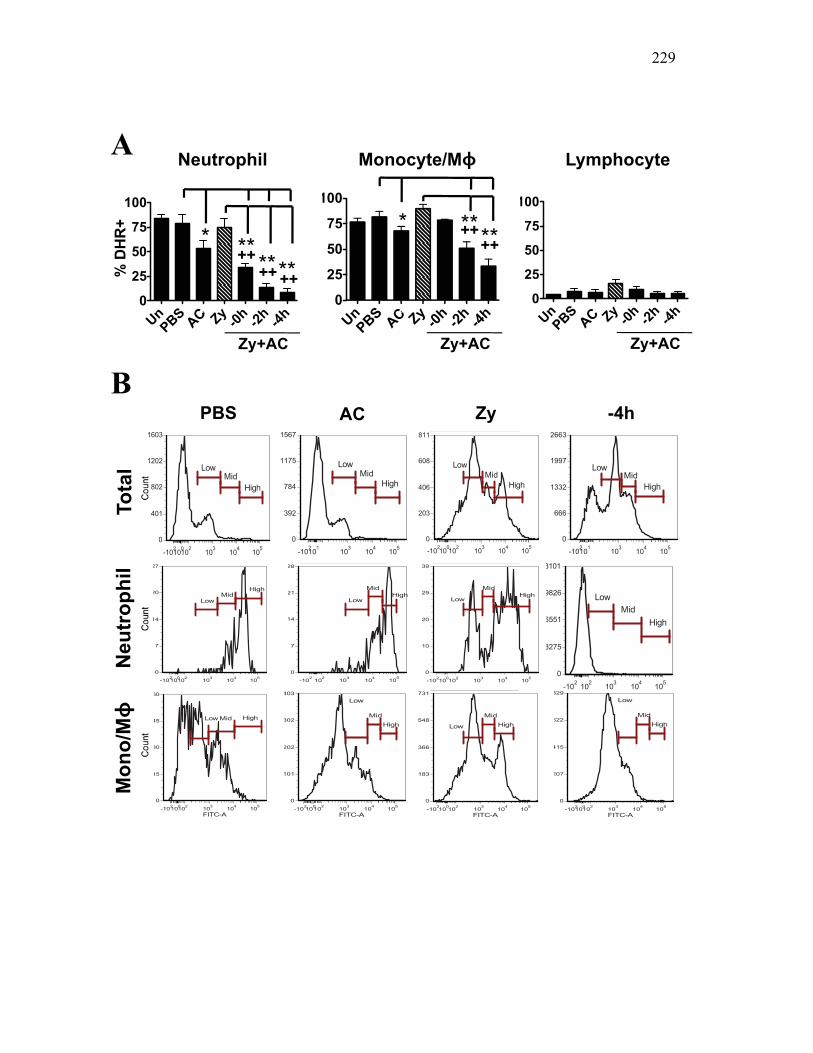
229
UnPBS AB Zy -0h -2h -4h
0
25
50
75
100
UnPBS AB Zy -0h -2h -4h
0
25
50
75
100
% D
HR
+
UnPBS AB Zy -0h -2h -4h
0
25
50
75
100
Zy+AC Zy+AC Zy+AC
Neutrophil Lymphocyte Monocyte/Mϕ
** ** **
* ++
++ ++
** * ** ++ ++
A
B Zy -4h AC PBS
Neu
trop
hil
Mon
o/Mϕ
-102100102 103 104 1050
7
14
20
27
HighMid
Low
FITC-A-102100102 103 104 105
0
15
30
45
60
HighMidLow
-102 102 103 104 1050
7
14
21
28
Low
MidHigh
FITC-A-102100102 103 104 105
0
101
202
302
403
HighMid
Low
-102100102 103 104 1050
10
20
29
39
Low
MidHigh
FITC-A-102100102 103 104 1050
183
366
548
731
Low
MidHigh
FITC-A-102100102 103 104 105
0
207
415
622
829
HighMid
Low
-102 102 103 104 1050
3275
6551
9826
3101
LowMid
High
-102100102 103 104 1050
401
802
1202
1603
LowMid
High
-102101 103 104 1050
392
784
1175
1567
LowMid
High
-102100102 103 104 1050
203
406
608
811
LowMid
High
Cou
nt-102101 103 104 105
0
666
1332
1997
2663
LowMid
High
Tota
l
AC
AC
AC
230
Figure 4.12. Murine neutrophil respiratory burst antimicrobial responses are most greatly affected by the presence of apoptotic cells. (A) C57BL/6 mice were injected intraperitoneally with saline, apoptotic cells (5x10⁶) or zymosan (2.5 mg). Apoptotic cells were also pre-injected 0, 2, or 4 hours before zymosan injections. Cells from injected mice were harvested by peritoneal lavage and respiratory burst was assayed with DHR in peritoneal cell subpopulations based on forward scatter and side scatter profiles. n=4; * p<0.05 and ** p<0.01 compared to control; + p<0.05 and ++ p<0.01 compared to zymosan (One-way ANOVA; Tukey’s post-hoc); error bars show SEM. No- no internalized particle; AC- apoptotic cell; Zy- zymosan. (B) Histograms show representative DHR responses for total leukocytes, neutrophils and monocytes/macrophages. We found that the high responders were predominantly neutrophils (>90%). Pre-incubation with apoptotic cells resulted in a preferential switch in the neutrophil population from high responders to mid/low responders.
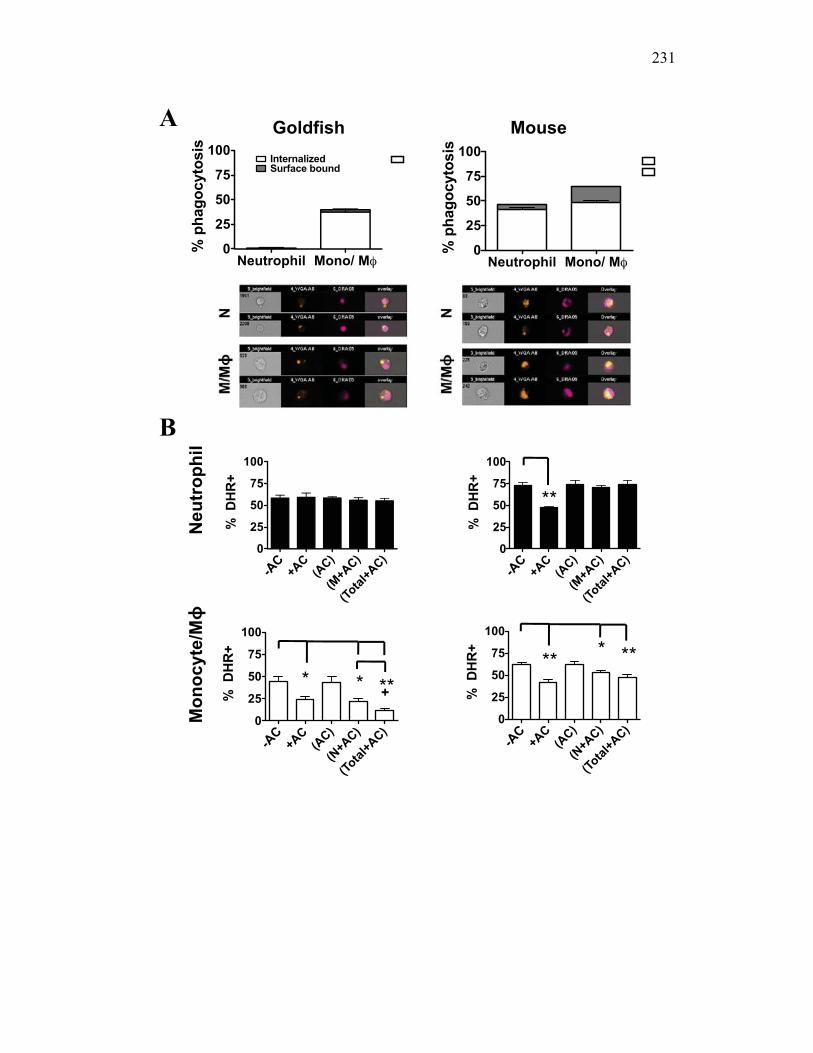
231
Unstim
+AC
(AC)
(M+A
C)
(Total
+AC)
0
25
50
75
100
% D
HR
+
Unstim
+AC
(AC)
(M+A
C)
(Total
+AC)
0
25
50
75
100%
DH
R+
Unstim
+AC
(AC)
(N+A
C)
(Total
+AC)
0
25
50
75
100
% D
HR
+
Unstim
+AC
(AC)
(N+A
C)
(Total
+AC)
0
25
50
75
100
% D
HR
+
+ * * **
Mon
ocyt
e/Mϕ
B
Neu
trop
hil
**
** ** *
Neutrophil Mono/ M0
25
50
75
100
% p
hago
cyto
sis
Neutrophil Mono/ M0
25
50
75
100
% p
hago
cyto
sis
InternalizedSurface bound
Mouse A Goldfish
A
B
-AC
-AC
-AC
-AC
232
Figure 4.13. Apoptotic cells downregulate murine neutrophil ROS production in a contact dependent manner. Goldfish (left) and C57BL/6 mice (right) were injected intraperitoneally with zymosan (2.5 mg). Activated peritoneal cells from were harvested by peritoneal lavage and subpopulations were isolated by density centrifugation. (A) Separated neutrophil or mononuclear populations were incubated with labeled apoptotic cells for 2 hours and internalization was analyzed. n=4; * p<0.05 and ** p<0.01 (One-way ANOVA; Tukey’s post-hoc); error bars show SEM; Mono/Mϕ= monocytes/ macrophage. (B) Isolated populations were cultured for 2 hours in the presence of the indicated stimuli. Conditions denoted within brackets were contained within a 4 μm transwell. After 2 hours, responder cells outside the transwells were harvested and respiratory burst was assayed using DHR. n=4; * p<0.05 and ** p<0.01 (One-way ANOVA; Tukey’s post-hoc); error bars show SEM; Mono/Mϕ= monocytes/ macrophage.
233
4.4 References
1. Poon, I.K.H., Hulett, M.D., and Parish, C.R. 2010. Molecular mechanisms of late apoptotic/necrotic cell clearance. Cell Death Differ 17:381-397.
2. Gregory, C.D., and Devitt, A. 2004. The macrophage and the apoptotic cell: an innate immune interaction viewed simplistically? Immunology 113:1-14.
3. Duffield, J.S. 2003. The inflammatory macrophage: a story of Jekyll and Hyde. Clin Sci (Lond) 104:27-38.
4. Soehnlein, O., and Lindbom, L. 2010. Phagocyte partnership during the onset and resolution of inflammation. Nat Rev Immunol 10:427-439.
5. Zamboni, D.S., and Rabinovitch, M. 2003. Nitric oxide partially controls Coxiella burnetii phase II infection in mouse primary macrophages. Infect Immun 71:1225-1233.
6. Johann, A.M., von Knethen, A., Lindemann, D., and Brune, B. 2006. Recognition of apoptotic cells by macrophages activates the peroxisome proliferator-activated receptor-gamma and attenuates the oxidative burst. Cell Death Differ 13:1533-1540.
7. Reiter, I., Krammer, B., and Schwamberger, G. 1999. Cutting edge: differential effect of apoptotic versus necrotic tumor cells on macrophage antitumor activities. J Immunol 163:1730-1732.
8. Huynh, M.L., Fadok, V.A., and Henson, P.M. 2002. Phosphatidylserine-dependent ingestion of apoptotic cells promotes TGF-beta1 secretion and the resolution of inflammation. J Clin Invest 109:41-50.
9. Potter, P.K., Cortes-Hernandez, J., Quartier, P., Botto, M., and Walport, M.J. 2003. Lupus-prone mice have an abnormal response to thioglycolate and an impaired clearance of apoptotic cells. J Immunol 170:3223-3232.
10. Fadok, V.A., Bratton, D.L., Konowal, A., Freed, P.W., Westcott, J.Y., and Henson, P.M. 1998. Macrophages that have ingested apoptotic cells in vitro inhibit proinflammatory cytokine production through autocrine/paracrine mechanisms involving TGF-beta, PGE2, and PAF. J Clin Invest 101:890-898.
11. Maderna, P., and Godson, C. 2003. Phagocytosis of apoptotic cells and the resolution of inflammation. Biochim Biophys Acta 1639:141-151.
12. Weigert, A., Jennewein, C., and Brune, B. 2009. The liaison between apoptotic cells and macrophages--the end programs the beginning. Biol Chem 390:379-390.
13. Voll, R.E., Herrmann, M., Roth, E.A., Stach, C., Kalden, J.R., and Girkontaite, I. 1997. Immunosuppressive effects of apoptotic cells. Nature 390:350-351.
14. Bellingan, G.J., Caldwell, H., Howie, S.E., Dransfield, I., and Haslett, C. 1996. In vivo fate of the inflammatory macrophage during the resolution of inflammation: inflammatory macrophages do not die locally, but emigrate to the draining lymph nodes. J Immunol 157:2577-2585.
15. Stark, M.A., Huo, Y., Burcin, T.L., Morris, M.A., Olson, T.S., and Ley, K. 2005. Phagocytosis of apoptotic neutrophils regulates granulopoiesis via IL-23 and IL-17. Immunity 22:285-294.
234
16. Tassiulas, I., Park-Min, K.H., Hu, Y., Kellerman, L., Mevorach, D., and Ivashkiv, L.B. 2007. Apoptotic cells inhibit LPS-induced cytokine and chemokine production and IFN responses in macrophages. Hum Immunol 68:156-164.
17. Kim, S., Elkon, K.B., and Ma, X. 2004. Transcriptional suppression of interleukin-12 gene expression following phagocytosis of apoptotic cells. Immunity 21:643-653.
18. Serinkan, B.F., Gambelli, F., Potapovich, A.I., Babu, H., Di Giuseppe, M., Ortiz, L.A., Fabisiak, J.P., and Kagan, V.E. 2005. Apoptotic cells quench reactive oxygen and nitrogen species and modulate TNF-alpha/TGF-beta1 balance in activated macrophages: involvement of phosphatidylserine-dependent and -independent pathways. Cell Death Differ 12:1141-1144.
19. Anderson, H.A., Englert, R., Gursel, I., and Shacter, E. 2002. Oxidative stress inhibits the phagocytosis of apoptotic cells that have externalized phosphatidylserine. Cell Death Differ 9:616-625.
20. Bianchi, S.M., Prince, L.R., McPhillips, K., Allen, L., Marriott, H.M., Taylor, G.W., Hellewell, P.G., Sabroe, I., Dockrell, D.H., Henson, P.W., et al. 2008. Impairment of apoptotic cell engulfment by pyocyanin, a toxic metabolite of Pseudomonas aeruginosa. Am J Respir Crit Care Med 177:35-43.
21. Fadeel, B., Xue, D., and Kagan, V. 2010. Programmed cell clearance: molecular regulation of the elimination of apoptotic cell corpses and its role in the resolution of inflammation. Biochem Biophys Res Commun 396:7-10.
22. Erwig, L.P., and Henson, P.M. 2007. Immunological consequences of apoptotic cell phagocytosis. Am J Pathol 171:2-8.
23. Fullard, J.F., Kale, A., and Baker, N.E. 2009. Clearance of apoptotic corpses. Apoptosis 14:1029-1037.
24. Bannenberg, G.L., Chiang, N., Ariel, A., Arita, M., Tjonahen, E., Gotlinger, K.H., Hong, S., and Serhan, C.N. 2005. Molecular circuits of resolution: formation and actions of resolvins and protectins. J Immunol 174:4345-4355.
25. Ariel, A., Fredman, G., Sun, Y.P., Kantarci, A., Van Dyke, T.E., Luster, A.D., and Serhan, C.N. 2006. Apoptotic neutrophils and T cells sequester chemokines during immune response resolution through modulation of CCR5 expression. Nat Immunol 7:1209-1216.
26. Schwab, J.M., Chiang, N., Arita, M., and Serhan, C.N. 2007. Resolvin E1 and protectin D1 activate inflammation-resolution programmes. Nature 447:869-874.
27. Chadzinska, M., Leon-Kloosterziel, K.M., Plytycz, B., and Lidy Verburg-van Kemenade, B.M. 2008. In vivo kinetics of cytokine expression during peritonitis in carp: evidence for innate and alternative macrophage polarization. Dev Comp Immunol 32:509-518.
28. Cash, J.L., White, G.E., and Greaves, D.R. 2009. Chapter 17. Zymosan-induced peritonitis as a simple experimental system for the study of inflammation. Methods Enzymol 461:379-396.
235
29. Kolaczkowska, E., Barteczko, M., Plytycz, B., and Arnold, B. 2008. Role of lymphocytes in the course of murine zymosan-induced peritonitis. Inflamm Res 57:272-278.
30. Vandivier, R.W., Fadok, V.A., Hoffmann, P.R., Bratton, D.L., Penvari, C., Brown, K.K., Brain, J.D., Accurso, F.J., and Henson, P.M. 2002. Elastase-mediated phosphatidylserine receptor cleavage impairs apoptotic cell clearance in cystic fibrosis and bronchiectasis. J Clin Invest 109:661-670.
31. Gantner, B.N., Simmons, R.M., Canavera, S.J., Akira, S., and Underhill, D.M. 2003. Collaborative induction of inflammatory responses by dectin-1 and Toll-like receptor 2. J Exp Med 197:1107-1117.
32. Herre, J., Marshall, A.S., Caron, E., Edwards, A.D., Williams, D.L., Schweighoffer, E., Tybulewicz, V., Reis e Sousa, C., Gordon, S., and Brown, G.D. 2004. Dectin-1 uses novel mechanisms for yeast phagocytosis in macrophages. Blood 104:4038-4045.
33. Pini, M., and Fantuzzi, G. 2010. Enhanced production of IL-17A during zymosan-induced peritonitis in obese mice. J Leukoc Biol 87:51-58.
34. Cuzzocrea, S., Zingarelli, B., Sautebin, L., Rizzo, A., Crisafulli, C., Campo, G.M., Costantino, G., Calapai, G., Nava, F., Di Rosa, M., et al. 1997. Multiple organ failure following zymosan-induced peritonitis is mediated by nitric oxide. Shock 8:268-275.
35. Neumann, N.F., Barreda, D.R., and Belosevic, M. 2000. Generation and functional analysis of distinct macrophage sub-populations from goldfish (Carassius auratus L.) kidney leukocyte cultures. Fish Shellfish Immunol 10:1-20.
36. Neumann, N.F., Barreda, D., and Belosevic, M. 1998. Production of a macrophage growth factor(s) by a goldfish macrophage cell line and macrophages derived from goldfish kidney leukocytes. Dev Comp Immunol 22:417-432.
37. Katzenback, B.A., and Belosevic, M. 2009. Isolation and functional characterization of neutrophil-like cells, from goldfish (Carassius auratus L.) kidney. Dev Comp Immunol 33:601-611.
38. Christenson, K., Bjorkman, L., Karlsson, J., Sundqvist, M., Movitz, C., Speert, D.P., Dahlgren, C., and Bylund, J. In vivo-transmigrated human neutrophils are resistant to antiapoptotic stimulation. J Leukoc Biol 90:1055-1063.
39. Goodridge, H.S., Simmons, R.M., and Underhill, D.M. 2007. Dectin-1 stimulation by Candida albicans yeast or zymosan triggers NFAT activation in macrophages and dendritic cells. J Immunol 178:3107-3115.
40. Underhill, D.M. 2003. Macrophage recognition of zymosan particles. J Endotoxin Res 9:176-180.
41. Esmann, L., Idel, C., Sarkar, A., Hellberg, L., Behnen, M., Moller, S., van Zandbergen, G., Klinger, M., Kohl, J., Bussmeyer, U., et al. 2009. Phagocytosis of apoptotic cells by neutrophil granulocytes: diminished proinflammatory neutrophil functions in the presence of apoptotic cells. J Immunol 184:391-400.
236
42. Li, J., Barreda, D.R., Zhang, Y.A., Boshra, H., Gelman, A.E., Lapatra, S., Tort, L., and Sunyer, J.O. 2006. B lymphocytes from early vertebrates have potent phagocytic and microbicidal abilities. Nat Immunol 7:1116-1124.
43. Zhang, Y.A., Salinas, I., Li, J., Parra, D., Bjork, S., Xu, Z., LaPatra, S.E., Bartholomew, J., and Sunyer, J.O. 2010. IgT, a primitive immunoglobulin class specialized in mucosal immunity. Nat Immunol 11:827-835.
44. Overland, H.S., Pettersen, E.F., Ronneseth, A., and Wergeland, H.I. 2010. Phagocytosis by B-cells and neutrophils in Atlantic salmon (Salmo salar L.) and Atlantic cod (Gadus morhua L.). Fish Shellfish Immunol 28:193-204.
45. Rieger, A., and Bar-Or, A. 2008. B-cell-derived interleukin-10 in autoimmune disease: regulating the regulators. Nat Rev Immunol 8:486-487.
46. Fillatreau, S., Gray, D., and Anderton, S.M. 2008. Not always the bad guys: B cells as regulators of autoimmune pathology. Nat Rev Immunol 8:391-397.
47. Zouali, M. 2008. B lymphocytes--chief players and therapeutic targets in autoimmune diseases. Front Biosci 13:4852-4861.
48. Keen, D. 2008. A review of research examining the regulatory role of lymphocytes in normal wound healing. J Wound Care 17:218-220, 222.
49. Martinez-Martin, N., Fernandez-Arenas, E., Cemerski, S., Delgado, P., Turner, M., Heuser, J., Irvine, D.J., Huang, B., Bustelo, X.R., Shaw, A., et al. 2011. T Cell Receptor Internalization from the Immunological Synapse Is Mediated by TC21 and RhoG GTPase-Dependent Phagocytosis. Immunity 35:208-222.
50. Parra, D., Rieger, A.M., Li, J., Zhang, Y.A., Randall, L.M., Hunter, C.A., Barreda, D.R., and Sunyer, J.O. Pivotal Advance: Peritoneal cavity B-1 B cells have phagocytic and microbicidal capacities and present phagocytosed antigen to CD4+ T cells. J Leukoc Biol.
51. Nakashima, M., Kinoshita, M., Nakashima, H., Habu, Y., Miyazaki, H., Shono, S., Hiroi, S., Shinomiya, N., Nakanishi, K., and Seki, S. Pivotal Advance: Characterization of mouse liver phagocytic B cells in innate immunity. J Leukoc Biol.
52. Leitch, A.E., Lucas, C.D., and Rossi, A.G. Editorial: Neutrophil apoptosis: hot on the TRAIL of inflammatory resolution. J Leukoc Biol 90:841-843.
53. Levy, B.D., Clish, C.B., Schmidt, B., Gronert, K., and Serhan, C.N. 2001. Lipid mediator class switching during acute inflammation: signals in resolution. Nat Immunol 2:612-619.
54. Wu, Y., Zhai, H., Wang, Y., Li, L., Wu, J., Wang, F., Sun, S., Yao, S., and Shang, Y. 2012. Aspirin-triggered lipoxin A(4) attenuates lipopolysaccharide-induced intracellular ROS in BV2 microglia cells by inhibiting the function of NADPH oxidase. Neurochem Res 37:1690-1696.
55. Nascimento-Silva, V., Arruda, M.A., Barja-Fidalgo, C., and Fierro, I.M. 2007. Aspirin-triggered lipoxin A4 blocks reactive oxygen species generation in endothelial cells: a novel antioxidative mechanism. Thromb Haemost 97:88-98.
237
56. Borgeson, E., Lonn, J., Bergstrom, I., Brodin, V.P., Ramstrom, S., Nayeri, F., Sarndahl, E., and Bengtsson, T. 2011. Lipoxin A(4) inhibits porphyromonas gingivalis-induced aggregation and reactive oxygen species production by modulating neutrophil-platelet interaction and CD11b expression. Infect Immun 79:1489-1497.
57. Medzhitov, R. 2007. Recognition of microorganisms and activation of the immune response. Nature 449:819-826.
58. Munoz, L.E., Janko, C., Schulze, C., Schorn, C., Sarter, K., Schett, G., and Herrmann, M. 2010. Autoimmunity and chronic inflammation - two clearance-related steps in the etiopathogenesis of SLE. Autoimmun Rev 10:38-42.
59. Weiss, S.J. 1989. Tissue destruction by neutrophils. N Engl J Med 320:365-376.
60. van Lent, P.L., Licht, R., Dijkman, H., Holthuysen, A.E., Berden, J.H., and van den Berg, W.B. 2001. Uptake of apoptotic leukocytes by synovial lining macrophages inhibits immune complex-mediated arthritis. J Leukoc Biol 70:708-714.
61. Kleinclauss, F., Perruche, S., Masson, E., de Carvalho Bittencourt, M., Biichle, S., Remy-Martin, J.P., Ferrand, C., Martin, M., Bittard, H., Chalopin, J.M., et al. 2006. Intravenous apoptotic spleen cell infusion induces a TGF-beta-dependent regulatory T-cell expansion. Cell Death Differ 13:41-52.
62. Bittencourt, M.C., Perruche, S., Contassot, E., Fresnay, S., Baron, M.H., Angonin, R., Aubin, F., Herve, P., Tiberghien, P., and Saas, P. 2001. Intravenous injection of apoptotic leukocytes enhances bone marrow engraftment across major histocompatibility barriers. Blood 98:224-230.
63. Saas, P., Bonnefoy, F., Kury-Paulin, S., Kleinclauss, F., and Perruche, S. 2007. Mediators involved in the immunomodulatory effects of apoptotic cells. Transplantation 84:S31-34.
238
Chapter 5: Apoptotic cells induce expression of non-
classical soluble factors in goldfish macrophages1
5.1 Introduction
In mammals, inflammation-associated apoptosis triggers anti-inflammatory
programs as an effective mechanism to control tissue damage and help regain
homeostatic balance (1). In vitro studies have shown that internalization of
apoptotic cells drives a decrease in pro-inflammatory antimicrobial killing
mechanisms (2-4). In vivo, apoptotic cells decrease thioglycollate-induced
leukocyte infiltration and promote the resolution of thioglycollate or LPS-driven
inflammation (5, 6). Mechanisms for apoptotic cell clearance within an
inflammatory site are associated with a decrease in the production of pro-
inflammatory cytokines such as TNF-α, IL-6 IL-8, IL-12, IL-17, IL-23, leukotriene
C4 and thromboxane B2, as well as an increase in the production of classical anti-
inflammatory immune mediators such as transforming growth factor (TGF)-β and
interleukin (IL)-10 (1, 7-12).
Macrophage colony-stimulating factor (CSF-1) is the primary regulator of the
survival, proliferation, and differentiation of macrophages, and their precursors and
is also highly involved in an array of inflammatory processes (13-15). Activation
A portion of this chapter has been previously published in:
Rieger AM, Konowalchuk JD, Havixbeck JJ, Robbins JS, Smith MK, Lund JM,
Barreda DR. 2013. A soluble form of the CSF-1 receptor contributes to the
inhibition of inflammation in a teleost fish. Dev Comp Immunol 39: 438-46.
239
of tyrosine kinase activity in its cognate receptor, CSF-1R, results in the
recruitment and activation of discrete signaling pathways that confer its biological
activity. These events occur quickly in the presence of minute amounts of
circulating CSF-1. Consequently, mechanisms have evolved to effectively control
the magnitude and duration of CSF-1 biological function (13-15). CSF-1 activity is
tightly controlled through receptor-mediated endocytosis, metabolic processing,
and inhibition of downstream signaling, as well as through intracellular
mechanisms regulating gene expression of CSF-1 and its membrane-bound
receptor (CSF-1R). In addition, there is a recently identified a novel mechanism for
the control of CSF-1 activity in teleosts- through the production of an inhibitory
soluble form of the CSF-1 receptor (sCSF-1R) (16). Early characterization of the
unique sCSF-1R mRNA transcript derived from goldfish PKM determined that it
was a full-length species possessing a start codon, signal peptide, stop codon,
polyadenylation signals, and a poly-A tail (16). The truncated transcript of the
CSF-1 receptor encoded for the ligand binding extracellular domains of the
goldfish membrane-associated CSF-1R but lacked both transmembrane and
cytoplasmic signal-transducing domains (16). Soluble recombinant sCSF-1R
effectively associated with its cognate ligand, CSF-1 (17). Interestingly, PKM
selectively expressed sCSF-1R during the senescence phase of development, which
corresponds to a defined stage of in vitro culture development where inhibition of
macrophage proliferation and increases in apoptotic cell death is prominent (16,
18). In contrast, PKM cultures undergoing active proliferation displayed low levels
of sCSF-1R expression. Addition of purified recombinant sCSF-1R to developing
240
PKM led to a dose-dependent decrease in macrophage proliferation; nanomolar
concentrations of recombinant sCSF-1R were sufficient for this inhibition (16).
Conversely, addition of antibodies generated against sCSF-1R prevented this
decrease in macrophage proliferation (16). Notably, unlike mammalian
macrophages, which rely heavily on other cells for production of cytokine growth
factors, teleost fish macrophages are well established to produce endogenous
growth factors (19-21). As such, the sCSF-1R represents an elegant mechanism for
endogenous control of macrophage numbers in this lower vertebrate.
Native sCSF-1R protein was found in goldfish PKM culture supernatants,
consistent with sCSF-1R mRNA expression by PKM (16). Interestingly, native
sCSF-1R was also identified in goldfish serum, suggesting that this soluble protein
may also play a systemic regulatory role that expands its role beyond the regulation
of macrophage proliferative events within goldfish hematopoietic tissues.
As a first step to characterize the contributions of apoptotic cells to the
resolution of inflammatory responses in lower vertebrates, the previous chapter
examined their impact on the innate antimicrobial responses of goldfish phagocytes
and compared them to those of a C57BL/6 murine system (22). I assessed the
conservation of divergent pro-inflammatory and anti-inflammatory (resolution)
responses at the level of the phagocyte and identified significant differences
between goldfish and mice in vivo with regards to the level of responsiveness to
zymosan and apoptotic cells, the identity of infiltrating leukocytes, their rate of
infiltration, and the kinetics and strength of resulting antimicrobial responses.
Interestingly, I also found that in vitro treatment of goldfish PKM with apoptotic
241
cells decreased the respiratory burst responses in both phagocytic and non-
phagocytic cells (22). Further, pre-incubation of PKM with apoptotic cells prior to
addition of zymosan resulted in reduced respiratory burst responses in those cells
that were non-phagocytic, those that had only internalized zymosan and those that
had internalized both zymosan and apoptotic cells (22). Together, these results
suggested that internalization of apoptotic cells induced the production of soluble
inhibitors of cell activation by goldfish primary macrophages. In this chapter, I
examine the role of soluble factors in regulating macrophage responses to apoptotic
cells.
The main objectives of this chapter are to (1) examine the role of soluble
factors in response to apoptotic cells, (2) investigate the expression patterns of
sCSF-1R, a putative mediator of responses to apoptotic cells, and (3) determine the
kinetics of expression of sCSF-1R during an acute inflammatory process.
5.2 Results
5.2.1 Apoptotic cells contribute to the production of non-classical
inhibitor(s) of macrophage antimicrobial responses by goldfish PKM.
I showed in the previous chapter that apoptotic cells contribute to the global
reduction of macrophage ROS production in goldfish primary kidney macrophage
(PKM) in vitro cultures (22). My results suggested the production of soluble
inhibitors by PKM, which were released into culture supernatants and modulated
the responses of those macrophages actively internalizing apoptotic cells as well as
those of surrounding non-phagocytic PKM (22). Further, pre-incubation of PKM
242
with apoptotic cells for 2 hours or 4 hours prior to addition of stimulatory zymosan
resulted in reduced respiratory burst responses in those cells that were non-
phagocytic, those that had only internalized zymosan as well as those that had
internalized both zymosan and apoptotic cells (22). As the next step to determine
the identity of these soluble factor(s), apoptotic cells were generated from catfish
3B11 B cells or primary goldfish kidney leukocytes and added to PKM cultures.
Trans-well experiments demonstrated the production of soluble inhibitor(s) of
respiratory burst responses. Target PKM, incubated opposite 0.4 μm trans-well
permeable supports containing PKM exposed to apoptotic cells, displayed a
significant decrease in ROS production (Figure 5.1 A). These soluble inhibitor(s)
were actively produced by PKM, which required direct contact with apoptotic cells
for production; no decrease in respiratory burst activity was detected in the absence
of direct contact between PKM and apoptotic cells (Figure 5.1 A). In similar
experiments, supernatants collected from PKM treated with apoptotic cells for 24
hours inhibited respiratory burst responses of target PKM later assayed for ROS
production (Figure 5.1 A).
Phagocytosis of apoptotic cells in mammals is well documented to result in
reduced expression of classical pro-inflammatory factors like TNF-α, combined
with an increase in production of anti-inflammatory factors like TGF-β and IL-10
(1, 8, 10, 12). Since goldfish macrophages displayed a similar decrease in ROS
production as mammalian macrophages following internalization of apoptotic cells,
I examined whether goldfish PKM displayed changes in immune gene expression
similar to those previously described in mice. Using real-time PCR, I measured the
243
expression of interleukin (IL)-1β, IL-10, tumor necrosis factor (TNF)-α1 and 2,
transforming growth factor (TGF)-β, and vascular endothelial growth factor
(VEGF), as a marker of alternative macrophage activation (23, 24), following 4,
24, or 48 hours incubation with apoptotic cells or zymosan (Figure 5.1 B).
Interestingly, while apoptotic cells contributed to a decrease in teleost pro-
inflammatory TNF-α1 and 2 and decreased VEGF expression, no significant
changes were found in the expression of the teleost anti-inflammatory cytokines
IL-10 and TGF-β. I considered whether goldfish macrophages may take advantage
of other novel soluble factors for inhibition of pro-inflammatory responses such as
the respiratory burst.
A novel soluble form of the CSF-1 receptor (sCSF-1R) represented a viable
candidate for my studies. This soluble factor was previously shown to be
temporally produced by goldfish PKM during periods of in vitro senescence and to
actively inhibit macrophage proliferation in a dose-dependent manner (16).
Previous studies also identified native sCSF-1R in goldfish serum, suggesting that
this soluble protein may also play a systemic regulatory role that expanded its role
beyond the regulation of macrophage proliferative events within goldfish
hematopoietic tissues. Examination of sCSF-1R gene expression in goldfish tissues
via RT-PCR indicated wide expression of sCSF-1R beyond kidney and spleen
hematopoietic tissues, consistent with this hypothesis (Figure 5.1 C). Finally,
among the various roles of CSF-1 in macrophage function, there is also a direct
link between CSF-1 activity and ROS production (25, 26). Thus, subsequent
experiments looked to examine the potential link between this novel cytokine
244
receptor and the inhibition of pro-inflammatory antimicrobial responses like the
respiratory burst by apoptotic cells in goldfish.
5.2.2 Apoptotic cells selectively induce expression of a soluble CSF-1R in
goldfish macrophages in vitro.
In vitro characterization of sCSF-1R expression determined selective up-
regulation of cytoplasmic mRNA expression upon exposure of PKM to apoptotic
cells (Figure 5.2 A). In contrast, zymosan, a strong inducer of pro-inflammatory
dectin-1 and TLR-2/6 responses (27, 28), did not induce up-regulation of sCSF-1R
expression (Figure 5.2 A). Analysis was based on a novel flow-assisted fluorescent
in-situ hybridization approach that allowed examination of gene expression in
mixed PKM in vitro cultures, which are known to contain macrophages at different
stages of differentiation (19, 29, 30). Using a differential cross-screen approach
coupled to RT-PCR analysis, legumain and CD63 have been previously shown to
be preferentially expressed in mature macrophage and monocyte PKM subsets,
respectively (31). Coupling these results to the examination of sCSF-1R expression
determined that sCSF-1R was expressed by PKM mature macrophages and not
monocytes (Figure 5.2 B). In contrast, both of these PKM sub-populations
expressed CSF-1R (Figure 5.2 C), consistent with prior analyses (16). This also
highlights the specificity of sCSF-1R and CSF-1R probes used in these
experiments. Finally, apoptotic cells were added to PKM cultures at decreasing
ratios and protein expression was examined by Western blot (Figure 5.2 D). Protein
245
concentration of native sCSF-1R decreased with decreasing ratios of apoptotic
cells.
5.2.3 Soluble CSF-1R does not affect PKM viability, phagocytosis nor
production of reactive oxygen intermediates in resting macrophages.
Since sCSF-1R expression increased in PKM cultures upon exposure to
apoptotic cells, I was curious if sCSF-1R may be one of the soluble factors
mediating responses to these inducers of anti-inflammatory homeostatic responses.
To this end, I incubated PKMs in vitro with increasing concentrations of
recombinant sCSF-1R (rsCSF-1R) known to induce dose-dependent inhibition of
PKM proliferation (16, 17). Based on the contributions of CSF-1 to macrophage
survival and up-regulation of phagocytic responses (13-15), I therefore examined
the impact of increasing concentrations of rsCSF-1R on PKM survival under basal
and oxidative conditions, as well as on the phagocytic uptake of zymosan. Unlike
the effects incurred on PKM proliferation, no changes were detected in PKM
survival or phagocytosis under any of the conditions tested (Figure 5.3 A).
Characterization of PKM ROS production via DHR also yielded no changes at any
of the rsCSF-1R concentrations tested (Figure 5.3 B). Finally, isolation of
peritoneal macrophages provided ex vivo examination of another distinct
population of goldfish macrophages. Consistent with PKM results, ex vivo
administration of rsCSF-1R did not affect ROS production in this tissue
macrophage population (Figure 5.3 B). I then wished to assess the impact of
rsCSF-1R on activated macrophages. To this end, PKMs were activated with
246
MAF/LPS for 24 hours +/- rsCSF-1R. Interestingly, rsCSF-1R significantly
decreased ROS production in activated macrophages but had no effect on
phagocytosis (Figure 5.4).
5.2.4 Apoptotic cells selectively induce up-regulation of goldfish sCSF-1R
expression in vivo, which coincides with increased macrophage
numbers at an inflammatory site.
The previous chapter showed that in vivo administration of apoptotic cells
into the goldfish peritoneal cavity resulted in a significant increase in macrophage
numbers, as defined by morphological, cytochemical, and cell surface marker
analyses (22). Flow-assisted in situ hybridization analysis of sCSF-1R and CSF-1R
using gene specific probes corroborated these results and showed selective up-
regulation of sCSF-1R and CSF-1R following in vivo administration of apoptotic
cells but not zymosan (Figure 5.5). Together, these experiments indicated that up-
regulation of sCSF-1R expression in vivo coincided with an increase in
macrophage numbers that resulted from administration of apoptotic cells into the
goldfish peritoneal cavity. These findings supported those observed in vitro where
PKM also increased sCSF-1R expression following apoptotic body but not
zymosan treatment (Figure 5.2 A). Conversely, there was no correlation between
increased sCSF-1R expression, G-CSFR expression, and the infiltration of
neutrophils into the peritoneal cavity observed during early zymosan-induced
inflammatory responses. Gene expression analysis indicated selective up-regulation
of G-CSFR expression in peritoneal cells from fish injected with zymosan (Figure
247
5.5). This up-regulation of G-CSFR expression paralleled the increase in neutrophil
infiltration observed using morphological cellular analysis and Sudan Black
cytochemical staining (22). However, peritoneal cells from fish injected with
zymosan had a significant reduction in expression of sCSF-1R, in contrast to those
from fish treated with apoptotic cells (Figure 5.5). Administration of apoptotic cells
4 hours prior to zymosan stimulation (-4h group) led to an intermediate expression
phenotype similar to that of PBS-treated controls (Figure 5.5).
5.2.5 Expression of sCSF-1R throughout a time-course of acute
inflammation mimics the presence of apoptotic cells.
Zymosan has been previously shown to induce an acute, self-resolving
peritonitis that generally resolves within 72 hours. These kinetics, however, have
not been described in fish so I measured a range of inflammatory responses within
this 72 hour time period. I found that cellular infiltration rose steadily, peaking at
18 hours. Counts then dropped steadily from 24- 72 hours (Figure 5.6 A). The
kinetics of cellular infiltration matched those of ROS responses. When CSF-1
expression was measured, I found responses peaked at 24 hours, dropping below
basal levels at 72 hours. When apoptotic cell death was measured in this same
window, I found that apoptosis levels were significantly increased at 72 hours. This
was the same time point at which we found significant increases in sCSF-1R
expression. When this time course was carried out further, it was found that sCSF-
1R levels remained high until 10 days post-injection, then returned to basal levels
(Figure 5.6 B). This data suggests that, similar to expression data found with
248
injected apoptotic cells, the generation of apoptotic cells in vivo coincides with
sCSF-1R expression increases.
Over this same time period, I measured cytokines known to be involved in
cellular recruitment, induction of inflammation and resolution of inflammation. I
found that CXCL-8 (a chemokine involved in neutrophil recruitment) levels were
high between 8 and 12 hours (Figure 5.7). This time period of expression
immediately precedes the detection of neutrophil infiltration, occurring primarily at
18 hours. Two important pro-inflammatory cytokines, TNF-α 2 and IL-1β 1, also
show high levels of expression early within the acute inflammatory period,
dropping to basal levels between 24 and 72 hours. While no increases in IL-10, an
important anti-inflammatory cytokine in mammalian systems, was detected late in
the inflammatory response, a significant increase was detected at 8 hours. This
likely is to control early inflammatory monocyte responses, as has been suggested
in murine sepsis models (32). Finally, this data suggests that, like in mammals,
zymosan peritonitis resolves within 72 hours in goldfish as well.
5.3 Discussion
Recent studies point to the conservation of the CSF-1 system between teleost
fish and mammals (13, 17, 33-38). Both CSF-1 and/or its cognate receptor, CSF-
1R, have been identified in a range of species and display the classic characteristics
associated with CSF-1 activity. In mammals, this cytokine regulatory node is
responsible for the control of macrophage numbers and contributes to the
modulation of their state of activation and function. However, the breadth of its
249
contributions also expands into bone metabolism, atherogenesis, lipoprotein
clearance, and female reproduction [(13) and references therein]. In teleost fish, the
CSF-1 / CSF-1R axis has been studied primarily in the context of macrophage
development and function, but is also known to be important for the development
of osteoclasts and the establishment of adult pigment pattern expressed by
zebrafish (13, 34-36, 39-41). The current chapter expands on the contributions of
this cytokine regulatory axis to teleost biology, through characterization of the
impact that sCSF-1R has on the inhibition of leukocyte inflammatory processes.
Two key findings from this study present the first evidence for the regulation of
teleost fish inflammation by sCSF-1R. Firstly, sCSF-1R expression was strongly
induced in response to apoptotic cells. Secondly, rsCSF-1R significantly decreased
ROS production in activated macrophages.
Based on the effective association of rsCSF-1R with goldfish rCSF-1, and the
capacity of this soluble receptor to abrogate recombinant and native CSF-1 activity
in vitro, it appears that this soluble receptor may inhibit PKM proliferation through
competitive inhibition of CSF-1 binding to the membrane-associated CSF-1R (16,
17, 20). Notably, the ability of rsCSF-1R to regulate PKM responses in vitro
beyond those associated with macrophage proliferation highlights the potential
complexity of the CSF-1 / CSF-1R regulatory node even in this lower vertebrate.
Soluble CSF-1R directly impacts macrophage respiratory burst antimicrobial
responses in fish in vitro. The in vivo effects of sCSF-1R will be discussed in the
next chapter.
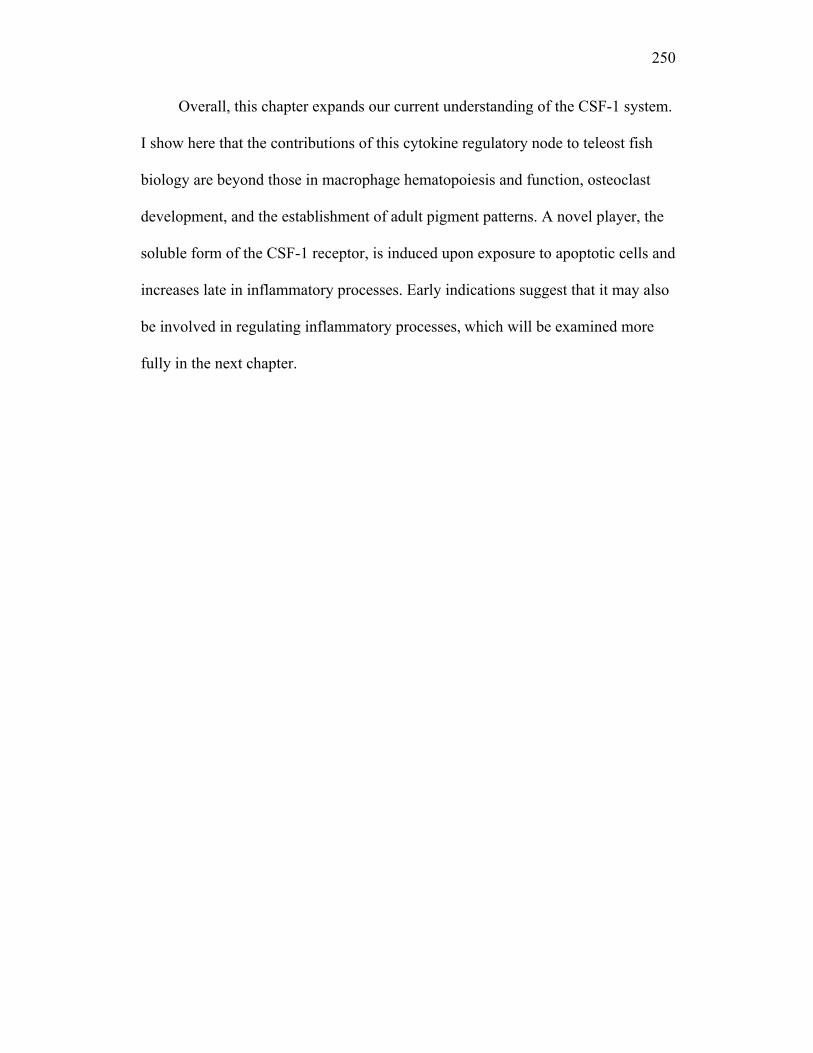
250
Overall, this chapter expands our current understanding of the CSF-1 system.
I show here that the contributions of this cytokine regulatory node to teleost fish
biology are beyond those in macrophage hematopoiesis and function, osteoclast
development, and the establishment of adult pigment patterns. A novel player, the
soluble form of the CSF-1 receptor, is induced upon exposure to apoptotic cells and
increases late in inflammatory processes. Early indications suggest that it may also
be involved in regulating inflammatory processes, which will be examined more
fully in the next chapter.
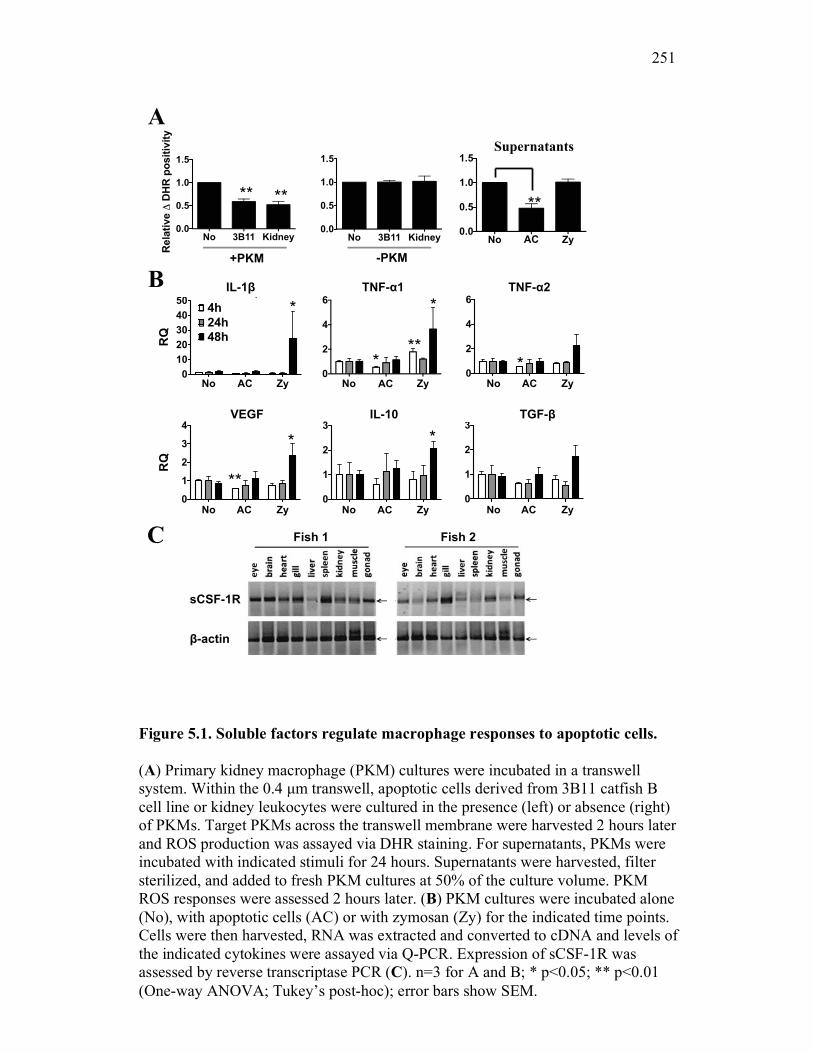
251
No 3B11 Kidney0.0
0.5
1.0
1.5R
elat
ive
DH
R p
ositi
vity
** **
No 3B11 Kidney0.0
0.5
1.0
1.5
+PKM -PKM No AB Zy
0.0
0.5
1.0
1.5
**
A
B
0
2
4
6
0
2
4
6
01020304050
0
1
2
3
N A B Z0
1
2
3
4
0
1
2
3
4h24h48h
**
*
*
*
* **
*
*
IL-1β TNF-α1 TNF-α2
VEGF IL-10 TGF-β
No AB Zy
RQ
R
Q
No AB Zy No AB Zy
No AB Zy No AB Zy No AB Zy
Fish 1 Fish 2
sCSF-1R
β-actin
C
Supernatants
AC
AC AC AC
AC AC AC
Figure 5.1. Soluble factors regulate macrophage responses to apoptotic cells. (A) Primary kidney macrophage (PKM) cultures were incubated in a transwell system. Within the 0.4 μm transwell, apoptotic cells derived from 3B11 catfish B cell line or kidney leukocytes were cultured in the presence (left) or absence (right) of PKMs. Target PKMs across the transwell membrane were harvested 2 hours later and ROS production was assayed via DHR staining. For supernatants, PKMs were incubated with indicated stimuli for 24 hours. Supernatants were harvested, filter sterilized, and added to fresh PKM cultures at 50% of the culture volume. PKM ROS responses were assessed 2 hours later. (B) PKM cultures were incubated alone (No), with apoptotic cells (AC) or with zymosan (Zy) for the indicated time points. Cells were then harvested, RNA was extracted and converted to cDNA and levels of the indicated cytokines were assayed via Q-PCR. Expression of sCSF-1R was assessed by reverse transcriptase PCR (C). n=3 for A and B; * p<0.05; ** p<0.01 (One-way ANOVA; Tukey’s post-hoc); error bars show SEM.

252
A
B C
A
B C
D No 5:1 4:1 3:1 2:1 1:1 Zy
AC: PKM
25
37
AC
Figure 5.2. Characterization of soluble CSF-1R expression in goldfish primary kidney macrophages. (A) PKM cells were incubated alone (No), with apoptotic cells (AC) or zymosan (Zy) for 2 hours. Levels of soluble CSF-1R were measured using a flow cytometry-based fluorescent in situ hybridization approach. Relative fluorescence of sense probe (negative control; red line) and anti-sense probe (experimental; black line). “M1” denotes positive cellular events. (B-C) PKM cells were cultured with apoptotic bodies for 2 hours and expression of sCSF-1R (B) or CSF-1R (C) were examined in the context of a monocyte (CD63) and a mature macrophage (legumain) PKM marker, as described in A. For A-C n=3; ** p<0.01 (One-way ANOVA; Tukey’s post-hoc); error bars show SEM. (D) PKM were incubated with decreasing concentrations of apoptotic cells or zymosan for 4 hours. Supernatants were then collected and run on a Western blot.
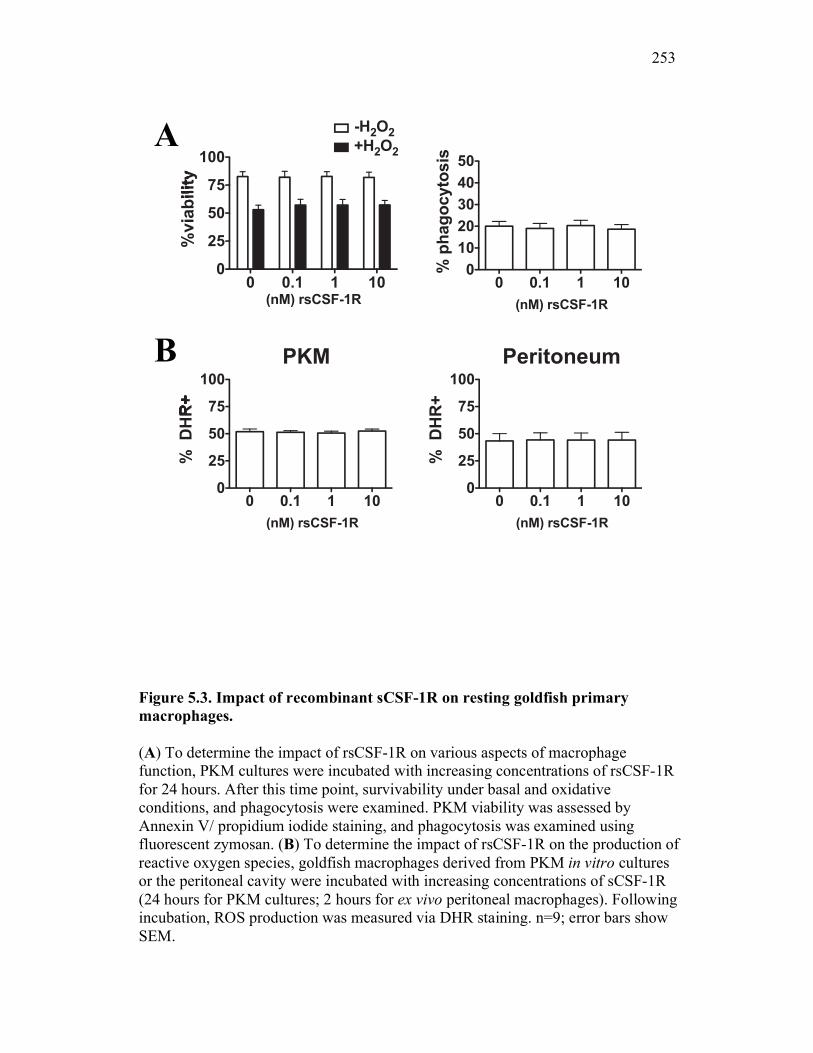
253
A
B
Figure 5.3. Impact of recombinant sCSF-1R on resting goldfish primary macrophages. (A) To determine the impact of rsCSF-1R on various aspects of macrophage function, PKM cultures were incubated with increasing concentrations of rsCSF-1R for 24 hours. After this time point, survivability under basal and oxidative conditions, and phagocytosis were examined. PKM viability was assessed by Annexin V/ propidium iodide staining, and phagocytosis was examined using fluorescent zymosan. (B) To determine the impact of rsCSF-1R on the production of reactive oxygen species, goldfish macrophages derived from PKM in vitro cultures or the peritoneal cavity were incubated with increasing concentrations of sCSF-1R (24 hours for PKM cultures; 2 hours for ex vivo peritoneal macrophages). Following incubation, ROS production was measured via DHR staining. n=9; error bars show SEM.
A
B
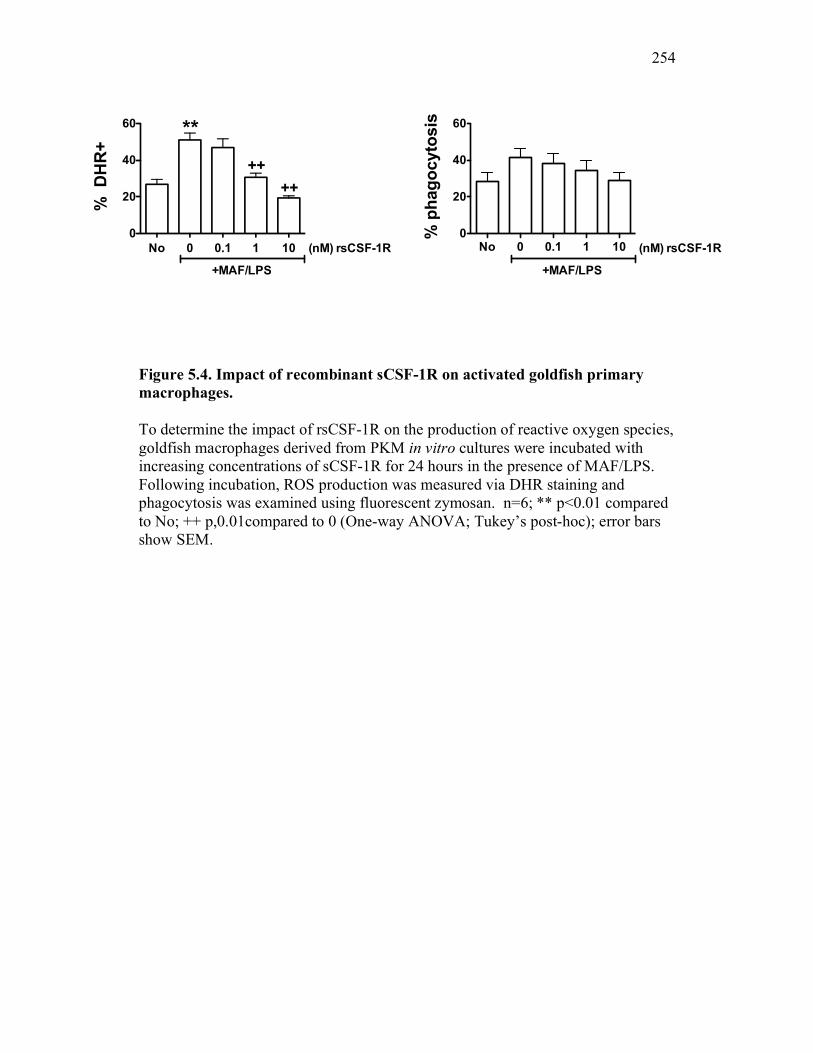
254
Figure 5.4. Impact of recombinant sCSF-1R on activated goldfish primary macrophages. To determine the impact of rsCSF-1R on the production of reactive oxygen species, goldfish macrophages derived from PKM in vitro cultures were incubated with increasing concentrations of sCSF-1R for 24 hours in the presence of MAF/LPS. Following incubation, ROS production was measured via DHR staining and phagocytosis was examined using fluorescent zymosan. n=6; ** p<0.01 compared to No; ++ p,0.01compared to 0 (One-way ANOVA; Tukey’s post-hoc); error bars show SEM.
No 0 0.1 1 100
20
40
60 **++
++
(nM) rsCSF-1R
+MAF/LPS
% D
HR
+
No 0 0.1 1 100
20
40
60
(nM) rsCSF-1R
+MAF/LPS
% p
hago
cyto
sis
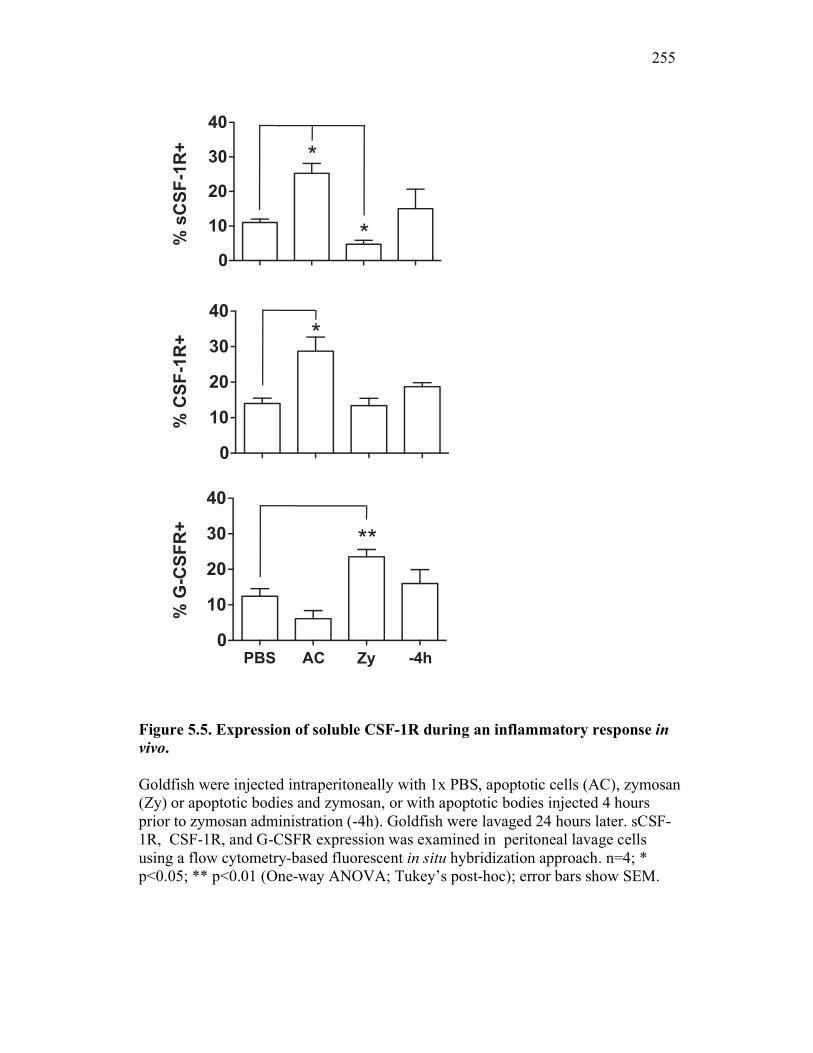
255
Figure 5.5. Expression of soluble CSF-1R during an inflammatory response in vivo. Goldfish were injected intraperitoneally with 1x PBS, apoptotic cells (AC), zymosan (Zy) or apoptotic bodies and zymosan, or with apoptotic bodies injected 4 hours prior to zymosan administration (-4h). Goldfish were lavaged 24 hours later. sCSF-1R, CSF-1R, and G-CSFR expression was examined in peritoneal lavage cells using a flow cytometry-based fluorescent in situ hybridization approach. n=4; * p<0.05; ** p<0.01 (One-way ANOVA; Tukey’s post-hoc); error bars show SEM.
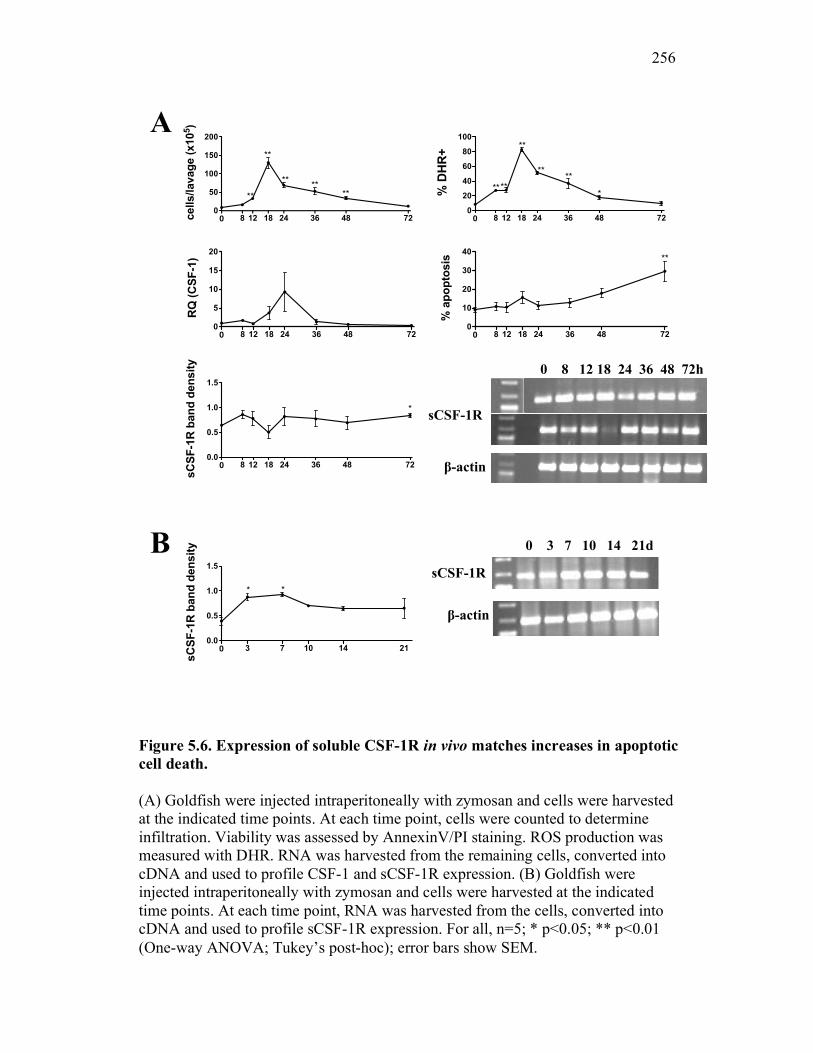
256
0 8 12 18 24 36 48 720
50
100
150
200
**
**
** ****
cells
/lava
ge (x
105 )
0 8 12 18 24 36 48 720
10
20
30
40**
% a
popt
osis
0 8 12 18 24 36 48 720
20
40
60
80
100
*
****
**
****% D
HR
+
0 8 12 18 24 36 48 720.0
0.5
1.0
1.5
*
sCSF
-1R
ban
d de
nsity
0 8 12 18 24 36 48 720
5
10
15
20
RQ
(CSF
-1)
0 3 7 10 14 210.0
0.5
1.0
1.5
**
sCSF
-1R
ban
d de
nsity
β-actin
sCSF-1R
β-actin
sCSF-1R
0 8 12 18 24 36 48 72h
0 3 7 10 14 21d
A
B
Figure 5.6. Expression of soluble CSF-1R in vivo matches increases in apoptotic cell death. (A) Goldfish were injected intraperitoneally with zymosan and cells were harvested at the indicated time points. At each time point, cells were counted to determine infiltration. Viability was assessed by AnnexinV/PI staining. ROS production was measured with DHR. RNA was harvested from the remaining cells, converted into cDNA and used to profile CSF-1 and sCSF-1R expression. (B) Goldfish were injected intraperitoneally with zymosan and cells were harvested at the indicated time points. At each time point, RNA was harvested from the cells, converted into cDNA and used to profile sCSF-1R expression. For all, n=5; * p<0.05; ** p<0.01 (One-way ANOVA; Tukey’s post-hoc); error bars show SEM.
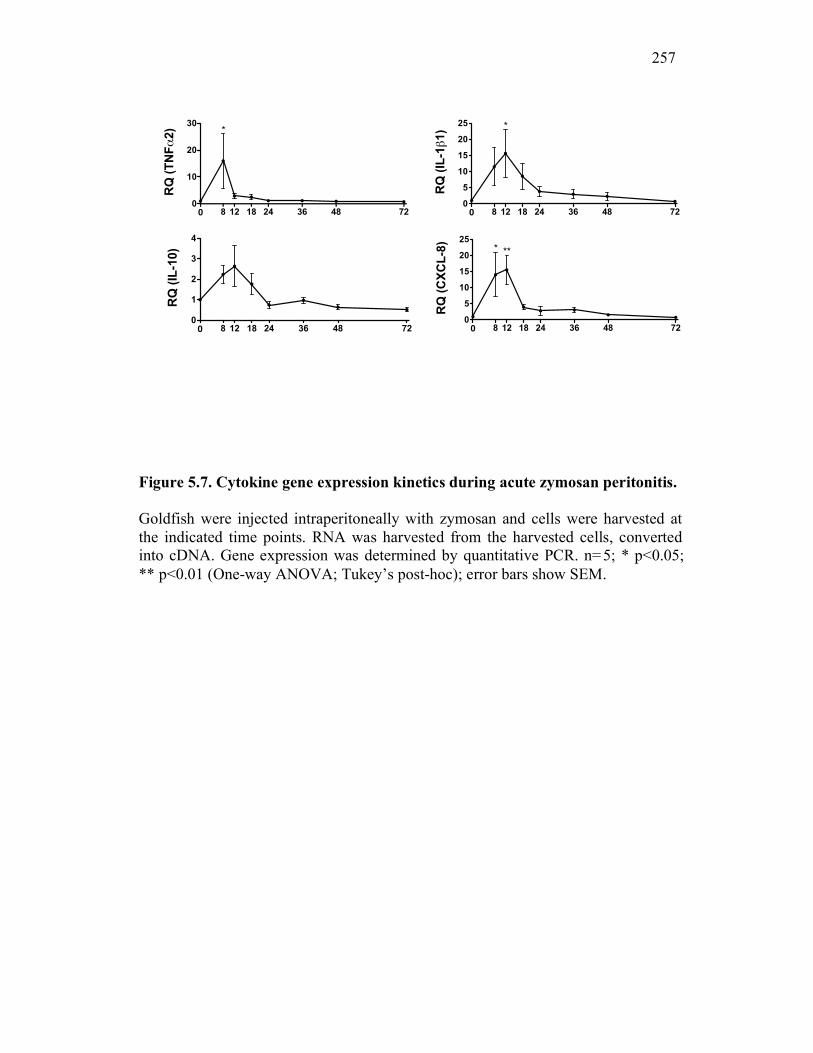
257
0 8 12 18 24 36 48 720
10
20
30
RQ
(TN
Fα2) *
0 8 12 18 24 36 48 720
5
10
15
20
25
RQ
(IL-
1β1)
*
0 8 12 18 24 36 48 720
1
2
3
4
RQ
(IL-
10)
0 8 12 18 24 36 48 720
5
10
15
20
25
RQ
(CXC
L-8) * **
Figure 5.7. Cytokine gene expression kinetics during acute zymosan peritonitis. Goldfish were injected intraperitoneally with zymosan and cells were harvested at the indicated time points. RNA was harvested from the harvested cells, converted into cDNA. Gene expression was determined by quantitative PCR. n=5; * p<0.05; ** p<0.01 (One-way ANOVA; Tukey’s post-hoc); error bars show SEM.
258
5.4 References
1. Soehnlein, O., and Lindbom, L. 2010. Phagocyte partnership during the onset and resolution of inflammation. Nature Reviews Immunology 10:427-439.
2. Johann, A.M., von Knethen, A., Lindemann, D., and Brune, B. 2006. Recognition of apoptotic cells by macrophages activates the peroxisome proliferator-activated receptor-gamma and attenuates the oxidative burst. Cell Death Differ 13:1533-1540.
3. Reiter, I., Krammer, B., and Schwamberger, G. 1999. Cutting edge: differential effect of apoptotic versus necrotic tumor cells on macrophage antitumor activities. J Immunol 163:1730-1732.
4. Zamboni, D.S., and Rabinovitch, M. 2003. Nitric oxide partially controls Coxiella burnetii phase II infection in mouse primary macrophages. Infect Immun 71:1225-1233.
5. Huynh, M.L., Fadok, V.A., and Henson, P.M. 2002. Phosphatidylserine-dependent ingestion of apoptotic cells promotes TGF-beta1 secretion and the resolution of inflammation. J Clin Invest 109:41-50.
6. Potter, P.K., Cortes-Hernandez, J., Quartier, P., Botto, M., and Walport, M.J. 2003. Lupus-prone mice have an abnormal response to thioglycolate and an impaired clearance of apoptotic cells. J Immunol 170:3223-3232.
7. Bellingan, G.J., Caldwell, H., Howie, S.E., Dransfield, I., and Haslett, C. 1996. In vivo fate of the inflammatory macrophage during the resolution of inflammation: inflammatory macrophages do not die locally, but emigrate to the draining lymph nodes. J Immunol 157:2577-2585.
8. Fadok, V.A., Bratton, D.L., Konowal, A., Freed, P.W., Westcott, J.Y., and Henson, P.M. 1998. Macrophages that have ingested apoptotic cells in vitro inhibit proinflammatory cytokine production through autocrine/paracrine mechanisms involving TGF-beta, PGE2, and PAF. J Clin Invest 101:890-898.
9. Kim, S., Elkon, K.B., and Ma, X. 2004. Transcriptional suppression of interleukin-12 gene expression following phagocytosis of apoptotic cells. Immunity 21:643-653.
10. Maderna, P., and Godson, C. 2003. Phagocytosis of apoptotic cells and the resolution of inflammation. Biochim Biophys Acta 1639:141-151.
11. Stark, M.A., Huo, Y., Burcin, T.L., Morris, M.A., Olson, T.S., and Ley, K. 2005. Phagocytosis of apoptotic neutrophils regulates granulopoiesis via IL-23 and IL-17. Immunity 22:285-294.
12. Weigert, A., Jennewein, C., and Brune, B. 2009. The liaison between apoptotic cells and macrophages--the end programs the beginning. Biol Chem 390:379-390.
13. Barreda, D.R., Hanington, P.C., and Belosevic, M. 2004. Regulation of myeloid development and function by colony stimulating factors. Dev Comp Immunol 28:509-554.
259
14. Hume, D.A., Pavli, P., Donahue, R.E., and Fidler, I.J. 1988. The effect of human recombinant macrophage colony-stimulating factor (CSF-1) on the murine mononuclear phagocyte system in vivo. J Immunol 141:3405-3409.
15. Stanley, E.R., Guilbert, L.J., Tushinski, R.J., and Bartelmez, S.H. 1983. CSF-1--a mononuclear phagocyte lineage-specific hemopoietic growth factor. J Cell Biochem 21:151-159.
16. Barreda, D.R., Hanington, P.C., Stafford, J.L., and Belosevic, M. 2005. A novel soluble form of the CSF-1 receptor inhibits proliferation of self-renewing macrophages of goldfish (Carassius auratus L.). Dev Comp Immunol 29:879-894.
17. Hanington, P.C., Wang, T., Secombes, C.J., and Belosevic, M. 2007. Growth factors of lower vertebrates: characterization of goldfish (Carassius auratus L.) macrophage colony-stimulating factor-1. J Biol Chem 282:31865-31872.
18. Barreda, D.R., and Belosevic, M. 2001. Characterisation of growth enhancing factor production in different phases of in vitro fish macrophage development. Fish and Shellfish Immunology 11:169-185.
19. Barreda, D.R., Neumann, N.F., and Belosevic, M. 2000. Flow cytometric analysis of PKH26-labeled goldfish kidney-derived macrophages. Dev Comp Immunol 24:395-406.
20. Hanington, P.C., Hitchen, S.J., Beamish, L.A., and Belosevic, M. 2009. Macrophage colony stimulating factor (CSF-1) is a central growth factor of goldfish macrophages. Fish Shellfish Immunol 26:1-9.
21. Neumann, N.F., Barreda, D.R., and Belosevic, M. 1998. Production of a macrophage growth factor(s) by a goldfish macrophage cell line and macrophages derived from goldfish kidney leukocytes. Developmental and Comparative Immunology 22:417-432.
22. Rieger, A.M., Konowalchuk, J.D., Grayfer, L., Katzenback, B.A., Havixbeck, J.J., Kiemele, M.D., Belosevic, M., and Barreda, D.R. 2012. Fish and mammalian phagocytes differentially regulate pro-inflammatory and homeostatic responses in vivo. PLoS ONE - Accepted [manuscript number: PONE-D-12-21984].
23. Biswas, S.K., and Mantovani, A. 2010. Macrophage plasticity and interaction with lymphocyte subsets: cancer as a paradigm. Nat Immunol 11:889-896.
24. Geissmann, F., Manz, M.G., Jung, S., Sieweke, M.H., Merad, M., and Ley, K. 2010. Development of monocytes, macrophages, and dendritic cells. Science 327:656-661.
25. Choi, H.K., Kim, T.H., Jhon, G.J., and Lee, S.Y. 2011. Reactive oxygen species regulate M-CSF-induced monocyte/macrophage proliferation through SHP1 oxidation. Cell Signal 23:1633-1639.
26. Gueller, S., Goodridge, H.S., Niebuhr, B., Xing, H., Koren-Michowitz, M., Serve, H., Underhill, D.M., Brandts, C.H., and Koeffler, H.P. 2010. Adaptor protein Lnk inhibits c-Fms-mediated macrophage function. J Leukoc Biol 88:699-706.
260
27. Goodridge, H.S., Simmons, R.M., and Underhill, D.M. 2007. Dectin-1 stimulation by Candida albicans yeast or zymosan triggers NFAT activation in macrophages and dendritic cells. J Immunol 178:3107-3115.
28. Underhill, D.M. 2003. Macrophage recognition of zymosan particles. J Endotoxin Res 9:176-180.
29. Belosevic, M., Hanington, P.C., and Barreda, D.R. 2006. Development of goldfish macrophages in vitro. Fish Shellfish Immunol 20:152-171.
30. Neumann, N.F., Barreda, D.R., and Belosevic, M. 2000. Generation and functional analysis of distinct macrophage sub-populations from goldfish (Carassius auratus L.) kidney leukocyte cultures. Fish Shellfish Immunol 10:1-20.
31. Barreda, D.R., Hanington, P.C., Walsh, C.K., Wong, P., and Belosevic, M. 2004. Differentially expressed genes that encode potential markers of goldfish macrophage development in vitro. Dev Comp Immunol 28:727-746.
32. Latifi, S.Q., O'Riordan, M.A., and Levine, A.D. 2002. Interleukin-10 controls the onset of irreversible septic shock. Infect Immun 70:4441-4446.
33. Wang, T., Hanington, P.C., Belosevic, M., and Secombes, C.J. 2008. Two macrophage colony-stimulating factor genes exist in fish that differ in gene organization and are differentially expressed. J Immunol 181:3310-3322.
34. Chatani, M., Takano, Y., and Kudo, A. 2011. Osteoclasts in bone modeling, as revealed by in vivo imaging, are essential for organogenesis in fish. Dev Biol 360:96-109.
35. Crowhurst, M.O., Layton, J.E., and Lieschke, G.J. 2002. Developmental biology of zebrafish myeloid cells. Int J Dev Biol 46:483-492.
36. Herbomel, P., Thisse, B., and Thisse, C. 2001. Zebrafish early macrophages colonize cephalic mesenchyme and developing brain, retina, and epidermis through a M-CSF receptor-dependent invasive process. Dev Biol 238:274-288.
37. Honda, T., Nishizawa, T., Uenobe, M., Kohchi, C., Kuroda, A., Ototake, M., Nakanishi, T., Yokomizo, Y., Takahashi, Y., Inagawa, H., et al. 2005. Molecular cloning and expression analysis of a macrophage-colony stimulating factor receptor-like gene from rainbow trout, Oncorhynchus mykiss. Mol Immunol 42:1-8.
38. Williams, H., Brenner, S., and Venkatesh, B. 2002. Identification and analysis of additional copies of the platelet-derived growth factor receptor and colony stimulating factor 1 receptor genes in fugu. Gene 295:255-264.
39. Parichy, D.M., Ransom, D.G., Paw, B., Zon, L.I., and Johnson, S.L. 2000. An orthologue of the kit-related gene fms is required for development of neural crest-derived xanthophores and a subpopulation of adult melanocytes in the zebrafish, Danio rerio. Development 127:3031-3044.
40. Parichy, D.M., and Turner, J.M. 2003. Temporal and cellular requirements for Fms signaling during zebrafish adult pigment pattern development. Development 130:817-833.
41. Quigley, I.K., Manuel, J.L., Roberts, R.A., Nuckels, R.J., Herrington, E.R., MacDonald, E.L., and Parichy, D.M. 2005. Evolutionary diversification of

261
pigment pattern in Danio fishes: differential fms dependence and stripe loss in D. albolineatus. Development 132:89-104.
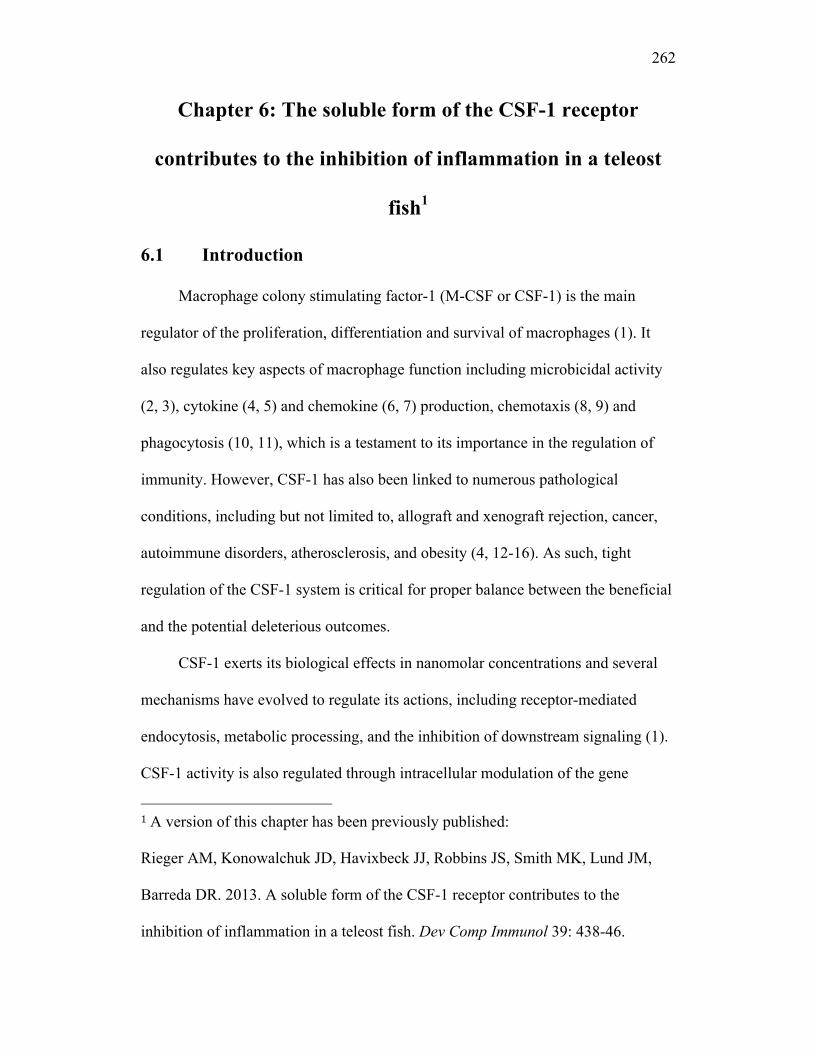
262
Chapter 6: The soluble form of the CSF-1 receptor
contributes to the inhibition of inflammation in a teleost
fish1
6.1 Introduction
Macrophage colony stimulating factor-1 (M-CSF or CSF-1) is the main
regulator of the proliferation, differentiation and survival of macrophages (1). It
also regulates key aspects of macrophage function including microbicidal activity
(2, 3), cytokine (4, 5) and chemokine (6, 7) production, chemotaxis (8, 9) and
phagocytosis (10, 11), which is a testament to its importance in the regulation of
immunity. However, CSF-1 has also been linked to numerous pathological
conditions, including but not limited to, allograft and xenograft rejection, cancer,
autoimmune disorders, atherosclerosis, and obesity (4, 12-16). As such, tight
regulation of the CSF-1 system is critical for proper balance between the beneficial
and the potential deleterious outcomes.
CSF-1 exerts its biological effects in nanomolar concentrations and several
mechanisms have evolved to regulate its actions, including receptor-mediated
endocytosis, metabolic processing, and the inhibition of downstream signaling (1).
CSF-1 activity is also regulated through intracellular modulation of the gene
A version of this chapter has been previously published:
Rieger AM, Konowalchuk JD, Havixbeck JJ, Robbins JS, Smith MK, Lund JM,
Barreda DR. 2013. A soluble form of the CSF-1 receptor contributes to the
inhibition of inflammation in a teleost fish. Dev Comp Immunol 39: 438-46.
263
expression of both CSF-1 and its cognate receptor CSF-1 receptor (CSF-1R) (1).
Most recently, a unique mechanism for the regulation of CSF-1 activity in teleost
fish was identified- through the production of a soluble form of CSF-1 receptor
(sCSF-1R) (17). Soluble CSF-1R decreases macrophage proliferation in a dose-
dependent manner and was originally identified among primary macrophage
cultures with high levels of apoptosis (17, 18). The native protein was detected in
goldfish serum (17), which suggested that this protein might also play a role in
systemic regulation, in addition to its role in regulating proliferation within the
hematopoietic compartment.
In the previous chapter, I showed that the expression of sCSF-1R was linked
to the presence of apoptotic cells. Further, sCSF-1R significantly decreased ROS
responses in activated macrophages, suggesting a potential role in inflammatory
control. With this in mind, in this chapter I examine the role of sCSF-1R in the
regulation of teleost macrophage inflammatory responses. The main objectives of
this chapter were to detail the role of sCSF-1R in regulating inflammatory
processes, notably (1) cellular infiltration and chemotaxis, (2) production of
reactive intermediates, (3) phagocytic capacity, and (4) production of inflammatory
mediators.
6.2 Results
6.2.1 Soluble CSF-1R contributes to amelioration of goldfish leukocyte
infiltration responses in vivo.
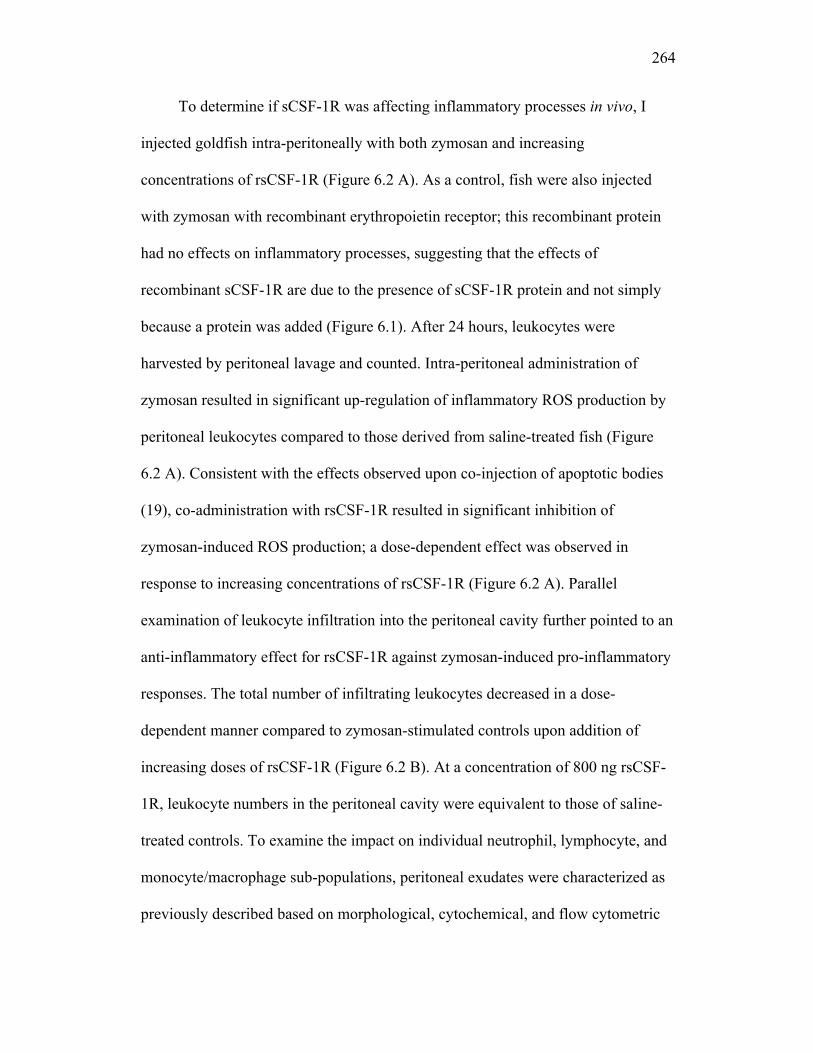
264
To determine if sCSF-1R was affecting inflammatory processes in vivo, I
injected goldfish intra-peritoneally with both zymosan and increasing
concentrations of rsCSF-1R (Figure 6.2 A). As a control, fish were also injected
with zymosan with recombinant erythropoietin receptor; this recombinant protein
had no effects on inflammatory processes, suggesting that the effects of
recombinant sCSF-1R are due to the presence of sCSF-1R protein and not simply
because a protein was added (Figure 6.1). After 24 hours, leukocytes were
harvested by peritoneal lavage and counted. Intra-peritoneal administration of
zymosan resulted in significant up-regulation of inflammatory ROS production by
peritoneal leukocytes compared to those derived from saline-treated fish (Figure
6.2 A). Consistent with the effects observed upon co-injection of apoptotic bodies
(19), co-administration with rsCSF-1R resulted in significant inhibition of
zymosan-induced ROS production; a dose-dependent effect was observed in
response to increasing concentrations of rsCSF-1R (Figure 6.2 A). Parallel
examination of leukocyte infiltration into the peritoneal cavity further pointed to an
anti-inflammatory effect for rsCSF-1R against zymosan-induced pro-inflammatory
responses. The total number of infiltrating leukocytes decreased in a dose-
dependent manner compared to zymosan-stimulated controls upon addition of
increasing doses of rsCSF-1R (Figure 6.2 B). At a concentration of 800 ng rsCSF-
1R, leukocyte numbers in the peritoneal cavity were equivalent to those of saline-
treated controls. To examine the impact on individual neutrophil, lymphocyte, and
monocyte/macrophage sub-populations, peritoneal exudates were characterized as
previously described based on morphological, cytochemical, and flow cytometric
265
characteristics (19). Administration of rsCSF-1R decreased the levels of all three
leukocyte subsets. However, inhibition of leukocyte infiltration was most notable
for the neutrophilic subset, as evidenced by the progressive dose-dependent
decrease associated with increasing concentrations of rsCSF-1R (Figure 6.2 B).
Further support for the potential contributions of rsCSF-1R to the inhibition of
goldfish inflammation came from evaluation of its impact on the proportions of
individual cellular subsets within the peritoneal cavity of zymosan-stimulated fish.
The percentage of neutrophils decreased dramatically in this zymosan-induced
peritonitis model following co-administration of rsCSF-1R; a progressive dose-
dependent decrease was observed in response to increasing concentrations of
rsCSF-1R (Figure 6.2 C). This decrease in the proportion of neutrophils was
accompanied by a parallel increase in the proportion of monocytes/macrophage and
lymphocyte sub-populations within the peritoneal cavity that was most marked at
800 ng rsCSF-1R.
6.2.2 Soluble CSF-1 receptor decreases pro-inflammatory phagocytic
responses similarly to apoptotic cells.
Phagocytosis of apoptotic cells is known to be a potent down-regulator of
inflammatory processes. I have shown in Chapter 4 that, in mammals, both
macrophages and neutrophils actively internalize apoptotic cells, leading to
reduction in the production of inflammatory antimicrobial products (20). In teleost
fish, however, neutrophils are not capable of internalizing apoptotic cells, leaving
macrophages as the main mediators of anti-inflammatory responses. As such, I

266
wished to investigate further the macrophage-specific mechanisms by which
apoptotic cells decrease inflammation in teleost fish. The previous data pointed to a
potential key role of soluble CSF-1R in regulating cellular infiltration and
inflammatory ROS production (21). I was curious, then, if sCSF-1R and apoptotic
cells were intrinsically linked and able to similarly down-regulate inflammatory
processes. I focused my studies on phagocytosis and the subsequent downstream
processes, as these are known to be integral to both the initiation and resolution of
inflammation. I found that both sCSF-1R and apoptotic cells significantly
decreased the phagocytic responses to basal levels (Figure 6.3 A, left panel). These
cells also had significant reduction in the production of reactive oxygen species, an
antimicrobial mechanism downstream of phagocytosis (Figure 6.3 A, right panel).
Interestingly, sCSF-1R seemed to have a greater impact on ROS production than
apoptotic cells. When the killing capacity of these cells was assessed using a
gentamicin protection assay, I found that apoptotic cells and rsCSF-1R
significantly decreased zymosan-induced increases in killing capacity (Figure 6.3
C). As such, sCSF-1R appears to play an integral role in regulating antimicrobial
responses of goldfish macrophages.
It has been suggested that apoptotic cells drive macrophage phenotypes from
a classically activated, inflammatory macrophage (M1) towards an alternatively
activated macrophage (M2) (22, 23). The phenotypic difference seems to lie largely
in the balance between nitric oxide (M1) and arginase (M2) production (24, 25).
These macrophage phenotypes have also been described in teleost fish, suggesting
that they are highly conserved (26, 27). Since I appear to be getting a classical-type
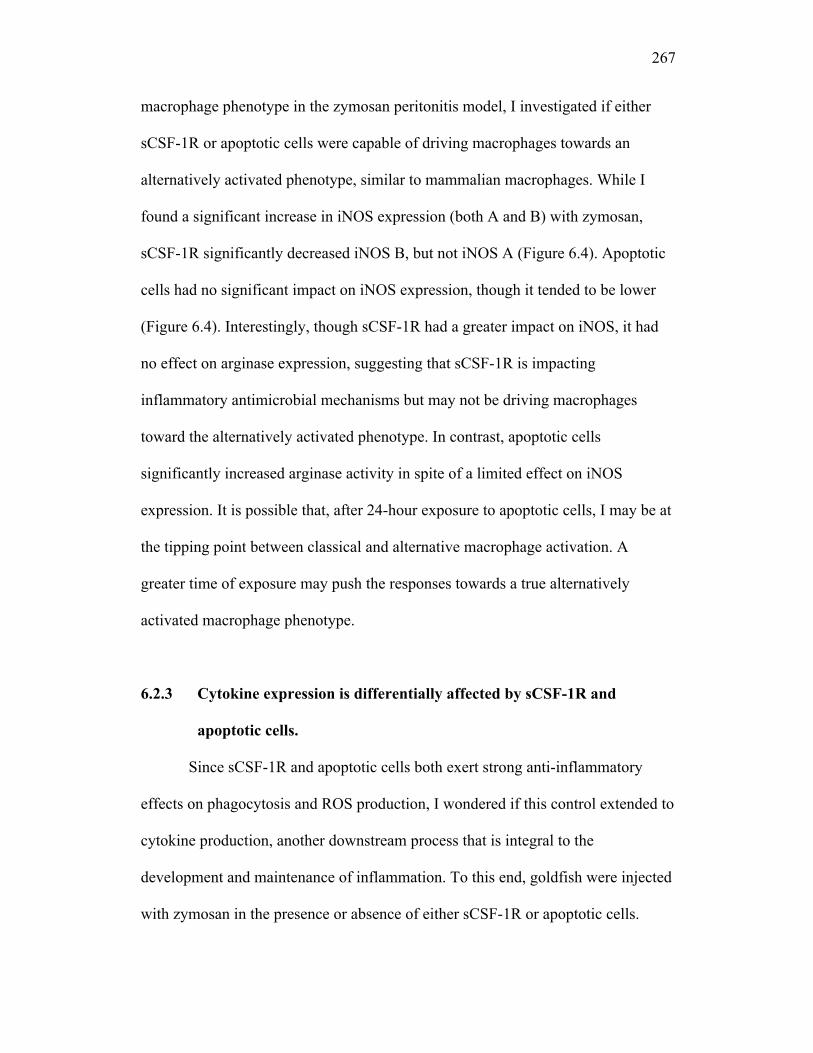
267
macrophage phenotype in the zymosan peritonitis model, I investigated if either
sCSF-1R or apoptotic cells were capable of driving macrophages towards an
alternatively activated phenotype, similar to mammalian macrophages. While I
found a significant increase in iNOS expression (both A and B) with zymosan,
sCSF-1R significantly decreased iNOS B, but not iNOS A (Figure 6.4). Apoptotic
cells had no significant impact on iNOS expression, though it tended to be lower
(Figure 6.4). Interestingly, though sCSF-1R had a greater impact on iNOS, it had
no effect on arginase expression, suggesting that sCSF-1R is impacting
inflammatory antimicrobial mechanisms but may not be driving macrophages
toward the alternatively activated phenotype. In contrast, apoptotic cells
significantly increased arginase activity in spite of a limited effect on iNOS
expression. It is possible that, after 24-hour exposure to apoptotic cells, I may be at
the tipping point between classical and alternative macrophage activation. A
greater time of exposure may push the responses towards a true alternatively
activated macrophage phenotype.
6.2.3 Cytokine expression is differentially affected by sCSF-1R and
apoptotic cells.
Since sCSF-1R and apoptotic cells both exert strong anti-inflammatory
effects on phagocytosis and ROS production, I wondered if this control extended to
cytokine production, another downstream process that is integral to the
development and maintenance of inflammation. To this end, goldfish were injected
with zymosan in the presence or absence of either sCSF-1R or apoptotic cells.
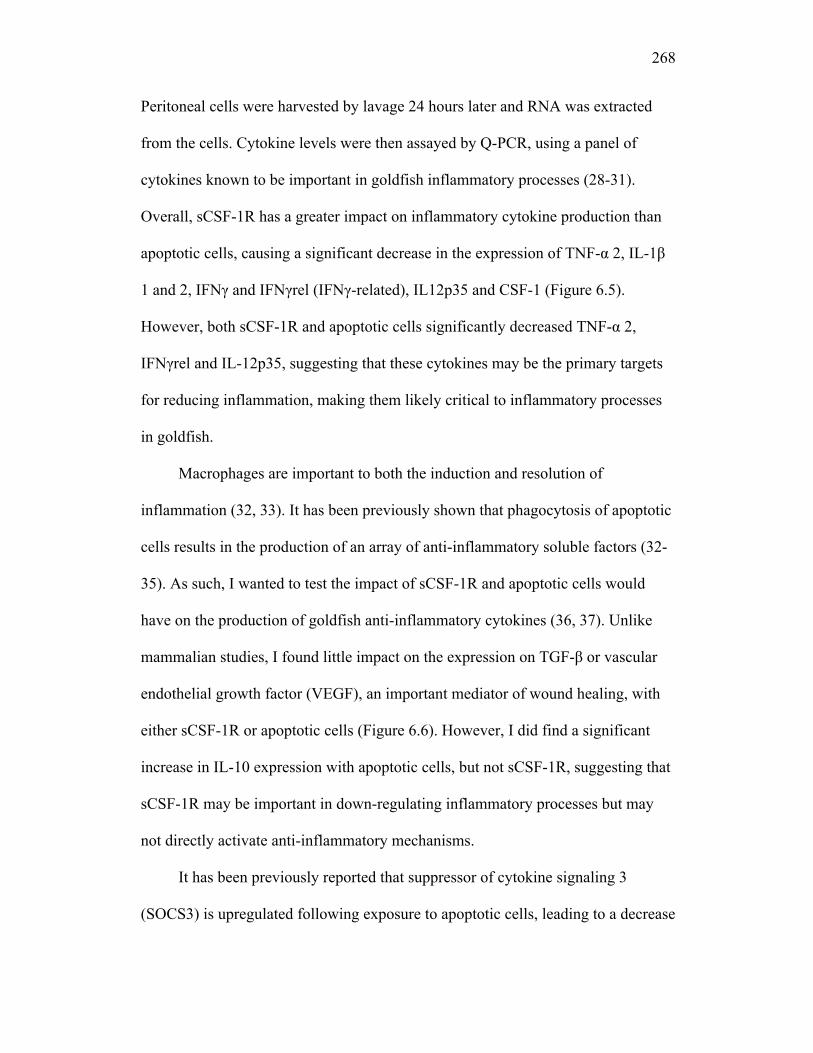
268
Peritoneal cells were harvested by lavage 24 hours later and RNA was extracted
from the cells. Cytokine levels were then assayed by Q-PCR, using a panel of
cytokines known to be important in goldfish inflammatory processes (28-31).
Overall, sCSF-1R has a greater impact on inflammatory cytokine production than
apoptotic cells, causing a significant decrease in the expression of TNF-α 2, IL-1β
1 and 2, IFNγ and IFNγrel (IFNγ-related), IL12p35 and CSF-1 (Figure 6.5).
However, both sCSF-1R and apoptotic cells significantly decreased TNF-α 2,
IFNγrel and IL-12p35, suggesting that these cytokines may be the primary targets
for reducing inflammation, making them likely critical to inflammatory processes
in goldfish.
Macrophages are important to both the induction and resolution of
inflammation (32, 33). It has been previously shown that phagocytosis of apoptotic
cells results in the production of an array of anti-inflammatory soluble factors (32-
35). As such, I wanted to test the impact of sCSF-1R and apoptotic cells would
have on the production of goldfish anti-inflammatory cytokines (36, 37). Unlike
mammalian studies, I found little impact on the expression on TGF-β or vascular
endothelial growth factor (VEGF), an important mediator of wound healing, with
either sCSF-1R or apoptotic cells (Figure 6.6). However, I did find a significant
increase in IL-10 expression with apoptotic cells, but not sCSF-1R, suggesting that
sCSF-1R may be important in down-regulating inflammatory processes but may
not directly activate anti-inflammatory mechanisms.
It has been previously reported that suppressor of cytokine signaling 3
(SOCS3) is upregulated following exposure to apoptotic cells, leading to a decrease
269
in inflammatory cytokines and chemokines (38). Interestingly, I found no increases
with either sCSF-1R or apoptotic cells, suggesting that the observed decreases in
pro-inflammatory cytokine expression in goldfish may not be regulated by SOCS3
(Figure 6.6).
6.2.4 Soluble CSF-1R affects cytokine expression in a dose-dependent
manner.
Figures 6.2 and 5.4 show that sCSF-1R has dose-dependent effects on both
cellular infiltration and ROS production (21). I wondered if there were also dose-
dependent effects on cytokine production. To examine this, I injected goldfish with
zymosan and increasing concentrations of sCSF-1R or apoptotic cells. Peritoneal
cells were harvested by lavage and cytokine expression was measured from the
extracted RNA. I chose to focus these studies on TNF-α 2, CSF-1, SOCS3 and IL-
10 since these cytokines were differentially affected by both sCSF-1R and
apoptotic cells. I found that TNF-α 2 was significantly decreased at all
concentrations of sCSF-1R, suggesting that expression of TNF-α 2 may be tightly
linked to the CSF-1 system (Figure 6.7). For CSF-1 and SOCS3, I found that
expression tended to be increased slightly with decreasing concentrations of sCSF-
1R, though this was not significant (Figure 6.7). Further, SOCS3 never
significantly rose above basal levels, again suggesting that this may not be the
primary mediator for decreasing the observed pro-inflammatory cytokine
expression in this system. The most dramatic effect of sCSF-1R concentration was
seen on IL-10 expression, where levels significantly increased with decreasing
270
sCSF-1R concentration (Figure 6.7). Interestingly, low levels of sCSF-1R induced
IL-10 expression to levels near what was found with apoptotic cells.
6.2.5 Neutrophil chemotaxis but not ROS production is impacted by sCSF-
1R.
Neutrophil infiltration is one of the hallmarks of inflammation. Figure 6.2
shows that zymosan-induced neutrophil infiltration is reduced by sCSF-1R (21).
However, neutrophils are not directly affected by sCSF-1R, suggesting that the
inhibition of inflammation caused by sCSF-1R relies on leukocyte cross-talk.
Given the central contribution of chemokines to leukocyte recruitment, I first
examined the impact of sCSF-1R on CXCL-8 and CCL-1, two important
chemokines, that are known to drive neutrophil and monocyte chemotaxis,
respectively. Recombinant sCSF-1R significantly decreased CXCL-8 at all
concentrations tested (Figure 6.8). In comparison, CCL-1 only displayed
significant decreases in expression at the highest concentration of sCSF-1R used.
Since macrophages are the primary recruiters of neutrophils to an
inflammatory site, I was curious if sCSF-1R decreased the capacity of
macrophages to drive neutrophil chemotaxis. To assess this, I isolated infiltrating
inflammatory neutrophils from zymosan-injected fish and measured chemotaxis
towards supernatants from activated macrophages treated with increasing
concentrations of sCSF-1R (Figure 6.9). Neutrophil chemotaxis in a blind-well
chamber decreased in a dose-dependent manner with increasing concentration of
271
recombinant sCSF-1R and reached similar levels to those achieved upon addition
of apoptotic cells.
In Chapter 4, I showed that murine but not teleost neutrophils were able to
internalize apoptotic cells, leading to decreased ROS production in neutrophils
with phagocytosed apoptotic cells (20). These experiments, however, were done ex
vivo, removing the effects of in vivo leukocyte cross-talk in the responses. As such,
I wished to determine if exposure to soluble products in vivo following either
apoptotic cells or sCSF-1R injection would impact neutrophil ROS. Interestingly, I
found that neutrophil-specific ROS responses were reduced in goldfish injected
with apoptotic cells but not with sCSF-1R (Figure 6.10 A). This is strikingly
different from ROS responses found in monocyte/ macrophages, where responses
are significantly reduced with both sCSF-1R and apoptotic cells (20, 21). Finally, I
assessed neutrophil killing capacity with a gentamicin protection assay and found a
significantly decreased ability to kill when exposed to soluble products from
macrophages activated in the presence of either apoptotic cells or rsCSF-1R
(Figure 6.8 B). Importantly, this data suggests that apoptotic cells are able to
trigger a variety of pathways that contribute to the resolution of inflammation, as
evidenced by the wide range of responses, while sCSF-1R is more targeted and
likely only able to regulate responses directly controlled by the CSF-1 system.
6.3 Discussion
Inflammation is a beneficial process required for the clearance and control of
pathogens. However, a loss of control of inflammatory processes can have grave
272
consequences for the host, including development of chronic inflammatory
diseases, autoimmunity, or chronic infection (39-41). Macrophages and their
central regulator, CSF-1, have been linked tightly to both the beneficial and
deleterious effects of inflammation (4). As such, the CSF-1 system represents a
potentially excellent target for controlling inflammatory processes.
Soluble receptors have been shown to be important and common regulators
of many cytokines within the immune system, including IL-1, IL-6, IFNγ, TNF-α,
GM-CSF, G-CSF and many more (42, 43). This chapter describes a novel soluble
receptor- soluble CSF-1 receptor- that, to date, has only been found in teleost fish.
In primary macrophage cultures, soluble CSF-1R was found at the highest levels
when macrophage development needed to be tightly controlled. In the senescent
phase of goldfish in vitro macrophage development, macrophage increase in sCSF-
1R production paralleled induction of apoptotic events (17). Recombinant sCSF-1R
inhibited macrophage proliferation, pointing to a potential role in hematopoiesis
control (17). As I have shown here, this novel soluble product is also able to induce
inflammatory control within teleost fish. Further, my data places the CSF-1 system
as a primary driver behind a range of inflammatory processes in goldfish.
Chapter 4 shows that apoptotic cells significantly decrease inflammatory
responses in goldfish by decreasing cellular infiltration and production of reactive
oxygen species (20). While there are striking differences in the cellular infiltration
responses in teleosts and mice (20), the overall outcomes following exposure to
apoptotic cells is similar between these two species. Interestingly, I have also
shown that sCSF-1R impacts the cellular infiltration and ROS production in a
273
similar manner as apoptotic cells (21). I wondered if this similarity would extend to
other aspects of the inflammatory response, suggesting that sCSF-1R was a
primary mediator of resolution responses in teleost fish. While I found some
similarities in the effects of sCSF-1R and apoptotic cells, there were some striking
differences in the responses that were induced.
Overall, soluble CSF-1R, like apoptotic cells, is an efficient regulator of
inflammatory processes. This was most evident in the production of antimicrobial
inflammatory mediators, where sCSF-1R reduced zymosan-induced ROS
production and iNOS B expression to basal levels. This was combined with a
significant decrease in expression of a number of inflammatory cytokines, notably
IL-1β 1 and 2, IFNγ and IFNγrel, TNF-α 2, IL-12p35 and CSF-1. All of these
cytokines have been shown to be important in the regulation of inflammatory
processes in goldfish macrophages, especially phagocytosis and the production of
reactive intermediates (28-31). It is probable, then, that the effects on ROS and
iNOS may not be a direct one but may be due to the changes in the cytokine
profiles following exposure to sCSF-1R. Further, since sCSF-1R is thought to only
bind CSF-1, it is likely that these cytokines and the production of reactive
intermediates are tightly linked to the CSF-1 system. However, the possibility
exists that sCSF-1R may be interacting with factors other than CSF-1 to exert these
effects. Interestingly, I found significant down-regulation of two pro-inflammatory
cytokines- TNFα 2 and CSF-1- across a range of sCSF-1R concentrations. This
suggests a high degree of sensitivity of these cytokines to sCSF-1R. It will be
interesting to examine the impact of low doses of sCSF-1R across a panel of pro-
274
inflammatory cytokines to see if this is a general effect or if pro-inflammatory
cytokines have differential levels of sensitivity to sCSF-1R.
When I studied canonical anti-inflammatory responses, I found further
differences between responses to sCSF-1R and apoptotic cells. The most dramatic
effect was seen on IL-10 expression. Unlike the pro-inflammatory cytokines, I
found that IL-10 expression increased with decreasing concentrations of sCSF-1R.
At the lowest level of sCSF-1R tested, responses were similar to those measured
with apoptotic cells. This may indicate that, at low doses of sCSF-1R, there are
sufficient pro-inflammatory signals remaining to induce IL-10 expression that are
ablated at high levels of sCSF-1R. Alternatively, it may show IL-10 requires a
threshold level of CSF-1 expression to be produced and it is not expressed below
this level. Interestingly, I have yet to observe an increase in TGF-β following
apoptotic cell exposure, even though this is the primary mediator of anti-
inflammatory responses following phagocytosis of apoptotic cells in mammals
(44). While expression and many of the functions of TGF-β are highly conserved
(37, 45), it is possible that the link between TGF-β and apoptotic cells is not
conserved through evolution. It is also possible that a different trigger or
combination of triggers is required to induce TGF-β production following exposure
to apoptotic cells in teleost fish.
Neutrophils are among the earliest leukocytes recruited into an inflammatory
site and are known for their vast inflammatory and antimicrobial arsenal.
Therefore, reducing the infiltration of neutrophils into an inflammatory site may
represent an important mechanism to limit damage to host tissues. I show here that
275
both sCSF-1R and apoptotic cells significantly reduce the infiltration of neutrophils
into an inflammatory site (20, 21). I was curious if this was occurring due to
changes in chemotaxis or through another mechanism. Using a blind-well
chemotaxis chamber, I found that neutrophil chemotaxis was significantly
decreased with increasing concentrations of sCSF-1R or with apoptotic cells.
Further, both sCSF-1R and apoptotic cells significantly decreased expression of
CXCL-8 (also known as IL-8), the primary mediator of neutrophil chemotaxis (46).
The relatively limited impact on CCL-1 also matches my infiltration data, where
monocyte/macrophage infiltration was only impacted at the highest doses of sCSF-
1R (21). I have previously shown that goldfish neutrophils are unable to ingest
apoptotic cells and that their ROS production is not changed by soluble factors
produced ex vivo (20). Thus, I examined if exposure to complex in vivo milieu
could affect neutrophil-specific ROS responses. Surprisingly, I found that only
apoptotic cells and not sCSF-1R resulted in decreased neutrophil ROS production,
though neutrophil killing capacity was equally affected by soluble products from
apoptotic cell or sCSF-1R stimulated macrophages. This suggests two things: [1.]
neutrophil ROS is not controlled by the CSF-1 system; and [2.] apoptotic cells are
able to affect inflammatory pathways not targeted by sCSF-1R, suggesting that
these two anti-inflammatory mediators are complimentary, not redundant.
Overall, the proper control of inflammation is of outmost physiological
importance for the long-term survival of an animal host. This chapter further
describes a novel method of controlling inflammation- through the production of a
soluble CSF-1 receptor. Soluble CSF-1R affects every aspect of a macrophage
276
inflammatory response examined- phagocytosis, production of inflammatory
cytokines and chemokines, production of reactive intermediates, and the ability to
recruit cells into an inflammatory site. This speaks to the importance of CSF-1 to
inflammation and suggests that it may be an important target for inflammatory
control across vertebrates.
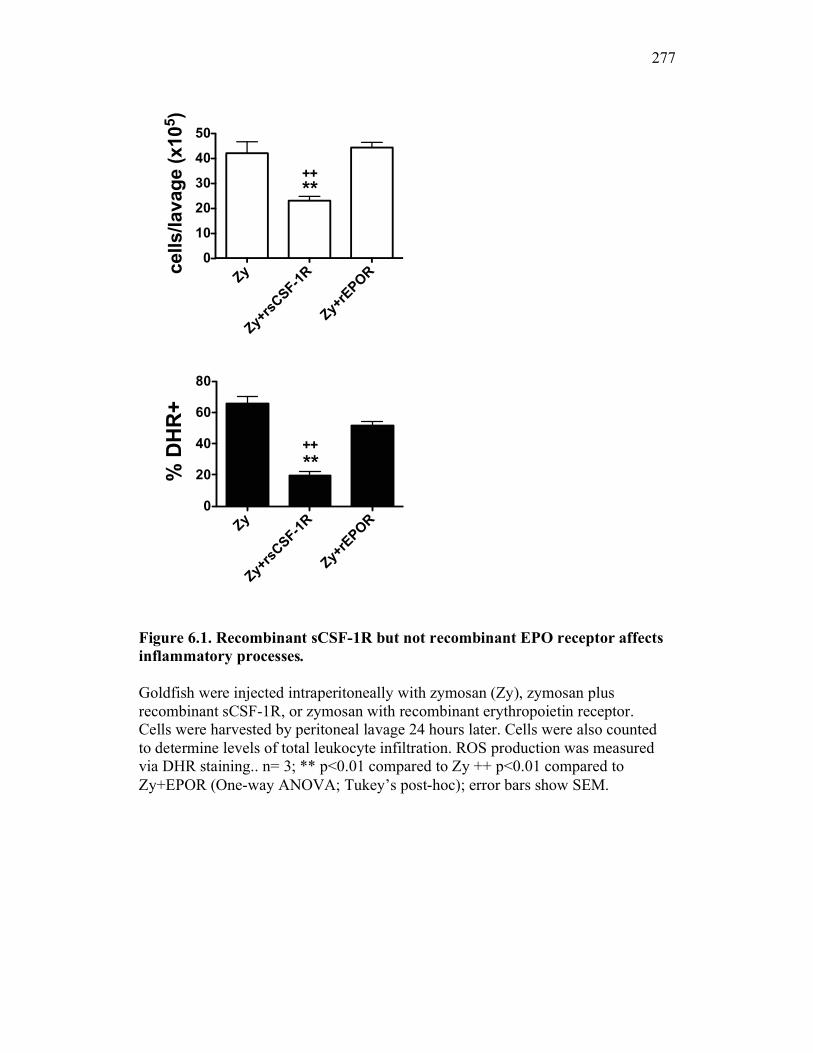
277
Zy
Zy+rsC
SF-1R
Zy+rE
POR0
10
20
30
40
50
cells
/lava
ge (x
105 )
**++
Zy
Zy+rsC
SF-1R
Zy+rE
POR0
20
40
60
80
**++
% D
HR
+
Figure 6.1. Recombinant sCSF-1R but not recombinant EPO receptor affects inflammatory processes. Goldfish were injected intraperitoneally with zymosan (Zy), zymosan plus recombinant sCSF-1R, or zymosan with recombinant erythropoietin receptor. Cells were harvested by peritoneal lavage 24 hours later. Cells were also counted to determine levels of total leukocyte infiltration. ROS production was measured via DHR staining.. n= 3; ** p<0.01 compared to Zy ++ p<0.01 compared to Zy+EPOR (One-way ANOVA; Tukey’s post-hoc); error bars show SEM.
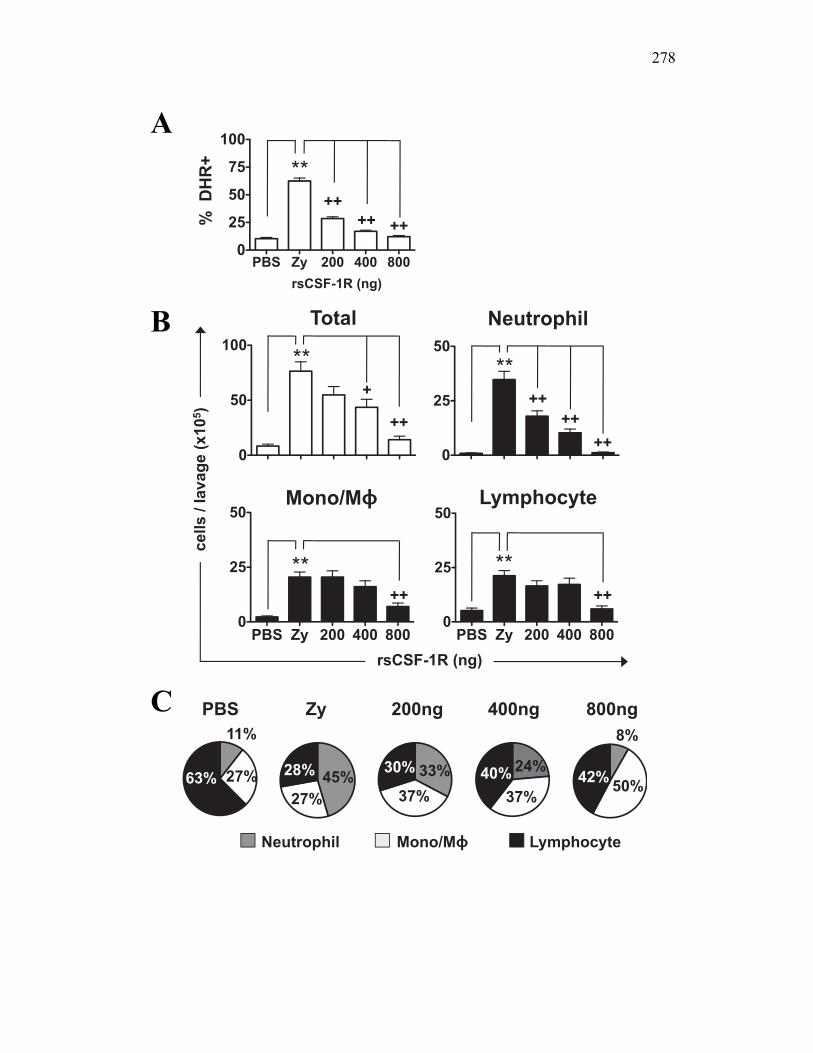
278
A
C
B
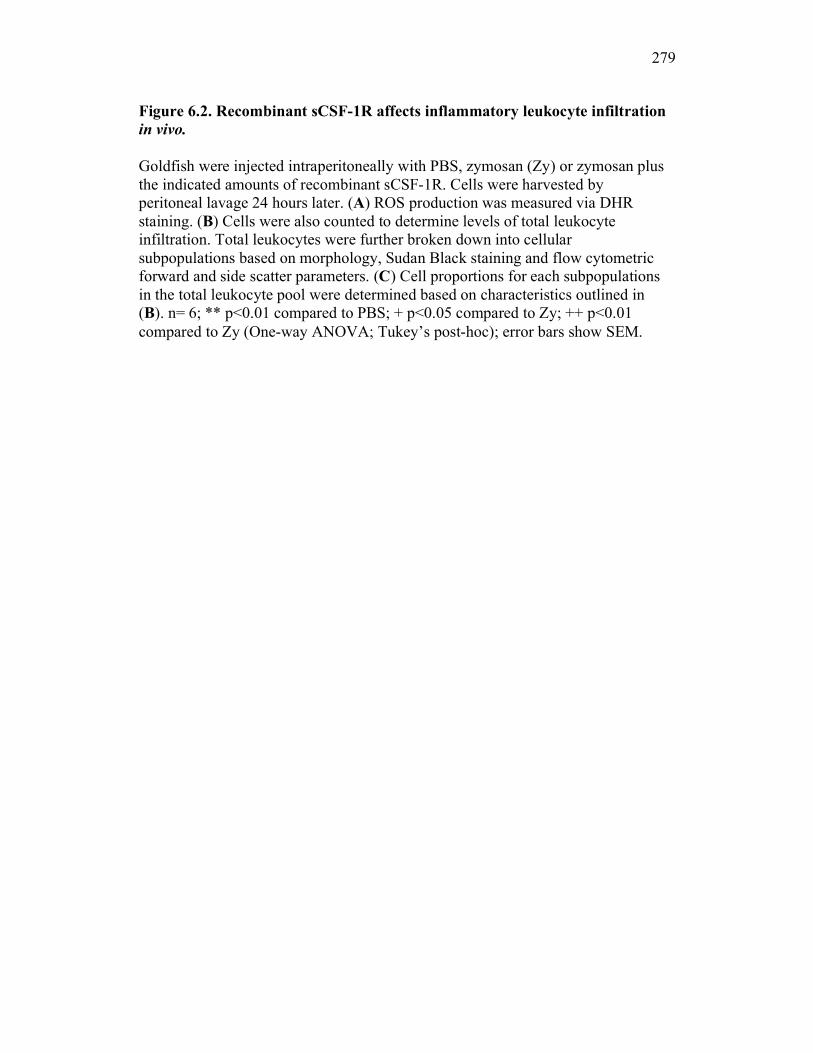
279
Figure 6.2. Recombinant sCSF-1R affects inflammatory leukocyte infiltration in vivo. Goldfish were injected intraperitoneally with PBS, zymosan (Zy) or zymosan plus the indicated amounts of recombinant sCSF-1R. Cells were harvested by peritoneal lavage 24 hours later. (A) ROS production was measured via DHR staining. (B) Cells were also counted to determine levels of total leukocyte infiltration. Total leukocytes were further broken down into cellular subpopulations based on morphology, Sudan Black staining and flow cytometric forward and side scatter parameters. (C) Cell proportions for each subpopulations in the total leukocyte pool were determined based on characteristics outlined in (B). n= 6; ** p<0.01 compared to PBS; + p<0.05 compared to Zy; ++ p<0.01 compared to Zy (One-way ANOVA; Tukey’s post-hoc); error bars show SEM.
280
Figure 6.3. Soluble CSF-1R and apoptotic cells down-regulate pro-inflammatory phagocytic responses. Goldfish were injected i.p. with zymosan in the presence or absence of either apoptotic cells (AC) or recombinant sCSF-1R. After 24 hours, peritoneal cells were harvested by lavage. (A) Cells were then incubated with zymosan-FITC particles (5:1 ratio, particle: cell) for 2 hours to measure phagocytosis. Reactive oxygen production was measured with dihydrorhodamine (DHR). Both apoptotic cells and sCSF-1R reduced phagocytic and ROS responses. n=4. (B) Killing capacity was measured with a gentamicin protection assay. PKMs were incubated for 2 hours with the noted stimuli. Aeromonas veronii was then added for 30 minutes. Cells were washed and incubated in a high dose of gentamicin for 30 minutes. At the indicated time points, cells were lysed and plated onto TSA plates. Colonies were counted 48 h later. n=6; * p<0.05, ** p<0.01 compared to PBS; + p<0.05, ++ p<0.01 compared to zymosan (One-way ANOVA; Tukey’s post-hoc for A; Two-way ANOVE; Bonferroni post-hoc for B); error bars show SEM.
PBS Zy
Zy+AC
Zy+rsC
SF-1R0
5
10
15 **
++++
% p
hago
cyto
sis
15 30 6000
50
100
150MediaZyZy+ACZy+rsCSF-1R
++
Bacteria
Time (min)
Surv
ival
rate
(%)
PBS Zy
Zy+AC
Zy+rsC
SF-1R0
20
40
60
80 **
++
++*%
DH
R+
A
B
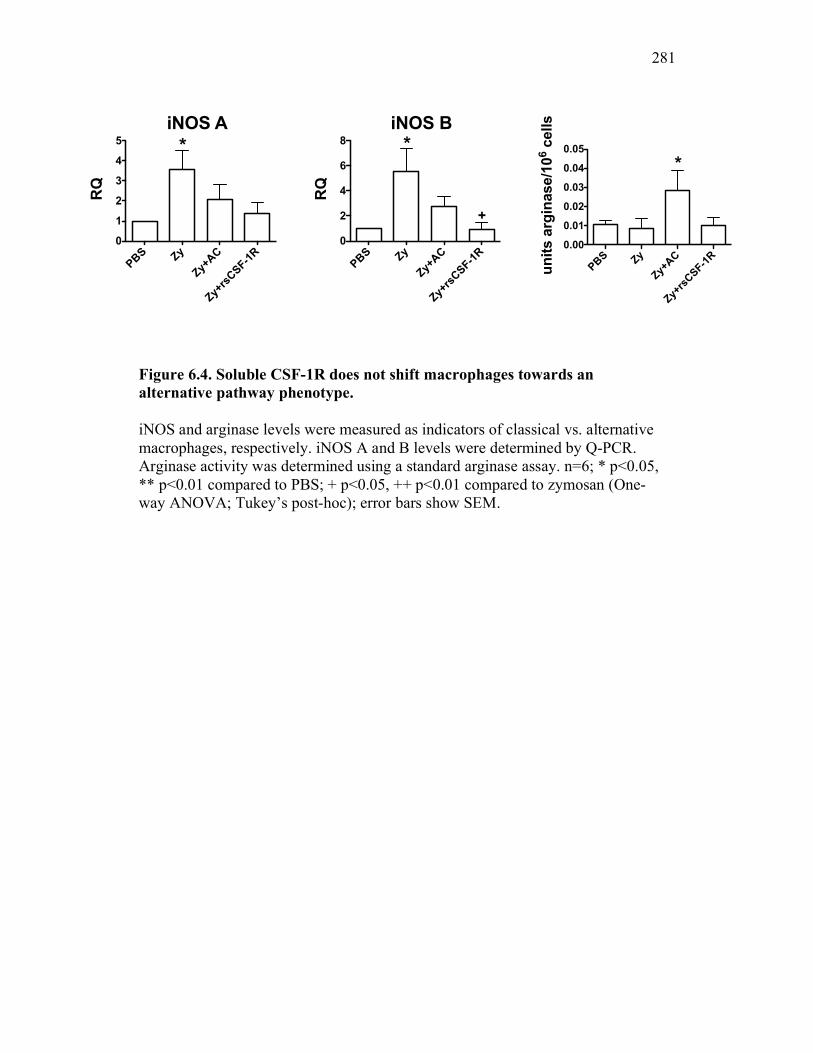
281
Figure 6.4. Soluble CSF-1R does not shift macrophages towards an alternative pathway phenotype. iNOS and arginase levels were measured as indicators of classical vs. alternative macrophages, respectively. iNOS A and B levels were determined by Q-PCR. Arginase activity was determined using a standard arginase assay. n=6; * p<0.05, ** p<0.01 compared to PBS; + p<0.05, ++ p<0.01 compared to zymosan (One-way ANOVA; Tukey’s post-hoc); error bars show SEM.
PBS Zy
Zy+AC
Zy+rsC
SF-1R0
1
2
3
4
5iNOS A
*
RQ
PBS Zy
Zy+AC
Zy+rsC
SF-1R0
2
4
6
8iNOS B
*
+
RQ
PBS Zy
Zy+AC
Zy+rsC
SF-1R0.00
0.01
0.02
0.03
0.04
0.05*
units
arg
inas
e/10
6 cel
ls
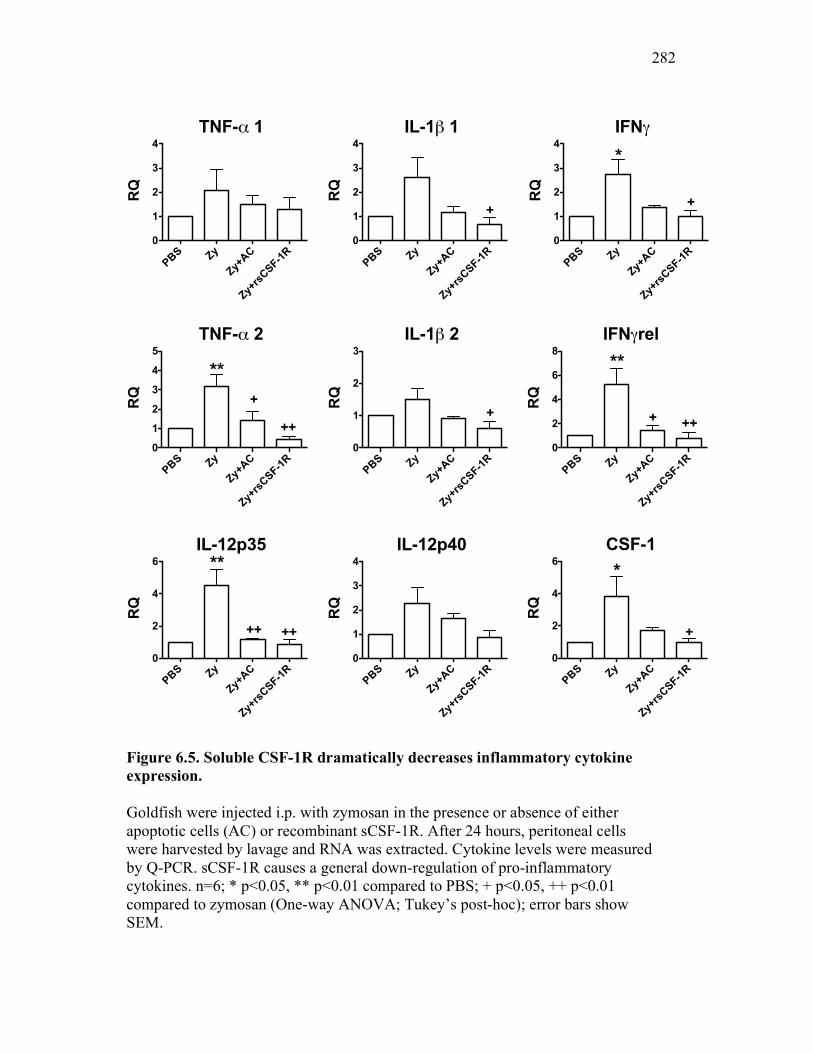
282
Figure 6.5. Soluble CSF-1R dramatically decreases inflammatory cytokine expression. Goldfish were injected i.p. with zymosan in the presence or absence of either apoptotic cells (AC) or recombinant sCSF-1R. After 24 hours, peritoneal cells were harvested by lavage and RNA was extracted. Cytokine levels were measured by Q-PCR. sCSF-1R causes a general down-regulation of pro-inflammatory cytokines. n=6; * p<0.05, ** p<0.01 compared to PBS; + p<0.05, ++ p<0.01 compared to zymosan (One-way ANOVA; Tukey’s post-hoc); error bars show SEM.
PBS Zy
Zy+AC
Zy+rsC
SF-1R0
1
2
3
4TNF-α 1
RQ
PBS Zy
Zy+AC
Zy+rsC
SF-1R0
1
2
3
4
5TNF-α 2
**
++
+RQ
PBS Zy
Zy+AC
Zy+rsC
SF-1R0
2
4
6IL-12p35
**
++++
RQ
PBS Zy
Zy+AC
Zy+rsC
SF-1R0
1
2
3
4IL-1β 1
+
RQ
PBS Zy
Zy+AC
Zy+rsC
SF-1R0
1
2
3IL-1β 2
+RQ
PBS Zy
Zy+AC
Zy+rsC
SF-1R0
1
2
3
4IL-12p40
RQ
PBS Zy
Zy+AC
Zy+rsC
SF-1R0
1
2
3
4IFNγ*
+RQ
PBS Zy
Zy+AC
Zy+rsC
SF-1R0
2
4
6
8IFNγrel**
+++
RQ
PBS Zy
Zy+AC
Zy+rsC
SF-1R0
2
4
6CSF-1*
+
RQ
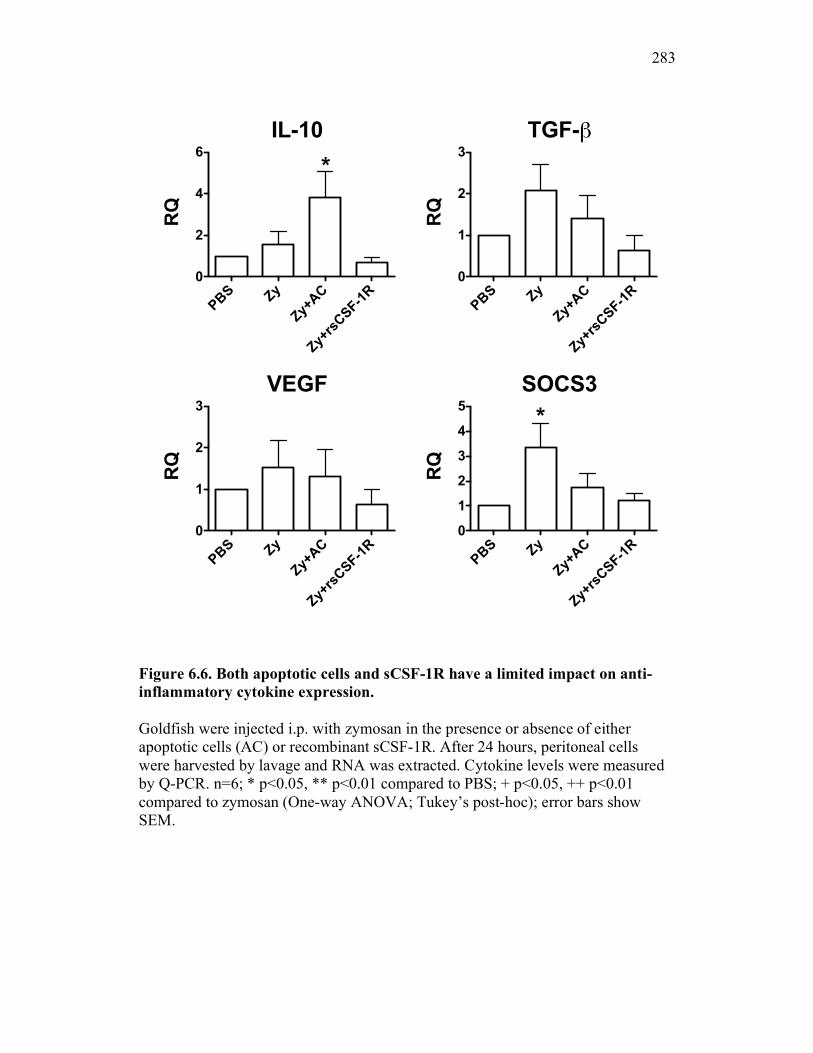
283
Figure 6.6. Both apoptotic cells and sCSF-1R have a limited impact on anti-inflammatory cytokine expression. Goldfish were injected i.p. with zymosan in the presence or absence of either apoptotic cells (AC) or recombinant sCSF-1R. After 24 hours, peritoneal cells were harvested by lavage and RNA was extracted. Cytokine levels were measured by Q-PCR. n=6; * p<0.05, ** p<0.01 compared to PBS; + p<0.05, ++ p<0.01 compared to zymosan (One-way ANOVA; Tukey’s post-hoc); error bars show SEM.
PBS Zy
Zy+AC
Zy+rsC
SF-1R0
2
4
6IL-10
*R
Q
PBS Zy
Zy+AC
Zy+rsC
SF-1R0
1
2
3VEGF
RQ
PBS Zy
Zy+AC
Zy+rsC
SF-1R0
1
2
3TGF-β
RQ
PBS Zy
Zy+AC
Zy+rsC
SF-1R0
1
2
3
4
5SOCS3
*R
Q
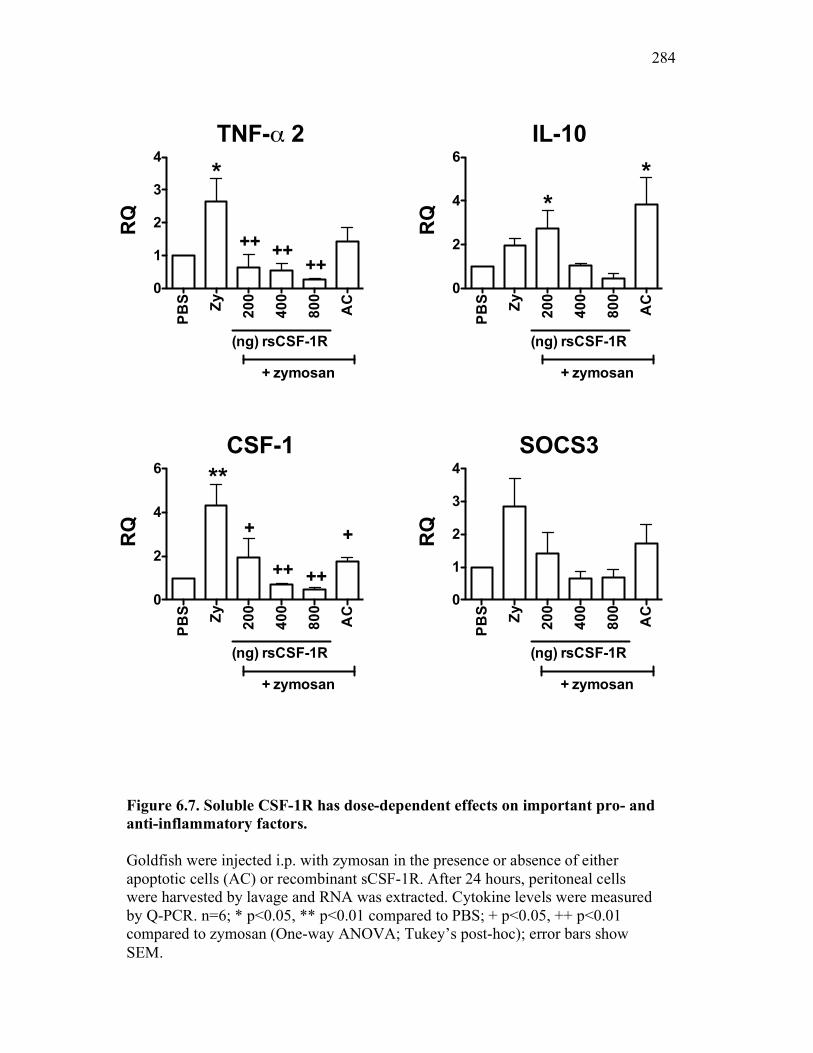
284
Figure 6.7. Soluble CSF-1R has dose-dependent effects on important pro- and anti-inflammatory factors. Goldfish were injected i.p. with zymosan in the presence or absence of either apoptotic cells (AC) or recombinant sCSF-1R. After 24 hours, peritoneal cells were harvested by lavage and RNA was extracted. Cytokine levels were measured by Q-PCR. n=6; * p<0.05, ** p<0.01 compared to PBS; + p<0.05, ++ p<0.01 compared to zymosan (One-way ANOVA; Tukey’s post-hoc); error bars show SEM.
PBS Zy 200
400
800
AC
0
1
2
3
4TNF-α 2*
++++
++
+ zymosan
(ng) rsCSF-1R
RQ
PBS Zy 200
400
800
AC
0
1
2
3
4SOCS3
+ zymosan
(ng) rsCSF-1R
RQ
PBS Zy 200
400
800
AC
0
2
4
6CSF-1
**
++++
+
+ zymosan
(ng) rsCSF-1R
+RQ
PBS Zy 200
400
800
AC
0
2
4
6IL-10
**
+ zymosan
(ng) rsCSF-1R
RQ
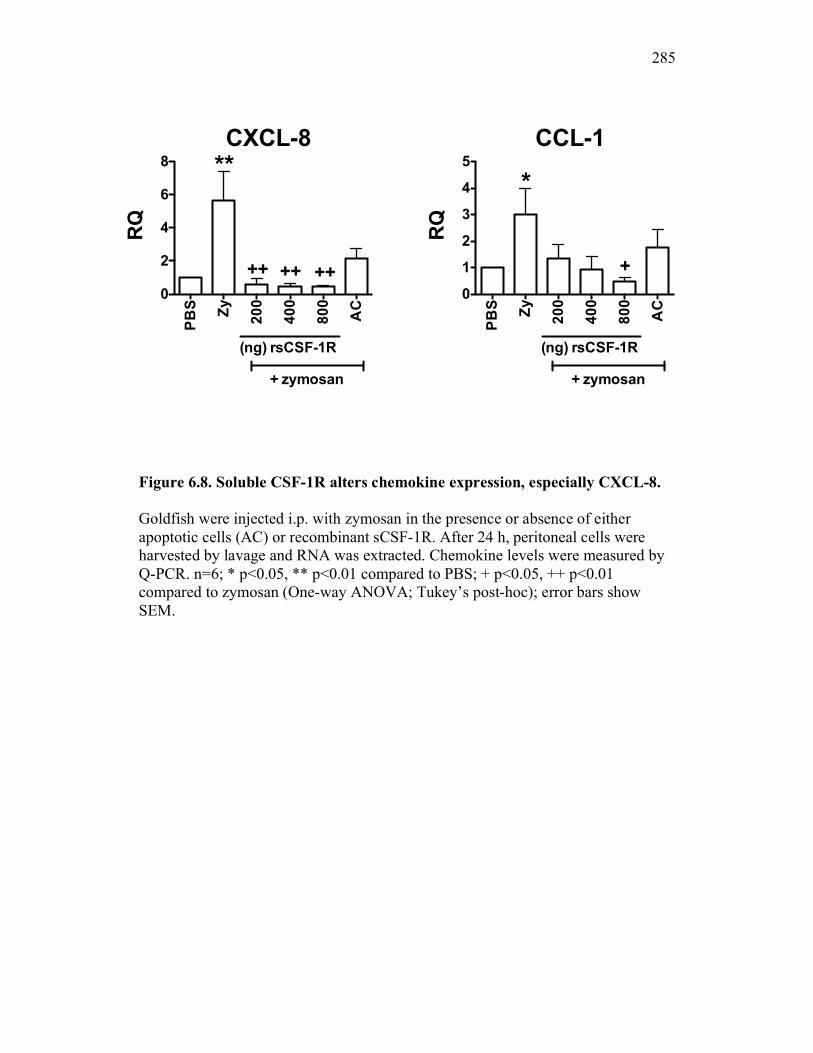
285
Figure 6.8. Soluble CSF-1R alters chemokine expression, especially CXCL-8.
Goldfish were injected i.p. with zymosan in the presence or absence of either apoptotic cells (AC) or recombinant sCSF-1R. After 24 h, peritoneal cells were harvested by lavage and RNA was extracted. Chemokine levels were measured by Q-PCR. n=6; * p<0.05, ** p<0.01 compared to PBS; + p<0.05, ++ p<0.01 compared to zymosan (One-way ANOVA; Tukey’s post-hoc); error bars show SEM.
PBS Zy 200
400
800
AC
0
2
4
6
8CXCL-8
**
++ ++ ++
+ zymosan
(ng) rsCSF-1R
RQ
PBS Zy 200
400
800
AC
0
1
2
3
4
5CCL-1
*
+
+ zymosan
(ng) rsCSF-1R
RQ
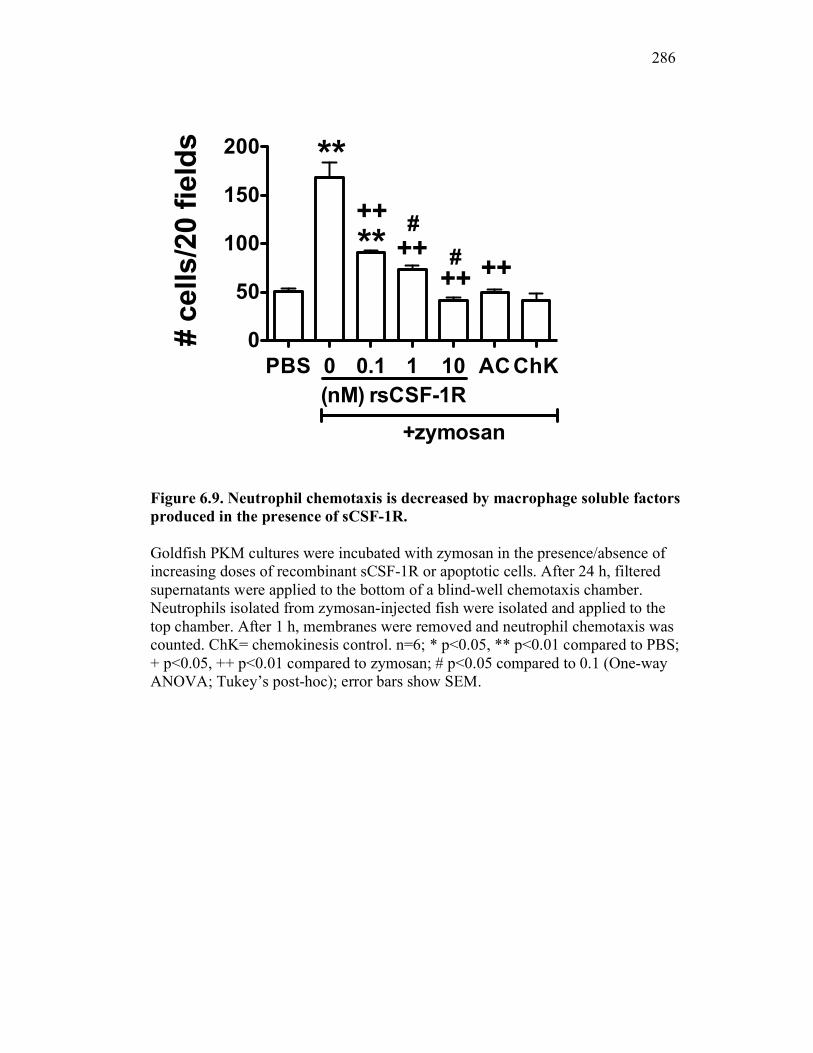
286
Figure 6.9. Neutrophil chemotaxis is decreased by macrophage soluble factors produced in the presence of sCSF-1R. Goldfish PKM cultures were incubated with zymosan in the presence/absence of increasing doses of recombinant sCSF-1R or apoptotic cells. After 24 h, filtered supernatants were applied to the bottom of a blind-well chemotaxis chamber. Neutrophils isolated from zymosan-injected fish were isolated and applied to the top chamber. After 1 h, membranes were removed and neutrophil chemotaxis was counted. ChK= chemokinesis control. n=6; * p<0.05, ** p<0.01 compared to PBS; + p<0.05, ++ p<0.01 compared to zymosan; # p<0.05 compared to 0.1 (One-way ANOVA; Tukey’s post-hoc); error bars show SEM.
PBS 0 0.1 1 10 ACChK0
50
100
150
200 **
++ ++
(nM) rsCSF-1R+zymosan
** ++++
# ce
lls/2
0 fie
lds
##
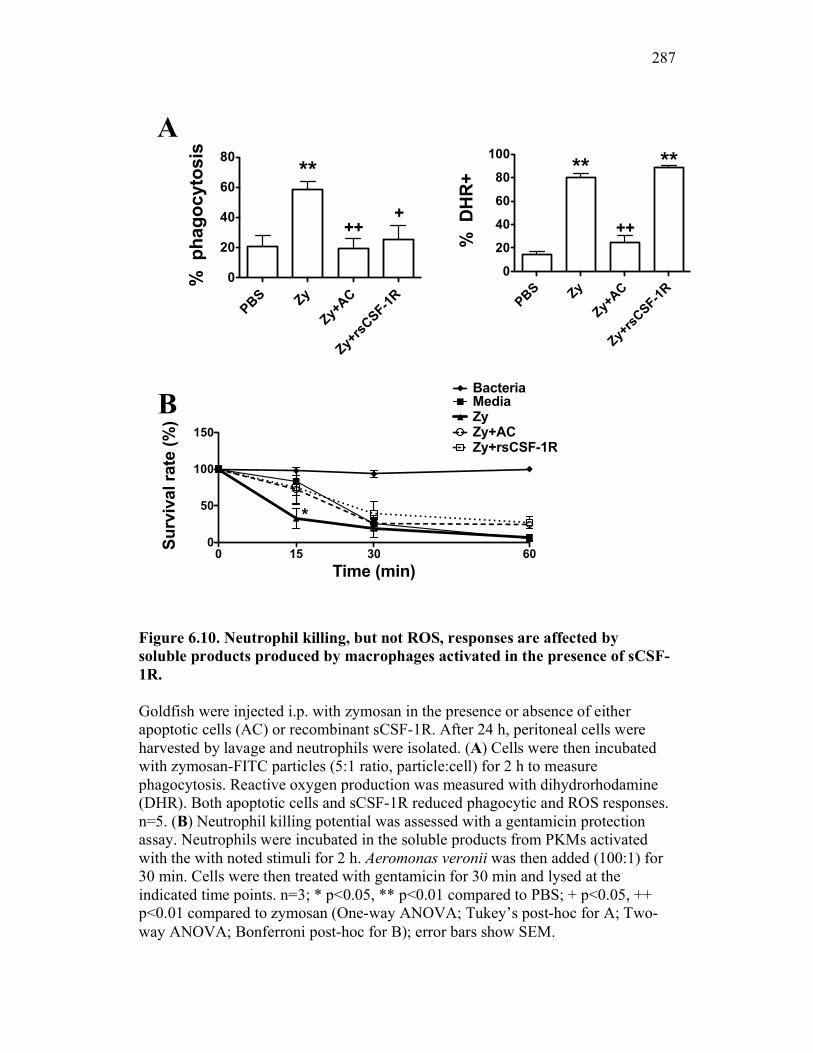
287
Figure 6.10. Neutrophil killing, but not ROS, responses are affected by soluble products produced by macrophages activated in the presence of sCSF-1R. Goldfish were injected i.p. with zymosan in the presence or absence of either apoptotic cells (AC) or recombinant sCSF-1R. After 24 h, peritoneal cells were harvested by lavage and neutrophils were isolated. (A) Cells were then incubated with zymosan-FITC particles (5:1 ratio, particle:cell) for 2 h to measure phagocytosis. Reactive oxygen production was measured with dihydrorhodamine (DHR). Both apoptotic cells and sCSF-1R reduced phagocytic and ROS responses. n=5. (B) Neutrophil killing potential was assessed with a gentamicin protection assay. Neutrophils were incubated in the soluble products from PKMs activated with the with noted stimuli for 2 h. Aeromonas veronii was then added (100:1) for 30 min. Cells were then treated with gentamicin for 30 min and lysed at the indicated time points. n=3; * p<0.05, ** p<0.01 compared to PBS; + p<0.05, ++ p<0.01 compared to zymosan (One-way ANOVA; Tukey’s post-hoc for A; Two-way ANOVA; Bonferroni post-hoc for B); error bars show SEM.
PBS Zy
Zy+AC
Zy+rsC
SF-1R0
20
40
60
80**
+++
% p
hago
cyto
sis
15 30 6000
50
100
150
MediaZyZy+ACZy+rsCSF-1R
*
Bacteria
Time (min)
Surv
ival
rate
(%)
PBS Zy
Zy+AC
Zy+rsC
SF-1R0
20
40
60
80
100**
++
**
% D
HR
+
A
B
288
6.4 References
1. Barreda, D.R., Hanington, P.C., and Belosevic, M. 2004. Regulation of myeloid development and function by colony stimulating factors. Dev Comp Immunol 28:509-554.
2. O'Mahony, D.S., Pham, U., Iyer, R., Hawn, T.R., and Liles, W.C. 2008. Differential constitutive and cytokine-modulated expression of human Toll-like receptors in primary neutrophils, monocytes, and macrophages. Int J Med Sci 5:1-8.
3. Roilides, E., Lyman, C.A., Mertins, S.D., Cole, D.J., Venzon, D., Pizzo, P.A., Chanock, S.J., and Walsh, T.J. 1996. Ex vivo effects of macrophage colony-stimulating factor on human monocyte activity against fungal and bacterial pathogens. Cytokine 8:42-48.
4. Chitu, V., and Stanley, E.R. 2006. Colony-stimulating factor-1 in immunity and inflammation. Curr Opin Immunol 18:39-48.
5. Evans, R., Kamdar, S.J., Fuller, J.A., and Krupke, D.M. 1995. The potential role of the macrophage colony-stimulating factor, CSF-1, in inflammatory responses: characterization of macrophage cytokine gene expression. J Leukoc Biol 58:99-107.
6. Hashimoto, S., Yoda, M., Yamada, M., Yanai, N., Kawashima, T., and Motoyoshi, K. 1996. Macrophage colony-stimulating factor induces interleukin-8 production in human monocytes. Exp Hematol 24:123-128.
7. Sweet, M.J., and Hume, D.A. 2003. CSF-1 as a regulator of macrophage activation and immune responses. Arch Immunol Ther Exp (Warsz) 51:169-177.
8. Boocock, C.A., Jones, G.E., Stanley, E.R., and Pollard, J.W. 1989. Colony-stimulating factor-1 induces rapid behavioural responses in the mouse macrophage cell line, BAC1.2F5. J Cell Sci 93 ( Pt 3):447-456.
9. Webb, S.E., Pollard, J.W., and Jones, G.E. 1996. Direct observation and quantification of macrophage chemoattraction to the growth factor CSF-1. J Cell Sci 109 ( Pt 4):793-803.
10. Akagawa, K.S. 2002. Functional heterogeneity of colony-stimulating factor-induced human monocyte-derived macrophages. Int J Hematol 76:27-34.
11. Cheers, C., Hill, M., Haigh, A.M., and Stanley, E.R. 1989. Stimulation of macrophage phagocytic but not bactericidal activity by colony-stimulating factor 1. Infect Immun 57:1512-1516.
12. Kleemann, R., Zadelaar, S., and Kooistra, T. 2008. Cytokines and atherosclerosis: a comprehensive review of studies in mice. Cardiovasc Res 79:360-376.
13. Lewis, C.E., and Pollard, J.W. 2006. Distinct role of macrophages in different tumor microenvironments. Cancer Res 66:605-612.
14. Weisberg, S.P., McCann, D., Desai, M., Rosenbaum, M., Leibel, R.L., and Ferrante, A.W., Jr. 2003. Obesity is associated with macrophage accumulation in adipose tissue. J Clin Invest 112:1796-1808.
289
15. Menke, J., Rabacal, W.A., Byrne, K.T., Iwata, Y., Schwartz, M.M., Stanley, E.R., Schwarting, A., and Kelley, V.R. 2009. Circulating CSF-1 promotes monocyte and macrophage phenotypes that enhance lupus nephritis. J Am Soc Nephrol 20:2581-2592.
16. Rubin Kelley, V., Bloom, R.D., Yui, M.A., Martin, C., and Price, D. 1994. Pivotal role of colony stimulating factor-1 in lupus nephritis. Kidney Int Suppl 45:S83-85.
17. Barreda, D.R., Hanington, P.C., Stafford, J.L., and Belosevic, M. 2005. A novel soluble form of the CSF-1 receptor inhibits proliferation of self-renewing macrophages of goldfish (Carassius auratus L.). Dev Comp Immunol 29:879-894.
18. Barreda, D.R., and Belosevic, M. 2001. Characterisation of growth enhancing factor production in different phases of in vitro fish macrophage development. Fish Shellfish Immunol 11:169-185.
19. Rieger, A.M., Konowalchuk, J.D., Grayfer, L., Katzenback, B.A., Havixbeck, J.J., Kiemele, M.D., Belosevic, M., and Barreda, D.R. 2012. Fish and mammalian phagocytes differentially regulate pro-inflammatory and homeostatic responses in vivo. PLoS ONE - Accepted [manuscript number: PONE-D-12-21984].
20. Rieger, A.M., Konowalchuk, J.D., Grayfer, L., Katzenback, B.A., Havixbeck, J.J., Kiemele, M.D., Belosevic, M., and Barreda, D.R. 2012. Fish and mammalian phagocytes differentially regulate pro-inflammatory and homeostatic responses in vivo. PLoS One 7:e47070.
21. Rieger, A.M., Konowalchuk, J.D., Havixbeck, J.J., Robbins, J.S., Smith, M.K., Lund, J.M., and Barreda, D.R. 2013. A soluble form of the CSF-1 receptor contributes to the inhibition of inflammation in a teleost fish. Dev Comp Immunol 39:438-446.
22. Murray, P.J., and Wynn, T.A. 2011. Protective and pathogenic functions of macrophage subsets. Nat Rev Immunol 11:723-737.
23. Mosser, D.M., and Edwards, J.P. 2008. Exploring the full spectrum of macrophage activation. Nat Rev Immunol 8:958-969.
24. Edwards, J.P., Zhang, X., Frauwirth, K.A., and Mosser, D.M. 2006. Biochemical and functional characterization of three activated macrophage populations. J Leukoc Biol 80:1298-1307.
25. Ho, V.W., and Sly, L.M. 2009. Derivation and characterization of murine alternatively activated (M2) macrophages. Methods Mol Biol 531:173-185.
26. Joerink, M., Forlenza, M., Ribeiro, C.M., de Vries, B.J., Savelkoul, H.F., and Wiegertjes, G.F. 2006. Differential macrophage polarisation during parasitic infections in common carp (Cyprinus carpio L.). Fish Shellfish Immunol 21:561-571.
27. Joerink, M., Savelkoul, H.F., and Wiegertjes, G.F. 2006. Evolutionary conservation of alternative activation of macrophages: structural and functional characterization of arginase 1 and 2 in carp (Cyprinus carpio L.). Mol Immunol 43:1116-1128.
290
28. Grayfer, L., and Belosevic, M. 2009. Molecular characterization, expression and functional analysis of goldfish (Carassius aurutus L.) interferon gamma. Dev Comp Immunol 33:235-246.
29. Grayfer, L., Garcia, E.G., and Belosevic, M. 2010. Comparison of macrophage antimicrobial responses induced by type II interferons of the goldfish (Carassius auratus L.). J Biol Chem 285:23537-23547.
30. Grayfer, L., Hanington, P.C., and Belosevic, M. 2009. Macrophage colony-stimulating factor (CSF-1) induces pro-inflammatory gene expression and enhances antimicrobial responses of goldfish (Carassius auratus L.) macrophages. Fish Shellfish Immunol 26:406-413.
31. Grayfer, L., Walsh, J.G., and Belosevic, M. 2008. Characterization and functional analysis of goldfish (Carassius auratus L.) tumor necrosis factor-alpha. Dev Comp Immunol 32:532-543.
32. Weigert, A., Jennewein, C., and Brune, B. 2009. The liaison between apoptotic cells and macrophages--the end programs the beginning. Biol Chem 390:379-390.
33. Huynh, M.L., Fadok, V.A., and Henson, P.M. 2002. Phosphatidylserine-dependent ingestion of apoptotic cells promotes TGF-beta1 secretion and the resolution of inflammation. J Clin Invest 109:41-50.
34. Erwig, L.P., and Henson, P.M. 2007. Immunological consequences of apoptotic cell phagocytosis. Am J Pathol 171:2-8.
35. Erwig, L.P., and Henson, P.M. 2008. Clearance of apoptotic cells by phagocytes. Cell Death Differ 15:243-250.
36. Grayfer, L., Hodgkinson, J.W., Hitchen, S.J., and Belosevic, M. 2011. Characterization and functional analysis of goldfish (Carassius auratus L.) interleukin-10. Mol Immunol 48:563-571.
37. Haddad, G., Hanington, P.C., Wilson, E.C., Grayfer, L., and Belosevic, M. 2008. Molecular and functional characterization of goldfish (Carassius auratus L.) transforming growth factor beta. Dev Comp Immunol 32:654-663.
38. Tassiulas, I., Park-Min, K.H., Hu, Y., Kellerman, L., Mevorach, D., and Ivashkiv, L.B. 2007. Apoptotic cells inhibit LPS-induced cytokine and chemokine production and IFN responses in macrophages. Hum Immunol 68:156-164.
39. Poon, I.K., Hulett, M.D., and Parish, C.R. 2010. Molecular mechanisms of late apoptotic/necrotic cell clearance. Cell Death Differ 17:381-397.
40. Duffield, J.S. 2003. The inflammatory macrophage: a story of Jekyll and Hyde. Clin Sci (Lond) 104:27-38.
41. Soehnlein, O., and Lindbom, L. 2010. Phagocyte partnership during the onset and resolution of inflammation. Nat Rev Immunol 10:427-439.
42. Fernandez-Botran, R. 1991. Soluble cytokine receptors: their role in immunoregulation. FASEB J 5:2567-2574.
43. Heaney, M.L., and Golde, D.W. 1998. Soluble receptors in human disease. J Leukoc Biol 64:135-146.
44. Fadok, V.A., Bratton, D.L., Konowal, A., Freed, P.W., Westcott, J.Y., and Henson, P.M. 1998. Macrophages that have ingested apoptotic cells in vitro
291
inhibit proinflammatory cytokine production through autocrine/paracrine mechanisms involving TGF-beta, PGE2, and PAF. J Clin Invest 101:890-898.
45. Newfeld, S.J., Wisotzkey, R.G., and Kumar, S. 1999. Molecular evolution of a developmental pathway: phylogenetic analyses of transforming growth factor-beta family ligands, receptors and Smad signal transducers. Genetics 152:783-795.
46. Harada, A., Sekido, N., Akahoshi, T., Wada, T., Mukaida, N., and Matsushima, K. 1994. Essential involvement of interleukin-8 (IL-8) in acute inflammation. J Leukoc Biol 56:559-564.
292
Chapter 7: Aeromonas infections induce high levels of
soluble CSF-1R expression and impact hematopoietic cell
production
7.1 Introduction
Aeromonas is one of the oldest known fish pathogens, originally
characterized in the 1890s (1). This highly virulent fish pathogen has had
devastating effects on the fish farming industry (2). Aeromonas infections are
characterized by the presence of fin rot, tail rot, ulcers, and hemorrhagic
septicemia- leading to scale shedding, hemorrhages in the gills and anal area,
exophthalmia, and abdominal swelling (3-7). However, many carrier fish do not
present with external furuncles but are still capable of shedding bacteria into the
environment at high rates (105-106 CFU/fish/hour) (8). In fact, it has been
estimated that up to 80% of cultivated fish may carry Aeromonas (9), and in many
cases of major die-offs in fish, Aeromonas species caused invasive secondary
infections in fish that were immune suppressed due to adverse environmental
conditions (improper handling, drastic temperature changes, poor water quality) (5-
8, 10) or spawning (1).
While reports vary, depending on the classification system used, there are
currently up to 24 characterized species of Aeromonas reported (1). The genus is
characterized as being Gram-negative, oxidase- and catalase-positive, glucose
fermenting rods (10) that have traditionally been divided into two groups: the
psychrophilic group and the mesophilic group (1). The psychrophilic group,
293
typified by A. salmonicida, causes primarily fish diseases and is compromised of
non-motile isolates that grow optimally at 22-25oC (1, 10). The mesophilic group,
typified by A. hydrophila, is composed of motile isolates that grow well at 35-37oC
and are commonly associated with human infections (1, 10). Other important
pathogens within this group include A. caviae, A. sobria, and the Aeromonas
veronii group (AVG) (A. veronii bv sobria, A. veronii bv veronii, and A.
allosaccharophila) (10). Bacteria within the AVG have been characterized as
‘virulent pathogens’, with an LD50 ranging from104.07-107 CFU/fish (11-13),
depending on species of fish and site of administration.
Of the characterized aeromonads, Aeromonas veronii displays virulence in
the greatest host range of species, including causing wound infections, diarrhea and
septicemia in humans (1, 11, 14), as well as infections in fish (15), eels (16) and
pigs (17). This species has been shown to produce significantly higher levels of
endotoxins than other Aeromonas species (18). One of the important endotoxins is
Act, a cytotoxic factor present in culture supernatants responsible for host cell
death and damage (19). Act has been shown to induce apoptosis in epithelial cells
through oxidant-dependent activation of the mitochondrial pathway (20), and is
thought to be the causative cytotoxic enterotoxin that induces apoptosis in murine
macrophages (21). Cell death is largely caused by the extensive generation of
reactive nitrogen and oxygen intermediates within the site of infection (22).
Aeromonas veronii is protected from ROS –induced damage by the presence
of KatA, an antioxidant enzyme catalase (23). This enzyme has been shown to be
important for bacterial survival within oxidative conditions, as well as proliferation
294
and persistence within a leech host (23). Furthermore, A. veronii has a catalase-
independent defensive mechanism against exogenous H2O2 during stationary-phase
growth (23). It has also been shown that, though A. veronii interacts with
macrophages, these interactions have a low rate of phagocytosis in murine
macrophages that is only slightly increased by activation with high levels of IFNγ
(24). This slight increase in phagocytic rates, however, was not followed by an
increased rate in bacterial clearance (24), suggesting that avoidance of
phagocytosis or escape/protection from downstream killing mechanisms represent
immune evasion techniques employed by A. veronii.
The previous chapters have examined the role of macrophage-specific factors
in regulating inflammatory responses induced by zymosan. In this chapter, I
examine the role of macrophages and the CSF-1 axis in an Aeromonas infection.
The main objectives of this chapter were to (1) identify the causative strain of
Aeromonas found within the University of Alberta aquatics facility, (2) examine
the expression of sCSF-1R and CSF-1 in infected fish, and (3) determine the
impact of sCSF-1R on macrophage responses during an Aeromonas infections,
including the impact on proliferation within the hematopoietic compartment.
7.2 Results
7.2.1 Isolates obtained from furuncles were typed by sequence analysis.
Goldfish naturally infected with Aeromonas are routinely found within the
aquatic facilities at the University of Alberta, with the prevalence increasing during
the spring months (spawning season) or immediately after animal shipments arrive.
295
Goldfish commonly present with sores on the body, mouth and oral cavity, and on
their fins/tail. Sores were classified based on the level of progress- early infection
fish had a raised, red area; mid infection had a red sore with a white center that had
not erupted; late infection fish had larger sores that had erupted in the center (or
extensive fin/tail rot) (Figure 7.1 A). When goldfish were swabbed, bacteria were
only detected from the furuncles, but not from areas without sores (on infected or
control fish) (Figure 7.1 B).
Bacterial clones were isolated from 6 furuncles (2 body, 1 mouth/oral cavity,
1 eye and 2 fin/tail) and expression of 16s rRNA and gyrB were analyzed by PCR
(Figure 7.2 A). PCR products were purified and sequences were analyzed.
Sequence alignments identified the isolated bacteria as Aeromonas veronii bv
sobria (Figure 7.2 B).
7.2.2 Naturally infected goldfish have increased expression of sCSF-1R
within the furuncle and peripheral tissues.
Furuncle, spleen, and kidney tissues were harvested from naturally infected
fish. For furuncle tissue, a similarly sized piece of tissue of the same origin was
harvested from an uninfected area (ie. for a body sore, a piece of muscle was
removed from the uninfected side of the fish). Control spleens and kidneys were
harvested from fish with no apparent sores. RNA was isolated from each tissue and
the corresponding cDNA was used to analyze sCSF-1R expression (Figure 7.3 A).
Furuncle, spleen, and kidney tissue of infected fish all had significant increases in
sCSF-1R expression. Interestingly, no increases in CSF-1 expression were detected
296
in the furuncle or spleen, and a significant decrease in CSF-1 expression was found
in infected kidneys (Figure 7.3 B). This suggested that Aeromonas might be
manipulating the CSF-1 system. Further, changes to the CSF-1 system are not a
general outcome of infection in goldfish, as goldfish infected with Mycobacterium
marinum showed significant decreases in sCSF-1R expression (Figure 7.4).
7.2.3 Addition of sCSF-1R does not abrogate Aeromonas-induced
inflammatory responses.
To determine the effects of sCSF-1R on Aeromonas-induced ROS
production, PKM cultures were incubated with heat-killed A. veronii clonal isolates
in the presence of apoptotic cells or sCSF-1R (Figure 7.5 A). As a control, PKM
cultures were also activated with MAF/LPS or zymosan. As expected, both
apoptotic cells and sCSF-1R significantly reduced ROS production in PKM
cultures activated with MAF/LPS or zymosan. Interestingly, in cultures activated
with Aeromonas, sCSF-1R had no impact on ROS responses; however, apoptotic
cells still significantly reduced ROS production. This same trend was observed
when PKM cultures were activated with heat-killed or live A. veronii clonal
isolates (Figure 7.5 B). Finally, PKM cultures were activated by clonal A. veronii
or A. salmonicida, in the presence of apoptotic cells or sCSF-1R (Figure 7.5 C). Of
note, A. salmonicida-induced ROS production was intermediately affected by
sCSF-1R, where ROS production was significantly higher than un-activated cells
but significantly reduced compared to both A. salmonicida and A. veronii activated
cells.
297
To assess the effects of sCSF-1R on Aeromonas-induced inflammation in
vivo, heat-killed A. veronii was injected intraperitoneally in combination with
apoptotic cells or sCSF-1R (Figure 7.6). Similar to in vitro experiments, sCSF-1R
had no impact on A. veronii-induced leukocyte infiltration or ROS production.
Apoptotic cells resulted in a significant reduction in both leukocyte infiltration and
ROS production.
7.2.4 Induced infection with Aeromonas veronii isolates also results in
increased sCSF-1R expression.
While intraperitoneal injection is a good method to measure the effects of
sCSF-1R on Aeromonas-induced inflammation in vivo, it does not recapitulate the
hypothesized mechanism of exposure of fish to Aeromonas. To better mimic a
natural infection, a patch of scales was removed and the underlying tissue was
slightly scraped. This area was then rubbed with a cotton-tip swab soaked in an A.
veronii clonal culture. This would mimic a fish rubbing up against another fish
with a sore. Bacteria from the swabbed area would also be introduced into the
water, coming into contact with all the fish in the tank. Control fish were rubbed
with a cotton-tip swab soaked in PBS. Fish were then harvested at the indicated
time points. Representative control and infected fish are shown in Figure 7.7. Sites
of infection and kidneys were harvested at each time point, RNA was isolated and
sCSF-1R expression was measured from the corresponding cDNA (Figure 7.8).
Aeromonas-infected fish tended to have higher sCSF-1R expression at both the site
of infection and in the kidney, similar to naturally infected fish.
298
7.2.5 Goldfish with natural or induced A. veronii infection have significant
reductions in proliferation within the hematopoietic compartment.
Goldfish with either a natural or induced Aeromonas veronii infection have
significant, systemic increases in sCSF-1R expression. However, unlike zymosan
or MAF/LPS-induced inflammation, sCSF-1R does not appear to reduce
Aeromonas-induced inflammatory processes. Since sCSF-1R was originally
described as a regulator of macrophage hematopoiesis, I was curious if the
hematopoietic compartments of infected fish would be affected. To this end,
infected goldfish (natural or induced) were injected intraperitoneally with BrdU.
Proliferation was then measured from isolated kidney cells. Interestingly, goldfish
that were infected with Aeromonas veronii, either naturally (Figure 7.9 A) or
through an induced infection (Figure 7.9 B), showed significant decreases in
kidney cell proliferation.
7.3 Discussion
Aeromonas veronii is a ubiquitous fresh water pathogen that has been found
to be associated with a wide range of hosts, including vertebrates and invertebrates
(1, 25). While this bacteria may have beneficial symbiotic relationships with some
hosts such as the leech, Aeromonas is a highly virulent bacterial pathogen that has
been linked to many massive die-offs in the fish farming industry, as well as to
human diseases ranging from diarrhea to septicemia (25).

299
In this chapter, I show that Aeromonas veronii infection promotes systemic
expression of the soluble colony stimulating factor-1 receptor (sCSF-1R) in
challenged goldfish. However, unlike other pathogen models, sCSF-1R was unable
to inhibit inflammation at the A. veronii challenge site. Instead, sCSF-1R did not
decrease leukocyte infiltration or the production of reactive oxygen species (ROS).
This was further supported by in vitro experiments with live and heat-killed A.
veronii, suggesting this pathogen may prevent sCSF-1R-mediated down-regulation
of macrophage ROS production. Importantly, while sCSF-1R did not appear to
reduce inflammatory processes, the increased systemic expression of sCSF-1R in
A. veronii infected fish appears to decrease proliferative activity among cells in the
hematopoietic compartment, which is further coupled to a decrease in CSF-1
expression in kidney hematopoietic tissues. It is interesting to speculate that
manipulating the CSF-1 system may represent a unique additional mechanism by
which A. veronii promotes sustained host-derived cytotoxic responses and
pathogenesis.
Currently, the mechanism behind the increase in Aeromonas-induced sCSF-
1R expression is unknown. I have shown in previous chapters that sCSF-1R
expression appears to be closely linked to apoptotic cell death. It has been
previously reported that A. veronii induces cell death in murine macrophages and
epithelial cells (21, 22, 24). This may be a potential explanation behind expression
levels within the furuncle tissues, where there would be a high level of cell death.
However, it has been recently reported that Aeromonas-induced cell death results
in pyroptosis (programmed cell death associated with antimicrobial responses in
300
inflammation, leading the cells to produce cytokines, swell, and burst), and not
apoptosis in macrophages (26). Specifically, cell death was induced by aerolysin
and the type III secretion system (T3SS), leading to activation of caspase-1,
secretion of IL-1β, and pyroptosis (26). It is currently unknown if pyroptosis will
have a similar effects on sCSF-1R expression as apoptosis. However, pyroptosis is
generally an inflammatory process, so it is hypothesized that this form of cell death
would not induce sCSF-1R expression.
In earlier chapters, I have shown that sCSF-1R reduces phagocytosis of
zymosan by goldfish macrophages. Further, sCSF-1R significantly decreases the
capacity of goldfish macrophages to kill Aeromonas veronii. Reduced phagocytic
capacity and killing has been previously reported for murine macrophages (21, 24)
and leech hemocytes (27). The changes in phagocytic capacity and killing appear to
be related to the type III secretion system (T3SS) (27). The T3SS has been shown
to be an important virulence factor in mammals, as bacteria with a mutant T3SS
have significantly reduced cytotoxic effects and decreased host mortality (27). It
will be interesting to test, then, the potential for modulation of the CSF-1 system by
the T3SS and related secretion products. This may represent an alternative
explanation for the induction of sCSF-1R and may represent an additional
mechanism by which A. veronii modulates macrophage responses, in addition to
inducing macrophage death, as a method for evading the immune response.
Reactive oxygen species (ROS) are short-lived species generated by
inflammatory cells that accumulate during inflammatory processes. ROS have
potent destructive effects on both DNA and proteins, making them effective
301
antimicrobial mediators (28). However, these mediators also have the potential to
destroy host tissue, especially under strong inflammatory conditions (28).
Aeromonas species have been shown to induce strong ROS and nitric oxide
responses (20). While this induction results in cell death and tissue destruction in
the host, (20-22, 24), Aeromonas is relatively well protected by catalase dependent
and independent mechanisms (23). This tissue damage may be an important
mechanism for Aeromonas infection, as tissue infections in mammals generally
occur after traumatic tissue injury that was exposed to infected water (29). I have
shown in previous chapters that sCSF-1R is able to reduce production of ROS
following activation with various inflammatory mediators. However, this does not
occur with Aeromonas-induced ROS production, suggesting that Aeromonas may
have developed a mechanism to modulate the effect of sCSF-1R on ROS
production. It will be interesting to determine if this further contributes to
Aeromonas colonization through subversion of host immune responses.
I also found increased expression of sCSF-1R in the kidney within both
naturally infected goldfish and goldfish with an induced infection. This increase in
expression appears to be linked to a decrease in the proliferative capacity within the
hematopoietic compartment and to a significant decrease in CSF-1 expression.
Prior to its link in regulating inflammatory processes, sCSF-1R had been
characterized as potent regulator of macrophage hematopoiesis (30-33). Aeromonas
salmonicida has previously been shown to induce changes to hematopoietic
transcription factors through an undetermined mechanism (34). This included
significantly decreased expression of markers of hematopoietic stem cells and
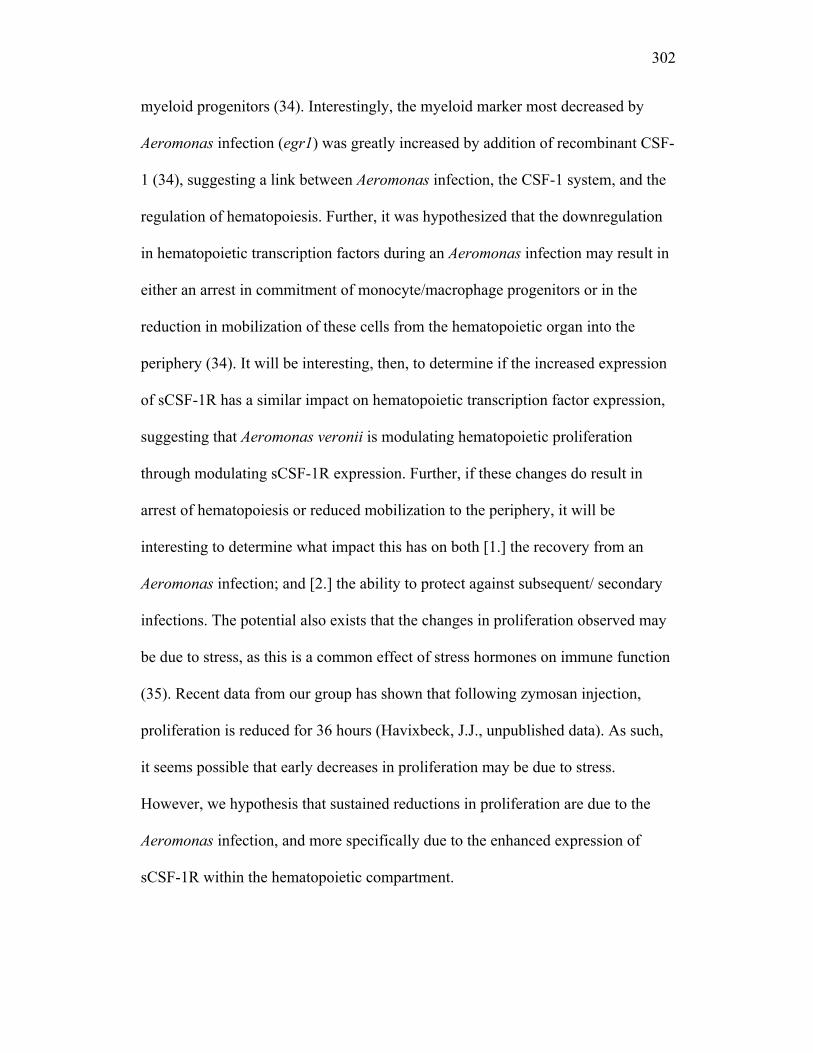
302
myeloid progenitors (34). Interestingly, the myeloid marker most decreased by
Aeromonas infection (egr1) was greatly increased by addition of recombinant CSF-
1 (34), suggesting a link between Aeromonas infection, the CSF-1 system, and the
regulation of hematopoiesis. Further, it was hypothesized that the downregulation
in hematopoietic transcription factors during an Aeromonas infection may result in
either an arrest in commitment of monocyte/macrophage progenitors or in the
reduction in mobilization of these cells from the hematopoietic organ into the
periphery (34). It will be interesting, then, to determine if the increased expression
of sCSF-1R has a similar impact on hematopoietic transcription factor expression,
suggesting that Aeromonas veronii is modulating hematopoietic proliferation
through modulating sCSF-1R expression. Further, if these changes do result in
arrest of hematopoiesis or reduced mobilization to the periphery, it will be
interesting to determine what impact this has on both [1.] the recovery from an
Aeromonas infection; and [2.] the ability to protect against subsequent/ secondary
infections. The potential also exists that the changes in proliferation observed may
be due to stress, as this is a common effect of stress hormones on immune function
(35). Recent data from our group has shown that following zymosan injection,
proliferation is reduced for 36 hours (Havixbeck, J.J., unpublished data). As such,
it seems possible that early decreases in proliferation may be due to stress.
However, we hypothesis that sustained reductions in proliferation are due to the
Aeromonas infection, and more specifically due to the enhanced expression of
sCSF-1R within the hematopoietic compartment.
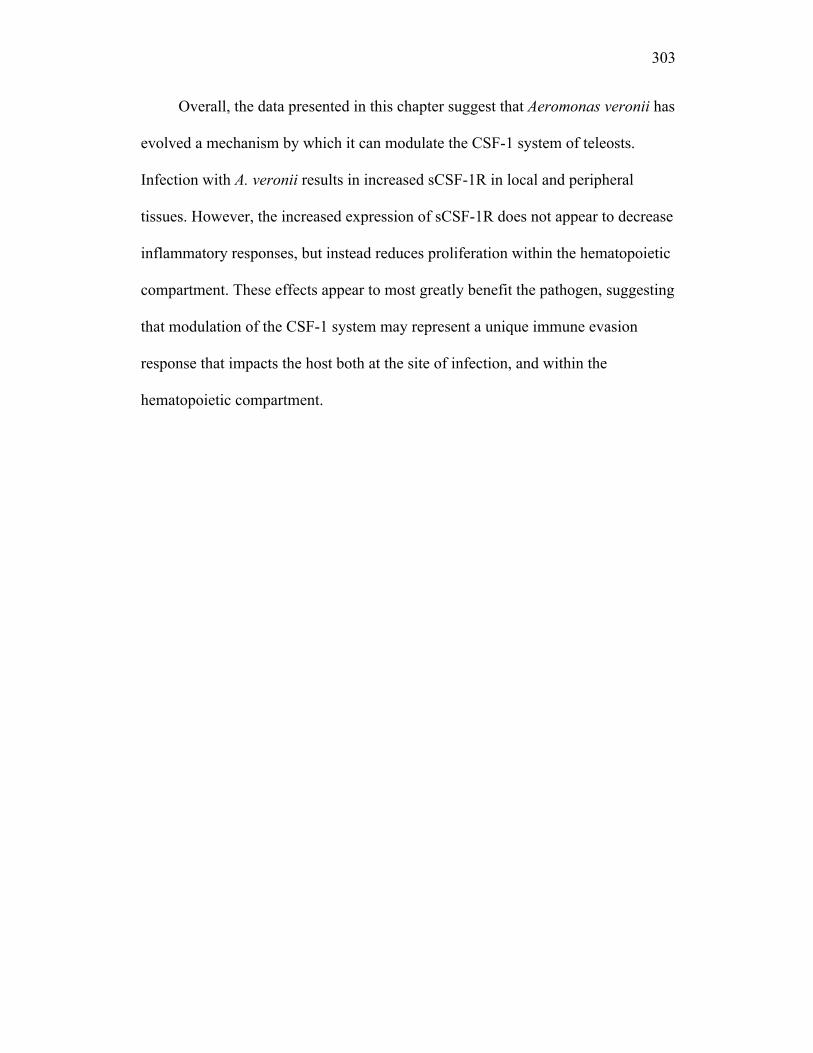
303
Overall, the data presented in this chapter suggest that Aeromonas veronii has
evolved a mechanism by which it can modulate the CSF-1 system of teleosts.
Infection with A. veronii results in increased sCSF-1R in local and peripheral
tissues. However, the increased expression of sCSF-1R does not appear to decrease
inflammatory responses, but instead reduces proliferation within the hematopoietic
compartment. These effects appear to most greatly benefit the pathogen, suggesting
that modulation of the CSF-1 system may represent a unique immune evasion
response that impacts the host both at the site of infection, and within the
hematopoietic compartment.
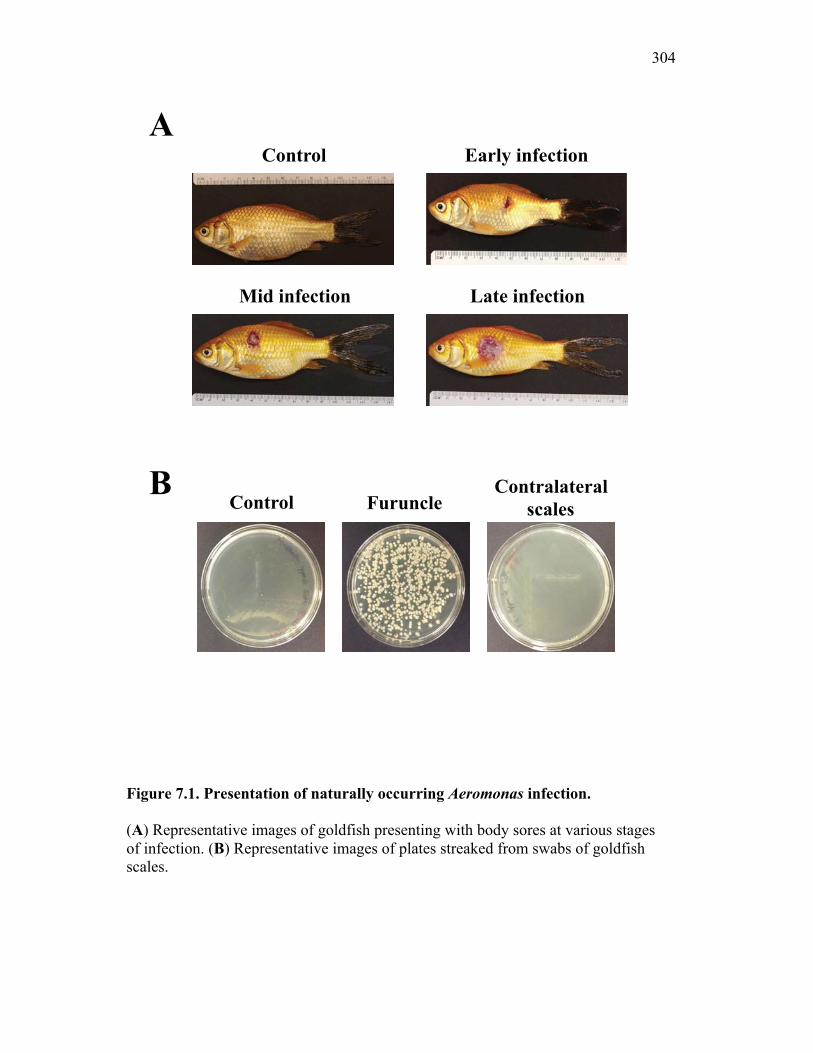
304
Control Furuncle Contralateral
scales
Control Early infection
Mid infection Late infection
A
B
Figure 7.1. Presentation of naturally occurring Aeromonas infection. (A) Representative images of goldfish presenting with body sores at various stages of infection. (B) Representative images of plates streaked from swabs of goldfish scales.
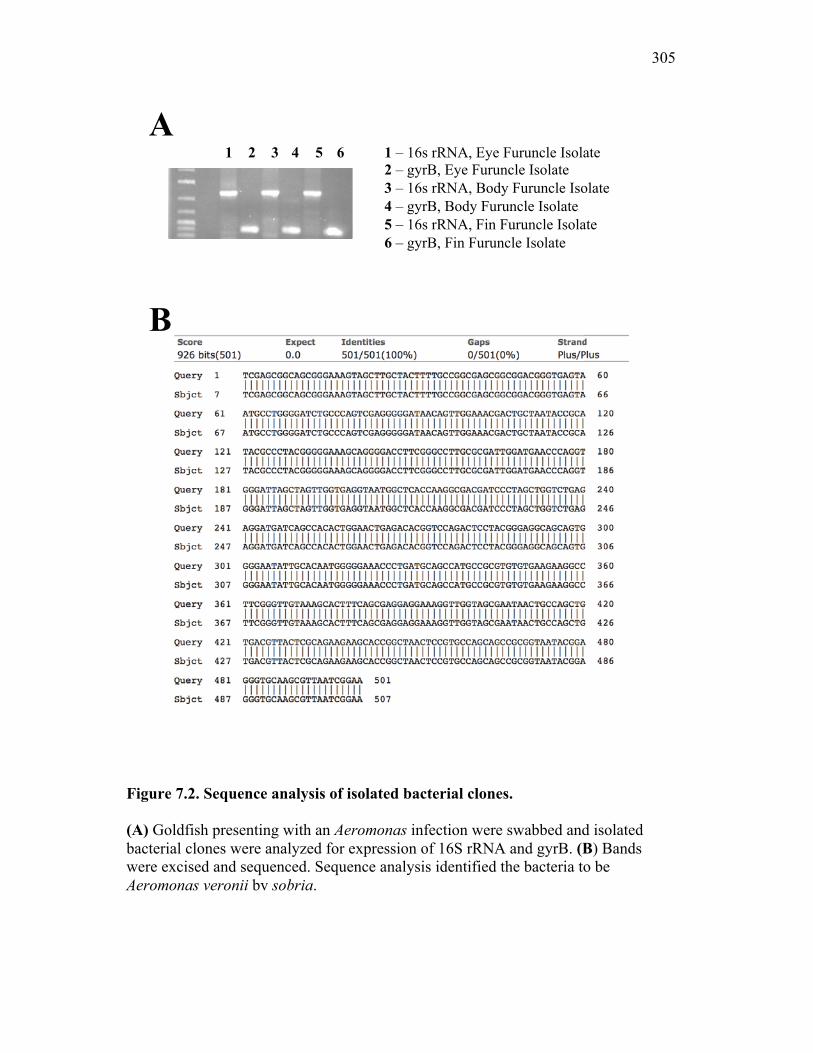
305
1 2 3 4 5 6 1 – 16s rRNA, Eye Furuncle Isolate 2 – gyrB, Eye Furuncle Isolate 3 – 16s rRNA, Body Furuncle Isolate 4 – gyrB, Body Furuncle Isolate 5 – 16s rRNA, Fin Furuncle Isolate 6 – gyrB, Fin Furuncle Isolate
A
B
Figure 7.2. Sequence analysis of isolated bacterial clones. (A) Goldfish presenting with an Aeromonas infection were swabbed and isolated bacterial clones were analyzed for expression of 16S rRNA and gyrB. (B) Bands were excised and sequenced. Sequence analysis identified the bacteria to be Aeromonas veronii bv sobria.

306
RQ
(CSF
-1)
Control Furuncle0
1
2
C F C F C F C F O
ral
Lip
Bod
y Ta
il
A
B
1 2 3 1 2 3 1 2 3 1 2 3 C I C I Spleen Kidney
Spleen Kidney0
1
2
3
4
5 ControlInfected
*RQ
(CSF
-1)
Control Furuncle0
1
2
3
*
sCSF
-1R
ban
d de
nsity
Spleen Kidney0
1
2
3
4
5 ControlInfected
**
sCSF
-1R
ban
d de
nsity
sCSF-1R
β-actin
A
B
Figure 7.3. Soluble CSF-1R expression is increased in furuncle and peripheral tissues. RNA was extracted from tissues harvested from control and naturally infected goldfish and sCSF-1R and CSF-1 expression was measured by RT-PCR and Q-PCR, respectively. n=4; * p<0.05, ** p<0.01 compared to control (Student’s t-test); error bars show SEM.
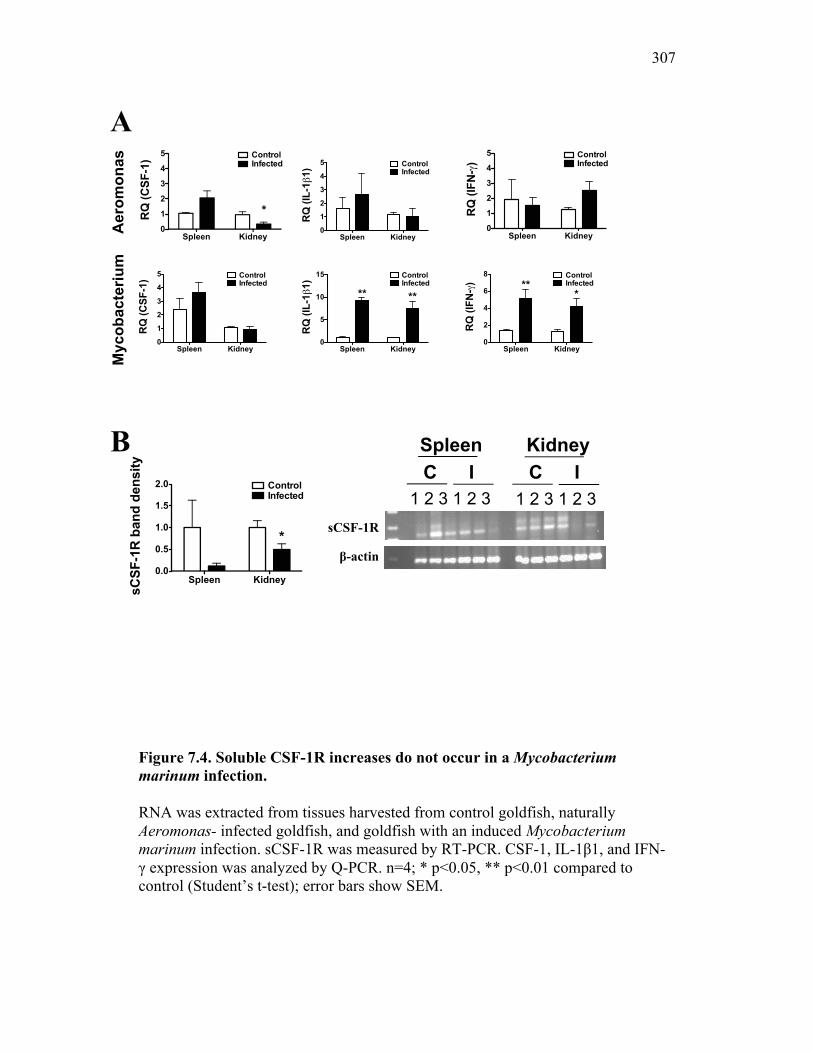
307
Spleen Kidney0
1
2
3
4
5 ControlInfected
*RQ
(CSF
-1)
Spleen Kidney0
1
2
3
4
5 ControlInfected
RQ
(CSF
-1)
Spleen Kidney0
1
2
3
4
5 ControlInfected
RQ
(IL-
1β1)
Spleen Kidney0
5
10
15 ControlInfected
****R
Q (I
L-1β
1)
Spleen Kidney0
1
2
3
4
5 ControlInfected
RQ
(IFN
-γ)
Spleen Kidney0
2
4
6
8 ControlInfected
***
RQ
(IFN
-γ)
Aer
omon
as
Myc
obac
teriu
m
A
Spleen Kidney0.0
0.5
1.0
1.5
2.0 ControlInfected
sCSF
-1R
ban
d de
nsity
*
B
1 2 3 1 2 3 1 2 3 1 2 3 C I C I Spleen Kidney
sCSF-1R
β-actin
Figure 7.4. Soluble CSF-1R increases do not occur in a Mycobacterium marinum infection. RNA was extracted from tissues harvested from control goldfish, naturally Aeromonas- infected goldfish, and goldfish with an induced Mycobacterium marinum infection. sCSF-1R was measured by RT-PCR. CSF-1, IL-1β1, and IFN-γ expression was analyzed by Q-PCR. n=4; * p<0.05, ** p<0.01 compared to control (Student’s t-test); error bars show SEM.
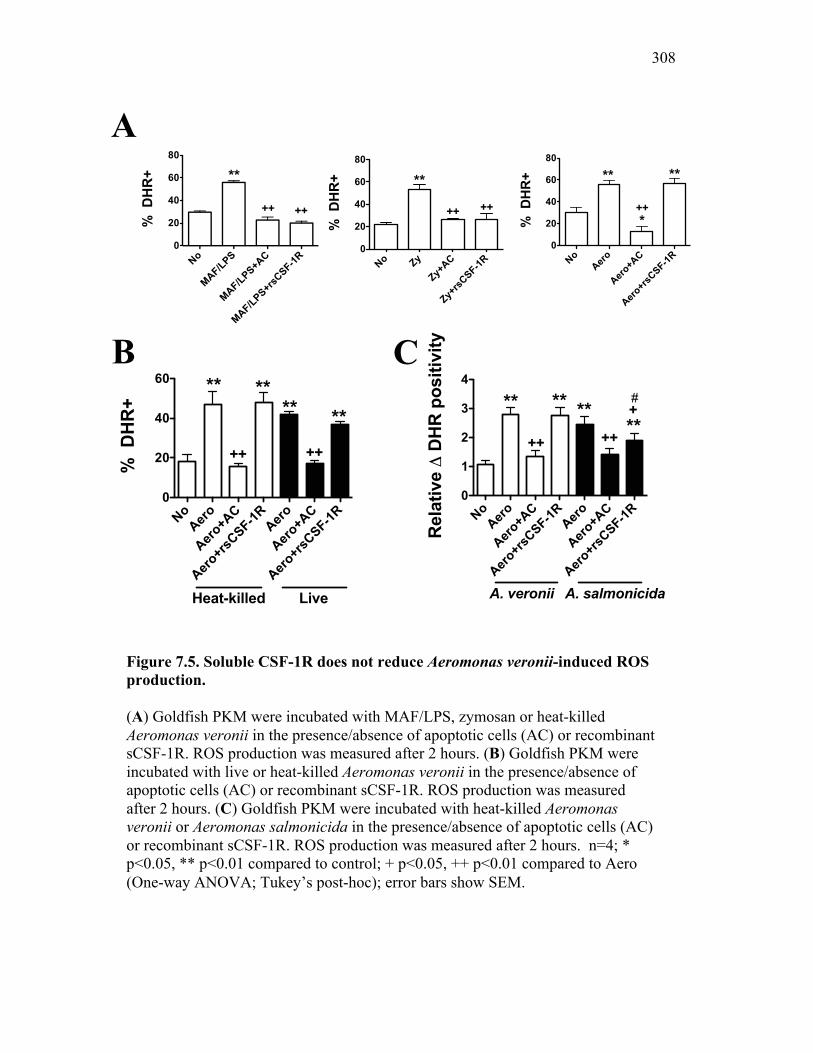
308
No
MAF/LPS
MAF/LPS+AC
MAF/LPS+rsCSF-1R
0
20
40
60
80
**
++ ++
% D
HR
+
No Zy
Zy+AC
Zy+rsC
SF-1R0
20
40
60
80
**
++ ++
% D
HR
+
NoAero
Aero+AC
Aero+rsC
SF-1R0
20
40
60
80
** **
*++
% D
HR
+No
Aero
Aero+AC
Aero+rsC
SF-1R Aero
Aero+AC
Aero+rsC
SF-1R0
1
2
3
4
** ** ****
++ ++
+
A. veronii A. salmonicida
#
Rel
ativ
e Δ
DH
R p
ositi
vity
NoAero
Aero+AC
Aero+rsC
SF-1R Aero
Aero+AC
Aero+rsC
SF-1R0
20
40
60 ****
****
++ ++
Heat-killed Live
% D
HR
+A
B C
Figure 7.5. Soluble CSF-1R does not reduce Aeromonas veronii-induced ROS production. (A) Goldfish PKM were incubated with MAF/LPS, zymosan or heat-killed Aeromonas veronii in the presence/absence of apoptotic cells (AC) or recombinant sCSF-1R. ROS production was measured after 2 hours. (B) Goldfish PKM were incubated with live or heat-killed Aeromonas veronii in the presence/absence of apoptotic cells (AC) or recombinant sCSF-1R. ROS production was measured after 2 hours. (C) Goldfish PKM were incubated with heat-killed Aeromonas veronii or Aeromonas salmonicida in the presence/absence of apoptotic cells (AC) or recombinant sCSF-1R. ROS production was measured after 2 hours. n=4; * p<0.05, ** p<0.01 compared to control; + p<0.05, ++ p<0.01 compared to Aero (One-way ANOVA; Tukey’s post-hoc); error bars show SEM.
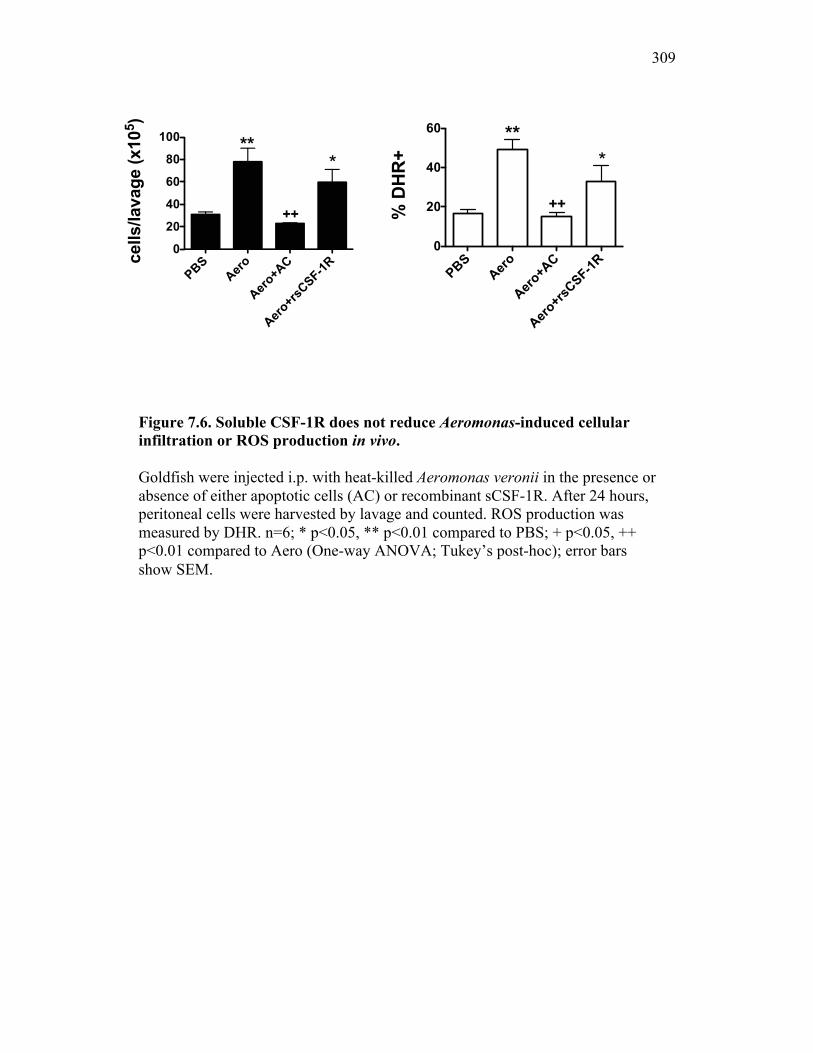
309
PBSAero
Aero+AC
Aero+rsC
SF-1R0
20
40
60
80
100 **
++
cells
/lava
ge (x
105 )
PBSAero
Aero+AC
Aero+rsC
SF-1R0
20
40
60 **
++% D
HR
+* *
Figure 7.6. Soluble CSF-1R does not reduce Aeromonas-induced cellular infiltration or ROS production in vivo. Goldfish were injected i.p. with heat-killed Aeromonas veronii in the presence or absence of either apoptotic cells (AC) or recombinant sCSF-1R. After 24 hours, peritoneal cells were harvested by lavage and counted. ROS production was measured by DHR. n=6; * p<0.05, ** p<0.01 compared to PBS; + p<0.05, ++ p<0.01 compared to Aero (One-way ANOVA; Tukey’s post-hoc); error bars show SEM.

310
PBS Aeromonas
Day 1
Day 2
Day 4
Day 7
Day 10
Day 14

311
Figure 7.7. Representative images of goldfish with induced Aeromonas veronii infection. Goldfish were infected with Aeromonas veronii by rubbing an exposed area with a swab soaked in a clonal culture. Fish were harvested at the time points indicated.
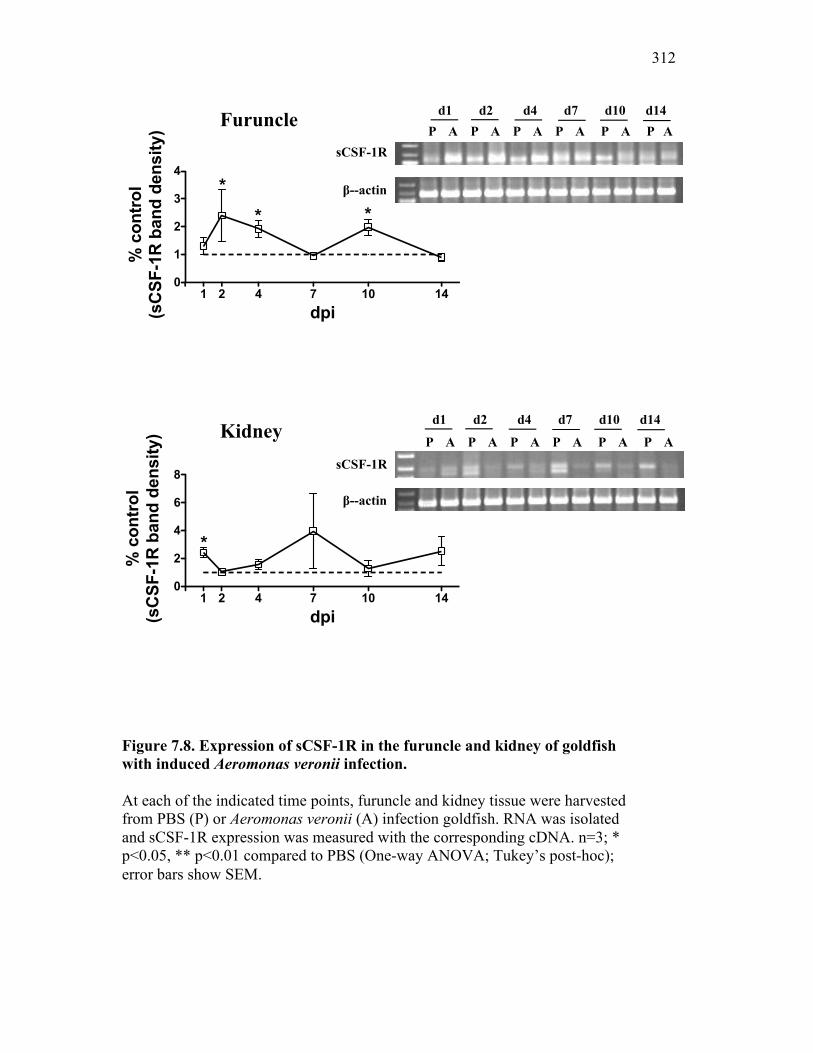
312
1 2 4 7 10 140
1
2
3
4
dpi
% c
ontr
ol(s
CSF
-1R
ban
d de
nsity
)
** *
1 2 4 7 10 140
2
4
6
8
dpi
% c
ontr
ol
(sC
SF-1
R b
and
dens
ity)
*
sCSF-1R
sCSF-1R
β--actin
β--actin
P A P A P A P A P A P A d1 d2 d4 d7 d10 d14
d1 d2 d4 d7 d10 d14
P A P A P A P A P A P A
Furuncle
Kidney
Figure 7.8. Expression of sCSF-1R in the furuncle and kidney of goldfish with induced Aeromonas veronii infection. At each of the indicated time points, furuncle and kidney tissue were harvested from PBS (P) or Aeromonas veronii (A) infection goldfish. RNA was isolated and sCSF-1R expression was measured with the corresponding cDNA. n=3; * p<0.05, ** p<0.01 compared to PBS (One-way ANOVA; Tukey’s post-hoc); error bars show SEM.
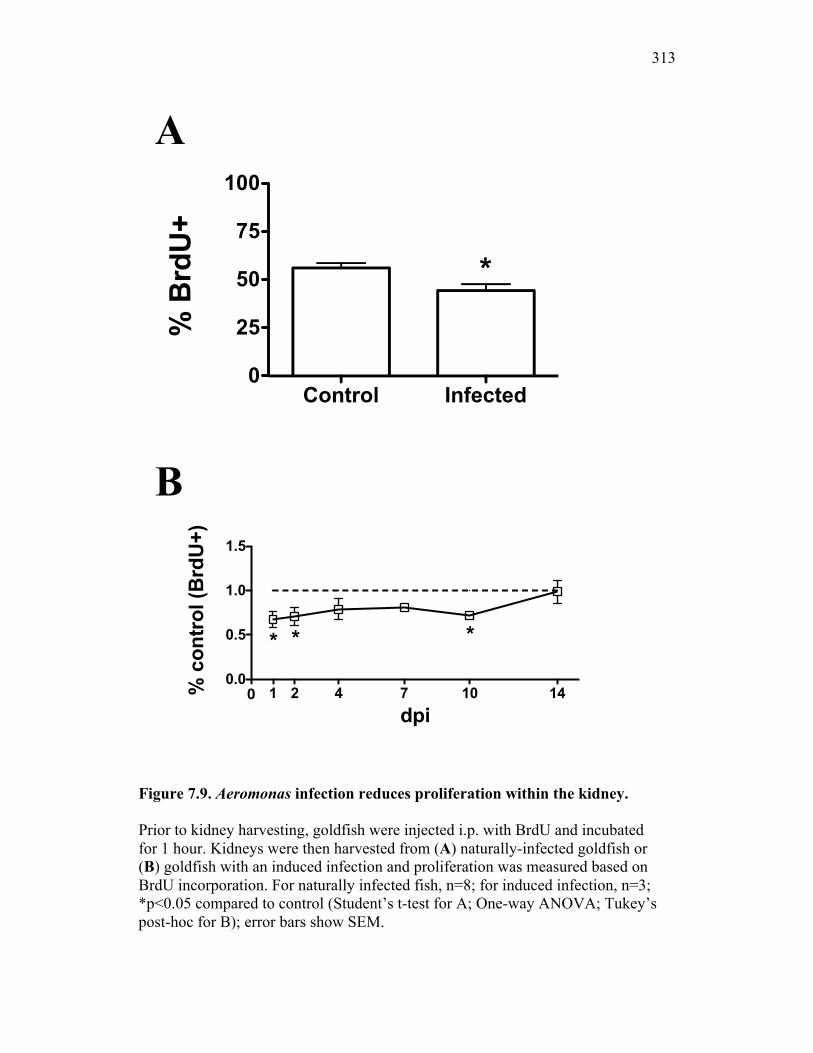
313
Control Infected0
25
50
75
100
*
% B
rdU
+
0 1 2 4 7 10 140.0
0.5
1.0
1.5
dpi
% c
ontr
ol (B
rdU
+)
* * *
A
B
Figure 7.9. Aeromonas infection reduces proliferation within the kidney. Prior to kidney harvesting, goldfish were injected i.p. with BrdU and incubated for 1 hour. Kidneys were then harvested from (A) naturally-infected goldfish or (B) goldfish with an induced infection and proliferation was measured based on BrdU incorporation. For naturally infected fish, n=8; for induced infection, n=3; *p<0.05 compared to control (Student’s t-test for A; One-way ANOVA; Tukey’s post-hoc for B); error bars show SEM.
314
7.4 References
1. Janda, J.M., and Abbott, S.L. 2010. The genus Aeromonas: taxonomy, pathogenicity, and infection. Clin Microbiol Rev 23:35-73.
2. Monette, S., Dallaire, A.D., Mingelbier, M., Groman, D., Uhland, C., Richard, J.P., Paillard, G., Johannson, L.M., Chivers, D.P., Ferguson, H.W., et al. 2006. Massive mortality of common carp (Cyprinus carpio carpio) in the St. Lawrence River in 2001: diagnostic investigation and experimental induction of lymphocytic encephalitis. Vet Pathol 43:302-310.
3. Joseph, S.W., and Carnahan, A. 1994. The isolation, identification, and systematics of the motile Aeromonas species. Annual Review of Fish Diseases 4:315-343.
4. Austin, B., and Autin, D. 2007. Bacterial fish pathogens, disease of farmed and wild fish: Springer-Praxis.
5. Bernoth, E., Ellis, A., Midtlyng, P., Olivier, G., and Smith, P. 1997. Furunculosis Multidisciplinary Fish Disease Research: Academic Press.
6. Hiney, M., Dawson, M.T., Heery, D.M., Smith, P.R., Gannon, F., and Powell, R. 1992. DNA probe for Aeromonas salmonicida. Appl Environ Microbiol 58:1039-1042.
7. Wiklund, T., and Dalsgaard, I. 1998. Occurrence and significance of atypical Aeromonas salmonicida in non-salmonid and salmonid fish species: a review. Dis Aquat Organ 32:49-69.
8. Noga, E. 2010. Fish disease: Willey-Blackwell. 9. Gustafson, C.E., Thomas, C.J., and Trust, T.J. 1992. Detection of
Aeromonas salmonicida from fish by using polymerase chain reaction amplification of the virulence surface array protein gene. Appl Environ Microbiol 58:3816-3825.
10. Martinez-Murcia, A.J., Esteve, C., Garay, E., and Collins, M.D. 1992. Aeromonas allosaccharophila sp. nov., a new mesophilic member of the genus Aeromonas. FEMS Microbiol Lett 70:199-205.
11. Sreedharan, K., Philip, R., and Singh, I.S. 2013. Characterization and virulence potential of phenotypically diverse Aeromonas veronii isolates recovered from moribund freshwater ornamental fishes of Kerala, India. Antonie Van Leeuwenhoek 103:53-67.
12. Cai, S.H., Wu, Z.H., Jian, J.C., Lu, Y.S., and Tang, J.F. 2012. Characterization of pathogenic Aeromonas veronii bv. veronii associated with ulcerative syndrome from chinese longsnout catfish (Leiocassis longirostris Gunther). Braz J Microbiol 43:382-388.
13. Han, H.J., Taki, T., Kondo, H., Hirono, I., and Aoki, T. 2008. Pathogenic potential of a collagenase gene from Aeromonas veronii. Can J Microbiol 54:1-10.
14. Silver, A.C., Williams, D., Faucher, J., Horneman, A.J., Gogarten, J.P., and Graf, J. 2011. Complex evolutionary history of the Aeromonas veronii group revealed by host interaction and DNA sequence data. PLoS One 6:e16751.
315
15. Vega-Sanchez, V., Acosta-Dibarrat, J., Vega-Castillo, F., Castro-Escarpulli, G., Aguilera-Arreola, M.G., and Soriano-Vargas, E. 2013. Phenotypical characteristics, genetic identification, and antimicrobial sensitivity of Aeromonas species isolated from farmed rainbow trout (Onchorynchus mykiss) in Mexico. Acta Trop 130C:76-79.
16. Yi, S.W., You, M.J., Cho, H.S., Lee, C.S., Kwon, J.K., and Shin, G.W. 2013. Molecular characterization of Aeromonas species isolated from farmed eels (Anguilla japonica). Vet Microbiol 164:195-200.
17. Aires, A., Dias, C.S., Rosa, E.A., and Saavedra, M.J. 2013. Antimicrobial susceptibility of Aeromonas spp. isolated from pig ileum segments to natural isothiocyanates. Med Chem 9:861-866.
18. Trower, C.J., Abo, S., Majeed, K.N., and von Itzstein, M. 2000. Production of an enterotoxin by a gastro-enteritis-associated Aeromonas strain. J Med Microbiol 49:121-126.
19. Sha, J., Kozlova, E.V., and Chopra, A.K. 2002. Role of various enterotoxins in Aeromonas hydrophila-induced gastroenteritis: generation of enterotoxin gene-deficient mutants and evaluation of their enterotoxic activity. Infect Immun 70:1924-1935.
20. Krzyminska, S., Tanska, A., and Kaznowski, A. 2011. Aeromonas spp. induce apoptosis of epithelial cells through an oxidant-dependent activation of the mitochondrial pathway. J Med Microbiol 60:889-898.
21. Krzyminska, S., Kaznowski, A., and Chodysz, M. 2009. Aeromonas spp. human isolates induce apoptosis of murine macrophages. Curr Microbiol 58:252-257.
22. Krzyminska, S., Mokracka, J., Koczura, R., Cwiertnia, A., and Kaznowski, A. 2012. Aeromonas spp.-mediated cell-contact cytotoxicity is associated with the presence of type III secretion system. Antonie Van Leeuwenhoek 101:243-251.
23. Rio, R.V., Anderegg, M., and Graf, J. 2007. Characterization of a catalase gene from Aeromonas veronii, the digestive-tract symbiont of the medicinal leech. Microbiology 153:1897-1906.
24. Krzyminska, S., Kaznowski, A., and Puk, M. 2008. Interaction of Aeromonas spp. human isolates with murine macrophages. New Microbiol 31:481-488.
25. Janda, J.M., and Abbott, S.L. 1998. Evolving concepts regarding the genus Aeromonas: an expanding Panorama of species, disease presentations, and unanswered questions. Clin Infect Dis 27:332-344.
26. McCoy, A.J., Koizumi, Y., Higa, N., and Suzuki, T. 2010. Differential regulation of caspase-1 activation via NLRP3/NLRC4 inflammasomes mediated by aerolysin and type III secretion system during Aeromonas veronii infection. J Immunol 185:7077-7084.
27. Silver, A.C., Kikuchi, Y., Fadl, A.A., Sha, J., Chopra, A.K., and Graf, J. 2007. Interaction between innate immune cells and a bacterial type III secretion system in mutualistic and pathogenic associations. Proc Natl Acad Sci U S A 104:9481-9486.
316
28. Simon, H.U., Haj-Yehia, A., and Levi-Schaffer, F. 2000. Role of reactive oxygen species (ROS) in apoptosis induction. Apoptosis 5:415-418.
29. Behera, B., Bhoriwal, S., Mathur, P., Sagar, S., Singhal, M., and Misra, M.C. 2011. Post-traumatic skin and soft tissue infection due to Aeromonas hydrophila. Indian J Crit Care Med 15:49-51.
30. Barreda, D.R., Hanington, P.C., Stafford, J.L., and Belosevic, M. 2005. A novel soluble form of the CSF-1 receptor inhibits proliferation of self-renewing macrophages of goldfish (Carassius auratus L.). Dev Comp Immunol 29:879-894.
31. Hanington, P.C., Wang, T., Secombes, C.J., and Belosevic, M. 2007. Growth factors of lower vertebrates: characterization of goldfish (Carassius auratus L.) macrophage colony-stimulating factor-1. J Biol Chem 282:31865-31872.
32. Hanington, P.C., Hitchen, S.J., Beamish, L.A., and Belosevic, M. 2009. Macrophage colony stimulating factor (CSF-1) is a central growth factor of goldfish macrophages. Fish Shellfish Immunol 26:1-9.
33. Rieger, A.M., Hanington, P.C., Belosevic, M., and Barreda, D.R. 2014. Control of CSF-1 induced inflammation in teleost fish by a soluble form of the CSF-1 receptor. Fish Shellfish Immunol.
34. Katzenback, B.A., Karpman, M., and Belosevic, M. 2011. Distribution and expression analysis of transcription factors in tissues and progenitor cell populations of the goldfish (Carassius auratus L.) in response to growth factors and pathogens. Mol Immunol 48:1224-1235.
35. Webster Marketon, J.I., and Glaser, R. 2008. Stress hormones and immune function. Cell Immunol 252:16-26.
317
Chapter 8: General Discussion1
8.1 Overview of findings
Inflammation is a complex, biological process that occurs following
activation by a noxious stimulus such as tissue injury or infection. Phagocytes are
central effectors in both the induction and resolution of inflammatory programs.
These cells are armed with potent antimicrobial defenses that aid in the clearance
of infiltrating pathogens. They are also capable of producing a wide range of
soluble mediators that instruct and shape downstream responses. However, though
inflammation is generally of benefit to the host, it can also have a high cost
associated with it. This includes collateral tissue damage, septic shock, and
autoimmune diseases (1). As such, various mechanisms have evolved to balance
these responses in order to maximize the host benefit and minimize inflammatory
tissue damage.
The main focus of my Ph.D. was to characterize functional phagocyte
responses that occur at inflammatory sites, where various responses are involved in
the clearance of pathogens, dying or senescent cells, and in tissue repair/ wound
healing. Using an in vitro system for culturing macrophage-lineage cells, I
determined that both goldfish monocytes and macrophages were highly phagocytic
A portion of this chapter has been previously published:
Rieger AM, Hanington PC, Belosevic M and Barreda DR. 2014. Control of CSF-1
induced inflammation in teleost fish by a soluble form of the CSF-1 receptor. Fish
Shellfish Immunol pii: S1050-4648(14)00105-3.

318
(Chapter 3). Both cell types upregulated phagocytic and antimicrobial responses in
a temporal fashion, dependent on the stage of differentiation (Chapter 3). However,
the data presented here suggest that monocytes and macrophages may
preferentially rely on different killing mechanisms: monocytes appear to favor
phagolysosome fusion while macrophages have stronger, more sustained
production of reactive oxygen and nitrogen species (Chapter 3). A similar
dichotomy exists in mammalian macrophage-lineage cells, where it is hypothesized
that maturation of macrophages leads to decreases in lysosomal proteolysis,
allowing for better presentation of antigens (2). My results highlight intrinsic
differences in phagocyte responses are present in teleost fish.
Mammalian macrophages are well known for their roles in both the
induction and resolution of inflammatory responses. Further, mammalian
macrophages are capable of internalizing both pathogenic and homeostatic/self
particles, resulting in activation of vastly different macrophage responses (3, 4). In
Chapter 4, I showed that teleost macrophages, similar to mammalian macrophages,
downregulate inflammatory responses following exposure to apoptotic cells (5).
Internalization of apoptotic cells resulted in decreased ROS production in vitro and
in vivo (Chapter 4). Using a zymosan peritonitis model, I found that apoptotic cells
significantly reduced infiltration of neutrophils, monocytes, and lymphocytes
(Chapter 4). Interestingly, in mice, apoptotic cell addition resulted in a decrease in
only the monocyte and lymphocyte populations, and not the neutrophil subset
(Chapter 4), suggesting a potential role for neutrophils in the resolution of
inflammatory responses. Using a purified inflammatory neutrophil population, I
319
found that, in mice, both neutrophils and macrophages were able to internalize
apoptotic cells, resulting in decreased ROS production (Chapter 4). In goldfish,
only macrophages (not neutrophils) were able to internalize apoptotic cells
(Chapter 4).
Early indications suggested that responses to apoptotic cells by goldfish
macrophages were partially mediated by soluble factors (Chapter 4/5).
Interestingly, unlike, mammalian systems, I detected no changes in the levels of
IL-10 and TGF-β (6), suggesting that a different soluble factor may be mediating
these responses (Chapter 5). A candidate molecule was soluble CSF-1R. When
sCSF-1R was originally characterized, the greatest levels of expression were
detected in senescent macrophage cultures, where there are high levels of apoptotic
cells death (7). In addition, the native sCSF-1R protein was detected in goldfish
serum (7), which suggested that this protein might also play a role in systemic
regulation in addition to its role in regulating proliferation within the hematopoietic
compartment. When goldfish macrophages were exposed to apoptotic cells either
in vitro or in vivo, expression of sCSF-1R transcript is greatly increased
(approximately 3-fold) (Chapter 5) (6). In vivo, the expression of sCSF-1R within
peritoneal cells is highest during the resolution of acute peritonitis, peaking after
cellular infiltration when the levels of apoptotic cell death are highest (Chapter 5).
This increase in expression is maintained following resolution of peritonitis
(Chapter 5).
In vitro, addition of recombinant sCSF-1R reduced phagocytic responses,
production of reactive nitrogen and oxygen species, and chemotaxis in
320
macrophages activated with either CSF-1 (8) or zymosan (Chapter 5/6) (6). In vivo,
recombinant sCSF-1R exerted a potent downregulatory effect on zymosan-induced
ROS production that is dose dependent (6) and reduces inflammatory ROS
responses to a similar degree as found with apoptotic cells (5) (Chapter 6). I also
found an in vivo reduction in macrophage phagocytic responses that culminates in a
reduced capacity to kill bacteria (Aeromonas veronii) (Chapter 6).
Within an inflammatory site, macrophages are known to produce a wide
range of soluble products that are important in recruiting cells and instructing
responses of responding cells. As inflammatory processes resolve, there is a drive
to switch off pro-inflammatory factors while increasing anti-inflammatory factors.
When studying a panel of pro-inflammatory goldfish cytokines, I found that
recombinant sCSF-1R greatly reduced zymosan-induced production of a wide
range of cytokines, including TNF-α 2, IL-1β 1 and 2, IFNγ and IFNγrel (IFNγ-
related), IL12p35, and CSF-1 (Chapter 6). The effects of apoptotic cells appear to
be targeted to a more select group of pro-inflammatory cytokines (TNF-α 2,
IFNγrel, and IL-12p35). Interestingly, while the presence of apoptotic cells induced
a slight increase in IL-10 expression, no change was induced by sCSF-1R (Chapter
6), suggesting that sCSF-1R may be important in down-regulating inflammatory
processes but may not directly activate anti-inflammatory mechanisms.
In addition to reducing inflammatory macrophage responses, recombinant
sCSF-1R also dramatically decreased zymosan-induced leukocyte infiltration into
the peritoneal cavity (6) (Chapter 6). Interestingly, sCSF-1R appeared to
preferentially affect neutrophil infiltration, since, even at the highest doses of
321
recombinant sCSF-1R, lymphocytes and monocytes are present at higher levels
than in control fish (6) (Chapter 6). This is unlike apoptotic cells, which targets the
infiltration of all three leukocyte subsets to a similar extent (5) (Chapter 4). When I
measured the in vivo expression of chemokines by quantitative PCR, I found that
sCSF-1R dramatically reduced levels of CXCL-8, the primary chemokine involved
in neutrophil recruitment, and had only a modest effect on expression of CCL-1,
the recruiter of lymphocytes and monocytes (Chapter 6). Interestingly, the
neutrophils that at still recruited into the inflammatory site maintain their ROS
production capacity in fish injected with sCSF-1R, but not those injected with
apoptotic cells (Chapter 6). However, following injection with sCSF-1R or
apoptotic cells, the recruited neutrophils exhibit a reduced capacity to kill bacteria
(Chapter 6).
Using an Aeromonas model, I found that infection, either natural or
induced, resulted in significant increases in sCSF-1R expression both at the site of
infection and distally in the kidney and spleen (Chapter 7). Interestingly, addition
of sCSF-1R in vitro or intraperitoneally did not reduce Aeromonas-induced
inflammatory responses, namely ROS production and leukocyte infiltration
(Chapter 7). However, I found a significant decrease in kidney cell proliferation
(Chapter 7), suggesting that Aeromonas-induced expression of sCSF-1R may affect
the hematopoietic compartment, possibly compromising host responses to this
pathogen.
Overall, my data suggests that sCSF-1R is produced at time when either [1.]
CSF-1 production is high or [2.] there are high levels of apoptotic cell death. The
322
presence of sCSF-1R then drives the inflammatory process towards resolution by
targeting inflammatory macrophage processes (Figure 8.1). Because of the mode of
action of sCSF-1R (binding CSF-1 and preventing interaction with membrane
bound CSF-1R), sCSF-1R can only block macrophage actions that require or are
downstream of CSF-1. By understanding the macrophage actions that are
controlled by sCSF-1R, we then not only gain an understanding of the role of
sCSF-1R in macrophage survival, proliferation, differentiation, and regulation of
immunity, we also gain a better appreciation of the varied roles of CSF-1 in
immune processes. My work places CSF-1 as a central component of teleost
inflammatory responses, being important in activating downstream processes that
direct leukocyte responses. As a primary regulator of CSF-1 activity, sCSF-1R has
become integrated at all levels of macrophage actions, from controlling
proliferation and differentiation to inducing the resolution of inflammation, with
the outcomes of its actions extending past macrophages.
8.2 Evolution of inflammatory control mechanisms
Responses to an inflammatory stimulus activate a complex web of
interactions between phagocytes and other immune cells throughout the response,
from induction to resolution (9-13). Apoptotic cell internalization has been
recognized as an important switch between inflammatory and repair programs (4).
All organisms have mechanisms in place to maintain integrity, both structural and
physiologically, following injury or disruption. Tissue repair, wound healing, and
regeneration are necessary for the long-term survival of an organism. It is therefore

323
reasonable to hypothesize that repair mechanisms are evolutionarily ancient. For
my thesis, I have focused on the role of apoptotic cells in downregulating
inflammatory responses. A comprehensive discussion of this can be found in
Chapter 4. This section will focus on outcomes of apoptotic cell phagocytosis
across a range of species, bringing in the impact on inflammatory control where
this is currently known, to gain a wider evolutionary appreciation of this process. A
summary of our current understanding can be found in Figure 8.2.
Genetic studies in Caenhorhabditis elegans have identified two partially
conserved pathways involved in the internalization of apoptotic cells that are
highly conserved (13-16). Interestingly, in C. elegans, apoptotic cells (called “cell
corpses”) are rapidly engulfed by neighboring cells and generally not by
professional phagocytes (17-19). Internalized corpses, similar to mammalian
phagocytes, are enclosed within a phagosome that fuses with lysosomes to form a
phagolysosome (20). In C. elegans, this is dependent on arl-8 expression; loss of
function of this gene results in accumulation of cell corpses and decreased
degradation (20). When a pathogen is sensed by C. elegans pattern recognition
receptors, a cascade of inducible defense mediators is initiated, including
antimicrobial peptides, caenopores, lysozymes, lectins, and ROS (21). The
mechanisms induced are pathogen- and tissue specific (21). This split in functions
suggests that phagocytes of C. elegans may not have the capacity to induce
divergent responses to pathogenic or homeostatic particles at the level of a single
cell. This, however, has not been studied yet.
324
Drosophila has proven to be a powerful model organism for the study of a
variety of biological processes. Within their immune system, three major types of
hemocytes have been identified: plasmatocytes, crystal cells, and lamellocytes (22,
23). Of these, plasmatocytes are most similar to mammalian phagocytes and are
involved in phagocytosis of invading pathogens, clearance of apoptotic cells, and
tissue repair/wound healing (22, 23). These cells are able to mount a number of
defenses, including production of antimicrobial peptides, nitric oxide, and ROS,
induce blood coagulation, and produce cytokine-like molecules (24-26). Crystal
cells also participate in wound healing, involved in formation of scabs (26). Unlike
C. elegans, phagocytosis of both pathogens and apoptotic cells is carried out by
hemocytes (27, 28). Similar to mammalian macrophages, the recognition and
internalization of apoptotic cells appears to involve phosphatidylserine (29).
Further, current work from the Barreda lab has shown that Drosophila hemocytes
are capable of internalizing bacteria and apoptotic cells at a single cell level
(Wong, M.E., unpublished observation). Functional outcomes of phagocytosis of
both apoptotic cells and pathogenic particles are currently unknown.
Lamprey, along with hagfish, are thought to be the earliest known
vertebrates. Unlike invertebrates, which appear to possess only innate immune
systems, lampreys possess both innate and adaptive immune systems. The lamprey
adaptive immune system, however, is different from that found in higher
vertebrates, consisting of lymphocyte-like cells that express somatically diversified
clonal variable lymphocyte receptors (VLRs) (30). Recent work from the Barreda
lab has shown that lamprey phagocytes are capable of internalizing both pathogenic
325
and homeostatic particles (31). Similar to goldfish, internalization of apoptotic cells
significantly reduces ROS production from lamprey phagocytes (31). However,
unlike goldfish, lamprey phagocytes appeared to by pre-disposed to have strong
responses to the internalization of apoptotic cells, and were less responsive to the
presence of zymosan (31). Internalization of a single apoptotic cell by lamprey
phagocytes was able to significantly reduce responses to zymosan, even when 3-
fold more zymosan was internalized (31). In goldfish, a similar downregulation in
responses was only observed when the number of internalized apoptotic cells
outnumbered zymosan 3:1 within an individual phagocyte (31). These data suggest
that a primary method of regulating inflammatory responses in lamprey may be due
to a shift in the balance of pro- and anti-inflammatory responses, with anti-
inflammatory responses being favored.
During my thesis work on goldfish, I found two main mechanisms by which
goldfish appear to regulate inflammatory responses. The first is through the
production of a novel receptor: soluble CSF-1 receptor. This is extensively
discussed in Chapters 5 and 6 and reviewed in Chapter 8, so will not be covered
here. Another mechanism appears to involve leukocyte recruitment. During an
acute peritonitis response, I found that neutrophils were recruited early in the
response, followed by a rapid reduction in neutrophil recruitment. Since goldfish
neutrophils do not appear to reduce inflammatory responses in the presence of
apoptotic cells (Chapter 4), it stands to reason then that reduced recruitment is a
primary mechanism whereby neutrophil inflammatory responses can be controlled.
326
Frogs, during metamorphosis, undergo a drastic change, involving significant
amounts of apoptotic cell death in the tail and body muscle. Macrophages are
known to be present in the body and tail muscles during active metamorphosis and
phagocytosis apoptotic muscle cells (32). Frog macrophages are also known to be
highly involved in immune defenses, providing protection against pathogens and
activating adaptive immune defenses (33-35). However, currently no
comprehensive work has studied frog macrophage responses when both apoptotic
cell and pathogenic particles are internalized. Interestingly, in salamanders, it has
recently been shown that infiltration of macrophages into a site of limb
regeneration is essential to the regeneration process (36). Further, the cells
recruited to the site are highly phagocytic (36).
In mice, it has been well documented that internalization of apoptotic cells by
macrophages results in important changes in phenotype- the macrophages decrease
production of pro-inflammatory cytokines and chemokines, reduce production of
inflammatory antimicrobial factors, and increase production of anti-inflammatory
mediators (3, 9, 37-42), thereby promoting the resolution of inflammatory
responses. Classically, neutrophils, due to their vast armamentarium of
antimicrobial defenses and short life span, have been thought to contribute only to
the induction of inflammation and pathogen clearance. It is becoming clear,
however, that they also actively participate in the control of inflammation. As
shown in Chapter 4 and summarized in Figure 8.3, murine neutrophils are able to
internalize apoptotic cells, leading to decreased ROS production (5). This appears
to be a relatively newly evolved feature of neutrophils as it has only been found
327
noted so far in murine (5) and human neutrophils (43). Murine neutrophils are also
capable of producing resolution-promoting mediators such as lipoxins from
arachidonic acid, which attenuate inflammatory responses (44). This suggests that,
over evolution, neutrophils have acquired the capacity to aid macrophages in the
resolution of inflammation. This added complexity of phagocyte-mediated
inflammatory control has the potential to increase the efficiency of resolution
responses. However, as systems gain in complexity, there tend to be more points at
which the system can fall apart or lose regulation. Inappropriate regulation of
inflammatory responses, especially during aging, may explain the increase in
diseases of affluence and extended lifespan that have a chronic inflammatory
component such as cardiovascular disease, obesity, neurodegenerative diseases,
and cancer (45-51).
Wound healing and tissue repair are essential for the long-term survival and
growth of an organism. As shown by the candidate species outlined above, there is
a varied array of responses by which phagocytes participate in the process of
wound healing, following the recognition of apoptotic cells. Through evolution,
these responses have become highly integrated and interdependent, leading to
increasing complexity in this process. Further, it is becoming increasingly apparent
that macrophage responses to pathogenic and homeostatic, self particles have been
well conserved across evolution while neutrophils appear to be acquiring a capacity
to actively participate in resolution events over evolution.
8.2.1 Apoptotic cells vs. exosomes
328
During the process of apoptosis, cells undergo a number of morphological
changes including cell shrinkage and rounding, chromatin condensation, and
organelle fragmentation (52). The cellular contents are then packaged up into
several vesicles- the apoptotic bodies- that are then phagocytosed (53, 54). In order
to be phagocytosed, these apoptotic bodies are identified by the presence of several
“eat me” signals on the surface (53-55), as discussed in Chapter 1. Apoptotic
bodies are just one type of extracellular vesicle released from the plasma
membrane. Almost all cells release vesicles, also known as exosomes, which have
a variety of physiological effects. It is important to note that the protein and lipid
composition of exosomes is different from apoptotic bodies (56). Exosomes are
derived from the membrane of living cells and contain various molecules,
including adhesion molecules, membrane trafficking molecules, cytoskeleton
molecules, heat shock proteins, cytoplasmic enzymes, signal transduction proteins,
cytokines, chemokines, proteinases, cell-specific antigens, mRNA, non-coding
RNAs, microRNAs, and extra-chromosomal DNA (56). Exosomes are found in
plasma and other body fluids and are important for intercellular communication,
especially within the immune system (56). These vesicles have been shown to
mediate immune stimulation and suppression, and have been implicated in
pathologies from infections, inflammation, and autoimmunity (56). Because they
are derived from living membranes, exosomes are not recognized by the same “eat
me” signals as apoptotic bodies. Further, exosomes tend to be much smaller in size
(30-100 nm vs. 1 μm); as such the contents of exosomes tend to enter cells through
either endocytosis or fusing with the plasma membrane (56). Therefore, it is
329
unlikely that immune suppression by exosomes or any potential roles of exosomes
in resolving inflammation occur through similar mechanisms induced by apoptotic
cells/bodies.
8.3 Soluble CSF-1R and self-renewing macrophages: potential
for inflammatory control
When originally characterized, soluble CSF-1R was most highly expressed in
progenitor cells and mature macrophages, the two populations in primary kidney
macrophage cultures that are capable of self-renewal (7). While self-renewal is a
common characteristic of progenitor/ hematopoietic stem cells, this feature is
generally lost following terminal differentiation. However, it is becoming
increasingly apparent that self-renewing macrophages exist in mammals, as well as
goldfish. It is now thought that major macrophage populations derived from
embryonic progenitors are able to renew independent of hematopoietic stem cells
and can respond to stimuli indefinitely without loss of functional differentiation
(57). Under homeostatic conditions, self-renewing macrophage populations have a
low level of proliferation (57). Under stress or challenge conditions, an increased
proliferative response is induced (57). This feature appears to be due to a continued
induction of proliferation by CSF-1 in mature macrophages. In non-self renewing
macrophages, CSF-1 generally enhances survival but no longer promotes
proliferation (58). There is a strong phenotypic similarity between self-renewing
macrophages in mammals and mature/ alternative pathway macrophages in
goldfish- both maintain their proliferative capacity and are highly responsive to
330
CSF-1 (59). Interestingly, goldfish mature/ alternative pathway macrophages are
also capable of producing CSF-1, in addition to sCSF-1R, allowing these cells to
regulate induction and suppression of proliferative responses (60). It will, then, be
interesting to determine if mammalian self-renewing macrophages have a similar,
self-contained mechanism(s) of regulation.
There is increasing evidence in mammalian literature showing the need for
macrophage proliferation within a site of infection (61-63). Local proliferation of
tissue-resident macrophages is transient and intense, and occurs following
recruitment of inflammation-associated macrophages (61). This proliferative burst
is dependent on CSF-1 (62). Interestingly, it has also been shown that
inflammatory macrophages recruited from bone-marrow precursors are also
capable of proliferation during the resolution phase of inflammation, also in a CSF-
1-dependent manner (62). Based on this, it has been hypothesized that the role of
CSF-1 in the resolution of inflammation is thought be dual: [1.] re-establishing the
tissue resident- macrophage population in a tightly governed manner that is
restricted once normal tissue macrophage numbers has been restored (61); and [2.]
maintaining the continued presence of inflammatory macrophages to control
pathogens or injury (62). The dynamics of proliferation induced by CSF-1 in these
two seemingly opposite types of macrophages is of critical importance, especially
given the strong link to fibrosis (excessive activity of resident tissue
macrophages?) and chronic inflammatory disease (excessive activity of
inflammatory macrophages?). It is interesting to speculate a role of a putative
sCSF-1R in this system, as a potential regulator of proliferation in these disparate
331
macrophage populations. Further, it will be of interest to determine if self-renewing
macrophages exist in vivo in goldfish, and what role sCSF-1R has in regulating
both the proliferation and inflammatory responses of this population.
8.4 Aeromonas-driven modulation of the inflammatory
response: implications for host defenses
Aeromonas is a highly virulent pathogen that, depending on the bacterial
species, can infect a range of hosts. In fish, infections are most prominent during
times of stress, including changes in water temperature, water quality or hormone
levels. In humans, infections are most common following traumatic tissue injury or
in immune-compromised individuals. Aeromonas species possess a vast repertoire
of virulence factors and host evasion strategies, which are covered in Chapter 1.
One main protective mechanism appears to be induction of apoptosis in
macrophages (64-66). Inducing apoptosis in members of the myeloid phagocyte
family is a common virulence mechanism of several successful bacterial pathogens
(67-69). When an overwhelming amount of apoptosis occurs at a site of infection,
it is common for non-cleared apoptotic cells to progress to secondary necrosis (70),
especially in the presence of extensive pathogen-induced macrophage apoptosis
(71). Within a site of infection, this is an efficient, self-amplifying mechanism that
benefits the pathogen in two distinct ways: [1.] clearance of macrophages (by
apoptosis) and neutrophils (by secondary necrosis) protects the bacteria from
potent anti-microbial defenses of phagocytes; and [2.] lysis of neutrophils during
secondary necrosis results in release of potent molecules that increase damage and
332
contribute to infection associated pathology (71). During an Aeromonas infection,
furunculation coincides with inflammation and large-scale cell death. Interestingly,
there is also a significant increase in sCSF-1R expression (Chapter 7). While this
may be due to the presence of apoptotic cells, its expression may amplify the
protective effects of Aeromonas-induced macrophage apoptosis for the pathogen-
macrophages within site are either undergoing apoptosis or less efficient at
phagocytosing and killing Aeromonas due to the effects of sCSF-1R (Chapter 6).
Thus, apoptosis of macrophages is likely highly beneficial to the establishment of
infection and subsequent tissue infection that occurs during furunculation.
Interestingly, I also noted an increase in sCSF-1R expression within the
kidney of infected fish (Chapter 7). This increase likely cannot be explained by
apoptotic cell death. While it is currently unclear what is inducing this increase, the
expression of sCSF-1R within the kidney coincides with a decrease in
hematopoietic proliferation (Chapter 7). Previously, it has been reported that
infection with Aeromonas salmonicida significantly alters the expression patterns
of transcription factors important to myeloid cell development (72). Specifically, it
was found that during infection expression of runx1, cmyb, and egr decreased,
while expression of pu.1 and cjun increased (72). Runx1 and cmyb are involved in
proliferation and maintenance of progenitor cells (73). Egr and cjun are important
for monocyte/macrophage differentiation (74). Pu.1 expression is necessary for
myeloid fate decision (75). It has been hypothesized that these changes may shift
cells within the kidney towards early myeloid committed progenitors, followed by
either an arrest in commitment/progression or mobilization of myeloid cells that
333
are not fully differentiated (72). It will be of great interest to determine if
Aeromonas veronii infection also results in changes to transcription factor
expression. Arrest in commitment combined with decreased proliferation may
allow Aeromonas to subvert defenses within the kidney and aid in colonization.
Therefore, it will be interesting to determine if expression of sCSF-1R within the
kidney contributes to Aeromonas colonization through the modulation of
hematopoiesis, thereby subverting host immune responses.
8.5 Future Directions
8.5.1 Neutrophil-driven inflammatory control in goldfish
In Chapter 4, I showed that goldfish neutrophils did not have the capacity to
internalize apoptotic cells. However, neutrophils incubated in the presence of
apoptotic cells produced soluble factors that decreased ROS responses in
monocytes and macrophages. It is currently unknown what these factors are.
Further, though neutrophil recruitment is temporally regulated (in zymosan
peritonitis, occurs between 18-24 hours), the neutrophils that remain within the
peritoneum after this time reduce ROS production while still maintaining
phagocytic responses. The role of these neutrophils remaining within the site is
currently unknown but it is hypothesized that they play a dual role: [1.] aid in
resolution of inflammation through the production of soluble factors, likely lipid
mediators involved in resolution responses, such as lipoxins and resolvins; and [2.]
provide protection against remaining pathogens or secondary infections that may
challenge a host following an inflammatory response. This topic is currently the
334
focus of the Ph.D. research of a current Barreda lab student J.J. Havixbeck. I
predict that, even though they lack the capacity to internalize apoptotic cells,
goldfish neutrophils are highly integrated into resolution responses and aid in
repair processes.
8.5.2 Does sCSF-1R promote long-term survival of Aeromonas within host
tissue?
At the end of Chapter 7, I mentioned that fish with Aeromonas infections,
either natural or induced, had significant decreases in proliferation. A next logical
step is to determine if, similar to Aeromonas salmonicida infections, there is a
change in transcription factor expression in Aeromonas veronii infected fish. This
may give an indication as to which progenitor populations are being affected
during an infection. To determine if these changes are due to the infection itself or
to the increase in sCSF-1R expression in the kidney, goldfish will be injected with
recombinant sCSF-1R into the caudal vein. Kidney proliferation and transcription
factor expression can then be analyzed for changes.
Aeromonas salmonicida infections have been shown to result in long-term
infection of several tissues, including the kidney, that can last for up to 2 years. To
determine if sCSF-1R contributes to survival of Aeromonas veronii in the kidney,
goldfish will be infected using the scale-scraping method. These fish will then be
injected with sCSF-1R or anti-sCSF-1R antibodies early in the infection process
(multiple injections between day 0 and day 7, the day the peak furunculosis).
Colony forming units in the kidney will be determined on various days, from day 0
335
to day 56 post-infection (or later). If sCSF-1R aids in survival, it would be
expected that CFUs of Aeromonas will increase in fish injected with sCSF-1R and
decrease in fish injected with antibodies against sCSF-1R. There is a possibility,
however, that the antibody raised against sCSF-1R will affect the function of
membrane bound CSF-1R on resident macrophages, impeding the action of
macrophages and aiding in colonization of Aeromonas. These studies are currently
underway in the Barreda lab, being conducted by M.E. Wong. I predict that
Aeromonas co-opts the CSF-1 system to its advantage, essentially inducing a short-
term, localized, pseudo-immunocompromisation necessary for infection. By
inducing high levels of sCSF-1R expression, Aeromonas effectively decreases the
efficacy and efficiency of macrophage responses and generation, allowing
Aeromonas to gain a foothold and overcome host defenses, leading to long-term
survival within the host. In the absence of such disruption, I believe that
Aeromonas infections would be rapidly cleared by the host.
8.5.3 Detection of sCSF-1R outside of teleosts
To date, sCSF-1R has only been identified in teleosts- goldfish and zebrafish
(Lund, J.M., M.Sc. thesis 2012). Based analysis of the splice site sequence
variations in the Exon4/Intron4 boundary and the presence of the hydrophilic tail, it
is predicted that sCSF-1R may also exist in Japanese medaka, Xenopus, chicken,
mouse, horse, gorilla, and human (Lund, J.M., M.Sc. thesis 2012). We have
previously attempted to identify native sCSF-1R in mice using RACE-PCR in
basal and LPS injected mice (Rieger, A.M. and Tam, J., unpublished data). These
336
attempts identified a potential transcript but this transcript did not have a poly-A
tail. Given the significant increase in sCSF-1R infection induced by Aeromonas, it
may be worth using a murine Aeromonas veronii infection model to hypothetically
increase sCSF-1R expression within the mouse as well. This may aid in detection.
It is also possible that, similar to phagocytic B cells, sCSF-1R plays a much more
focused role in mammalian compared to piscine immune systems. As such, it is
worth attempting to detect sCSF-1R within tissues that require specialized
modulation of macrophage responses such as the brain or liver. Once/if sCSF-1R is
found in mice and a recombinant protein is generated, it will be interesting to
determine if murine sCSF-1R is also capable of modulating inflammatory
responses or if it plays a more specialized role. I predict that sCSF-1R will have a
limited, highly specialized role in the mammalian immune system. I think it will be
localized to areas with a high density of self-renewing macrophages and will be
involved in regulating the generation of these cells.
8.6 Relevance
8.6.1 To basic biology
Colony stimulating factor-1 is central to a number of processes, including
survival and maintenance of macrophage-lineage cells, and in inflammatory
processes. Through the study of CSF-1 and factors regulating the action of CSF-1
(ie. sCSF-1R), we will gain a better understanding of how the CSF-1 system
induces inflammation and regulates phagocytes throughout an inflammatory
reaction. Further, by studying the actions of CSF-1 from an evolutionary
337
perspective, we will gain added information on the highly conserved mechanisms
of CSF-1 action, allowing identification of critical roles of this important cytokine.
8.6.2 To aquaculture
One of the greatest challenges in aquaculture is mass death caused by
infections. Aeromonas infections are commonly associated with mass death
outbreaks. As such, gaining a better understanding of mechanisms of immune
evasion and modulation employed by this pathogen may lead to the development of
novel strategies for disease prevention.
8.6.3 To medicine
Currently, there are a number of therapeutic inhibitors are being developed
against c-fms, or CSF-1R. These include Ki20227 (bone metastasis), GW2580
(rheumatoid arthritis), SB1578 (rheumatoid arthritis), and PLX5622 (rheumatoid
arthritis) (76-79). Other therapeutics targeting the CSF-1 system are being
developed for interventions against infections, other autoimmune disorders, various
cancers, and a range of inflammatory conditions (80). The potential, therefore,
exists that an sCSF-1R-like therapeutic could be beneficial to a range of medically
relevant diseases.
8.7 Summary
The main objective of my Ph.D. was to characterize functional phagocyte
responses that occur at inflammatory sites. I specifically focused on responses that
338
occur at the boundary between inflammation and resolution. My research has
expanded our current knowledge of inflammatory control on goldfish and mice,
highlighting important roles for phagocytes in each species. Further, the
identification of sCSF-1R as a central regulator of inflammation in goldfish has
advanced our understanding of the importance of the CSF-1 system in
inflammation and opens the door for potential applications not only to aquaculture,
but to human therapeutics as well.
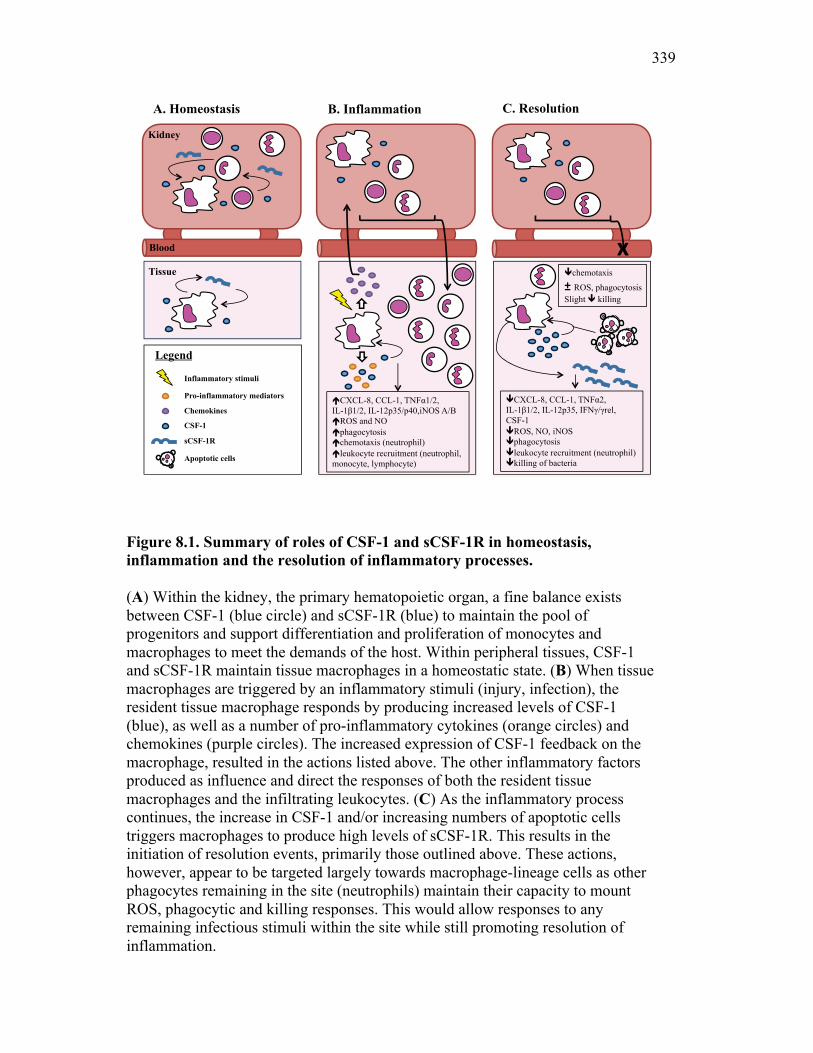
339
Tissue
Blood
A. Homeostasis B. Inflammation C. Resolution
Kidney
CXCL-8, CCL-1, TNFα1/2, IL-1β1/2, IL-12p35/p40,iNOS A/B
ROS and NO phagocytosis chemotaxis (neutrophil) leukocyte recruitment (neutrophil,
monocyte, lymphocyte)
chemotaxis
ROS, phagocytosis Slight killing
CXCL-8, CCL-1, TNFα2, IL-1β1/2, IL-12p35, IFNγ/γrel, CSF-1
ROS, NO, iNOS phagocytosis leukocyte recruitment (neutrophil) killing of bacteria
Legend
Inflammatory stimuli
Pro-inflammatory mediators
Chemokines
CSF-1
sCSF-1R
Apoptotic cells
Figure 8.1. Summary of roles of CSF-1 and sCSF-1R in homeostasis, inflammation and the resolution of inflammatory processes. (A) Within the kidney, the primary hematopoietic organ, a fine balance exists between CSF-1 (blue circle) and sCSF-1R (blue) to maintain the pool of progenitors and support differentiation and proliferation of monocytes and macrophages to meet the demands of the host. Within peripheral tissues, CSF-1 and sCSF-1R maintain tissue macrophages in a homeostatic state. (B) When tissue macrophages are triggered by an inflammatory stimuli (injury, infection), the resident tissue macrophage responds by producing increased levels of CSF-1 (blue), as well as a number of pro-inflammatory cytokines (orange circles) and chemokines (purple circles). The increased expression of CSF-1 feedback on the macrophage, resulted in the actions listed above. The other inflammatory factors produced as influence and direct the responses of both the resident tissue macrophages and the infiltrating leukocytes. (C) As the inflammatory process continues, the increase in CSF-1 and/or increasing numbers of apoptotic cells triggers macrophages to produce high levels of sCSF-1R. This results in the initiation of resolution events, primarily those outlined above. These actions, however, appear to be targeted largely towards macrophage-lineage cells as other phagocytes remaining in the site (neutrophils) maintain their capacity to mount ROS, phagocytic and killing responses. This would allow responses to any remaining infectious stimuli within the site while still promoting resolution of inflammation.
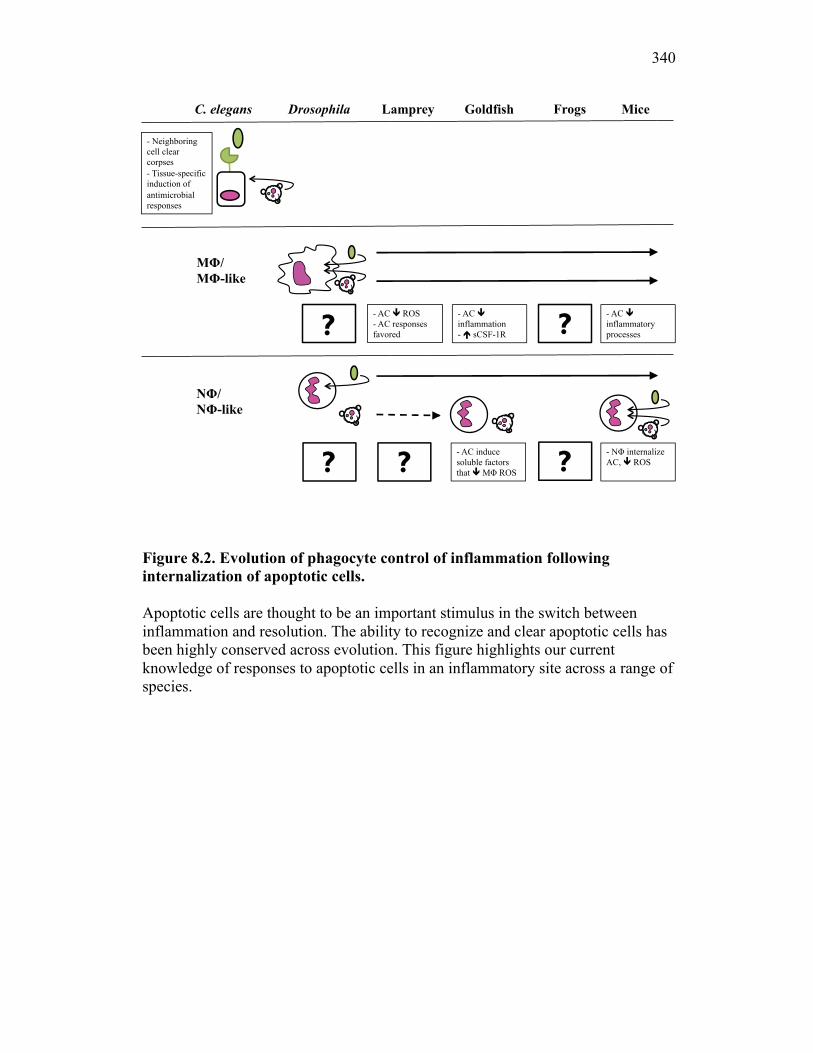
340
C. elegans Drosophila Lamprey Goldfish Mice Frogs
MΦ/ MΦ-like
NΦ/ NΦ-like
- Neighboring cell clear corpses - Tissue-specific induction of antimicrobial responses
- AC induce soluble factors that MΦ ROS
- NΦ internalize AC, ROS
- AC inflammation - sCSF-1R
- AC inflammatory processes
? ? ?
? ? - AC ROS - AC responses favored
Figure 8.2. Evolution of phagocyte control of inflammation following internalization of apoptotic cells. Apoptotic cells are thought to be an important stimulus in the switch between inflammation and resolution. The ability to recognize and clear apoptotic cells has been highly conserved across evolution. This figure highlights our current knowledge of responses to apoptotic cells in an inflammatory site across a range of species.
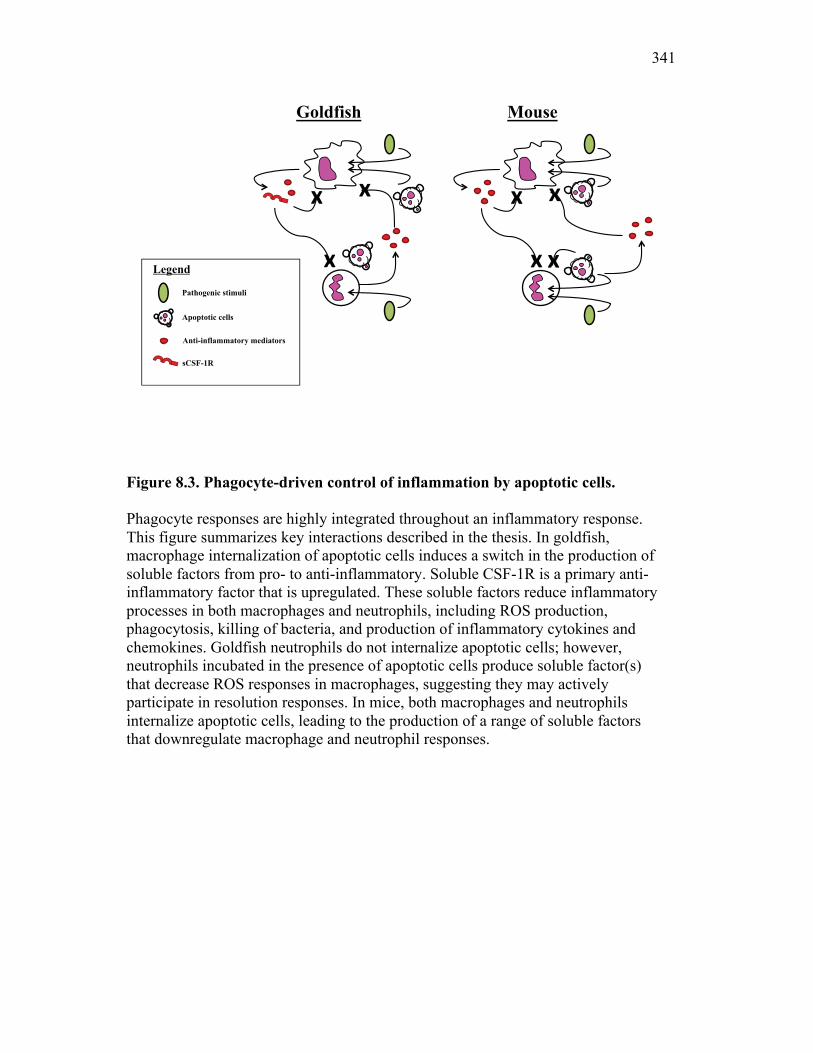
341
Goldfish Mouse
Legend
Pathogenic stimuli
Anti-inflammatory mediators
Apoptotic cells
sCSF-1R
Figure 8.3. Phagocyte-driven control of inflammation by apoptotic cells. Phagocyte responses are highly integrated throughout an inflammatory response. This figure summarizes key interactions described in the thesis. In goldfish, macrophage internalization of apoptotic cells induces a switch in the production of soluble factors from pro- to anti-inflammatory. Soluble CSF-1R is a primary anti-inflammatory factor that is upregulated. These soluble factors reduce inflammatory processes in both macrophages and neutrophils, including ROS production, phagocytosis, killing of bacteria, and production of inflammatory cytokines and chemokines. Goldfish neutrophils do not internalize apoptotic cells; however, neutrophils incubated in the presence of apoptotic cells produce soluble factor(s) that decrease ROS responses in macrophages, suggesting they may actively participate in resolution responses. In mice, both macrophages and neutrophils internalize apoptotic cells, leading to the production of a range of soluble factors that downregulate macrophage and neutrophil responses.
342
8.8 References
1. Okin, D., and Medzhitov, R. 2012. Evolution of inflammatory diseases. Curr Biol 22:R733-740.
2. Delamarre, L., Pack, M., Chang, H., Mellman, I., and Trombetta, E.S. 2005. Differential lysosomal proteolysis in antigen-presenting cells determines antigen fate. Science 307:1630-1634.
3. Weigert, A., Jennewein, C., and Brune, B. 2009. The liaison between apoptotic cells and macrophages--the end programs the beginning. Biol Chem 390:379-390.
4. Soehnlein, O., and Lindbom, L. 2010. Phagocyte partnership during the onset and resolution of inflammation. Nat Rev Immunol 10:427-439.
5. Rieger, A.M., Konowalchuk, J.D., Grayfer, L., Katzenback, B.A., Havixbeck, J.J., Kiemele, M.D., Belosevic, M., and Barreda, D.R. 2012. Fish and mammalian phagocytes differentially regulate pro-inflammatory and homeostatic responses in vivo. PLoS One 7:e47070.
6. Rieger, A.M., Konowalchuk, J.D., Havixbeck, J.J., Robbins, J.S., Smith, M.K., Lund, J.M., and Barreda, D.R. 2013. A soluble form of the CSF-1 receptor contributes to the inhibition of inflammation in a teleost fish. Dev Comp Immunol 39:438-446.
7. Barreda, D.R., Hanington, P.C., Stafford, J.L., and Belosevic, M. 2005. A novel soluble form of the CSF-1 receptor inhibits proliferation of self-renewing macrophages of goldfish (Carassius auratus L.). Dev Comp Immunol 29:879-894.
8. Grayfer, L., Hanington, P.C., and Belosevic, M. 2009. Macrophage colony-stimulating factor (CSF-1) induces pro-inflammatory gene expression and enhances antimicrobial responses of goldfish (Carassius auratus L.) macrophages. Fish Shellfish Immunol 26:406-413.
9. Maderna, P., and Godson, C. 2003. Phagocytosis of apoptotic cells and the resolution of inflammation. Biochim Biophys Acta 1639:141-151.
10. Bianchi, S.M., Prince, L.R., McPhillips, K., Allen, L., Marriott, H.M., Taylor, G.W., Hellewell, P.G., Sabroe, I., Dockrell, D.H., Henson, P.W., et al. 2008. Impairment of apoptotic cell engulfment by pyocyanin, a toxic metabolite of Pseudomonas aeruginosa. Am J Respir Crit Care Med 177:35-43.
11. Erwig, L.P., and Henson, P.M. 2007. Immunological consequences of apoptotic cell phagocytosis. Am J Pathol 171:2-8.
12. Fullard, J.F., Kale, A., and Baker, N.E. 2009. Clearance of apoptotic corpses. Apoptosis 14:1029-1037.
13. Fadeel, B., Xue, D., and Kagan, V. 2010. Programmed cell clearance: molecular regulation of the elimination of apoptotic cell corpses and its role in the resolution of inflammation. Biochem Biophys Res Commun 396:7-10.
14. Park, D., Tosello-Trampont, A.C., Elliott, M.R., Lu, M., Haney, L.B., Ma, Z., Klibanov, A.L., Mandell, J.W., and Ravichandran, K.S. 2007. BAI1 is an engulfment receptor for apoptotic cells upstream of the ELMO/Dock180/Rac module. Nature 450:430-434.
343
15. Tosello-Trampont, A.C., Kinchen, J.M., Brugnera, E., Haney, L.B., Hengartner, M.O., and Ravichandran, K.S. 2007. Identification of two signaling submodules within the CrkII/ELMO/Dock180 pathway regulating engulfment of apoptotic cells. Cell Death Differ 14:963-972.
16. Kinchen, J.M., and Ravichandran, K.S. 2010. Identification of two evolutionarily conserved genes regulating processing of engulfed apoptotic cells. Nature 464:778-782.
17. Sulston, J.E., and Horvitz, H.R. 1977. Post-embryonic cell lineages of the nematode, Caenorhabditis elegans. Dev Biol 56:110-156.
18. Gumienny, T.L., Lambie, E., Hartwieg, E., Horvitz, H.R., and Hengartner, M.O. 1999. Genetic control of programmed cell death in the Caenorhabditis elegans hermaphrodite germline. Development 126:1011-1022.
19. Zhou, Z., Hartwieg, E., and Horvitz, H.R. 2001. CED-1 is a transmembrane receptor that mediates cell corpse engulfment in C. elegans. Cell 104:43-56.
20. Sasaki, A., Nakae, I., Nagasawa, M., Hashimoto, K., Abe, F., Saito, K., Fukuyama, M., Gengyo-Ando, K., Mitani, S., Katada, T., et al. 2013. Arl8/ARL-8 functions in apoptotic cell removal by mediating phagolysosome formation in Caenorhabditis elegans. Mol Biol Cell 24:1584-1592.
21. Engelmann, I., and Pujol, N. 2010. Innate immunity in C. elegans. Adv Exp Med Biol 708:105-121.
22. Lanot, R., Zachary, D., Holder, F., and Meister, M. 2001. Postembryonic hematopoiesis in Drosophila. Dev Biol 230:243-257.
23. Hartenstein, V. 2006. Blood cells and blood cell development in the animal kingdom. Annu Rev Cell Dev Biol 22:677-712.
24. Lemaitre, B., and Hoffmann, J. 2007. The host defense of Drosophila melanogaster. Annu Rev Immunol 25:697-743.
25. Kounatidis, I., and Ligoxygakis, P. 2012. Drosophila as a model system to unravel the layers of innate immunity to infection. Open Biol 2:120075.
26. Wang, L., Kounatidis, I., and Ligoxygakis, P. 2013. Drosophila as a model to study the role of blood cells in inflammation, innate immunity and cancer. Front Cell Infect Microbiol 3:113.
27. Nonaka, S., Nagaosa, K., Mori, T., Shiratsuchi, A., and Nakanishi, Y. 2013. Integrin alphaPS3/betanu-mediated phagocytosis of apoptotic cells and bacteria in Drosophila. J Biol Chem 288:10374-10380.
28. Tung, T.T., Nagaosa, K., Fujita, Y., Kita, A., Mori, H., Okada, R., Nonaka, S., and Nakanishi, Y. 2013. Phosphatidylserine recognition and induction of apoptotic cell clearance by Drosophila engulfment receptor Draper. J Biochem 153:483-491.
29. Manaka, J., Kuraishi, T., Shiratsuchi, A., Nakai, Y., Higashida, H., Henson, P., and Nakanishi, Y. 2004. Draper-mediated and phosphatidylserine-independent phagocytosis of apoptotic cells by Drosophila hemocytes/macrophages. J Biol Chem 279:48466-48476.
30. Boehm, T., McCurley, N., Sutoh, Y., Schorpp, M., Kasahara, M., and Cooper, M.D. 2012. VLR-based adaptive immunity. Annu Rev Immunol 30:203-220.
344
31. Havixbeck, J.J., Rieger, A.M., Wong, M.E., Wilkie, M.P., and Barreda, D.R. 2014. Evolutionary conservation of divergent pro-inflammatory and homeostatic responses in Lamprey phagocytes. PLoS One 9:e86255.
32. Nishikawa, A., Murata, E., Akita, M., Kaneko, K., Moriya, O., Tomita, M., and Hayashi, H. 1998. Roles of macrophages in programmed cell death and remodeling of tail and body muscle of Xenopus laevis during metamorphosis. Histochem Cell Biol 109:11-17.
33. Corsaro, C., Scalia, M., Leotta, N., Mondio, F., and Sichel, G. 2000. Characterisation of Kupffer cells in some Amphibia. J Anat 196 ( Pt 2):249-261.
34. Grayfer, L., and Robert, J. 2013. Colony-stimulating factor-1-responsive macrophage precursors reside in the amphibian (Xenopus laevis) bone marrow rather than the hematopoietic subcapsular liver. J Innate Immun 5:531-542.
35. Grayfer, L., De Jesus Andino, F., and Robert, J. 2014. The Amphibian (Xenopus laevis) Type I Interferon Response to Frog Virus 3: New Insight into Ranavirus Pathogenicity. J Virol 88:5766-5777.
36. Godwin, J.W., Pinto, A.R., and Rosenthal, N.A. 2013. Macrophages are required for adult salamander limb regeneration. Proc Natl Acad Sci U S A 110:9415-9420.
37. Fadok, V.A., Bratton, D.L., Konowal, A., Freed, P.W., Westcott, J.Y., and Henson, P.M. 1998. Macrophages that have ingested apoptotic cells in vitro inhibit proinflammatory cytokine production through autocrine/paracrine mechanisms involving TGF-beta, PGE2, and PAF. J Clin Invest 101:890-898.
38. Voll, R.E., Herrmann, M., Roth, E.A., Stach, C., Kalden, J.R., and Girkontaite, I. 1997. Immunosuppressive effects of apoptotic cells. Nature 390:350-351.
39. Bellingan, G.J., Caldwell, H., Howie, S.E., Dransfield, I., and Haslett, C. 1996. In vivo fate of the inflammatory macrophage during the resolution of inflammation: inflammatory macrophages do not die locally, but emigrate to the draining lymph nodes. J Immunol 157:2577-2585.
40. Stark, M.A., Huo, Y., Burcin, T.L., Morris, M.A., Olson, T.S., and Ley, K. 2005. Phagocytosis of apoptotic neutrophils regulates granulopoiesis via IL-23 and IL-17. Immunity 22:285-294.
41. Tassiulas, I., Park-Min, K.H., Hu, Y., Kellerman, L., Mevorach, D., and Ivashkiv, L.B. 2007. Apoptotic cells inhibit LPS-induced cytokine and chemokine production and IFN responses in macrophages. Hum Immunol 68:156-164.
42. Kim, S., Elkon, K.B., and Ma, X. 2004. Transcriptional suppression of interleukin-12 gene expression following phagocytosis of apoptotic cells. Immunity 21:643-653.
43. Esmann, L., Idel, C., Sarkar, A., Hellberg, L., Behnen, M., Moller, S., van Zandbergen, G., Klinger, M., Kohl, J., Bussmeyer, U., et al. 2009. Phagocytosis of apoptotic cells by neutrophil granulocytes: diminished
345
proinflammatory neutrophil functions in the presence of apoptotic cells. J Immunol 184:391-400.
44. Levy, B.D., Clish, C.B., Schmidt, B., Gronert, K., and Serhan, C.N. 2001. Lipid mediator class switching during acute inflammation: signals in resolution. Nat Immunol 2:612-619.
45. Hotamisligil, G.S., and Erbay, E. 2008. Nutrient sensing and inflammation in metabolic diseases. Nat Rev Immunol 8:923-934.
46. Libby, P., and Plutzky, J. 2007. Inflammation in diabetes mellitus: role of peroxisome proliferator-activated receptor-alpha and peroxisome proliferator-activated receptor-gamma agonists. Am J Cardiol 99:27B-40B.
47. Deguchi, J.O., Aikawa, M., Tung, C.H., Aikawa, E., Kim, D.E., Ntziachristos, V., Weissleder, R., and Libby, P. 2006. Inflammation in atherosclerosis: visualizing matrix metalloproteinase action in macrophages in vivo. Circulation 114:55-62.
48. Shimizu, K., Mitchell, R.N., and Libby, P. 2006. Inflammation and cellular immune responses in abdominal aortic aneurysms. Arterioscler Thromb Vasc Biol 26:987-994.
49. Libby, P. 2006. Inflammation and cardiovascular disease mechanisms. Am J Clin Nutr 83:456S-460S.
50. Trinchieri, G. 2012. Cancer and inflammation: an old intuition with rapidly evolving new concepts. Annu Rev Immunol 30:677-706.
51. Wyss-Coray, T., and Mucke, L. 2002. Inflammation in neurodegenerative disease--a double-edged sword. Neuron 35:419-432.
52. Green, D. 2011. Means to an End: Apoptosis and Other Cell Death Mechanisms. Cold Spring Harbor, NY: Cold Spring Harbor Laboratory Press.
53. Fadok, V.A., and Henson, P.M. 1998. Apoptosis: getting rid of the bodies. Curr Biol 8:R693-695.
54. Geske, F.J., Monks, J., Lehman, L., and Fadok, V.A. 2002. The role of the macrophage in apoptosis: hunter, gatherer, and regulator. Int J Hematol 76:16-26.
55. Devitt, A., Moffatt, O.D., Raykundalia, C., Capra, J.D., Simmons, D.L., and Gregory, C.D. 1998. Human CD14 mediates recognition and phagocytosis of apoptotic cells. Nature 392:505-509.
56. Robbins, P.D., and Morelli, A.E. 2014. Regulation of immune responses by extracellular vesicles. Nat Rev Immunol 14:195-208.
57. Sieweke, M.H., and Allen, J.E. 2013. Beyond stem cells: self-renewal of differentiated macrophages. Science 342:1242974.
58. Molawi, K., and Sieweke, M.H. 2013. Transcriptional control of macrophage identity, self-renewal, and function. Adv Immunol 120:269-300.
59. Barreda, D.R., Hanington, P.C., and Belosevic, M. 2004. Regulation of myeloid development and function by colony stimulating factors. Dev Comp Immunol 28:509-554.
346
60. Rieger, A.M., Hanington, P.C., Belosevic, M., and Barreda, D.R. 2014. Control of CSF-1 induced inflammation in teleost fish by a soluble form of the CSF-1 receptor. Fish Shellfish Immunol.
61. Davies, L.C., Rosas, M., Smith, P.J., Fraser, D.J., Jones, S.A., and Taylor, P.R. 2011. A quantifiable proliferative burst of tissue macrophages restores homeostatic macrophage populations after acute inflammation. Eur J Immunol 41:2155-2164.
62. Davies, L.C., Rosas, M., Jenkins, S.J., Liao, C.T., Scurr, M.J., Brombacher, F., Fraser, D.J., Allen, J.E., Jones, S.A., and Taylor, P.R. 2013. Distinct bone marrow-derived and tissue-resident macrophage lineages proliferate at key stages during inflammation. Nat Commun 4:1886.
63. Rosas, M., Davies, L.C., Giles, P.J., Liao, C.T., Kharfan, B., Stone, T.C., O'Donnell, V.B., Fraser, D.J., Jones, S.A., and Taylor, P.R. 2014. The transcription factor Gata6 links tissue macrophage phenotype and proliferative renewal. Science 344:645-648.
64. Krzyminska, S., Mokracka, J., Koczura, R., Cwiertnia, A., and Kaznowski, A. 2012. Aeromonas spp.-mediated cell-contact cytotoxicity is associated with the presence of type III secretion system. Antonie Van Leeuwenhoek 101:243-251.
65. Krzyminska, S., Kaznowski, A., and Puk, M. 2008. Interaction of Aeromonas spp. human isolates with murine macrophages. New Microbiol 31:481-488.
66. Krzyminska, S., Kaznowski, A., and Chodysz, M. 2009. Aeromonas spp. human isolates induce apoptosis of murine macrophages. Curr Microbiol 58:252-257.
67. Allen, L.A. 2003. Mechanisms of pathogenesis: evasion of killing by polymorphonuclear leukocytes. Microbes Infect 5:1329-1335.
68. Flannagan, R.S., Cosio, G., and Grinstein, S. 2009. Antimicrobial mechanisms of phagocytes and bacterial evasion strategies. Nat Rev Microbiol 7:355-366.
69. Bhavsar, A.P., Guttman, J.A., and Finlay, B.B. 2007. Manipulation of host-cell pathways by bacterial pathogens. Nature 449:827-834.
70. Silva, M.T. 2010. Secondary necrosis: the natural outcome of the complete apoptotic program. FEBS Lett 584:4491-4499.
71. Silva, M.T. 2010. Bacteria-induced phagocyte secondary necrosis as a pathogenicity mechanism. J Leukoc Biol 88:885-896.
72. Katzenback, B.A., Karpman, M., and Belosevic, M. 2011. Distribution and expression analysis of transcription factors in tissues and progenitor cell populations of the goldfish (Carassius auratus L.) in response to growth factors and pathogens. Mol Immunol 48:1224-1235.
73. Loose, M., Swiers, G., and Patient, R. 2007. Transcriptional networks regulating hematopoietic cell fate decisions. Curr Opin Hematol 14:307-314.
74. Krishnaraju, K., Hoffman, B., and Liebermann, D.A. 1998. The zinc finger transcription factor Egr-1 activates macrophage differentiation in M1 myeloblastic leukemia cells. Blood 92:1957-1966.
347
75. Burda, P., Laslo, P., and Stopka, T. 2010. The role of PU.1 and GATA-1 transcription factors during normal and leukemogenic hematopoiesis. Leukemia 24:1249-1257.
76. Dewar, A.L., Cambareri, A.C., Zannettino, A.C., Miller, B.L., Doherty, K.V., Hughes, T.P., and Lyons, A.B. 2005. Macrophage colony-stimulating factor receptor c-fms is a novel target of imatinib. Blood 105:3127-3132.
77. Ohno, H., Kubo, K., Murooka, H., Kobayashi, Y., Nishitoba, T., Shibuya, M., Yoneda, T., and Isoe, T. 2006. A c-fms tyrosine kinase inhibitor, Ki20227, suppresses osteoclast differentiation and osteolytic bone destruction in a bone metastasis model. Mol Cancer Ther 5:2634-2643.
78. Paniagua, R.T., Chang, A., Mariano, M.M., Stein, E.A., Wang, Q., Lindstrom, T.M., Sharpe, O., Roscow, C., Ho, P.P., Lee, D.M., et al. 2010. c-Fms-mediated differentiation and priming of monocyte lineage cells play a central role in autoimmune arthritis. Arthritis Res Ther 12:R32.
79. Madan, B., Goh, K.C., Hart, S., William, A.D., Jayaraman, R., Ethirajulu, K., Dymock, B.W., and Wood, J.M. 2012. SB1578, a novel inhibitor of JAK2, FLT3, and c-Fms for the treatment of rheumatoid arthritis. J Immunol 189:4123-4134.
80. Hume, D.A., and MacDonald, K.P. 2012. Therapeutic applications of macrophage colony-stimulating factor-1 (CSF-1) and antagonists of CSF-1 receptor (CSF-1R) signaling. Blood 119:1810-1820.
348
Appendix I: Conventional apoptosis assays using
propidium iodide generate a significant number of false
positives that prevent accurate assessment of cell death1
AI.1 Introduction
Propidium iodide (PI) is a widely utilized stain for assessing cell death, for
measuring cell cycling and for determining ploidy in tumor samples. Since the
advent of flow-cytometry based apoptosis assays, PI, in combination with Annexin
V, has been commonly used to distinguish between live, apoptotic and necrotic
cells based on differences in membrane permeability (1, 2). Intact membranes
exclude PI, and thus live and early apoptotic cells are not stained as PI does not
pass through the plasma membrane (1-3). Cells undergoing late apoptosis or
necrosis, however, have changes in the permeability of both the plasma and nuclear
membranes. In late apoptotic cells, increased permeability of nuclear pores allows
even large proteins and complexes to enter the nucleus (4). In necrotic cells,
A version of this Appendix has been previously published:
Rieger AM, Hall BE, Luong Le T, Schang LM, Barreda DR. 2010. Conventional
apoptosis assays using propidium iodide generate a significant number of false
positives that prevent accurate assessment of cell death. J Immunol Methods 358:
81-92.
Rieger AM, Nelson KL, Konowalchuk JD, Barreda DR. 2011. Modified
AnnexinV/Propidium Iodide apoptosis assay for accurate assessment of cell death.
J Vis Exp 50: pii: 2597.
349
mitochondrial dysfunction results in the disruption of nuclear membrane integrity
(5). Therefore, in late apoptotic and necrotic cells, PI enters the cell, passes through
the disrupted nuclear membrane and intercalates into DNA, causing red
fluorescence in the nucleus (1-3).
Early studies that precede current flow cytometry-based assays indicated that
PI does not only bind DNA but can intercalate into any double-stranded nucleic
acid in the cell, which includes both DNA and dsRNA (6). For this reason, early
microscopy-based PI staining protocols had an RNase treatment following fixation
to remove RNA and thereby increase the specificity of the PI stain for DNA (6, 7).
This step, however, has been omitted in the vast majority of studies and protocols
of major developers of assays that employ flow cytometry. Since the first
published Annexin V/PI staining protocol in 1995 (2), only 3 of 1019 published
papers using an Annexin V/PI stain have an RNase treatment (8) and the main PI
staining protocols for apoptotic cells, including Current Protocols in Immunology
(9) and those of major developers of flow cytometry applications (e.g. Molecular
Probes, BD Biosciences, eBioscience, Abcam, MBL international, Santa Cruz,
Miltenyi Biotech, Roche Applied Science), do not include an RNase treatment.
This likely stems from a lack of RNase permeability in live cells.
The ImageStream multi-spectral flow cytometer combines features of both
flow cytometry and fluorescence microscopy (10). The ImageStream 100 platform
(Amnis) produces six simultaneous images of each cell and images over 100 cells
per second (11). In an effort to correlate Annexin V/PI staining with morphological
changes associated with apoptotic events, I examined cellular death in a variety of
350
primary cells systems and cell lines using an ImageStream multi-spectral flow
cytometer. In this appendix, I show that conventional Annexin V/PI staining results
in a significant number of false positive events that greatly impacts quantification
of cell death. Based on thse findings, I have developed and propose a modified
Annexin V/PI protocol in which cells are fixed at a late stage in the procedure and
RNase treated prior to examination. This greatly reduces the number of false
positive events while having no detectable impact on Annexin V or nuclear PI
stains. The modified protocol described here would be applicable to ImageStream
multi-spectral and conventional flow cytometry applications, as well as microscopy
and microplate-based approaches that historically rely on examination of cellular
death events in unfixed cells. Importantly, these modifications are necessary to
accurately quantify cell death, especially in biological systems where changes in
RNA content could severely impact accurate assessment of cell death. As I show
here, RNA produced during replicative viral infection (DNA or RNA virus) can be
misinterpreted as cell death, leading to a belief that infected cells may actively
induce cell death to contain virus spread. In fact, I found that cell viability levels in
virally infected cells remains high between 6 and 24 hours. This points to an
alternative conclusion: during the initial phase of infection, host defenses are
overcome but cell death is not induced. Instead, high levels of viral RNA likely
serve to produce high titers of infectious viral particles.
351
AI.2 Materials and Methods
AI.2.1 Animals
Four-to-six week old C57BL/6 female mice were maintained in a P-2-
specific pathogen-free facility in the Biosciences Animal Services Centre at the
University of Alberta.
Goldfish (Carassius auratus L.) 10–15 cm in length were purchased from
Mount Parnell (Mercersburg, PA) and maintained in the Aquatic Facility of the
Department of Biological Sciences, University of Alberta. The fish were held at
20oC in a flow-through water system on a simulated natural photoperiod. Unlike its
smaller cyprinid relative, D. rerio, C. auratus provided sufficient numbers of
hematopoietic progenitors necessary for the establishment of in vitro primary
macrophage cultures. Blastoderms were isolated from hatching eggs obtained from
white leghorn hens (Lohmann LSL-Lite) at the Poultry Research Center,
University of Alberta. Weaner pigs were obtained from the Swine Research and
Technology Center, University of Alberta. All animals were maintained in
accordance with the guidelines of the Canadian Council on Animal Care.
AI.2.2 Primary cells
Primary cells from four species were examined to study the relevance of
these findings across a wide range of animal models. Chicken blastodermal cells
were isolated from embryos after 0, 4 or 14 days of storage. Following dissection,
embryonic tissue was trypsin digested for 10 minutes at 37oC. Cells were then
washed and allowed to settle for 2 minutes. The cells were harvested and the
352
isolated cells stained. Goldfish (Carassius auratus L.) leukocytes were isolated
from kidneys. Primary kidney macrophages (PKM) were generated by seeding
isolated leukocytes and culturing in 15 mL complete MGFL-15 media (MGFL-15
supplemented with 100 U/mL penicillin, 100 μg/mL streptomycin, 100 μg/mL
gentamicin, 10% newborn calf serum (Gibco) and 5% carp serum) with 5 mL cell-
conditioned media from previous experiments and incubated for 6-9 days at 20oC
(12). Naïve C57BL/6 mice were sacrificed by cervical dislocation and their spleens
were harvested. Spleen tissue was passed through a tissue screen and allowed to
settle for 2 minutes. The cells were harvested and washed once in PBS-/- (no
calcium, no magnesium) and treated with ACK lysing buffer (Lonza) for 1 minute
at room temperature. Cells were washed once in complete DMEM media (DMEM,
100 U/mL penicillin, 100 μg/mL streptomycin, 10% fetal calf serum; all from
Gibco) and cultured at 37oC/5% CO2 for 24 hours. Spleen and lung tissues isolated
from weaner pigs were diced into 1 cm2 pieces and passed through a tissue screen
in homogenizing solution (100 U/mL penicillin, 100 μg/mL streptomycin and 0.1%
heparin in DMEM). The tissue was allowed to settle and the supernatant is
transferred to a 51% Percoll (GE Healthcare Life Sciences) gradient and spun for
25 minutes at 300 x g at 4oC. The interface between the solution and the pellet was
collected in washed twice in complete DMEM media. Cells were then cultured for
24 hours in complete DMEM media to allow adherence of macrophage
populations. After 24 hours, culture plates were washed with PBS+/+ to remove all
non-adherent cells. The remaining adherent cell population (> 90% macrophages)
was cultured for another 24 hours in complete DMEM media.
353
AI.2.3 Cell lines
Jurkat T cells were cultured in RPMI 1640 supplemented with 100 U/mL
penicillin, 100 μg/mL streptomycin, 10% fetal calf serum, 1 mM sodium pyruvate,
and 1x non-essential amino acids (all from Gibco). RAW 264.7 macrophage cells
were cultured in complete DMEM media. Cell lines were cultured at 37oC/5% CO2
and passaged every 3-4 days. RAW and Jurkat cells were treated with 10 μg/mL
cycloheximide (Sigma) for 24 hours prior to propidium iodide staining to induce
cell death.
AI.2.4 Nuclear stains
AI.2.4.1 BrdU staining
Cells were incubated with 10 μM bromodeoxyuridine (5-bromo-2-
deoxyuridine, BrdU) (BD Biosciences) for 18 hours. Cells were subsequently
harvested, washed twice in PBS-/-, and fixed with 1% formaldehyde on ice for 10
minutes. Cells were then stained following the manufacturer’s protocol (BD
Biosciences).
AI.2.4.2 Propidium iodide staining
Following BrdU staining, cells were washed twice in PBS-/- and re-suspended
at 2x10⁷ cells/mL. 100 μL (2x10⁶ cells) were transferred to 500 μL siliconized
polypropylene tubes. Propidium iodide (Sigma) was then added at a final
concentration of 1 μg/mL and cells were incubated for another 15 minutes at room
354
temperature. To ensure that false positives were not due to a specific lot of the
reagent, PI staining was compared between two unique lots of PI purchased from
two major distributors - Sigma and Molecular Probes (Invitrogen).
AI.2.4.3 DAPI staining
Following PI staining, cells were washed once with PBS-/- and re-suspended
in 100 μL of 1 μg/mL 4',6-diamidino-2-phenylindole (DAPI) (Invitrogen) in PBS-/-.
Cells were incubated for 15 minutes at room temperature. Following DAPI
staining, cells were washed twice with PBS-/- and re-suspended in 60 μL PBS-/-.
AI.2.4.4 DRAQ5 staining
Cells were stained with a 1:600 dilution of DRAQ5 (Biostatus). Cells were
subsequently incubated at room temperature for a minimum of 5 minutes before
acquisition.
AI.2.5 RNase treatment to remove false positive events
Fixed and unfixed cells were treated with 0 μg/mL or 50 μg/mL (equivalent
to 4 units of activity) DNase-free RNase A (Sigma) for 15 minutes at 37oC. Cells
were then washed once with 1xPBS-/- (centrifuge 393 x g for 10 minutes at 4oC)
and stained with PI as outlined above.
AI.2.6 Modified Annexin V/PI staining protocol to reduce false positive
events
355
Cells were harvested and washed once with PBS-/- and once with 1x Annexin
V binding buffer (BD Biosciences). Cells were re-suspended at a final
concentration of 2x10⁷ cell/mL and 100 μL (2x10⁶ cells) was transferred into a 500
μL siliconized polypropylene tube. Annexin V-Alexa Fluor 488 (Molecular
Probes) was added at a 1:20 dilution and cells were incubated for 15 minutes at
room temperature. Following this, PI was added at a final concentration of 1
μg/mL and cells were stained for a further 15 minutes at room temperature. After
staining, cells were washed twice with PBS-/- and fixed with 1% formaldehyde for
10 minutes on ice. Following fixation, cells were washed twice with 1xPBS-/-
(centrifuge 393 x g for 10 minutes at 4oC) and treated with 50 μg/mL DNase-free
RNase for 15 minutes at 37oC. Cells were then washed once with 1xPBS-/-
(centrifuge 393 x g for 10 minutes at 4oC), stained with DRAQ5 (1:600 final
concentration) and were then analyzed by an ImageStream multi-spectral flow
cytometer (Amnis).
AI.2.7 Viral infection
African green monkey (Vero) cells were maintained in DMEM supplemented
with 50 U/mL penicillin, 50 μg/mL streptomycin, and 5% fetal calf serum (all from
Gibco). Cells were infected with 5 plaque-forming units (PFU) per cell of herpes
simplex virus type-1 (HSV-1) or vesicular stomatitis virus (VSV) (multiplicity of
infection- MOI 5). Mock-infected cells were used to control for normal cell death.
Cycloheximide treated cells were used to control for cell death with no viral
infection. Cells were harvested at 6 and 24 hours (HSV-1) or 6 and 16 hours (VSV)
356
and stained using the conventional (-RNase) or modified (+RNase) AnnexinV/PI
protocols. To ensure that the additional steps in the modified protocol (fixation,
incubation and washes) did not skew the results, the samples stained with the
conventional protocol were treated the same but received PBS during the RNase
incubation step. Data was then acquired using a FACSCalibur (Becton Dickson)
and an ImageStream multispectral flow cytometer (Amnis) and were analyzed as
described below.
AI.2.8 Acquisition and analysis- ImageStream
Cell imagery was acquired using an ImageStream multi-spectral imaging
flow cytometer (Amnis Corporation). Classifiers were set to eliminate cell debris
and clusters prior to data acquisition based on low and high bright field area,
respectively (11). After acquisition, a compensation matrix was applied to all data
to correct for spectral overlap.
All analyses were completed on a population of spectrally compensated,
single, focused cells. Using analysis features available in IDEAS® (Image Data
Exploration and Analysis Software, Amnis Corporation), a mask was applied to
determine the nuclear area based on DAPI, BrdU and DRAQ5 staining (11). Using
this mask, the similarity feature was then applied to calculate the degree of
localization of PI stain to the nucleus. Cells with a high degree of similarity
between PI stain and the defined nuclear area were characterized as ‘true-positive’
PI stained cells. Cells with a low degree of similarity (PI stain largely outside of
the nuclear region) were classified as ‘false-positive’ PI stained cells. For further
357
description of ImageStream technology and analysis features, refer to Zuba-Surma
et al. (2007).
AI.2.9 Acquisition and analysis- flow cytometry
Flow cytometry data was acquired on a FACSCalibur (Becton Dickson) and
analyzed using FCS express. Debris were eliminated by gating based on FSC-H
and SSC-H parameters. Cell death was then analyzed based on the intensity of
FL1-H (AnnexinV) and FL2-H (PI). Gates were defined based on differences in
fluorescence levels between experimental and non-infected controls.
AI.2.10 Statistics
GraphPad Prism software was used to determine the significance between
control and experimental groups by paired Student’s t-test. Probability level of P <
0.05 was considered significant.
AI.3 Results
AI.3.1 Propidium iodide stains outside of the nuclear area in fixed cells.
Primary cells and cell lines were harvested, fixed and stained with DAPI,
BrdU FITC, PI and DRAQ5, using standard protocols, to compare nuclear staining
patterns (Figure AI.1). While DAPI, BrdU FITC and DRAQ5 all had a high degree
of similarity in nuclear staining patterns, PI showed a significantly broader staining
pattern that included marked staining of the cytoplasmic compartment. This pattern
of staining was verified using a Zeiss LSM 510 laser scanning confocal
358
microscope. Using this microscope, I found that the majority of cells exhibited
strong cytoplasmic staining by PI at both 40x and 63x magnification (Figure AI.1
D, E).
Since DAPI, BrdU and DRAQ5 had a high degree in similarity with respect
to nuclear staining patterns, I chose to use DRAQ5 as the nuclear stain for the
remainder of the experiments as it has been previously reported that DRAQ5
staining correlates very well with PI staining (13). Furthermore, DRAQ5 is highly
membrane permeable (14), allowing for rapid nuclear staining of both live and
dead cells (15). In contrast, BrdU only stains proliferating cells making it less
amenable for this application. Finally, DRAQ5 can be excited by either 488 nm
and 658 nm lasers (13) making it compatible with the optics of benchtop flow
cytometers and non-UV laser scanning confocal microscopes (16). In contrast,
compatibility of DAPI staining tends to be restricted by a requirement for optics
not commonly found in these systems.
Results from the ImageStream multi-spectral imaging flow cytometer and
laser scanning confocal microscope led us to classify PI stained cells as “true-
positive” or “false-positive” based on distinct staining parameters within nuclear
and cytoplasmic compartments (Figure AI.2). To ensure that false positives were
not due to a specific lot of the reagent, PI staining was compared between two
unique lots of PI purchased from Sigma-Aldrich and Molecular Probes-Invitrogen.
No difference was found in the staining patterns derived from these two PI stains.
359
AI.3.2 False positive PI staining is detected in both unfixed primary cells and
cell lines.
Propidium iodide has become a popular stain for assessing membrane
integrity, thereby aiding in studies of viability in unfixed cells. While cytoplasmic
staining of PI has been documented in fixed cells (17), this pattern of PI staining
has not been studied in unfixed cells. Since PI positivity in apoptosis / necrosis
assays is based upon nuclear DNA PI staining (18-20), false positive cytoplasmic
PI staining would greatly affect the accuracy of quantifying cell viability. Primary
cells and cells lines were harvested and stained with PI and DRAQ5 to determine
the degree of similarity between the two stains in unfixed cells. Gating on the
population of PI+/DRAQ5+ cells, I used the similarity feature to determine the
degree of similarity between PI and DRAQ5 stains in goldfish primary kidney
macrophages (Figure AI.3 A). I found that there was a sizable proportion of falsely
stained PI positive in these cells, as well as in all unfixed primary cells and cell
lines tested (Figure AI.3 B).
I examined and present data derived from cells isolated from a broad range of
animal species that span across teleost fish, avian and mammalian animal models.
The percentage of false positive PI stained cells was greater in primary cells than in
the cell lines tested, ranging from 3-40% in primary cells compared 1-3% in cells
lines (Figure AI.3 C). For primary cell preparations there were generally two
distinct cell populations, ‘small cells’ and ‘large cells’ (Figure AI.4 A). Small cells
were classified based on a nuclear: cytoplasmic ratio of greater than 0.5 while the
large cells were classified based on a nuclear: cytoplasmic ratio of less than 0.5.
360
The false PI staining was much more pronounced in cells with a nuclear:
cytoplasmic ratio less than 0.5 (Figure AI.1 B). I believe that this is associated
with a lower limit in the capacity to detect cytoplasmic PI staining in cells with
small cytoplasmic compartments, rather than an intrinsic inability of these cells to
exhibit cytoplasmic PI staining.
AI.3.3 RNase removes false positive staining but only in fixed cells.
Previous work using microscopy has shown that RNase treatment in fixed
cells prior to PI staining greatly reduces cytoplasmic PI staining (17). To determine
the effect that RNase treatment had on false PI staining for unfixed cells, cells were
treated for 15 minutes at 37oC with 50 μg/mL (4U) DNase-free RNase A. RNase A
was added prior to PI staining. In all primary cells and cell lines tested, RNase
treatment had no significant effect on the percentage of false positive PI events
(Figure AI.5 A). Furthermore, morphological examination showed that RNase
treatment on unfixed cells did not decrease the intensity of the false cytoplasmic
stain (Figure AI.5 B). However, when cells were fixed prior to RNase treatment,
the percentage of false positive PI events was significantly reduced (Figure AI.5
C). It is likely that the increased membrane permeabilization that results from
fixation allows RNase to pass through the cell membrane thereby increasing its
capacity to target cytoplasmic RNA.
AI.3.4 Modified Annexin V/PI protocol significantly reduces the number of
false positive PI events.
361
Annexin V and PI are commonly used stains to determine cell viability as
they allow discrimination between live, apoptotic, and necrotic cells (3). However,
current Annexin V/PI protocols fail to remove false positive PI staining associated
with RNA staining in the cytoplasmic compartment. This presents a particularly
relevant problem for flow cytometry applications, which unlike ImageStream and
microscopy-based assays lack the spatial resolution to discriminate between
different subcellular compartments. This results in a significant overestimation of
the number of PI positive events, and thus late apoptotic and necrotic events. I
therefore propose a modification to the current Annexin V/PI protocol. Following
staining with Annexin V and PI as described previously (2), cells are fixed with 1%
formaldehyde to 10 minutes on ice. This fixation protocol increases plasma
membrane permeability thereby promoting RNase A entry. This step, however,
must be completed after staining and thorough removal of excess stain to prevent
entry of unbound stain into cells. Following fixation, cells are treated with DNase-
free RNase A for 15 minutes at 37oC. I found that this combination of incubation
time and temperature optimally removes false positive staining across the broad
range of primary cells and cell lines observed in this study. Results using this
modified protocol are shown for representative cell types in Figure AI.6 A.
Importantly, this modified protocol has no adverse effect on Annexin V staining or
nuclear PI staining (Figure AI.6 B, C). Inclusion of these steps in conventional
Annexin V /PI staining protocols results in significant reduction of false positive
events and greatly improves the accuracy of cell death measurements.
362
AI.3.5 Virus infection increases dsRNA content in cells and is detected as cell
death
I have shown here that false positive propidium iodide staining occurs in
resting cells from species as diverse as mice and teleost fish. Since false positive PI
staining is due to RNA, I hypothesized that the number of false positive events
would be further exacerbated in cells that undergo increased RNA production. This
could potentially compromise conclusions stemming from any cellular system
where levels of RNA change at the time of analysis. Virally infected cells represent
a common biological system in which apoptosis is studied and in which cellular
RNA content is increased due to viral replication. To study the effects of
replicative viral infection on the detection of true cell death, Vero cells were
infected with an RNA virus, vesicular stomatitis virus (VSV) or a DNA virus,
herpes simplex virus type-1 (HSV-1). Cell death was then assayed using the
conventional (-RNase) and modified (+RNase) Annexin V/PI protocols. Results
using the conventional AnnexinV/PI protocol indicated that infection with either
VSV or HSV-1 led to an increase in cellular death. Other authors have speculated
that this may represent an effective host defense mechanism designed to slow down
viral spread by decreasing the number of cells that can yield de novo viral particles
(21, 22). However, my results indicate that viral infection leads to a high
percentage of false positive PI events in these cells, and that this is associated with
PI-mediated staining of cytoplasmic viral RNA (Figure AI.6 D). The levels were
highest at 6 hours, the time with the highest levels of viral replication. The
percentage of cytoplasmic PI staining was greatly reduced with the modified
363
(+RNase) protocol. Overall, these results support an alternative conclusion: during
the initial phase of infection viruses overcome existing host defenses, and
effectively increase cytoplasmic RNA that likely serves as a platform for de novo
production of infectious viral particles. Further, viral infection does not lead to
induction of cellular death.
AI.3.6 Modified protocol allows multivariate dissection of cellular processes.
Current Annexin V/ PI protocols require that cells be analyzed shortly after
staining because the cells are unfixed. With this modified Annexin V/ PI protocol,
cells can be stored at 40C for up to 7 days and can also be stained with various
intracellular markers, allowing further dissection of cellular processes during death.
This opens the door for multivariate analysis of cellular processes (Figure AI.7).
RAW cells were stained with the modified Annexin V/ PI protocol following two-
hour stimulation with 250 ng/mL E. coli LPS (Invitrogen). After fixation and
RNase treatment, cells were permeabilized and stained with NF-κB to examine the
state of activation in live, early apoptotic, late apoptotic and necrotic cells, as
measured by the degree of NF-κB translocation. I have found that the subsequent
staining steps have no impact on Annexin V and PI staining as the percent gated
cells in each quadrant does not significantly change following permeabilization and
NF-κB staining. Adding this extra dimension to current Annexin V/ PI apoptosis
assays will enable comprehensive analysis of live, early apoptotic, late apoptotic
and necrotic cell individual populations previous limited to whole cell populations.
364
AI.4 Discussion
Propidium iodide is one of the most commonly used dyes for the quantitative
assessment of DNA content and for determination of cell viability (23). In this
appendix, I have shown that PI staining results in a sizable proportion of false
positive events- up to 40%- in both primary cells and cell lines. The percent of
false positive events were particularly prominent in primary cells. While RNase
treatment significantly decreased the degree of false positive staining in fixed cells,
it had no effect on false positive staining in unfixed cells. Thus, it required
modification of conventional Annexin V/PI staining protocols and optimization of
the methodology to ensure that it will be amenable to a broad range of cell types
and several animal models currently used in the field today. Further, removal of PI
false positive staining needed to maintain integrity of the parallel Annexin V stain.
To achieve this I determined the optimal concentration of RNase, incubation time
and temperature to maximally remove false positive PI staining with no effect on
Annexin V staining. Finally, I applied this modified protocol to study apoptosis in
a system with high levels of RNA- virally infected cells. I have shown here that, in
virally infected cells, RNase treatment significantly reduces levels of cytoplasmic
PI staining, indicating that in the absence of RNase treatment, PI staining is due to
virally produced RNA and not cell death.
The nucleic acid composition of cells typically consists of DNA, ssRNA and
dsRNA. PI has been shown to intercalate into double-stranded regions of helical
nucleic acids, which includes both DNA and dsRNA (6). While most studies have
focused on the DNA binding properties of PI, some studies have exploited the
365
binding capacity of PI to study dsRNA content in DNase-treated cells (24). These
studies have shown that, under basal conditions, cells normally have low dsRNA
content, with bone marrow primary cells and certain neoplastic cell lines (HeLa,
L1210, HL60, ARH-77) generally having higher dsRNA content compared to other
primary/ non-neoplastic cells (24, 25). This would lead to differential false
positives across different cell types, consistent with results presented in this
manuscript. Based on these studies it is likely that the majority of false positive
events are resulting from cytoplasmic staining of dsRNA. Importantly, cellular
activation and proliferation led to an increase in dsRNA abundance within the
cytoplasmic compartment (24-26). As such, it is likely that false positive events are
more prominent in activated and/or cycling cells, thus falsely increasing the
relative gap in cell death events between activated and non-activated groups.
False positive, cytoplasmic PI staining has been previously documented by
confocal microscopy on ethanol fixed tissue sections (17, 27). In the absence of
RNase treatment, both the cytoplasm and nucleus stained with PI (17, 27). This has
likely been overlooked in assays with unfixed cells as cytoplasmic PI staining was
thought to occur only in fixed cells (28). The assumption that unfixed cells would
not exhibit false positive cytoplasmic staining was supported by early flow
cytometry data showing that RNase treatment of unfixed cells has no effect on the
intensity of PI staining (7). However, as I have shown here, this observation was
not due to a lack of false positive staining but, instead, because RNase is unable to
cross the membrane of unfixed cells. Based on my work, it is clear that cytoplasmic
RNA staining does occur in conventional Annexin V/PI staining protocols.
366
However, cells must be fixed prior to RNase treatment in order for RNase to pass
through the membrane and degrade cytoplasmic RNA. For those studies
employing conventional Annexin V/PI staining protocols, failure to remove
cytoplasmic RNA has likely led to varying degrees of false positives, depending on
the cell model used, and an overestimation of late apoptotic and/or necrotic events.
More critically, my findings have important ramifications for studies that examine
events in cellular models experiencing changes in RNA content. As I have shown,
virally infected cells, for example, are qualified as undergoing cellular death in
response to infection when conventional Annexin V/PI staining protocols are used;
in fact, these cells are alive and actively producing viral dsRNA that can serve to
produce additional infectious viral particles.
Importantly, these ramifications go beyond the viral infection example that I
describe, and would be relevant to any cellular system where changes in RNA,
especially dsRNA, occur during examination of cellular death events. Among
others, these include cells undergoing genotoxic stress (29, 30), cells treated with
cell cycle arrest drugs such as thymidine or hydroxyurea (25, 31), neoplastic tissue
(31) or studies on embryonic cells where developmental progression is
characterized by discrete changes in cellular RNA synthesis (32). The potential
impact of this is shown in a recent study by Mansilla et al (2006). In this study,
breast cancer cell lines were treated with two cell cycle arrest drugs and cell death
was assayed with a conventional AnnexinV/PI assay and by caspase activation. It
was concluded that the drugs induced necrotic type cell despite identification of
caspase induction, which is generally associated with apoptosis (33). It is possible
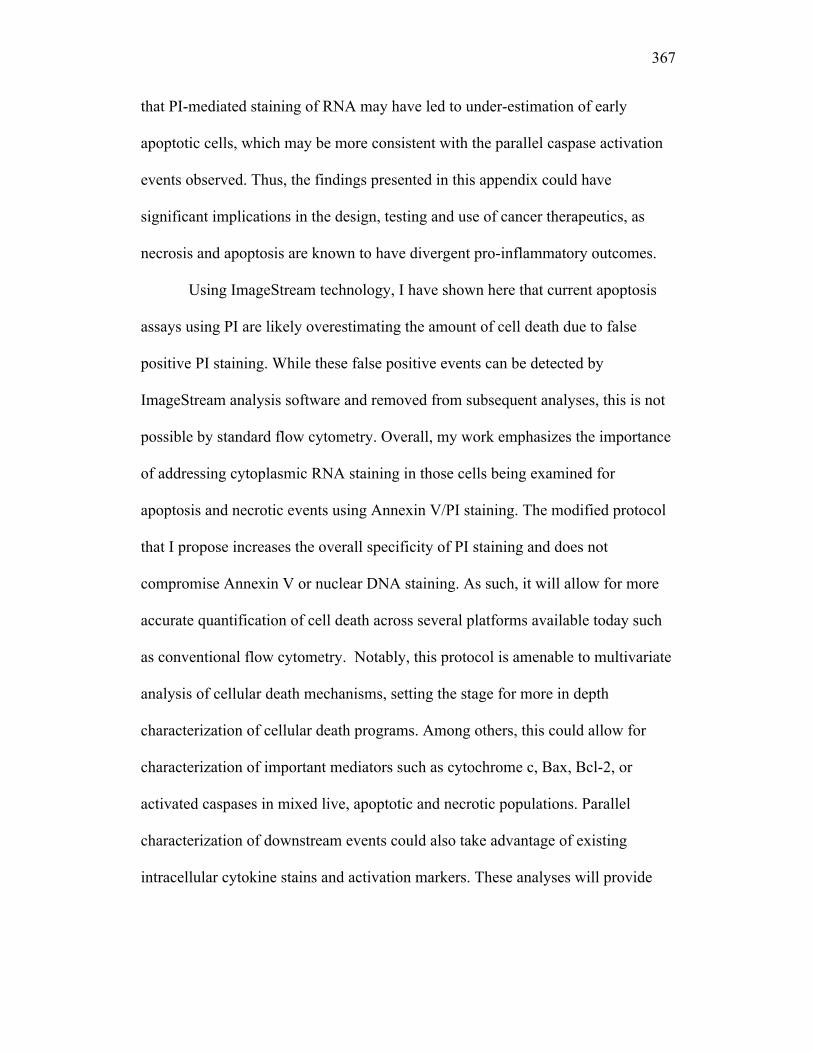
367
that PI-mediated staining of RNA may have led to under-estimation of early
apoptotic cells, which may be more consistent with the parallel caspase activation
events observed. Thus, the findings presented in this appendix could have
significant implications in the design, testing and use of cancer therapeutics, as
necrosis and apoptosis are known to have divergent pro-inflammatory outcomes.
Using ImageStream technology, I have shown here that current apoptosis
assays using PI are likely overestimating the amount of cell death due to false
positive PI staining. While these false positive events can be detected by
ImageStream analysis software and removed from subsequent analyses, this is not
possible by standard flow cytometry. Overall, my work emphasizes the importance
of addressing cytoplasmic RNA staining in those cells being examined for
apoptosis and necrotic events using Annexin V/PI staining. The modified protocol
that I propose increases the overall specificity of PI staining and does not
compromise Annexin V or nuclear DNA staining. As such, it will allow for more
accurate quantification of cell death across several platforms available today such
as conventional flow cytometry. Notably, this protocol is amenable to multivariate
analysis of cellular death mechanisms, setting the stage for more in depth
characterization of cellular death programs. Among others, this could allow for
characterization of important mediators such as cytochrome c, Bax, Bcl-2, or
activated caspases in mixed live, apoptotic and necrotic populations. Parallel
characterization of downstream events could also take advantage of existing
intracellular cytokine stains and activation markers. These analyses will provide
368
detailed information in particular populations of cells and will open avenues for
comprehensive analysis of mechanisms of cell death.
AI.5 Protocol
This procedure can be performed in 500 μL siliconized tubes or 6 mL polystyrene
round-bottom FACS tubes. The latter is normally used when carrying out viability
analysis in conjunction with other procedures. All volumes given are for 6 mL
polystyrene round-bottom FACS tubes. For 500 μL siliconized tubes, reduce all
volumes by 1/5.
The optimum concentration for flow cytometry analysis is 2-4 x 10⁶ cells per 200
μL volume. Cell loss may result from this procedure and thus we recommend that
each sample consist of 4 x 10⁶ cells at the start of the procedure.
1. Cell Preparation
1. Harvest cells - refer to specific procedures for corresponding cell lines or
primary cell isolations.
2. Centrifuge samples at 311 x g for 10 minutes at 4oC and decant the
supernatant.
3. Resuspend cells in 2 mL 1 x phosphate buffered saline (PBS) -/- (no
calcium, no magnesium).
4. Centrifuge samples at 311 x g for 10 minutes at 4oC and decant the
supernatant.
5. Resuspend cells in 1 mL 1 x Annexin V binding buffer.

369
6. Centrifuge samples at 311 x g for 10 minutes at 4oC and decant the
supernatant.
7. Resuspend cells in 100 μL 1 x Annexin V binding buffer.
2. Application of Annexin V/ PI Stain
1. Add Annexin V according to the manufacturer's recommendations [e.g. 5
μL Annexin V Alexa Fluor 488 (Molecular Probes, A13201)].
2. Incubate tubes in the dark for 15 minutes at room temperature.
3. Add 100 μL of 1 x Annexin V binding buffer to each reaction tube. There
should be approximately 200 μL in each tube.
4. Add 4 μL of PI (Sigma, Cat# P-4864-10ML) that has been diluted 1:10 in 1
x Annexin V binding buffer (i.e. 1 μL PI with 9 μL 1 x Annexin V binding
buffer). This will yield a final PI concentration of 2 μg/mL in each sample.
5. Incubate tubes in the dark for 15 minutes at room temperature.
6. Add 500 μL 1 x Annexin V binding buffer to wash the cells.
7. Centrifuge samples at 311 x g for 10 minutes at 4oC and decant the
supernatant.
8. Resuspend cells in 500 μL 1 x Annexin V binding buffer and 500 μL 2%
formaldehyde to create a 1% formaldehyde (fixative) solution. Mix tubes
by gentle flicking.
9. Fix samples on ice for 10 minutes. Alternatively, samples can be stored
overnight at 4°C in the dark. If the latter method is chosen, make sure to be
370
consistent across all tubes labeled with Annexin V/PI (including
compensation controls).
10. Add 1 mL 1 x PBS-/- to each sample and mix gently by flicking.
11. Centrifuge tubes at 393 x g for 10 minutes at 4oC and decant the
supernatant.
12. Repeat steps 2.10 and 2.11.
13. Resuspend pellet by flicking the tube.
14. Add 16 μL of 1:100 diluted RNase A (Sigma, R4642) to give a final
concentration of 50 μg/mL. Incubate for 15 min at 37°C.
15. Add 1 mL 1 x PBS-/- and mix gently by flicking.
16. Centrifuge tubes at 393 x g for 10 minutes at 4oC.
17. Samples are now ready to be analyzed. Alternatively, samples can be used
for subsequent staining steps if Annexin/PI staining is being performed in
parallel with other procedures.
371
Bright field DAPI DRAQ5 Overlay (BrdU/PI) BrdU FITC PI C
Bright field DAPI DRAQ5 Overlay B
Similarity
Nor
mal
ized
freq
uenc
y A
2
4
6
0-4 -2 0 2 4 6
Bright field DAPI PI D Bright field DAPI PI E
372
Figure AI.1. Propidium iodide stains outside of the nuclear area. (A-C) RAW cells were stained with DAPI, BrdU FITC, PI and DRAQ5 in order to compare nuclear staining patterns and imagery was acquired using an ImageStream multi-spectral flow cytometer. All imagery was collected using 40X magnification. Two independent experiments examined 10,000 cells. (A) Using the similarity feature (refer to Materials and Methods for description of analysis), the degree of similarity between nuclear stains was determined. Purple line: similarity between DAPI and DRAQ5; green line: similarity between DAPI and BrdU FITC; red histogram: similarity between DAPI and PI. The low similarity between DAPI and PI indicates that PI stains the cytoplasm as well as the nucleus. (B) Representative images showing the high degree of similarity between DAPI and DRAQ5. (C) Representative images showing the low degree of similarity between PI and other nuclear stains. (D, E) RAW cells (n=2) were stained with DAPI and PI and imaged using a Zeiss LSM 510 laser scanning confocal microscope to examine correlation with ImageStream results. Images were acquired at 40x/1.3 (F-Fluar lens) (D) and 63x/1.4 (Plan Apochromat lens) (E). Images were acquired at room temperature in Fluoromount G imaging media (Southern Biotech) with a Zeiss LSM510 camera. Data was acquired and analyzed using Zen software. Propidium iodide staining was detectable in the cytoplasm at both levels of magnification.
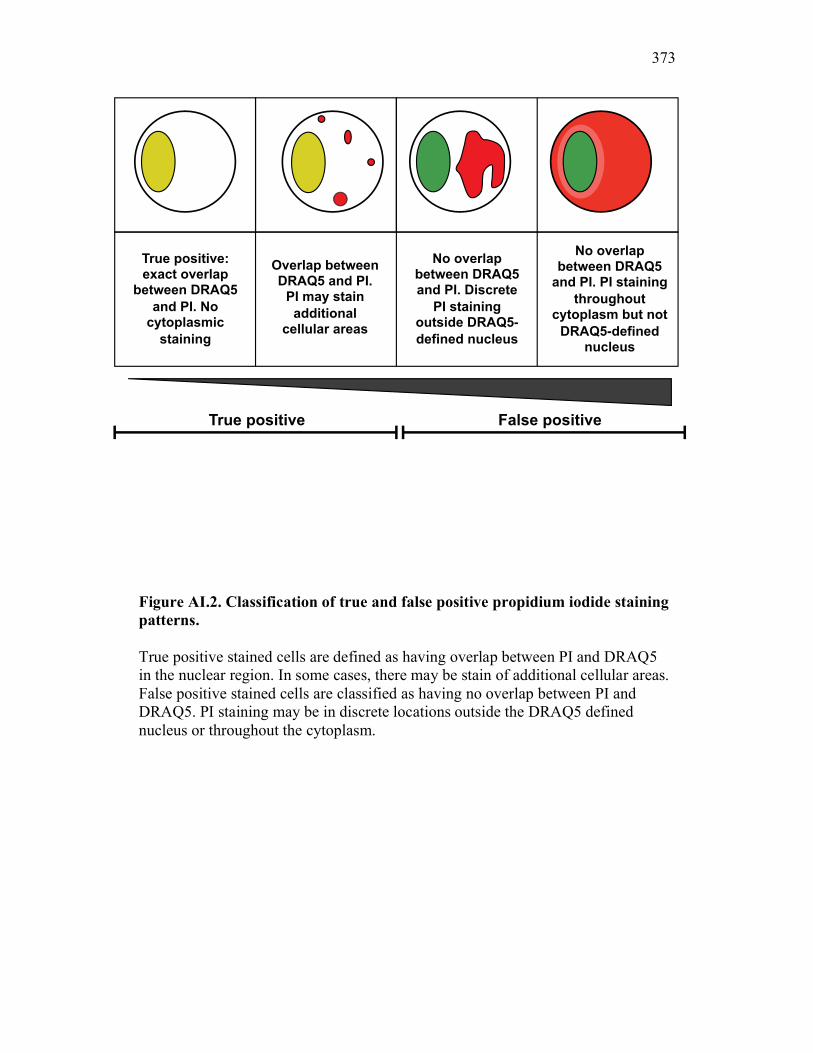
373
True positive False positive
True positive: exact overlap
between DRAQ5 and PI. No
cytoplasmic staining
Overlap between DRAQ5 and PI.
PI may stain additional
cellular areas
No overlap between DRAQ5 and PI. Discrete
PI staining outside DRAQ5-defined nucleus
No overlap between DRAQ5
and PI. PI staining throughout
cytoplasm but not DRAQ5-defined
nucleus
Figure AI.2. Classification of true and false positive propidium iodide staining patterns. True positive stained cells are defined as having overlap between PI and DRAQ5 in the nuclear region. In some cases, there may be stain of additional cellular areas. False positive stained cells are classified as having no overlap between PI and DRAQ5. PI staining may be in discrete locations outside the DRAQ5 defined nucleus or throughout the cytoplasm.
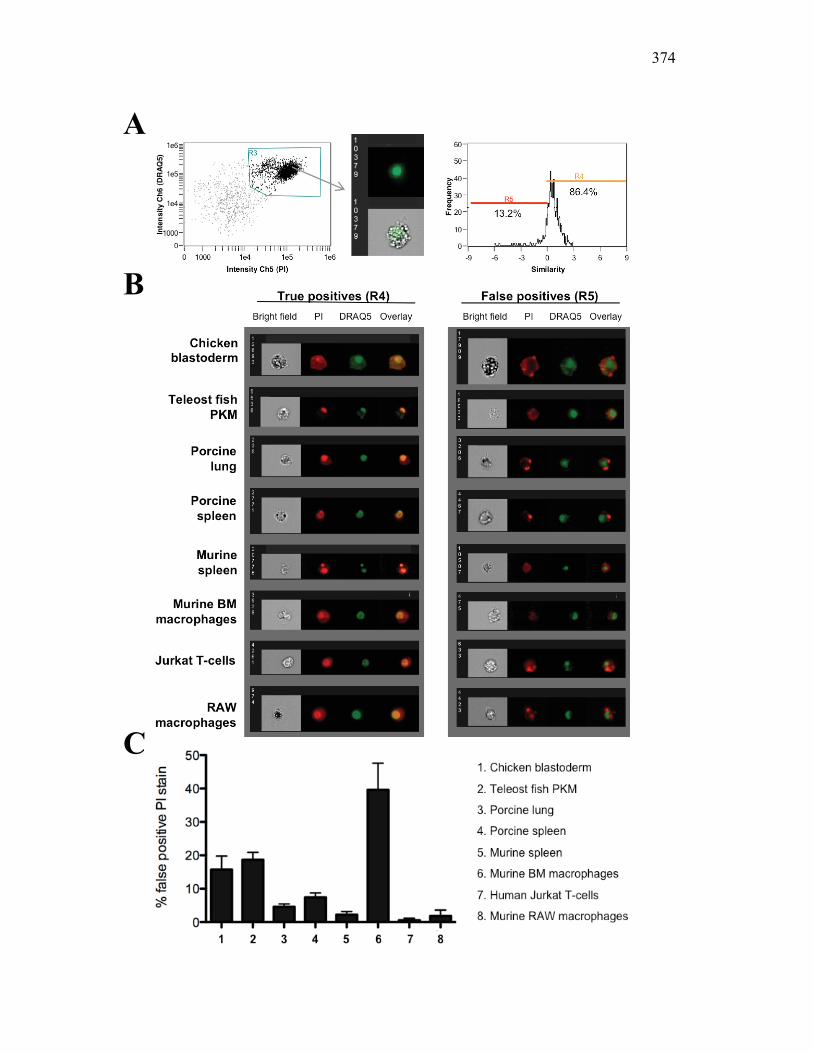
374
A
B
C
375
Figure AI.3. Primary cells and cell lines exhibit false-positive PI staining. Primary cells and cell lines were harvested and stained with propidium iodide and DRAQ5. Primary cells included chicken blastodermal cells, goldfish primary kidney macrophages (PKM), porcine lung macrophages, porcine spleen macrophages murine splenocytes and bone marrow (BM) macrophages. Cell lines included human Jurkat T-cells and murine RAW macrophages. Imagery was acquired by an ImageStream multi-spectral imaging flow cytometer. (A) Representative analysis shows procedure for classification of primary kidney macrophage cells into true positive (R4) and false positive (R5) populations. Using a mask that highlighted the nuclear area, based on the pixel intensity of the DRAQ5 stain (refer to Materials and Methods for description of masking strategy), the degree of colocalization between DRAQ5 and PI was determined. (B) All cell types tested exhibited false positive PI staining to varying degrees. To allow for easier visual determination of PI and DRAQ5 colocalization, the DRAQ5 stain was given a green pseudocolour. Areas where PI and DRAQ5 colocalize appear yellow. Cells with a high degree of colocalization were characterized as true positive. Cells with a low degree of colocalization were characterized as false positive. Chicken blastodermal cells, n=5; goldfish PKM, n=3; porcine lung and spleen macrophages, n=3; murine splenocytes and bone marrow (BM) macrophages, n=2; Jurkat T-cells, n=3; RAW macrophages, n=3; error bars show SEM.
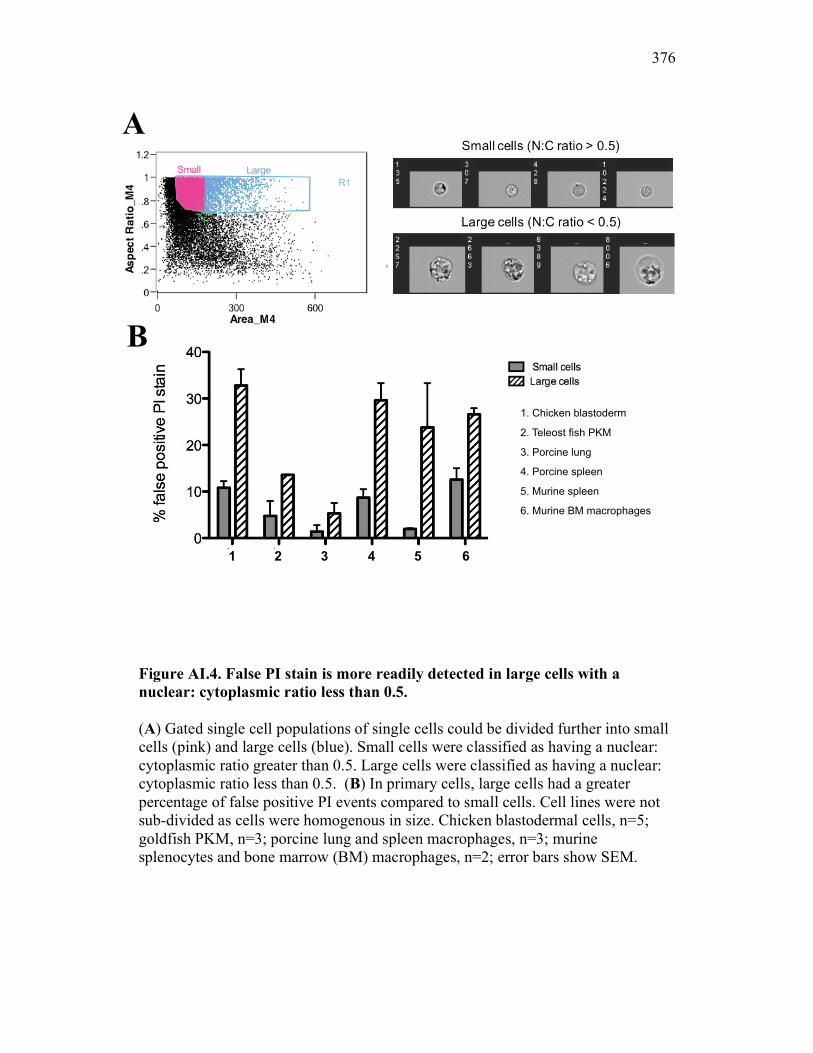
376
1. Chicken blastoderm
5. Murine spleen
3. Porcine lung
4. Porcine spleen
6. Murine BM macrophages
2. Teleost fish PKM
1 2 3 4 5 6
A
B
Figure AI.4. False PI stain is more readily detected in large cells with a nuclear: cytoplasmic ratio less than 0.5. (A) Gated single cell populations of single cells could be divided further into small cells (pink) and large cells (blue). Small cells were classified as having a nuclear: cytoplasmic ratio greater than 0.5. Large cells were classified as having a nuclear: cytoplasmic ratio less than 0.5. (B) In primary cells, large cells had a greater percentage of false positive PI events compared to small cells. Cell lines were not sub-divided as cells were homogenous in size. Chicken blastodermal cells, n=5; goldfish PKM, n=3; porcine lung and spleen macrophages, n=3; murine splenocytes and bone marrow (BM) macrophages, n=2; error bars show SEM.
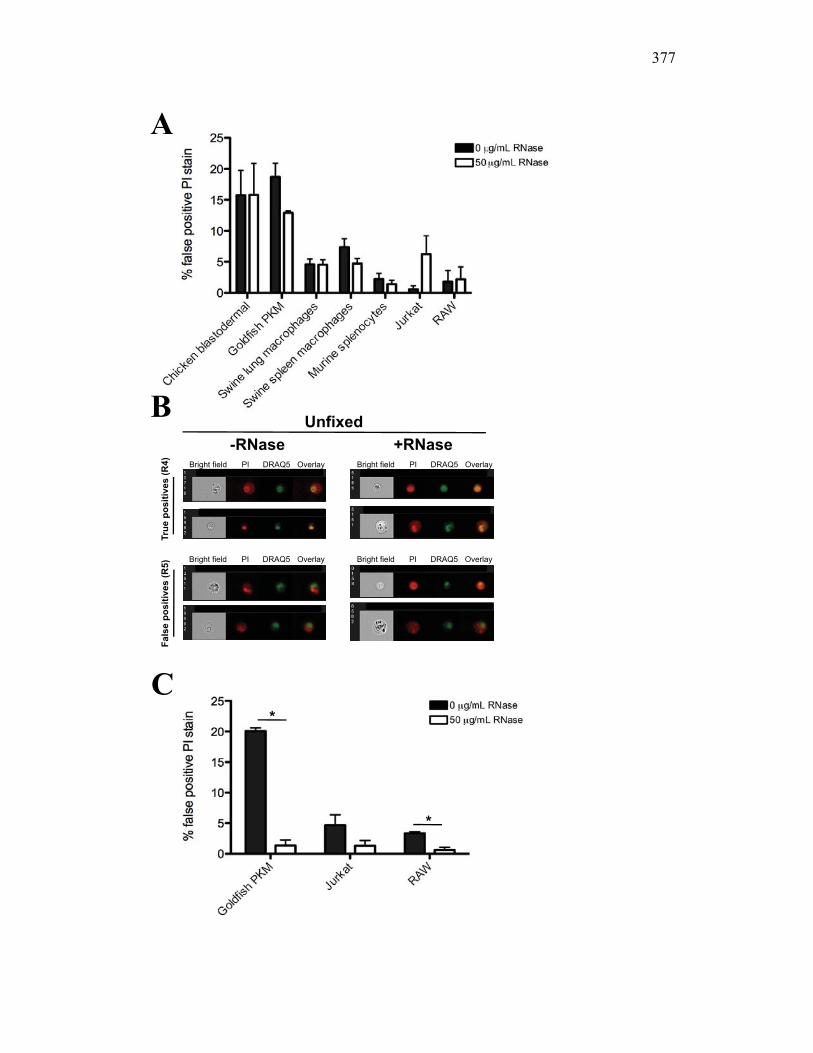
377
A
B
C
-RNase +RNase
True
pos
itive
s (R
4)
Fals
e po
sitiv
es (R
5)
Unfixed
Bright field PI DRAQ5 Overlay Bright field PI DRAQ5 Overlay
Bright field PI DRAQ5 Overlay Bright field PI DRAQ5 Overlay
*
*
378
Figure AI.5. RNase treatment decreases false positive PI stain on fixed cells but not in unfixed cells. (A) Chicken blastodermal cells, goldfish primary kidney macrophages (PKM), murine splenocytes, porcine lung macrophages, porcine spleen macrophages, Jurkat T-cells and RAW macrophages were harvested and treated +/- 50 μg/mL DNase-free RNase for 15 minutes prior to propidium iodide and DRAQ5 staining. Imagery was acquired by an ImageStream multi-spectral imaging flow cytometer equipped with 488nm and 658nm lasers. The percentage of true- and false-positive PI events was calculated by determining the degree of colocalization between DRAQ5 and PI. RNase treatment did not decrease the percentage of false positive PI stains in unfixed cells. Chicken blastoderm, n=4; goldfish PKM, n=3; murine splenocytes, n=2; porcine lung and spleen macrophages, n=3; Jurkat T-cells, n=3; RAW macrophages, n=3; error bars show SEM. (B) Representative figures from fixed and unfixed goldfish primary kidney macrophage cells treated +/- 50 μg/mL DNase-free RNase for 15 minutes prior to PI and DRAQ5 staining. (C) Unfixed cells continue to stain non-nuclear areas following RNase treatment. In contrast, RNase treatment of fixed cells removes cytoplasmic RNA staining. Goldfish primary kidney macrophages (PKM), Jurkat T-cells and RAW macrophage cells were harvested and fixed with 1% formaldehyde. Cells were then washed and treated +/- 50 μg/mL DNase-free RNase for 15 minutes prior to PI and DRAQ5 staining. Imagery was acquired by an ImageStream multi-spectral imaging flow cytometer. The percentage of true- and false-positive PI events was calculated by determining the degree of colocalization between DRAQ5 and PI. RNase treatment significantly decreased the percentage of false positive PI stains in goldfish PKM and RAW. n=2, *p<0.05; error bars show SEM.
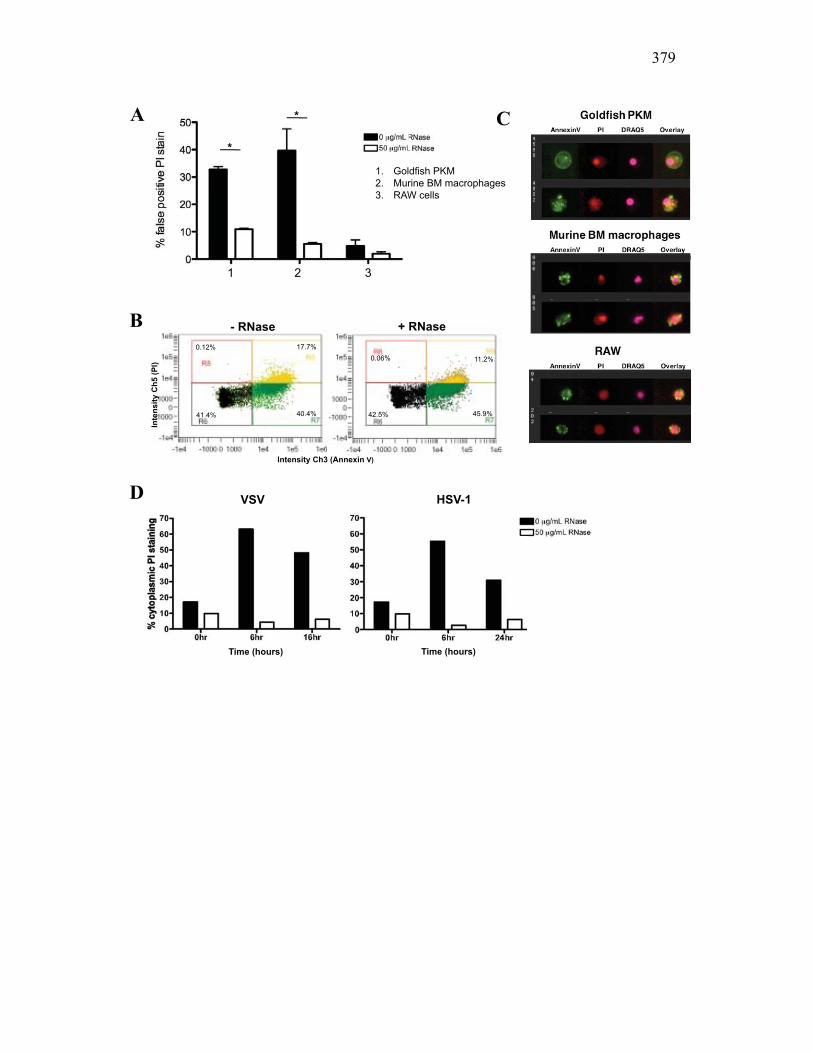
379
VSV HSV-1
C *
* A
B
Inte
nsity
Ch5
(PI)
- RNase
41.4%
0.12% 17.7%
40.4%
Intensity Ch3 (Annexin V)
+ RNase
42.5%
0.06% 11.2%
45.9%
D
1 2 3
1. Goldfish PKM 2. Murine BM macrophages 3. RAW cells
Time (hours) Time (hours)
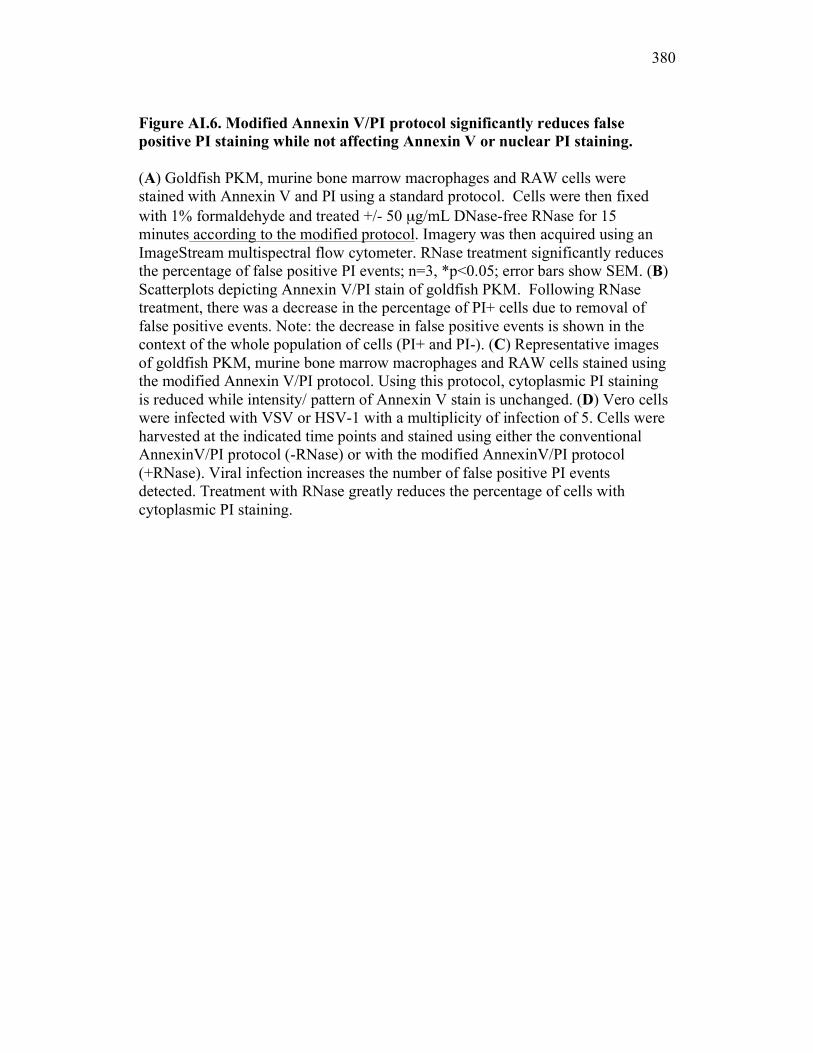
380
Figure AI.6. Modified Annexin V/PI protocol significantly reduces false positive PI staining while not affecting Annexin V or nuclear PI staining. (A) Goldfish PKM, murine bone marrow macrophages and RAW cells were stained with Annexin V and PI using a standard protocol. Cells were then fixed with 1% formaldehyde and treated +/- 50 μg/mL DNase-free RNase for 15 minutes according to the modified protocol. Imagery was then acquired using an ImageStream multispectral flow cytometer. RNase treatment significantly reduces the percentage of false positive PI events; n=3, *p<0.05; error bars show SEM. (B) Scatterplots depicting Annexin V/PI stain of goldfish PKM. Following RNase treatment, there was a decrease in the percentage of PI+ cells due to removal of false positive events. Note: the decrease in false positive events is shown in the context of the whole population of cells (PI+ and PI-). (C) Representative images of goldfish PKM, murine bone marrow macrophages and RAW cells stained using the modified Annexin V/PI protocol. Using this protocol, cytoplasmic PI staining is reduced while intensity/ pattern of Annexin V stain is unchanged. (D) Vero cells were infected with VSV or HSV-1 with a multiplicity of infection of 5. Cells were harvested at the indicated time points and stained using either the conventional AnnexinV/PI protocol (-RNase) or with the modified AnnexinV/PI protocol (+RNase). Viral infection increases the number of false positive PI events detected. Treatment with RNase greatly reduces the percentage of cells with cytoplasmic PI staining.
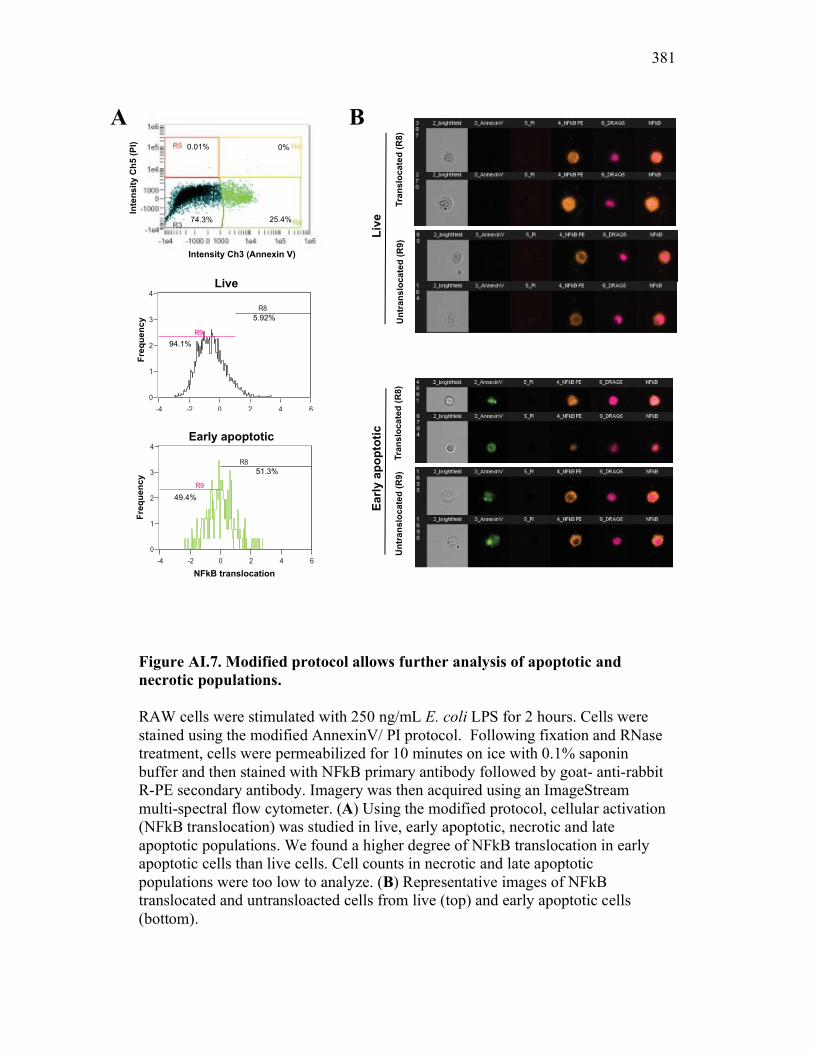
381
-4 -2 0 2 4 6
0
1
2
3
4
R8
R9
-4 -2 0 2 4 6
0
1
2
3
4
R8
R9
Freq
uenc
y
Intensity Ch3 (Annexin V)
Inte
nsity
Ch5
(PI)
Live
Unt
rans
loca
ted
(R9)
Tr
ansl
ocat
ed (R
8)
NFkB translocation
Early apoptotic
Freq
uenc
y
Unt
rans
loca
ted
(R9)
Tr
ansl
ocat
ed (R
8)
Live
Ea
rly a
popt
otic
A B
5.92%
94.1%
51.3%
49.4%
74.3% 25.4%
0.01% 0%
Figure AI.7. Modified protocol allows further analysis of apoptotic and necrotic populations. RAW cells were stimulated with 250 ng/mL E. coli LPS for 2 hours. Cells were stained using the modified AnnexinV/ PI protocol. Following fixation and RNase treatment, cells were permeabilized for 10 minutes on ice with 0.1% saponin buffer and then stained with NFkB primary antibody followed by goat- anti-rabbit R-PE secondary antibody. Imagery was then acquired using an ImageStream multi-spectral flow cytometer. (A) Using the modified protocol, cellular activation (NFkB translocation) was studied in live, early apoptotic, necrotic and late apoptotic populations. We found a higher degree of NFkB translocation in early apoptotic cells than live cells. Cell counts in necrotic and late apoptotic populations were too low to analyze. (B) Representative images of NFkB translocated and untransloacted cells from live (top) and early apoptotic cells (bottom).
382
AI.6 References
1. Vermes, I., Haanen, C., and Reutelingsperger, C. 2000. Flow cytometry of apoptotic cell death. J Immunol Methods 243:167-190.
2. Vermes, I., Haanen, C., Steffens-Nakken, H., and Reutelingsperger, C. 1995. A novel assay for apoptosis. Flow cytometric detection of phosphatidylserine expression on early apoptotic cells using fluorescein labelled Annexin V. J Immunol Methods 184:39-51.
3. Darzynkiewicz, Z., Bruno, S., Del Bino, G., Gorczyca, W., Hotz, M.A., Lassota, P., and Traganos, F. 1992. Features of apoptotic cells measured by flow cytometry. Cytometry 13:795-808.
4. Faleiro, L., and Lazebnik, Y. 2000. Caspases disrupt the nuclear-cytoplasmic barrier. J Cell Biol 151:951-959.
5. Kroemer, G., Dallaporta, B., and Resche-Rigon, M. 1998. The mitochondrial death/life regulator in apoptosis and necrosis. Annu Rev Physiol 60:619-642.
6. Deitch, A.D., Law, H., and deVere White, R. 1982. A stable propidium iodide staining procedure for flow cytometry. J Histochem Cytochem 30:967-972.
7. Fried, J., Perez, A.G., and Clarkson, B.D. 1976. Flow cytofluorometric analysis of cell cycle distributions using propidium iodide. Properties of the method and mathematical analysis of the data. J Cell Biol 71:172-181.
8. http://apps.isiknowledge.com/summary.do?qid=17&product=UA&SID=3EdJcO897oK2Gfd6EH4&search_mode=Refine. 2009. Web of Knowledge search.
9. Muppidi, J., Porter, M., and Siegel, R.M. 2004. Measurement of apoptosis and other forms of cell death. Curr Protoc Immunol Chapter 3:Unit 3 17.
10. Zuba-Surma, E.K., Kucia, M., Abdel-Latif, A., Lillard, J.W., Jr., and Ratajczak, M.Z. 2007. The ImageStream System: a key step to a new era in imaging. Folia Histochem Cytobiol 45:279-290.
11. Henery, S., George, T., Hall, B., Basiji, D., Ortyn, W., and Morrissey, P. 2008. Quantitative image based apoptotic index measurement using multispectral imaging flow cytometry: a comparison with standard photometric methods. Apoptosis 13:1054-1063.
12. Barreda, D.R., Hanington, P.C., Stafford, J.L., and Belosevic, M. 2005. A novel soluble form of the CSF-1 receptor inhibits proliferation of self-renewing macrophages of goldfish (Carassius auratus L.). Dev Comp Immunol 29:879-894.
13. Yuan, C.M., Douglas-Nikitin, V.K., Ahrens, K.P., Luchetta, G.R., Braylan, R.C., and Yang, L. 2004. DRAQ5-based DNA content analysis of hematolymphoid cell subpopulations discriminated by surface antigens and light scatter properties. Cytometry B Clin Cytom 58:47-52.
14. Smith, P.J., Wiltshire, M., Davies, S., Patterson, L.H., and Hoy, T. 1999. A novel cell permeant and far red-fluorescing DNA probe, DRAQ5, for blood cell discrimination by flow cytometry. J Immunol Methods 229:131-139.
383
15. Martin, R.M., Leonhardt, H., and Cardoso, M.C. 2005. DNA labeling in living cells. Cytometry A 67:45-52.
16. Smith, P.J., Blunt, N., Wiltshire, M., Hoy, T., Teesdale-Spittle, P., Craven, M.R., Watson, J.V., Amos, W.B., Errington, R.J., and Patterson, L.H. 2000. Characteristics of a novel deep red/infrared fluorescent cell-permeant DNA probe, DRAQ5, in intact human cells analyzed by flow cytometry, confocal and multiphoton microscopy. Cytometry 40:280-291.
17. Suzuki, T., Fujikura, K., Higashiyama, T., and Takata, K. 1997. DNA staining for fluorescence and laser confocal microscopy. J Histochem Cytochem 45:49-53.
18. Overbeeke, R., Steffens-Nakken, H., Vermes, I., Reutelingsperger, C., and Haanen, C. 1998. Early features of apoptosis detected by four different flow cytometry assays. Apoptosis 3:115-121.
19. Bryson, G.J., Harmon, B.V., and Collins, R.J. 1994. A flow cytometric study of cell death: failure of some models to correlate with morphological assessment. Immunol Cell Biol 72:35-41.
20. Ormerod, M.G., Sun, X.M., Snowden, R.T., Davies, R., Fearnhead, H., and Cohen, G.M. 1993. Increased membrane permeability of apoptotic thymocytes: a flow cytometric study. Cytometry 14:595-602.
21. Everett, H., and McFadden, G. 1999. Apoptosis: an innate immune response to virus infection. Trends Microbiol 7:160-165.
22. O'Brien, V. 1998. Viruses and apoptosis. J Gen Virol 79 ( Pt 8):1833-1845. 23. Riccardi, C., and Nicoletti, I. 2006. Analysis of apoptosis by propidium
iodide staining and flow cytometry. Nat Protoc 1:1458-1461. 24. Frankfurt, O.S. 1980. Flow cytometric analysis of double-stranded RNA
content distributions. J Histochem Cytochem 28:663-669. 25. Frankfurt, O.S. 1981. Unbalanced growth and cell death in HeLa S3
cultures treated with DNA synthesis inhibitors. J Cell Physiol 107:115-122. 26. Smolewski, P., Grabarek, J., Halicka, H.D., and Darzynkiewicz, Z. 2002.
Assay of caspase activation in situ combined with probing plasma membrane integrity to detect three distinct stages of apoptosis. J Immunol Methods 265:111-121.
27. Matsuzaki, T., Suzuki, T., Fujikura, K. and Takata, K. 1997. Nuclear staining for laser confocal microscopy. Acta Histochemica et Cytochemica 30:309-314.
28. Invitrogen. 2006. Propidium Iodide Nucleic Acid Stain Product Data Sheet.1-5.
29. Bottger, S., Jerszyk, E., Low, B., and Walker, C. 2008. Genotoxic stress-induced expression of p53 and apoptosis in leukemic clam hemocytes with cytoplasmically sequestered p53. Cancer Res 68:777-782.
30. Catalano, A., Caprari, P., Soddu, S., Procopio, A., and Romano, M. 2004. 5-lipoxygenase antagonizes genotoxic stress-induced apoptosis by altering p53 nuclear trafficking. FASEB J 18:1740-1742.
31. Hartwell, L.H., and Kastan, M.B. 1994. Cell cycle control and cancer. Science 266:1821-1828.

384
32. Bernstein, R.M., and Mukherjee, B.B. 1972. Control of nuclear RNA synthesis in 2-cell and 4-cell mouse embryos. Nature 238:457-459.
33. Budihardjo, I., Oliver, H., Lutter, M., Luo, X., and Wang, X. 1999. Biochemical pathways of caspase activation during apoptosis. Annu Rev Cell Dev Biol 15:269-290.
385
Appendix II: X-FISH: the use of RNA-based probes in
flow cytometry for differentiating cellular populations
based on RNA expression patterns
AII.1 Introduction
Fluorescent in situ hybridization (FISH) allows detection of nucleic acid
(both RNA and DNA) within tissues and cells. FISH has proven to be a very useful
technique in the detection of mRNA expression (1), viral RNA (2, 3), telomere
length determination (4), and studies of gene expression (5). While FISH is
conventionally used to study expression in cells or tissues fixed on slides, this
technique has been adapted to study hybridization by flow cytometry (flow-FISH)
(6), a powerful technique for the detection and quantification of mRNA within cell
populations (7-10). This technique has also been recently used to study gene
expression within bacteria and viruses (11, 12). However, due to the time
consuming nature of the technique, the limitations in sensitivity and resolution, the
difficulty in maintaining cellular morphology following the required fixation steps,
and issues of probe design and stability (13, 14), flow-FISH is infrequently utilized
in eukaryotic cells compared to other techniques to study mRNA (e.g. real-time
PCR).
One of the greatest challenges in comparative immunology is the lack of
specific antibodies to differentiate between subpopulations of cells. While
morphological and functional features can be used to differentiate cells, further
characterization of subpopulations using unique markers has been limited. Teleost
386
fish, being the earliest known vertebrate to have both an innate and adaptive
immune system, are a commonly used model in comparative immunology studies.
While teleost fish have been shown to possess the main immune cells that are
characteristic of mammalian systems (15), further sub-typing of these cells has not
been possible due to a lack of reagents. As such, there is currently a great deal of
interest in finding unique markers to differentiate between various leukocyte
populations.
Previous studies with goldfish macrophages have identified a number of
genes by PCR that are differentially expressed in the three distinct macrophage
subpopulations (16-21). However, all of these studies have been performed using
cell lysates of sorted populations. The protocol developed herein utilizes RNA-
based markers to differentiate between leukocyte populations in mixed cultures.
Importantly, this is accomplished while still maintaining cellular morphology. This
technique can be applied to any cellular system to allow sensitive and specific
detection of mRNA species that are differentially expressed- in cellular subsets,
over time, following activation or following any treatment that affects expression.
Using this technique, cells are studied as single events, allowing for robust
statistical analyses not possible in lysate-based detection methods.
AII.2 Materials and Methods
AII.2.1 Animals
Goldfish (Carassius auratus L.) 10–15 cm in length were purchased from
Mount Parnell (Mercersburg, PA) and maintained in the Aquatic Facility of the
387
Department of Biological Sciences, University of Alberta. The fish were held at
20oC in a flow-through water system on a simulated natural photoperiod. All
animals were maintained according to the guidelines of the Canadian Council on
Animal Care. The University of Alberta Animal Care and Use Committee
approved all protocols.
AII.2.2 Cell lines
RAW 264.7 macrophage cells and COS-1 wild type cells were cultured in
complete DMEM media (DMEM supplemented with 10% heat-inactivated fetal
bovine serum, 100 U/mL penicillin, and 100 μg/mL streptomycin). Thp-1 and
U937 cells were cultured in complete RPMI 1640 media (RPMI, supplemented
with 10% heat-inactivated fetal bovine serum, 100 U/mL penicillin, and 100 μg/mL
streptomycin). Cell lines were cultured at 37oC/5% CO2 and passaged every 3-4
days.
AII.2.3 Goldfish primary kidney macrophage cultures
Primary kidney macrophages (PKM) were generated by seeding isolated
leukocytes and culturing in 15 mL complete MGFL-15 media (MGFL-15
supplemented with 100 U/mL penicillin, 100 μg/mL streptomycin, 100 μg/mL
gentamicin, 10% newborn calf serum (Gibco) and 5% carp serum) with 5 mL cell-
conditioned media from previous experiments and incubated for 6-9 days at 20oC
(22, 23).
388
AII.2.4 cDNA synthesis
RNA was extracted from cultured cells using an RNeasy Mini kit (Qiagen).
TURBO DNA-free (Ambion) was used to remove any remaining contaminating
genomic DNA from the isolated RNA. First strand synthesis was completed using
the Clontech SMARTScribe protocol. In brief, 2 μg of RNA was incubated with 20
μM CDS poly T primer and 5’ oligo at 72oC for 3 minutes. 5X first-strand buffer,
dNTPs (Invitrogen), DDT and reverse transcriptase (Clontech) were then added
and the reaction was incubated at 42oC for 60 minutes. Heating at 70oC for 15
minutes terminated the reaction. Second strand synthesis was completed using Taq:
Pfu with 20 μM 5’ PCR primer.
AII.2.5 PCR amplification of genes of interest and cloning
Refer to Table AII.1 for all primer sequences. Primers were designed to
amplify β-actin, FcγRIIa, legumain, CD63, tumor necrosis factor (TNF)-α1
(goldfish), TNF-α (mouse) and interleukin (IL)-12p40. Optimal length of inserts
for generating probes was found to be between 400-700 base pairs. Genes were
elongated at 52.5oC for 1.5 minutes for 35 cycles and run on a 1% agarose gel.
Bands were extracted and purified using QIAquick gel extraction kit (Qiagen).
Purified PCR products were cloned into pCRII-TOPO, following the
manufacturer’s directions (Invitrogen). TOP10 competent cells (Invitrogen) were
incubated with the TOPO cloning reaction for 5 minutes on ice to transform cells.
Cells were then plated directly onto pre-warmed LB-ampicillin plates (100 μg/mL)
and incubated over night at 37oC.
389
AII.2.6 Identification of positive clones
Colonies were picked from LB-ampicillin plates and PCR was preformed
using M13 forward and reverse primers (vector based). Plasmids were purified
from positive clones using QIAprep Spin Miniprep kit (Qiagen) and sequenced
using BigDye (Applied Biosystems) to confirm the insert and to determine the
orientation of the insert.
AII.2.7 Probe synthesis
Purified plasmids from positive clones were digested with BamHI for 1 hour
at 37oC to linearize plasmids. Linear plasmids were purified using a PCR
purification kit (Qiagen). 1 μg of linear template plasmid was then incubated with
T7 RNA polymerase in the presence of 25 mM RNA label mix (fluorescein-UTP:
Roche; biotin-CTP: Invitrogen; digoxigenin-UTP: Roche) and 0.1M dithiothreitol
(DTT) for 2 hours at 37oC. Probe size was verified by running on a 1% agarose gel
with RiboRuler High Range RNA ladder (Fermentas).
AII.2.8 Hybridization
Cells were harvested and fixed with 2% formaldehyde overnight at 4oC. Cells
were then spun down and resuspended in 70% ethanol and incubated for 15
minutes at room temperature. After washing in incomplete media (centrifuge 393 x
g for 10 minutes at 4oC), cells were resuspended in 20 mM Tris-HCl/ 2 mM CaCl2
(pH 7.5) and treated with proteinase K (1 mg/mL, Sigma) for 7.5 minutes at room
390
temperature. Cells were then re-fixed in 2% formaldehyde for 10 minutes at 4oC
and centrifuged at 393 x g for 10 minutes at 4oC. Cells were resuspended in a mix
of formamide and 20X SSC (2:1) and 100 μL was aliquoted into 5 mL round
bottom polypropylene tubes containing 400 μL hybridization buffer (5X SSC, 50%
formamide, 10 mg/mL sheared salmon sperm DNA, 0.1% Tween-20 and 0.5%
SDS) and probes. Tubes were mixed thoroughly and incubated in a 60oC water
bath for 4 hours, with occasional mixing. After 4 hours, excess hybridization buffer
without probe was added to each tube to remove unbound probe and cells were
incubated further for 45 minutes at 60oC. Cells were then washed once in 2X SSC
followed by 0.1X SSC (centrifuge 393 x g for 10 minutes at 4oC). Cells were then
washed twice in 1x PBS-/- (centrifuge 393 x g for 10 minutes at 4oC) and
resuspended in 1xPBS-/-/ 2% newborn calf serum (Gibco) for staining. Samples can
also be resuspended in 2% formaldehyde and stored at 4oC overnight prior to
washes and staining.
AII.2.9 Detection and analysis
Hybridized cells were stained with streptavidin-PE (Invitrogen) or
streptavidin-DyLight405 (Jackson ImmunoResearch Laboratories; to detect biotin-
CTP labeled probes) and/or anti-FITC IgG1 DyLight488 (Jackson
ImmunoResearch Laboratories; to detect fluorescein-UTP labeled probes) and/or
anti-digoxigenin (Roche) followed by anti-mouse IgG1 (BD BioSciences; to detect
digoxigenin-UTP probes) for 30 minutes at room temperature. Cells were then
washed twice with 1xPBS-/-/ 2% newborn calf serum (centrifuge 393 x g for 10
391
minutes at 4oC) and data was acquired using an ImageStream multi-spectral flow
cytometer (Amnis) or FACSCanto II (BD Biosciences). Hybridization was
analyzed based on fluorescence intensity using IDEAS 4.0 software (Amnis),
FACSDiva (BD Biosciences) or FCS Express 3.0. Statistics were done using a two-
tailed Students’ T test (Prism).
AII.2.10 Intracellular cytokine staining
Cells were activated in the presence of GolgiPlug (BD BioSciences).
Following activation, cells were fixed with 2% formaldehyde at 4oC for a
minimum for 10 minutes. Cells were then washed twice with 1X PBS-/- containing
2% calf serum (centrifuge 393 x g for 10 minutes at 4oC). Cells were then
permeabilized with 0.1% saponin in 1X PBS-/- containing 2% calf serum on ice for
20 minutes. Anti-TNF-α-PE (BD BioSciences) was then added for 30 minutes.
Cells were then washed 3 times with saponin buffer (centrifuge 393 x g for 10
minutes at 4oC).
AII.3 Results
AII.3.1. X-FISH detects specific RNA species within the cytoplasm.
Fluorescent in situ hybridization is a robust technique for the detection of
nucleic acids within tissues and cells. Though most FISH assays have focused on
microscopy-based readouts, recent protocols have adapted this technique for use in
flow cytometry. Because of the lack of protein-based markers and the wealth of
information on gene expression in comparative immunology systems, I sought to
392
test the efficacy of FISH in providing unique markers for subpopulations of
immune cells. To this end, I created a flow cytometry-based FISH that detects
RNA with a high level of specificity and sensitivity in cells with minimal effect of
cellular morphology.
In order to optimize the X-FISH assay, I designed probes for β-actin, a
ubiquitously expressed gene. This probe was used in COS-1 cells, which have a
large cytoplasmic area, giving an increased area for hybridization, as well as a good
indication of the effect that the hybridization protocol has on cell morphology.
COS-1 cells were hybridized with either sense or anti-sense β-actin probes (Figure
AII.1 A and B). The sense probe served as a control to determine the level of
background fluorescence due to unhybridized probe not removed by washes. As a
control to show specificity of the probe for RNA, COS-1 cells were also pretreated
with RNase A (equivalent 4 units of activity) for 15 minutes at room temperature.
Hybridization with an anti-sense β-actin probe (binds complementary sense mRNA
within the cell) resulted in a significant shift in fluorescence compared to both
streptavidin alone or hybridization with a sense probe (95% vs. 3% and 6%,
respectively; Figure AII.1 A). When cells are pretreated with RNase A, the level of
fluorescence is dramatically reduced (8%), showing that the detected fluorescence
is due to RNA hybridization. Importantly, using the protocol described here,
sensitive hybridization is accomplished while cell morphology is maintained
(Figure AII.1 B). This is necessary to detect a strong signal within the cytoplasmic
compartment. As expected, the β-actin signal is localized throughout the cytoplasm
in a disperse pattern.
393
As a next step, I wanted to ensure that this protocol was amenable to use in
immune cells and could specifically discriminate between cells that had
differentially expressed genes. To this end, I designed sense and anti-sense probes
to FcγRIIa, an Fc-receptor expressed on human but not murine leukocytes. These
probes were used to stain three myeloid cell lines: human Thp-1 and U937
monocytes and murine RAW 264.7 macrophages. As expected, I saw a significant
shift in fluorescence with the anti-sense probes in the Thp-1 and U937 cell lines
(Figure AII.1 C). The murine RAW 264.7 cells displayed no difference in
fluorescence between sense and anti-sense probes.
AII.3.2 RNA probes match expression patterns of antibody markers.
An important criterion for this protocol is to possess a similar robustness in
detection as is present for protein-based markers. As such, I wanted to test this
protocol with a gene expressed in low quantities and compare this to the expression
detected with an antibody to the same molecule. To this end, I activated RAW
264.7 macrophages with LPS or PMA over a 24-hour period and used both X-FISH
and intracellular cytokine staining to measure TNF-α expression (Figure AII.2 A). I
found similar levels of expression and kinetics of upregulation with both
techniques, showing that X-FISH is not only able to detect RNA species that
expressed at a low level, but is also able to sensitively detect subtle changes in
expression following activation. Further, I found no difference in the staining
pattern with TNF-α antibodies when the stain was done separately or in
394
conjunction with the X-FISH protocol, suggesting that these two techniques may
be combined so long as the antibody epitope is unchanged by the fixation steps.
AII.3.3 X-FISH can distinguish between cells in mixed populations and
measure changes in activation in each subpopulation.
As a final step, I wanted to test the protocol on primary cells, as primary cells
are known to be generally much more sensitive and less amenable to manipulation
compared to cell lines. For this, I employed a well-studied teleost primary
macrophage culture – goldfish primary kidney macrophage cells (PKMs). It has
been previously shown by PCR that the three subpopulations within these cultures
(early progenitors, monocytes and mature macrophage) have distinct expression
patterns of certain markers (21). To test this protocol, I selected CD63, a marker of
monocytes, and legumain, a marker of mature macrophages. Using the X-FISH
protocol, I probed PKMs that had been incubated with fluorescent zymosan with
probes against legumain, CD63 and TNF-α1. I found that TNF-α1 was expressed to
a significantly higher degree in cells that had internalized zymosan compared to
cells that had not (Figure AII.2B). This occurred in both legumain+ mature
macrophages and CD63+ monocytes. Similar to cell lines, I noticed no negative
impact of the X-FISH protocol on primary goldfish macrophage cells.
AII.4. Discussion
Fluorescent in situ hybridization is a powerful technique for detecting nucleic
acids within cells or whole tissue mounts. The protocol described here adapts this
395
process for use on cells in suspension and provides sensitive detection of RNA
species while maintaining cellular morphology. Further, this technique can be
applied to both cell lines and primary cells and can be used across a range of
species.
There are a number of challenges associated with FISH assays, the most
prominent being the ability to detect a signal with a high signal: noise ratio. The
majority of background fluorescence with this technique is associated with
unbound probe that remains within the cells following washes (24). As such,
stringent washing protocols must be followed to remove unbound probe (24). In
this assay, have developed here, I detected little fluorescence due to either unbound
probe or non-specific staining with the secondary detection antibodies.
Another common challenge with in situ hybridization is optimizing fixation
and permeabilization steps to avoid loss of cell morphology as well as to minimize
any effects that these steps may have on signal levels and integrity of organelles
(25). I found that the fixation and permeabilization steps outlined here had minimal
effect on the nuclear: cytoplasmic ratios while still providing strong signal
detection. This was true for not only cell lines, but primary cells as well.
Maintaining the cytoplasmic size is of critical importance as loss of cytoplasm will
significantly reduce the ability to detect hybridization, especially in cells such as
leukocytes that may have a small nuclear: cytoplasmic ratio. Lastly, target
accessibility presents a unique challenge. Within cells, RNA molecules have
complex secondary structures and associated proteins that may mask or outcompete
396
probe binding sites (14). As such, it may be necessary design, synthesize and test
multiple probes to select the best target probe (14).
While there may be many challenges associated with in situ hybridization, I
have been able to overcome the main challenges through optimization of the X-
FISH protocol. As such, X-FISH appears to hold significant potential in creating
probes to differentiate between cell populations in the absence of specific protein-
based markers. This technique may also be complexed with certain antibodies to
provide an added layer investigation. Finally, X-FISH can be applied to any cell or
tissue, irrespective of species or origin. As such, is can be easily applied to and
transferred across many different comparative immunology model systems, filling
a void until protein-based markers become available. Finally, as a testament to the
importance of this technique across a wide range of disciplines, there are now
multiple companies with commercial products similar to the technique described in
this Appendix (Stellaris, EMD Millipore, eBioscience).
AII.5. Protocol
1. PCR of desired insert and ligation into vector
1. Follow established lab protocols for PCR of the gene of interest.
2. Excise band from gel and follow gel purification protocol in Qiagen kit.
3. Insert into TOPO TA cloning vector and transform bacteria, following the
recommended protocol outlined by Invitrogen.
4. Isolate plasmid by mini-prep, following the Qiagen protocol.
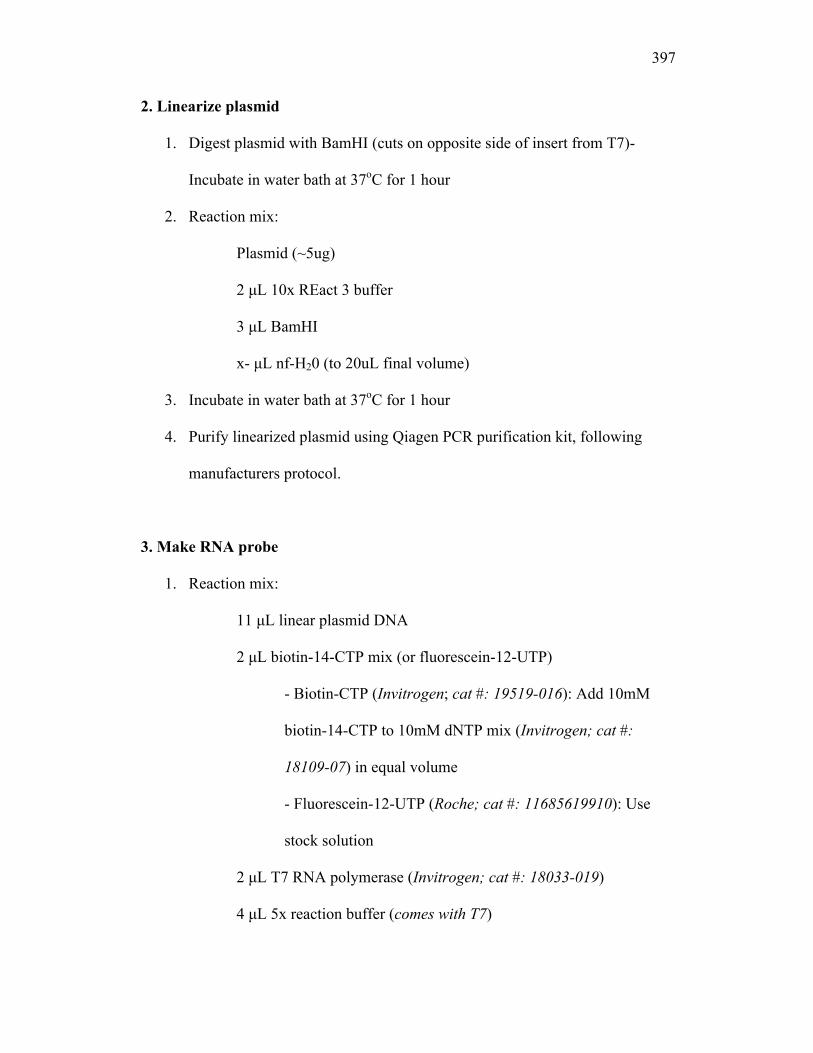
397
2. Linearize plasmid
1. Digest plasmid with BamHI (cuts on opposite side of insert from T7)-
Incubate in water bath at 37oC for 1 hour
2. Reaction mix:
Plasmid (~5ug)
2 μL 10x REact 3 buffer
3 μL BamHI
x- μL nf-H20 (to 20uL final volume)
3. Incubate in water bath at 37oC for 1 hour
4. Purify linearized plasmid using Qiagen PCR purification kit, following
manufacturers protocol.
3. Make RNA probe
1. Reaction mix:
11 μL linear plasmid DNA
2 μL biotin-14-CTP mix (or fluorescein-12-UTP)
- Biotin-CTP (Invitrogen; cat #: 19519-016): Add 10mM
biotin-14-CTP to 10mM dNTP mix (Invitrogen; cat #:
18109-07) in equal volume
- Fluorescein-12-UTP (Roche; cat #: 11685619910): Use
stock solution
2 μL T7 RNA polymerase (Invitrogen; cat #: 18033-019)
4 μL 5x reaction buffer (comes with T7)
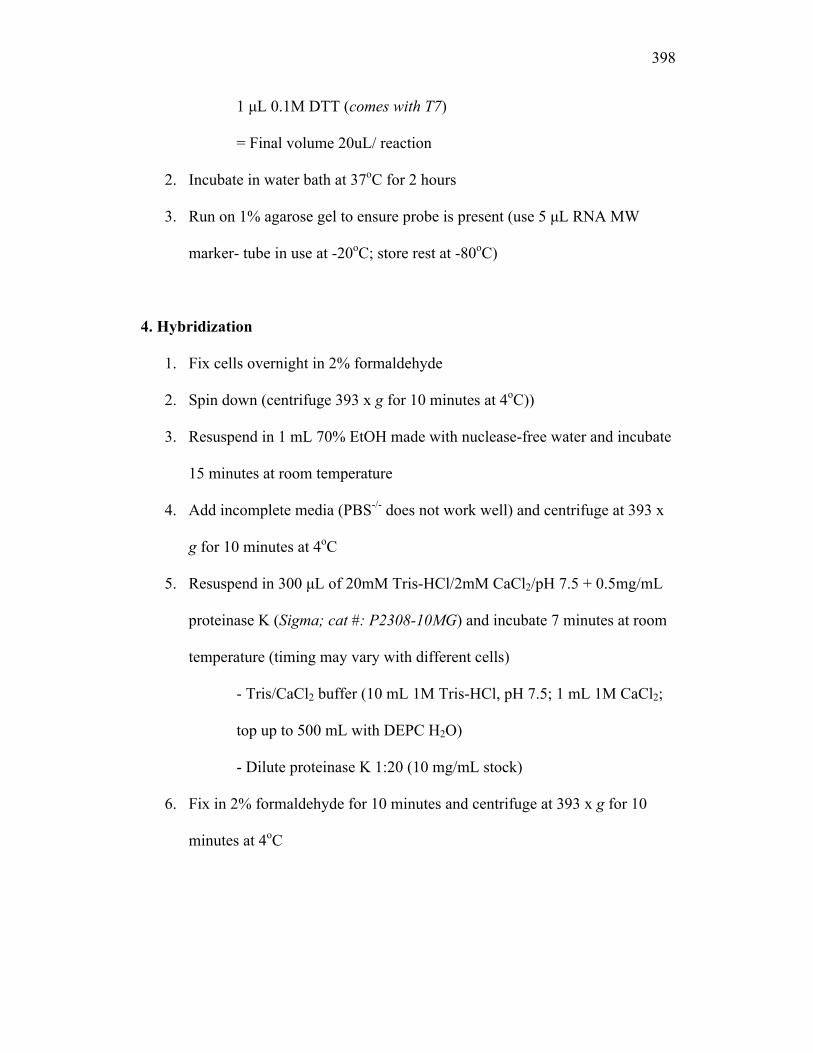
398
1 μL 0.1M DTT (comes with T7)
= Final volume 20uL/ reaction
2. Incubate in water bath at 37oC for 2 hours
3. Run on 1% agarose gel to ensure probe is present (use 5 μL RNA MW
marker- tube in use at -20oC; store rest at -80oC)
4. Hybridization
1. Fix cells overnight in 2% formaldehyde
2. Spin down (centrifuge 393 x g for 10 minutes at 4oC))
3. Resuspend in 1 mL 70% EtOH made with nuclease-free water and incubate
15 minutes at room temperature
4. Add incomplete media (PBS-/- does not work well) and centrifuge at 393 x
g for 10 minutes at 4oC
5. Resuspend in 300 μL of 20mM Tris-HCl/2mM CaCl2/pH 7.5 + 0.5mg/mL
proteinase K (Sigma; cat #: P2308-10MG) and incubate 7 minutes at room
temperature (timing may vary with different cells)
- Tris/CaCl2 buffer (10 mL 1M Tris-HCl, pH 7.5; 1 mL 1M CaCl2;
top up to 500 mL with DEPC H2O)
- Dilute proteinase K 1:20 (10 mg/mL stock)
6. Fix in 2% formaldehyde for 10 minutes and centrifuge at 393 x g for 10
minutes at 4oC
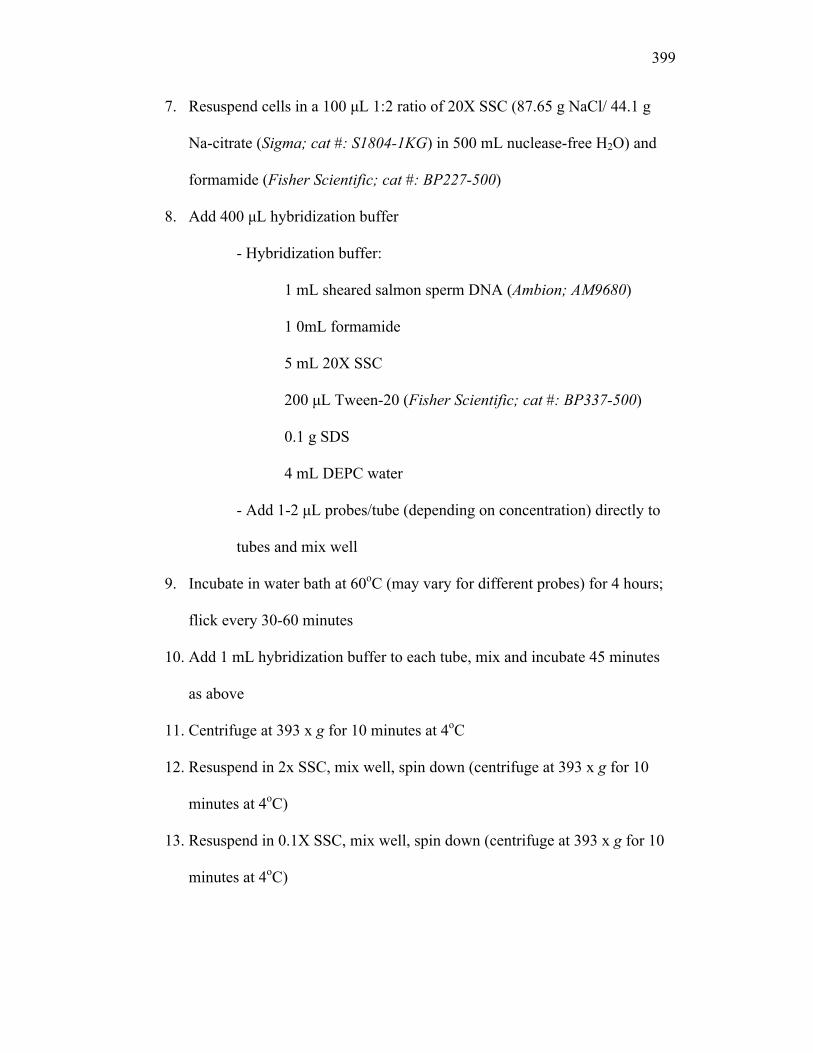
399
7. Resuspend cells in a 100 μL 1:2 ratio of 20X SSC (87.65 g NaCl/ 44.1 g
Na-citrate (Sigma; cat #: S1804-1KG) in 500 mL nuclease-free H2O) and
formamide (Fisher Scientific; cat #: BP227-500)
8. Add 400 μL hybridization buffer
- Hybridization buffer:
1 mL sheared salmon sperm DNA (Ambion; AM9680)
1 0mL formamide
5 mL 20X SSC
200 μL Tween-20 (Fisher Scientific; cat #: BP337-500)
0.1 g SDS
4 mL DEPC water
- Add 1-2 μL probes/tube (depending on concentration) directly to
tubes and mix well
9. Incubate in water bath at 60oC (may vary for different probes) for 4 hours;
flick every 30-60 minutes
10. Add 1 mL hybridization buffer to each tube, mix and incubate 45 minutes
as above
11. Centrifuge at 393 x g for 10 minutes at 4oC
12. Resuspend in 2x SSC, mix well, spin down (centrifuge at 393 x g for 10
minutes at 4oC)
13. Resuspend in 0.1X SSC, mix well, spin down (centrifuge at 393 x g for 10
minutes at 4oC)
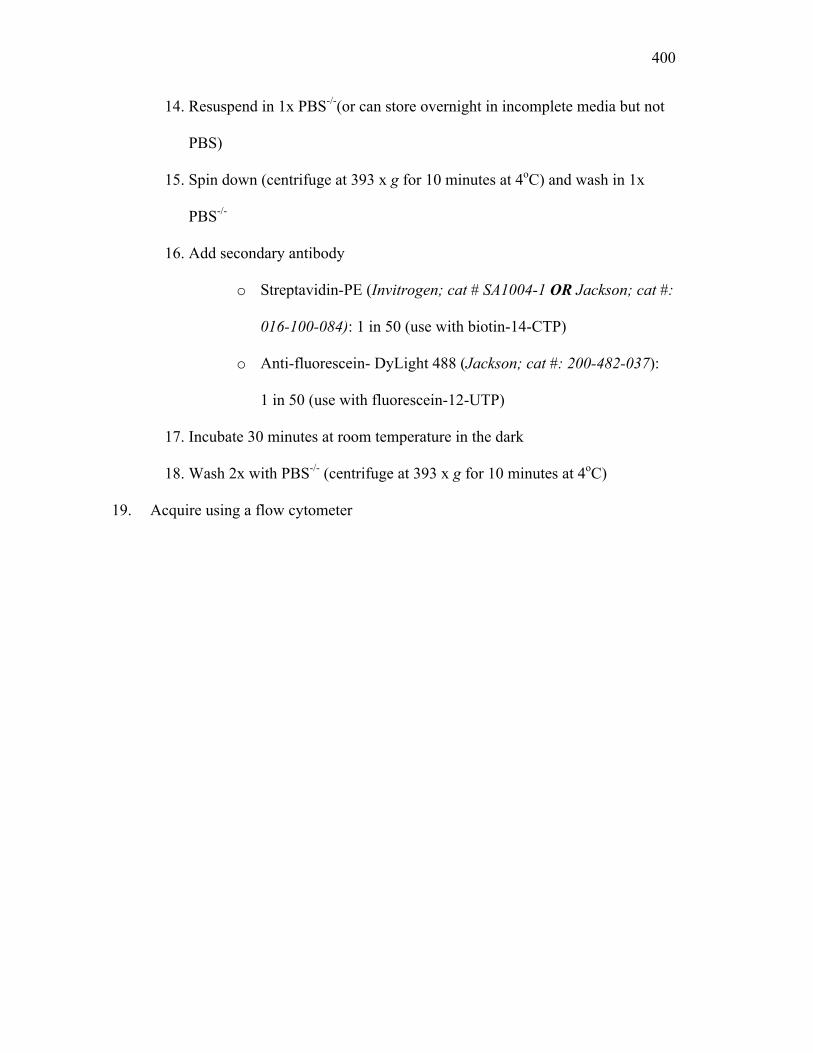
400
14. Resuspend in 1x PBS-/-(or can store overnight in incomplete media but not
PBS)
15. Spin down (centrifuge at 393 x g for 10 minutes at 4oC) and wash in 1x
PBS-/-
16. Add secondary antibody
o Streptavidin-PE (Invitrogen; cat # SA1004-1 OR Jackson; cat #:
016-100-084): 1 in 50 (use with biotin-14-CTP)
o Anti-fluorescein- DyLight 488 (Jackson; cat #: 200-482-037):
1 in 50 (use with fluorescein-12-UTP)
17. Incubate 30 minutes at room temperature in the dark
18. Wash 2x with PBS-/- (centrifuge at 393 x g for 10 minutes at 4oC)
19. Acquire using a flow cytometer

401
5_brightfield 4_streptav idin PE
59
5_brightfield 4_streptav idin PE
4298
5_brightfield 4_streptav idin PE
4955
A
B
3% 6%
95% 8%
Intensity streptavidin-PE
Freq
uenc
y
streptavidin alone sense probe
RNase treated cells + anti-sense probe anti-sense probe
sense probe RNase treated cells + anti-sense probe
anti-sense probe
FITC-A
Cou
nt
101 102 103 104 1050
831
1663
2494
3325
M1
FITC-A
Cou
nt
-101 102 103 104 1050
163
326
489
652
M1
FITC-A
Cou
nt
-102-101 102 103 104 1050
125
251
376
501
M1
RAW 264.7 Thp-1 U937 C
Sense Anti-sense
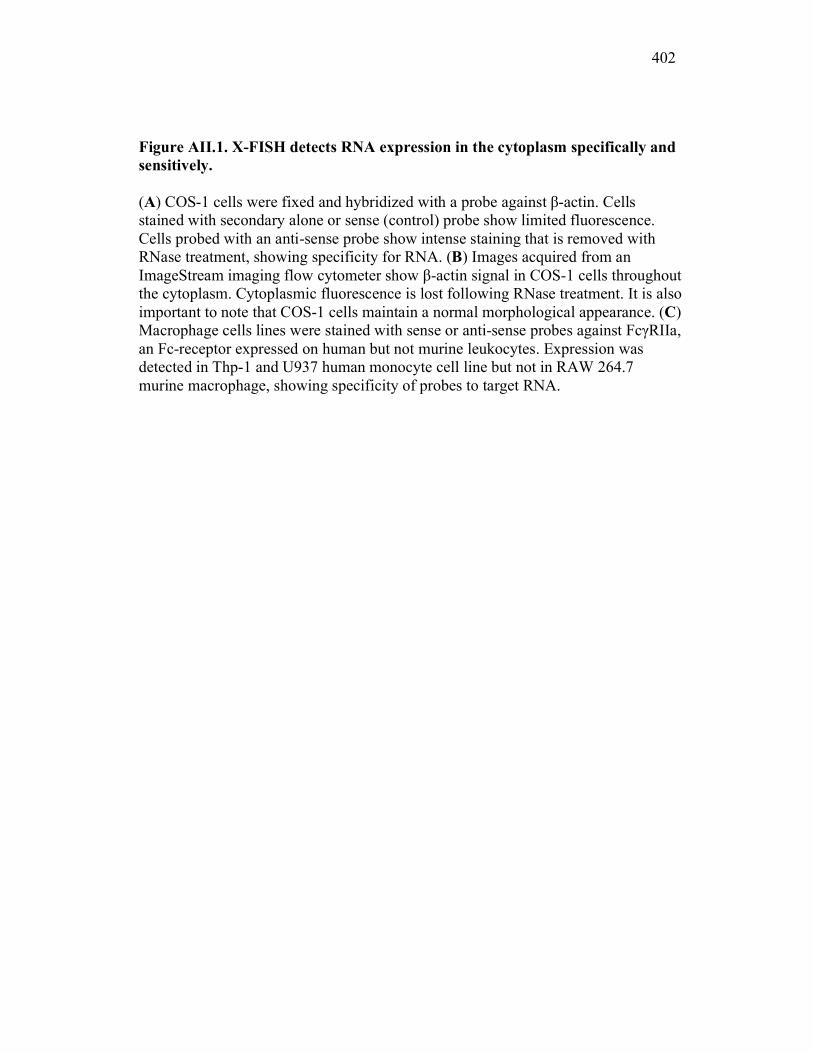
402
Figure AII.1. X-FISH detects RNA expression in the cytoplasm specifically and sensitively. (A) COS-1 cells were fixed and hybridized with a probe against β-actin. Cells stained with secondary alone or sense (control) probe show limited fluorescence. Cells probed with an anti-sense probe show intense staining that is removed with RNase treatment, showing specificity for RNA. (B) Images acquired from an ImageStream imaging flow cytometer show β-actin signal in COS-1 cells throughout the cytoplasm. Cytoplasmic fluorescence is lost following RNase treatment. It is also important to note that COS-1 cells maintain a normal morphological appearance. (C) Macrophage cells lines were stained with sense or anti-sense probes against FcγRIIa, an Fc-receptor expressed on human but not murine leukocytes. Expression was detected in Thp-1 and U937 human monocyte cell line but not in RAW 264.7 murine macrophage, showing specificity of probes to target RNA.
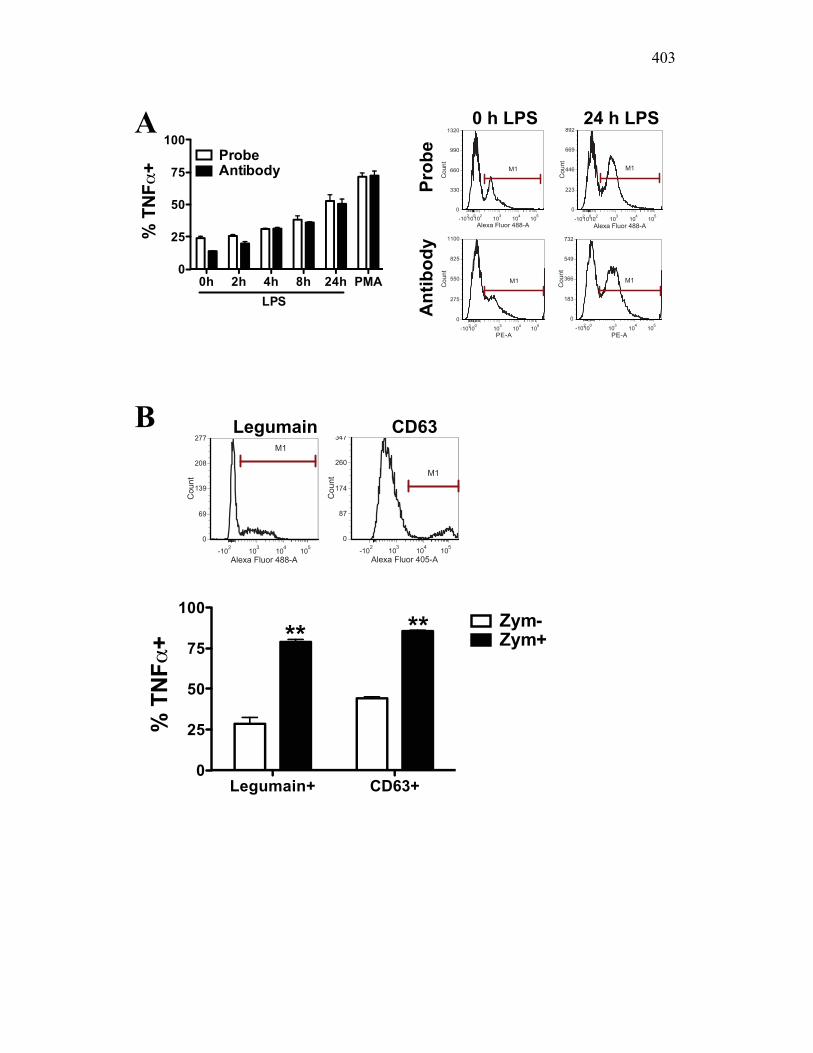
403
0h 2h 4h 8h 24h PMA0
25
50
75
100%
TN
F+
LPS
Alexa Fluor 488-A
Cou
nt
-102100102 103 104 1050
330
660
990
1320
M1
PE-A
Cou
nt
-102100 103 104 1050
275
550
825
1100
M1
Alexa Fluor 488-A
Cou
nt
-102100102 103 104 1050
223
446
669
892
M1
PE-A
Cou
nt
-102100 103 104 1050
183
366
549
732
M1
Prob
e A
ntib
ody
0 h LPS 24 h LPS
ProbeAntibody
A
B
Alexa Fluor 488-A
Cou
nt
-102 103 104 1050
69
139
208
277M1
Alexa Fluor 405-A
Cou
nt
-102 103 104 1050
87
174
260
347
M1
Legumain CD63
Legumain+ CD63+0
25
50
75
100Zym-Zym+
% T
NF
+ ** **
404
Figure AII.2. X-FISH detects changes in cytokine expression following activation in specific cell subpopulations. (A) RAW 264.7 macrophages were activated with LPS for 0-24 h. Cells were then harvested and fixed and TNF-α with either an RNA based probe using the X-FISH protocol or with an antibody through intracellular cytokine staining. Probe and antibody showed similar patterns of staining. n=4; **p<0.01; error bars show SEM. (B) Goldfish primary kidney macrophages were incubated with fluorescent zymosan for 2 h. Cells were then fixed and probed with legumain, CD63 and TNF-α1 probes. Both legumain+ mature macrophages and CD63+ monocytes significantly increased TNF-α1 expression following internalization of zymosan. n=4; **p<0.01; error bars show SEM.
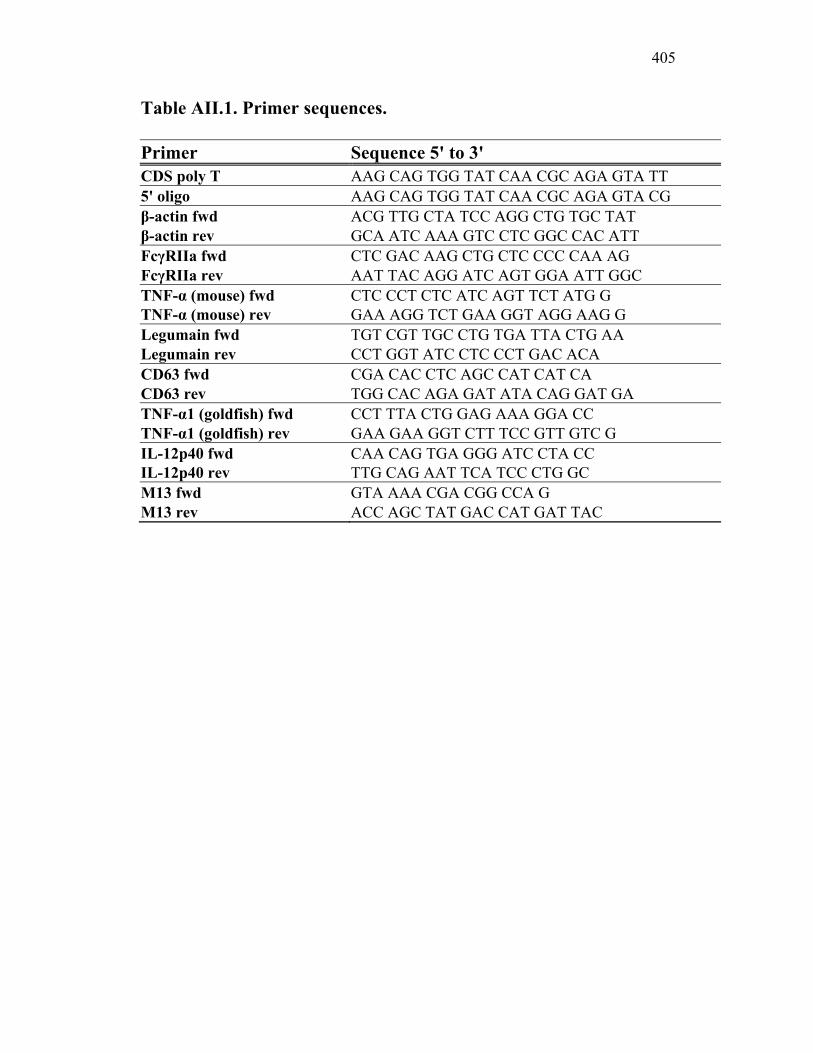
405
Table AII.1. Primer sequences. Primer Sequence 5' to 3' CDS poly T AAG CAG TGG TAT CAA CGC AGA GTA TT 5' oligo AAG CAG TGG TAT CAA CGC AGA GTA CG β-actin fwd ACG TTG CTA TCC AGG CTG TGC TAT β-actin rev GCA ATC AAA GTC CTC GGC CAC ATT FcγRIIa fwd CTC GAC AAG CTG CTC CCC CAA AG FcγRIIa rev AAT TAC AGG ATC AGT GGA ATT GGC TNF-α (mouse) fwd CTC CCT CTC ATC AGT TCT ATG G TNF-α (mouse) rev GAA AGG TCT GAA GGT AGG AAG G Legumain fwd TGT CGT TGC CTG TGA TTA CTG AA Legumain rev CCT GGT ATC CTC CCT GAC ACA CD63 fwd CGA CAC CTC AGC CAT CAT CA CD63 rev TGG CAC AGA GAT ATA CAG GAT GA TNF-α1 (goldfish) fwd CCT TTA CTG GAG AAA GGA CC TNF-α1 (goldfish) rev GAA GAA GGT CTT TCC GTT GTC G IL-12p40 fwd CAA CAG TGA GGG ATC CTA CC IL-12p40 rev TTG CAG AAT TCA TCC CTG GC M13 fwd GTA AAA CGA CGG CCA G M13 rev ACC AGC TAT GAC CAT GAT TAC
406
AII.5. References
1. Desmouliere, A., Geinoz, A., Gabbiani, F., and Gabbiani, G. 1993. Transforming growth factor-beta 1 induces alpha-smooth muscle actin expression in granulation tissue myofibroblasts and in quiescent and growing cultured fibroblasts. J Cell Biol 122:103-111.
2. Schnittman, S.M., Psallidopoulos, M.C., Lane, H.C., Thompson, L., Baseler, M., Massari, F., Fox, C.H., Salzman, N.P., and Fauci, A.S. 1989. The reservoir for HIV-1 in human peripheral blood is a T cell that maintains expression of CD4. Science 245:305-308.
3. Brigati, D.J., Myerson, D., Leary, J.J., Spalholz, B., Travis, S.Z., Fong, C.K., Hsiung, G.D., and Ward, D.C. 1983. Detection of viral genomes in cultured cells and paraffin-embedded tissue sections using biotin-labeled hybridization probes. Virology 126:32-50.
4. Moyzis, R.K., Buckingham, J.M., Cram, L.S., Dani, M., Deaven, L.L., Jones, M.D., Meyne, J., Ratliff, R.L., and Wu, J.R. 1988. A highly conserved repetitive DNA sequence, (TTAGGG)n, present at the telomeres of human chromosomes. Proc Natl Acad Sci U S A 85:6622-6626.
5. Lalli, E., Gibellini, D., Santi, S., and Facchini, A. 1992. In situ hybridization in suspension and flow cytometry as a tool for the study of gene expression. Anal Biochem 207:298-303.
6. Bauman, J.G., Bayer, J.A., and van Dekken, H. 1990. Fluorescent in-situ hybridization to detect cellular RNA by flow cytometry and confocal microscopy. J Microsc 157:73-81.
7. Crouch, J., Leitenberg, D., Smith, B.R., and Howe, J.G. 1997. Epstein-Barr virus suspension cell assay using in situ hybridization and flow cytometry. Cytometry 29:50-57.
8. Belloc, F., and Durrieu, F. 1994. Detection of mRNA species by flow cytometry. Methods Cell Biol 42 Pt B:59-69.
9. Childs, G.V., Lloyd, J.M., Unabia, G., Gharib, S.D., Wierman, M.E., and Chin, W.W. 1987. Detection of luteinizing hormone beta messenger ribonucleic acid (RNA) in individual gonadotropes after castration: use of a new in situ hybridization method with a photobiotinylated complementary RNA probe. Mol Endocrinol 1:926-932.
10. Grunwald, D. 1993. Flow cytometry and RNA studies. Biol Cell 78:27-30. 11. Robertson, K.L., Verhoeven, A.B., Thach, D.C., and Chang, E.L. 2010.
Monitoring viral RNA in infected cells with LNA flow-FISH. RNA 16:1679-1685.
12. Robertson, K.L., and Vora, G.J. 2012. Locked nucleic acid flow cytometry-fluorescence in situ hybridization (LNA flow-FISH): a method for bacterial small RNA detection. J Vis Exp:e3655.
13. Robertson, K.L., and Thach, D.C. 2009. LNA flow-FISH: a flow cytometry-fluorescence in situ hybridization method to detect messenger RNA using locked nucleic acid probes. Anal Biochem 390:109-114.
14. Bao, G., Rhee, W.J., and Tsourkas, A. 2009. Fluorescent probes for live-cell RNA detection. Annu Rev Biomed Eng 11:25-47.
407
15. Miller, N., Wilson, M., Bengten, E., Stuge, T., Warr, G., and Clem, W. 1998. Functional and molecular characterization of teleost leukocytes. Immunol Rev 166:187-197.
16. Hanington, P.C., Barreda, D.R., and Belosevic, M. 2006. A novel hematopoietic granulin induces proliferation of goldfish (Carassius auratus L.) macrophages. J Biol Chem 281:9963-9970.
17. Grayfer, L., and Belosevic, M. 2009. Molecular characterization of novel interferon gamma receptor 1 isoforms in zebrafish (Danio rerio) and goldfish (Carassius auratus L.). Mol Immunol 46:3050-3059.
18. Grayfer, L., and Belosevic, M. 2009. Molecular characterization of tumor necrosis factor receptors 1 and 2 of the goldfish (Carassius aurutus L.). Mol Immunol 46:2190-2199.
19. Katzenback, B.A., and Belosevic, M. 2009. Molecular and functional characterization of kita and kitla of the goldfish (Carassius auratus L.). Dev Comp Immunol 33:1165-1175.
20. Walsh, J.G., Barreda, D.R., and Belosevic, M. 2007. Cloning and expression analysis of goldfish (Carassius auratus L.) prominin. Fish Shellfish Immunol 22:308-317.
21. Barreda, D.R., Hanington, P.C., Walsh, C.K., Wong, P., and Belosevic, M. 2004. Differentially expressed genes that encode potential markers of goldfish macrophage development in vitro. Dev Comp Immunol 28:727-746.
22. Neumann, N.F., Barreda, D., and Belosevic, M. 1998. Production of a macrophage growth factor(s) by a goldfish macrophage cell line and macrophages derived from goldfish kidney leukocytes. Dev Comp Immunol 22:417-432.
23. Neumann, N.F., Barreda, D.R., and Belosevic, M. 2000. Generation and functional analysis of distinct macrophage sub-populations from goldfish (Carassius auratus L.) kidney leukocyte cultures. Fish Shellfish Immunol 10:1-20.
24. Buongiorno-Nardelli, M., and Amaldi, F. 1970. Autoradiographic detection of molecular hybrids between RNA and DNA in tissue sections. Nature 225:946-948.
25. Behrens, S., Fuchs, B.M., Mueller, F., and Amann, R. 2003. Is the in situ accessibility of the 16S rRNA of Escherichia coli for Cy3-labeled oligonucleotide probes predicted by a three-dimensional structure model of the 30S ribosomal subunit? Appl Environ Microbiol 69:4935-4941.