mechanics and deformation of polymer kirigami structures
86
MECHANICS AND DEFORMATION OF POLYMER KIRIGAMI STRUCTURES A Thesis by KIAN BASHANDEH KHODAEI NAEINI Submitted to the Office of Graduate and Professional Studies of Texas A&M University in partial fulfillment of the requirements for the degree of MASTER OF SCIENCE Chair of Committee, Committee Members, Head of Department, Andreas A. Polycarpou M. Cynthia Hipwell Matt Pharr Mohammad Naraghi Andreas A. Polycarpou December 2020 Major Subject: Mechanical Engineering Copyright 2020 Kian Bashandeh
-
Upload
khangminh22 -
Category
Documents
-
view
4 -
download
0
Transcript of mechanics and deformation of polymer kirigami structures
MECHANICS AND DEFORMATION OF POLYMER KIRIGAMI STRUCTURES
A Thesis
by
KIAN BASHANDEH KHODAEI NAEINI
Submitted to the Office of Graduate and Professional Studies of
Texas A&M University
in partial fulfillment of the requirements for the degree of
MASTER OF SCIENCE
Chair of Committee,
Committee Members,
Head of Department,
Andreas A. Polycarpou
M. Cynthia Hipwell Matt Pharr Mohammad Naraghi
Andreas A. Polycarpou
December 2020
Major Subject: Mechanical Engineering
Copyright 2020 Kian Bashandeh
ii
ABSTRACT
Recent advances in the assembly of three-dimensional (3D) structures driven by
compressive buckling of 2D precursors have provided an opportunity to exploit the
capability in a broad range of engineering applications with complex geometries and a
span of length scales from sub-micron to macro scales. These applications include but not
limited to microelectromechanical systems, energy storage, and wearable electronic
devices. The present work is dedicated to study the fabrication of flexible 3D kirigami-
inspired polymer-based structures using mechanically-guided 3D micro-assembly. The
mechanical response of assembled 3D buckled kirigami structures were investigated
through mechanical cyclic and single loading compression at room and elevated
temperatures.
Although a variety of 3D structures with different geometrical and material
arrangements were fabricated already, their mechanical response to applied load is still
unknown. In this thesis, the mechanics of these kirigami structures were studied using
experimental in-situ scanning electron microscopy (SEM) flat punch compression.
Computational modeling was conducted to support the experimental findings and to
investigate and understand the deformation and fracture of the structures.
Our findings revealed that the load-bearing capacity, resilience, and stability under
deformation were largely affected by structures’ geometry. Furthermore, the structures
with defects were also found to achieve stable hysteretic cycling with steady-state
mechanical response after a number of cycles.

iii
The information presented in this thesis is of great interest in understanding the
mechanics of 3D polymer-based structures. The work is expected to contribute to the
current and future research on the development of flexible and stretchable biomedical
devices as in tissue repair and vascular stents, as well as adaptive and deployable structures
in aerospace engineering and wearable electronics.
iv
ACKNOWLEDGEMENTS
I would like to thank my advisor, Professor Andreas Polycarpou, for his valuable
guidance, support, and encouragement throughout this research project.
I would like to thank my friends and colleagues, especially my research group
members in the Microtribodynamics laboratory, for their help and friendship. I would also
like to thank Dr. Wilson Serem, the Associate Research Scientist at TAMU material
characterization facility, for his valuable help and guidance in performing some of the
experiments. Thanks also to department faculty and staff for making my time at Texas
A&M University a great experience.
I would like to also thank the Hagler Institute for Advanced Study (HIAS) at Texas
A&M University for partial funding of this study.
Last but not least, I warmest thanks to my parents for their unconditional love,
constant support, and encouragement.
v
CONTRIBUTORS AND FUNDING SOURCES
Contributors
This work was supervised by a thesis committee consisting of the committee chair
Prof. Andreas A. Polycarpou, and committee members Prof. M. Cynthia Hipwell, and
Prof. Matt Pharr of the J. Mike Walker ’66 Department of Mechanical Engineering and
Prof. Mohammad Naraghi of the Department of Aerospace Engineering.
The studies of 3D structures in Chapter 2 were conducted with the help of Dr.
Jungkyu Lee, Dr. Yan Shi, Dr. Mengdi Han, and Dr. Xueju Wang. The studies of 3D
structures in Chapter 3 were conducted with the help of Dr. Jungkyu Lee, Dr. Yan Shi,
and Dr. Xueju Wang. The studies of 3D structures in Chapter 4 were conducted with the
help of Dr. Mengdi Han. All other work conducted in the thesis was completed by the
student independently.
Funding Sources
Partial funding of this study was provided by the Hagler Institute for Advanced
Study (HIAS) at Texas A&M University. Kian Bashandeh acknowledges the support of
HIAS through the HEEP graduate fellowship program.
vi
TABLE OF CONTENTS
Page
ABSTRACT .......................................................................................................................ii
ACKNOWLEDGEMENTS .............................................................................................. iv
CONTRIBUTORS AND FUNDING SOURCES .............................................................. v
TABLE OF CONTENTS .................................................................................................. vi
LIST OF FIGURES ........................................................................................................ viii
LIST OF TABLES ............................................................................................................ xi
1. INTRODUCTION AND LITERATURE REVIEW ...................................................... 1
1.1 Introduction .............................................................................................................. 1
1.2 Assembly of 3D Structures Using Controlled Mechanical Buckling ...................... 2
1.3 Mechanical Performance of Kirigami Structures ..................................................... 3
1.4 Objectives and Outlines ........................................................................................... 4
2. THE EFFECT OF DEFECTS ON THE CYCLIC BEHAVIOR OF POLYMERIC
3D KIRIGAMI STRUCTURES ......................................................................................... 7
2.1 Introduction .............................................................................................................. 8
2.2 Materials and Methods ............................................................................................. 9
2.3 Results and Discussion ........................................................................................... 12
2.3.1 Stiffening of the structures at 100% compression ........................................... 12
2.3.2 Structures with Defects ................................................................................... 14
2.3.3 Modeling using finite element analysis (FEA) ................................................ 21
2.4. Summary ............................................................................................................... 24
2.5 Supplementary movie legends ............................................................................... 25
3. MECHANICS AND DEFORMATION OF SHAPE MEMORY POLYMER
KIRIGAMI MICROSTRUCTURES ............................................................................... 26
3.1 Introduction ............................................................................................................ 27
3.2 Materials and Methods ........................................................................................... 29
3.2.1 Fabrication of the Structures ........................................................................... 29
3.2.2 Modeling Using Finite Element Analysis (FEA) ............................................ 32
vii
3.3 Results and Discussion ........................................................................................... 34
3.3.1 Mechanical Cycling (15 Cycles) at RT ........................................................... 34
3.3.2 Shape Memory Property Characterization at Elevated Temperature .............. 39
3.4 Summary ................................................................................................................ 45
3.5 Supplementary movie legends ............................................................................... 46
4. MECHANICAL CYCLING OF ENCAPSULATED 3D KIRIGAMI
STRUCTURES ................................................................................................................ 47
4.1 Introduction ............................................................................................................ 47
4.2 Materials and methods ........................................................................................... 49
4.3 Results and discussion ............................................................................................ 52
4.4 Summary ................................................................................................................ 60
5. CONCLUSION AND RECOMMENDATIONS FOR FUTURE WORK .................. 62
5.1 Conclusions ............................................................................................................ 62
5.2 Recommendations for Future Work ....................................................................... 63
REFERENCES ................................................................................................................. 65
viii
LIST OF FIGURES
Page
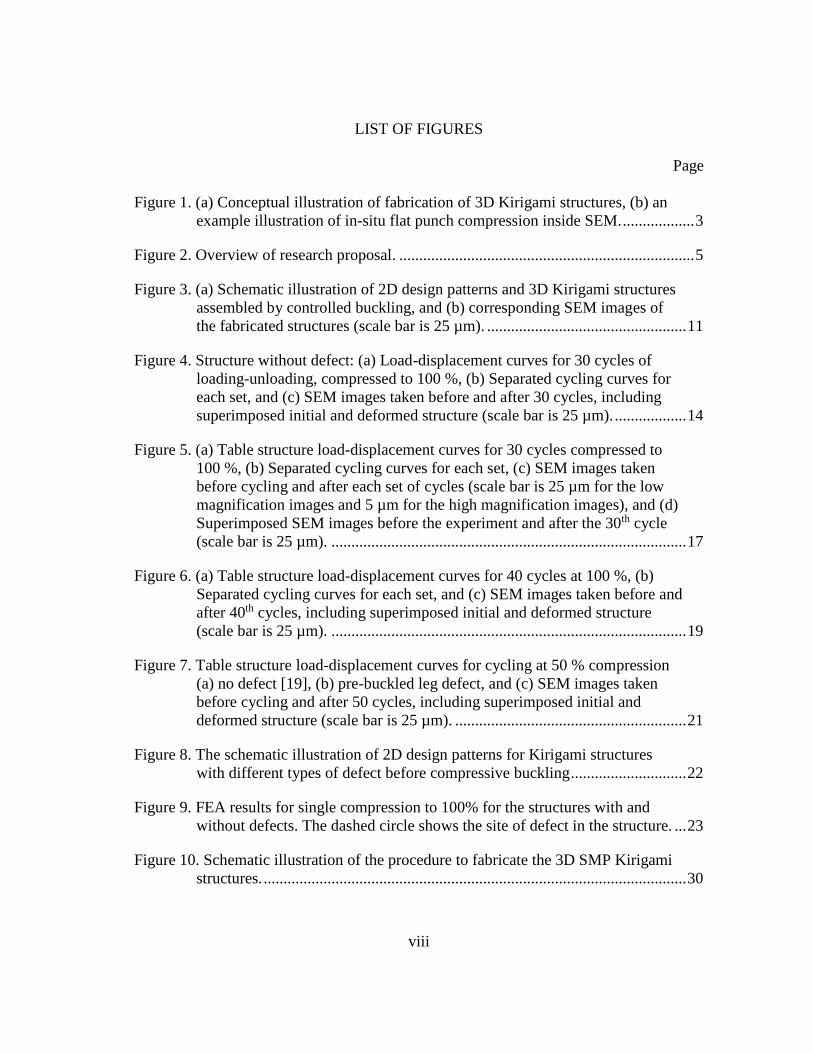
Figure 1. (a) Conceptual illustration of fabrication of 3D Kirigami structures, (b) an
example illustration of in-situ flat punch compression inside SEM. .................. 3
Figure 2. Overview of research proposal. .......................................................................... 5
Figure 3. (a) Schematic illustration of 2D design patterns and 3D Kirigami structures
assembled by controlled buckling, and (b) corresponding SEM images of
the fabricated structures (scale bar is 25 µm). .................................................. 11
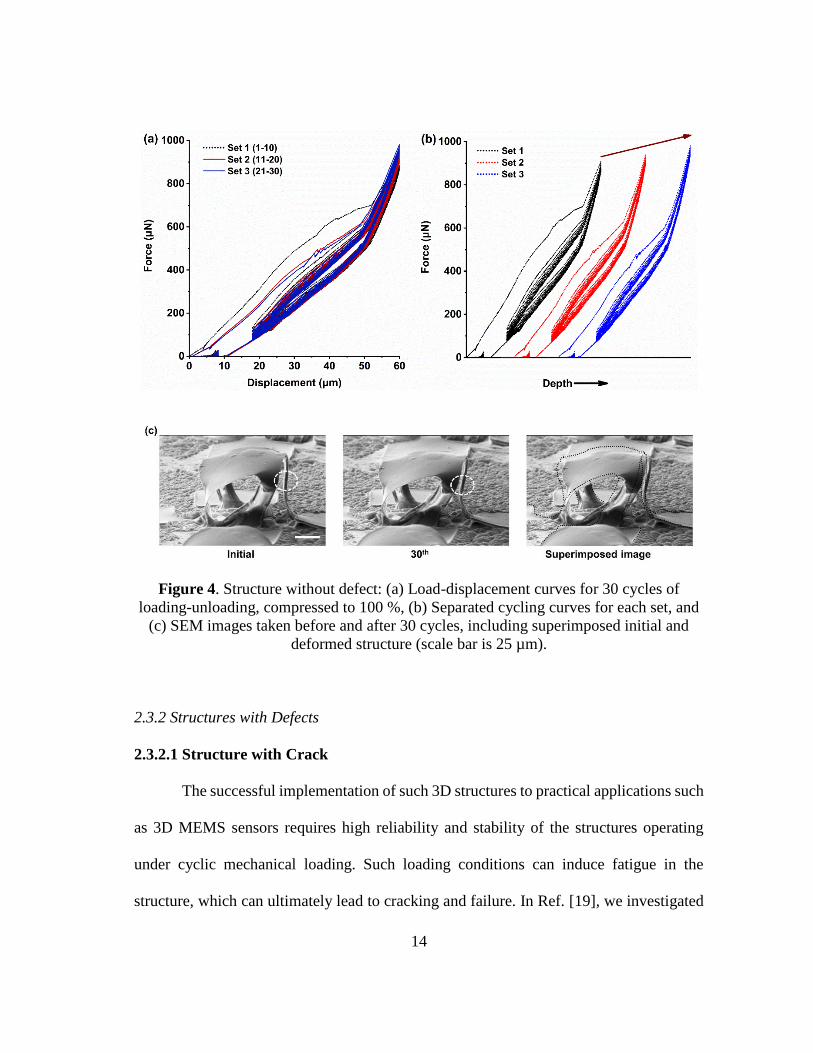
Figure 4. Structure without defect: (a) Load-displacement curves for 30 cycles of
loading-unloading, compressed to 100 %, (b) Separated cycling curves for
each set, and (c) SEM images taken before and after 30 cycles, including
superimposed initial and deformed structure (scale bar is 25 µm). .................. 14
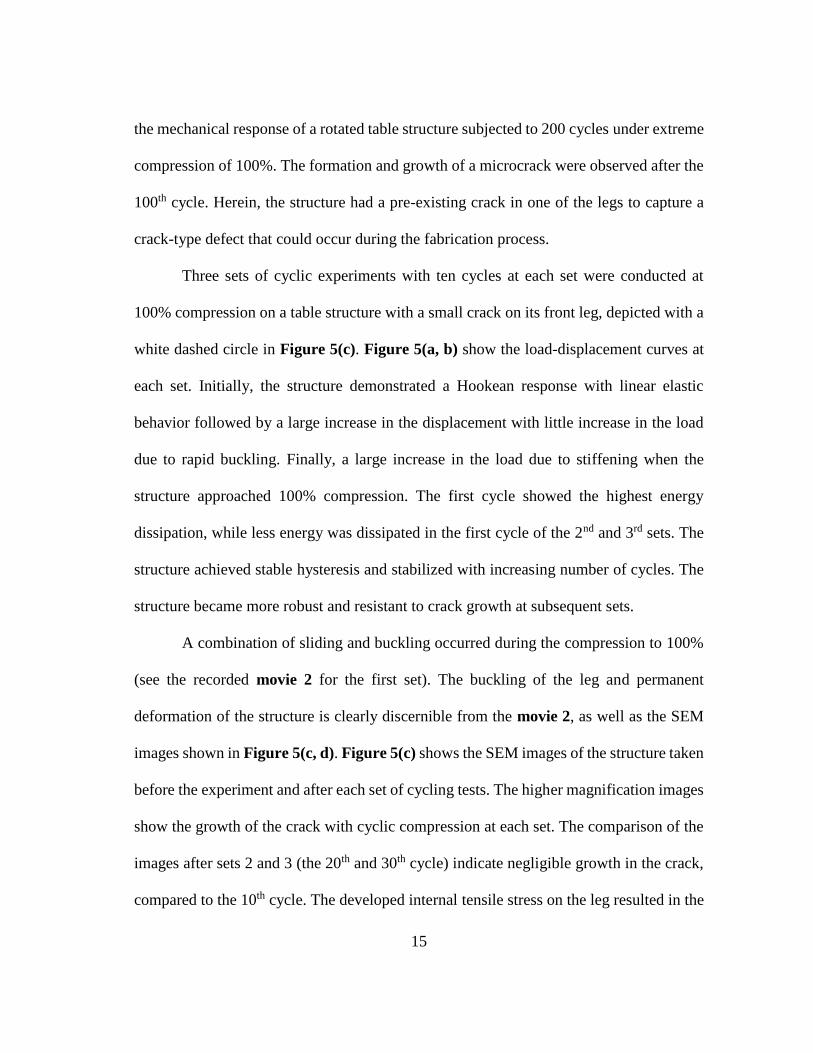
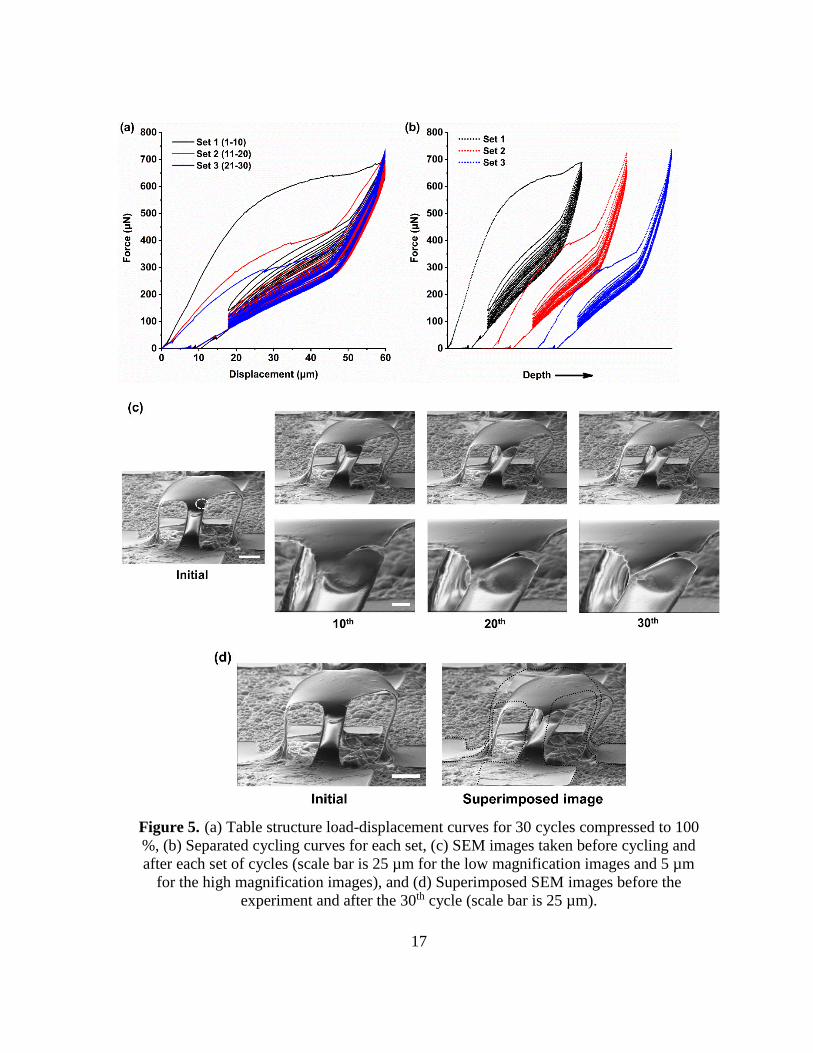
Figure 5. (a) Table structure load-displacement curves for 30 cycles compressed to
100 %, (b) Separated cycling curves for each set, (c) SEM images taken
before cycling and after each set of cycles (scale bar is 25 µm for the low
magnification images and 5 µm for the high magnification images), and (d)
Superimposed SEM images before the experiment and after the 30th cycle
(scale bar is 25 µm). ......................................................................................... 17
Figure 6. (a) Table structure load-displacement curves for 40 cycles at 100 %, (b)
Separated cycling curves for each set, and (c) SEM images taken before and
after 40th cycles, including superimposed initial and deformed structure
(scale bar is 25 µm). ......................................................................................... 19
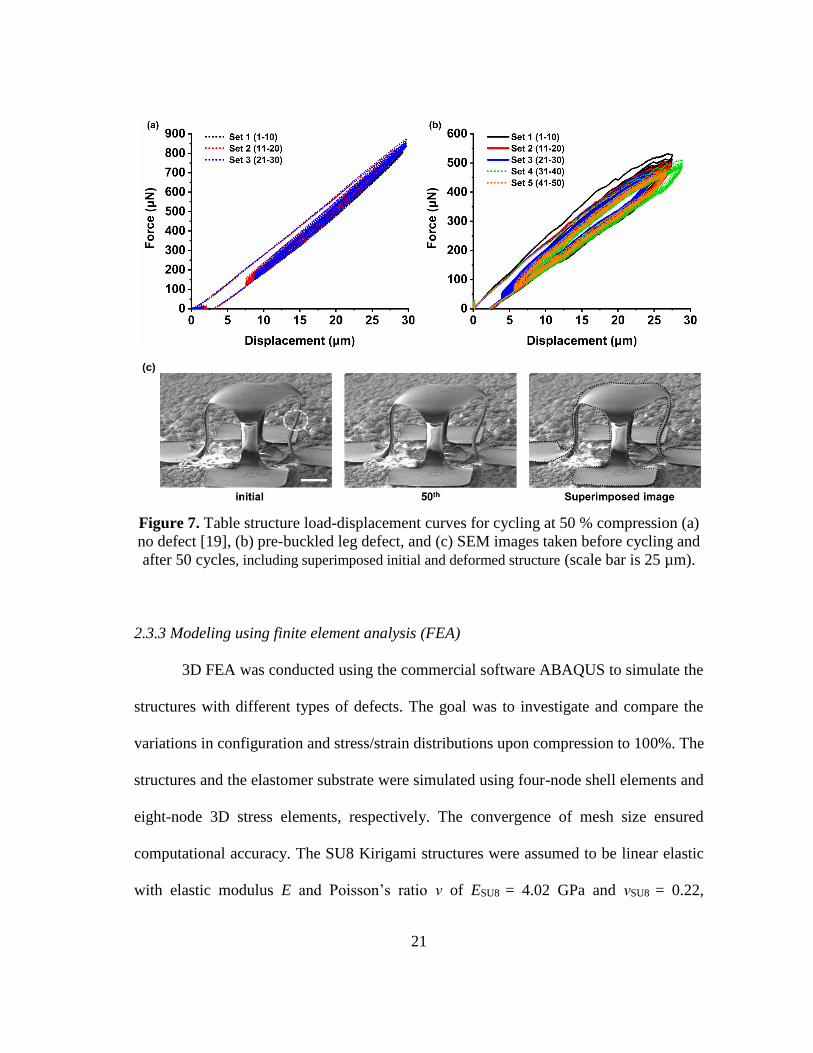
Figure 7. Table structure load-displacement curves for cycling at 50 % compression
(a) no defect [19], (b) pre-buckled leg defect, and (c) SEM images taken
before cycling and after 50 cycles, including superimposed initial and
deformed structure (scale bar is 25 µm). .......................................................... 21
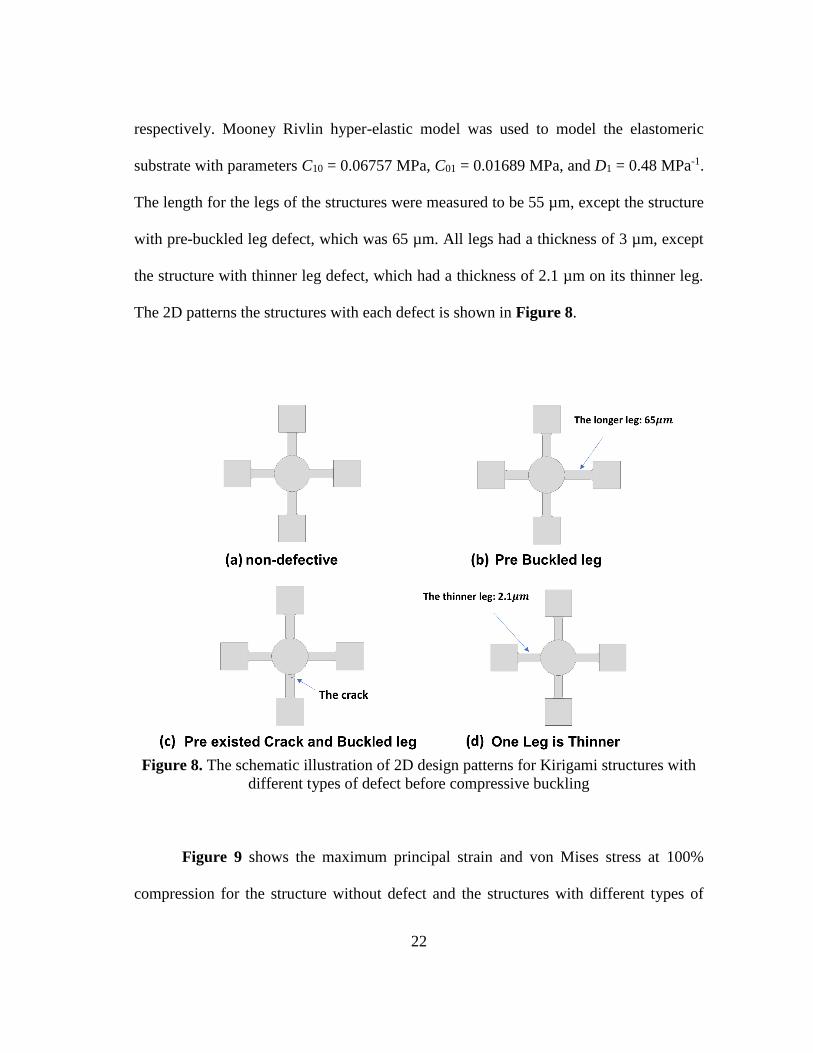
Figure 8. The schematic illustration of 2D design patterns for Kirigami structures
with different types of defect before compressive buckling ............................. 22
Figure 9. FEA results for single compression to 100% for the structures with and
without defects. The dashed circle shows the site of defect in the structure. ... 23
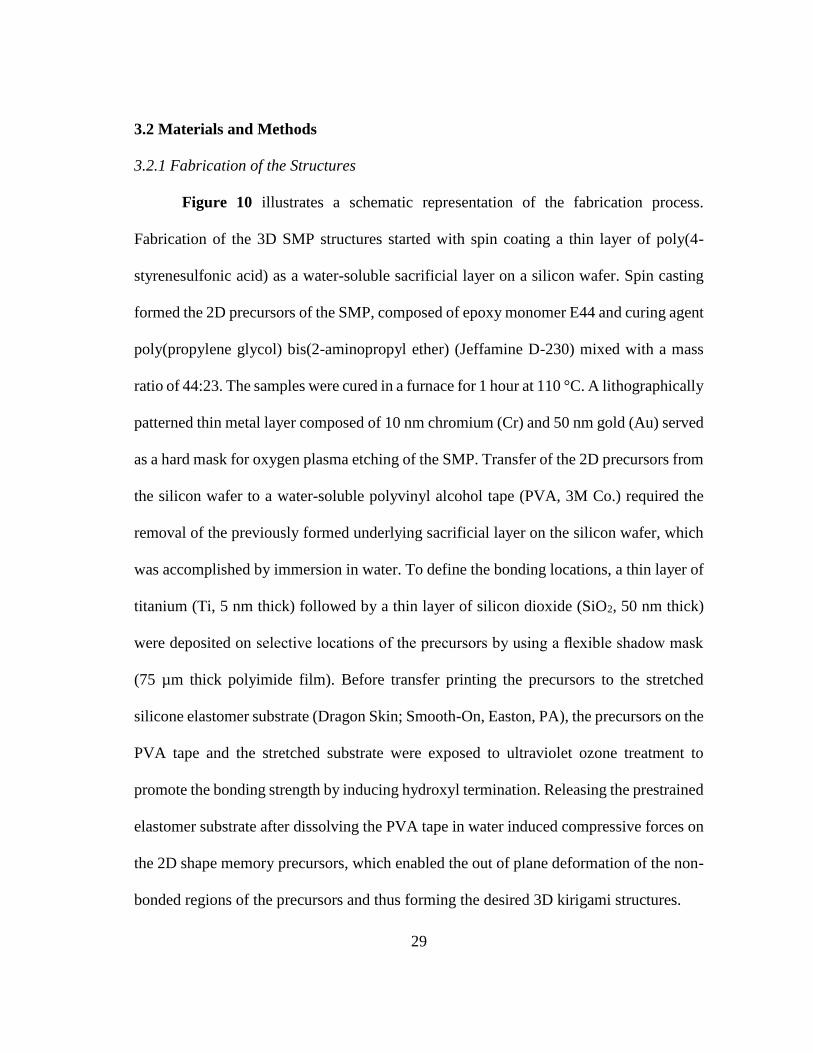
Figure 10. Schematic illustration of the procedure to fabricate the 3D SMP Kirigami
structures. .......................................................................................................... 30
ix
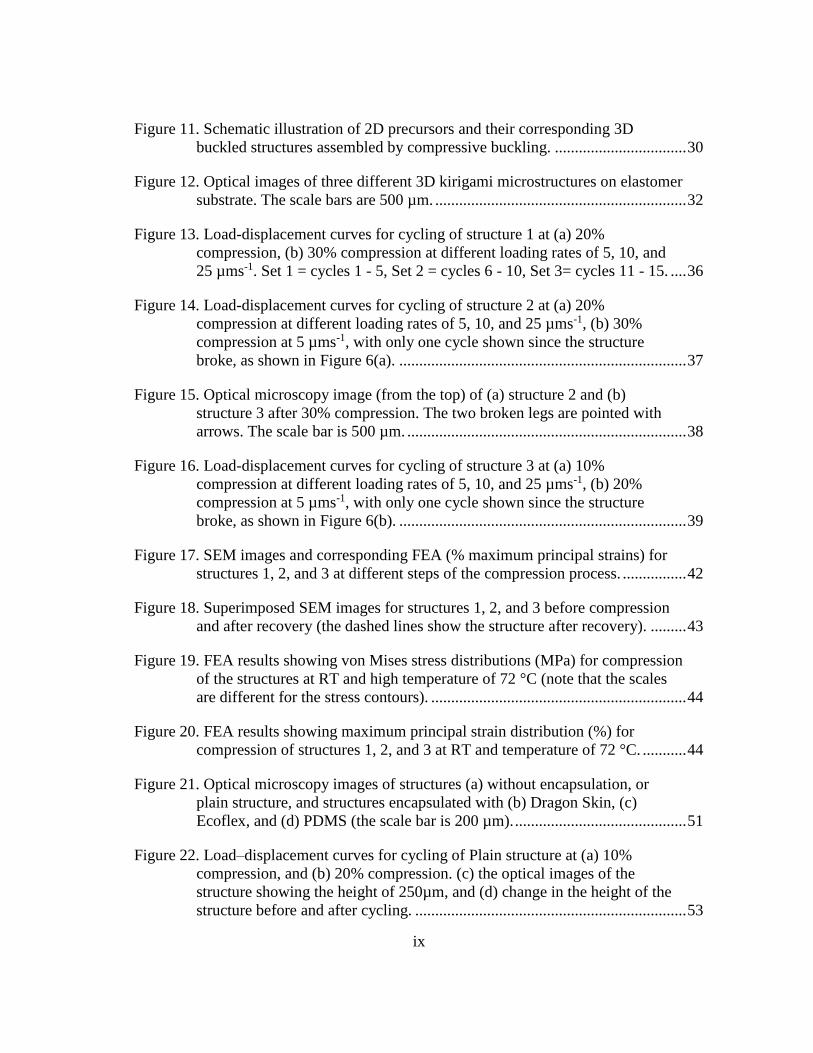
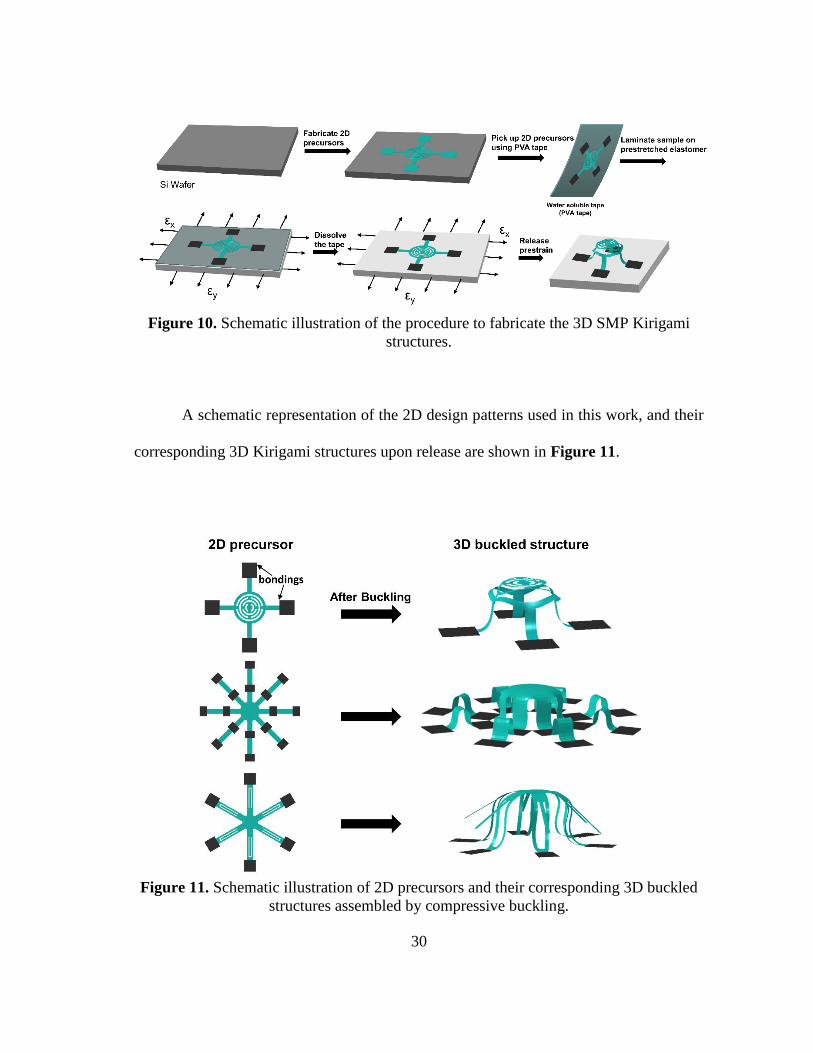
Figure 11. Schematic illustration of 2D precursors and their corresponding 3D
buckled structures assembled by compressive buckling. ................................. 30
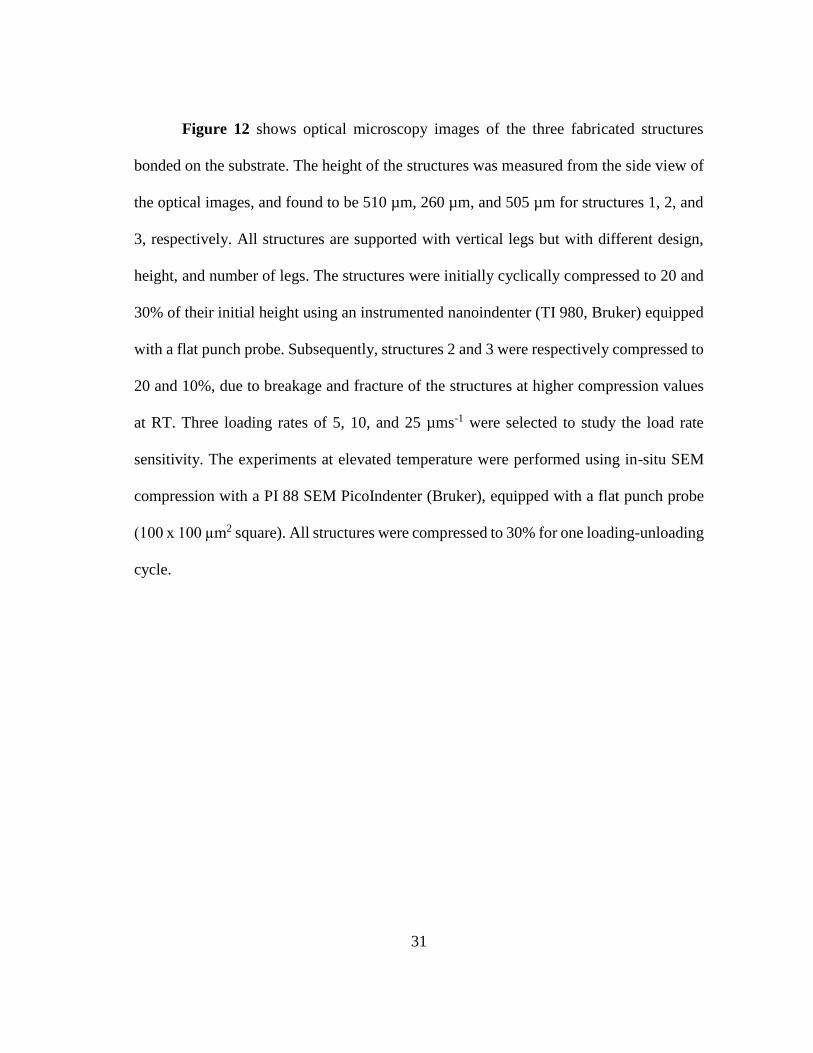
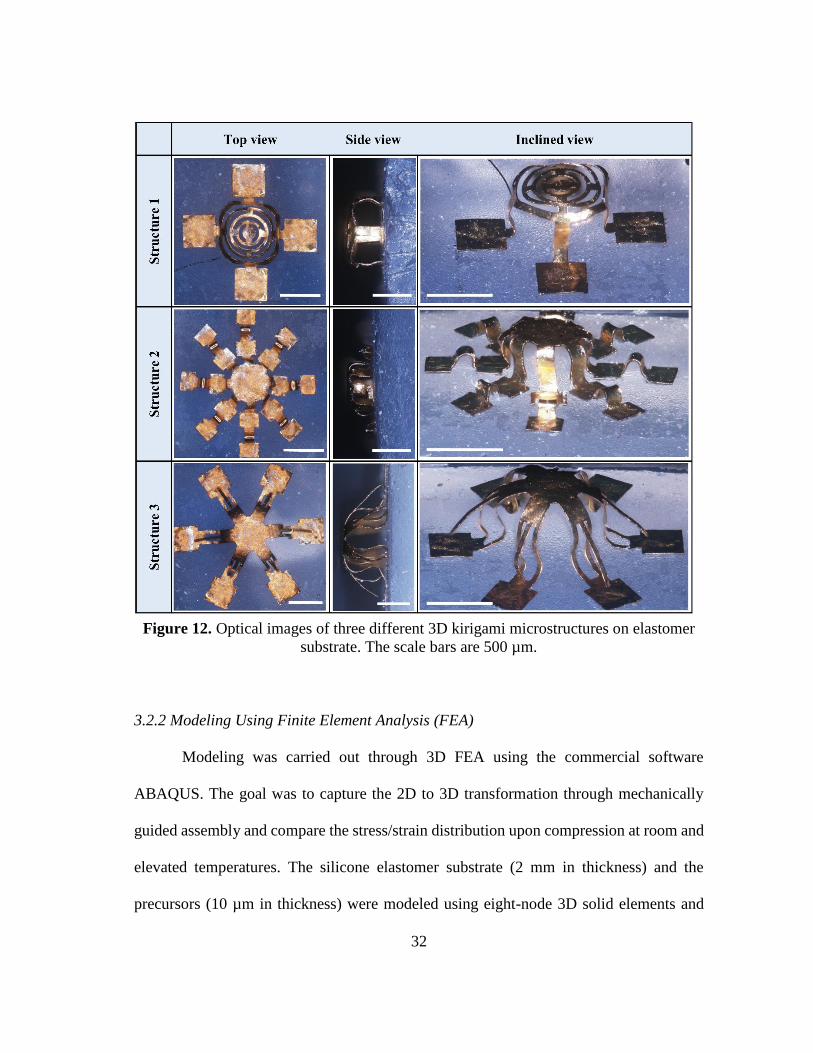
Figure 12. Optical images of three different 3D kirigami microstructures on elastomer
substrate. The scale bars are 500 µm. ............................................................... 32
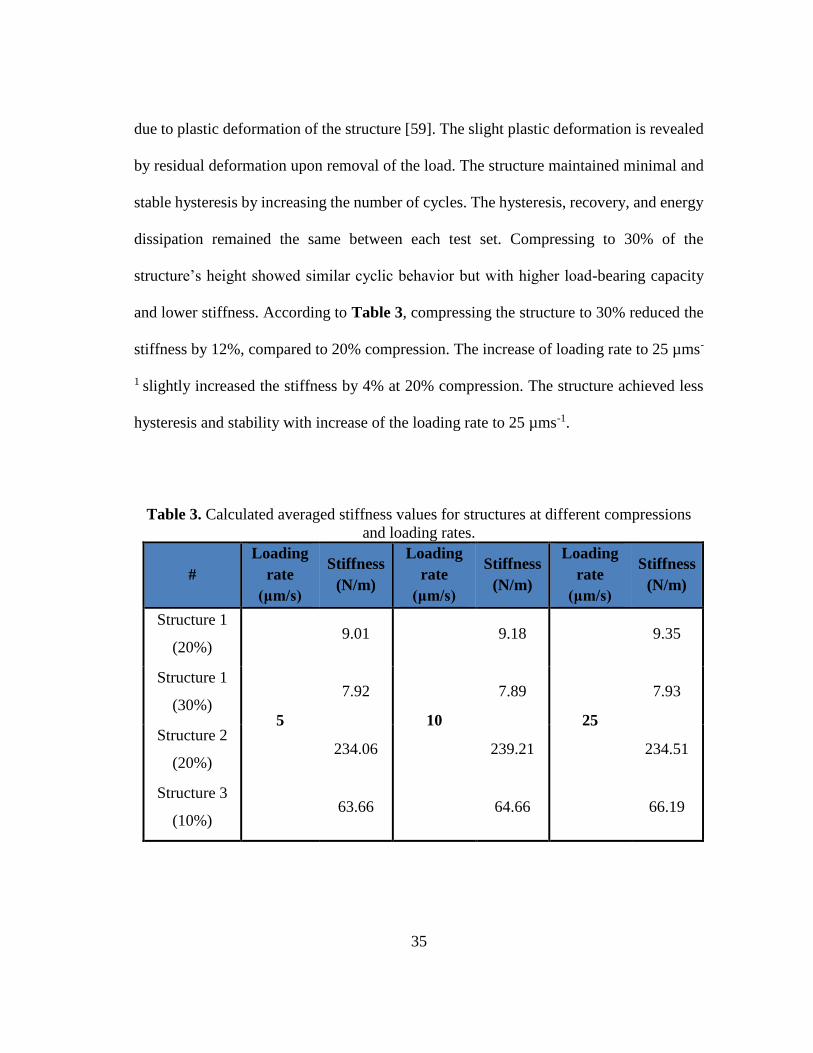
Figure 13. Load-displacement curves for cycling of structure 1 at (a) 20%
compression, (b) 30% compression at different loading rates of 5, 10, and
25 µms-1. Set 1 = cycles 1 - 5, Set 2 = cycles 6 - 10, Set 3= cycles 11 - 15. .... 36
Figure 14. Load-displacement curves for cycling of structure 2 at (a) 20%
compression at different loading rates of 5, 10, and 25 µms-1, (b) 30%
compression at 5 µms-1, with only one cycle shown since the structure
broke, as shown in Figure 6(a). ........................................................................ 37
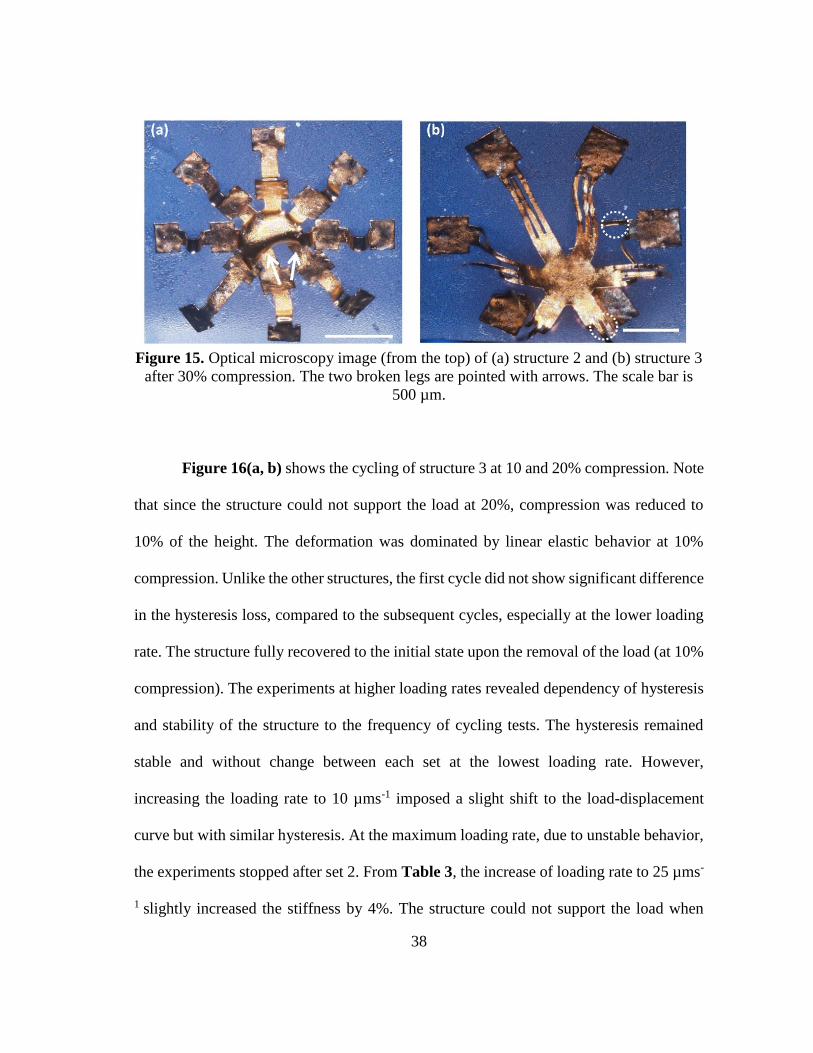
Figure 15. Optical microscopy image (from the top) of (a) structure 2 and (b)
structure 3 after 30% compression. The two broken legs are pointed with
arrows. The scale bar is 500 µm. ...................................................................... 38
Figure 16. Load-displacement curves for cycling of structure 3 at (a) 10%
compression at different loading rates of 5, 10, and 25 µms-1, (b) 20%
compression at 5 µms-1, with only one cycle shown since the structure
broke, as shown in Figure 6(b). ........................................................................ 39
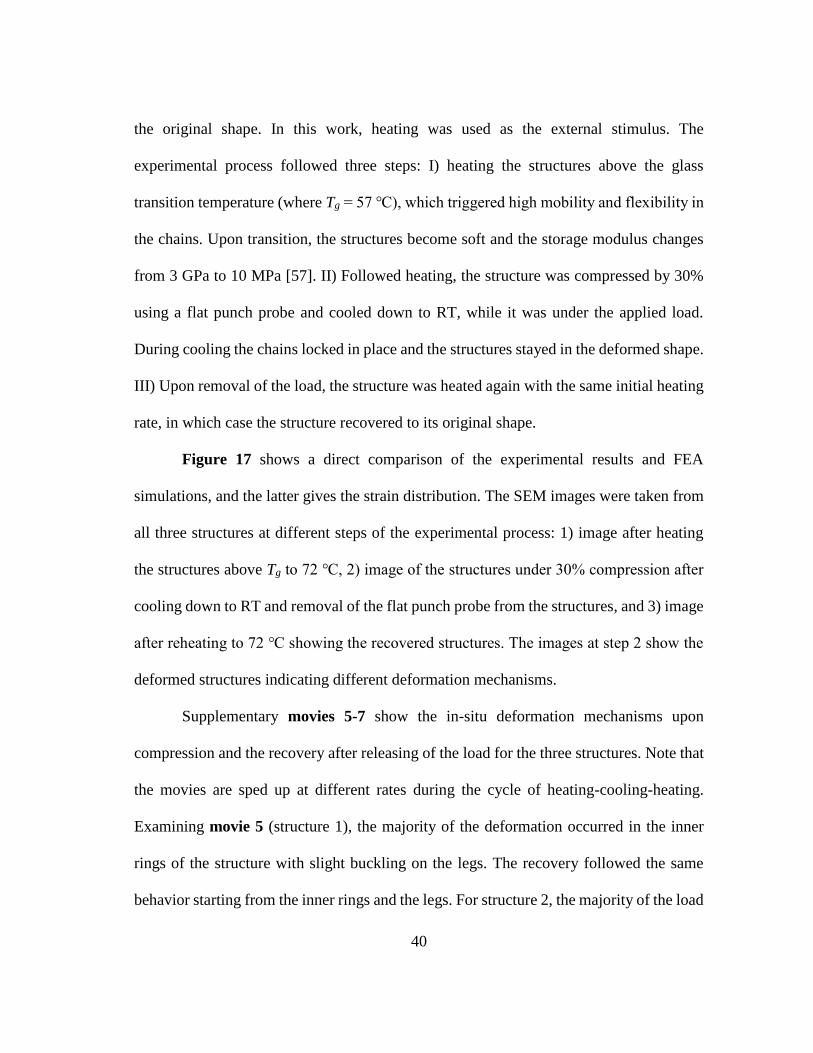
Figure 17. SEM images and corresponding FEA (% maximum principal strains) for
structures 1, 2, and 3 at different steps of the compression process. ................ 42
Figure 18. Superimposed SEM images for structures 1, 2, and 3 before compression
and after recovery (the dashed lines show the structure after recovery). ......... 43
Figure 19. FEA results showing von Mises stress distributions (MPa) for compression
of the structures at RT and high temperature of 72 °C (note that the scales
are different for the stress contours). ................................................................ 44
Figure 20. FEA results showing maximum principal strain distribution (%) for
compression of structures 1, 2, and 3 at RT and temperature of 72 °C. ........... 44
Figure 21. Optical microscopy images of structures (a) without encapsulation, or
plain structure, and structures encapsulated with (b) Dragon Skin, (c)
Ecoflex, and (d) PDMS (the scale bar is 200 µm). ........................................... 51
Figure 22. Load–displacement curves for cycling of Plain structure at (a) 10%
compression, and (b) 20% compression. (c) the optical images of the
structure showing the height of 250µm, and (d) change in the height of the
structure before and after cycling. .................................................................... 53
x
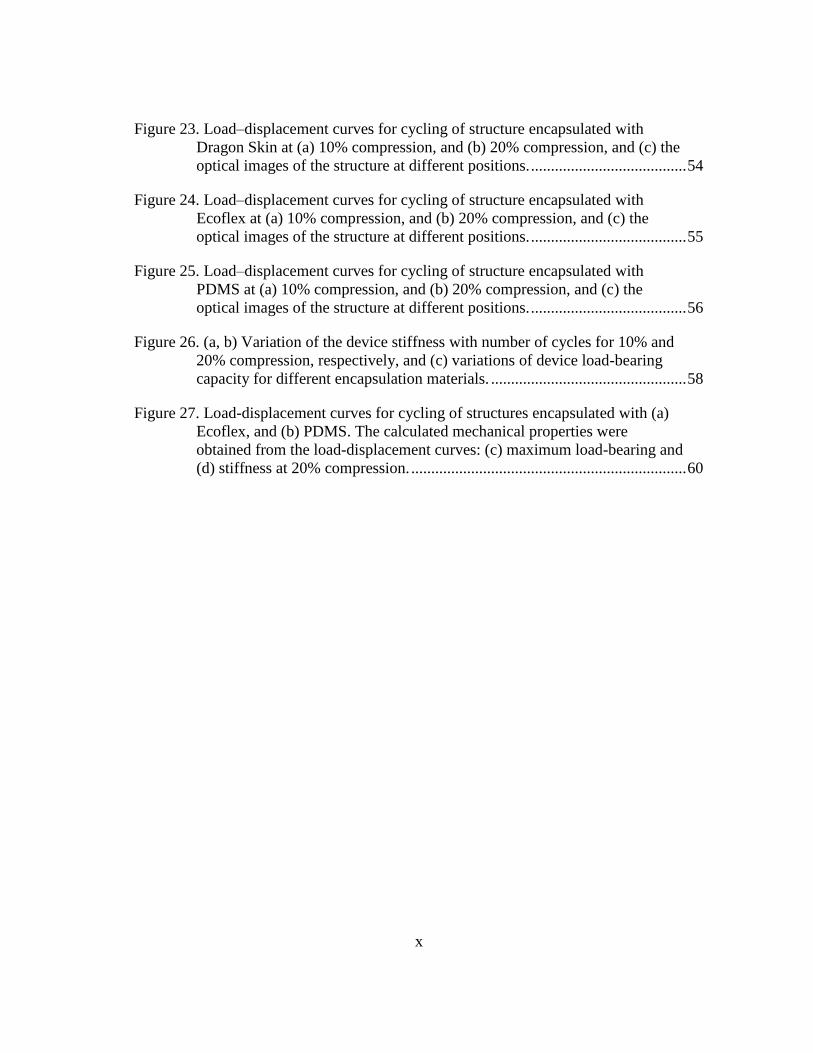
Figure 23. Load–displacement curves for cycling of structure encapsulated with
Dragon Skin at (a) 10% compression, and (b) 20% compression, and (c) the
optical images of the structure at different positions. ....................................... 54
Figure 24. Load–displacement curves for cycling of structure encapsulated with
Ecoflex at (a) 10% compression, and (b) 20% compression, and (c) the
optical images of the structure at different positions. ....................................... 55
Figure 25. Load–displacement curves for cycling of structure encapsulated with
PDMS at (a) 10% compression, and (b) 20% compression, and (c) the
optical images of the structure at different positions. ....................................... 56
Figure 26. (a, b) Variation of the device stiffness with number of cycles for 10% and
20% compression, respectively, and (c) variations of device load-bearing
capacity for different encapsulation materials. ................................................. 58
Figure 27. Load-displacement curves for cycling of structures encapsulated with (a)
Ecoflex, and (b) PDMS. The calculated mechanical properties were
obtained from the load-displacement curves: (c) maximum load-bearing and
(d) stiffness at 20% compression. ..................................................................... 60
xi
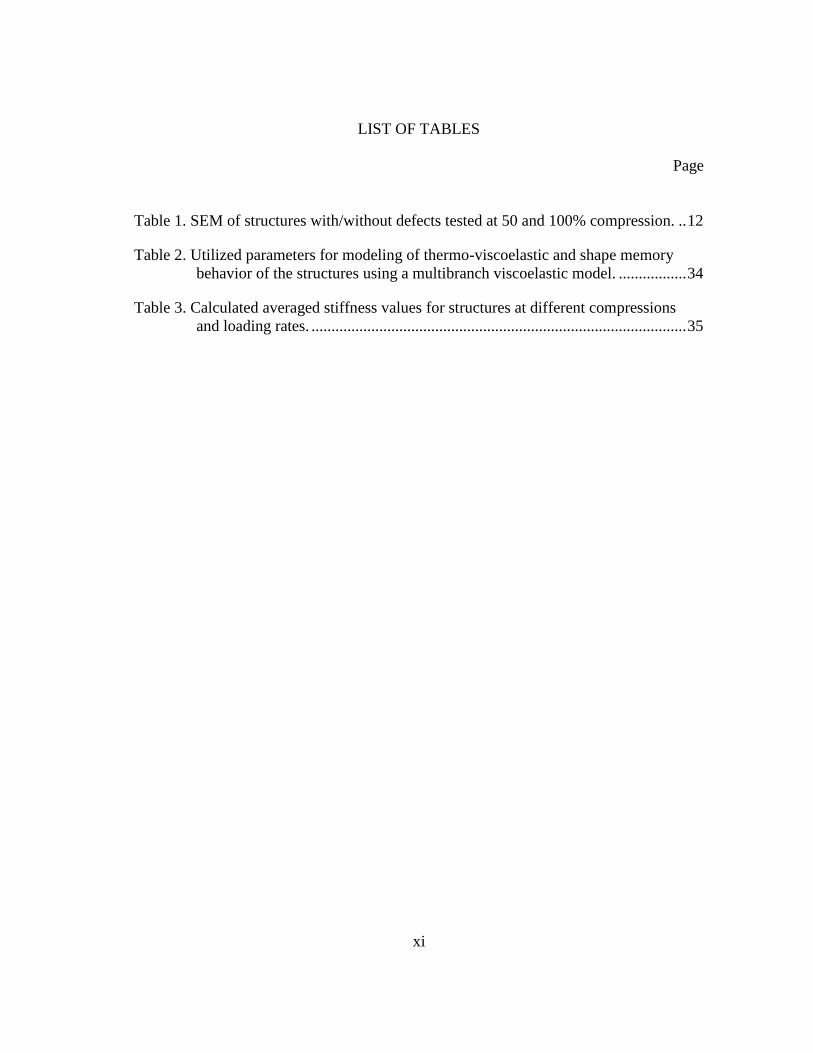
LIST OF TABLES
Page
Table 1. SEM of structures with/without defects tested at 50 and 100% compression. .. 12
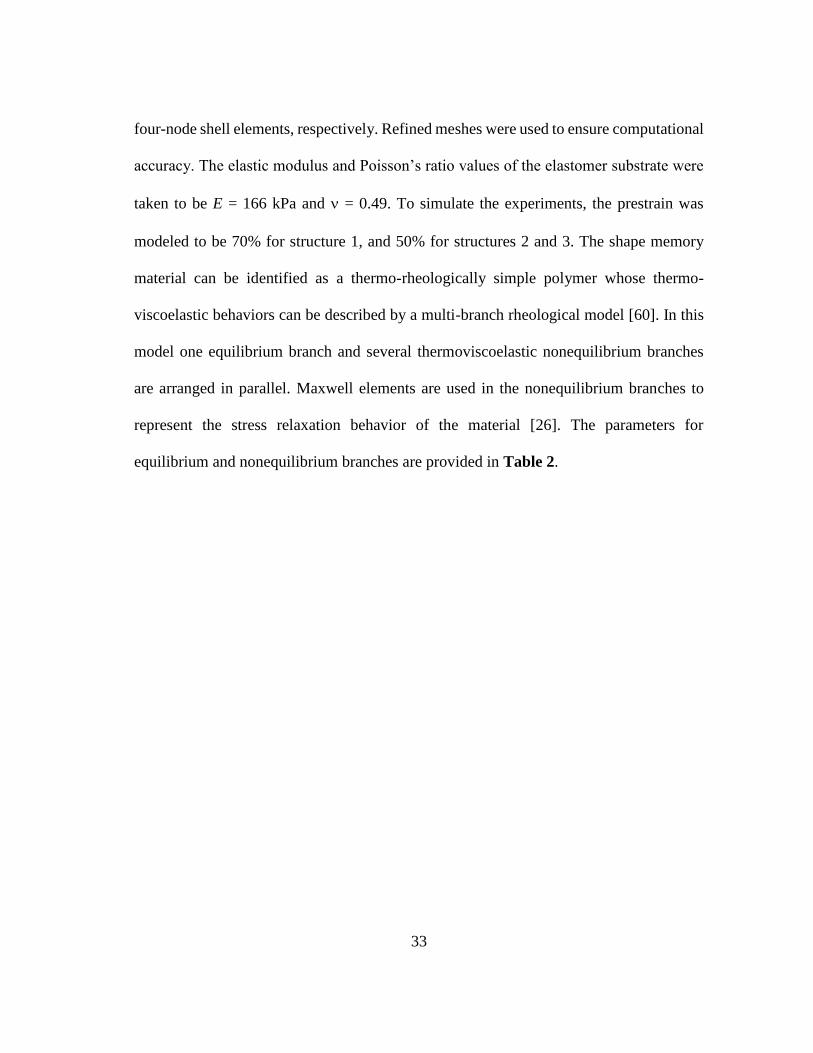
Table 2. Utilized parameters for modeling of thermo-viscoelastic and shape memory
behavior of the structures using a multibranch viscoelastic model. ................. 34
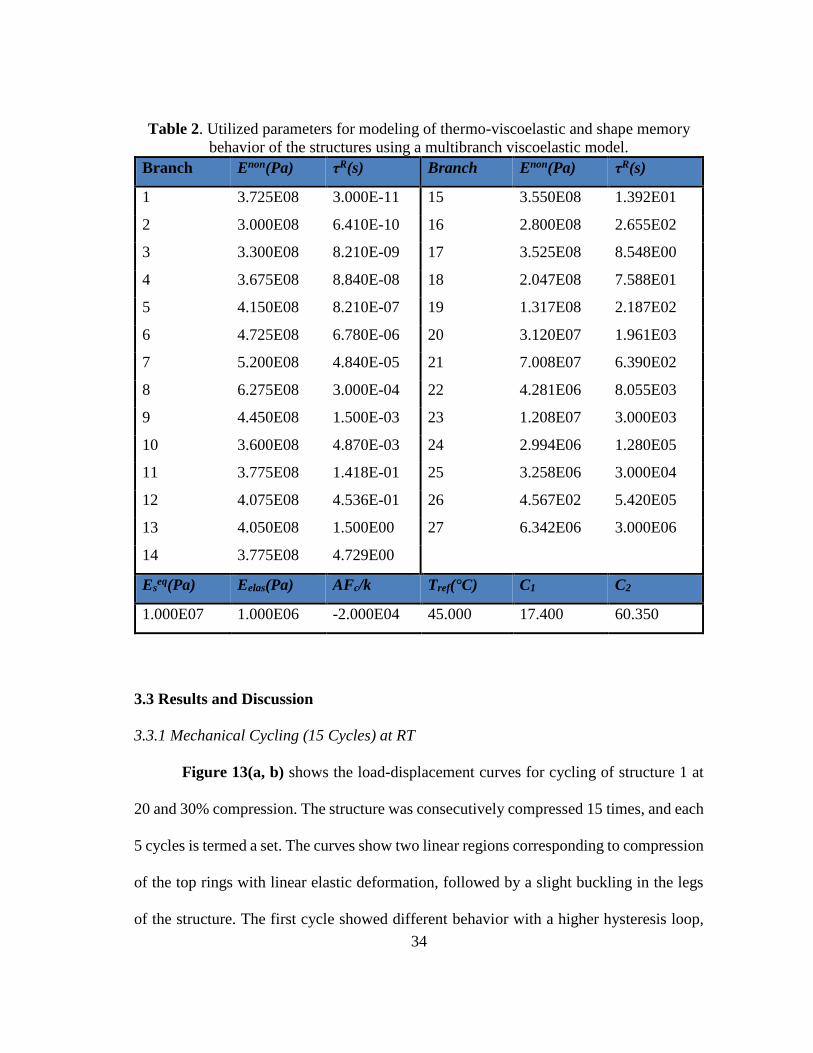
Table 3. Calculated averaged stiffness values for structures at different compressions
and loading rates. .............................................................................................. 35
1
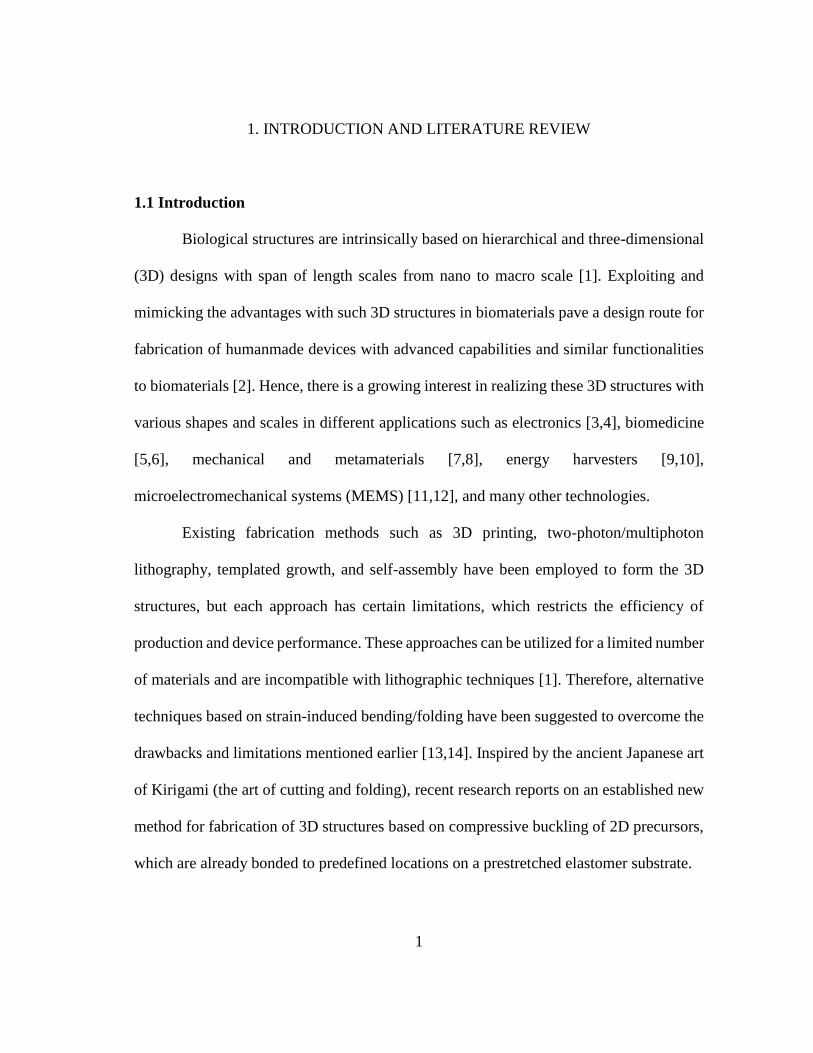
1. INTRODUCTION AND LITERATURE REVIEW
1.1 Introduction
Biological structures are intrinsically based on hierarchical and three-dimensional
(3D) designs with span of length scales from nano to macro scale [1]. Exploiting and
mimicking the advantages with such 3D structures in biomaterials pave a design route for
fabrication of humanmade devices with advanced capabilities and similar functionalities
to biomaterials [2]. Hence, there is a growing interest in realizing these 3D structures with
various shapes and scales in different applications such as electronics [3,4], biomedicine
[5,6], mechanical and metamaterials [7,8], energy harvesters [9,10],
microelectromechanical systems (MEMS) [11,12], and many other technologies.
Existing fabrication methods such as 3D printing, two-photon/multiphoton
lithography, templated growth, and self-assembly have been employed to form the 3D
structures, but each approach has certain limitations, which restricts the efficiency of
production and device performance. These approaches can be utilized for a limited number
of materials and are incompatible with lithographic techniques [1]. Therefore, alternative
techniques based on strain-induced bending/folding have been suggested to overcome the
drawbacks and limitations mentioned earlier [13,14]. Inspired by the ancient Japanese art
of Kirigami (the art of cutting and folding), recent research reports on an established new
method for fabrication of 3D structures based on compressive buckling of 2D precursors,
which are already bonded to predefined locations on a prestretched elastomer substrate.
2
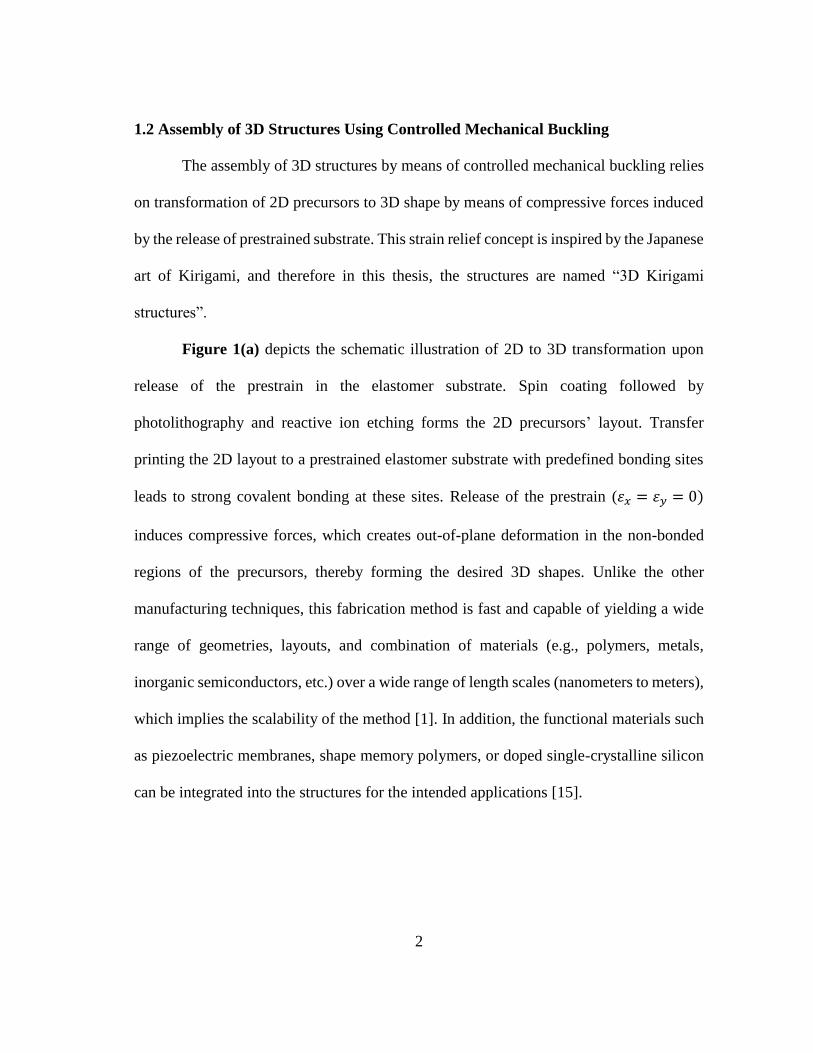
1.2 Assembly of 3D Structures Using Controlled Mechanical Buckling
The assembly of 3D structures by means of controlled mechanical buckling relies
on transformation of 2D precursors to 3D shape by means of compressive forces induced
by the release of prestrained substrate. This strain relief concept is inspired by the Japanese
art of Kirigami, and therefore in this thesis, the structures are named “3D Kirigami
structures”.
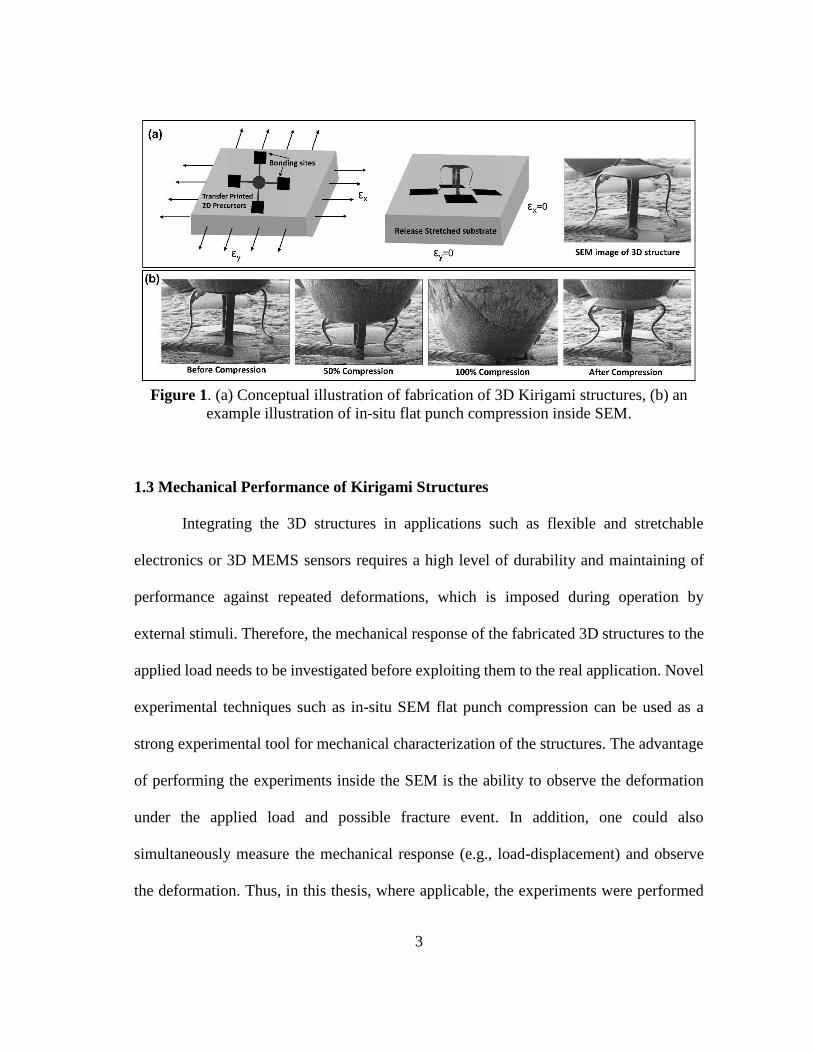
Figure 1(a) depicts the schematic illustration of 2D to 3D transformation upon
release of the prestrain in the elastomer substrate. Spin coating followed by
photolithography and reactive ion etching forms the 2D precursors’ layout. Transfer
printing the 2D layout to a prestrained elastomer substrate with predefined bonding sites
leads to strong covalent bonding at these sites. Release of the prestrain (𝜀𝑥 = 𝜀𝑦 = 0)
induces compressive forces, which creates out-of-plane deformation in the non-bonded
regions of the precursors, thereby forming the desired 3D shapes. Unlike the other
manufacturing techniques, this fabrication method is fast and capable of yielding a wide
range of geometries, layouts, and combination of materials (e.g., polymers, metals,
inorganic semiconductors, etc.) over a wide range of length scales (nanometers to meters),
which implies the scalability of the method [1]. In addition, the functional materials such
as piezoelectric membranes, shape memory polymers, or doped single-crystalline silicon
can be integrated into the structures for the intended applications [15].
3
Figure 1. (a) Conceptual illustration of fabrication of 3D Kirigami structures, (b) an
example illustration of in-situ flat punch compression inside SEM.
1.3 Mechanical Performance of Kirigami Structures
Integrating the 3D structures in applications such as flexible and stretchable
electronics or 3D MEMS sensors requires a high level of durability and maintaining of
performance against repeated deformations, which is imposed during operation by
external stimuli. Therefore, the mechanical response of the fabricated 3D structures to the
applied load needs to be investigated before exploiting them to the real application. Novel
experimental techniques such as in-situ SEM flat punch compression can be used as a
strong experimental tool for mechanical characterization of the structures. The advantage
of performing the experiments inside the SEM is the ability to observe the deformation
under the applied load and possible fracture event. In addition, one could also
simultaneously measure the mechanical response (e.g., load-displacement) and observe
the deformation. Thus, in this thesis, where applicable, the experiments were performed
4
inside SEM to investigate the deformation behavior of different fabricated 3D Kirigami
structures. Figure 1(b) shows an example to illustrate the in-situ SEM experimental
method. Before the experiment, the flat punch is brought to the proximity of the top
membrane, and then the experiment begins by compressing the structures to different
percentage of the height. For example, 50% compression denotes compressing to 50% of
the structure’s height.
1.4 Objectives and Outlines
A large number of studies have been performed to realize different classes of
Kirigami-inspired 3D structures with different 3D layouts, materials, and sizes [1,16,17].
Nonetheless, little is known about the mechanics of these structures, and only a few studies
have investigated the deformation behavior [15,18,19]. Therefore, this work is dedicated
to studying the mechanics of various 3D Kirigami structures made of different materials
such as SU8 epoxy, shape memory polymers, and polyimides, each intended for different
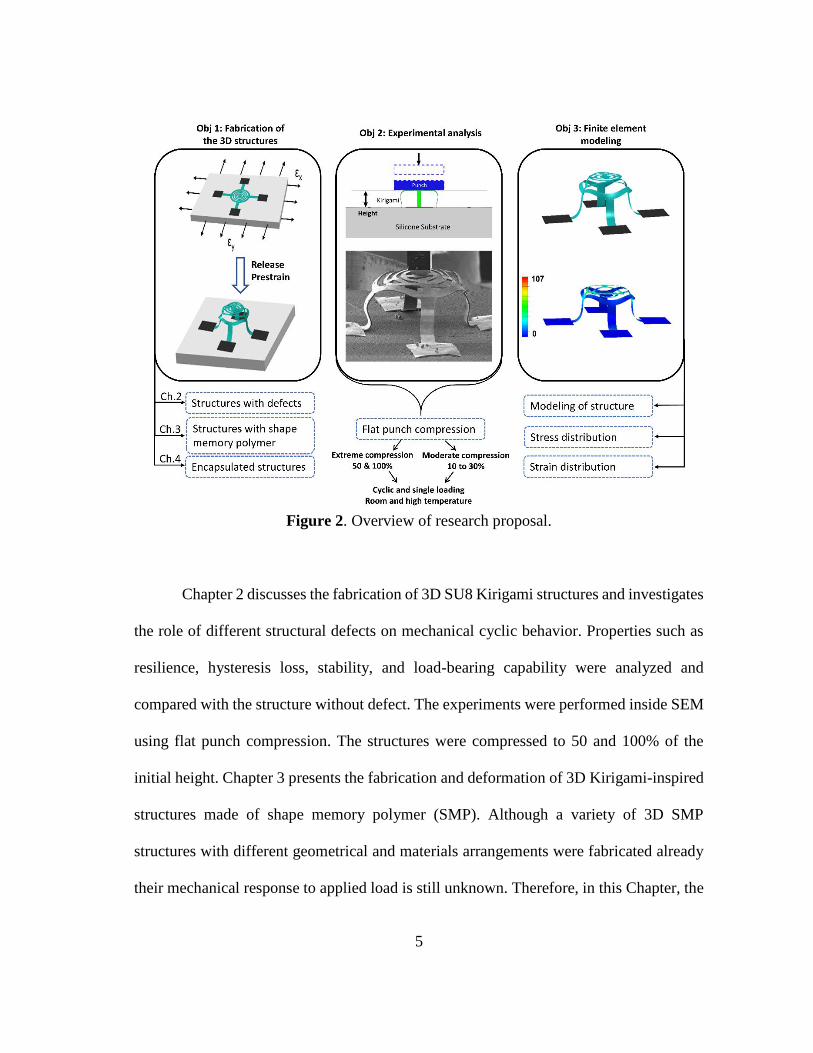
applications. Figure 2 illustrates an overview of the research ideas and the objectives that
will be met throughout the thesis. 3D Kirigami structures were fabricated using
compressive buckling method. The structures were made of different materials, namely
SU8 epoxy, E44 shape memory epoxy, and polyimide (PI). The PI structures were
encapsulated with different polymers to fabricate a more realistic type structure utilized in
the applications. The mechanical response of assembled structures was studied through
mechanical cyclic and single loading compression at room and elevated temperatures.
Computational modeling was implemented for supporting the experimental findings and
better understanding of deformation and fracture of the structures.
5
Figure 2. Overview of research proposal.
Chapter 2 discusses the fabrication of 3D SU8 Kirigami structures and investigates
the role of different structural defects on mechanical cyclic behavior. Properties such as
resilience, hysteresis loss, stability, and load-bearing capability were analyzed and
compared with the structure without defect. The experiments were performed inside SEM
using flat punch compression. The structures were compressed to 50 and 100% of the
initial height. Chapter 3 presents the fabrication and deformation of 3D Kirigami-inspired
structures made of shape memory polymer (SMP). Although a variety of 3D SMP
structures with different geometrical and materials arrangements were fabricated already
their mechanical response to applied load is still unknown. Therefore, in this Chapter, the
6
mechanics of these Kirigami structures were studied at room and elevated temperatures.
In Chapter 4, the PI was used as the material for fabrication of the structures. In addition,
piezoelectric monocrystalline Si-NM elements were integrated into the precursors, and
thereafter the entire structures were encapsulated with a thin coating of different polymers.
The information presented in this thesis should be of great interest in understanding
the mechanics of 3D polymer-based Kirigami-inspired structures. The work is expected
to contribute to the current and future research on the development of flexible and
stretchable electronics, biomedical devices as in tissue repair and vascular stents, as well
as adaptive and deployable structures in aerospace engineering.
7
2. THE EFFECT OF DEFECTS ON THE CYCLIC BEHAVIOR OF POLYMERIC 3D
KIRIGAMI STRUCTURES1
Recent advances in the assembly of three-dimensional (3D) structures driven by
compressive buckling have provided an opportunity to exploit the capability in a broad
range of engineering applications. These include microelectromechanical systems, energy
storage, and wearable electronic devices. The occurrence of defects during fabrication and
assembly, or during operation could impact the performance of the devices. Herein, we
investigate the mechanical cycling of structures with different types of structural defects,
including the presence of a pre-existing crack, structures with a thinner leg, and a pre-
buckled leg. Studies of compressive cycling response of these microscale 3D polymer-
based Kirigami architectures revealed stiffening behavior for both defective and non-
defective structures. Structural densification, developed internal stress, and deformation
of the elastomer substrate were the reasons for stiffening. Cyclic compression was
performed to 50% and extreme condition of 100 % of the initial height using in-situ
scanning electron microscopy. The structures were found to achieve stable hysteretic
cycling with steady-state mechanical response after a number of cycles. The deformation
behavior, the structure stability under cyclic loading, and the load-bearing capability were
found to be dependent on the defect type, but they were not catastrophic.
1Reprinted with permission from “The effect of defects on the cyclic behavior of polymeric 3D kirigami
structures” by Bashandeh K, Humood M, Lee J, Han M, Cui Y, Shi Y, Huang Y, Rogers JA,
Polycarpou AA, Extreme Mechanics Letters. 2020, 18:100650. Copyright 2020 Elsevier.
8
2.1 Introduction
Three-dimensional (3D) architectures have emerged as a promising replacement
of conventional two-dimensional (2D) structures, due to their application in nano/micro
electromechanical systems (NEMS/MEMS) [12,20,21], biomedical devices [22,23],
energy storage devices [24,25], stretchable and wearable electronics[26,27], robotics
[21,28], and elsewhere [29–31]. With recent advances in fabrication techniques, such as
strain-induced folding/bending and compressive buckling, inspired by the ancient art of
origami/kirigami, various programmed configurations and scales of 3D structures, from
sub-micron to macro-scales can be realized from 2D patterns [1,12]. In this work, the
compressive forces created by releasing the prestrained elastomer transform the non-
bonded regions of 2D precursors into the desired 3D Kirigami shapes [2].
The successful implementation of such 3D structures in practical applications
requires a high level of efficiency and reliability. For example, the mechanical reliability
of MEMS devices is a critical concern that must be considered from design to fabrication,
and ultimately functionality [32,33]. The ideal situation for structures in applications such
as 3D MEMS, sensors, or energy harvesting devices, is to sustain the external load and
associated repeated deformation for extended periods of time. Factors such as geometry
and thickness of the structure, the level and number of cyclic loading, and defect-induced
degradation during fabrication process, could limit this lifetime and lead to unwanted
malfunctioning of the devices.
In an earlier study, we investigated the mechanical resilience of different
geometries of 3D kirigami structures under single compressive loading, and found a strong
9
geometric dependent mechanical behavior in terms of flexibility and elastic recovery [18].
Energy dissipation and durability of these structures under repeated compressive cyclic
loading were also examined [19]. The structures demonstrated elastic behavior with
minimal hysteresis by compressing to 50% of their height. At the extreme condition of
cycling to 100% compression, the structures achieved stable hysteresis after few cycles
and 94% elastic recovery.
Herein, we investigate the mechanical responses of 3D Kirigami-inspired
structures with different types of defects. In any microfabrication process, the aim is
always to increase the yield. However, sometimes defects are introduced in these
structures at different steps of the process. Since buckling is a defect-dependent
deformation, it is essential to investigate how these structures behave under compressive
loading with the existence of such defects. 3D structures with defects were fabricated
using a controlled compressive buckling approach and mechanically tested under cyclic
compressive loading using in-situ scanning electron microscopy (SEM).
2.2 Materials and Methods
Fabrication of the 3D structures started with patterning of 2D precursors of epoxy
(SU-8, 3 µm thickness) by spin coating and photolithography on a layer of silicon dioxide
(SiO2, 800 nm thickness), which was previously formed on a silicon wafer by thermal
oxidation. The exposed regions of the SiO2 layer were then removed by wet etching in
diluted hydrofluoric acid (HF). Spin coating and photolithography were used again to form
another layer of photoresist (AZ 5214, 4 µm thickness) on the non-bonded regions of the
precursors. The remaining buried SiO2 layer under the precursors was eliminated by
10
another HF wet etching process, to facilitate the transfer printing of the precursors from
the Si wafer to another silicone elastomer substrate (Dragon Skin, 600 µm thickness). A
layer of titanium (5 nm thickness) and SiO2 (50 nm thickness) were deposited on the
precursors by electron beam evaporation to enhance the adhesion of the bonding regions
of the precursors with the elastomer substrate.
The 2D patterns were then transfer printed from the Si wafer to a water-soluble
polyvinyl alcohol (PVA) tape using a polydimethylsiloxane (PDMS) stamp. To form a
strong bonding between the elastomer substrate and the precursors, the silicone elastomer
and the precursors on the PVA tape were exposed to ultraviolet-induced ozone treatment,
which formed a hydroxyl termination. The elastomer was then biaxially stretched to 75%
prestrain with a mechanical stage. The PVA tape and the 2D precursors were then
laminated on the stretched elastomer substrate and baked at 70 °C for 8 min to yield a
strong bond between the substrate and the bonding regions of the precursors. Thereafter,
the PVA tape and photoresist layer were removed using hot water and acetone,
respectively. Releasing the prestrained elastomer substrate induced compressive forces
which enabled the out-of-plane deformation of the non-bonded regions of the precursors,
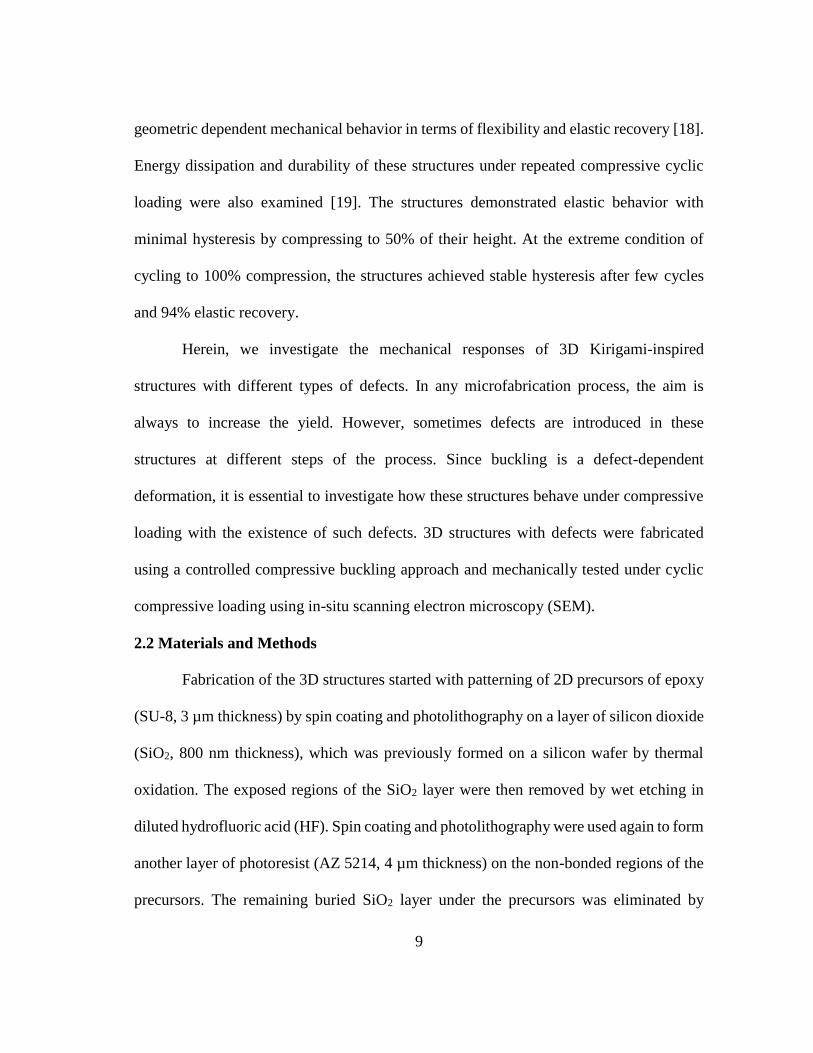
forming the desired 3D shapes. A schematic representation of the 2D patterns and their
transformation to 3D structures upon releasing the elastomer is illustrated in Figure 3, for
a table structure without defect and with a crack type defect. Each resulting nominal
kirigami structure is made of 3 µm thickness SU-8, and a height of 60 µm.
11
Figure 3. (a) Schematic illustration of 2D design patterns and 3D Kirigami structures
assembled by controlled buckling, and (b) corresponding SEM images of the fabricated
structures (scale bar is 25 µm).
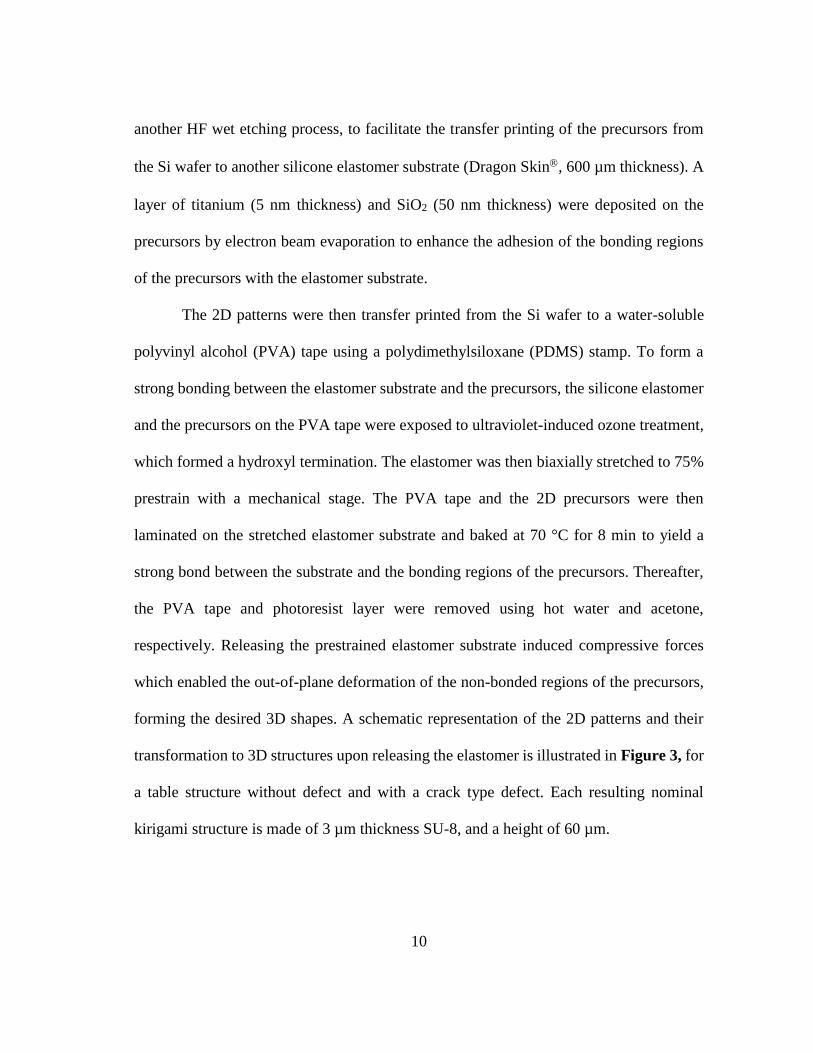
The mechanical cyclic compression experiments were carried out on the structures
with/without defects (shown in Table 1) using a commercial PI 88 SEM Picoindenter
(Bruker) equipped with a diamond flat punch probe with a diameter of 100 µm. The
samples were sputter-coated with 8 nm of Pt/Pd for better visualization inside the SEM.
A displacement-controlled mode was used to compress the structures to 50% and 100%
of their height.
12
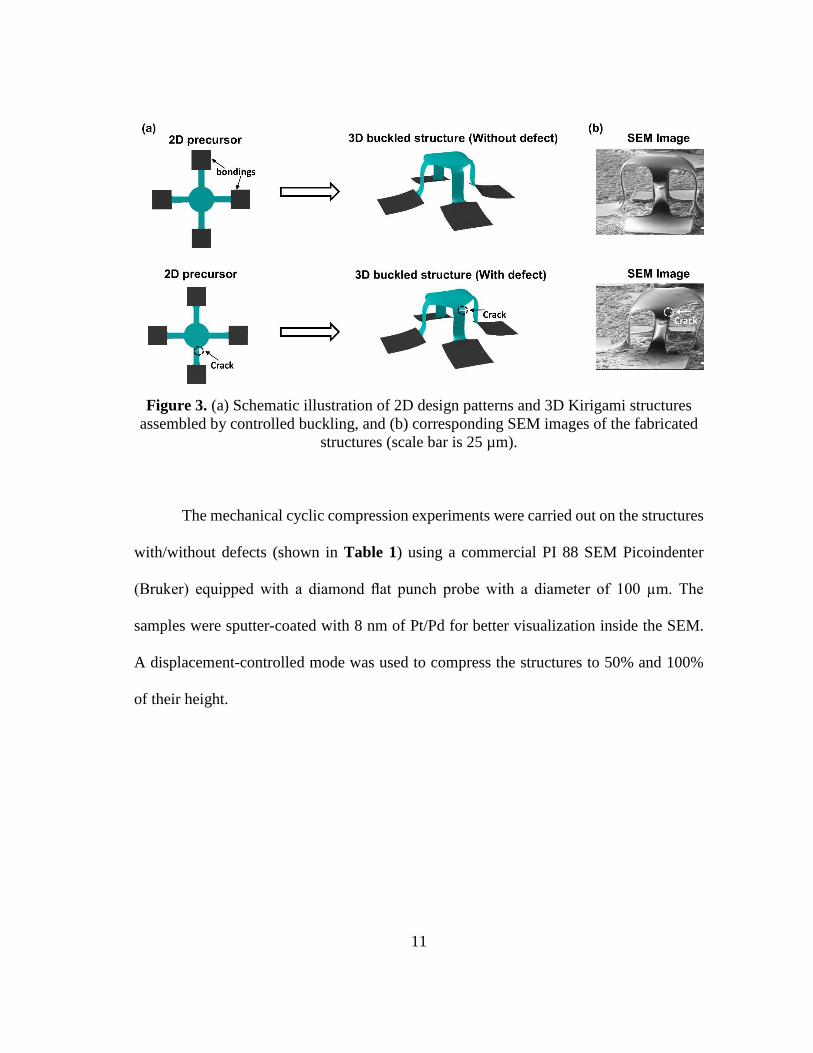
Table 1. SEM of structures with/without defects tested at 50 and 100% compression.
Structures without defect Structures with defect
Table Rotated table Pre-existing
crack Thinner leg Pre buckled leg
* The dashed circle shows the site of defect in each structure.
2.3 Results and Discussion
2.3.1 Stiffening of the structures at 100% compression
Figure 4(a, b) shows the load-displacement curves obtained by cycling of the
rotated table structure to 100%. The curves in Figure 4(b) were divided for each set for
clarity. Three sets of cycling experiments were carried out. Each set consisted of 10 cycles
resulting in a total number of 30 cycles. 4 min was selected as the wait time after the
complete unloading of the structure at the end of each set to allow for viscous relaxation
of the structure/substrate. Note that the structure was fully unloaded only at the last cycle
of each test set. The first cycle of each set, particularly set 1, demonstrated the largest
hysteresis loop with the highest energy dissipation. This could be due to plastic
deformation and initiation of buckling of the leg at the first cycle. Less energy was
dissipated in subsequent cycles, indicating stabilization of the structure.
The load-bearing capacity increased with each set, as shown in Figure 4(b). The
curves showed three regions for the loading associated with Hookean-type deformation
with a linear slope, a reduction in the slope due to small buckling, and an increase in the
13
slope due to stiffening of the structure. Similar behavior was observed for single
compression of Kirigami structures [18]. The reasons behind the stiffening can be
attributed to different mechanisms involved during the compression of the structure.
Referring to the recorded movie 1 in the supporting information, the densification of the
structure with increase in compression forced the legs to ultimately touch the bonding pads
and the substrate, wherein rapid increase in the force with small compression was initiated.
According to [34], a slight curvature in a thin sheet can significantly increase the stiffness
during bending, due to developed internal stresses. Here, the bonding pads behaved similar
to a curved thin sheet subjected to bending at 100%. The role of substrate deformation
became more dominant upon compression to 100%. The compression of the substrate
indicated higher stiffness and load-bearing capability, compared to the structure [19].
The recorded movie 1 shows that a combination of sliding, twisting, and slight
bucking occurred with compression to 100%. The permanent buckling of the leg, and
twisting of the structure can also be observed from the SEM images shown in Figure 4(c),
which were taken before the experiment and after the 30th cycle. The buckling of the leg
is shown with a dashed white circle in the SEM images. The superimposed image depicts
a better visualization of the changes in the shape of the structure after the experiments.
The dashed black line represents the initial structure before the experiment. From the
superimposed image in Figure 4(c) three distinct deformation modes can be observed: (a)
shifting to the right in the sliding direction, (b) slight reduction in the height due to
buckling of the leg and plastic deformation, and (c) in-plane twisting of the structure.
14
Figure 4. Structure without defect: (a) Load-displacement curves for 30 cycles of
loading-unloading, compressed to 100 %, (b) Separated cycling curves for each set, and
(c) SEM images taken before and after 30 cycles, including superimposed initial and
deformed structure (scale bar is 25 µm).
2.3.2 Structures with Defects
2.3.2.1 Structure with Crack
The successful implementation of such 3D structures to practical applications such
as 3D MEMS sensors requires high reliability and stability of the structures operating
under cyclic mechanical loading. Such loading conditions can induce fatigue in the
structure, which can ultimately lead to cracking and failure. In Ref. [19], we investigated
15
the mechanical response of a rotated table structure subjected to 200 cycles under extreme
compression of 100%. The formation and growth of a microcrack were observed after the
100th cycle. Herein, the structure had a pre-existing crack in one of the legs to capture a
crack-type defect that could occur during the fabrication process.
Three sets of cyclic experiments with ten cycles at each set were conducted at
100% compression on a table structure with a small crack on its front leg, depicted with a
white dashed circle in Figure 5(c). Figure 5(a, b) show the load-displacement curves at
each set. Initially, the structure demonstrated a Hookean response with linear elastic
behavior followed by a large increase in the displacement with little increase in the load
due to rapid buckling. Finally, a large increase in the load due to stiffening when the
structure approached 100% compression. The first cycle showed the highest energy
dissipation, while less energy was dissipated in the first cycle of the 2nd and 3rd sets. The
structure achieved stable hysteresis and stabilized with increasing number of cycles. The
structure became more robust and resistant to crack growth at subsequent sets.
A combination of sliding and buckling occurred during the compression to 100%
(see the recorded movie 2 for the first set). The buckling of the leg and permanent
deformation of the structure is clearly discernible from the movie 2, as well as the SEM
images shown in Figure 5(c, d). Figure 5(c) shows the SEM images of the structure taken
before the experiment and after each set of cycling tests. The higher magnification images
show the growth of the crack with cyclic compression at each set. The comparison of the
images after sets 2 and 3 (the 20th and 30th cycle) indicate negligible growth in the crack,
compared to the 10th cycle. The developed internal tensile stress on the leg resulted in the
16
crack growth. As seen in movie 2, the top portion of the leg is under tension with buckling
of the leg inducing tensile stress at the crack site. The internal stresses decreased with
number of cycles, which caused the crack growth to decelerate [35]. Figure 5(d) depicts
the superimposed image before the experiment and after the 30th cycle. The structure
permanently deformed and tilted in the sliding direction, and the right leg experienced
two-fold bending.
17
Figure 5. (a) Table structure load-displacement curves for 30 cycles compressed to 100
%, (b) Separated cycling curves for each set, (c) SEM images taken before cycling and
after each set of cycles (scale bar is 25 µm for the low magnification images and 5 µm
for the high magnification images), and (d) Superimposed SEM images before the
experiment and after the 30th cycle (scale bar is 25 µm).
18
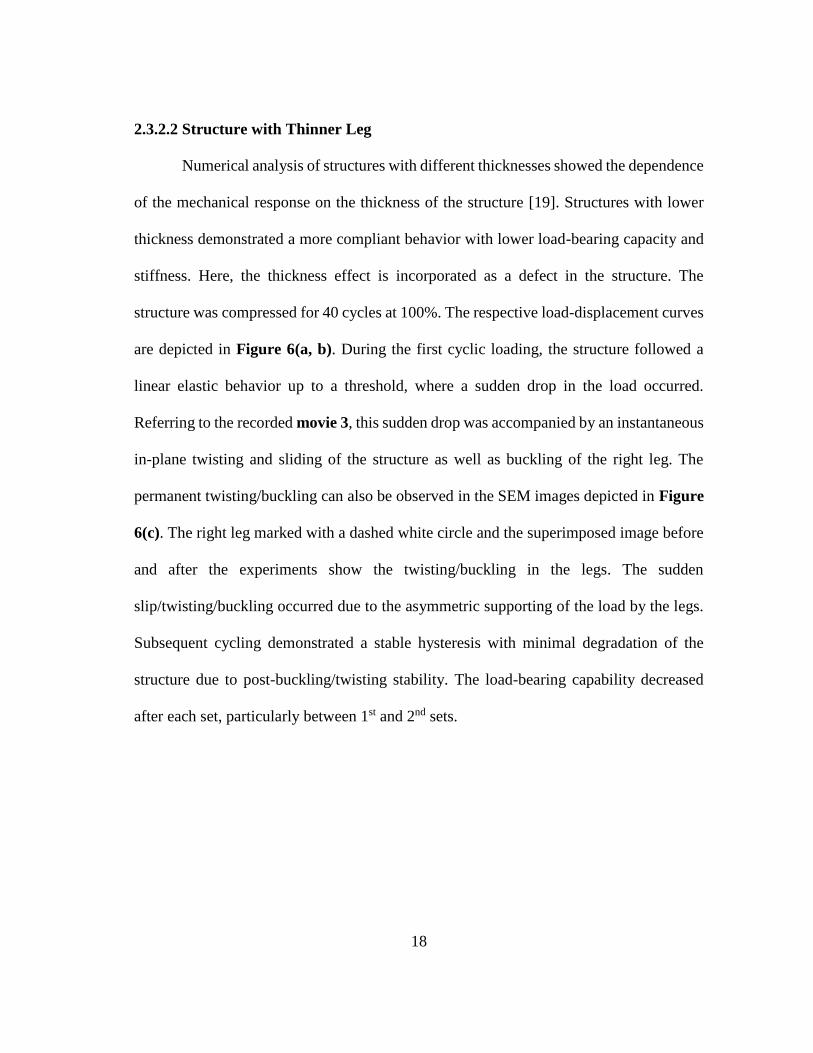
2.3.2.2 Structure with Thinner Leg
Numerical analysis of structures with different thicknesses showed the dependence
of the mechanical response on the thickness of the structure [19]. Structures with lower
thickness demonstrated a more compliant behavior with lower load-bearing capacity and
stiffness. Here, the thickness effect is incorporated as a defect in the structure. The
structure was compressed for 40 cycles at 100%. The respective load-displacement curves
are depicted in Figure 6(a, b). During the first cyclic loading, the structure followed a
linear elastic behavior up to a threshold, where a sudden drop in the load occurred.
Referring to the recorded movie 3, this sudden drop was accompanied by an instantaneous
in-plane twisting and sliding of the structure as well as buckling of the right leg. The
permanent twisting/buckling can also be observed in the SEM images depicted in Figure
6(c). The right leg marked with a dashed white circle and the superimposed image before
and after the experiments show the twisting/buckling in the legs. The sudden
slip/twisting/buckling occurred due to the asymmetric supporting of the load by the legs.
Subsequent cycling demonstrated a stable hysteresis with minimal degradation of the
structure due to post-buckling/twisting stability. The load-bearing capability decreased
after each set, particularly between 1st and 2nd sets.
19
Figure 6. (a) Table structure load-displacement curves for 40 cycles at 100 %, (b)
Separated cycling curves for each set, and (c) SEM images taken before and after 40th
cycles, including superimposed initial and deformed structure (scale bar is 25 µm).
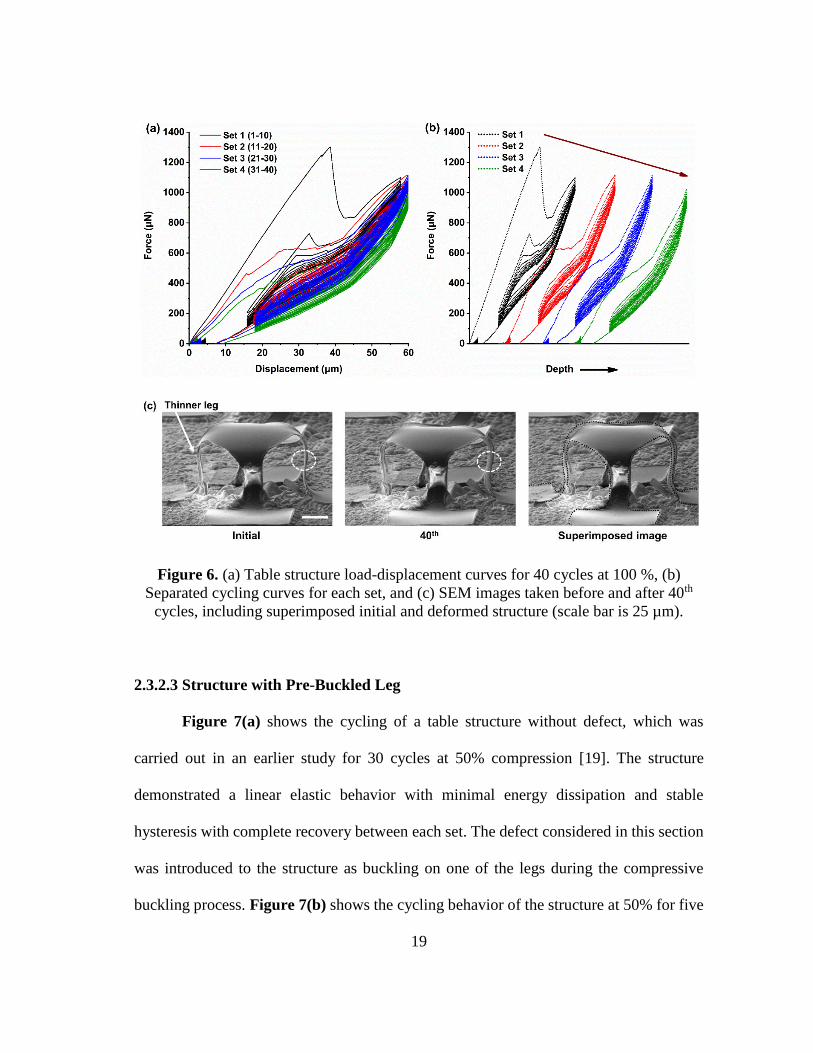
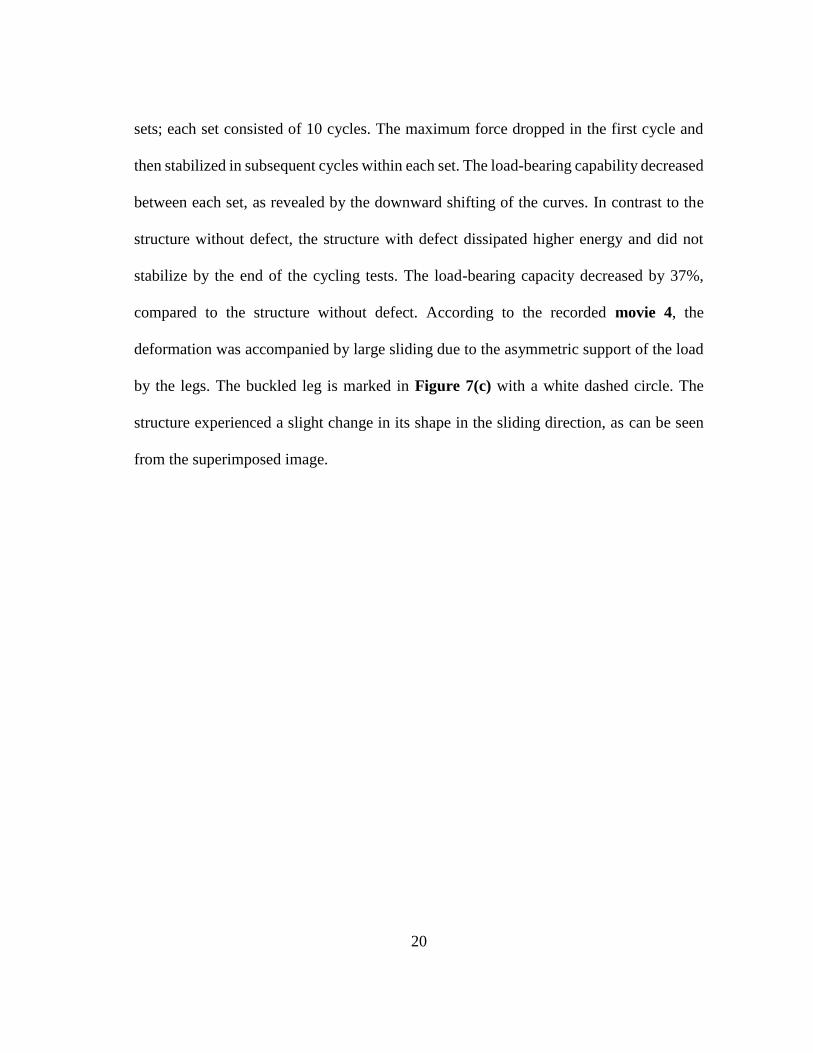
2.3.2.3 Structure with Pre-Buckled Leg
Figure 7(a) shows the cycling of a table structure without defect, which was
carried out in an earlier study for 30 cycles at 50% compression [19]. The structure
demonstrated a linear elastic behavior with minimal energy dissipation and stable
hysteresis with complete recovery between each set. The defect considered in this section
was introduced to the structure as buckling on one of the legs during the compressive
buckling process. Figure 7(b) shows the cycling behavior of the structure at 50% for five
20
sets; each set consisted of 10 cycles. The maximum force dropped in the first cycle and
then stabilized in subsequent cycles within each set. The load-bearing capability decreased
between each set, as revealed by the downward shifting of the curves. In contrast to the
structure without defect, the structure with defect dissipated higher energy and did not
stabilize by the end of the cycling tests. The load-bearing capacity decreased by 37%,
compared to the structure without defect. According to the recorded movie 4, the
deformation was accompanied by large sliding due to the asymmetric support of the load
by the legs. The buckled leg is marked in Figure 7(c) with a white dashed circle. The
structure experienced a slight change in its shape in the sliding direction, as can be seen
from the superimposed image.
21
Figure 7. Table structure load-displacement curves for cycling at 50 % compression (a)
no defect [19], (b) pre-buckled leg defect, and (c) SEM images taken before cycling and
after 50 cycles, including superimposed initial and deformed structure (scale bar is 25 µm).
2.3.3 Modeling using finite element analysis (FEA)
3D FEA was conducted using the commercial software ABAQUS to simulate the
structures with different types of defects. The goal was to investigate and compare the
variations in configuration and stress/strain distributions upon compression to 100%. The
structures and the elastomer substrate were simulated using four-node shell elements and
eight-node 3D stress elements, respectively. The convergence of mesh size ensured
computational accuracy. The SU8 Kirigami structures were assumed to be linear elastic
with elastic modulus E and Poisson’s ratio ν of ESU8 = 4.02 GPa and νSU8 = 0.22,
22
respectively. Mooney Rivlin hyper-elastic model was used to model the elastomeric
substrate with parameters C10 = 0.06757 MPa, C01 = 0.01689 MPa, and D1 = 0.48 MPa-1.
The length for the legs of the structures were measured to be 55 µm, except the structure
with pre-buckled leg defect, which was 65 µm. All legs had a thickness of 3 µm, except
the structure with thinner leg defect, which had a thickness of 2.1 µm on its thinner leg.
The 2D patterns the structures with each defect is shown in Figure 8.
Figure 8. The schematic illustration of 2D design patterns for Kirigami structures with
different types of defect before compressive buckling
Figure 9 shows the maximum principal strain and von Mises stress at 100%
compression for the structure without defect and the structures with different types of
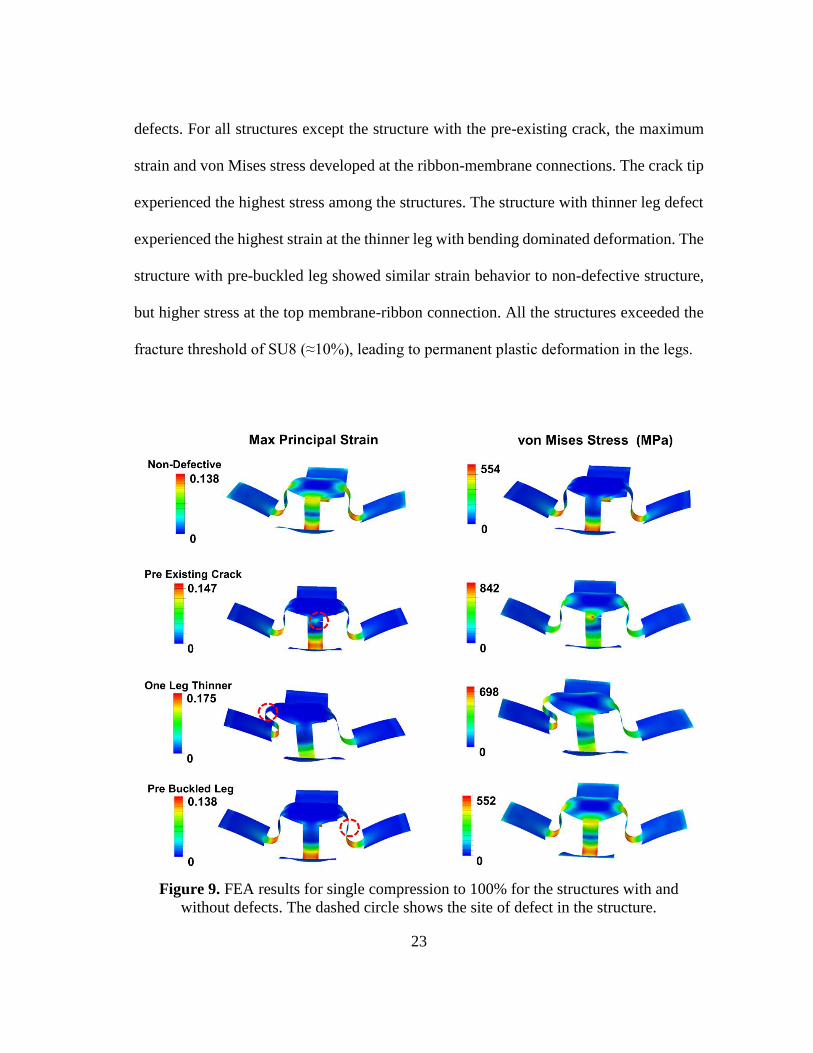
23
defects. For all structures except the structure with the pre-existing crack, the maximum
strain and von Mises stress developed at the ribbon-membrane connections. The crack tip
experienced the highest stress among the structures. The structure with thinner leg defect
experienced the highest strain at the thinner leg with bending dominated deformation. The
structure with pre-buckled leg showed similar strain behavior to non-defective structure,
but higher stress at the top membrane-ribbon connection. All the structures exceeded the
fracture threshold of SU8 (≈10%), leading to permanent plastic deformation in the legs.
Figure 9. FEA results for single compression to 100% for the structures with and
without defects. The dashed circle shows the site of defect in the structure.
24
2.4. Summary
Extreme mechanical cycling of 3D kirigami-inspired architectures with defects
was performed using in-situ SEM flat punch compression at 50 and 100%. Three different
types of structural defects, which could result during batch fabrication, were considered
during the compressive buckling process. Apart from the possibility of occurrence of
defects in the assembly process, these defects might also occur in practical applications
during operation under extreme conditions. Therefore, it would be beneficial to know how
the existence of defects would impact the mechanical response and durability against
compressive cycling. Reduction in load-bearing capacity, energy dissipation, and
deformation of the structures were found to be a function of the defect type. The crack
type defect created a large plastic deformation in the sliding direction. The thinner leg type
defect caused a sudden snap during the first cycle with a slight permanent twisting
remaining after the experiments. The structures maintained stable hysteresis and achieved
post-buckling stability after a few cycles, which is advantageous. Compared to the
structure without defect, the pre-buckled leg in the structure induced non-instability in the
load-displacement response with higher energy dissipation and decreased load-bearing
capacity by 37%. The degree of plastic deformation was found to be a function of defect
type. The existence of crack in one of the legs caused the largest plastic deformation. FEA
results showed the dependency of stress/strain distribution and deformation on the defect
type. The internally developed stress and the deformation of the substrate were the
mechanisms behind stiffening, once compressed to 100%. It is worth noting that despite
25
the defect type, all structures ultimately achieved stable hysteresis with steady-state
mechanical behavior, which is advantageous in practical applications.
2.5 Supplementary movie legends
Movie 1: Mechanical cycling of rotated table structure to 100% compression
Movie 2: Mechanical cycling of table structure with pre-existing crack to 100%
compression
Movie 3: Mechanical cycling of table structure with thinner leg to 100% compression
Movie 4: Mechanical cycling of table structure with pre buckled leg to 50% compression
3. MECHANICS AND DEFORMATION OF SHAPE MEMORY POLYMER
KIRIGAMI MICROSTRUCTURES2
The assembly of three dimensional (3D) structures through compressive buckling
of 2D precursors can serve as a promising and robust tool to realize different classes of
advanced materials in a broad range of applications with complex geometries and a span
of length scales from sub-micron to macro scales. In this Chapter, a shape memory
polymer (SMP) material was used as the precursor to form different configurations of 3D
kirigami microstructures. 3D SMP structures can serve in a wide range of applications,
such as biomedical and aerospace, which require a level of robustness and compliance. To
this end, the mechanical response of assembled 3D buckled Kirigami structures were
investigated through mechanical cyclic and single loading compression at room and
elevated temperatures, respectively. The experiments at room temperature were performed
to examine the mechanical resilience and stability of the structures upon repeated loading.
The load-bearing capacity, resiliency, and stability under deformation were shown to be
largely affected by their structural shape. In-situ scanning electron microscopy
experiments at elevated temperatures demonstrated the outstanding shape memory
behavior by full recovery to their original shape, without any structural damage or fracture.
2 Reprinted with permission from “Mechanics and deformation of shape memory polymer kirigami
microstructures” by Bashandeh K, Lee J, Wu Q, Li Y, Wang X, Shi Y, Guo X, Huang Y, Rogers JA,
Polycarpou AA., Extreme Mechanics Letters. 2020, 10:100831. Copyright 2020 Elsevier. 26
27
Computational modeling supports the experimental findings and contributes to the
understanding of deformation and fracture of the structures.
3.1 Introduction
Multiscale and three dimensional (3D) structures of biological materials with
multifunctional properties have been utilized as a design route in many research studies to
prepare bioinspired manmade materials and devices, with similar multifunctionality and
integrity to biomaterials [36,37]. Such 3D structures with various shapes, configurations,
and scales have been realized in applications, such as electronic systems [38–40],
biomedical devices [41–43], energy storage [44,45], metamaterials [46,47], functional
scaffolds for tissue engineering [48], and others [49,50]. Different fabrication techniques,
including 3D printing [51], two-photon/multiphoton lithography [52,53], and strain-
induced bending/folding [54] have been developed to form various 3D structures. Each
technique has its limitations and constraints, such as material compatibility and accessible
feature sizes and geometries [50,55].
Of these techniques, compressive buckling can serve as a strong tool in the
assembly of 3D structures with different materials, geometries, and length scales. In this
technique, the non-bonded regions of the 2D precursors on a prestrained elastomer
substrate transform into a deterministically controlled 3D structure in a reversible manner
through compressive forces induced upon the release of the prestrained elastomer [56].
Such structures are referred to as kirigami microstructures. Maintaining the 3D design
shape upon the removal of prestrain requires the structure to stay on the assembly
elastomer substrate. However, there are practical applications that require operating in a
28
condition that is not compatible with elastomer substrates, such as elevated temperatures,
as in templates for materials growth, or applications which demand a freestanding
structure in isolated forms, as in micro-robotics [48]. The freestanding 3D structure can
be realized through shape fixation and memory effect using shape memory polymer (SMP)
[48,57]. The implementation of 3D SMP-based structures provides the ability to recover
from severe deformation and also enables programmable shape changes.
Although different 3D SMP structures have been fabricated, their mechanical
response to applied load, and their reversibility is unknown. Past experimental
investigations were confined to qualitative methods and not direct mechanical
measurements [57,58]. The deformation and mechanical cycling of various configurations
of 3D polymer-based kirigami structures were investigated using in-situ compression
inside a scanning electron microscope (SEM) [18,59]. Herein, we perform in-situ cyclic
compression of 3D SMP structures using an indenter equipped with a flat punch probe.
Load-displacement responses, including cyclic loading were measured in-situ at room
temperature (RT, 23 °C). Also, in-situ compression experiments inside a SEM were
performed to directly observe the shape recovery of the structures after the removal of the
stress, at elevated temperature. The experiments were initiated with heating the structures
above their glass transition temperature (Tg) by 15 ℃, followed by compressing the
structures to 30% of their initial height. The structures fully recovered to their initial state
upon reheating.
29
3.2 Materials and Methods
3.2.1 Fabrication of the Structures
Figure 10 illustrates a schematic representation of the fabrication process.
Fabrication of the 3D SMP structures started with spin coating a thin layer of poly(4-
styrenesulfonic acid) as a water-soluble sacrificial layer on a silicon wafer. Spin casting
formed the 2D precursors of the SMP, composed of epoxy monomer E44 and curing agent
poly(propylene glycol) bis(2-aminopropyl ether) (Jeffamine D-230) mixed with a mass
ratio of 44:23. The samples were cured in a furnace for 1 hour at 110 °C. A lithographically
patterned thin metal layer composed of 10 nm chromium (Cr) and 50 nm gold (Au) served
as a hard mask for oxygen plasma etching of the SMP. Transfer of the 2D precursors from
the silicon wafer to a water-soluble polyvinyl alcohol tape (PVA, 3M Co.) required the
removal of the previously formed underlying sacrificial layer on the silicon wafer, which
was accomplished by immersion in water. To define the bonding locations, a thin layer of
titanium (Ti, 5 nm thick) followed by a thin layer of silicon dioxide (SiO2, 50 nm thick)
were deposited on selective locations of the precursors by using a flexible shadow mask
(75 µm thick polyimide film). Before transfer printing the precursors to the stretched
silicone elastomer substrate (Dragon Skin; Smooth-On, Easton, PA), the precursors on the
PVA tape and the stretched substrate were exposed to ultraviolet ozone treatment to
promote the bonding strength by inducing hydroxyl termination. Releasing the prestrained
elastomer substrate after dissolving the PVA tape in water induced compressive forces on
the 2D shape memory precursors, which enabled the out of plane deformation of the non-
bonded regions of the precursors and thus forming the desired 3D kirigami structures.
30
Figure 10. Schematic illustration of the procedure to fabricate the 3D SMP Kirigami
structures.
A schematic representation of the 2D design patterns used in this work, and their
corresponding 3D Kirigami structures upon release are shown in Figure 11.
Figure 11. Schematic illustration of 2D precursors and their corresponding 3D buckled
structures assembled by compressive buckling.
31
Figure 12 shows optical microscopy images of the three fabricated structures
bonded on the substrate. The height of the structures was measured from the side view of
the optical images, and found to be 510 µm, 260 µm, and 505 µm for structures 1, 2, and
3, respectively. All structures are supported with vertical legs but with different design,
height, and number of legs. The structures were initially cyclically compressed to 20 and
30% of their initial height using an instrumented nanoindenter (TI 980, Bruker) equipped
with a flat punch probe. Subsequently, structures 2 and 3 were respectively compressed to
20 and 10%, due to breakage and fracture of the structures at higher compression values
at RT. Three loading rates of 5, 10, and 25 µms-1 were selected to study the load rate
sensitivity. The experiments at elevated temperature were performed using in-situ SEM
compression with a PI 88 SEM PicoIndenter (Bruker), equipped with a flat punch probe
(100 х 100 µm2 square). All structures were compressed to 30% for one loading-unloading
cycle.
32
Figure 12. Optical images of three different 3D kirigami microstructures on elastomer
substrate. The scale bars are 500 µm.
3.2.2 Modeling Using Finite Element Analysis (FEA)
Modeling was carried out through 3D FEA using the commercial software
ABAQUS. The goal was to capture the 2D to 3D transformation through mechanically
guided assembly and compare the stress/strain distribution upon compression at room and
elevated temperatures. The silicone elastomer substrate (2 mm in thickness) and the
precursors (10 µm in thickness) were modeled using eight-node 3D solid elements and
33
four-node shell elements, respectively. Refined meshes were used to ensure computational
accuracy. The elastic modulus and Poisson’s ratio values of the elastomer substrate were
taken to be E = 166 kPa and = 0.49. To simulate the experiments, the prestrain was
modeled to be 70% for structure 1, and 50% for structures 2 and 3. The shape memory
material can be identified as a thermo-rheologically simple polymer whose thermo-
viscoelastic behaviors can be described by a multi-branch rheological model [60]. In this
model one equilibrium branch and several thermoviscoelastic nonequilibrium branches
are arranged in parallel. Maxwell elements are used in the nonequilibrium branches to
represent the stress relaxation behavior of the material [26]. The parameters for
equilibrium and nonequilibrium branches are provided in Table 2.
34
Table 2. Utilized parameters for modeling of thermo-viscoelastic and shape memory
behavior of the structures using a multibranch viscoelastic model.
Branch Enon(Pa) τR(s) Branch Enon(Pa) τR(s)
1 3.725E08 3.000E-11 15 3.550E08 1.392E01
2 3.000E08 6.410E-10 16 2.800E08 2.655E02
3 3.300E08 8.210E-09 17 3.525E08 8.548E00
4 3.675E08 8.840E-08 18 2.047E08 7.588E01
5 4.150E08 8.210E-07 19 1.317E08 2.187E02
6 4.725E08 6.780E-06 20 3.120E07 1.961E03
7 5.200E08 4.840E-05 21 7.008E07 6.390E02
8 6.275E08 3.000E-04 22 4.281E06 8.055E03
9 4.450E08 1.500E-03 23 1.208E07 3.000E03
10 3.600E08 4.870E-03 24 2.994E06 1.280E05
11 3.775E08 1.418E-01 25 3.258E06 3.000E04
12 4.075E08 4.536E-01 26 4.567E02 5.420E05
13 4.050E08 1.500E00 27 6.342E06 3.000E06
14 3.775E08 4.729E00
Eseq(Pa) Eelas(Pa) AFc/k Tref(°C) C1 C2
1.000E07 1.000E06 -2.000E04 45.000 17.400 60.350
3.3 Results and Discussion
3.3.1 Mechanical Cycling (15 Cycles) at RT
Figure 13(a, b) shows the load-displacement curves for cycling of structure 1 at
20 and 30% compression. The structure was consecutively compressed 15 times, and each
5 cycles is termed a set. The curves show two linear regions corresponding to compression
of the top rings with linear elastic deformation, followed by a slight buckling in the legs
of the structure. The first cycle showed different behavior with a higher hysteresis loop,
35
due to plastic deformation of the structure [59]. The slight plastic deformation is revealed
by residual deformation upon removal of the load. The structure maintained minimal and
stable hysteresis by increasing the number of cycles. The hysteresis, recovery, and energy
dissipation remained the same between each test set. Compressing to 30% of the
structure’s height showed similar cyclic behavior but with higher load-bearing capacity
and lower stiffness. According to Table 3, compressing the structure to 30% reduced the
stiffness by 12%, compared to 20% compression. The increase of loading rate to 25 µms-
1 slightly increased the stiffness by 4% at 20% compression. The structure achieved less
hysteresis and stability with increase of the loading rate to 25 µms-1.
Table 3. Calculated averaged stiffness values for structures at different compressions
and loading rates.
#
Loading
rate
(μm/s)
Stiffness
(N/m)
Loading
rate
(μm/s)
Stiffness
(N/m)
Loading
rate
(μm/s)
Stiffness
(N/m)
Structure 1
(20%)
5
9.01
10
9.18
25
9.35
Structure 1
(30%) 7.92 7.89 7.93
Structure 2
(20%) 234.06 239.21 234.51
Structure 3
(10%) 63.66 64.66 66.19
36
Figure 13. Load-displacement curves for cycling of structure 1 at (a) 20% compression,
(b) 30% compression at different loading rates of 5, 10, and 25 µms-1. Set 1 = cycles 1 -
5, Set 2 = cycles 6 - 10, Set 3= cycles 11 - 15.
Structure 2 was compressed at the same conditions as structure 1. The load-
displacement curves are depicted in Figure 14(a, b) showing linear elastic deformation at
all cycles. Similar to structure 1, the first cycle showed the highest hysteresis, and then
exhibited minimal and stable hysteresis. The load-bearing capacity increased significantly
compared to structure 1. The stiffness remained nearly unchanged at different loading
rates (see Table 3). However, the stability reduced by increasing the loading rate to 10
and 25 µms-1. While the structure could support the load up to 20% compression, cycling
to 30% revealed a different behavior; namely, the structure could not support the load and
broke at 70 µm displacement, which is captured by a sudden drop in the load-displacement
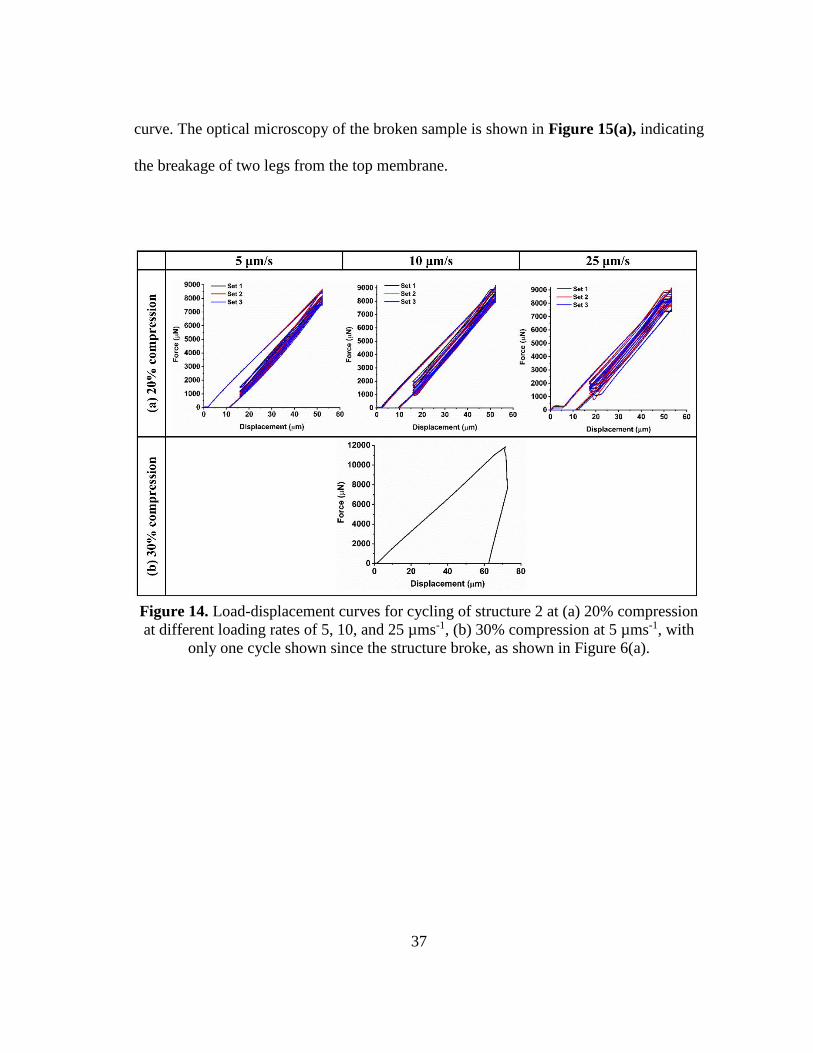
37
curve. The optical microscopy of the broken sample is shown in Figure 15(a), indicating
the breakage of two legs from the top membrane.
Figure 14. Load-displacement curves for cycling of structure 2 at (a) 20% compression
at different loading rates of 5, 10, and 25 µms-1, (b) 30% compression at 5 µms-1, with
only one cycle shown since the structure broke, as shown in Figure 6(a).
38
Figure 15. Optical microscopy image (from the top) of (a) structure 2 and (b) structure 3
after 30% compression. The two broken legs are pointed with arrows. The scale bar is
500 µm.
Figure 16(a, b) shows the cycling of structure 3 at 10 and 20% compression. Note
that since the structure could not support the load at 20%, compression was reduced to
10% of the height. The deformation was dominated by linear elastic behavior at 10%
compression. Unlike the other structures, the first cycle did not show significant difference
in the hysteresis loss, compared to the subsequent cycles, especially at the lower loading
rate. The structure fully recovered to the initial state upon the removal of the load (at 10%
compression). The experiments at higher loading rates revealed dependency of hysteresis
and stability of the structure to the frequency of cycling tests. The hysteresis remained
stable and without change between each set at the lowest loading rate. However,
increasing the loading rate to 10 µms-1 imposed a slight shift to the load-displacement
curve but with similar hysteresis. At the maximum loading rate, due to unstable behavior,
the experiments stopped after set 2. From Table 3, the increase of loading rate to 25 µms-
1 slightly increased the stiffness by 4%. The structure could not support the load when
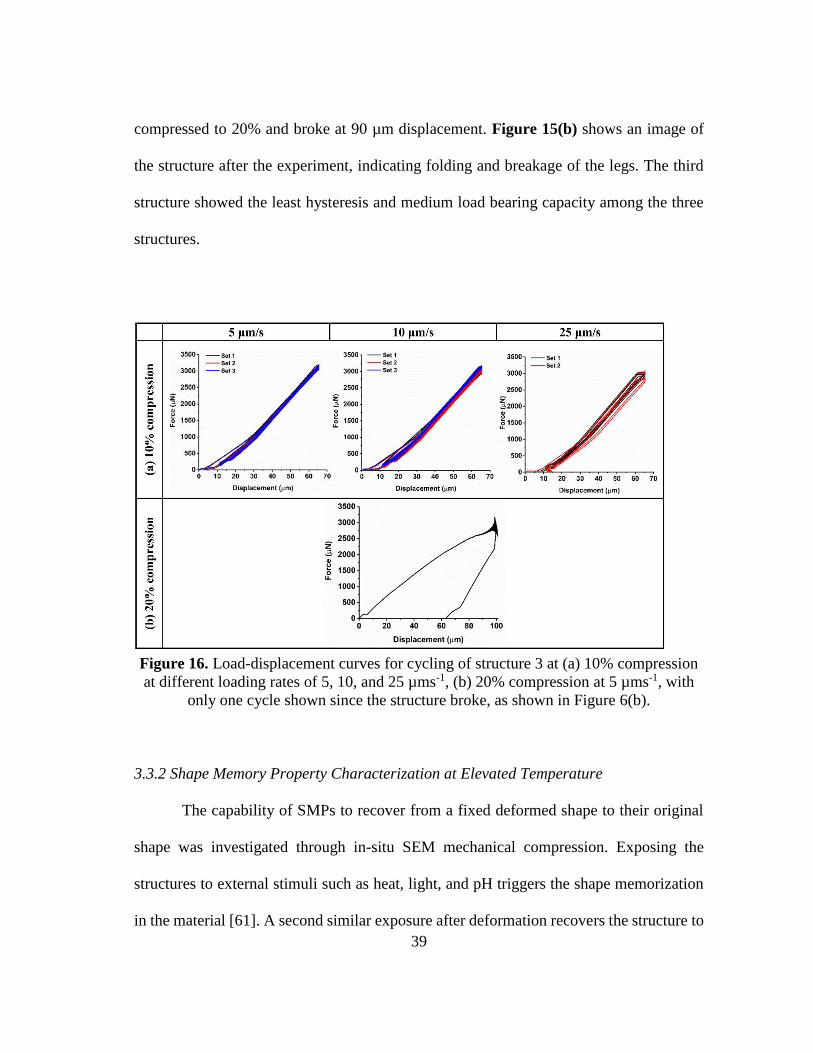
39
compressed to 20% and broke at 90 µm displacement. Figure 15(b) shows an image of
the structure after the experiment, indicating folding and breakage of the legs. The third
structure showed the least hysteresis and medium load bearing capacity among the three
structures.
Figure 16. Load-displacement curves for cycling of structure 3 at (a) 10% compression
at different loading rates of 5, 10, and 25 µms-1, (b) 20% compression at 5 µms-1, with
only one cycle shown since the structure broke, as shown in Figure 6(b).
3.3.2 Shape Memory Property Characterization at Elevated Temperature
The capability of SMPs to recover from a fixed deformed shape to their original
shape was investigated through in-situ SEM mechanical compression. Exposing the
structures to external stimuli such as heat, light, and pH triggers the shape memorization
in the material [61]. A second similar exposure after deformation recovers the structure to
40
the original shape. In this work, heating was used as the external stimulus. The
experimental process followed three steps: I) heating the structures above the glass
transition temperature (where Tg = 57 ℃), which triggered high mobility and flexibility in
the chains. Upon transition, the structures become soft and the storage modulus changes
from 3 GPa to 10 MPa [57]. II) Followed heating, the structure was compressed by 30%
using a flat punch probe and cooled down to RT, while it was under the applied load.
During cooling the chains locked in place and the structures stayed in the deformed shape.
III) Upon removal of the load, the structure was heated again with the same initial heating
rate, in which case the structure recovered to its original shape.
Figure 17 shows a direct comparison of the experimental results and FEA
simulations, and the latter gives the strain distribution. The SEM images were taken from
all three structures at different steps of the experimental process: 1) image after heating
the structures above Tg to 72 ℃, 2) image of the structures under 30% compression after
cooling down to RT and removal of the flat punch probe from the structures, and 3) image
after reheating to 72 ℃ showing the recovered structures. The images at step 2 show the
deformed structures indicating different deformation mechanisms.
Supplementary movies 5-7 show the in-situ deformation mechanisms upon
compression and the recovery after releasing of the load for the three structures. Note that
the movies are sped up at different rates during the cycle of heating-cooling-heating.
Examining movie 5 (structure 1), the majority of the deformation occurred in the inner
rings of the structure with slight buckling on the legs. The recovery followed the same
behavior starting from the inner rings and the legs. For structure 2, the majority of the load
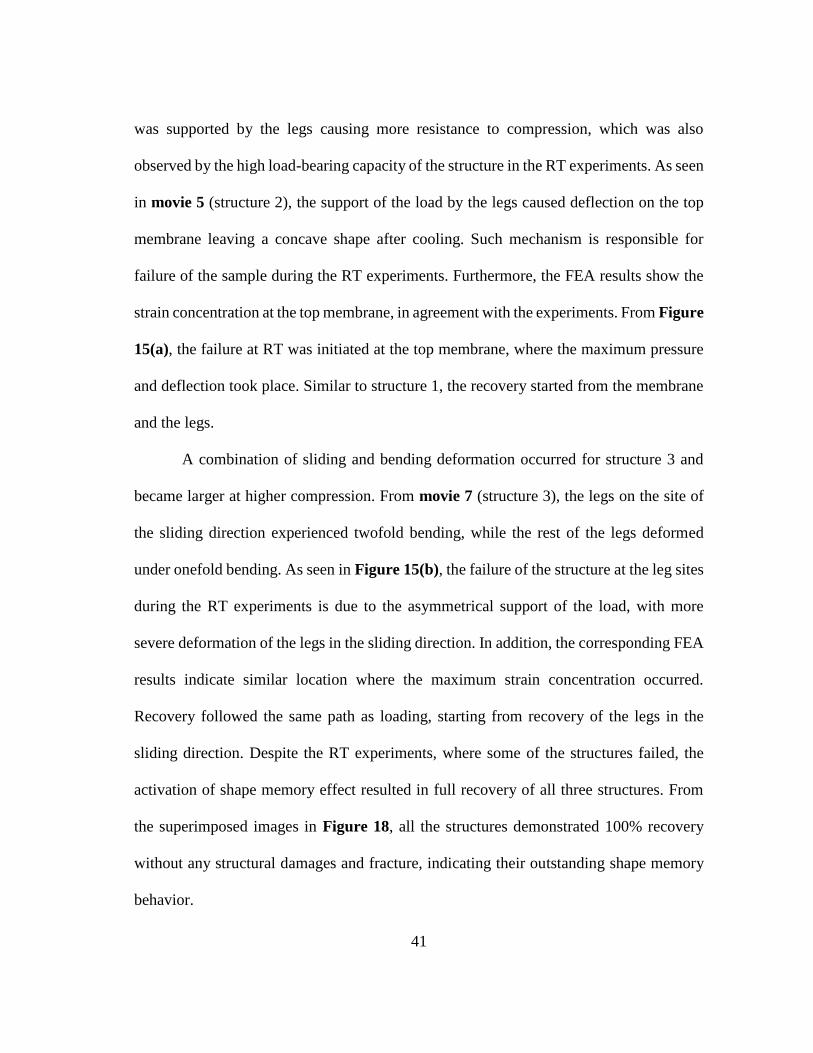
41
was supported by the legs causing more resistance to compression, which was also
observed by the high load-bearing capacity of the structure in the RT experiments. As seen
in movie 5 (structure 2), the support of the load by the legs caused deflection on the top
membrane leaving a concave shape after cooling. Such mechanism is responsible for
failure of the sample during the RT experiments. Furthermore, the FEA results show the
strain concentration at the top membrane, in agreement with the experiments. From Figure
15(a), the failure at RT was initiated at the top membrane, where the maximum pressure
and deflection took place. Similar to structure 1, the recovery started from the membrane
and the legs.
A combination of sliding and bending deformation occurred for structure 3 and
became larger at higher compression. From movie 7 (structure 3), the legs on the site of
the sliding direction experienced twofold bending, while the rest of the legs deformed
under onefold bending. As seen in Figure 15(b), the failure of the structure at the leg sites
during the RT experiments is due to the asymmetrical support of the load, with more
severe deformation of the legs in the sliding direction. In addition, the corresponding FEA
results indicate similar location where the maximum strain concentration occurred.
Recovery followed the same path as loading, starting from recovery of the legs in the
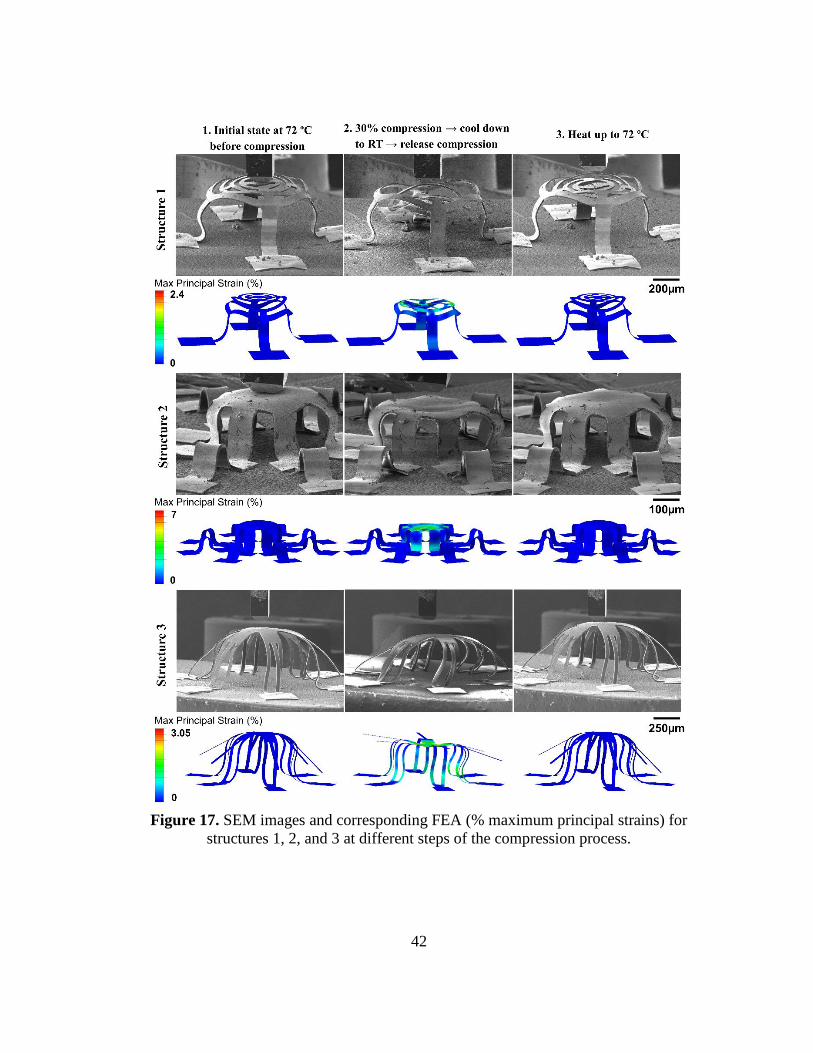
sliding direction. Despite the RT experiments, where some of the structures failed, the
activation of shape memory effect resulted in full recovery of all three structures. From
the superimposed images in Figure 18, all the structures demonstrated 100% recovery
without any structural damages and fracture, indicating their outstanding shape memory
behavior.
42
Figure 17. SEM images and corresponding FEA (% maximum principal strains) for
structures 1, 2, and 3 at different steps of the compression process.
43
Figure 18. Superimposed SEM images for structures 1, 2, and 3 before compression and
after recovery (the dashed lines show the structure after recovery).
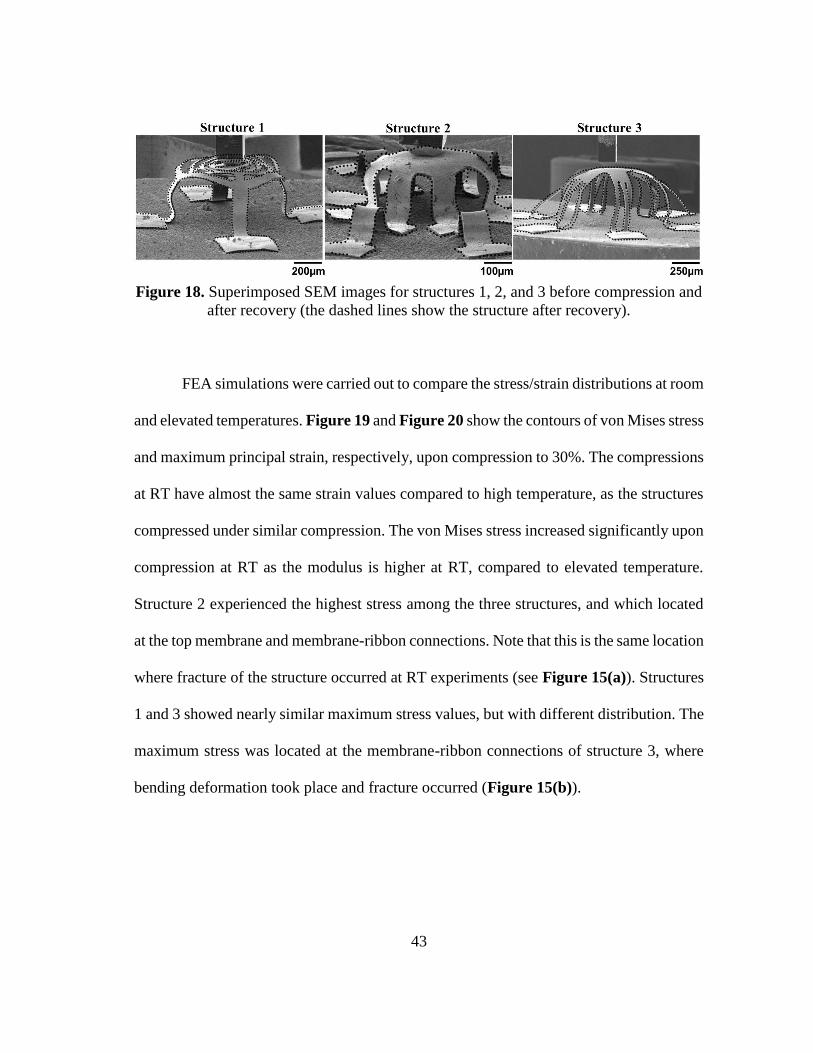
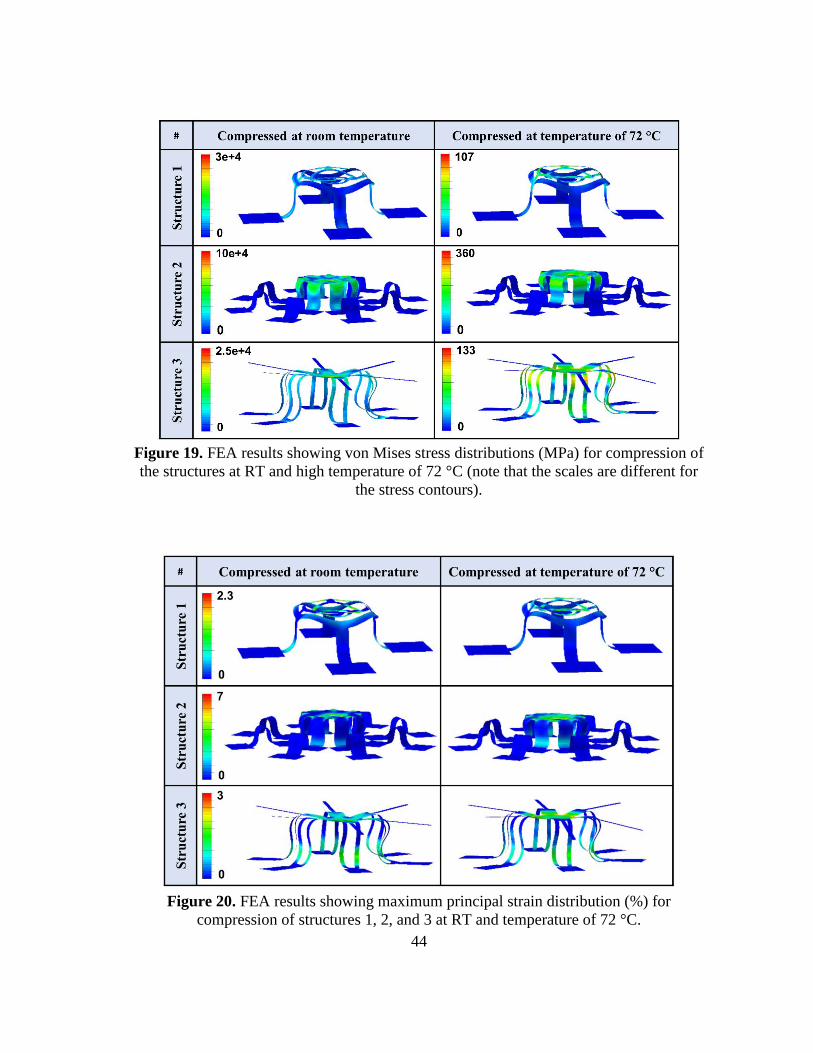
FEA simulations were carried out to compare the stress/strain distributions at room
and elevated temperatures. Figure 19 and Figure 20 show the contours of von Mises stress
and maximum principal strain, respectively, upon compression to 30%. The compressions
at RT have almost the same strain values compared to high temperature, as the structures
compressed under similar compression. The von Mises stress increased significantly upon
compression at RT as the modulus is higher at RT, compared to elevated temperature.
Structure 2 experienced the highest stress among the three structures, and which located
at the top membrane and membrane-ribbon connections. Note that this is the same location
where fracture of the structure occurred at RT experiments (see Figure 15(a)). Structures
1 and 3 showed nearly similar maximum stress values, but with different distribution. The
maximum stress was located at the membrane-ribbon connections of structure 3, where
bending deformation took place and fracture occurred (Figure 15(b)).
44
Figure 19. FEA results showing von Mises stress distributions (MPa) for compression of
the structures at RT and high temperature of 72 °C (note that the scales are different for
the stress contours).
Figure 20. FEA results showing maximum principal strain distribution (%) for
compression of structures 1, 2, and 3 at RT and temperature of 72 °C.
45
Flexible, robust, and shape-programmable 3D SMP kirigami-inspired structures
reported here are promising for different applications, including biomedical devices for
tissue repair and vascular stents [62], as well as adaptive and deployable structures in
aerospace engineering [63]. In addition, the mechanics-deterministic nature of the 3D
buckling technique allows freedom to design and fabricate 3D structures of well-
controlled geometries in advanced materials, including combination of SMPs with
functional electronics. Although epoxy SMPs are used in this work, the fabrication and
characterization techniques developed herein are applicable to SMPs with a wide range of
glass transition temperatures (20 - 300 ℃) for various applications.
3.4 Summary
3D kirigami microstructures were fabricated with different geometrical
configurations from epoxy shape memory polymer, using compressive buckling. The
mechanical response of the structures was measured at room and elevated temperatures,
under cyclic and single compressive loading, respectively. The goal was to evaluate the
resilience and stability of the structures upon compression from 20% to 30% of their initial
height, and examine and compare their behavior with experiments at elevated temperature
with shape memory effect.
The experiments at RT revealed strong dependency of mechanical performance
upon deformation (e.g., resilience, load bearing capacity, stiffness, and energy dissipation)
to the initial configuration of the structures. The simplest quad-leg structure 1 showed the
lowest load bearing capacity and stiffness, but the highest resilience compared to the other
more complex structures. The most complex octa-leg 16 bonding sites structure 2, showed
46
the highest load bearing capacity and stiffness but lower stability and higher hysteresis,
compared to structure 1. Hexa-double leg structure 3 showed the lowest hysteresis and
medium load bearing capacity and stiffness, but the least resilience upon compression, as
the sample fractured beyond 10% compression. The in-situ SEM compression
experiments at elevated temperature (above glass transition) demonstrated the shape
memory effect in the structures. All structures fully recovered to their initial state after
experiments at 30% compression. Unlike the experiments at RT, no structural fracture was
observed after the experiments. Modeling using FEA indicated that the fracture of
structures 2 and 3 at RT experiments could be attributed to their structural design, von
Mises stress, and their distribution. Shape memory is an effective way to enhance the
performance of these flexible kirigami microstructures upon loading.
3.5 Supplementary movie legends
Movie 5: Deformation and recovery of structure 1
Movie 6: Deformation and recovery of structure 2
Movie 7: Deformation and recovery of structure 3
47
4. MECHANICAL CYCLING OF ENCAPSULATED 3D KIRIGAMI STRUCTURES
3D Kirigami-inspired microsensors were fabricated using compressive bucking
method. The structure was integrated with piezoresistive elements and encapsulated with
polymers with different stiffness. The mechanical response of assembled 3D buckled
structures were investigated through mechanical cyclic at 10 and 20% compression. The
goal was to evaluate the stability and durability of the device against multiple cycles of
loading, frequency of applied external stimuli, viscoelastic effect, and load-bearing
capability of the encapsulant materials. To this end, mechanical cycling from 30 to 100
cycles was performed with loading rates varying from 5 to 15 µm/s. Additional faster
experiments were performed with a frequency of 1 Hz to simulate the frequency of human
walking for simulating the conditions in the intended application.
4.1 Introduction
The advantages of 3D nature biological systems and structures have motivated
researchers to mimic their capabilities in humanmade devices in applications such as
biomedical prosthetics [64], electronic skin [65,66], and health monitoring [67,68]. An
example of such 3D structure in the human body is the sensory receptors, which are
responsible for the detection of external stimuli. The incorporation of such 3D designs to
piezoelectric devices such as sensors and actuators provided valuable advances in the
device capabilities, which would be difficult to achieve with 2D systems [69]. An example
is the improved frequency tunability and bandwidth of 3D MEMS compared to 2D
structures [70].
48
Different techniques have been developed for the fabrication of 3D structures such
as 3D printing [71], two-photon/multiphoton lithography [72], and thin-film folding and
wrinkling [73]. Among these fabrication methods, compressive buckling is proved to be
of particular interest due to its unique advantages such as the accessible feature size, scale,
and material [1]. The compressive buckling technique relies on the 2D to 3D geometrical
transformation of the precursors, which are selectively bonded to a prestretched elastomer
substrate. Releasing the prestrain in the substrate induced compressive force that pops up
the 2D precursor into a programmable 3D shape.
In this Chapter, the mechanical performance of 3D tactile sensors is investigated
using an experimental approach by flat punch compression. The 3D sensors were
fabricated using compressive bucking method, and the Table-like shape was selected for
the structural design of the sensor. Piezoelectric monocrystalline silicon nanomembranes
(Si-NMs) were integrated into the body of the structures at selective locations and the
whole layout was encapsulated with a thin layer of polymers with different stiffnesses to
complete the fabrication process. The stiffness is an important aspect in the design of 3D
devices intended for mechanical sensing and harvesting. For example, ultralow stiffness
is of interest for systems with low-frequency response and in soft biology [45].
The durability of the device against many cycles of loading, the frequency of
applied external stimuli, the viscoelastic effect and the load-bearing capability of
encapsulant materials, and the overall mechanical response of device upon loading and
unloading are important parameters that need to be studied before implementing the device
into a real application. Hence, this Chapter is dedicated to studying the mechanical
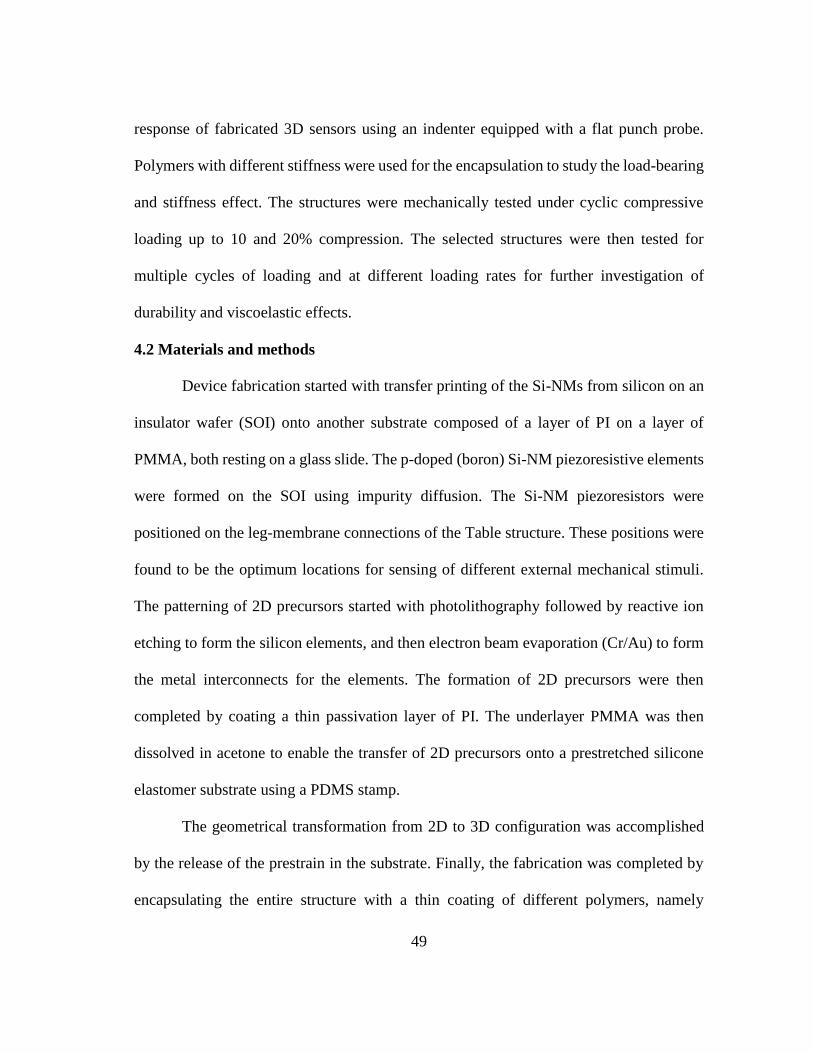
49
response of fabricated 3D sensors using an indenter equipped with a flat punch probe.
Polymers with different stiffness were used for the encapsulation to study the load-bearing
and stiffness effect. The structures were mechanically tested under cyclic compressive
loading up to 10 and 20% compression. The selected structures were then tested for
multiple cycles of loading and at different loading rates for further investigation of
durability and viscoelastic effects.
4.2 Materials and methods
Device fabrication started with transfer printing of the Si-NMs from silicon on an
insulator wafer (SOI) onto another substrate composed of a layer of PI on a layer of
PMMA, both resting on a glass slide. The p-doped (boron) Si-NM piezoresistive elements
were formed on the SOI using impurity diffusion. The Si-NM piezoresistors were
positioned on the leg-membrane connections of the Table structure. These positions were
found to be the optimum locations for sensing of different external mechanical stimuli.
The patterning of 2D precursors started with photolithography followed by reactive ion
etching to form the silicon elements, and then electron beam evaporation (Cr/Au) to form
the metal interconnects for the elements. The formation of 2D precursors were then
completed by coating a thin passivation layer of PI. The underlayer PMMA was then
dissolved in acetone to enable the transfer of 2D precursors onto a prestretched silicone
elastomer substrate using a PDMS stamp.
The geometrical transformation from 2D to 3D configuration was accomplished
by the release of the prestrain in the substrate. Finally, the fabrication was completed by
encapsulating the entire structure with a thin coating of different polymers, namely
50
polydimethylsiloxane (PDMS), Ecoflex, and Dragon Skin. The selection of these
polymers was based on the difference in their modulus. The Ecoflex and Dragon Skin
have a modulus of 68.9 kPa and 151.68 kPa, respectively. PDMS has a modulus of about
1 MPa. Therefore, PDMS had the highest modulus among the polymers. The structures
are composed of PI (with modulus of 2.5 GPa) and Gold (with modulus of 76 GPa). Gold
has a thickness of 100 nm and is sandwiched between the top PI (with thickness of 2 μm)
and bottom polyimide (with thickness of 3 μm). Optical images of plain and encapsulated
structures are shown in Figure 21. The plain refers to the structure without encapsulation.
Note that the encapsulation will not only physically protect the 3D device but also helps
to maintain the deformability. The design of the 3D geometry and the type of material
utilized for the encapsulation could be optimized for achieving the desired sensitivity [45].
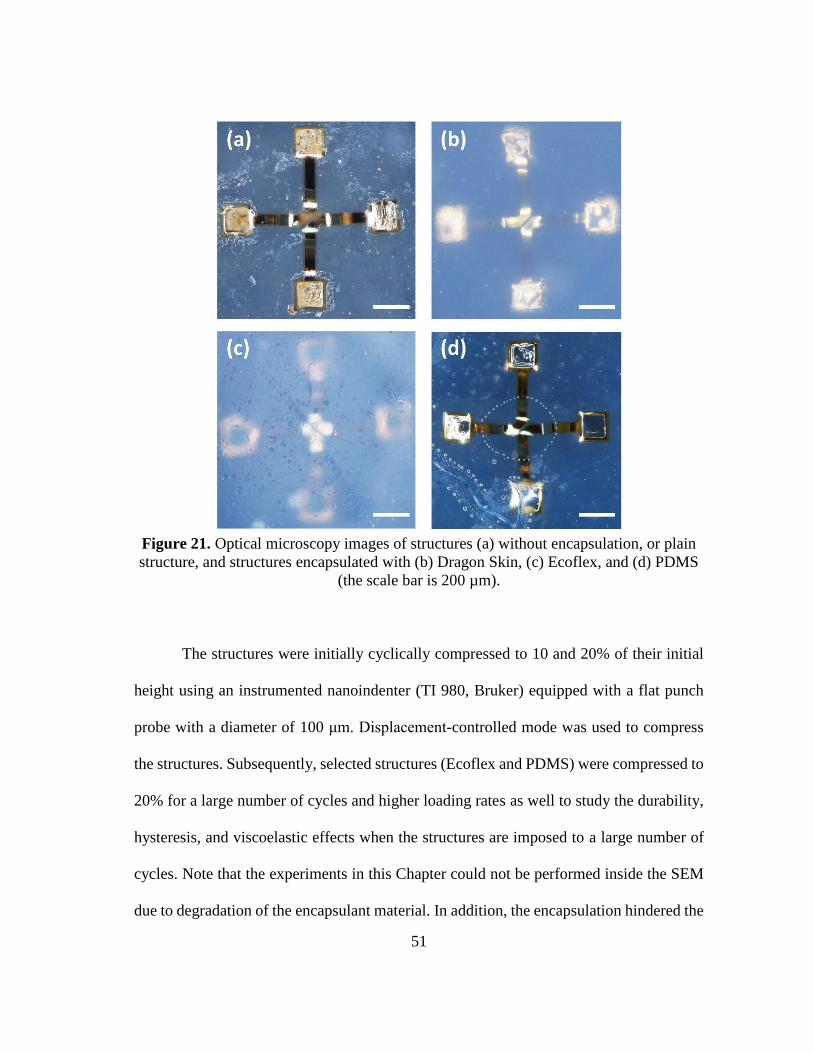
51
Figure 21. Optical microscopy images of structures (a) without encapsulation, or plain
structure, and structures encapsulated with (b) Dragon Skin, (c) Ecoflex, and (d) PDMS
(the scale bar is 200 µm).
The structures were initially cyclically compressed to 10 and 20% of their initial
height using an instrumented nanoindenter (TI 980, Bruker) equipped with a flat punch
probe with a diameter of 100 μm. Displacement-controlled mode was used to compress
the structures. Subsequently, selected structures (Ecoflex and PDMS) were compressed to
20% for a large number of cycles and higher loading rates as well to study the durability,
hysteresis, and viscoelastic effects when the structures are imposed to a large number of
cycles. Note that the experiments in this Chapter could not be performed inside the SEM
due to degradation of the encapsulant material. In addition, the encapsulation hindered the
52
visibility of the structure under it and we were not able to locate the structure to perform
the compression.
4.3 Results and discussion
Figure 22(a, b) shows the load-displacement curves for cycling of the Plain
structure at 10 and 20% compression. Five sets of cycling experiments were carried out
for 10% compression each set consisting of 20 cycles resulting in a total number of 100
cycles. For compression at 20%, three sets of cycling experiments were carried out, each
set being 10 cycles resulting in a total number of 30 cycles. All experiments were
performed with a constant loading rate of 5µm/s. After the complete unloading of the
structure at the end of each set, the next cycle was performed after 4 minutes to allow for
the viscous relaxation of the structure and substrate. The punch was fully removed from
the structure at the last cycle of each set.
From Figure 22(a), cycling of the structure at 10% was fully elastic with minimal
hysteresis. The hysteresis was similar between each set and remained constant for the
whole set of cycling tests. Unlike the compression at 10%, cycling at 20% showed
different behavior. As shown in Figure 22(b), the load-displacement curves show two
regions for the loading associated with Hookean-type deformation with a linear slope and
a reduction in the slope due to small buckling of the legs. Similar behavior was observed
during the unloading. Figure 22(d) shows the changes in the height of the structure
measured across the red dashed line shown in Figure 22(c). From the figure, the height of
the structure remained unchanged, which shows the full recovery of the structure after
cycling to 10 and 20% compression.
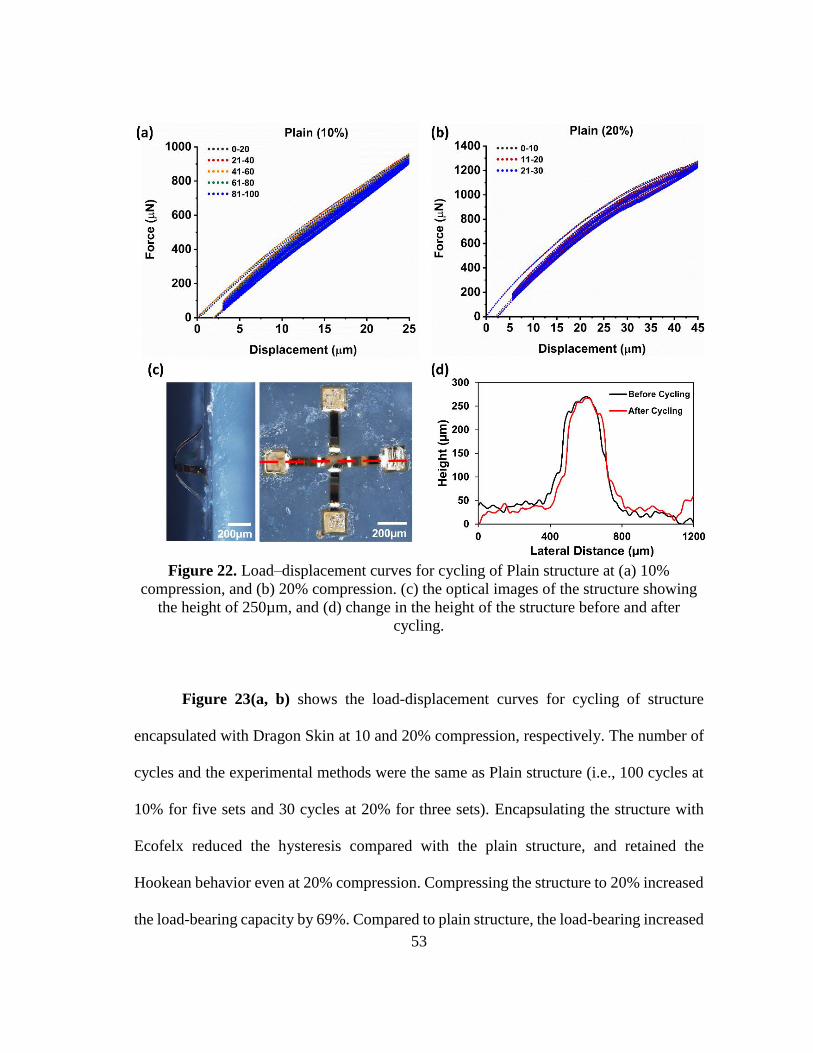
53
Figure 22. Load–displacement curves for cycling of Plain structure at (a) 10%
compression, and (b) 20% compression. (c) the optical images of the structure showing
the height of 250µm, and (d) change in the height of the structure before and after
cycling.
Figure 23(a, b) shows the load-displacement curves for cycling of structure
encapsulated with Dragon Skin at 10 and 20% compression, respectively. The number of
cycles and the experimental methods were the same as Plain structure (i.e., 100 cycles at
10% for five sets and 30 cycles at 20% for three sets). Encapsulating the structure with
Ecofelx reduced the hysteresis compared with the plain structure, and retained the
Hookean behavior even at 20% compression. Compressing the structure to 20% increased
the load-bearing capacity by 69%. Compared to plain structure, the load-bearing increased
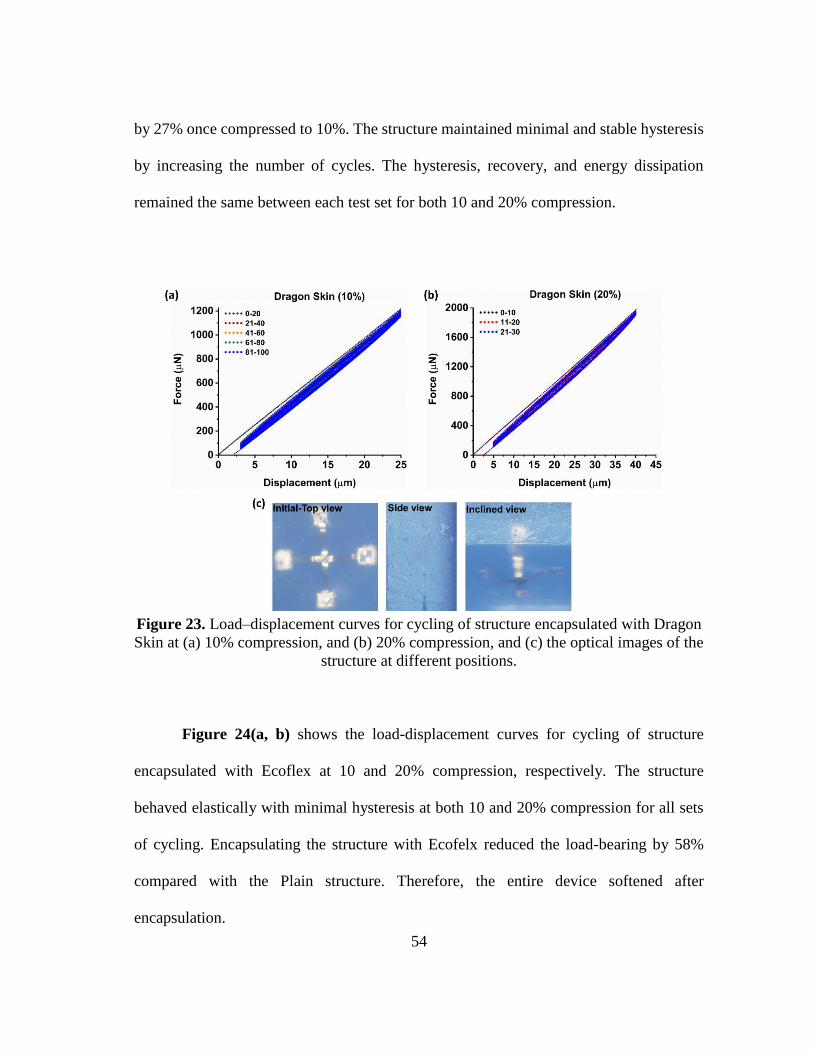
54
by 27% once compressed to 10%. The structure maintained minimal and stable hysteresis
by increasing the number of cycles. The hysteresis, recovery, and energy dissipation
remained the same between each test set for both 10 and 20% compression.
Figure 23. Load–displacement curves for cycling of structure encapsulated with Dragon
Skin at (a) 10% compression, and (b) 20% compression, and (c) the optical images of the
structure at different positions.
Figure 24(a, b) shows the load-displacement curves for cycling of structure
encapsulated with Ecoflex at 10 and 20% compression, respectively. The structure
behaved elastically with minimal hysteresis at both 10 and 20% compression for all sets
of cycling. Encapsulating the structure with Ecofelx reduced the load-bearing by 58%
compared with the Plain structure. Therefore, the entire device softened after
encapsulation.
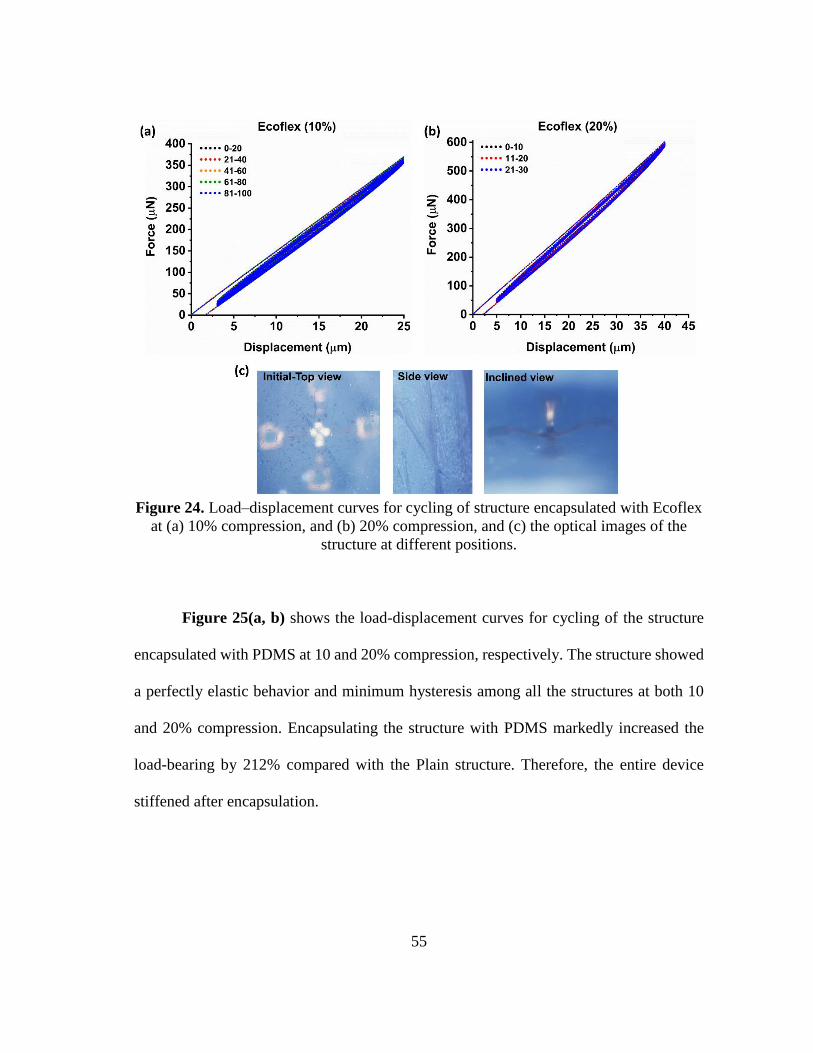
55
Figure 24. Load–displacement curves for cycling of structure encapsulated with Ecoflex
at (a) 10% compression, and (b) 20% compression, and (c) the optical images of the
structure at different positions.
Figure 25(a, b) shows the load-displacement curves for cycling of the structure
encapsulated with PDMS at 10 and 20% compression, respectively. The structure showed
a perfectly elastic behavior and minimum hysteresis among all the structures at both 10
and 20% compression. Encapsulating the structure with PDMS markedly increased the
load-bearing by 212% compared with the Plain structure. Therefore, the entire device
stiffened after encapsulation.
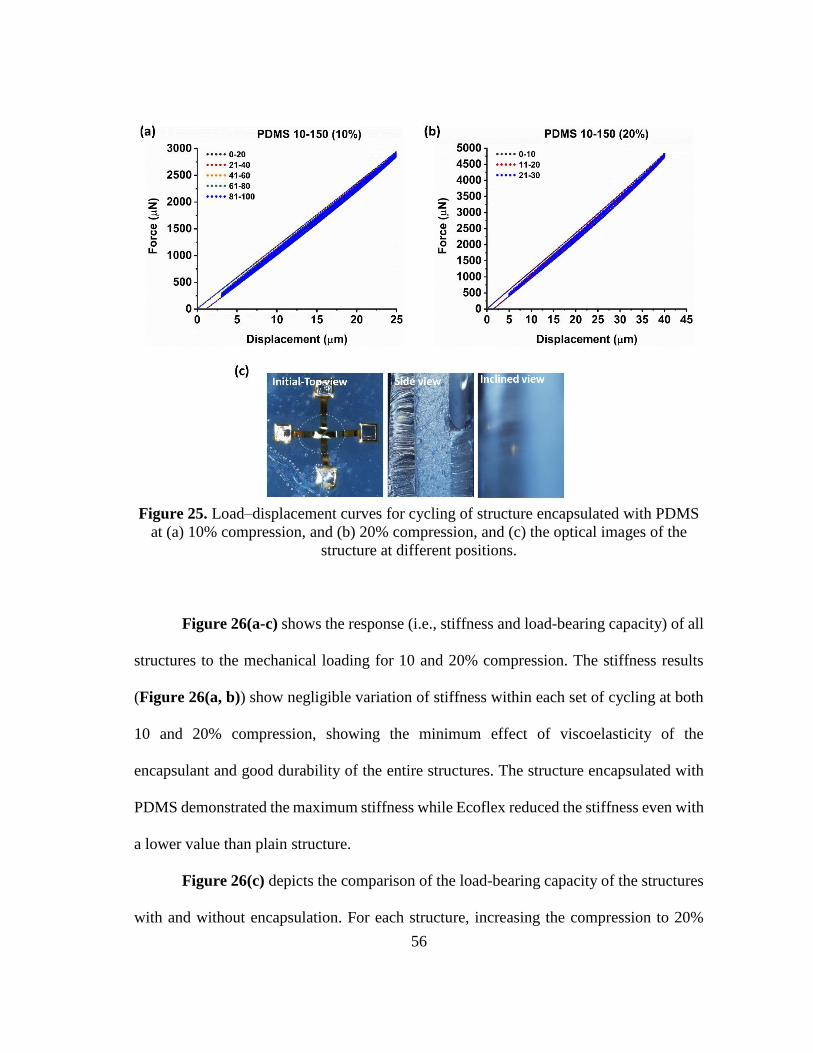
56
Figure 25. Load–displacement curves for cycling of structure encapsulated with PDMS
at (a) 10% compression, and (b) 20% compression, and (c) the optical images of the
structure at different positions.
Figure 26(a-c) shows the response (i.e., stiffness and load-bearing capacity) of all
structures to the mechanical loading for 10 and 20% compression. The stiffness results
(Figure 26(a, b)) show negligible variation of stiffness within each set of cycling at both
10 and 20% compression, showing the minimum effect of viscoelasticity of the
encapsulant and good durability of the entire structures. The structure encapsulated with
PDMS demonstrated the maximum stiffness while Ecoflex reduced the stiffness even with
a lower value than plain structure.
Figure 26(c) depicts the comparison of the load-bearing capacity of the structures
with and without encapsulation. For each structure, increasing the compression to 20%
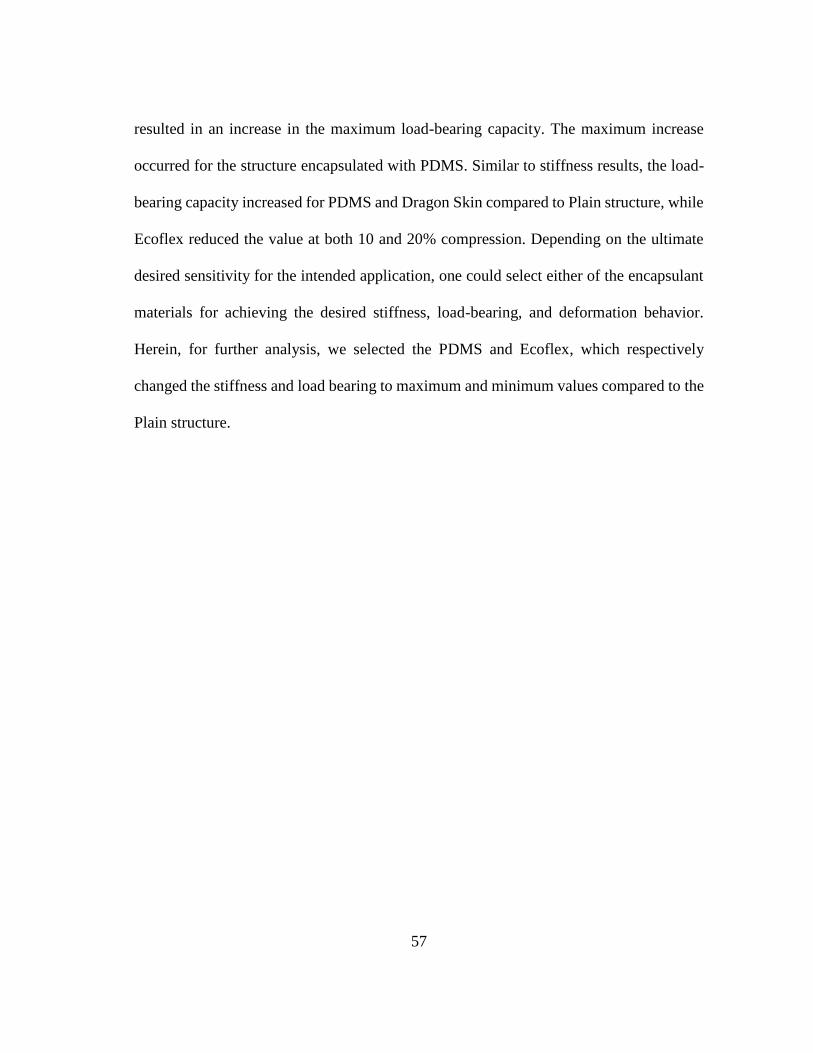
57
resulted in an increase in the maximum load-bearing capacity. The maximum increase
occurred for the structure encapsulated with PDMS. Similar to stiffness results, the load-
bearing capacity increased for PDMS and Dragon Skin compared to Plain structure, while
Ecoflex reduced the value at both 10 and 20% compression. Depending on the ultimate
desired sensitivity for the intended application, one could select either of the encapsulant
materials for achieving the desired stiffness, load-bearing, and deformation behavior.
Herein, for further analysis, we selected the PDMS and Ecoflex, which respectively
changed the stiffness and load bearing to maximum and minimum values compared to the
Plain structure.
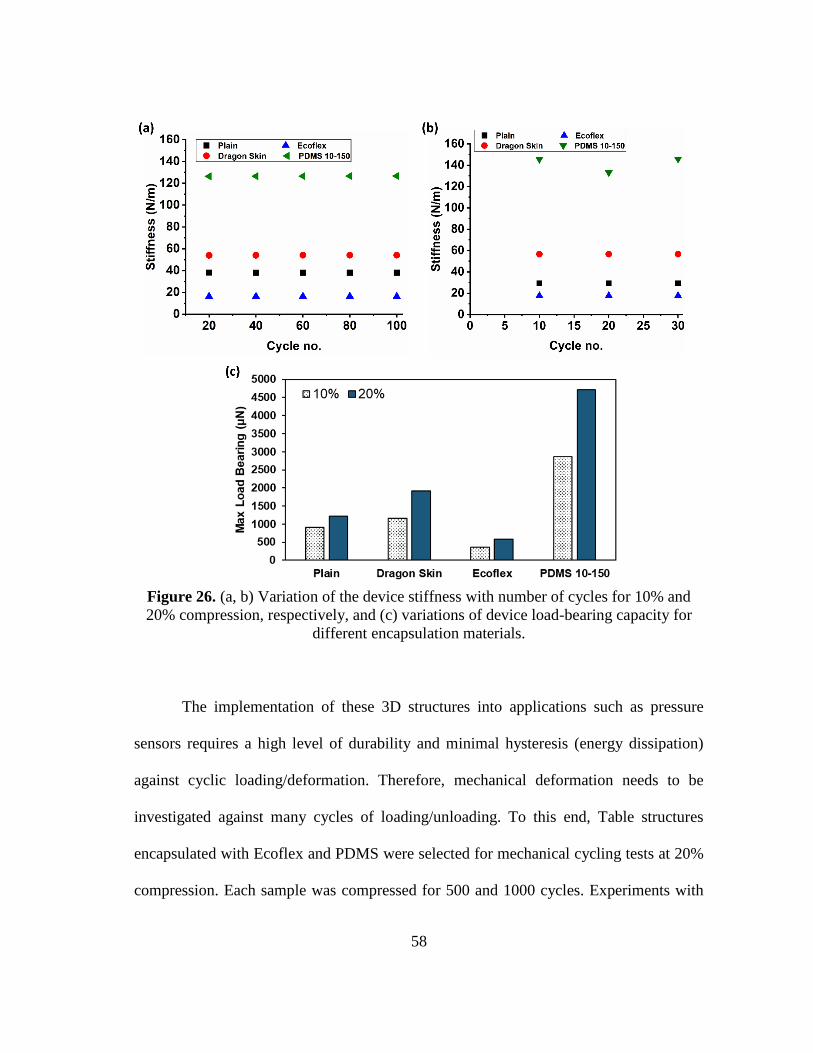
58
Figure 26. (a, b) Variation of the device stiffness with number of cycles for 10% and
20% compression, respectively, and (c) variations of device load-bearing capacity for
different encapsulation materials.
The implementation of these 3D structures into applications such as pressure
sensors requires a high level of durability and minimal hysteresis (energy dissipation)
against cyclic loading/deformation. Therefore, mechanical deformation needs to be
investigated against many cycles of loading/unloading. To this end, Table structures
encapsulated with Ecoflex and PDMS were selected for mechanical cycling tests at 20%
compression. Each sample was compressed for 500 and 1000 cycles. Experiments with
59
500 cycles performed with a loading rate of 15 µm/s, while 1000 cycles were performed
at a higher frequency of f = 1 Hz, which is similar to human walking frequency.
Figure 27(a, b) shows the load-displacement curves for cycling of structure
encapsulated with Ecoflex and PDMS, respectively. Increasing the number of cycles to
500 and 1000 did not alter the hysteresis behavior compared to low cycling tests, and the
structures maintained their durable behavior with minimal energy dissipation for both
Ecoflex and PDMS encapsulant. Moreover, the structures’ hysteresis was found to be
insensitive to the loading rate up to f=1Hz. Figure 27(c, d) shows the mechanical
properties such as load-bearing capacity and stiffness, respectively that were extracted
from the load-displacement curves. From Figure 27(c), the variation of maximum load-
bearing with the number of cycles and loading rate was found to be negligible for Ecoflex,
while for PDMS, the load-bearing slightly decreased with increase of the number of cycles
and loading rate by 6 and 10%, respectively. The stiffness followed similar behavior (see
Figure 27(d)) ad the load-bearing. The stiffness of Ecoflex remain nearly unchanged,
whereas the stiffness of PDMS reduced with increase of the number of cycles and loading
rate by 10 and 11%, respectively. In summary, the effect of viscoelastic behavior is more
pronounced for PDMS compared to Ecoflex.
60
Figure 27. Load-displacement curves for cycling of structures encapsulated with (a)
Ecoflex, and (b) PDMS. The calculated mechanical properties were obtained from the
load-displacement curves: (c) maximum load-bearing and (d) stiffness at 20%
compression.
4.4 Summary
3D kirigami microstructures were fabricated with Table-like geometrical
configurations from PI polymer using compressive buckling method. The device was
encapsulated with polymers with different stiffnesses, and their mechanical response was
measured at 10 and 20% compression under cyclic loading. The experiments were
performed with a nanoindenter equipped with a flat punch probe. The goal was to evaluate
61
the stability and durability of the device against many cycles of loading, the frequency of
applied external stimuli, the viscoelastic effect and the load-bearing capability of
encapsulant materials. The plain structures showed softening behavior above 10 %
compression. Encapsulating the structures minimized the hysteresis. All the encapsulated
structures showed a linear elastic behavior at 10 and 20 % compression. The experimental
findings indicated the strong effect of encapsulant material on the ultimate mechanical
behavior of 3D device. The Ecoflex was found to decrease the load-bearing and stiffness
of the device compared to plain structure, while Dragon Skin and particularly PDMS
increased the load-bearing and stiffness. Similar to low cycling tests, all the encapsulated
structures maintained their durable behavior with minimal energy dissipation upon cycling
test to 1000 cycles. The effect of viscoelastic behavior was found to be more pronounced
for PDMS compared to Ecoflex encapsulant.
62
5. CONCLUSION AND RECOMMENDATIONS FOR FUTURE WORK
5.1 Conclusions
This thesis was dedicated to the study of fabrication and deformation of three-
dimensional (3D) Kirigami-inspired polymer-based micro-structures made using
mechanically-guided 3D micro-assembly. The mechanical response of assembled 3D
buckled kirigami structures were investigated through mechanical cyclic and single
loading compression and based on the findings, the following conclusions could be drawn:
1) In Chapter 2, the mechanical cycling of 3D structures with different types of
structural defects under compressive loading up to 50 and 100% were
performed for 3D structures made of SU8. Reduction in load-bearing capacity,
energy dissipation, degree of plastic deformation, and overall deformation of
the structures were found to be a function of the defect type. Despite the defect
type, all structures ultimately achieved stable hysteresis with steady-state
mechanical behavior at compression of 50% and extreme condition of 100 %,
which is advantageous in practical applications as in flexible and stretchable
electronics.
2) In chapter 3, the 3D structures consisted of a layer of E44 shape memory
epoxy, which were patterned using microfabrication. The mechanics of these
kirigami structures were studied using experimental instrumentation and
computational modeling through mechanical cyclic and single loading
compression at room and elevated temperatures, respectively. Our findings
63
reveal that the load-bearing capacity, resilience, and stability under
deformation were largely affected by structures’ geometry. The SM behavior
of the structures was observed inside a scanning electron microscopy,
indicating outstanding shape memory behavior by full recovery to their
original shape.
3) In Chapter 4, 3D Kirigami microstructures were fabricated with Table-like
geometrical configurations from PI polymer integrated with piezoresistive
elements. The device was encapsulated with polymers with different
stiffnesses, and their mechanical response was measured at 10 and 20%
compression under cyclic loading. All the encapsulated structures showed a
linear elastic behavior, while Plain structure softened after 10% compression.
The Ecoflex and PDMS were found to respectively decrease and increase the
load-bearing and stiffness of the device compared to Plain structure.
5.2 Recommendations for Future Work
As seen in Chapter 2, the mechanical response of the structures was found to be
dependent on the defect type. The FEA showed the stress/strain distribution for each
defective structure upon single loading compression. Future studies need to be carried out
for modeling of cyclic compression for more precise comparison with the experiments.
In Chapter 3, the shape memory effect was qualitatively captured inside the SEM.
However, due to the high transition temperature and sample dimensions, we were not able
to get the thermo-mechanical force-displacement diagram. Future studies could be
focused on developing the recipe for body temperature SMPs to fabricate 3D structures in
64
micron scales. Further studies could be carried out to investigate the time-dependent
properties such as strain rate sensitivity, and stress relaxation and creep testing. Moreover,
there has not been a lot of work with shear/sliding of these structures, which is a potential
area for further studies.
In Chapter 4, the 3D structures were integrated with piezoresistive elements and
encapsulated with polymers with different stiffness to fabricate 3D tactile pressure sensor.
Due to degradation of encapsulant polymers inside the SEM and invisibility of the
structures, we were not able to see the deformation of the structure. Further studies could
be focused on resolving this issue. For example, one could attach the encapsulant material
to the flat punch and compress the Plain structure inside the SEM.
65
REFERENCES
[1] Yan Z, Han M, Yang Y, Nan K, Luan H, Luo Y, et al. Deterministic assembly of
3D mesostructures in advanced materials via compressive buckling: A short review
of recent progress. Extrem Mech Lett 2017;11:96–104.
doi:10.1016/J.EML.2016.12.006.
[2] Xu S, Yan Z, Jang K, Huang W, Fu H, … JK-, et al. Assembly of
micro/nanomaterials into complex, three-dimensional architectures by compressive
buckling. Science 2015;347:154–9. doi:10.1126/science.1260960.
[3] Fan Z, Razavi H, Do JW, Moriwaki A, Ergen O, Chueh YL, et al. Three-
dimensional nanopillar-array photovoltaics on low-cost and flexible substrates. Nat
Mater 2009;8:648–53. doi:10.1038/nmat2493.
[4] Braun P V. Materials chemistry in 3D templates for functional photonics. Chem
Mater 2014;26:277–86. doi:10.1021/cm4023437.
[5] Leong TG, Randall CL, Benson BR, Bassik N, Stern GM, Gracias DH. Tetherless
thermobiochemically actuated microgrippers. Proc Natl Acad Sci U S A
2009;106:703–8. doi:10.1073/pnas.0807698106.
[6] Yu M, Huang Y, Ballweg J, Shin H, Huang M, Savage DE, et al. Semiconductor
nanomembrane tubes: Three-dimensional confinement for controlled neurite
outgrowth. ACS Nano 2011;5:2447–57. doi:10.1021/nn103618d.
[7] Gansel JK, Thiel M, Rill MS, Decker M, Bade K, Saile V, et al. Gold helix photonic
metamaterial as broadband circular polarizer. Science 2009;325:1513–5.
66
doi:10.1126/science.1177031.
[8] Zheng X, Lee H, Weisgraber TH, Shusteff M, DeOtte J, Duoss EB, et al. Ultralight,
ultrastiff mechanical metamaterials. Science 2014;344:1373–7.
doi:10.1126/science.1252291.
[9] Zhang H, Yu X, Braun P V. Three-dimensional bicontinuous ultrafast-charge and-
discharge bulk battery electrodes. Nat Nanotechnol 2011;6:277–81.
doi:10.1038/nnano.2011.38.
[10] Jiang H, Lee PS, Li C. 3D carbon based nanostructures for advanced
supercapacitors. Energy Environ Sci 2013;6:41–53. doi:10.1039/c2ee23284g.
[11] Wood RJ. The challenge of manufacturing between Macro and Micro: classic ways
of folding paper into dynamic shapes--origami, pop-up books--inspire methods to
engineer millimeter-scale machines. Am Sci 2014;102:124–32.
[12] Rogers J, Huang Y, Schmidt OG, Gracias DH. Origami MEMS and NEMS. MRS
Bull 2016;41:123–9. doi:10.1557/mrs.2016.2.
[13] Yan Z, Zhang F, Wang J, Liu F, Guo X, Nan K, et al. Controlled Mechanical
Buckling for Origami-Inspired Construction of 3D Microstructures in Advanced
Materials. Adv Funct Mater 2016;26:2629–39. doi:10.1002/adfm.201504901.
[14] Fu H, Nan K, Bai W, Huang W, Bai K, Lu L, et al. Morphable 3D mesostructures
and microelectronic devices by multistable buckling mechanics. Nat Mater
2018;17:268–76. doi:10.1038/s41563-017-0011-3.
[15] Li S, Han M, Rogers JA, Zhang Y, Huang Y, Wang H. Mechanics of buckled
serpentine structures formed via mechanics-guided, deterministic three-
67
dimensional assembly. J Mech Phys Solids 2019;125:736–48.
doi:10.1016/j.jmps.2019.01.019.
[16] Ning X, Wang X, Zhang Y, Yu X, Choi D, Zheng N, et al. Assembly of Advanced
Materials into 3D Functional Structures by Methods Inspired by Origami and
Kirigami: A Review. Adv Mater Interfaces 2018;5:1800284.
doi:10.1002/admi.201800284.
[17] Ray TR, Choi J, Bandodkar AJ, Krishnan S, Gutruf P, Tian L, et al. Bio-integrated
wearable systems: A comprehensive review. Chem Rev 2019;119:5461–533.
doi:10.1021/acs.chemrev.8b00573.
[18] Humood M, Shi Y, Han M, Lefebvre J, Yan Z, Pharr M, et al. Fabrication and
Deformation of 3D Multilayered Kirigami Microstructures. Small
2018;14:1703852. doi:10.1002/smll.201703852.
[19] Humood M, Lefebvre J, Shi Y, Han M, Fincher CD, Pharr M, et al. Fabrication and
Mechanical Cycling of Polymer Microscale Architectures for 3D MEMS Sensors.
Adv Eng Mater 2019;21:1801254. doi:10.1002/adem.201801254.
[20] Wang C, Taherabadi L, Jia G, Madou M, Yeh Y, Dunn B. C-MEMS for the
Manufacture of 3D Microbatteries. Electrochem Solid-State Lett 2004;7:A435.
doi:10.1149/1.1798151.
[21] Felton S, Tolley M, Demaine E, Rus D, Wood R. A method for building self-folding
machines Downloaded from. Science 2014;345:644–6.
doi:10.1126/science.1252610.
[22] Randall CL, Gultepe E, Gracias DH. Self-folding devices and materials for
68
biomedical applications. Trends Biotechnol 2012;30:138–46.
doi:10.1016/J.TIBTECH.2011.06.013.
[23] Tian B, Liu J, Dvir T, Jin L, Tsui JH, Qing Q, et al. Macroporous nanowire
nanoelectronic scaffolds for synthetic tissues. Nat Mater 2012;11:986–94.
doi:10.1038/nmat3404.
[24] Song Z, Ma T, Tang R, Cheng Q, Wang X, Krishnaraju D, et al. Origami lithium-
ion batteries. Nat Commun 2014;5:3140. doi:10.1038/ncomms4140.
[25] Lukatskaya MR, Dunn B, Gogotsi Y. Multidimensional materials and device
architectures for future hybrid energy storage. Nat Commun 2016;7:12647.
doi:10.1038/ncomms12647.
[26] Rogers JA, Someya T, Huang Y. Materials and mechanics for stretchable
electronics. Science 2010;327:1603–7. doi:10.1126/science.1182383.
[27] Su Y, Ping X, Yu KJ, Lee JW, Fan JA, Wang B, et al. In-Plane Deformation
Mechanics for Highly Stretchable Electronics. Adv Mater 2017;29:1604989.
doi:10.1002/adma.201604989.
[28] Breger JC, Yoon C, Xiao R, Kwag HR, Wang MO, Fisher JP, et al. Self-Folding
Thermo-Magnetically Responsive Soft Microgrippers. ACS Appl Mater Interfaces
2015;7:3398–405. doi:10.1021/am508621s.
[29] Schumann M, Bückmann T, Gruhler N, Wegener M, Pernice W. Hybrid 2D–3D
optical devices for integrated optics by direct laser writing. Light Sci Appl
2014;3:e175. doi:10.1038/lsa.2014.56.
[30] Silverberg JL, Evans AA, Mcleod L, Hayward RC, Hull T, Santangelo CD, et al.
69
Using origami design principles to fold reprogrammable mechanical metamaterials.
Science 2014;345:647–50. doi:10.1126/science.1252876.
[31] Yan Z, Zhang F, Liu F, Han M, Ou D, Liu Y, et al. Mechanical assembly of
complex, 3D mesostructures from releasable multilayers of advanced materials. Sci
Adv 2016:e1601014. doi:10.1126/sciadv.1601014.
[32] Iannacci J. Reliability of MEMS: A perspective on failure mechanisms,
improvement solutions and best practices at development level. Displays
2015;37:62–71. doi:10.1016/J.DISPLA.2014.08.003.
[33] Mulloni V, Margesin B, Farinelli P, Marcelli R, Lucibello A, De Angelis G.
Cycling reliability of RF-MEMS switches with Gold–Platinum multilayers as
contact material. Microsyst Technol 2017;23:3843–50. doi:10.1007/s00542-015-
2782-2.
[34] Pini V, Ruz JJ, Kosaka PM, Malvar O, Calleja M, Tamayo J. How two-dimensional
bending can extraordinarily stiffen thin sheets. Sci Rep 2016;6:29627.
doi:10.1038/srep29627.
[35] Vasudevan A., Sadananda K. Analysis of fatigue crack growth under compression–
compression loading. Int J Fatigue 2001;23:365–74. doi:10.1016/S0142-
1123(01)00172-4.
[36] Liu K, Jiang L. Bio-inspired design of multiscale structures for function integration.
Nano Today 2011;6:155–75. doi:10.1016/J.NANTOD.2011.02.002.
[37] Zhao N, Wang Z, Cai C, Shen H, Liang F, Wang D, et al. Bioinspired Materials:
from Low to High Dimensional Structure. Adv Mater 2014;26:6994–7017.
70
doi:10.1002/adma.201401718.
[38] Ahn J-H, Kim H-S, Lee KJ, Jeon S, Kang SJ, Sun Y, et al. Heterogeneous Three-
Dimensional Electronics by Use of Printed Semiconductor Nanomaterials. Science
2006;314:1754–7. doi:10.1126/science.1132394.
[39] Xu L, Gutbrod SR, Bonifas AP, Su Y, Sulkin MS, Lu N, et al. 3D multifunctional
integumentary membranes for spatiotemporal cardiac measurements and
stimulation across the entire epicardium. Nat Commun 2014;5:3329.
doi:10.1038/ncomms4329.
[40] Liu Z, Qi D, Leow WR, Yu J, Xiloyannnis M, Cappello L, et al. 3D-Structured
Stretchable Strain Sensors for Out-of-Plane Force Detection. Adv Mater
2018;30:1707285. doi:10.1002/adma.201707285.
[41] Tian B, Liu J, Dvir T, Jin L, Tsui JH, Qing Q, et al. Macroporous nanowire
nanoelectronic scaffolds for synthetic tissues. Nat Mater 2012;11:986–94.
doi:10.1038/nmat3404.
[42] Feiner R, Engel L, Fleischer S, Malki M, Gal I, Shapira A, et al. Engineered hybrid
cardiac patches with multifunctional electronics for online monitoring and
regulation of tissue function. Nat Mater 2016;15:679–85. doi:10.1038/nmat4590.
[43] Liu X, Yuk H, Lin S, Parada GA, Tang T-C, Tham E, et al. 3D Printing of Living
Responsive Materials and Devices. Adv Mater 2018;30:1704821.
doi:10.1002/adma.201704821.
[44] Song Z, Ma T, Tang R, Cheng Q, Wang X, Krishnaraju D, et al. Origami lithium-
ion batteries. Nat Commun 2014;5:3140. doi:10.1038/ncomms4140.
71
[45] Han M, Wang H, Yang Y, Liang C, Bai W, Yan Z, et al. Three-dimensional
piezoelectric polymer microsystems for vibrational energy harvesting, robotic
interfaces and biomedical implants. Nat Electron 2019;2:26–35.
doi:10.1038/s41928-018-0189-7.
[46] Soukoulis CM, Wegener M. Past achievements and future challenges in the
development of three-dimensional photonic metamaterials. Nat Photonics
2011;5:523–30. doi:10.1038/nphoton.2011.154.
[47] Overvelde JTB, Weaver JC, Hoberman C, Bertoldi K. Rational design of
reconfigurable prismatic architected materials. Nature 2017;541:347–52.
doi:10.1038/nature20824.
[48] Yan Z, Han M, Shi Y, Badea A, Yang Y, Kulkarni A, et al. Three-dimensional
mesostructures as high-temperature growth templates, electronic cellular scaffolds,
and self-propelled microrobots. Proc Natl Acad Sci U S A 2017;114:E9455–64.
doi:10.1073/pnas.1713805114.
[49] Breger JC, Yoon C, Xiao R, Kwag HR, Wang MO, Fisher JP, et al. Self-Folding
Thermo-Magnetically Responsive Soft Microgrippers. ACS Appl Mater Interfaces
2015;7:3398–405. doi:10.1021/am508621s.
[50] Rogers J, Huang Y, Schmidt OG, Gracias DH. Origami MEMS and NEMS. MRS
Bull 2016;41:123–9. doi:10.1557/mrs.2016.2.
[51] Lin D, Nian Q, Deng B, Jin S, Hu Y, Wang W, et al. Three-Dimensional Printing
of Complex Structures: Man Made or toward Nature? ACS Nano 2014;8:9710–5.
doi:10.1021/nn504894j.
72
[52] Moon JH, Ford J, Yang S. Fabricating three-dimensional polymeric photonic
structures by multi-beam interference lithography. Polym Adv Technol
2006;17:83–93. doi:10.1002/pat.663.
[53] Farsari M, Chichkov BN. Two-photon fabrication. Nat Photonics 2009;3:450–2.
doi:10.1038/nphoton.2009.131.
[54] Zhang X, Pint CL, Lee MH, Schubert BE, Jamshidi A, Takei K, et al. Optically-
and Thermally-Responsive Programmable Materials Based on Carbon Nanotube-
Hydrogel Polymer Composites. Nano Lett 2011;11:3239–44.
doi:10.1021/nl201503e.
[55] Yan Z, Zhang F, Liu F, Han M, Ou D, Liu Y, et al. Mechanical assembly of
complex, 3D mesostructures from releasable multilayers of advanced materials. Sci
Adv 2016;2:e1601014. doi:10.1126/sciadv.1601014.
[56] Zhang Y, Yan Z, Nan K, Xiao D, Liu Y, Luan H, et al. A mechanically driven form
of Kirigami as a route to 3D mesostructures in micro/nanomembranes. Proc Natl
Acad Sci U S A 2015;112:11757–64. doi:10.1073/pnas.1515602112.
[57] Wang X, Guo X, Ye J, Zheng N, Kohli P, Choi D, et al. Freestanding 3D
Mesostructures, Functional Devices, and Shape-Programmable Systems Based on
Mechanically Induced Assembly with Shape Memory Polymers. Adv Mater
2019;31:1805615. doi:10.1002/adma.201805615.
[58] Guo X, Xu Z, Zhang F, Wang X, Zi Y, Rogers JA, et al. Reprogrammable 3D
Mesostructures Through Compressive Buckling of Thin Films with Prestrained
Shape Memory Polymer. Acta Mech Solida Sin 2018;31:589–98.
73
doi:10.1007/s10338-018-0047-1.
[59] Humood M, Lefebvre J, Shi Y, Han M, Fincher CD, Pharr M, et al. Fabrication and
Mechanical Cycling of Polymer Microscale Architectures for 3D MEMS Sensors.
Adv Eng Mater 2019;21:1801254. doi:10.1002/adem.201801254.
[60] Yu K, Ge Q, Qi HJ. Reduced time as a unified parameter determining fixity and
free recovery of shape memory polymers. Nat Commun 2014;5:3066.
doi:10.1038/ncomms4066.
[61] Santhosh Kumar KS, Biju R, Reghunadhan Nair CP. Progress in shape memory
epoxy resins. React Funct Polym 2013;73:421–30.
doi:10.1016/j.reactfunctpolym.2012.06.009.
[62] Zhao W, Liu L, Zhang F, Leng J, Liu Y. Shape memory polymers and their
composites in biomedical applications. Mater Sci Eng C 2019;97:864–83.
doi:10.1016/j.msec.2018.12.054.
[63] Liu Y, Du H, Liu L, Leng J. Shape memory polymers and their composites in
aerospace applications: A review. Smart Mater Struct 2014;23:023001.
doi:10.1088/0964-1726/23/2/023001.
[64] Toyama S, Tanaka Y, Shirogane S, Nakamura T, Umino T, Uehara R, et al.
Development of Wearable Sheet-Type Shear Force Sensor and Measurement
System that is Insusceptible to Temperature and Pressure. Sensors 2017;17:1752.
doi:10.3390/s17081752.
[65] Hua Q, Sun J, Liu H, Bao R, Yu R, Zhai J, et al. Skin-inspired highly stretchable
and conformable matrix networks for multifunctional sensing. Nat Commun
74
2018;9:1–11. doi:10.1038/s41467-017-02685-9.
[66] You I, Choi S-E, Hwang H, Han SW, Kim JW, Jeong U. E-Skin Tactile Sensor
Matrix Pixelated by Position-Registered Conductive Microparticles Creating
Pressure-Sensitive Selectors. Adv Funct Mater 2018;28:1801858.
doi:10.1002/adfm.201801858.
[67] Gao Y, Ota H, Schaler EW, Chen K, Zhao A, Gao W, et al. Wearable Microfluidic
Diaphragm Pressure Sensor for Health and Tactile Touch Monitoring. Adv Mater
2017;29. doi:10.1002/adma.201701985.
[68] Liu Y, Wang H, Zhao W, Zhang M, Qin H, Xie Y. Flexible, Stretchable Sensors
for Wearable Health Monitoring: Sensing Mechanisms, Materials, Fabrication
Strategies and Features. Sensors 2018;18:645. doi:10.3390/s18020645.
[69] Won SM, Wang H, Kim BH, Lee K, Jang H, Kwon K, et al. Multimodal Sensing
with a Three-Dimensional Piezoresistive Structure. ACS Nano 2019;13:10972–9.
doi:10.1021/acsnano.9b02030.
[70] Ning X, Wang H, Yu X, Soares JANT, Yan Z, Nan K, et al. 3D Tunable, Multiscale,
and Multistable Vibrational Micro-Platforms Assembled by Compressive
Buckling. Adv Funct Mater 2017;27:1605914. doi:10.1002/adfm.201605914.
[71] Truby RL, Lewis JA. Printing soft matter in three dimensions. Nature
2016;540:371–8. doi:10.1038/nature21003.
[72] Cumpston BH, Ananthavel SP, Barlow S, Dyer DL, Ehrlich JE, Erskine LL, et al.
Two-photon polymerization initiators for three-dimensional optical data storage
and microfabrication. Nature 1999;398:51–4. doi:10.1038/17989.

75
[73] Chen Z, Huang G, Trase I, Han X, Mei Y. Mechanical Self-Assembly of a Strain-
Engineered Flexible Layer: Wrinkling, Rolling, and Twisting. Phys Rev Appl
2016;5:017001. doi:10.1103/PhysRevApplied.5.017001.