Effects of tree species composition on within-forest distribution of understorey species
Upload
independentCategory
view
2download
0
Ms
Da
b
c
a
ARRA
KIFRPSA
1
miaslsp
mm
((
1h
Ecological Indicators 26 (2013) 174–182
Contents lists available at SciVerse ScienceDirect
Ecological Indicators
jo ur n al homep ag e: www.elsev ier .com/ locate /eco l ind
easuring the Insecurity Index of species in networks of protected areas usingpecies distribution modeling and fuzzy logic: The case of raptors in Andalusia
.L. Díaz-Gómeza,∗, A.G. Toxopeusa, T.A. Groena, A.R. Munozb, A.K. Skidmorea, R. Realc
Faculty of GeoInformation Science and Earth Observation (ITC), University of Twente, PO Box 217, 7500 AE Enschede, The NetherlandsFundación Migres, Huerta Grance, CN’340 Km. 96 (Pelayo), 11390 Alegeciras, Cadiz, SpainFaculty of Science, University of Malaga, E29071 Malaga, Spain
r t i c l e i n f o
rticle history:eceived 15 May 2012eceived in revised form 4 October 2012ccepted 17 October 2012
eywords:nsecurity Indexuzzy logicaptorsrotected areaspecies distribution modelingndalusia
a b s t r a c t
Networks of protected areas often fail to include favorable areas for all species, even when they covera considerable percentage of a territory. To assess the effectiveness of protected areas, harsh thresholdsare commonly used (e.g. minimum 20% of the cell must be covered by a protected area to define itas protected). Setting a threshold implies a transformation of continuous data into binary data whichfrequently results in information loss and in outcomes changing sharply depending on the thresholdset. To avoid uncertainty and information loss when evaluating the effectiveness of protected areas, wedeveloped the “Insecurity Index” based on species distribution modeling and fuzzy logic. The InsecurityIndex (0–1) of a species represents how much of the fuzzy set of favorable areas for the species is notincluded in the protected areas. The larger the extent of favorable areas of a species that is not covered byprotected areas, the higher the Insecurity Index. We applied this approach to Andalusia, in the south ofSpain, which sustains 22 out of the 40 raptor species present in Europe, and has about 30% of its territorycovered by regional and Natura 2000 protected areas. By measuring and mapping the Insecurity Index ofraptors in Andalusia we assessed the extent to which protected areas exclude favorable sites for forest,cliff and steppe nesting raptors, identified species with a high Insecurity Index and mapped high priorityareas for implementing conservation actions. The Insecurity Index was significantly higher for steppe
nesting raptors (mean Insecurity Index = 0.81) compared to forest (mean Insecurity Index = 0.62) and cliffnesting raptors (mean Insecurity Index = 0.59). We propose areas of high insecurity for steppe nestingraptors, as potential sites for implementing actions aimed at providing nesting habitat for these species.As demonstrated here for raptors in Andalusia, the Insecurity Index can be used to assess and comparethe extent to which species’ favorable areas are left unprotected by reserves while avoiding uncertaintyto th
and information loss due. Introduction
Networks of protected areas are fundamental conservationeasures for the persistence of species (Chape et al., 2008), but
n many cases even if they cover a considerable percentage of territory they may fail to support adequately all groups ofpecies (Rodrigues et al., 2004; Watson et al., 2011). Given the
imited financial resources available for conservation, evaluatingpecies protection within current networks of protected areas andrioritizing sites for the establishment of new ones or for the∗ Corresponding author. Present address: Carrera 66 N. 76 – 26 Unidad 7 Aparta-ento 203, Postal code 111211, Bogota, Colombia. Tel.: +57 1 2251421;obile: +57 3202262571.
E-mail addresses: [email protected] (D.L. Díaz-Gómez), [email protected]. Toxopeus), [email protected] (T.A. Groen), [email protected]. Munoz), [email protected] (A.K. Skidmore), [email protected] (R. Real).
470-160X/$ – see front matter © 2012 Elsevier Ltd. All rights reserved.ttp://dx.doi.org/10.1016/j.ecolind.2012.10.019
e use of thresholds.© 2012 Elsevier Ltd. All rights reserved.
implementation of management action are crucial steps for bio-diversity conservation.
The basic information required to evaluate a species’ protectionwithin a network of protected areas is the geographical distribu-tion of the species and of the protected areas (Jennings, 2000).Predefined thresholds are often used to derive such informa-tion. For example, when the distribution of a species is inferredfrom a species distribution model, a threshold is frequently usedto transform probability of occurrence into discrete categories(present/absent or suitable/unsuitable) (de Pous et al., 2011; López-López et al., 2011; Martinez et al., 2006). This transformation entailsa loss of information on the location of areas of very high probabil-ity of occurrence (e.g. probability of occurrence >0.9). Adittionally,depending on the method used to derive a probability threshold,
models with different levels of accuracy can be obtained (Jiménez-Valverde and Lobo, 2007).Information on protected areas often comes in vector formatwhilst information on species often comes in raster format.

gical In
TaeFparoic2
twei2lvltcoto2maf
F
Tosn
iiahnaviadoiuo
oSifctftIiA
D.L. Díaz-Gómez et al. / Ecolo
hresholds are also used to match the spatial scale of the protectedreas’ data with the spatial scale of the species data (Estradat al., 2008; Sanchez-Fernandez et al., 2008; Traba et al., 2007).or example, in order for a 10 km × 10 km cell to be consideredrotected, it has to be covered at least in a 25% by a protectedrea. The protected area threshold chosen affects the estimatedepresentation of species in the network (Araújo, 2004). The usef both thresholds, probability and protected area thresholds,mplies that the perceived protection status of the species canhange sharply depending on the thresholds set (Alagador et al.,011).
Fuzzy logic deals with sets that have a degree of membershipo a category (i.e. fuzzy sets) (Zadeh, 1965). Within the frame-ork of fuzzy logic a statement can be half true instead of being
ither false or true. Previously, fuzzy logic was used to derive fuzzyndices of richness, rarity, vulnerability and endemicity (Estrada,008; Real et al., 2006b). These fuzzy diversity indices are calcu-
ated from favorability values (Estrada, 2008). To obtain favorabilityalues, the probability of occurrence of a species predicted by aogistic regression model is transformed with the favorability func-ion (Real et al., 2006a) (Eq. (1)). Because favorability values areomparable between species with different prevalence (i.e. ratiof the number of presences to the total number of sample points),hey can be used to calculate diversity indices without a thresh-ld transformation into species’ presence and absence (Real et al.,006a). These fuzzy diversity indices address the problem of infor-ation loss, resultant from using a harsh probability threshold, and
s such allow the characterization of areas with varying degree ofavorability for the species (Estrada et al., 2008).
ij = Pij/(1 − Pij)n1/n0 + Pij/(1 − Pij)
(1)
he favorability function by Real et al. (2006a). Fij is the favorabilityf the species i in the cell j. Pij is the predicted probability of thepecies i in the cell j, n1 is the number of presences and n0 is theumber of absences.
We propose the “Insecurity Index” as a new approach to evaluat-ng species protection. This index is built as a fuzzy logic equationnvolving two fuzzy sets: extent of a cell covered by a protectedrea and predicted favorability. The Insecurity Index representsow much of the fuzzy set of favorable areas for the species isot included in the fuzzy set of protected areas. We focused onn “Insecurity Index” rather than a “Security Index” because it pro-ides the same essential information and it facilitates mapping ofmportant areas for the implementation of conservation or man-gement action. This index is comparable between species withifferent prevalence because it is calculated from predicted valuesf favorability instead of predicted values of probability. Since thendex is constructed from fuzzy instead of binary sets it avoids thencertainty and information loss arising from the use of thresh-lds.
We exemplify the use of the Insecurity Index and its advantagesver threshold approaches with raptors in Andalusia (Southernpain). We obtained favorability models for all raptors breed-ng in Andalusia and used them to calculate the Insecurity Indexor each species. We compared the Insecurity Index of steppe,liff and forest nesting raptors under two scenarios of protec-ion. For one of the species we compare the results obtainedrom a threshold approach to the results obtained from using
he Insecurity Index. Subsequently, we demonstrate how thensecurity Index can be used to identify areas of conservationmportance by mapping the Insecurity Index for raptor species inndalusia.dicators 26 (2013) 174–182 175
2. Data and methods
2.1. Study area
Andalusia (87,600 km2) is an autonomous region of Spainlocated in the Southern part of the Iberian Peninsula. The climateis typically Mediterranean and presents a strong gradient of rain-fall, of 170–1800 mm from east to west (Font, 2000). The altitudevaries from sea level up to 3500 m and the mean annual tempera-ture ranges from 9.8 ◦C to 19.4 ◦C (Font, 2000). The Pennibaetic andSubbaetic mountain ranges are located in the south and east, theSierra Morena Mountains in the north and the Guadalquivir val-ley in the west. In the mountain ranges the Mediterranean forest isthe most characteristic vegetation; in the lowlands olive and cerealcrops predominate.
2.2. Data
2.2.1. Species dataThe autonomous region of Andalusia sustains 22 raptor species
breeding within its territory, representing half of the raptor speciespresent in Europe (Martí and Moral, 2003). Raptors in Andalusia canbe classified into forest, cliff or steppe raptors according to theirnesting habitat. Data on the presence and absence of breeding ter-ritories of all the breeding raptors in Andalusia were obtained fromthe Atlas of breeding birds of Spain (Martí and Moral, 2003). Thedata on the atlas was the result of fieldwork campaigns that tookplace between 1998 and 2001 by a network of volunteers and pro-fessionals and it is originally represented in a vector UTM projectedgrid that covers Andalusia with 975 polygons of 10 km × 10 km. TheUTM projected grid was converted to a series of rasters, one foreach species presence/absence data. Two species were not includedin the modeling. The Western Osprey (Pandion haliaetus) was notincluded because it is considered to be extinct (and is under reintro-duction) (Consejería de Medio Ambiente, 2001; Muriel et al., 2010)and the European Honey Buzzard (Pernis apivorus) because it hasvery occasional reproduction in Andalusia (Martí and Moral, 2003).In total we modeled 20 raptor species (Appendix A).
2.2.2. Protected areas’ dataWe evaluated separately two scenarios of protection: the net-
work of protected areas of Andalusia (RENPA from the Spanish “Redde áreas protegidas de Andalucía”) and the RENPA plus the Natura2000 sites (from here on called Natura 2000). The Natura 2000 net-work in Andalusia includes all areas protected under RENPA, plusareas that have been declared “site of community interest” but havenot yet been officially incorporated into RENPA. The RENPA and theNatura 2000 networks cover 19% and 29% of Andalusia, respectively(Consejería de Medio Ambiente, 2006).
Shapefiles of the protected areas were downloaded from thewebpage of the Andalusia’s Board (Junta de Andalucía, n.d.) Thevector data on protected areas was intersected with the vector UTMprojected grid of Andalusia. For each polygon of the UTM projectedgrid, the intersected areas were used to calculate the proportionof the polygon covered by protected areas (Pj). Pj ranges between0 and 1, with a polygon receiving a value of 1 when is completelycovered by protected areas. The vector UTM projected grid wasconverted to a raster with Pj as values. By calculating Pj beforethe vector to raster conversion, the information on the smallestprotected areas was not lost.
2.2.3. Predictor variables for species distribution models
The potential predictor variables used in the species distributionmodels were chosen from a set of 46 environmental variables fromvarious sources (Appendix B). To generate a geometrically consis-tent data set, all environmental variables were set to the coordinate

176 D.L. Díaz-Gómez et al. / Ecological Indicators 26 (2013) 174–182
Table 1Illustrative example on how to calculate the Insecurity Index of cells (Iij) (Eq. (2)) and the Insecurity Index of species (Ii) (Eq. (3)) for two hypothetical species: species 1 (Sp1)and species 2 (Sp2) in an area of 10 cells. Species were simulated so that cells that are highly favorable for Sp1 are highly protected, and cells that are highly favorable forSp2 are less protected.
Cells 1 2 3 4 5 6 7 8 9 10
Pja 0 0 0 0.2 0.3 0.8 0.8 1 1 1
Fijb Sp1 0.1 0.1 0.2 0.3 0.1 0.3 0.5 0.6 0.9 1
Sp2 1 0.9 0.6 0.5 0.3 0.1 0.3 0.2 0.1 0.1Iij Sp1 1 0.9 0.6 0.4 0.21 0.02 0.06 0 0 0
Sp2 0.1 0.1 0.2 0.24 0.07 0.06 0.1 0 0 0Ii Sp1 0.21
Sp2 0.78
and 1.
soUer2lcr
tssrpomcmpRaevswtaTcvcFct
fitLrdt
2
2
t2(s
a Pj is the simulated protected area coverage of each cell as a fraction between 0
b Fij is the simulated values of favorability for the species in each cell.
ystem ED 1950 UTM zone 30. The variables with an original res-lution of 1 km × 1 km were resample to match the 1 km × 1 kmTM grids with a bilinear interpolation technique, clipped to thextent of Andalusia and aggregated by averaging, to match theesolution (10 km × 10 km) of the species data (Martí and Moral,003). Altitude, slope, aspect, south exposure, west exposure, and
and cover were derived using ArcGIS 9.3 following specific pro-edures in order to assure consistency of the final 10 km × 10 kmaster (Appendix B).
In order to reduce collinearity, different subsets of environmen-al variables were used for resident forest, resident cliff, residentteppe, migratory forest, migratory cliff and migratory steppepecies (Appendix B). Raptors were classified as “resident” if theyemain in Andalusia for the entire year or “migratory” if they areresent only during the breeding season (Appendix A). The choicef whether to include a variable or not for each group of raptors wasade using the following procedure: We calculated the Spearman
orrelation coefficient (Spearman, 1987) for all pairs of environ-ental variables and when the correlation coefficient between a
air of variables exceeded 0.8 (Jiménez-Valverde and Lobo, 2006;eal et al., 2008) only one variable was retained, based on thenticipated suitability of the variable for each group of species. Forxample, for “migratory” species we did not include winter relatedariables when these were correlated to variables of the spring orummer months, because these species are not present during theinter in the study area. For cliff nesting species, we prioritized
he selection of altitude over correlated variables such as meannnual number of frost days or precipitation of the driest month.his decision was made on the assumption that the availability ofliffs is directly related to altitude but indirectly related to climateariables. After selecting variables based on the correlation coeffi-ient, we performed collinearity tests (Mansfield and Helms, 1982).or variables with a Variance Inflation Factor (VIF) higher than 10,hoices were made about which variables to include or exclude onhe same basis as explained before.
A common problem in species distribution modeling is over-tting, which means producing a model that adjusts well to theraining data but does not predict well over new sites (Elith andeathwick, 2009). To avoid over-fitting, for species with very fewecords of presence or absence, we restricted the number of pre-ictor variables by not including land cover variables or “distanceo” variables.
.3. Methods
.3.1. Favorability modelingWe fitted generalized linear models (GLMs) of polynomial
erms for each species’ presence/absence data with the software R.11.1 (R Development Core Team, 2010) and the library BIOMODThuiller, 2003). A GLM predicts the probability of occurrence of apecies from a set of predictor variables. The output of a GLM is a
logistic probability that ranges from 0 to 1 (Wintle et al., 2005). Aforward stepwise procedure was applied using the Akaike’s Infor-mation Criterion (AIC) to select the final model for each species.The AIC is a measure of goodness of fit that describes the trade-off between prediction error and model complexity (Akaike, 1974;Elith and Leathwick, 2009). Since probability values obtained withGLMs are not comparable between species with different preva-lence (Jiménez-Valverde et al., 2009), we corrected the probabilityvalues with the favorability function (Eq. (1)). The favorability func-tion describes the deviation of the probability of occurrence of aspecies from what it would be expected by its prevalence, as a resultfavorability values higher than 0.5 are obtained where environmen-tal conditions favor the presence of the species (Acevedo and Real,2012). To summarize the results of the favorability modeling wemapped the Fuzzy Richness of cliff, forest and steppe nesting rap-tors. The fuzzy richness of a cell is the sum of the favorability valuesof all the species in the group (Estrada, 2008). It is normalized bydividing by the maximum value in the study area.
We used two evaluation measures: Area under the ReceivingOperating Characteristic Curve (AUC) (Metz 1978) and Cohen’sKappa (Cohen, 1960). Both AUC and Cohen’s Kappa are measuresof the discrimination capacity of models. For the threshold-independent evaluation of the models (AUC), we split the data into70% for calibration and 30% for validation. The split was repeated10 times and the average AUC is reported as Cross Validation AUC.The definitive probabilities of occurrence were obtained with thefull set of data, and we report an AUC score for the full run as well.In order to discriminate the source of error of the models we cal-culated the false positive rate and the false negative rate (Fieldingand Bell, 1997). Here a false negative is a cell for which the modelpredicts low favorability but where the species is actually presentand a false positive is a cell where the model predicts high favor-ability but where the species is not actually present. The Kappascore, false positive rate and false negative rate were calculatedfrom favorability values with a threshold of 0.5.
2.3.2. Measuring the Insecurity Index of speciesFuzzy logic acknowledges that there are objects that cannot be
clearly defined as belonging to one category or the other, but thathave a degree of membership to a category (Zadeh, 1965). Sincean area is not completely favorable or unfavorable for a species,fuzzy logic provides a good framework to work with favorabilityvalues. For a species, favorability can be viewed as a fuzzy set andthe favorability of each particular area can be considered the degreeof membership to that fuzzy set (Estrada et al., 2008).
Since the coverage of the protected areas in a region can be con-sidered a fuzzy set, an inclusion fuzzy equation (Aranda Almansa
et al., 2000) was used to formulate the Insecurity Index of each cellfor each species (Iij) (Eq. (2)) and the overall Insecurity Index (Ii) (Eq.(3)). The higher the favorability of a species in a cell and the lowerthe coverage of protected areas in the cell, the higher the value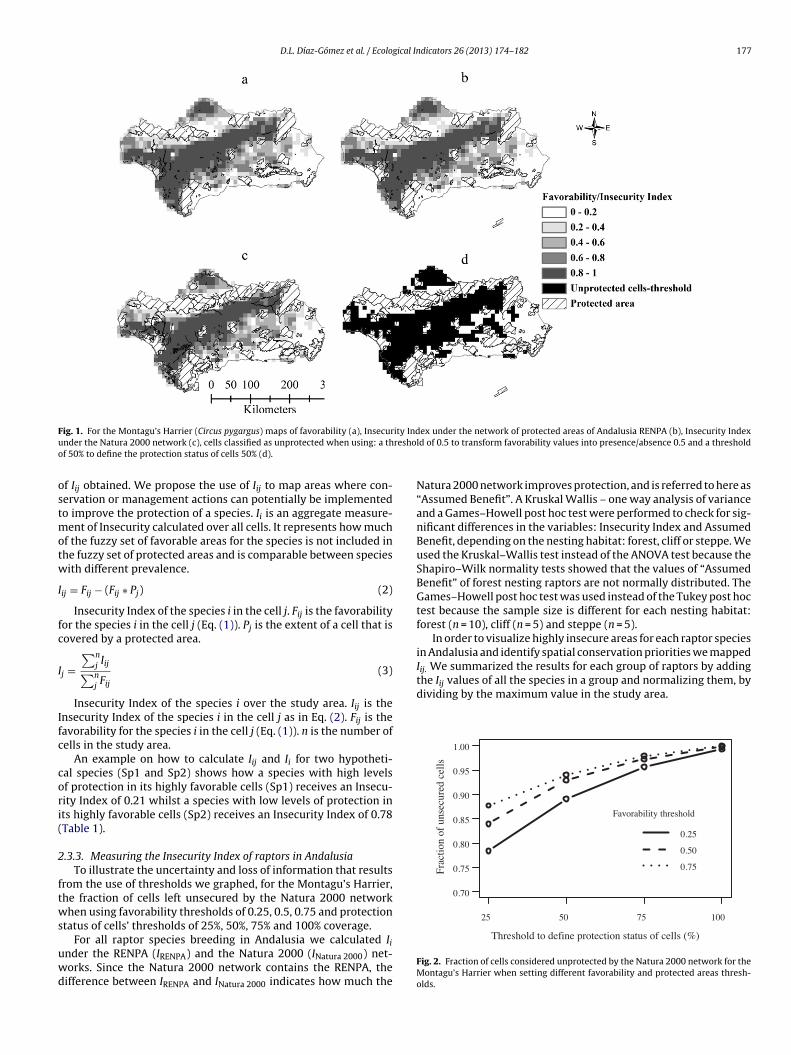
D.L. Díaz-Gómez et al. / Ecological Indicators 26 (2013) 174–182 177
F ity Indu reshoo
ostmotw
I
fc
I
Ifc
cori(
2
ftws
uwd
Iij. We summarized the results for each group of raptors by addingthe Iij values of all the species in a group and normalizing them, bydividing by the maximum value in the study area.
0.70
0.75
0.80
0.85
0.90
0.95
1.00
Frac
tion
of u
nsec
ured
cel
ls
25 50 75 100
Fav orability threshold
0.25
0.50
0.75
ig. 1. For the Montagu’s Harrier (Circus pygargus) maps of favorability (a), Insecurnder the Natura 2000 network (c), cells classified as unprotected when using: a thf 50% to define the protection status of cells 50% (d).
f Iij obtained. We propose the use of Iij to map areas where con-ervation or management actions can potentially be implementedo improve the protection of a species. Ii is an aggregate measure-
ent of Insecurity calculated over all cells. It represents how muchf the fuzzy set of favorable areas for the species is not included inhe fuzzy set of protected areas and is comparable between speciesith different prevalence.
ij = Fij − (Fij ∗ Pj) (2)
Insecurity Index of the species i in the cell j. Fij is the favorabilityor the species i in the cell j (Eq. (1)). Pj is the extent of a cell that isovered by a protected area.
j =∑n
j Iij∑n
j Fij
(3)
Insecurity Index of the species i over the study area. Iij is thensecurity Index of the species i in the cell j as in Eq. (2). Fij is theavorability for the species i in the cell j (Eq. (1)). n is the number ofells in the study area.
An example on how to calculate Iij and Ii for two hypotheti-al species (Sp1 and Sp2) shows how a species with high levelsf protection in its highly favorable cells (Sp1) receives an Insecu-ity Index of 0.21 whilst a species with low levels of protection ints highly favorable cells (Sp2) receives an Insecurity Index of 0.78Table 1).
.3.3. Measuring the Insecurity Index of raptors in AndalusiaTo illustrate the uncertainty and loss of information that results
rom the use of thresholds we graphed, for the Montagu’s Harrier,he fraction of cells left unsecured by the Natura 2000 networkhen using favorability thresholds of 0.25, 0.5, 0.75 and protection
tatus of cells’ thresholds of 25%, 50%, 75% and 100% coverage.
For all raptor species breeding in Andalusia we calculated Iinder the RENPA (IRENPA) and the Natura 2000 (INatura 2000) net-orks. Since the Natura 2000 network contains the RENPA, theifference between IRENPA and INatura 2000 indicates how much the
ex under the network of protected areas of Andalusia RENPA (b), Insecurity Indexld of 0.5 to transform favorability values into presence/absence 0.5 and a threshold
Natura 2000 network improves protection, and is referred to here as“Assumed Benefit”. A Kruskal Wallis – one way analysis of varianceand a Games–Howell post hoc test were performed to check for sig-nificant differences in the variables: Insecurity Index and AssumedBenefit, depending on the nesting habitat: forest, cliff or steppe. Weused the Kruskal–Wallis test instead of the ANOVA test because theShapiro–Wilk normality tests showed that the values of “AssumedBenefit” of forest nesting raptors are not normally distributed. TheGames–Howell post hoc test was used instead of the Tukey post hoctest because the sample size is different for each nesting habitat:forest (n = 10), cliff (n = 5) and steppe (n = 5).
In order to visualize highly insecure areas for each raptor speciesin Andalusia and identify spatial conservation priorities we mapped
Threshold to define protection status of cells (%)
Fig. 2. Fraction of cells considered unprotected by the Natura 2000 network for theMontagu’s Harrier when setting different favorability and protected areas thresh-olds.

178 D.L. Díaz-Gómez et al. / Ecological Indicators 26 (2013) 174–182
Fig. 3. Summary maps for cliff (a and b), forest (c and d) and steppe (e and f) nesting raptors. Maps of fuzzy richness of each nesting habitat group (a, c and e) and maps ofI rize thM
3
3
ar
nsecurity Index of richness (b, d and f). These maps were only produced to summaaps for each species can be found in the Supplementary Data (Appendix C).
. Results
.1. Favorability models of raptors in Andalusia
Areas of high favorability for cliff nesting raptors were predictedlong the Sierra Morena, the Subbaetic and the Ronda mountainanges. For forest nesting raptors areas of high favorability were
e results; the analysis of the results was made with the maps of individual species.
predicted along the Sierra Morena mountain range and the saltmarshes of the mouth of the Guadalquivir River. Areas of highfavorability were predicted for steppe nesting raptors along the
Guadalquivir valley, particularly in the western part of the provinceof Cadiz and in the lowlands of the province of Jaen (Fig. 3).The maps of favorability and Insecurity Index of the Mon-tagu’s Harrier (Circus pygargus) are shown as example of the maps
D.L. Díaz-Gómez et al. / Ecological Indicators 26 (2013) 174–182 179
Table 2Insecurity Index of raptors in Andalusia for two scenarios of protection: RENPA and Natura 2000.
Species Habitata IRENPAb INatura 2000
c Assumed Benefitd
Montagu’s Harrier (Circus pygargus) S 0.93 0.86 0.07Marsh Harrier (Circus aeruginosus) S 0.91 0.85 0.06Lesser Kestrel (Falco naumanni) S 0.89 0.81 0.08Black-winged Kite (Elanus caeruleus) S 0.86 0.76 0.10Common Kestrel (Falco tinnunculus) S 0.84 0.76 0.09Average for steppe nesting raptors 0.89 0.81 0.08
Eurasian Hobby (Falco subbuteo) F 0.83 0.72 0.11Black Kite (Milvus migrans) F 0.82 0.70 0.12Common Buzzard (Buteo buteo) F 0.76 0.65 0.12Red Kite (Milvus milvus) F 0.76 0.65 0.11Short-toed Eagle (Circaetus gallicus) F 0.76 0.64 0.12Booted Eagle (Hieraaetus pennatus) F 0.75 0.62 0.12Eurasian Sparrowhawk (Accipiter nisus) F 0.72 0.60 0.13Northern Goshawk (Accipiter gentilis) F 0.72 0.58 0.14Spanish Imperial Eagle (Aquila adalberti) F 0.73 0.53 0.21Cinereous Vulture (Aegypius monachus) F 0.69 0.50 0.19Average for forest nesting raptors 0.75 0.62 0.14
Peregrine Falcon (Falco peregrinus) C 0.77 0.65 0.12Bonelli’s Eagle (Aquila fasciatus) C 0.77 0.64 0.14Golden Eagle (Aquila chrysaetos) C 0.73 0.58 0.15Egyptian Vulture (Neophron percnopterus) C 0.70 0.56 0.14Griffon Vulture (Gyps fulvus) C 0.68 0.52 0.16Average for cliff nesting raptors 0.73 0.59 0.14Average for all raptors 0.78 0.66 0.12
a Nesting habitat: S (steppe), F (forest) and C (cliff).b Insecurity Index under the network of protected areas of Andalusia (RENPA).c Insecurity Index under the Natura 2000 network. Species are ordered from the most insecure to the most secure according to this index.d
pafp
EteKf(Dittwe
3I
t0stsaorchf(
Assumed Benefit = IRENPA − INatura 2000.
roduced for each raptor species breeding in Andalusia (Fig. 1a–cnd Appendix C). The Montagu’s Harrier presented high values ofavorability along the valley of the Guadalquivir River and in therovince of Cordoba north of the sierra Morena Mountains (Fig. 1a).
The models of the Black-winged Kite (Elanus caeruleus), theurasian Hobby (Falco subbuteo) and the Common Kestrel (Falcoinnunculus) presented the lowest average AUC scores (less orqual to 0.78) after the cross validation procedure (Appendix D).appa scores of less than 0.4 were found for the same species and
or the Cinereous Vulture (Aegypius monachus), Egyptian VultureNeophron percnopterus) and Red Kite (Milvus milvus) (Appendix). The False Negative Rate was higher than the False Positive Rate
n the model of the Common Kestrel (Appendix D). In contrast,he False Positive Rate was higher than the False Negative Rate forhe Cinereous and Egyptian Vultures and the Red Kite. The Black-inged Kite and the Eurasian Hobby presented a False Positive Rate
qual to the False Negative Rate (Appendix D).
.2. Montagu’s Harrier: threshold based results vs. Insecurityndex
When setting thresholds the fraction of cells left unsecured byhe Natura 2000 network for the Montagu’s Harrier varied between.78 and 1 depending on the threshold chosen (Fig. 2). For thispecies the higher the presence/absence threshold and the higherhe protected areas threshold, the higher the fraction of cells con-idered unsecured (Fig. 2). Under a favorability threshold of 0.50nd a protection status of cells’ threshold of 50%, a fraction of 0.93f the cells (405 cells) appeared unsecured for the Montagu’s Har-ier (Fig. 1d and Fig. 2). Out of the 405 cells 52% corresponded to
ells that received, under the fuzzy approach, an Insecurity Indexigher than 0.8. The Insecurity Index of the Montagu’s Harrier wasound to be 0.93 under RENPA and 0.86 under Natura 2000 networkTable 2).
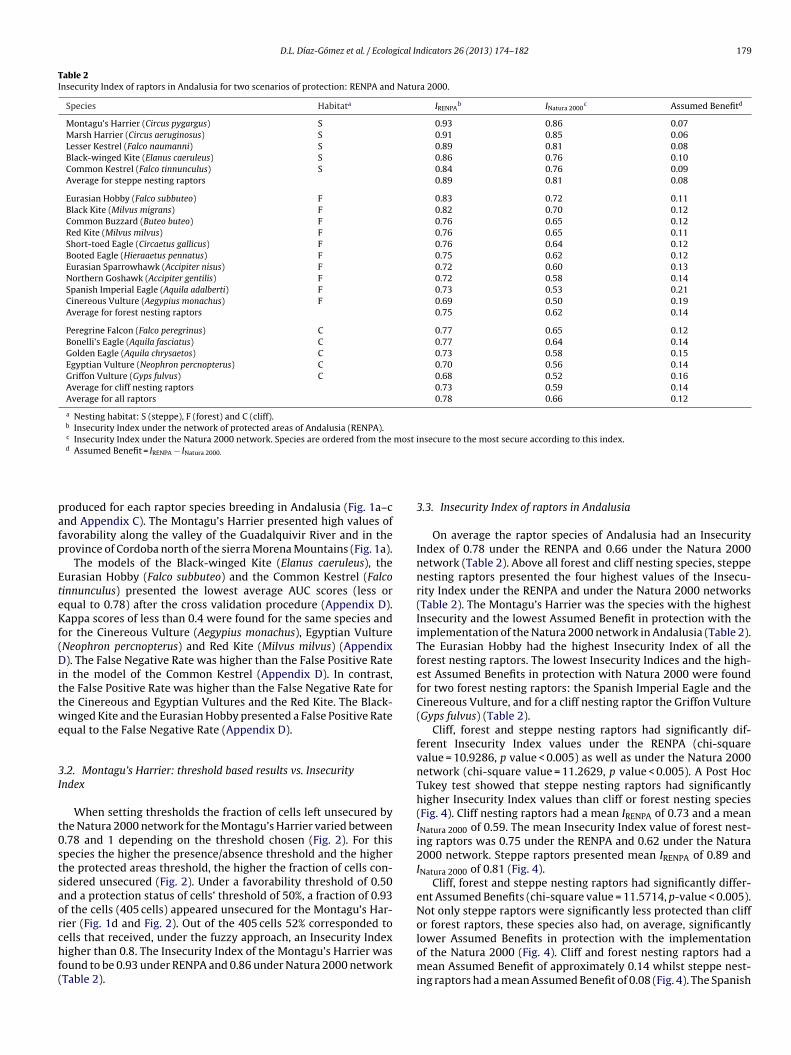
3.3. Insecurity Index of raptors in Andalusia
On average the raptor species of Andalusia had an InsecurityIndex of 0.78 under the RENPA and 0.66 under the Natura 2000network (Table 2). Above all forest and cliff nesting species, steppenesting raptors presented the four highest values of the Insecu-rity Index under the RENPA and under the Natura 2000 networks(Table 2). The Montagu’s Harrier was the species with the highestInsecurity and the lowest Assumed Benefit in protection with theimplementation of the Natura 2000 network in Andalusia (Table 2).The Eurasian Hobby had the highest Insecurity Index of all theforest nesting raptors. The lowest Insecurity Indices and the high-est Assumed Benefits in protection with Natura 2000 were foundfor two forest nesting raptors: the Spanish Imperial Eagle and theCinereous Vulture, and for a cliff nesting raptor the Griffon Vulture(Gyps fulvus) (Table 2).
Cliff, forest and steppe nesting raptors had significantly dif-ferent Insecurity Index values under the RENPA (chi-squarevalue = 10.9286, p value < 0.005) as well as under the Natura 2000network (chi-square value = 11.2629, p value < 0.005). A Post HocTukey test showed that steppe nesting raptors had significantlyhigher Insecurity Index values than cliff or forest nesting species(Fig. 4). Cliff nesting raptors had a mean IRENPA of 0.73 and a meanINatura 2000 of 0.59. The mean Insecurity Index value of forest nest-ing raptors was 0.75 under the RENPA and 0.62 under the Natura2000 network. Steppe raptors presented mean IRENPA of 0.89 andINatura 2000 of 0.81 (Fig. 4).
Cliff, forest and steppe nesting raptors had significantly differ-ent Assumed Benefits (chi-square value = 11.5714, p-value < 0.005).Not only steppe raptors were significantly less protected than cliffor forest raptors, these species also had, on average, significantly
lower Assumed Benefits in protection with the implementationof the Natura 2000 (Fig. 4). Cliff and forest nesting raptors had amean Assumed Benefit of approximately 0.14 whilst steppe nest-ing raptors had a mean Assumed Benefit of 0.08 (Fig. 4). The Spanish
180 D.L. Díaz-Gómez et al. / Ecological Indicators 26 (2013) 174–182
Fig. 4. Box plots comparing the values of Insecurity Index of groups of species with different nesting habitat. Insecurity Index under RENPA (a), Insecurity Index under Natura2000 (b) and Assumed Benefit (c). (X) and (Y) are groups according to Games–Howell post hoc tests for significant differences. The p values of the post hoc test are shown fore
Isat
tfhr0opa
4
wastotit
ach pair of nesting habitats.
mperial Eagle (Aquila adalberti) and the Cinereous Vulture were thepecies with the highest Assumed Benefits in protection with 0.21nd 0.19 respectively (Table 2), values that are outliers comparedo the median Assumed Benefit for forest raptors (Fig. 4).
The number and location of cells with an Insecurity Index higherhan 0.8 differed among the nesting habitat groups. For exampleor forest nesting raptors only two cells, located in Sierra Morena,ad an Insecurity Index higher than 0.8 whilst for steppe nestingaptors 50 cells presented an Insecurity Index higher or equal to.8 (Fig. 3). These 50 cells were found along the north western partf the province of Cadiz (South West of Andalusia) and in the Jaenrovince (Fig. 3). The areas of high insecurity of individual speciesre in Appendix C.
. Discussion
The Insecurity Index was calculated for raptors in Andalusia,ithout the need for harsh thresholds to transform values of prob-
bility of occurrence or to define the protection status of cells in thetudy area. It has been shown that the threshold chosen for settinghe protection status of cells affects the estimated representation
f species in protected areas (Araújo, 2004) and that the use of twohresholds (probability values and protection status of cells) mayncrease the uncertainty of the results (Alagador et al., 2011). Usinghe Montagu’s Harrier as an example, we showed that dependingon the thresholds set, the fraction of cells that are classified as inse-cure changes. These insecure cells belong to a discrete categorythat does not contain information on the priority of one cell overthe other. By using the Insecurity Index is possible to avoid theuncertainty that may result from the use of probability and pro-tection status thresholds, and is possible to recognize cells withdifferent levels of insecurity, thereby allowing its prioritization forthe implementation of conservation action.
The Insecurity Index proposed in this study allows comparisonbetween species with different prevalence, because it is derivedfrom favorability values, rather than probability values. The com-parison of the Insecurity Indices of different species of raptorsrevealed that, despite the large coverage of protected areas inAndalusia, steppe nesting raptors are significantly less protectedthan forest or cliff species. Previous studies have shown thatthe networks of protected areas of Spain do not cover the mostimportant areas for steppe birds (Traba et al., 2007) and havecalled for special attention to endangered steppe avifauna giventhe threats that Iberian steppes face: agricultural intensification,scrub encroachment caused by the abandonment of tradition-ally cultivated areas, transformation into industrial activities and
installation of wind turbines (Laiolo and Tella, 2006). Steppes areincluded in the Annex I of the European Union habitat directive andall steppe nesting raptors considered here, except for the CommonKestrel, are listed under the Annex I of the bird directive. Despite
gical In
ttf
IIopmItmtnsvnunpb
stntrohteaposcppi
oaIpAtfvavesdiAK(t
kloiIiK
D.L. Díaz-Gómez et al. / Ecolo
his fact, the Assumed Benefit derived from the Natura 2000 pro-ected areas is significantly lower for steppe nesting raptors thanor forest or cliff nesting species.
The Insecurity Index of a species should be carefully interpreted.t is not the unprotected percentage of the species’ distribution. Thensecurity Index of a species represents how much of the fuzzy setf favorable areas for the species is not included in the fuzzy set ofrotected areas. This implies that the actual distribution of a speciesay fall completely within the protected areas, and the Insecurity
ndex will still be different from zero because the index includeshe entire range of favorability values. The Insecurity Index is nor-
alized with the sum of the favorability values of the species overhe study area which allows comparisons between species witharrow and wide distributions. This means that rare and commonpecies may have a similar Insecurity Index even when they haveery different areas under protection, hence the index alone can-ot be used to distinguish between unprotected rare species andnprotected common species. In order to fully assess the effective-ess of networks of protected areas, their ability to sustain viableopulations and to protect vulnerable and rare species should alsoe considered.
The establishment of protected areas may not be a feasibleolution to improve the protection of steppe nesting raptors. Dis-ributed in human dominated landscapes, steppe raptors build theirests in cereal crops or in abandoned rural houses, and benefit fromhe existence of a traditional agricultural landscape rather from aeturn to its natural status. Nevertheless, the high Insecurity Indexf steppe raptors and the decline in traditional agricultural areasighlights the need for management action. Alternatives to pro-ected areas include an active management of cereal crops by, forxample, delaying the time of harvesting in order to assure thevailability of suitable nesting habitat. Equally important would bereventing the transformation of cereals into other crops such aslive plantations that, although more productive, may not provideuitable nesting habitat. Given that areas with high values of Inse-urity Index for steppe raptors were found along the north westernart of the province of Cadiz (South West of Andalusia) and on therovince of Jaen, we propose these areas as potential sites for the
mplementation of management actions (Fig. 3).Contrary to steppe nesting raptors, networks of protected areas
f Andalusia cover extensive areas of high favorability for forestnd cliff nesting raptors. This is reflected in significantly lowernsecurity Indices and in significantly higher Assumed Benefits inrotection with Natura 2000 compared to steppe nesting raptors. Inndalusia, protected areas are placed mostly in mountainous sys-
ems and wetlands, hence providing appropriate nesting habitator most forest and cliff nesting raptors. This is of high conser-ation importance given the vulnerability of many of the forestnd cliff nesting raptors. For example, protected areas exclude onlyery few cells of high favorability for the Spanish Imperial Eagle, anndemic of the Iberian Peninsula, narrowly distributed in Andalu-ia and regionally classified as Critically Endangered (Consejeríae Medio Ambiente, 2001). The Cinereous Vulture, a forest nest-
ng raptor, narrowly distributed and classified as Endangered inndalusia, is the species with the lowest Insecurity Index. The Redite and the Egyptian Vulture, classified as Critically Endangered
Consejería de Medio Ambiente, 2001), also benefit from the pro-ection in Andalusia of forest and cliff nesting habitats.
False positive and false negative errors, as evidenced by the lowappa values of some of the favorability models of the species, areikely to influence our results. False negatives are the main sourcef error in the favorability model of the Common Kestrel resulting
n its area of occurrence being underestimated and its Insecurityndex overestimated especially if the false negatives are containedn the protected areas. The low kappa scores of the Black-wingedite and the Eurasian Hobby are a result of both false negative anddicators 26 (2013) 174–182 181
false positive errors. These errors result from a high number of cellsfor which the predicted favorability is intermediate. The discrim-ination capacity of the models for these species is insufficient toaccurately assess the species’ Insecurity Index and to accuratelyidentify cells that are of conservation importance. For the Cinere-ous Vulture, the Red Kite and the Egyptian Vulture false positivesare the main source of error. The consequence is that conservationpriorities may be set in cells where the species is not really present(Loiselle et al., 2003), and the Insecurity Index may be overesti-mated if the false positive errors are located outside the protectedareas. Areas of high favorability, even if the species is not currentlypresent, are still of conservation importance because they could berecolonized by the species.
Beyond the results presented here for raptors in Andalusia, weconsider that the Insecurity Index has the potential to be extrap-olated to larger areas and to cover a wide range of species. Themain requirement for using the Insecurity Index is the availabil-ity of good quality datasets containing presences and absences ofspecies. Presence/absence datasets are available in many parts ofthe world. Particularly in Europe, it is possible to find atlas datafor many different groups of species, even at the continental scale(Gasc et al., 1997; Hagemeijer and Blair, 1997; Mitchell-Jones et al.,1999). Evaluating the Insecurity Index of species at a European levelmay allow the identification of species that have been neglected bynetworks of protected areas to a higher or lesser degree, and as aresult may become a useful tool for guiding decision making. Byidentifying areas with high values of Insecurity Index for species ofspecial concern it may be possible to guide actions aimed at the con-servation of the species, either by the declaration of new protectedareas or by the implementation of management strategies.
5. Conclusions
This study shows that it is possible to evaluate networks ofprotected areas by calculating the Insecurity Index of species with-out threshold transformations. Furthermore, the Insecurity Indexobtained at cell level aids in the identification of areas of conser-vation importance for future conservation efforts. In Andalusia, theanalysis of the Insecurity Index of raptor species revealed that net-works of protected areas in the region cover more effectively areasfavorable for forest and cliff nesting raptors than areas favorablefor Steppe nesting raptors. Therefore, areas of high insecurity forsteppe nesting raptors are proposed as priorities for the imple-mentation of management and conservation actions. Although itis exemplified here with raptors in Andalusia, the Insecurity Indexcan potentially be applied to a diverse set of areas and species andits results can aid policy makers in prioritizing species and areasfor conservation actions.
Appendices
A list of the species of raptors modeled (Appendix A), the envi-ronmental variables used for modeling (Appendix B), the evaluationresults of the models (Appendix C) and the maps of favorability andInsecurity Index of all the species are available online (Appendix D).
Acknowledgments
This research was funded by the European Union ErasmusMundus program and by the Spanish Ministry of Education andScience (project CGL2009 11316, BOS subprogram). Many thanks
to M. de la Heras for sharing his knowledge on raptors on the field.Important comments and suggestions were received from A. Niamirand E. Balugani during the research. We thanked two anonymousreviewers for suggestions that greatly improved this paper.
1 gical In
A
t
R
A
A
A
A
A
C
C
C
C
d
E
E
E
F
F
G
H
J
82 D.L. Díaz-Gómez et al. / Ecolo
ppendix A. Supplementary data
Supplementary data associated with this article can be found, inhe online version, at doi:10.1016/j.ecolind.2012.10.019.
eferences
cevedo, P., Real, R., 2012. Favourability: concept, distinctive characteristics andpotential usefulness. Naturwissenschaften 99, 515–522.
kaike, H., 1974. A new look at the statistical model identification. IEEE Trans.Automat. Contr. 19, 716–723.
lagador, D., Martins, M.J., Cerdeira, J.O., Cabeza, M., Araújo, M.B., 2011. Aprobability-based approach to match species with reserves when data are atdifferent resolutions. Biol. Cons. 144, 811–820.
randa Almansa, J., Fernandéz Marrón, J.L., Jiménez González, J., Morilla Gar-cía, F., 2000. Fundamento de lógica matemática. Editorial Sanzy Torres,Madrid.
raújo, M.B., 2004. Matching species with reserves—uncertainties from using dataat different resolutions. Biol. Conserv. 118, 533–538.
hape, S., Spalding, M., Jenkins, M. (Eds.), 2008. The World’s Protected Areas Status,Values and Prospects in the 21st Century. University of California Press, Berkeleyand Los Angeles.
ohen, J., 1960. A coefficient of agreement for nominal scales. Educ. Psychol. Meas.20, 37–46.
onsejería de Medio Ambiente, 2001. Libro Rojo de los Vertebrados Amenazados deAndalucía. Junta de Andalucía, Sevilla.
onsejería de Medio Ambiente, 2006. La RENPA en cifras. Junta de Andalucía,Sevilla. Available from: http://www.juntadeandalucia.es/medioambiente/site/web/menuitem.a5664a214f73c3df81d8899661525ea0/?vgnextoid=dc1a7af3b1b83110VgnVCM1000000624e50aRCRD&vgnextchannel=aceb30bcb062b110VgnVCM1000000624e50aRCRD&lr=lang es (accessedOctober 2010).
e Pous, P., Beukema, W., Weterings, M., Dümmer, I., Geniez, P., 2011. Area pri-oritization and performance evaluation of the conservation area network forthe Moroccan herpetofauna: a preliminary assessment. Biodivers. Conserv. 20,89–118.
lith, J., Leathwick, J.R., 2009. The contribution of species distribution modellingto conservation prioritization. In: Moilanen, A., Wilson, K.A., Possingham, H.P.(Eds.), Spatial Conservation Priritization: Quatitative Methods and Tools. OxfordUniversity Press, Oxford, UK.
strada, A., 2008. Evaluación de las redes de espacios naturales protegidosen Andalucía mediante el uso de modelos espaciales de distribución devertebrados. Animal Biology Department, University of Malaga, Malaga,p. 424.
strada, A., Real, R., Vargas, J.M., 2008. Using crisp and fuzzy modelling to identifyfavourability hotspots useful to perform gap analysis. Biodivers. Conserv. 17,857–871.
ielding, A.H., Bell, J.F., 1997. A review of methods for the assessment of predic-tion errors in conservation presence/absence models. Environ. Conserv. 24,38–49.
ont, 2000. Climatología de Espana y Portugal. Ediciones Universidad de Salamanca,Salamanca.
asc, J.P., Cabela, A., Crnobrnja-Isailovic, J., Dolmen, D., Grossenbacher, K., Haffner, P.,Lescure, J., Martens, H., Martínez Rica, J.P., Maurin, H., Oliveira, M.E., Sofianidou,T.S., Veith, M., Zuiderwijk, A. (Eds.), 1997. Atlas of Amphibians and Reptiles inEurope. Societas Europaea Herpetologica. Muséum National d’Histoire Naturelle
& Service du Patrimoine Naturel, Paris, 496 pp.agemeijer, E.J.M., Blair, M.J. (Eds.), 1997. The EBCC Atlas of European BreedingBirds: Their Distribution and Abundance. T & A.D. Poyser, London.
ennings, M.D., 2000. Gap analysis: concepts, methods, and recent results. LandscapeEcol. 15, 5–20.
dicators 26 (2013) 174–182
Jiménez-Valverde, A., Lobo, J.M., 2006. Distribution determinants of endangeredIberian spider macrothele calpeiana (Araneae, Hexathelidae). Environ. Entomol.35, 1491–1499.
Jiménez-Valverde, A., Lobo, J.M., 2007. Threshold criteria for conversion of probabil-ity of species presence to either-or presence-absence. Acta Oecol. 31, 361–369.
Jiménez-Valverde, a., Lobo, J.M., Hortal, J., 2009. The effect of prevalence and itsinteraction with sample size on the reliability of species distribution models.Community Ecol. 10, 196–205.
Junta de Andalucía, n.d. Descargas de información ambiental.Mitchell-Jones, A.J., Bogdanowicz, W., Krystufek, B., Reijnders, P.J.H., Spitzenberger,
F., Stubbe, C., Thissen, J.B.M., Vohralík, V., Zima, J., 1999. The Atlas of EuropeanMammals. T & AD Poyser, London.
Laiolo, P., Tella, J., 2006. Fate of unproductive and unattractive habitats: recentchanges in Iberian steppes and their effects on endangered avifauna. Environ.Conserv. 33, 223–232.
Loiselle, B.A., Howell, C.A., Graham, C.H., Goerck, J.M., Brooks, T., Smith, K.G., et al.,2003. Avoiding pitfalls of using species distribution models in conservationplanning. Conserv. Biol. 17, 1591–1600.
López-López, P., Maiorano, L., Falcucci, A., Emilio, B., Boitani, L., 2011. Hotspots ofspecies richness, threat and endemism for terrestrial vertebrates in SW Europe.Acta Oecol. 37, 399–412.
Mansfield, E.R., Helms, B.P., 1982. Detecting multicollinearity. Am. Stat. 36, 158–160.Martí, R., Moral, J.C. (Eds.), 2003. Atlas de las aves reproductoras de Espana. Dirección
General de Conservación de la Naturaleza-Sociedad Espanola de Ornitología,Madrid.
Martinez, I., Carreno, F., Escudero, a., Rubio, a., 2006. Are threatened lichen specieswell-protected in Spain? Effectiveness of a protected areas network. Biol. Con-serv. 133, 500–511.
Muriel, R., Ferrer, M., Casado, E., Pérez Calabuig, C., 2010. First succesful breeding ofreintroduced ospreys Pandion haliaetus in mainland Spain. Ardeola 57, 175–180.
R Development Core Team, 2010. R: A Language and Environment for StatisticalComputing. 2.11.1. R Foundation for Statistical Computing, Vienna, Availablefrom: http://www.r-project.org (accessed October 2010).
Real, R., Barbosa, A.M., Vargas, J.M., 2006a. Obtaining environmental favourabilityfunctions from logistic regression. Environ. Ecol. Stat. 13, 237–245.
Real, R., Estrada, A., Barbosa, A.M., Vargas, J.M., 2006b. Aplicación de la lógica difusaal concepto de rareza para su uso en Gap Analysis: El caso de los mamíferos ter-restres de Andalucía. Serie Geográfica—Biogeografía: Distribuciones. Dinámicasy Diversidad 13, 99–116.
Real, R., Márquez, A.L., Estrada, A., Munoz, a.R., Vargas, J.M., 2008. Modellingchorotypes of invasive vertebrates in mainland Spain. Divers. Distrib. 14,364–373.
Rodrigues, A.S.L, Andelman, S.J., Bakarr, M.I., Boitani, L., Brooks, T.M., Cowling, R.M.,et al., 2004. Effectiveness of the global protected area network in representingspecies diversity. Nature 428, 640–643.
Sanchez-Fernandez, D., Bilton, D., Abellan, P., Ribera, I., Velasco, J., Millan, a., 2008.Are the endemic water beetles of the Iberian Peninsula and the Balearic Islandseffectively protected? Biol. Conserv. 141, 1612–1627.
Spearman, C., 1987. The proof and measurement of association between two things.Am. J. Psychol. 100, 441–471.
Thuiller, W., 2003. BIOMOD—optimizing predictions of species distributions andprojecting potential future shifts under global change. Global Change Biol. 9,1353–1362.
Traba, J., García de la Morena, E., Morales, M., Suárez, F., 2007. Determining high valueareas for steppe birds in Spain: hot spots, complementarity and the efficiencyof protected areas. Biodivers. Conserv. 16, 3255–3275.
Watson, J.E.M., Evans, M.C., Carwardine, J., Fuller, R.A., Joseph, L.N., Segan, D.B., et al.,2011. The capacity of Australia’s protected-area system to represent threatened
species. Conserv. Biol. 25, 324–332.Wintle, B.A., Elith, J., Potts, J.M., 2005. Fauna habitat modelling and mapping: areview and case study in the Lower Hunter Central Coast region of NSW. Aust.Ecol. 30, 719–738.
Zadeh, L.A., 1965. Fuzzy sets. Inform. Contr. 8, 338–353.
Copyright © 2022 FDOKUMEN