Measuring the Access Dimension of Digital Literacy Using Simulation.IRI Conference.2014.ppt.pdf
25
Ágota Tongori Doctoral School of Educational Sciences University of Szeged Measuring the Access Dimension of Digital Literacy Using Simulation 2nd IRI International Educational Conference 17-21 October, 2014 Komárno 1
Transcript of Measuring the Access Dimension of Digital Literacy Using Simulation.IRI Conference.2014.ppt.pdf

Ágota TongoriDoctoral School of Educational SciencesUniversity of Szeged
Measuring the Access Dimension of Digital Literacy Using Simulation
2nd IRI International Educational Conference17-21 October, 2014Komárno
1
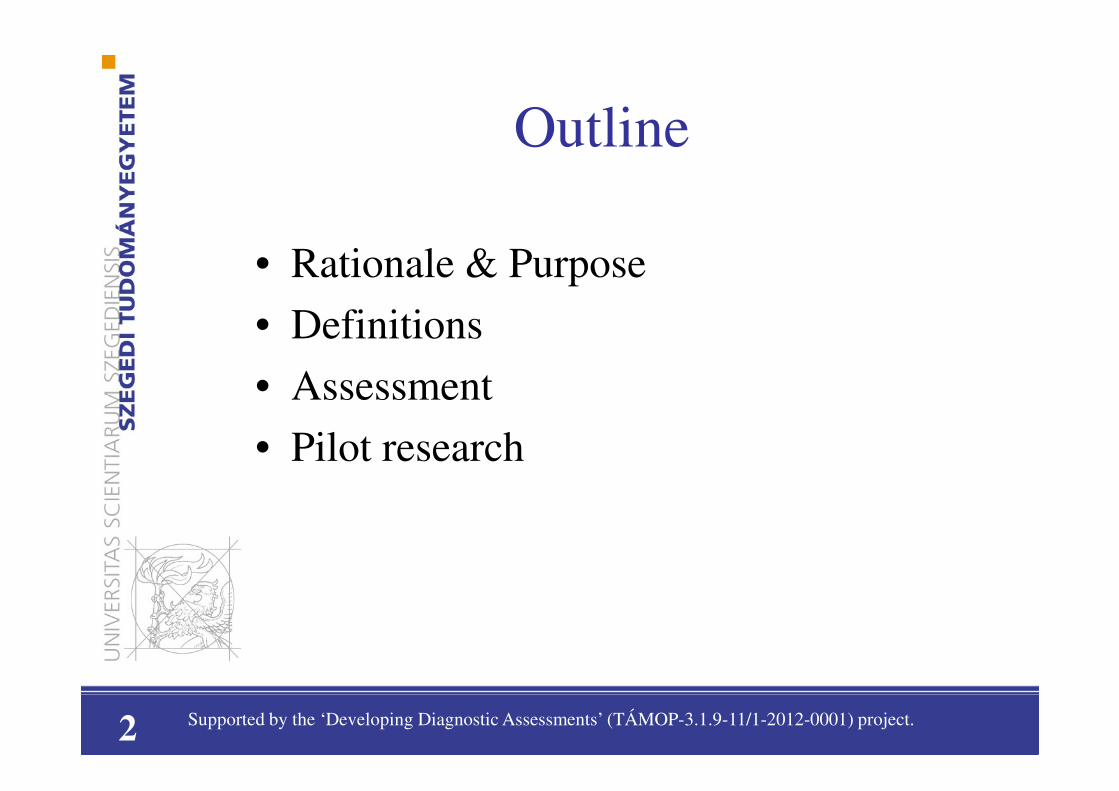
Outline
• Rationale & Purpose
• Definitions
• Assessment
• Pilot research
2 Supported by the ‘Developing Diagnostic Assessments’ (TÁMOP-3.1.9-11/1-2012-0001) project.

Rationale
� Ubiquitous utilization of digital technologies
� Advance in knowledge and information exchange exploiting them (Fraillon, Schulz and Ainley, 2013)
3

Purpose of Presentation
Introduce a pilot assessment (a new measurement instrument – Hungary):
To map the measure of confidence/ grade in accessing digital information
[access dimension (from define, access, manage, integrate, evaluating, create and communicate) of digital literacy]
4(ACARA, 2011; UNESCO, 2008; ETS ,2008; IEA, 2013; NAEP, n.d.; P21, 2008; Tongori, 2013)
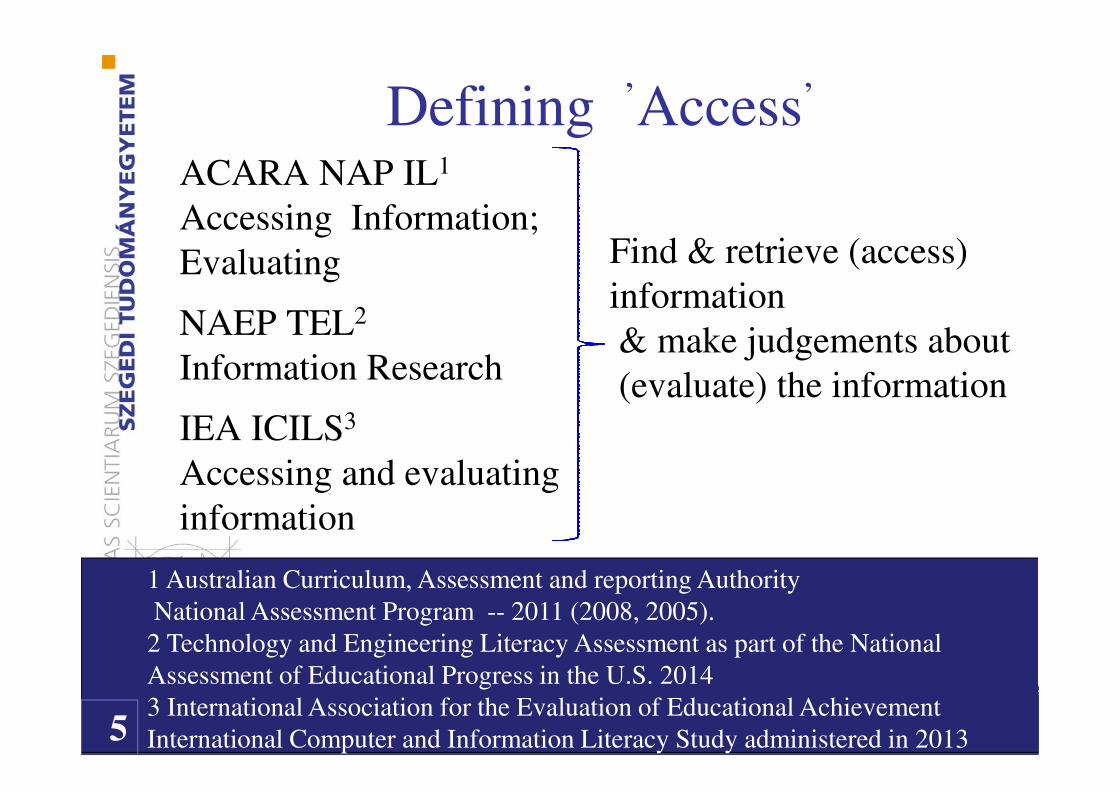
Defining ‚Access
‚
ACARA NAP IL1
Accessing Information;Evaluating
NAEP TEL2
Information Research
IEA ICILS3
Accessing and evaluatinginformation
5
Find & retrieve (access) information& make judgements about(evaluate) the information
1 Australian Curriculum, Assessment and reporting AuthorityNational Assessment Program -- 2011 (2008, 2005).
2 Technology and Engineering Literacy Assessment as part of the National Assessment of Educational Progress in the U.S. 20143 International Association for the Evaluation of Educational AchievementInternational Computer and Information Literacy Study administered in 2013

Defining ‚Simulation
‚
Imitation of the operation of authentic technology environments e.g. internet-like databases, websites in which students perform tasks to find specific information.
(Students’ actions logged)
6

7
Sample Age/Grade Time allotted
OECD PISA Feasibility (ACER/NIER/ETS)
n=34 Secondary school students aged 15
165 min.n=55n=29
ETS n=4048 College students
150 min.
ACARA/ MCEETYA n=5710 Grade 6 120 min.n=5313 Grade 10
CITE n=2622 Grades 5 & 8 135 min.READ n=395
Grades 9No data
n=100IEA ICILS n=3000 per
participating country
Grade 8 90 min
NAGB NAEP US student population; about 30 Ssper school
Grade 8 50 min
Comparison of the CBA ICT literacy performance assessment instruments regarding samples, grades and time

Aims & Research Questions• What relationship: successful task
completion/ time spent?
• How much time is spent on each item of Performance Test by grades & genders?
• How do different grade or gender students’ achievements differ from each other in the access dimension of ICT literacy?
9

Hypotheses• H1: a relationship is expected between
successful task completion and the time spent completing it across all grades and genders.
• H2: An advantage of the higher graders over the lower graders is expected in terms of speed.
• H3: The access dimension of students’ ICT literacy is expected to be measured invariant across gender but not across grades.
10

Methods
• May to June, 2014
• Four different state schools in a major city in Hungary.
Data loss: 17 grade 10 students
1♂≈♀ in all grades
Grade 5 Grade 8 Grade 10 ∑
n=57 n=40 n=9 N=1061
11

Materials & Design
1 (Molnár and Csapó, 2013)
Performance Test Questionnaire
Linear + scenario based Linear
Tasks 1-10 Tasks 11-14
Simple multiple choice
complex
imitated online surfaces
simulated website search
Total score: 20
45 min 45 min
Delivered: eDia1 online platform
12

Levels of ’Access’ tasks
• Imitated online surface (multiple choice, typing a search term)– No further action
– Further Action (follow-up task)
• Searching a simulated website for information– Simple (finding a piece of information)
– More complex (using and choosing from the information found)
13

1014
Click on the button which would print the map found to give it to your elderly woman neighbour who was looking for a jewellery in the neighbourhood. Then click on the Next button.

The student government would like to put an ad ofthe school gala in the local paper. Look at thehome page of the online version of the local paper,click on the right menu to learn what to do, thenclick on the Next button.
15

Clicking on the Ads menu, you were directed to thispage. Find the information you need, and thenchoose the right answer(s) by clicking in the rightcheck box(es). Then click on the Next button.
16

You want to present your brother on his graduation from highschool with something special. He is in for extreme sports. Searchthe following website to check if there is some kind of birdmantraining and how much it costs. Then click on Next and give youranswers.
17

You have just searched the website for information. Give your answers by clicking on the radio button next to the right answer.
18

In the last school ski camp you decided to convince your parents to goskiing with you. It is December 10th now. You want to find a skiinstructor in Hungary in order to build your parents’ confidence duringthe winter holiday. Search the following website for the lowest priceskiing instruction per hour for 2 people. Also, find the ski course with thecheapest 3-hour pass for adults. Then click on the Next button.
19

Give your answers by clicking on the radio button next to the right answer. Then click on the Next button.
20

Results
21
Descriptive statistics
• Questionnaire (Cronbach α= .91);
• Performance Test [comparatively low number of (14) administered tasks; limited sample size] (Cronbach α= .68).
• Further development: number & elaboration of tasks & items;
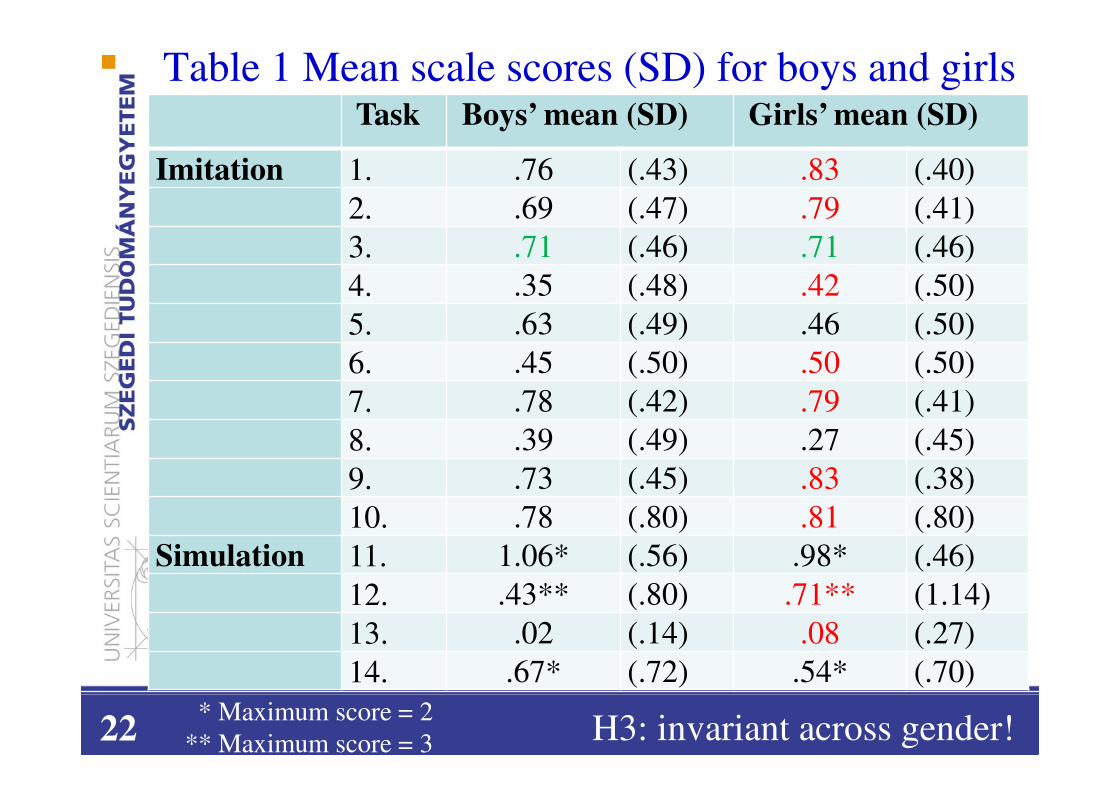
Table 1 Mean scale scores (SD) for boys and girls Task Boys’ mean (SD) Girls’ mean (SD)
Imitation 1. .76 (.43) .83 (.40)2. .69 (.47) .79 (.41)3. .71 (.46) .71 (.46)4. .35 (.48) .42 (.50)5. .63 (.49) .46 (.50)6. .45 (.50) .50 (.50)7. .78 (.42) .79 (.41)8. .39 (.49) .27 (.45)9. .73 (.45) .83 (.38)10. .78 (.80) .81 (.80)
Simulation 11. 1.06* (.56) .98* (.46)12. .43** (.80) .71** (1.14)13. .02 (.14) .08 (.27)14. .67* (.72) .54* (.70)
* Maximum score = 2 ** Maximum score = 3 H3: invariant across gender!22
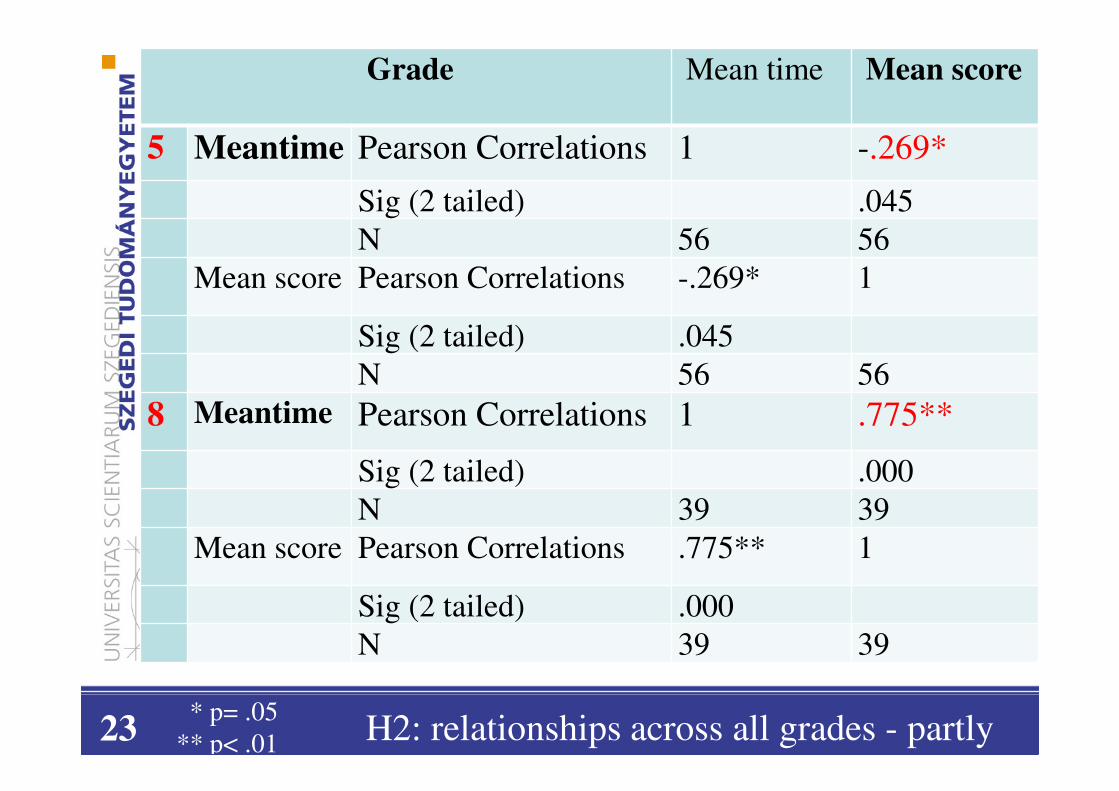
Grade Mean time Mean score
5 Meantime Pearson Correlations 1 -.269*
Sig (2 tailed) .045N 56 56
Mean score Pearson Correlations -.269* 1
Sig (2 tailed) .045N 56 56
8 Meantime Pearson Correlations 1 .775**
Sig (2 tailed) .000N 39 39
Mean score Pearson Correlations .775** 1
Sig (2 tailed) .000N 39 39
* p= .05 ** p< .01 H2: relationships across all grades - partly23

Table 3 Multiple Comparisons of successful task completion of tasks 1-10 (imitated online surfaces)
(I) Grade
(J) Grade
Mean Difference
(I-J)
SD 95% Confidence Interval
Lower Bound
Upper Bound
DunnettT3
*p= .03
5 8 .90 .57 -.52 2.32
10 -1.66 .74 -3.79 .47
8 5 -.90 .57 -2.32 .52
10 -2.56* .86 -4.84 -.28
10 5 1.66 .74 -.47 3.79
8 2.56* .86 .28 4.84one-way ANOVA analysis: differences btw. rates of successful task 1-10 completion across grades24

Conclusions
• Limitations on interpretation of results -- to be imposed owing to sampling and reliability measures.► Further development of the test in terms of the number of items + elaborating existent ones to improve test consistency
• Comparison of Performance Test & Questionnaire results
25

Thank you for your attention.
Supported by the ‘Developing Diagnostic Assessments’ (TÁMOP-3.1.9-11/1-2012-0001) project.
26