Measurement of the t(t)over-bar production cross section in p(p)over-barcollisions at root s=1.96...
23
Physics Physics Research Publications Purdue University Year Measurement of the t(t)over bar production cross section in p(p)over bar collisions at root s=1.96 TeV using lepton plus jets events with semileptonic B decays to muons D. Acosta, J. Adelman, T. Affolder, T. Akimoto, M. G. Albrow, D. Ambrose, S. Amerio, D. Amidei, A. Anastassov, K. Anikeev, A. Annovi, J. Antos, M. Aoki, G. Apollinari, T. Arisawa, J. F. Arguin, A. Artikov, W. Ashmanskas, A. Attal, F. Azfar, P. Azzi-Bacchetta, N. Bacchetta, H. Bachacou, W. Badgett, A. Barbaro-Galtieri, G. J. Barker, V. E. Barnes, B. A. Barnett, S. Baroiant, G. Bauer, F. Bedeschi, S. Behari, S. Belforte, G. Bellettini, J. Bellinger, A. Bel- loni, E. Ben-Haim, D. Benjamin, A. Beretvas, T. Berry, A. Bhatti, M. Binkley, D. Bisello, M. Bishai, R. E. Blair, C. Blocker, K. Bloom, B. Blumenfeld, A. Bocci, A. Bodek, G. Bolla, A. Bolshov, D. Bortoletto, J. Boudreau, S. Bourov, B. Brau, C. Bromberg, E. Brubaker, J. Budagov, H. S. Budd, K. Burkett, G. Busetto, P. Bussey, K. L. Byrum, S. Cabrera, M. Campanelli, M. Campbell, F. Canelli, A. Canepa, M. Casarsa, D. Carlsmith, R. Carosi, S. Carron, M. Cavalli-Sforza, A. Castro, P. Catastini, D. Cauz, A. Cerri, L. Cerrito, J. Chap- man, Y. C. Chen, M. Chertok, G. Chiarelli, G. Chlachidze, F. Chlebana, I. Cho, K. Cho, D. Chokheli, J. P. Chou, S. Chuang, K. Chung, W. H. Chung, Y. S. Chung, M. Cijliak, C. I. Ciobanu, M. A. Ciocci, A. G. Clark, D. Clark, M. Coca, A. Connolly, M. Convery, J. Conway, B. Cooper, K. Copic, M. Cordelli, G. Cortiana, J. Cranshaw, J. Cuevas, A. Cruz, R. Culbertson, C. Currat, D. Cyr, D. Dagenhart, S. Da Ronco, S. D’Auria, P. de Barbaro, S. De Cecco, A. Deisher, G. De Lentdecker, M. Dell’Orso, S. Demers, L. Demortier, M. Deninno, D. De Pedis, P. F. Derwent, C. Dionisi, J. R. Dittmann, P. DiTuro, C. Dorr, A. Dominguez, S. Donati, M. Donega, J. Donini, M. D’Onofrio, T. Dorigo, K. Ebina, J. Efron, J. Ehlers, R. Erbacher, M. Erdmann, D. Errede, S. Errede, R. Eusebi, H. C. Fang, S. Farrington, I. Fedorko, W. T. Fedorko, R. G. Feild, M. Feindt, J. P. Fernandez, R. D. Field, G. Flanagan, L. R. Flores-Castillo, A.
-
Upload
independent -
Category
Documents
-
view
0 -
download
0
Transcript of Measurement of the t(t)over-bar production cross section in p(p)over-barcollisions at root s=1.96...

Physics
Physics Research Publications
Purdue University Year
Measurement of the t(t)over bar
production cross section in p(p)over bar
collisions at root s=1.96 TeV using
lepton plus jets events with semileptonic
B decays to muonsD. Acosta, J. Adelman, T. Affolder, T. Akimoto, M. G. Albrow, D. Ambrose,S. Amerio, D. Amidei, A. Anastassov, K. Anikeev, A. Annovi, J. Antos, M.Aoki, G. Apollinari, T. Arisawa, J. F. Arguin, A. Artikov, W. Ashmanskas, A.Attal, F. Azfar, P. Azzi-Bacchetta, N. Bacchetta, H. Bachacou, W. Badgett, A.Barbaro-Galtieri, G. J. Barker, V. E. Barnes, B. A. Barnett, S. Baroiant, G.Bauer, F. Bedeschi, S. Behari, S. Belforte, G. Bellettini, J. Bellinger, A. Bel-loni, E. Ben-Haim, D. Benjamin, A. Beretvas, T. Berry, A. Bhatti, M. Binkley,D. Bisello, M. Bishai, R. E. Blair, C. Blocker, K. Bloom, B. Blumenfeld, A.Bocci, A. Bodek, G. Bolla, A. Bolshov, D. Bortoletto, J. Boudreau, S. Bourov,B. Brau, C. Bromberg, E. Brubaker, J. Budagov, H. S. Budd, K. Burkett, G.Busetto, P. Bussey, K. L. Byrum, S. Cabrera, M. Campanelli, M. Campbell,F. Canelli, A. Canepa, M. Casarsa, D. Carlsmith, R. Carosi, S. Carron, M.Cavalli-Sforza, A. Castro, P. Catastini, D. Cauz, A. Cerri, L. Cerrito, J. Chap-man, Y. C. Chen, M. Chertok, G. Chiarelli, G. Chlachidze, F. Chlebana, I.Cho, K. Cho, D. Chokheli, J. P. Chou, S. Chuang, K. Chung, W. H. Chung, Y.S. Chung, M. Cijliak, C. I. Ciobanu, M. A. Ciocci, A. G. Clark, D. Clark, M.Coca, A. Connolly, M. Convery, J. Conway, B. Cooper, K. Copic, M. Cordelli,G. Cortiana, J. Cranshaw, J. Cuevas, A. Cruz, R. Culbertson, C. Currat, D.Cyr, D. Dagenhart, S. Da Ronco, S. D’Auria, P. de Barbaro, S. De Cecco, A.Deisher, G. De Lentdecker, M. Dell’Orso, S. Demers, L. Demortier, M. Deninno,D. De Pedis, P. F. Derwent, C. Dionisi, J. R. Dittmann, P. DiTuro, C. Dorr,A. Dominguez, S. Donati, M. Donega, J. Donini, M. D’Onofrio, T. Dorigo, K.Ebina, J. Efron, J. Ehlers, R. Erbacher, M. Erdmann, D. Errede, S. Errede,R. Eusebi, H. C. Fang, S. Farrington, I. Fedorko, W. T. Fedorko, R. G. Feild,M. Feindt, J. P. Fernandez, R. D. Field, G. Flanagan, L. R. Flores-Castillo, A.

Foland, S. Forrester, G. W. Foster, M. Franklin, J. C. Freeman, Y. Fujii, I. Furic,A. Gajjar, M. Gallinaro, J. Galyardt, M. Garcia-Sciveres, A. F. Garfinkel, C.Gay, H. Gerberich, D. W. Gerdes, E. Gerchtein, S. Giagu, P. Giannetti, A. Gib-son, K. Gibson, C. Ginsburg, K. Giolo, M. Giordani, M. Giunta, G. Giurgiu, V.Glagolev, D. Glenzinski, M. Gold, N. Goldschmidt, D. Goldstein, J. Goldstein,G. Gomez, G. Gomez-Ceballos, M. Goncharov, O. Gonzalez, I. Gorelov, A. T.Goshaw, Y. Gotra, K. Goulianos, A. Gresele, M. Griffiths, C. Grosso-Pilcher,U. Grundler, J. Guimaraes da Costa, C. Haber, K. Hahn, S. R. Hahn, E. Halki-adakis, A. Hamilton, B. Y. Han, R. Handler, F. Happacher, K. Hara, M. Hare,R. F. Harr, R. M. Harris, F. Hartmann, K. Hatakeyama, J. Hauser, C. Hays,H. Hayward, B. Heinemann, J. Heinrich, M. Hennecke, M. Herndon, C. Hill, D.Hirschbuehl, A. Hocker, K. D. Hoffman, A. Holloway, S. Hou, M. A. Houlden,B. T. Huffman, Y. Huang, R. E. Hughes, J. Huston, K. Ikado, J. Incandela,G. Introzzi, M. Iori, Y. Ishizawa, C. Issever, A. Ivanov, Y. Iwata, B. Iyutin, E.James, D. Jang, B. Jayatilaka, D. Jeans, H. Jensen, E. J. Jeon, M. Jones, K. K.Joo, S. Y. Jun, T. Junk, T. Kamon, J. Kang, M. Karagoz Unel, P. E. Karchin,Y. Kato, Y. Kemp, R. Kephart, U. Kerzel, V. Khotilovich, B. Kilminster, D. H.Kim, H. S. Kim, J. E. Kim, M. J. Kim, M. S. Kim, S. B. Kim, S. H. Kim, Y. K.Kim, M. Kirby, L. Kirsch, S. Klimenko, M. Klute, B. Knuteson, B. R. Ko, H.Kobayashi, D. J. Kong, K. Kondo, J. Konigsberg, K. Kordas, A. Korn, A. Ko-rytov, A. V. Kotwal, A. Kovalev, J. Kraus, I. Kravchenko, A. Kreymer, J. Kroll,M. Kruse, V. Krutelyov, S. E. Kuhlmann, S. Kwang, A. T. Laasanen, S. Lai,S. Lami, S. Lammel, M. Lancaster, R. Lander, K. Lannon, A. Lath, G. Latino,I. Lazzizzera, C. Lecci, T. LeCompte, J. Lee, J. Lee, S. W. Lee, R. Lefevre, N.Leonardo, S. Leone, S. Levy, J. D. Lewis, K. Li, C. Lin, C. S. Lin, M. Lindgren,E. Lipeles, T. M. Liss, A. Lister, D. O. Litvintsev, T. Liu, Y. Liu, N. S. Lockyer,A. Loginov, M. Loreti, P. Loverre, R. S. Lu, D. Lucchesi, P. Lujan, P. Lukens,G. Lungu, L. Lyons, J. Lys, R. Lysak, E. Lytken, D. MacQueen, R. Madrak, K.Maeshima, P. Maksimovic, G. Manca, R. Marginean, C. Marino, A. Martin, M.Martin, V. Martin, M. Martinez, T. Maruyama, H. Matsunaga, M. Mattson,P. Mazzanti, K. S. McFarland, D. McGivern, P. M. McIntyre, P. McNamara,A. Mehta, S. Menzemer, A. Menzione, P. Merkel, C. Mesropian, A. Messina,T. Miao, N. Miladinovic, J. Miles, L. Miller, R. Miller, J. S. Miller, C. Mills,R. Miquel, S. Miscetti, G. Mitselmakher, A. Miyamoto, N. Moggi, B. Mohr, R.Moore, M. Morello, P. A. M. Fernandez, J. Muelmenstaedt, A. Mukherjee, M.Mulhearn, T. Muller, R. Mumford, A. Munar, P. Murat, J. Nachtman, S. Nahn,I. Nakano, A. Napier, R. Napora, D. Naumov, V. Necula, T. Nelson, C. Neu, M.S. Neubauer, J. Nielsen, T. Nigmanov, L. Nodulman, O. Norniella, T. Ogawa, S.H. Oh, Y. D. Oh, T. Ohsugi, T. Okusawa, R. Oldeman, R. Orava, W. Orejudos,K. Osterberg, C. Pagliarone, E. Palencia, R. Paoletti, V. Papadimitriou, A. A.Paramonov, S. Pashapour, J. Patrick, G. Pauletta, M. Paulini, C. Paus, D. Pel-lett, A. Penzo, T. J. Phillips, G. Piacentino, J. Piedra, K. T. Pitts, C. Plager,L. Pondrom, G. Pope, X. Portell, O. Poukhov, N. Pounder, F. Prakoshyn, A.Pronko, J. Proudfoot, F. Ptohos, G. Punzi, J. Rademacker, M. A. Rahaman, A.Rakitine, S. Rappoccio, F. Ratnikov, H. Ray, B. Reisert, V. Rekovic, P. Renton,M. Rescigno, F. Rimondi, K. Rinnert, L. Ristori, W. J. Robertson, A. Robson,
T. Rodrigo, S. Rolli, R. Roser, R. Rossin, C. Rott, J. Russ, V. Rusu, A. Ruiz,D. Ryan, H. Saarikko, S. Sabik, A. Safonov, R. St Denis, W. K. Sakumoto, G.Salamanna, D. Saltzberg, C. Sanchez, L. Santi, S. Sarkar, K. Sato, P. Savard,A. Savoy-Navarro, P. Schlabach, E. E. Schmidt, M. P. Schmidt, M. Schmitt, T.Schwarz, L. Scodellaro, A. L. Scott, A. Scribano, F. Scuri, A. Sedov, S. Seidel,Y. Seiya, A. Semenov, F. Semeria, L. Sexton-Kennedy, I. Sfiligoi, M. D. Shapiro,T. Shears, P. F. Shepard, D. Sherman, M. Shimojima, M. Shochet, Y. Shon,I. Shreyber, A. Sidoti, A. Sill, P. Sinervo, A. Sisakyan, J. Sjolin, A. Skiba, A.J. Slaughter, K. Sliwa, D. Smirnov, J. R. Smith, F. D. Snider, R. Snihur, M.Soderberg, A. Soha, S. V. Somalwar, J. Spalding, M. Spezziga, F. Spinella, P.Squillacioti, H. Stadie, M. Stanitzki, B. Stelzer, O. Stelzer-Chilton, D. Stentz,J. Strologas, D. Stuart, J. S. Suh, A. Sukhanov, K. Sumorok, H. Sun, T. Suzuki,A. Taffard, R. Tafirout, H. Takano, R. Takashima, Y. Takeuchi, K. Takikawa,M. Tanaka, R. Tanaka, N. Tanimoto, M. Tecchio, P. K. Teng, K. Terashi, R.J. Tesarek, S. Tether, J. Thom, A. S. Thompson, E. Thomson, P. Tipton, V.Tiwari, S. Tkaczyk, D. Toback, K. Tollefson, T. Tomura, D. Tonelli, M. Tonnes-mann, S. Torre, D. Torretta, S. Tourneur, W. Trischuk, R. Tsuchiya, S. Tsuno,D. Tsybychev, N. Turini, F. Ukegawa, T. Unverhau, S. Uozumi, D. Usynin, L.Vacavant, A. Vaiciulis, A. Varganov, S. Vejcik, G. Velev, V. Veszpremi, G. Ver-amendi, T. Vickey, R. Vidal, I. Vila, R. Vilar, I. Vollrath, I. Volobouev, M. vonder Mey, P. Wagner, R. G. Wagner, R. L. Wagner, W. Wagner, R. Wallny, T.Walter, Z. Wan, M. J. Wang, S. M. Wang, A. Warburton, B. Ward, S. Waschke,D. Waters, T. Watts, M. Weber, W. C. Wester, B. Whitehouse, D. Whiteson, A.B. Wicklund, E. Wicklund, H. H. Williams, P. Wilson, B. L. Winer, P. Wittich,S. Wolbers, C. Wolfe, M. Wolter, M. Worcester, S. Worm, T. Wright, X. Wu, F.Wurthwein, A. Wyatt, A. Yagil, T. Yamashita, K. Yamamoto, J. Yamaoka, C.Yang, U. K. Yang, W. Yao, G. P. Yeh, J. Yoh, K. Yorita, T. Yoshida, I. Yu, S.Yu, J. C. Yun, L. Zanello, A. Zanetti, I. Zaw, F. Zetti, J. Zhou, and S. Zucchelli
This paper is posted at Purdue e-Pubs.
http://docs.lib.purdue.edu/physics articles/50

Measurement of the t �t production cross section in p �p collisions at���s
p� 1:96 TeV using lepton
plus jets events with semileptonic B decays to muons
D. Acosta,16 J. Adelman,12 T. Affolder,9 T. Akimoto,54 M. G. Albrow,15 D. Ambrose,15 S. Amerio,42 D. Amidei,33
A. Anastassov,50 K. Anikeev,15 A. Annovi,44 J. Antos,1 M. Aoki,54 G. Apollinari,15 T. Arisawa,56 J.-F. Arguin,32
A. Artikov,13 W. Ashmanskas,15 A. Attal,7 F. Azfar,41 P. Azzi-Bacchetta,42 N. Bacchetta,42 H. Bachacou,28 W. Badgett,15
A. Barbaro-Galtieri,28 G. J. Barker,25 V. E. Barnes,46 B. A. Barnett,24 S. Baroiant,6 G. Bauer,31 F. Bedeschi,44 S. Behari,24
S. Belforte,53 G. Bellettini,44 J. Bellinger,58 A. Belloni,31 E. Ben-Haim,15 D. Benjamin,14 A. Beretvas,15 T. Berry,29
A. Bhatti,48 M. Binkley,15 D. Bisello,42 M. Bishai,15 R. E. Blair,2 C. Blocker,5 K. Bloom,33 B. Blumenfeld,24 A. Bocci,48
A. Bodek,47 G. Bolla,46 A. Bolshov,31 D. Bortoletto,46 J. Boudreau,45 S. Bourov,15 B. Brau,9 C. Bromberg,34 E. Brubaker,12
J. Budagov,13 H. S. Budd,47 K. Burkett,15 G. Busetto,42 P. Bussey,19 K. L. Byrum,2 S. Cabrera,14 M. Campanelli,18
M. Campbell,33 F. Canelli,7 A. Canepa,46 M. Casarsa,53 D. Carlsmith,58 R. Carosi,44 S. Carron,14 M. Cavalli-Sforza,3
A. Castro,4 P. Catastini,44 D. Cauz,53 A. Cerri,28 L. Cerrito,41 J. Chapman,33 Y. C. Chen,1 M. Chertok,6 G. Chiarelli,44
G. Chlachidze,13 F. Chlebana,15 I. Cho,27 K. Cho,27 D. Chokheli,13 J. P. Chou,20 S. Chuang,58 K. Chung,11 W.-H. Chung,58
Y. S. Chung,47 M. Cijliak,44 C. I. Ciobanu,23 M. A. Ciocci,44 A. G. Clark,18 D. Clark,5 M. Coca,14 A. Connolly,28
M. Convery,48 J. Conway,6 B. Cooper,30 K. Copic,33 M. Cordelli,17 G. Cortiana,42 J. Cranshaw,52 J. Cuevas,10 A. Cruz,16
R. Culbertson,15 C. Currat,28 D. Cyr,58 D. Dagenhart,5 S. Da Ronco,42 S. D’Auria,19 P. de Barbaro,47 S. De Cecco,49
A. Deisher,28 G. De Lentdecker,47 M. Dell’Orso,44 S. Demers,47 L. Demortier,48 M. Deninno,4 D. De Pedis,49
P. F. Derwent,15 C. Dionisi,49 J. R. Dittmann,15 P. DiTuro,50 C. Dorr,25 A. Dominguez,28 S. Donati,44 M. Donega,18
J. Donini,42 M. D’Onofrio,18 T. Dorigo,42 K. Ebina,56 J. Efron,38 J. Ehlers,18 R. Erbacher,6 M. Erdmann,25 D. Errede,23
S. Errede,23 R. Eusebi,47 H.-C. Fang,28 S. Farrington,29 I. Fedorko,44 W. T. Fedorko,12 R. G. Feild,59 M. Feindt,25
J. P. Fernandez,46 R. D. Field,16 G. Flanagan,34 L. R. Flores-Castillo,45 A. Foland,20 S. Forrester,6 G. W. Foster,15
M. Franklin,20 J. C. Freeman,28 Y. Fujii,26 I. Furic,12 A. Gajjar,29 M. Gallinaro,48 J. Galyardt,11 M. Garcia-Sciveres,28
A. F. Garfinkel,46 C. Gay,59 H. Gerberich,14 D. W. Gerdes,33 E. Gerchtein,11 S. Giagu,49 P. Giannetti,44 A. Gibson,28
K. Gibson,11 C. Ginsburg,15 K. Giolo,46 M. Giordani,53 M. Giunta,44 G. Giurgiu,11 V. Glagolev,13 D. Glenzinski,15
M. Gold,36 N. Goldschmidt,33 D. Goldstein,7 J. Goldstein,41 G. Gomez,10 G. Gomez-Ceballos,10 M. Goncharov,51
O. Gonzalez,46 I. Gorelov,36 A. T. Goshaw,14 Y. Gotra,45 K. Goulianos,48 A. Gresele,42 M. Griffiths,29 C. Grosso-Pilcher,12
U. Grundler,23 J. Guimaraes da Costa,20 C. Haber,28 K. Hahn,43 S. R. Hahn,15 E. Halkiadakis,47 A. Hamilton,32
B.-Y. Han,47 R. Handler,58 F. Happacher,17 K. Hara,54 M. Hare,55 R. F. Harr,57 R. M. Harris,15 F. Hartmann,25
K. Hatakeyama,48 J. Hauser,7 C. Hays,14 H. Hayward,29 B. Heinemann,29 J. Heinrich,43 M. Hennecke,25 M. Herndon,24
C. Hill,9 D. Hirschbuehl,25 A. Hocker,15 K. D. Hoffman,12 A. Holloway,20 S. Hou,1 M. A. Houlden,29 B. T. Huffman,41
Y. Huang,14 R. E. Hughes,38 J. Huston,34 K. Ikado,56 J. Incandela,9 G. Introzzi,44 M. Iori,49 Y. Ishizawa,54 C. Issever,9
A. Ivanov,6 Y. Iwata,22 B. Iyutin,31 E. James,15 D. Jang,50 B. Jayatilaka,33 D. Jeans,49 H. Jensen,15 E. J. Jeon,27 M. Jones,46
K. K. Joo,27 S. Y. Jun,11 T. Junk,23 T. Kamon,51 J. Kang,33 M. Karagoz Unel,37 P. E. Karchin,57 Y. Kato,40 Y. Kemp,25
R. Kephart,15 U. Kerzel,25 V. Khotilovich,51 B. Kilminster,38 D. H. Kim,27 H. S. Kim,23 J. E. Kim,27 M. J. Kim,11
M. S. Kim,27 S. B. Kim,27 S. H. Kim,54 Y. K. Kim,12 M. Kirby,14 L. Kirsch,5 S. Klimenko,16 M. Klute,31 B. Knuteson,31
B. R. Ko,14 H. Kobayashi,54 D. J. Kong,27 K. Kondo,56 J. Konigsberg,16 K. Kordas,32 A. Korn,31 A. Korytov,16
A. V. Kotwal,14 A. Kovalev,43 J. Kraus,23 I. Kravchenko,31 A. Kreymer,15 J. Kroll,43 M. Kruse,14 V. Krutelyov,51
S. E. Kuhlmann,2 S. Kwang,12 A. T. Laasanen,46 S. Lai,32 S. Lami,44 S. Lammel,15 M. Lancaster,30 R. Lander,6
K. Lannon,38 A. Lath,50 G. Latino,44 I. Lazzizzera,42 C. Lecci,25 T. LeCompte,2 J. Lee,27 J. Lee,47 S. W. Lee,51 R. Lefevre,3
N. Leonardo,31 S. Leone,44 S. Levy,12 J. D. Lewis,15 K. Li,59 C. Lin,59 C. S. Lin,15 M. Lindgren,15 E. Lipeles,8 T. M. Liss,23
A. Lister,18 D. O. Litvintsev,15 T. Liu,15 Y. Liu,18 N. S. Lockyer,43 A. Loginov,35 M. Loreti,42 P. Loverre,49 R.-S. Lu,1
D. Lucchesi,42 P. Lujan,28 P. Lukens,15 G. Lungu,16 L. Lyons,41 J. Lys,28 R. Lysak,1 E. Lytken,46 D. MacQueen,32
R. Madrak,15 K. Maeshima,15 P. Maksimovic,24 G. Manca,29 Margaroli,4 R. Marginean,15 C. Marino,23 A. Martin,59
M. Martin,24 V. Martin,37 M. Martınez,3 T. Maruyama,54 H. Matsunaga,54 M. Mattson,57 P. Mazzanti,4 K. S. McFarland,47
D. McGivern,30 P. M. McIntyre,51 P. McNamara,50 McNulty,29 A. Mehta,29 S. Menzemer,31 A. Menzione,44 P. Merkel,46
C. Mesropian,48 A. Messina,49 T. Miao,15 N. Miladinovic,5 J. Miles,31 L. Miller,20 R. Miller,34 J. S. Miller,33 C. Mills,9
R. Miquel,28 S. Miscetti,17 G. Mitselmakher,16 A. Miyamoto,26 N. Moggi,4 B. Mohr,7 R. Moore,15 M. Morello,44
P. A. Movilla Fernandez,28 J. Muelmenstaedt,28 A. Mukherjee,15 M. Mulhearn,31 T. Muller,25 R. Mumford,24 A. Munar,43
P. Murat,15 J. Nachtman,15 S. Nahn,59 I. Nakano,39 A. Napier,55 R. Napora,24 D. Naumov,36 V. Necula,16 T. Nelson,15
C. Neu,43 M. S. Neubauer,8 J. Nielsen,28 T. Nigmanov,45 L. Nodulman,2 O. Norniella,3 T. Ogawa,56 S. H. Oh,14 Y. D. Oh,27
PHYSICAL REVIEW D 72, 032002 (2005)
1550-7998=2005=72(3)=032002(20)$23.00 032002-1 2005 The American Physical Society

T. Ohsugi,22 T. Okusawa,40 R. Oldeman,29 R. Orava,21 W. Orejudos,28 K. Osterberg,21 C. Pagliarone,44 E. Palencia,10
R. Paoletti,44 V. Papadimitriou,15 A. A. Paramonov,12 S. Pashapour,32 J. Patrick,15 G. Pauletta,53 M. Paulini,11 C. Paus,31
D. Pellett,6 A. Penzo,53 T. J. Phillips,14 G. Piacentino,44 J. Piedra,10 K. T. Pitts,23 C. Plager,7 L. Pondrom,58 G. Pope,45
X. Portell,3 O. Poukhov,13 N. Pounder,41 F. Prakoshyn,13 A. Pronko,16 J. Proudfoot,2 F. Ptohos,17 G. Punzi,44
J. Rademacker,41 M. A. Rahaman,45 A. Rakitine,31 S. Rappoccio,20 F. Ratnikov,50 H. Ray,33 B. Reisert,15 V. Rekovic,36
P. Renton,41 M. Rescigno,49 F. Rimondi,4 K. Rinnert,25 L. Ristori,44 W. J. Robertson,14 A. Robson,19 T. Rodrigo,10
S. Rolli,55 R. Roser,15 R. Rossin,16 C. Rott,46 J. Russ,11 V. Rusu,12 A. Ruiz,10 D. Ryan,55 H. Saarikko,21 S. Sabik,32
A. Safonov,6 R. St. Denis,19 W. K. Sakumoto,47 G. Salamanna,49 D. Saltzberg,7 C. Sanchez,3 L. Santi,53 S. Sarkar,49
K. Sato,54 P. Savard,32 A. Savoy-Navarro,15 P. Schlabach,15 E. E. Schmidt,15 M. P. Schmidt,59 M. Schmitt,37 T. Schwarz,33
L. Scodellaro,10 A. L. Scott,9 A. Scribano,44 F. Scuri,44 A. Sedov,46 S. Seidel,36 Y. Seiya,40 A. Semenov,13 F. Semeria,4
L. Sexton-Kennedy,15 I. Sfiligoi,17 M. D. Shapiro,28 T. Shears,29 P. F. Shepard,45 D. Sherman,20 M. Shimojima,54
M. Shochet,12 Y. Shon,58 I. Shreyber,35 A. Sidoti,44 A. Sill,52 P. Sinervo,32 A. Sisakyan,13 J. Sjolin,41 A. Skiba,25
A. J. Slaughter,15 K. Sliwa,55 D. Smirnov,36 J. R. Smith,6 F. D. Snider,15 R. Snihur,32 M. Soderberg,33 A. Soha,6
S. V. Somalwar,50 J. Spalding,15 M. Spezziga,52 F. Spinella,44 P. Squillacioti,44 H. Stadie,25 M. Stanitzki,59 B. Stelzer,32
O. Stelzer-Chilton,32 D. Stentz,37 J. Strologas,36 D. Stuart,9 J. S. Suh,27 A. Sukhanov,16 K. Sumorok,31 H. Sun,55
T. Suzuki,54 A. Taffard,23 R. Tafirout,32 H. Takano,54 R. Takashima,39 Y. Takeuchi,54 K. Takikawa,54 M. Tanaka,2
R. Tanaka,39 N. Tanimoto,39 M. Tecchio,33 P. K. Teng,1 K. Terashi,48 R. J. Tesarek,15 S. Tether,31 J. Thom,15
A. S. Thompson,19 E. Thomson,43 P. Tipton,47 V. Tiwari,11 S. Tkaczyk,15 D. Toback,51 K. Tollefson,34 T. Tomura,54
D. Tonelli,44 M. Tonnesmann,34 S. Torre,44 D. Torretta,15 S. Tourneur,15 W. Trischuk,32 R. Tsuchiya,56 S. Tsuno,39
D. Tsybychev,16 N. Turini,44 F. Ukegawa,54 T. Unverhau,19 S. Uozumi,54 D. Usynin,43 L. Vacavant,28 A. Vaiciulis,47
A. Varganov,33 S. Vejcik III,15 G. Velev,15 V. Veszpremi,46 G. Veramendi,23 T. Vickey,23 R. Vidal,15 I. Vila,10 R. Vilar,10
I. Vollrath,32 I. Volobouev,28 M. von der Mey,7 P. Wagner,51 R. G. Wagner,2 R. L. Wagner,15 W. Wagner,25 R. Wallny,7
T. Walter,25 Z. Wan,50 M. J. Wang,1 S. M. Wang,16 A. Warburton,32 B. Ward,19 S. Waschke,19 D. Waters,30 T. Watts,50
M. Weber,28 W. C. Wester III,15 B. Whitehouse,55 D. Whiteson,43 A. B. Wicklund,2 E. Wicklund,15 H. H. Williams,43
P. Wilson,15 B. L. Winer,38 P. Wittich,43 S. Wolbers,15 C. Wolfe,12 M. Wolter,55 M. Worcester,7 S. Worm,50 T. Wright,33
X. Wu,18 F. Wurthwein,8 A. Wyatt,30 A. Yagil,15 T. Yamashita,39 K. Yamamoto,40 J. Yamaoka,50 C. Yang,59 U. K. Yang,12
W. Yao,28 G. P. Yeh,15 J. Yoh,15 K. Yorita,56 T. Yoshida,40 I. Yu,27 S. Yu,43 J. C. Yun,15 L. Zanello,49 A. Zanetti,53 I. Zaw,20
F. Zetti,44 J. Zhou,50 and S. Zucchelli4
(CDF Collaboration)
1Institute of Physics, Academia Sinica, Taipei, Taiwan 11529, Republic of China2Argonne National Laboratory, Argonne, Illinois 60439, USA
3Institut de Fisica d’Altes Energies, Universitat Autonoma de Barcelona, E-08193, Bellaterra (Barcelona), Spain4Istituto Nazionale di Fisica Nucleare, University of Bologna, I-40127 Bologna, Italy
5Brandeis University, Waltham, Massachusetts 02254, USA6University of California at Davis, Davis, California 95616, USA
7University of California at Los Angeles, Los Angeles, California 90024, USA8University of California at San Diego, La Jolla, California 92093, USA
9University of California at Santa Barbara, Santa Barbara, California 93106, USA10Instituto de Fisica de Cantabria, CSIC-University of Cantabria, 39005 Santander, Spain
11Carnegie Mellon University, Pittsburgh, Pennsylvania 15213, USA12Enrico Fermi Institute, University of Chicago, Chicago, Illinois 60637, USA
13Joint Institute for Nuclear Research, RU-141980 Dubna, Russia14Duke University, Durham, North Carolina 27708
15Fermi National Accelerator Laboratory, Batavia, Illinois 60510, USA16University of Florida, Gainesville, Florida 32611, USA
17Laboratori Nazionali di Frascati, Istituto Nazionale di Fisica Nucleare, I-00044 Frascati, Italy18University of Geneva, CH-1211 Geneva 4, Switzerland
19Glasgow University, Glasgow G12 8QQ, United Kingdom20Harvard University, Cambridge, Massachusetts 02138, USA
21Division of High Energy Physics, Department of Physics, University of Helsinki and Helsinki Institute of Physics, FIN-00044,Helsinki, Finland
D. ACOSTA et al. PHYSICAL REVIEW D 72, 032002 (2005)
032002-2

22Hiroshima University, Higashi-Hiroshima 724, Japan23University of Illinois, Urbana, Illinois 61801, USA
24The Johns Hopkins University, Baltimore, Maryland 21218, USA25Institut fur Experimentelle Kernphysik, Universitat Karlsruhe, 76128 Karlsruhe, Germany
26High Energy Accelerator Research Organization (KEK), Tsukuba, Ibaraki 305, Japan27Center for High Energy Physics, Kyungpook National University, Taegu 702-701 Korea;
Seoul National University, Seoul 151-742 Korea;and SungKyunKwan University, Suwon 440-746 Korea
28Ernest Orlando Lawrence Berkeley National Laboratory, Berkeley, California 94720, USA29University of Liverpool, Liverpool L69 7ZE, United Kingdom
30University College London, London WC1E 6BT, United Kingdom31Massachusetts Institute of Technology, Cambridge, Massachusetts 02139, USA32Institute of Particle Physics: McGill University, Montreal, Canada H3A 2T8;
and University of Toronto, Toronto, Canada M5S 1A733University of Michigan, Ann Arbor, Michigan 48109, USA
34Michigan State University, East Lansing, Michigan 48824, USA35Institution for Theoretical and Experimental Physics, ITEP, Moscow 117259, Russia
36University of New Mexico, Albuquerque, New Mexico 87131, USA37Northwestern University, Evanston, Illinois 60208, USA38The Ohio State University, Columbus, Ohio 43210, USA
39Okayama University, Okayama 700-8530, Japan40Osaka City University, Osaka 588, Japan
41University of Oxford, Oxford OX1 3RH, United Kingdom42Istituto Nazionale di Fisica Nucleare, Sezione di Padova-Trento, University of Padova, I-35131 Padova, Italy
43University of Pennsylvania, Philadelphia, Pennsylvania 19104, USA44Istituto Nazionale di Fisica Nucleare Pisa, Universities of Pisa, Siena
and Scuola Normale Superiore, I-56127 Pisa, Italy45University of Pittsburgh, Pittsburgh, Pennsylvania 15260, USA
46Purdue University, West Lafayette, Indiana 47907, USA47University of Rochester, Rochester, New York 14627, USA
48The Rockefeller University, New York, New York 10021, USA49Istituto Nazionale di Fisica Nucleare, Sezione di Roma 1, University di Roma ‘‘La Sapienza’’, I-00185 Roma, Italy
50Rutgers University, Piscataway, New Jersey 08855, USA51Texas A&M University, College Station, Texas 77843, USA
52Texas Tech University, Lubbock, Texas 79409, USA53Istituto Nazionale di Fisica Nucleare, University of Trieste/Udine, Italy
54University of Tsukuba, Tsukuba, Ibaraki 305, Japan55Tufts University, Medford, Massachusetts 02155, USA
56Waseda University, Tokyo 169, Japan57Wayne State University, Detroit, Michigan 48201, USA
58University of Wisconsin, Madison, Wisconsin 53706, USA59Yale University, New Haven, Connecticut 06520, USA
(Received 1 June 2005; published 9 August 2005)
We present a measurement of the t�t production cross section using 194 pb�1 of CDF II data usingevents with a high transverse momentum electron or muon, three or more jets, and missing transverseenergy. The measurement assumes 100% t! Wb branching fraction. Events consistent with t�t decay arefound by identifying jets containing heavy-flavor semileptonic decays to muons. The dominant back-grounds are evaluated directly from the data. Based on 20 candidate events and an expected background of9:5� 1:1 events, we measure a production cross section of 5:3� 3:3�1:3
�1:0 pb, in agreement with thestandard model.
DOI: 10.1103/PhysRevD.72.032002 PACS numbers: 13.85.Ni, 13.85.Qk, 14.65.Ha
I. INTRODUCTION
Top quark pair production in the standard model pro-ceeds via either quark-antiquark annihilation or gluon-gluon fusion. At the Fermilab Tevatron collider, with acenter-of-mass energy of 1.96 TeV , quark-antiquark anni-hilation is expected to dominate. For a top mass of
175 GeV=c2, the calculated cross section is 6:7�0:7�0:9 pb
[1], and is approximately 0.2 pb smaller for each1 GeV=c2 increase in the value of the top mass over therange 170 GeV=c2 <Mtop < 190 GeV=c2.
Measurements of the cross section for top quark pairproduction provide a test of QCD, as well as the standard
MEASUREMENT OF THE t�t PRODUCTION CROSS . . . PHYSICAL REVIEW D 72, 032002 (2005)
032002-3

model decay t! Wb. Nonstandard model productionmechanisms, such as the production and decay of a heavyresonance into t�t pairs [2], could enhance the measuredcross section. Nonstandard model top quark decays, suchas the decay into supersymmetric particles [3], could sup-press the measured value, for which a t! Wb branchingfraction of nearly 100% is assumed.
In this paper we report a measurement of the t�t produc-tion cross section in p �p collisions at
���s
p� 1:96 TeV with
the CDF II detector at the Fermilab Tevatron. The standardmodel decay t! Wb of the top quark results in a final statefrom t�t production of two W bosons and two bottomquarks. We select events consistent with a decay of oneof the W bosons to an electron or muon plus a neutrino,both of which have large momentum transverse to thebeam direction (PT). We refer to these high PT electronsor muons as the ‘‘primary lepton.’’ The neutrino is unde-tected and results in an imbalance in transverse momen-tum. The imbalance is labeled ‘‘missing ET’’ (E6 T) since itis reconstructed based on the flow of energy in the calo-rimeter [4]. The otherW boson in the event decays to a pairof quarks. The two quarks from the W boson and the two bquarks from the top decays hadronize and are observed asjets of charged and neutral particles. This mode is referredas W plus jets. We take advantage of the semileptonicdecay of b hadrons to muons to identify final-state jetsthat result from hadronization of the bottom quarks. Such atechnique, called ‘‘soft-lepton tagging’’ (SLT), is effectivein reducing the background to the t�t signal from W bosonproduced in association with several hadronic jets withlarge transverse momentum. The production cross sectionis measured in events with three or more jets and at leastone SLT tagged jet.
This measurement is complementary to other measure-ments from CDF II, which use secondary vertex tagging,kinematic fitting, or a combination of the two [5–7]. Aforthcoming paper [8] will present a combined cross sec-tion measurement based on the result of these fouranalyses.
Previous measurements [9] from run I at the Tevatronhave measured production cross sections statistically con-sistent with the standard model prediction. This and otherrun II measurements are made at a slightly higher center-of-mass energy (1.96 TeV vs 1.8 TeV) and with nearlytwice as much integrated luminosity.
The organization of this paper is as follows: Section IIreviews the detector systems relevant to this analysis. Thetrigger and event selection, the data and the Monte Carlosamples and the SLT tagging algorithm are described inSec. III. The estimate of the background is presented inSec. IV. The acceptance and the t�t event tagging efficiencyare described in Sec. V. The evaluation of the systematicuncertainties on the measurement is presented in Sec. VI.The t�t production cross section measurement and the con-clusions are presented in Secs. VII and VIII.
II. THE CDF II DETECTOR
The CDF II detector is described in detail in [10], onlythe components relevant to this measurement are summa-rized here. The CDF II detector is a nearly azimuthally andforward-backward symmetric detector designed to studyp �p interactions at the Fermilab Tevatron. It consists of amagnetic spectrometer surrounded by calorimeters andmuon chambers. An elevation view of the CDF II detectoris shown in Fig. 1.
Charged particles are tracked inside a 1.4 T solenoidalmagnetic field by an 8-layer silicon strip detector coveringradii from 1.5 to 28 cm, followed by the central outertracker (COT), an open-cell drift chamber that providesup to 96 measurements of charged-particle position overthe radial region from 40 to 137 cm. The 96 COT mea-surements are arranged in 8 ‘‘superlayers’’ of 12 sensewires each alternating between axial and 2� stereo. TheCOT and the silicon detectors track charged particles forj�j< 1 and j�j< 2, respectively.
Surrounding the tracking system are electromagneticand hadronic calorimeters, used to measure charged andneutral particle energies. The electromagnetic calorimeteris a lead-scintillator sandwich and the hadronic calorimeteris an iron-scintillator sandwich. Both calorimeters are seg-mented in azimuth and polar angle to provide directionalinformation for the energy deposition. The segmentationvaries with position on the detector and is 15� in azimuthby 0.1 units of � in the central region (j�j< 1:1).Segmentation in the plug region (1:1< j�j< 3:6) is 7:5�
up to j�j< 2:1, and 15� for j�j> 2:1 in azimuth, whileranging from 0.1 to 0.64 units of � in pseudorapidity (anearly constant 2:7� change in polar angle). The electro-magnetic calorimeters are instrumented with proportionaland scintillating strip detectors that measure the transverseprofile of electromagnetic showers at a depth correspond-ing to the shower maximum.
Outside the central calorimeter are four layers of muondrift chambers covering j�j< 0:6 (CMU). The calorimeterprovides approximately 1 m of steel shielding. Behind anadditional 60 cm of steel in the central region sit an addi-tional four layers of muon drift chambers (CMP) arrangedin a box-shaped layout around the central detector. Centralmuon extension (CMX) chambers, which are arrayed in aconical geometry, provide muon detection for the region0:6< j�j< 1 with four to eight layers of drift chambers,depending on polar angle. All the muon chambers measurethe coordinates of hits in the drift direction, x, via adrift time measurement and a calibrated drift velocity.The CMU and the CMX also measure the longitudinalcoordinate, z. The longitudinal coordinate is measured inthe CMU by comparing the height of pulses, encodedin time-over-threshold, at opposite ends of the sensewire. In the CMX, the conical geometry provides asmall stereo angle from which the z coordinate of tracksegments can be determined. Reconstructed track
D. ACOSTA et al. PHYSICAL REVIEW D 72, 032002 (2005)
032002-4

segments have a minimum of three hits, and a maximumof four hits in the CMU and the CMP, and 8 hits in theCMX.
III. DATA SAMPLE AND EVENT SELECTION
In this section we describe the collision data and theMonte Carlo samples used in this analysis. Section III Aoutlines the trigger system used for the initial selection ofevents from the p �p collisions. Section III B describes theMonte Carlo samples used for acceptance and backgroundstudies. The selection of the W � jets data sets from thetriggered data samples is presented in Sec. III C. The t�tsignal is extracted from the W � jets events through theidentification of candidate b hadron semileptonic decays tomuons. The algorithm for identifying these decays is sum-marized in Sec. III D, and its application to the W � jetsdata set is described in Sec. III E.
This analysis is based on an integrated luminosity of194� 11 pb�1 [11] collected with the CDF II detectorbetween March 2002 and August 2003 (175 pb�1 withthe CMX detector operational).
A. p �p collision data
CDF II employs a three-level trigger system, the firsttwo consisting of special purpose hardware and the thirdconsisting of a farm of commodity computers. Triggers forthis analysis are based on selecting high transverse mo-mentum electrons and muons. The electron sample istriggered as follows: At the first trigger level events areselected by requiring a track with PT > 8 GeV=c matchedto an electromagnetic calorimeter tower with ET > 8 GeVand little energy in the hadronic calorimeter behind it. Atthe second trigger level, calorimeter energy clusters areassembled and the track found at the first level is matchedto an electromagnetic cluster with ET > 16 GeV. At thethird level, offline reconstruction is performed and anelectron candidate with ET > 18 GeV is required. Theefficiency of the electron trigger is measured from Z!ee data and found to be 96:2� 0:6�% [12]. The selectionof the muon sample begins at the first trigger level with atrack with PT > 4 GeV=c matched to hits in the CMU andthe CMP chambers or a track with PT > 8 GeV=cmatchedto hits in the CMX chambers. At the second level, a trackwith PT > 8 GeV=c is required in the event for about 70%of the integrated luminosity, while for the remainder, trig-
FIG. 1. Elevation view of the CDF II detector.
MEASUREMENT OF THE t�t PRODUCTION CROSS . . . PHYSICAL REVIEW D 72, 032002 (2005)
032002-5

gers at the first level are fed directly to the third level. Atthe third trigger level, a reconstructed track with PT >18 GeV=c is required to be matched to the muon chamberhits. The efficiency of the muon trigger, measured fromZ! �� data, is 88:7� 0:7�% for CMU/CMP muons and95:4� 0:4�% for CMX muons [12].
B. Monte Carlo data sets
The detector acceptance of t�t events is modeled usingPYTHIA v6.2 [13] and HERWIG v6.4 [14]. These are leading-order event generators with parton showering to simulateradiation and fragmentation effects. The generators areused with the CTEQ5L parton distribution functions [15].Decays of b and c hadrons are modeled using QQ v9.1 [16].Estimates of backgrounds from diboson production (WW,WZ, ZZ) are derived using the ALPGEN generator [17] withparton showering provided by HERWIG. The backgroundfrom single top production (e.g. W� ! tb) is simulatedusing PYTHIA. Samples of the remaining backgrounds arederived directly from the data as described in Sec. IV.
The detector simulation reproduces the response of thedetector to particles produced in p �p collisions. The samedetector geometry database is used in both the simulationand the reconstruction, and tracking of particles throughmatter is performed with GEANT3 [18]. The drift model forthe COT uses a parametrization of a GARFIELD simulation[19] with parameters tuned to match COT collider data.The calorimeter simulation uses the GFLASH [20] parame-trization package interfaced with GEANT3. The GFLASH
parameters are tuned to test beam data for electrons andhigh-PT pions and checked by comparing the calorimeterenergy of isolated tracks in the collision data to theirmomenta as measured in the COT. Further details of theCDF II simulation can be found in [21].
C. W � jets data set
From the inclusive lepton data set produced by theelectron and muon triggers described in Sec. III A, weselect events with an isolated electron ET (muon PT)greater than 20 GeV and E6 T > 20 GeV. The isolation Iof the electron or muon is defined as the calorimeter
transverse energy in a cone of �R ����������������������������2 � ��2
p<
0:4 around the lepton (not including the lepton energyitself ) divided by the ET (PT) of the lepton. We require I <0:1. The W � jets data set is categorized according to thenumber of jets with ET > 15 GeV and j�j< 2:0. Thedecay of t�t pairs gives rise to events with typically at leastthree such jets, while the W plus one or two jet samplesprovide a control data set with little signal contamination.Jets are identified using a fixed-cone algorithm with a conesize of 0.4 and are constrained to originate from the p �pcollision vertex. Their energies are corrected to accountfor detector response variations in �, calorimeter gaininstability, and multiple interactions in an event. A
complete description of W � jets event selection is givenin [6].
The W � jets data set consists mainly of events of directproduction of W bosons with multiple jets. This amountsalso to the largest background to t�t signal. As a first stage ofbackground reduction, we define a total event energy, HT,as the scalar sum of the electron ET or muon PT, the eventE6 T and jet ET for jets with ET > 8 GeV and j�j< 2:4.Because of the large mass of the top quark, a t�t event isexpected to have a large HT compared to a W plus three ormore jets event, as illustrated in Fig. 2. We studied theexpected amount of signal (S) and background (B) as afunction of HT using the PYTHIA Monte Carlo program tomodel the signal HT distribution. Data is used to model thebackground HT distribution. We optimized the selection ofevents by imposing a minimum HT requirement whichmaximizes S=
�������������S� B
p. We select events with HT >
200 GeV, rejecting approximately 40% of the backgroundwhile retaining more than 95% of the t�t signal.
There are 337W plus three or more jet events withHT >200 GeV in 194 pb�1 of data, 115 from W ! �� candi-dates and 222 from W ! e� candidates.
Even after the HT cut, the expected S:B in W plus threeor more jet events is only of order 1:3. To further improvethe signal to background ratio, we identify events with oneor more b-jets by searching inside jets for semileptonicdecays of b hadrons into muons.
D. Soft lepton tagging algorithm
Muon identification at CDF proceeds by extrapolatingtracks found in the central tracker, through the calorimeterto the muon chambers, and matching them to track seg-ments reconstructed in the muon chambers. Matching isdone in the following observables: extrapolated position
[GeV]TH0 50 100 150 200 250 300 350 400 450 500
stinU yrartibr
A
ttW+jets
niB
wolfrevO
FIG. 2 (color online). HT distributions, normalized to unity,for t�t (solid line) and W � jets (dotted line) PYTHIA Monte Carloevents with three or more jets after the event selection describedin the text.
D. ACOSTA et al. PHYSICAL REVIEW D 72, 032002 (2005)
032002-6

along the muon chamber drift direction (x), the longitudi-nal coordinate along the chamber wires (z) when suchinformation is available, and the extrapolated slope com-pared to the slope of the reconstructed muon chamber tracksegment (�L). Tracks are paired with muon chamber tracksegments based on the best match in x for those tracksegments that are within 50 cm of an extrapolated COTtrack. In what follows we refer to the difference betweenthe extrapolated and measured positions in x and z as dxand dz, respectively, and the extrapolated and measuredslope as d�L. The distributions of these variables over anensemble of events are referred to as the matching distri-butions. In addition to selection based on dx and dz, thestandard muon identification also requires consistency withminimum ionizing energy deposition in the calorimeters.However, in order to retain sensitivity for muons embeddedin jets, the muon SLT algorithm makes full usage of themuon matching information without any requirement onthe calorimeter information. The algorithm starts withhigh-quality reconstructed tracks in the COT, selected byrequiring at least 24 axial and 24 stereo hits on the track.Some rejection for pion and kaon decays in flight isachieved by requiring that the impact parameter of thereconstructed track be less than 3 mm with respect to thebeam line. The track is also required to originate within60 cm in z of the center of the detector. Only tracks passingthese cuts and extrapolating within 3�PT� in x outside ofthe muon chambers, where �PT� is the multiple scatteringwidth, are considered as muon candidates. Also, when atrack extrapolates to greater than 3�PT� in x inside themuon chambers, but no muon chamber track segment isfound, the track is rejected and not allowed to be paired toother muon chamber track segments.
Candidate muons are selected with the SLT algorithm byconstructing a quantity L, based on a comparison of themeasured matching variables with their expectations. Toconstruct L we first form a sum, Q, of individual �2
variables
Q �Xni�1
Xi ��i�2
�2i
; (1)
where �i and �i are the expected mean and width of thedistribution of matching variable Xi. The sum is taken overn selected variables, as described below. L is then con-structed by normalizing Q according to
L �Q� n���������������varQ�
p ; (2)
where the variance varQ� is calculated using the fullcovariance matrix for the selected variables. The normal-ization is chosen to make L independent of the number ofvariables n; note that the distribution of L tends to a
Gaussian centered at zero and with unitary width, for nsufficiently large. The correlation coefficients betweeneach pair of variables are measured from J= ! ��data. The calculation proceeds by comparing the varianceof the sum with the sum of the variances of each pair of �2
variables in Eq. (1). Since the values of the matchingvariables are either positive or negative, according to thelocal coordinate system, separate correlation coefficientsare used for pairs that have same-sign and opposite-signvalues.
The selected variables are the full set of matching var-iables, x; z; �L in the CMU, CMP and CMX with thefollowing two exceptions: The CMP chambers do notprovide a measurement of the longitudinal coordinate z,and matching in �L is not included for track segments inthe muon chambers that have only three hits. Because oftheir significantly poorer resolution, track segments recon-structed in the CMU chambers with three hits are not used.Note that a muon that traverses both the CMU and the CMPchambers yields two sets of matching measurements in xand �L and one z matching measurement, and are referredas CMUP muons. All available matching variables are usedin the calculation of L for a given muon candidate. Byplacing an appropriate cut on L, background is preferen-tially rejected because hadrons have broader matchingdistributions than muons since the track segments in themuon chambers from hadrons are generally a result ofleakage of the hadronic shower.
The widths of the matching distributions that enter intoL are a combination of intrinsic resolution of the muonchambers and multiple scattering. The multiple scatteringterm varies inversely with PT and is dominant at low PT.The expected widths of the matching distributions arebased on measurements of muons from J= decays atlow PT (see Fig. 3) and W and Z boson decays at high PT.
The mean values [�i in Eq. (1)] are typically zero,except for a small offset in the CMU dz. We parametrizethe widths as a function of up to three variables: PT, � and�. These variables describe to first order the effects ofmultiple scattering in the detector. For the CMU detector,PT is sufficient since the material traversed by a muoncandidate is approximately homogenous in � and �. Thewidths are parametrized with a second-order polynomial in1=PT with an exponential term that describes the PT rangebelow 3 GeV=c. For the CMP detector we parametrize thewidths as functions of PT and � to take into account therectangular shape of the absorber outside the central calo-rimeter. For the CMX detector we use PT, � and � toaccount for a number of irregularities in the amount ofabsorber between � � 0:6 and � � 1:0. The measurementof the widths of the matching distributions as functions ofPT, overlayed with their fits, are shown in Fig. 4.
Figure 5 (left) shows an example of the distribution of Lfrom J= decays. The number of variables used variesfrom two to five. Figure 5 (right) shows the efficiency of
MEASUREMENT OF THE t�t PRODUCTION CROSS . . . PHYSICAL REVIEW D 72, 032002 (2005)
032002-7

dx [cm]-20 -15 -10 -5 0 5 10 15 20
stin
U yr
artibr
A 3.0≤T P≤2.5
6.0≤T P≤5.0
dx [cm]-20 -15 -10 -5 0 5 10 15 20
stin
U yr
artibr
A
) [cm]θdz sin(-30 -20 -10 0 10 20 30
stin
U yr
artibr
A
3.0≤T P≤2.5
6.0≤T P≤5.0
) [cm]θdz sin(-30 -20 -10 0 10 20 30
stin
U yr
artibr
A
[rad]Lφd-0.2 -0.1 0 0.1 0.2
stin
U yr
artibr
A
3.0≤T P≤2.5
6.0≤T P≤5.0
[rad]Lφd-0.2 -0.1 0 0.1 0.2
stin
U yr
artibr
A
FIG. 3 (color online). Examples of muon matching distributions for the CMU in (left to right) drift direction, x, the longitudinalcoordinate, z, and angle, �L. For each variable we show two PT ranges, 2:5 � PT � 3 GeV=c (wide distribution) and 5 � PT �6 GeV=c (narrow distribution). For the longitudinal coordinate z, we plot the product of dz by sin&, which is the projection orthogonalto the direction of flight.
[GeV/c]TP1 10
]mc[ x
dσ
0
5
10
15
20
25
[GeV/c]TP1 10
]mc[ x
dσ
0
5
10
15
20
25
CMU
CMP
CMX
-µ+µ → ψ J/
νµ → W
-µ+µ → *γ/0 Z
3 5 7 20 40 [GeV/c]TP
1 10
]dar[ Lφdσ
0
0.05
0.1
0.15
0.2
0.25
[GeV/c]TP1 10
]dar[ Lφdσ
0
0.05
0.1
0.15
0.2
0.25
CMU
CMP
CMX
-µ+µ → ψ J/
νµ → W
-µ+µ → *γ/0 Z
3 5 7 20 40
[GeV/c]TP1 10
]mc[ ) θ(
nis zdσ
0
2
4
6
8
10
12
14
16
18
20
[GeV/c]TP1 10
]mc[ ) θ(
nis zdσ
0
2
4
6
8
10
12
14
16
18
20
CMU
CMX
-µ+µ → ψ J/
νµ → W
-µ+µ → *γ/0 Z
3 5 7 20 40
FIG. 4 (color online). Width of the matching variable distributions (dx; dz sin&; d�L) vs PT for each of the muon chambers. The datapoints, from J= , W and Z decays, are fit to the parametrizations described in the text.
D. ACOSTA et al. PHYSICAL REVIEW D 72, 032002 (2005)
032002-8
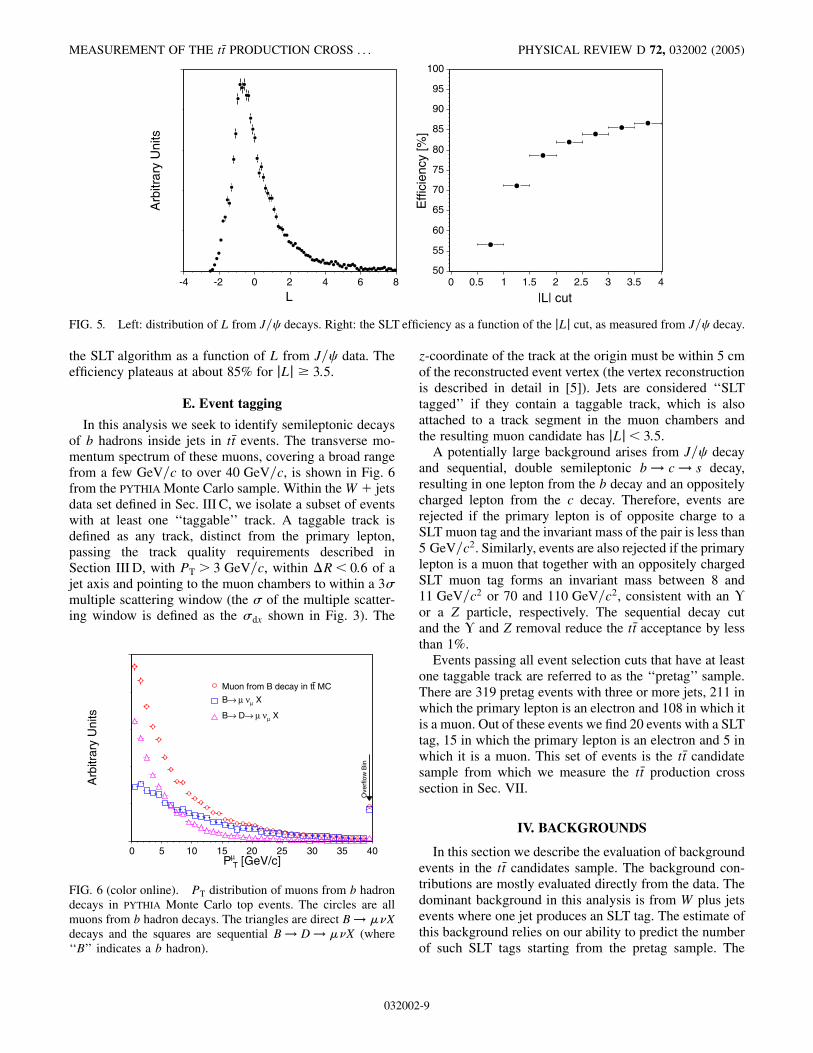
the SLT algorithm as a function of L from J= data. Theefficiency plateaus at about 85% for jLj � 3:5.
E. Event tagging
In this analysis we seek to identify semileptonic decaysof b hadrons inside jets in t�t events. The transverse mo-mentum spectrum of these muons, covering a broad rangefrom a few GeV=c to over 40 GeV=c, is shown in Fig. 6from the PYTHIA Monte Carlo sample. Within the W � jetsdata set defined in Sec. III C, we isolate a subset of eventswith at least one ‘‘taggable’’ track. A taggable track isdefined as any track, distinct from the primary lepton,passing the track quality requirements described inSection III D, with PT > 3 GeV=c, within �R< 0:6 of ajet axis and pointing to the muon chambers to within a 3�multiple scattering window (the � of the multiple scatter-ing window is defined as the �dx shown in Fig. 3). The
z-coordinate of the track at the origin must be within 5 cmof the reconstructed event vertex (the vertex reconstructionis described in detail in [5]). Jets are considered ‘‘SLTtagged’’ if they contain a taggable track, which is alsoattached to a track segment in the muon chambers andthe resulting muon candidate has jLj< 3:5.
A potentially large background arises from J= decayand sequential, double semileptonic b! c! s decay,resulting in one lepton from the b decay and an oppositelycharged lepton from the c decay. Therefore, events arerejected if the primary lepton is of opposite charge to aSLT muon tag and the invariant mass of the pair is less than5 GeV=c2. Similarly, events are also rejected if the primarylepton is a muon that together with an oppositely chargedSLT muon tag forms an invariant mass between 8 and11 GeV=c2 or 70 and 110 GeV=c2, consistent with an �or a Z particle, respectively. The sequential decay cutand the � and Z removal reduce the t�t acceptance by lessthan 1%.
Events passing all event selection cuts that have at leastone taggable track are referred to as the ‘‘pretag’’ sample.There are 319 pretag events with three or more jets, 211 inwhich the primary lepton is an electron and 108 in which itis a muon. Out of these events we find 20 events with a SLTtag, 15 in which the primary lepton is an electron and 5 inwhich it is a muon. This set of events is the t�t candidatesample from which we measure the t�t production crosssection in Sec. VII.
IV. BACKGROUNDS
In this section we describe the evaluation of backgroundevents in the t�t candidates sample. The background con-tributions are mostly evaluated directly from the data. Thedominant background in this analysis is from W plus jetsevents where one jet produces an SLT tag. The estimate ofthis background relies on our ability to predict the numberof such SLT tags starting from the pretag sample. The
L-4 -2 0 2 4 6 8
Arb
itrar
y U
nits
|L| cut0 0.5 1 1.5 2 2.5 3 3.5 4
Effi
cien
cy [%
]
50
55
60
65
70
75
80
85
90
95
100
FIG. 5. Left: distribution of L from J= decays. Right: the SLT efficiency as a function of the jLj cut, as measured from J= decay.
[GeV/c]µ TP
0 5 10 15 20 25 30 35 40
stinU yrartibr
A
n iB
w olf revO
MCtMuon from B decay in t
Xµν µ →B
Xµν µ → D→B
FIG. 6 (color online). PT distribution of muons from b hadrondecays in PYTHIA Monte Carlo top events. The circles are allmuons from b hadron decays. The triangles are direct B! ��Xdecays and the squares are sequential B! D! ��X (where‘‘B’’ indicates a b hadron).
MEASUREMENT OF THE t�t PRODUCTION CROSS . . . PHYSICAL REVIEW D 72, 032002 (2005)
032002-9

prediction is based on the probability for a given track in ajet to yield an SLT tag, and is measured in (� jets events.We then evaluate the systematic uncertainty on the W �jets background estimate by testing the predictive power ofthe measured probabilities in a variety of data samples. TheW � jets background evaluation and its systematic uncer-tainty is described in Sec. IVA. AfterW � jets production,the next largest background is due to QCD multijet events.The evaluation of the QCD multijet contribution also relieson tagging probabilities measured in (� jets events.However, we must account for the possible differencebetween the tagging probabilities for the QCD eventsthat populate the t�t candidate sample because the E6 T oftencomes from a mismeasured jet and not from a neutrino.The evaluation of the QCD background is described inSec. IV B. An additional small source of background isdue to Drell-Yan events and is estimated from the data anddescribed in Sec. IV C. The remaining background contri-butions are relatively small and are evaluated using MonteCarlo samples, as described in Sec. IV D.
A. Backgrounds from W � jets
W plus jets events enter the signal sample either whenone of the jets is a b-jet or a c-jet with a semileptonic decayto a muon, or a light quark jet is misidentified as containinga semileptonic decay (‘‘mistagged’’). We refer to thesebackground events as W � heavy flavor and W �“fakes”, respectively. W � heavy flavor events includeWb �b, Wc �c and Wc production. One way of estimating
these backgrounds would be to use a Monte Carlo program,such as ALPGEN to predict the W � heavy flavor compo-nent, and the data to predict the W � fakes (because thedata provides a more reliable measure of mistags than thesimulation). However, to avoid double-counting, thiswould require an estimate of mistags that is uncontami-nated by tags from heavy flavor. Instead we have chosen toestimate both background components directly from thedata, and we test the accuracy of the prediction as de-scribed below. We measure the combined W � heavy fla-vor and W � fakes background by constructing a ‘‘tagmatrix’’ that parametrizes the probability that a taggabletrack with a given PT, � and�, in a jet with ET > 15 GeV,will satisfy the SLT tagging requirement described inSec. III E. The variables � and � are measured at the outerradius of the COT with respect to the origin of the CDF IIcoordinate system. The tag matrix is constructed using jetsin (� jets events with one or more jets. The tag probabil-ity is approximately 0.7% per taggable track, and includestags from both fakes and heavy flavor. The tag rate as afunction of each of the matrix parameters (integrated overthe remaining two) is shown in Fig. 7. The features in thetag rate vs � and � plots are a result of calorimeter gapsand changes in the thickness of the absorber before themuon chambers. The matrix is binned to take account ofthese variations. The bottom right plot shows the tag rate asthe function of the jLj cut for each muon category. The tagrate is higher for the CMP-only muons due to the smalleramount of absorber material that results from cracks in the
P [GeV/c]0 10 20 30 40 50
Tag
Rat
e [%
]
0
0.2
0.4
0.6
0.8
1
1.2
1.4
T-1 -0.5 0 0.5 1
Tag
Rat
e [%
]
0
0.2
0.4
0.6
0.8
1
1.2
1.4
η
[rad]-3 -2 -1 0 1 2 3
Tag
Rat
e [%
]
0
0.2
0.4
0.6
0.8
1
1.2
1.4
φ |L| cut0 0.5 1 1.5 2 2.5 3 3.5 4
Tag
Rat
e [%
]
0.2
0.4
0.6
0.8
1
1.2
1.4
1.6
1.8
2CMP-onlyCMU-onlyCMUPCMX
FIG. 7. Tag rates in the photon plus jets sample as a function of each of the tag-rate matrix parameters. Each plot is integrated overthe two parameters not shown. The bottom right plot shows the tag rate as the function of the jLj cut for each of the muon categories.
D. ACOSTA et al. PHYSICAL REVIEW D 72, 032002 (2005)
032002-10

calorimeter where there is no coverage by the CMUchambers.
We apply the tag matrix to all pretag events in the signalregion according to
Ntagpredicted �
Xevents
"1�
YNtrk
i�1
1� P i�
#; (3)
where the sum runs over each event in the pretag sample,and the product is over each taggable track in the event. P iis the probability from the tag matrix for tagging the i-trackwith parameters PTi , �i and �i. Note that the sum over theevents in Eq. (3) includes any t�t events that are in the pretagsample. We correct for the resulting overestimate of thebackground at the final stage of the cross section calcula-tion, since the correction depends on the measured taggingefficiency (see Sec. VII).
A fraction, FQCD, of the events in the signal region areQCD events (such as b �b or events in which a jet fakes anisolated lepton, see Sec. IV B) for which the background isestimated separately. Therefore, we explicitly exclude theircontribution toNtag
predicted and obtain the predicted number oftagged W � jets background events
NWj-tagpredicted � 1� FQCD� � N
tagpredicted: (4)
The estimated W � fakes and W � heavy flavor back-ground is given in the third line of Table I.
The above technique relies on the assumption that thetagging rate in jets of the (� jets sample is a good modelfor the tagging rate of the jets in W � jets events. Theassumption is plausible because the SLT tagging rate ingeneric jet events is largely due to fakes. We have studiedthe heavy-flavor content of the tags in the (� jets sampleusing the overlap sample between SLT tags and displacedvertex tags identified with the silicon tracker [5]. We findthat 21:0� 1:4�% of the tags in the (� jets sample arefrom heavy flavor. We have used MADEVENT [22] to do
generator-level comparisons of the heavy-flavor fractionsof W � jets events with those from the ( plus jets eventsthat make up the tag matrix. We find that the (� jetssample used to make the tag matrix has approximately30% more heavy flavor than the W� � 3 jet events.Since SLT tags in (� jets events are dominantly fakes,this difference affects the background prediction in W �jets events at only the few-percent level.
TABLE I. Number of tagged events and the background summary. The HT > 200 GeV requirement is made only for events with atleast 3 jets.
Background W � 1 jet W � 2 jets W � 3 jets W� � 4 jets W� � 3 jets
Pretag events 9117 2170 211 108 319Fake, Wb �b, Wc �c, Wc 116:3� 11:6 40:5� 4:1 7:0� 0:7 4:3� 0:4 11:3� 1:1WW, WZ, ZZ, Z! ,�,� 1:10� 0:17 1:33� 0:06 0:16� 0:02 0:04� 0:01 0:19� 0:02QCD 19:6� 24:2 12:4� 3:5 0:9� 0:2 0:8� 0:2 1:6� 0:3Drell-Yan 0:8� 0:4 0:36� 0:20 0:08� 0:09 0:00� 0:09 0:08� 0:09Single top 0:50� 0:03 0:94� 0:06 0:15� 0:01 0:035� 0:003 0:19� 0:01
Total background 138:2� 26:8 55:5� 5:4 8:2� 0:8 5:2� 0:5 13:4� 1:3Corrected background 9:5� 1:1 9:5� 1:1t�t Expectation (6.7 pb) 0:4� 0:1 2:9� 0:5 5:4� 0:9 7:9� 1:7 13:3� 2:6
Total background plus t�t 138:6� 26:8 58:4� 5:4 22:8� 2:8 22:8� 2:8
Tagged events 139 48 13 7 20
(Predicted-Observed)/Predicted [%]-30 -20 -10 0 10 20 30 40 50
Photon
Jet 20
Jet 50
Jet 70
Jet 100
SumEt
Z+jets
1 jet2 jets>=3 jets>=1 jets
FIG. 8. The percent difference between the number of pre-dicted and measured tags in a variety of samples for different jetmultiplicities, as marked. Jet multiplicities do not include thetrigger object (photon or jet). The three photon points contain theevents that make up the tag matrix. Their average is zero bydefinition and is shown by the line centered at zero. The dashedlines at �10% indicate the systematic uncertainty as determinedfrom these data.
MEASUREMENT OF THE t�t PRODUCTION CROSS . . . PHYSICAL REVIEW D 72, 032002 (2005)
032002-11

Given the limitations of a generator-level, matrix ele-ment Monte Carlo study of the heavy flavor content of the(� jets and W � jets samples, we do not use theMADEVENT study to evaluate the systematic uncertaintyon the background due to tagged W � jets events.Instead we test the accuracy of the tag matrix for predictingSLT muon tags by using it to predict the number of tags in avariety of samples with different heavy-flavor content. Wecheck Z plus jets events, events triggered on a jet with ET
thresholds of 20, 50, 70 and 100 GeV (called Jet 20, Jet 50,Jet 70 and Jet 100), or triggered on four jets and the scalarsum of transverse energy in the detector (called SumET).We find that the matrix predicts the observed number oftags in each of these samples to within 10%, as shown inFig. 8, and we use this as the systematic uncertainty on theprediction from the tag matrix.
B. QCD background
We refer to events with two or more jets in which thedecay of a heavy-flavor hadron produces a high-PT isolatedlepton, or in which a jet fakes such a lepton, as QCDevents. These events enter the sample when, in additionto the high-PT isolated lepton, a muon from a heavy-flavordecay gives an SLT tag, or there is a fake tag. We measurethis background directly from the data.
To estimate the QCD component we first use the distri-bution of pretag events in the plane of E6 T vs isolation, I, ofthe primary lepton. We populate this plane with lepton plusjets events according to the event E6 T and I. We considerfour regions in the plane:
A: E6 T < 15 I > 0:2 B: E6 T < 15 I < 0:1
C: E6 T > 20 I > 0:2 D: E6 T > 20 I < 0:1
where region D is the t�t signal region. The distribution ofevents, with one or more jets, in the E6 T vs I regions isshown in Fig. 9.
In order to populate regions A, B and C with only QCDevents, we correct the number of events for the expectedcontamination of W � jets and t�t events in those regionsusing expectations from PYTHIA t�t and W Monte Carlosimulations. The corrections range from less than 1% inelectron plus one-jet events in region A, to 57� 15�% inregion B in muon plus three or more jet events.
Assuming that the variables E6 T and I are uncorrelatedfor the QCD background, the ratio of the number of QCDevents in region A to those in region B should be the sameas the ratio of the number of QCD events in region C tothose in region D. Therefore we calculate the fraction ofQCD events in region D, FQCD, as
FQCD �NQCDD
ND
��������pretagged�NB � NCNA � ND
��������pretagged; (5)
where NQCDD is the total number of pretag QCD events in
the signal region, and Ni represent the number of events inregion i. The measured fractions are shown in Table II.
To estimate the number of tagged QCD events in thesignal region, we multiply FQCD by the tagging probabilityfor QCD events. However, this tagging probability is notnecessarily given by the tag matrix probabilities which aredesigned for jets in W � jets events. Mismeasurement inthe jet energies and differences in kinematics betweenW � jets and QCD events can affect the tagging probabil-ities. W � jets events have E6 T from the undetected neu-trino, whereas QCD events have E6 T primarily from jetmismeasurement. Jet mismeasurement is correlated withfake tags due to energy leakage from the calorimeterthrough calorimeter gaps or incomplete absorption of thehadronic shower, both of which can result in track seg-ments in the muon chambers. W � jets events have aprimary lepton from the W decay, whereas QCD eventshave a primary lepton that is either a fake or a result of asemileptonic decay of heavy flavor. The presence of alepton from heavy-flavor decay typically enhances thetag rate. Figure 10 shows the ratio of the number ofmeasured tags in the Jet 20 sample to the number of tagspredicted by the tag matrix as a function of E6 T . As ex-pected, in QCD events with large E6 T we find a tag ratesignificantly larger than that described by the tag matrix.
We find that the prediction of the tag matrix can berenormalized to properly account for the tag rates inQCD events with a single multiplicative factor, which wecall k. We measure k using events in region C by compar-ing the number of SLT tags found to the number predictedby the tag matrix. Since the signal region contains onlyisolated (I < 0:1) primary leptons, we reject events in themeasurement of k in which the SLT tag is within �R< 0:5of the primary lepton. After this requirement we do not find
FIG. 9 (color online). Distribution of events with � 1 jet in E6 Tvs I. Regions A,B,C are defined in the text and are used tocalculate the fraction of QCD events in region D (the signalregion) according to Eq. (5).
D. ACOSTA et al. PHYSICAL REVIEW D 72, 032002 (2005)
032002-12

any dependence of k on the isolation of the primary lepton.Figure 11 shows the ratio of measured to predicted tags inevents in region C as a function of HT. The tag rate aboveHT � 200 GeV is approximately flat and is not muchdifferent from the prediction of the tag matrix (dashedline in Fig. 11). However, QCD events at lower HT havea significantly different tag rate than that predicted by thetag matrix. As shown in Fig. 12, FQCD also has an HT
dependence for events with 1 or 2 jets, but is flat within thestatistical uncertainty for three or more jets.
The number of QCD background events is calculated as
NQCD � hFQCD � ki � Ntagpredicted; (6)
where Ntagpredicted is given in Eq. (3) and the brackets repre-
sent the product of FQCD and k convoluted with the HT
distribution of QCD events from region C. In the controlregion (1 and 2 jets), the fits of FQCD vs HT, shown inFig. 12, are convoluted with k vsHT, shown in Fig. 11. Forevents with three or more jets, since there is no visible HT
dependence for either FQCD or k, we simply multiply theiraverage values for HT > 200 GeV. Measured values of ktimes FQCD are given in Table II. The procedure by whichFQCD is determined as a function of HT is important
because the ratios between the four different regions ofthe E6 T and I kinematic plane, calculated in separate rangesof HT and then averaged, does not necessarily correspondto the same ratios taken while integrating over the full HT
range. The uncertainties on the 1 and 2 jet events areconservatively taken as the difference between the centralvalue and the result of the straight product of FQCD and k.The straight product corresponds to ignoring the HT de-pendence as well as any other variable’s dependence ofFQCD and k.
C. Drell-Yan background
Drell-Yan events can enter the sample when they areproduced with jets and one muon is identified as theprimary muon while the second muon is close enough toa jet to be tagged. Residual Drell-Yan background that isnot removed by the dimuon and sequential decay rejectiondescribed in Sec. III E, is estimated from the data. We useevents inside the Z-mass window (76–106 GeV=c2), whichare otherwise removed from the analysis by the Z-mass cut,to measure the number of events that would pass all ourselection requirements including the SLT tag, Ntags
inside.Because of the limited sample size of Z� jets events, we
Missing Transverse Energy [GeV]0 10 20 30 40 50
Tag
s: O
bser
ved
/ Pre
dict
ed
1
2
3
4
5 Jet 20 sample
Tag Matrix prediction
FIG. 10. The ratio of the number of observed tags to tagspredicted using the tag matrix, as a function of E6 T , in eventswith at least one jet with measured energy above 20 GeV.
TABLE II. QCD fraction, given by Eq. (5), and the HT-averaged product of k and the QCD fraction.
Jet multiplicity 1 jet 2 jet 3 jets � 4 jets � 3 jets
Muons
FQCD 0:03� 0:002 0:039� 0:004 0:023� 0:011 0:146� 0:088 0:044� 0:016hk� � FQCDi 0:02� 0:07 0:05� 0:51 0:01� 0:01 0:09� 0:07 0:03� 0:02
Electrons
FQCD 0:145� 0:007 0:177� 0:010 0:135� 0:032 0:163� 0:051 0:145� 0:028hke � FQCDi 0:24� 0:31 0:41� 0:12 0:16� 0:046 0:20� 0:07 0:17� 0:04
H [GeV]0 100 200 300 400 500
Tag
s: O
bser
ved
/ Pre
dict
ed
-5
0
5
10
15
20Electron Channel
Muon ChannelTag Matrix prediction
T
FIG. 11. The ratio of the observed rate of tags to that pre-dicted, as a function of HT in region C for events with one ormore jets. The arrow at 200 GeV shows where the selection cutfor the t�t signal sample is placed.
MEASUREMENT OF THE t�t PRODUCTION CROSS . . . PHYSICAL REVIEW D 72, 032002 (2005)
032002-13

use Z� 0 jet events without the E6 T andHT requirements tofind the ratio of events outside the Z-mass window to thoseinside the window, Rout=in
Z=(� , and a first-order estimate of thenumber of expected Drell-Yan events outside of the Z-masswindow is calculated as
NDY � Ntagsinside � R
out=inZ=(� : (7)
This estimate assumes that Rout=inZ=(� does not depend on the
number of jets in the event. We assign a systematic uncer-tainty of 33% for this assumption based on the largestdeviation between Rout=in
Z=(� for ALPGEN Z=(� plus zero jetevents compared with 1, 2 or � 3 jets events.
The first-order estimate is then corrected by the relativeefficiency inside and outside the Z-mass window of the E6 T ,HT, and SLT-jet requirements, which we measure usingZ=(� � jets Monte Carlo events. The Drell-Yan back-ground estimates are listed in the sixth line of Table I.
D. Other backgrounds
Remaining background sources are due to WW, WZ,ZZ, Z! ,, and single top production. Diboson events canenter the sample when there are two leptons from a Z and/or aW decay and jets. One lepton passes the primary leptonrequirements while the second is available to pass the SLTrequirement if it is close to a jet. The E6 T in these events caneither come from a W-boson decay or from an undetectedlepton in a Z-boson decay. Z! ,, events can enter the
sample when the Z is produced in association with jets andone , decays to a high-PT isolated electron or muon, whilethe second , produces an SLT muon in its decay.Electroweak single top production gives rise to an eventsignature nearly identical to t�t when there are additionaljets from gluon radiation.
None of the above background sources are completelyaccounted for by the application of the tag matrix to thepretag event sample because these backgrounds have asignificant source of muons from, for instance, W and Zdecay. Therefore, we independently estimate their contri-butions to the background using Monte Carlo samplesnormalized to the cross sections referenced in Table III.In modeling the SLT tagging of such events in the MonteCarlo samples, we explicitly exclude the mistag contribu-tion which is taken into account in the application of thetag matrix to the pretag sample. The background for eachsource is estimated as
Ni � �i � Ai � 1tag;i �Z
Ldt; (8)
where �i is the theoretical cross section for the particularbackground source, Ai is the acceptance for passing thepretag event selection, 1tag;i is the SLT tagging efficiencyand
RLdt is the integrated luminosity of the overall data
sample. The expected background contributions areshown, as a function of jet multiplicity, in Table III.
[GeV]TH0 50 100 150 200 250 300
DC
QF
0
0.1
0.2
0.3
0.4
0.5Electron 1 jet event
[GeV]TH0 50 100 150 200 250 300
DC
QF
0
0.1
0.2
0.3
0.4
0.5Electron 2 jets event
[GeV]TH0 50 100 150 200 250 300
DC
QF
0
0.1
0.2
0.3
0.4
0.5 3 jets event≥Electron
[GeV]TH0 50 100 150 200 250 300
DC
QF
0
0.1
0.2
0.3Muon 1 jet event
[GeV]TH0 50 100 150 200 250 300
DC
QF
0
0.1
0.2
0.3Muon 2 jets event
[GeV]TH0 50 100 150 200 250 300
DC
QF
0
0.1
0.2
0.3 3 jets event≥Muon
FIG. 12 (color online). FQCD measured according to Eq. (5) as a function of HT in electron events (top) and muon events (bottom)with (left to right) 1, 2 or � 3 jets.
D. ACOSTA et al. PHYSICAL REVIEW D 72, 032002 (2005)
032002-14

V. TOTAL t �t ACCEPTANCE
We factorize the efficiency for identifying t�t events intothe geometric times kinematic acceptance and the SLTtagging efficiency. The acceptance includes all the cutsdescribed in Secs. III C as well as the invariant mass cutdescribed in Sec. III E, and is evaluated assuming a topmass of 175 GeV=c2. The tagging efficiency is the effi-ciency for SLT tagging at least one jet in events that passthe geometric and kinematic selection. We describe eachpiece below.
A. Geometric and kinematic acceptance
The acceptance is measured in a combination of dataand Monte Carlo simulations. Simulations are done usingthe PYTHIA Monte Carlo program [13]. The primary leptonidentification efficiency is measured in Z-boson decaysacquired with a trigger that requires a single high-PT
electron or muon. The efficiency is measured using thelepton from the Z-boson decay that is unbiased by thetrigger, and the identification efficiency in the MonteCarlo sample is scaled to that measured in the data [6].The acceptance, as a function of the number of identifiedjets above 15 GeV, is shown in Table IV. These numbersinclude the measured efficiencies of the high-PT leptontriggers.
B. SLT efficiency
The efficiency for the reconstruction of the COT track istaken directly from Monte Carlo simulation. The recon-struction efficiencies of muon chamber track segments arealso taken from the simulation and scaled to the valuesmeasured in the data using the lepton in Z-boson decaysunbiased by the trigger. The muon identification efficiencyof the SLT algorithm is measured in data using J= and Z
decays. We use events acquired with triggers that demand asingle muon, and use only the muon not biased by thetrigger. The efficiency is defined as the ratio of muons thatsatisfy the SLT tagging requirement over the number oftaggable tracks attached to track segments in the muonchambers. In the calculation of the efficiency a backgroundlinear in invariant mass is subtracted from the J= and Zpeaks. The measured efficiency vs PT is shown in Fig. 13for muons with j�j< 0:6 (CMU and/or CMP) and formuons with 0:6 � j�j � 1:0 (CMX). The decrease in ef-ficiency with increasing PT is a result of non-Gaussian tailsin the components of L.
Since the efficiency measurement is dominated by iso-lated muons, whereas the muons in b-jets tend to besurrounded by other tracks, we have studied the depen-dence of the efficiency on the number of tracks, Ntrk, above1 GeV=c in a cone of �R � 0:4 around the muon track.We find no significant efficiency loss, although the preci-sion of the measurement is poor near Ntrk � 6, the meanexpected in t�t events. We include a systematic uncertaintyto account for this by fitting the efficiency vsNtrk to a linearfunction and evaluating this function at the mean Ntrk
expected in t�t events. The systematic uncertainty on theefficiency for at least one SLT tag in a t�t event from thiseffect is �0%, �8%.
The detector simulation does not properly reproduce thenon-Gaussian tails of the muon matching distributions.Therefore the measured efficiencies, shown in Fig. 13,are applied directly to a generated muon in the MonteCarlo sample when evaluating the efficiency for tagginga t�t event. This accounts for tagging of semileptonic heavy-flavor decays in t�t events (including charm decays fromW ! c�s). Events from t�t can also be mistagged when a tagresults from a fake muon or a decay-in-flight. We accountfor this effect in the tagging efficiency evaluation by al-
TABLE III. Summary of the expected number of background events for those sources derived from Monte Carlo simulations, and thecross sections used in Eq. (8). The quoted uncertainties come from the respective Monte Carlo sample sizes and the uncertainty on thetheoretical cross sections.
1 jet 2 jets 3 jets � 4 jets � 3 jets
WW [23] 0:64� 0:15 0:99� 0:18 0:12� 0:07 0:029� 0:033 0:15� 0:08WZ [23] 0:11� 0:07 0:22� 0:09 0:03� 0:04 0:003� 0:006 0:03� 0:04ZZ [23] 0:013� 0:010 0:025� 0:015 0:007� 0:007 0:004� 0:004 0:010� 0:010Z! ,�,� [24] 0:34� 0:16 0:10� 0:05 0:006� 0:003 0:002� 0:001 0:008� 0:004Single top [25] 0:50� 0:03 0:94� 0:06 0:15� 0:01 0:035� 0:003 0:19� 0:01
TABLE IV. Acceptance for t�t events as a function of jet multiplicity from PYTHIA Monte Carlo sample, corrected for the data=MCratio for tight lepton ID efficiencies and the primary lepton trigger efficiency. The uncertainties listed are statistical only.
W � 1 jet W � 2 jets W � 3 jets W� � 4 jets W� � 3 jets
W ! e� (%) 0:204� 0:005 1:05� 0:01 1:79� 0:02 2:27� 0:02 4:06� 0:02W ! �� (CMUP) (%) 0:095� 0:003 0:501� 0:007 0:861� 0:007 1:12� 0:01 1:98� 0:01W ! �� (CMX) (%) 0:045� 0:002 0:235� 0:006 0:388� 0:007 0:507� 0:008 0:90� 0:01
MEASUREMENT OF THE t�t PRODUCTION CROSS . . . PHYSICAL REVIEW D 72, 032002 (2005)
032002-15

lowing events that are not tagged by muons from heavy-flavor decays to be tagged by other charged tracks using thetagging probabilities from the tag matrix, as described inSec. IV. Since the heavy-flavor component of the taggingefficiency has already been accounted for, the generic-track tagging probabilities are corrected downwards forthe measured 21% heavy-flavor component of the tagmatrix (Sec. IVA). The overall efficiency for finding oneor more SLT tags in a t�t event (‘‘tagging efficiency’’) isshown in Table V. Mistags account for approximately 25%of the t�t tagging efficiency. Because a small portion of theintegrated luminosity was accumulated before the CMXwas fully functional, we break the efficiency into pieceswith and without the CMX. This is taken into account inthe final cross section denominator. The total t�t detectionefficiency is the product of the acceptance and the taggingefficiency.
As noted above, the SLT efficiency has been parame-trized using muons that tend to be isolated from otheractivity. To further check that this efficiency measurementis representative of muons in or near jets, we use a high-purity b �b sample, derived from events triggered on 8 GeVelectrons or muons. These events are enriched in semi-leptonic b-hadron decays. To select this sample, we requirethat the events have two jets above 15 GeV. One jet must be
within �R � 0:4 of the primary electron or muon (the‘‘lepton jet’’). For jets associated with muons, the energyis corrected to account for the muon PT. The second jet (the‘‘away jet’’) in the event is chosen as the jet above 15 GeVwith maximum separation in azimuth ( � 2 rad) from thelepton jet. Both jets are required to have a secondary vertexreconstructed and tagged by the SecVtx algorithm [5](‘‘SecVtx-tagged’’). This results in a b �b sample with apurity of approximately 95% [26]. We measure the SLTacceptance times efficiency for semileptonic decays tomuons in the away jet in a HERWIG dijet Monte Carlosample. Monte Carlo events are subject to the same eventselection, as described above, used for the b �b data sample.The efficiency parametrization measured from the data isapplied in the same way as in the t�t Monte Carlo sample.The derived efficiency times acceptance per b-jet is appliedto the data to predict the number of SLT tags in the awayjet. There are 7726 SecVtx-tagged away jets in which thelepton jet is from a muon and 2233 in which it is from anelectron. In these events we predict 388� 54 tags in theaway jet opposite a muon jet and 116� 17 tags in the awayjet opposite an electron jet. We find 353 and 106, respec-tively. We conclude that the efficiency for SLT taggingmuons from semileptonic decays of heavy flavor in jets iswell modeled by our simulation.
TABLE V. t�t event tagging efficiency for SLT muons as a function of jet multiplicity from PYTHIA Monte Carlo sample.Uncertainties are statistical only.
W � 1 jet W � 2 jets W � 3 jets W� � 4 jets W� � 3 jets
W ! e� w/CMX (%) 9:5� 0:8 13:1� 0:4 14:7� 0:3 15:9� 0:3 15:4� 0:2W ! e� w/o CMX (%) 6:7� 0:7 10:3� 0:4 11:5� 0:3 12:4� 0:3 12:0� 0:2
W ! �� w/CMX (%) 7:2� 0:8 12:3� 0:5 13:3� 0:3 16:1� 0:3 14:9� 0:2W ! �� w/o CMX (%) 5:0� 0:8 9:6� 0:5 10:3� 0:4 12:8� 0:3 11:7� 0:3
[GeV/c]TP10
]%[ ycneiciff
E
50
55
60
65
70
75
80
85
90
95
100
3 5 7 20 40 [GeV/c]TP
10
]%[ ycneiciff
E
50
55
60
65
70
75
80
85
90
95
100
3 5 7 20 40
FIG. 13 (color online). The SLT efficiency for j�j< 0:6 (left) and j�j � 0:6 (right) as a function of PT, measured from J= and Zdata for jLj< 3:5. The dotted lines are the �1� statistical uncertainty on the fit which is used in the evaluation of the systematicuncertainty.
D. ACOSTA et al. PHYSICAL REVIEW D 72, 032002 (2005)
032002-16

VI. SYSTEMATIC UNCERTAINTIES
Systematic uncertainties in this analysis come from un-certainties in the Monte Carlo modeling of the acceptance,knowledge of the SLT tagging efficiency, the effect on theacceptance of the uncertainty on the jet energy calibration,uncertainties on the background predictions, and the un-certainty on the luminosity.
Uncertainties in the Monte Carlo modeling of accep-tance include effects of parton distribution functions(PDFs), initial-state radiation (ISR), final-state radiation(FSR), and the calibration of the measured jet energy.These are estimated by comparing different choices forPDFs, varying ISR, FSR and the jet energy in the MonteCarlo programs and comparing the results from the PYTHIA
generator with those from HERWIG. A complete descriptionof the evaluation of these uncertainties appears in [6]. Thetotal systematic uncertainty on the acceptance due to thesefactors is �6:1%. Possible variations of the lepton IDefficiency in events with multiple jets are an additionalsource of systematic uncertainty on the acceptance. We usea data to Monte Carlo scale factor for the lepton IDefficiency that is taken from Z! ee and Z! �� dataand Monte Carlo samples. These samples contain predomi-nantly events with no jets. A 5% systematic uncertainty onthe scale factor is estimated by convoluting the scale factoritself, measured as a function of �R between the lepton andthe nearest jet, with the �R distribution of leptons in � 3jet t�t events [6]. Adding the uncertainties in quadraturegives a total Monte Carlo modeling systematic uncertaintyon the acceptance of �8:0%.
There are several factors that contribute to the system-atic uncertainty on the SLT tagging efficiency. The uncer-tainty due to our knowledge of the PT dependence isdetermined by varying the efficiency curves used in the t�tMonte Carlo sample according to the upper and lowerbands in Fig. 13. We find that the tagging efficiency fort�t changes by �1% from its central value. An additionalsource of systematic uncertainty for the tagging efficiencycomes from the fact that we implicitly use the Monte Carlotracking efficiency for taggable tracks. As these tracks can
be in dense environments in or near jets, we expect theefficiency to be somewhat less than for isolated tracks.Studies done by embedding Monte Carlo tracks in jets inboth data and Monte Carlo events indicate that the MonteCarlo tracking efficiency in dense environments is a fewpercent higher than in data. We assign a �5% systematicuncertainty to the tagging efficiency for this effect. Asdescribed in Sec. V B the systematic uncertainty due tothe modeling of the isolation dependence of the taggingefficiency is �0%, �8%. Finally, the statistical uncertaintyon the measurement of the SLT tagging efficiency in t�tevents, differences between PYTHIA and HERWIG, the un-certainty on the semileptonic branching fraction for Bmesons and the estimation of the heavy-flavor content ofthe mistag matrix also contribute to the systematic uncer-tainties. Adding these contributions in quadrature gives anoverall systematic uncertainty for the tagging efficiency of�8%, �11%. Note that the uncertainty on the taggingefficiency affects also the backgrounds determination.The reason is that t�t events need to be subtracted fromthe pretag sample which is used in Eq. (3) to determine theW � jets background. We take this effect into accountwhen calculating the uncertainty on the cross section.
Uncertainties on the tag matrix are determined by thelevel of agreement between observed tags and predictionsin a variety of samples, as described in Sec. IV. Theuncertainty on the W � fakes and Wb �b�Wc �c�Wc pre-diction is �10%.
To determine the uncertainties on the QCD backgroundprediction in events with three or more jets, we define acontrol sample from the E6 T vs lepton isolation plane,where the primary lepton isolation parameter I is between0.1 and 0.2 and the event has E6 T > 20 GeV. After subtract-ing expected contributions from W and t�t events, all eventsin this region are expected to be QCD. We determine thesystematic uncertainty on the QCD background using theratio of the observed over predicted number of events inthis control region, which should be 1.0. In the samplewhere the primary lepton is a muon, we measure 0:5� 0:4.In the sample where the primary lepton is an electron, wemeasure 0:8� 0:2. A 50% systematic uncertainty is as-
TABLE VI. Summary of systematic uncertainties. The shift ��t�t of the measured crosssection value assumes the cross section calculated in Sec. VII.
Source Fractional system uncertainty (%) ��t�t (pb)
Acceptance modeling �8�1:10�0:70
SLT tagging efficiency �8;�11Tag matrix prediction �10 �0:68QCD prediction �19e� � 67�� �0:14Drell-Yan and other MC backgrounds �19 �0:05Luminosity �6 �0:32
Total systematic uncertainty�1:3�1:0
MEASUREMENT OF THE t�t PRODUCTION CROSS . . . PHYSICAL REVIEW D 72, 032002 (2005)
032002-17

signed to the FQCD measurement for muons and 20% forelectrons. We combine this with the statistical uncertaintyon FQCD, the uncertainty on the correction factor k, bothgiven in Table II and the 10% systematic uncertainty due tothe application of the tag matrix. The total QCD back-ground uncertainty is �67% and �19% for muons andelectrons, respectively. These values are determined takinginto account the correlation between the estimate of theQCD background and the estimate of the W � fakes andW � heavy flavor backgrounds [Eqs. (4) and (6)]. We addin quadrature the separate effects on the cross section of theQCD uncertainties for electrons and muons.
The systematic uncertainty on the small Drell-Yan back-ground is dominated by its statistical uncertainty. We alsoinclude a 33% relative uncertainty to account for changesin the shape of the Drell-Yan spectrum with the number ofjets in the event, as described in Sec. IV C. Uncertainties onthe Monte Carlo background predictions come from un-certainties in the cross sections for the various processesand from the event sizes of the Monte Carlo samples.
The systematic uncertainties and the corresponding shiftof the measured cross section value are summarized inTable VI.
VII. RESULTS
Table I shows a summary of the background estimatesand the number of SLT tagged events as a function of thenumber of jets. A ‘‘tagged event’’ is an event with at leastone tagged jet. The total background and the t�t expectationare also listed. The line labeled ‘‘Corrected background’’corresponds to the background after correcting for the t�tcontent of the pretag sample, as described in Sec. IVA.
We calculate the cross section as
�t�t �Nobs � Nbgnd
At�t �RLdt
; (9)
where Nobs is the number of events with � 3 jets that aretagged with at least 1 SLT, Nbgnd is the corrected back-ground and At�t is the total acceptance (geometrical accep-tance times kinematic acceptance times taggingefficiency), taken from Tables IV and V. For events withthree or more jets, the total denominator is 1:98�0:28 pb�1.
From the number of candidate events with three or morejets, we find a total t�t production cross section of
�p �p! t�t� � 5:3� 3:3�1:3�1:0 pb;
where the first uncertainty is statistical and the second issystematic. This cross section value uses acceptances andtagging efficiencies appropriate for a top mass of175 GeV=c2. The acceptances and efficiencies, and there-fore the calculated cross section, change slightly for other
assumed top masses. The calculated cross section is 1%higher assuming a top mass of 170 GeV=c2, and 5% lowerassuming a top mass of 180 GeV=c2.
[GeV] TTagged Jet E0 20 40 60 80 100 120 140 160 180 200
Num
ber
of ta
gged
jets
/ 10
GeV
0
10
20
30
40
50
60
70
[GeV] TTagged Jet E0 20 40 60 80 100 120 140 160 180 200
Num
ber
of ta
gged
jets
/ 10
GeV
0
10
20
30
40
50
60
70 ,Wcc,WcbFake,WbQCDOther backgrounds
= 5.3 pbtt
σ scaled to tt
uncertaintiestBackground+t-1
11 pb±Data L = 194
W + 1,2 jets
Ove
rflo
w B
in
[GeV]TTagged Jet E0 20 40 60 80 100 120 140 160 180 200
Num
ber
of ta
gged
jets
/ 10
GeV
0
1
2
3
4
5
6
7
8
9
[GeV]TTagged Jet E0 20 40 60 80 100 120 140 160 180 200
Num
ber
of ta
gged
jets
/ 10
GeV
0
1
2
3
4
5
6
7
8
9 = 5.3 pbtt
σ scaled to tt
,Wcc,WcbFake,WbQCDOther backgrounds
uncertaintiestBackground+t-1
11 pb±Data L = 194
3 jets≥W +
Ove
rflo
w B
in
FIG. 15. Comparison of the jet ET distributions for taggedevents and for expectations from fakes, QCD and t�t events.The upper plot is for W � 1 and 2 jet events and the lowerplot for W� � 3 jet events.
Number of jets in W+jets1 2 3 4
stneve deggat fo rebmu
N
1
10
102
Background
Background errorstBackground+t
errorstBackground+t)
-1 11 pb±Data (194
=6.7 pbtt
σ scaled to tt
≥
3 jets≥>200 GeV for TRequire H
FIG. 14 (color online). The expected background and observedtags in W � 1, 2, 3 and 4 or more jet events. The background iscorrected for the t�t content of the pretag sample.
D. ACOSTA et al. PHYSICAL REVIEW D 72, 032002 (2005)
032002-18

Figure 14 shows the number of tags in W � 1; 2; 3;� 4jet events together with the histograms representing thetotal corrected background with and without the t�t signalexpectation, based on the theoretical cross section of 6.7 pbfor Mtop � 175 GeV=c2.
We examine a number of kinematic distributions of thetagged events and compare with expectations based on themeasured signal plus background. Figure 15 shows the ET
distribution of the tagged jets in W � 1 and 2 jets (com-bined), and in the signal region of W plus three or morejets. The W � 1 and 2 jet data-Monte Carlo comparisonhas a Kolmogorov-Smirnov test (KS) probability of 41%,and the three or more jet comparison has a KS probabilityof 82%.
Figure 16 compares the PT distribution of muons iden-tified as SLT tags with expectations from t�t plus back-grounds. The KS probabilities are 6% for W � 1 and 2 jetcomparison and 5% for the three or more jet comparison.
Finally, Fig. 17 shows the impact parameter signifi-cance, defined as the impact parameter divided by itsuncertainty, for the SLT tracks and the expectation fromsignal plus background. The sign of the impact parameter
is defined according to whether the track trajectory crossesthe jet axis in front of or behind the event primary vertex.The long-lived component from semileptonic b-hadrondecays is readily apparent in the shape of the positiveimpact parameter distribution. The KS probabilities are12% forW � 1 and 2 jet comparison and 23% for the threeor more jet comparison. (Note that Figs. 15–17 contain 21entries since one of the events has two jets tagged withSLT.)
VIII. CONCLUSIONS
We have measured the total cross section for t�t produc-tion through the decay of top pairs into an electron or muonplus multiple jets. We separate signal from background byidentifying semileptonic decays of b hadrons into muons.The measured t�t production cross section is 5:3�3:3�1:3
�1:0 pb, consistent with the expectation of 6.7 pb forstandard model production and decay of top quark pairswith a mass of 175 GeV=c2. Distributions of Jet ET andimpact parameter significance for the tagged events, and
]σTagged SLT d0 Significance [-20 -15 -10 -5 0 5 10 15 20
σN
umbe
r of
tagg
ed S
LT /
2
1
10
102
]σTagged SLT d0 Significance [-20 -15 -10 -5 0 5 10 15 20
σN
umbe
r of
tagg
ed S
LT /
2
1
10
102
,Wcc,WcbFake,WbQCDOther backgrounds
= 5.3 pbtt
σ scaled to tt
uncert.tBackground+t-1
11 pb±Data L = 194
W + 1,2 jets
Und
erflo
w B
in Ove
rflo
w B
in
]σTagged SLT d0 Significance [-20 -15 -10 -5 0 5 10 15 20
σN
umbe
r of
tagg
ed S
LT /
2
10-1
1
10
]σTagged SLT d0 Significance [-20 -15 -10 -5 0 5 10 15 20
σN
umbe
r of
tagg
ed S
LT /
2
10-1
1
10
= 5.3 pbtt
σ scaled to tt
,Wcc,WcbFake,WbQCDOther backgrounds
uncert.tBackground+t-1
11 pb±Data L = 194
3 jets≥W +
Und
erflo
w B
in
Ove
rflo
w B
in
FIG. 17. The impact parameter (d0) significance for taggedevents, compared with expectations from backgrounds plus t�t.The upper plot is for W � 1 and 2 jet events and the lower plotfor W� � 3 jet events.
[GeV/c] TTagged SLT P0 5 10 15 20 25 30 35 40
Num
ber
of ta
gged
SLT
/ 2
GeV
/c
0
10
20
30
40
50
60
70
[GeV/c] TTagged SLT P0 5 10 15 20 25 30 35 40
Num
ber
of ta
gged
SLT
/ 2
GeV
/c
0
10
20
30
40
50
60
70,Wcc,WcbFake,Wb
QCDOther backgrounds
= 5.3 pbtt
σ scaled to tt
uncertaintiestBackground+t-1
11 pb±Data L = 194
W + 1,2 jets
Ove
rflo
w B
in
[GeV/c] TTagged SLT P0 5 10 15 20 25 30 35 40
Num
ber
of ta
gged
SLT
/ 2
GeV
/c
0
1
2
3
4
5
6
7
8
[GeV/c] TTagged SLT P0 5 10 15 20 25 30 35 40
Num
ber
of ta
gged
SLT
/ 2
GeV
/c
0
1
2
3
4
5
6
7
8 = 5.3 pbtt
σ scaled to tt
,Wcc,WcbFake,WbQCDOther backgrounds
uncertaintiestBackground+t-1
11 pb±Data L = 194
3 jets≥W +
Ove
rflo
w B
in
FIG. 16. PT of the SLT tags. The upper plot is for W � 1 and 2jet events and the lower plot for W� � 3 jet events.
MEASUREMENT OF THE t�t PRODUCTION CROSS . . . PHYSICAL REVIEW D 72, 032002 (2005)
032002-19

the distributions of the PT of the tags, are also consistentwith standard model expectations.
The sensitivity of this analysis to test nonstandard modelt�t production or decay mechanisms is limited by the sta-tistical uncertainty. The combination of this measurementwith other CDF II measurements [8] will yield a signifi-cantly more precise value. Future measurements with thefull run II data set of 4–8 fb�1 will provide further factorsof approximately four to six in statistical precision. At thesame time, significantly larger data sets will provide ave-nues for reduction of the systematic uncertainties throughsuch things as better understanding of the tag rate in W �jets events and direct measurement of the tagging effi-ciency for semileptonic b-hadron decays.
ACKNOWLEDGMENTS
We are grateful to Tim Stelzer for help with studies ofthe heavy-flavor content of (� jets and W � jets eventsusing MADEVENT. We thank the Fermilab staff and the
technical staffs of the participating institutions for theirvital contributions. This work was supported by the U.S.Department of Energy and National Science Foundation;the Italian Istituto Nazionale di Fisica Nucleare; theMinistry of Education, Culture, Sports, Science andTechnology of Japan; the Natural Sciences andEngineering Research Council of Canada; the NationalScience Council of the Republic of China; the SwissNational Science Foundation; the A.P. Sloan Foundation;the Bundesministerium fur Bildung und Forschung,Germany; the Korean Science and EngineeringFoundation and the Korean Research Foundation; theParticle Physics and Astronomy Research Council andthe Royal Society, U.K.; the Russian Foundation forBasic Research; the Comision Interministerial de Cienciay Tecnologia, Spain; and in part by the EuropeanCommunity’s Human Potential Programme underContract No. HPRN-CT-2002-00292, Probe for NewPhysics.
[1] M. Cacciari, S. Frixione, G. Ridolfi, M. Mangano, andP. Nason, J. High Energy Phys. 04 (2004) 068;N. Kidonakis and R. Vogt, Phys. Rev. D 68, 114014(2003).
[2] C. T. Hill and S. J. Parke, Phys. Rev. D 49, 4454(1994).
[3] H. P. Nilles, Phys. Rep. 110, 1 (1984); H. E. Haber andG. L. Kane, ibid. 117, 75 (1985).
[4] We use a (z; �; &) coordinate system where the z-axis is inthe direction of the proton beam, and � and & are theazimuthal and polar angles, respectively. The pseudora-pidity, �, is defined as � lntan&2�. The transverse momen-tum of a charged particle is PT � P sin&, where Prepresents the measured momentum of the charged-particle track. The analogous quantity using calorimeterenergies, defined as ET � E sin&, is called transverseenergy. The missing transverse energy is defined as E6 T ��j
PiE
iTnij where EiT is the magnitude of the transverse
energy contained in each calorimeter tower i in the pseu-dorapidity region j�j< 3:6 and ni is the direction unitvector of the tower in the plane transverse to the beamdirection.
[5] D. Acosta et al., Phys. Rev. D 71, 052003 (2005).[6] D. Acosta et al., Phys. Rev. D (to be published).[7] D. Acosta et al. Phys. Rev. D 71, 072005 (2005).[8] A. Abulencia et al. [Phys. Rev. Lett. (to be published)].[9] T. Affolder et al., Phys. Rev. D 64, 032002 (2001); V. M.
Abazov et al., Phys. Rev. D 67, 012004 (2003).[10] The CDF II Detector Technical Design Report, Fermilab-
Pub-96/390-E; D. Acosta et al., Phys. Rev. D 71, 032001(2005).
[11] S. Klimenko, J. Konigsberg, and T. M. Liss, Fermilab-FN-0741.
[12] A. Abulencia et al. Phys. Rev. D (to be published).[13] T. Sjostrand et al., Comput. Phys. Commun. 135, 238
(2001).[14] G. Corcella et al., J. High Energy Phys. 01 (2001) 010.[15] J. Pumplin et al., Eur. Phys. J. C 12, 375 (2000).[16] P. Avery, K. Read, and G. Trahern, CLEO Report CSN-
212 (1985).[17] M. Mangano et al., J. High Energy Phys. 07 (2003) 001.[18] R. Brun and F. Carminati, CERN Programming Library
Long Writeup W5013 (1993).[19] T. Affolder et al., Nucl. Instrum. Methods Phys. Res.,
Sect. A 526, 249 (2004).[20] G. Grindhammer, M. Rudowicz, and S. Peters, Nucl.
Instrum. Methods Phys. Res., Sect. A 290, 469 (1990).[21] E. Gerchtein and M. Paulini, ECONF C0303241,
TUMT005 (2003).[22] F. Maltoni and T. Stelzer, J. High Energy Phys. 02 (2003)
027.[23] J. Campbell and R. Ellis, Phys. Rev. D 60, 113006
(1999).[24] D. Acosta et al., Phys. Rev. Lett. 94, 091803 (2005).[25] B. Harris, E. Laenen, L. Phaf, Z. Sullivan, and
S. Weinzierl, Phys. Rev. D 66, 054024 (2002).[26] D. Acosta et al., FERMILAB-PUB-04-370-E [Phys. Rev.
D (to be published)].
D. ACOSTA et al. PHYSICAL REVIEW D 72, 032002 (2005)
032002-20