Measurement of the corrosion rate of iron by polarization ...
9
Journal of Resear ch of the National Bureau of Standards Vol. 58, N o. 3, Mar ch 1957 Research Paper 274 6 Measurement of the Corrosion Rate of Iron by Polarization Techniques W. J. Sc hwe rdtfeger Co rr'osion-r ate-meas urin g tec hni q ues pr eviously shown to be appli cable to lo w- ca r bon s tee l ex posed to co rr osive so il s are also shown to a p p ly to low- an d merhu m-carbo n stee ls 111 a s od ium chlorid e so lut io n hav ing a concent r at ion of 2, 000 parts per million. Un li ke the wo rk pr eviously r epo r te d , 1 R dr ops, att ribu tab le to polarizing curre nts, are inc lud ed in the pote ntial meas ur eme nts. . . It is shown h ow co rr osion-r at e measur em ents ca n be made au to maticall y by USIng a sy nc hr onously d ri ven vo lt age div ider a nd a two- pen elect ronic r ecorder. Th e po larizing char acteristics of high-silicon cast ir on when exposed to a 2,009- pa rts- per -m illi o n so dium c hl o ri de solu tIOn \\'e re also st udI ed. It IS shown that t h e COI 'l'OSlon T ate bec omes rel at i vp ly low as the corr osion r eact ion cha nges from cathod ic to a nodi c cont r ol. 1. Introduction Iron a nd steel are the m ost co mmonly used st ruc- tural m ate rials and und er cer ta in co nditions of ex- posure are very susceptible to severe b.y corrosion. In the labor at or y, the ext en t of co rr osion IS usuall y expressed in s ll ch te rms as " we igh t l oss" or "pit depth ," whereas, in the case of perm anent fi eld stru ct ures, visual insp ect ion is prob ably the chief way of evalu at ing damage. i iVhen the degree of corr osion is based on weight loss the test specimens mu st be exposed s uffi ciently Ion; to rend er the cl eaning err ors negli gible in com- p alYso ll with the act ual weigh t losses. Also, in ord er to stu dy the e£l'eC't of ex posure t ime on the rate of C'o rrosion of a gi ve n material, removals of simil ar speC'i mens at several int er vals m ust be resorted to. U nd er t h ese co nditions, the results depe nd on the uniformi ty of the el ectrolyte. If the el ect rol yte is a so il the co rrosion rates of similar sp eC' imens m ay unless the degree of aer at ion around eaC' h is the sam e. On per ma nent ficld stru ct ures, co rrosion produ cts mu st be removed in order to estimate the exten t of C'o rrosion damage. Af ter insp ect ion, unless preven- tive measur es are taken, co rr osion will be r esum ed, tem porarily at least, at an acceler ated rate. Th e forego ing en co urages the search fo r any met hod of measuring co rr osion rate in which the dis- a. cl n llltages discussed above might be Previo us wo rk has shown th at the corr OS IOn rates on small low-carbon steel specimens exposed to soils in the laboratory can be meas ur ed electrically the analysis of polari zat ion curves [1 ]1 During th at in- vestigat ion , weighed d isk s area- 2.4 in. 2 ) were exposed to 6 SO lI s for a p er' lO d oj 2 mon th s. Oa th ocl ic and anod ie polari zat ion cur ves were ob- ta ined on the sp ec imens a.t period ic in ter val s, followed b.\' cleanin g an d reweighin g. On the average, the calc ul at ed weight losses based on the el eetrolytlC measuremen ts and Faraday 's law were wi thin 4 percent of the measured weight losses. I n each of the 6 soils, it was observed th at a relatively co n stant ratio existed between the calcul ate d corrosion cur - rent and a valu e of c Ul'r ent, design ated I p, o b- 1 F igur es in hracket s indicate the literature re fercnces at the end of t b is papcr . ta ined from a br eak (change-in-slope) in the catho di C'- polariz at ion curve. As the co rrosion pr oC'ess was cathodically co ntrolled, the usc of cathodic polariza- t ion , in m eas Ul'in g cor ro si on rate appeared to be ju stifia bl e. Th e simplified ap pr oach 'yas suggested by Pea rson [2] a nd by ,[3]. th at i nvestigat ion [1] this was t n ecl , uS ll1 g one SOlI, a nd fo un d to be satisfactory. Up to the pr esent time, corr osion:r ate measur e- ments based on cat hodic and ano dI C polan zalion have b ee n made wi th null or current-in te r- circ ui ts [1 , 2, 3, 4,5]. Although sucll. cir C' ui ts are n eC'essar,\' when aC'C' ur ate pote n t1 al r ead I ngs are d es ired their use is n ot always necessarv for ob- serv in o" breaks in polari zat ion cur ves. Tile purpose of this" in vest i gat ion is to show, at least for the C'o ndi- tions of the experim en ts, that sub sta n Lially all corr osion can be evalu ate d us in g some wh at m or e simple elect ri cal measuri ngteC'h niq ue.s t it an employed, in wh icb the 1 R dr ops are Incl ud ed JIl t !le p ote ntial measurements. C'aL hodl c- polari zat ion measurements, exclUSiv el y, IS evaluated by measuring the eff ects heat tl:eatment a nd carbon C'o n te n t on the C01'1' OSlO n r ate of C'arb on stee l. The ada p tab ili ty of a duplex el ect ronic r eC'o rder fo], Llse in polari zat ion char acte ri sti C's and measuring rates of co rr osion is also illus tr ated and discussed. 2. Theoretica l Conside rat ions Th e hyp ot h et ical polariz in g of a gal va nic co uple exposed to an of negligible resista nce are sho wn graphl cally lIlfigure 1. Part A shows the polari zat ion of the anode and cat hode of the co uple and part B represen ts t lt e eff ect of extern al C' urr ent on the co uple. The symb ols u se d in this paper arc id entifi ed and d efin ed as follows: Ea= open-cir C' uit potential of the anod e. Ec= open -c ircuit potential of the eat hode. Eg= potential of the couple. io = local act ion or co rr osion current. 1 1' = exter nal cat hodic curr en t applied to the couple when the anode curren t (local-act io n cUlTent ) becomes ze ro. This is the minimuHl cur- re n t req nired for cat hodi c pr otect ion. 145
-
Upload
khangminh22 -
Category
Documents
-
view
3 -
download
0
Transcript of Measurement of the corrosion rate of iron by polarization ...

Journal of Research of the National Bureau of Standards Vol. 58, No. 3, March 1957 Research Paper 2746
Measurement of the Corrosion Rate of Iron by Polarization Techniques
W . J. Schwerdtfeger
Corr'osion-r ate-measuring techni q ues previously shown to be applicable to lo w-carbon s tee l ex posed to corrosive soils a re also s hown to a p ply to low- an d merhu m-carbo n steels 111
a sod ium chloride solution hav ing a co ncentrat ion of 2, 000 par ts per milli on . Un li ke t he wo rk previo us ly r epor ted , 1 R drops, att ribu table to pola ri zing curren ts, are i nc luded in the potent ia l meas ureme nts. . .
It is s hown how corrosio n-rat e meas urement s can be made a uto matically by USI ng a sy nc hrono usly d ri ve n voltage div ider a nd a two-p en elect ro nic recorder.
The pola ri zing characteris t ics of h igh-sili co n cast iro n w hen ex posed to a 2,009-par tsper-m illion sodium chl ori de solu tIOn \\'e re a lso studI ed. It IS show n t hat the COI'l'OSlon Tate becomes r elat ivply low as t he corros ion reaction changes fro m cathod ic to a nodic control.
1. Introduction Iron and steel are the most commonly used struc
tural m aterials and und er cer tain co ndi t ions of expos ure are very suscep tible to severe d amag~ b.y corrosion . In the laboratory, the exten t of corrosion IS usually expressed in sllch terms as " we igh t loss" or "pit dep th ," whereas, in t he case of permanent field structures, v isual inspection is probab ly the chief way of evaluating dam age.
i iVhen the degree of corrosion is b ased on weigh t loss the test specimens must be exposed sufficiently Ion; to render the cl eaning errors negligible in compalYsoll with the actual weigh t losses. Also, in order to study the e£l'eC't of exposure time on the rate of C'o rrosion of a given m ateri al, removals of simil ar speC'imens at several inter vals m ust be resor ted to. Und er these cond it ions, the results depend on the uniformi ty of the electrolyte. If the electrolyte is a soil the co rrosion rates of similar speC'imens m ay cli ff~r unless the degree of aeration around eaC'h is the same.
On perma nent ficld structures, co rrosion p roducts must be removed in order to es t imate the exten t of C'orrosion damage. After inspection , unless pr even t ive meas ures are taken, corrosion will be resumed, temporarily at least, at an accelerated rate.
The forego ing encourages the search for any method of measuring corrosion r ate in which the disa.cl n lll tages discussed above m ight be ~vercome. Previo us work h as shown th at the corrOS IOn rates on small low-carbon steel specimens exposed to so ils in the laboratory ca n be measured electrically b~' the analys is of polarization curves [1]1 During th at investigation, weighed ste~l d isks (exposec~ area- 2.4 in.2) were exposed to 6 SOlIs for a per'lOd oj 2 mon ths. Oa thocl ic and anod ie polarization curves were obtai ned on the spec imens a.t period ic in tervals, followed b.\' cleaning and reweighing. On the average, the calc ulated weigh t losses based on the eleetrolytlC measuremen ts and Faraday's law were wi thin 4 percent of the meas ured weigh t losses. I n each of the 6 soils, i t was observed th at a relatively constan t r atio existed between the calculated corrosion current and a value of cUl'ren t , designated I p , ob-
1 F igures in hrackets indicate the litera ture re fercnces at the end of tb is papcr .
tained from a break (ch ange-in-slope) in the cathodi C'pol arization curve . As the co rrosion proC'ess was cathod ically con trolled , the usc of cathodic polarizat ion , excluslvel~- , in measUl'ing cor rosion rate appeared to be justifia ble. The simplified approach ' yas suggested by Pearson [2] and by ~loll er ,[3]. Dun~g th at investigation [1] this was t n ecl , uSll1g one SOlI, and fo un d to be satisfacto ry .
Up to the prese nt t ime, corrosion:rate m easurements based on cathodi c a nd anodIC polan zali on crll ve~ have b een made wi th null or current-in te rr up tio~ circui ts [1 , 2, 3, 4,5]. Although sucll. cirC'ui ts a re n eC'essar,\' wh en aC'C'urate pote n t1 al read I ngs are desired t heir use is not always necessarv for observ in o" breaks in polarizat ion curves. Tile p urpose of this"in vest igat ion is to show, at leas t for the C'o nditions of the experimen ts, that su bstan Lially all corrosion can be evaluated b~T using somewhat mor e simple electri cal measuri ngteC' h niq ue.s t itan lI ~ u all .\ · employed, in wh icb the 1 R drops are Incl uded JIl t!le pote ntial m easurements. Tlte ~ se o~ C'aLhodl cpolarization measurements, excl USively , IS evalu ated by measuring the eff ects ~f heat t l:eatment a nd carbo n C'o nten t on the C01'1'OSlO n rate of C'arbon steel. The adap tabili ty of a duplex electroni c reC'o rder fo], Llse in stud~'ing polarization characteri st iC's and measuring rates of corrosion is also illus trated and discussed.
2. Theoretical Considerations The hypothetical polarizing ch aracte ris ti e~ of a
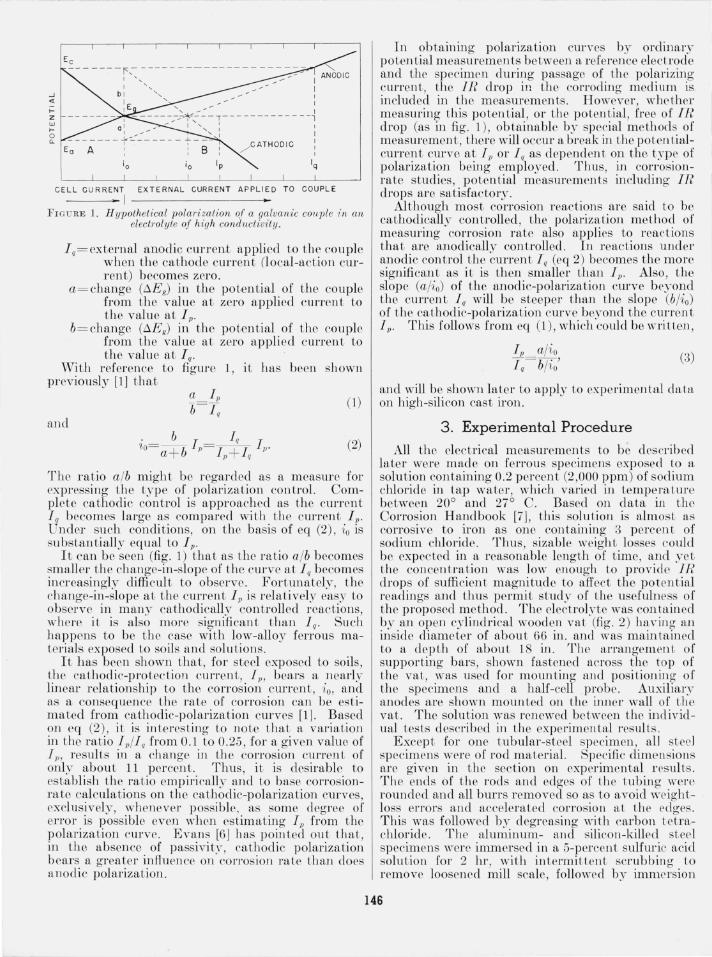
galvanic co uple exposed to an aqu~o u s ~edlUm of negligible resistance are shown graphlcally lIlfigure 1. Par t A shows the polarization of t he anode and cathode of t he couple and par t B repr esen ts t lte effect of external C' urrent on the couple.
The symbols used in this paper ar c identifi ed and defined as follows:
E a= open-cirC' ui t potent ial of the anod e. E c= open-circui t potential of t he eathode. E g= pote nt ial of the couple .
io = local action or corrosion current. 11' = external cathodic curren t applied to the co uple
when the anode curren t (local-action cUlTent) becomes zero. This is t he minimuHl curre n t req nired for cathodi c protect ion.
145
..J .. IZ W Io a.
CELL CU RR ENT EX TERNA L CURR ENT APPLIED T O COUPLE
--- - I ----------FrG lJRE 1. H ypothetical polarization of a galvanic couple 7:n an
electrolyte of high conductivity.
I q= external anodic current appli ed to the couple when the ca thode curren t (local-actio n curren t) becomes zero.
a = change (bEg) in the po tential of th e couple from the value at zero applied curren t to the value at I v'
b= change (bEg) in t he potential of th e couple from th e value at zero appli ed current to the valu e a t I Q•
vVith reference to figure 1, i t has been shown previollsly [1] that
a I p b ~
(1)
and . b I Iq I ~o=a+ b P= I v+ l q po
(2)
The rat io alb migh t be regard ed as a measure for expressing the type of polarization control. Complete ca thodi c control is approached as the curren t I q becomes large as compared with the current I II ' Und er such conditions, on the basis of eq (2), io is substantially equ al to I v'
It can b e seen (fig. 1) tha t as the ratio alb becomes small er th e change-in-slope of the curve a t I q becomes increasingly diffi cult to observe. Fortunately, the change-in-slope a t th e current I v is relativel~T easy to observe in m any cathodically con trolled reactions, where it is also more significan t than I Q • Such happens to be th e case with low-alloy ferrous materi als exposed to soils and solu tion s.
It has been shown tha t, for steel exposed Lo soils, the cathodic-protec tion current, I v, bears a nearly linear relationship to the corrosion curren t, io, and as a consequence the rate of corrosion call be es t imated from cathodic-polariza tion curves [1 ]. Based on eq (2) , it is interes ting to note tha t a \Tariation in the ratio I vlI Q from 0.1 to 0.25 , for a given valu e of I v, resul ts in a change in the corrosion CUlTen t of only about 11 percent. Thus, i t is desirabl e to establish the ratio emp irically and to base corrosionrate cal cula tions on th e ca thodic-polariza tion curves, exclusively, wheneve r possible, as some degree of error is possible even when estimating I p from the polariza tion curve. Evans [6] has pointed ou t that, in the absence of passiv it~- , cath odic polarization b ears a greater influence on corrosion rate than does anodic polarization .
In ob taining polarization curves by ordinary poten t ial measuremen ts between a reference electrode and the specimen during passage of the polarizing cLirren t , the IR drop in the corroding medium is included in the measuremen ts. However , whether measuring this potential , or th e potential, free of IR drop (as in fig. 1), ob tainable by special method s of measuremen t , there will occur a break in the potcn tialcurren t curve at I v or 1Q as dependent on the type of polarization being employed . Thus, in corros iollrate studies, potential measurements including IR drops are satisfactory.
Although most corrosion reactions are said to be cathodically controlled, the polariza tion method of measuring corrosion rate also applies to reactions tha t are anodically controlled . In rea,ctions under anodic control the curren t I q (eq 2) becomes the more significant as it is then smaller than I p. Also, the slope (a/io) of the anodic-polarizat ion curve beyond the curren t I q will be steeper than the slope (blio) of the cathodic-polarization curve beyond the CLiLTen t I p. This follows from eq (1), which could be written ,
I p a/io I~= blio' (3)
and will be shown later to apply to experimental da ta on high-silicon cast iron .
3. Experimental Procedure
All the electri cal measurements to be desc ribed later were made on ferrous specimens exposed to a solution con taining 0.2 percen t (2,000 ppm) of sodium chloride in tap water , which varied in temperature between 20° and 27° C . Based on data in the Corrosion H andbook [7], this solution is almost as corrosive to iron as on e containing 3 percen t of sodium chloride. Thus, sizable weigh t losses could be expected in a reasonable length of time, and ye t the concentrat ion was low enough to provide 1R drops of sufficient magnitud e to affec t the poten tial readings and thus permi t stud y of the usefuln ess of the proposed me thod . The electrol~- te was conta ined b~T an open c~-lindrical wooden vat (fig. 2) ha\-ing an inside diameter of about 66 in. and was m aintained to a dep th of abou t 18 in . The arrangemen t of supporting bars, shown fastened across the top of the vat, was used for mounting and positioning of the specimens and a half-cell probe. Auxiliary anod es are shown mounted on the inner wall of the vat. The solution was renewed between the indi vidual tes ts described in the experimen tal results .
Except for one tubular-steel specimen, all steel specimens were of rod material. Specific dimensions are given in th e section on experimental n sults. Th e ends of the rod s and edges of the tubing were rounded and all burrs removed so as to avoid weigh tloss errors and accelerated corrosion a t t he edges. This was followed by degreasingwith carbon te trachloride. The aluminum- and silicon-killed steel specimens were immersed in a 5-percen t sulfuric acid solution for 2 hI' , with intermi tt ent scrubbing to remove loosened mill scale, followed by immersion
146
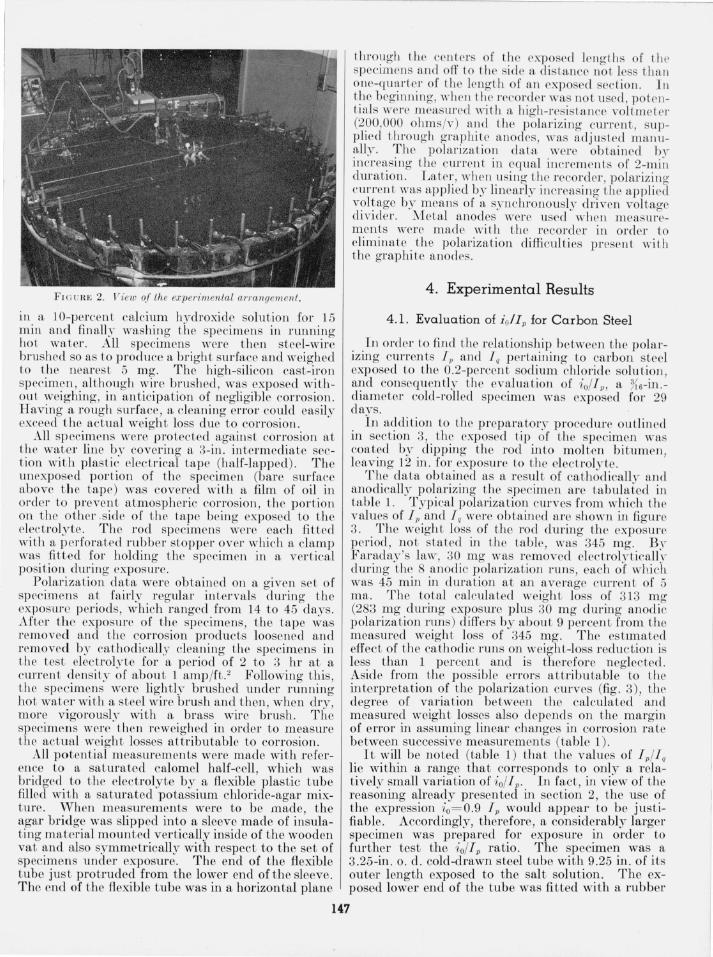
FI GURE 2. 1'iew of the expe1'imental arrangement.
in a 10-percent calc ium hydroxid e solu tion for 15 min and finaIl.'" washing t he specimens in funnillg hot water. All specimens were then steel-wire brushed so as to produce a brigh t surface and weighed to t he nearest 5 mg. The high-silicon cast-iron specimen, although wire brushed, was exposed without weighing, in an ticipation of negligible corrosion. Having a rough surface, a cleaning error could easil~T exceed the actual weight loss due to corrosion .
All specimens were protected against corrosion at t he water line b.\T coverin g a 3-in. intermediate section with plastic electrical tape (half-lapped). The unexposed portion of the specimen (bare surface above t he tape) was covered with a film of oil in order to preve nt atmosp heric corrosion , t he portion on t he other .side of t he tape being exposed to t he E'lectrolyte. The rod specimens were each fitted with a p erforated rubber stopper over which a clamp was fitted for holding t he specimen in a vertical position during exposure.
Polarization data were obtained on a given se t of specimens at fairly regulari n tervals during the exposure periods, which ranged from 14 to 45 da,ys. After t he exposm e of the specimens, the tape was removed and t he corrosion products loosened and removed by cathodically cleaning the specimens in the test electrol~~ te for a period of 2 to 3 hr at a current densit~~ of about 1 amp/ft. 2 Following this, the specimens were ligh tly brushed under running hot water with a steel wire brush and then, when dry, more vigorously with a brass wire brush . The specimens were then reweighed in order to measure t he actual weight losses attributable to corrosio n.
All poten tial measuremen ts were made with reference to a saturated calomel half-cell, which was bridged to t he E'lectrolyte by a flexible plastic tube filled with a satmated potassium chloride-agar mixture. When measurements were to be made, the agar bridge was slipped into a sleeve made of insulat ing material mounted vertically inside of the wooden vat and also symmetrically with respect to the set of specimens under exposure. The end of the flexible tube just protruded from the lower end ofthe sleeve. The end of t he flexible tube was in a horizontal plane
througll Lhe ce uters of LllC exposed length of the specimens and off to the side a distance not less than one~quarLe.J' of Lhe length of an exposed section . III the beglllnmg, when the recorder was not used, potentials were measured with a high-resistance voltmeter (2.00,000 ohms/v) a l.ld the polariz ing current, suppl ied t hrough graplute anodE'S, was adjusted manually. The polar izat ion data were obtained b,' increasing the cunent in equal increments of 2-mi;1 durat ion. Later, when using the recorder, polarizing current was applied by linearly increasing the applied v?l~age by means of a synchronously driven voltage dIVIder. .Metal anodes were used when measurements were made with the recorder in order to eliminate the polarization difficulties prese nt with th e graphite anodes.
4. Experimental Results
4.1. Evaluation of iolI." for Carbon Steel
In order to find the relationship between the polarizing curren ts / 11 and 1 q pertaining to carbon steel exposed to the 0.2-percents odium chloride solu t ion , and consequently the evaluation of io// p, a ~\6-in .diameter cold-roll ed specimen \\"as exposed for 29 days. .
In addition to the preparatory procedure outlined in section 3, the exposed tip of the specimen was coated by dipping the rod into molten bitumen leaving 12 in . for exposure to the electrolyte. '
The data obtained as a resul t of cathod ically and anodically polarizing the specimen a re tabulated in table l. Typical polarization cllrves from which the values of I v and Jq were obtained are shown in figure 3" The weigh t loss of the rod during the exposure period, not sLated in the table, was 345 mg. B," Fara.da~"'s law, 30 mg was removed electrolyticall~~ during the 8 anodic polarization runs, each of which was 45 min in duration at an average current of 5 rna. The total calculated weight loss of 313 mg (283 mg during exposure plus 30 mg during anodic polarization r11ns ) differs by about 9 percent from t he measured weight loss of 345 mg. The estImated effect of the cathodic runs on weight-loss reduction is less than 1 percent and is therefore neglected. Aside from the possible errors attributable to the interpretation of the polarization curves (fig. 3), the degree of variation between the calculated and measured weight losses also depends on the margin of error in assuming linear changes in corrosion rate between successive measurements (table 1).
It will be noted (table 1) that the valu es of I p/I q lie within a range that corresponds to only a relatively small variation of io/I p. In fact, in view of the reasoning already presented in section 2, the use of the expression io= 0.9 I p would appear to be justifiable. Accordingly, therefore, a considerably larger specimen was prepared for exposure in order to further test the io/I ." ratio. The specimen was a 3.25-in . o. d. cold-drawn steel tube with 9.25 in. of its outer length exposed to the salt solution. The exposed lower end of the tube was fitted with a rubber
147
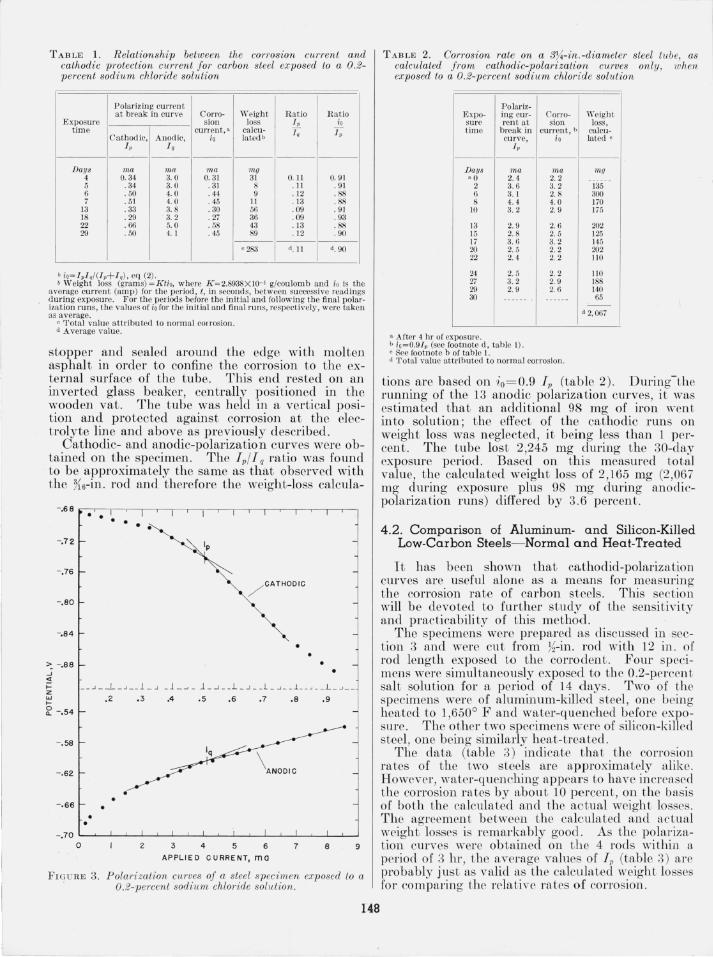
TABLE 1. R elationship between the corrosion CU1'Tent and cathodic protection current / 01' carbon steel exposed to a 0 .2-percent sodium chloride solution
Polarizing current at break in curve Corro- Weigh t R a Lio R a t io
E xposure sion loss Tp io time currcnt,a calcu- To 1;,
Cathodic, Anodic, io lated b Jp I .
------ ------------Days ma ma ma my
4 0.34 3.0 0.31 31 0. 11 0. 91 5 . 34 3. 0 .31 8 . 11 . 91 6 . 50 4.0 .44 9 . 12 .88 7 . 51 4.0 . 45 11 . 13 .88
13 . 33 3.8 . 30 56 . 09 . 91 18 . 29 3.2 .27 36 . 09 . 93 22 .66 5.0 . 58 43 .13 . 88 29 . 50 4. 1 . 45 89 . 12 . 90
--- ------c 283 d. ll d. 90
b io= I pI./(lp+ J.) , eq (2) . b Weight loss (grams)= K tio, where K = 2.8938X lO-' g/coulomb and io is the
average current (amp) for the period, l, in second s, between successive readings during exposure. For the periods before tbe initial and followin g the fina l pola rization runs, the values of io for the initial and final runs, respect h'ely, were taken as average.
o Total value attributed to normal COl rosiol1 . d Average value.
stopper and sealed around the edge with molten asphalt in order to confine the corrosion to the external surface of the tube. This end rested on an inverted glass beaker, centrally positioned in the wooden vat. The tube was held in a vertical position and protected against corrosion at the electrolyte line and above as previously described .
Cathodic- and anodic-polarization curves were obtained on the specimen . The I p/I q ratio was found to be approximately the same as that observed with the Ji6-in. rod and therefore the weight-loss calcula-
-.72
- .76
-.80
- .84
":. -.88 ...J
~ .... z w .... )( - .54
- .58
- .62
- .66
. . .
.2 .3
/ CATHODIC
.4 .5 .6 .7 .8 .9
- .70 I.-......... ....l...--'-_L...-..L..-...L-L---l._'--L--...I----L---'_.L--'--'----'---'
o 2 3 4 5 6 7 8 9
APPLIED CU RRENT, ma
FI G URE 3. Polarization curves of a steel specimen exposed to a 0.2-percent sodium chloride solution.
148
TABLE 2. Corrosion rate on a 3~~-in. -diameter steel tube, as calculated from cathodic-polarizativn curves only, when exposed to a 0 .2-pe1·cent sodium chloride solution
Polariz-Expo- ing cur-sure ren t at tim e break in
curve, I .
------
Days ma - 0 2.4
2 3.6 6 3. I 8 4.4
10 3.2
13 2.9 J5 2.8 17 3.6 20 2.5 22 2.4
24 2. 5 27 3.2 29 2. 9 30
a. A ftcr 4 hI' of exposure . b ;, =0.9/p (see footnote d, table I). o Sec footnote b of ta ble 1.
Corro-sion
current, b io
---
ma 2.2 3.2 2.8 4.0 2.9
2.6 2.5 3.2 2.2 2.2
2.2 2. 9 2.6
d Total value attributed to normal corrosion.
Weight loss,
calcu-laLed 0
---
my
135 300 liO J75
202 125 145 202 110
ItO 188 140 65
d 2, 067
tions are based on io= O.9 I p (table 2). During-the running of the 13 anodic polarization curves, it was estimated that an additional 98 mg of iron wen t into solution; the effect of the cathodic runs on weight loss was neglected , it being less than 1 percent. The tube lost 2,245 mg during the 30-day exposure period. Based on this measured total value, the calculated weight loss of 2,165 mg (2,067 mg during exposure plus 98 mg during anodicpolarization runs) differed by 3.6 percent.
4.2. Comparison of Aluminum- and Silicon-Killed Low-Carbon Steels- Normal and Heat-Treated
It has been shown that cathodid-polarization curves are useful alone as a means for measuring the corrosion rate of carbon steels. This section will be devoted to further study of the sensitivi ty and practicability of this method .
The specimens were prepared as discussed in section 3 and were cut from H-in . rod with 12 in . of rod length exposed to the corrodent. Four specimens were simultaneo usly exposed to th e 0.2-percen t salt solution for a period of 14 days. Two of the specimens were of aluminum-killed steel, one being heated to 1,650° F and water-quenched before exposure. The other two specimens were of silicon-killed steel, one being similarly heat-treated .
The data (table 3) indicate that the corrosion rates of the two steels are approximately alike. However, water-quenching appears to have increased the corrosion rates by about 10 percen t, on the basis of both the calculated and the actual weight losses. The agreemen t between the calculated and actual weight losses is remarkably good . As the polarization curves were ob tained on the 4 rods within a period of 3 hI', the average values of I p (table 3) are probably just as valid as the calculated weight losses for comparing the relative rates of corrosion .
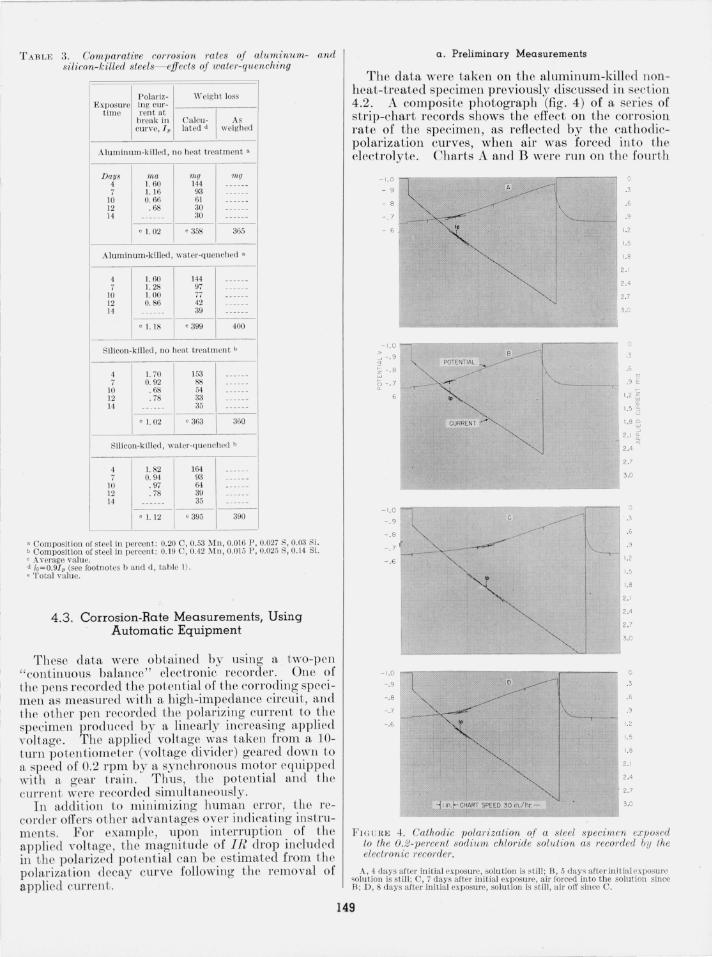
TABLE 3. Comparative corrosion rates of aluminum- and silicon-killed steels- effects of wQ,ter-quenching
P olariz- II' eight loss Exposure ing CUI' - 1---_---
timo ren t at I break in Calcu- As curve, 1'P Iatcd d weighed
A1uminllm-ki llcd, no heat treatment a
Da,vs ma my my 4 I. 60 144 i 1.16 93
10 0.66 61 12 .68 30 14 30
---------, I. 02 • 358 365
Alumi_llum-kUled , water-quenched a
4 i
10 12 14
1. 60 1. 28 1. 00 0.86
, 1. 18
144 9i ii 42 39
• 399 400
SilicolJ·killed , no heat treatment b
4 i
10 12 14
I. 70 0.92
. 68
. 78
c 1. 02
153 88 54 33 35
:J60
Silicon.killed, water-quenched b
4 7
10 12 14
1. 82 0.94
. 97
. 78
c 1. 12
164 93 64 39 35
390
• Composition of steel ill percent: 0.20 C, 0. 53 Mn , 0.016 P, 0.02i S, 0.03 Si. b Composition of steel in percent : 0.19 C, 0.42 Mn, 0.015 P , 0.025 S, 0.14 Si. c A "crage value. d io= 0.9/. (sec footnotes band d, table I) . • Total value.
4. 3 . Corrosion-Rate Measurements, Using Automatic Equipment
These data were obtained by using a two-p en "continuous balance" elec tronic recorder. One of the pens recorded the potential of the corroding specimen as measured with a high-impedance circuit, and the other pen recorded the polarizing current to t he specimen produced by a linearly increasing applied voltage. Th e applied voltage was taken from a 10-tum po tentiometer (voltage d ivider) geared down to a speed of 0.2 rpm by a synchronou s motor equipped with a gear train. Thus, t he potential and t he CUl'l'en t were recorded simultaneously.
In addition to minimizing human enol', the recorder offers otber advantages over indicating instruments. For example, upon intenuption of the a,pplied voltage, t he magnitude of IR drop includ ed in the polarized potential can be estimated from the polarizat ion decay curve following the removal of applied CUl'rent.
a . Preliminary Measurements
The data were taken on the aluminum-killed Ilonheat-treated specimen previously discussed in section 4.2. A composite photograph (fig. 4) of a series of strip-chart records shows the effect on the corrosion rate of t he specimen, as reflected by the catbodicpolarization curves , when ail' was forced into the electroly te. Charts A and B were ru n on the fOUl'th
- 1. 0
- 9
- B
-1 .0 :-.--------~----r---....... --., > <1 - . 9
§ ' . 8
~ - . 7
-1 .0 -
POTENTIAL _
,-/"""
CURRENT ,.......
B --
C
Y - . 9
-.B
- . 7 r - .6
Ip
I\.. --- ,
- 1.0 _r---~"?-------""----- .9
- .B
- . 7 , .~~:>.r-"" - .6
-{lln .t-CHART SPEED 30 on.lhr.-
.3
.6
.9
1.2
1.5
I.B
2 . 1
2.4
2.7
3.0
1.2
1.5
I.B
2 . 1
2.4
2.7
3 .0
.3
.9
1.2
1.5
I.B
2 . 1
2.4
2.7
3.0
.3
.6
.9
1.2
1.5
1.8
2 , 1
2.4
2.7
3.0
FIG U RE .}. Cathodic po/al'ization of a steel specimen exposed to the O.2-percent sodium chlol'ide solution as l'ecol'decl by the electronic recordel'.
A, ~ days after initia l exposure, solu tion is stU) ; H, 5 days afLerinit.ial exposurc I;)Oi llt lOil is st ill ; C, 7 days afte r initia l exposure, air forced into t he sol u tion s ince D; D , 8 days after initial exposure, solu tion is still , air off since C.
149
-1 .0 > <i -.9
§ -.8
~ -.7
-.6
> i .3 , ~ .2
t:l .I ' ;'! <5 0
POTEN'"lAL __ .. of"
CURRENT ..-
I ..
'1 •
1 .3
.6 o
.9 E r
1.2 i 1.5 :::J
u
1.88 ::0
2.\ §::
2.4
2.7
3 .0
.3
.6
«
.9 E. r
1.2 ~ 1.5 <3
1.8 8 ::0
_--.-----' 2 . 1 fr «
2.4
2.7
3 .0
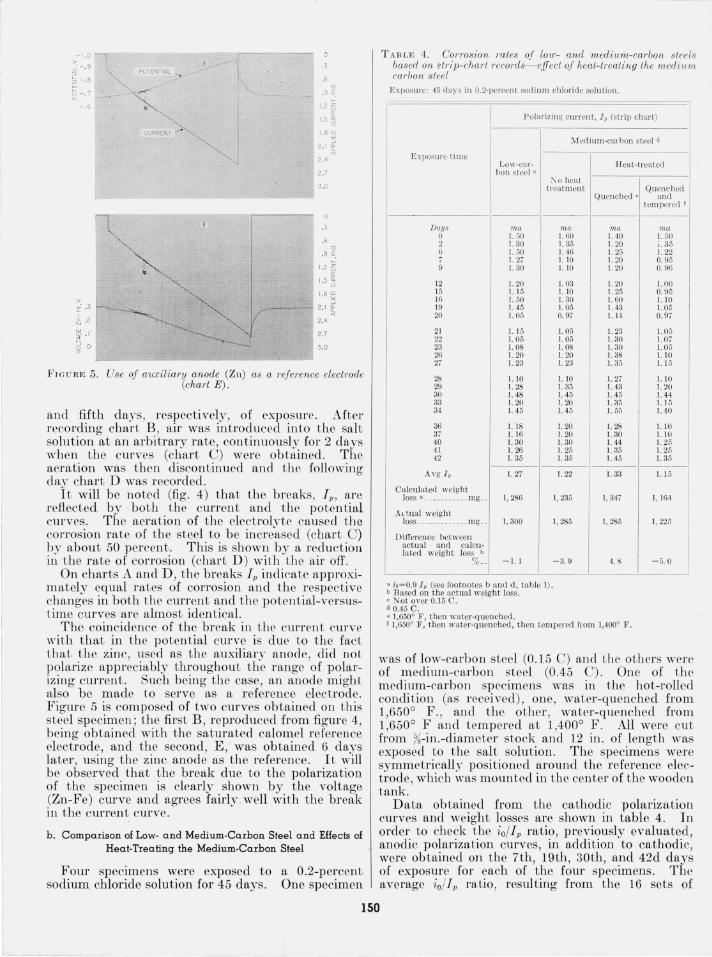
> ~-------------------------------Fl G U RE 5. Use of auxiliary anode (Zn) as a reference eleclrode
(chari E ) .
and fift h days , r espectively, of exposure . . After recording chart B , ail' was int roduced into the salt solut ion at an arbitrary rate , continuously for 2 days when t he curves (char t C) were obt ained . The aera tion was then discontinued and t he following day chart D was recorded .
It will be no ted (fig. 4) that t he breaks, Iv, are refl ect ed by both . t he current and the potent ial curves. The aeratlOn of the electrolyte caused the corrosion rate of the steel to be increased (chart C) by about 50 percent: This is showr: by a reduction in t he rate of corroslOn (chart D ) wIth t he all' off.
On charts A a nd D , the breaks Iv indicat e approxim ately equal rates of corrosion and t he !'espective changes in both t he current and t he poten twl-versust ime curves are almost ident ical.
The coincidence of t he break in the curren t curve with t hat in t he potential curve is due to the fact that the zinc, used as th e auxiliary anode, did no t pol arize appreciably th~'oughout the range of p~larizing current. Such bemg the case, an anode mlght also be made to serve as a reference electrode. Figure 5 is composed of two curves obtained on this steel specimen ; the first B , reproduced from figure 4, being obtained with the saturated calomel reference electrode, and th e second, E , was obtained 6 days la ter , using t he zinc anode as t he reference. .It ,:VIII be observed that the break due to the polanzatlon of t he specimen is clearly shown by t he voltage (Zn-Fe) curve and agrees fairly well with the break in the curren t curve.
b. Comparison of Low· and Medium·Carbon Steel and Effects of Heat·Treating the Medium·Carbon Steel
Four specimens were exposed t o a 0.2-percen t sodium chloride solution for 45 days. One specimen
T ABLE 4. Corrosion rales of low- and medium-carbon sleels based on slri p-chaTt Tecords- effect of heat-treating the medium raJ'bon steel
Exposure : 45 d ays in 0.2·percent sodi u m chloride solution.
Polarizing cWTent, I p (s t r ip chart)
M ediu m·carbon steel d
Exposure time Lo\\,·car· Heat·treated
bon steel c
"0 heat treatment Quenched
Quenebed • a nd tem pered f
Days ma ma ma ma 0 1. 50 1. 60 1. 40 1. 50 2 I. 30 1. 35 1. 20 ;. 35 6 l. 50 I. 46 1. 25 1. 22
I. 27 1.10 1. 20 0. 95 I. 30 1. 10 1. 20 0.96
12 1. 20 1. 03 l. 20 1.00 15 l. 15 1. 10 1. 25 0.95 16 1. 50 1. 30 I. 60 1.10 19 1. 45 1. 05 1. 43 1. 05 20 I. 05 0. 97 1. 14 0. 97
21 1. 15 1. 05 1. 23 1. 05 22 1.05 1. 05 1.30 1.07 23 1.08 1. 08 1.30 1. 05 26 1. 20 1. 20 1. 38 1. 10 27 1. 23 I. 23 1. 35 1.15
28 1.10 1. 10 I. 27 I. 10 29 1. 28 1. 05 1. 43 1. 20 30 1. 48 1. 45 1.45 1.44 33 I. 20 1. 20 I. 35 1.15 3{ 1. 45 1. 45 1. 55 1.10
36 1.18 1. 20 1. 28 1.10 37 1. 16 1. 20 1. 30 1.1 0 40 1. 30 1. 30 1. 44 1.25 41 1. 26 1. 25 1. 35 1. 25 42 1. 35 1. 35 1. 45 1. 35
--------------A\'g I . 1. 27 1. 22 1. 33 1.15
Calcu lated weight loss • ........... m g .. 1, 286 1, 235 1,347 1, 164
ALt ual weight loss ... .......... mg .. 1, 300 1, 285 1, 285 1, 225
D ifference between ac t ua l and calcu · la t ed weight loss b
% .. - 1. 1 -3. 9 4. 8 -5. 0
• io= 0.9 I . (see footnotes b and d , table 1). b Based on t he actual weight loss. o N ot over 0.15 C. d 0.45 C . ' 1,650° F , t ben \\·ater·quench ed . f 1,650° F , t hen water·quen ched , t ben tempered [rom 1,400° F .
was of low-carbon steel (0.15 C) and the others were of medium-carbon steel (0.45 C) . One of th e medium-carbon specimens was in t he ho t-rolled condition (as received), one, water-quenched from 1,650° F. , and the other , water-quenched from 1 650° F and tempered at 1,400° F . All were cu t f;'om %-in.-diameter stock and 12 in. of length was exposed to t he salt solution. The specimens were symmetrically positioned around t he reference electrode which was mounted in the cen ter of the wooden tank '
Data ob tained from the cathodic polarization curves and weigh t losses are shown in table 4. In order to check the io/Iv ratio, previously evaluated, anodic polarization curves, in addit ion to cathodic, were ob tained on the 7th, 19th , 30th, and 42d days of exposure for each of the foUl' specimens. The average io/l p ratio, resulting from the 16 se ts of
ISO

data, was again approximately 0.9 , ranging from 0.88 to 0.92. The calculated weigh t losses (table 4) are based on the average values of 11" as measurements were m ade frequen tly. The net effect of bo th cathodic and anodic polarization on the weight losses was estimated to be less than 1 per cent and therefore is neglected.
The differences in the corrosion rates of the specimens, both actual and calculated, must be considered negligible with possibly the exception of the tempered specimen . These and previous measurements seem to indicate that variations in values of 11) as low as 10 percen t can be considered as revealing significant differences in rates of corrosion when the control of the corrosion reaction is within the limi ts previously described.
c. Measurements on High·Silicon Cast Iron
High-silicon cast iron is known for i ts good corrosion resistance in many aqueous environments. The material is not machinable and comes fabricated only in the form of cas tings. Because of these characteristics, accurate corrosion weight-loss measurements canno t be made when high-silicon cast iron is exposed for relatively short periods of time, but thc polarization technique of corrosion-rate measurement would appear to be par-Licularly adaptable.
A specimen of high-silicon cast iron (Duriron), iJl the form of an anode ordinarily sold for usc in cathodic protection, was exposed to a 0.2-perccnt sodium chloride solution for a period of 28 days, during which time the polarizing characteristics of the material were studied. The specimen had a diameter of 1 in ., and 12 in . of i ts length was exposed to the electrolyte. Contrary to the behavior of carbon steel, the potential of the high-silicon cast iron started to change toward more caLllOdic valu es after having been exposed for 1 hr.
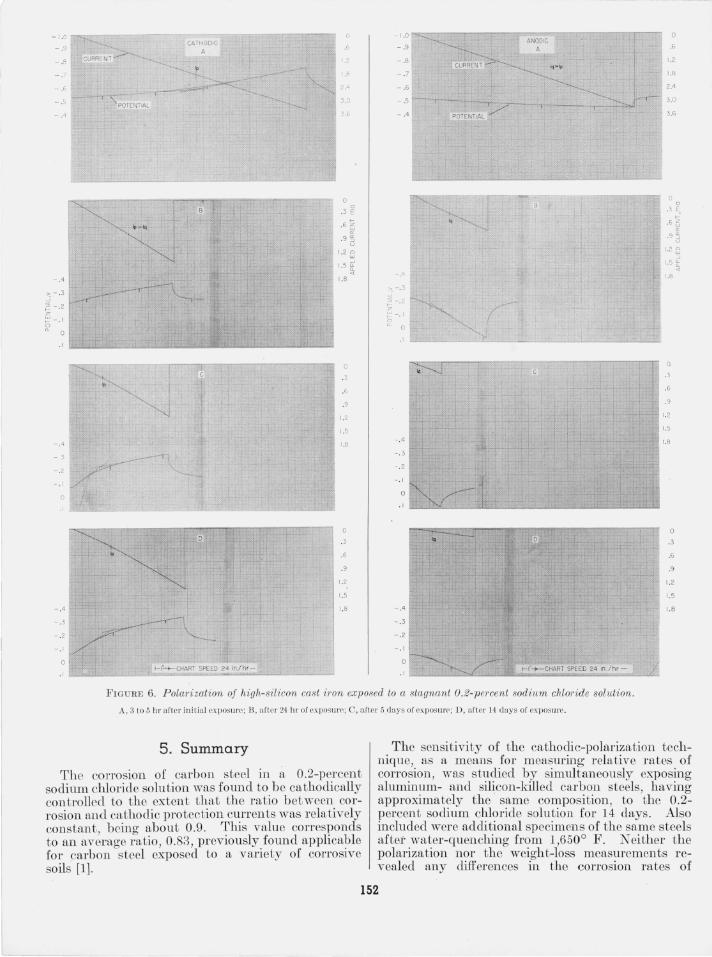
Cathodic and anodic polarization curves recorded eluring the first 14 days of exposure arc shown in figure 6. The cathodic curve A was obtained after the specimen had been eA'}Josed for 3?~ hr. Then , af ter a lapse of another 2 hI', allowed for the decay of the cathodic polarization, the anodic curve A was recorded. The break in the cathodic-potential curve, A , occlUTed at a ClUTent I p of 1.8 rna, whereas no break appeared in the corresponding anodicpotential ClU've for the range of applied currents shown. This initial set of curves is typical of thosc for carbon steel in that the cathodic polarization is greater than the anodic polarization, and the magnitude of 11) is about what would be expected for the exposed area in volved. There was visible evidence of a faj dy high corrosion rate during the first 24 hr in the form of rust, which commenced to appear around the high-silicon cast iron a few hours after exposure. The action is considered normal for this material during the early stages of exposure. The change in potential toward more cathodic values con tinu ed and ill 24 hr amounted to approximately 0.3 v , at which t ime the second pair of curves, B , was obLained. It will be observed tha t anodic
414438- 57--3 151
polarization now occurs at a greater rate than on the previous day and that the corrosion reaction i now anodically controlled (table 5). Thus, the corrosion rate is now determined chiefly by the break in the anodic-potential curve as evaluated by the current I q. The slope of the anodic-poten tial curve now becomes steeper at curren ts greater than I q ,
whereas when the reaction was cathodically controlled (curves A) the slope of the cathodic po tential curve became stceper at currents greater than 11)'
T ABLE 5. Polarization-curve data on high-silicon cast iron exposed to a O.2-percent sodium chloride solution
Polarizing CUITcn t Slope' Expos ure Cun'c Corros ion
t ime ( fig. 6) potential cathodic. anodic, cathodic. anodic,
Jp f, b/ io a/io - --- ------------
Da!ls v rna rna. l1w/ma mv/m(£ 0.2 A - 0.530 1. 80 > 1.80 100 14 1 n -. 235 > 0. '10 0.40 80 480 5 C -.075 .30 . 05 H7 700
14 I) -.060 .40 . 05 115 960
• Seo LI10 toxt.
The next set of polarization curves , C, were obtained after 5 days of exposure. It will be noted th at the corrosion potential had changed still farther in th e noble direcLion and that the corrosion rate as indicated by the CUlTen t Jq is even smaller than previously. Thefu1al set of curves, D , shown in fi.gure 6, were run on the 14th day of exposure. The corrosion potential is about the same as it was on the 5th day of exposure, ns is the co rrosion rate. Curves, not shown, were again obtained on the 28th day of exposure when breaks in the potential cur ves appeared at subsLanLially Lhe same val ues of current as revealed by curves D . The specimen Wfl S then removed from the salt solu Lion . The liLtle eyielence of rust was readily removed wiLh a wire brush .
That eq (3) is fairly well substantiated by the resul ts obtained from the polarization curves is shown by the data (table 5). This is particularly so for tlte clatfl. from curves C and D w]l el"e values are given for both I p and I q. Excessive IR chop, if in cluded in the polarized potenLinls, would disturb the relation, but in the experiment under disc ussion iL can be seen that the IR component, as can be estimated from th e decay curves (fig. 6) following Lhe removal of polarizing current, was only a small par t of the po tential change.
As previously mentioned, the values of 11) and I Q from curves D (table 5) represenL a condi tion th at is substantially stabilized for longer periods of exposure. Therefore, by substi tuting these values of I p and Iq into eq (2) and using the resul tant value of io in Ffl.raclay's equation, the weight-loss equivalent :figures out to be n.bou t 0.055 (oz/W) /yr . That this is a realistic value can be judged by comparing it with weigh t-loss measurements on high-silicon cast iron made by Logan [8] after approximately 12 years of underground exposure. The average weight loss was 0.031 (oz/ft2)/yr on specimens buried in 35 soils ranging in resistivity from 60 to 45,000 ohm-cm.
-J .0
-D A ,
- .8 CURRENT~ ~---.
1.2
- , J .6
- ,6 ~-"J;''';;:;::'''.i<''rc 2.4
-.' "POTENTIAL 3 .0
-,4 3.6
0
.3
.6
.9
1.2
1. 5
-.4 1.8
- .3
- .2
-. 1
.3
.6
.9
1.2
1.5
-.4 1.8
- 3
- .2
- . 1
0
.3
.6
.9
1.2
1.5
-.4 1.8
- .3
- .2
- . 1
I-J~CHART SPEED 24 In.lh r -
- .8
-.7
- .5
- .5
- .4 POTENTIAL
-.4
- , - .2
- . I
0
.1
- .4
- . 3
- .2
- . 1
0
- .4
- .3
- .2
- . 1
. 1
ANODIC
,,'Ip
j-I"-+-CHART SPEED 24 In'/hr-
0
.5
1.2
1.8
2.4
3.0
3.5
.3
.6
.9
1.2
1.5
1.8
o .3
.5
.9
1.2
1.5
1.8
FIGURE 6. Polal'i zation of high-silicon cast iron exposed to a stagnant O.2-percent sodium chlO1'ide solution.
A , 3 to 5 hI" aftor init ial exposure; B , after 24 hI" of exposurr; 0, a fter 5 da.ys of exposurr ; D, after 14 d"lYS of exposure.
5. Summary
The corrosion of carbon steel in a 0.2-percent sodium chloride solution was found to be cathodically controlled to the extent that the ratio between corrosion and cathodic protection currents was relatively constant, being about 0.9. This value corresponds to an average ratio, 0.83, previously found applicable for carbon steel exposed to a variety of corrosive soils [1].
The sensitivity of the cathodic-polarization technique, as a means for measuring relative rates of corrosion, was studied by simultaneously exposing aluminum- and silicon-killed carbon steels, having approximately the same composition, to the 0.2-percent sodium chloride solution for 14 days. Also included were additional specimens of the same steels aftei' water-quenching from 1,650° F. N either th e polarization nor the weight-loss measurements revealed any differences in the corrosion rates of
152
al uminum-killed 01' silicon-kill ed sleel specimens, but both methods or meaSllrement showed that quenching presumably caused lhe rates of corrosion to be slightly increased.
The use of polarization curves for measuring rates of corrosion is also shown by strip chart records made with a two-pen electronic recorder. Preliminary measurements illustrated Lhe effect of increasing the rate of corrosion of carbon steel exposed to a 0.2-percent sal t solution when air was bubbled in to the electrolyte. Zinc used as the auxiliary anode was also found to be sa tisfactory as a rpference elec trode for the range of polarizing curren t involved.
The sensitivity of polarization curves in measuring rates of corrosion was further explored by using automatic equipment for recording the cathodic polarization on simultaneously exposed low and medium carbon steels. Some of the medium carbon pecimens were heat-treated before exposure. The
corrosion rates calculated from the polarization curves were within ± 5 perce nt of Lhe cor rosion rates shown by th e actual weight losses.
Upon exposing a specimen of high-silicon cast iron to the 0.2-perce nt sodium chloride solution, th e control of the corrosion reaction was observed to shift from catbodic to anodic within a p eriod of 24 hI' ; automatic recording equipment was used. After 14 days of exposure , the corrosion rate appeared to be quite stable; and, based on breaks in the polarization curves, chi efly the anodic curves, the corrosion rate was estimated as being abou t 0.055 (oz /ft2) /yr. This value is shown to be comparable to the corrosion rate of t he same material based on 12 years of und erground exposure, thus showing the value of polarization curves ill quickly estimating rates of corrosion that could not be measured accurately by weight loss for sbort periods of exposure.
It is not suggested t hat t he measurement of polarizalion curves be used as a substitute for
lon g-time-exposure Le t , as one is unable Lo extrapolate wit h a high degree of cer tainty t he corrosion rates over long period of t ime. However , iL i believed t hat the polarization technique of C01"1"OS[OI1 -rate measurement is a good way of screenin g mater ials for u nderground- or marine-exposure s tudies.
The author expresses his thanks to William T . Bryan of the Duriron Co. and to Samuel Epstein of t he Research Department of the Bethlehem Steel Co. for supplying some of the materials for specimens, and to Carl R. Johnson of the Thermal ;"1etallurgy Section , National Bureau of Standards, for heat-treating specimens used in this investigation.
6 . References
[ll \Y. J . Schll·crd tfcger a nd O. ::-J . :\IcDorman , TI'fcasurcll1cnt of thc corrosion rate of a mctal from it polari zing charactr ristics, J . E lcctrochcm. Soc. 99,407 (1952).
[21 J . M. P ca rso n, "~ ull" mcthods applicd to co rrosion meas uremcnts, Trans. E lcct roc hcm. Soc. 81, 485 ( 1942).
[3] H . D . H oll cr , Stud ies on galva lli c co uplcs. I & II . Som c potcntial-cu rrent rclations ill galva ni c corros ion , J . Elcctroc hcm. Soc. 97 , 27 L (1950); a lso Co rrosion 7, 52 (1951).
[4] P . A. Johnson and A. L. Babb, Th erm odynamics of .ilTevcrsiblc proccsses app li ed to corros ion, Ind . Eng. Chcm. 46, 518 (Mar. 3 J, L954).
[51 w. J . Sc hll·crdtfcgcr, E lectr ical m easurcment s in t hc sclcction of bolt matcrials for scrvi ce uncIPrgrou rid , J . R escarch NBS 52, 265 (1954) RP2499.
[6] U. It. Evans, ;\Ietalli c corrosion , passiv ity, and protect ion (Longmans, Grccn, & Co., New York, N. Y. , 19LJ6).
[7] Corrosion H an dbook, E lcctrochcmical Soc icty, p. 131 (J ohn VITi ley & Sons, Inc. , Ncw York , N . Y. , 1948).
[8] K . H . Logan , Soil-corrosioll studics, 1984. R ates of loss of \\"cight and pi tting of fcrro Ll s specimens, J . R esearch NBS 16, (:\Iay 19:36) RP883
, VASHIKGTO);!, October 19, 1956.
41443 -57--4 153