Measurement of inclusive jet cross-sections in deep-inelastic ep scattering at HERA
21
arXiv:hep-ex/0206029v1 12 Jun 2002 DESY 02-079 ISSN 0418-9833 June 2002 Measurement of Inclusive Jet Cross-Sections in Deep-Inelastic ep Scattering at HERA H1 Collaboration Abstract A measurement of inclusive jet cross-sections in deep-inelastic ep scattering at HERA is presented based on data with an integrated luminosity of 21.1 pb −1 . The measurement is performed for photon virtualities Q 2 between 5 and 100 GeV 2 , differentially in Q 2 , in the jet transverse energy E T , in E 2 T /Q 2 and in the pseudorapidity η lab . With the renor- malization scale μ R = E T , perturbative QCD calculations in next-to-leading order (NLO) give a good description of the data in most of the phase space. Significant discrepancies are observed only for jets in the proton beam direction with E T below 20 GeV and Q 2 below 20 GeV 2 . This corresponds to the region in which NLO corrections are largest and further improvement of the calculations is thus of particular interest. To be submitted to Phys. Lett.
Transcript of Measurement of inclusive jet cross-sections in deep-inelastic ep scattering at HERA
arX
iv:h
ep-e
x/02
0602
9v1
12
Jun
2002
DESY 02-079 ISSN 0418-9833June 2002
Measurement of Inclusive Jet Cross-Sectionsin Deep-Inelastic ep Scattering at HERA
H1 Collaboration
Abstract
A measurement of inclusive jet cross-sections in deep-inelasticep scattering at HERAis presented based on data with an integrated luminosity of21.1 pb−1. The measurementis performed for photon virtualitiesQ2 between 5 and100 GeV2, differentially in Q2, inthe jet transverse energyET , in E2
T /Q2 and in the pseudorapidityηlab. With the renor-malization scaleµR = ET , perturbative QCD calculations in next-to-leading order (NLO)give a good description of the data in most of the phase space.Significant discrepancies areobserved only for jets in the proton beam direction withET below 20 GeV andQ2 below20 GeV2. This corresponds to the region in which NLO corrections arelargest and furtherimprovement of the calculations is thus of particular interest.
To be submitted to Phys. Lett.
C. Adloff33, V. Andreev24, B. Andrieu27, T. Anthonis4, A. Astvatsatourov35, A. Babaev23,J. Bahr35, P. Baranov24, E. Barrelet28, W. Bartel10, S. Baumgartner36, J. Becker37,M. Beckingham21, A. Beglarian34, O. Behnke13, C. Beier14, A. Belousov24, Ch. Berger1,T. Berndt14, J.C. Bizot26, J. Bohme10, V. Boudry27, W. Braunschweig1, V. Brisson26,H.-B. Broker2, D.P. Brown10, W. Bruckner12, D. Bruncko16, F.W. Busser11, A. Bunyatyan12,34,A. Burrage18, G. Buschhorn25, L. Bystritskaya23, A.J. Campbell10, T. Carli10,25, S. Caron1,F. Cassol-Brunner22, D. Clarke5, C. Collard4, J.G. Contreras7,41, Y.R. Coppens3,J.A. Coughlan5, M.-C. Cousinou22, B.E. Cox21, G. Cozzika9, J. Cvach29, J.B. Dainton18,W.D. Dau15, K. Daum33,39, M. Davidsson20, B. Delcourt26, N. Delerue22, R. Demirchyan34,A. De Roeck10,43, E.A. De Wolf4, C. Diaconu22, J. Dingfelder13, P. Dixon19, V. Dodonov12,J.D. Dowell3, A. Droutskoi23, A. Dubak25, C. Duprel2, G. Eckerlin10, D. Eckstein35,V. Efremenko23, S. Egli32, R. Eichler36, F. Eisele13, E. Eisenhandler19, M. Ellerbrock13,E. Elsen10, M. Erdmann10,40,e, W. Erdmann36, P.J.W. Faulkner3, L. Favart4, A. Fedotov23,R. Felst10, J. Ferencei10, S. Ferron27, M. Fleischer10, P. Fleischmann10, Y.H. Fleming3,G. Flugge2, A. Fomenko24, I. Foresti37, J. Formanek30, G. Franke10, G. Frising1,E. Gabathuler18, K. Gabathuler32, J. Garvey3, J. Gassner32, J. Gayler10, R. Gerhards10,C. Gerlich13, S. Ghazaryan4,34, L. Goerlich6, N. Gogitidze24, C. Grab36, V. Grabski34,H. Grassler2, T. Greenshaw18, G. Grindhammer25, T. Hadig13, D. Haidt10, L. Hajduk6,J. Haller13, W.J. Haynes5, B. Heinemann18, G. Heinzelmann11, R.C.W. Henderson17,S. Hengstmann37, H. Henschel35, R. Heremans4, G. Herrera7,44, I. Herynek29,M. Hildebrandt37, M. Hilgers36, K.H. Hiller35, J. Hladky29, P. Hoting2, D. Hoffmann22,R. Horisberger32, A. Hovhannisyan34, S. Hurling10, M. Ibbotson21, C. Issever7, M. Jacquet26,M. Jaffre26, L. Janauschek25, X. Janssen4, V. Jemanov11, L. Jonsson20, C. Johnson3,D.P. Johnson4, M.A.S. Jones18, H. Jung20,10, D. Kant19, M. Kapichine8, M. Karlsson20,O. Karschnick11, F. Keil14, N. Keller37, J. Kennedy18, I.R. Kenyon3, S. Kermiche22,C. Kiesling25, P. Kjellberg20, M. Klein35, C. Kleinwort10, T. Kluge1, G. Knies10, B. Koblitz25,S.D. Kolya21, V. Korbel10, P. Kostka35, S.K. Kotelnikov24, R. Koutouev12, A. Koutov8,J. Kroseberg37, K. Kruger10, T. Kuhr11, T. Kurca16, D. Lamb3, M.P.J. Landon19, W. Lange35,T. Lastovicka35,30, P. Laycock18, E. Lebailly26, A. Lebedev24, B. Leißner1, R. Lemrani10,V. Lendermann7, S. Levonian10, M. Lindstroem20, B. List36, E. Lobodzinska10,6,B. Lobodzinski6,10, A. Loginov23, N. Loktionova24, V. Lubimov23, S. Luders36, D. Luke7,10,L. Lytkin12, N. Malden21, E. Malinovski24, I. Malinovski24, S. Mangano36, R. Maracek25,P. Marage4, J. Marks13, R. Marshall21, H.-U. Martyn1, J. Martyniak6, S.J. Maxfield18,D. Meer36, A. Mehta18, K. Meier14, A.B. Meyer11, H. Meyer33, J. Meyer10, P.-O. Meyer2,S. Mikocki6, D. Milstead18, S. Mohrdieck11, M.N. Mondragon7, F. Moreau27, A. Morozov8,J.V. Morris5, K. Muller37, P. Murın16,42, V. Nagovizin23, B. Naroska11, J. Naumann7,Th. Naumann35, G. Nellen25, P.R. Newman3, F. Niebergall11, C. Niebuhr10, O. Nix14,G. Nowak6, J.E. Olsson10, D. Ozerov23, V. Panassik8, C. Pascaud26, G.D. Patel18, M. Peez22,E. Perez9, A. Petrukhin35, J.P. Phillips18, D. Pitzl10, R. Poschl26, I. Potachnikova12, B. Povh12,G. Radel1, J. Rauschenberger11, P. Reimer29, B. Reisert25, C. Risler25, E. Rizvi3,P. Robmann37, R. Roosen4, A. Rostovtsev23, S. Rusakov24, K. Rybicki6, J. Samson36,D.P.C. Sankey5, S. Schatzel13, J. Scheins1, F.-P. Schilling10, P. Schleper10, D. Schmidt33,D. Schmidt10, S. Schmidt25, S. Schmitt10, M. Schneider22, L. Schoeffel9, A. Schoning36,T. Schorner-Sadenius25, V. Schroder10, H.-C. Schultz-Coulon7, C. Schwanenberger10,K. Sedlak29, F. Sefkow37, V. Shekelyan25, I. Sheviakov24, L.N. Shtarkov24, Y. Sirois27,T. Sloan17, P. Smirnov24, Y. Soloviev24, D. South21, V. Spaskov8, A. Specka27, H. Spitzer11,
1
R. Stamen7, B. Stella31, J. Stiewe14, I. Strauch10, U. Straumann37, M. Swart14,S. Tchetchelnitski23, G. Thompson19, P.D. Thompson3, F. Tomasz14, D. Traynor19, P. Truol37,G. Tsipolitis10,38, I. Tsurin35, J. Turnau6, J.E. Turney19, E. Tzamariudaki25, S. Udluft25,A. Uraev23, M. Urban37, A. Usik24, S. Valkar30, A. Valkarova30, C. Vallee22,P. Van Mechelen4, S. Vassiliev8, Y. Vazdik24, A. Vest1, A. Vichnevski8, K. Wacker7,J. Wagner10, R. Wallny37, B. Waugh21, G. Weber11, D. Wegener7, C. Werner13, N. Werner37,M. Wessels1, G. White17, S. Wiesand33, T. Wilksen10, M. Winde35, G.-G. Winter10,Ch. Wissing7, M. Wobisch10, E.-E. Woehrling3, E. Wunsch10, A.C. Wyatt21, J.Zacek30,J. Zalesak30, Z. Zhang26, A. Zhokin23, F. Zomer26, and M. zur Nedden10
1 I. Physikalisches Institut der RWTH, Aachen, Germanya
2 III. Physikalisches Institut der RWTH, Aachen, Germanya
3 School of Physics and Space Research, University of Birmingham, Birmingham, UKb4 Inter-University Institute for High Energies ULB-VUB, Brussels; Universiteit Antwerpen(UIA), Antwerpen; Belgiumc5 Rutherford Appleton Laboratory, Chilton, Didcot, UKb
6 Institute for Nuclear Physics, Cracow, Polandd
7 Institut fur Physik, Universitat Dortmund, Dortmund, Germanya
8 Joint Institute for Nuclear Research, Dubna, Russia9 CEA, DSM/DAPNIA, CE-Saclay, Gif-sur-Yvette, France10 DESY, Hamburg, Germany11 Institut fur Experimentalphysik, Universitat Hamburg, Hamburg, Germanya
12 Max-Planck-Institut fur Kernphysik, Heidelberg, Germany13 Physikalisches Institut, Universitat Heidelberg, Heidelberg, Germanya
14 Kirchhoff-Institut fur Physik, Universitat Heidelberg, Heidelberg, Germanya
15 Institut fur experimentelle und Angewandte Physik, Universitat Kiel, Kiel, Germany16 Institute of Experimental Physics, Slovak Academy of Sciences, Kosice, Slovak Republice,f
17 School of Physics and Chemistry, University of Lancaster, Lancaster, UKb18 Department of Physics, University of Liverpool, Liverpool, UKb
19 Queen Mary and Westfield College, London, UKb
20 Physics Department, University of Lund, Lund, Swedeng
21 Physics Department, University of Manchester, Manchester, UKb
22 CPPM, CNRS/IN2P3 - Univ Mediterranee, Marseille - France23 Institute for Theoretical and Experimental Physics, Moscow, Russial24 Lebedev Physical Institute, Moscow, Russiae
25 Max-Planck-Institut fur Physik, Munchen, Germany26 LAL, Universite de Paris-Sud, IN2P3-CNRS, Orsay, France27 LPNHE, Ecole Polytechnique, IN2P3-CNRS, Palaiseau, France28 LPNHE, Universites Paris VI and VII, IN2P3-CNRS, Paris, France29 Institute of Physics, Academy of Sciences of the Czech Republic, Praha, Czech Republice,i
30 Faculty of Mathematics and Physics, Charles University, Praha, Czech Republice,i
31 Dipartimento di Fisica Universita di Roma Tre and INFN Roma 3, Roma, Italy32 Paul Scherrer Institut, Villigen, Switzerland33 Fachbereich Physik, Bergische Universitat Gesamthochschule Wuppertal, Wuppertal,Germany34 Yerevan Physics Institute, Yerevan, Armenia
2

35 DESY, Zeuthen, Germany36 Institut fur Teilchenphysik, ETH, Zurich, Switzerlandj37 Physik-Institut der Universitat Zurich, Zurich, Switzerlandj
38 Also at Physics Department, National Technical University, Zografou Campus, GR-15773Athens, Greece39 Also at Rechenzentrum, Bergische Universitat Gesamthochschule Wuppertal, Germany40 Also at Institut fur Experimentelle Kernphysik, Universitat Karlsruhe, Karlsruhe, Germany41 Also at Dept. Fis. Ap. CINVESTAV, Merida, Yucatan, Mexicok42 Also at University of P.J.Safarik, Kosice, Slovak Republic43 Also at CERN, Geneva, Switzerland44 Also at Dept. Fis. CINVESTAV, Mexico City, Mexicok
a Supported by the Bundesministerium fur Bildung und Forschung, FRG, under contractnumbers 05 H1 1GUA /1, 05 H1 1PAA /1, 05 H1 1PAB /9, 05 H1 1PEA /6,05 H1 1VHA /7 and05 H1 1VHB /5b Supported by the UK Particle Physics and Astronomy ResearchCouncil, and formerly by theUK Science and Engineering Research Councilc Supported by FNRS-FWO-Vlaanderen, IISN-IIKW and IWTd Partially Supported by the Polish State Committee for Scientific Research, grant no.2P0310318 and SPUB/DESY/P03/DZ-1/99 and by the German Bundesministerium fur Bildungund Forschunge Supported by the Deutsche Forschungsgemeinschaftf Supported by VEGA SR grant no. 2/1169/2001g Supported by the Swedish Natural Science Research Councili Supported by the Ministry of Education of the Czech Republicunder the projectsINGO-LA116/2000 and LN00A006, by GAUK grant no 173/2000j Supported by the Swiss National Science Foundationk Supported by CONACyTl Partially Supported by Russian Foundation for Basic Research, grant no. 00-15-96584
3
1 Introduction
HERA offers excellent possibilities to test predictions ofquantum chromodynamics (QCD), thetheory of the strong interaction, in deep-inelastic electron1 proton scattering (DIS). This theoryhas been successfully tested to a very high level of precision in the measurements of the protonstructure functionF2 [1, 2], in which the photon virtualityQ2 gives rise to a hard scale. QCDalso predicts the production of partons with large transverse momenta, which fragment intohadronic jets with similar four-momenta. Jet observables therefore give direct access to the un-derlying parton dynamics. In addition to
√
Q2, the transverse energiesET of the resulting jets,measured in an appropriate frame of reference, provide a natural hard scale for the descriptionof the interaction within perturbative QCD.
Jets have been studied extensively at HERA and at other colliders. Recent measurementsof (multi-)jet cross-sections at HERA [3–6] have shown thatat sufficiently large values of thephoton virtualityQ2
∼> 150 GeV2, calculations implementing matrix elements toO(α2
s) in thestrong coupling constant, i.e. next-to-leading order (NLO), are in excellent agreement with thedata. These highly successful calculations are performed in the conventional collinear approx-imation referred to as DGLAP [7]. Since in this kinematic regime of largeQ2, the theoreticaluncertainties are small, the measured cross-sections havebeen used to extractαs [3, 6] and thegluon density of the proton [3]. For some observables these data can be described even at lowervalues ofQ2, although the theoretical uncertainties in the predictions and the QCD correctionsbetween leading order (LO) and NLO predictions increase in this kinematic region.
Problems have also been encountered in the theoretical description of jets in DIS. Measure-ments of highly energetic jets at large pseudorapidities2 ηlab with transverse energies squared ofthe order ofQ2 (so-called forward jets [8]) made by the H1 [9] and ZEUS [10, 11] collabora-tions show large discrepancies between data and NLO calculations at low values of Bjorken-x.This may be due to a breakdown of the DGLAP approximation and the onset of BFKL [12]effects where, in contrast to DGLAP, the emissions of partons are not ordered in transversemomentum. Alternatively, a good description of the data canbe obtained [13] by consideringthe partonic structure of the virtual photon, which is expected to be important forE2
T > Q2
andQ2 not too large. It has been pointed out [14], however, that there is some correspondencebetween higher order effects and resolved virtual photon contributions. Further discrepanciesbetween NLO calculations and data were revealed by H1 measurements of DIS dijet productionfor Q2 < 11 GeV2 [15] and forQ2 < 10 GeV2 with invariant dijet massesMjj < 25 GeV ormean dijetET < 20 GeV [3]. In these regions of phase space the NLO corrections to the LOcross-sections are large, such that next-to-next-to-leading order (NNLO) contributions are alsolikely to be important.
While the H1 measurements of dijet [3] and three-jet production [4] mentioned above coverlow and highQ2 values, inclusive jet production in DIS has only been measured previously athigh values ofQ2 above 150 GeV2 [3]. This paper presents precision measurements of inclusive
1 In the following, the generic name “electron” will be used for the beam and scattered lepton.2 The pseudorapidityηlab is defined asηlab = − ln tan(θ/2), with the polar angleθ being measured with
respect to the positivez-axis, which is given by the proton beam (or forward) direction.
4
jet cross-sections in the Breit frame3 at low Q2 values (5 < Q2 < 100 GeV2). Here, “inclu-sive” means that in every selected event every jet that passes the experimental cuts contributesto the measured cross-section. The advantages of investigating QCD with studies of inclusivejets compared with multi-jets are two-fold. First, the accessible phase space is extended. Sec-ond, phase space regions in which fixed order calculations are infrared-sensitive are naturallyavoided. In dijet analyses such regions are usually suppressed by imposing asymmetric cuts onthe transverse jet energies [16].
2 Experimental apparatus
A detailed description of the H1 apparatus can be found elsewhere [17, 18]. Here, only thecomponents of the detector which are relevant for the measurement of lowQ2 jet cross-sectionsare introduced.
The scattered electron is measured with a calorimeter made of lead and scintillating fibres(SpaCal) [19]. The SpaCal covers polar angles from153◦ to 177.5◦ for collisions at the nominalinteraction point. It is divided into an electromagnetic section with 28 radiation lengths and ahadronic section and has a total depth of 2 interaction lengths. The electromagnetic section ofthe SpaCal has an energy resolution ofσE/E ≈ 0.07/
√
E[GeV] ⊕ 0.01 for electrons [20]. Inaddition, a backward planar drift chamber in front of the SpaCal with an angular acceptanceof 151◦ < θ < 177.5◦ serves to suppress photoproduction background, where a high energyhadron fakes an electron.
The hadronic final state is measured using the SpaCal and the liquid argon (LAr) calorime-ter [21] together with the tracking chambers. The LAr calorimeter provides full azimuthalcoverage over the polar angle range4◦ < θ < 154◦ with a depth ranging between 4.5 and 8 in-teraction lengths, depending on the polar angle. Test beam measurements of the LAr calorimetermodules showed an energy resolution ofσE/E ≈ 0.50/
√
E[GeV]⊕ 0.02 for charged pions af-ter software energy reweighting [22] and ofσE/E ≈ 0.12/
√
E[GeV]⊕0.01 for electrons [23].
The calorimeters are surrounded by a superconducting solenoid which provides a uniformmagnetic field of 1.15 T parallel to the beam axis in the regionof the central tracking detec-tors. Charged particles are measured in this central tracking area which consists of drift andproportional chambers. The drift chambers cover a range in polar angle from15◦ to 165◦. Thetracking chambers also serve for the determination of the event vertex.
3 QCD calculations and Monte Carlo models
For the NLO calculation of jet observables at the parton level the DISENT computer pro-gram [24] was used. Several other programs [25–27] are knownto give comparable results [28].All of these programs calculate the direct photon induced contributions to the cross-section.
3 The Breit frame is defined by2x~p+~q = 0, wherex is the Bjorken scaling variable, and~p and~q are the protonand the virtual photon momenta, respectively.
5
Only the JetViP program [25] provides the additional possibility to calculate a cross-sectionconsisting of both direct and resolved photon contributions. While implementing the concept ofthe resolved hadronic substructure of the photon is straightforward for photoproduction, in theDIS case conceptual difficulties are encountered [29] whichlead to ambiguous results. There-fore we decided not to use JetViP for comparisons with the present data.
In the DISENT program the square of the renormalization scale,µ2
R, can be set to any linearcombination of the two hard scales in the event,E2
T andQ2. Here,ET is the transverse energyof the jet in the Breit frame in the case of events in which onlyone jet satisfies the selectioncriteria. In the case of two or more selected jets,ET was set to the mean transverse energy of thetwo hardest jets. For most of the comparisons with dataµR = ET was chosen, sinceE2
T > Q2
in almost all of the phase space considered. However, the effects of choosingµR =√
Q2 arealso discussed in section 5. The factorization scale was always set to
√
Q2. In the kinematicregion considered in this analysis the cross-section predictions are stable within a few percenteven for large variations of the factorization scale [30]. The parton density functions (PDF) ofthe proton were taken from the CTEQ5M (CTEQ5L) parameterization [31] for the calculationof the NLO (LO) cross-sections. For NLO, the corresponding value ofαs(MZ) is 0.118. Thenumber of active flavours was chosen to benf = 5 unlessµ2
R was less than 25 GeV2 in whichcasenf = 4 was used in order to simulate the threshold for the onset of beauty production viathe boson gluon fusion process.
In contrast to fixed order QCD calculations, which can only predict the partonic final stateof an event, the implementation of phenomenological QCD models in Monte Carlo (MC) gen-erators allows the details of the hadronic final state to be simulated. These generators typicallyimplementO(αs) matrix elements and account for the effects of higher ordersusing differentQCD-inspired mechanisms. LEPTO [32] and RAPGAP [33] are so-called ME+PS Monte Carloprograms which combine theO(αs) matrix elements with parton showers which take into ac-count the leading logarithms inQ2 to all orders. As an alternative approach, the ARIADNEMC [34] simulates parton cascades as a chain of independently radiating colour dipoles accord-ing to [35]. Higher order QED corrections, which can influence the event topology and the sizeof the cross-sections, are implemented in the program HERACLES [36] which is interfacedto RAPGAP. An interface to LEPTO and ARIADNE is provided by the DJANGO [37] pro-gram. In the present analysis the MC generators ARIADNE and LEPTO were used to estimatethe hadronization corrections which were applied to the NLOQCD calculations. RAPGAP andthe DJANGO-interfaced ARIADNE program (’DJANGO/ARIADNE’) were used to correct thedata for detector and higher order QED effects (see section 4.2). For all MC generators used inthe analysis, the hadronization of the final partonic systemas well as the particle decays weremodelled with the Lund colour string model [38] as implemented in JETSET [39].
4 Measurement
4.1 Event and jet selection
The analysed data were collected with the H1 detector in the years 1996 and 1997. In thisrunning period HERA collided 27.5 GeV positrons with 820 GeVprotons. The integratedluminosity as measured using the bremsstrahlung processep → epγ amounts to 21.1pb−1.
6
The events are triggered by demanding a localized energy deposition in the SpaCal andloose track requirements. The trigger efficiencies are close to 100%. DIS events are selectedby identifying the scattered electron in the SpaCal. More precisely, the electron is defined asthe highest energy cluster in the SpaCal with an energy of at least 10 GeV. It must be detectedat a polar angleθ > 156◦ to guarantee the full reconstruction of the particle withinthe SpaCalacceptance.
The kinematic variablesx, Q2 andy are determined using electron information only, ac-cording toQ2 = 4EeE
′
e cos2(θe/2), y = 1 − (E ′
e/Ee) sin2(θe/2) andx = Q2/(ys), whereEe,E ′
e andθe are the electron beam energy, the energy of the scattered electron and the electronscattering angle, respectively. The latter two quantitiesare measured using the SpaCal. Thecenter-of-mass energy squareds of the proton-electron scattering is computed from the beamenergies.
The kinematic range considered in this analysis is further constrained by the conditions5 < Q2 < 100 GeV2 and 0.2 < y < 0.6. The latter condition also leads to a reductionof photoproduction background and of events in which the incoming electron radiates a high-energy photon.
The hadronic final state objects of an event are reconstructed using information from energydeposits in the calorimeters and from tracks in the inner detectors. A cut
∑
j(Ej − Pz,j) >45 GeV further suppresses radiative events. Here the sum runs overthe objects of the hadronicfinal state and the scattered lepton. An additional cut
∑
j(Ej −Pz,j) < 65 GeV reduces non-epbackground. For all events the reconstructedz-coordinate of the event vertex is required to bewithin ±35 cm of its nominal position which further reduces non-ep background to a negligiblelevel.
Jets are defined using the inclusivek⊥ cluster algorithm [40] in the Breit frame in which thephoton and the parton collide head-on. This ensures that thejet transverse energies are closelyrelated to those of the partons emerging from the hard scattering. Jets are finally selected byrequiring their transverse energy to be larger than 5 GeV. Inaddition, the jets have to be wellcontained within the polar angle acceptance of the LAr calorimeter. Therefore, a cut on thepseudorapidity of the jets−1 < ηlab < 2.8 is applied.
4.2 Correction procedure
All data distributions shown in this paper are corrected forthe effects of limited detector ac-ceptance and resolution and for higher-order QED effects using a bin-to-bin correction method.Following studies of migrations made with simulated events, the bin sizes were chosen in orderto ensure that this method can be applied. In all bins, the stability 4 and purity exceed 40%. Thedistributions of kinematic variables and jet observables in the data are sufficiently well describedby the QCD Monte Carlo models used in the correction procedure. RAPGAP describes the datavery well for transverse energies above 10 GeV but lies belowthe data forET < 10 GeV. TheDJANGO/ARIADNE program gives a good description forET < 10 GeV, but is too high forhigher values of the transverse energy.
4 The stability (purity) is defined as the number of jets which are both generated and reconstructed in an analysisbin, divided by the total number of jets that are generated (reconstructed) in that bin.
7
The correction factor is defined as the ratio of the number of events from two different MCevent samples generated for the same phase space. The first sample has no QED correctionsand is not subjected to the detector simulation. The second sample includes QED correctionsto the leptonic vertex of the interaction and is subjected toa full simulation of the H1 detectorand reconstruction procedure. The correction factors werecalculated from both the RAPGAPand the DJANGO/ARIADNE programs. The final correction was taken to be the average ofthe two results. The corrections factors thus derived are typically between 0.9 and 1.1. Val-ues down to 0.7 and up to 1.3 are reached in some exceptional analysis bins, for example forE2
T /Q2 < 2 andE2
T /Q2 > 50 for jets in the forward region1.5 < ηlab < 2.8. Although theshapes and normalizations of the predicted cross-sectionsdiffer significantly between RAGPAPand DJANGO/ARIADNE, the difference between the correctionfactors derived with the twoprograms is usually as small as 5 to 10%. Half of this difference is assigned as the systematicerror in the correction procedure.
In order to compare the data, which are corrected for instrumental and radiative effects,to the NLO QCD calculations, hadronization corrections areapplied to the latter. They wereestimated using the predictions of the Monte Carlo programsLEPTO and ARIADNE for theratio of the hadron level to the parton level cross-sections. The average of the two predictions istaken as the correction. The effects of hadronization reduce the NLO cross-sections by factorsthat vary from 0.85 to 0.95 with increasing jet transverse energy orQ2 [41]. The uncertaintyin the hadronization correction is taken to be half the difference between the predictions of thetwo programs.
The treatment of systematic uncertainties is similar to that in [3, 4]. The dominant con-tribution to the total systematic error stems from the uncertainty in the hadronic energy scaleof the LAr calorimeter, which is taken to be 3% for this analysis. This uncertainty leads toan uncertainty in the measured cross-sections of 10 to 15%. All other sources of systematicuncertainties, such as the method used for the reconstruction of kinematic variables, the deter-mination of the energy and polar angle of the scattered electron and the model dependence ofthe correction procedure, are small by comparison.
5 Results
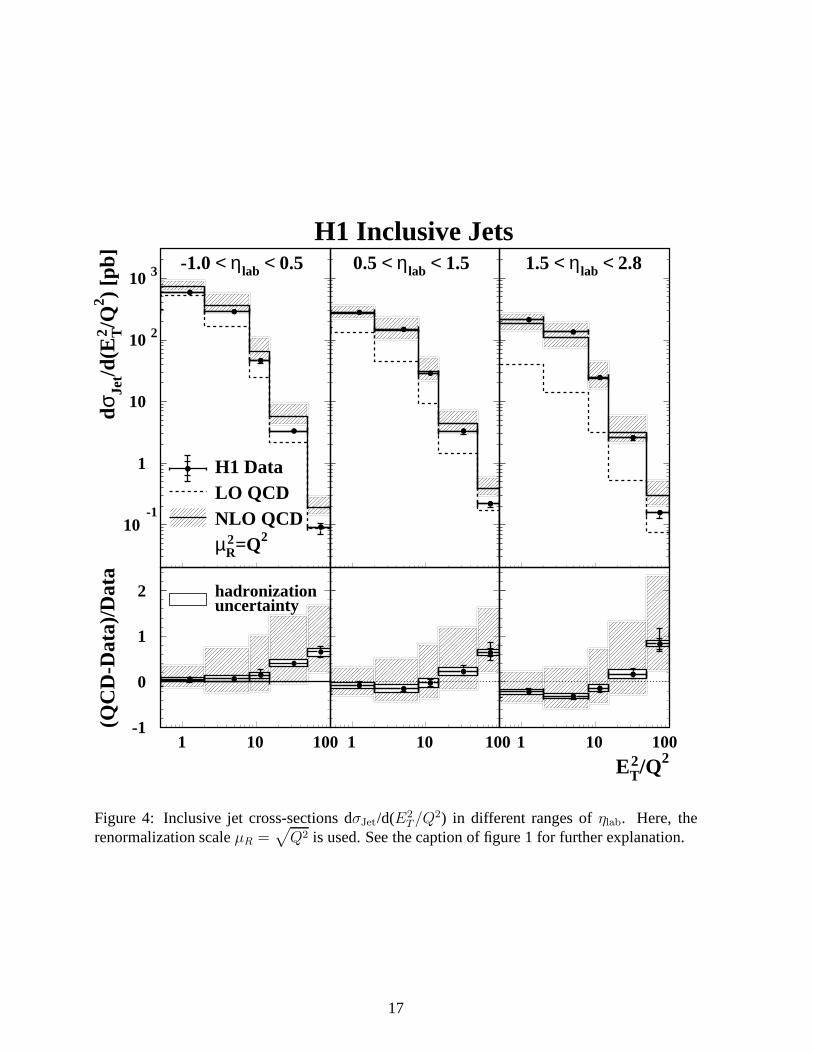
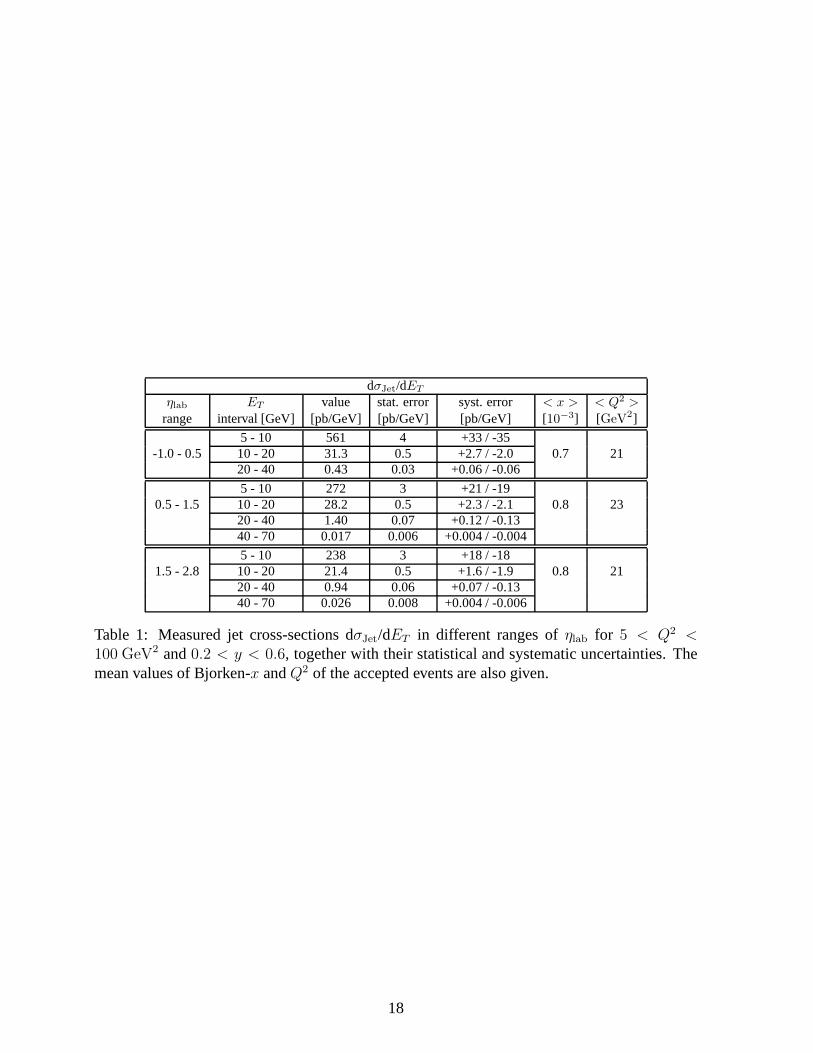
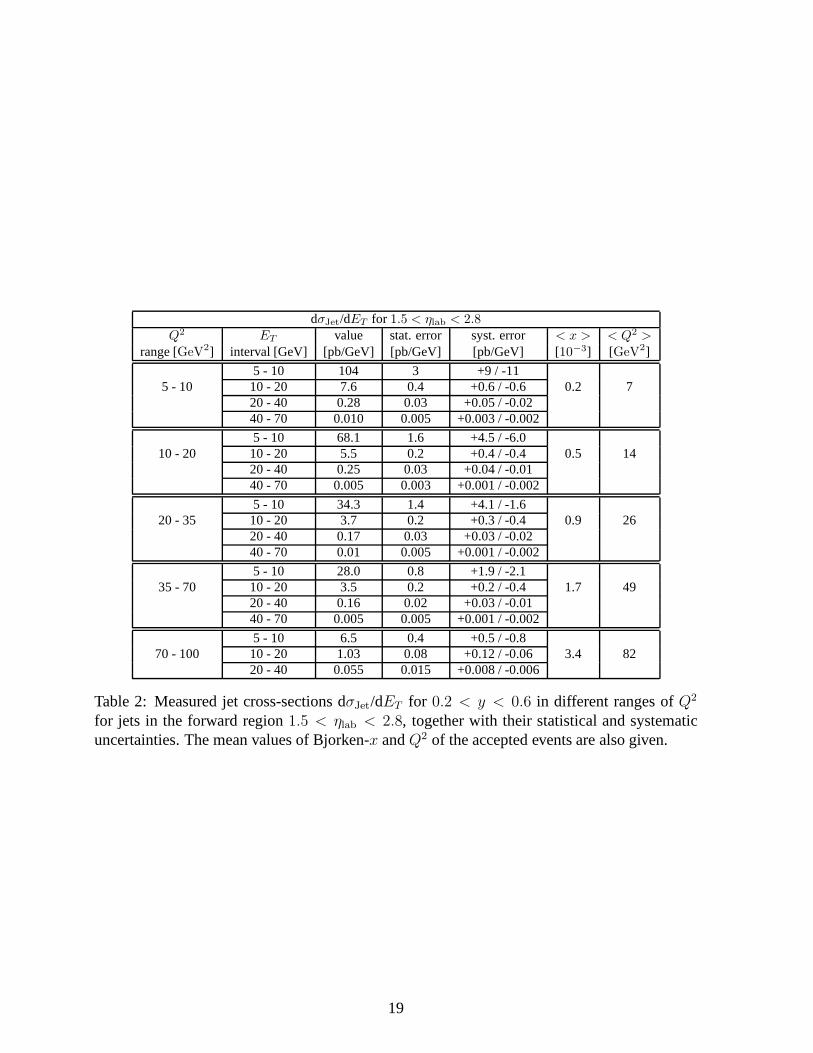
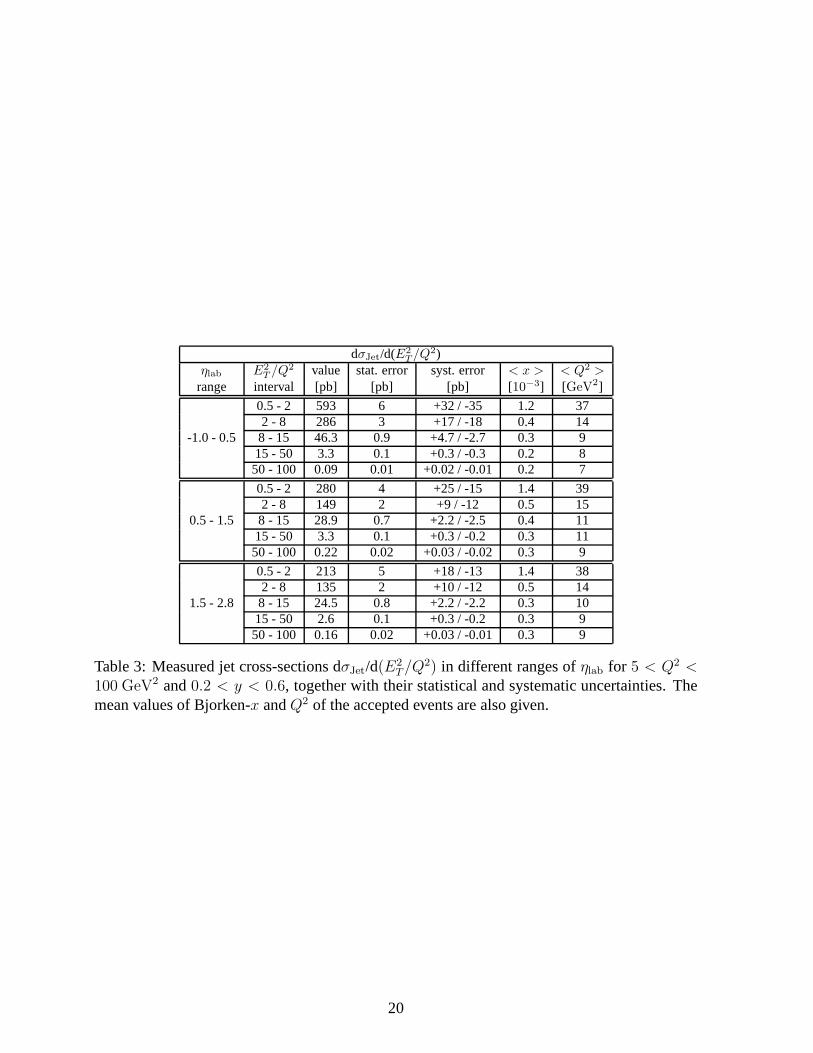
In this section the results of the inclusive jet measurementdescribed in section 4 are com-pared with LO and NLO QCD calculations as explained in section 3. The data are presentedin figures 1 to 4. In the top parts of the figures, the data, corrected for detector and radiativeeffects, are compared with the results of the LO and NLO QCD calculations without hadroniza-tion corrections. The uncertainty in the NLO predictions, which was estimated by varying therenormalization scaleµR by a factor of±2, is also shown. In the bottom part of the figures,the consistency of the NLO QCD prediction with the data is studied in more detail by plottingthe relative difference (QCD-Data)/Data. Here “QCD” denotes the NLO prediction correctedfor hadronization effects as discussed in section 4.2. Boththe uncertainty due to the hadroniza-tion correction and the effect of the variation of the renormalization scaleµR are indicated. Allmeasured cross-sections and their errors are given in tables 1, 2 and 3, together with the averageBjorken-x andQ2 values of the measurements, taken from the data.
8
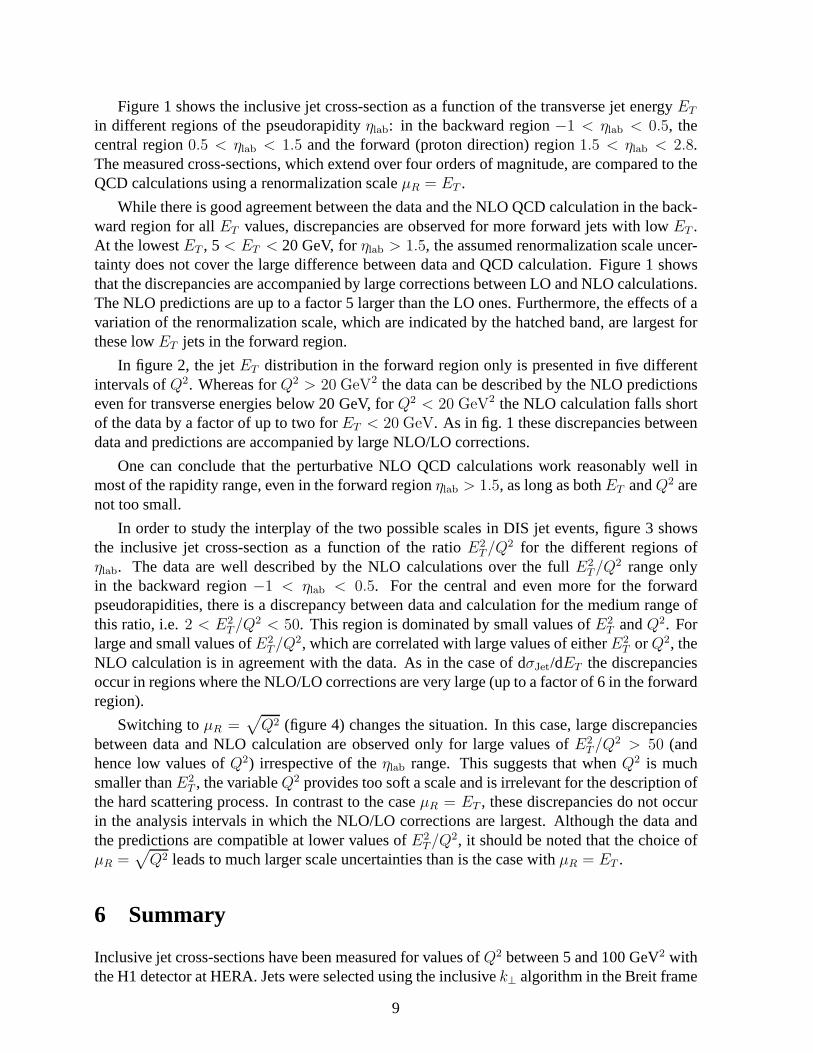
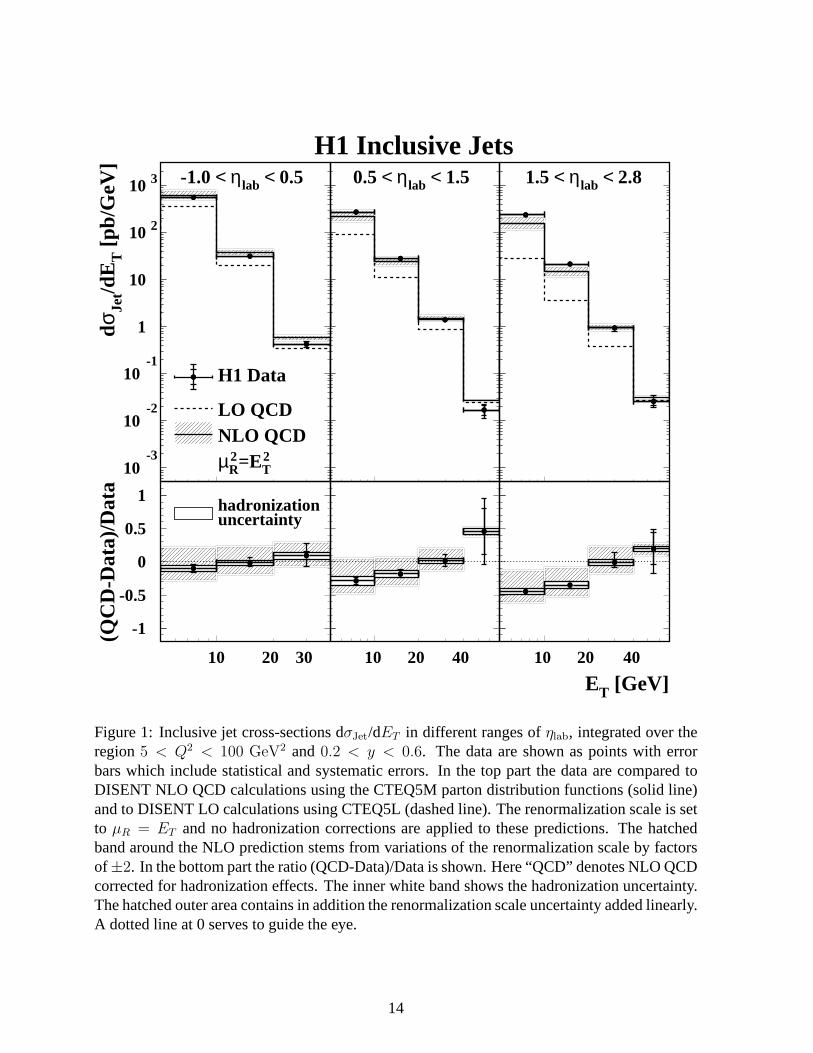
Figure 1 shows the inclusive jet cross-section as a functionof the transverse jet energyET
in different regions of the pseudorapidityηlab: in the backward region−1 < ηlab < 0.5, thecentral region0.5 < ηlab < 1.5 and the forward (proton direction) region1.5 < ηlab < 2.8.The measured cross-sections, which extend over four ordersof magnitude, are compared to theQCD calculations using a renormalization scaleµR = ET .
While there is good agreement between the data and the NLO QCDcalculation in the back-ward region for allET values, discrepancies are observed for more forward jets with low ET .At the lowestET , 5 < ET < 20 GeV, forηlab > 1.5, the assumed renormalization scale uncer-tainty does not cover the large difference between data and QCD calculation. Figure 1 showsthat the discrepancies are accompanied by large corrections between LO and NLO calculations.The NLO predictions are up to a factor 5 larger than the LO ones. Furthermore, the effects of avariation of the renormalization scale, which are indicated by the hatched band, are largest forthese lowET jets in the forward region.
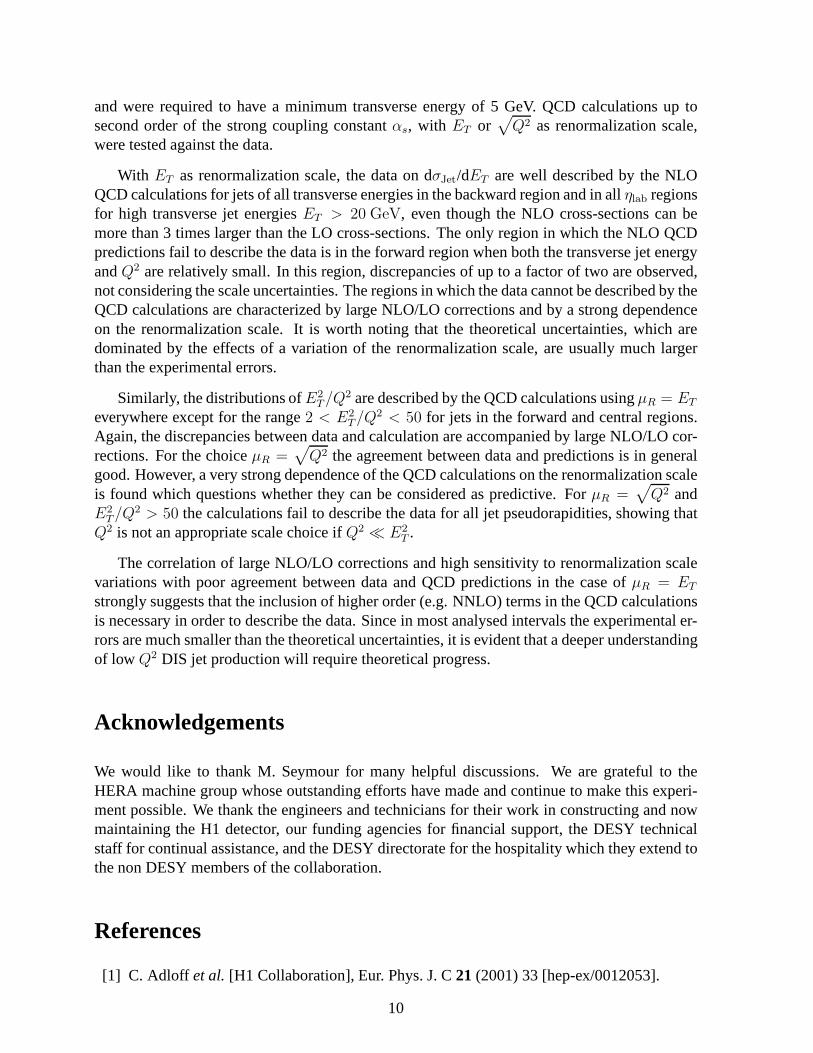
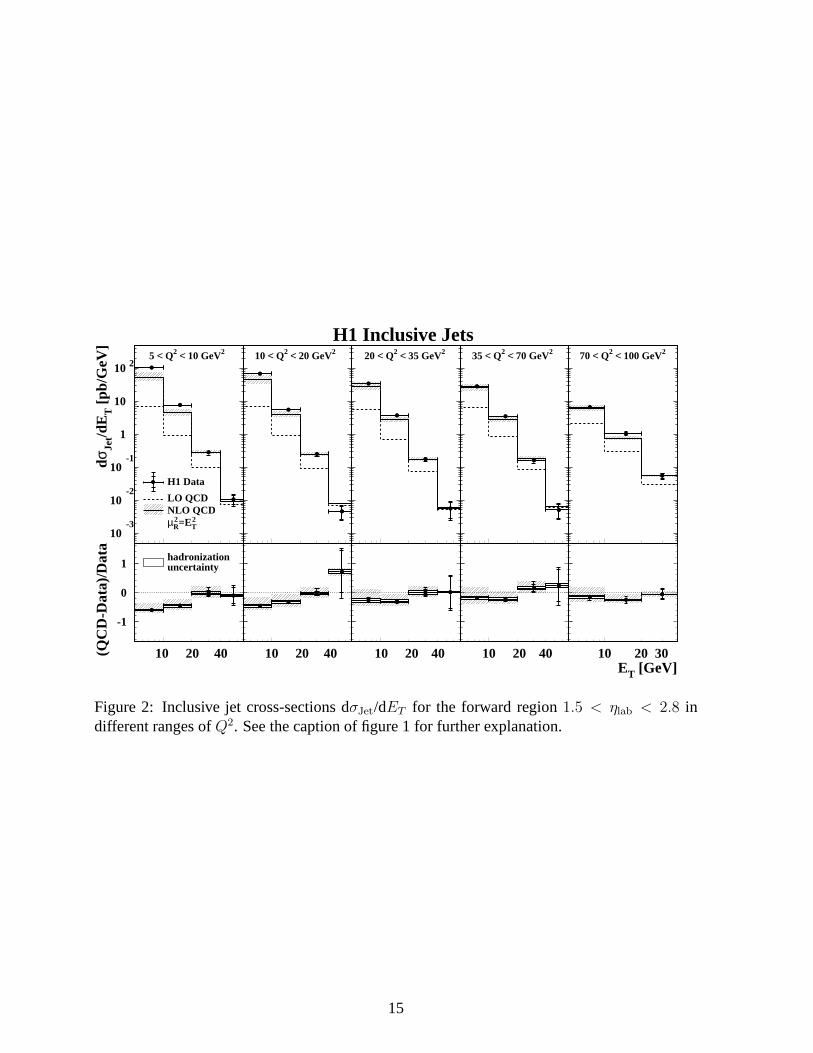
In figure 2, the jetET distribution in the forward region only is presented in five differentintervals ofQ2. Whereas forQ2 > 20 GeV2 the data can be described by the NLO predictionseven for transverse energies below 20 GeV, forQ2 < 20 GeV2 the NLO calculation falls shortof the data by a factor of up to two forET < 20 GeV. As in fig. 1 these discrepancies betweendata and predictions are accompanied by large NLO/LO corrections.
One can conclude that the perturbative NLO QCD calculationswork reasonably well inmost of the rapidity range, even in the forward regionηlab > 1.5, as long as bothET andQ2 arenot too small.
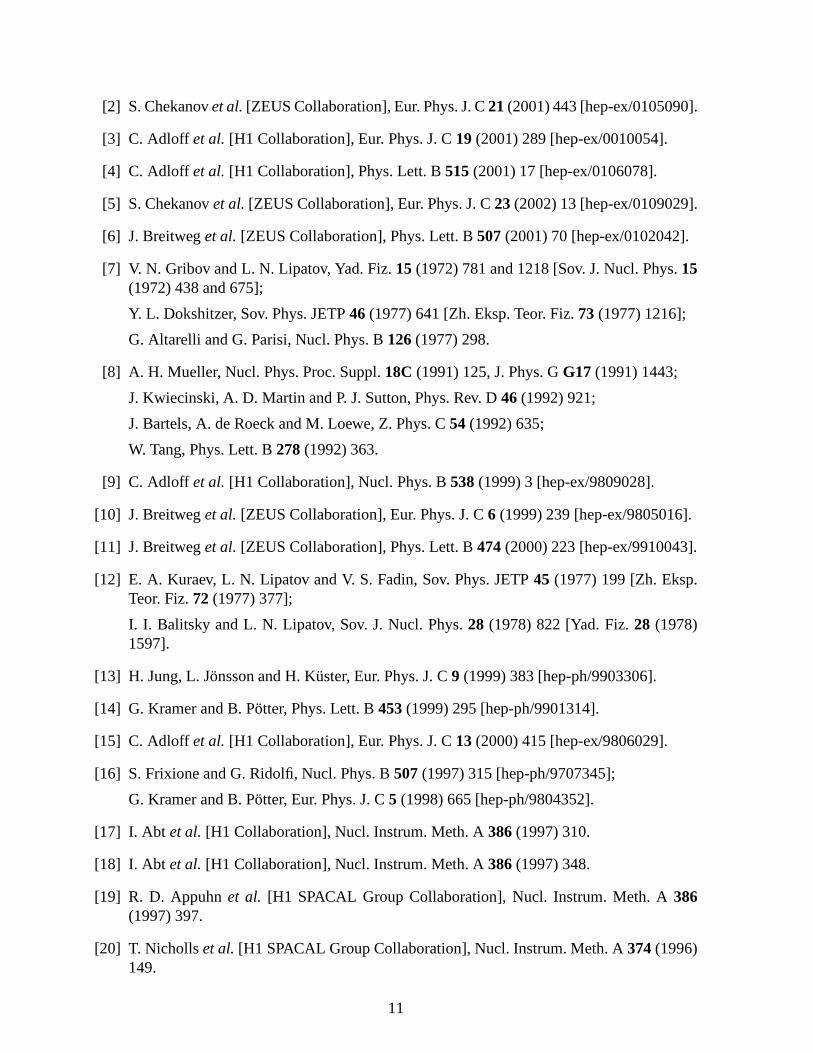
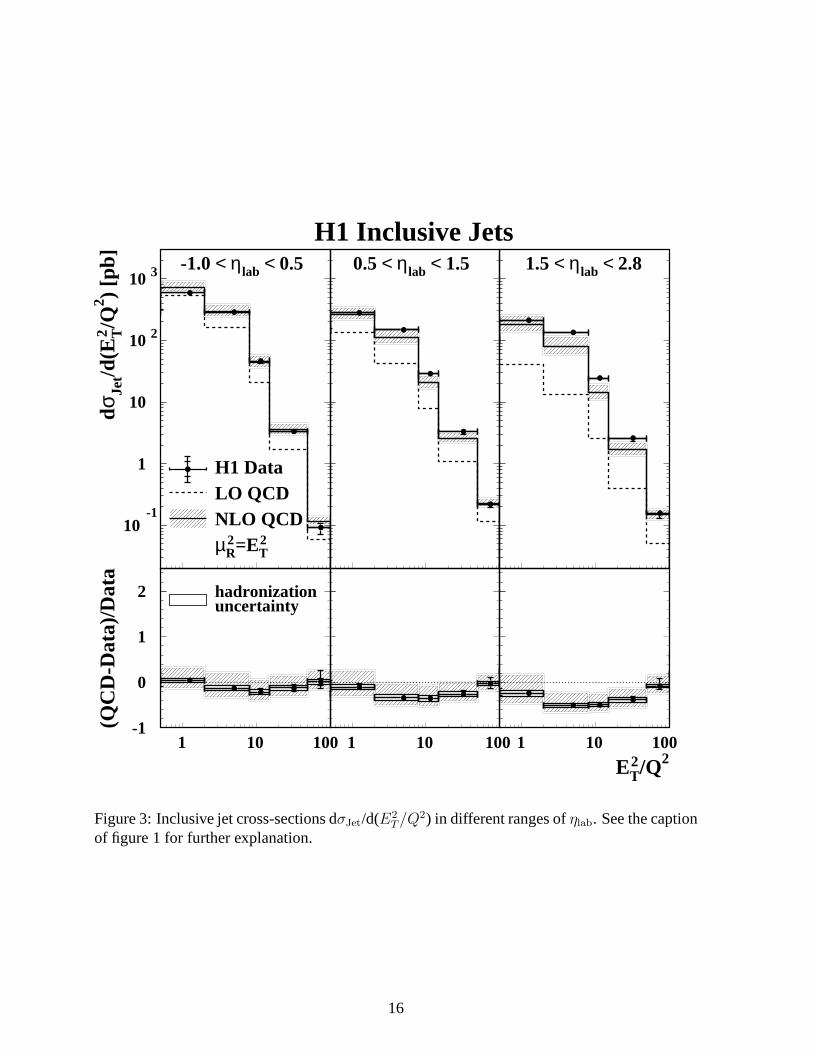
In order to study the interplay of the two possible scales in DIS jet events, figure 3 showsthe inclusive jet cross-section as a function of the ratioE2
T /Q2 for the different regions ofηlab. The data are well described by the NLO calculations over thefull E2
T /Q2 range onlyin the backward region−1 < ηlab < 0.5. For the central and even more for the forwardpseudorapidities, there is a discrepancy between data and calculation for the medium range ofthis ratio, i.e.2 < E2
T /Q2 < 50. This region is dominated by small values ofE2
T andQ2. Forlarge and small values ofE2
T /Q2, which are correlated with large values of eitherE2
T or Q2, theNLO calculation is in agreement with the data. As in the case of dσJet/dET the discrepanciesoccur in regions where the NLO/LO corrections are very large(up to a factor of 6 in the forwardregion).
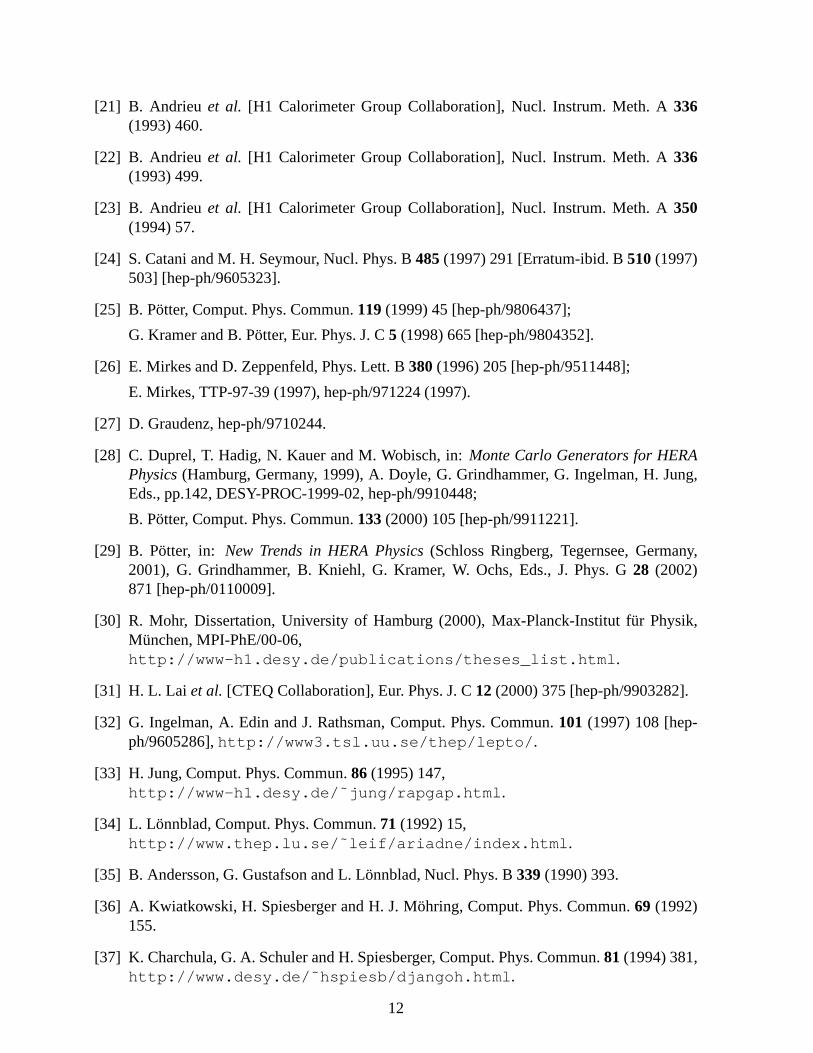
Switching toµR =√
Q2 (figure 4) changes the situation. In this case, large discrepanciesbetween data and NLO calculation are observed only for largevalues ofE2
T /Q2 > 50 (andhence low values ofQ2) irrespective of theηlab range. This suggests that whenQ2 is muchsmaller thanE2
T , the variableQ2 provides too soft a scale and is irrelevant for the description ofthe hard scattering process. In contrast to the caseµR = ET , these discrepancies do not occurin the analysis intervals in which the NLO/LO corrections are largest. Although the data andthe predictions are compatible at lower values ofE2
T /Q2, it should be noted that the choice ofµR =
√
Q2 leads to much larger scale uncertainties than is the case with µR = ET .
6 Summary
Inclusive jet cross-sections have been measured for valuesof Q2 between 5 and 100 GeV2 withthe H1 detector at HERA. Jets were selected using the inclusivek⊥ algorithm in the Breit frame
9
and were required to have a minimum transverse energy of 5 GeV. QCD calculations up tosecond order of the strong coupling constantαs, with ET or
√
Q2 as renormalization scale,were tested against the data.
With ET as renormalization scale, the data on dσJet/dET are well described by the NLOQCD calculations for jets of all transverse energies in the backward region and in allηlab regionsfor high transverse jet energiesET > 20 GeV, even though the NLO cross-sections can bemore than 3 times larger than the LO cross-sections. The onlyregion in which the NLO QCDpredictions fail to describe the data is in the forward region when both the transverse jet energyandQ2 are relatively small. In this region, discrepancies of up toa factor of two are observed,not considering the scale uncertainties. The regions in which the data cannot be described by theQCD calculations are characterized by large NLO/LO corrections and by a strong dependenceon the renormalization scale. It is worth noting that the theoretical uncertainties, which aredominated by the effects of a variation of the renormalization scale, are usually much largerthan the experimental errors.
Similarly, the distributions ofE2
T /Q2 are described by the QCD calculations usingµR = ET
everywhere except for the range2 < E2
T /Q2 < 50 for jets in the forward and central regions.Again, the discrepancies between data and calculation are accompanied by large NLO/LO cor-rections. For the choiceµR =
√
Q2 the agreement between data and predictions is in generalgood. However, a very strong dependence of the QCD calculations on the renormalization scaleis found which questions whether they can be considered as predictive. ForµR =
√
Q2 andE2
T /Q2 > 50 the calculations fail to describe the data for all jet pseudorapidities, showing thatQ2 is not an appropriate scale choice ifQ2 ≪ E2
T .
The correlation of large NLO/LO corrections and high sensitivity to renormalization scalevariations with poor agreement between data and QCD predictions in the case ofµR = ET
strongly suggests that the inclusion of higher order (e.g. NNLO) terms in the QCD calculationsis necessary in order to describe the data. Since in most analysed intervals the experimental er-rors are much smaller than the theoretical uncertainties, it is evident that a deeper understandingof low Q2 DIS jet production will require theoretical progress.
Acknowledgements
We would like to thank M. Seymour for many helpful discussions. We are grateful to theHERA machine group whose outstanding efforts have made and continue to make this experi-ment possible. We thank the engineers and technicians for their work in constructing and nowmaintaining the H1 detector, our funding agencies for financial support, the DESY technicalstaff for continual assistance, and the DESY directorate for the hospitality which they extend tothe non DESY members of the collaboration.
References
[1] C. Adloff et al. [H1 Collaboration], Eur. Phys. J. C21 (2001) 33 [hep-ex/0012053].
10
[2] S. Chekanovet al.[ZEUS Collaboration], Eur. Phys. J. C21 (2001) 443 [hep-ex/0105090].
[3] C. Adloff et al. [H1 Collaboration], Eur. Phys. J. C19 (2001) 289 [hep-ex/0010054].
[4] C. Adloff et al. [H1 Collaboration], Phys. Lett. B515 (2001) 17 [hep-ex/0106078].
[5] S. Chekanovet al.[ZEUS Collaboration], Eur. Phys. J. C23 (2002) 13 [hep-ex/0109029].
[6] J. Breitweget al. [ZEUS Collaboration], Phys. Lett. B507 (2001) 70 [hep-ex/0102042].
[7] V. N. Gribov and L. N. Lipatov, Yad. Fiz.15 (1972) 781 and 1218 [Sov. J. Nucl. Phys.15(1972) 438 and 675];
Y. L. Dokshitzer, Sov. Phys. JETP46 (1977) 641 [Zh. Eksp. Teor. Fiz.73 (1977) 1216];
G. Altarelli and G. Parisi, Nucl. Phys. B126 (1977) 298.
[8] A. H. Mueller, Nucl. Phys. Proc. Suppl.18C (1991) 125, J. Phys. GG17 (1991) 1443;
J. Kwiecinski, A. D. Martin and P. J. Sutton, Phys. Rev. D46 (1992) 921;
J. Bartels, A. de Roeck and M. Loewe, Z. Phys. C54 (1992) 635;
W. Tang, Phys. Lett. B278 (1992) 363.
[9] C. Adloff et al. [H1 Collaboration], Nucl. Phys. B538 (1999) 3 [hep-ex/9809028].
[10] J. Breitweget al. [ZEUS Collaboration], Eur. Phys. J. C6 (1999) 239 [hep-ex/9805016].
[11] J. Breitweget al. [ZEUS Collaboration], Phys. Lett. B474 (2000) 223 [hep-ex/9910043].
[12] E. A. Kuraev, L. N. Lipatov and V. S. Fadin, Sov. Phys. JETP 45 (1977) 199 [Zh. Eksp.Teor. Fiz.72 (1977) 377];
I. I. Balitsky and L. N. Lipatov, Sov. J. Nucl. Phys.28 (1978) 822 [Yad. Fiz.28 (1978)1597].
[13] H. Jung, L. Jonsson and H. Kuster, Eur. Phys. J. C9 (1999) 383 [hep-ph/9903306].
[14] G. Kramer and B. Potter, Phys. Lett. B453 (1999) 295 [hep-ph/9901314].
[15] C. Adloff et al. [H1 Collaboration], Eur. Phys. J. C13 (2000) 415 [hep-ex/9806029].
[16] S. Frixione and G. Ridolfi, Nucl. Phys. B507 (1997) 315 [hep-ph/9707345];
G. Kramer and B. Potter, Eur. Phys. J. C5 (1998) 665 [hep-ph/9804352].
[17] I. Abt et al. [H1 Collaboration], Nucl. Instrum. Meth. A386 (1997) 310.
[18] I. Abt et al. [H1 Collaboration], Nucl. Instrum. Meth. A386 (1997) 348.
[19] R. D. Appuhnet al. [H1 SPACAL Group Collaboration], Nucl. Instrum. Meth. A386(1997) 397.
[20] T. Nichollset al. [H1 SPACAL Group Collaboration], Nucl. Instrum. Meth. A374 (1996)149.
11
[21] B. Andrieu et al. [H1 Calorimeter Group Collaboration], Nucl. Instrum. Meth. A 336(1993) 460.
[22] B. Andrieu et al. [H1 Calorimeter Group Collaboration], Nucl. Instrum. Meth. A 336(1993) 499.
[23] B. Andrieu et al. [H1 Calorimeter Group Collaboration], Nucl. Instrum. Meth. A 350(1994) 57.
[24] S. Catani and M. H. Seymour, Nucl. Phys. B485 (1997) 291 [Erratum-ibid. B510 (1997)503] [hep-ph/9605323].
[25] B. Potter, Comput. Phys. Commun.119 (1999) 45 [hep-ph/9806437];
G. Kramer and B. Potter, Eur. Phys. J. C5 (1998) 665 [hep-ph/9804352].
[26] E. Mirkes and D. Zeppenfeld, Phys. Lett. B380 (1996) 205 [hep-ph/9511448];
E. Mirkes, TTP-97-39 (1997), hep-ph/971224 (1997).
[27] D. Graudenz, hep-ph/9710244.
[28] C. Duprel, T. Hadig, N. Kauer and M. Wobisch, in:Monte Carlo Generators for HERAPhysics(Hamburg, Germany, 1999), A. Doyle, G. Grindhammer, G. Ingelman, H. Jung,Eds., pp.142, DESY-PROC-1999-02, hep-ph/9910448;
B. Potter, Comput. Phys. Commun.133 (2000) 105 [hep-ph/9911221].
[29] B. Potter, in: New Trends in HERA Physics(Schloss Ringberg, Tegernsee, Germany,2001), G. Grindhammer, B. Kniehl, G. Kramer, W. Ochs, Eds., J. Phys. G28 (2002)871 [hep-ph/0110009].
[30] R. Mohr, Dissertation, University of Hamburg (2000), Max-Planck-Institut fur Physik,Munchen, MPI-PhE/00-06,http://www-h1.desy.de/publications/theses_list.html .
[31] H. L. Lai et al. [CTEQ Collaboration], Eur. Phys. J. C12 (2000) 375 [hep-ph/9903282].
[32] G. Ingelman, A. Edin and J. Rathsman, Comput. Phys. Commun. 101 (1997) 108 [hep-ph/9605286],http://www3.tsl.uu.se/thep/lepto/ .
[33] H. Jung, Comput. Phys. Commun.86 (1995) 147,http://www-h1.desy.de/˜jung/rapgap.html .
[34] L. Lonnblad, Comput. Phys. Commun.71 (1992) 15,http://www.thep.lu.se/˜leif/ariadne/index.html .
[35] B. Andersson, G. Gustafson and L. Lonnblad, Nucl. Phys. B 339 (1990) 393.
[36] A. Kwiatkowski, H. Spiesberger and H. J. Mohring, Comput. Phys. Commun.69 (1992)155.
[37] K. Charchula, G. A. Schuler and H. Spiesberger, Comput.Phys. Commun.81 (1994) 381,http://www.desy.de/˜hspiesb/djangoh.html .
12
[38] B. Andersson, G. Gustafson, G. Ingelman and T. Sjostrand, Phys. Rept.97 (1983) 31.
[39] T. Sjostrand, Comput. Phys. Commun.39 (1986) 347;
T. Sjostrand, Comput. Phys. Commun.82 (1994) 74;
T. Sjostrand and M. Bengtsson, Comput. Phys. Commun.43 (1987) 367;
[40] S. D. Ellis and D. E. Soper, Phys. Rev. D48 (1993) 3160 [hep-ph/9305266];
S. Catani, Y. L. Dokshitzer, M. H. Seymour and B. R. Webber, Nucl. Phys. B406 (1993)187.
[41] T. Schorner-Sadenius, Dissertation, University of Munich (2001), Max-Planck-Institut furPhysik, Munchen, MPI-PhE/2001-10, (available fromhttp://www-h1.desy.de/publications/theses_list.html ).
13
10-3
10-2
10-1
1
10
10 2
10 3
-1
-0.5
0
0.5
1
dσJe
t/dE
T [
pb/G
eV]
(QC
D-D
ata)
/Dat
a
ET [GeV]
-1.0 < ηlab < 0.5 0.5 < ηlab < 1.5 1.5 < ηlab < 2.8
10 20 30 10 20 40 10 20 40
LO QCDNLO QCDµR
2=ET2
H1 Data
H1 Inclusive Jets
hadronizationuncertainty
Figure 1: Inclusive jet cross-sections dσJet/dET in different ranges ofηlab, integrated over theregion5 < Q2 < 100 GeV2 and0.2 < y < 0.6. The data are shown as points with errorbars which include statistical and systematic errors. In the top part the data are compared toDISENT NLO QCD calculations using the CTEQ5M parton distribution functions (solid line)and to DISENT LO calculations using CTEQ5L (dashed line). The renormalization scale is setto µR = ET and no hadronization corrections are applied to these predictions. The hatchedband around the NLO prediction stems from variations of the renormalization scale by factorsof ±2. In the bottom part the ratio (QCD-Data)/Data is shown. Here“QCD” denotes NLO QCDcorrected for hadronization effects. The inner white band shows the hadronization uncertainty.The hatched outer area contains in addition the renormalization scale uncertainty added linearly.A dotted line at 0 serves to guide the eye.
14
10-3
10-2
10-1
1
10
10 2
-1
0
1
dσJe
t/dE
T [
pb/G
eV]
(QC
D-D
ata)
/Dat
a
ET [GeV]
5 < Q2 < 10 GeV2 10 < Q2 < 20 GeV2 20 < Q2 < 35 GeV2 35 < Q2 < 70 GeV2 70 < Q2 < 100 GeV2
LO QCDNLO QCDµR
2=ET2
H1 Data
10 20 40 10 20 40 10 20 40 10 20 40 10 20 30
H1 Inclusive Jets
hadronizationuncertainty
Figure 2: Inclusive jet cross-sections dσJet/dET for the forward region1.5 < ηlab < 2.8 indifferent ranges ofQ2. See the caption of figure 1 for further explanation.
15
10-1
1
10
10 2
10 3
-1
0
1
2
dσJe
t/d(E
T2/Q
2 ) [p
b](Q
CD
-Dat
a)/D
ata
ET2/Q2
-1.0 < ηlab < 0.5 0.5 < ηlab < 1.5 1.5 < ηlab < 2.8
LO QCDNLO QCDµR
2=ET2
H1 Data
1 10 100 1 10 100 1 10 100
H1 Inclusive Jets
hadronizationuncertainty
Figure 3: Inclusive jet cross-sections dσJet/d(E2
T /Q2) in different ranges ofηlab. See the captionof figure 1 for further explanation.
16
10-1
1
10
10 2
10 3
-1
0
1
2
dσJe
t/d(E
T2/Q
2 ) [p
b](Q
CD
-Dat
a)/D
ata
ET2/Q2
-1.0 < ηlab < 0.5 0.5 < ηlab < 1.5 1.5 < ηlab < 2.8
LO QCDNLO QCDµR
2=Q2
H1 Data
1 10 100 1 10 100 1 10 100
H1 Inclusive Jets
hadronizationuncertainty
Figure 4: Inclusive jet cross-sections dσJet/d(E2
T /Q2) in different ranges ofηlab. Here, therenormalization scaleµR =
√
Q2 is used. See the caption of figure 1 for further explanation.
17
dσJet/dET
ηlab ET value stat. error syst. error < x > < Q2 >
range interval [GeV] [pb/GeV] [pb/GeV] [pb/GeV] [10−3] [GeV2]
5 - 10 561 4 +33 / -35-1.0 - 0.5 10 - 20 31.3 0.5 +2.7 / -2.0 0.7 21
20 - 40 0.43 0.03 +0.06 / -0.06
5 - 10 272 3 +21 / -190.5 - 1.5 10 - 20 28.2 0.5 +2.3 / -2.1 0.8 23
20 - 40 1.40 0.07 +0.12 / -0.1340 - 70 0.017 0.006 +0.004 / -0.004
5 - 10 238 3 +18 / -181.5 - 2.8 10 - 20 21.4 0.5 +1.6 / -1.9 0.8 21
20 - 40 0.94 0.06 +0.07 / -0.1340 - 70 0.026 0.008 +0.004 / -0.006
Table 1: Measured jet cross-sections dσJet/dET in different ranges ofηlab for 5 < Q2 <100 GeV2 and0.2 < y < 0.6, together with their statistical and systematic uncertainties. Themean values of Bjorken-x andQ2 of the accepted events are also given.
18
dσJet/dET for 1.5 < ηlab < 2.8Q2 ET value stat. error syst. error < x > < Q2 >
range [GeV2] interval [GeV] [pb/GeV] [pb/GeV] [pb/GeV] [10−3] [GeV2]
5 - 10 104 3 +9 / -115 - 10 10 - 20 7.6 0.4 +0.6 / -0.6 0.2 7
20 - 40 0.28 0.03 +0.05 / -0.0240 - 70 0.010 0.005 +0.003 / -0.002
5 - 10 68.1 1.6 +4.5 / -6.010 - 20 10 - 20 5.5 0.2 +0.4 / -0.4 0.5 14
20 - 40 0.25 0.03 +0.04 / -0.0140 - 70 0.005 0.003 +0.001 / -0.002
5 - 10 34.3 1.4 +4.1 / -1.620 - 35 10 - 20 3.7 0.2 +0.3 / -0.4 0.9 26
20 - 40 0.17 0.03 +0.03 / -0.0240 - 70 0.01 0.005 +0.001 / -0.002
5 - 10 28.0 0.8 +1.9 / -2.135 - 70 10 - 20 3.5 0.2 +0.2 / -0.4 1.7 49
20 - 40 0.16 0.02 +0.03 / -0.0140 - 70 0.005 0.005 +0.001 / -0.002
5 - 10 6.5 0.4 +0.5 / -0.870 - 100 10 - 20 1.03 0.08 +0.12 / -0.06 3.4 82
20 - 40 0.055 0.015 +0.008 / -0.006
Table 2: Measured jet cross-sections dσJet/dET for 0.2 < y < 0.6 in different ranges ofQ2
for jets in the forward region1.5 < ηlab < 2.8, together with their statistical and systematicuncertainties. The mean values of Bjorken-x andQ2 of the accepted events are also given.
19
dσJet/d(E2
T/Q2)
ηlab E2
T/Q2 value stat. error syst. error < x > < Q2 >
range interval [pb] [pb] [pb] [10−3] [GeV2]
0.5 - 2 593 6 +32 / -35 1.2 372 - 8 286 3 +17 / -18 0.4 14
-1.0 - 0.5 8 - 15 46.3 0.9 +4.7 / -2.7 0.3 915 - 50 3.3 0.1 +0.3 / -0.3 0.2 850 - 100 0.09 0.01 +0.02 / -0.01 0.2 7
0.5 - 2 280 4 +25 / -15 1.4 392 - 8 149 2 +9 / -12 0.5 15
0.5 - 1.5 8 - 15 28.9 0.7 +2.2 / -2.5 0.4 1115 - 50 3.3 0.1 +0.3 / -0.2 0.3 1150 - 100 0.22 0.02 +0.03 / -0.02 0.3 9
0.5 - 2 213 5 +18 / -13 1.4 382 - 8 135 2 +10 / -12 0.5 14
1.5 - 2.8 8 - 15 24.5 0.8 +2.2 / -2.2 0.3 1015 - 50 2.6 0.1 +0.3 / -0.2 0.3 950 - 100 0.16 0.02 +0.03 / -0.01 0.3 9
Table 3: Measured jet cross-sections dσJet/d(E2
T /Q2) in different ranges ofηlab for 5 < Q2 <100 GeV2 and0.2 < y < 0.6, together with their statistical and systematic uncertainties. Themean values of Bjorken-x andQ2 of the accepted events are also given.
20