Measurement of Energy Expenditure on the Uniport Mobility ...
33
ARMY RESEARCH LABORATORY Measurement of Energy Expenditure on the Uniport Mobility Platform Andrea S. Krausman Douglas S. Savick Kathy L. Leiter Jim A. Faughn Joseph J. Knapik ARL-TR-1263 FEBRUARY 1997 tmc ^»^ 8 19970321 064 Approved for public release; distribution is unlimited.
-
Upload
khangminh22 -
Category
Documents
-
view
0 -
download
0
Transcript of Measurement of Energy Expenditure on the Uniport Mobility ...

ARMY RESEARCH LABORATORY
Measurement of Energy Expenditure on the Uniport Mobility Platform
Andrea S. Krausman Douglas S. Savick
Kathy L. Leiter Jim A. Faughn
Joseph J. Knapik
ARL-TR-1263 FEBRUARY 1997
tmc ̂ »^8
19970321 064 Approved for public release; distribution is unlimited.

Oxylog2® is a registered trademark of P.K. Morgan Limited.
Polar Vantage XL® is a registered trademark of Polar Electro Oy.
The findings in this report are not to be construed as an official Department of the Army position unless so designated by other authorized documents.
Citation of manufacturer's or trade names does not constitute an official endorsement or approval of the use thereof.
Destroy this report when it is no longer needed. Do not return it to the originator.

Army Research Laboratory Aberdeen Proving Ground, MD 21005-5425
ARL-TR-1263 February 1997
Measurement of Energy Expenditure on the Uniport Mobility Platform
Andrea S. Krausman Douglas S. Savick Kathy L. Leiter Jim A. Faughn Joseph J. Knapik Human Research & Engineering Directorate
Approved for public release; distribution is unlimited.

Abstract
The objective of this study was to measure energy expenditure on the Uniport mobility platform, a virtual reality device for dismounted infantry soldiers. Eight subjects performed at five grades (-5.0°, -2.5°, 0°, 2.5°, and 5.0 ) at four speeds (2.5, 3.0, 3.5, and 4.0 mph). An Oxylog® device was used to measure oxygen uptake (VO2). An empirical equation derived by Pandolf et al. (1977) was also used to estimate VO2 for comparison purposes. Analysis of variance indicated that the actual V02 values recorded by the Oxylog were lower than the estimated V02 values from the Pandolf equation at 2.5° and 5.0° grades. This illustrates that the Uniport does not provide a sufficient amount of energy extraction as the grade increases and suggests that error increases as the grade increases. There were no differences between speeds for the estimated and actual V02, which indicates that the Uniport provides sufficient energy extraction at the speeds tested. Appropriate software or hardware adjustments must be developed on the Uniport device to increase energy output when subjects move uphill.
11

ACKNOWLEDGMENTS
The authors would like to thank Dr. Jock Grynovicki for advice and assistance with the
statistical analysis of the data, and they also thank the subjects for their enthusiastic participation.
in

CONTENTS
INTRODUCTION 3
BACKGROUND 3
ACSM Equation 4 Pandolf Equation 5 Downhill Equation 6
OBJECTIVE 6
METHODS 7
Equipment. 7 Participants 7 Procedures 8
DATA ANALYSIS 9
RESULTS 9
DISCUSSION 13
REFERENCES 15
BIBLIOGRAPHY 17
APPENDICES
A. Uniport With Model Ml 6 Rifle 19 B. Validation of ACSM Equation 23 C. Uniport Mobility Platform 27 D. Oxylog2® 31
DISTRIBUTION LIST 35
REPORT DOCUMENTATION PAGE 37
FIGURES
1. Mean Actual V02 and Estimated V02 From Pandolf et al. (1977) and the ACSM (1991) for Positive Grades 10

2. Mean V02 Observed Versus VO2 Predicted From the Wanta Equation for Negative Grades 11
3. Pandolf Versus Actual x Grade Interaction 12 4. Grade x Speed Interaction 12 5. Three-way Interaction for Pandolf Versus Actual x Grade x Speed 13
TABLES
1. Participant Data 7 2. Experimental Order for Grade and Speed 9 3. VO2 for Positive Grades 10 4. VO2 for Negative Grades 11

MEASUREMENT OF ENERGY EXPENDITURE ON THE UNIPORT MOBILITY PLATFORM
INTRODUCTION
Modern simulation technology is a fundamental element in maintaining readiness for war
since it provides soldiers with skills and techniques that may be transferable to battlefield conditions. Modern simulation technology networks tactical engagement simulation with actual equipment, allowing realistic exercises to be conducted at a small fraction of the environmental
impact and cost of field training exercises.
A recent development in simulation technology to aid the individual infantry soldier is the Uniport, developed for the U.S. Army Research Laboratory (ARL) by Sarcos Research Corporation and the Naval Postgraduate School. The Uniport is an electro-mechanical device that functions as an individual combat simulator (ICS). This system may be used with any of the Army's current or projected weapons and with any form of battle equipment for the dismounted combatant. It could allow evaluation of new materiel or new concepts within simulations of
combined arms warfare. New aspects of weaponry could be explored in virtual prototype, quickly and at relatively low cost. The Uniport consists of 1) a mobility platform (similar to a unicycle) that allows the soldier to "pedal" his or her way through the virtual environment, 2) a helmet-mounted display through which the soldier sees the terrain and environment he or she will be interacting with, and 3) a model M-16 rifle (see Appendix A). Uniport allows individuals to move, shoot, communicate, be seen and heard, and interact with other objects on a simulated battlefield. In the near future, the Uniport mobility platform will be changed from the cycling- type device just described to a walking-type device.
To make the Uniport fully realistic, it will be necessary for physical exertion of the user to be similar to that experienced during an actual situation. Thus, the purpose of this study is to compare energy expenditure data generated by subjects using the Uniport with data generated by equations that estimate energy expenditure.
BACKGROUND
A method of determining expended energy or the metabolic cost of walking is done by using a standard physiological procedure known as indirect calorimetry. Indirect calorimetry is accomplished by collecting the individual's expired air and analyzing it for the volume of O2

(V02) consumed and the volume of C02 (VC02) produced (Lusk, 1928). An oxygen monitor, such as an Oxylog® or similar device, consisting of a full face mask tethered to the monitor, is used to measure the number of breaths and inspiratory and expiratory V02. The difference
between the inspiratory and expiratory V02 (corrected for the relative oxidation of fats and carbohydrates) yields the individual's consumed V02.
The measured oxygen consumption provides a close estimate of energy expenditure (McArdle, Katch, & Katch, 1991). These estimates, however, can be affected by two factors: 1)
the measured V02 will be less than the estimated V02, if a steady state is not reached, and 2) exercise at maximal or near maximal intensities will involve both aerobic and anaerobic
components, resulting in an over-estimation attributable to unknown contribution of the
anaerobic component to the exercise (American College of Sports Medicine, 1991).
Measuring V02 is not always convenient because of the equipment and skills necessary to obtain it. This has prompted an interest in determining other reliable methods of predicting energy cost. As a result, several empirical equations have been developed to predict energy cost by using the speed of walking, the weight of the body and the load, and the gradient (Pandolf, Givoni, & Goldman, 1977; ACSM, 1991; Wanta, Nagle, & Webb, 1993).
ACSM Equation
The American College of Sports Medicine (ACSM) has reported an equation to estimate energy expenditure for a variety of activities including walking, running, and stepping. This formula is broken into three components: horizontal, vertical (resistive), and resting.
V02 = (Speed x 0.1) + (Grade x Speed x 1.8) + 3.5
ft ft ft (1)
Horizontal Vertical Resting
The formula can be simplified if the calculations involve only estimating energy expenditure for horizontal locomotion (no grade). (There are two constants in the ACSM equation, 0.1 ml • kg'1 • min-1 and 1.8 m/« kg'1 • min-1. These values were validated by the present authors and are presented in Appendix B).

VO = (Speed x 0.1) + 3.5
11 ft Horizontal Resting
The units for VO2 are in ml • kg'1 • min-1 • The O2 cost of horizontal walking is (0.1 ml» kg'1 »min"1^ , . _ .._.., , . (l.S ml • kg'1 • rma'
and the O2 cost of vertical work is
(2)
m«min ' m«min 2 The resting
component is 3.5 ml • kg 1 • min ' (ACSM, 1991). The units for speed are m • min-1, and grade
is a percentage.
Although VO2 estimates for walking are relatively accurate for most speeds and grades, there are exceptions. For example, the formula is more accurate in estimating VO2 when the individual is walking up a grade than when walking on a level plane. Underestimations of 15% to 20% are expected with level walking and 5% to 8% for walking up a 3% grade. VO2 can be estimated with reasonable accuracy for speeds as high as 134 m^mhr1 (5 mi»h_1) and even for speeds as low as 80 mnnin-1 (3 mi-lr1) (ACSM, 1991).
Pandolf Equation
Pandolf et al. (1977) also developed an equation to estimate energy expenditure for walking and running with and without loads. This equation included factors such as body weight plus external load, velocity, gradient, and type of surface (terrain factor).
M = 1.5(W) + 2.0(W + L)(L/Wf + n(W + L)(l.5V2 + 0.35VG) (3)
M = metabolic rate (Watts) W = subject mass (kg) L = external load (kg) n = terrain factor V = velocity (m»sec) G = grade (percent)
The terrain factor for this equation were empirically derived by Pandolf et al. to allow for more accurate prediction of energy expenditure. Firm walking surfaces appear to impact energy expenditure only slightly. Surfaces that allow penetration (e.g., loose sand and soft snow) alter energy expenditure more dramatically (Pandolf et al., 1977). Following are some of the terrain factors derived by Pandolf. For the purposes of this experiment, we used a terrain factor of 1.0, which is equivalent to that of treadmill walking.

Blacktop Surface T] = 1.0 Dirt Road n = 1.1 Hard Packed Snow n = 1.3 Heavy Brush T] = 1.5 Loose Sand n = 2.1 Sofi Snow (25 cm) ■n = 3.3 Sofi Snow (35 cm) V = 4.1
Downhill Equation
A separate equation was needed to estimate the VO2 consumption for downhill walking
since neither the ACSM nor the Pandolf equation accurately does this. Wanta et al. (1993)
investigated the effects of progressive downhill treadmill walking on energy expenditure using
various negative grades (0%, -3%, -6%, -9%, -12%, -15%, -18% or 0°, -1.7°, -3.4°, -5.1°, -6.8°,
-8.5°, -10.2°) at speeds of 3.4 mph and 3.9 mph (90 and 105 m-min-1). The relationship between
VO2 and grade for downhill walking was described by the following equations:
V02 = 10.488 + 0.73914Z + 0.033132X2 for 3.4 mi■ h'1 (4)
V02= 13.319 + 0.90949X + 0.039025X2 /or 3.9 mi-/T1 (5)
in which VO2 is in mMcg-^min-1 and X represents percent grade.
We estimated energy expenditure at speeds of 2.5 and 3.0 mph for grades -2.5° and -5.0°
using the energy cost curve developed by Wanta et al. (1993) and extrapolating using Y = mx+b.
The extrapolated numbers for 2.5 mph and 3.0 mph were not used in the analysis. These values
were calculated, assuming linearity, and fall outside the range of speeds used by Wanta et al.
(1993). These extrapolated values were used only for observation.
OBJECTIVE
The purpose of this study was to calculate estimated values of energy expenditure using
the ACSM, Pandolf et al., and Wanta et al. equations and to compare these values to direct
measures of energy expenditure obtained while subjects are performing activity on the Uniport device.

METHODS
Equipment
The main apparatus consisted of
1. Uniport mobility platform (see Appendix C)
2. Video monitor to display terrain and speed
3. Metronome to control speed
4. Oxylog2® device to measure O2 consumption (see Appendix D)
5. Polar® device to measure heart rate
6. Scale to weigh each subject
Participants
Eight male soldiers volunteered to be subjects. They were briefed about the purposes and
risks of the study and gave their written voluntary informed consent to participate. The
investigators have adhered to the policies for the protection of human subjects as prescribed in
AR 70-25. All subjects were cleared for the study by a medical record screening. Subjects were
asked to provide their height and were then weighed. Subject data are shown in Table 1.
Table 1
Participant Data (age, height, and body mass)
Mean SDa
Age (yr.) 27 34 31 33 30 35 35 34 32.4 2.83
Height (cm) 165 188 188 178 185 178 180 183 180.6 7.48 Body mass (kg) 78.6 89.5 98.6 81.8 105.9 87.7 88.6 94.1 90.6 8.82
Note. For the purposes of this study, no load was used. aSD = standard deviation

Procedures
Subjects were fitted with a Polar® device to monitor their heart rate throughout the duration of the study. This device consists of a chest strap and a watch. The chest strap detects the heart impulses and transmits them via telemetry to the watch which displays the heart rate in beats per minute.
The Oxylog2® device (PK Morgan, Chatham, United Kingdom) was designed to measure
oxygen consumption (V02) and ventilation (VE) in ambulatory subjects. The subjects' expired
air was passed to the central Oxylog2® unit which contained a FIGARO KE-25 oxygen fuel-type
cell. The difference in volume of oxygen between the inspired and expired gases was measured in
the instrument, and the volume of oxygen extracted was calculated. A turbine flow meter attached to the air intake side calculated the volume of the subjects' inspired air. A display on the device provided the V02 and VE, which were averaged as minute values. The Oxylog2® mask was placed over the subject's mouth and nose and adjusted to obtain a proper seal. The seal assured that all expired gases entered the device. Two different sized masks were used to fit the various facial sizes and shapes of the subjects. The subject mounted the Uniport to start the test. A baseline VO2 reading was first recorded by having the subject breathe normally while sitting on the Uniport and not pedaling (see Appendix C).
Subjects were told to traverse at four different speeds (2.5 mph, 3.0 mph, 3.5 mph, and 4.0 mph) along five different grades (0°, 2.5°, 5.0°, -2.5°, -5.0°) that were displayed on the monitor. Subjects followed the same order of testing as shown in Table 2; speeds and grades were not randomized. A metronome allowed the subject to maintain a constant speed by synchronizing the pedal strokes with a constant beat. The beats per minute were predetermined for each speed. Subjects began the test by traversing the 0° grade at a speed of 2.5 mph for approximately 3 to 4 minutes until their VO2 reached a plateau. V02 readings were recorded every minute. Subjects were then asked to increase their speed to 3.0 mph for the same approximate time still on the 0° grade. The subject remained on the 0° grade until he finished traversing that grade at all four speeds. The subject then dismounted the Uniport and rested for approximately 10 minutes. The same procedure was followed for the each of the remaining grades at each speed.

Table 2
Experimental order for grade and speed
Grade (degrees) Speed (mph)
0 2.5,3.0, 3.5,4.0 2.5 2.5,3.0, 3.5,4.0 5.0 2.5,3.0, 3.5,4.0
-2.5 2.5, 3.0, 3.5,4.0 -5.0 2.5, 3.0,3.5,4.0
DATA ANALYSIS
Approximately four readings were taken for every subject at each speed and grade combination (one reading per minute). These readings were averaged and divided by their weight to determine the subject VO2 (mlHkg-^min-1). Means and standard deviations were calculated for the actual VO2 values, Pandolf estimated VO2 values, and ACSM estimates. Differences between the actual VO2 values and Pandolf estimates were compared using a repeated measures analysis of variance (ANOVA) in order to look more closely at speed and grade interactions. The VO2 values from the ACSM equation were not used in the analysis because it is a point estimation with no variance. The ACSM values are included in Table 3 and Figure 1 for comparison.
RESULTS
The mean actual VO2 and the estimated VO2 for the positive grades are shown in Table 3 and Figure 1.

Table 3
VO2 for Positive Grades (estimated V02 calculated from ACSM equation [ACSM, 1991] and Pandolf [1977])
Grade = 0° Rest 2.5 3.0 3.5 4.0 mph mph mph mph mph
Grade = 2.5° Grade = 5.0° 2.5 3.0 3.5 4.0 2.5 3.0 3.5 4.0 mph mph mph mph mph mph mph mph
Actual V02 mean 3.86 10.7 13.4 17.1 20.6 (ml'kg'^min"1)
13.6 15.5 18.7 23.4
Standard deviation 0.67 1.37 1.86 2.96 3.56 2.22 2.13 2.50 4.54
ACSM estimate (ml'kg^'min"1)
3.5 10.2 11.5 12.9 14.2
Difference (percent) 9.3 4.7 14.2 24.6 31.1 Act. vs. ACSM
Pandolf estimate** 4.4* 10.0 12.4 15.3 18.7 (ml'kg^'min"1)
Difference (percent) -14.5 6.5 7.5 10.5 9.2 Act. vs. Pandolf
15.5 17.8 20.3 22.6
-14.0 -14.8 -8.6 3.4
15.1 18.5 22.4 26.8
-11.0 -19.4 -19.8 -14.5
14.8 18.2 21.9 26.8
1.45 1.63 2.71 3.33
20.7 24.1 27.6 31.0
-39.9 -32.4 -26.0 -15.7
20.2 24.6 29.5 35.1
-36.5 -35.2 -34.7 -30.9
* Pandolf estimate for rest calculated from mean weight of all subjects ** Data from Pandolf were converted from watts to mHcg-^mür1 (McArdle, Katch, & Katch, 1991)
40 - Grade = 0° Grade = 2.5° Grade = 5.0°
35 ,
~ 30 -
1 25 - _>*__. ■—■— Actual
A Pnnrtnlf E J&___ ■ 20 - —O—ACSM b
■* 15 - -^ ~£r I 10 " > 0
»*^
F \ 2.5 3 3.5 4 2.5 3 3.5 4
Speed (mph)
2.5 3 3.5 4
Figure 1- Mean actual V02 and estimated V02 from Pandolf et al. (1977) and the ACSM (1991) for positive grades.
10

The mean actual VO2 and the estimated VO2 for the negative grades are shown in Table 4
and Figure 2. The negative grades were not included in the ANOVA, they are shown for
observation only.
Table 4
VO2 for Negative Grades (estimated VO2 calculated from Wanta equation [Wanta et al., 1993])
Grade = -2.5° Grade = -5.0° 2.5 3.0 3.5 4.0 2.5 3.0 3.5 4.0
mph mph mph mph mph mph mph mph
Actual VO2 mean 10.16 (mHcg^mnr1)
12.31 14.75 17.70 9.15 10.56
* Extrapolated values for observation only (not included in analysis)
13.21 16.31
Standard deviation 1.24 1.23 1.58 2.34 1.05 0.65 1.19 2.31
Wanta estimate (ml*kg"1»min"1)
3.7* 5.9* 8.1 10.3 3.2* 5.0* 6.8 8.6
Difference (percent) Act. vs. Est. V02
- - 45.08 41.81 - - 48.52 47.27
Grade = -2.5 Grade = -5.0°
Actual Wanta
Figure 2. Mean VO2 observed versus VO2 predicted from the Wanta equation for negative grades.
11

An ANOVA performed on the VO2 for positive grades revealed a significant main effect for Pandolf versus actual V02, F(l,7) - \l.\A,p = .004. There were also significant main effect differences between speeds, F (3,21) = 483.47,p < .01 and grades, F (2,14) = 283.28,/? < .01. There was a significant Pandolf versus Actual x Grade interaction, F (2,14), = 57.49,/? < .01 as illustrated in Figure 3. This illustrates that as grade increases, VO2 estimates from the Pandolf equation rise more rapidly than the actual VO2.
c E
b
CM o >
■ Pandolf ■ Actual
2.5
Grade (degrees)
5.0
Figure 3. Pandolf versus Actual x Grade interaction.
There was no significant Pandolf versus Actual x Speed interaction, F (3,21) = 1.43,/? = .26, but there was a Grade x Speed interaction, F (6,42) = 19.44,/? <.01 as illustrated in Figure 4.
c E
J?
CM
O >
Speed (mph)
Figure 4. Grade x Speed interaction.
12

There was a significant three-way interaction for Pandolf versus Actual x Grade x Speed,
F (6,42) = 6.22,p < .01 as illustrated in Figure 5.
Grade Actual 0° Pandolf 0° Actual 2.5° Pandolf 2.5° Actual 5.0° Pandolf 5.0°
2.5 3.5
Speed (mph)
Figure 5. Three-way interaction for Pandolf versus Actual x Grade x Speed.
DISCUSSION
The results of the ANOVA are shown in Figures 3,4, and 5. Figure 3 shows that the actual VO2 values recorded by the Oxylog are lower than the estimated VO2 values from the Pandolf equation at 2.5° and 5.0° grades. This illustrates that the Uniport does not provide a sufficient amount of energy extraction as the grade increases and suggests that error increases as the grade increases. As indicated in the results, there was no significant Pandolf versus Actual x Speed interaction, which illustrates that the Uniport provides sufficient energy extraction at the speeds tested.
Also striking is the fact that in downhill movement there were large discrepancies between the actual energy cost on the Uniport and values calculated from the Wanta equation as shown in Figure 2. These mismatches ranged from 40% to 50% with the actual VO2 values higher than the Wanta estimates. There was, however, a 20% to 40% decrease in VO2 when actual VO2 values were compared at positive and negative grades and a 14% decrease in VO2 when actual VO2 values were compared at the 0° grade to actual VO2 values for negative grades, indicating that the Uniport did attempt to simulate downhill walking (see Figures 1 and 2).
Overall, these results indicate that further research must be conducted to determine how to change energy cost as grade is changed. Energy extraction must be increased on the uphill and
13

decreased on the downhill. Downhill energy cost will be particularly difficult to simulate since the relationship between energy cost and negative grade is not linear (Wanta et al., 1993). The Wanta equation provides oxygen uptake but the relationship between effort felt and energy expenditure would have to be programmed into the Uniport's software to obtain a more accurate measure of energy cost. The results from this test will serve as a baseline for adjusting the Uniport's software and hardware for a higher precision of energy extraction.
14

REFERENCES
American College of Sports Medicine (1991). Guidelines for exercise testing and prescription. Fourth Edition.
Duggan, A., & Haisman, M.F. (1992). Prediction of the metabolic cost of walking with and without loads. Ergonomics. 35C4J 417-426.
Goldman, R.F., & Iampietro P.P. (1962). Energy Cost of Load Carriage. Journal of Applied Physiology. 17. 675-676.
Jones, B.H., Toner, M.M., Daniels, W.L., & Knapik, J.J. (1984). The energy cost and heart-rate response of trained and untrained subjects walking and running in shoes and boots, Ergonomics. 27(81 895-902.
Lusk, G. (1928). The Elements of the Science of Nutrition (4th ed., pp 61-74). New York: Academic Press.
McArdle, W.D., Katch, F.I., & Katch, V.L. (1991). Exercise physiology: Energy, nutrition, and human performance. Philadelphia: Lea & Febiger.
Pandolf, K.B., Givoni, B., & Goldman, R.F. (1977). Predicting energy expenditure with loads while standing or walking very slowly. Journal of Applied Physiology. 43(41 577-581.
Pimental, N.A., Shapiro, Y., & Pandolf, K.B. (1982). Comparison of uphill and downhill walking and concentric and eccentric cycling. Ergonomics. 25(51373-380.
Soule R.G., Pandolf, K.B., & Goldman R.F. (1978). Energy cost of heavy load carriage. Ergonomics. 21.373-381.
Wanta, D.M., Nagle, F.J., & Webb, P. (1993). Metabolic response to graded downhill walking. Medicine and Science in Sports and Exercise. 25(11159-162.
15

BIBLIOGRAPHY
Bobbert, A.C. (1960). Energy expenditure in level and grade walking. Journal of Applied Physiology. 15(g). 1015-1021.
Givoni, B. & Goldman, R.F. (1971). Predicting metabolic energy cost. Journal of Applied Physiology. 30(3). Natick, MA: U.S. Army Research Institute of Environmental Medicine.
Malhotra, M., Ramaswamy, S., & Ray, S. (1962). Influence of body weight on energy expenditure. Journal of Applied Physiology. 17(3\ 433-435.
Patton, J.F., Kaszuba, R.P., Mello, P., & Reynolds, K.L. (1991). Physiological responses to prolonged treadmill walking with external loads. European Journal of Applied Physiology. SL 89-93.
Van Der Walt, W.H., & Wyndham, C.H. (1973). An equation for prediction of energy expenditure of walking and running. Journal of Applied Physiology. 34(51 559-563.
Vogel, J.A., Patton, J.F., Mello, R.P., & Daniels, W.L.(1986). An analysis of aerobic capacity in a large United States population. Journal of Applied Physiology. 60(21494-500.
Workman, J.M., & Armstrong, B.W. (1963). Oxygen cost of treadmill walking. Journal of Applied Physiology. 18(4\ 798-803.
17

APPENDIX A
UNIPORT WITH MODEL Ml 6 RIFLE
19
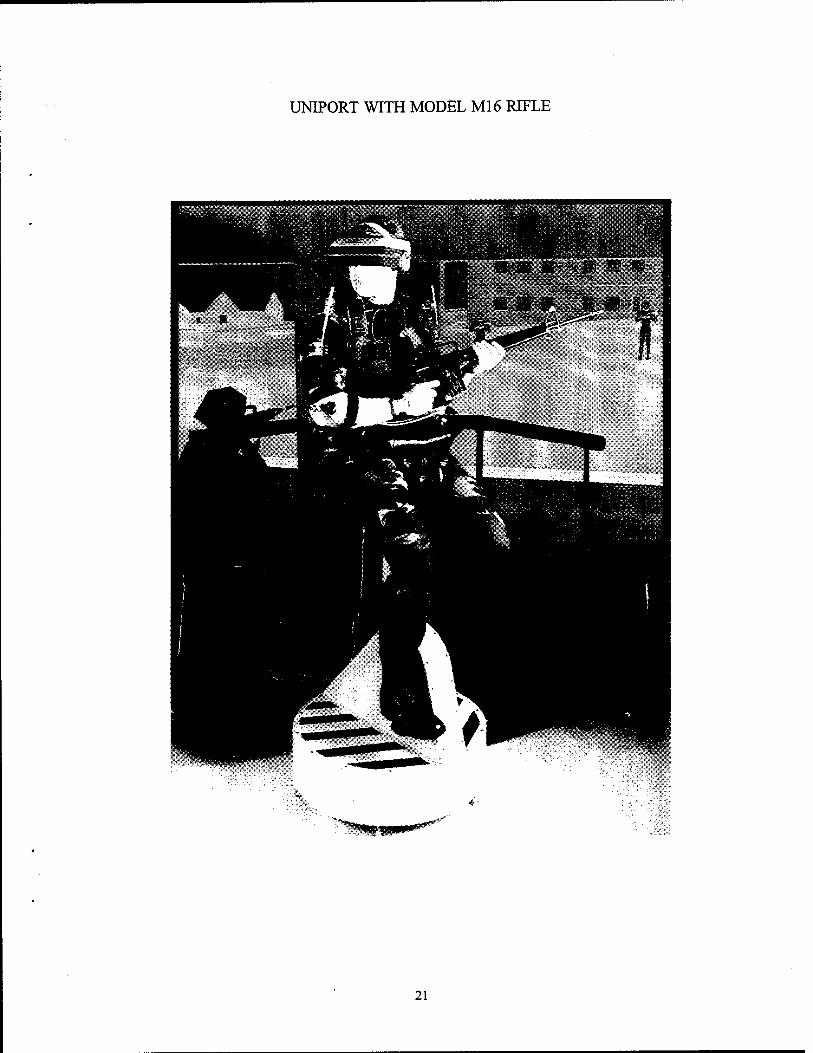
UNIPORT WITH MODEL M16 RIFLE
21

APPENDIX B
VALIDATION OF ACSM EQUATION
23

VALIDATION OF ACSM EQUATION
The constants from the ACSM equation were validated by the present authors against
energy expenditure data obtained in previous studies. The data used to validate the horizontal component were taken from Duggan and Haisman (1992) and Jones, Toner, Daniels, and Knapik (1984). In these studies, subjects performed level walking on the treadmill at different speeds. A horizontal component (HC) was calculated for each subject by plugging the given data into the ACSM equation and solving for HC. Additional load carried by subjects was added to the total body weight (Soule, Pandolf, & Goldman, 1978; Goldman & Iampietro, 1962).
V02 = (Speed x HC) + 3.5
(VQ2 - 3.5) HC =
Speed
(6)
(7)
Results of the horizontal component calculations are shown in Table B-l. The results from this empirical validation indicate that the ACSM estimate of 0.1 for the horizontal component of the equations is a close approximation, although it tends to slightly underestimate the values of Duggan and Haisman (1992) and Jones et al. (1984).
Table B-l
Horizontal Component Calculations
Subject Load mass Speed body mass carried V02 Horizontal
(m^mhr1) (kg) (kg) (ml'kg^nriin-1) component
Duggan & Haisman 1992 99.23 70.42 4.09 12.74 0.13 99.23 70.42 24.71 12.06 0.12 99.23 70.42 24.68 12.9 0.13 99.23 63.49 26.92 13.8 0.14 99.23 63.44 29.70 13.9 0.14 99.23 63.60 29.62
Jones et al. 13.5
,1984 0.14
67.0 75.1 0 7.00 0.10 67.0 75.1 0 7.6 0.11 93.8 75.1 0 10.7 0.11 93.8 75.1 0 11.9 0.13 Note. The VC >2 data are with the resti ng component, 3.5, alre ady subtracted.
25

To validate the vertical component (VC), data were taken from Pimental, Shapiro, and
Pandolf (1982). In this investigation subjects walked on level and uphill grades with or without
loads. Similar to the calculations for the HC, VO2, speed, weight, and load were used in addition
to grade for calculating the VC.
V02 = (Speed x 0.1) + (Grade x Speed xVC) + 3.5 (8)
(V02-3.5)-(Speed x 0.1) VC = !—?-, —K— (9)
(Grade x Speed)
The results of vertical component calculations are shown in Table B-2.
Table B-2
Vertical Component Calculations
Speed Weight Load Grade V02 Vertical (m»min_1) (kg) (kg) (percent) (ml*kg~1*min'1) component
Pimental et al., 1982 40.2 70.4 0 10 6.94 1.72 40.2 70.4 0 30 20.06 1.66 40.2 70.4 15.0 5 3.27 1.62 40.2 70.4 15.0 10 6.33 1.57 67.0 70.4 0 5 6.14 1.83 67.0 70.4 0 10 11.25 1.54 67.0 70.4 15 5 4.90 1.47 67.0 70.4 30.0 5 5.33 1.59
Note. TheVC )2 data shown in Table B-2 are with the resting coi nponent, 3.5, and the horizontal component already subtracted.
Results indicate that the 1.8 constant for the vertical component has more variability than
the horizontal component and tends to overestimate the value obtained from the Pimental et al.
(1982) data. However, the constant is a close approximation for a vertical component constant.
26

APPENDIX C
UNIPORT MOBILITY PLATFORM
27

UNIPORT MOBILITY PLATFORM
29

APPENDIX D
0XYL0G2®
31

0XYL0G2®
33

NO. OF COPIES ORGANIZATION
ADMINISTRATOR DEFENSE TECHNICAL INFO CENTER ATTN DTICDDA 8725 JOHN J KINGMAN RD STE 0944 FTBELVOIR VA 22060-6218
DIRECTOR US ARMY RESEARCH LABORATORY ATTN AMSRLCSALTA
RECORDS MANAGEMENT 2800 POWDER MILL RD ADELPHI MD 20783-1197
DIRECTOR US ARMY RESEARCH LABORATORY ATTN AMSRL CI LL
TECHNICAL LIBRARY 2800 POWDER MILL RD ADELPHI MD 207830-1197
DIRECTOR US ARMY RESEARCH LABORATORY ATTN AMSRL CS AL TP
TECH PUBLISHING BRANCH 2800 POWDER MILL RD ADELPHIMD 20783-1197
WALTER REED ARMY INST OF RSCH ATTN SGRD UWI C (COL REDMOND) WASHINGTON DC 20307-5100
NO. OF COPIES
1
ORGANIZATION
US ARMY TROOP SUPPORT CMD NATICK RD&E CENTER ATTN BEHAVIORAL SCI DIV SSD NATICK MA 01760-5020
US ARMY TROOP SUPPORT CMD NATICK RD&E CENTER ATTN TECH LIBRARY (STRNC MIL) NATICK MA 01760-5040
DR RICHARD JOHNSON HEALTH & PERFORMANCE DIVISION USARIEM NATICK MA 01760-5007
STRICOM 12350 RESEARCH PARKWAY ORLANDO FL 32826-3276
GOVT PUBLICATIONS LIBRARY 409 WILSON M UNIVERSITY OF MINNESOTA MINNEAPOLIS MN 55455
NAVAL OCEAN SYSTEMS CENTER ATTN SUZANNE V BEMIS HUMAN FACTORS SCIENTIST CODE 441 HUMAN FACTORS & SPEECH TECH BR 271 CATALINA BLVD SAN DIEGO CA 92152-5000
DR ARTHUR RUBIN NATL INST OF STANDARDS & TECH BUILDING 226 ROOM A313 GAITHERSBURG MD 20899
COMMANDER US ARMY RESEARCH INSTITUTE ATTN PERIZT(DR E M JOHNSON) 5001 EISENHOWER AVENUE ALEXANDRIA VA 22333-5600
COMMANDER US ARMY MATERIEL COMMAND ATTN AMCAM 5001 EISENHOWER AVENUE ALEXANDRIA VA 22333-0001
US ARMY NATICK RD&E CENTER ATTN STRNC YBA NATICK MA 01760-5020
ARLHRED ATTN AMSRL HR MQ ( FLETCHER) NATICK MA
ARLHRED STRICOM FIELD ELEMENT ATTN AMSRL HR MT (A GALBAVY) 12350 RESEARCH PARKWAY ORLANDO FL 32826-3276
ARL HRED USAIC FIELD ELEMENT ATTN AMSRL HR MW (E REDDEN) BUILDING 4 ROOM 349 FTBENNING GA 31905-5400
ARLHRED USASOC FIELD ELEMENT ATTN AMSRL HR MN (F MALKIN) BUILDING D3206 ROOM 503 FORT BRAGG NC 28307-5000
35

NO. OF COPIES ORGANIZATION
ABERDEEN PROVING OROTTNT)
DIRECTOR US ARMY RESEARCH LABORATORY ATTN AMSRLOPAPL (TECH LIB) BLDG305 APGAA
LIBRARY ARL BUILDING 459 APG-AA
36

REPORT DOCUMENTATION PAGE Form Approved OMRNn. 07M-D1RR
Public reporting burden for this collection of information is estimated to average 1 hour per response, including the time for reviewing instructions, searching existing data sources, gathering and maintaining the data needed, and completing and reviewing the collection of information. Send comments regarding this burden estimate or any other aspectof this collection of information, including suggestions for reducing this burden, to Washington Headquarters Services, Directorate for Information Operations and Reports, 1215 Jefferson Davis Highway, Suite 1204, Arlington, VA 22202-4302, and to the Office of Management and Budget, Paperwork Reduction Project (0704-0188), Washington, DC 20503.
1. AGENCY USE ONLY (Leave blank) 2. REPORT DATE
February 1997 3. REPORT TYPE AND DATES COVERED
Final
4. TITLE AND SUBTITLE
Measurement of Energy Expenditure on the Uniport Mobility Platform
5. FUNDING NUMBERS
AMS Code 622716.H700011 PR: 1L162716AH70 PE: 6.27.16
6. AUTHOR(S)
Krausman, A.S.; Savick, D.S.; Leiter, K.L.; Faughn, J.A.; Knapik, J.J.
7. PERFORMING ORGANIZATION NAME(S) AND ADDRESS(ES)
U.S. Army Research Laboratory Human Research & Engineering Directorate Aberdeen Proving Ground, MD 21005-5425
8. PERFORMING ORGANIZATION REPORT NUMBER
9. SPONSORING/MONITORING AGENCY NAME(S) AND ADDRESS(ES)
U.S. Army Research Laboratory Human Research & Engineering Directorate Aberdeen Proving Ground, MD 21005-5425
10. SPONSORING/MONITORING AGENCY REPORT NUMBER
ARL-TR-1263
11. SUPPLEMENTARY NOTES
12a. DISTRIBUTION/AVAILABILITY STATEMENT
Approved for public release; distribution is unlimited.
12b. DISTRIBUTION CODE
13. ABSTRACT (Maximum 200 words)
The objective of this study was to measure energy expenditure on the Uniport mobility platform, a virtual reality device for dismounted infantry soldiers. Eight subjects performed at five grades (-5.0°, -2.5°, 0°, 2.5°, and 5.0°) at four speeds (2.5,3.0, 3.5, and 4.0 mph). An Oxylog" device was used to measure oxygen uptake (VO2). An empirical equation derived by Pandolf et al. (1987) was also used to estimate VO2 for comparison purposes. Analysis of variance indicated that the actual VO2 values recorded by the Oxylog were lower than the estimated VO2 values from the Pandolf equation at 2.5° and 5.0° grades. This illustrates that the Uniport does not provide a sufficient amount of energy extraction as the grade increases and suggests that error increases as the grade increases. There were no differences between speeds for the estimated and actual VO2, which indicates that the Uniport provides sufficient energy extraction at the speeds tested. Appropriate software or hardware adjustments must be developed on the Uniport device to increase energy output when subjects move uphill.
14. SUBJECT TERMS
metabolic cost mobility VO2 metabolic platform virtual reality
15. NUMBER OF PAGES 40
16. PRICE CODE
17. SECURITY CLASSIFICATION OF REPORT
Unclassified
18. SECURITY CLASSIFICATION OF THIS PAGE
Unclassified
19. SECURITY CLASSIFICATION OF ABSTRACT
Unclassified
20. LIMITATION OF ABSTRACT
NSN 7540-01-280-5500 37 Standard Form 298 (Rev. 2-89) Prescribed by ANSI Std. Z39-18 298-102