J/ψ Photoproduction in Peripheral AA Collisions - CERN Indico

arX
iv:h
ep-e
x/02
0100
6v1
4 J
an 2
002
DESY 01-225 ISSN 0418-9833December 2001
Measurement of Dijet Cross Sections in Photoproductionat HERA
H1 Collaboration
Abstract
Dijet cross sections as functions of several jet observables are measured in photoproductionusing the H1 detector at HERA. The data sample comprisese+p data with an integratedluminosity of 34.9 pb−1. Jets are selected using the inclusivek⊥ algorithm with a minimumtransverse energy of25 GeV for the leading jet. The phase space covers longitudinalproton momentum fractionxp and photon longitudinal momentum fractionxγ in the ranges0.05 < xp < 0.6 and0.1 < xγ < 1. The predictions of next-to-leading order perturbativeQCD, including recent photon and proton parton densities, are found to be compatible withthe data in a wide kinematical range.
To be submitted to Eur. Phys. J. C

C. Adloff33, V. Andreev24, B. Andrieu27, T. Anthonis4, V. Arkadov35, A. Astvatsatourov35,A. Babaev23, J. Bahr35, P. Baranov24, E. Barrelet28, W. Bartel10, J. Becker37, A. Beglarian34,O. Behnke13, C. Beier14, A. Belousov24, Ch. Berger1, T. Berndt14, J.C. Bizot26, J. Bohme10,V. Boudry27, W. Braunschweig1, V. Brisson26, H.-B. Broker2, D.P. Brown10, W. Bruckner12,D. Bruncko16, J. Burger10, F.W. Busser11, A. Bunyatyan12,34, A. Burrage18, G. Buschhorn25,L. Bystritskaya23, A.J. Campbell10, S. Caron1, F. Cassol-Brunner22, D. Clarke5, C. Collard4,J.G. Contreras7,41, Y.R. Coppens3, J.A. Coughlan5, M.-C. Cousinou22, B.E. Cox21,G. Cozzika9, J. Cvach29, J.B. Dainton18, W.D. Dau15, K. Daum33,39, M. Davidsson20,B. Delcourt26, N. Delerue22, R. Demirchyan34, A. De Roeck10,43, E.A. De Wolf4,C. Diaconu22, J. Dingfelder13, P. Dixon19, V. Dodonov12, J.D. Dowell3, A. Droutskoi23,A. Dubak25, C. Duprel2, G. Eckerlin10, D. Eckstein35, V. Efremenko23, S. Egli32, R. Eichler36,F. Eisele13, E. Eisenhandler19, M. Ellerbrock13, E. Elsen10, M. Erdmann10,40,e, W. Erdmann36,P.J.W. Faulkner3, L. Favart4, A. Fedotov23, R. Felst10, J. Ferencei10, S. Ferron27,M. Fleischer10, P. Fleischmann10, Y.H. Fleming3, G. Flugge2, A. Fomenko24, I. Foresti37,J. Formanek30, G. Franke10, G. Frising1, E. Gabathuler18, K. Gabathuler32, J. Garvey3,J. Gassner32, J. Gayler10, R. Gerhards10, C. Gerlich13, S. Ghazaryan4,34, L. Goerlich6,N. Gogitidze24, C. Grab36, V. Grabski34, H. Grassler2, T. Greenshaw18, G. Grindhammer25,T. Hadig13, D. Haidt10, L. Hajduk6, J. Haller13, W.J. Haynes5, B. Heinemann18,G. Heinzelmann11, R.C.W. Henderson17, S. Hengstmann37, H. Henschel35, R. Heremans4,G. Herrera7,44, I. Herynek29, M. Hildebrandt37, M. Hilgers36, K.H. Hiller35, J. Hladky29,P. Hoting2, D. Hoffmann22, R. Horisberger32, A. Hovhannisyan34, S. Hurling10, M. Ibbotson21,C. Issever7, M. Jacquet26, M. Jaffre26, L. Janauschek25, X. Janssen4, V. Jemanov11,L. Jonsson20, C. Johnson3, D.P. Johnson4, M.A.S. Jones18, H. Jung20,10, D. Kant19,M. Kapichine8, M. Karlsson20, O. Karschnick11, F. Keil14, N. Keller37, J. Kennedy18,I.R. Kenyon3, S. Kermiche22, C. Kiesling25, P. Kjellberg20, M. Klein35, C. Kleinwort10,T. Kluge1, G. Knies10, B. Koblitz25, S.D. Kolya21, V. Korbel10, P. Kostka35, S.K. Kotelnikov24,R. Koutouev12, A. Koutov8, H. Krehbiel10, J. Kroseberg37, K. Kruger10, T. Kuhr11, T. Kurca16,D. Lamb3, M.P.J. Landon19, W. Lange35, T. Lastovicka35,30, P. Laycock18, E. Lebailly26,A. Lebedev24, B. Leißner1, R. Lemrani10, V. Lendermann7, S. Levonian10, M. Lindstroem20,B. List36, E. Lobodzinska10,6, B. Lobodzinski6,10, A. Loginov23, N. Loktionova24,V. Lubimov23, S. Luders36, D. Luke7,10, L. Lytkin12, H. Mahlke-Kruger10, N. Malden21,E. Malinovski24, I. Malinovski24, S. Mangano36, R. Maracek25, P. Marage4, J. Marks13,R. Marshall21, H.-U. Martyn1, J. Martyniak6, S.J. Maxfield18, D. Meer36, A. Mehta18,K. Meier14, A.B. Meyer11, H. Meyer33, J. Meyer10, P.-O. Meyer2, S. Mikocki6, D. Milstead18,T. Mkrtchyan34, S. Mohrdieck11, M.N. Mondragon7, F. Moreau27, A. Morozov8, J.V. Morris5,K. Muller37, P. Murın16,42, V. Nagovizin23, B. Naroska11, J. Naumann7, Th. Naumann35,G. Nellen25, P.R. Newman3, F. Niebergall11, C. Niebuhr10, O. Nix14, G. Nowak6, J.E. Olsson10,D. Ozerov23, V. Panassik8, C. Pascaud26, G.D. Patel18, M. Peez22, E. Perez9, A. Petrukhin35,J.P. Phillips18, D. Pitzl10, R. Poschl26, I. Potachnikova12, B. Povh12, G. Radel1,J. Rauschenberger11, P. Reimer29, B. Reisert25, D. Reyna10, C. Risler25, E. Rizvi3,P. Robmann37, R. Roosen4, A. Rostovtsev23, S. Rusakov24, K. Rybicki6, D.P.C. Sankey5,S. Schatzel13, J. Scheins1, F.-P. Schilling10, P. Schleper10, D. Schmidt33, D. Schmidt10,S. Schmidt25, S. Schmitt10, M. Schneider22, L. Schoeffel9, A. Schoning36, T. Schorner25,V. Schroder10, H.-C. Schultz-Coulon7, C. Schwanenberger10, K. Sedlak29, F. Sefkow37,V. Shekelyan25, I. Sheviakov24, L.N. Shtarkov24, Y. Sirois27, T. Sloan17, P. Smirnov24,Y. Soloviev24, D. South21, V. Spaskov8, A. Specka27, H. Spitzer11, R. Stamen7, B. Stella31,
1
J. Stiewe14, U. Straumann37, M. Swart14, S. Tchetchelnitski23, G. Thompson19,P.D. Thompson3, N. Tobien10, F. Tomasz14, D. Traynor19, P. Truol37, G. Tsipolitis10,38,I. Tsurin35, J. Turnau6, J.E. Turney19, E. Tzamariudaki25, S. Udluft25, M. Urban37, A. Usik24,S. Valkar30, A. Valkarova30, C. Vallee22, P. Van Mechelen4, S. Vassiliev8, Y. Vazdik24,A. Vichnevski8, K. Wacker7, J. Wagner10, R. Wallny37, B. Waugh21, G. Weber11, M. Weber14,D. Wegener7, C. Werner13, N. Werner37, M. Wessels1, G. White17, S. Wiesand33, T. Wilksen10,M. Winde35, G.-G. Winter10, Ch. Wissing7, M. Wobisch10, E.-E. Woehrling3, E. Wunsch10,A.C. Wyatt21, J.Zacek30, J. Zalesak30, Z. Zhang26, A. Zhokin23, F. Zomer26, andM. zur Nedden10
1 I. Physikalisches Institut der RWTH, Aachen, Germanya
2 III. Physikalisches Institut der RWTH, Aachen, Germanya
3 School of Physics and Space Research, University of Birmingham, Birmingham, UKb4 Inter-University Institute for High Energies ULB-VUB, Brussels; Universiteit Antwerpen(UIA), Antwerpen; Belgiumc5 Rutherford Appleton Laboratory, Chilton, Didcot, UKb
6 Institute for Nuclear Physics, Cracow, Polandd
7 Institut fur Physik, Universitat Dortmund, Dortmund, Germanya
8 Joint Institute for Nuclear Research, Dubna, Russia9 CEA, DSM/DAPNIA, CE-Saclay, Gif-sur-Yvette, France10 DESY, Hamburg, Germany11 Institut fur Experimentalphysik, Universitat Hamburg, Hamburg, Germanya
12 Max-Planck-Institut fur Kernphysik, Heidelberg, Germany13 Physikalisches Institut, Universitat Heidelberg, Heidelberg, Germanya
14 Kirchhoff-Institut fur Physik, Universitat Heidelberg, Heidelberg, Germanya
15 Institut fur experimentelle und Angewandte Physik, Universitat Kiel, Kiel, Germany16 Institute of Experimental Physics, Slovak Academy of Sciences, Kosice, Slovak Republice,f
17 School of Physics and Chemistry, University of Lancaster, Lancaster, UKb18 Department of Physics, University of Liverpool, Liverpool, UKb
19 Queen Mary and Westfield College, London, UKb
20 Physics Department, University of Lund, Lund, Swedeng
21 Physics Department, University of Manchester, Manchester, UKb
22 CPPM, CNRS/IN2P3 - Univ Mediterranee, Marseille - France23 Institute for Theoretical and Experimental Physics, Moscow, Russial24 Lebedev Physical Institute, Moscow, Russiae
25 Max-Planck-Institut fur Physik, Munchen, Germany26 LAL, Universite de Paris-Sud, IN2P3-CNRS, Orsay, France27 LPNHE, Ecole Polytechnique, IN2P3-CNRS, Palaiseau, France28 LPNHE, Universites Paris VI and VII, IN2P3-CNRS, Paris, France29 Institute of Physics, Academy of Sciences of the Czech Republic, Praha, Czech Republice,i
30 Faculty of Mathematics and Physics, Charles University, Praha, Czech Republice,i
31 Dipartimento di Fisica Universita di Roma Tre and INFN Roma 3, Roma, Italy32 Paul Scherrer Institut, Villigen, Switzerland33 Fachbereich Physik, Bergische Universitat Gesamthochschule Wuppertal, Wuppertal,Germany34 Yerevan Physics Institute, Yerevan, Armenia
2

35 DESY, Zeuthen, Germany36 Institut fur Teilchenphysik, ETH, Zurich, Switzerlandj37 Physik-Institut der Universitat Zurich, Zurich, Switzerlandj
38 Also at Physics Department, National Technical University, Zografou Campus, GR-15773Athens, Greece39 Also at Rechenzentrum, Bergische Universitat Gesamthochschule Wuppertal, Germany40 Also at Institut fur Experimentelle Kernphysik, Universitat Karlsruhe, Karlsruhe, Germany41 Also at Dept. Fis. Ap. CINVESTAV, Merida, Yucatan, Mexicok42 Also at University of P.J.Safarik, Kosice, Slovak Republic43 Also at CERN, Geneva, Switzerland44 Also at Dept. Fis. CINVESTAV, Mexico City, Mexicok
a Supported by the Bundesministerium fur Bildung und Forschung, FRG, under contractnumbers 05 H1 1GUA /1, 05 H1 1PAA /1, 05 H1 1PAB /9, 05 H1 1PEA /6,05 H1 1VHA /7 and05 H1 1VHB /5b Supported by the UK Particle Physics and Astronomy ResearchCouncil, and formerly by theUK Science and Engineering Research Councilc Supported by FNRS-FWO-Vlaanderen, IISN-IIKW and IWTd Partially Supported by the Polish State Committee for Scientific Research, grant no.2P0310318 and SPUB/DESY/P03/DZ-1/99 and by the German Bundesministerium fur Bildungund Forschunge Supported by the Deutsche Forschungsgemeinschaftf Supported by VEGA SR grant no. 2/1169/2001g Supported by the Swedish Natural Science Research Councili Supported by the Ministry of Education of the Czech Republicunder the projectsINGO-LA116/2000 and LN00A006, by GA AVCR grant no B1010005 and by GAUK grant no173/2000j Supported by the Swiss National Science Foundationk Supported by CONACyTl Partially Supported by Russian Foundation for Basic Research, grant no. 00-15-96584
3
1 Introduction
In QCD (Quantum Chromo Dynamics) the photoproduction of jets with high transverse energyis described by the hard interaction of real photons with quarks and gluons inside the proton. In-teractions with two outgoing partons of large transverse momentum are due to direct processes,such asγq → gq (QCD-Compton effect) andγg → qq (photon-gluon fusion) and resolvedprocesses where the photon first splits into a quark pair (or higher multiplicity fluctuation) andone of the resulting partons subsequently scatters off a parton in the proton. The calculation ofthe latter processes can be approximated by ascribing parton densities to the photon, which alsoinclude the inherently non-perturbative aspects of the photon structure.
In analogy to the proton case parton densities of the photon depend on a factorization scaleµγ and onxγ , the longitudinal momentum fraction of the photon taken by the interacting par-ton. The limiting case of direct interactions is given byxγ = 1. At HERA these photopro-duction reactions can be investigated in inelastic electron (positron) proton reactions at verysmall squared four-momentum transfersQ2. Starting from the first investigation of this kind atHERA [1] the comparison of the predictions of QCD with the results has been a central topic ofinterest [2–4]. These investigations are particularly interesting, because previous measurementsof high transverse energy jet production inep andpp scattering were not fully described byQCD calculations [5–7].
High transverse energy jets provide a natural hard scale forperturbative QCD calculations.Such calculations have been performed for direct and resolved processes in leading (LO) andnext-to-leading (NLO) order. The measurement of jet cross sections at high transverse energypresented in this paper can therefore be used to test the current predictions of NLO perturbativeQCD and the parameterizations of photon and proton parton densities at large scales with aprecision of typically 10%. Photon quark densities have been determined in experiments ate+e−-colliders [8] which investigate the photon structure function F γ
2 , wherexγ values up to0.8 and scales up to500 GeV2 have been reached. In comparison the analysis presented hereextends thexγ range up to1 at scales between600 and6000 GeV2, where the quark densityparameterizations of the photon are presently not well constrained by measurements. In contrastto theF γ
2 measurements, the photoproduction of jets is directly sensitive to the gluon densityof the photon, which is poorly known to date. Furthermore ourdata are sensitive to the partondensities of the proton at fractional momentum valuesxp up to0.6. In this kinematical regime,the quark densities are well known from deeply inelastic scattering data, while the gluon densityhas uncertainties of the order 10 to 50% [9]. Photoproduction data can thus be used to constrainthe parton density functions in regions where only few measurements are presently available.However, detailed parton densities can not be extracted from these data alone.
This paper is based on ane+p data sample collected with the H1 detector in the years 1995-1997 and corresponds to an integrated luminosity of 34.9 pb−1. It presents dijet cross sectionsas a function of jet observables with mean jet transverse energies20 < ET < 80 GeV, observedxγ values0.1 < xγ < 1 and values ofxp ranging from0.05 to 0.6. The two jets considered inthe investigated processep → e jet jetX are defined as the two jets with the highest transverseenergy1.
1A similar analysis has recently been made available [10].
4
2 Jets in Photoproduction
2.1 Cross sections and observables
The cross section for the photoproduction of hard jets in electron-proton collisions,σep, can becalculated from the photon-proton scattering result,σγp, using the factorization ansatz
σep→eX =
∫dyfγ,e(y)σγp(y) . (1)
Here the usual variabley of deeply inelastic scattering is interpreted as the longitudinal momen-tum fraction of the incoming electron taken by the photon andfγ,e is the photon flux calculatedin the Weizsacker-Williams approximation [11–13]. The hadronic photon-proton jet cross sec-tion is obtained as the convolution of the partonic cross sections with the parton momentumdistributions of the protonfi/p and the photonfj/γ . As outlined in the introduction it is dividedinto a sum of two components, the direct partσdirect
γp , where the photon directly interacts with aparton of the proton and the resolved partσresolved
γp , where one of the partons inside the photoninteract with a parton of the proton. This distinction is unambiguously defined in leading orderonly and depends on the photon factorization scaleµγ. The two components can be expressedas:
σdirectγp =
∑i
∫dxpfi/p(xp, µp)σiγ(s, µγ, µp, αs(µr), µr) (2)
σresolvedγp =
∑j,i
∫dxγfj/γ(xγ , µγ)dxpfi/p(xp, µp)σij(s, µγ, µp, αs(µr), µr) . (3)
The squared centre-of-mass energy of the hard subprocess iss = xpxγys, where√
s is the totalcentre-of-mass energy in theep-system, i.e. 300 GeV for this analysis. The proton factorizationscale isµp and the renormalization scale isµr. The partonic cross sectionsσ can be expandedas a perturbative series in powers ofαs and have been calculated up to the next-to-leading orderin QCD [14–17].
The total cross sections on the left hand side of equation 1 are obtained by integrating overy,xp andxγ . The partonic cross sectionsσiγ andσij contain a further integration over an internaldegree of freedom, e.g.cos θ∗, the scattering angle in the centre-of-mass system of the partonictwo body reaction, or the transverse energy. More detailed information on the reaction dynamicsis obtained by measuring differential cross sections in these kinematical observables. In orderto avoid singularities in the partonic cross sections a minimum cut inθ∗ or in the transverseenergy of the outgoing partons has to be applied.
The two scaled longitudinal parton momentaxγ andxp are calculated from the jets producedin the hard subprocess, using the definition
xγ =1
2Eey(ET,1e
−η1 + ET,2e−η2) (4)
xp =1
2Ep(ET,1e
η1 + ET,2eη2) (5)
5
HereET,1 andET,2 are the transverse energies of the two jets of the hard subprocess,η1 andη2
are their pseudorapidities in the laboratory frame (η = − ln(tan θ/2)) andEe andEp are theenergies of the electron and proton beams2. These relations are used as definitions of observ-ables in all orders and are easily derived for2 → 2 processes, where the transverse energies ofthe jets are equal. The pseudorapidities of the jets are related toθ∗ via
cos θ∗ = | tanh((η1 − η2)/2)| . (6)
In principle one could measure the dependence of the fourfold differential cross sectiondσγp/dydxγdxpd cos θ∗ on all four variables. This, however, would require a much larger dataset than presently available. Therefore in this paper more inclusive quantities are presented. Thedistribution of the invariant mass of the two jets with the highest transverse energies,MJJ , themean transverse energy of the two leading jetsET,mean and the transverse energy distributionof the highest transverse energy jet,ET,max, are studied. The cross section differential in theaverage value of the pseudorapiditiesη = (η1 + η2)/2 is particularly sensitive to parton densityfunctions. It is thus presented for different photon-proton centre-of-mass energies (y regions)and different scales (ET,max regions), cf. equations 4 and 5.
Differential cross sections inxγ andxp are measured in different scale regions (ET,max re-gions) and for differentxγ or xp cut-off values. The angleθ∗ is sensitive to the dynamics of jetproduction and the corresponding differential cross section is therefore evaluated for differentxγ regions for allMJJ and in addition with a cut inMJJ . Thecos θ∗ distribution could be in-fluenced by the production ofW or Z0 bosons, whose hadronic decays have a different angulardistribution from that expected for QCD dijet production. Using the EPVEC Monte Carlo gen-erator [18], the contribution ofW bosons is estimated to be 5-6 events. TheZ0 contribution isexpected to be negligible. The background from these processes is therefore not considered inthe following.
In the present analysis jets are defined using the inclusivek⊥ algorithm as proposed in[19, 20]. The application of this algorithm has become standard in jet analyses at HERA [21].It utilizes a definition of jets in which not all particles areassigned to hard jets. Here it isapplied in the laboratory frame with the separation parameter set to 1 and using anET weightedrecombination scheme in which the jets are considered massless.
2.2 QCD Predictions and Models
To simulate the direct and resolved photoproduction of jets, the PYTHIA 5.7 [22] and HERWIG5.9 [23] event generators were used followed by a full detector simulation [24] of all MonteCarlo events. Both programs contain the Born level QCD hard scattering matrix elements,regulated by a minimum cut-off in transverse momentum. Leading logarithmic parton showersare used to represent higher order QCD radiation. GRV-LO [25, 26] parton density functions(pdfs) for the proton and photon were chosen. The Lund Stringmodel is applied in PYTHIA tohadronize the outgoing partons, while in HERWIG the clusterhadronization approach is used.
2The coordinate system is centered at the nominal interaction point with the positivez direction along theincident proton beam. The polar angleθ is defined with respect to the positivez axis.
6
Multiple interactions between the proton and the resolved photon are dealt with in PYTHIA byadding additional interactions between spectator partonswithin the same event. These processesare calculated by extending the perturbative parton-parton scattering to a lowET cut-off.
In HERWIG multiple interactions are included by producing in a fractionP ′ of the resolvedevents so calledsoft underlying events. These interactions are parameterized using experimentalresults of soft hadron-hadron scattering. The effect of multiple interactions is tested by com-paring, in the data and in the HERWIG calculations, the energy flow distributions around thejet axis with and without a fractionP ′ of events containing the soft underlying event. ForP ′
∼30-35% these distributions are found to be well described for all regions ofxγ . The differ-ence of the calculated HERWIG cross sections with and without 35% of soft underlying eventsis below 10% forxγ between 0.3-0.8 and 10-20% forxγ < 0.3. Forxγ > 0.8 the difference isnegligible. PYTHIA is also able to describe these distributions.
The goal of this analysis is the comparison of the measured cross sections to perturbativeQCD calculations at the parton level. The LO and NLO dijet cross sections were computedusing a program based on the subtraction method [14,27] for the analytic cancellation of infraredsingularities. In calculating LO and NLO cross sections a 2-loop αs was taken with 5 activeflavours.ΛQCD was set to0.226 GeV (αs(MZ) = 0.118), which is the value used in the protonparton density functions. CTEQ5M [28] parton density functions were chosen for the protonwhereas MRST99 [29] parton density functions were selectedto test the dependence of theNLO cross sections on the proton pdfs. For the photon we choose GRV-HO [30] as a mainsetting and the parameterization of AFG-HO [31] to study thedependence of the results on thechoice of the photon pdfs. The renormalization scaleµr and the factorization scalesµp andµγ
were, event by event, set to the sum of the transverse energies of the outgoing partons dividedby two. The QCD program allows the variation of this common scale. It was varied from0.5 to 2 times the default scale to estimate the scale uncertainty in the NLO calculation. Thisuncertainty turned out to vary between±10 and±20% in the measured kinematic range.
In addition the data are compared to the predictions of NLO QCD corrected for hadroniza-tion effects, which are defined as the ratio of the cross sections with jets reconstructed fromhadrons and from partons before hadronization. The hadronization effects are calculated withPYTHIA and HERWIG and the mean value of the two predictions isused for corrections. Herethe difference between the two Monte Carlo models is in general very small and at maximum10%. The jets built out of partons are found to be very well correlated with the jets built out ofhadrons.
3 Experimental Technique
3.1 H1 Detector
The H1 detector is described in detail in [32,33]. Only thosecomponents relevant to the presentanalysis are briefly described here. The Liquid Argon (LAr ) [34] and SpaCal [35] calorimeterswere used to trigger events, to reconstruct the hadronic energy of the final state and to selectphotoproduction events by eliminating events with an identified scattered positron. The LAr
7
calorimeter covers the polar angle range4◦ < θ < 154◦ with full azimuthal acceptance. Thejet energy calibration agrees at the 2% level with the Monte Carlo simulation as determinedby the transverse energy balance between jet and electron for deeply inelastic scattering eventsand by the transverse energy balance between the two jets forthe photoproduction sample indifferent kinematic regions. The angular region153◦ < θ < 177.8◦ is covered by the SpaCal,a lead/scintillating-fibre calorimeter. It has a hadronic energy scale uncertainty of 8%. Thecentral tracking detector (CJC) was used to reconstruct theinteraction vertex and to supplementthe measurement of hadronic energy flow. The CJC consists of two concentric cylindrical driftchambers, coaxial with the beam-line, with a polar angle coverage of15◦ < θ < 165◦. Theentire CJC is immersed in a 1.15 T magnetic field. The luminosity determination is based onthe measurement of theep → epγ Bethe-Heitler process, where the positron and photon aredetected in calorimeters located downstream of the interaction point ine-beam direction.
3.2 Event Selection
The data sample was collected at HERA with the H1 detector in the years 1995-97, whenprotons of 820 GeV energy collided with positrons of 27.6 GeVenergy resulting in a centre-of-mass energy of 300 GeV. The events were triggered on the basis of high transverse energydeposits in the LAr calorimeter. The trigger efficiencies were above 94% for the event sampledescribed in this analysis. Energy deposits in the calorimeters and tracks in the CJC were com-bined in a manner that avoids double counting to reconstructthe hadronic energy of events [36].
It was required that an event vertex was reconstructed within 35 cm of the nominalz po-sition of the vertex. The most significant background in the data sample arises from neutralcurrent deeply inelastic scattering events, and was suppressed by removing events with an elec-tron identified in the LAr calorimeter or SpaCal and by requiring y < 0.9, with y reconstructedusing hadronic variables [37]. This reduces the backgroundto less than 1% for the total sam-ple. In the region with the highesty at low η the remaining background was calculated to beabout 5% based on deeply inelastic scattering dijet data andthe ARIADNE [38] Monte Carlointerfaced with DJANGO [39]. It was subtracted statistically. After applying a cut on themissing transverse energyET,miss < 20 GeV the remaining charged current (ep → νX) andnon-ep scattering background was found to be negligible. Events induced by cosmic rays wereremoved.
Asymmetric cuts on theET of the two jets with the highest transverse energies are applied toavoid regions of phase space affected by uncertainties in the NLO calculation [14]. On the otherhand a highly asymmetric cut causes large NLO corrections and a pronounced dependence onthe choice of scale. The jet selection criteria therefore required anET of the highest transverseenergy jetET,max > 25 GeV, and the transverse energy of the second highest transverse energyjet ET,second > 15 GeV. When the cut onET,second is varied between±5 GeV, the ratio of themeasured cross sections to the theoretical prediction varies by up to 10% forxγ < 0.8 and byup to 3% forxγ > 0.8.
The pseudorapidity of each jetηi was restricted to−0.5 < ηi < 2.5. All jets are thus wellcontained in the LAr calorimeter. The measured kinematic region was restricted to0.1 < y <0.9 andQ2 < 1 GeV2, as given by the acceptance for electrons in the LAr and Spacal. Thekinematic range of the measured dijet cross sections is summarized in Table 1. Applying thesecuts the total number of events measured was 5265.
8
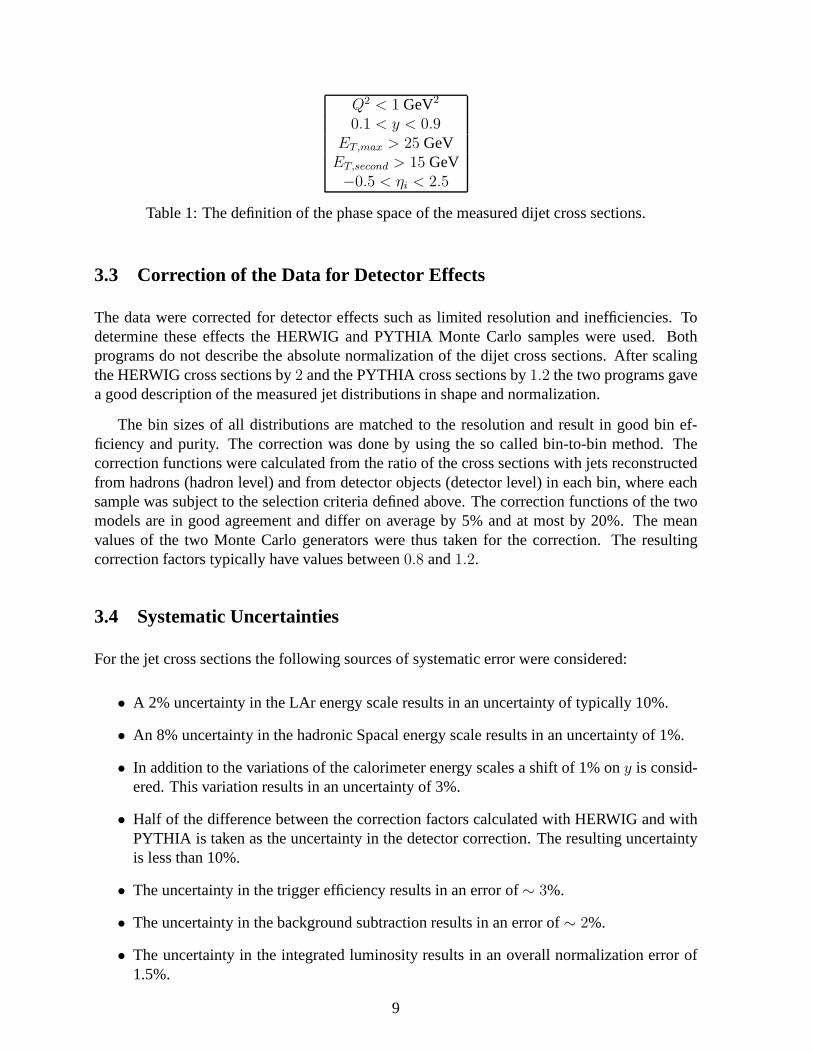
Q2 < 1 GeV2
0.1 < y < 0.9ET,max > 25 GeV
ET,second > 15 GeV−0.5 < ηi < 2.5
Table 1: The definition of the phase space of the measured dijet cross sections.
3.3 Correction of the Data for Detector Effects
The data were corrected for detector effects such as limitedresolution and inefficiencies. Todetermine these effects the HERWIG and PYTHIA Monte Carlo samples were used. Bothprograms do not describe the absolute normalization of the dijet cross sections. After scalingthe HERWIG cross sections by2 and the PYTHIA cross sections by1.2 the two programs gavea good description of the measured jet distributions in shape and normalization.
The bin sizes of all distributions are matched to the resolution and result in good bin ef-ficiency and purity. The correction was done by using the so called bin-to-bin method. Thecorrection functions were calculated from the ratio of the cross sections with jets reconstructedfrom hadrons (hadron level) and from detector objects (detector level) in each bin, where eachsample was subject to the selection criteria defined above. The correction functions of the twomodels are in good agreement and differ on average by 5% and atmost by 20%. The meanvalues of the two Monte Carlo generators were thus taken for the correction. The resultingcorrection factors typically have values between0.8 and1.2.
3.4 Systematic Uncertainties
For the jet cross sections the following sources of systematic error were considered:
• A 2% uncertainty in the LAr energy scale results in an uncertainty of typically 10%.
• An 8% uncertainty in the hadronic Spacal energy scale results in an uncertainty of 1%.
• In addition to the variations of the calorimeter energy scales a shift of 1% ony is consid-ered. This variation results in an uncertainty of 3%.
• Half of the difference between the correction factors calculated with HERWIG and withPYTHIA is taken as the uncertainty in the detector correction. The resulting uncertaintyis less than 10%.
• The uncertainty in the trigger efficiency results in an errorof ∼ 3%.
• The uncertainty in the background subtraction results in anerror of∼ 2%.
• The uncertainty in the integrated luminosity results in an overall normalization error of1.5%.
9
The statistical and all systematic errors are added in quadrature. The resulting total uncer-tainty ranges from 10 to 30%, where the systematic contribution is dominated by uncertaintiesin the calorimeter energy scales and in the correction to thehadron level.
4 Results
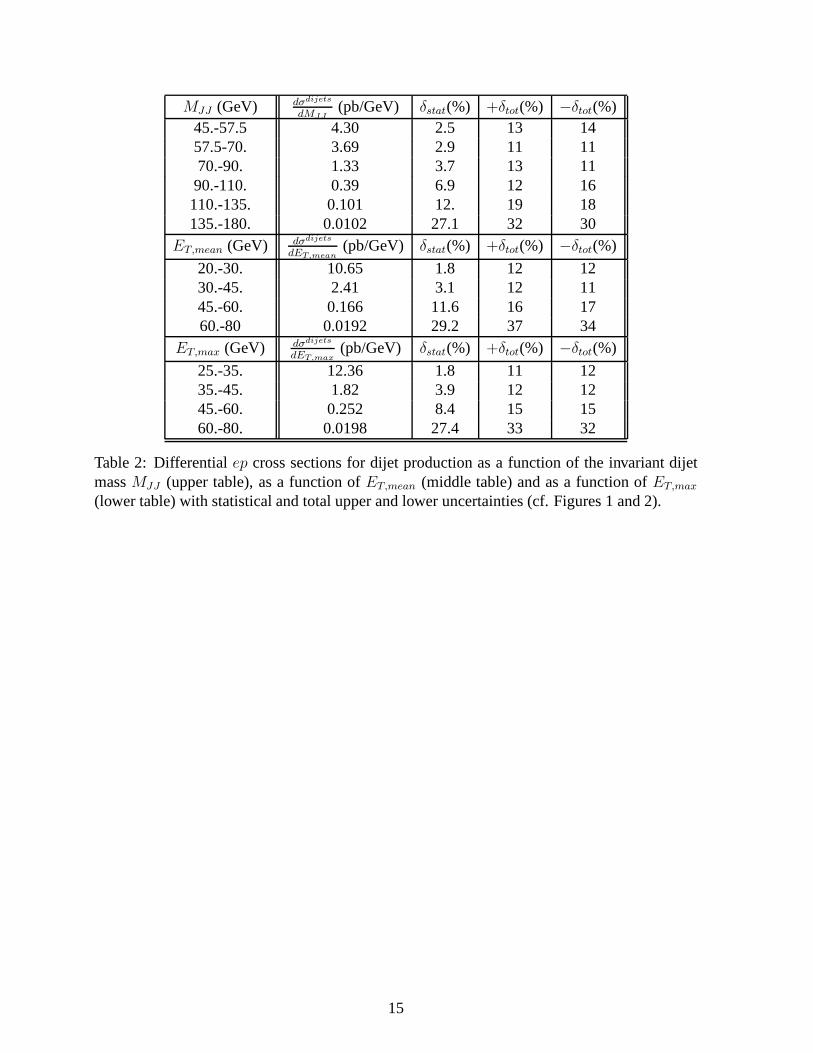
The measured cross sections for inclusive dijet productionin the reactionep → e jet jet X aregiven as single differential cross sections in all cases. The data are corrected for detector effectsand are presented at the level of stable hadrons for the phasespace region defined in Table 1.The inner error bars of the data points in the figures denote the statistical, the outer error barsthe total uncertainty. The data are also presented in Tables2-7. All results are compared tonext-to-leading order (NLO) QCD predictions obtained withthe standard setting described insection 2 if not otherwise quoted. The predictions of NLO QCDcorrected for hadronizationeffects NLO(1 + δhadr) are also shown.
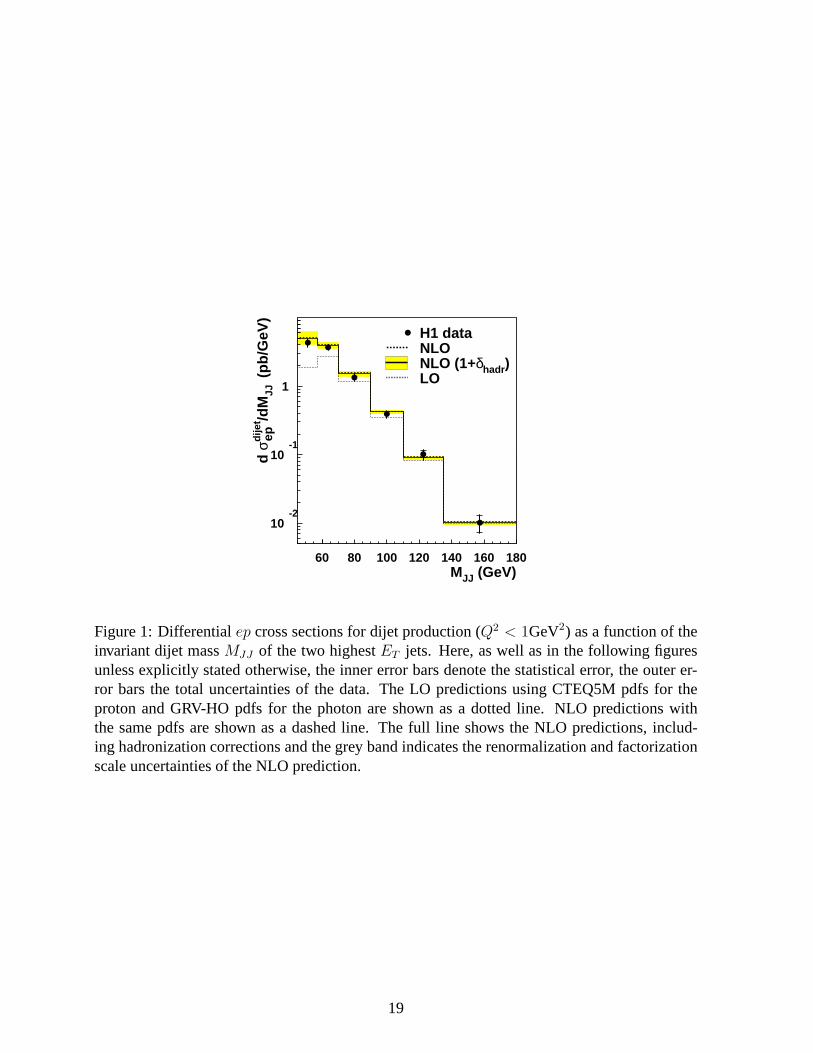
In Figure 1 the dijet cross section is shown as a function of the invariant massMJJ of thedijet system. The data are presented forMJJ values between45 and180 GeV. The measuredcross section falls by about 3 orders of magnitude over this range. NLO QCD describes themeasured cross sections for the whole mass range. Hadronization corrections are less than 5%for all bins. The calculation using LO matrix elements failsto describe the lowMJJ region. Thisis partly due to the fact that the lowMJJ region is populated by events which are influencedby the asymmetric cuts on the jet transverse energies. Events in which the second jet has atransverse energy below25 GeV contribute mainly in this region. In dijet calculationstheyonly appear beyond leading order. The scale uncertainties in the QCD predictions are largest atlow MJJ values.
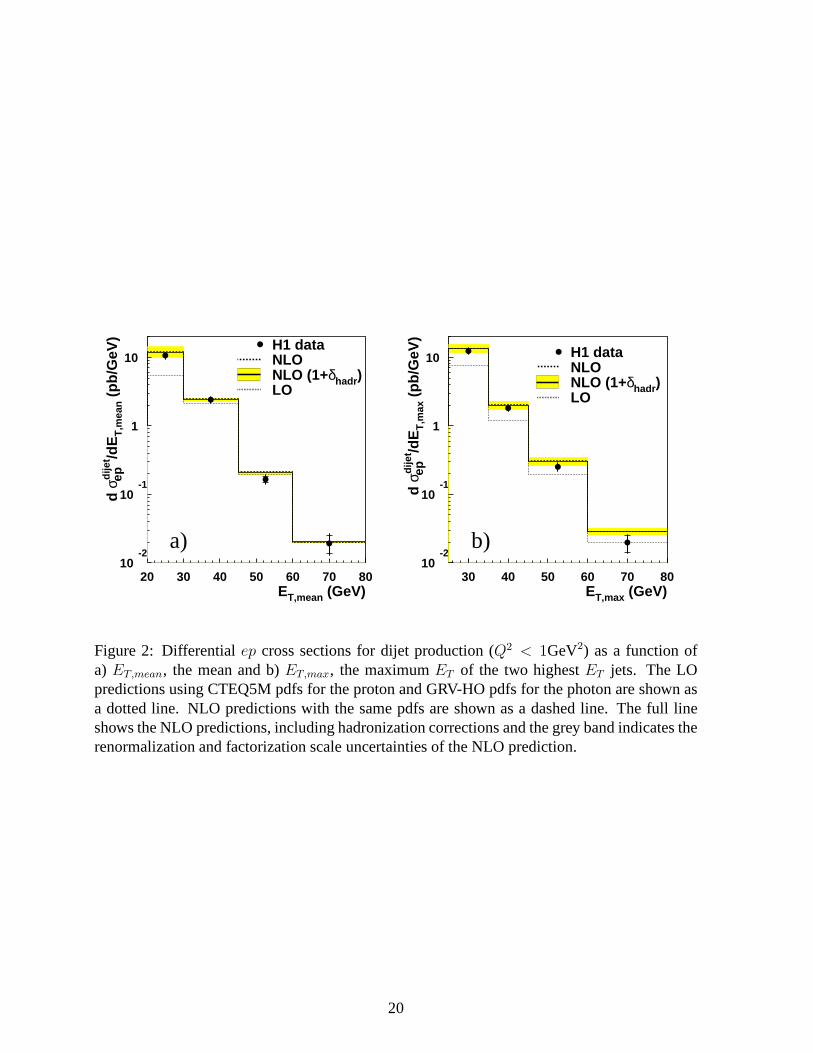
A similar statement on the large scale uncertainties and thedifference between data andthe LO calculation holds for small transverse momenta. In Figure 2a) the dijet cross sectiondσ/dET,mean is shown. Here the scale uncertainties decrease from±20% for the first bins toless than±5% for ET,mean > 30 GeV. The data are well described by the NLO calculation.The dijet cross section as a function of the transverse energy of the highest transverse energy jetET,max is shown in Figure 2b). The distribution again demonstratesthat the data are describedby NLO QCD up to the highestET,max values within errors. The NLO scale uncertainty isnot reduced significantly with increasingET,max. The cross sections differential in transverseenergy are hardly altered by hadronization corrections which are around 5% for all bins. TheNLO QCD calculation with hadronization corrections predicts the measured cross sections upto the highest masses and transverse energies, although thephoton and proton pdfs have beenextracted from quite different processes and mostly at lower scales.
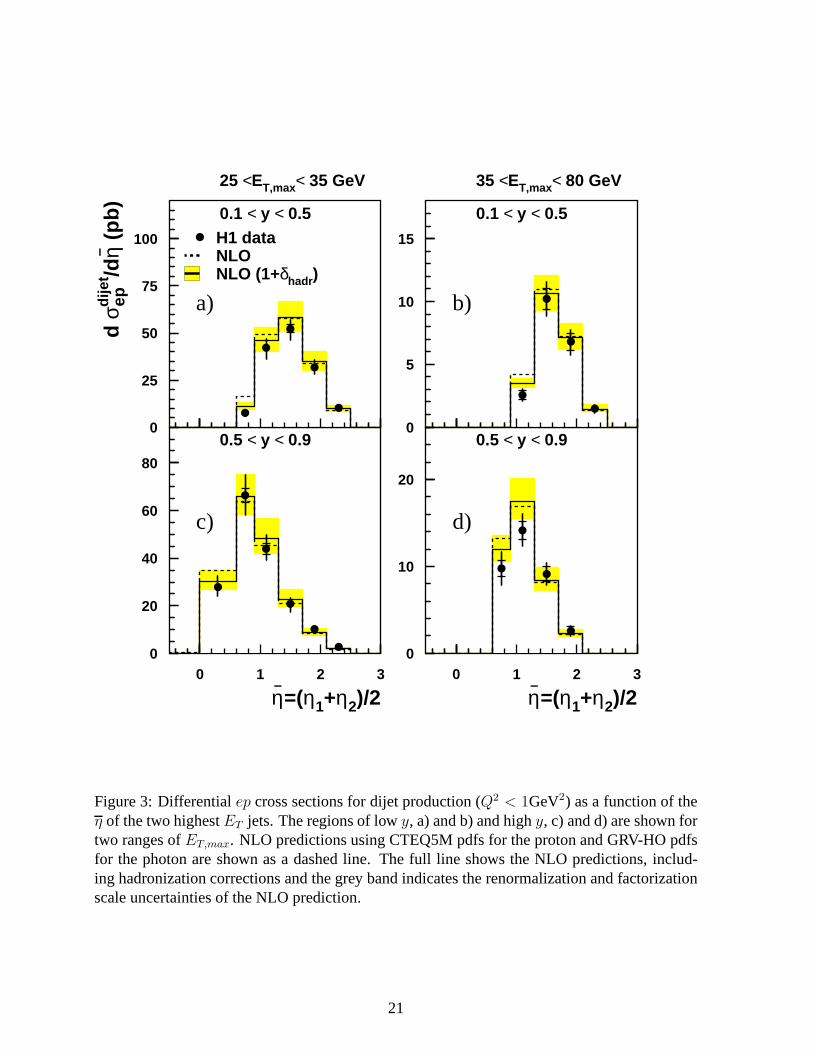
To further explore the photon and proton structure the differential cross sectiondσ/dη isdisplayed in Figure 3 for two ranges ofET,max subdivided into twoy regions. While the formerimplies a variation of the scale the latter corresponds to different center of mass energies in thephoton-proton-system. Again, good agreement between dataand NLO QCD is observed takinginto account the uncertainties in the calculations and in the data points. The predictions tendto lie above the data at lowη, where direct interactions dominate and hadronization corrections
10
are largest. At highη, where in contrast resolved interactions dominate and hadronizationcorrections are small, the NLO QCD predictions agree well with the measured data.
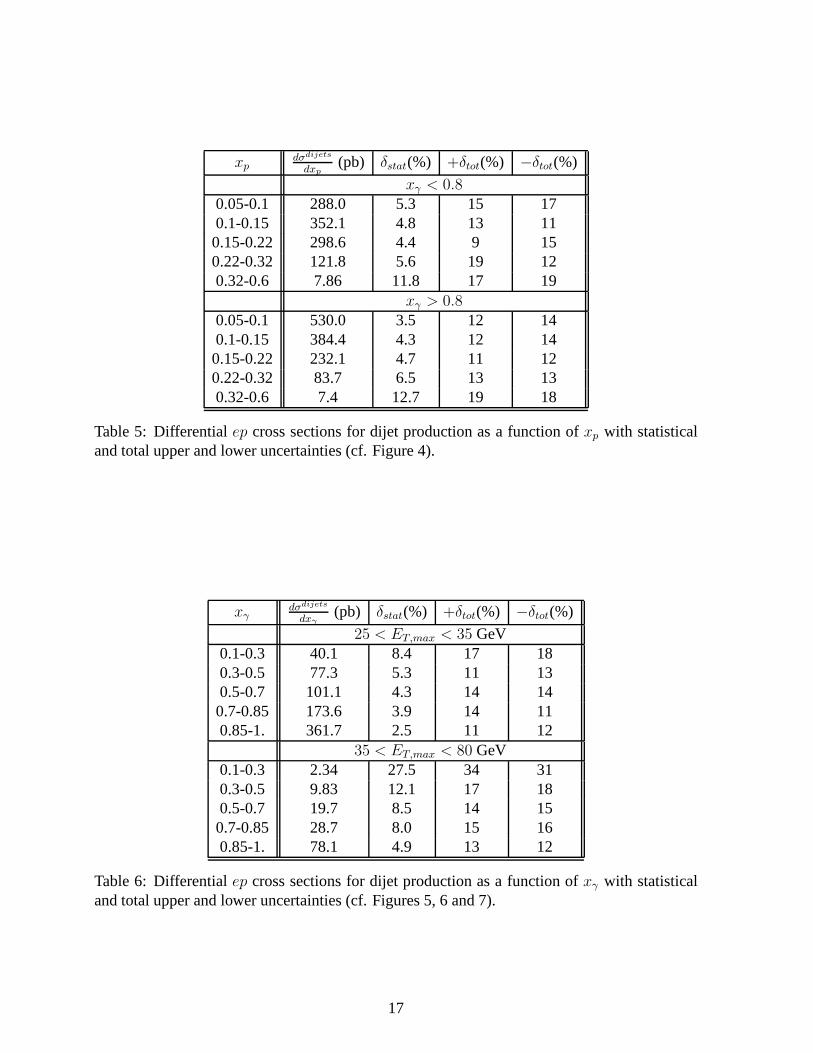
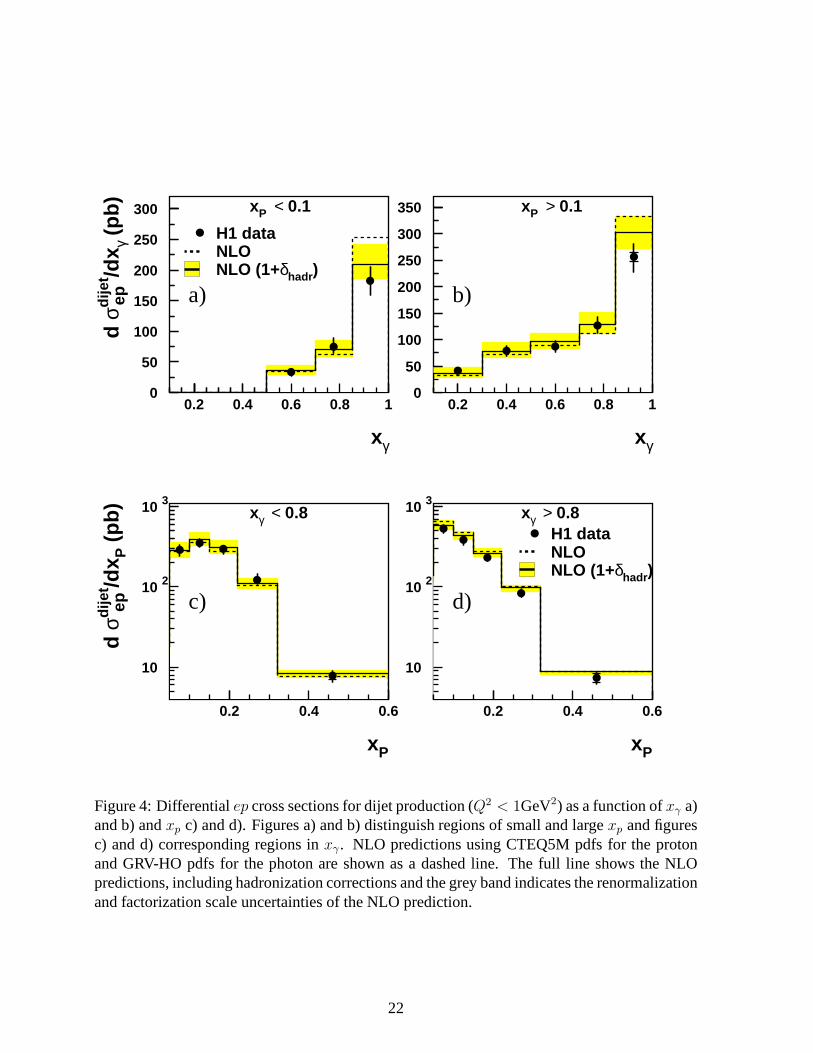
Figures 4a) and b) show the dijet cross sectiondσ/dxγ as a function ofxγ for two differentxp regions. The calculations exceed the data, while remainingwithin the given uncertainties,only for xγ > 0.85, where the largest hadronization correction occur. Using the MRST99 1-3proton pdfs (with a large variation of the highxp gluon density) instead of CTEQ5M resultsin differences of less than 5% for the predicted cross section for xp < 0.1 and up to 15% forxp > 0.1. This is smaller than the scale uncertainties forxp < 0.1 and of the same order forxp > 0.1. These findings are corroborated in Figures 4c) and d) where the cross sectiondσ/dxp
is shown as a function ofxp for two differentxγ regions. Even at the highestxp the measuredcross sections are seen to agree well with the QCD predictions, which in this part of the phasespace attribute about 40% of the cross section to processes induced by gluons in the proton.The constraints on the pdfs used in the QCD calculations herecome dominantly from deeplyinelastic scattering at lower scales where the gluon fraction is smaller. The concept of universalpdfs in hard processes in QCD is thus observed to describe measurements with rather differentexperimental conditions.
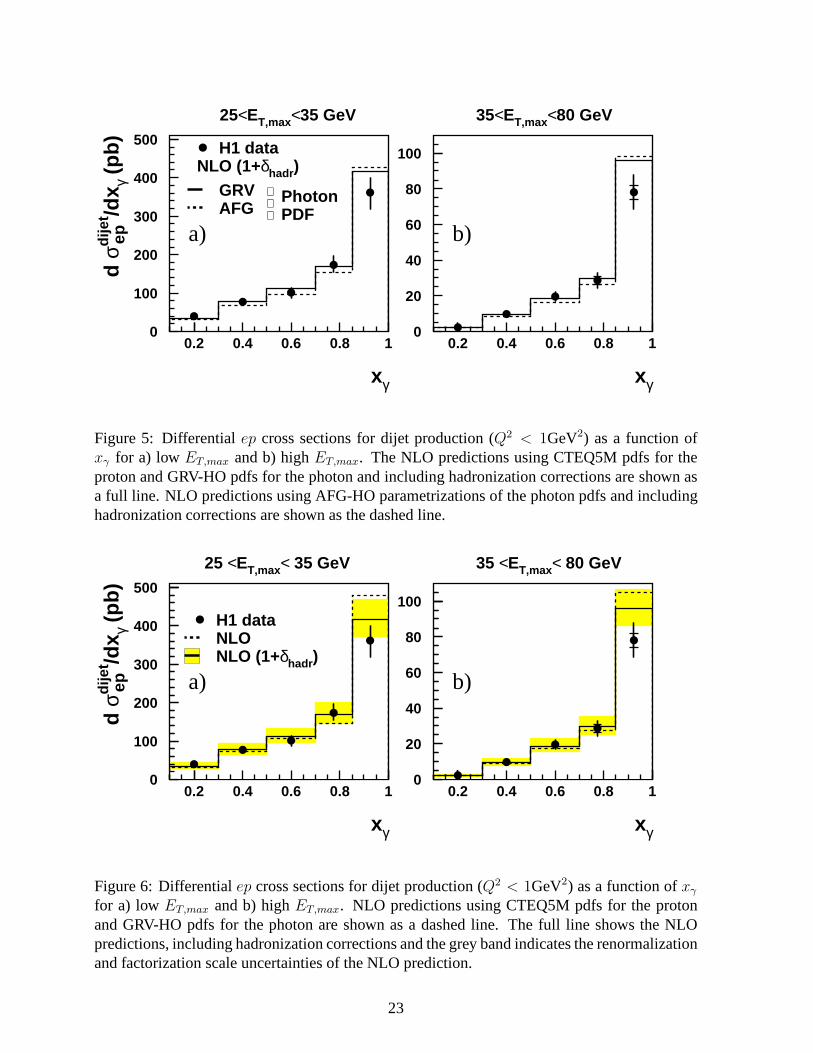
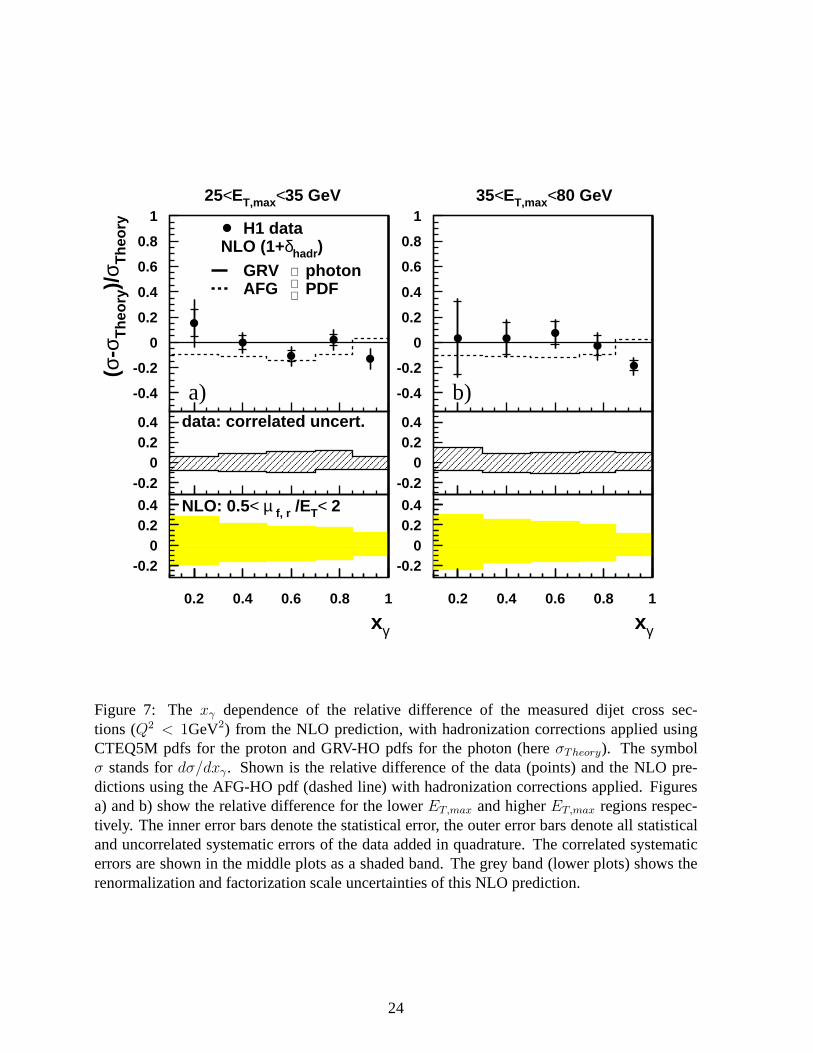
Figure 5 displays the dijet cross sectionsdσ/dxγ as a function ofxγ for two regions ofET,max, representing different factorization scales for the photon and proton pdfs. The data arecompared to NLO calculations corrected for hadronization effects with two different parame-terizations of the photon structure. The predictions describe the data well and vary only slightlywith the photon pdfs used. In contrast the NLO scale uncertainties produce a significant effectas can be inferred from Figure 6, which repeats the data of Figure 5 with a comparison of theGRV-HO pdfs of the photon. For high values ofxγ the hadronization corrections are sizeableand improve the agreement with the data. A more detailed comparison between data and theoryis obtained by plotting their relative difference as shown in Figure 7. NLO predictions includinghadronization corrections are shown for both sets of photonpdfs. At variance to the previousplots the error bars of the data contain only the uncorrelated systematic errors, while the corre-lated errors due to the uncertainty in the calorimeter energy scales are shown as a hatched band.Figure 7 shows that the assumed NLO scale uncertainties are the dominant source of uncertain-ties in the comparison of data and theory. The expectation exceeds the data only for the highxγ
and highET,max regions. Within these uncertainties the picture of an universal photon structureis thus corroborated.
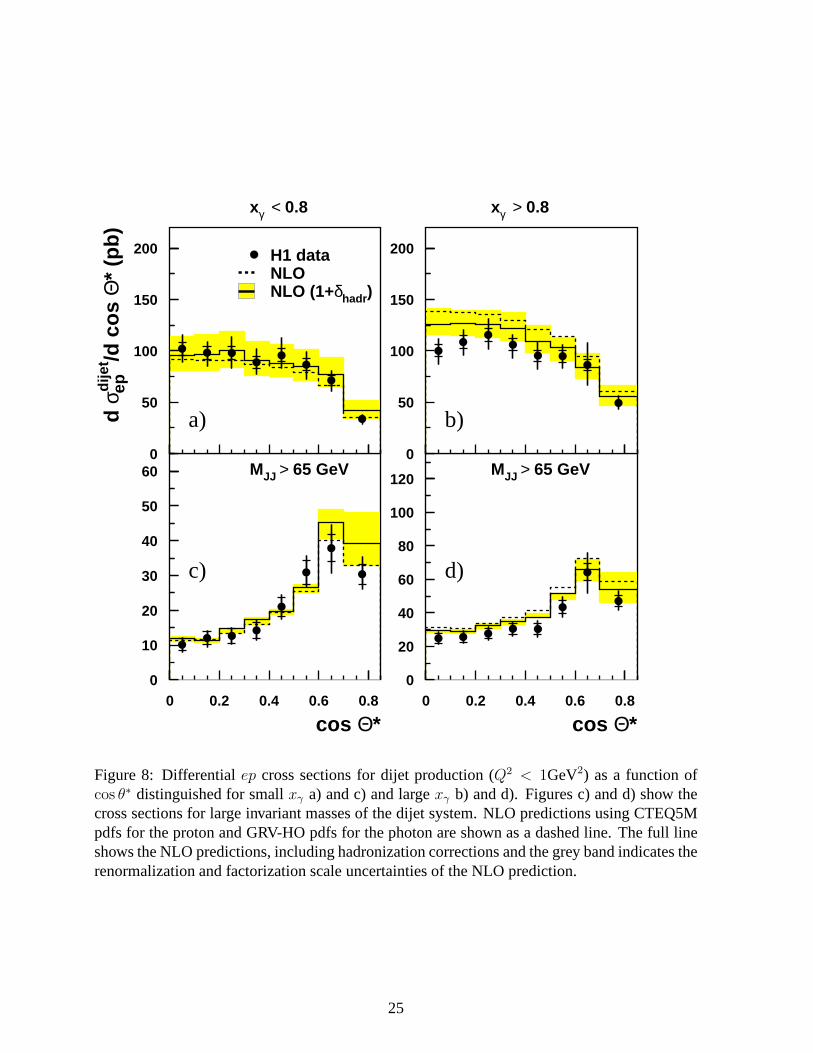
Finally, the dijet cross sectiondσ/d cos θ∗ is plotted in Figures 8a) and b) forxγ < 0.8 andxγ > 0.8 respectively. The cross section decreases with increasingcos θ∗ mainly because ofthe cuts inET . Again, the data are well described by NLO QCD for lowxγ , whereas at higherxγ the predictions overshoot the data for small values ofcos θ∗. These cross sections are alsoshown with a cut on the invariant massMJJ of the dijet system in Figures 8c) and d), essentiallyexcluding the first bin of Figure 1. The cut reduces the restriction of the phase space due tothe correlation with theET requirements and changes the shape of the distribution towards thatexpected from the QCD matrix elements. The QCD calculationsreproduce this transition nicelyin bothxγ regions where resolved and direct photon induced processescontribute with differentweights.
11
5 Conclusions
New measurements of dijet cross sections in photoproduction at high transverse energies arepresented for various jet kinematic observables. The measurements cover invariant dijet massesup to 180 GeV and transverse energies up to80 GeV, reachingxp andxγ values where theexperimental information was previously limited. In this kinematic domain non-perturbativeeffects like multiple interactions and hadronization are found to be small, which allows a directcomparison of NLO QCD calculations with the data to be made. The results demonstrate thepower of perturbative QCD in predicting the measured cross sections in a wide kinematicalrange. Even though the photon pdfs have been obtained from measurements at lower scales,their QCD evolution correctly reproduces the data at high scales. The data do not require sig-nificant changes in the parameterizations of the pdfs but arecertainly useful to further constrainthe existing ones. Likewise our understanding of the protonstructure in the highxp, high scaleregion can be improved with the help of these data. A future stronger constraint requires areduction of both the theoretical scale uncertainties and the systematic uncertainties in the data.
Acknowledgements
We are grateful to the HERA machine group whose outstanding efforts have made and continueto make this experiment possible. We thank the engineers andtechnicians for their work inconstructing and now maintaining the H1 detector, our funding agencies for financial support,the DESY technical staff for continual assistance, and the DESY directorate for the hospitalitywhich they extend to the non-DESY members of the collaboration. We wish to thank S. Frixioneand B. Potter for many helpful discussions.
12
References
[1] T. Ahmedet al. [H1 Collaboration], Phys. Lett. B297 (1992) 205.
[2] C. Adloff et al. [H1 Collaboration], Eur. Phys. J. C1 (1998) 97 [arXiv:hep-ex/9709004].
[3] C. Adloff et al. [H1 Collaboration], Phys. Lett. B483 (2000) 36 [arXiv:hep-ex/0003011].
[4] J. Breitweg et al. [ZEUS Collaboration], Eur. Phys. J. C1 (1998) 109 [arXiv:hep-ex/9710018].
[5] J. Breitweg et al. [ZEUS Collaboration], Eur. Phys. J. C11 (1999) 35 [arXiv:hep-ex/9905046].
[6] T. Affolder et al. [CDF Collaboration], Phys. Rev. D64 (2001) 012001 [arXiv:hep-ex/0012013].
[7] V. M. Abazovet al. [D0 Collaboration], arXiv:hep-ex/0109041.
[8] R. Nisius, Phys. Rept.332 (2000) 165 [arXiv:hep-ex/9912049].
[9] J. Huston, S. Kuhlmann, H. L. Lai, F. I. Olness, J. F. Owens, D. E. Soper and W. K. Tung,Phys. Rev. D58 (1998) 114034 [arXiv:hep-ph/9801444].
[10] S. Chekanovet al. [ZEUS Collaboration], DESY 01-220, arXiv:hep-ex/0112029.
[11] P. Kessler, Il Nuovo Cimento17 (1960) 809.
[12] V. M. Budnev, I. F. Ginzburg, G. V. Meledin and V. G. Serbo, Phys. Rept.15 (1974) 181.
[13] S. Frixione, M. L. Mangano, P. Nason and G. Ridolfi, Phys.Lett. B 319 (1993) 339[arXiv:hep-ph/9310350].
[14] S. Frixione and G. Ridolfi, Nucl. Phys. B507 (1997) 315 [arXiv:hep-ph/9707345].
[15] M. Klasen and G. Kramer, Z. Phys. C76 (1997) 67 [arXiv:hep-ph/9611450].
[16] B. W. Harris and J. F. Owens, Phys. Rev. D56 (1997) 4007 [arXiv:hep-ph/9704324].
[17] P. Aurenche, L. Bourhis, M. Fontannaz and J. P. Guillet,Eur. Phys. J. C17 (2000) 413[arXiv:hep-ph/0006011].
[18] U. Baur, J. A. Vermaseren and D. Zeppenfeld, Nucl. Phys.B 375 (1992) 3.
[19] S. D. Ellis and D. E. Soper, Phys. Rev. D48 (1993) 3160 [arXiv:hep-ph/9305266].
[20] S. Catani, Y. L. Dokshitzer, M. H. Seymour and B. R. Webber, Nucl. Phys. B406 (1993)187.
[21] C. Adloff et al.[H1 Collaboration], Eur. Phys. J. C19 (2001) 289 [arXiv:hep-ex/0010054].
[22] T. Sjostrand, Comput. Phys. Commun.82 (1994) 74.
13
[23] G. Marchesini, B. R. Webber, G. Abbiendi, I. G. Knowles,M. H. Seymour and L. Stanco,Comput. Phys. Commun.67 (1992) 465.
[24] R. Brun, F. Bruyant, M. Maire, A. C. McPherson and P. Zanarini, CERN-DD/EE/84-1.
[25] M. Gluck, E. Reya and A. Vogt, Z. Phys. C67 (1995) 433.
[26] M. Gluck, E. Reya and A. Vogt, Phys. Rev. D46 (1992) 1973.
[27] S. Frixione, Nucl. Phys. B507 (1997) 295 [arXiv:hep-ph/9706545].
[28] H. L. Lai et al., Phys. Rev. D55 (1997) 1280 [arXiv:hep-ph/9606399].
[29] A. D. Martin, R. G. Roberts, W. J. Stirling and R. S. Thorne, Eur. Phys. J. C14 (2000) 133[arXiv:hep-ph/9907231].
[30] M. Gluck, E. Reya and A. Vogt, Phys. Rev. D45 (1992) 3986.
[31] P. Aurenche, J. P. Guillet and M. Fontannaz, Z. Phys. C64 (1994) 621 [arXiv:hep-ph/9406382].
[32] I. Abt et al. [H1 Collaboration], Nucl. Instrum. Meth. A386 (1997) 310.
[33] I. Abt et al. [H1 Collaboration], Nucl. Instrum. Meth. A386 (1997) 348.
[34] B. Andrieu et al. [H1 Calorimeter Group Collaboration], Nucl. Instrum. Meth. A 336(1993) 460.
[35] R. D. Appuhnet al. [H1 SPACAL Group Collaboration], Nucl. Instrum. Meth. A386(1997) 397.
[36] C. Adloff et al. [H1 Collaboration], Z. Phys. C74 (1997) 221 [arXiv:hep-ex/9702003].
[37] A. Blondel and F. Jacquet, Proceedings of the Study of anep Facility for Europeed. U. Amaldi, DESY 79/48 (1979) 391.
[38] L. Lonnblad, Comput. Phys. Commun.71 (1992) 15.
[39] K. Charchula, G. A. Schuler and H. Spiesberger, Comput.Phys. Commun.81 (1994) 381.
14
MJJ (GeV) dσdijets
dMJJ(pb/GeV) δstat(%) +δtot(%) −δtot(%)
45.-57.5 4.30 2.5 13 1457.5-70. 3.69 2.9 11 1170.-90. 1.33 3.7 13 1190.-110. 0.39 6.9 12 16110.-135. 0.101 12. 19 18135.-180. 0.0102 27.1 32 30
ET,mean (GeV) dσdijets
dET,mean(pb/GeV) δstat(%) +δtot(%) −δtot(%)
20.-30. 10.65 1.8 12 1230.-45. 2.41 3.1 12 1145.-60. 0.166 11.6 16 1760.-80 0.0192 29.2 37 34
ET,max (GeV) dσdijets
dET,max(pb/GeV) δstat(%) +δtot(%) −δtot(%)
25.-35. 12.36 1.8 11 1235.-45. 1.82 3.9 12 1245.-60. 0.252 8.4 15 1560.-80. 0.0198 27.4 33 32
Table 2: Differentialep cross sections for dijet production as a function of the invariant dijetmassMJJ (upper table), as a function ofET,mean (middle table) and as a function ofET,max
(lower table) with statistical and total upper and lower uncertainties (cf. Figures 1 and 2).
15

η dσdijets
dη(pb) δstat(%) +δtot(%) −δtot(%)
0.1 < y < 0.5 and25 < ET,max < 35 GeV0.6-0.9 7.55 10.0 20 220.9-1.3 42.2 4.4 11 151.3-1.7 52.2 4.2 10 111.7-2.1 31.8 5.4 12 112.1-2.5 10.3 10.1 17 18
0.1 < y < 0.5 and35 < ET,max < 80 GeV0.9-1.3 2.57 14.0 20 201.3-1.7 10.2 8.0 14 131.7-2.1 6.80 9.9 14 162.1-2.5 1.47 21.0 24 24
0.5 < y < 0.9 and25 < ET,max < 35 GeV0.0-0.6 27.9 4.7 17 140.6-0.9 66.4 4.5 13 130.9-1.3 43.9 4.9 14 111.3-1.7 20.8 7.4 13 161.7-2.1 10.2 11.7 14 142.1-2.5 2.75 24.8 30 29
0.5 < y < 0.9 and35 < ET,max < 80 GeV0.6-0.9 9.77 9.7 20 200.9-1.3 14.14 7.5 13 131.3-1.7 9.12 9.3 15 151.7-2.1 2.59 18.1 24 24
Table 3: Differentialep cross sections for dijet production as a function ofη with statistical andtotal upper and lower uncertainties (cf. Figure 3).
xγdσdijets
dxγ(pb) δstat(%) +δtot(%) −δtot(%)
xp < 0.10.5-0.7 33.5 7.5 20 200.7-0.85 75.0 5.8 19 140.85-1. 182.7 3.3 13 13
xp > 0.10.1-0.3 41.4 8.0 15 160.3-0.5 78.9 5.1 13 130.5-0.7 87.2 4.5 12 120.7-0.85 126.8 4.3 12 120.85-1 256.1 3.0 10 12
Table 4: Differentialep cross sections for dijet production as a function ofxγ with statisticaland total upper and lower uncertainties (cf. Figure 4).
16
xpdσdijets
dxp(pb) δstat(%) +δtot(%) −δtot(%)
xγ < 0.80.05-0.1 288.0 5.3 15 170.1-0.15 352.1 4.8 13 110.15-0.22 298.6 4.4 9 150.22-0.32 121.8 5.6 19 120.32-0.6 7.86 11.8 17 19
xγ > 0.80.05-0.1 530.0 3.5 12 140.1-0.15 384.4 4.3 12 140.15-0.22 232.1 4.7 11 120.22-0.32 83.7 6.5 13 130.32-0.6 7.4 12.7 19 18
Table 5: Differentialep cross sections for dijet production as a function ofxp with statisticaland total upper and lower uncertainties (cf. Figure 4).
xγdσdijets
dxγ(pb) δstat(%) +δtot(%) −δtot(%)
25 < ET,max < 35 GeV0.1-0.3 40.1 8.4 17 180.3-0.5 77.3 5.3 11 130.5-0.7 101.1 4.3 14 140.7-0.85 173.6 3.9 14 110.85-1. 361.7 2.5 11 12
35 < ET,max < 80 GeV0.1-0.3 2.34 27.5 34 310.3-0.5 9.83 12.1 17 180.5-0.7 19.7 8.5 14 150.7-0.85 28.7 8.0 15 160.85-1. 78.1 4.9 13 12
Table 6: Differentialep cross sections for dijet production as a function ofxγ with statisticaland total upper and lower uncertainties (cf. Figures 5, 6 and7).
17
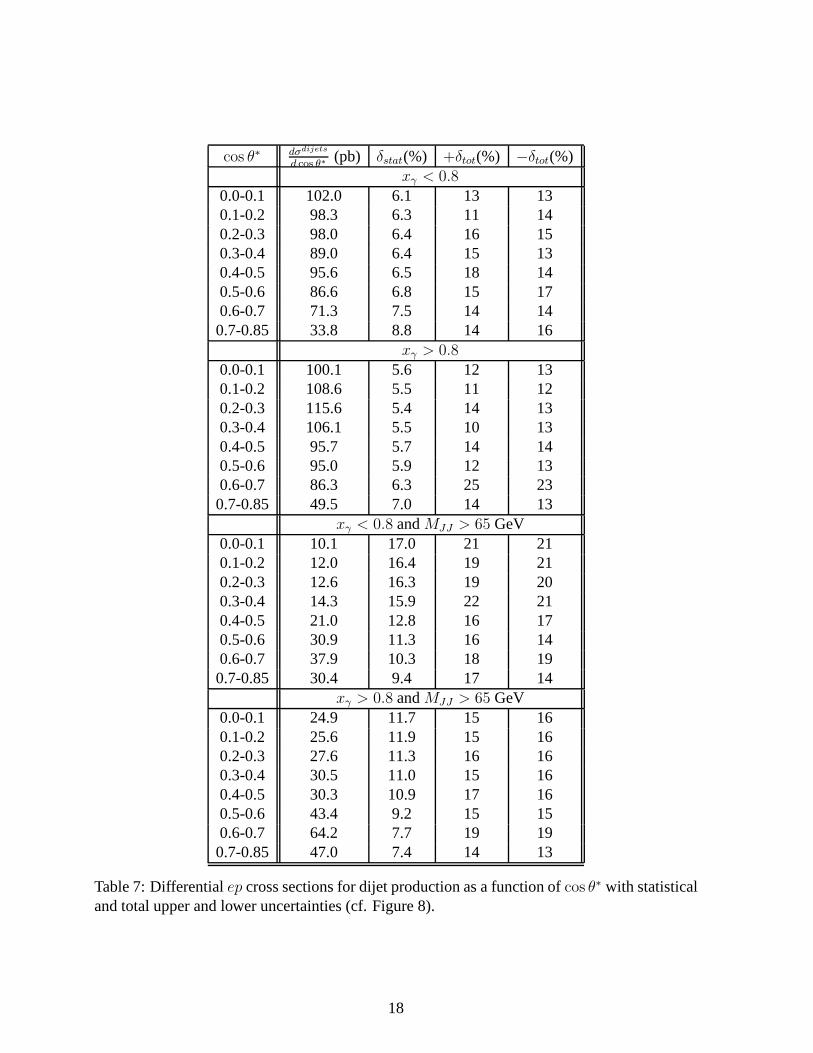
cos θ∗ dσdijets
d cos θ∗(pb) δstat(%) +δtot(%) −δtot(%)
xγ < 0.80.0-0.1 102.0 6.1 13 130.1-0.2 98.3 6.3 11 140.2-0.3 98.0 6.4 16 150.3-0.4 89.0 6.4 15 130.4-0.5 95.6 6.5 18 140.5-0.6 86.6 6.8 15 170.6-0.7 71.3 7.5 14 140.7-0.85 33.8 8.8 14 16
xγ > 0.80.0-0.1 100.1 5.6 12 130.1-0.2 108.6 5.5 11 120.2-0.3 115.6 5.4 14 130.3-0.4 106.1 5.5 10 130.4-0.5 95.7 5.7 14 140.5-0.6 95.0 5.9 12 130.6-0.7 86.3 6.3 25 230.7-0.85 49.5 7.0 14 13
xγ < 0.8 andMJJ > 65 GeV0.0-0.1 10.1 17.0 21 210.1-0.2 12.0 16.4 19 210.2-0.3 12.6 16.3 19 200.3-0.4 14.3 15.9 22 210.4-0.5 21.0 12.8 16 170.5-0.6 30.9 11.3 16 140.6-0.7 37.9 10.3 18 190.7-0.85 30.4 9.4 17 14
xγ > 0.8 andMJJ > 65 GeV0.0-0.1 24.9 11.7 15 160.1-0.2 25.6 11.9 15 160.2-0.3 27.6 11.3 16 160.3-0.4 30.5 11.0 15 160.4-0.5 30.3 10.9 17 160.5-0.6 43.4 9.2 15 150.6-0.7 64.2 7.7 19 190.7-0.85 47.0 7.4 14 13
Table 7: Differentialep cross sections for dijet production as a function ofcos θ∗ with statisticaland total upper and lower uncertainties (cf. Figure 8).
18
10-2
10-1
1
60 80 100 120 140 160 180MJJ (GeV)
d σ
dije
t /dM
JJ (
pb
/GeV
)ep
H1 dataNLONLO (1+δhadr)LO
Figure 1: Differentialep cross sections for dijet production (Q2 < 1GeV2) as a function of theinvariant dijet massMJJ of the two highestET jets. Here, as well as in the following figuresunless explicitly stated otherwise, the inner error bars denote the statistical error, the outer er-ror bars the total uncertainties of the data. The LO predictions using CTEQ5M pdfs for theproton and GRV-HO pdfs for the photon are shown as a dotted line. NLO predictions withthe same pdfs are shown as a dashed line. The full line shows the NLO predictions, includ-ing hadronization corrections and the grey band indicates the renormalization and factorizationscale uncertainties of the NLO prediction.
19
10-2
10-1
1
10
20 30 40 50 60 70 80ET,mean (GeV)
d σ
dije
t /dE
T,m
ean (
pb
/GeV
)ep
H1 dataNLONLO (1+δhadr)LO
a)10
-2
10-1
1
10
30 40 50 60 70 80ET,max (GeV)
d σ
dije
t /dE
T,m
ax (
pb
/GeV
)ep
H1 dataNLONLO (1+δhadr)LO
b)
Figure 2: Differentialep cross sections for dijet production (Q2 < 1GeV2) as a function ofa) ET,mean, the mean and b)ET,max, the maximumET of the two highestET jets. The LOpredictions using CTEQ5M pdfs for the proton and GRV-HO pdfsfor the photon are shown asa dotted line. NLO predictions with the same pdfs are shown asa dashed line. The full lineshows the NLO predictions, including hadronization corrections and the grey band indicates therenormalization and factorization scale uncertainties ofthe NLO prediction.
20
0
25
50
75
100
d σ
dije
t /dη–
(p
b)
0
5
10
15
0
20
40
60
80
0 1 2 3
η–=(η1+η2)/2
0
10
20
0 1 2 3
η–=(η1+η2)/2
ep
25 <ET,max< 35 GeV
0.1 < y < 0.5
35 <ET,max< 80 GeV
0.1 < y < 0.5
0.5 < y < 0.9 0.5 < y < 0.9
H1 dataNLONLO (1+δhadr)
a) b)
c) d)
Figure 3: Differentialep cross sections for dijet production (Q2 < 1GeV2) as a function of theη of the two highestET jets. The regions of lowy, a) and b) and highy, c) and d) are shown fortwo ranges ofET,max. NLO predictions using CTEQ5M pdfs for the proton and GRV-HOpdfsfor the photon are shown as a dashed line. The full line shows the NLO predictions, includ-ing hadronization corrections and the grey band indicates the renormalization and factorizationscale uncertainties of the NLO prediction.
21
0
50
100
150
200
250
300
0.2 0.4 0.6 0.8 1
xγ
d σ
dije
t /dx γ (
pb
)
0
50
100
150
200
250
300
350
0.2 0.4 0.6 0.8 1
xγ
ep
xP < 0.1 xP > 0.1
H1 dataNLONLO (1+δhadr)
a) b)
10
10 2
10 3
0.2 0.4 0.6
xP
d σ
dije
t /dx P
(p
b)
10
10 2
10 3
0.2 0.4 0.6
xP
H1 dataNLONLO (1+δhadr)
ep
xγ < 0.8 xγ > 0.8
c) d)
Figure 4: Differentialep cross sections for dijet production (Q2 < 1GeV2) as a function ofxγ a)and b) andxp c) and d). Figures a) and b) distinguish regions of small and largexp and figuresc) and d) corresponding regions inxγ . NLO predictions using CTEQ5M pdfs for the protonand GRV-HO pdfs for the photon are shown as a dashed line. The full line shows the NLOpredictions, including hadronization corrections and thegrey band indicates the renormalizationand factorization scale uncertainties of the NLO prediction.
22
0
100
200
300
400
500
0.2 0.4 0.6 0.8 1
xγ
d σ
dije
t /dx γ (
pb
)
0
20
40
60
80
100
0.2 0.4 0.6 0.8 1
xγ
ep
H1 dataNLO (1+δhadr)
GRVAFG
PhotonPDF
25<ET,max<35 GeV 35<ET,max<80 GeV
a) b)
Figure 5: Differentialep cross sections for dijet production (Q2 < 1GeV2) as a function ofxγ for a) low ET,max and b) highET,max. The NLO predictions using CTEQ5M pdfs for theproton and GRV-HO pdfs for the photon and including hadronization corrections are shown asa full line. NLO predictions using AFG-HO parametrizationsof the photon pdfs and includinghadronization corrections are shown as the dashed line.
0
100
200
300
400
500
0.2 0.4 0.6 0.8 1
xγ
d σ
dije
t /dx γ (
pb
)
0
20
40
60
80
100
0.2 0.4 0.6 0.8 1
xγ
H1 dataNLONLO (1+δhadr)
25 <ET,max< 35 GeV 35 <ET,max< 80 GeV
ep a) b)
Figure 6: Differentialep cross sections for dijet production (Q2 < 1GeV2) as a function ofxγ
for a) low ET,max and b) highET,max. NLO predictions using CTEQ5M pdfs for the protonand GRV-HO pdfs for the photon are shown as a dashed line. The full line shows the NLOpredictions, including hadronization corrections and thegrey band indicates the renormalizationand factorization scale uncertainties of the NLO prediction.
23
-0.4
-0.2
0
0.2
0.4
0.6
0.8
1
(σ-σ
Th
eory
)/σ T
heo
ry
-0.4
-0.2
0
0.2
0.4
0.6
0.8
1
-0.20
0.20.4
-0.20
0.20.4
-0.20
0.20.4
0.2 0.4 0.6 0.8 1
xγ
-0.20
0.20.4
0.2 0.4 0.6 0.8 1
xγ
H1 dataNLO (1+δhadr)
GRVAFG
photonPDF
data: correlated uncert.
NLO: 0.5< µ f, r /ET< 2
25<ET,max<35 GeV 35<ET,max<80 GeV
a) b)
Figure 7: Thexγ dependence of the relative difference of the measured dijetcross sec-tions (Q2 < 1GeV2) from the NLO prediction, with hadronization corrections applied usingCTEQ5M pdfs for the proton and GRV-HO pdfs for the photon (here σTheory). The symbolσ stands fordσ/dxγ. Shown is the relative difference of the data (points) and the NLO pre-dictions using the AFG-HO pdf (dashed line) with hadronization corrections applied. Figuresa) and b) show the relative difference for the lowerET,max and higherET,max regions respec-tively. The inner error bars denote the statistical error, the outer error bars denote all statisticaland uncorrelated systematic errors of the data added in quadrature. The correlated systematicerrors are shown in the middle plots as a shaded band. The greyband (lower plots) shows therenormalization and factorization scale uncertainties ofthis NLO prediction.
24
0
50
100
150
200
d σ
dije
t /d c
os
Θ*
(pb
)
0
50
100
150
200
0
10
20
30
40
50
60
0 0.2 0.4 0.6 0.8
cos Θ*
0
20
40
60
80
100
120
0 0.2 0.4 0.6 0.8
cos Θ*
ep
H1 dataNLONLO (1+δhadr)
xγ < 0.8 xγ > 0.8
MJJ > 65 GeV MJJ > 65 GeV
a) b)
c) d)
Figure 8: Differentialep cross sections for dijet production (Q2 < 1GeV2) as a function ofcos θ∗ distinguished for smallxγ a) and c) and largexγ b) and d). Figures c) and d) show thecross sections for large invariant masses of the dijet system. NLO predictions using CTEQ5Mpdfs for the proton and GRV-HO pdfs for the photon are shown asa dashed line. The full lineshows the NLO predictions, including hadronization corrections and the grey band indicates therenormalization and factorization scale uncertainties ofthe NLO prediction.
25
Copyright © 2022 FDOKUMEN