Measurement of black carbon (BC) by an optical method and a thermal-optical method: Intercomparison...
7
Measurement of black carbon (BC) by an optical method and a thermal-optical method: Intercomparison for four sites Tanveer Ahmed a , Vincent A. Dutkiewicz a, b , Akhtar Shareef b, 1 , Gurdal Tuncel c , Semra Tuncel c , Liaquat Husain a, b, * a Department of Environmental Health Sciences, School of Public Health, State University of New York at Albany, Empire State Plaza, Albany, NY 12201-0509, USA b Wadsworth Center, New York State Department of Health, Empire State Plaza, Albany, NY,12201-0509, USA c Middle East Technical University, Ankara, Turkey article info Article history: Received 1 July 2009 Received in revised form 2 September 2009 Accepted 18 September 2009 Keywords: Black carbon Whatman 41 Transmissometer Light absorption abstract Comparison of black carbon (BC) measurements obtained by two methods was performed for aerosols samples collected on Whatman 41 (W-41) filters, using an optical method (Magee Scientific Optical Transmissometer Model OT-21) and a thermal-optical method (Sunset Laboratory Thermal-optical analyzer). Samples were collected from four sites: Albany (a small urban site, NY), Antalya (coastal site, Turkey), Whiteface Mountain (remote site, NY) and Mayville (rural site, NY). At Albany, comparison between the two methods showed excellent agreement; a least-squares regression line yielded a slope of 1.02, and r 2 ¼ 0.88. Similar comparisons at Antalya (slope of 1.02, r 2 ¼ 0.5) and Whiteface Mountain (slope of 0.92 and r 2 ¼ 0.58) also gave very good relationship. At Mayville, the relationship between the two methods yielded somewhat lower regression: a slope of 0.75, and r 2 ¼ 0.44. The data from the four locations, when plotted together, yielded an excellent agreement: a slope of 0.91, and r 2 of 0.84. Based on our measurements, it appears that optical measurement using the OT-21 can be successfully applied to determination of BC in W-41 filters. However, because of the variability in the chemical composition of BC aerosol at different locations, it is suggested that the calibration of OT-21 when using W-41 filters should be performed with a statistically significant numbers of samples for specific sites. Ó 2009 Elsevier Ltd. All rights reserved. 1. Introduction Black carbon (BC) aerosols are primary sub-micrometer parti- culate matter emitted during incomplete combustion of fossil or bio-fuels. They are graphite – like in structure, and a wide variety of organic carbon (OC) species adsorbed to them. Fuel type and combustion conditions determine the percentage of inorganic elements and OC composition. Primary BC particles are aggregates of spherules ranging between 20 and 60 nm in diameter (Alexander et al., 2008). In pure graphitic form, the BC particles are hydro- phobic, and chemically inert. As they age and mix with species such as sulfates, nitrates, and mineral dust, their physical and optical properties can be modified. Thus, for example, aged BC particles can contribute to cloud nucleation (Lammel and Novakov, 1995), and heterogeneous chemical reactions occur on the particle surfaces. They reduce atmospheric visibility and affect a wide variety of atmospheric processes related to climate (Ramanathan and Car- michael, 2008; McConnell et al., 2007); they also affect human health (e.g., Dockery et al., 1993; Seaton et al., 1995; Ackermann- Liebrich et al., 1997; Gwynn et al., 2000; Pope et al., 2002). BC aerosols are strongly light-absorbing and affect earth’s temperature by heating the atmosphere and changing its radiative balance (Crutzen and Andreae, 1990; Jacobson, 2001, 2002). Owing to their small particle size, BC aerosols can travel thousands of km from their source. Estimation of BC’s effect on earth’s radiation balance requires regionally representative global data. Such data are currently sparse. Thus, models are used to estimate atmospheric concentrations based on energy consumption, but field data are needed to verify the models. We recently reported long-term (w1835–2005) atmospheric BC measurements for the North- eastern US, using a technique developed in our laboratory (Husain et al., 2008). However, data sets are needed from many regions around the world. Since the data must cover periods of many years, if not decades, archived filter samples from aerosol collection networks serve as a ready source of the data needed for model verification and climate change estimates. Such a global analysis * Corresponding author. Department of Environmental Health Sciences, School of Public Health, State University of New York at Albany, Empire State Plaza, Albany, NY 12201-0509, USA. Tel.: þ1 518 473 4854; fax: þ1 518 473 2895. E-mail address: [email protected] (L. Husain). 1 Permanent address: Centre for Environmental Studies, PCSIR Laboratories, Karachi-75280, Pakistan. Contents lists available at ScienceDirect Atmospheric Environment journal homepage: www.elsevier.com/locate/atmosenv 1352-2310/$ – see front matter Ó 2009 Elsevier Ltd. All rights reserved. doi:10.1016/j.atmosenv.2009.09.031 Atmospheric Environment 43 (2009) 6305–6311
-
Upload
independent -
Category
Documents
-
view
1 -
download
0
Transcript of Measurement of black carbon (BC) by an optical method and a thermal-optical method: Intercomparison...
lable at ScienceDirect
Atmospheric Environment 43 (2009) 6305–6311
Contents lists avai
Atmospheric Environment
journal homepage: www.elsevier .com/locate/atmosenv
Measurement of black carbon (BC) by an optical method and a thermal-opticalmethod: Intercomparison for four sites
Tanveer Ahmed a, Vincent A. Dutkiewicz a,b, Akhtar Shareef b,1,Gurdal Tuncel c, Semra Tuncel c, Liaquat Husain a,b,*
a Department of Environmental Health Sciences, School of Public Health, State University of New York at Albany, Empire State Plaza, Albany, NY 12201-0509, USAb Wadsworth Center, New York State Department of Health, Empire State Plaza, Albany, NY, 12201-0509, USAc Middle East Technical University, Ankara, Turkey
a r t i c l e i n f o
Article history:Received 1 July 2009Received in revised form2 September 2009Accepted 18 September 2009
Keywords:Black carbonWhatman 41TransmissometerLight absorption
* Corresponding author. Department of EnvironmenPublic Health, State University of New York at AlbanyNY 12201-0509, USA. Tel.: þ1 518 473 4854; fax: þ1
E-mail address: [email protected] (L. Husain).1 Permanent address: Centre for Environmental
Karachi-75280, Pakistan.
1352-2310/$ – see front matter � 2009 Elsevier Ltd.doi:10.1016/j.atmosenv.2009.09.031
a b s t r a c t
Comparison of black carbon (BC) measurements obtained by two methods was performed for aerosolssamples collected on Whatman 41 (W-41) filters, using an optical method (Magee Scientific OpticalTransmissometer Model OT-21) and a thermal-optical method (Sunset Laboratory Thermal-opticalanalyzer). Samples were collected from four sites: Albany (a small urban site, NY), Antalya (coastal site,Turkey), Whiteface Mountain (remote site, NY) and Mayville (rural site, NY). At Albany, comparisonbetween the two methods showed excellent agreement; a least-squares regression line yielded a slope of1.02, and r2 ¼ 0.88. Similar comparisons at Antalya (slope of 1.02, r2 ¼ 0.5) and Whiteface Mountain(slope of 0.92 and r2 ¼ 0.58) also gave very good relationship. At Mayville, the relationship between thetwo methods yielded somewhat lower regression: a slope of 0.75, and r2 ¼ 0.44. The data from the fourlocations, when plotted together, yielded an excellent agreement: a slope of 0.91, and r2 of 0.84. Based onour measurements, it appears that optical measurement using the OT-21 can be successfully applied todetermination of BC in W-41 filters. However, because of the variability in the chemical composition ofBC aerosol at different locations, it is suggested that the calibration of OT-21 when using W-41 filtersshould be performed with a statistically significant numbers of samples for specific sites.
� 2009 Elsevier Ltd. All rights reserved.
1. Introduction
Black carbon (BC) aerosols are primary sub-micrometer parti-culate matter emitted during incomplete combustion of fossil orbio-fuels. They are graphite – like in structure, and a wide variety oforganic carbon (OC) species adsorbed to them. Fuel type andcombustion conditions determine the percentage of inorganicelements and OC composition. Primary BC particles are aggregatesof spherules ranging between 20 and 60 nm in diameter (Alexanderet al., 2008). In pure graphitic form, the BC particles are hydro-phobic, and chemically inert. As they age and mix with species suchas sulfates, nitrates, and mineral dust, their physical and opticalproperties can be modified. Thus, for example, aged BC particles cancontribute to cloud nucleation (Lammel and Novakov, 1995), andheterogeneous chemical reactions occur on the particle surfaces.
tal Health Sciences, School of, Empire State Plaza, Albany,518 473 2895.
Studies, PCSIR Laboratories,
All rights reserved.
They reduce atmospheric visibility and affect a wide variety ofatmospheric processes related to climate (Ramanathan and Car-michael, 2008; McConnell et al., 2007); they also affect humanhealth (e.g., Dockery et al., 1993; Seaton et al., 1995; Ackermann-Liebrich et al., 1997; Gwynn et al., 2000; Pope et al., 2002). BCaerosols are strongly light-absorbing and affect earth’s temperatureby heating the atmosphere and changing its radiative balance(Crutzen and Andreae, 1990; Jacobson, 2001, 2002). Owing to theirsmall particle size, BC aerosols can travel thousands of km fromtheir source. Estimation of BC’s effect on earth’s radiation balancerequires regionally representative global data. Such data arecurrently sparse. Thus, models are used to estimate atmosphericconcentrations based on energy consumption, but field data areneeded to verify the models. We recently reported long-term(w1835–2005) atmospheric BC measurements for the North-eastern US, using a technique developed in our laboratory (Husainet al., 2008). However, data sets are needed from many regionsaround the world. Since the data must cover periods of many years,if not decades, archived filter samples from aerosol collectionnetworks serve as a ready source of the data needed for modelverification and climate change estimates. Such a global analysis
T. Ahmed et al. / Atmospheric Environment 43 (2009) 6305–63116306
requires analysis of several thousands of filters. Most archivedsamples have been collected on cellulose (Whatman 41) filters,which cannot be used directly with the thermal-optical method,which is now commonly used for BC measurement. Accordingly,we have developed a technique that quantitatively removes BCaerosols from cellulose, allowing subsequent determination of BCconcentration by means of a thermal-optical method (Li et al.,2002). The method has low detection limits of w10 ng m�3 (basedon air volume of w1500 m3) and enables accurate measurements,but it is time consuming. Hence we decided to investigate a rapidoptical method, and to then compare the results with the resultsfrom the commonly used thermal-optical technique, describedearlier in detail by Khan et al. (2006).
2. Experimental
2.1. Sample collection
During May–June 2002 and October–December 2003, a set of 35samples were collected on Whatman 41 (W-41) filters with a standardhigh-volume sampler outside the Wadsworth Laboratories in down-town Albany, a moderate-sized city in New York State with a pop-ulation of about 90,000. The Laboratory is adjacent to a busy 4-lanestreet that often has buses idling while they wait for their next run.Thus, carbonaceous aerosols in these samples should be relativelyfresh and should have a significant component from diesel emissions.
Aerosols samples from the Mediterranean coast of Turkey werecollected between September and December 1993. The samplingstation was located 20 km to the west of the city of Antalya (30.34 E,36.47 N) on a rock structure at a height of 20 m above the sea level.The nearest local pollution source was the city of Antalya, which was20 km away. Aerosol samples were collected on 20 � 25 cm W-41filters, using a high-volume sampler (Sierra-Andersen Model SAUV-10H). Sampling was daily and continuous; the sampler was stoppedonly for filter changes. Total volume of air passed through the filtersin 24 h of sampling was measured with a calibrated high-volume drygas meter. The flow rate through the sampler was measured usinga strip-chart recorder, to monitor the performance of the sampler.Data from the dry-gas-meter were used in volume calculations.Average flow rate through the filters was 1.35 m3 min�1. Blank filterswere treated identically to real samples, except that air was pulledthrough the blank filters for only 1 min.
Aerosols samples have been collected continuously on 20�25 cmW-41 filters at Whiteface Mountain and Mayville, NY, with high-volume samplers over the last three decades. The pumps wereoperated at flow rate from 1 to 1.4 m3 min�1. Whiteface Mountain(WFM) is a remote site located in the Adirondack Park region ofupstate NY. The observatory at WFM is located at the summit, 1.5 kmabove mean sea level. Mayville is a rural site located in western NY,w530 km southwest of WFM, and close to the industrialized Mid-western US. The sampling system at this site is located on the rooftopof a 4-story building. Details of the two sampling sites have beengiven elsewhere (Husain et al., 1984). The sampling systems at WFMand Mayville were equipped with mass flow controllers that main-tain flow rates within�5% (e.g., Husain and Dutkiewicz,1990; Husainet al., 2004). Flow rate calibrations were verified with either a fixed ora variable orifice calibrator that is traceable to a NIST standard.
2.2. Determination of BC by Optical Transmissometer (OT-21)
Several commercial instruments are available that can determineBC based on its black-body optical properties. They include theMagee Scientific Aethalometer, the TSI model 3563 three-wave-length Nephelometer, Radiance Research Particle/Soot AbsorptionPhotometer (PSAP), and the Thermo Electron Corporation Model
5012 Multi Angle Absorption Photometer (MAAP). We chose theOptical Transmissometer (OT-21, Magee Scientific), because it isportable, non-destructive, and can perform rapid BC determinationon different types of filters. The analysis time for an individualmeasurement is less than 1 min. The OT-21 is modeled on the opticsused in Aethalometer Model AE21 and AE22. The OT-21 is suppliedwith a movable tray with two filter holder slots, one inside and theother outside. The outside holder is used to measure light attenua-tion through the sample filter, while a simultaneous measurement ismade through the reference (blank) filter placed in the inside holder.Filter holder slots have variable adapter size and can accommodate25 mm, 37 mm, or 47 mm filters. The OT-21 measures and comparesthe transmission intensity of light at 880 and 370 nm passingthrough a particle loaded filter to the intensity of a blank filter, so asto determine the attenuation ATN (ATN¼�ln(T/To), where T and To
are the respective transmission intensities through the loaded andblank filters). Optically based methods assume that ATN through thefilter is proportional to the BC loading on the filter paper (Hansenet al., 1984; Liousse et al., 1993; Petzold et al., 1997). BC density(in mg cm�2) is determined by dividing the relative ATN by thespecific attenuation coefficient sATN (m2 g�1), using the relationship,BC ¼ ATN/sATN. BC density is then converted to BC concentration,[BC], in ng m�3. The [BC] is inversely proportional to the coefficientused. Several authors have suggested that this coefficient is depen-dent on the aerosol type and the age of the carbonaceous matter(Liousse et al., 1993; Petzold et al., 1997). This represents a majorsource of uncertainty in OT-21 results. We have used the classicalMagee sATN of 16.6 m2 g�1 for 880 nm channel optical BC. An internalcalibration was run at the start of each analytical session, andappropriate blank filters were used to reference the ATN measure-ments. The active measurement area is a 15 mm diameter spot in thecenter of the filter adapter. Since a 15 mm area is integrated by theOT-21, test showed that the orientation of a filter in the instrument isnot important. In this study, we used either two or four aliquots of25 mm punches from each sample. All BC determinations reportedhere were acquired with the 880 nm channel.
2.3. Determination of BC by thermal-optical method
Commonly, two thermal-optical methods are in use to measureBC. These are (1) the IMPROVE method (Chow et al., 1993), knownas Total Optical Reflectance (TOR), and (2) the NIOSH method(NIOSH, 1996; Birch and Cary, 1996) referred as Total OpticalTransmission (TOT). We used the TOT method. Details of theexperimental method used were given by Khan et al. (2006).
Owing to the high carbon content of W-41 filters, this material isnot suitable for a direct determination of the [BC] collected on it.Therefore, we developed a technique by which to transfer BC fromW-41 to quartz filters, with minimal loss (Li et al., 2002). Briefly, thecellulose substrate containing the sample is dissolved in a high-purity 70% ZnCl2 solution at 50 �C, and BC is transferred to a quartzfilter. The latter has very low background for BC and is thus suitablefor BC determination using the thermal-optical method. Recoveriesof BC using this analytical technique were determined throughdeposition of known amounts of BC standard (carbon black fromacetylene; Alfa Aesar, Ward Hill, MA) on W-41 filters, with pro-cessing of the filters as described elsewhere (Li et al., 2002). Therecoveries were 93 � 4%.
3. Results
We have summarized the optical and thermal-optical [BC]measurements from the four sampling sites, in Table 1. The totalnumber of samples analyzed was 474. The uncertainties in indi-vidual measurement of [BC] were obtained through combination of
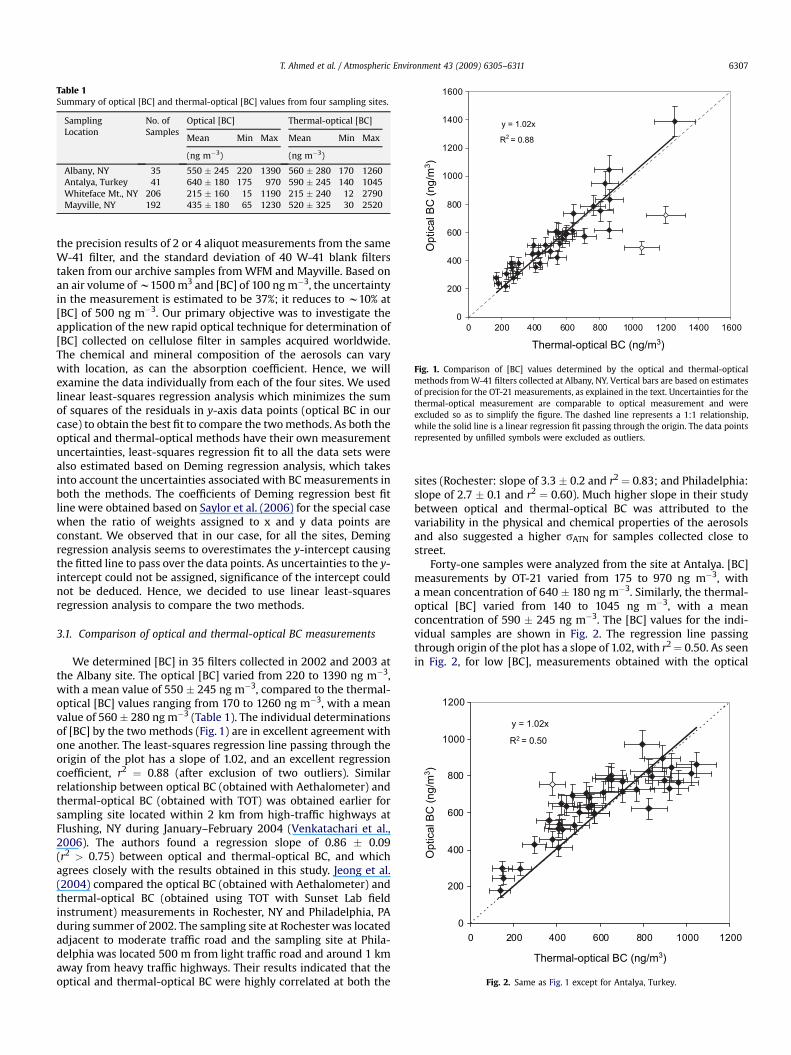
Table 1Summary of optical [BC] and thermal-optical [BC] values from four sampling sites.
SamplingLocation
No. ofSamples
Optical [BC] Thermal-optical [BC]
Mean Min Max Mean Min Max
(ng m�3) (ng m�3)
Albany, NY 35 550 � 245 220 1390 560 � 280 170 1260Antalya, Turkey 41 640 � 180 175 970 590 � 245 140 1045Whiteface Mt., NY 206 215 � 160 15 1190 215 � 240 12 2790Mayville, NY 192 435 � 180 65 1230 520 � 325 30 2520
y = 1.02x
R2 = 0.88
0
200
400
600
800
1000
1200
1400
1600
0 200 400 600 800 1000 1200 1400 1600
Thermal-optical BC (ng/m3)
Opt
ical
BC
(ng/
m3 )
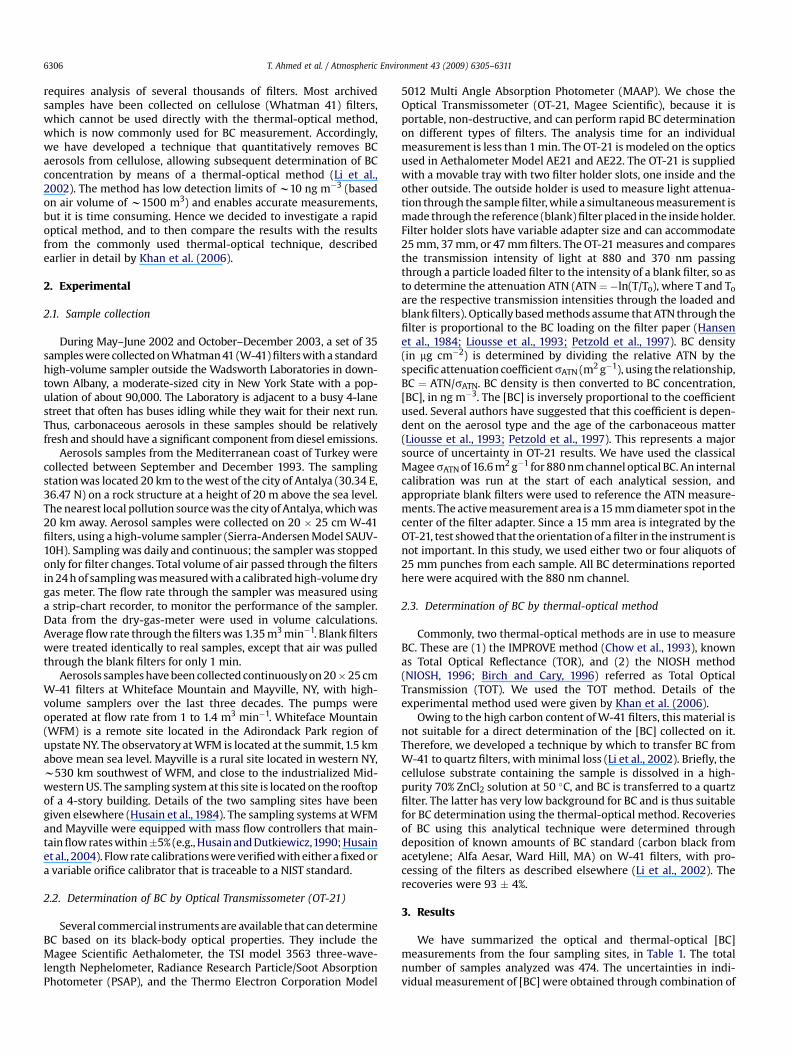
Fig. 1. Comparison of [BC] values determined by the optical and thermal-opticalmethods from W-41 filters collected at Albany, NY. Vertical bars are based on estimatesof precision for the OT-21 measurements, as explained in the text. Uncertainties for thethermal-optical measurement are comparable to optical measurement and wereexcluded so as to simplify the figure. The dashed line represents a 1:1 relationship,while the solid line is a linear regression fit passing through the origin. The data pointsrepresented by unfilled symbols were excluded as outliers.
y = 1.02x
R2 = 0.50
0
200
400
600
800
1000
1200
0 200 400 600 800 1000 1200
Thermal-optical BC (ng/m3)
Opt
ical
BC
(ng/
m3 )
Fig. 2. Same as Fig. 1 except for Antalya, Turkey.
T. Ahmed et al. / Atmospheric Environment 43 (2009) 6305–6311 6307
the precision results of 2 or 4 aliquot measurements from the sameW-41 filter, and the standard deviation of 40 W-41 blank filterstaken from our archive samples from WFM and Mayville. Based onan air volume of w1500 m3 and [BC] of 100 ng m�3, the uncertaintyin the measurement is estimated to be 37%; it reduces to w10% at[BC] of 500 ng m�3. Our primary objective was to investigate theapplication of the new rapid optical technique for determination of[BC] collected on cellulose filter in samples acquired worldwide.The chemical and mineral composition of the aerosols can varywith location, as can the absorption coefficient. Hence, we willexamine the data individually from each of the four sites. We usedlinear least-squares regression analysis which minimizes the sumof squares of the residuals in y-axis data points (optical BC in ourcase) to obtain the best fit to compare the two methods. As both theoptical and thermal-optical methods have their own measurementuncertainties, least-squares regression fit to all the data sets werealso estimated based on Deming regression analysis, which takesinto account the uncertainties associated with BC measurements inboth the methods. The coefficients of Deming regression best fitline were obtained based on Saylor et al. (2006) for the special casewhen the ratio of weights assigned to x and y data points areconstant. We observed that in our case, for all the sites, Demingregression analysis seems to overestimates the y-intercept causingthe fitted line to pass over the data points. As uncertainties to the y-intercept could not be assigned, significance of the intercept couldnot be deduced. Hence, we decided to use linear least-squaresregression analysis to compare the two methods.
3.1. Comparison of optical and thermal-optical BC measurements
We determined [BC] in 35 filters collected in 2002 and 2003 atthe Albany site. The optical [BC] varied from 220 to 1390 ng m�3,with a mean value of 550 � 245 ng m�3, compared to the thermal-optical [BC] values ranging from 170 to 1260 ng m�3, with a meanvalue of 560 � 280 ng m�3 (Table 1). The individual determinationsof [BC] by the two methods (Fig. 1) are in excellent agreement withone another. The least-squares regression line passing through theorigin of the plot has a slope of 1.02, and an excellent regressioncoefficient, r2 ¼ 0.88 (after exclusion of two outliers). Similarrelationship between optical BC (obtained with Aethalometer) andthermal-optical BC (obtained with TOT) was obtained earlier forsampling site located within 2 km from high-traffic highways atFlushing, NY during January–February 2004 (Venkatachari et al.,2006). The authors found a regression slope of 0.86 � 0.09(r2 > 0.75) between optical and thermal-optical BC, and whichagrees closely with the results obtained in this study. Jeong et al.(2004) compared the optical BC (obtained with Aethalometer) andthermal-optical BC (obtained using TOT with Sunset Lab fieldinstrument) measurements in Rochester, NY and Philadelphia, PAduring summer of 2002. The sampling site at Rochester was locatedadjacent to moderate traffic road and the sampling site at Phila-delphia was located 500 m from light traffic road and around 1 kmaway from heavy traffic highways. Their results indicated that theoptical and thermal-optical BC were highly correlated at both the
sites (Rochester: slope of 3.3 � 0.2 and r2 ¼ 0.83; and Philadelphia:slope of 2.7 � 0.1 and r2 ¼ 0.60). Much higher slope in their studybetween optical and thermal-optical BC was attributed to thevariability in the physical and chemical properties of the aerosolsand also suggested a higher sATN for samples collected close tostreet.
Forty-one samples were analyzed from the site at Antalya. [BC]measurements by OT-21 varied from 175 to 970 ng m�3, witha mean concentration of 640 � 180 ng m�3. Similarly, the thermal-optical [BC] varied from 140 to 1045 ng m�3, with a meanconcentration of 590 � 245 ng m�3. The [BC] values for the indi-vidual samples are shown in Fig. 2. The regression line passingthrough origin of the plot has a slope of 1.02, with r2¼ 0.50. As seenin Fig. 2, for low [BC], measurements obtained with the optical
T. Ahmed et al. / Atmospheric Environment 43 (2009) 6305–63116308
method were higher than measurements from by the thermal-optical method; for high [BC], the measurements obtained with thethermal-optical method were higher. This has resulted in a lowerregression coefficient. Because the sampling site is located alongthe Northeastern coast of the Mediterranean Sea, aerosol compo-sition at this site is affected by: the anthropogenic sources locatedin the northern and northwestern regions of Turkey, northwesterncrustal sources from North Africa, marine sources from the Medi-terranean Sea, and pollution carried by long-range transport fromindustrialized northwestern European countries (Gullu et al., 1998).Previous studies have shown that the air masses most frequentlyflow to the Mediterranean Basin from north and northwest, but inapproximately 20% of the time upper atmospheric airflow occursbetween southeastern and southwestern sector, bringing dust fromNorth Africa. The presence of dust particle in aerosols at this sitecould affect the optical BC measurements by scattering the light.Liousse et al. (1993) indicated that the effect of desert dust particlesin BC absorption measurement is small and can be neglected.However, the presence of mineral oxide such as iron oxides(hematite and goethite), in aerosols transported from Africa, canaffect the BC absorption measurement (Schladitz et al., 2009). Ironoxides absorb sunlight in the UV region and its absorption effi-ciency decreases in the visible region. The presence of iron oxidecould have caused relatively high absorption in aerosols at lowconcentrations producing higher [BC] values by the optical method.However, with increasing [BC], the relative contribution of ironoxide would decrease and the absorption would be primarilyattributable to BC.
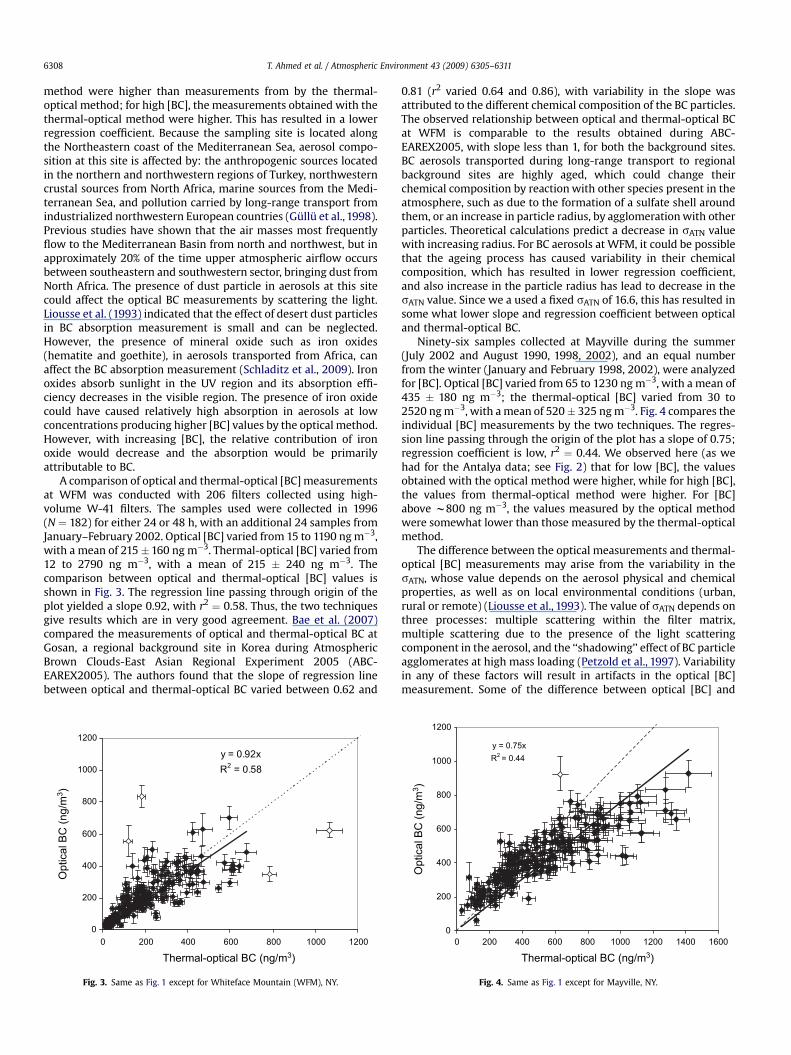
A comparison of optical and thermal-optical [BC] measurementsat WFM was conducted with 206 filters collected using high-volume W-41 filters. The samples used were collected in 1996(N ¼ 182) for either 24 or 48 h, with an additional 24 samples fromJanuary–February 2002. Optical [BC] varied from 15 to 1190 ng m�3,with a mean of 215�160 ng m�3. Thermal-optical [BC] varied from12 to 2790 ng m�3, with a mean of 215 � 240 ng m�3. Thecomparison between optical and thermal-optical [BC] values isshown in Fig. 3. The regression line passing through origin of theplot yielded a slope 0.92, with r2 ¼ 0.58. Thus, the two techniquesgive results which are in very good agreement. Bae et al. (2007)compared the measurements of optical and thermal-optical BC atGosan, a regional background site in Korea during AtmosphericBrown Clouds-East Asian Regional Experiment 2005 (ABC-EAREX2005). The authors found that the slope of regression linebetween optical and thermal-optical BC varied between 0.62 and
y = 0.92xR2 = 0.58
0
200
400
600
800
1000
1200
0 200 400 600 800 1000 1200
Thermal-optical BC (ng/m3)
Opt
ical
BC
(ng/
m3 )
Fig. 3. Same as Fig. 1 except for Whiteface Mountain (WFM), NY.
0.81 (r2 varied 0.64 and 0.86), with variability in the slope wasattributed to the different chemical composition of the BC particles.The observed relationship between optical and thermal-optical BCat WFM is comparable to the results obtained during ABC-EAREX2005, with slope less than 1, for both the background sites.BC aerosols transported during long-range transport to regionalbackground sites are highly aged, which could change theirchemical composition by reaction with other species present in theatmosphere, such as due to the formation of a sulfate shell aroundthem, or an increase in particle radius, by agglomeration with otherparticles. Theoretical calculations predict a decrease in sATN valuewith increasing radius. For BC aerosols at WFM, it could be possiblethat the ageing process has caused variability in their chemicalcomposition, which has resulted in lower regression coefficient,and also increase in the particle radius has lead to decrease in thesATN value. Since we a used a fixed sATN of 16.6, this has resulted insome what lower slope and regression coefficient between opticaland thermal-optical BC.
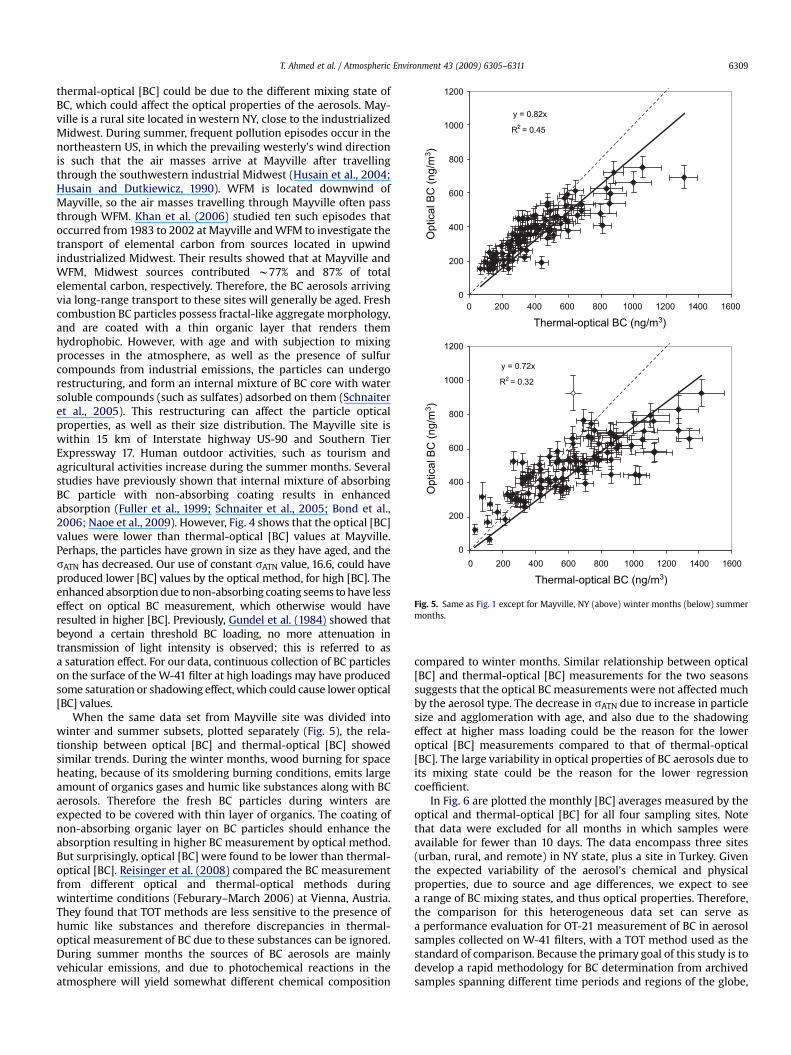
Ninety-six samples collected at Mayville during the summer(July 2002 and August 1990, 1998, 2002), and an equal numberfrom the winter (January and February 1998, 2002), were analyzedfor [BC]. Optical [BC] varied from 65 to 1230 ng m�3, with a mean of435 � 180 ng m�3; the thermal-optical [BC] varied from 30 to2520 ng m�3, with a mean of 520� 325 ng m�3. Fig. 4 compares theindividual [BC] measurements by the two techniques. The regres-sion line passing through the origin of the plot has a slope of 0.75;regression coefficient is low, r2 ¼ 0.44. We observed here (as wehad for the Antalya data; see Fig. 2) that for low [BC], the valuesobtained with the optical method were higher, while for high [BC],the values from thermal-optical method were higher. For [BC]above w800 ng m�3, the values measured by the optical methodwere somewhat lower than those measured by the thermal-opticalmethod.
The difference between the optical measurements and thermal-optical [BC] measurements may arise from the variability in thesATN, whose value depends on the aerosol physical and chemicalproperties, as well as on local environmental conditions (urban,rural or remote) (Liousse et al., 1993). The value of sATN depends onthree processes: multiple scattering within the filter matrix,multiple scattering due to the presence of the light scatteringcomponent in the aerosol, and the ‘‘shadowing’’ effect of BC particleagglomerates at high mass loading (Petzold et al., 1997). Variabilityin any of these factors will result in artifacts in the optical [BC]measurement. Some of the difference between optical [BC] and
y = 0.75xR2
= 0.44
0
200
400
600
800
1000
1200
0 200 400 600 800 1000 1400 16001200
Thermal-optical BC (ng/m3)
Opt
ical
BC
(ng/
m3 )
Fig. 4. Same as Fig. 1 except for Mayville, NY.
0
200
400
600
800
1000
1200
0 200 400 600 800 1000 1400 16001200
Thermal-optical BC (ng/m3)
0 200 400 600 800 1000 1400 16001200
Thermal-optical BC (ng/m3)
Opt
ical
BC
(ng/
m3 )
0
200
400
600
800
1000
1200
Opt
ical
BC
(ng/
m3 )
y = 0.82x
R2 = 0.45
y = 0.72x
R2 = 0.32
Fig. 5. Same as Fig. 1 except for Mayville, NY (above) winter months (below) summermonths.
T. Ahmed et al. / Atmospheric Environment 43 (2009) 6305–6311 6309
thermal-optical [BC] could be due to the different mixing state ofBC, which could affect the optical properties of the aerosols. May-ville is a rural site located in western NY, close to the industrializedMidwest. During summer, frequent pollution episodes occur in thenortheastern US, in which the prevailing westerly’s wind directionis such that the air masses arrive at Mayville after travellingthrough the southwestern industrial Midwest (Husain et al., 2004;Husain and Dutkiewicz, 1990). WFM is located downwind ofMayville, so the air masses travelling through Mayville often passthrough WFM. Khan et al. (2006) studied ten such episodes thatoccurred from 1983 to 2002 at Mayville and WFM to investigate thetransport of elemental carbon from sources located in upwindindustrialized Midwest. Their results showed that at Mayville andWFM, Midwest sources contributed w77% and 87% of totalelemental carbon, respectively. Therefore, the BC aerosols arrivingvia long-range transport to these sites will generally be aged. Freshcombustion BC particles possess fractal-like aggregate morphology,and are coated with a thin organic layer that renders themhydrophobic. However, with age and with subjection to mixingprocesses in the atmosphere, as well as the presence of sulfurcompounds from industrial emissions, the particles can undergorestructuring, and form an internal mixture of BC core with watersoluble compounds (such as sulfates) adsorbed on them (Schnaiteret al., 2005). This restructuring can affect the particle opticalproperties, as well as their size distribution. The Mayville site iswithin 15 km of Interstate highway US-90 and Southern TierExpressway 17. Human outdoor activities, such as tourism andagricultural activities increase during the summer months. Severalstudies have previously shown that internal mixture of absorbingBC particle with non-absorbing coating results in enhancedabsorption (Fuller et al., 1999; Schnaiter et al., 2005; Bond et al.,2006; Naoe et al., 2009). However, Fig. 4 shows that the optical [BC]values were lower than thermal-optical [BC] values at Mayville.Perhaps, the particles have grown in size as they have aged, and thesATN has decreased. Our use of constant sATN value, 16.6, could haveproduced lower [BC] values by the optical method, for high [BC]. Theenhanced absorption due to non-absorbing coating seems to have lesseffect on optical BC measurement, which otherwise would haveresulted in higher [BC]. Previously, Gundel et al. (1984) showed thatbeyond a certain threshold BC loading, no more attenuation intransmission of light intensity is observed; this is referred to asa saturation effect. For our data, continuous collection of BC particleson the surface of the W-41 filter at high loadings may have producedsome saturation or shadowing effect, which could cause lower optical[BC] values.
When the same data set from Mayville site was divided intowinter and summer subsets, plotted separately (Fig. 5), the rela-tionship between optical [BC] and thermal-optical [BC] showedsimilar trends. During the winter months, wood burning for spaceheating, because of its smoldering burning conditions, emits largeamount of organics gases and humic like substances along with BCaerosols. Therefore the fresh BC particles during winters areexpected to be covered with thin layer of organics. The coating ofnon-absorbing organic layer on BC particles should enhance theabsorption resulting in higher BC measurement by optical method.But surprisingly, optical [BC] were found to be lower than thermal-optical [BC]. Reisinger et al. (2008) compared the BC measurementfrom different optical and thermal-optical methods duringwintertime conditions (Feburary–March 2006) at Vienna, Austria.They found that TOT methods are less sensitive to the presence ofhumic like substances and therefore discrepancies in thermal-optical measurement of BC due to these substances can be ignored.During summer months the sources of BC aerosols are mainlyvehicular emissions, and due to photochemical reactions in theatmosphere will yield somewhat different chemical composition
compared to winter months. Similar relationship between optical[BC] and thermal-optical [BC] measurements for the two seasonssuggests that the optical BC measurements were not affected muchby the aerosol type. The decrease in sATN due to increase in particlesize and agglomeration with age, and also due to the shadowingeffect at higher mass loading could be the reason for the loweroptical [BC] measurements compared to that of thermal-optical[BC]. The large variability in optical properties of BC aerosols due toits mixing state could be the reason for the lower regressioncoefficient.
In Fig. 6 are plotted the monthly [BC] averages measured by theoptical and thermal-optical [BC] for all four sampling sites. Notethat data were excluded for all months in which samples wereavailable for fewer than 10 days. The data encompass three sites(urban, rural, and remote) in NY state, plus a site in Turkey. Giventhe expected variability of the aerosol’s chemical and physicalproperties, due to source and age differences, we expect to seea range of BC mixing states, and thus optical properties. Therefore,the comparison for this heterogeneous data set can serve asa performance evaluation for OT-21 measurement of BC in aerosolsamples collected on W-41 filters, with a TOT method used as thestandard of comparison. Because the primary goal of this study is todevelop a rapid methodology for BC determination from archivedsamples spanning different time periods and regions of the globe,
y = 0.91xR2 = 0.84
0
200
400
600
800
1000
0 200 400 600 800 1000
Albany, NY
Antalya, Turkey
Mayville, NY
WFM,NY
Thermal-optical BC (ng/m3)
Opt
ical
BC
(ng/
m3 )
y = 0.91xR2 = 0.84
0
200
400
600
800
1000
0 200 400 600 800 1000
Albany, NY
Antalya, Turkey
Mayville, NY
WFM,NY
Thermal-optical BC (ng/m3)
Opt
ical
BC
(ng/
m3 )
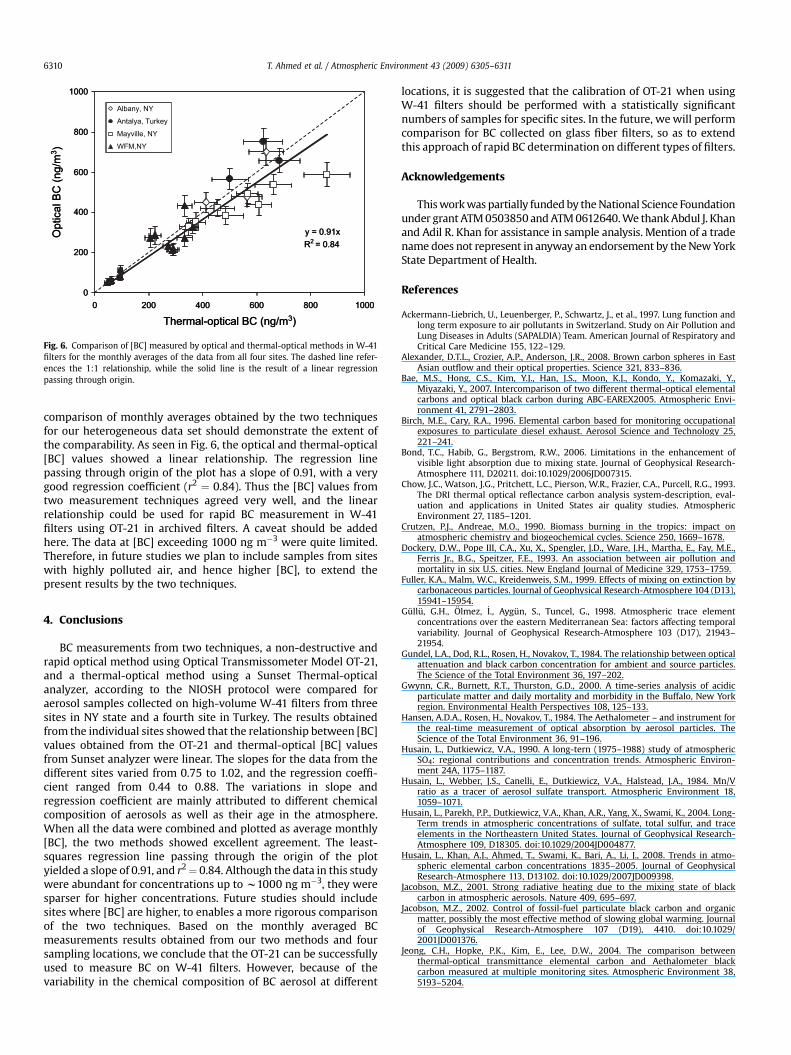
Fig. 6. Comparison of [BC] measured by optical and thermal-optical methods in W-41filters for the monthly averages of the data from all four sites. The dashed line refer-ences the 1:1 relationship, while the solid line is the result of a linear regressionpassing through origin.
T. Ahmed et al. / Atmospheric Environment 43 (2009) 6305–63116310
comparison of monthly averages obtained by the two techniquesfor our heterogeneous data set should demonstrate the extent ofthe comparability. As seen in Fig. 6, the optical and thermal-optical[BC] values showed a linear relationship. The regression linepassing through origin of the plot has a slope of 0.91, with a verygood regression coefficient (r2 ¼ 0.84). Thus the [BC] values fromtwo measurement techniques agreed very well, and the linearrelationship could be used for rapid BC measurement in W-41filters using OT-21 in archived filters. A caveat should be addedhere. The data at [BC] exceeding 1000 ng m�3 were quite limited.Therefore, in future studies we plan to include samples from siteswith highly polluted air, and hence higher [BC], to extend thepresent results by the two techniques.
4. Conclusions
BC measurements from two techniques, a non-destructive andrapid optical method using Optical Transmissometer Model OT-21,and a thermal-optical method using a Sunset Thermal-opticalanalyzer, according to the NIOSH protocol were compared foraerosol samples collected on high-volume W-41 filters from threesites in NY state and a fourth site in Turkey. The results obtainedfrom the individual sites showed that the relationship between [BC]values obtained from the OT-21 and thermal-optical [BC] valuesfrom Sunset analyzer were linear. The slopes for the data from thedifferent sites varied from 0.75 to 1.02, and the regression coeffi-cient ranged from 0.44 to 0.88. The variations in slope andregression coefficient are mainly attributed to different chemicalcomposition of aerosols as well as their age in the atmosphere.When all the data were combined and plotted as average monthly[BC], the two methods showed excellent agreement. The least-squares regression line passing through the origin of the plotyielded a slope of 0.91, and r2¼ 0.84. Although the data in this studywere abundant for concentrations up to w1000 ng m�3, they weresparser for higher concentrations. Future studies should includesites where [BC] are higher, to enables a more rigorous comparisonof the two techniques. Based on the monthly averaged BCmeasurements results obtained from our two methods and foursampling locations, we conclude that the OT-21 can be successfullyused to measure BC on W-41 filters. However, because of thevariability in the chemical composition of BC aerosol at different
locations, it is suggested that the calibration of OT-21 when usingW-41 filters should be performed with a statistically significantnumbers of samples for specific sites. In the future, we will performcomparison for BC collected on glass fiber filters, so as to extendthis approach of rapid BC determination on different types of filters.
Acknowledgements
This work was partially funded by the National Science Foundationunder grant ATM 0503850 and ATM 0612640. We thank Abdul J. Khanand Adil R. Khan for assistance in sample analysis. Mention of a tradename does not represent in anyway an endorsement by the New YorkState Department of Health.
References
Ackermann-Liebrich, U., Leuenberger, P., Schwartz, J., et al., 1997. Lung function andlong term exposure to air pollutants in Switzerland. Study on Air Pollution andLung Diseases in Adults (SAPALDIA) Team. American Journal of Respiratory andCritical Care Medicine 155, 122–129.
Alexander, D.T.L., Crozier, A.P., Anderson, J.R., 2008. Brown carbon spheres in EastAsian outflow and their optical properties. Science 321, 833–836.
Bae, M.S., Hong, C.S., Kim, Y.J., Han, J.S., Moon, K.J., Kondo, Y., Komazaki, Y.,Miyazaki, Y., 2007. Intercomparison of two different thermal-optical elementalcarbons and optical black carbon during ABC-EAREX2005. Atmospheric Envi-ronment 41, 2791–2803.
Birch, M.E., Cary, R.A., 1996. Elemental carbon based for monitoring occupationalexposures to particulate diesel exhaust. Aerosol Science and Technology 25,221–241.
Bond, T.C., Habib, G., Bergstrom, R.W., 2006. Limitations in the enhancement ofvisible light absorption due to mixing state. Journal of Geophysical Research-Atmosphere 111, D20211. doi:10.1029/2006JD007315.
Chow, J.C., Watson, J.G., Pritchett, L.C., Pierson, W.R., Frazier, C.A., Purcell, R.G., 1993.The DRI thermal optical reflectance carbon analysis system-description, eval-uation and applications in United States air quality studies. AtmosphericEnvironment 27, 1185–1201.
Crutzen, P.J., Andreae, M.O., 1990. Biomass burning in the tropics: impact onatmospheric chemistry and biogeochemical cycles. Science 250, 1669–1678.
Dockery, D.W., Pope III, C.A., Xu, X., Spengler, J.D., Ware, J.H., Martha, E., Fay, M.E.,Ferris Jr., B.G., Speitzer, F.E., 1993. An association between air pollution andmortality in six U.S. cities. New England Journal of Medicine 329, 1753–1759.
Fuller, K.A., Malm, W.C., Kreidenweis, S.M., 1999. Effects of mixing on extinction bycarbonaceous particles. Journal of Geophysical Research-Atmosphere 104 (D13),15941–15954.
Gullu, G.H., Olmez, _I., Aygun, S., Tuncel, G., 1998. Atmospheric trace elementconcentrations over the eastern Mediterranean Sea: factors affecting temporalvariability. Journal of Geophysical Research-Atmosphere 103 (D17), 21943–21954.
Gundel, L.A., Dod, R.L., Rosen, H., Novakov, T., 1984. The relationship between opticalattenuation and black carbon concentration for ambient and source particles.The Science of the Total Environment 36, 197–202.
Gwynn, C.R., Burnett, R.T., Thurston, G.D., 2000. A time-series analysis of acidicparticulate matter and daily mortality and morbidity in the Buffalo, New Yorkregion. Environmental Health Perspectives 108, 125–133.
Hansen, A.D.A., Rosen, H., Novakov, T., 1984. The Aethalometer – and instrument forthe real-time measurement of optical absorption by aerosol particles. TheScience of the Total Environment 36, 91–196.
Husain, L., Dutkiewicz, V.A., 1990. A long-tern (1975–1988) study of atmosphericSO4: regional contributions and concentration trends. Atmospheric Environ-ment 24A, 1175–1187.
Husain, L., Webber, J.S., Canelli, E., Dutkiewicz, V.A., Halstead, J.A., 1984. Mn/Vratio as a tracer of aerosol sulfate transport. Atmospheric Environment 18,1059–1071.
Husain, L., Parekh, P.P., Dutkiewicz, V.A., Khan, A.R., Yang, X., Swami, K., 2004. Long-Term trends in atmospheric concentrations of sulfate, total sulfur, and traceelements in the Northeastern United States. Journal of Geophysical Research-Atmosphere 109, D18305. doi:10.1029/2004JD004877.
Husain, L., Khan, A.J., Ahmed, T., Swami, K., Bari, A., Li, J., 2008. Trends in atmo-spheric elemental carbon concentrations 1835–2005. Journal of GeophysicalResearch-Atmosphere 113, D13102. doi:10.1029/2007JD009398.
Jacobson, M.Z., 2001. Strong radiative heating due to the mixing state of blackcarbon in atmospheric aerosols. Nature 409, 695–697.
Jacobson, M.Z., 2002. Control of fossil-fuel particulate black carbon and organicmatter, possibly the most effective method of slowing global warming. Journalof Geophysical Research-Atmosphere 107 (D19), 4410. doi:10.1029/2001JD001376.
Jeong, C.H., Hopke, P.K., Kim, E., Lee, D.W., 2004. The comparison betweenthermal-optical transmittance elemental carbon and Aethalometer blackcarbon measured at multiple monitoring sites. Atmospheric Environment 38,5193–5204.
T. Ahmed et al. / Atmospheric Environment 43 (2009) 6305–6311 6311
Khan, A.J., Li, J., Husain, L., 2006. Atmospheric transport of elemental carbon. Journalof Geophysical Research-Atmosphere 111, D04303. doi:10.1029/2005/JD006505.
Lammel, G., Novakov, T., 1995. Water nucleation properties of carbon black anddiesel soot particles. Atmospheric Environment 29, 813–823.
Li, J., Khan, A.J., Husain, L., 2002. A technique for determination of black carbon incellulose filters. Atmospheric Environment 36, 4699–4704.
Liousse, C., Cachier, H., Jennings, S.G., 1993. Optical and thermal measurementsof black carbon aerosol ontent in different environments: variation of thespecific attenuation cross-section sigma. Atmospheric Environment 27,1203–1211.
McConnell, J.R., Edwards, R., Kok, G.L., Flanner, M.G., Zender, C.S., Saltzman, E.S.,Banta, J.R., Pasteris, D.R., Carter, M.M., Kahl, J.D.W., 2007. 20th-Century indus-trial black carbon emissions altered Arctic climate forcing. Science 317 (5843),1381–1384.
Naoe, H., Hasegawa, S., Heintzenberg, J., Okada, K., Uchiyama, A., Zaizen, Y.,Kobayashi, E., Yamazaki, A., 2009. State of mixture of atmospheric sub-micrometer black carbon particles and its effect on particulate light absorption.Atmospheric Environment 43, 1296–1301.
NIOSH, 1996. Elemental Carbon (Diesel Particulate) Method 5040, in NIOSH Manualof Analytical Methods. 1st Suppl, fourth ed. National Institute for OccupationalSafety and Health, Cincinnati, Ohio.
Petzold, A., Kopp, C., Niessner, R., 1997. The dependence of the specific attenuationcross-section on black carbon mass fraction and particle size. AtmosphericEnvironment 31, 661–672.
Pope, C.A., Burnett, R.T., Thun, M.J., Calle, E.E., Krewski, D., Ito, K., Thurston, G.D.,2002. Lung cancer, cardiopulmonary mortality, and long-term exposure to fine
particulate air pollution. The Journal of the American Medical Association 287(9), 1132–1141.
Ramanathan, V., Carmichael, G., 2008. Global and regional climate changes due toblack carbon. Nature Geoscience 1, 221–227.
Reisinger, P., Wonaschutz, A., Hitzenberger, R., Petzold, A., Bauer, H., Jankowski, N.,Puxbaum, H., Chi, X., Maenhaut, W., 2008. Intercomparison of measurementtechniques for black or elemental carbon under urban background conditions inwintertime. Influence of biomass combustion. Environmental Science andTechnology 42, 884–889.
Saylor, R.D., Edgerton, E.S., Hartsell, B.E., 2006. Linear regression techniques for usein the EC tracer method of secondary organic aerosol estimation. AtmosphericEnvironment 40, 7546–7556.
Schladitz, A., Muller, T., Kaaden, N., Massling, A., Kandler, K., Ebert, M.,Weinbruch, S., Deutscher, C., Wiedensohler, A., 2009. In situ measurement ofoptical properties at Tinfou (Morocco) during the Saharan mineral dustExperiment SAMUM 2006. Tellus 61B, 64–78.
Schnaiter, M., Linke, C., Mohler, O., Naumann, K.-H., Saathoff, H., Wagner, R.,Schurath, U., 2005. Absorption amplification of black carbon internally mixedwith secondary organic aerosol. Journal of Geophysical Research-Atmosphere110, D19204. doi:10.1029/2005JD006046.
Seaton, A., MacNee, W., Donaldson, K., Godden, D., 1995. Particulate air pollutionand acute health effects. Lancet 345, 176–178.
Venkatachari, P., Zhou, L., Hopke, P.K., Schwab, J.J., Demerjian, K.L., Weimer, S.,Hogrefe, O., Felton, D., Rattigan, O., 2006. An intercomparison of measurementmethods for carbonaceous aerosol in the ambient air in New York City. AerosolScience and Technology 40, 788–795.