AlO bonding: a method of joining oxide optical components to aluminum coated substrates
12
AIO Bonding: A Method Of Joining Oxide Optical Components To Aluminum Coated Substrates Alexander Coucoulas, Albert M. Benzoni*, Mindaugas F. Dautartas*, Ranjan Dutta, William R. Holland, Casmir R. Nijander and Robert E. Woods AT&T Bell Laboratories Princeton, N.J. and *Breiningsville, PA ABSTRACT With the increased use of photonic packages, there are needs for reliable and low cost methods of attaching optical components. Packages based on silicon optical bench (SiOB) technology include oxide coated ball-lenses and silica fibers which are generally epoxied in anisotropically etched features of silicon substrates. The reliable attachment of these micro- optical components requires the application of small (approximately 1 nanoliter) quantities of epoxy at precise locations on the substrate. This is a time consuming process and requires considerable operator training and skill. Dispensing too much epoxy can deteriorate the optical performance of the device and dispensing too little results in an insufficient holding power. -- AIO bonding is an alternative attachment technique, under development, which forms solid-state bonds directly between these oxide-components and aluminum thin film coated silicon optical bench substrates and therefore does not require the handling of additives, such as epoxy, at the bond interface. This paper includes: methods of bonding ball-lenses and fibers; an interfacial analysis and proposed bonding mechanism derived from SEM/metallographic photomicrographs and thermodynamic data; destructive test results as a function of bonding and material parameters and; in situ loss measurements through AIO bonded components (multi-, single mode fibers and ball-lenses) during the bonding procedures and subsequent thermal cycling (-40 to 80°C and from ambient to -195.8°C) tests. I. INTRODUCTION The transition from electronic to optoelectronic .and optical packaging has introduced passive transmission components with material properties that are not directly compatible with methods used to join metal conductors in electronic packages,llJ [2] [3] Packages, based on silicon optical bench technology, include silica fibers and oxide ball-lenses which are epoxy bonded in chemically micro-machined V-grooves and pyramidal cavities of silicon substrates. Figure 1 shows these components in position at their permanent sites for the purpose of guiding and collimating optical signals in an optical switch. [4] At present, the reliable attachment of a 300 micron diameter ball-Iense requires the application of small quantities (approximately 1 nanoliter) of liquid epoxy in the cavities, positioning the ball in the cavity and holding it in place without rotation while curing the epoxy. This is a time consuming process and requires considerable operator training and skill since it has been found that dispensing too much epoxy can deteriorate the optical performance of the component and dispensing too little results in an insufficient holding power. A similar procedure is used to epoxy fibers in V-grooves. This paper describes an alternative bonding method which forms solid-state bonds directly between an oxide component and an aluminized' silicon substrate and therefore does not require the handling and curing of additives at the bond interface. The objective of this investigation is aimed at bonding oxide coated ball-lenses and silica fibers with the simplicity presently used to join metal conductors in electronic packages. For brevity, the aluminum to oxide bonding technique described herein is referred to as AIO bonding. The report includes an interfacial analysis and mechanical testing of the AIO bonds, and in situ loss measurements through various AIO bonded components during the bonding sequence and subsequent thermal cycling tests. II. MATERIALS There were three forms of <100> oriented silicon substrates used in this investigation. It included planar substrates; chemically micro-machined substrates with 128 micron wide parallel V-grooves to accommodate fibers, and substrates used in the Silicon-Based Moving Mirror Optical Switch[4] which contain both V-grooves (107 microns wide) and pyramidal cavities. These features are anisotropically etched into <100> oriented silicon wafers using a thermally grown silicon dioxide mask. The oxide mask is removed after etching the features. The etched wafers were sputter-coated with aluminum thicknesses of I and 2.5 microns. Optimal adhesion between the sputtered aluminum metal and silicon was achieved by using an in situ RF Ar+ ion beam cleaning, followed by the sputter deposition of the aluminum film in a MRC-603 sputtering machine. The wafers were then diced into appropriate size substrates. Ball-lenses used in this investigation were AR-coated sapphire spheres having a nominal diameter of 300 microns. The anti-reflective coating of silicon dioxide was deposited by chemica! vapor deposition, LPCVD, [5] to a thickness of 2240 ± 200 A. The fibers used in this study were AT&T multimode and single mode fibers having a core/clad diameter of 62.5/125 and 9/125 microns respectively. Relevant material properties of an epoxy used for attaching optical fibers and a commercially pure aluminum is shown in Table I. III. BONDING PROCEDURE, MECHANICAL TESTING AND EXAMINATION OF BONDED BALLS In practice, AR coated sapphire ball-lenses and silica fibers are attached to multi-faceted walls of pyramidal cavities and V-grooves in silicon. This multi-point contact strengthens as well as accurately fixes their optical position relative to other attached components. To simplify subsequent destruGtiVe testing and interfacial analysis of an AIO bond, the formation of a relatively fragile single area bond will first be described between a 300 micron diameter AR coated sapphire ball and a
Transcript of AlO bonding: a method of joining oxide optical components to aluminum coated substrates
AIO Bonding: A Method Of Joining Oxide Optical ComponentsTo Aluminum Coated Substrates
Alexander Coucoulas, Albert M. Benzoni*, Mindaugas F. Dautartas*, Ranjan Dutta,William R. Holland, Casmir R. Nijander and Robert E. Woods
AT&T Bell Laboratories
Princeton, N.J. and *Breiningsville, PA
ABSTRACT
With the increased use of photonic packages, there are needsfor reliable and low cost methods of attaching opticalcomponents. Packages based on silicon optical bench (SiOB)technology include oxide coated ball-lenses and silica fiberswhich are generally epoxied in anisotropically etched featuresof silicon substrates. The reliable attachment of these microoptical components requires the application of small(approximately 1 nanoliter) quantities of epoxy at preciselocations on the substrate. This is a time consuming processand requires considerable operator training and skill.Dispensing too much epoxy can deteriorate the opticalperformance of the device and dispensing too little results in aninsufficient holding power. --
AIO bonding is an alternative attachment technique, underdevelopment, which forms solid-state bonds directly betweenthese oxide-components and aluminum thin film coated siliconoptical bench substrates and therefore does not require thehandling of additives, such as epoxy, at the bond interface.
This paper includes: methods of bonding ball-lenses and fibers;an interfacial analysis and proposed bonding mechanismderived from SEM/metallographic photomicrographs andthermodynamic data; destructive test results as a function ofbonding and material parameters and; in situ lossmeasurements through AIO bonded components (multi-, singlemode fibers and ball-lenses) during the bonding procedures andsubsequent thermal cycling (-40 to 80°C and from ambient to-195.8°C) tests.
I. INTRODUCTION
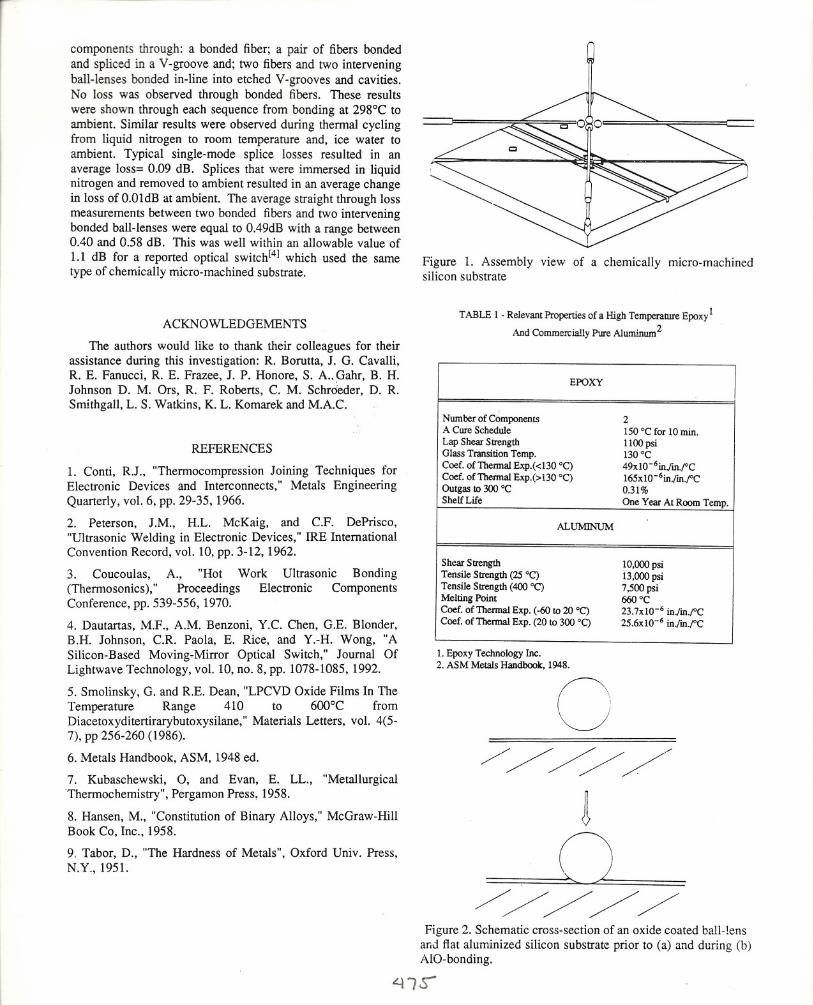
The transition from electronic to optoelectronic .and opticalpackaging has introduced passive transmission componentswith material properties that are not directly compatible withmethods used to join metal conductors in electronicpackages,llJ [2] [3] Packages, based on silicon optical benchtechnology, include silica fibers and oxide ball-lenses whichare epoxy bonded in chemically micro-machined V-groovesand pyramidal cavities of silicon substrates. Figure 1 showsthese components in position at their permanent sites for thepurpose of guiding and collimating optical signals in an opticalswitch. [4] At present, the reliable attachment of a 300 microndiameter ball-Iense requires the application of small quantities(approximately 1 nanoliter) of liquid epoxy in the cavities,positioning the ball in the cavity and holding it in place withoutrotation while curing the epoxy. This is a time consumingprocess and requires considerable operator training and skillsince it has been found that dispensing too much epoxy candeteriorate the optical performance of the component anddispensing too little results in an insufficient holding power. Asimilar procedure is used to epoxy fibers in V-grooves.
This paper describes an alternative bonding method whichforms solid-state bonds directly between an oxide componentand an aluminized' silicon substrate and therefore does not
require the handling and curing of additives at the bondinterface. The objective of this investigation is aimed atbonding oxide coated ball-lenses and silica fibers with thesimplicity presently used to join metal conductors in electronicpackages. For brevity, the aluminum to oxide bondingtechnique described herein is referred to as AIO bonding. Thereport includes an interfacial analysis and mechanical testing ofthe AIO bonds, and in situ loss measurements through variousAIO bonded components during the bonding sequence andsubsequent thermal cycling tests.
II. MATERIALS
There were three forms of <100> oriented silicon substratesused in this investigation. It included planar substrates;chemically micro-machined substrates with 128 micron wideparallel V-grooves to accommodate fibers, and substrates usedin the Silicon-Based Moving Mirror Optical Switch[4] whichcontain both V-grooves (107 microns wide) and pyramidalcavities. These features are anisotropically etched into <100>oriented silicon wafers using a thermally grown silicon dioxidemask. The oxide mask is removed after etching the features.The etched wafers were sputter-coated with aluminumthicknesses of I and 2.5 microns. Optimal adhesion betweenthe sputtered aluminum metal and silicon was achieved byusing an in situ RF Ar+ ion beam cleaning, followed by thesputter deposition of the aluminum film in a MRC-603sputtering machine. The wafers were then diced intoappropriate size substrates. Ball-lenses used in thisinvestigation were AR-coated sapphire spheres having anominal diameter of 300 microns. The anti-reflective coatingof silicon dioxide was deposited by chemica! vapor deposition,LPCVD, [5] to a thickness of 2240 ± 200 A. The fibers used
in this study were AT&T multimode and single mode fibershaving a core/clad diameter of 62.5/125 and 9/125 micronsrespectively. Relevant material properties of an epoxy used forattaching optical fibers and a commercially pure aluminum isshown in Table I.
III. BONDING PROCEDURE, MECHANICAL TESTINGAND EXAMINATION OF BONDED BALLS
In practice, AR coated sapphire ball-lenses and silica fibersare attached to multi-faceted walls of pyramidal cavities andV-grooves in silicon. This multi-point contact strengthens aswell as accurately fixes their optical position relative to otherattached components. To simplify subsequent destruGtiVetesting and interfacial analysis of an AIO bond, the formationof a relatively fragile single area bond will first be describedbetween a 300 micron diameter AR coated sapphire ball and a
:-pla.narsilicon substrate coated with 2.5 microns of aluminum.The AIO bonding of balls in cavities will then be shown.
A. Procedure
A 2.5 micron thick layer of aluminum coated on a planarsilicon substrate is positioned over a small vacuum hole of aheated base. The vacuum ensures that the substrate reaches a
maximum steady-state temperature for a given temperaturesetting of the heated base. The ball is then placed on thesubstrate (Figure 2). After pre-heating the workpieces, a flatfaced metal bonding tool is loaded on the top surface of the ballfor a pre-determined time. The inherently low thermalconductivity of the oxide ball and tangential contact that thetool makes on the ball results in an efficient condition forheating the bond region without requiring to heat the tool. If itis necessary, a heated tool could be an effective way to reducethe required base or substrate temperature.
B. Testing
The bonded workpieces were then transferred to the base ofa commercial Vertical Bond Tester.1 A loop-shaped adhesivetape was attached to the jaws of the tester, and then slowlylowered onto the top portion of the ball and stopped before thetape made contact with the surrounding substrate (Figure 3).The tape was then vertically pulled to test the bond.Destructively tested balls conveniently remained tacked to thetape for examination. A lower than maximum pull-strength wasusually obtained since most bonded balls were partially peeledduring testing. This was confirmed by microscopicobservatioris during testing which showed that the adhesive'contact was usually not at precisely the top of the ball.
.c. Examination
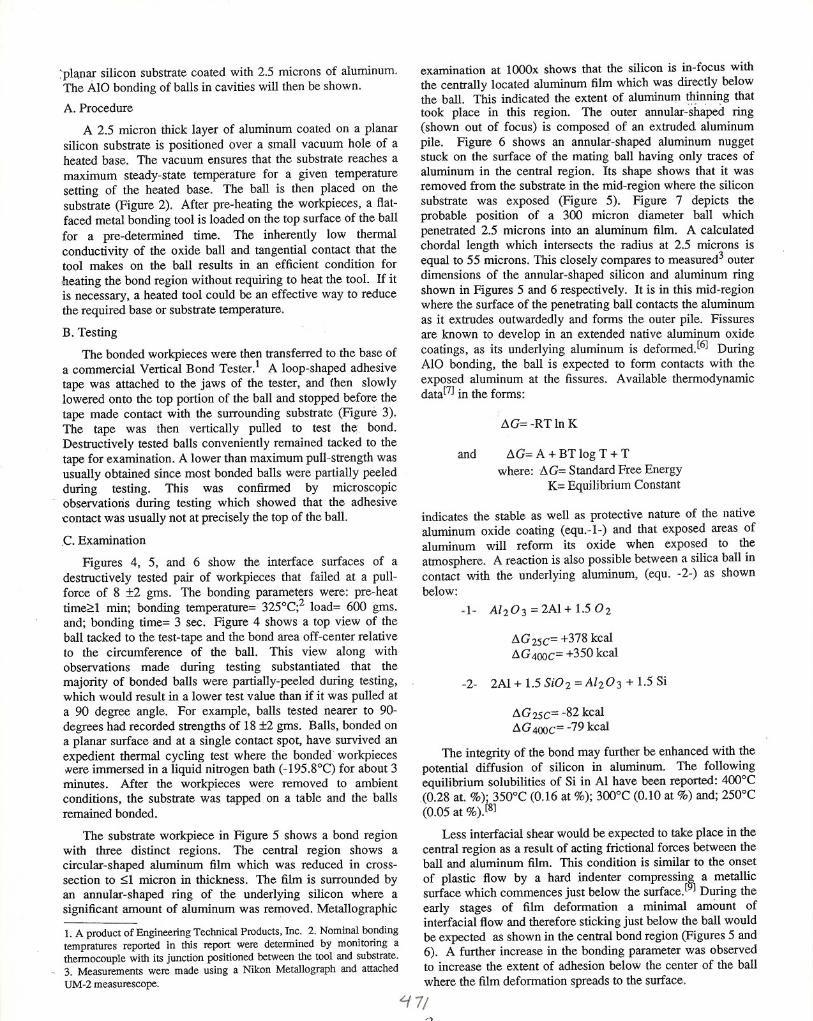
Figures 4, 5, and 6 show the interface surfaces of adestructively tested pair of workpieces that failed at a pullforce of 8 ±2 gms. The bonding parameters were: pre-heattime~1 min; bonding temperature= 325°C;z load= 600 gms.and; bonding time= 3 sec. Figure 4 shows a top view of theball tacked to the test-tape and the bond area off-center relativeto the circumference of the ball. This view along withobservations made during testing substantiated that themajority of bonded balls were partially-peeled during testing,which would result in a lower test value than if it was pulled ata 90 degree angle. For example, balls tested nearer to 90degrees had recorded strengths of 18 ±2 gms. Balls, bonded ona planar surface and at a single contact spot, have survived anexpedient thermal cycling test where the bonded workpiecesNere immersed in a liquid nitrogen bath (-195.8°C) for about 3minutes. After the workpieces were removed to ambientconditions, the substrate was tapped on a table and the ballsremained bonded.
The substrate workpiece in Figure 5 shows a bond regionwith three distinct regions. The central region shows acircular-shaped aluminum film which was reduced in crosssection to ::;;1micron in thickness. The film is surrounded byan annular-shaped ring of the underlying silicon where asignificant amount of aluminum was removed. Metallographic
1. A product of Engineering Technical Products, Inc. Z. Nominal bondingtempratures reported in this report were determined by monitoring athermocouple with its junction positioned between the tool and substrate.
_ 3. Measurements were made using a Nikon Metallograph and attachedUM-Z measurescope.
examination at l000x shows that the silicon is in-focus withthe centrally located aluminum film which was directly belowthe ball. This indicated the extent of aluminum thinning thattook place in this region. The outer annular-shaped ring(shown out of focus) is composed of an extruded aluminumpile. Figure 6 shows an annular-shaped aluminum nuggetstuck on the surface of the mating ball having only traces ofaluminum in the central region. Its shape shows that it wasremoved from the substrate in the mid-region where the siliconsubstrate was exposed (Figure 5). Figure 7 depicts theprobable position of a 300 micron diameter ball whichpenetrated 2.5 microns into an aluminum film. A calculatedchordal length which intersects the radius at 2.5 microns isequal to 55 microns. This closely compares to measured3 outerdimensions of the annular-shaped silicon and aluminum ringshown in Figures 5 and 6 respectively. It is in this mid-regionwhere the surface of the penetrating ball contacts the aluminumas it extrudes outwardedly and forms the outer pile. Fissuresare known to develop in an extended native aluminum oxidecoatings, as its underlying aluminum is deformed. [6] DuringAIO bonding, the ball is expected to form contacts with theexposed aluminum at the fissures. Available thermodynamicdata[7] in the forms:
/)'G= -RT In K
and /)'G= A + BT log T + Twhere: -/)'G=Standard Free Energy
K= Equilibrium Constant
indicates the stable as well as protective nature of the nativealuminum oxide coating (equ.-l-) and that exposed areas ofaluminum will reform its oxide when exposed to the
atmosphere. A reaction is also possible between a silica ball incontact with the underlying aluminum, (equ. -2-) as shownbelow:
-1- Alz03 = 2AI + 1.5 Oz
/)'G25C= +378 kcal/)'G400C= +350 kcal
-2- 2AI + 1.5 SiOz = Alz 03 + 1.5 Si
/)'G25C= -82 kcal/).G400C= -79 kcal
The integrity of the bond may further be enhanced with thepotential diffusion of silicon in aluminum. The followingequilibrium solubilities of Si in Al have been reported: 400°C(0.28 at. %); 350°C (0.16 at %); 300°C (0.10 at %) and; 250°C(0.05 at %). [8]
Less interfacial shear would be expected to take place in thecentral region as a result of acting frictional forces between theball and aluminum film. This condition is similar to the onset
of plastic flow by a hard indenter compressin? a metallicsurface which commences just below the surface. [ ] During theearly stages of film deformation a minimal amount ofinterfacial flow and therefore sticking just below the ball wouldbe expected as shown in the central bond region (Figures 5 and6). A further increase in the bonding parameter was observedto increase the extent of adhesion below the center of the ballwhere the film deformation spreads to the surface.
'17/
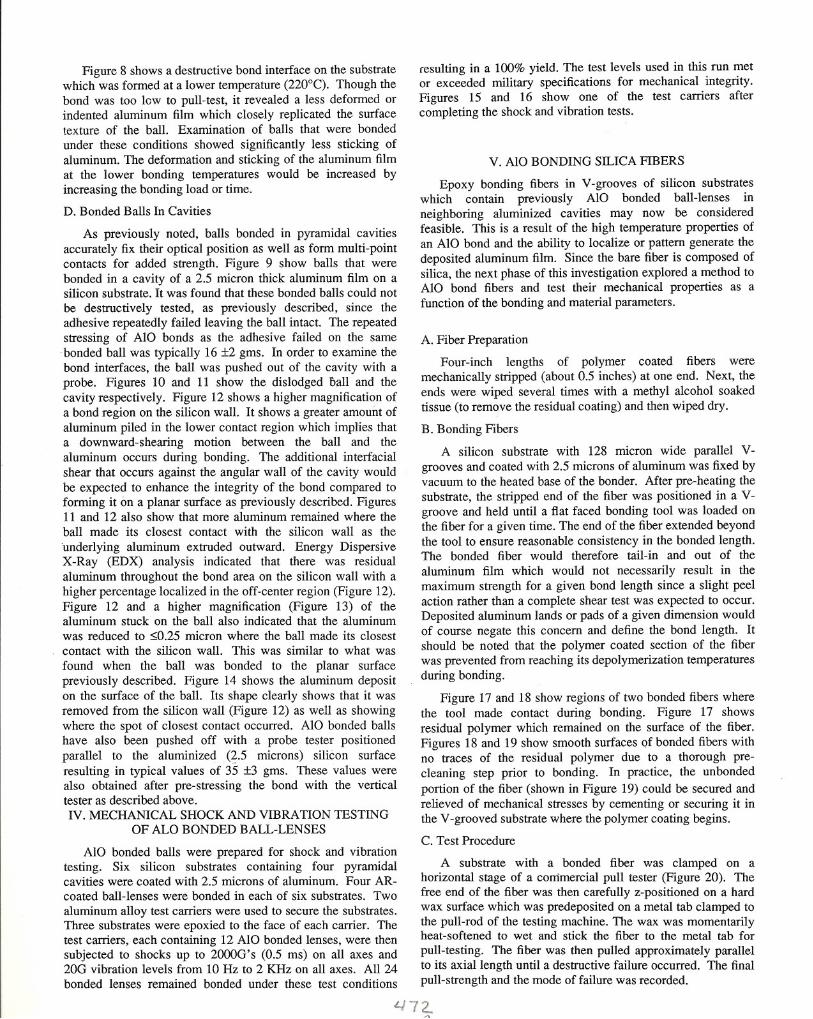
Figure 8 shows a destructive bond interface on the substratewhich was formed at a lower temperature (220°C). Though thebond was too lcw to pull-test, it revealed a less deformed orindented aluminum film which closely replicated the surfacetexture of the ball. Examination of balls that were bondedunder these conditions showed significantly less sticking ofaluminum. The deformation and sticking of the aluminum filmat the lower bonding temperatures would be increased byincreasing the bonding load or time.
D. Bonded Balls In Cavities
As previously noted, balls bonded in pyramidal caVItiesaccurately fix their optical position as well as form multi-pointcontacts for added strength. Figure 9 show balls that werebonded in a cavity of a 2.5 micron thick aluminum film on asilicon substrate. It was found that these bonded balls could not
be destructively tested, as previously described, since theadhesive repeatedly failed leaving the ball intact. The repeatedstressing of AIO bonds as the adhesive failed· on the samebonded ball was typically 16 ±2 gms. In order to examine thebond interfaces, the ball was pushed out of the cavity with aprobe. Figures 10 and 11 show the dislodged Dall and thecavity respectively. Figure 12 shows a higher magnification ofa bond region on the silicon wall. It shows a greater amount ofaluminum piled in the lower contact region which implies thata downward-shearing motion between the ball and thealuminum occurs during bonding. The additional interfacialshear that occurs against the angular wall of the cavity wouldbe expected to enhance the integrity of the bond compared toforming it on a planar surface as previously described. Figures11 and 12 also show that more aluminum remained where theball made its closest contact with the silicon wall as the
·underlying aluminum extruded outward. Energy DispersiveX-Ray (EDX) analysis indicated that there was residualaluminum throughout the bond area on the silicon wall with ahigher percentage localized in the off-center region (Figure 12).Figure 12 and a higher magnification (Figure 13) of thealuminum stuck on the ball also indicated that the aluminumwas reduced to ~0.25 micron where the ball made its closestcontact with the silicon wall. This was similar to what was
found when the ball was bonded to the planar surfacepreviously described. Figure 14 shows the aluminum depositon the surface of the ball. Its shape clearly shows that it wasremoved from the silicon wall (Figure 12) as well as showingwhere the spot of closest contact occurred. AIO bonded ballshave also been pushed off with a probe tester positionedparallel to the aluminized (2.5 microns) silicon surfaceresulting in typical values of 35 ±3 gms. These values werealso obtained after pre-stressing the bond with the verticaltester as described above.IV. MECHANICAL SHOCK AND VIBRATION TESTING
OF ALO BONDED BALL-LENSES
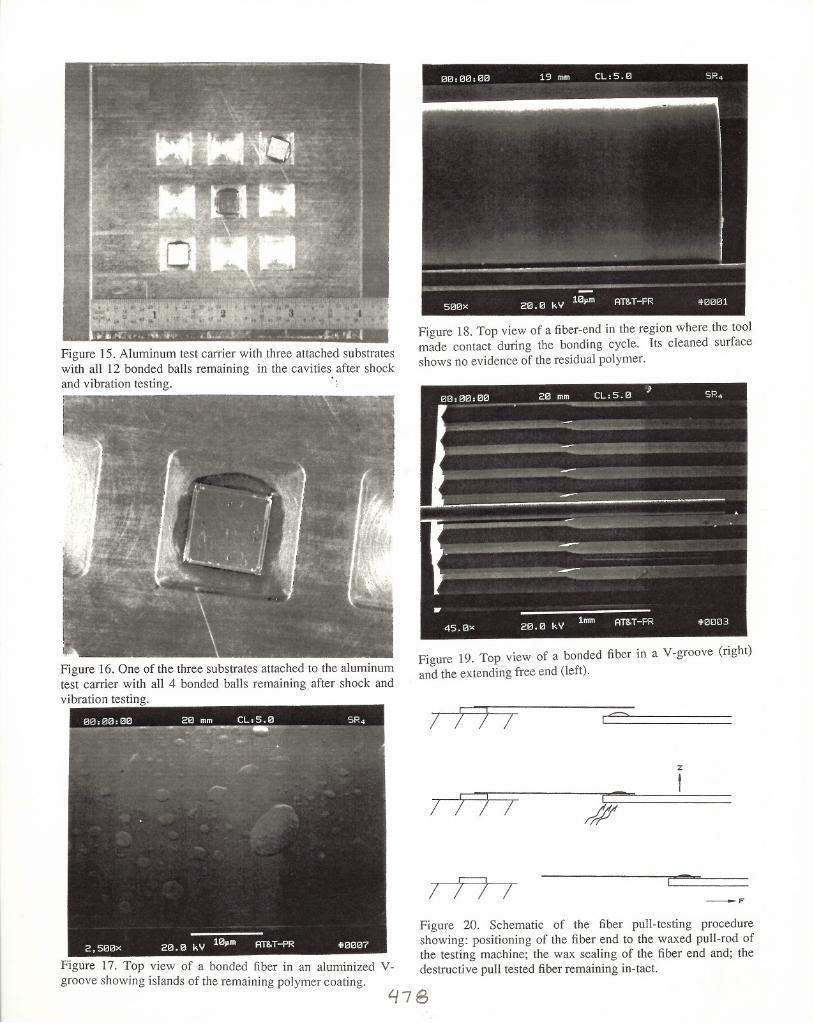
AIO bonded balls were prepared for shock and vibrationtesting. Six silicon substrates containing four pyramidalcavities were coated with 2.5 microns of aluminum. Four ARcoated ball-lenses were bonded in each of six substrates. Two
aluminum alloy test carriers were used to secure the substrates.Three substrates were epoxied to the face of each carrier. Thetest carriers, each containing 12 AIO bonded lenses, were thensubjected to shocks up to 2000G's (0.5 ms) on all axes and20G vibration levels from 10 Hz to 2 KHz on all axes. All 24bonded lenses remained bonded under these test conditions
resulting in a 100% yield. The test levels used in this run metor exceeded military specifications for mechanical integrity.Figures 15 and 16 show one of the test carriers aftercompleting the shock and vibration tests.
V. AIO BONDING SILICA FIBERS
Epoxy bonding fibers in V-grooves of silicon substrateswhich contain previously AIO bonded ball-lenses inneighboring aluminized cavities may now be consideredfeasible. This is a result of the high temperature properties ofan AIO bond and the ability to localize or pattern generate thedeposited aluminum film. Since the bare fiber is composed ofsilica, the next phase of this investigation explored a method toAIO bond fibers and test their mechanical properties as afunction of the bonding and material parameters.
A. Fiber Preparation
Four-inch lengths of polymer coated fibers weremechanically stripped (about 0.5 inches) at one end. Next, theends were wiped several times with a methyl alcohol soakedtissue (to remove the residual coating) and then wiped dry.
B. Bonding Fibers
A silicon substrate with 128 micron wide parallel Vgrooves and coated with 2.5 microns of aluminum was fixed byvacuum to the heated base of the bonder. After pre-heating thesubstrate, the stripped end of the fiber was positioned in a Vgroove and held until a flat faced bonding tool was loaded onthe fiber for a given time. The end of the fiber extended beyondthe tool to ensure reasonable consistency in the bonded length.The bonded fiber would therefore tail-in and out of thealuminum film which would not necessarily result in themaximum strength for a given bond length since a slight peelaction rather than a complete shear test was expected to occur.Deposited aluminum lands or pads of a given dimension wouldof course negate this concern and define the bond length. Itshould be noted that the polymer coated section of the fiberwas prevented from reaching its depolymerization temperaturesduring bonding.
Figure 17 and 18 show regions of two bonded fibers wherethe tool made contact during bonding. Figure 17 showsresidual polymer which remained on the surface of the fiber.Figures 18 and 19 show smooth surfaces of bonded fibers withno traces of the residual polymer due to a thorough precleaning step prior to bonding. In practice, the unbondedportion of the fiber (shown in Figure 19) could be secured andrelieved of mechanical stresses by cementing or securing it inthe V -grooved substrate where the polymer coating begins.
C. Test Procedure
A substrate with a bonded fiber was clamped on ahorizontal stage of a commercial pull tester (Figure 20). Thefree end of the fiber was then carefully z-positioned on a hardwax surface which was predeposited on a metal tab clamped tothe pull-rod of the testing machine. The wax was momentarilyheat-softened to wet and stick the fiber to the metal tab for
pull-testing. The fiber was then pulled approximately parallelto its axial length until a destructive failure occurred. The finalpull-strength and the mode of failure was recorded.
472..~
D. Test Results
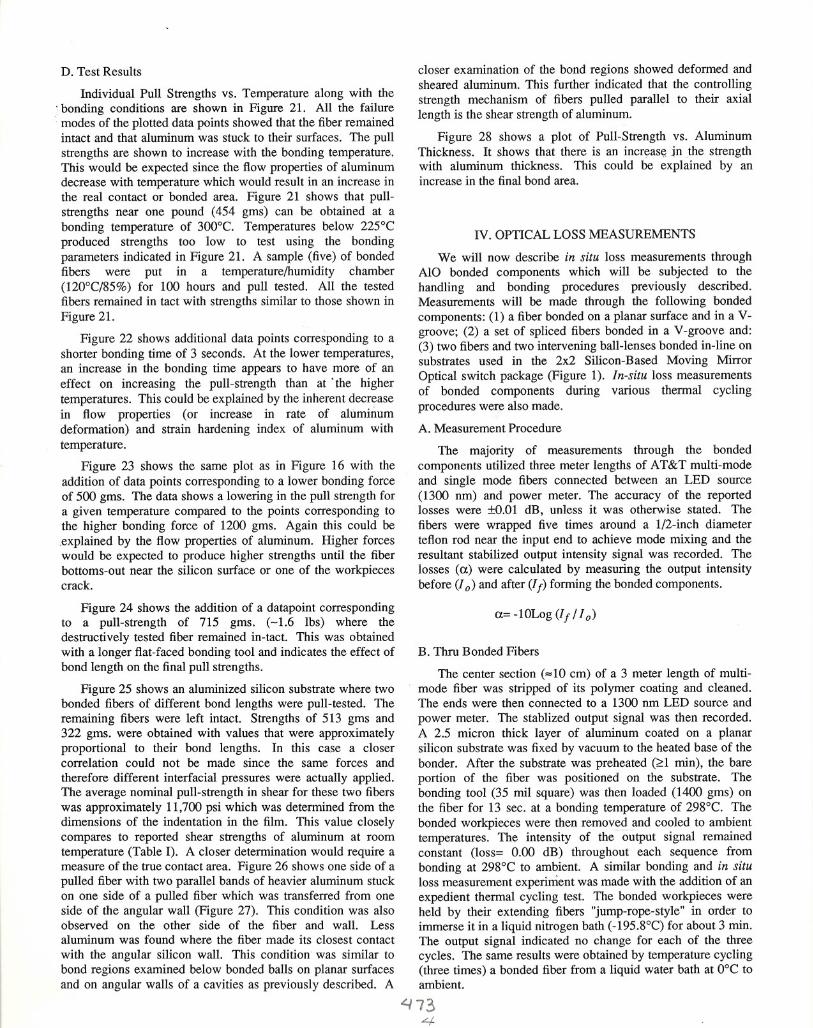
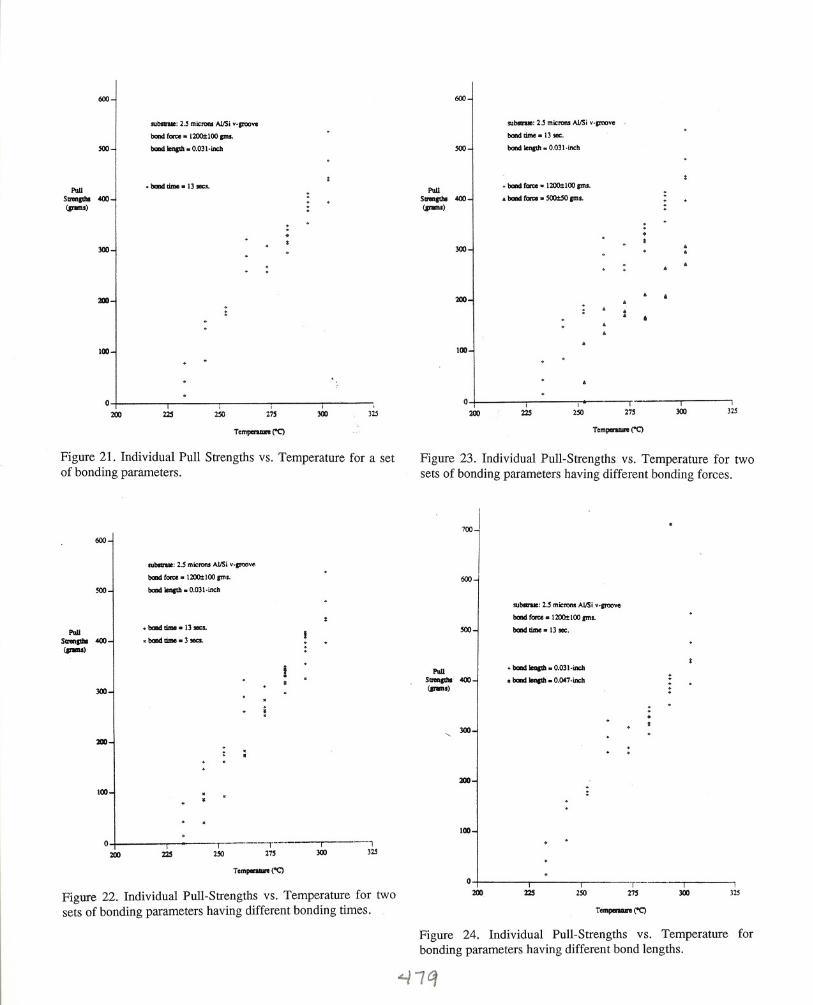
Individual Pull Strengths vs. Temperature along with the: bonding conditions are shown in Figure 21. All the failure..modes of the plotted data points showed that the fiber remained
intact and that aluminum was stuck to their surfaces. The pullstrengths are shown to increase with the bonding temperature.This would be expected since the flow properties of aluminumdecrease with temperature which would result in an increase inthe real contact or bonded area. Figure 21 shows that pullstrengths near one pound (454 gms) can be obtained at abonding temperature of 300°C. Temperatures below 225°Cproduced strengths too low to test using the bondingparameters indicated in Figure 21. A sample (five) of bondedfibers were put in a temperature/humidity chamber(120°C/85%) for 100 hours and pull tested. All the testedfibers remained in tact with strengths similar to those shown inFigure 21.
Figure 22 shows additional data points corresponding to ashorter bonding time of 3 seconds. At the lower temperatures,an increase in the bonding time appears to have more of aneffect on increasing the pull-strength than at "the highertemperatures. This could be explained by the inherent decreasein flow properties (or increase in rate of aluminumdeformation) and strain hardening index of aluminum withtemperature.
Figure 23 shows the same plot as in Figure 16 with theaddition of data points corresponding to a lower bonding forceof 500 gms. The data shows a lowering in the pull strength fora given temperature compared to the points corresponding tothe higher bonding force of 1200 gms. Again this could beexplained by the flow properties of aluminum. Higher forceswould be expected to produce higher strengths until the fiberbottoms-out near the silicon surface or one of the workpiecescrack.
Figure 24 shows the addition of a datapoint correspondingto a pull-strength of 715 gms. (-1.6 Ibs) where thedestructively tested fiber remained in-tact. This was obtainedwith a longer flat-faced bonding tool and indicates the effect ofbond length on the final pull strengths.
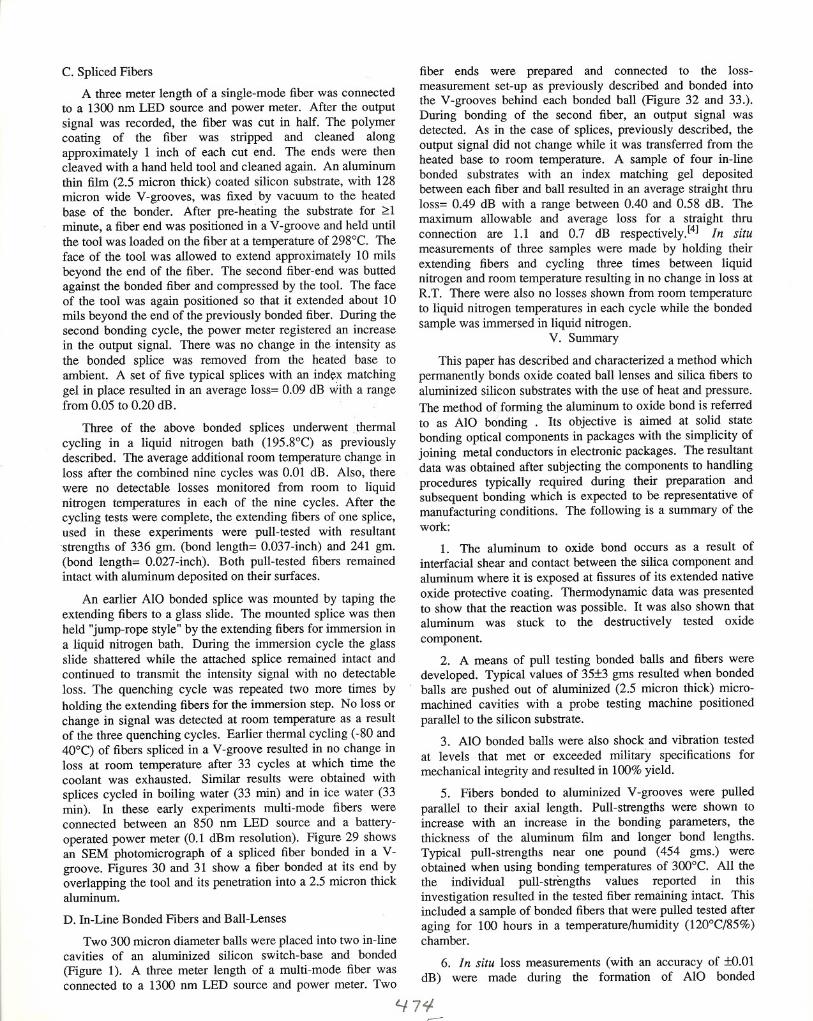
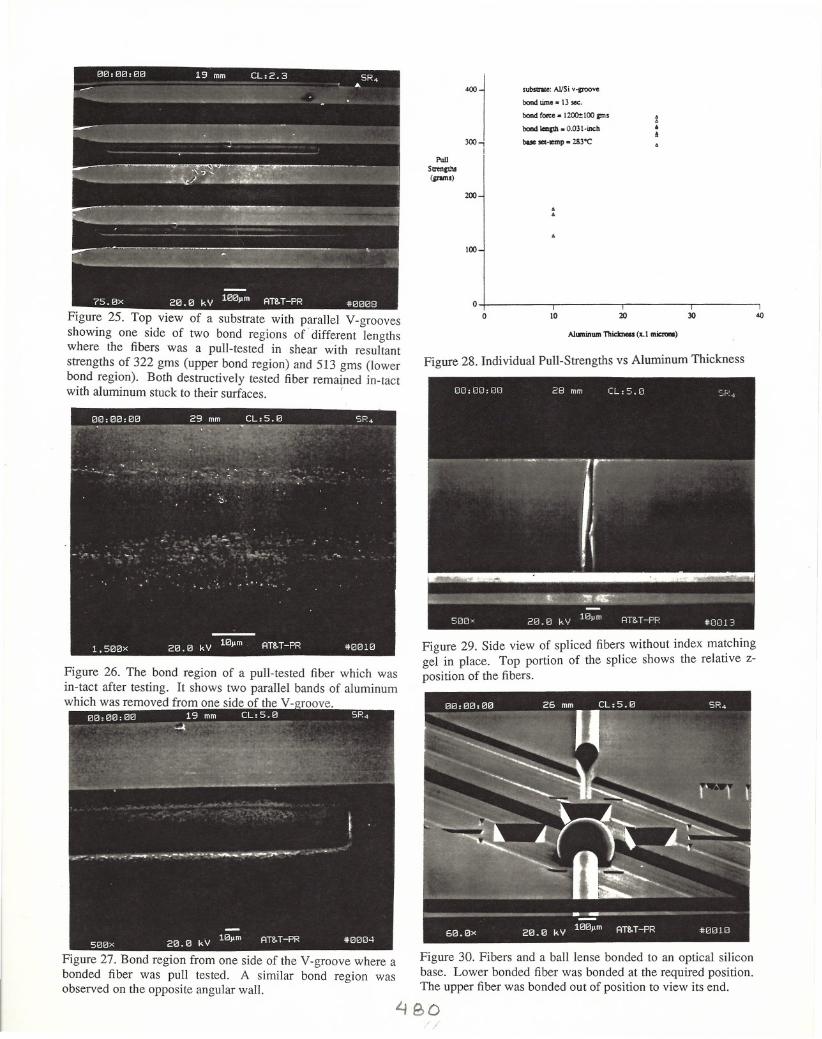
Figure 25 shows an aluminized silicon substrate where twobonded fibers of different bond lengths were pull-tested. Theremaining fibers were left intact. Strengths of 513 gms and322 gms. were obtained with values that were approximatelyproportional to their bond lengths. In this case a closercorrelation could not be made since the same forces and
therefore different interfacial pressures were actually applied.The average nominal pull-strength in shear for these two fiberswas approximately 11,700 psi which was determined from thedimensions of the indentation in the film. This value closelycompares to reported shear strengths of aluminum at roomtemperature (Table I). A closer determination would require ameasure of the true contact area. Figure 26 shows one side of apulled fiber with two parallel bands of heavier aluminum stuckon one side of a pulled fiber which was transferred from oneside of the angular wall (Figure 27). This condition was alsoobserved on the other side of the fiber and wall. Lessaluminum was found where the fiber made its closest contact
with the angular silicon wall. This condition was similar tobond regions examined below bonded balls on planar surfacesand on angular walls of a cavities as previously described. A
closer examination of the bond regions showed deformed andsheared aluminum. This further indicated that the controllingstrength mechanism of fibers pulled parallel to their axiallength is the shear strength of aluminum .
Figure 28 shows a plot of Pull-Strength vs. AluminumThickness. It shows that there is an increas~ jn .the strengthwith aluminum thickness. This could be explained by anincrease in the final bond area.
IV. OPTICAL LOSS MEASUREMENTS
We will now describe in situ loss measurements throughAIO bonded components which will be subjected to thehandling and bonding procedures previously described.Measurements will be made through the following bondedcomponents: (1) a fiber bonded on a planar surface and in a Vgroove; (2) a set of spliced fibers bonded in a V-groove and:(3) two fibers and two intervening ball-lenses bonded in-line onsubstrates used in the 2x2 Silicon-Based Moving MirrorOptical switch package (Figure 1). In-situ loss measurementsof bonded components during various thermal cyclingprocedures were also made.
A. Measurement Procedure
The majority of measurements through the bondedcomponents utilized three meter lengths of AT&T multi-modeand single mode fibers connected between an LED source(1300 nm) and power meter. The accuracy of the reportedlosses were ±o.OI dB, unless it was otherwise stated. Thefibers were wrapped five times around a 1/2-inch diameterteflon rod near the input end to achieve mode mixing and theresultant stabilized output intensity signal was recorded. Thelosses (a) were calculated by measuring the output intensity
before (10) and after (If) forming the bonded components.
a= -lOLog (If / 10)
B. Thru Bonded Fibers
The center section (=10 cm) of a 3 meter length of multimode fiber was stripped of its polymer coating and cleaned.The ends were then connected to a 1300 nm LED source and
power meter. The stablized output signal was then recorded.A 2.5 micron thick layer of aluminum coated on a planarsilicon substrate was fixed by vacuum to the heated base of thebonder. After the substrate was preheated (~l min), the bareportion of the fiber was positioned on the substrate. Thebonding tool (35 mil square) was then loaded (1400 gms) onthe fiber for 13 sec. at a bonding temperature of 298°C. Thebonded workpieces were then removed and cooled to ambienttemperatures. The intensity of the- output signal remainedconstant (loss= 0.00 dB) throughout each sequence frombonding at 298°C to ambient. A similar bonding and in situloss measurement experiment was made with the addition of anexpedient thermal cycling test. The bonded workpieces wereheld by their extending fibers "jump-rope-style" in order toimmerse it in a liquid nitrogen bath (-195.8°C) for about 3 min.The output signal indicated no change for each of the threecycles. The same results were obtained by temperature cycling(three times) a bonded fiber from a liquid water bath at O°C toambient.
4734
C. Spliced Fibers
A three meter length of a single-mode fiber was connectedto a 1300 nm LED source and power meter. After the outputsignal was recorded, the fiber was cut in half. The polymercoating of the fiber was stripped and cleaned alongapproximately 1 inch of each cut end. The ends were thencleaved with a hand held tool and cleaned again. An aluminumthin film (2.5 micron thick) coated silicon substrate, with 128micron wide V-grooves, was fixed by vacuum to the heatedbase of the bonder. After pre-heating the substrate for ~1minute, a fiber end was positioned in a V-groove and held untilthe tool was loaded on the fiber at a temperature of 298°C. Theface of the tool was allowed to extend approximately 10 milsbeyond the end of the fiber. The second fiber-end was buttedagainst the bonded fiber and compressed by the tool. The faceof the tool was again positioned so that it extended about 10mils beyond the end of the previously bonded fiber. During thesecond bonding cycle, the power meter registered an increasein the output signal. There was no change in the intensity asthe bonded splice was removed from the heated base toambient. A set of five typical splices with an index matchinggel in place resulted in an average loss= 0.09 dB v.iith a rangefrom 0.05 to 0.20 dB.
Three of the above bonded splices underwent thermalcycling in a liquid nitrogen bath (195.8°C) as previouslydescribed. The average additional room temperature change inloss after the combined nine cycles was 0.01 dB. Also, therewere no detectable losses monitored from room to liquidnitrogen temperatures in each of the nine cycles. After thecycling tests were complete, the extending fibers of one splice,used in these experiments were pull-tested with resultantstrengths of 336 gm. (bond length= 0.037-inch) and 241 gm.(bond length= 0.027-inch). Both pull-tested fibers remainedintact with aluminum deposited on their surfaces.
An earlier Ala bonded splice was mounted by taping theextending fibers to a glass slide. The mounted splice was thenheld "jump-rope style" by the extending fibers for immersion ina liquid nitrogen bath. During the immersion cycle the glassslide shattered while the attached splice remained intact andcontinued to transmit the intensity signal with no detectableloss. The quenching cycle~lls repeated two more times byholding the extending fibers for the immersion step. No loss orchange in signal was detected at room temperature as a resultof the three quenching cycles. Earlier thermal cycling (-80 and40°C) of fibers spliced in a V-groove resulted in no change inloss at room temperature after 33 cycles at which time thecoolant was exhausted. Similar results were obtained withsplices cycled in boiling water (33 min) and in ice water (33min). In these early experiments multi-mode fibers wereconnected between an 850 nm LED source and a battery
operated power meter (0.1 dBm resolution). Figure 29 showsan SEM photomicrograph of a spliced fiber bonded in a Vgroove. Figures 30 and 31 show a fiber bonded at its end byoverlapping the tool and its penetration into a 2.5 micron thickaluminum.
D. In-Line Bonded Fibers and Ball-Lenses
Two 300 micron diameter balls were placed into two in-linecavities of an aluminized silicon switch-base and bonded
(Figure 1). A three meter length of a multi-mode fiber wasconnected to a 1300 nm LED source and power meter. Two
fiber ends were prepared and connected to the lossmeasurement set-up as previously described and bonded intothe V-grooves behind each bonded ball (Figure 32 and 33.).During bonding of the second fiber, an output signal wasdetected. As in the case of splices, previously described, theoutput signal did not change while it was transferred from theheated base to room temperature. A sample of four in-linebonded substrates with an index matching gel depositedbetween each fiber and ball resulted in an average straight thruloss= 0.49 dB with a range between 0.40 and 0.58 dB. Themaximum allowable and average loss for a straight thruconnection are 1.1 and 0.7 dB respectively.l4] In situmeasurements of three samples were made by holding their
e~tending fibers and cycling three times between liquidmtrogen and room temperature resulting in no change in loss atR.T. There were also no losses shown from room temperatureto liquid nitrogen temperatures in each cycle while the bondedsample was immersed in liquid nitrogen.
V. Summary
This paper has described and characterized a method whichpermanently bonds oxide coated ball lenses and silica fibers toaluminized silicon substrates with the use of heat and pressure.The method offorming the aluminum to oxide bond is referredto as Ala bonding . Its objective is aimed at solid statebonding optical components in packages with the simplicity ofjoining metal conductors in electronic packages. The resultantdata was obtained after subjecting the components to handlingprocedures typically required during their preparation andsubsequent bonding which is expected to be representative ofmanufacturing conditions. The following is a summary of thework:
1. The aluminum to oxide bond occurs as a result ofinterfacial shear and contact between the silica component andaluminum where it is exposed at fissures of its extended nativeoxide protective coating. Thermodynamic data was presentedto show that the reaction was possible. It was also shown thataluminum was stuck to the destructively tested oxide
component.
2. A means of pull testing bonded balls and fibers weredeveloped. Typical values of 35±3 gms resulted when bondedballs are pushed out of aluminized (2.5 micron thick) micromachined cavities with a probe testing machine positionedparallel to the silicon substrate.
3. Ala bonded balls were also shock and vibration testedat levels that met or exceeded military specifications formechanical integrity and resulted in 100% yield.
5. Fibers bonded to aluminized V-grooves were pulledparallel to their axial length. Pull-strengths were shown toincrease with an increase in the bonding parameters, thethickness of the aluminum film and longer bond lengths.Typical pull-strengths near one pound (454 gms.) wereobtained when using bonding temperatures of 300°C. All thethe individual pull-strengths values reported in thisinvestigation resulted in the tested fiber remaining intact. Thisincluded a sample of bonded fibers that were pulled tested afteraging for 100 hours in a temperature!humidity (120°C/85%)chamber.
6. In situ loss measurements (with an accuracy of ±0.01dB) were made during the formation of Ala bonded
47~
components through: a bonded fiber; a pair of fibers bondedand spliced in a V-groove and; two fibers and two interveningball-lenses bonded in-line into etched V-grooves and cavities.No loss was observed through bonded fibers. These resultswere shown through each sequence from bonding at 298°C toambient. Similar results were observed during thermal cyclingfrom liquid nitrogen to room temperature and, ice water toambient. Typical single-mode splice losses resulted in anaverage loss= 0.09 dB. Splices that were immersed in liquidnitrogen and removed to ambient resulted in an average changein loss of O.OldB at ambient. The average straight through lossmeasurements between two bonded fibers and two interveningbonded ball-lenses were equal to 0.49dB with a range between0.40 and 0.58 dB. This was well within an allowable value of1.1 dB for a reported optical switch[4] which used the sametype of chemically micro-machined substrate.
ACKNOWLEDGEMENTS
The authors would like to thank their colleagues for theirassistance during this investigation: R. Borutta, J. G. Cavalli,R. E. Fanucci, R. E. Frazee, J. P. Honore, S. A.. Gahr, B. H.Johnson D. M. Ors, R. F. Roberts, C. M. Schroeder, D. R.Smithgall, L. S. Watkins, K. L. Komarek and M.A.C.
REFERENCES
1. Conti, R.I., "Thermocompression Joining Techniques forElectronic Devices and Interconnects," Metals EngineeringQuarterly, vol. 6, pp. 29-35, 1966.
2. Peterson, J.M., H.L. McKaig, and C.F. DePrisco,"Ultrasonic Welding in Electronic Devices," IRE InternationalConvention Record, vol. 10, pp. 3-12, 1962.
3. Coucoulas, A., "Hot Work Ultrasonic Bonding(Thermosonics)," Proceedings Electronic ComponentsConference, pp. 539-556, 1970.
4. Dautartas, M.F., A.M. Benzoni, Y.c. Chen, G.E. Blonder,B.H. Johnson, C.R. Paola, E. Rice, and Y.-H. Wong, "ASilicon-Based Moving-Mirror Optical Switch," Journal OfLightwave Technology, vol. 10, no. 8, pp. 1078-1085, 1992.
5. Smolinsky, G. and R.E. Dean, "LPCVD Oxide Films In TheTemperature Range 410 to 600°C fromDiacetoxyditertirarybutoxysilane," Materials Letters, vol. 4(57), pp 256-260 (1986).
6. Metals Handbook, ASM, 1948 ed.
7. Kubaschewski, 0, and Evan, E. LL., "MetallurgicalThermochemistry", Pergamon Press, 1958.
8. Hansen, M., "Constitution of Binary Alloys," McGraw-HillBook Co, Inc., 1958.
9, Tabor, D., "The Hardness of Metals", Oxford Univ. Press,N.Y., 1951.
Figure 1. Assembly view of a chemically micro-machinedsilicon substrate
TABLE 1 - Relevant Propenies of a High TemperalUre Epoxy 1
And Commerci.a!ly Pure Aluminum2
EPOXY
Number of Components
2A Cure Schedule
150 °C for 10 min.Lap Shear Strength
1100 psiGlass Transition Temp.
130°CCoef. of Thermal Exp.«130 0c)
49x1O-6inJin./"CCoef. of Thermal Exp.(>130 0c)
165xl0-6in./in./"COutgas to 300 °C
0.31%Shelf Life One Year At Room Temp.
ALUMINUM
Shear Strength
10,000 psiTensile Strength (25 0c)
13,000 psiTensile Strength (400 0c)
7,500 psiMelting Point
66O°CCoef. of Thermal Exp. (-60 to 20 0c)
23.7x1O-6 in./in./"CCoef. of Thermal Exp. (20 to 300 0c)
25.6x1O'6 in./in./"C
1. Epoxy Technology Inc.2. ASM Metals Handbook, 1948.
(\'!o//////
~
-()~/////Figure 2. Schematic cross-section of an oxide coated ball-lens
and flat aluminized silicon substrate prior to (a) and during (b)AIO-bonding.
£.liS-
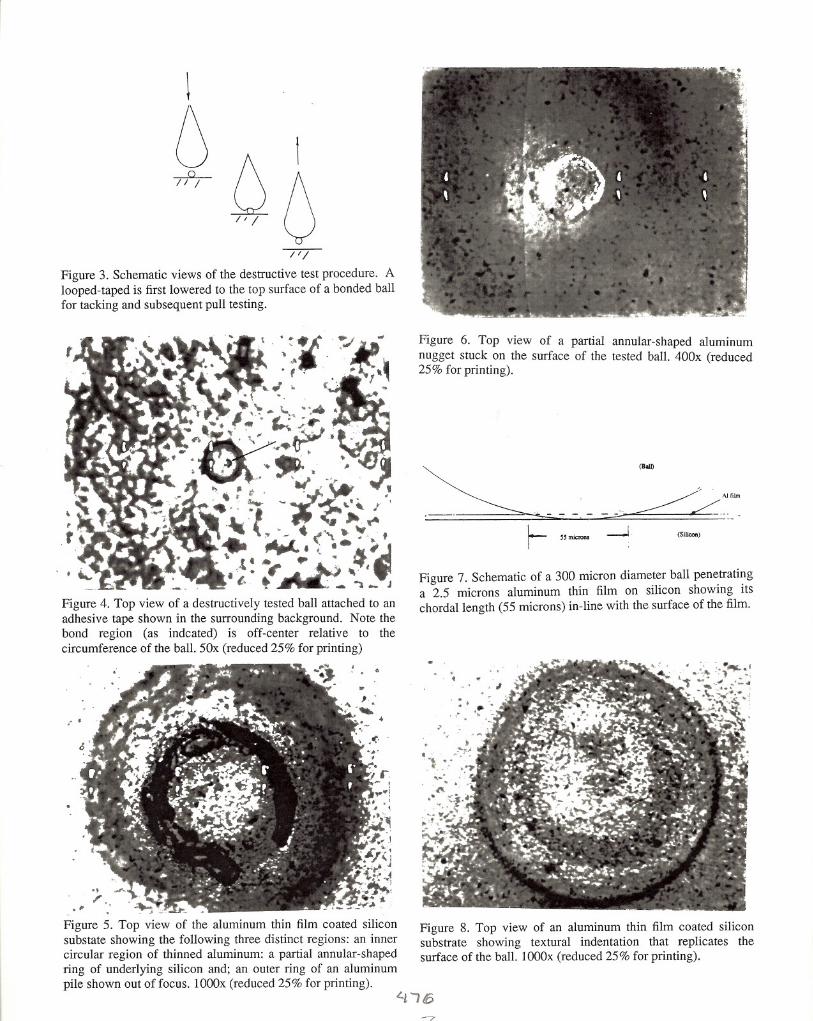
-----;tj
Figure 3. Schematic views of the destructive test procedure. Alooped-taped is first lowered to the top surface of a bonded ballfor tacking and subsequent pull testing.
.~.
'~ .. ,~ ~
~,:," .,.y.y. ...~.,:- - .•~~' / '
~t..-.(''\:~:f.~. •~:'.': ~·sf#tfit. 'J1' .. " _' t• e ~ .'. t '_"l_J
Figure 4. Top view of a destructively tested ball attached to anadhesive tape shown in the surrounding background. Note thebond region (as indcated) is off-center relative to thecircumference of the ball. 50x (reduced 25% for printing)
,, .
." .
.,••• " '~,~ iI" ••
Figure 5. Top view of the aluminum thin film coated siliconsubstate showing the following three distinct regions: an innercircular region of thinned aluminum: a partial annular-shapedring of underlying silicon and; an outer ring of an aluminumpile shown out offocus. 1000x (reduced 25% for printing).
Figure 6. Top view of a partial annular-shaped aluminumnugget stuck on the surface of the tested ball. 400x (reduced25% for printing).
Figure 7. Schematic of a 300 micron diame~~r ball pen~trati~ga 2.5 microns aluminum thin film on SIlIcon showmg Itschordal length (55 microns) in-line with the surface of the film.
Figure 8. Top view of an aluminum thin film coated siliconsubstrate showing textural indentation that replicates thesurface of the ball. 1000x (reduced 25% for printing).
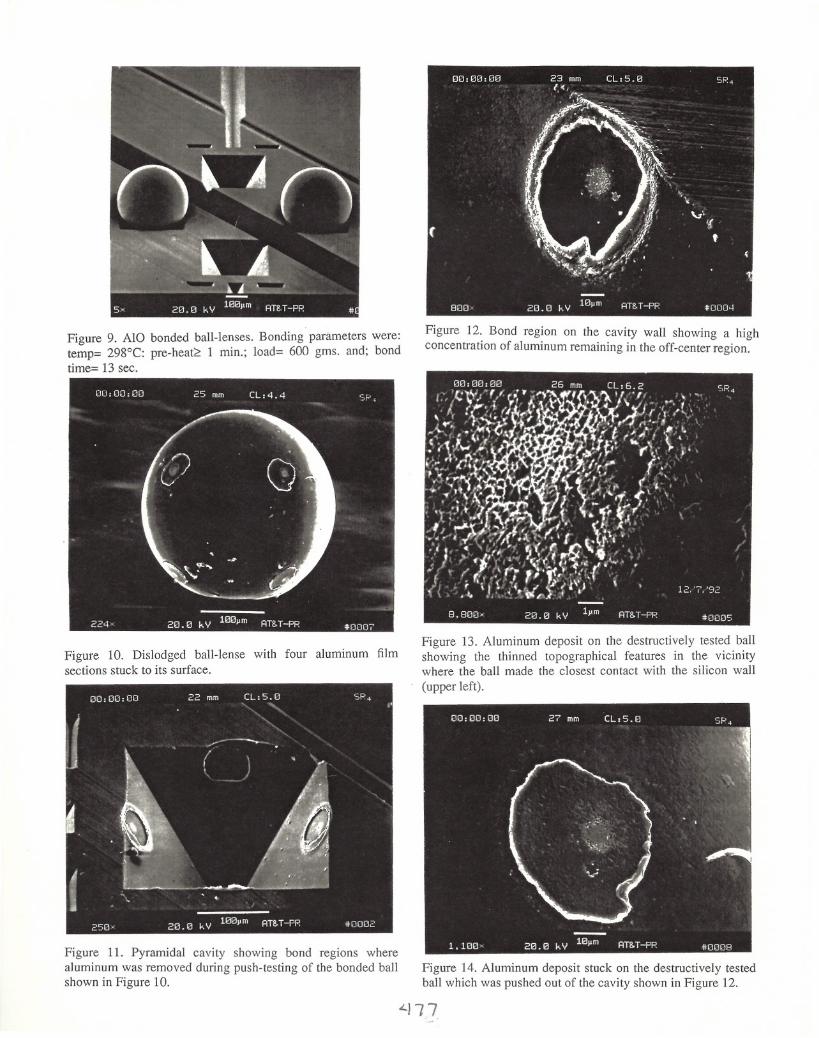
Figure 9. AlO bonded ball-lenses. Bonding parameters were:temp= 298°C: pre-heat~ 1 min.; load= 600 gms. and; bondtime= 13 sec.
Figure 10. Dislodged ball-lense with four aluminum filmsections stuck to its surface.
Figure 11. Pyramidal cavity showing bond regions wherealuminum was removed during push-testing of the bonded ballshown in Figure 10.
Figure 12. Bond region on the cavity wall showing a highconcentration of aluminum remaining in the off-center region.
Figure 13. Aluminum deposit on the destructively tested ballshowing the thinned topographical features in the vicinitywhere the ball made the closest contact with the silicon wall
(upper left).
Figure 14. Aluminum deposit stuck on the destructively testedball which was pushed out of the cavity shown in Figure 12.
_F
I ))I I...-....
zI
;)I I
~
I II IFigure 20. Schematic of the fiber pull-testing procedure
showinir positio~ing of the fiber end to the waxed pull-rod ofthe testmg machme; the wax sealing of the fiber end and' thedestructive pull tested fiber remaining in-tact. '
Figure 19. Top view of a bonded fiber in a V-groove (right)and the extending free end (left).
Figure 18. Top view of a fiber-end in the region where the toolmade contact during the bonding cycle. Its cleaned surfaceshows no evidence of the residual polymer.Figure 15. Aluminum test carrier with three attached substrates
with all 12 bonded balls remaining in the cavities after shockand vibration testing ..
Figure 17. Top view of a bonded fiber in an aluminized Vgroove showing islands of the remaining polymer coating.
Figure 16. One of the three substrates attached to the aluminumtest carrier with all 4 bonded balls remaining after shock andvibration testing.
47S
600
subsnle: 2.~ microns AlISi v-JfOOVI
bolld fon:e. 12OO±1OOJIllS.
bolld 1eflIth. 0.031·inch
600
substrals: 2.5 microns AlISi v-JtOOve
bcftd time • 13 tee.
bolld 1eflIth. 0.031·inch
.•.boa4 time. 13 tea. • bolld fon:e. 12OO±IOOJIIIS.
• bcDd farce • SOO:t.SO ems.
300
100
0+-----,----,-----:-----:-, -----;,~ ~ ill 300 m
Temperunrcl
Figure 21. Individual Pull Strengths vs. Temperature for a setof bonding parameters.
600
subllrut: 2.5 microns AlISi v_p'OOve
bolld fon:e. 12OO±100I"'s.
bolld 1eflIth. 0.031-inch
300
100
0+-----:-, ----.-, -----,------,.,-----"~ :w 250 275 300 m
Tem_rcl
Figure 23. Individual Pull-Strengths vs. Temperature for twosets of bonding parameters having different bonding forces.
600
.•.bald. time. 13 teeS.
• bond time • 3 JlllCS •
subcue: 2..$ microns AlISi v'JI:'OOYe
bolld fon:e. 12OO±IOO1"" .
bolld 1ilIle. 13 •••.
300
• bolld IelIc1h • O.03I·inch
• bolld IelIc1h - 0.0.7·inch
100
0+-----,----,-----,---··~ ~ 275
,300
132.5
300
lOll
Tem_rcl
Figure 22. Individual Pull-Strengths vs. Temperature for twosets of bonding parameters having different bonding times.
O+----,----,.-----·r---·--, ----,~. 250 275 300 m
Figure 24. Individual Pull-Strengths vs. Temperature forbonding parameters having different bond lengths.
302010
subsnle: AJ/Si V41J'OOve
bond time • 13 sec.
bond (octo. I 200± 100 ps
bond kqlIl • 0.03 I-inch
_ •••. """p • 2li3"C
O+-----,-------r------,-------,o
A1•••• inum Thiclmas (LIIIIicronI)
100
200
~I300.,
IPull
Stm>cW(Jnms)
Figure 28. Individual Pull-Strengths vs Aluminum Thickness
Figure 29. Side view of spliced fibers without index matchinggel in place. Top portion of the splice shows the relative zposition of the fibers.
Figure 30. Fibers and a balllense bonded to an optical siliconbase. Lower bonded fiber was bonded at the required position.The upper fiber was bonded out of position to view its end.
Figure 25. Top view of a substrate with parallel V-groovesshowing one side of two bond regions of· different lengthswhere the fibers was a pull-tested in shear with resultant
strengths.of 322 gms (upper bond region) and 513 gms (lowerbond regIOn). Both destructively tested fiber remained in-tactwith aluminum stuck to their surfaces.
Figure 26. The bond region of a pull-tested fiber which wasin-tact after testing. It shows two parallel bands of aluminumwhich was removed from one side of the V-aroove.
Figure 27. Bond region from one side of the V-groove where abonded fiber was pull tested. A similar bond region wasobserved on the opposite angular wall.
. ,
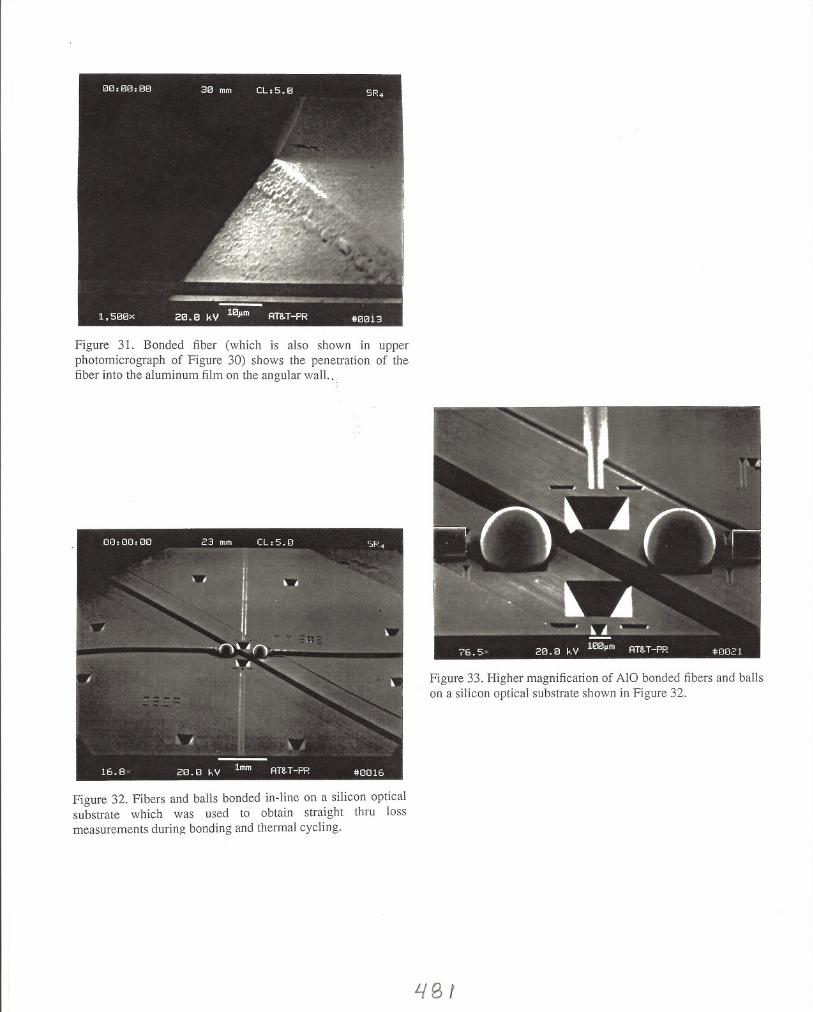
Figure 31. Bonded fiber (which is also shown in upperphotomicrograph of Figure 30) shows the penetration of thefiber into the aluminum film on the angular wall .. ,
Figure 32. Fibers and balls bonded in-line on a silicon opticalsubstrate which was used to obtain straight thru lossmeasu~ements during bonding and thermal cycling.
Figure 33. Higher magnification of AlO bonded fibers and ballson a silicon optical substrate shown in Figure 32,
LlBf