MDM2Dependent Downregulation of p21 and hnRNP K Provides a Switch between Apoptosis and Growth...
13
Cancer Cell Article MDM2-Dependent Downregulation of p21 and hnRNP K Provides a Switch between Apoptosis and Growth Arrest Induced by Pharmacologically Activated p53 Martin Enge, 1 Wenjie Bao, 1 Elisabeth Hedstro ¨ m, 1 Stephen P. Jackson, 2 Abdeladim Moumen, 2,3 and Galina Selivanova 1, * 1 Department of Microbiology, Tumor and Cell Biology, Karolinska Institutet, SE-171 77 Stockholm, Sweden 2 The Gurdon Institute, University of Cambridge, Tennis Court Road, Cambridge CB2 1QN, UK 3 Basic Medical Science, St. George’s University of London, Cranmer Terrace, London SW17 0RE, UK *Correspondence: [email protected] DOI 10.1016/j.ccr.2009.01.019 SUMMARY We have previously identified the p53-reactivating compound RITA in a cell-based screen. Here, using micro- array analysis, we show that the global transcriptional response of tumor cells to RITA is p53 dependent. Pathway analysis revealed induction of the p53 apoptosis pathway, consistent with apoptosis being the major response to RITA in cancer cells. We uncovered that MDM2 released from p53 by RITA promotes degradation of p21 and the p53 cofactor hnRNP K, required for p21 transcription. Functional studies revealed MDM2- dependent inhibition of p21 as a key switch regulating cell fate decisions upon p53 reactivation. Our results emphasize the utility of targeting wild-type p53 protein itself as a promising approach for anticancer therapy. INTRODUCTION The role of p53 as a gatekeeper of tumor suppression (Vogelstein et al., 2000) coupled to its great propensity to be a target for inac- tivation in tumors has made it a tempting choice for targeted therapy. In normal, nontransformed cells, p53 levels are kept low through the activity of negative regulators, the most thor- oughly studied being MDM2. The E3 ligase MDM2 binds to the p53 N-terminal transcriptional activation domain, inhibiting its transcriptional activation function as well as tagging p53 for pro- teasomal degradation. Upon DNA damage or other stress, p53 protein levels rapidly increase due to inhibition of MDM2/p53 interaction via several mechanisms (Vousden and Lu, 2002). The outcome of p53 activation in cells ranges from a reversible cell-cycle arrest and induction of DNA repair to more drastic responses, such as cell death by apoptosis or senescence. p53 transactivates genes that induce apoptosis, such as FAS, BBC3 (PUMA), PMAIP1 (Noxa), and BAX, as well as genes that induce cell-cycle arrest, such as CDKN1A (p21) and GADD45. The choice of biological response to p53—death or survival— is strongly influenced by the presence of death or survival signals, and such signals act both upstream and downstream of p53. However, the exact molecular mechanism by which the switch between arrest and apoptosis is implemented remains largely unknown. Several p53 partner proteins or enzymes inducing posttranslational modifications of p53 that can shift the response toward cell-cycle arrest or apoptosis have been described to date (D’Orazi et al., 2002; Samuels-Lev et al., 2001; Sykes et al., 2006; Tang et al., 2006). One of the most recently identified cofactors is hnRNP K, which is important for the induc- tion of cell-cycle arrest by p53 (Moumen et al., 2005). Upon DNA damage, hnRNP K is protected from MDM2-mediated proteaso- mal degradation and cooperates with p53 in transcriptional activation of cell-cycle arrest genes, such as 14-3-3s, GADD45, and CDKN1A (p21). Interestingly, p21 has also been shown to act in an antiapoptotic manner. The inhibition of apoptosis by p21 has been attributed to interaction with procaspase-3 resulting in inhibition of its activity (Suzuki et al., 1998), stabilization of the antiapoptotic c-IAP1 protein (Steinman and Johnson, 2000), or downregulation of caspase-2 (Baptiste-Okoh et al., 2008). SIGNIFICANCE Reconstitution of p53 function might open new therapeutic avenues against cancer. A more rigorous determination of the mechanisms governing induction of cell survival or death by p53 is crucial for the development of novel therapies since induction of cell-cycle arrest might allow DNA repair, thus protecting cancers from chemotherapeutic agents. Our study advances the understanding of the switch governing induction of apoptosis or growth arrest by p53 and implicates MDM2 and p21 as key players. Importantly, we also show that small molecules can selectively modulate this switch. These findings might help to design more effective and less toxic treatment strategies, manipulating the p53 response so that pharmacological reactivation of p53 will favor apoptosis or growth arrest in tumor cells. Cancer Cell 15, 171–183, March 3, 2009 ª2009 Elsevier Inc. 171
-
Upload
independent -
Category
Documents
-
view
2 -
download
0
Transcript of MDM2Dependent Downregulation of p21 and hnRNP K Provides a Switch between Apoptosis and Growth...
Cancer Cell
Article
MDM2-DependentDownregulationofp21andhnRNPKProvides a Switch between Apoptosis and GrowthArrest Induced by Pharmacologically Activated p53Martin Enge,1 Wenjie Bao,1 Elisabeth Hedstrom,1 Stephen P. Jackson,2 Abdeladim Moumen,2,3 and Galina Selivanova1,*1Department of Microbiology, Tumor and Cell Biology, Karolinska Institutet, SE-171 77 Stockholm, Sweden2The Gurdon Institute, University of Cambridge, Tennis Court Road, Cambridge CB2 1QN, UK3Basic Medical Science, St. George’s University of London, Cranmer Terrace, London SW17 0RE, UK*Correspondence: [email protected]
DOI 10.1016/j.ccr.2009.01.019
SUMMARY
We have previously identified the p53-reactivating compound RITA in a cell-based screen. Here, using micro-array analysis, we show that the global transcriptional response of tumor cells to RITA is p53 dependent.Pathway analysis revealed induction of the p53 apoptosis pathway, consistent with apoptosis being the majorresponse to RITA in cancer cells. We uncovered that MDM2 released from p53 by RITA promotes degradationof p21 and the p53 cofactor hnRNP K, required for p21 transcription. Functional studies revealed MDM2-dependent inhibition of p21 as a key switch regulating cell fate decisions upon p53 reactivation. Our resultsemphasize the utility of targeting wild-type p53 protein itself as a promising approach for anticancer therapy.
INTRODUCTION
The role of p53 as a gatekeeper of tumor suppression (Vogelstein
et al., 2000) coupled to its great propensity to be a target for inac-
tivation in tumors has made it a tempting choice for targeted
therapy. In normal, nontransformed cells, p53 levels are kept
low through the activity of negative regulators, the most thor-
oughly studied being MDM2. The E3 ligase MDM2 binds to the
p53 N-terminal transcriptional activation domain, inhibiting its
transcriptional activation function as well as tagging p53 for pro-
teasomal degradation. Upon DNA damage or other stress, p53
protein levels rapidly increase due to inhibition of MDM2/p53
interaction via several mechanisms (Vousden and Lu, 2002).
The outcome of p53 activation in cells ranges from a reversible
cell-cycle arrest and induction of DNA repair to more drastic
responses, such as cell death by apoptosis or senescence.
p53 transactivates genes that induce apoptosis, such as FAS,
BBC3 (PUMA), PMAIP1 (Noxa), and BAX, as well as genes that
induce cell-cycle arrest, such as CDKN1A (p21) and GADD45.
The choice of biological response to p53—death or survival—
is strongly influenced by the presence of death or survival
signals, and such signals act both upstream and downstream
of p53. However, the exact molecular mechanism by which the
switch between arrest and apoptosis is implemented remains
largely unknown. Several p53 partner proteins or enzymes
inducing posttranslational modifications of p53 that can shift
the response toward cell-cycle arrest or apoptosis have been
described to date (D’Orazi et al., 2002; Samuels-Lev et al., 2001;
Sykes et al., 2006; Tang et al., 2006). One of the most recently
identified cofactors is hnRNP K, which is important for the induc-
tion of cell-cycle arrest by p53 (Moumen et al., 2005). Upon DNA
damage, hnRNP K is protected from MDM2-mediated proteaso-
mal degradation and cooperates with p53 in transcriptional
activation of cell-cycle arrest genes, such as 14-3-3s, GADD45,
and CDKN1A (p21). Interestingly, p21 has also been shown to act
in an antiapoptotic manner. The inhibition of apoptosis by p21
has been attributed to interaction with procaspase-3 resulting
in inhibition of its activity (Suzuki et al., 1998), stabilization of
the antiapoptotic c-IAP1 protein (Steinman and Johnson, 2000),
or downregulation of caspase-2 (Baptiste-Okoh et al., 2008).
SIGNIFICANCE
Reconstitution of p53 function might open new therapeutic avenues against cancer. A more rigorous determination of themechanisms governing induction of cell survival or death by p53 is crucial for the development of novel therapies sinceinduction of cell-cycle arrest might allow DNA repair, thus protecting cancers from chemotherapeutic agents. Our studyadvances the understanding of the switch governing induction of apoptosis or growth arrest by p53 and implicatesMDM2 and p21 as key players. Importantly, we also show that small molecules can selectively modulate this switch. Thesefindings might help to design more effective and less toxic treatment strategies, manipulating the p53 response so thatpharmacological reactivation of p53 will favor apoptosis or growth arrest in tumor cells.
Cancer Cell 15, 171–183, March 3, 2009 ª2009 Elsevier Inc. 171
Cancer Cell
MDM2 Contributes to p53-Induced Cell Death
Thus, the antiapoptotic function of p21 appears to be distinct
from its growth-arrest function.
Identification of pathways and/or factors governing the deci-
sion between apoptosis and growth arrest/DNA repair induced
by p53 might help to develop tools that can modulate these path-
ways so that therapeutic reactivation of p53 by small molecules
will kill tumor cells without detrimental effects on normal cells.
Moreover, it would be of great importance to be able to modulate
p53, since the relative impact of apoptotic and other activities of
p53 could either enhance or prevent the therapeutic response.
For example, p53-mediated cell-cycle arrest and DNA repair
might serve as barriers to optimal chemotherapeutic treatment,
as shown in a recent study in ovarian carcinoma patients
(Moreno et al., 2007).
Up to 50% of human tumors carry inactivating mutations in the
TP53 gene (Olivier et al., 2002), making it one of the most
frequently mutated genes in cancer. In tumors that retain
a wild-type TP53 gene, its function is generally compromised,
largely due to deregulation of its destructor MDM2 (Vousden
and Lu, 2002). Several efforts have been made to pharmacolog-
ically reactivate p53 in cancer cells using small molecules by inhi-
bition of either the enzymatic activity of MDM2 (Lai et al., 2002;
Yang et al., 2005) or the binding between MDM2 and p53 (Vassi-
lev et al., 2004). Indeed, recent studies support the validity of
pharmacological reactivation of p53 by small molecules as
a promising approach to therapy (Lain et al., 2008; Vassilev
et al., 2004; Yang et al., 2005). RITA (reactivation of p53 and
induction of tumor cell apoptosis) is a low-molecular-weight
compound that we previously identified in a cell-based screen
for wild-type p53-reactivating compounds (Issaeva et al.,
2004). Unlike other wild-type p53-reactivating compounds,
RITA targets p53 itself, inhibiting its binding to MDM2 as well as
other negative regulators in cultured cells and in human tumor
xenografts in vivo, resulting in derepression of p53 and highly
efficient induction of apoptosis (Issaeva et al., 2004).
Here, we use oligonucleotide microarray analysis to explore the
molecular mechanism of the RITA-induced p53 biological
response. We explore the mechanism of the preferential induc-
tion of apoptosis by RITA and the role of MDM2-dependent
degradation of critical regulators of p53-induced cell-cycle arrest.
RESULTS
RITA Induces Profound Changes in Gene ExpressionProfiles Exclusively in a p53-Dependent MannerOur previous results demonstrated an efficient induction of
apoptosis by RITA in tumor cells of different origin expressing
wild-type p53 (Issaeva et al., 2004). To explore the molecular
mechanism of action of RITA in more detail, we conducted an
oligonucleotide microarray experiment using the HCT116 cell
line harboring wild-type p53 and its isogenic derivative in which
p53 has been knocked out by means of homologous recombina-
tion (HCT116 TP53�/�) (Bunz et al., 1998). We hybridized cDNA
prepared from parental and p53 knockout HCT116 cells
untreated or treated with 1 mM RITA for 12 hr to Affymetrix
hgu133a chips containing �22,000 probe sets mapping to
�15,000 known human genes.
First, we explored the global topology of gene expression by
using the significance analysis of microarrays (SAM) procedure
172 Cancer Cell 15, 171–183, March 3, 2009 ª2009 Elsevier Inc.
(Tusher et al., 2001) to assess the statistical significance of differ-
ential expression of individual genes. We then compared the
effects of RITA treatment by clustering analysis of samples.
Using a false discovery rate (FDR) of 1% and the SAM procedure
on an F statistic on all four groups and with no further evaluation
produced a list of 2300 genes (the 2.3k list). Figure 1A shows
a heat map of the 2.3k list, selected by no criteria other than
within-group variance versus between-group variance. As evi-
denced by global analysis of gene expression, few or no genes
changed expression after RITA treatment of HCT116 TP53�/�
cells. In fact, the clustering algorithm was unable to distinguish
between the treated and untreated HCT116 TP53�/� samples,
indicating an insignificant effect of RITA on p53-negative cells.
On the other hand, considerable changes in gene expression
were detected in RITA-treated HCT116 cells. Indeed, an analysis
using ANOVA showed that almost 1700 genes out of the 2300
were mainly influenced by the interaction effect between p53
status and RITA treatment. Differences in gene expression
between HCT116 and HCT116 TP53�/� cell lines indicating
p53 effects on basal transcription were also detected, although
they were markedly smaller than those seen in RITA-treated
samples.
Next, we focused on the specific comparisons between
untreated and treated samples in wild-type p53 and p53 null
cell lines separately. With a FDR of 5% and using the SAM proce-
dure on a two-sample t statistic, we identified 800 differentially
regulated genes in the HCT116 cells treated with RITA compared
to untreated samples (the 0.8k list). The same procedure on the
HCT116 TP53�/� samples yielded no differentially regulated
genes. In fact, the first differentially regulated genes could be
detected in p53 null cells only when using a FDR of more than
20%. Based on these data, we concluded that in our system of
isogenic cell lines, the biological effect of RITA is entirely p53
dependent.
Thus, out of the 2300 genes differentially expressed, which
constitute 10% of the measured genes, 1700 genes (8% of the
measured genes) were altered only in wild-type p53-containing
cells treated with RITA. Since no changes in gene expression
were detected in RITA-treated p53 null cells, the differential
expression of the remaining 2% of the measured genes could
be attributed to the basal transcriptional activity of wild-type p53.
Pathway Analysis Reveals p53 Apoptotic Pathwaysto Be Most Highly Upregulated by RITA TreatmentThe high number of differentially expressed genes in RITA-
treated HCT116 cells made interpretation based on single genes
difficult and possibly arbitrary. In order to characterize the tran-
scriptional response to RITA in an unbiased, structured manner,
we analyzed differential expression on the level of pathways. To
do this, we used existing knowledge of pathways and categories
of genes and determined the probability of their differential regu-
lation. We applied a modified procedure from Tian et al. (2005),
adapted for small sample sizes and highly correlated expression
patterns. The original procedure ranks the pathways by
computing two sets of p values for the pathways—one based
on permutations of the sample labels and one based on permu-
tations of the gene labels—and then ranks them by the average.
As the pattern of expression of genes in our experiment is highly
correlated (i.e., a very high percentage of genes are differentially
Cancer Cell
MDM2 Contributes to p53-Induced Cell Death
regulated), the former p value becomes inflated and uninforma-
tive. Therefore, the test based on permutations of the sample
labels was disregarded, keeping the test based on permutations
of gene labels, and instead the data for differentially regulated
genes were prefiltered using the per gene p value. Thus, we em-
ployed the procedure on the 0.8k list with the pathways from Tian
et al. (2005) containing around 6500 pathways (Gene Ontology
categories [Ashburner et al., 2000], KEGG pathways [Kanehisa
and Goto, 2000], and pathways from SuperArray [now SABio-
sciences; www.sabiosciences.com]) plus lists of p53 target
genes sorted according to function from Xu and el-Gewely
(2001).
This unbiased procedure placed p53 proapoptotic targets as
being the most significantly affected by RITA treatment, followed
by other pathways related to apoptosis (Table 1). In addition,
pathways related to DNA damage that contain genes responsive
to p53 were ranked high, as well as pathways related to PI3K/Akt
and signal transduction. Interestingly, pathways involved in
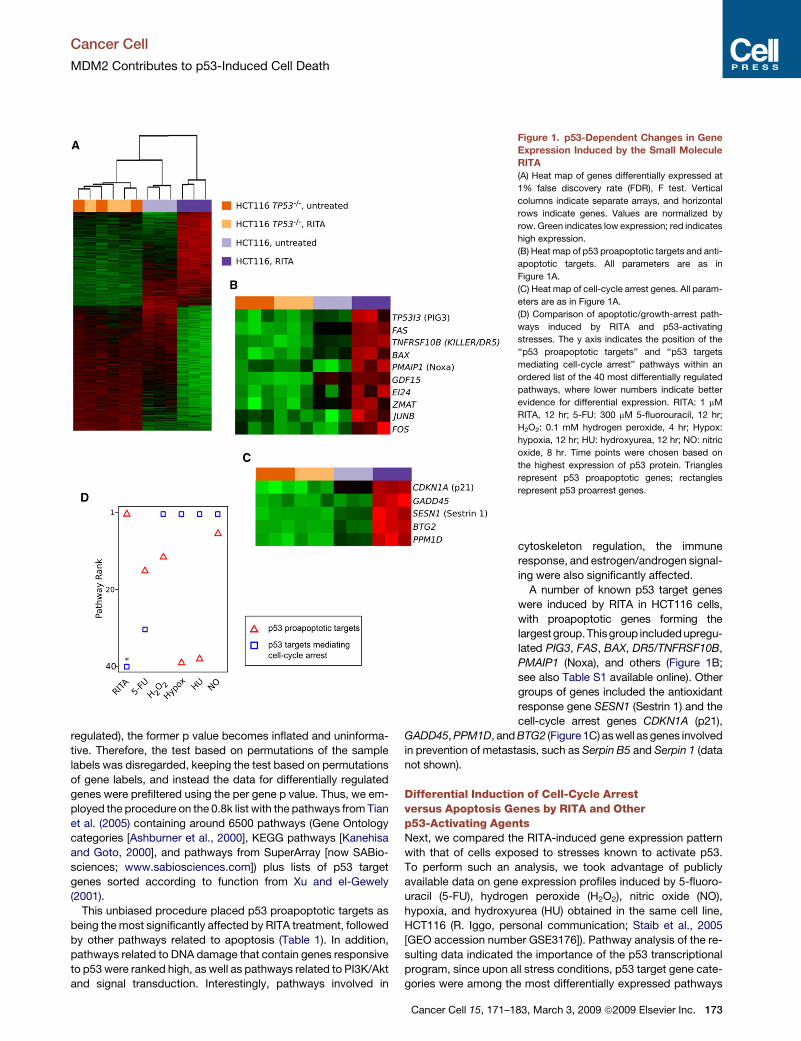
Figure 1. p53-Dependent Changes in Gene
Expression Induced by the Small Molecule
RITA
(A) Heat map of genes differentially expressed at
1% false discovery rate (FDR), F test. Vertical
columns indicate separate arrays, and horizontal
rows indicate genes. Values are normalized by
row. Green indicates low expression; red indicates
high expression.
(B) Heat map of p53 proapoptotic targets and anti-
apoptotic targets. All parameters are as in
Figure 1A.
(C) Heat map of cell-cycle arrest genes. All param-
eters are as in Figure 1A.
(D) Comparison of apoptotic/growth-arrest path-
ways induced by RITA and p53-activating
stresses. The y axis indicates the position of the
‘‘p53 proapoptotic targets’’ and ‘‘p53 targets
mediating cell-cycle arrest’’ pathways within an
ordered list of the 40 most differentially regulated
pathways, where lower numbers indicate better
evidence for differential expression. RITA: 1 mM
RITA, 12 hr; 5-FU: 300 mM 5-fluorouracil, 12 hr;
H2O2: 0.1 mM hydrogen peroxide, 4 hr; Hypox:
hypoxia, 12 hr; HU: hydroxyurea, 12 hr; NO: nitric
oxide, 8 hr. Time points were chosen based on
the highest expression of p53 protein. Triangles
represent p53 proapoptotic genes; rectangles
represent p53 proarrest genes.
cytoskeleton regulation, the immune
response, and estrogen/androgen signal-
ing were also significantly affected.
A number of known p53 target genes
were induced by RITA in HCT116 cells,
with proapoptotic genes forming the
largest group.Thisgroup includedupregu-
lated PIG3, FAS, BAX, DR5/TNFRSF10B,
PMAIP1 (Noxa), and others (Figure 1B;
see also Table S1 available online). Other
groups of genes included the antioxidant
response gene SESN1 (Sestrin 1) and the
cell-cycle arrest genes CDKN1A (p21),
GADD45, PPM1D, and BTG2 (Figure 1C) as well as genes involved
in prevention of metastasis, such as Serpin B5 and Serpin 1 (data
not shown).
Differential Induction of Cell-Cycle Arrestversus Apoptosis Genes by RITA and Otherp53-Activating AgentsNext, we compared the RITA-induced gene expression pattern
with that of cells exposed to stresses known to activate p53.
To perform such an analysis, we took advantage of publicly
available data on gene expression profiles induced by 5-fluoro-
uracil (5-FU), hydrogen peroxide (H2O2), nitric oxide (NO),
hypoxia, and hydroxyurea (HU) obtained in the same cell line,
HCT116 (R. Iggo, personal communication; Staib et al., 2005
[GEO accession number GSE3176]). Pathway analysis of the re-
sulting data indicated the importance of the p53 transcriptional
program, since upon all stress conditions, p53 target gene cate-
gories were among the most differentially expressed pathways
Cancer Cell 15, 171–183, March 3, 2009 ª2009 Elsevier Inc. 173
Cancer Cell
MDM2 Contributes to p53-Induced Cell Death
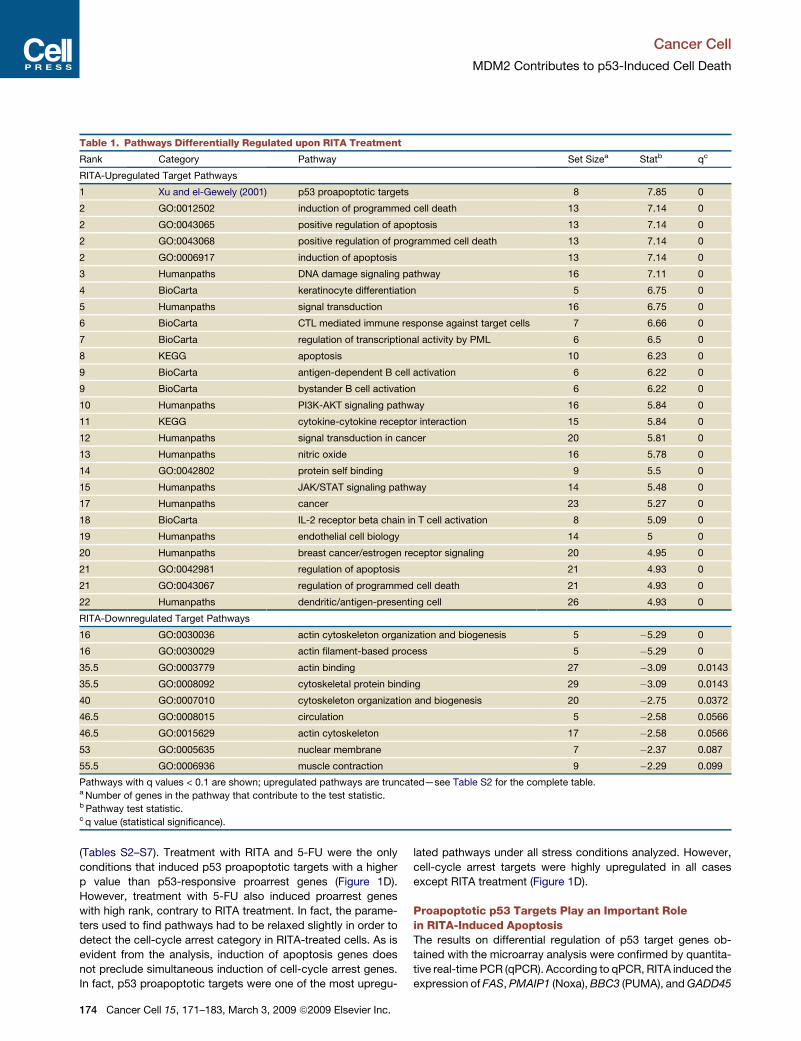
Table 1. Pathways Differentially Regulated upon RITA Treatment
Rank Category Pathway Set Sizea Statb qc
RITA-Upregulated Target Pathways
1 Xu and el-Gewely (2001) p53 proapoptotic targets 8 7.85 0
2 GO:0012502 induction of programmed cell death 13 7.14 0
2 GO:0043065 positive regulation of apoptosis 13 7.14 0
2 GO:0043068 positive regulation of programmed cell death 13 7.14 0
2 GO:0006917 induction of apoptosis 13 7.14 0
3 Humanpaths DNA damage signaling pathway 16 7.11 0
4 BioCarta keratinocyte differentiation 5 6.75 0
5 Humanpaths signal transduction 16 6.75 0
6 BioCarta CTL mediated immune response against target cells 7 6.66 0
7 BioCarta regulation of transcriptional activity by PML 6 6.5 0
8 KEGG apoptosis 10 6.23 0
9 BioCarta antigen-dependent B cell activation 6 6.22 0
9 BioCarta bystander B cell activation 6 6.22 0
10 Humanpaths PI3K-AKT signaling pathway 16 5.84 0
11 KEGG cytokine-cytokine receptor interaction 15 5.84 0
12 Humanpaths signal transduction in cancer 20 5.81 0
13 Humanpaths nitric oxide 16 5.78 0
14 GO:0042802 protein self binding 9 5.5 0
15 Humanpaths JAK/STAT signaling pathway 14 5.48 0
17 Humanpaths cancer 23 5.27 0
18 BioCarta IL-2 receptor beta chain in T cell activation 8 5.09 0
19 Humanpaths endothelial cell biology 14 5 0
20 Humanpaths breast cancer/estrogen receptor signaling 20 4.95 0
21 GO:0042981 regulation of apoptosis 21 4.93 0
21 GO:0043067 regulation of programmed cell death 21 4.93 0
22 Humanpaths dendritic/antigen-presenting cell 26 4.93 0
RITA-Downregulated Target Pathways
16 GO:0030036 actin cytoskeleton organization and biogenesis 5 �5.29 0
16 GO:0030029 actin filament-based process 5 �5.29 0
35.5 GO:0003779 actin binding 27 �3.09 0.0143
35.5 GO:0008092 cytoskeletal protein binding 29 �3.09 0.0143
40 GO:0007010 cytoskeleton organization and biogenesis 20 �2.75 0.0372
46.5 GO:0008015 circulation 5 �2.58 0.0566
46.5 GO:0015629 actin cytoskeleton 17 �2.58 0.0566
53 GO:0005635 nuclear membrane 7 �2.37 0.087
55.5 GO:0006936 muscle contraction 9 �2.29 0.099
Pathways with q values < 0.1 are shown; upregulated pathways are truncated—see Table S2 for the complete table.a Number of genes in the pathway that contribute to the test statistic.b Pathway test statistic.c q value (statistical significance).
(Tables S2–S7). Treatment with RITA and 5-FU were the only
conditions that induced p53 proapoptotic targets with a higher
p value than p53-responsive proarrest genes (Figure 1D).
However, treatment with 5-FU also induced proarrest genes
with high rank, contrary to RITA treatment. In fact, the parame-
ters used to find pathways had to be relaxed slightly in order to
detect the cell-cycle arrest category in RITA-treated cells. As is
evident from the analysis, induction of apoptosis genes does
not preclude simultaneous induction of cell-cycle arrest genes.
In fact, p53 proapoptotic targets were one of the most upregu-
174 Cancer Cell 15, 171–183, March 3, 2009 ª2009 Elsevier Inc.
lated pathways under all stress conditions analyzed. However,
cell-cycle arrest targets were highly upregulated in all cases
except RITA treatment (Figure 1D).
Proapoptotic p53 Targets Play an Important Rolein RITA-Induced ApoptosisThe results on differential regulation of p53 target genes ob-
tained with the microarray analysis were confirmed by quantita-
tive real-time PCR (qPCR). According to qPCR, RITA induced the
expression of FAS, PMAIP1 (Noxa), BBC3 (PUMA), and GADD45
Cancer Cell
MDM2 Contributes to p53-Induced Cell Death
in HCT116 cells, but not in HCT116 TP53�/� cells (Figure 2A and
data not shown). To test the generality of our findings, we next
tested the induction of p53 target genes upon RITA treatment
in another pair of isogenic cell lines differing in p53 status: the
osteosarcoma cell line U2OS, which carries wild-type p53, and
U2OS p53 shRNA cells stably transfected with p53 shRNA, re-
sulting in p53 expression at approximately 20% of the levels in
the parental line (Figure 2B, left panel). qPCR analysis of the
p53 target genes BAX, BBC3 (PUMA), GADD45, and PMAIP1
(Noxa) demonstrated their induction by RITA in a p53-dependent
manner (Figure 2B).
According to our microarray data, both the extrinsic and
intrinsic apoptotic pathways are affected by RITA treatment via
induction of FAS and DR5/TNFRSF10B and upregulation of
BAX, BBC3 (PUMA), and PMAIP1 (Noxa), respectively. In order
to validate the impact of RITA on individual branches of the
p53 apoptotic response, we functionally inactivated compo-
nents from each pathway. To examine the role of the extrinsic
pathway, we employed a Fas-neutralizing antibody. By using
colony formation, a long-term growth suppression assay, we
found that functional inactivation of Fas in HCT116 cells partially
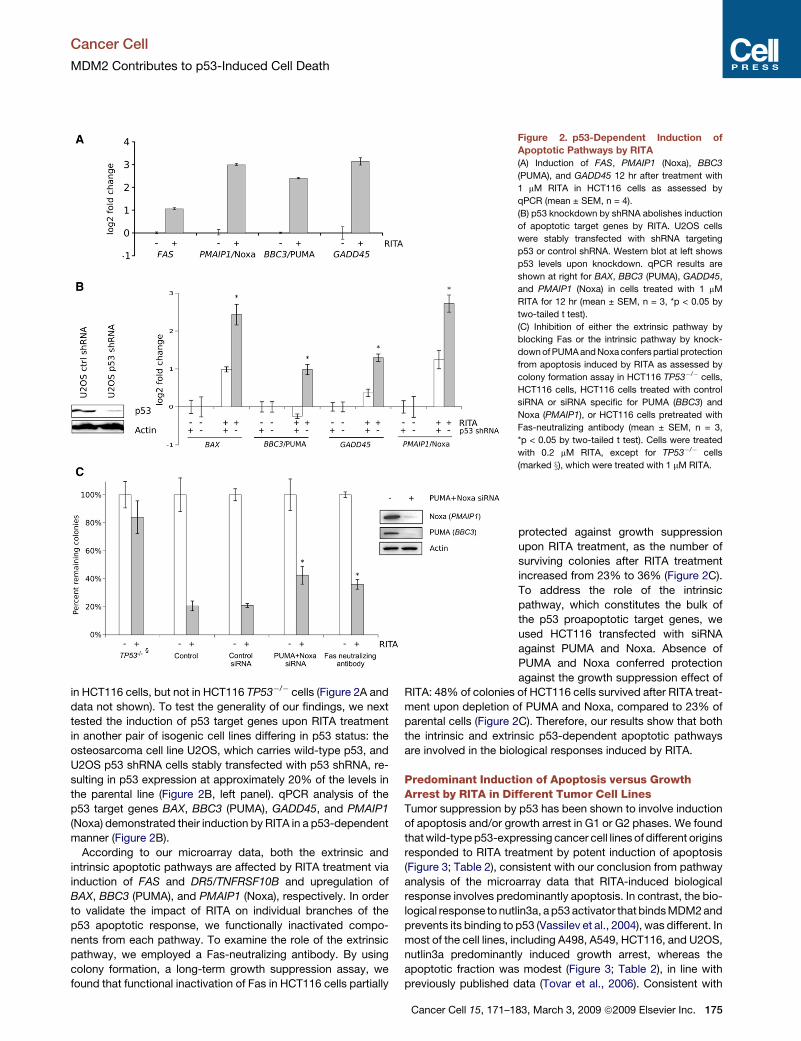
Figure 2. p53-Dependent Induction of
Apoptotic Pathways by RITA
(A) Induction of FAS, PMAIP1 (Noxa), BBC3
(PUMA), and GADD45 12 hr after treatment with
1 mM RITA in HCT116 cells as assessed by
qPCR (mean ± SEM, n = 4).
(B) p53 knockdown by shRNA abolishes induction
of apoptotic target genes by RITA. U2OS cells
were stably transfected with shRNA targeting
p53 or control shRNA. Western blot at left shows
p53 levels upon knockdown. qPCR results are
shown at right for BAX, BBC3 (PUMA), GADD45,
and PMAIP1 (Noxa) in cells treated with 1 mM
RITA for 12 hr (mean ± SEM, n = 3, *p < 0.05 by
two-tailed t test).
(C) Inhibition of either the extrinsic pathway by
blocking Fas or the intrinsic pathway by knock-
down of PUMA and Noxa confers partial protection
from apoptosis induced by RITA as assessed by
colony formation assay in HCT116 TP53�/� cells,
HCT116 cells, HCT116 cells treated with control
siRNA or siRNA specific for PUMA (BBC3) and
Noxa (PMAIP1), or HCT116 cells pretreated with
Fas-neutralizing antibody (mean ± SEM, n = 3,
*p < 0.05 by two-tailed t test). Cells were treated
with 0.2 mM RITA, except for TP53�/� cells
(marked x), which were treated with 1 mM RITA.
protected against growth suppression
upon RITA treatment, as the number of
surviving colonies after RITA treatment
increased from 23% to 36% (Figure 2C).
To address the role of the intrinsic
pathway, which constitutes the bulk of
the p53 proapoptotic target genes, we
used HCT116 transfected with siRNA
against PUMA and Noxa. Absence of
PUMA and Noxa conferred protection
against the growth suppression effect of
RITA: 48% of colonies of HCT116 cells survived after RITA treat-
ment upon depletion of PUMA and Noxa, compared to 23% of
parental cells (Figure 2C). Therefore, our results show that both
the intrinsic and extrinsic p53-dependent apoptotic pathways
are involved in the biological responses induced by RITA.
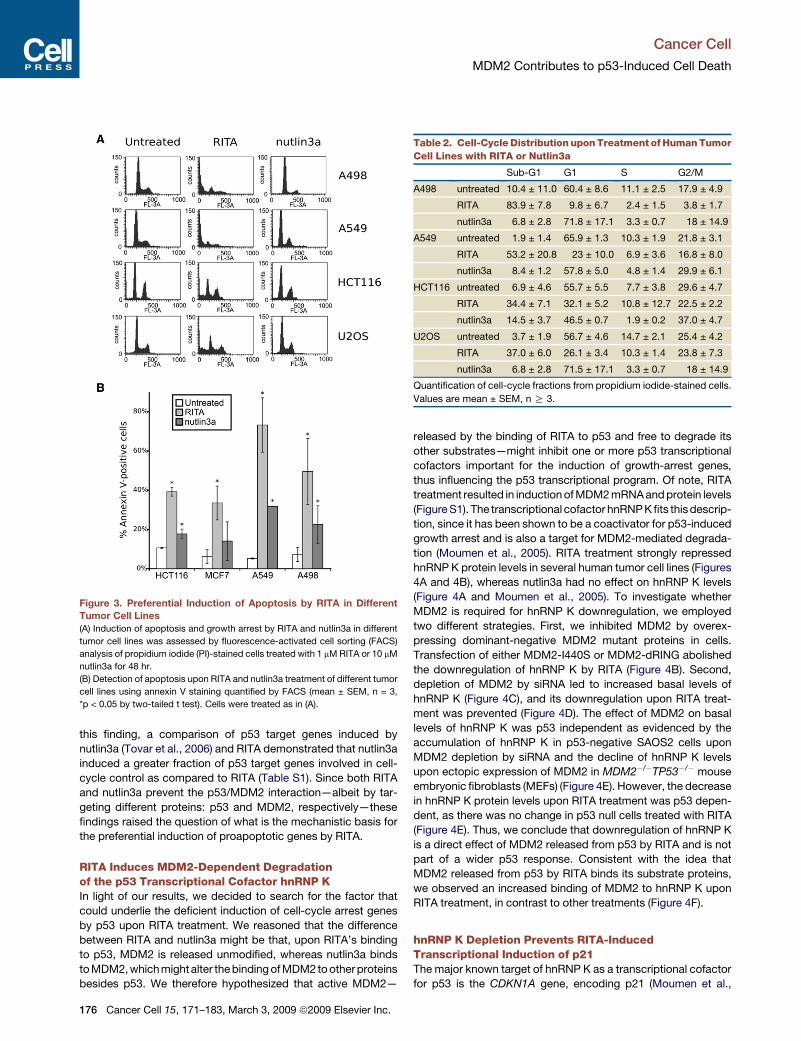
Predominant Induction of Apoptosis versus GrowthArrest by RITA in Different Tumor Cell LinesTumor suppression by p53 has been shown to involve induction
of apoptosis and/or growth arrest in G1 or G2 phases. We found
that wild-type p53-expressing cancer cell lines of different origins
responded to RITA treatment by potent induction of apoptosis
(Figure 3; Table 2), consistent with our conclusion from pathway
analysis of the microarray data that RITA-induced biological
response involves predominantly apoptosis. In contrast, the bio-
logical response to nutlin3a, a p53 activator that binds MDM2 and
prevents its binding to p53 (Vassilev et al., 2004), was different. In
most of the cell lines, including A498, A549, HCT116, and U2OS,
nutlin3a predominantly induced growth arrest, whereas the
apoptotic fraction was modest (Figure 3; Table 2), in line with
previously published data (Tovar et al., 2006). Consistent with
Cancer Cell 15, 171–183, March 3, 2009 ª2009 Elsevier Inc. 175
Cancer Cell
MDM2 Contributes to p53-Induced Cell Death
this finding, a comparison of p53 target genes induced by
nutlin3a (Tovar et al., 2006) and RITA demonstrated that nutlin3a
induced a greater fraction of p53 target genes involved in cell-
cycle control as compared to RITA (Table S1). Since both RITA
and nutlin3a prevent the p53/MDM2 interaction—albeit by tar-
geting different proteins: p53 and MDM2, respectively—these
findings raised the question of what is the mechanistic basis for
the preferential induction of proapoptotic genes by RITA.
RITA Induces MDM2-Dependent Degradationof the p53 Transcriptional Cofactor hnRNP KIn light of our results, we decided to search for the factor that
could underlie the deficient induction of cell-cycle arrest genes
by p53 upon RITA treatment. We reasoned that the difference
between RITA and nutlin3a might be that, upon RITA’s binding
to p53, MDM2 is released unmodified, whereas nutlin3a binds
to MDM2, which might alter the binding of MDM2 to otherproteins
besides p53. We therefore hypothesized that active MDM2—
Figure 3. Preferential Induction of Apoptosis by RITA in DifferentTumor Cell Lines
(A) Induction of apoptosis and growth arrest by RITA and nutlin3a in different
tumor cell lines was assessed by fluorescence-activated cell sorting (FACS)
analysis of propidium iodide (PI)-stained cells treated with 1 mM RITA or 10 mM
nutlin3a for 48 hr.
(B) Detection of apoptosis upon RITA and nutlin3a treatment of different tumor
cell lines using annexin V staining quantified by FACS (mean ± SEM, n = 3,
*p < 0.05 by two-tailed t test). Cells were treated as in (A).
176 Cancer Cell 15, 171–183, March 3, 2009 ª2009 Elsevier Inc.
released by the binding of RITA to p53 and free to degrade its
other substrates—might inhibit one or more p53 transcriptional
cofactors important for the induction of growth-arrest genes,
thus influencing the p53 transcriptional program. Of note, RITA
treatment resulted in induction of MDM2 mRNA and protein levels
(Figure S1). The transcriptional cofactor hnRNP K fits this descrip-
tion, since it has been shown to be a coactivator for p53-induced
growth arrest and is also a target for MDM2-mediated degrada-
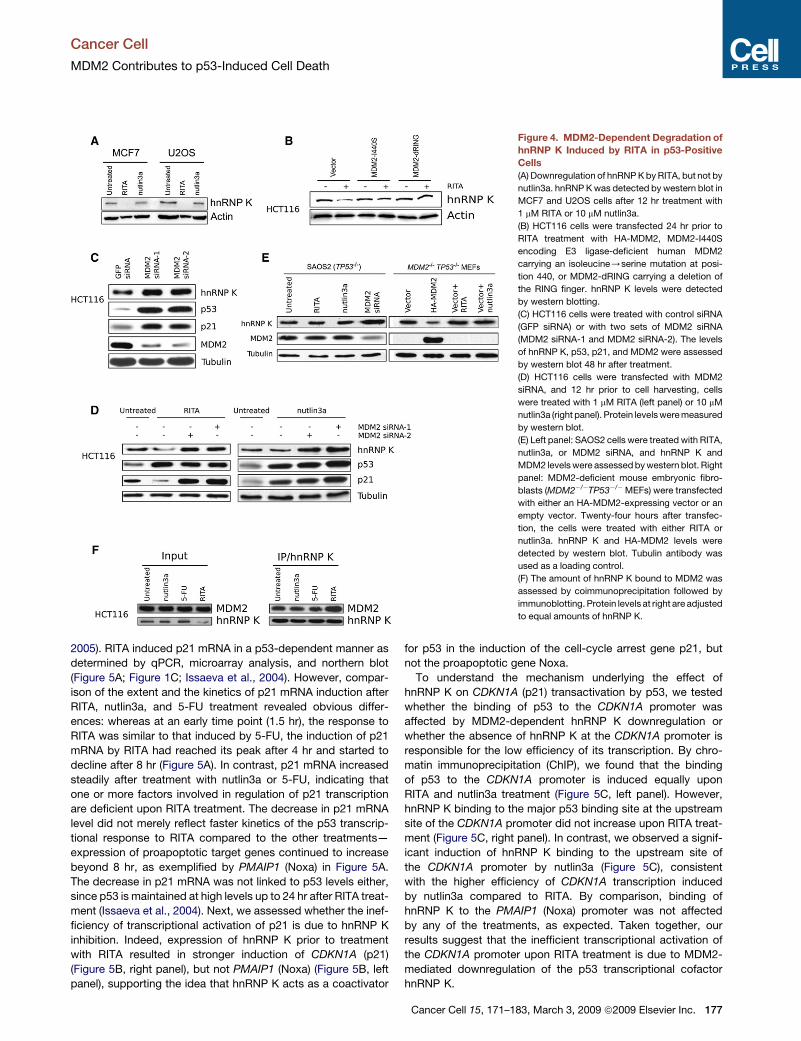
tion (Moumen et al., 2005). RITA treatment strongly repressed
hnRNP K protein levels in several human tumor cell lines (Figures
4A and 4B), whereas nutlin3a had no effect on hnRNP K levels
(Figure 4A and Moumen et al., 2005). To investigate whether
MDM2 is required for hnRNP K downregulation, we employed
two different strategies. First, we inhibited MDM2 by overex-
pressing dominant-negative MDM2 mutant proteins in cells.
Transfection of either MDM2-I440S or MDM2-dRING abolished
the downregulation of hnRNP K by RITA (Figure 4B). Second,
depletion of MDM2 by siRNA led to increased basal levels of
hnRNP K (Figure 4C), and its downregulation upon RITA treat-
ment was prevented (Figure 4D). The effect of MDM2 on basal
levels of hnRNP K was p53 independent as evidenced by the
accumulation of hnRNP K in p53-negative SAOS2 cells upon
MDM2 depletion by siRNA and the decline of hnRNP K levels
upon ectopic expression of MDM2 in MDM2�/�TP53�/� mouse
embryonic fibroblasts (MEFs) (Figure 4E). However, the decrease
in hnRNP K protein levels upon RITA treatment was p53 depen-
dent, as there was no change in p53 null cells treated with RITA
(Figure 4E). Thus, we conclude that downregulation of hnRNP K
is a direct effect of MDM2 released from p53 by RITA and is not
part of a wider p53 response. Consistent with the idea that
MDM2 released from p53 by RITA binds its substrate proteins,
we observed an increased binding of MDM2 to hnRNP K upon
RITA treatment, in contrast to other treatments (Figure 4F).
hnRNP K Depletion Prevents RITA-InducedTranscriptional Induction of p21The major known target of hnRNP K as a transcriptional cofactor
for p53 is the CDKN1A gene, encoding p21 (Moumen et al.,
Table 2. Cell-Cycle Distribution upon Treatment of Human Tumor
Cell Lines with RITA or Nutlin3a
Sub-G1 G1 S G2/M
A498 untreated 10.4 ± 11.0 60.4 ± 8.6 11.1 ± 2.5 17.9 ± 4.9
RITA 83.9 ± 7.8 9.8 ± 6.7 2.4 ± 1.5 3.8 ± 1.7
nutlin3a 6.8 ± 2.8 71.8 ± 17.1 3.3 ± 0.7 18 ± 14.9
A549 untreated 1.9 ± 1.4 65.9 ± 1.3 10.3 ± 1.9 21.8 ± 3.1
RITA 53.2 ± 20.8 23 ± 10.0 6.9 ± 3.6 16.8 ± 8.0
nutlin3a 8.4 ± 1.2 57.8 ± 5.0 4.8 ± 1.4 29.9 ± 6.1
HCT116 untreated 6.9 ± 4.6 55.7 ± 5.5 7.7 ± 3.8 29.6 ± 4.7
RITA 34.4 ± 7.1 32.1 ± 5.2 10.8 ± 12.7 22.5 ± 2.2
nutlin3a 14.5 ± 3.7 46.5 ± 0.7 1.9 ± 0.2 37.0 ± 4.7
U2OS untreated 3.7 ± 1.9 56.7 ± 4.6 14.7 ± 2.1 25.4 ± 4.2
RITA 37.0 ± 6.0 26.1 ± 3.4 10.3 ± 1.4 23.8 ± 7.3
nutlin3a 6.8 ± 2.8 71.5 ± 17.1 3.3 ± 0.7 18 ± 14.9
Quantification of cell-cycle fractions from propidium iodide-stained cells.
Values are mean ± SEM, n R 3.
Cancer Cell
MDM2 Contributes to p53-Induced Cell Death
2005). RITA induced p21 mRNA in a p53-dependent manner as
determined by qPCR, microarray analysis, and northern blot
(Figure 5A; Figure 1C; Issaeva et al., 2004). However, compar-
ison of the extent and the kinetics of p21 mRNA induction after
RITA, nutlin3a, and 5-FU treatment revealed obvious differ-
ences: whereas at an early time point (1.5 hr), the response to
RITA was similar to that induced by 5-FU, the induction of p21
mRNA by RITA had reached its peak after 4 hr and started to
decline after 8 hr (Figure 5A). In contrast, p21 mRNA increased
steadily after treatment with nutlin3a or 5-FU, indicating that
one or more factors involved in regulation of p21 transcription
are deficient upon RITA treatment. The decrease in p21 mRNA
level did not merely reflect faster kinetics of the p53 transcrip-
tional response to RITA compared to the other treatments—
expression of proapoptotic target genes continued to increase
beyond 8 hr, as exemplified by PMAIP1 (Noxa) in Figure 5A.
The decrease in p21 mRNA was not linked to p53 levels either,
since p53 is maintained at high levels up to 24 hr after RITA treat-
ment (Issaeva et al., 2004). Next, we assessed whether the inef-
ficiency of transcriptional activation of p21 is due to hnRNP K
inhibition. Indeed, expression of hnRNP K prior to treatment
with RITA resulted in stronger induction of CDKN1A (p21)
(Figure 5B, right panel), but not PMAIP1 (Noxa) (Figure 5B, left
panel), supporting the idea that hnRNP K acts as a coactivator
for p53 in the induction of the cell-cycle arrest gene p21, but
not the proapoptotic gene Noxa.
To understand the mechanism underlying the effect of
hnRNP K on CDKN1A (p21) transactivation by p53, we tested
whether the binding of p53 to the CDKN1A promoter was
affected by MDM2-dependent hnRNP K downregulation or
whether the absence of hnRNP K at the CDKN1A promoter is
responsible for the low efficiency of its transcription. By chro-
matin immunoprecipitation (ChIP), we found that the binding
of p53 to the CDKN1A promoter is induced equally upon
RITA and nutlin3a treatment (Figure 5C, left panel). However,
hnRNP K binding to the major p53 binding site at the upstream
site of the CDKN1A promoter did not increase upon RITA treat-
ment (Figure 5C, right panel). In contrast, we observed a signif-
icant induction of hnRNP K binding to the upstream site of
the CDKN1A promoter by nutlin3a (Figure 5C), consistent
with the higher efficiency of CDKN1A transcription induced
by nutlin3a compared to RITA. By comparison, binding of
hnRNP K to the PMAIP1 (Noxa) promoter was not affected
by any of the treatments, as expected. Taken together, our
results suggest that the inefficient transcriptional activation of
the CDKN1A promoter upon RITA treatment is due to MDM2-
mediated downregulation of the p53 transcriptional cofactor
hnRNP K.
Figure 4. MDM2-Dependent Degradation of
hnRNP K Induced by RITA in p53-Positive
Cells
(A) Downregulation of hnRNP K by RITA, but not by
nutlin3a. hnRNP K was detected by western blot in
MCF7 and U2OS cells after 12 hr treatment with
1 mM RITA or 10 mM nutlin3a.
(B) HCT116 cells were transfected 24 hr prior to
RITA treatment with HA-MDM2, MDM2-I440S
encoding E3 ligase-deficient human MDM2
carrying an isoleucine/serine mutation at posi-
tion 440, or MDM2-dRING carrying a deletion of
the RING finger. hnRNP K levels were detected
by western blotting.
(C) HCT116 cells were treated with control siRNA
(GFP siRNA) or with two sets of MDM2 siRNA
(MDM2 siRNA-1 and MDM2 siRNA-2). The levels
of hnRNP K, p53, p21, and MDM2 were assessed
by western blot 48 hr after treatment.
(D) HCT116 cells were transfected with MDM2
siRNA, and 12 hr prior to cell harvesting, cells
were treated with 1 mM RITA (left panel) or 10 mM
nutlin3a (right panel). Protein levels were measured
by western blot.
(E) Left panel: SAOS2 cells were treated with RITA,
nutlin3a, or MDM2 siRNA, and hnRNP K and
MDM2 levels were assessed by western blot. Right
panel: MDM2-deficient mouse embryonic fibro-
blasts (MDM2�/�TP53�/�MEFs) were transfected
with either an HA-MDM2-expressing vector or an
empty vector. Twenty-four hours after transfec-
tion, the cells were treated with either RITA or
nutlin3a. hnRNP K and HA-MDM2 levels were
detected by western blot. Tubulin antibody was
used as a loading control.
(F) The amount of hnRNP K bound to MDM2 was
assessed by coimmunoprecipitation followed by
immunoblotting. Protein levels at right are adjusted
to equal amounts of hnRNP K.
Cancer Cell 15, 171–183, March 3, 2009 ª2009 Elsevier Inc. 177
Cancer Cell
MDM2 Contributes to p53-Induced Cell Death
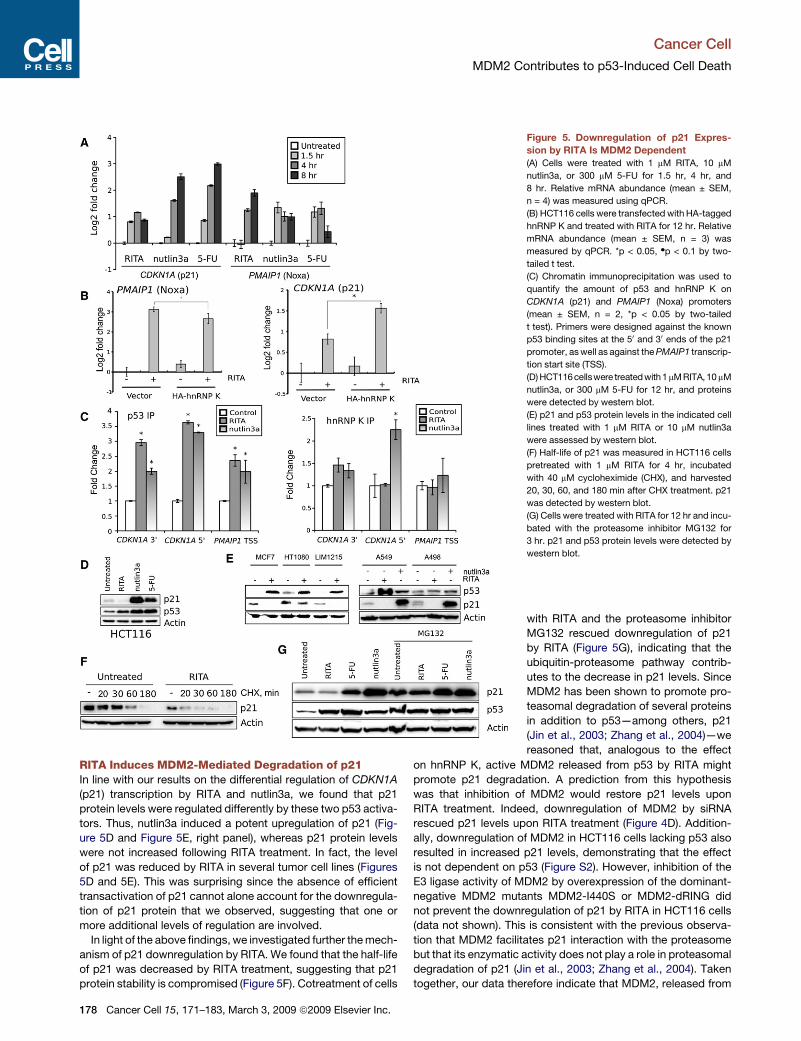
RITA Induces MDM2-Mediated Degradation of p21In line with our results on the differential regulation of CDKN1A
(p21) transcription by RITA and nutlin3a, we found that p21
protein levels were regulated differently by these two p53 activa-
tors. Thus, nutlin3a induced a potent upregulation of p21 (Fig-
ure 5D and Figure 5E, right panel), whereas p21 protein levels
were not increased following RITA treatment. In fact, the level
of p21 was reduced by RITA in several tumor cell lines (Figures
5D and 5E). This was surprising since the absence of efficient
transactivation of p21 cannot alone account for the downregula-
tion of p21 protein that we observed, suggesting that one or
more additional levels of regulation are involved.
In light of the above findings, we investigated further the mech-
anism of p21 downregulation by RITA. We found that the half-life
of p21 was decreased by RITA treatment, suggesting that p21
protein stability is compromised (Figure 5F). Cotreatment of cells
Figure 5. Downregulation of p21 Expres-
sion by RITA Is MDM2 Dependent
(A) Cells were treated with 1 mM RITA, 10 mM
nutlin3a, or 300 mM 5-FU for 1.5 hr, 4 hr, and
8 hr. Relative mRNA abundance (mean ± SEM,
n = 4) was measured using qPCR.
(B) HCT116 cells were transfected with HA-tagged
hnRNP K and treated with RITA for 12 hr. Relative
mRNA abundance (mean ± SEM, n = 3) was
measured by qPCR. *p < 0.05, dp < 0.1 by two-
tailed t test.
(C) Chromatin immunoprecipitation was used to
quantify the amount of p53 and hnRNP K on
CDKN1A (p21) and PMAIP1 (Noxa) promoters
(mean ± SEM, n = 2, *p < 0.05 by two-tailed
t test). Primers were designed against the known
p53 binding sites at the 50 and 30 ends of the p21
promoter, as well as against the PMAIP1 transcrip-
tion start site (TSS).
(D) HCT116cellswere treatedwith1 mMRITA,10 mM
nutlin3a, or 300 mM 5-FU for 12 hr, and proteins
were detected by western blot.
(E) p21 and p53 protein levels in the indicated cell
lines treated with 1 mM RITA or 10 mM nutlin3a
were assessed by western blot.
(F) Half-life of p21 was measured in HCT116 cells
pretreated with 1 mM RITA for 4 hr, incubated
with 40 mM cycloheximide (CHX), and harvested
20, 30, 60, and 180 min after CHX treatment. p21
was detected by western blot.
(G) Cells were treated with RITA for 12 hr and incu-
bated with the proteasome inhibitor MG132 for
3 hr. p21 and p53 protein levels were detected by
western blot.
with RITA and the proteasome inhibitor
MG132 rescued downregulation of p21
by RITA (Figure 5G), indicating that the
ubiquitin-proteasome pathway contrib-
utes to the decrease in p21 levels. Since
MDM2 has been shown to promote pro-
teasomal degradation of several proteins
in addition to p53—among others, p21
(Jin et al., 2003; Zhang et al., 2004)—we
reasoned that, analogous to the effect
on hnRNP K, active MDM2 released from p53 by RITA might
promote p21 degradation. A prediction from this hypothesis
was that inhibition of MDM2 would restore p21 levels upon
RITA treatment. Indeed, downregulation of MDM2 by siRNA
rescued p21 levels upon RITA treatment (Figure 4D). Addition-
ally, downregulation of MDM2 in HCT116 cells lacking p53 also
resulted in increased p21 levels, demonstrating that the effect
is not dependent on p53 (Figure S2). However, inhibition of the
E3 ligase activity of MDM2 by overexpression of the dominant-
negative MDM2 mutants MDM2-I440S or MDM2-dRING did
not prevent the downregulation of p21 by RITA in HCT116 cells
(data not shown). This is consistent with the previous observa-
tion that MDM2 facilitates p21 interaction with the proteasome
but that its enzymatic activity does not play a role in proteasomal
degradation of p21 (Jin et al., 2003; Zhang et al., 2004). Taken
together, our data therefore indicate that MDM2, released from
178 Cancer Cell 15, 171–183, March 3, 2009 ª2009 Elsevier Inc.
Cancer Cell
MDM2 Contributes to p53-Induced Cell Death
the complex with p53 by RITA, contributes to both the proteaso-
mal degradation of the antiapoptotic factor p21 and the ineffi-
cient transactivation of the p21 gene by mediating degradation
of the transcriptional cofactor hnRNP K.
Impact of p21 on the Biological Response Inducedby RITASince p21 has been shown to be the major factor mediating p53-
dependent growth arrest and in addition is able to protect cells
from p53-induced apoptosis (reviewed in Gartel and Tyner,
2002), it could play a role in the differential outcome of p53 acti-
vation by RITA. To determine the impact of p21 on the biological
response, we compared apoptosis induction by RITA between
cells expressing endogenous p21 transfected with either control
siRNA or siRNA specific to CDKN1A (p21). Fluorescence-acti-
vated cell sorting (FACS) analysis of propidium iodide-stained
cells showed an increase in the sub-G1 cell fraction in the
p21-depleted cells upon RITA treatment, compared to control
RITA-treated cells (Figure 6A).
To assess the impact of p21 on general growth suppression, we
compared the effect of RITA andnutlin3aupondepletionof p21by
siRNA using a colony formation assay. We observed a prominent
difference in response to RITA and nutlin3a in cells lacking p21:
the effect of RITA was not decreased in the absence of p21,
whereas nutlin3a was significantly less efficient in p21-depleted
cells (Figure 6B). This is in accordance with previously published
data showing that nutlin3a is a potent inducer of p21 and that
growth suppression by nutlin3a is due mainly to the induction of
growth arrest and/or senescence (Brummelkamp et al., 2006;
Kitagawa et al., 2008; Tovar et al., 2006; Wade et al., 2006). Taken
together, these results suggest that, in contrast to nutlin3a, the
growth suppression activity of RITA does not depend on p21
induction.
MDM2 Contributes to the RITA-InducedApoptotic ResponseFinally, to address the question of whether MDM2 contributes to
the efficient apoptosis induction by RITA via downregulation of
p21, we tested the effect of RITA in the absence of MDM2,
p21, or both. We expected that MDM2 depletion would dere-
press p53 and induce both p21 and proapoptotic genes. If p21
downregulation is important for RITA-induced apoptosis, we
predict that MDM2 depletion should not synergize with RITA
(since without MDM2, p21 is not downregulated). However, in
cells unable to induce p21, MDM2 knockdown should enhance
the effects of RITA. We tested this idea by depleting MDM2 in
HCT116 cells by siRNA, achieving �50% reduction of MDM2
protein level, which was enough to stabilize p53 (Figure 6A, right
panel) and induce some apoptotic response in HCT116 cells
(Figure 6A, left panel). As predicted from our model, RITA treat-
ment did not cooperate with MDM2 knockdown: we did not
observe a further increase in the apoptotic fraction by RITA treat-
ment (Figure 6A). In fact, the apoptotic fractions achieved by
RITA alone or RITA in combination with MDM2 siRNA were
equivalent. These data support the idea that induction of p21
upon MDM2 depletion counteracts the effect of RITA. To
address this further, we examined whether ectopic overexpres-
sion of p21 could prevent RITA-induced apoptosis. As shown
in Figure 6C, overexpression of p21 reduced the fraction of
apoptotic cells after RITA treatment. Consequently, acute deple-
tion of p21 by siRNA as well as stable knockout of the gene
enhanced the induction of apoptosis by RITA (Figure 6A). Taken
together, these data show that manipulating p21 levels can
enhance or diminish apoptosis by RITA (Figures 6A and 6C).
Furthermore, RITA treatmentshould cooperatewith MDM2deple-
tion in the absence of p21. Indeed, in the p21 null cell line HCT116
CDKN1A�/�, RITA was able to significantly enhance the effect of
MDM2 knockdown, increasing apoptosis to 80% (Figure 6A).
Next, we addressed the question of whether the biological
response induced by nutlin3a could also be affected by manip-
ulating p21 levels, i.e., whether growth arrest induced by nutlin3a
could be converted into apoptosis by depletion of p21. As shown
in Figure 6D, acute depletion of p21 by siRNA significantly
enhanced apoptosis induced by nutlin3a while increasing the
fraction of cells in S phase and reducing the fraction in G1/G2.
Thus, our results demonstrate that MDM2, via downregulation
of the transcriptional coactivator hnRNP K and the antiapoptotic
factor p21, has a crucial role in the induction of apoptosis by
RITA-reactivated p53.
DISCUSSION
To investigate the molecular mechanism of action of the p53-
reactivating compound RITA from an unbiased perspective, we
performed transcriptome-wide oligonucleotide microarray
experiments with the wild-type p53-carrying cell line HCT116
and its isogenic p53 null derivative HCT116 TP53�/�. The anal-
ysis revealed that the activity of RITA was specific to the wild-
type p53-expressing cell line, with negligible effect on the p53
null cell line. Interestingly, upon RITA treatment, a large number
of genes (10%) were differentially expressed in wild-type p53-
expressing cells. Although the number of experimentally vali-
dated p53 target genes only reaches 160 (Riley et al., 2008),
direct analyses using modern ChIP-based techniques have esti-
mated 500–1600 genes to be p53 targets (Wei et al., 2006). In our
experiments, the number of genes observed to be differentially
expressed after RITA treatment exceeded this estimation. It is
therefore possible that some of the genes are differentially regu-
lated due to secondary effects; that is, their alterations may be
due to the induction/repression of corresponding transcription
factors by p53. The identity of these potential p53-induced tran-
scriptional factors is currently under investigation.
To gain further insight into the nature of the responses to RITA,
we analyzed differential expression at the level of pathways,
applying a modified procedure based on Tian et al. (2005). Our
analysis placed p53 proapoptotic targets as the most highly up-
regulated pathway, followed by pathways related to apoptosis
and DNA damage signaling. Examination of the functional signif-
icance of individual target genes representing the extrinsic and
intrinsic apoptotic pathways—identified by inhibiting Fas or
PUMA and Noxa, respectively—led us to conclude that both
are involved in apoptosis induced by RITA. Interestingly, path-
ways related to the immunological response, the PI3K/Akt
pathway, and the cytoskeleton were also differentially regulated,
and the possible functions for these responses are currently
being examined.
Notably, other p53-activating stimuli did not produce the same
pattern of gene expression as treatment with RITA did. Instead,
Cancer Cell 15, 171–183, March 3, 2009 ª2009 Elsevier Inc. 179
Cancer Cell
MDM2 Contributes to p53-Induced Cell Death
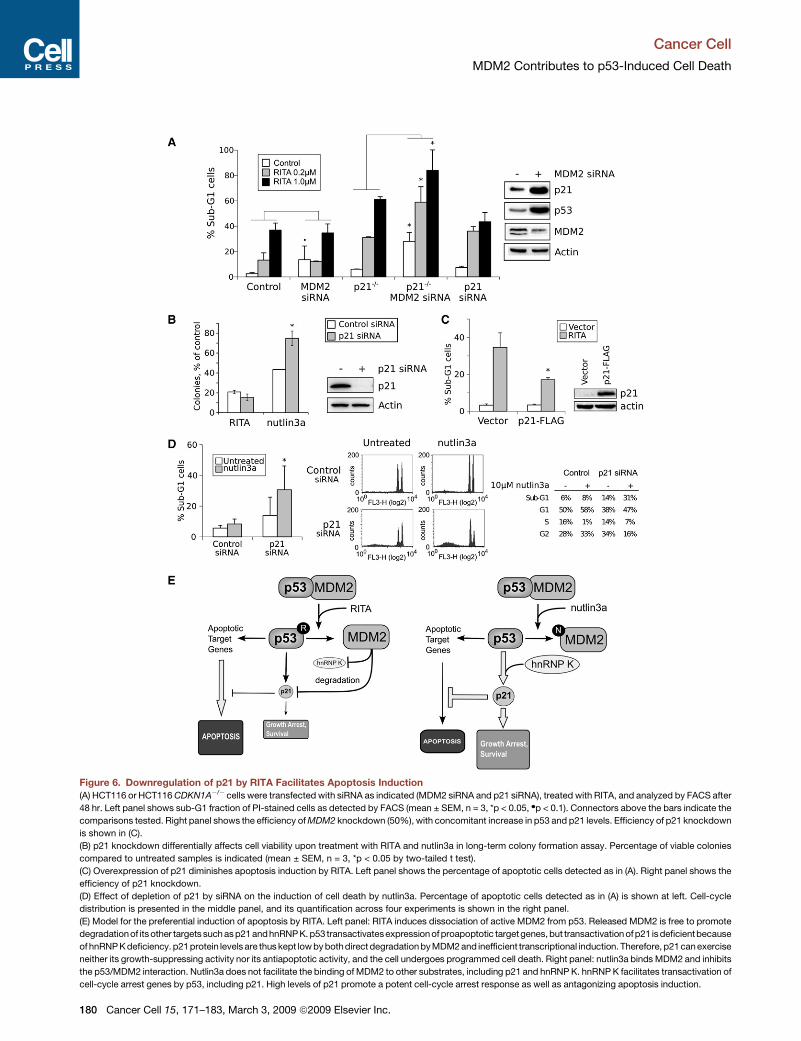
Figure 6. Downregulation of p21 by RITA Facilitates Apoptosis Induction
(A) HCT116 or HCT116 CDKN1A�/� cells were transfected with siRNA as indicated (MDM2 siRNA and p21 siRNA), treated with RITA, and analyzed by FACS after
48 hr. Left panel shows sub-G1 fraction of PI-stained cells as detected by FACS (mean ± SEM, n = 3, *p < 0.05, dp < 0.1). Connectors above the bars indicate the
comparisons tested. Right panel shows the efficiency of MDM2 knockdown (50%), with concomitant increase in p53 and p21 levels. Efficiency of p21 knockdown
is shown in (C).
(B) p21 knockdown differentially affects cell viability upon treatment with RITA and nutlin3a in long-term colony formation assay. Percentage of viable colonies
compared to untreated samples is indicated (mean ± SEM, n = 3, *p < 0.05 by two-tailed t test).
(C) Overexpression of p21 diminishes apoptosis induction by RITA. Left panel shows the percentage of apoptotic cells detected as in (A). Right panel shows the
efficiency of p21 knockdown.
(D) Effect of depletion of p21 by siRNA on the induction of cell death by nutlin3a. Percentage of apoptotic cells detected as in (A) is shown at left. Cell-cycle
distribution is presented in the middle panel, and its quantification across four experiments is shown in the right panel.
(E) Model for the preferential induction of apoptosis by RITA. Left panel: RITA induces dissociation of active MDM2 from p53. Released MDM2 is free to promote
degradationof its other targets such as p21andhnRNP K. p53 transactivatesexpression of proapoptotic targetgenes, but transactivation of p21 is deficientbecause
of hnRNP K deficiency. p21protein levels are thus kept low by bothdirect degradation by MDM2 and inefficient transcriptional induction. Therefore, p21can exercise
neither its growth-suppressing activity nor its antiapoptotic activity, and the cell undergoes programmed cell death. Right panel: nutlin3a binds MDM2 and inhibits
the p53/MDM2 interaction. Nutlin3a does not facilitate the binding of MDM2 to other substrates, including p21 and hnRNP K. hnRNP K facilitates transactivation of
cell-cycle arrest genes by p53, including p21. High levels of p21 promote a potent cell-cycle arrest response as well as antagonizing apoptosis induction.
180 Cancer Cell 15, 171–183, March 3, 2009 ª2009 Elsevier Inc.
Cancer Cell
MDM2 Contributes to p53-Induced Cell Death
induction of cell-cycle arrest genes was more pronounced for
most of the treatments, except 5-FU (Figure 1D; Table 1; Tables
S2–S7). Thus, the question arises: What is the mechanism of
preferential induction of proapoptotic genes by RITA-reactivated
p53? Elucidation of mechanisms of p53-induced apoptosis as
opposed to growth arrest will be crucial for the development of
therapies aimed at reactivating p53, since induction of cell-cycle
arrest by p53 might protect cancer cells from chemotherapeutic
agents by allowing DNA repair. In contrast, triggering apoptosis
or senescence will ultimately eliminate cancer cells.
A recent study comparing p53-induced gene expression
profiles with p53 binding to promoters in vivo using microarray
and ChIP-on-chip analyses came to the conclusion that the
binding of p53 to response elements in its target genes per se is
not sufficient to affect their transcription (Shaked et al., 2008).
Instead, it appears that p53 cofactors at the promoters are
required for triggering transcriptional activation by p53. Our data
areconsistent with thesefindings, showing that although the pres-
ence of p53 at the CDKN1A (p21) promoter is induced to a similar
extent upon p53 activation by RITA and nutlin3a, the deficiency in
the p53 transcriptional cofactor hnRNP K after RITA treatment
makes transcriptional induction of p21 inefficient. Based on these
issues, we hypothesize that the difference in p53 transcriptional
programs induced by RITA and other stimuli observed by our
pathway analysis is because targeting p53 by RITA does not favor
its interaction with the set of cofactors required for the transactiva-
tion of cell-cycle arrest genes. We identified hnRNP K as one such
cofactor, but there may well be others. In addition, it remains to be
determined whether hnRNP K can cooperate withp53 in induction
of other growth-arrest genes.
In addition to yielding the above insights, our pathway analysis
revealed that the differential induction of growth-arrest versus
apoptotic targets cannot entirely account for the differences
we observed in p53-induced biological responses since the tran-
scription of genes involved in apoptotic and cell-cycle arrest
responses clearly can be initiated simultaneously by different
p53-inducing stimuli (Figure 1D; Tables S2–S7). Thus, the ques-
tion remains of whether there is another level of regulation down-
stream of p53 that dictates the differential activation of the path-
ways. To address this issue, we focused our attention on p21,
which has been shown to be a negative regulator of apoptosis.
Inhibition of apoptosis by p21 seems to be distinct from its
growth-arrest function (Baptiste-Okoh et al., 2008; Steinman
and Johnson, 2000; Suzuki et al., 1998). We demonstrated
that, in addition to inefficient induction of p21 due to hnRNP K
deficiency, RITA induces potent downregulation of p21 at the
protein level. Furthermore, we found that p21 is differentially
regulated upon RITA and nutlin3a treatment and appears to
play a critical role in regulating the choice between cell-cycle
arrest and death upon p53 reactivation. Specifically, we found
that p21 is downregulated by RITA on two different levels:
transcription and protein stability. Perhaps unexpectedly, we
observed a crucial role of MDM2 in both these processes.
Thus, our data suggest that MDM2 induces proteasomal degra-
dation of hnRNP K and p21, affecting p21 transcription and
protein turnover. Consistent with this, inhibition of MDM2 by
siRNA rescues both hnRNP K and p21 levels (Figure 4D),
whereas dominant-negative MDM2, which inhibits enzymatic
activity of MDM2, rescues only hnRNP K levels. This is in line
with the different mechanisms by which MDM2 affects hnRNP
K and p21: MDM2 E3 ligase activity being involved in hnRNP
K degradation, but not in p21 degradation, which is triggered
by MDM2-dependent interaction of p21 with the proteasome
(Jin et al., 2003; Zhang et al., 2004).
Based on our results, we suggest a model (Figure 6E) in which
functional MDM2, released from p53 upon treatment with RITA,
contributes to the apoptotic response by promoting proteaso-
mal degradation of the p53 transcriptional cofactor hnRNP K,
which impairs p53-mediated induction of transcription of proarr-
est genes, such as CDKN1A (p21). In addition, the proteasomal
degradation of p21 protein is enhanced by MDM2, eliminating
p21 antiapoptotic function. In turn, transcriptional upregulation
of MDM2 induced by p53 upon RITA treatment amplifies the
negative effect of MDM2 on hnRNP K and p21. It is tempting
to speculate that such dual regulation brings robustness to the
system, leading to more efficient downregulation of p21 and
thus creating a sharper switch toward induction of apoptosis.
In contrast, nutlin3a-induced p53 activation is followed by potent
induction of p21. It is plausible that the binding of nutlin3a to
MDM2, in addition to blocking the MDM2/p53 complex, might
prevent the interaction of MDM2 with some of its other
substrates, possibly including hnRNP K and p21. As a result,
upon nutlin3a treatment, p53 interacts with the proarrest
cofactor hnRNP K favoring transcriptional activation of p21
and induction of growth arrest (Figure 6E, right panel). Additional
studies will be necessary to fully investigate these ideas.
In conclusion, our global analysis of gene expression patterns
upon treatment of tumor cells with the small molecule RITA
reveals a highly specific targeting of p53 by RITA, supporting
the notion that this compound could be a lead for the develop-
ment of a nongenotoxic target-specific anticancer drug. Our
study has uncovered a paradoxical contribution of MDM2 in
the choice of biological responses provoked by p53 and also
has uncovered that a robust dual regulation of p21 is a major
switch between growth arrest and apoptosis.
EXPERIMENTAL PROCEDURES
Cell Lines, Plasmids, and Transfections
HCT116, HCT116 TP53�/�, and HCT116 CDKN1A�/� cells were provided by
B. Vogelstein. U2OS cells were stably transfected with either pSUPER-p53
shRNA- or pSUPER-ctrl shRNA-encoding plasmids (Oligoengine) using Lipo-
fectamine 2000 (Invitrogen Life Technologies). Breast carcinoma MCF7, fibro-
sarcoma HT1080, colon carcinoma LIM1215, lung carcinoma A549, and renal
carcinoma A498 cells were treated with 1 mM RITA or 10 mM nutlin3a for 12 hr.
For Fas inhibitionexperiments,cell cultureswere treated with1 mM Fas inhibitory
antibody (Nordic BioSite) for 1 hr before exposure to compounds. The human
MDM2-encoding constructs HA-MDM2, MDM2-dRING and MDM2-I440S
were a gift from A. Ciechanover. MDM2�/�TP53�/� MEFs were a gift from
G. Lozano. MDM2, p21, PUMA, and Noxa siRNA pools were from Santa Cruz.
Oligonucleotide Microarray Data Analysis
Raw data from the hgu133a2 chips were normalized using the robust multiar-
ray average with GC correction (GCRMA) procedure, implemented in the R
package gcrma (quantile-based normalization with background correction
based on gene chip content of probes) (Wu et al., 2004). Per gene hypothesis
testing was performed using the significance analysis of microarrays (SAM)
procedure (Tusher et al., 2001), implemented in the R package siggenes, using
linear models for microarray data (LIMMA) (Smyth, 2004).
Pathway analysis was performed using a modified version of the procedure
in Tian et al. (2005) implemented in the R package sigPathway. The data were
Cancer Cell 15, 171–183, March 3, 2009 ª2009 Elsevier Inc. 181
Cancer Cell
MDM2 Contributes to p53-Induced Cell Death
first filtered using the SAM procedure to cull out potentially differentially regu-
lated genes. The sigPathway NTk statistic was then calculated on the filtered
data set. In short, the test statistic for each pathway was built using the sum of
the t statistic of its constituent genes. To get a measure of the significance of
the test statistic, it was compared to a null distribution calculated from random
permutations of gene labels. A minimum pathway size of 5 genes was used for
all analyses in Table 1 and Tables S2–S7. To find the rank for cell-cycle arrest
genes in the RITA-induced pathway in Figure 1C, a pathway size of 4 was
used.
Real-Time qPCR
Total RNA was extracted and purified with an RNeasy kit (QIAGEN) using the
manufacturer’s protocol. RNA (5 mg) was reverse transcribed using a Super-
Script First-Strand RT-PCR kit (Invitrogen). Real-time PCR was performed
with SYBR green reagent (Applied Biosystems) using 10 ng template in a
25 ml reaction mixture according to the manufacturer’s protocol. All primers
were designed using the PerlPrimer program (Marshall, 2004) with one primer
overlapping an exon boundary. Primer sequences are listed in Supplemental
Experimental Procedures.
Growth Suppression Assays
Fluorescence-activated cell sorting (FACS) was performed on a Becton
Dickinson FACScan. For cell-cycle analysis, cells were fixed in ethanol,
stained with propidium iodide, and analyzed according to standard proce-
dures. The fraction of apoptotic cells was detected by flow cytometry after
staining with annexin V-FITC as described by the manufacturer (BioSource
International).
Colony formation assay was performed in 12-well plates with 100,000 cells
treated for 8 hr with RITA or nutlin3a. One hundred cells per well were seeded
in 12-well plates. Five days after treatment, viable colonies were fixed in 3.7%
formaldehyde and stained with Giemsa.
Western Blots
Western blots were performed according to standard procedures with mouse
anti-human antibodies. Except where indicated, actin was used as a loading
control. p53 was detected with antibody DO-1 (Santa Cruz), hnRNP K
with IQ213 (ImmuQuest), MDM2 with SMP14 (Santa Cruz), p21 with Cip1/
WAF1 (Nordic BioSite), HA-tag with HA.11 (Covance), and actin with AC15
(Sigma).
Chromatin Immunoprecipitation
ChIP was performed largely as described previously (Boyd et al., 1998). Briefly,
after the chromatin solution was precleared with protein G agarose (Santa
Cruz) for 1 hr at 4�C, it was incubated with 1 mg of anti-human p53 monoclonal
antibody DO-1 (Santa Cruz) or 1 mg of anti-human anti-hnRNP K monoclonal
antibody IQ213 (ImmuQuest) at 4�C for 2 hr. The supernatant from the reaction
lacking primary antibody before the first washing was saved as total input
of chromatin. Pellets were collected by microcentrifugation, resuspended in
30 ml of H2O, and used for qPCR analysis.
Serial dilutions of the input sample were used to make a standard curve. The
reaction mixture was SYBR Green Master Mix (Applied Biosystems), 10 pmol/ml
of each primer, and 2 pmol/ml of template. Primer sequences are listed in
Supplemental Experimental Procedures. The reaction was performed at
50�C for 2 min and 95�C for 10 min, followed by 50 cycles of amplification at
95�C for 15 s and 60�C for 1 min.
ACCESSION NUMBERS
Microarray data described herein have been deposited in the NCBI Gene
Expression Omnibus (http://www.ncbi.nlm.nih.gov/geo/) with the accession
number GSE11578.
SUPPLEMENTAL DATA
The Supplemental Data include Supplemental Experimental Procedures, two
figures, and seven tables and can be found with this article online at http://
www.cancercell.org/supplemental/S1535-6108(09)00028-2.
182 Cancer Cell 15, 171–183, March 3, 2009 ª2009 Elsevier Inc.
ACKNOWLEDGMENTS
This study was funded by grants to G.S. from the Swedish Cancer Society, the
Swedish Research Council, and the Stockholm Research School of Genomics
and Bioinformatics and by the European Commission Sixth Framework Pro-
gramme. This study was also supported by an Association for International
Cancer Research grant to S.P.J. and A.M. Research in S.P.J.’s laboratory is
supported by Cancer Research UK and the European Union, and A.M. is sup-
ported by the Wellcome Trust. This publication reflects only the authors’ views.
The European Commission is not liable for any use that may be made of the
information therein. We are greatly indebted to all of our colleagues who
shared their reagents and cell lines with us, in particular to R. Iggo for sharing
the 5-FU microarray data. We are grateful to S. Soddu and G.S. laboratory
members for discussions and critical reading of the manuscript.
G.S. is a founder of Aprea AB, a small biotechnology company.
Received: May 16, 2008
Revised: October 6, 2008
Accepted: January 20, 2009
Published: March 2, 2009
REFERENCES
Ashburner, M., Ball, C.A., Blake, J.A., Botstein, D., Butler, H., Cherry, J.M.,
Davis, A.P., Dolinski, K., Dwight, S.S., Eppig, J.T., et al. (2000). Gene ontology:
tool for the unification of biology. The Gene Ontology Consortium. Nat. Genet.
25, 25–29.
Baptiste-Okoh, N., Barsotti, A.M., and Prives, C. (2008). Caspase 2 is both
required for p53-mediated apoptosis and downregulated by p53 in a p21-
dependent manner. Cell Cycle 7, 1133–1138.
Boyd, K.E., Wells, J., Gutman, J., Bartley, S.M., and Farnham, P.J. (1998).
c-Myc target gene specificity is determined by a post-DNAbinding mecha-
nism. Proc. Natl. Acad. Sci. USA 95, 13887–13892.
Brummelkamp, T.R., Fabius, A.W., Mullenders, J., Madiredjo, M., Velds, A.,
Kerkhoven, R.M., Bernards, R., and Beijersbergen, R.L. (2006). An shRNA bar-
code screen provides insight into cancer cell vulnerability to MDM2 inhibitors.
Nat. Chem. Biol. 2, 202–206.
Bunz, F., Dutriaux, A., Lengauer, C., Waldman, T., Zhou, S., Brown, J.P.,
Sedivy, J.M., Kinzler, K.W., and Vogelstein, B. (1998). Requirement for p53
and p21 to sustain G2 arrest after DNA damage. Science 282, 1497–1501.
D’Orazi, G., Cecchinelli, B., Bruno, T., Manni, I., Higashimoto, Y., Saito, S.,
Gostissa, M., Coen, S., Marchetti, A., Del Sal, G., et al. (2002). Homeodo-
main-interacting protein kinase-2 phosphorylates p53 at Ser 46 and mediates
apoptosis. Nat. Cell Biol. 4, 11–19.
Gartel, A.L., and Tyner, A.L. (2002). The role of the cyclin-dependent kinase
inhibitor p21 in apoptosis. Mol. Cancer Ther. 1, 639–649.
Issaeva, N., Bozko, P., Enge, M., Protopopova, M., Verhoef, L.G., Masucci, M.,
Pramanik, A., and Selivanova, G. (2004). Small molecule RITA binds to p53,
blocks p53-HDM-2 interaction and activates p53 function in tumors. Nat.
Med. 10, 1321–1328.
Jin, Y., Lee, H., Zeng, S.X., Dai, M.S., and Lu, H. (2003). MDM2 promotes
p21waf1/cip1 proteasomal turnover independently of ubiquitylation. EMBO
J. 22, 6365–6377.
Kanehisa, M., and Goto, S. (2000). KEGG: Kyoto encyclopedia of genes and
genomes. Nucleic Acids Res. 28, 27–30.
Kitagawa, M., Aonuma, M., Lee, S.H., Fukutake, S., and McCormick, F. (2008).
E2F-1 transcriptional activity is a critical determinant of Mdm2 antagonist-
induced apoptosis in human tumor cell lines. Oncogene 27, 5303–5314.
Lai, Z., Yang, T., Kim, Y.B., Sielecki, T.M., Diamond, M.A., Strack, P., Rolfe,
M., Caligiuri, M., Benfield, P.A., Auger, K.R., et al. (2002). Differentiation of
Hdm2-mediated p53 ubiquitination and Hdm2 autoubiquitination activity by
small molecular weight inhibitors. Proc. Natl. Acad. Sci. USA 99, 14734–
14739.
Lain, S., Hollick, J.J., Campbell, J., Staples, O.D., Higgins, M., Aoubala, M.,
McCarthy, A., Appleyard, V., Murray, K.E., Baker, L., et al. (2008). Discovery,
Cancer Cell
MDM2 Contributes to p53-Induced Cell Death
in vivo activity, and mechanism of action of a small-molecule p53 activator.
Cancer Cell 13, 454–463.
Marshall, O.J. (2004). PerlPrimer: cross-platform, graphical primer design for
standard, bisulphite and real-time PCR. Bioinformatics 20, 2471–2472.
Moreno, C.S., Matyunina, L., Dickerson, E.B., Schubert, N., Bowen, N.J.,
Logani, S., Benigno, B.B., and McDonald, J.F. (2007). Evidence that p53-
mediated cell-cycle-arrest inhibits chemotherapeutic treatment of ovarian
carcinomas. PLoS ONE 2, e441.
Moumen, A., Masterson, P., O’Connor, M.J., and Jackson, S.P. (2005). hnRNP
K: an HDM2 target and transcriptional coactivator of p53 in response to DNA
damage. Cell 123, 1065–1078.
Olivier, M., Eeles, R., Hollstein, M., Khan, M.A., Harris, C.C., and Hainaut, P.
(2002). The IARC TP53 database: new online mutation analysis and recom-
mendations to users. Hum. Mutat. 19, 607–614.
Riley, T., Sontag, E., Chen, P., and Levine, A. (2008). Transcriptional control of
human p53-regulated genes. Nat. Rev. Mol. Cell Biol. 9, 402–412.
Samuels-Lev, Y., O’Connor, D.J., Bergamaschi, D., Trigiante, G., Hsieh, J.K.,
Zhong, S., Campargue, I., Naumovski, L., Crook, T., and Lu, X. (2001). ASPP
proteins specifically stimulate the apoptotic function of p53. Mol. Cell 8,
781–794.
Shaked, H., Shiff, I., Kott-Gutkowski, M., Siegfried, Z., Haupt, Y., and Simon, I.
(2008). Chromatin immunoprecipitation-on-chip reveals stress-dependent
p53 occupancy in primary normal cells but not in established cell lines. Cancer
Res. 68, 9671–9677.
Smyth, G.K. (2004). Linear models and empirical bayes methods for assessing
differential expression in microarray experiments. Stat. Appl. Genet. Mol. Biol.
3, Article3.
Staib, F., Robles, A.I., Varticovski, L., Wang, X.W., Zeeberg, B.R., Sirotin, M.,
Zhurkin, V.B., Hofseth, L.J., Hussain, S.P., Weinstein, J.N., et al. (2005). The
p53 tumor suppressor network is a key responder to microenvironmental
components of chronic inflammatory stress. Cancer Res. 65, 10255–10264.
Steinman, R.A., and Johnson, D.E. (2000). p21WAF1 prevents down-modula-
tion of the apoptotic inhibitor protein c-IAP1 and inhibits leukemic apoptosis.
Mol. Med. 6, 736–749.
Suzuki, A., Tsutomi, Y., Akahane, K., Araki, T., and Miura, M. (1998). Resis-
tance to Fas-mediated apoptosis: activation of caspase 3 is regulated by
cell cycle regulator p21WAF1 and IAP gene family ILP. Oncogene 17, 931–939.
Sykes, S.M., Mellert, H.S., Holbert, M.A., Li, K., Marmorstein, R., Lane, W.S.,
and McMahon, S.B. (2006). Acetylation of the p53 DNA-binding domain regu-
lates apoptosis induction. Mol. Cell 24, 841–851.
Tang, Y., Luo, J., Zhang, W., and Gu, W. (2006). Tip60-dependent acetylation
of p53 modulates the decision between cell-cycle arrest and apoptosis. Mol.
Cell 24, 827–839.
Tian, L., Greenberg, S.A., Kong, S.W., Altschuler, J., Kohane, I.S., and Park,
P.J. (2005). Discovering statistically significant pathways in expression
profiling studies. Proc. Natl. Acad. Sci. USA 102, 13544–13549.
Tovar, C., Rosinski, J., Filipovic, Z., Higgins, B., Kolinsky, K., Hilton, H., Zhao,
X., Vu, B.T., Qing, W., Packman, K., et al. (2006). Small-molecule MDM2 antag-
onists reveal aberrant p53 signaling in cancer: implications for therapy. Proc.
Natl. Acad. Sci. USA 103, 1888–1893.
Tusher, V.G., Tibshirani, R., and Chu, G. (2001). Significance analysis of micro-
arrays applied to the ionizing radiation response. Proc. Natl. Acad. Sci. USA
98, 5116–5121.
Vassilev, L.T., Vu, B.T., Graves, B., Carvajal, D., Podlaski, F., Filipovic, Z.,
Kong, N., Kammlott, U., Lukacs, C., Klein, C., et al. (2004). In vivo activation
of the p53 pathway by small-molecule antagonists of MDM2. Science 303,
844–848.
Vogelstein, B., Lane, D., and Levine, A.J. (2000). Surfing the p53 network.
Nature 408, 307–310.
Vousden, K.H., and Lu, X. (2002). Live or let die: the cell’s response to p53. Nat.
Rev. Cancer 2, 594–604.
Wade, M., Wong, E.T., Tang, M., Stommel, J.M., and Wahl, G.M. (2006). Hdmx
modulates the outcome of p53 activation in human tumor cells. J. Biol. Chem.
281, 33036–33044.
Wei, C.L., Wu, Q., Vega, V.B., Chiu, K.P., Ng, P., Zhang, T., Shahab, A., Yong,
H.C., Fu, Y., Weng, Z., et al. (2006). A global map of p53 transcription-factor
binding sites in the human genome. Cell 124, 207–219.
Wu, Z., Irizarry, R., Gentleman, R., Martinez-Murillo, F., and Spencer, F. (2004).
A model-based background adjustment for oligonucleotide expression arrays.
J. Am. Stat. Assoc. 99, 909–917.
Xu, H., and el-Gewely, M.R. (2001). P53-responsive genes and the potential for
cancer diagnostics and therapeutics development. Biotechnol. Annu. Rev. 7,
131–164.
Yang, Y., Ludwig, R.L., Jensen, J.P., Pierre, S.A., Medaglia, M.V., Davydov,
I.V., Safiran, Y.J., Oberoi, P., Kenten, J.H., Phillips, A.C., et al. (2005). Small
molecule inhibitors of HDM2 ubiquitin ligase activity stabilize and activate
p53 in cells. Cancer Cell 7, 547–559.
Zhang, Z., Wang, H., Li, M., Agrawal, S., Chen, X., and Zhang, R. (2004). MDM2
is a negative regulator of p21WAF1/CIP1, independent of p53. J. Biol. Chem.
279, 16000–16006.
Cancer Cell 15, 171–183, March 3, 2009 ª2009 Elsevier Inc. 183