mcclanahan-thesis-2019.pdf - Fang-Yen Lab
185
AUTOMATED ANALYSIS OF EXPERIENCE-DEPENDENT SENSORY RESPONSE BEHAVIOR IN CAENORHABDITIS ELEGANS Patrick D. McClanahan A DISSERTATION in Bioengineering Presented to the Faculties of the University of Pennsylvania in Partial Fulfillment of the Requirements for the Degree of Doctor of Philosophy 2019 Supervisor of Dissertation __________________ Christopher Fang-Yen Associate Professor of Bioengineering and Neuroscience Graduate Group Chairperson __________________ Ravi Radhakrishnan Professor of Bioengineering and Chemical and Biomolecular Engineering Dissertation Committee David Issadore (chair), Associate Professor of Bioengineering Maria Geffen, Associate Professor of Otorhinolaryngology Matthew Kayser, Assistant Professor of Psychiatry Wenqin Luo, Associate Professor of Neuroscience Martin Chalfie, University Professor of Biological Sciences, Columbia University
-
Upload
khangminh22 -
Category
Documents
-
view
3 -
download
0
Transcript of mcclanahan-thesis-2019.pdf - Fang-Yen Lab

AUTOMATED ANALYSIS OF EXPERIENCE-DEPENDENT SENSORY RESPONSE BEHAVIOR IN CAENORHABDITIS ELEGANS
Patrick D. McClanahan
A DISSERTATION
in
Bioengineering
Presented to the Faculties of the University of Pennsylvania
in
Partial Fulfillment of the Requirements for the
Degree of Doctor of Philosophy
2019
Supervisor of Dissertation
__________________
Christopher Fang-Yen Associate Professor of Bioengineering and Neuroscience
Graduate Group Chairperson
__________________
Ravi Radhakrishnan Professor of Bioengineering and Chemical and Biomolecular Engineering
Dissertation Committee
David Issadore (chair), Associate Professor of Bioengineering Maria Geffen, Associate Professor of Otorhinolaryngology Matthew Kayser, Assistant Professor of Psychiatry Wenqin Luo, Associate Professor of Neuroscience Martin Chalfie, University Professor of Biological Sciences, Columbia University
AUTOMATED ANALYSIS OF EXPERIENCE-DEPENDENT SENSORY RESPONSE BEHAVIOR IN CAENORHABDITIS ELEGANS
COPYRIGHT
2019
Patrick Dean McClanahan
This work is licensed under the Creative Commons Attribution- NonCommercial-ShareAlike 3.0
License
To view a copy of this license, visit
https://creativecommons.org/licenses/by-nc-sa/3.0/us/

iii
ACKNOWLEDGMENTS
I would like to thank several individuals and groups who helped me, either directly or
indirectly, to complete the work in this dissertation.
First, I would like to thank Chris Fang-Yen for welcoming me into his lab. Throughout my
time in his lab, he has provided weekly one on one guidance and honest feedback on my work,
and has never hesitated to provide the materials and equipment I needed to carry out these
studies. He has also taught me to forage several local edible plants, a skill I hope I will not need.
I would also like to thank all the members of my thesis committee, Marty Chalfie, Maria
Geffen, Dave Issadore, Matt Kayser, and Wenqin Luo, for their valuable feedback during my
proposal and committee meetings and whenever else I needed it. I especially thank Dave
Issadore for sharing his microfluidics expertise and allowing me (and even one of my
undergraduate mentees) free use of his laboratory for device fabrication.
Although David Raizen was not on my committee, the quantity and quality of the
feedback and ideas he and members of his lab provided on all aspects of this project cannot be
overstated.
Chris is selective when it comes to hiring, so I had great colleagues in lab. My fellow
trainees (Anthony Fouad, Nick Trojanowski, Rich McCloskey, Matt Churgin, Hongfei Ji, Areta
Jushaj, Sangkyu Jung and others) were always eager to bounce ideas around, and the lab staff
(Miguel de la Torre, Julia Hayden, Liping He, Kevin Zhang, Bowen Yao) almost always kept the
boxes full of seeded NGM plates. I would especially like to thank the undergraduates whose
perseverance, curiosity, and fine motor skills contributed to my dissertation work (Joyce Xu, Jess
Dubuque, Daphne Kontogiorgos-Heintz, Ben Habermeyer, and Anthony Ma).
I would like to thank the Department of Bioengineering for providing a supportive school
and work environment. I had the pleasure of serving on the board of the Graduate Association of
Bioengineers (student council with beer) for three years, and the department was there to support
us financially, listen to the concerns of its students, and make helpful changes both to the
program and the physical environment. I would also like to thank the BE office staff with whom I

iv
interacted frequently (Jenn Shotto, Yolanda Washington, Renee Kelly, and Kathy Venit) for
always being friendly and helpful, and also Sevile Mannickarottu, for being a font of departmental
news and information.
Finally, I would like to thank my friends and family for their support. Especially my
roommate Maggie Dunagin, an accomplished baker, for near weekly test cakes, my brother Matt,
a skilled homebrewer, for beer, of course, and my parents, who live outside the city, for providing,
in addition to their love and support, a quiet and peaceful place to go to whenever I needed a
break from West Philadelphia.

v
ABSTRACT
AUTOMATED ANALYSIS OF EXPERIENCE-DEPENDENT SENSORY RESPONSE BEHAVIOR IN CAENORHABDITIS ELEGANS
Patrick D. McClanahan
Christopher Fang-Yen
Understanding how the internal state of an organism affects its response to stimuli is an
important question of biology and key to understanding human neurobehavioral problems. With
its tractable 302 neuron nervous system and complex behavioral repertoire, the roundworm
Caenorhabditis elegans is well suited for neurobehavioral studies. In this work, I investigate the
modulation of C. elegans touch response. The traditional gentle and harsh (nociceptive) touch
assays involve manually delivering a stimulus to 1 mm long animals using an eyebrow or a metal
wire, respectively. Using these simple assays, researchers have identified the genes and
mechanoreceptor neurons mediating gentle and harsh touch. However, these are two separate
manual assays limited in throughput and repeatability of the stimulus. First, I created a
multiplexed microfluidic assay that allows gentle and harsh touch response behavior to be
compared quantitatively in the same assay. I found that the threshold of harsh touch is about five
times the threshold of gentle touch and that, while both responses habituate to repeated stimuli,
the gentle touch response depends on the location of the previous touch, while the harsh touch
response does not. I also found that gentle touch response is not affected by pre-stimulus
velocity. Neuromodulatory states like sleep and stress can also affect touch response. Next, I
examined how the response to cellular stressors, which causes an EGF-mediated recovery
quiescence called stress-induced sleep (SIS), affects the mechanosensory response. Normally
touch causes increased locomotor activity followed by return to baseline behavior. During this
study, I observed a period of about 45 seconds of increased quiescence following the initial
locomotor response. This behavior had not been documented in the literature, so I named it post-
response quiescence (PRQ). I found that PRQ is upregulated following EGF overexpression,
vi
mediated, like sleep, by neuropeptide signaling, and requires the sleep active neurons ALA and
RIS. While these observations suggested a form of sleep homeostasis, I found that PRQ does not
meet two of the four behavioral criteria of sleep: it is not accompanied by a decrease in
arousability, and it is not itself under homeostatic regulation. C. elegans touch response is known
to be an escape response, and the presence of predator kairomone is known to affect C. elegans
behavior. Because of the prevalence of quiescent behavior (freezing and tonic immobility) in
vertebrate threat responses, and its upregulation during stress, I argue that PRQ may be a
stress-modulated defensive freezing behavior in C. elegans.

vii
TABLE OF CONTENTS
ACKNOWLEDGMENTS ..................................................................................... III
CHAPTER 1: USING CAENORHABDITIS ELEGANS TO STUDY THE REGULATION OF TOUCH RESPONSE BEHAVIOR ......................................... 1
INTRODUCTION .............................................................................................................................. 1
TOUCH SENSATION ...................................................................................................................... 2 Touch sensation in mammals ...................................................................................................... 2 Caenorhabditis elegans as a model organism ............................................................................. 3 Harsh touch ................................................................................................................................ 10 Other types of touch ................................................................................................................... 11 Other senses .............................................................................................................................. 11
REGULATION OF MECHANOSENSORY RESPONSE ............................................................... 12 Previous stimuli .......................................................................................................................... 12 Lethargus / developmentally-timed sleep .................................................................................. 13 Stress-induced sleep .................................................................................................................. 14 Other quiescent states ............................................................................................................... 14
OBJECTIVE ................................................................................................................................... 15
CHAPTER 2: COMPARING CAENORHABDITIS ELEGANS GENTLE AND HARSH TOUCH RESPONSE BEHAVIOR USING A MULTIPLEXED HYDRAULIC MICROFLUIDIC DEVICE ............................................................. 16
ABSTRACT ................................................................................................................................... 16
INTRODUCTION ............................................................................................................................ 17
MATERIALS AND METHODS ...................................................................................................... 20 Device concept and design ........................................................................................................ 20 Mold fabrication .......................................................................................................................... 21 Device fabrication ....................................................................................................................... 23 Control system ........................................................................................................................... 23 Imaging system .......................................................................................................................... 23 Experimental procedures ........................................................................................................... 24 C. elegans strains ...................................................................................................................... 25 Image processing ....................................................................................................................... 25
RESULTS AND DISCUSSION ...................................................................................................... 26 Stimulus calibration and measurement ...................................................................................... 26 Comparison with classical touch assays .................................................................................... 29 Comparison with other quantitative C. elegans touch assays ................................................... 29 Quantification of gentle and harsh touch response thresholds .................................................. 30 Estimates of the force applied to the worm ................................................................................ 33

viii
Behavioral receptive fields of the touch receptor neurons ......................................................... 33 Influence of previous locomotory direction on touch response .................................................. 37 Influence of previous touch location on touch response ............................................................ 39
ACKNOWLEDGEMENTS.............................................................................................................. 43
CHAPTER 3: ALA / RIS-DEPENDENT, NEUROPEPTIDE-MEDIATED QUIESCENCE FOLLOWS MILD SENSORY AROUSAL DURING A CAENORHABDITIS ELEGANS STRESS STATE ............................................. 53
ABSTRACT ................................................................................................................................... 53
INTRODUCTION ............................................................................................................................ 54
RESULTS ...................................................................................................................................... 56 Quiescence increases after mechanosensory response during UV stress-induced sleep ........ 56 Post response quiescence is enhanced following LIN-3C / EGF overexpression ..................... 60 Post response quiescence is not enhanced following a variety of other cellular stressors ....... 61 Post-response quiescence requires neuropeptide signaling and the sleep active neurons ALA and RIS ...................................................................................................................................... 64 Post response quiescence does not fulfill behavioral criteria for sleep ..................................... 68 Mechanical stimuli increase head movement quiescence but not locomotion quiescence ....... 74
DISCUSSION ................................................................................................................................. 78
MATERIALS AND METHODS ...................................................................................................... 80 C. elegans strains & maintenance ............................................................................................. 80 Heat shock, UV, and other stressors ......................................................................................... 81 Mechanosensory stimulation ..................................................................................................... 82 Blue light stimulation .................................................................................................................. 83 WorMotel fabrication and preparation ........................................................................................ 83 Imaging and image processing in the WorMotel ........................................................................ 84 Quantification of stimulus response ........................................................................................... 85 Quantification of PRQ ................................................................................................................ 86 Imaging and scoring locomotion, head movement, and feeding ............................................... 86 Lifespan measurements ............................................................................................................. 86 Statistics ..................................................................................................................................... 87
ACKNOWLEDGEMENTS.............................................................................................................. 87
CHAPTER 4: CONCLUSION AND FUTURE DIRECTIONS ............................ 110
CONCLUSIONS ........................................................................................................................... 110
REGULATION OF HARSH TOUCH ............................................................................................ 112
IS POST RESPONSE QUIESCENCE A METHOD OF ENERGY CONSERVATION? .............. 113
IS POST RESPONSE QUIESCENCE A DEFENSIVE FREEZING BEHAVIOR? ...................... 114

ix
APPENDIX I: ADAPTER FOR COUPLING A WORMOTEL TO AN AUDIO LOUDSPEAKER .............................................................................................. 117
OVERVIEW .................................................................................................................................. 117
MATERIALS AND EQUIPMENT ................................................................................................. 117
INSTRUCTIONS FOR ASSEMBLY ............................................................................................ 118 Pedestal ................................................................................................................................... 118 Petri dish holder ....................................................................................................................... 118 WorMotel holder ....................................................................................................................... 119
APPENDIX II: MATLAB CODE FOR DATA ACQUISITION AND PROCESSING ......................................................................................................................... 123
OVERVIEW .................................................................................................................................. 123
MATLAB GUI FOR IMAGE ACQUISITION ................................................................................ 123 Required hardware ................................................................................................................... 123 Required software .................................................................................................................... 124 Instructions ............................................................................................................................... 124 Code ......................................................................................................................................... 125
MATLAB GUI FOR MECHANOSENSORY STIMULATION ....................................................... 133 Required hardware ................................................................................................................... 133 Required software .................................................................................................................... 133 Instructions ............................................................................................................................... 133 Code: ........................................................................................................................................ 134
MATLAB CODE FOR DIFFERENCE IMAGE ACTIVITY AND QUIESCENCE DETECTION .... 144 Required hardware and software ............................................................................................. 144 Instructions ............................................................................................................................... 144 Code ......................................................................................................................................... 144
BIBLIOGRAPHY .............................................................................................. 165

1
CHAPTER 1: Using Caenorhabditis elegans to study the regulation of touch response behavior
INTRODUCTION
The sense of touch is a subcategory of mechanosensation that deals with detecting
physical contact of the body with outside matter and objects. Touch is extraordinarily important for
nearly all animal behavior and human daily activity, yet is relatively poorly understood, with
mammalian touch transducing channels only discovered in the last decade (Coste et al., 2011;
Ranade et al., 2014; Woo et al., 2014). Since the 1970s, research on the nematode
Caenorhabditis elegans has been on the cutting edge of our understanding of many biological
processes, including embryonic development (Sulston and Horvitz, 1977; Sulston et al., 1983)
and apoptosis (Hedgecock, Sulston and Thomson, 1983; Yuan and Horvitz, 1992). Touch sense
is no exception. Simple mutagenesis screens were used to discover genes required for the touch
response (Chalfie and Sulston, 1981). Some of these genes ended up being the touch receptor
channels themselves (O’Hagan, Chalfie and Goodman, 2005) - the first characterized in any
organism. Meanwhile, mapping of most of the worm’s nervous system using electron micrographs
of serial sections has allowed the touch response circuit to be worked out to the synaptic level
(White et al., 1986). This has allowed the worm to be used in detailed, quantitative studies of the
biophysics and modulation of touch response behavior, including some that have elucidated
molecules and mechanisms of learning and memory. But such studies often call for assays that
are more standardized and quantitative than the traditional manual stroke with an eyebrow hair.
These assays have generally fallen into two classes: those based on the worm’s response to
plate tap / substrate vibration (Rankin, Beck and Chiba, 1990; Sugi et al., 2014), and those where
the animal is touched directly (O’Hagan, Chalfie and Goodman, 2005; Park, Goodman and Pruitt,
2007). In this chapter I will briefly survey the history of scientific study of touch and its regulation
with emphasis on the worm. Then I will summarize the newer, quantitative touch assays that were
in use prior to and during my work, and lastly, I will review several physiological and behavioral

2
states known to modulate touch response behavior, including the stress response. This
information should serve to give the reader sufficient context for my work on comparing gentle
and harsh touch regulation as well as touch response modulation during stress, which are the
topics of chapters 2 and 3.
TOUCH SENSATION
Touch sensation in mammals
Touch sense is a type of mechanosensation that allows organisms to detect contact with
external objects or matter. Biological mechanoreceptors typically detect tissue strain resulting
from this contact. In mammals, there are four types of light (low-threshold) touch receptors:
Pacinian (PC), rapidly adapting (RA), slowly adapting 1 (SA1), and slowly adapting 2 (SA2)
(Knibestöl and Vallbo, 1970; Johnson, 2001). Each of these consists of a myelinated (typically
Aβ) afferent ending in a specialized structure located in or under the dermis. While these
mechanoreceptors have been known for many decades, the mechanotransductive channels of
mammals have only recently been discovered. Piezo2 is the pore-forming subunit of a
mechanically-activated ion channel that appears to function in low-threshold touch (Coste et al.,
2011; Ranade et al., 2014; Woo et al., 2014). Another isoform, Piezo1, is essential for vascular
system development and may play a role in sensing shear forces from fluid flow (Wu, Lewis and
Grandl, 2017).
When enough force is applied to the skin, the resulting sensation is not merely one of
touch, but also of pain. The task of nociception – the sensing of harmful or potentially-harmful
stimuli, falls on a different set of receptors called nociceptors. As their name suggests, they do
not merely sense touch but are polymodal, often sensing heat as well (Julius and Basbaum,
2001). Perhaps surprisingly, nociceptive afferents tend to be thin myelinated or unmyelinated (Aδ
or C), and thus conduct action potentials more slowly (Burgess and Perl, 1973). This may be why
it is possible to pick up a hot object, such as a skillet, before realizing it is too hot to safely handle.
3
Unlike innocuous touch, the channels mediating mammalian noxious touch have not been
identified (Dubin and Patapoutian, 2010), although the transient receptor potential (TRP) family is
suspected to contain them.
While the regulation of touch sensitivity and response behavior is overall poorly
understood, recent work has provided some insights. Some of the most fundamental modes of
touch regulation are habituation and adaptation, wherein touch receptor sensitivity or touch
responsiveness decreases with repeated stimuli. This may be why humans are not constantly
aware of their clothes. Sensitivity to touch and pain can also be regulated by local and global
states. Adrenaline and noradrenaline during the fight or flight response as well as other
neuromodulators released during the acute stress response function as analgesics (Bodnar et al.,
1980), allowing the body to ignore even grievous injury during an emergency. During recovery,
cytokines released during inflammation serve to sensitize nociceptors (Hucho and Levine, 2007),
resulting in soreness of the inflamed area. Anxiety can also sensitize threat response to all
aversive stimuli, not just touch (von Graffenried et al., 1978; Schmidt and Cook, 1999; Ploghaus
et al., 2001). On the other hand, states of low arousability, like sleep, can downregulate touch
sensitivity and response (Kleitman, 1929; Goff et al., 1966; Montagu, 1984).
Caenorhabditis elegans as a model organism
C. elegans is a cosmopolitan, free-living (non-parasitic) nematode or roundworm often
found in rotting vegetable matter where it feeds on bacteria (Corsi, Wightman and Chalfie, 2015;
Schulenburg and Félix, 2017). Wild isolates of the species had been in laboratory use for
decades, notably in the hands of Ellsworth Dougherty and Victor Nigon, but the standard
laboratory strain, Bristol N2, was initially isolated from compost in England by L. Staniland in 1951
and later popularized by Sydney Brenner in the 1970s (Sterken et al., 2015). C. elegans hatches
from an egg and grows through four larval stages. At the end of each larval stage is a period of
behavioral quiescence called lethargus followed by a molt. The larval stages are called L1
through L4. After the L4 molt, the worm is called a young adult until it begins laying eggs, after

4
which it is an adult. The timing of this process is temperature dependent, taking about three days
at 20°C. Most C. elegans are self-fertile hermaphrodites, but males do occur at low frequency
(Corsi, Wightman and Chalfie, 2015).
The features that make C. elegans useful for research are its ease of rearing, optical
transparency, ease of genetic manipulation, and stereotyped and well-mapped nervous system.
C. elegans is reared on agar plates where it feeds on non-pathogenic strains of E. coli, such as
OP50. Care of strains entails simply transferring a few animals to a new plate, where each
hermaphrodite will generate about 300 self progeny. Optical transparency allows for easy
visualization of fluorescent markers, optogenetic manipulation, and direct observation of activity
inside the animal, including, for example, movements of the pharyngeal grinder. The nervous
system of C. elegans hermaphrodites consists of exactly 302 neurons (White et al., 1986) that
can mostly be grouped into three categories: sensory neurons, interneurons, and motor neurons.
Neurons are further divided into classes, each with a three letter name. Classes often contain of
just a pair, and sometimes a single neuron.
Despite its simplicity, the C. elegans exhibits complex behaviors. Sensory detection of
stimuli is often inferred through the effect of the stimulus on behaviors such as locomotion and
feeding. Locomotion is controlled by two groups of interneurons and motor neurons. Interneurons
PVC and AVB activate the B-type motor neurons (MRNs) to promote forward locomotion, and
AVA, AVD, and AVE activate the A-type MRNs to promote reverse locomotion (Haspel,
O’Donovan and Hart, 2010). Neurons within each group tend to be co-active, with simultaneous
activation or inactivation of both groups resulting in a pause in locomotion (Roberts et al., 2016).
Feeding, which is inhibited by some noxious stimuli, is observable by recording the pharyngeal
pumps by which the worm ingests its bacterial food.
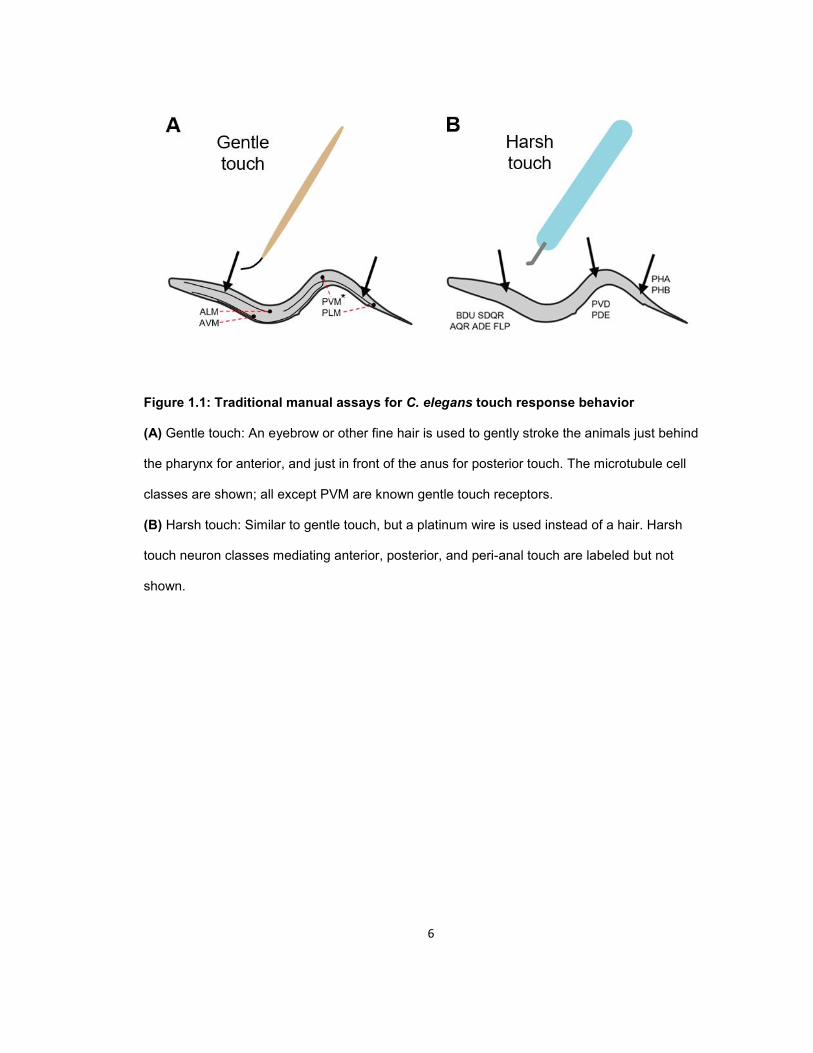
Gentle touch

5
The classical C. elegans touch assays involve manually touching the animals with a fine
hair (gentle touch) or platinum wire (harsh touch) (Chalfie and Sulston, 1981; Way, J.C., and
Chalfie, 1989; Chatzigeorgiou et al., 2010; Li et al., 2011) (Fig. 1.1). Gently stroking the body of
C. elegans with the thin end of an eyebrow hair generates a locomotor response thought to
function as an escape response in the wild (Maguire et al., 2011). The responses vary by
location: touches to the anterior half of the body elicit a reversal, while touches to the posterior
elicit forward movement. Reversals are sometimes followed by a reorienting turn, preventing the
animals from returning to the same location (Li et al., 2011; Donnelly et al., 2013). Touches to the
middle of the body can elicit either response (Chalfie et al., 2014). The directionality of the
response is possible because there are separate touch receptor neurons (TRNs) in the anterior
and posterior of the body (Chalfie et al., 1985). These cells were originally called microtubule
cells due to the presence of a bundles of unusually large, darkly staining microtubules in electron
micrographs (Chalfie and Thomson, 1979). There are three anterior TRNs, ALM right & left (R/L),
and AVM, and two posterior TRNs, PLM(R/L). PVM, while resembling the TRNs morphologically,
has not been shown to contribute to the touch response (Chalfie et al., 1985). The anterior and
posterior TRNs form gap junctions with reverse and forward command interneurons and chemical
synapses (inferred to be inhibitory) with the forward and reverse command interneurons,
respectively (Chalfie et al., 1985). By screening for animals that were defective in the gentle touch
response, Chalfie and Sulston were able to identify a number of genes, called mec for
mechanosensory abnormal (Chalfie and Sulston, 1981). One of these genes, mec-4 (Chalfie and
Sulston, 1981), coding for a sodium-epithelial channel (DEG/ENaC) subunit, turned out to be a
mechanically-gated ion channel (O’Hagan, Chalfie and Goodman, 2005), the first to have its
function demonstrated.
6
Figure 1.1: Traditional manual assays for C. elegans touch response behavior
(A) Gentle touch: An eyebrow or other fine hair is used to gently stroke the animals just behind
the pharynx for anterior, and just in front of the anus for posterior touch. The microtubule cell
classes are shown; all except PVM are known gentle touch receptors.
(B) Harsh touch: Similar to gentle touch, but a platinum wire is used instead of a hair. Harsh
touch neuron classes mediating anterior, posterior, and peri-anal touch are labeled but not
shown.

7
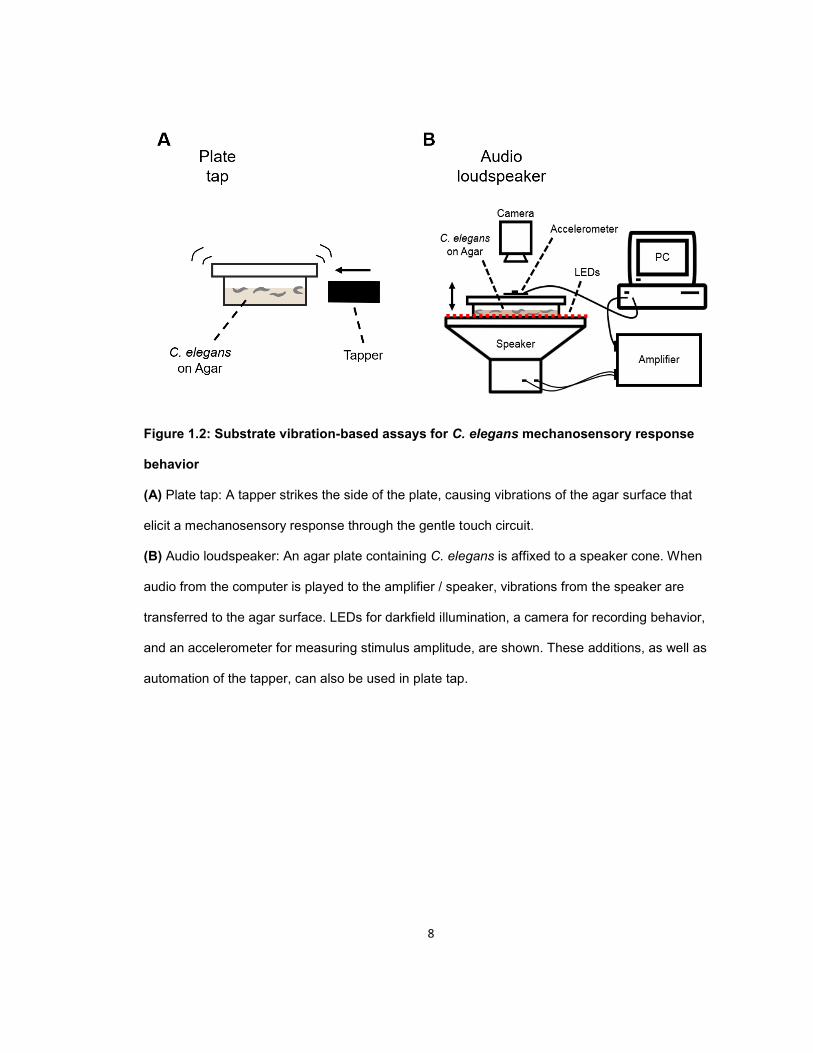
Plate tap
In addition to responding to direct gentle touch, the TRNs mediate a response called “tap
reflex”, where vibrations in the agar substrate caused by tapping the petri dish trigger a locomotor
response of the worms inside (Brenner, 1974; Rankin, Beck and Chiba, 1990). Other means of
generating substrate vibrations, such as audio loudspeakers (Chen and Chalfie, 2014), and
automated mechanical plate tappers (Timbers et al., 2013; Sugi et al., 2014, 2016) (Fig. 1.2)
have been coupled with various means of recording and quantifying the behavioral response.
This family of methods allows for relatively precise control of the stimulus and assaying of many
worms at once, and has been used extensively to study the modulation of the mechanosensory
response and habituation by repeated stimuli (Rankin, Beck and Chiba, 1990; Rankin and
Broster, 1992), age (Timbers et al., 2013), and genetic mutants (Rose et al., 2003; Timbers and
Rankin, 2011; Ardiel et al., 2018).
While the tap reflex has been useful for quantifying the gross behavior of a large number
of animals, recent development of tools that allow the recording and manipulation of neural
activity in intact worms, such as genetically-encoded calcium indicators (GECIs) (J. Nakai, M.
Ohkura and K. Imoto, 2001; Zhao et al., 2011) and optogenetics, have sparked a number of
studies of the biophysics and neurophysiology of touch. Such experiments require the controlled
administration of touch stimuli to a single, often constrained animal and have motivated the
development of a number of automated or semi-automated direct touch assays that provide
greater control of the stimulus than the traditional manual assays (Fig. 1.3).
8
Figure 1.2: Substrate vibration-based assays for C. elegans mechanosensory response
behavior
(A) Plate tap: A tapper strikes the side of the plate, causing vibrations of the agar surface that
elicit a mechanosensory response through the gentle touch circuit.
(B) Audio loudspeaker: An agar plate containing C. elegans is affixed to a speaker cone. When
audio from the computer is played to the amplifier / speaker, vibrations from the speaker are
transferred to the agar surface. LEDs for darkfield illumination, a camera for recording behavior,
and an accelerometer for measuring stimulus amplitude, are shown. These additions, as well as
automation of the tapper, can also be used in plate tap.

9
Figure 1.3: Mechanized and automated direct touch assays
(A) Glass pipette positioned by a micromanipulator and actuated with a piezo bimorph (O’Hagan,
Chalfie and Goodman, 2005).
(B) Piezoresistive cantilever with a glass sphere to deliver touch stimuli to an immobilized or
moving worm, which can be repositioned by means of a motorized x-y stage (Park, Goodman and
Pruitt, 2007; Petzold et al., 2013; Eastwood et al., 2016).
(C) Single layer microfluidic with worm trap and actuators (Cho et al., 2017; Nekimken et al.,
2017)
10
Harsh touch
Many animals, including humans, have both low-threshold touch receptors for detecting
innocuous touch, and high-threshold touch receptors that detect potentially damaging noxious
touch. This dysregulation of nociception in humans can lead to debilitating symptoms like
allodynia (perceiving innocuous stimuli as painful), hyperalgesia (excessive pain) (Coutaux et al.,
2005; Sandkühler, 2009; Jensen and Finnerup, 2014), and chronic pain (Basbaum and Fields,
1978). While the C. elegans MEC-4 channel mediates mechanotransduction in gentle touch, in
the gain-of-function mutant mec-4(e1611), the gentle TRNs discussed above degenerate and die
(Driscoll and Chalfie, 1991). However, when prodded with a wire pick, a stimulus strong enough
to approach the threshold of physical damage, these animals respond like WT, crawling forward
or backward away from the touch (Li et al., 2011), indicating that C. elegans also has separate
high-threshold touch receptors (Chalfie and Sulston, 1981; Way, J.C., and Chalfie, 1989;
Chatzigeorgiou et al., 2010). Furthermore, the harsh touch response is generally more prolonged
and, in the case of reversals, more likely to end in a reorienting omega turn (Li et al., 2011). Using
a series of laser ablation studies, researchers in X. Z. Shawn Xu’s lab were able to determine
which nociceptors underly harsh touch to different regions of the body. These were BDU, SDQR,
AQR, ADE, and FLP for anterior, PVD and PDE for posterior, and PHA and PHB for touch near
the anus (far posterior). Harsh touch sensitivity requires the DEG/ENaC channel subunits MEC-
10 and DEGT-1 (Chatzigeorgiou et al., 2010). Reminiscent of mammalian polymodal nociceptors,
many of these sensory neurons are multimodal. For example, the highly-branched PVD also
responds to cold in a TRPA-1 – dependent fashion (Chatzigeorgiou et al., 2010), and FLP
responds to noxious heat in a TRPV-dependent fashion (Liu, Schulze and Baumeister, 2012).
The gentle touch TRNs are not thought to contribute to harsh touch, as harsh mechanosensory
neuron-ablated WT animals respond to harsh touch stimuli with a gentle touch response
magnitude (Li et al., 2011). Thus harsh touch may be thought of as the C. elegans analogue of
mammalian nociception.
11
Other types of touch
Harsh and gentle touch to the body both elicit what is believed to be an escape response
(Maguire et al., 2011). However, not all touch indicates danger. Several forms of innocuous touch
have been studied in C. elegans. These include nose touch, when an animal stops or briefly
reverses when it bumps into an obstacle (Kaplan and Horvitz, 2016). Nose touch is mediated
mostly by the polymodal ciliated sensory neuron ASH, though OLQ and FLP also contribute, and
requires the TRPV subunits OSM-9 (Colbert, Smith and Bargmann, 1997) and OCR-2 (Tobin et
al., 2002). While nose touch is still arguably aversive, slowing upon entering bacteria food is
clearly not. The bacteria slowing response can be elicited by non-food beads and involves ciliated
sensory neurons in the nose (CEP) and along the midline (ADE, PDE) and requires serotonin
(Sawin, Ranganathan and Horvitz, 2000). CEP and PDE express the TRPA gene trp-4, which
may be the mechanotransducer (Kahn-Kirby and Bargmann, 2006). Finally, the C. elegans male
has an additional 42 ciliated neurons located in its tail which are likely to be mechanosensory
neurons involved in mating (Sulston, Albertson and Thomson, 1980; Bounoutas and Chalfie,
2007).
Other senses
C. elegans chemosensory (olfactory and gustatory), thermosensory, and, to a lesser
extent, photosensory systems and have been characterized. Chemical cues are detected by
ciliated amphid and inner labial neurons in the head and phasmid neurons in the tail (Ward, 1973;
Ward et al., 1975; Ware et al., 1975), while the AFD thermosensory neuron allows C. elegans to
navigate temperature gradients (Mori, Sasakura and Kuhara, 2007), and the nociceptor PVD
detects cold through TRPA-1 (Chatzigeorgiou et al., 2010). C. elegans is also capable of
electrosensation (Sukul and Croll, 1978; Gabel et al., 2007) and magnetosensation (Gadea et al.,
2015; Clites and Pierce, 2017), which are speculated to be a vestige of parasitic nematode
navigation toward the electrical fields of muscles, and a compass for navigation, respectively.
Like gentle and harsh touch, C. elegans photosensation (Burr, 1985; Ward et al., 2008) is an
aversive response, possibly allowing the animal to avoid sunlight, where it may face heat,

12
desiccation, and DNA damage from UV exposure. C. elegans lacks eyes, instead, the ciliated
sensory neurons ASJ, AWB, ASK and ASH (Xu et al., 2016) appear to be the photoreceptors and
gustatory receptors GUR-3 and LITE-1 play a role in phototransduction. There is debate in the
field over whether LITE-1 absorbs photons directly (Xu et al., 2016), or detects hydrogen peroxide
(Bhatla and Horvitz, 2015), a byproduct of light exposure.
REGULATION OF MECHANOSENSORY RESPONSE
In addition to responding differently to different types and magnitudes of external
stimulus, sensory responses are also determined by the internal states of the animal, notably the
history of prior stimuli as well as states like stress and sleep. While C. elegans touch habituation
is well studied, less is known about how sleep and stress modulate touch response behavior.
Here I briefly review what is currently known about the modulation of touch response behavior, as
well as some of the internal states of C. elegans that do or might regulate touch.
Previous stimuli
Repeated stimulation of an organism generally leads to an attenuation of the response
known as habituation. Habituation of the C. elegans tap reflex (Rankin, Beck and Chiba, 1990),
which is mediated by the gentle touch TRNs, has been studied as a model of experience-
dependent learning. Tap habituation manifests as a decrease in the amount of locomotor
response (distance travelled) following tap. Electric shock can partially reverse touch habituation,
a process called dishabituation (Rankin, Beck and Chiba, 1990), showing that habituation is not
due to fatigue. The decrement increases more quickly when the stimuli are closer together in time
(shorter inter-stimulus interval, or ISI), but persists longer when the ISI is longer (Rankin and
Broster, 1992). Glutamate signaling plays a role in tap habituation; retention of tap habituation
depends on the non-NMDA glutamate receptor homologue GLR-1 (Rose et al., 2003), and eat-4
mutants, thought to be defective in glutamate synthesis, habituate more quickly and do not
dishabituate (Rankin and Wicks, 2000). Like olfaction / chemosensation (Wen et al., 1997), plate
13
tap habituation shows associative learning; animals habituated in the presence of sodium acetate
respond less when re-tested in the presence sodium acetate (Rankin, 2000). Work from the
Rankin lab and Chalfie lab has demonstrated differential regulation of the anterior and posterior
gentle touch circuits; the anterior touch response habituates more quickly (Wicks and Rankin,
1996), but can be resensitized by several hours of vibration stimulation (Chen and Chalfie, 2014).
This resensitization requires AKT kinase AKT-1, which suppresses FOXO/DAF-16 (Chen and
Chalfie, 2014). Much less is known about the regulation of harsh, or nociceptive touch. The most
complete study to date on harsh touch response was from Shawn Xu’s lab. Work from his lab
showed that, much like gentle touch, different harsh touch receptors mediate the response to
harsh touch to different parts of the body. However, it is unknown how the relative sensitivity of
the different harsh touch receptors might change following repeated stimulation, but differing
receptive fields and the use of different mechanotransducers (TRPA-1 and DEGT-1) suggest the
potential for differential regulation of harsh touch sensitivity.
Lethargus / developmentally-timed sleep
In animals where EEG is not feasible, such as C. elegans, a set of behavior criteria is
used to identify sleep states. These are behavioral quiescence, decreased arousability, rapid
reversibility (Kleitman, 1929), and homeostatic regulation (Borbély, 1982). C. elegans
developmental lethargus satisfies these requirements (Raizen et al., 2008), plus it is regulated by
the PERIOD homologue LIN-42 (Jeon et al., 1999), suggesting that the behavior shares its
evolutionary origin with human sleep. Lethargus appears during the final two hours of each of the
four larval stages when the new cuticle is forming and is characterized by cessation of feeding
and bouts of movement quiescence (Cassada and Russell, 1975) ranging from several seconds
to around a minute (Iwanir et al., 2013; Nagy, Raizen and Biron, 2014) and accompanied by a
relaxed posture (Schwarz, Spies and Bringmann, 2012). This quiescence is regulated by
neuropeptide signaling from the interneurons RIS (Turek et al., 2016) and RIA(R/L) (Nelson et al.,
2013). During this time, the animal becomes less responsive to blue light (Nagy et al., 2014; Wu
14
et al., 2018), chemical (Raizen et al., 2008; Driver et al., 2013), and mechanosensory stimuli
(Raizen et al., 2008; Schwarz, Lewandrowski and Bringmann, 2011), but sufficiently harsh
stimulus can quickly restore waking-level responsiveness (Raizen et al., 2008; Driver et al.,
2013). Little is known about how sensory response is regulated during lethargus, but both the
baseline activity and the responsiveness of the TRNs themselves is reduced (Schwarz,
Lewandrowski and Bringmann, 2011).
Stress-induced sleep
Following the L4 molt, the adult C. elegans will never again sleep under standard
laboratory conditions. However, following exposure to a wide variety of stressors, including heat,
cold, ethanol, high salt, UV light, and pore-forming toxins, the worm enters a quiescent recovery
state called stress-induced sleep (SIS) (Hill et al., 2014; Trojanowski and Raizen, 2016). This
state is mediated primarily by neuropeptide signaling from the ALA interneuron (Van Buskirk and
Sternberg, 2007; Nelson et al., 2014), including neuropeptides encoded by FLP-13, which bind to
the G-protein coupled receptor DMSR-1 (Iannacone et al., 2017), with some contribution from
RIS (personal communication, David Raizen, and my own unpublished data). SIS animals are
less responsive to blue light and chemical stimuli, and harsh touch can rouse the animals (Hill et
al., 2014) and increase arousibility (DeBardeleben et al., 2017), but SIS quiescence has not been
shown to be under homeostatic regulation like lethargus. To my knowledge, the response of SIS
animals to gentle touch or plate tap has not been reported.
Other quiescent states
Several other quiescent states have been described in C. elegans, and some of them
overlap behaviorally and mechanistically with lethargus and SIS. These include responses to
extreme nutritional states like satiety quiescence (You et al., 2008; Gallagher et al., 2013; Hyun et
al., 2016; Davis et al., 2018) and fasting quiescence (Richard J McCloskey et al., 2017; Skora,
Mende and Zimmer, 2018), as well as an as-yet unpublished confinement or touch-induced
quiescence (Gonzales, 2019). Under adverse conditions (crowding, food scarcity), C. elegans

15
can also arrest its development and enter semi-dormant quiescent states. Two of these are L1
arrest and the alternative L3 stage called dauer (Cassada and Russell, 1975; Klass and Hirsch,
1976). A recent report showed that, despite the differences in causation between satiety, fasting,
L1 arrest, and dauer quiescence, all four of these require the neuropeptide function of the sleep
active neuron RIS for behavioral quiescence (Wu et al., 2018). Little is known about the
regulation of sensory response behavior in these states, but arrested L1s respond more slowly to
blue light (Wu et al., 2018), and worms touched on the nose (not the classical nose touch assay
because that requires the worms to run into the hair) during satiety quiescence return to
quiescence more quickly than non-fasted worms (You et al., 2008), and dauers are less
responsive to anterior gentle touch, but can be sensitized by prolonged vibration (Chen and
Chalfie, 2014).
OBJECTIVE
Manual assays are difficult to tune, and current automated methods are either based on
non-localized substrate vibrations or have single worm throughput and, in some cases, require
immobilization of the test subject. My first goal, described in chapter 2, was to develop an
automated C. elegans local touch assay that overcomes the limitations of current designs and
then do a quantitative comparison of gentle and harsh touch, including how those responses are
modulated by prior localized touch. Specifically, I wanted my assay to be able to deliver tunable,
localized touch to freely behaving animals and allow their natural behavioral response to be
observed. This would enable a behavioral comparison of how animals respond to repeated gentle
and harsh touch stimuli.
My second goal was to investigate how internal states like stress / SIS modulate the
gentle touch (escape) response in C. elegans. While I expected responsiveness to decrease
during SIS, we did not know how such a decrease is regulated, whether there are any qualitative
changes to the touch response, and whether there is homeostatic compensation after sensory
arousal. This is the subject of chapter 3.

16
CHAPTER 2: Comparing Caenorhabditis elegans gentle and harsh touch response behavior using a multiplexed hydraulic
microfluidic device
Patrick D. McClanahan, Joyce H. Xu, Christopher Fang-Yen
Department of Bioengineering, School of Engineering and Applied Sciences, University of
Pennsylvania, Philadelphia, PA 19104.
This chapter is a slightly modified version of a paper published in the journal Integrative Biology
(McClanahan, Xu and Fang-Yen, 2017)
I collected all the data presented in this paper. Joyce Xu assisted with fabrication and testing of
the microfluidic devices. Christopher Fang-Yen helped with device concept and design,
experimental planning, and revising the manuscript.
ABSTRACT
The roundworm Caenorhabditis elegans is an important model system for understanding the
genetics and physiology of touch. Classical assays for C. elegans touch, which involve manually
touching the animal with a probe and observing its response, are limited by their low throughput
and qualitative nature. We developed a microfluidic device in which several dozen animals are
subject to spatially localized mechanical stimuli with variable amplitude. The device contains 64
sinusoidal channels through which worms crawl, and hydraulic valves that deliver touch stimuli to
the worms. We used this assay to characterize the behavioral responses to gentle touch stimuli
and the less well-studied harsh (nociceptive) touch stimuli. First, we measured the relative
response thresholds of gentle and harsh touch. Next, we quantified differences in the receptive
fields between wild type worms and a mutant with non-functioning posterior touch receptor
neurons. We showed that under gentle touch the receptive field of the anterior touch receptor

17
neurons extends into the posterior half of the body. Finally, we found that the behavioral response
to gentle touch does not depend on the locomotion of the animal immediately prior to the
stimulus, but does depend on the location of the previous touch. Responses to harsh touch, on
the other hand, did not depend on either previous velocity or stimulus location. Differences in
gentle and harsh touch response characteristics may reflect the different innervation of the
respective mechanosensory cells. Our assay will facilitate studies of mechanosensation, sensory
adaptation, and nociception.
INTRODUCTION
The sense of touch allows animals to detect and react to forces resulting from physical
contact with the outside world. Much of the pioneering work in identifying the molecules and
mechanisms underlying touch response has been done in small genetic model systems such as
the roundworm C. elegans (Chalfie and Sulston, 1981). This organism’s simple, well-mapped
nervous system, optical transparency, short life cycle, and amenability to genetic manipulation
make it an attractive model for understanding the molecular and circuit bases of
mechanosensation. Current, widely used behavioral assays for C. elegans touch involve either
stroking the animal with a fine hair (‘‘gentle touch’’) or prodding it with a platinum pick (‘‘harsh
touch’’). These types of touch sensation have been shown to be mediated by different subsets of
sensory neurons (Chalfie and Sulston, 1981; Way, J.C., and Chalfie, 1989; Chatzigeorgiou et al.,
2010; Li et al., 2011).
Sensation of gentle touch to the body is mediated by five touch receptor neurons (TRNs).
These are ALM right and ALM left (R/L) and AVM in the anterior half of the body, and PLM (R/L)
in the posterior half (Chalfie and Sulston, 1981). PVM is sometimes considered a posterior TRN
due to morphological and genetic similarities to the other five, but it has not been shown to
mediate or contribute to the gentle touch response (Chalfie et al., 1985).

18
Gentle touch to the anterior of the body usually results in reverse movement, while gentle
touch to the posterior of the body usually results in forward movement. Touches to the middle of
the body can elicit either response, and are not usually performed in mechanosensory assays
(Chalfie et al., 2014). Mutants that fail to respond normally to gentle touch are called ‘‘mec’’ for
mechanosensory abnormal (Chalfie et al., 2014). Genetic screens with the gentle touch assay
have identified many proteins necessary for mechanotransduction, including the degenerin
(DEG)/epithelial sodium channel (ENaC) subunit MEC-4 (Chalfie and Sulston, 1981). The gentle
touch assay has also been used to investigate the nature and mechanisms of sensory adaptation
(Chen and Chalfie, 2014) and sensitization (Chaudhuri et al., 2016). Harsh touch to the body
using a platinum wire pick elicits similar behavior to gentle touch, but depends on a distinct set of
sensory neurons, in addition to at least some of the gentle TRNs (Suzuki et al., 2003). These
include BDU, SDQR, FLP, AQR, and ADE in the anterior, and PVD and PDE in the posterior.
Harsh touch response is independent of the gene mec-4, and has been shown to involve either
TRP-4 (Li et al., 2011) or the Deg/ENaC subunits MEC-10 and DEGT-1 (Chatzigeorgiou et al.,
2010) in different neurons. Harsh touch is thought to be a form of nociception (detection of
harmful stimuli) because its response threshold is on the order of the threshold of physical
damage (Li et al., 2011). Like mammalian nociceptors (Julius and Basbaum, 2001), many of the
C. elegans harsh touch receptors are polymodal sensory neurons, such as PVD (R/L), a pair of
highly branched neurons that send processes throughout the body (Chatzigeorgiou et al., 2010;
Albeg et al., 2011).
The gentle and harsh touch manual assays have two important limitations. First, they are
low in throughput, being performed manually on one worm at a time. Second, they are largely
qualitative in nature, both in terms of the stimulus delivered and the resulting behavior. Tools with
very different shapes and mechanical properties are used to test gentle and harsh touch, making
it difficult to compare their relative thresholds. These limitations complicate measurement of
subtle differences in sensitivity and location-dependence of touch response behavior. To partially
address these limitations, several alternative C. elegans touch assays have been reported.

19
Tapping an agar plate containing worms induces touch response behavior, which can be
observed using machine vision (Brenner, 1974; Rankin, Beck and Chiba, 1990). Plate tap has
been used to study mechanosensory habituation (Chiba and Rankin, 1990; Ebrahimi and Rankin,
2007; Chen and Chalfie, 2014). However, this method lacks spatial selectivity, stimulating both
the anterior and posterior TRNs, and has not been reported to elicit the harsh touch response
(Chalfie and Sulston, 1981; Wicks and Rankin, 1995). Another approach has been to deliver
measurable forces to specific locations on a single worm using a piezoresistive cantilever. This
method has been used to explore the biomechanical properties of the worm’s body (Park,
Goodman and Pruitt, 2007) and their effects on touch sensitivity (Petzold et al., 2013), and to
develop a biophysical model of mechanotransduction in the touch cells (Eastwood et al., 2016).
Another approach is to immobilize a single worm with glue (Suzuki et al., 2003) or a microfluidic
trap (Cho et al., 2017; Nekimken et al., 2017) and use a glass probe or pneumatic indenter to
apply direct stimulus while monitoring calcium transients or electrophysiological activity (O’Hagan,
Chalfie and Goodman, 2005). However, no method to date has combined the application of a
localized, tunable, mechanical stimulus with behavioral recording of the responses of many
worms at the same time.
Here we report a microfluidic-based touch assay that can deliver spatially localized gentle
and harsh touch stimuli to up to several dozen C. elegans and quantify their behavior before and
after stimuli. Our design integrates concepts from several previous microfluidic devices: (1) an
array of channels for imaging a large number of C. elegans at once (Hulme et al., 2007a), (2)
sinusoidal microfluidic channels and ‘artificial dirt’ post arrays that encourage natural crawling
behavior (Lockery et al., 2008), and (3) pressure-actuated monolithic microfluidic valves (Unger et
al., 2000) that apply localized touch stimuli.
We sought to characterize and compare aspects of the gentle and harsh touch responses
on a quantitative level. First, we measured the relative thresholds for gentle (mec-4 dependent)
and harsh (mec-4 independent) touch. Next, we investigated the extent of gentle touch receptive
field overlap by comparing the receptive fields of wild-type and mutant animals. We then
20
examined the influence of prior behavior and prior touch history on behavior after an ambiguous
stimulus (touch to the mid-body), for both gentle and harsh touch.
MATERIALS AND METHODS
Device concept and design
Our microfluidic device (Fig. 2.1) consists of: (1) a layer containing loading channels with
six bifurcations leading to an array of 64 sinusoidal channels into which worms are allowed to
crawl, and (2) a layer containing an array of 15 channels that can be pressurized to deliver touch
stimuli to worms in the first layer. Each intersection between the worm channels and touch
channels, which are mutually perpendicular, forms a monolithic microfluidic valve (Unger et al.,
2000) capable of partially closing the worm channel and delivering a touch stimulus if a worm is
present (Fig. 2.1A). The touch channels are filled with water to minimize compressibility and
reduce optical scattering arising from the refractive index difference with the PDMS device.
Worms are loaded through an entry port and flow through a set of bifurcating channels
that distribute them approximately uniformly (Hulme et al., 2007b) before entering the worm
channels. All layers of the device are transparent, allowing for behavioral imaging under dark field
or bright field illumination.
The design of our device reflects optimizations over several constraints and trade-offs.
The number of channels and the field of view were chosen to accommodate as many animals as
possible while allowing sufficient spatial resolution to clearly identify worms including their
anterior–posterior orientation. The touch channels were spaced 1.067 mm apart, approximately
the length of an adult worm, such that each animal experiences only one stimulus at a time (Fig.
2.1C). The sinusoidal shape of the worm channels allows the animals to exhibit a natural crawling
behavior similar to that on a moist surface (Lockery et al., 2008), and clearance in the worm
channels allows worms to execute turns and pass one another. The thicknesses of the layers
were optimized over several iterations to allow repeated gentle or harsh touch stimuli while
21
maintaining the integrity of the device. Thicker separations between the worm and control
channels resulted in smaller deflections and the inability to trigger mec-4-independent touch
response; thinner separations led to device failures after repeated pressure cycles.
Mold fabrication
We designed photomasks (Fig. 2.S1 and 2.S2) in DraftSight (Dassault
Systèms, Vélizy-Villacoublay, France) and had them printed on polyester film by Fine Line
Imaging (Colorado Springs, CO). We fabricated worm and control layer molds using standard soft
lithography techniques. Briefly, SU-8 2025 (MicroChem, Westborough, MA) was spin-coated onto
a 5 inch diameter Si wafer for 10 s at 500 RPM followed by 30 s at 1000 RPM (worm layer) or
500 RPM (control layer). After soft baking at 80°C for 10 min (worm layer) or 60°C for 2 h (control
layer), wafers were placed under a 360 nm long pass filter and treated with a 2.6 J/cm2 (worm
layer) or 3.2 J/cm2 (control layer) ultraviolet exposure in an Intelli-Ray 400 UV curing oven
(Uvitron, West Springfield, MA). We developed photoresists by immersion in propylene glycol
monomethyl ether acetate (Sigma-Aldrich). Molds were silanized with trichloro(1H,1H,2H,2H-
perfluorooctyl)silane (Sigma-Aldrich) for 20 min to facilitate demolding.

22
Figure 2.1: Microfluidic device for assaying touch response behavior
(A) A touch channel (magenta) inflates upon pressurization, partially closing the worm channel
(blue).
(B) Schematic of the device containing 64 sinusoidal worm channels and 15 control channels.
(C) Dark field image of C. elegans crawling in the worm channels with photomask design
overlaid.
23
Device fabrication
The elastic modulus of PDMS can be adjusted by varying the ratio of base to curing
agent (Khanafer et al., 2009; Wang, Volinsky and Gallant, 2014). To create the worm layer, we
mixed PDMS (Dow Corning Sylgard 184) at a 20 : 1 base : curing agent ratio, degassed it under
vacuum for 30 min, spin-coated it onto the mold for 90 s at 630 RPM, and baked it on a level
hotplate at 50°C overnight (B12 h). To create the control layer, we mixed PDMS at a 5 : 1 or 10 :
1 base : curing agent ratio, poured it onto the mold in a petri dish to a depth of 10 mm, vacuum
degassed it for 30 min, and cured it in a 50°C oven overnight.
To bond device layers, we plasma treated the surfaces to be bonded for 9 s in a plasma
cleaner consisting of a Plasma Preen II 973 controller (Plasmatic Systems, Inc.) connected to a
modified microwave oven (Amana RCS10TS) and then pressed the surfaces together for several
minutes. We first demolded the control layer and bonded it to the worm layer. Next we demolded
both layers from the worm layer mold and plasma bonded the worm layer side to a 75 mm X 25
mm X 1 mm glass slide. Each device was calibrated before use (see RESULTS).
Control system
Control pressures were provided by a nitrogen gas cylinder through a two-stage pressure
regulator (Harris Products) and measured by an analog pressure gauge. We used a 3-way
solenoid valve (Asco 3UL87) to apply or release pressure to the touch channels. The solenoid
valve was controlled with the analog output of a National Instruments USB-6001 DAQ device
coupled to an electromechanical relay.
Imaging system
We recorded behavior at 10 frames per second with a 5 megapixel CMOS camera (DMK
33GP031, The Imaging Source, Charlotte, NC) and a C-mount lens (Schneider Kreuznach
Xenoplan 1.4/23- 0512, 23 mm effective focal length) using IC Capture software (The Imaging
24
Source) on a Windows PC. The field of view was approximately 15 mm X 11 mm. To ensure
sufficient resolution for tracking, we did not image all 64 worm channels at once. Red LED strips
(Oznium, Inc.) surrounding the device provided dark field illumination.
Experimental procedures
To prepare the device, we first filled the control channels and connecting tubes with
water. Then we filled the worm channels with NGMB (50 mM NaCl, 1 mM CaCl2, 1 mM
MgSO4,20 mM KH2PO4, 5 mMK2HPO4) containing 0.1% bovine serum albumin (Sigma A9647)
to minimize adhesion of worms to the channels and tubing. We used NGMB to wash C. elegans
from their growth plates and placed them in a syringe connected to the worm channel inlet port.
To load worms into the device, we used syringes on the inlet and outlet tubes to manually apply
pressure or vacuum. Loading required approximately 5 minutes. All experiments were performed
at room temperature (18–22°C).
For each set of worms, we first recorded for at least 30 s to establish a baseline level of
behavior. Next, we applied one sham stimulus with zero pressure followed by one of two stimulus
regimes. (1) To determine the response threshold of a population of animals, we delivered a ramp
of twelve stimuli of increasing magnitude with a 30 s inter-stimulus interval (ISI). (2) To determine
the sensory adaptation and/or behavioral receptive field of a population of animals, we delivered
a series of 20 equal magnitude stimuli with a 30 s ISI. Data collection time was 7 min and 11 min,
respectively. For all worm experiments, each stimulus consisted of a train of 5 pulses of 20 ms
duration with 20 ms separation between pulses. Video 2.S3 shows a subset of worms on the
device undergoing a touch stimulus.
After each experiment, the device was cleared of worms by flowing a bleach solution (1 :
1 : 3 parts by volume mixture of 5 M NaOH, 5% NaClO, and water) through the worm channels
for approximately 5 min, followed by a 5 min water rinse and refilling with NGMB. Thus a typical
20-stimulus experiment lasted about 25 minutes and involved 50 worms. The overall

25
experimental throughput was approximately 2400 individual touch assays on 120 distinct worms
per hour.
C. elegans strains
Strains used in this study were Bristol N2 (WT), TU253 mec-4(u253), and TU4032 egl-
5(u202); uIs115 [Pmec-17::RFP]. Animals were cultured on OP50 E. coli food bacteria on
standard NGM agar plates (Brenner, 1974) or high-peptone NGM plates (same as NGM plates
except with 10 g/L peptone) at 15–20 °C. To synchronize growth, we used a sodium hypochlorite
bleach procedure (Stiernagle, 2006) to obtain eggs, which were hatched in NGMB overnight.
About 200 worms were then transferred onto OP50-seeded NGM agar plates and grown to
adulthood. All experiments were performed using day 1 adult hermaphrodites.
Image processing
All image processing and data analysis was performed using custom software written in
MATLAB (MathWorks, Natick, MA). Briefly, each frame was background subtracted and
thresholded to obtain a binary image of the worms on the dark background. We determined the
head–tail orientation of each worm by visual inspection. Velocities were calculated by tracking the
centroid of each animal over time.
We excluded images acquired during each stimulus because valve actuation caused a
small distortion in the device and a fluctuation in animal position. The worm channels provide
enough clearance for worms to pass each other or execute a 180 degree turn (Vid. 2.S4). We
excluded from analysis worms that were touching or overlapping. We also excluded worms that
were turning because they could receive touch stimuli to two locations simultaneously.
26
RESULTS AND DISCUSSION
Stimulus calibration and measurement
One limitation of traditional touch assays in C. elegans is the difficulty of controlling the
strength of stimulus delivered to the animal by hand. In our device, stimulus amplitude can be
continuously varied by changing the pressure delivered to the touch channels, causing the worm
channel ceiling to deflect downward by variable amounts. The microvalve indenter is slightly
rounded when pressure is applied. As for any rounded indenter (e.g. eyebrow hairs, wires, glass
probes, and micro-spheres (Chalfie et al., 2014)) the contact area between indenter and worm
increases with indentation depth.
Previous work (Petzold et al., 2013; Eastwood et al., 2016) showed that the amount of
deformation, not pressure, is the key determining quantity for the mechanoreceptor response. We
therefore used deformation amplitude as the measure of stimulus amplitude. To calibrate the
relationship between pressure and deformation of each device, we measured the worm channel
height inside the microvalves at different pressures by monitoring the transmission of light
through a blue dye solution (Fig. 2.2). We filled the worm channels with 15 mM Brilliant Blue FCF
dye in water and recorded video sequences of valve closure at different pressures under bright
field illumination provided by a red LED (Fig. 2.2A). The Beer–Lambert Law describes the
relationship between the proportion of light transmitted through the channel (I/I0) and the worm
channel height (L): I/I0 = exp(-L/λ)+ B, where λ is the absorption length and B is the baseline
intensity when transmitted light is blocked. We used the known height of the worm channel when
fully open (75 mm) and the intensity of a region of interest (ROI) in which all transmitted light was
blocked with an opaque material to calculate λ and B, respectively. We used this relationship to
convert the light intensity recorded in an ROI to the deflection of the worm channel ceiling in the
touch valves (Fig. 2.2B). For calibration experiments, we used trains of 10–20 pulses to
compensate for the video’s sparse sampling of the device response. We repeated this procedure
at least three times to develop a calibration curve for each device (Fig. 2.2C). By testing several
valves at the center and edges of a single chip, we verified that calibrations were uniform
27
throughout the device. Thereafter we calibrated each device using a single valve at the center of
the chip.
The calibration procedure could not be performed with a worm present in the valve
because the worm’s body excludes the dye and blocks some of the transmitted light. The values
given for deflection are therefore for a worm channel not containing a worm. To determine to what
extent the presence of an animal changes the touch valve deflection, we measured the channel
deflection using a confocal microscope (Leica SP5). We loaded day 1 adults into the device and
immobilized them in a solution of 10 mM NaN3 with 0.3 mM sodium fluorescein in NGMB. We
imaged the 3-dimensional shape of the fluorescein solution in two adjacent touch valves, one
containing a worm and the other containing only the fluorescein solution. Due to the long
acquisition time required for confocal microscopy, we applied a static instead of pulsatile
pressure. We used 15 psi because maintaining higher pressures for several minutes
compromised the device integrity. We found no difference between the deflection of the touch
valves with a worm (deflection 19.1 ± 2.0 mm (mean ± SD) at 15 psi) and without a worm
(deflection 19.4 ± 1.7 mm at 15 psi). Both values agreed with results from optical transmission
studies described above (deflection 18.8 ± 0.3 mm at 15 psi).
We conclude that the presence of a worm does not significantly affect the deflection of
the microfluidic valve at this pressure. This may be because the worm’s elastic modulus is much
smaller than that of PDMS. Studies that consider the worm as a whole have estimated its
modulus to be the range of 110–140 kPa (Backholm, Ryu and Dalnoki-Veress, 2013; Gilpin,
Uppaluri and Brangwynne, 2015) compared to ~1 MPa for PDMS with a 20 : 1 base : curing
agent ratio (Johnston et al., 2014). However, the stiffness of C. elegans and other biological
tissues is known to increase sharply with strain (Gilpin, Uppaluri and Brangwynne, 2015), so it is
possible that valve deflection with and without a worm are not equal at higher pressures.

28
Figure 2.2: Stimulus measurement and calibration
(A) Optical transmission of dye-filled touch valves is used to monitor worm channel height in the
valve.
(B) Worm channel ceiling deflection when control solenoid is driven by a 25 Hz square wave with
an amplitude of 40 psi and a 50% duty cycle. Red lines denote pressure on.
(C) Maximum deflection as a function of pressure. Points (mean ± SD) show the average of 3–5
trials. Colors show 4 different devices.

29
Comparison with classical touch assays
We sought to determine to what extent the touch response behavior in our device is
similar to that on an agar plate. We performed the traditional (eyebrow hair) anterior gentle touch
assay on 10 worms crawling on an unseeded agar plate while acquiring video recordings on a
stereo microscope. We measured the wavelength and bending frequency of the animals in 3
second windows before and after the touch. We found no change in wavelength (0.49 ± 0.4 mm
before and 0.51 ± 0.3 mm after, p = 0.22, 2 tailed paired t-test) but a significant increase in
frequency 0.59 ± 0.31 Hz to 1.39 ± 0.38 Hz (p = 9.2 × 10⁻⁶, 2-tailed paired t-test). In the
microfluidic chip, we also saw a significant increase in frequency in the three seconds after the
stimulus, from 1.00 ± 0.58 Hz before stimulus to 2.56 ± 0.88 Hz after stimulus (p = 6.6 × 10⁻⁵).
The worm’s wavelength in the microfluidic device was constrained to be 0.5 mm, very close to
that observed on agar. While the worms move faster overall in the microfluidic channels, both
worms on plates and in our device respond to touch by increasing their bending frequency by
similar amounts (2.36 times on agar, 2.56 times in the microfluidic device). These results show
that with regard to touch response behavioral characteristics, the microfluidic device environment
is reasonably similar to that of an agar plate.
Comparison with other quantitative C. elegans touch assays
Two classes of existing assays allow for tunable touch stimuli, as well as quantitative
response data. The first class is based around the plate tap reflex and comprises assays that use
an impactor or actuator to induce vibration of the agar substrate, triggering a response mediated
by the gentle touch receptors (Rankin, Beck and Chiba, 1990). As in our assay, stimulus strength
can be measured, usually with a MEMS accelerometer (Chen and Chalfie, 2014; Sugi et al.,
2014, 2016) or laser Doppler vibrometer (Timbers et al., 2013), and responses of freely moving
animals can be recorded. However, the stimulus is not localized to any one part of the animal,
preventing the study of touches to a subset of touch receptors.
30
The second class involves directly touching a single, often immobilized animal with
instruments such as glass micropipettes, piezoresistive cantilevers, and microfluidic actuators. A
previously reported microfluidic actuator (Nekimken et al., 2017) with an in-plane deflection
geometry has a smaller standard deviation of deflection (1 mm) than our device (2.6 mm).
However, our device has a two-layer geometry that permits assaying many animals
simultaneously. Thus our assay combines the multi-worm throughput and quantitative behavior
measurement of the substrate vibration assays with the localized, tunable stimuli of the direct
touch assays.
Quantification of gentle and harsh touch response thresholds
A quantitative understanding of touch response behavior is necessary for understanding
which cells and genes are required to detect different physical properties and govern different
aspects of the response. In traditional touch assays, gentle and harsh touch are assayed using
different tools, and animals are normally scored in a binary fashion as responding or not
responding. However, touch responses are known to vary both qualitatively (e.g. direction of
movement) and quantitatively (distance travelled during response) (Rankin, Beck and Chiba,
1990; Li et al., 2011).
Worms lacking the DEG/ENaC channel subunit MEC-4 are insensitive to gentle touch but
remain sensitive to harsh touch (Li et al., 2011). While some estimates of the forces and/or
deformations required for gentle and harsh touch have been reported (O’Hagan, Chalfie and
Goodman, 2005; Hart, 2006; Li et al., 2011; Petzold et al., 2013), these measurements have
been performed in different ways, for example using unequal probe sizes, making them difficult to
compare directly. We used our touch microfluidic device to measure the differences in touch
sensitivity between N2 and mec-4 worms.
To determine the response threshold (defined here as the stimulus amplitude at which
the response probability of a population of N2 or mec-4 animals is 50%), we delivered stimuli of
monotonically increasing strength spaced 30 s apart. Since response to local touch occurs
31
quickly, we quantified the worms’ behavioral responses by measuring the difference in centroid
velocity of the animals between one second before and one second after the stimulus (Fig. 2.3).
To determine a threshold for automatic scoring, we scored a subset of our data (149 worm
touches) by visual inspection of video recordings and then chose the velocity change (0.18 mm/s)
that maximized the difference between the true positive rate (80% for this threshold) and the false
positive rate (14.7% for this threshold). Animals whose velocity changed more than the scoring
threshold after the stimulus were scored as responding. We excluded animals that received a
posterior touch if they were already moving forward, as well as animals that received an anterior
touch if they were already reversing. We adjusted for possible false positives by subtracting the
response rate of the strain to a mock stimulus (12.3% for WT, 0% for mec-4). We considered the
lowest deflection causing at least 50% of animals tested to respond to be the response threshold,
interpolating as necessary. For WT animals, the response threshold was 9.3 ± 2.7 mm, and for
mec-4 animals, the response threshold was 46.1 ± 2.8 mm. For WT animals, response probability
decreased for the strongest stimuli, suggesting that a MEC-4-dependent sensory adaptation or
response fatigue occurs with increasing mechanical stimulus amplitude.
However, we note that, given that the width of the worm is non-uniform and (approx. 60-
75 μm excluding the anterior and posterior 15%, see Fig.2.S7), with the exception of the middle,
less than the height of the worm channels (75 μm), indentation experienced by individual animals
is likely to vary depending on the position of touch channel and the worm’s body. Furthermore,
eggs, which could become trapped between the animal’s body and the channel during stimulus
and act as indenters themselves, were mostly washed away during the loading process such that
few were present during the assay. Some C. elegans mutants differ morphologically and To our
knowledge
These results demonstrate the ability of this device to administer a continuum of
mechanical stimuli, and show that in terms of the vertical deflection of the microfluidic membrane
in this assay, subject to the qualifications raised above, the threshold for harsh touch is about 5
times greater than the threshold for gentle touch.
32
Figure 2.3: Proportion responding of WT and mec-4 as a function of stimulus amplitude.
Vertical error bars are 95% confidence intervals based on a binomial fit, and horizontal error bars
are standard deviations of the calibration measurements for the device. Each point represents
data from n = 21–57 animals.

33
Estimates of the force applied to the worm
Recent studies suggest that touch receptor neurons are sensitive to deformation rather
than force per se (Petzold et al., 2013; Eastwood et al., 2016). Nevertheless, touch stimuli are
often quantified in terms of force applied (O’Hagan, Chalfie and Goodman, 2005; Chalfie et al.,
2014). While we have no direct measure of the force applied to the worm in our device, we can
approximate this force based on the deflection and previous estimates for the mechanical
properties of the worm. Our confocal measurements suggest that touch valve deflection is similar
with and without a worm up to at least 15 psi, the pressure tested. A deflection of 9.3 mm causes
a response in WT animals 50% of the time, and the Young’s modulus of the worm, based on an
average of literature values, is approximately E = 125 kPa (average of two estimates30,31).
Since the worm’s modulus is much smaller than that of PDMS, the force on the worm is
dominated the worm’s elasticity. A simple estimate based on the elasticity of the worm yields a
force of 116 mN for a 9.3 mm deformation. Application of deformation theory (Puttock and
Thwaite, 1969) for a cylindrical body in contact with a surface of limited extent yields an estimate
of 94 mN (Suppl. 2.S5A).
Using 10 mm diameter glass bead as an indenter, Petzold et al. reported a 50%
response probability at a force of about 0.75 mN and deflection of 1.5 mm, both much smaller
than we find here. This difference is likely due to the very different sizes of the indenters, and
differences in indentation number, rate, and shape. If we consider the active area of the spherical
indenter to be the area of a disk with the same diameter, and the active area of a touch valve to
be a rectangle (Suppl. 2.S5B) the downward force per area exerted by the touch valve and glass
bead are similar: 19.0 kPa and 18.7 kPa, respectively.
Behavioral receptive fields of the touch receptor neurons
C. elegans normally responds to touch by moving in a direction opposite to the stimulus:
anterior touch results in a reversal and posterior touch results in forward movement. Touches
near the middle of the body can result in either forward or reverse movement, and Ca2+ imaging
of ALM shows sporadic activation by near (close to mid-body) but not far posterior touch (Suzuki

34
et al., 2003). This suggests an overlap in receptive fields between the anterior and posterior
TRNs, even though the TRN processes themselves do not overlap. However, the receptive fields,
or regions over which the anterior and posterior TRNs are sensitive to touch, have remained
unclear.
To spatially map the gentle touch behavioral response, we used the ability of our assay to
rapidly assess behavioral responses as a function of body position. Using our microfluidic device,
we measured the responses of WT animals and egl-5(u202) mutants, in which the posterior
TRNs are not functional (Chalfie and Au, 1987). For each group of worms, we administered 20
stimuli with a deflection amplitude of 30 μm separated by a 30 second ISI and measured the
speed for one second after the stimulus. The average speed after a stimulus was 0.35 mm/s for
the first five stimuli and 0.30 mm/s for the final five stimuli in WT animals, indicating that sensory
habituation is minimal in this protocol (Fig. 2.S6). The average speed was 0.21 mm/s after a
mock stimulus.
egl-5 mutants were slower than WT: egl-5 worms in the absence of stimulus had an
average speed of 0.10 mm/s versus 0.23 mm/s for WT, and also had a significantly slower
response speed (p < 0.05, two-sided t-test), but their responses also did not decline significantly
over the course of the experiment.
To examine responses to touches at different regions of the body, we grouped the
responses into five bins according to body coordinate touched (Fig. 2.4). We excluded data from
touches to the anterior and posterior 15% of the body because of reduced responsiveness to
touches in these regions, possibly due to decreasing body diameter at the two ends of the animal,
which could reduce the stimulus experienced. The rest of the body also varies in width (Fig.
2.S7), so we do not make direct comparisons between different location bins.
WT animals responded to anterior touch with movement in the reverse direction (negative
mean velocity) and to posterior touch with movement in the forward direction (positive mean
velocity) (Fig. 2.4A). Touch near the center of the worm induced either forward or reverse
movement with roughly equal probability (mean velocity close to zero). Variation in response
35
direction decreased for touches close to either end of the animal. These results are consistent
with C. elegans behavior on agar plates and show that worms’ normal mechanosensory
behaviors are retained in our microfluidic device.
Like WT animals, egl-5 mutants responded to anterior touch with movement in the
reverse direction (Fig. 2.4B). However, egl-5 worms also responded to mid-body and mid-
posterior touch by reversing, reflecting the absence of posterior TRN function. Responses after
mid-body and mid-posterior touch were weaker than that of anterior touch, and, in the most
posterior bin, responses were no longer statistically significantly different from zero (p = 0.49,
one-sided z-test). mec-4 worms lacking all TRN function did not respond to touch at this location
with reversals (Fig. 2.S8), showing that egl-5 reversals in response to posterior touch are
mediated by the anterior TRNs.
Our results show that the anterior gentle TRNs, in addition to being sensitive to touch to
the anterior half of the animal, are also sensitive to touch to the posterior of the body. That is, the
receptive fields of one or more of the anterior TRNs extend into the animal’s posterior half. This
result suggests that TRNs respond to both local and global touch deformation (Petzold et al.,
2013) through mechanical coupling.
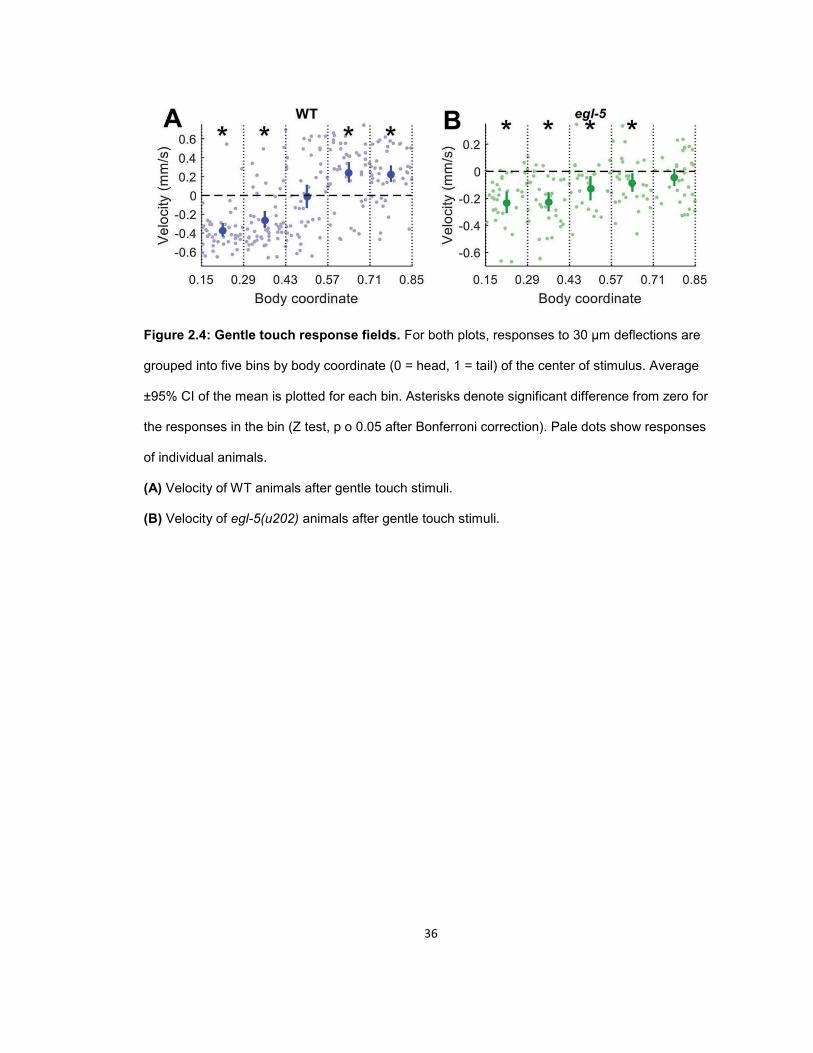
36
Figure 2.4: Gentle touch response fields. For both plots, responses to 30 μm deflections are
grouped into five bins by body coordinate (0 = head, 1 = tail) of the center of stimulus. Average
±95% CI of the mean is plotted for each bin. Asterisks denote significant difference from zero for
the responses in the bin (Z test, p o 0.05 after Bonferroni correction). Pale dots show responses
of individual animals.
(A) Velocity of WT animals after gentle touch stimuli.
(B) Velocity of egl-5(u202) animals after gentle touch stimuli.

37
Influence of previous locomotory direction on touch response
Because the anterior and posterior TRNs influence the motor behavior in an opposing
manner, the behavioral response after a touch at or near the middle of the body represents a
decision between two conflicting inputs. We examined factors influencing the behavioral response
to mid-body touch.
One such potential factor is the worm’s direction of movement prior to the stimulus. It is
not clear to what extent the worm’s locomotory behavior before the stimulus influences the
behavior after the stimulus. One possibility is that a mechanosensory stimulus induces a certain
change in velocity independent of the original velocity, such that the final (after stimulus) velocity
is linearly related to the initial velocity with unity slope. A second possibility is that the final
velocity is unrelated to the initial velocity. A third, intermediate, possibility is that the final velocity
depends on the initial velocity, but with slope less than 1.
To determine the relationship between the velocities before and after each stimulus, we
delivered gentle touch stimuli with 30 μm deflection amplitude to WT animals (Fig. 2.5A). Here
and elsewhere, we used 30 μm and 50 μm for experiments requiring repeated stimulus of N2
and WT animals, respectively, because these stimuli elicited responses reliably. We found that
the velocity prior to stimulus had very little influence on the velocity after stimulus. The initial
velocity could explain only 4.1% of the variance in the final velocity, while the position of stimulus
could explain 32% of the variance in the final velocity. Furthermore, when we grouped responses
according to whether the touch stimulus occurred in the anterior, middle, or posterior third of the
body (roughly the regions covered by the anterior TRNs, all TRNs, and posterior TRNs) and then
compared responses when the worm was initially moving forward to responses when the worm
was initially moving backward, we did not find a significant difference in velocity after stimulus (p
= 0.32, 0.72, and 0.19 for anterior, middle, and posterior touches, respectively, two-tailed t-test).
We also performed the same experiment for harsh touch, using a 50 mm stimulus on mec-4
animals, and found similar results (Fig. 2.5B).
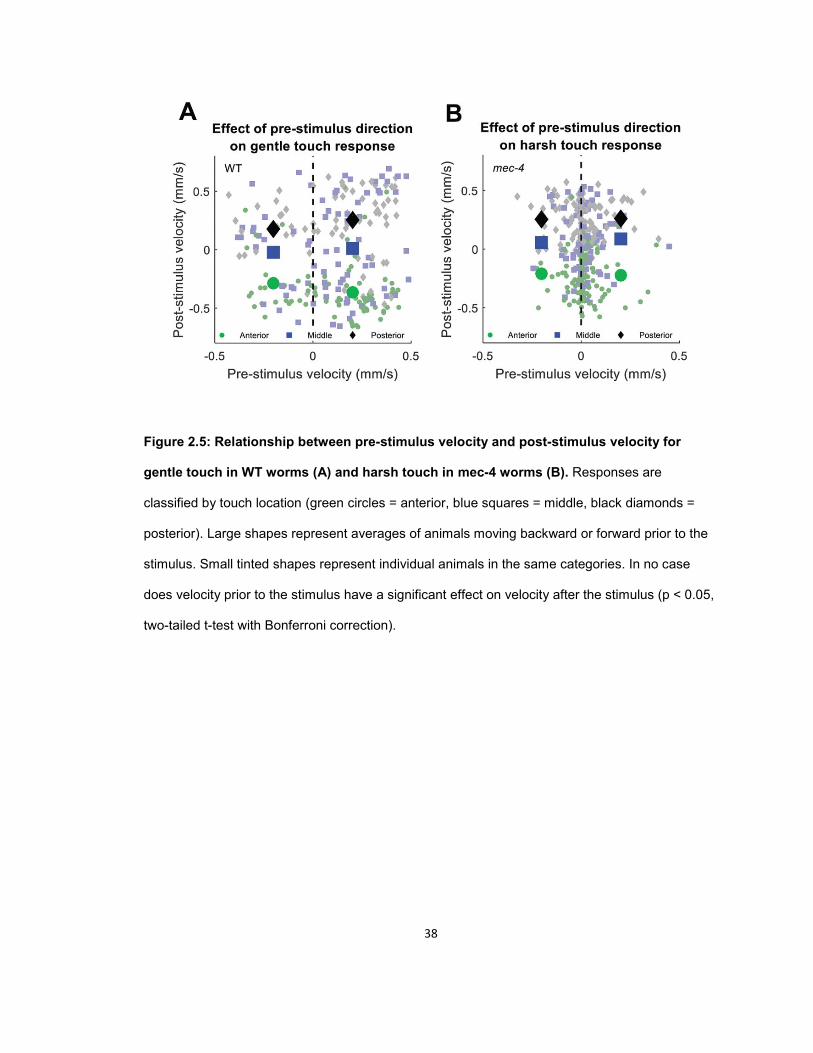
38
Figure 2.5: Relationship between pre-stimulus velocity and post-stimulus velocity for
gentle touch in WT worms (A) and harsh touch in mec-4 worms (B). Responses are
classified by touch location (green circles = anterior, blue squares = middle, black diamonds =
posterior). Large shapes represent averages of animals moving backward or forward prior to the
stimulus. Small tinted shapes represent individual animals in the same categories. In no case
does velocity prior to the stimulus have a significant effect on velocity after the stimulus (p < 0.05,
two-tailed t-test with Bonferroni correction).
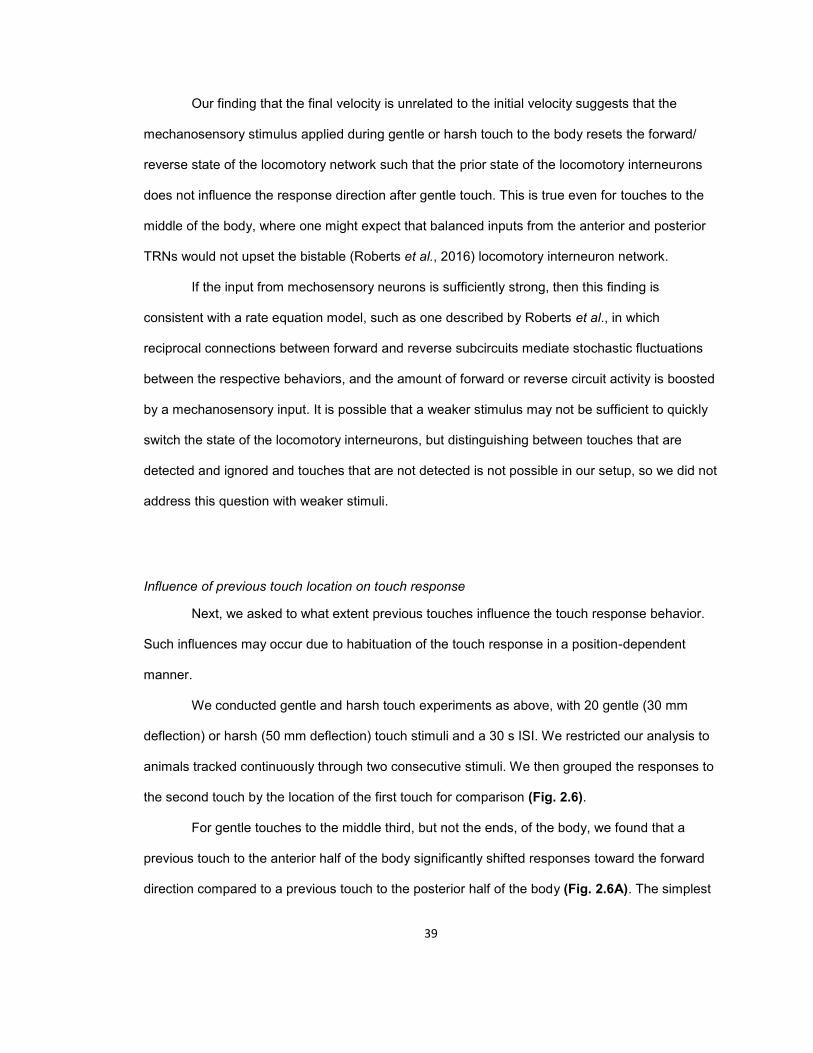
39
Our finding that the final velocity is unrelated to the initial velocity suggests that the
mechanosensory stimulus applied during gentle or harsh touch to the body resets the forward/
reverse state of the locomotory network such that the prior state of the locomotory interneurons
does not influence the response direction after gentle touch. This is true even for touches to the
middle of the body, where one might expect that balanced inputs from the anterior and posterior
TRNs would not upset the bistable (Roberts et al., 2016) locomotory interneuron network.
If the input from mechosensory neurons is sufficiently strong, then this finding is
consistent with a rate equation model, such as one described by Roberts et al., in which
reciprocal connections between forward and reverse subcircuits mediate stochastic fluctuations
between the respective behaviors, and the amount of forward or reverse circuit activity is boosted
by a mechanosensory input. It is possible that a weaker stimulus may not be sufficient to quickly
switch the state of the locomotory interneurons, but distinguishing between touches that are
detected and ignored and touches that are not detected is not possible in our setup, so we did not
address this question with weaker stimuli.
Influence of previous touch location on touch response
Next, we asked to what extent previous touches influence the touch response behavior.
Such influences may occur due to habituation of the touch response in a position-dependent
manner.
We conducted gentle and harsh touch experiments as above, with 20 gentle (30 mm
deflection) or harsh (50 mm deflection) touch stimuli and a 30 s ISI. We restricted our analysis to
animals tracked continuously through two consecutive stimuli. We then grouped the responses to
the second touch by the location of the first touch for comparison (Fig. 2.6).
For gentle touches to the middle third, but not the ends, of the body, we found that a
previous touch to the anterior half of the body significantly shifted responses toward the forward
direction compared to a previous touch to the posterior half of the body (Fig. 2.6A). The simplest

40
explanation of this result is that an anterior touch causes adaptation in the anterior TRNs,
changing the balance of sensory input from touches to areas where the receptive fields overlap.
In contrast, when this experiment was done in mec-4 mutant animals with stimulus
amplitudes corresponding to harsh touch, we did not observe any effect of previous touch
location on touch response (Fig. 2.6B). This is not due to a lack of a decrement in
responsiveness, as overall responsiveness to harsh touch decreases more rapidly with
subsequent stimuli than for gentle touch (Fig. 2.S1b). Our results suggest that harsh touch
habituation, unlike gentle touch habituation, does not occur in an anterior/posterior-dependent
manner. Our result is consistent with an organism wide rather than local regulation of harsh
touch.
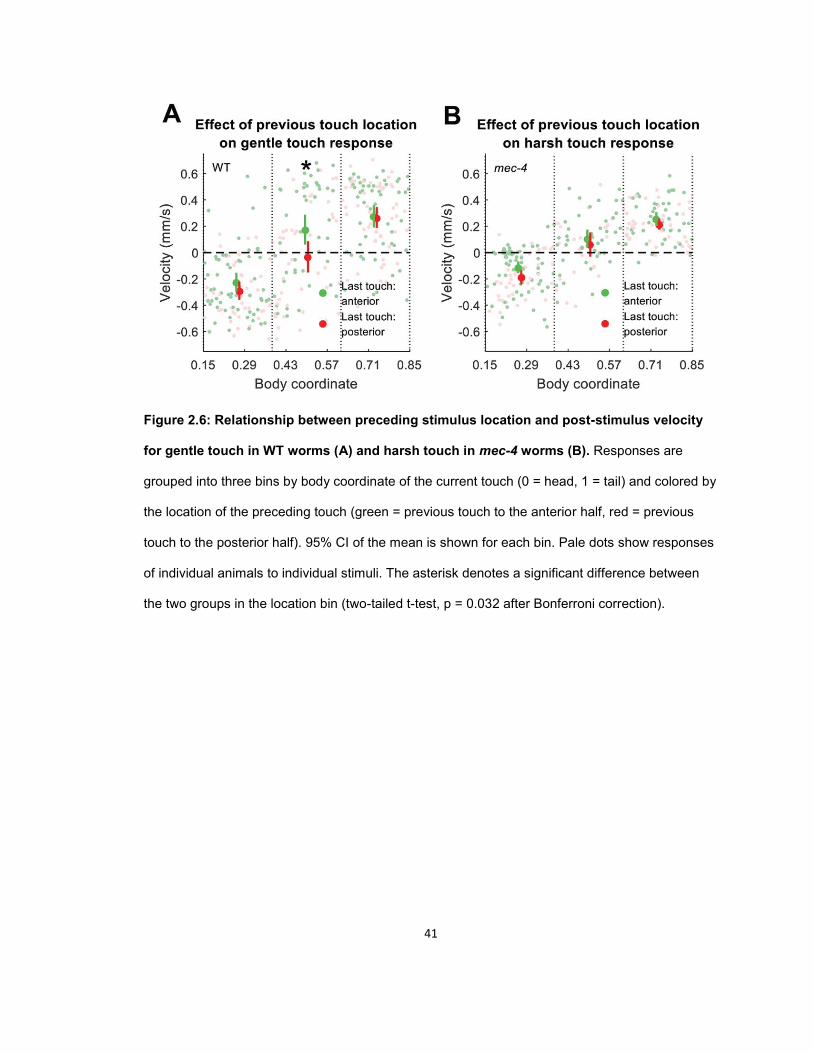
41
Figure 2.6: Relationship between preceding stimulus location and post-stimulus velocity
for gentle touch in WT worms (A) and harsh touch in mec-4 worms (B). Responses are
grouped into three bins by body coordinate of the current touch (0 = head, 1 = tail) and colored by
the location of the preceding touch (green = previous touch to the anterior half, red = previous
touch to the posterior half). 95% CI of the mean is shown for each bin. Pale dots show responses
of individual animals to individual stimuli. The asterisk denotes a significant difference between
the two groups in the location bin (two-tailed t-test, p = 0.032 after Bonferroni correction).

42
CONCLUSIONS
We have presented a microfluidic-based method for delivering continuously variable,
localized touch stimuli to many freely behaving C. elegans. First, we measured the relative
response thresholds of gentle (mec-4 dependent) and harsh (mec-4 independent) touch,
establishing our ability to test both modes of touch with a single assay. This ability, combined with
the amenability of microfluidics to the administration of chemical, pharmacological, and optical
stimuli, opens the door to studies of the relationship between touch and nociception in C.
elegans.
Using the ability of our device to provide localized stimuli to many animals
simultaneously, we mapped the position-dependent behavioral responses of WT animals and
mutants lacking function in some or all of the TRNs. By comparing these responses, we showed
that the mutants respond to posterior touch by reversing, showing that the behavioral receptive
field of the anterior touch receptor neurons extends into the posterior half of the body. This
sensitivity to nonlocal deformations may occur via biomechanical coupling of induced strain
through the worm’s body (Eastwood et al., 2016). Together, these experiments demonstrate the
utility of our methods for studying how touch response thresholds vary, how they adapt to
repeated stimuli, and the extension of a neuron’s receptive field by body mechanics.
Finally, we used our assay to ask what determines the behavioral decision of a worm
subject to local touch stimulus. We found that there is little to no influence of the pre-stimulus
velocity on the response velocity for either gentle or harsh touch stimuli. This result supports a
model in which the mechanosensory stimulus resets the locomotory network state.
We found a significant effect of the location of the previous gentle touch on responses to
gentle touches to the middle of the body, suggesting that touch sensitivity is locally regulated in
response to a localized touch. This result is consistent with previous studies showing that the
anterior and posterior gentle touch circuits can be modulated independently (Wicks and Rankin,
1995; Suzuki et al., 2003; Chen and Chalfie, 2014). However, no such location-dependent
sensitivity to previous touch was observed for harsh touch. This difference may reflect the whole-

43
body innervation of some of the harsh touch mechanosensory neurons, as compared to the
anterior and posterior specific innervation of the TRNs mediating gentle touch.
Our findings open new possibilities in generating and testing quantitative models of the
touch response and the coupling between the mechanosensory and the locomotory networks.
ACKNOWLEDGEMENTS
We thank David Issadore for technical support and equipment and Martin Chalfie for
strains. Some strains used in this study were provided by the CGC, which is funded by the NIH
Office of Research Infrastructure Programs (P40 OD010440). P. D. M. was supported by the
National Institutes of Health. J. H. X. was supported by the Center for Undergraduate Research
and Fellowships. C. F.-Y. was supported by the National Institutes of Health, Ellison Medical
Foundation, and Sloan Research Foundation.

44
SUPPLEMENTAL MATERIAL
Figure 2.S1: Photomask for the worm layer (DWG file)

45
Figure 2.S2: Photomask for the control layer (DWG file)
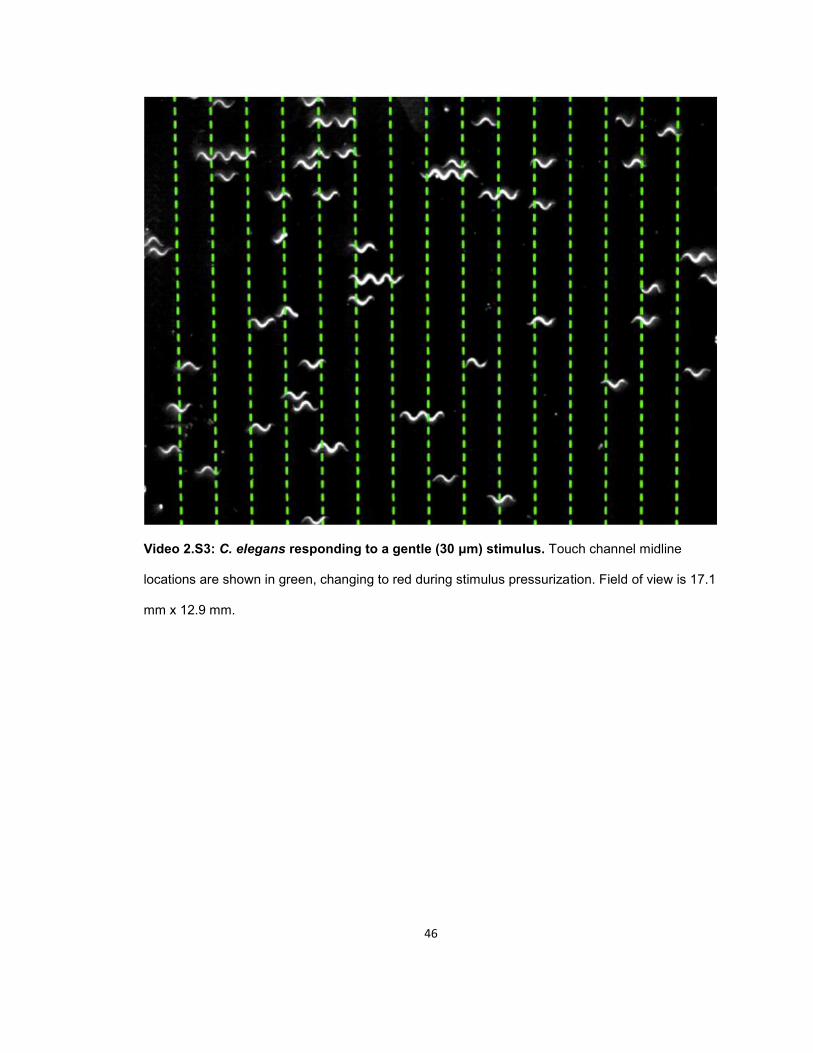
46
Video 2.S3: C. elegans responding to a gentle (30 μm) stimulus. Touch channel midline
locations are shown in green, changing to red during stimulus pressurization. Field of view is 17.1
mm x 12.9 mm.

47
Video 2.S4: Detail of device showing C. elegans executing a 180 degree turn in a
microfluidic channel. Field of view is 2.5 mm x 1.2 mm.
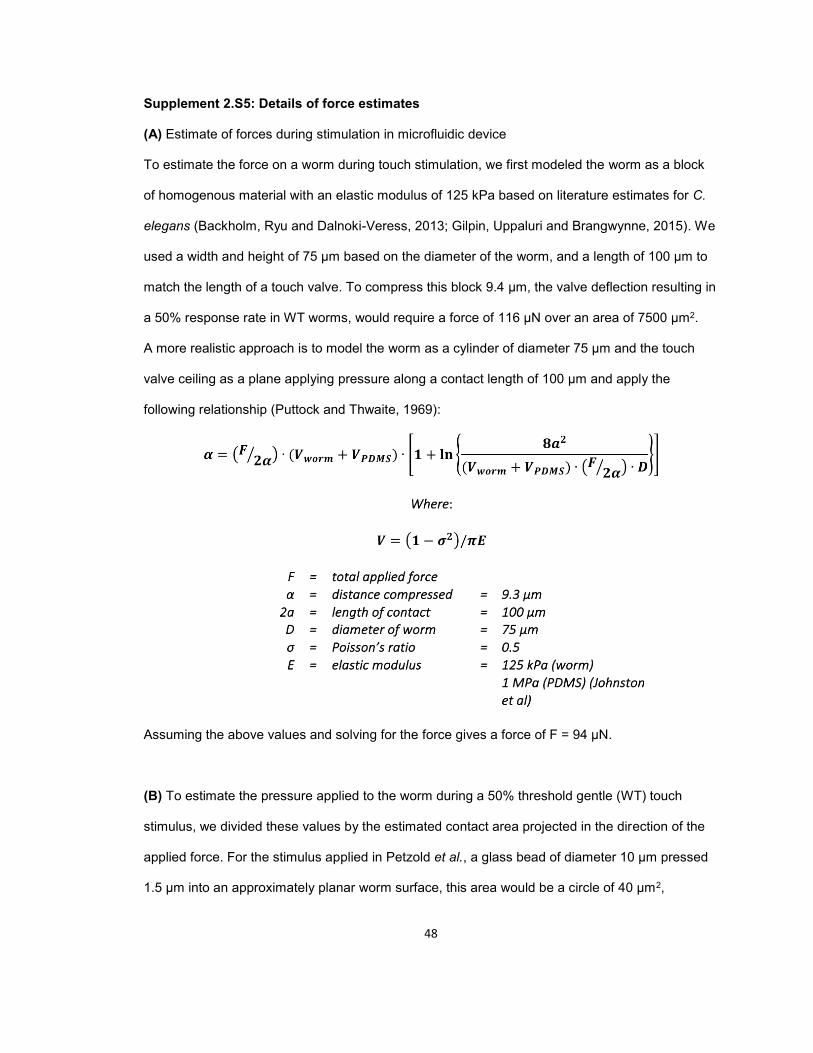
48
Supplement 2.S5: Details of force estimates
(A) Estimate of forces during stimulation in microfluidic device
To estimate the force on a worm during touch stimulation, we first modeled the worm as a block
of homogenous material with an elastic modulus of 125 kPa based on literature estimates for C.
elegans (Backholm, Ryu and Dalnoki-Veress, 2013; Gilpin, Uppaluri and Brangwynne, 2015). We
used a width and height of 75 μm based on the diameter of the worm, and a length of 100 μm to
match the length of a touch valve. To compress this block 9.4 μm, the valve deflection resulting in
a 50% response rate in WT worms, would require a force of 116 μN over an area of 7500 μm2.
A more realistic approach is to model the worm as a cylinder of diameter 75 μm and the touch
valve ceiling as a plane applying pressure along a contact length of 100 μm and apply the
following relationship (Puttock and Thwaite, 1969):
Assuming the above values and solving for the force gives a force of F = 94 μN.
(B) To estimate the pressure applied to the worm during a 50% threshold gentle (WT) touch
stimulus, we divided these values by the estimated contact area projected in the direction of the
applied force. For the stimulus applied in Petzold et al., a glass bead of diameter 10 μm pressed
1.5 μm into an approximately planar worm surface, this area would be a circle of 40 μm2,

49
resulting in a pressure of 18.7 kPa. For our device, we assumed a force of 94 μN over a
rectangular contact area of 49 μm x 100 μm, which would result from flattening of 75 μm wide
cylindrical worm by 9.3 μm, resulting in a pressure of 19.0 kPa.

50
Figure 2.S6: Velocity after repeated gentle (A) and harsh (B) touch stimulation. Average
absolute value velocity ±SE of WT, egl-5(u202), and mec-4(u253) animals subjected to repeated
gentle touch stimuli are binned into groups of five consecutive stimuli. The number of animals
scored is shown for each point. Velocity changes are significantly higher than baseline, and the
first five stimuli are not significantly different from the last five for gentle touch, but are for harsh
touch. (Wilcoxon rank sum test, α = 0.05)

51
Figure 2.S7: Width as a function of body coordinate for synchronized N2 day 1 adult
animals, measured by analyzing micrographs of 10 individual worms. Measurements within
each 5% of body length are binned together. Mean ± SD is shown.

52
Figure 2.S8: Gentle touch response field of mec-4 mutants. Analysis and representation are
as in Fig. 4.

53
CHAPTER 3: ALA / RIS-dependent, neuropeptide-mediated
quiescence follows mild sensory arousal during a Caenorhabditis elegans stress state
Patrick D. McClanahan, Jessica M. Dubuque, Daphne Kontogiorgos-Heintz, Ben Habermeyer, Joyce H. Xu, Anthony Ma, David M. Raizen, Christopher Fang-Yen This chapter is a slightly modified manuscript in preparation I performed experiments and wrote the manuscript, JD, DKH, BH, JHX, and AM performed
experiments, DMR provided scientific guidance, and CFY supervised the project and edited the
manuscript.
ABSTRACT
In response to threats, animals display quiescent behaviors such as freezing and tonic
immobility. How these behaviors are modulated by neuromodulatory states like stress is not well
understood. Here we describe a Caenorhabditis elegans quiescent behavior, post-response
quiescence (PRQ), which is modulated by the C. elegans response to cellular stressors.
Following an aversive mechanical or light stimulus, worms respond first by briefly moving, and
then become more quiescent for about ~45 seconds. PRQ occurs at low frequency in unstressed
animals but is frequent in animals that have experienced cellular stress due to ultraviolet light
exposure as well as in animals following overexpression of epidermal growth factor (EGF). PRQ
requires the function of the carboxypeptidase EGL-21 and the calcium-activated protein for
secretion (CAPS) UNC-31, suggesting a neuropeptidergic mechanism for PRQ. Although PRQ
requires the sleep-promoting neurons RIS and ALA, PRQ is not accompanied by decreased
arousability, and is not homeostatically regulated, suggesting that it is not a sleep state. PRQ
represents a simple, tractable model for studying how neuromodulatory states alter behavioral
responses to stimuli.

54
INTRODUCTION
Quiescent animal behaviors encompass low-vigilance states like sleep (Kleitman, 1929)
and hibernation (Heller, 1979), but also include high-vigilance states that play important roles in
the threat response (Bracha, 2004; Roelofs, 2017). The mammalian response to predatory threat
includes four behaviors: freeze, flight, fight, and tonic immobility (Ratner, 1967). Animals freeze
upon detecting a relatively distant threat in order to reduce conspicuousness while preparing for
the next two stages: flight or fight (Roelofs, 2017). Flight and fight (Cannon, 1916) are active
behaviors occurring at intermediate and close range. Tonic immobility typically occurs once a
prey animal is very near to or in the grip of a predator. Tonically immobile animals may appear
dead, but are in fact alert and able to escape if the predator becomes distracted or lets go
(Sargeant and Eberhardt, 1975). Therefore, freezing and tonic immobility are quiescent behaviors
with high vigilance.
The regulation of freezing and tonic immobility is intertwined with animals’ physiological
response to stress. In mammals, acute threats and stressors precipitate the release of
epinephrine (adrenaline) and norepinephrine (noradrenaline), increasing muscle tone and cardiac
output to prepare for fight or flight (Roelofs, 2017). This sympathetic nervous system activation is
also the first phase of the general stress response, or general adaptation syndrome (Selye,
1951). The transient alarm phase is followed by a much longer resistance phase (Selye, 1936) in
which glucocorticoids like cortisone are elevated. These hormones have many functions,
including mobilizing energy stores, and they upregulate both freezing (Roelofs, 2017) and tonic
immobility (Koolhaas et al., 1999). The resistance phase typically ends with either exhaustion or
removal of the stressor, but upregulation of threat responses following stress can persist as
observed in psychological disorders including Posttraumatic Stress Disorder (Rau, DeCola and
Fanselow, 2005). Despite significant public health implications, our understanding of the
regulation of threat response behavior by stress remains quite limited (Perusini and Fanselow,
2015).
The study of genetically tractable models can increase our understanding of the

55
regulation of behavior. Like mammals, the nematode Caenorhabditis elegans has a stereotypical
response to stressors. Following exposure to a stressor like heat or UV radiation, the worm
exhibits a period of quiescence (Van Buskirk and Sternberg, 2007) that aids survival (Hill et al.,
2014; Fry et al., 2016; Konietzka et al., 2019). This quiescence is partly mediated by the ALA
neuron, which can be activated by the EGF homologue LIN-3, releasing a cocktail of
neuropeptides, including those encoded by flp-13 (Nelson et al., 2014; Nath et al., 2016). This
recovery quiescence is associated with reduced responsiveness to some stimuli (Cho and
Sternberg, 2014; Hill et al., 2014), but the quiescence can be rapidly reversed by a sufficiently
strong stimulus (Hill et al., 2014). Quiescence after stress is therefore thought to be similar to
recovery sleep or quiescence following illness or injury in other animals and is referred to as
stress-induced sleep (SIS). In mammals, EGF is known to upregulate sleep (Kushikata et al.,
1998; Kramer et al., 2001) and is released following stress (Konturek et al., 1991), suggesting a
conserved role in animal stress response regulation.
Like its stress response, the C. elegans acute escape behavior following threatening
stimuli has been extensively characterized. Six touch-receptor neurons sense mechanical stimuli,
allowing the animal to quickly accelerate forward or backward away from the stimulus (Chalfie
and Sulston, 1981; Chalfie et al., 1985). Similar behavioral responses occur following aversive
chemical (Bargmann, Thomas and Horvitz, 1990), thermal (Wittenburg and Baumeister, 1999), or
osmotic (Culotti and Russell, 1978) stimuli. Tyramine and octopamine function analogously to
epinephrine and norepinephrine in the invertebrate fight or flight response (Roeder et al., 2003;
Alkema et al., 2005), and the locomotor escape response is accompanied by a tyramine-
dependent (Alkema et al., 2005) inhibition of exploratory side to side head movements (Chalfie
and Sulston, 1981). Mutations that decrease touch sensitivity or head movement suppression
increase the worm’s susceptibility to predation by trap-forming Drechslerella doedycoides fungi
(Maguire et al., 2011). However, little is known about how stress affects C. elegans escape
behavior, and behaviors resembling freezing or tonic immobility have not been described.
Here we describe a freezing behavior following locomotor escape behavior after mild
56
aversive stimuli. We show that this behavior, which we call post response quiescence (PRQ), is
enhanced following the EGF-mediated cellular stress response. We show that some of the genes
and neurons required for SIS are also required for PRQ. Like SIS, PRQ requires genes involved
in the processing and secretion of neuropeptides, and the sleep active interneurons RIS and ALA.
Despite its genetic and anatomical overlap with C. elegans sleep states, PRQ lacks two of the
behavioral characteristics of sleep – decreased arousability and homeostatic regulation –
suggesting that it is distinct type of quiescence. The occurrence of PRQ during an escape
response and its upregulation by the stress response pathway suggest a role in predator evasion
similar to freezing behavior in mammals.
RESULTS
Quiescence increases after mechanosensory response during UV stress-induced sleep
We asked how cellular stress affects the C. elegans behavioral response to aversive
mechanical stimuli. We induced SIS by exposing young adult wild-type (WT) animals to UV
radiation (DeBardeleben et al., 2017). At the intensity of UV irradiation used, the animals became
sterile and died in less than one week (Fig. 3.S1), suggesting that they sustain considerable
damage (DeBardeleben et al., 2017).To track behavior, we imaged worms isolated in wells of a
multi-well device (WorMotel) (Churgin et al., 2017) and used frame subtraction (Raizen et al.,
2008) to measure behavioral activity and quiescence (see Methods). Consistent with previous
reports (DeBardeleben et al., 2017), quiescence peaked 1 – 2 hours following UV-C exposure
and decreased over the next 5 hours (Fig. 3.1a). Notably, even at the time of peak quiescence,
the fraction of time spend quiescent was only about 70%, allowing for the detection of both
increases and decreases in quiescent behavior.

57
Figure 3.1: Mechanosensory stimulus during UV SIS elicits post response quiescence.
(A) (top) Average quiescence after 1000 J/m2 UV (blue), and non-exposed (black) WT animals in
the absence of stimuli. Dots represent individual animals. 1 or 2 hour bins, n = 15 per condition,
four replicates. ** denotes p < 0.01 comparing UV-treated to controls (Wilcoxon rank-sum test
with Bonferroni correction for five comparisons) (bottom) Quantification of PRQ. Change in
quiescence is the peak quiescence within two minutes after mechanostimulus minus the peak
quiescence within two minutes before mechanostimulus in the time period specified. Typically
four or eight traces averaged per animal and smoothed with a 10 s averaging filter. n = 22
animals per condition, two replicates. ** denotes p < 0.01, * denotes p < 0.05 (one sample t-test
with Bonferroni correction for five comparisons)
58
(B) Mechanosensory response during UV SIS normalized to non-UV controls. Response is the
average activity from the five seconds after the stimulus minus the average activity in the minute
before the stimulus. The data are from the same animals as panel a (bottom). ** denotes
significance (Wilcoxon rank-sum test with α = 0.01 and Bonferroni correction for five
comparisons).
(C) Fraction quiescent before and after stimulus (dashed red line) 0-1 h,1-2 h, 2-4 h, 4-6 h, and 6-
8 h (blue) after UV treatment and in non-UV controls averaged throughout the experiment (black).
Data are from the same animals as panel a (bottom) and panel b.
(D) Schematic of post-response quiescence: (1) following stimulus, (2) the animal responds by
moving, and (3) subsequently becomes quiescent.
59
To deliver mechanical stimuli to worms in the WorMotel, we placed the WorMotel housing
the animals on top of an audio loudspeaker, which we programmed to produce 1 s long, 1 kHz
vibrations every 15 minutes. Substrate vibrations elicit a mechanosensory response mediated by
the gentle touch receptors (Brenner, 1974; Rankin, Beck and Chiba, 1990). Both chemosensory
and photosensory responsiveness are known to decrease during SIS (Hill et al., 2014;
DeBardeleben et al., 2017), and mechanosensory arousability decreases in another C. elegans
sleep state, developmental lethargus (Schwarz, Lewandrowski and Bringmann, 2011). Consistent
with decreased overall sensory arousability, mechanosensory responses decreased during SIS
relative to controls, displaying a minimum at the time of peak quiescence (Fig. 3.1b).
Despite a decrease in activity, most worms usually showed some movement response to
the mechanical stimulus during SIS. We noticed that UV-treated worms sometimes froze for a
short period (tens of seconds) following their brief locomotor response (Vid. 3.S1). Control
animals, which had not been exposed to UV light, rarely displayed this freezing behavior, instead
displaying a normal mechanosensory response (Vid. 3.S2).
To quantify this freezing behavior, we compared the fraction of animals quiescent before
and after the stimulus. Starting two hours after UV exposure, the fraction quiescent after the
mechanical stimulus was higher than the fraction quiescent before the mechanical stimulus. The
post-stimulus quiescence peaked at about 15 seconds after the stimulus, and then decreased to
baseline over approximately the next minute. Non-irradiated control animals showed only a slight,
non-significant increase in quiescence after the stimulus (Fig. 3.1a,c). We refer to this behavior, a
cessation of body movement following a mechanosensory response, as post-response
quiescence (PRQ) (Fig. 3.1d).
To quantify PRQ, we calculated the difference between the maximum average
quiescence in the two minutes before and after the stimulus for each animal during each post-UV
time interval. PRQ occurred after the time of deepest SIS, becoming statistically significant in the
2-4, 4-6, and 6-8 hour periods. We did not find a significant increase in quiescence in the first and
second hours after UV exposure, or in control animals at any time (Fig. 3.1a), although we

60
occasionally observed similar behavior in untreated controls (Vid. 3.S3). To ascertain whether
PRQ requires the function of the touch receptor neurons, we performed the experiment in mec-4
mutants, which are defective in the behavioral response to vibration (Chalfie and Sulston, 1981;
Rankin, Beck and Chiba, 1990) (Fig. 3.S2). As expected, mec-4 mutants had neither a movement
response nor a PRQ response to the vibration. This result indicates that PRQ occurs downstream
of activation of the touch receptor neurons and possibly the brief escape response that they
mediate.
Together, these results suggest that UV stress affects mechanosensory response
behavior in two ways. First, the overall locomotor activity following the stimulus is reduced,
consistent with low arousability during SIS. Second, the animals freeze after initiation of an
otherwise normal mechanosensory response, and before returning to baseline quiescence levels.
Post response quiescence is enhanced following LIN-3C / EGF overexpression
SIS caused by UV and other stressors occurs following activation of the ALA neuron,
likely by the EGF homologue LIN-3 (Van Buskirk and Sternberg, 2007; Hill et al., 2014). We
therefore asked whether PRQ is regulated downstream of EGF, or is part of an EGF-independent
UV stress response. To address this question, we induced overexpression of EGF by heating
(33°C for 10 min) animals carrying a lin-3c transgene under the control of a heat shock promoter.
LIN-3 overexpression caused an overall increase in quiescence and decrease in arousability with
dynamics similar to UV SIS (Van Buskirk and Sternberg, 2007; DeBardeleben et al., 2017) (Fig.
3.2a,b). We then used our mechanosensory stimulus protocol to study the mechanosensory
response.
We found that PRQ occurs following EGF overexpression-induced quiescence, similar to
the PRQ we observed after UV exposure. This result is consistent with PRQ being upregulated
downstream of EGF during SIS. Interestingly, PRQ, measured as the increase in fraction
quiescent following stimulus, is greater after EGF overexpression than after UV exposure (0.25 ±
61
0.07 in hours 4.5-7 after EGF overexpression vs. 0.12 ± 0.06 in hours 4-6 after UV-C exposure)
(Fig. 3.1a,3.2a).
Post response quiescence is not enhanced following a variety of other cellular stressors
In addition to UV radiation, exposure to ethanol, high salt, Cry5b pore-forming toxin, heat
shock, and cold shock have been reported to induce SIS (Hill et al., 2014). To test whether these
stressors also promote PRQ, we assessed quiescence changes following vibration in animals
exposed to these stressors. We compared the behavioral response to control animals that were
housed on the same WorMotel chip (see Methods). Consistent with previous reports (Hill et al.,
2014), we observed an increase in quiescence in animals exposed to these stressors (Fig. 3.S3).
However, we found to our surprise that in no case was PRQ significantly higher in SIS animals
than in controls that had not been exposed to the stressors (Fig. 3.3). These results suggest that
PRQ is enhanced by EGF signaling and by UV exposure, but not following a variety of cellular
stressors that also cause SIS.
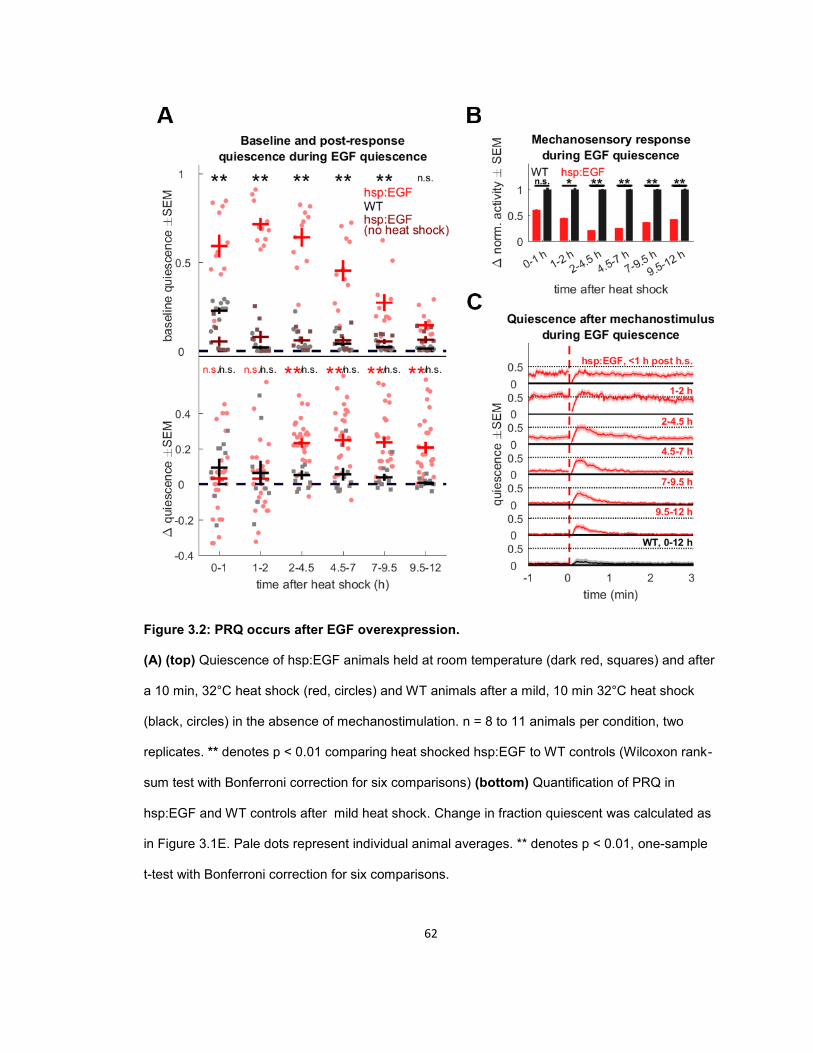
62
Figure 3.2: PRQ occurs after EGF overexpression.
(A) (top) Quiescence of hsp:EGF animals held at room temperature (dark red, squares) and after
a 10 min, 32°C heat shock (red, circles) and WT animals after a mild, 10 min 32°C heat shock
(black, circles) in the absence of mechanostimulation. n = 8 to 11 animals per condition, two
replicates. ** denotes p < 0.01 comparing heat shocked hsp:EGF to WT controls (Wilcoxon rank-
sum test with Bonferroni correction for six comparisons) (bottom) Quantification of PRQ in
hsp:EGF and WT controls after mild heat shock. Change in fraction quiescent was calculated as
in Figure 3.1E. Pale dots represent individual animal averages. ** denotes p < 0.01, one-sample
t-test with Bonferroni correction for six comparisons.
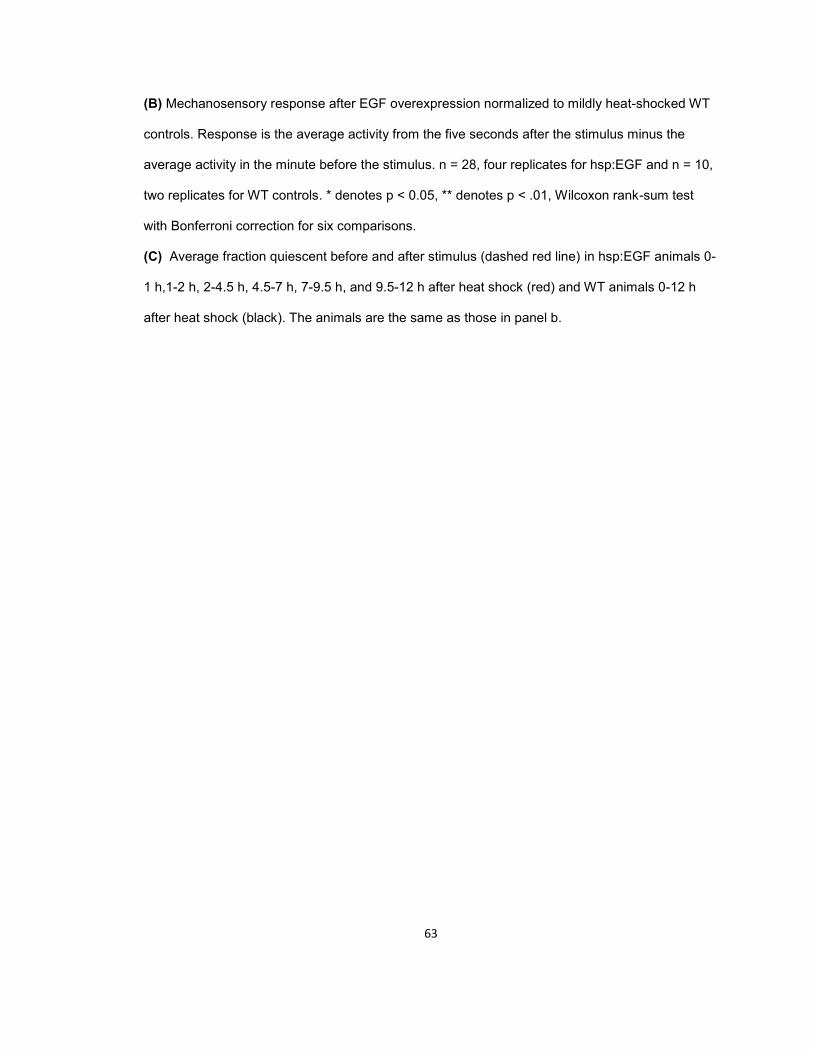
63
(B) Mechanosensory response after EGF overexpression normalized to mildly heat-shocked WT
controls. Response is the average activity from the five seconds after the stimulus minus the
average activity in the minute before the stimulus. n = 28, four replicates for hsp:EGF and n = 10,
two replicates for WT controls. * denotes p < 0.05, ** denotes p < .01, Wilcoxon rank-sum test
with Bonferroni correction for six comparisons.
(C)_Average fraction quiescent before and after stimulus (dashed red line) in hsp:EGF animals 0-
1 h,1-2 h, 2-4.5 h, 4.5-7 h, 7-9.5 h, and 9.5-12 h after heat shock (red) and WT animals 0-12 h
after heat shock (black). The animals are the same as those in panel b.
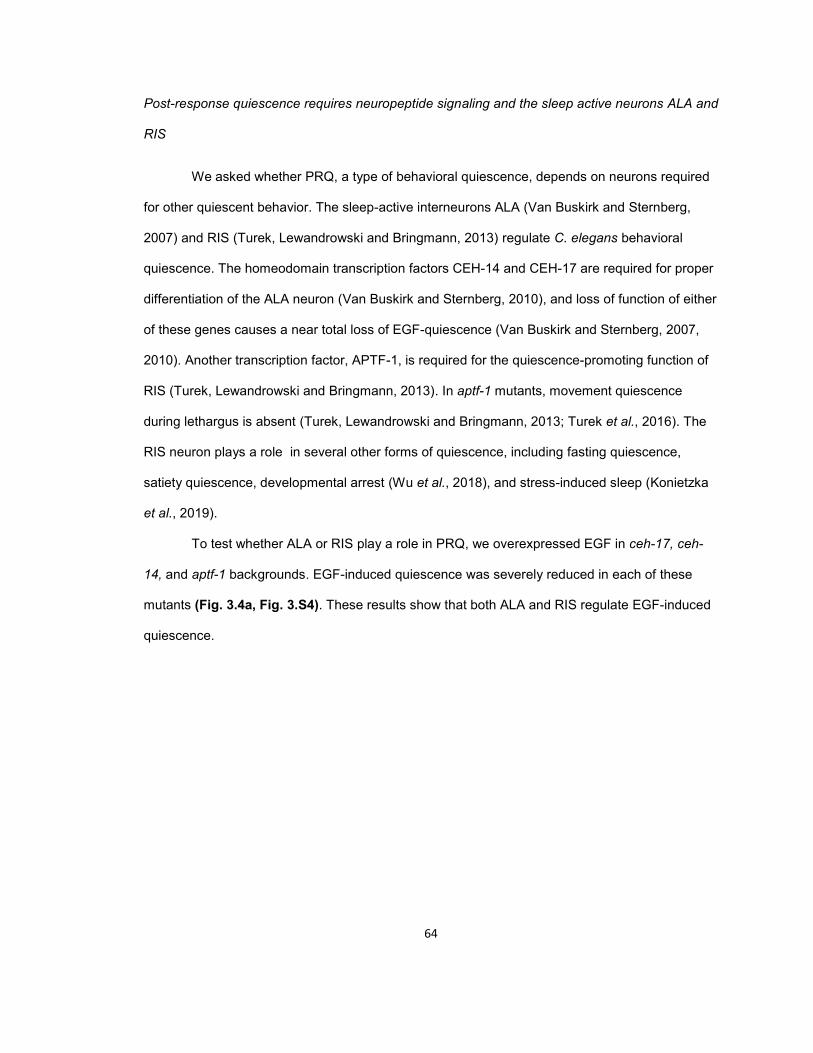
64
Post-response quiescence requires neuropeptide signaling and the sleep active neurons ALA and
RIS
We asked whether PRQ, a type of behavioral quiescence, depends on neurons required
for other quiescent behavior. The sleep-active interneurons ALA (Van Buskirk and Sternberg,
2007) and RIS (Turek, Lewandrowski and Bringmann, 2013) regulate C. elegans behavioral
quiescence. The homeodomain transcription factors CEH-14 and CEH-17 are required for proper
differentiation of the ALA neuron (Van Buskirk and Sternberg, 2010), and loss of function of either
of these genes causes a near total loss of EGF-quiescence (Van Buskirk and Sternberg, 2007,
2010). Another transcription factor, APTF-1, is required for the quiescence-promoting function of
RIS (Turek, Lewandrowski and Bringmann, 2013). In aptf-1 mutants, movement quiescence
during lethargus is absent (Turek, Lewandrowski and Bringmann, 2013; Turek et al., 2016). The
RIS neuron plays a role in several other forms of quiescence, including fasting quiescence,
satiety quiescence, developmental arrest (Wu et al., 2018), and stress-induced sleep (Konietzka
et al., 2019).
To test whether ALA or RIS play a role in PRQ, we overexpressed EGF in ceh-17, ceh-
14, and aptf-1 backgrounds. EGF-induced quiescence was severely reduced in each of these
mutants (Fig. 3.4a, Fig. 3.S4). These results show that both ALA and RIS regulate EGF-induced
quiescence.

65
Figure 3.3: PRQ is not observed in ethanol, high salt, cry5b toxin, heat, and cold – induced
SIS.
PRQ following mechanostimulus after various stressors compared to positive (EGF
overexpressing, red) and negative controls. (left) Comparison of PRQ after 15 min immersion in
5% ethanol by volume (purple) or +500 mM NaCl in NGMB (yellow) and EGF overexpression
(black) to NGMB-immersed controls (gray). (middle) Comparison of PRQ in animals after 15 min
exposure to Cry5b-expressing bacteria (green) and empty-vector bacteria-exposed animals
(gray). (right) Comparison of PRQ after 30 min, 36°C heat shock (orange) or 24 h, 4°C cold
shock (blue) to room temperature controls (gray). Circles are individual animal averages from
throughout the experiment (12 h). ** denotes p < 0.01 after Bonferroni correction for three
(liquids, left, temperature, right) or two (bacteria toxin, middle) comparisons.
66
Figure 3.4: The ALA and RIS neurons and neuropeptide signaling are required for PRQ.
(A) Average quiescence of WT (black) and apft-1 (red) and ceh-17 (blue) mutant animals
following EGF overexpression in the absence of additional stimuli (quiescence averaged in 1 h
bins, n = 8 animals per genotype, one replicate).
(B) Fraction quiescent before and after mechanostimulus (dashed red line) in WT (black), aptf-1
(red), and ceh-17 (blue), background animals carrying the hsp:EGF array 2-12 h after mild heat
shock. n = 16 animals per genotype, two replicates.
(C) (left) Quantification of PRQ in WT and aptf-1 and ceh-17 mutants in panel b and (right) ceh-
14, egl-21, and unc-31 mutants. Dots represent individual animals. ** denotes p < 0.01 (one
sample t-test with Bonferroni correction for three comparisons, left, one sample t-test, no
correction, right).

67
Following mechanical stimulus, neither mutant showed an increase in quiescence,
suggesting that both ALA and RIS are required for PRQ. However, we observed a difference in
the behavior of these mutants: ceh-17 and ceh-14 mutant animals showed a brief recovery of
quiescence to baseline levels within the first minute after the mechanical stimulus, but this was
followed by several minutes of reduced quiescence (Fig. 3.4c, Fig. 3.S4b). In contrast, aptf-1
mutants responded to the vibration by briefly moving and then monotonically returning to baseline
quiescence levels over the course of several minutes (Fig. 3.4b). As a result, aptf-1 mutants had
a decrease in peak quiescence in the two minutes following stimulus (Fig. 3.4c).
ALA and RIS regulate sleep and quiescent behavior through the release of sleep-
promoting neuropeptides, including those encoded by flp-13 (Nelson et al., 2014) and flp-11
(Turek et al., 2016), respectively. Another interneuron, RIA, promotes quiescence through the
release of neuropeptide NLP-22 (Nelson et al., 2013). We therefore asked whether PRQ is also
regulated by neuropeptide signaling. EGL-21 is a carboxypeptidase (Jacob and Kaplan, 2003)
required for the processing of members of both the FMRF-amide-like (FLP) and neuropeptide-like
(NLP) neuropeptide families, and UNC-31 is the C. elegans homologue of the calcium-dependent
activator protein for secretion (CAPS), which is required for dense core vesicle release (Sieburth
et al., 2005). To test whether neuropeptide signaling regulates PRQ, we studied animals
overexpressing EGF in egl-21 and in unc-31 mutant backgrounds.
egl-21 and unc-31 mutants showed reduced EGF-induced quiescence compared to
control animals overexpressing EGF in a wild-type background (Fig. 3.S4). Following substrate
vibrations, the quiescence of egl-21 mutants was below baseline levels for several minutes,
similar to aptf-1 mutants. However, unc-31 animals, while also lacking PRQ, quickly returned to
baseline quiescence levels (Fig. 3.S4b). Because unc-31 animals are sluggish (Avery, Bargmann
and Horvitz, 1993) and have reduced touch sensitivity (M. Chalfie, personal communication), we
asked if a reduced movement response to mechanical stimuli might explain their lack of PRQ. To
address this question, we restricted our comparison of the PRQ to episodes in which unc-31
mutants had a movement response to mechanical stimulus that was similar to that of wild-type

68
controls. We found that unc-31 animals with mechanosensory response activity similar to WT are
still defective in PRQ (Vid. 3.S4, Figs. 3.S5,S6).
In addition to expressing FLP-11, RIS also expresses markers of GABAergic neurons
(McIntire et al., 1993; Turek et al., 2016). We therefore asked whether GABA signaling plays a
role in PRQ. The GABA-defective mutant unc-25, which has reduced GABA synthesis (Jin et al.,
1999), showed a decrease in PRQ as measured by change in peak quiescence, and a slight
change in the shape of the PRQ peak, suggesting that GABA too plays a role in regulating the
depth and dynamics of PRQ (Fig. 3.S7). This result was surprising since RIS’s GABAergic
function is not affected in aptf-1 mutants (Turek et al., 2016).
In conclusion, these results show that PRQ is regulated by neuropeptide and GABA
signaling and by the quiescence-promoting interneurons ALA and RIS.
Post response quiescence does not fulfill behavioral criteria for sleep
Because PRQ occurs during and following SIS, and depends on some of the same
neurons and genes as SIS, we asked whether PRQ is a form of sleep. Sleep is defined
behaviorally as a quiescent state with three additional characteristics: rapid reversibility,
decreased arousability, and homeostatic regulation (Kleitman, 1929; Borbély, 1982). Homeostatic
regulation of sleep manifests as an increase in sleep quantity, drive, or depth following sleep
deprivation. While considered a form of sleep (Trojanowski and Raizen, 2016), SIS has not been
shown to be under homeostatic regulation. Because PRQ occurs following an interruption in UV
SIS, we wondered whether PRQ is a form of SIS homeostasis.
C. elegans lethargus has been shown to be homeostatically regulated at both short and
long timescales following brief (seconds) or prolonged (minutes to hours) periods of deprivation
(Raizen et al., 2008; Nagy et al., 2014). Like PRQ, short-term homeostasis consists of a brief
period of increased quiescence following mechanosensory and blue light stimuli (Nagy et al.,
2014). Short term homeostasis is associated with spontaneous “microhomeostasis” which
manifests as a correlation between the duration of quiescent bouts and preceding movement

69
bouts even in the absence of external stimuli (Iwanir et al., 2013). Mutations in genes such as
npr-1 and unc-31 that eliminate this bout correlation also reduce stimulus-evoked short-term
homeostasis (Nagy et al., 2014).
The hypothesis that PRQ is a form of sleep homeostasis leads to several testable
predictions: (1) That SIS movement / quiescent bout dynamics would show microhomeostasis
similar to lethargus, (2) that more deprivation of quiescence would cause more compensatory
quiescence, (3) that PRQ would not be specific to mechanosensory responses, and (4) that PRQ
would fulfill the behavioral criteria of sleep: rapidly reversibility, decreased arousability, and
homeostatic regulation. We designed experiments to test each of these predictions.
To test the first prediction, that microhomeostasis would be present in SIS, we examined
the bout architecture of UV SIS. In UV SIS, quiescent bout durations were not significantly
correlated with the preceding movement bout duration (Fig. 3.5a). Bout correlation in EGF-
induced quiescence was positive, but also not significant (Fig. 3.S8). In contrast, we were able to
confirm the presence of microhomeostasis during L4 lethargus (Fig. 3.5a). Furthermore, while
short-term homeostasis in lethargus requires npr-1 (Nagy et al., 2014), we saw only a modest
reduction in PRQ in npr-1 mutants. Meanwhile, we observed a larger reduction in PRQ in daf-16
mutants, which are defective in long-term, but not short-term homeostasis in lethargus (Driver et
al., 2013) (Fig. 3.S9). These results suggest that SIS quiescent bout duration and PRQ are
regulated differently from microhomeostasis and short-term homeostasis during lethargus.
To test the second prediction, that more quiescence deprivation would cause more
homeostatic rebound quiescence, we re-analyzed our EGF overexpression PRQ dataset by
separating responses into two groups: those in which the stimulus occurred while the animal was
quiescent, and those in which the stimulus occurred while the animal was active. If PRQ were
sleep homeostasis, interruption of a quiescent bout should result in greater PRQ. Because
selecting responses this way alters the pre-stimulus quiescence level, we used the quiescence
level 2-4 minutes prior to the stimulus as a baseline when calculating PRQ. We did not see a
significant difference in PRQ between these groups (Fig. 3.5b), showing that an equal amount of
70
PRQ occurs when the worm is active at the time of stimulus and that direct interruption of
quiescence is not required for PRQ.
It is possible that a response during an active bout could still prevent initiation of a
quiescent bout that would have otherwise occurred. Therefore, we further interrogated the second
prediction by cycling through four substrate vibration durations, 0.3, 1.0, 3.0, and 10 seconds,
while keeping the same 15 minute ISI. As expected, response magnitude increased with
increasing stimulus duration. However, PRQ was only significant following 0.3 and 1.0 second
stimuli. PRQ was not significant after 3 second stimuli, and 10 second stimuli caused a significant
decrease in quiescence (Fig. 3.5c). Furthermore, we did not see an increase in average
quiescence over baseline at any time during the ISI (Fig. 3.S10). Together, these results indicate
that PRQ is not a compensation for interruption in quiescence.
While we consider these results to be inconsistent with a homeostatic function of PRQ,
Nagy and coworkers (Nagy et al., 2014) also observed no short-term increase in quiescence after
longer duration mechanosensory and blue light stimuli during lethargus and concluded that a
separate, DAF-16-mediated long-term homeostatic mechanism operating over a longer timescale
allows lethargus animals to increase their quiescence following prolonged deprivation. We
attempted to deprive UV SIS animals of quiescence for 30 minutes using repetitive gentle touch
and forced swimming protocols previously shown to cause a daf-16-dependent increase in
quiescence consolidation and sleep drive, respectively, in lethargus (Raizen et al., 2008; Driver et
al., 2013). However, we did not observe increased quiescence following deprivation (Fig. 3.S11).
We sought to compare PRQ to short-term homeostasis in lethargus, but we did not observe
increased quiescence in lethargus after a range of stimuli that cause PRQ following EGF
overexpression (Fig. 3.S12).
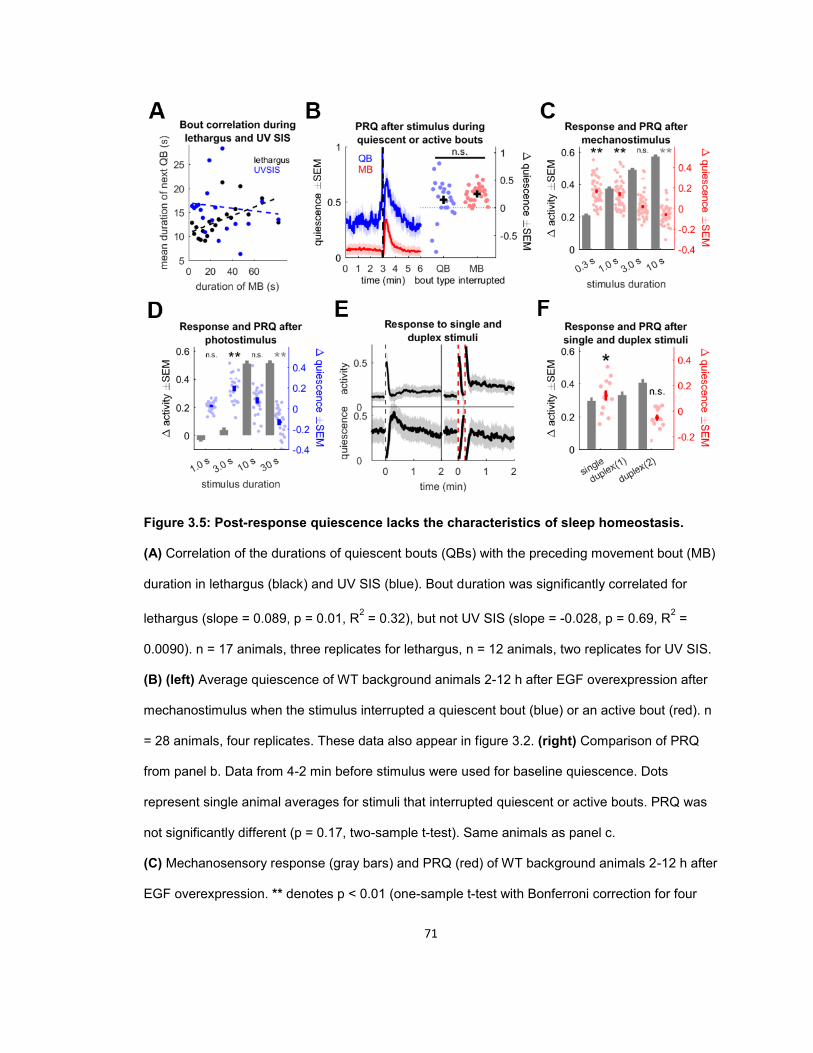
71
Figure 3.5: Post-response quiescence lacks the characteristics of sleep homeostasis.
(A) Correlation of the durations of quiescent bouts (QBs) with the preceding movement bout (MB)
duration in lethargus (black) and UV SIS (blue). Bout duration was significantly correlated for
lethargus (slope = 0.089, p = 0.01, R2 = 0.32), but not UV SIS (slope = -0.028, p = 0.69, R2 =
0.0090). n = 17 animals, three replicates for lethargus, n = 12 animals, two replicates for UV SIS.
(B) (left) Average quiescence of WT background animals 2-12 h after EGF overexpression after
mechanostimulus when the stimulus interrupted a quiescent bout (blue) or an active bout (red). n
= 28 animals, four replicates. These data also appear in figure 3.2. (right) Comparison of PRQ
from panel b. Data from 4-2 min before stimulus were used for baseline quiescence. Dots
represent single animal averages for stimuli that interrupted quiescent or active bouts. PRQ was
not significantly different (p = 0.17, two-sample t-test). Same animals as panel c.
(C) Mechanosensory response (gray bars) and PRQ (red) of WT background animals 2-12 h after
EGF overexpression. ** denotes p < 0.01 (one-sample t-test with Bonferroni correction for four

72
comparisons, note 10 s stimulus animals were less quiescent after stimulus). n = 48 animals, four
replicates.
(D) Photosensory response (gray bars) and PRQ (blue) of WT background animals 2-12 h after
EGF overexpression. ** denotes p < 0.01 (one-sample t-test with Bonferroni correction for four
comparisons, note 30 s stimulus animals were less quiescent after stimulus). n = 23, two
replicates for 1, 3, and 10 s, n = 24, three replicates, for 30 s stimuli)
(E) Average activity (top) and quiescence (bottom) following a single (left) and double (15 s
separated) (right) mechanostimulus in WT background animals 2-12 h after EGF overexpression.
(n = 12 animals, one replicate)
(F) Mechanosensory response (gray bars) of WT background animals 2-12 h after EGF
overexpression after a single and the first and second of a pair of stimuli, and PRQ (red) of the
same animals after single and double stimuli. * denotes p < 0.05 (one sample t-test with
Bonferroni correction for two comparisons). Same animals as panel f.

73
To test the third prediction, that PRQ would not be specific to mechanosensory stimulus,
we replaced mechanical vibration with illumination by blue light, which also causes an aversive
locomotor response, but through the amphid sensory neuron ASJ and metabotropic
photoreceptor LITE-1 (Liu et al., 2010). We tested several stimulus durations: 1.0, 3.0, 10, and 30
seconds. Because the 30 second blue light stimulus seemed to inhibit PRQ following shorter
stimuli, the 30 second photosensory response data are from a separate set of experiments. Like
substrate vibration, increasing the blue light duration increased response activity. We saw neither
PRQ nor an increase in activity after 1 second photostimuli, suggesting that this stimulus was too
weak to cause a response. Consistent with prediction 3, we saw PRQ following 3 s photostimuli,
which caused a similar response magnitude to our 0.3 and 1 second substrate vibrations,
indicating that PRQ is not specific to the mechanosensory response. However, after 10 and 30
second blue light stimuli, we saw no change, and a significant decrease in quiescence,
respectively, showing that, like substrate vibrations, longer duration blue light stimuli do not cause
PRQ (Fig. 3.5d).
To test the fourth prediction, that PRQ would display the behavioral characteristics of
sleep (rapid reversibility, decreased arousability, and homeostatic regulation) we alternated a
single 1 second vibration with a stimulus duplex consisting of two, 1 second vibrations spaced 15
seconds apart, allowing us to compare responses to stimuli at baseline (baseline stimulus)
quiescence and at the peak of PRQ (PRQ stimulus). We found that animals responded to the
PRQ stimulus, demonstrating that PRQ is rapidly reversible. However, we also found that activity
following the PRQ stimulus was higher than activity following the baseline stimulus, suggesting
that the animals are in fact more rather than less arousable during PRQ. Lastly, we did not see a
second peak of PRQ following the PRQ stimulus, suggesting that PRQ is not itself under
homeostatic regulation (Fig. 3.5e-f). These results show that PRQ lacks two of the four
behavioral criteria of sleep: decreased arousability and homeostatic regulation.
Of our four predictions based on the hypothesis that PRQ is a form of sleep homeostasis,
only one, the prediction that PRQ would also occur after non-mechanosensory stimuli, turned out

74
to be correct. Therefore, we do not consider PRQ to be a sleep state or homeostatic rebound in
SIS.
Mechanical stimuli increase head movement quiescence but not locomotion quiescence
Our image subtraction-based analysis in the WorMotel does not distinguish between
head movement and locomotion, and lacks the spatiotemporal resolution to detect feeding.
However, quiescent states often involve the coordinated suppression of multiple behaviors. In C.
elegans, different aspects of SIS quiescence – locomotion, head movement, feeding, and
defecation – are regulated by different combinations of neuropeptides (Nath et al., 2016).
Lethargus quiescence is also regulated in a piecewise manner. For example, flp-11 mutants are
defective in movement quiescence, but show normal feeding quiescence (Turek et al., 2016). We
therefore asked whether PRQ encompasses different types of behavioral quiescence.
To resolve various aspects of behavior, we recorded bright field videos of individual WT
background animals placed on agar pads at 50 frames per second. After recording the behavioral
response to mechanostimulus before and at one hour intervals up to six hours after EGF
overexpression, we reviewed video recordings and manually scored lateral head movements,
forward and reverse locomotion (movement relative to the substrate), and pharyngeal pumps (an
indicator of feeding (Hart, 2006)). This allowed us to quantify head movement, locomotion, and
feeding quiescence separately. We did not attempt to score defecation because the defecation
cycle has a similar timescale to PRQ (Liu and Thomas, 1994) and because expulsion was not
easily observable using our imaging system.
Consistent with previous reports (Van Buskirk and Sternberg, 2007; Nath et al., 2016),
we found that EGF overexpression increased locomotion and head movement quiescence and
decreased pumping rate (Fig. 3.6a-c, 3.S13). To determine whether locomotion and head
movement quiescence also increase following mechanostimulus, we examined the change in
peak fraction quiescent from the 30 seconds before to the 30 seconds after mechanostimulus
following EGF overexpression (Fig. 3.6d). Unlike in the WorMotel, we noticed an increase in
75
quiescence after stimuli even within 2 h of EGF overexpression, so we pooled the data from all
six post-EGF timepoints. Interestingly, we saw no significant increase in locomotion quiescence,
while peak head movement quiescence became significantly higher after the stimulus (Fig. 3.6e).
If we define simultaneous locomotion and head movement quiescence as “body quiescence” we
find a significant increase in body quiescence after the stimulus comparable to our wormotel data
(Fig. 3.6d,e).
Starting approximately 10 s after the stimulus, body quiescence is nearly as high as head
movement quiescence (Fig. 3.6d), suggesting that increased head movement quiescence occurs
simultaneously with locomotion quiescence. Indeed, when we compared the fraction of time
animals were head movement quiescent while moving forward, reversing, or pausing, we found
the highest levels of head movement quiescence while animals were pausing, especially after the
stimulus. Following mechanostimulus, animals had significantly higher head movement
quiescence while pausing than while moving in either direction. In contrast, prior to the stimulus,
head movement quiescence during pausing was significantly higher than head movement
quiescence during forward, but not backward, movement (Fig. 3.6f). These results demonstrate
that PRQ consists of an increase in head movement quiescence specifically when the animal is
pausing.
Side to side head movements, also known as foraging, typically occur in the presence of
food (Kindt et al., 2007). To examine feeding quiescence during PRQ, we used pumping rate as a
measure of feeding quiescence, with a lower pumping rate corresponding to higher feeding
quiescence. Pumping rate generally decreased following EGF overexpression, but when we
examined the effect of mechanostimulus on pumping rate, we found a similar decrease in
pumping rate following the stimulus before and after EGF overexpression (Fig. 3.6e, 3.S13c,d),
suggesting that while pumping is suppressed following a stimulus, this suppression is not specific
to PRQ. Indeed, aversive mechanosensory (Chalfie et al., 1985; Keane and Avery, 2003) as well
as photosensory stimuli (Bhatla and Horvitz, 2015) are known to inhibit pumping.

76
Figure 3.6: Locomotion, head movement, and feeding during PRQ.
(A-C) Heat maps showing locomotion, head movement, and pumping rate from 30 s before to 60
s after a 1 s, 1 kHz substrate vibration (dashed red lines) in hsp:EGF animals before a 10 min
32°C heat shock and at 1, 2, 3, 4, 5, and 6 h afterward. n = 6 animals, seven recordings each.
Censored data are in gray. Data from the same animals are used in panels d-f and
supplementary figure 3.13.
(D) Traces showing fraction of animals locomotion, head movement, and body movement
quiescent (both locomotion and head movement quiescent) after mechanostimulus following EGF

77
overexpression. Dashed line indicates stimulus. Traces represent the mean of six animals, four
recordings each, 0-6 h after heat shock, smoothed with a 5 s window.
(E) Average change in peak locomotion, head movement, and body quiescence (black) and
average change in minimum pumping rate (red) from the 25 s period before the stimulus to the 25
s period after the stimulus starting at 5 s post stimulus. Circles represent individual animal
averages. * denotes p < 0.05, ** denotes p < 0.01. A one sample t-test was used except to
compare pre- and post heat shock pumping rates, where a paired t-test was used. Data are the
same as panels a-c, 1-6 h post heat shock.
(F) Fraction of time the animals were head movement quiescent while moving forward, reversing,
or pausing before (left) and after (right) mechanostimulus. Circles represent single recording
averages. * denotes P < 0.05, ** denotes p < 0.01, Wilcoxon rank sum test.

78
Considered separately, these data imply that PRQ consists solely of an increase in head
movement quiescence. However, taken together they show that increased head movement
quiescence occurs specifically while the animal is paused, indicating that the regulation of these
behaviors is coordinated during PRQ. The suppression of head movement during PRQ suggests
an extension of the tyramine-dependent suppression of head movement during C. elegans
escape behavior (Maguire et al., 2011; Pirri and Alkema, 2012).
DISCUSSION
In this study we have described PRQ, a form of quiescence that follows C. elegans
responses to mild, aversive stimuli. This behavior is distinct from other forms of quiescence
previously described in C. elegans. For example, animals touched in the anterior will sometimes
exhibit an immediate and brief pause in forward movement (Chalfie et al., 2014). Compared to
these pauses, PRQ is much longer in duration and occurs with delay relative to the stimulus. In
contrast, PRQ occurs more quickly and is much shorter in duration than a form of quiescence
recently described in physically confined animals (Gonzales, 2019).
Several lines of evidence suggest that PRQ is related to SIS. Both PRQ and SIS occur
robustly following overexpression of EGF, which mediates the stress response, and PRQ and SIS
share a dependence on the ALA and RIS quiescence-promoting interneurons and neuropeptide
signaling. However, PRQ is not a direct consequence of SIS, as we have shown that some forms
of stress induce SIS but not PRQ. Furthermore, the time course of PRQ following stress or EGF
overexpression is distinct from that of SIS, with PRQ reaching a maximum after that of SIS and
continuing many hours after cessation of the SIS response.
We asked what might be the possible adaptive significance of the PRQ behavior. Here
we consider three ideas: (1) PRQ reflects a homeostatic mechanism in SIS, (2) PRQ results from
energy conservation, and (3) PRQ is a form of defensive freezing.
Given the association between PRQ and SIS, we first considered the possibility that PRQ

79
represents a homeostatic mechanism in SIS. However, we showed that during PRQ, animals do
not exhibit reduced arousability or homeostatic regulation, and therefore do not exhibit the
properties expected for a homeostatic mechanism for sleep. Furthermore, the amount of PRQ
does not increase when stimulus duration is increased, or when quiescent bouts are specifically
interrupted, indicating that PRQ is not a simple compensation for deprivation of quiescence.
A second possible interpretation of PRQ is in terms of energy conservation. C. elegans
locomotion requires energy expenditure (Laranjeiro et al., 2017), and cessation of feeding and
activation of DNA repair pathways would likely reduce energy stores during UV SIS. Indeed, fat
stores decrease during lethargus and ATP levels decrease during lethargus and over the course
of UV SIS (Grubbs et al., 2019) . PRQ may allow the animal to compensate for energy depletion
associated with an active response with cessation of locomotion and feeding. However, we
consider this energy-based argument unlikely since longer stimuli elicit more activity than brief
stimuli, without causing PRQ.
A third possibility is that PRQ represents a form of defensive freezing analogous to the
freezing phase in the classic mammalian escape response (Bracha, 2004; Roelofs, 2017). A
cessation of movement can help an animal that has detected a predator to evade detection by the
predator (Sargeant and Eberhardt, 1975; Roelofs, 2017). Given the limited light and visibility in C.
elegans’ natural environment of decaying organic material, it seems likely that its predators rely
on primarily olfactory, mechanosensory, and potentially electrosensory (Gabel et al., 2007) cues
rather than visual ones for prey seeking and identification. While little is known about C. elegans’
natural predators, they likely include many species of nematophagous arthropods, fungi, and
other nematodes (Maguire et al., 2011; Frézal and Félix, 2015; Schulenburg and Félix, 2017).
PRQ may allow C. elegans to avoid detection after retreating from contact with a predator by
minimizing mechanosensory, electromyogenic, and potentially olfactory (touch resets the
defecation cycle (Liu and Thomas, 1994)) cues. Reduced feeding during PRQ (and after touch
generally) may help minimize the ingestion of predatory fungal spores (Schulenburg and Félix,
2017).

80
Additional lines of evidence support an association between PRQ and defensive
behaviors. We found that RIS neuropeptide function is required for PRQ, while unc-25 (GABA
synthesis) mutants show a partial deficit in PRQ. GABAergic function in the RIS neuron has been
found to regulate C. elegans avoidance of kairomones of the predatory nematode Pristionchus
pacificus (Liu et al., 2018), supporting a connection between PRQ and defensive avoidance
behavior. We also found that PRQ depends on EGF signaling. In mice, the EGF-family receptor
neuregulin-1 has been shown to modulate anxiety-like behaviors (Karl et al., 2007; Bi et al.,
2015); for example, overexpression of the neuregulin-1 receptor increases baseline startle
response (Deakin et al., 2009). These results suggest that EGF family signaling may play
conserved roles in regulating defensive and fear / anxiety behaviors.
In summary, PRQ represents a novel feature of C. elegans escape behavior during a
stress state. Further study of its circuit and genetic bases may lead to understanding of the
mechanisms modulating animal responses to aversive stimuli.
MATERIALS AND METHODS
C. elegans strains & maintenance
We cultured C. elegans on OP50 E. coli food bacteria on standard NGM agar plates
(Brenner, 1974) at 20°C, and experiments were performed at ambient lab temperature, 18°C-
24°C. We performed most experiments using young adult hermaphrodites staged by picking late
L4s 5-7 hours prior to the experiment. The exceptions to this are in the long-term SIS deprivation
experiments, where we used day 1 adults staged by picking L4s 16-24 hours in advance, and in
lethargus experiments, where we used mid to late L4s picked just before the experiment.
We used the Bristol N2 strain as wild-type. For EGF overexpression experiments in a
wild-type background, we crossed PS5009 [pha-1(e2132ts) III.; him-5(e1490) V. syEx723] with
N2 to make YX256. The transgene syEx723 is [hsp16-41::lin-3c; myo-2:GFP; pha-1(+)] (Van
Buskirk and Sternberg, 2007). For EGF overexpression experiments in other mutant
backgrounds, we crossed mutant strains with YX256 to generate strains carrying syEx723. All
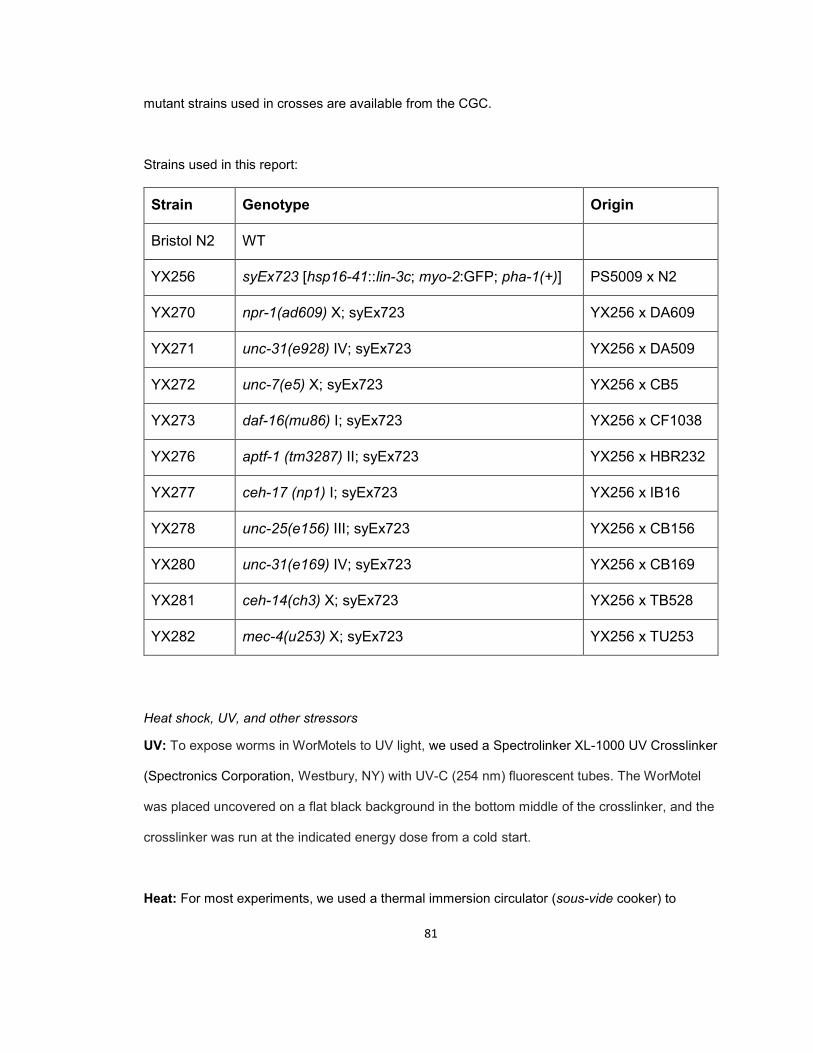
81
mutant strains used in crosses are available from the CGC.
Strains used in this report:
Strain Genotype Origin
Bristol N2 WT
YX256 syEx723 [hsp16-41::lin-3c; myo-2:GFP; pha-1(+)] PS5009 x N2
YX270 npr-1(ad609) X; syEx723 YX256 x DA609
YX271 unc-31(e928) IV; syEx723 YX256 x DA509
YX272 unc-7(e5) X; syEx723 YX256 x CB5
YX273 daf-16(mu86) I; syEx723 YX256 x CF1038
YX276 aptf-1 (tm3287) II; syEx723 YX256 x HBR232
YX277 ceh-17 (np1) I; syEx723 YX256 x IB16
YX278 unc-25(e156) III; syEx723 YX256 x CB156
YX280 unc-31(e169) IV; syEx723 YX256 x CB169
YX281 ceh-14(ch3) X; syEx723 YX256 x TB528
YX282 mec-4(u253) X; syEx723 YX256 x TU253
Heat shock, UV, and other stressors
UV: To expose worms in WorMotels to UV light, we used a Spectrolinker XL-1000 UV Crosslinker
(Spectronics Corporation, Westbury, NY) with UV-C (254 nm) fluorescent tubes. The WorMotel
was placed uncovered on a flat black background in the bottom middle of the crosslinker, and the
crosslinker was run at the indicated energy dose from a cold start.
Heat: For most experiments, we used a thermal immersion circulator (sous-vide cooker) to
82
maintain a water bath at the specified temperature. For some experiments, we used a hot plate
and added hot or cold water to maintain the temperature. We fully immersed a Parafilmed petri
dish containing the WorMotel for the specified time, then placed the petri dish on the lab bench
for about 5 min to return to ambient temperature before proceeding.
Cold: We chilled a Parafilmed petri dish containing the WorMotel and young adult worms in a 4°C
refrigerator or 4°C thermal circulator for 24 hours.
Salt: We picked WT worms from a WorMotel into NGMB containing an additional 500 mM NaCl
for 15 minutes and then picked them back onto the WorMotel using an eyebrow pick. Controls for
this experiment were picked into regular NGMB without extra salt.
Ethanol: We picked WT worms from a WorMotel into a 5% (v/v) solution of ethanol in NGMB for
15 minutes using an eyebrow pick. Controls for this experiment were picked into regular NGMB
without ethanol.
Cry5b: We picked WT worms from the WorMotel onto a standard NGM plate seeded with Cry5b-
expressing bacteria (Wei et al., 2003; Hill et al., 2014) for 15 minutes and then picked them back
onto the WorMotel. Controls were picked onto an empty vector-containing bacteria lawn for the
same amount of time.
Mechanosensory stimulation
For mechanosensory assays performed simultaneously with dark field imaging, we
coupled the WorMotel to an audio loudspeaker (PLMRW10 10-Inch Marine Subwoofer, Pyle
Audio Inc., Brooklyn, NY). Acrylic mounting plates with screws fixed the WorMotel tightly to the
inside of a 10 cm petri dish (Corning), which itself was mounted on a plastic pedestal in the center
of the speaker cone using an acrylic ring with screws.

83
For mechanostimulus assays performed with bright field imaging for scoring pharyngeal
pumps, we coupled a 3 mm thick agar pad contained in a custom acrylic pad holder to a BOSS
BRS40 4-inch audio loudspeaker (BOSS Audio Systems, Oxnard, CA) using a 50 mL polystyrene
pipette tip glued to the middle of the speaker cone and projecting horizontally. A notch on the end
of the pipette tip fit snugly onto a tab on the pad holder, transferring vibrations from the speaker to
the worm substrate.
For all mechanosensory assays, we used a custom MATLAB script to output audio
signals though a NIDAQ PCI-6281 (National Instruments, Austin, TX) or an audio jack to a KAC-
M1804 Amplifier (Kenwood, Long Beach, CA) which powered the loudspeaker. Audio signals
from the NIDAQ were 1 kHz at a 2 V peak to peak amplitude except where noted. The beginning
and end of the envelope of the audio waveform were made smooth by initiating and terminating
using two halves of a 0.1 second Hann window. Waveform duration varied by experiment as
specified.
Blue light stimulation
The blue light setup is similar to one previously described (Churgin et al., 2017). We used
a high power blue LED (Luminus PT-121, Sunnyvale, CA, center wavelength 461 nm) driven at
20 A using a DC power supply to illuminate the worms with 0.36 mW / mm2 blue light. To improve
illumination uniformity, we placed the WorMotel and LED inside a box made of mirrored acrylic
interior walls as previous described. A custom MATLAB script controlled illumination timing
through a NIDAQ USB6001 (National Instruments, Austin, TX) data input/output device and relay
(6325AXXMDS-DC3, Schneider Electric, France)
WorMotel fabrication and preparation
We fabricated WorMotels as described previously (Churgin et al., 2017). Briefly, we
poured PDMS (Dow Corning Sylgard 184) into 3D-printed acrylic or polycarbonate molds, cured
them overnight at 50°C, and demolded the PDMS WorMotel devices. We boiled WorMotels in DI
water to sanitize them, baked them in a 50°C oven to dry, and treated them with oxygen plasma

84
for 10 seconds in a plasma oven consisting of a Plasma Preen II 973 controller (Plasmatic
Systems, Inc.) connected to a microwave oven (Amana RCS10TS). Plasma treatment makes the
PDMS device hydrophilic, making it easier to fill and the agar surfaces flatter.
We used a pipette to fill the wells with either media containing 3 g / L low-melt agarose
(Research Products International, Mount Prospect, IL), 5 mg / L cholesterol, 2.5 mg / L bacto-
peptone, 1 mM CaCl2, 1 mM MgSO4, 20 mM KH2PO4, 5mM K2HPO4) (variable duration blue light
and vibration experiments) or standard NGM agar (Brenner, 1974) (all other experiments). To
reduce the rate of worms escaping from their wells, we filled the moats surrounding the wells with
an aversive solution of 100 mM CuSO4 (Churgin et al., 2017).
We seeded agarose-filled WorMotels with 5 μL of an overnight E. coli OP50 culture
resuspended in 3g / L NaCl and allowed the bacteria to dry, re-wetting faster-drying wells with DI
water to ensure even drying overall, and either used the WorMotels immediately or stored them in
a Parafilmed dish with hydrated water crystals (AGSAP PAM, small particle size, M2 Polymer, 1.5
g in 500 mL water) at 4°C for up to two weeks. We seeded agar-filled WorMotels with 2 μL of an
overnight culture of OP50 in LB, and aspirated excess LB before allowing the WorMotels to dry
open in a biosafety cabinet for 8 minutes. We incubated these WorMotels in a Parafilmed dish
with hydrated water crystals at 20°C, allowing a bacterial lawn to grow for three days. We either
used them immediately or stored them at 4°C for up to two weeks until needed.
After each experiment, we emptied the wells of agar / agarose, washed the WorMotels
with hot water and detergent (Alconox), rinsed in DI water, dried, and stored them for reuse.
Imaging and image processing in the WorMotel
For imaging in the WorMotel, we used a CMOS camera (DMK 24UJ003, The Imaging
Source, Charlotte, NC) and 12.5 mm lens (HF12.5SA-1, Fujifilm Corp., Tokyo, Japan) controlled
by MATLAB (MathWorks, Natick, MA) to acquire 8 bit, 10 MP grayscale images of worms in
WorMotel wells at 1 frame per second. Red LED strips (Oznium, Pagosa Spring, CO) provided
dark field illumination. For most experiments, we imaged 24 wells (a 4 x 6 array) at resolution of
85
approximately 135 pixels / mm. The exceptions to this were data used in bout correlation
analysis, where we used the same camera with a 50 mm lens (HF50SA-1, Fujifilm Corp., Tokyo,
Japan) to image 6 wells (2 x 3 array) at approximately 280 pixels / mm for L4 lethargus or 12
wells (3 x 4 array) at approximately 200 pixels / mm for young adult SIS and EGF-induced
quiescence.
We used custom MATLAB scripts for image processing. We smoothed consecutive
frames with a Gaussian filter (σ = 1.5 pixels) and then subtracted them. We binarized the
absolute value of the resulting difference image by thresholding it at a grayscale value of 5. The
number of non-zero pixels in each binarized difference image was summed to determine the
activity of each worm. A worm was considered quiescent if no activity was detected in its well ROI
for one frame, and active otherwise. The only exception was for bout correlation analysis, where
we used a 2 second floor on quiescent bouts in keeping with the literature (Iwanir et al., 2013;
Nagy et al., 2014). To calculate normalized activity for each worm, we divided the activity value of
each frame pair by the average activity from 50 most active frames after excluding the top 0.5%.
Stimulus frames and stimulus-adjacent frames were excluded from analysis, as were wells
containing no worms, more than one worm, or in which the worm escaped the well or burrowed
into the substrate during recording. Several worms that remained immobile and non-responsive
for the entire recording period following cold shock were also censored.
Quantification of stimulus response
Responsiveness was calculated by first averaging the activity of each animal over stimuli
in the concerned time period, and then finding the mean activity for five seconds following the
stimulus (excluding the stimulus and stimulus adjacent frame), and subtracting the average
activity in the minute prior to the stimulus (again, excluding the stimulus frame and the frame
before it). Responses were normalized to control (untreated in UV SIS experiments or WT in EGF
quiescence experiments) responses when examining how SIS and EGF overexpression affect
responsiveness. For quantifying the responses of unc-31 animals and their controls, activity was
86
first calculated by subtraction of non-consecutive frames separated by five seconds, and activity
resulting from movement during the stimulus minus baseline activity was used as a measure of
the response (Fig. 3.S5,6).
Quantification of PRQ
PRQ was calculated by first taking the average quiescence of each animal before and
after stimuli in the time period of interest, smoothing this trace with a 10 second averaging filter,
and then subtracting the highest quiescence level in any 10 second period in the two minutes
before the stimulus from the highest quiescence level in any 10 second period in the two minutes
after the stimulus. The only exception to this was for comparison of PRQ following active and
quiescent bout interruption (Fig. 3.5b), where the baseline period was shifted to four to two
minutes before the stimulus to avoid the increase or decrease in quiescence leading up to the
stimulus in the two groups, respectively.
Imaging and scoring locomotion, head movement, and feeding
To image pharyngeal pumping, we manually tracked unconstrained worms on an agar
pad containing OP50 bacteria using an M156 FC stereo microscope (Leica, Wetzlar, Germany)
with a 1.0X Plan Apo objective and white, bright field illumination. We used a 5 MP CMOS
camera (DMK33GP031, The Imaging Source, Charlotte, NC) to image at 50 fps with a resolution
of approximately 700 pixels / mm and a field of view of approximately 0.91 mm x 0.68 mm.
We used custom MATLAB graphical user interfaces to replay images at approximately 15
fps and score individual pumps, the locomotion state (forward, pause, or backward), and the head
motion state (active or quiescent) of the worm from 30 s before the stimulus to 60 s after,
censoring frames where the behavior could not be scored confidently. The scorer was blind to the
condition of the worm (pre- or 1-6 h post-EGF overexpression).
Lifespan measurements
For lifespan measurements, WorMotels were filled with NGM agar as described, except
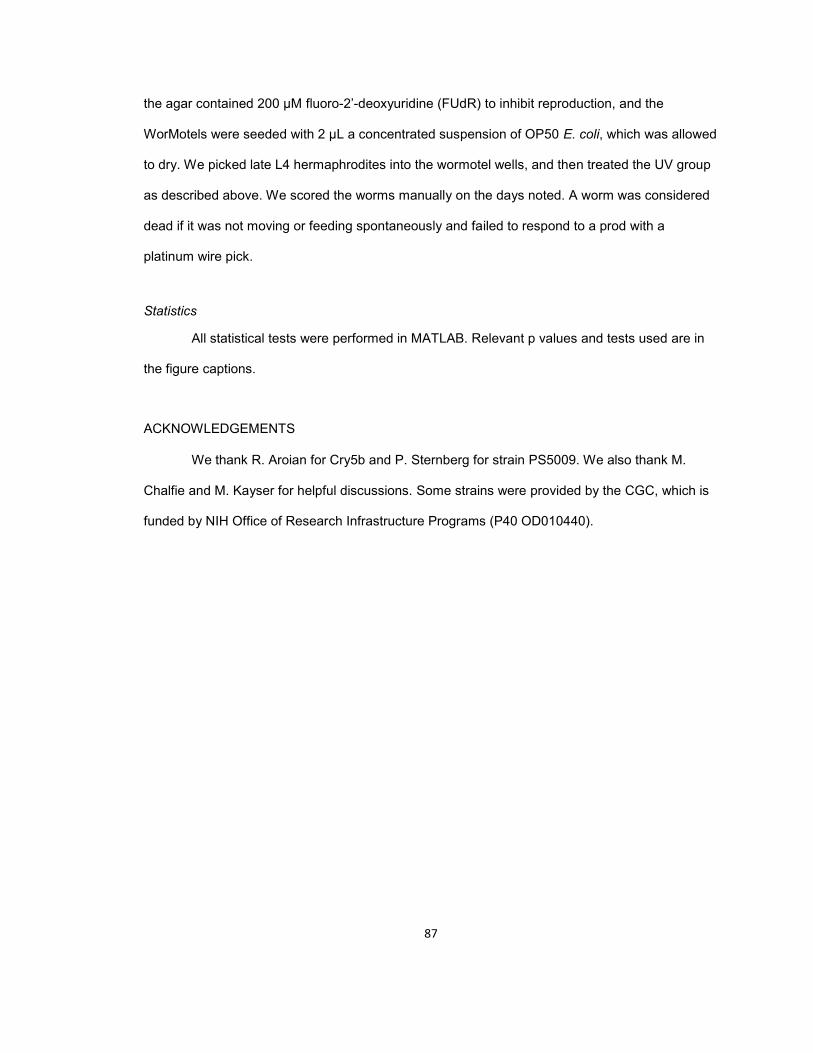
87
the agar contained 200 μM fluoro-2’-deoxyuridine (FUdR) to inhibit reproduction, and the
WorMotels were seeded with 2 μL a concentrated suspension of OP50 E. coli, which was allowed
to dry. We picked late L4 hermaphrodites into the wormotel wells, and then treated the UV group
as described above. We scored the worms manually on the days noted. A worm was considered
dead if it was not moving or feeding spontaneously and failed to respond to a prod with a
platinum wire pick.
Statistics
All statistical tests were performed in MATLAB. Relevant p values and tests used are in
the figure captions.
ACKNOWLEDGEMENTS
We thank R. Aroian for Cry5b and P. Sternberg for strain PS5009. We also thank M.
Chalfie and M. Kayser for helpful discussions. Some strains were provided by the CGC, which is
funded by NIH Office of Research Infrastructure Programs (P40 OD010440).

88
Figure 3.S1: UV exposure reduces lifespan. Lifespan of young adult WT animals after
exposure to 1000 J/m2 UV radiation (blue, n = 19) and same chip controls (black, n = 15). Dots
represent days when animals were scored.
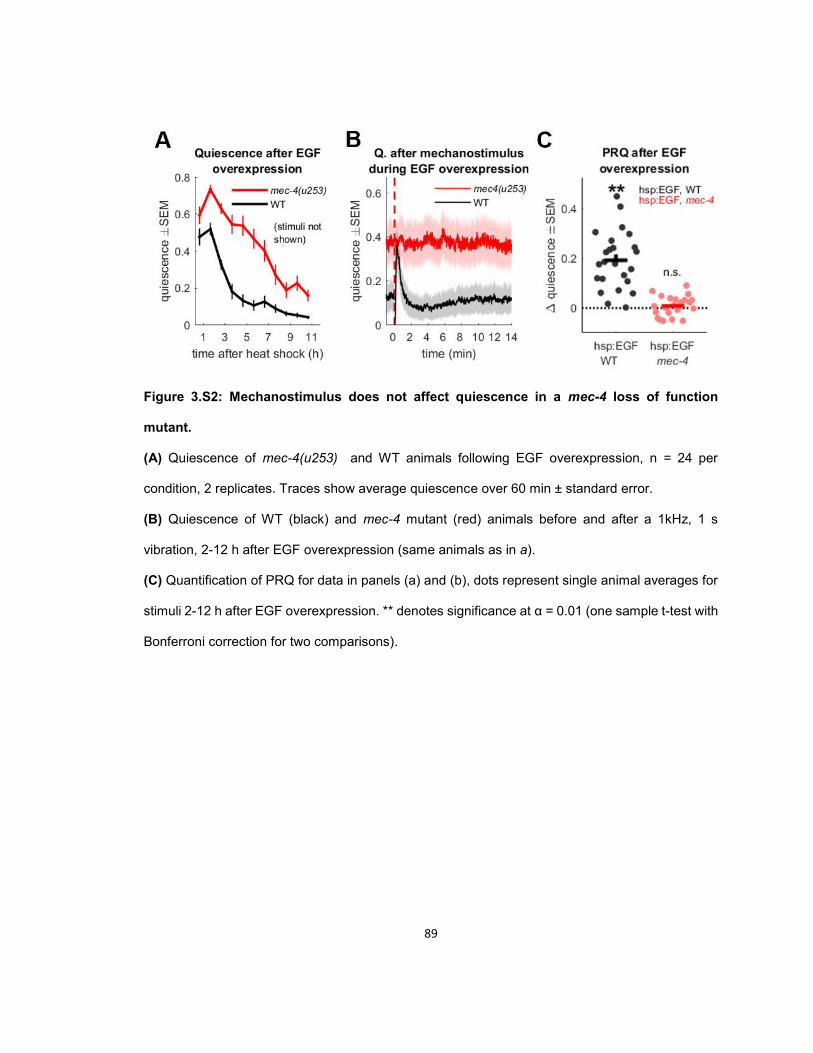
89
Figure 3.S2: Mechanostimulus does not affect quiescence in a mec-4 loss of function
mutant.
(A) Quiescence of mec-4(u253) and WT animals following EGF overexpression, n = 24 per
condition, 2 replicates. Traces show average quiescence over 60 min ± standard error.
(B) Quiescence of WT (black) and mec-4 mutant (red) animals before and after a 1kHz, 1 s
vibration, 2-12 h after EGF overexpression (same animals as in a).
(C) Quantification of PRQ for data in panels (a) and (b), dots represent single animal averages for
stimuli 2-12 h after EGF overexpression. ** denotes significance at α = 0.01 (one sample t-test with
Bonferroni correction for two comparisons).

90
Figure 3.S3: Overall quiescence and quiescence after mechanosensory stimulus following
exposure to various stressors.
(A) (top) Movement quiescence of WT animals following 20 min immersion in 5% EtOH in water,
NGMB with an added 500 mM NaCl or standard NGMB and EGF overexpression (three replicates,
12 to 18 animals per condition); (middle) WT animals exposed to Cry5b-expressing bacteria for 15
min, WT animals exposed to empty vector control bacteria for 15 min, and EGF overexpression
(three replicates, 17 to 22 animals per condition); and (bottom) WT animals exposed to 36°C for
30 min, 4 °C for 24 h, following EGF overexpression, and WT room temperature controls (two
replicates, 12 animals per condition). Data are the same as in figure 3.3, stimuli are not shown.
(B) Movement quiescence before and after 1 s, 1 kHz substrate vibrations. The inter-stimulus
interval was 15 min. Data are the same as panel a and figure 3.3.
91
Figure 3.S4: Overall and post stimulus quiescence of egl-21, unc-31, and ceh-14 mutants
after EGF overexpression.
(A) 30 min average quiescence of WT (black) and egl-21 (top), unc-31 (middle), or ceh-14
(bottom) mutants (gray) for 12 h following EGF overexpression. Stimuli not shown. n = 24
animals, two replicates per strain for egl-21 experiments; n = 36 (unc-31) and 35 (WT), three
replicates for unc-31 experiments; n = 12 animals, one replicate per strain for ceh-14
experiments. Data from the same experiment appear in figure 3.4, panel c.
(B) Fraction quiescent before and after mechanostimulus (dashed red line) in WT (black) and
mutant (gray) background animals 2-12 h following EGF overexpression . Data are from the same
experiment as panel A and figure 3.4c.
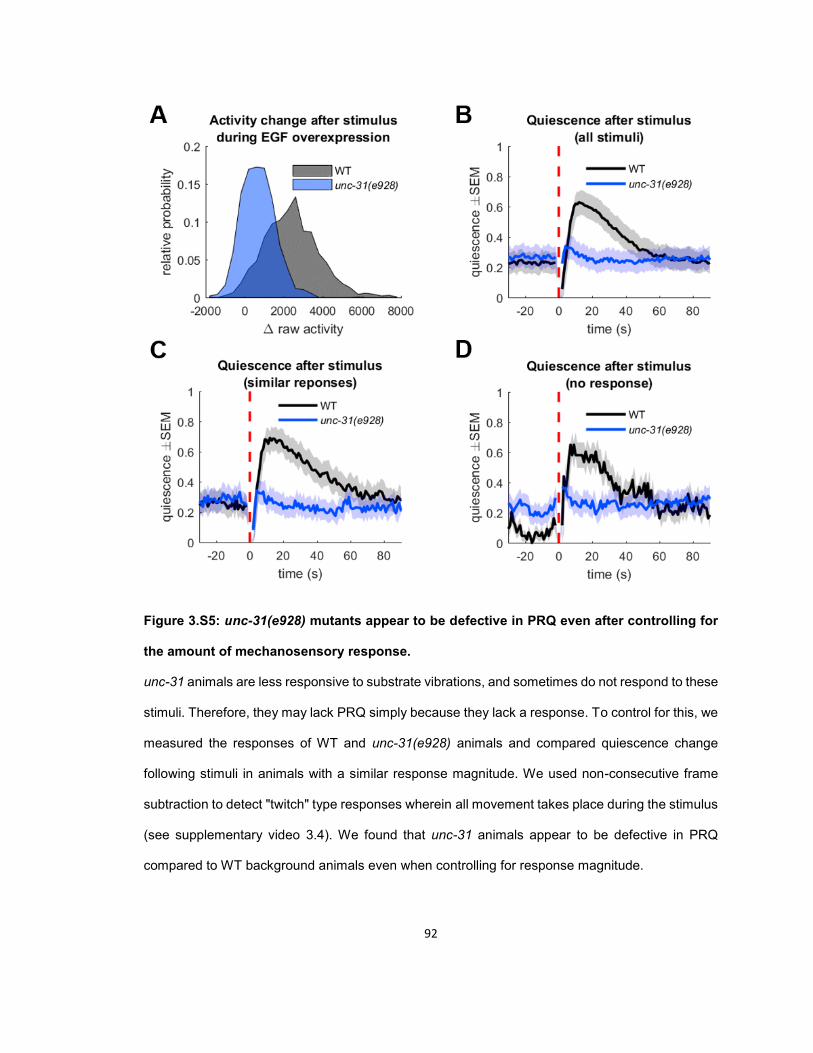
92
Figure 3.S5: unc-31(e928) mutants appear to be defective in PRQ even after controlling for
the amount of mechanosensory response.
unc-31 animals are less responsive to substrate vibrations, and sometimes do not respond to these
stimuli. Therefore, they may lack PRQ simply because they lack a response. To control for this, we
measured the responses of WT and unc-31(e928) animals and compared quiescence change
following stimuli in animals with a similar response magnitude. We used non-consecutive frame
subtraction to detect "twitch" type responses wherein all movement takes place during the stimulus
(see supplementary video 3.4). We found that unc-31 animals appear to be defective in PRQ
compared to WT background animals even when controlling for response magnitude.

93
(A) Histogram of the responses of WT and unc-31(e928) background animals 2-12 h after EGF
overexpression. Stimuli were 1 s 1 kHz substrate vibrations, responses are the max. raw activity in
the 5 s after the stimulus minus the mean raw activity in the minute preceding the stimulus. (n = 36
unc-31(e928) and 35 WT animals from 3 replicates and a total of 2840 responses).
(B) Average fraction quiescent before and after all stimuli (dashed red line) of unc-31(e928) (blue)
and WT (black) animals background animals carrying the hsp:EGF array 2-12 h after mild heat
shock. Traces are the averages of 1440 unc-31(e928) and 1400 WT responses from the same
animals as panel a.
(C) Average fraction quiescent before and after stimuli (dashed red line), after which responses fell
between 1200 and 2000 raw activity values, 2-12 h after mild heat shock. Traces are the averages
of 286 unc-31(e928) and 279 WT responses from the same animals as panel a.
(D) Average fraction quiescent before and after stimuli (dashed red line), after which responses
were ≤ 0 raw activity values, 2-12 h after mild heat shock. Traces are the averages of 318 unc-
31(e928) and 43 WT responses from the same animals as panel a.
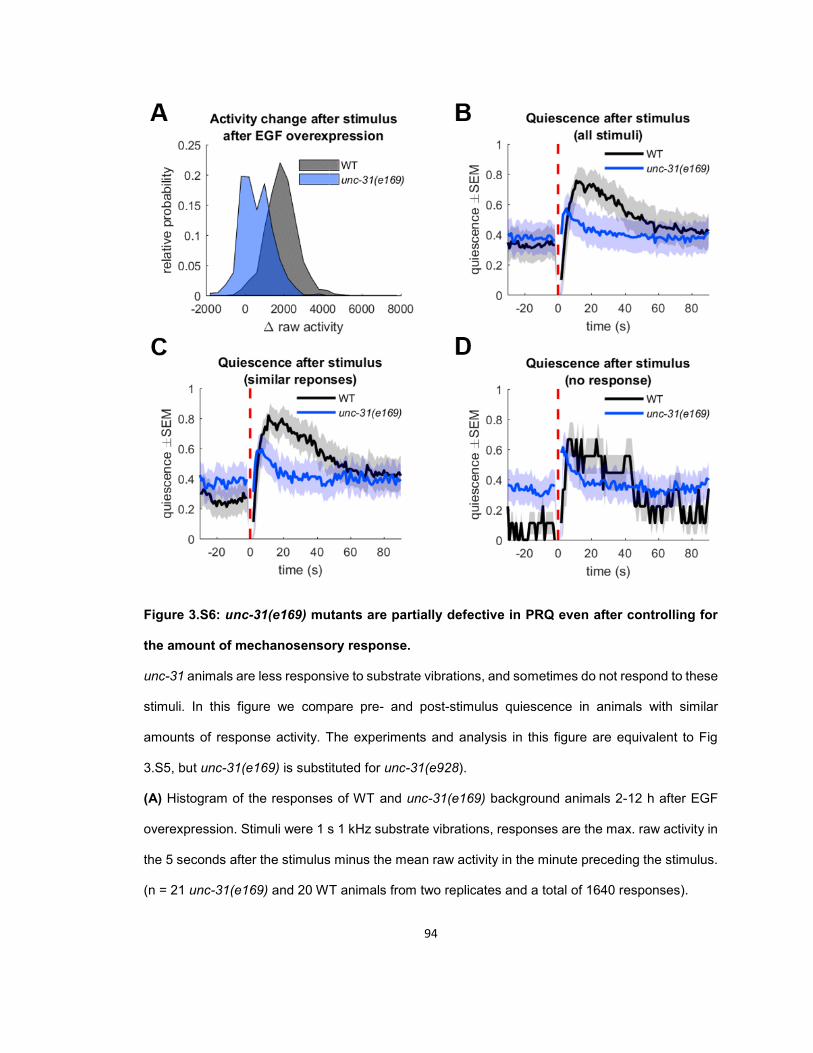
94
Figure 3.S6: unc-31(e169) mutants are partially defective in PRQ even after controlling for
the amount of mechanosensory response.
unc-31 animals are less responsive to substrate vibrations, and sometimes do not respond to these
stimuli. In this figure we compare pre- and post-stimulus quiescence in animals with similar
amounts of response activity. The experiments and analysis in this figure are equivalent to Fig
3.S5, but unc-31(e169) is substituted for unc-31(e928).
(A) Histogram of the responses of WT and unc-31(e169) background animals 2-12 h after EGF
overexpression. Stimuli were 1 s 1 kHz substrate vibrations, responses are the max. raw activity in
the 5 seconds after the stimulus minus the mean raw activity in the minute preceding the stimulus.
(n = 21 unc-31(e169) and 20 WT animals from two replicates and a total of 1640 responses).

95
(B) Average fraction quiescent before and after all stimuli (dashed red line) of unc-31(e928) (blue)
and WT (black) animals background animals carrying the hsp:EGF array 2-12 h after mild heat
shock. Traces are the averages of 840 unc-31 and 800 WT responses from the same animals as
panel a.
(C) Average fraction quiescent before and after stimuli (dashed red line), after which responses fell
between 800 and 1600 raw activity values, 2-12 h after mild heat shock. Traces are the averages
of 248 unc-31 and 227 WT responses from the same animals as panel a.
(D) Average fraction quiescent before and after stimuli (dashed red line), after which responses
were ≤ 0 raw activity values, 2-12 h after mild heat shock. Traces are the averages of 231 unc-31
and 9 WT responses from the same animals as panel a.

96
Figure 3.S7: Loss of function of unc-25 mutants have lower peak PRQ.
(A) Quiescence of WT and unc-25(e156) animals following EGF overexpression, n = 12 per
condition, 1 replicate. Traces show average quiescence over 60 min. Stimuli not shown. n = 24
per strain, 2 replicates.
(B) Quiescence of WT (black) and unc-25 (orange) animals before and after a 1 kHz 1 s
mechanostimulus, same animals as in panel a.
(C) Quantification of the PRQ from panel b. ** denotes p < 0.01, one-sided t-test (testing for
significant PRQ in each strain), or two-sided t-test (comparing PRQ of WT and unc-25
background animals).

97
Figure 3.S8: Correlation of the duration of quiescent bouts (QBs) with the preceding
movement bout (MB) in EGF quiescence.
Dots represent MB duration bins with bounds at 2, 4, 6, 8, 10, 12, 14, 16, 18, 20, 23, 26, 29, 33,
37, 41, 45, 50, 60, 75, and 90 s. Bout duration was positively but not significantly correlated.
(slope = 0.088, p = 0.089, R2 = 0.15). n = 12 animals, two replicates.
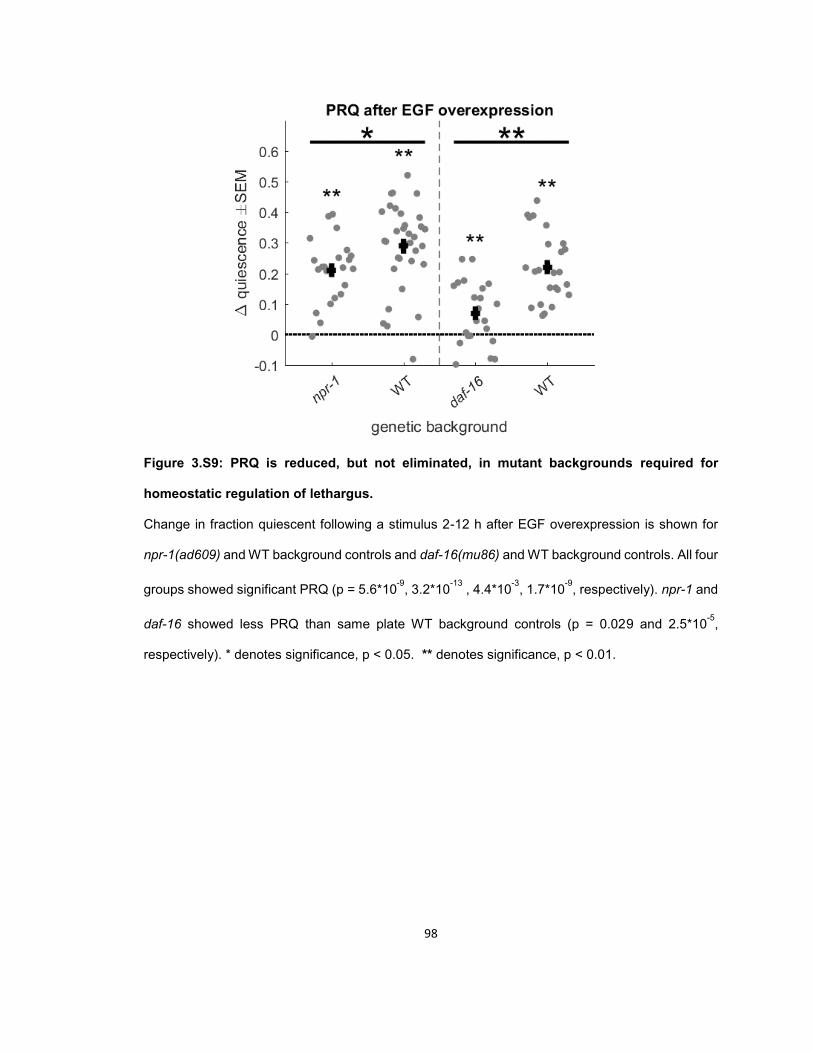
98
Figure 3.S9: PRQ is reduced, but not eliminated, in mutant backgrounds required for
homeostatic regulation of lethargus.
Change in fraction quiescent following a stimulus 2-12 h after EGF overexpression is shown for
npr-1(ad609) and WT background controls and daf-16(mu86) and WT background controls. All four
groups showed significant PRQ (p = 5.6*10-9, 3.2*10-13 , 4.4*10-3, 1.7*10-9, respectively). npr-1 and
daf-16 showed less PRQ than same plate WT background controls (p = 0.029 and 2.5*10-5,
respectively). * denotes significance, p < 0.05. ** denotes significance, p < 0.01.

99
Figure 3.S10: Fraction quiescent following mechanosensory and blue light stimuli of
various durations.
(A) Fraction quiescent of WT background animals 2-12 h after EGF overexpression following 0.3,
1.0, 3.0, and 10 s. duration mechanosensory stimuli. n = 48 animals, four replicates.
(B) Fraction quiescent of WT background animals 2-12 h after EGF overexpression following 1.0,
3.0, 10, and 30 s duration blue light stimuli. n = 23, two replicates for 1, 3, and 10 s, n = 24, three
replicates, for 30 s stimuli).
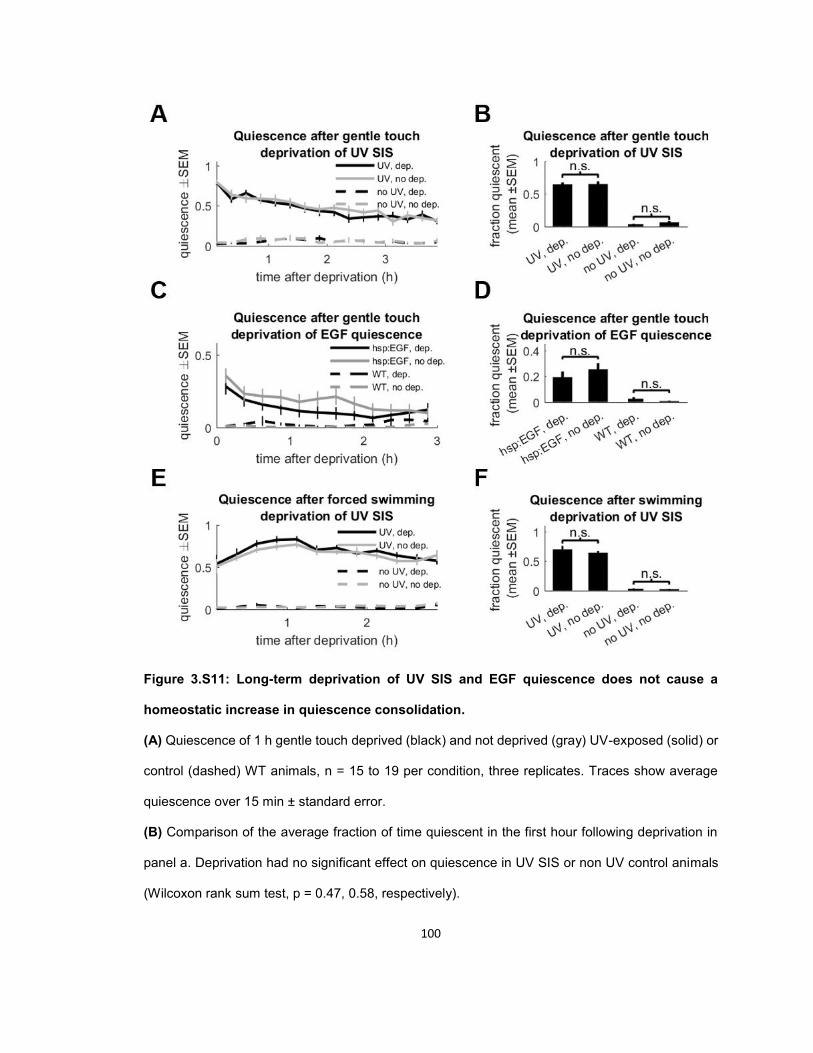
100
Figure 3.S11: Long-term deprivation of UV SIS and EGF quiescence does not cause a
homeostatic increase in quiescence consolidation.
(A) Quiescence of 1 h gentle touch deprived (black) and not deprived (gray) UV-exposed (solid) or
control (dashed) WT animals, n = 15 to 19 per condition, three replicates. Traces show average
quiescence over 15 min ± standard error.
(B) Comparison of the average fraction of time quiescent in the first hour following deprivation in
panel a. Deprivation had no significant effect on quiescence in UV SIS or non UV control animals
(Wilcoxon rank sum test, p = 0.47, 0.58, respectively).
101
(C) Quiescence of gentle touch deprived (black) and not deprived (gray) hsp:EGF (solid) or WT
(dashed) animals following a 10 min, 33°C heat shock and 1 h deprivation period, n = 18 to 24 per
condition, four replicates.
(D) Comparison of the average fraction quiescent in the first hour following deprivation in panel c.
Deprivation had no significant effect on quiescence in hsp:EGF or WT controls (Wilcoxon rank sum
test, p = 0.32, 0.36, respectively).
(E) Quiescence of 30 min forced swimming deprived (black) and not deprived (gray) UV-exposed
(solid) or control (dashed) animals following deprivation, two replicates, n = 10-12 per condition.
(F) Comparison of the average fraction quiescent in the first hour following deprivation in panel e.
Forced swimming deprivation had no significant effect on quiescence in UV SIS or control animals
(Wilcoxon rank-sum test, p = 0.11, 1.0, respectively).

102
Figure 3.S12: Post response quiescence does not occur after mechanostimulus during L4
lethargus.
We observed PRQ after 0.3, 1.0, and 3.0 s substrate vibrations following EGF overexpression. A
similar increase in quiescence has been reported following short duration (1 s) but not long duration
(15 s) 1 kHz substrate vibrations separated by a 15 min ISI during lethargus (Nagy et al. 2014). We
performed three experiments to attempt to replicate this finding. First, we picked L4 animals by
vulva morphology and active feeding. In analysis, we defined the start and end of lethargus for
each animal as described elsewhere (see Raizen et al. 2008, Iwanir et al. 2013). After smoothing
with a 10 min filter, the beginning of lethargus was defined as the point after which quiescence
levels stayed above 5% for at least 20 min, and the end of lethargus was defined as the point after
which quiescence levels stayed below 5% for at least 20 min. We performed three experiments (1)
We stimulated WT and hsp:EGF (no heat shock) lethargus animals every 15 min with 1 s 1 kHz
103
vibrations, (2) we stimulated WT lethargus animals every 15 min with 0.3, 1.0, 3.0, and 10 s, 1 kHz
substrate vibrations, and (3) we stimulated WT lethargus animals with 0.3 s, 1 kHz substrate
vibrations, but changed the amplitude of the audio signal sent to the amplifier from 2V peak to peak
(used in all other experiment in this manuscript) to 0.6, 0.2, and 0.06 V. Each experiment had one
replicate. We plotted the quiescence of lethargus animals after these stimuli; in no case did we
observe and increase in quiescence above baseline.
(A) Average lethargus quiescence for experiments 1, 2, and 3.
(B) Average quiescence of WT (black, n = 16) and hsp:EGF (blue, n = 8) lethargus animals
following 1 s, 1kHz substrate vibrations (red dashed line). Animals were not heat shocked; brief
recovery of baseline quiescence of hsp:EGF animals may be due to leaky expression of EGF. n =
10 (WT), 6 (hsp:EGF)
(C) Average quiescence of WT lethargus animals following 1 kHz substrate vibrations of various
durations (red dashed line). n = 16.
(D) Average quiescence of WT lethargus animals following 1 kHz, 0.3 s substrate vibrations of
various amplitudes (red dashed line). n = 17.

104
Figure 3.S13: Summary of locomotion, head movement, and feeding before and after EGF
overexpression and mechanostimulus.
(A) Fraction of time locomotion quiescent before (gray) and after (red) mechanostimulus. n = 6
animals.
(B) Fraction of time head movement quiescent before (gray) and after (red) mechanostimulus.
Same animals as panel A.
(C) Traces showing mean pumping rate before heat shock (black) and 1-6 hours after heat shock
(red) after mechanostimulus (dashed line) in hsp:EGF animals. Traces are smoothed with a 5

105
second averaging window and represent 6 animals, one recording each at prior to heat shock, six
recordings each 1-6 hours after heat shock. Same animals as panel A.
(B) Pumping rate before (gray) and after (red) mechanostimulus. Same animals as panel A.
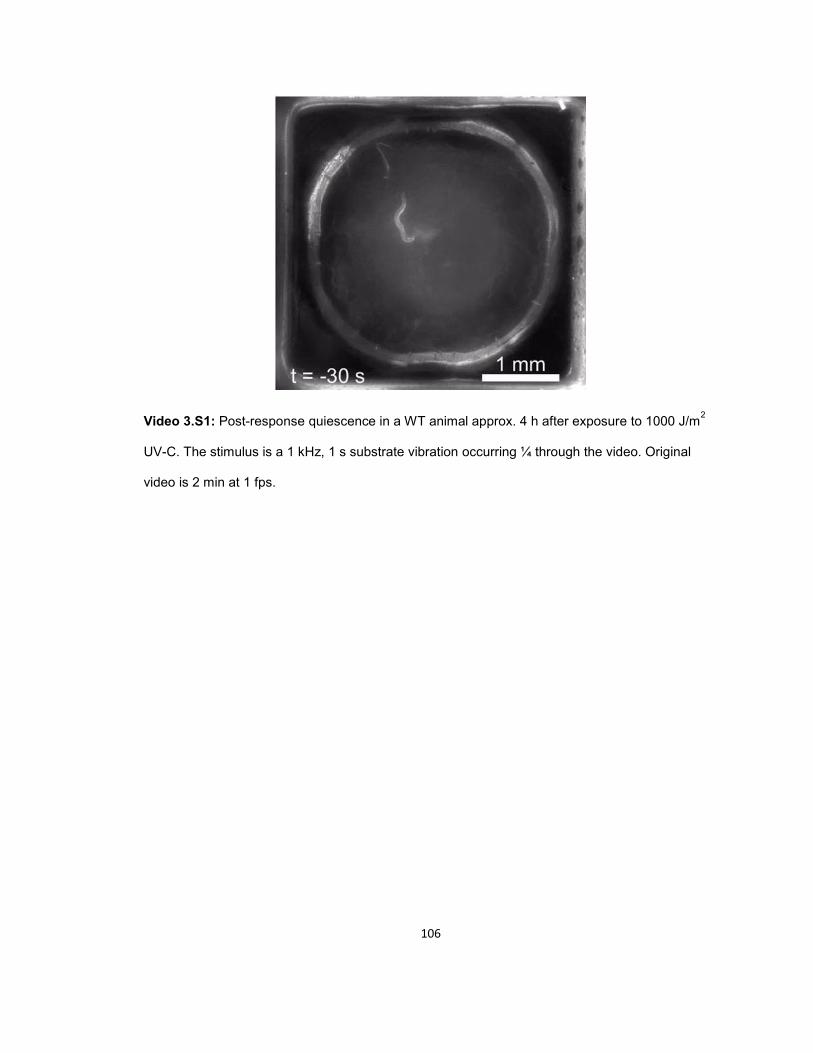
106
Video 3.S1: Post-response quiescence in a WT animal approx. 4 h after exposure to 1000 J/m2
UV-C. The stimulus is a 1 kHz, 1 s substrate vibration occurring ¼ through the video. Original
video is 2 min at 1 fps.

107
Video 3.S2: Normal mechanosensory response of a non UV-treated animal. There is no
quiescence following the locomotor response and turn. The stimulus is a 1 kHz, 1 s substrate
vibration occurring ¼ through the video. Original video is 2 min at 1 fps.
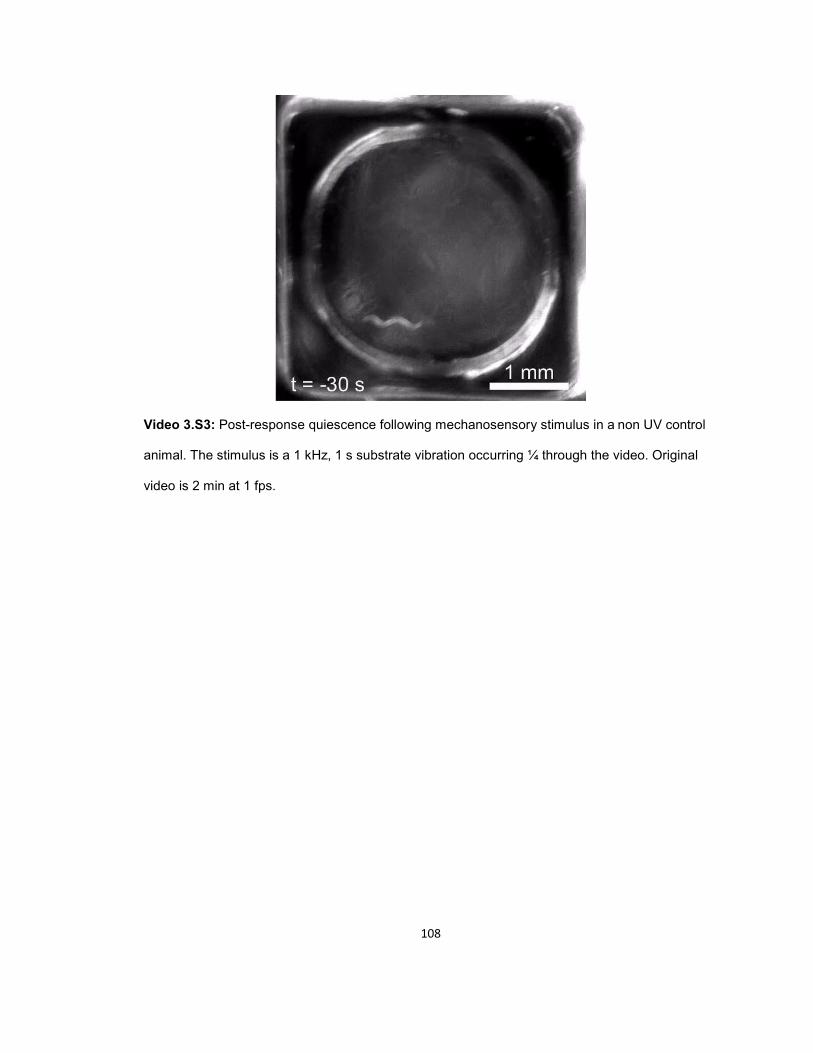
108
Video 3.S3: Post-response quiescence following mechanosensory stimulus in a non UV control
animal. The stimulus is a 1 kHz, 1 s substrate vibration occurring ¼ through the video. Original
video is 2 min at 1 fps.
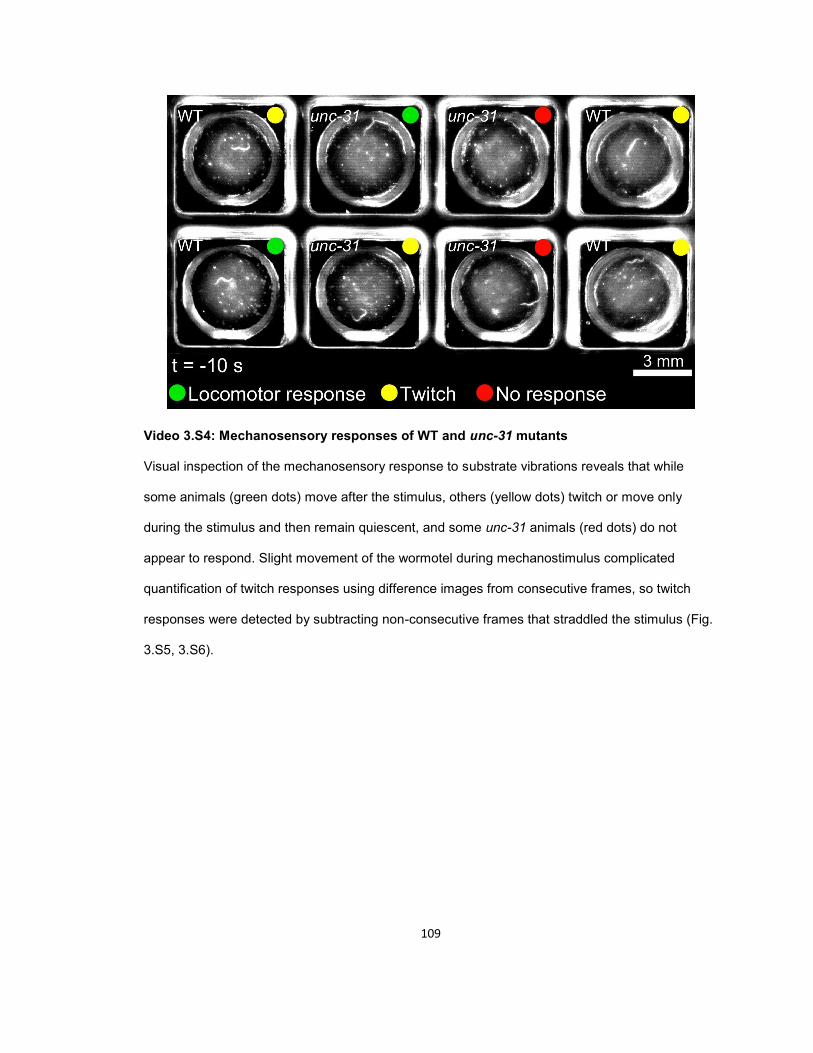
109
Video 3.S4: Mechanosensory responses of WT and unc-31 mutants
Visual inspection of the mechanosensory response to substrate vibrations reveals that while
some animals (green dots) move after the stimulus, others (yellow dots) twitch or move only
during the stimulus and then remain quiescent, and some unc-31 animals (red dots) do not
appear to respond. Slight movement of the wormotel during mechanostimulus complicated
quantification of twitch responses using difference images from consecutive frames, so twitch
responses were detected by subtracting non-consecutive frames that straddled the stimulus (Fig.
3.S5, 3.S6).

110
CHAPTER 4: Conclusion and future directions
CONCLUSIONS
In this thesis I have presented two investigations of the regulation of touch response
behavior. In the first, I developed a microfluidic-based assay and used it to compare C. elegans
response to gentle and harsh touch. In the second, I used a substrate vibration assay, which
causes a gentle touch receptor-mediated response, to investigate how a C. elegans stress
response changes the way it responds to stimuli.
Prior to this work, there was no multiplexed quantitative behavioral assay that could be
used to study and compare the behavior following both gentle and harsh touch. I combined
aspects of a microfabricated array of clamps for holding C. elegans (Hulme et al., 2007a), a
sinusoidal channel design that permits C. elegans crawling locomotion (Lockery et al., 2008), and
an array of monolithic valves (Unger et al., 2000) to develop such an assay. Using this assay, I
was able to directly compare gentle and harsh touch using the same method of stimulation and
behavioral quantification. I found that the response threshold for harsh touch is about five times
higher than gentle touch. In gentle touch, I was able to show that mutants defective in posterior
touch receptor neuron function could still respond to near posterior touch, indicating that the
“ambiguous” response to mid-body touch is the result of overlapping receptive fields, in
agreement with calcium imaging studies of immobilized worms (Suzuki et al., 2003) and manual
assays (Zheng, Diaz-Cuadros and Chalfie, 2015), and thus the directionality or response to mid
body touch could be used to interrogate the relative sensitivity of the anterior and posterior TRNs.
I found that velocity at the time of stimulus did not affect velocity after gentle touch, but that the
location of previous touch did affect velocity after gentle touch, but not velocity after harsh touch,
consistent with independent regulation of the anterior and posterior gentle touch circuits, but
global regulation of the harsh touch response.

111
There is a continuing interest in developing quantitative touch assays for C. elegans.
Two other microfluidic-based C. elegans touch assays based on single layer topology and worm-
immobilizing straight channels were recently published (Cho et al., 2017; Nekimken et al., 2017),
allowing calcium imaging of the mechanoreceptors and other neurons during stimulation. Other
labs have shown interested in my approach. We are helping the Goodman lab adopt our
technology, and Daniel Gonzales of the Robinson lab at Rice is using a Quake valve based touch
assay to study arousability in a confinement induced sleep-like state (Gonzales, 2019).
In addition to locomotion and previous touch stimuli, neuromodulation during sleep and
stress states can influence how an animal responds to stimuli. C. elegans response to a variety of
cellular stressors includes a protective, quiescent state called stress-induced sleep (SIS). In an
experiment that was originally intended to measure arousability during SIS as a correlate of sleep
depth, I observed an increase in quiescent behavior following mechanosensory response during
SIS and after EGF overexpression. Because this behavior had not been documented, I named it
post-response quiescence (PRQ). While I initially suspected that this behavior was a form of
sleep homeostasis, based on experiments described in chapter 3, I am reasonably confident that
PRQ does not represent a form of sleep and therefor also is not sleep homeostasis. While PRQ
appears to be an upregulation of a post response pausing that I occasionally observed in
unstressed, WT controls, at this time I can only speculate about its ethological significance.
Because gentle touch is an escape behavior, I believe the most likely purpose of this behavior is
like that of the defensive freezing behaviors that are well documented in vertebrates, but also
present in several arthropods (Card, 2012; Humphreys and Ruxton, 2018). Later in this chapter I
will describe preliminary experiments that could be used to investigate this possibility.
The mechanosensory speaker assay that I used in my work on PRQ, while differing only
slightly from methods employed in other labs, is nevertheless useful due to its throughput,
reliability, and use of technology accessible even to labs without significant engineering or soft
lithography capabilities. I built a similar rig that is currently being used to study C. elegans SIS in
112
David Raizen’s lab, and a much larger version that is being used by Arzu Öztürk Çolak in
Kyunghee Koh’s Drosophila lab to study how mechanosensory stimulation modulates sleep in
that organism. In order to facilitate use of this assay by researchers in the future, I have included
as appendices a description of the setup as well as the MATLAB scrips I used to record and
process data.
Much remains to be done both to understand the basic regulation of innocuous and
nociceptive touch response behavior under normal waking conditions, and to understand how
touch and responses to touch are modulated by states like sleep and stress. My work lays the
groundwork for a number of possible lines of inquiry. Below I summarize a few of these.
REGULATION OF HARSH TOUCH
The microfluidic assay I developed is the first multiplexed C. elegans touch assay
capable of administering both gentle and harsh touch. The branched, polymodal nociceptors that
mediate harsh touch are similar to the polymodal nociceptors that mediate mammalian
nociception. As a model of nociceptive regulation, this system has the potential to bring the focus
and clarity of model organism research to bear on the regulation of nociception, and lead to
discoveries that could help fix one of the most vexing medical problems of our time: how to safely
control pain without causing substance abuse.
One result to come out of my microfluidic-based comparisons between the regulation of
gentle and harsh touch was that while harsh touch response did not depend on the location of the
previous touch, the overall responsiveness decreased over the course of the experiment. This is
despite the fact that different receptors mediate harsh touch response in different parts of the
body (Li et al., 2011), and suggests organism-wide down-regulation of harsh touch
responsiveness. One possibility is that nociceptive PVD neurons regulate harsh touch throughout
the body, since, although they chiefly mediate responses to posterior harsh touch, their highly-
ramified processes extend well into the anterior half of the body. Internal states like stress,
113
inflammation (Zhang and An, 2007), and the adrenaline-mediated alarm response (Kuraishi,
Harada and Takagi, 1979; Ramana Reddy and Yaksh, 1980) can modulate nociception. As a
relatively high throughput, quantitative harsh touch assay, my assay has potential for studying
harsh touch regulation in populations of animals much as the tap reflex assay has been used to
study gentle touch-mediated responses. Furthermore, microfluidics allow aqueous drugs and
other chemicals to be flowed in (the sinusoidal channels allow the animals to “hold on” during low-
velocity flow), potentially providing a platform to study pharmacological modulation of nociceptive
touch.
IS POST RESPONSE QUIESCENCE A METHOD OF ENERGY CONSERVATION?
The biological reason for the seemingly universal occurrence of sleep states among
metazoans is not known. One hypothesis is that sleep serves an energy conservation function
(Siegel, 2005)., since there is a 10-15% decrease in the metabolic rate of sleeping versus resting
mammals (Rechtschaffen, 2015). Energy use is higher during REM sleep than non-REM sleep
(Van Cauter, Polonsky and Scheen, 1997), which appears to have developed in reptiles (Eban-
Rothschild and de Lecea, 2017), so the idea is somewhat more plausible in animals without REM
sleep. Furthermore, calcium imaging data from C. elegans lethargus show a large scale
deactivation of most nerve ring neurons, with the exception of sleep active neurons (Nichols et
al., 2017). While PRQ is not sleep, its regulation by sleep active neurons and presence in UV
SIS, where ATP levels are reduced (Grubbs et al., 2019), merits the investigation of the
hypothesis that PRQ represents an opportunity for the animal to “catch its breath” after moving
when energy is scarce. I propose two experiments to investigate this hypothesis. First, I would
look for upregulation of PRQ in animals that were fasted prior to EGF overexpression. If PRQ is
an energy conservation mechanism, these animals should show more PRQ. Acute fasting is
known to upregulate locomotion (Ben Arous, Laffont and Chatenay, 2009), while prolonged
fasting suppresses it (Skora, Mende and Zimmer, 2018), so it would be necessary to vary the
duration of the fast to get a complete picture. Second, I would liberate fat stores in kin-29 loss of
114
function mutants using overexpression of the C. elegans adipose triglyceride lipase-1 orthologue
(ATGL-1) (Grubbs et al., 2019). kin-29 is the C. elegans homologue of the mammalian Sik3
kinase (Bringmann, 2019), and kin-29 mutants have greater fat stores but lower ATP levels
(Grubbs et al., 2019), making them good candidates for this manipulation. In this experiment, the
suppression of PRQ in kin-29 animals by the liberation of fat stores would be consistent with the
energy conservation hypothesis. Even if these experiments indicate suppression of PRQ when
energy is available, it will be necessary to reconcile this hypothesis with the observation that PRQ
is replaced by prolonged arousal following long duration stimuli, a phenomenon that may be
explained by the ability of the animals to mobilize “emergency” energy stores following sufficiently
strong stimuli.
IS POST RESPONSE QUIESCENCE A DEFENSIVE FREEZING BEHAVIOR?
Defensive quiescence in the form of freezing behavior or tonic immobility has been
described in animals ranging from humans (Volchan et al., 2011; Roelofs, 2017) to several
arthropods (Card, 2012; Humphreys and Ruxton, 2018). These behaviors allow prey animals to
avoid detection or cause the predator to lose interest, giving them a chance to escape when fight
or flight would likely fail. Defensive freezing has not been described in C. elegans. But while little
is known about C. elegans behavior in the wild, naïve C. elegans is reported to avoid the
kairomones (chemical signatures, like pheromones, but detected by another species) of the
predatory nematode P. pacificus (Liu et al., 2018), suggesting an inborn threat response to active
predators. PRQ occurs during an established escape response, similar to mammalian freezing
(Perusini and Fanselow, 2015), is upregulated in a stress model (though admittedly this
comparison blurs the lines between physiological and physiological stress), and therefor may
represent defensive freezing behavior.
Here I propose several experiments to test the hypothesis that PRQ is a defensive
freezing behavior. I have shown that PRQ is upregulated following ectopic EGF overexpression,
which mediates the response to cellular stress / damage (Hill et al., 2014), but may or may not

115
play a role in “predator threat stress”. If PRQ is defensive freezing, I would expect to observe
increased PRQ in animals cultured in the presence of either P. pacificus or its kairomones. If
successful at demonstrating upregulation of PRQ by predator presence, I would next attempt to
demonstrate a survival benefit, as has been demonstrated for both gentle touch response and
head movement suppression in the case of C. elegans and its trap-forming fungal predator
Drechslerella doedycoides (Maguire et al., 2011). The following assumes that P. pacificus locates
its prey using tactile or maybe electrical signals emitted as C. elegans moves. If not, I may need
to find a more suitable predator. First it would be necessary to establish that PRQ occurs in L1
larvae, which are bitten by P. pacificus (Lightfoot et al., 2016). If this occurs, survival or bite
avoidance of ceh-17, aptf-1, and WT C. elegans could be compared. Furthermore, since head
movement suppression is the main contributor to PRQ, it may be possible to use tdc-1 and lgc-55
mutants, which lack head movement suppression during gentle touch response, to reduce PRQ.
On its face, my observation of PRQ following blue light stimulation seems to contradict
the hypothesis that PRQ is defensive freezing. Sunlight contains harmful UV and is a threat, but it
is not a predator. The photosensor ASJ is polymodal, also playing a role in electrosensation.
While electrosensation has been posited to be a vestigial sense that was useful in parasitic
nematodes for locating large muscles inside hosts, (Gabel et al., 2007) I find this explanation
unsatisfying because C. elegans separated from its closest relative, C. briggsae about 100
million years ago (Stajich et al., 2003).
Why else might one characterize and study possibly defensive freezing behavior in C.
elegans? Two reasons: first, the fitness benefit of tonic immobility has been inferred from
observation (Sargeant and Eberhardt, 1975), but, for practical and ethical reasons, not
demonstrated in a controlled experiment (Humphreys and Ruxton, 2018), thus these experiments
would be interesting from the perspective of behavioral ecology. Second, given the conserved
roles of neurotransmitter systems, much can be learned about environmental and
pharmacological modulation of behavior in the worm. For example, it has already been reported

116
that the SSRI sertraline (Zoloft) suppresses predator avoidance in C. elegans (Liu et al., 2018),
as it does in mammals (Hashimoto, Inoue and Koyama, 1996). The true mechanisms of action
even of common psychotropic drugs that have been on the market for decades are still debated.
C. elegans represents a powerful model in which the mechanistic details of these drugs’ effects
on behavior can be studied.

117
APPENDIX I: Adapter for coupling a WorMotel to an audio loudspeaker
OVERVIEW
This appendix contains the plans for an adapter that allows a 48 well WorMotel
containing C. elegans to be reliably coupled to the cone of an audio loudspeaker for
mechanosensory assays using substrate vibration stimuli. When combined with this hardware,
the camera, additional hardware, and MATLAB code described in Appendix II can be used to
perform and analyze mechanosensory behavior assays like those described in Chapter 3. The
schematic (Fig. A1.1) describes the layout of the components of the adapter.
MATERIALS AND EQUIPMENT
The following materials and equipment are required to replicate our setup exactly. We
used a laser cutter to cut custom parts from acrylic sheets. Laser cutters are often available in
university mechanical engineering departments, prototyping shops, etc. The plans for the parts
are in DWG files in mm units. Different 10 cm Petri dishes than those specified may be used but
would necessitate minor changes to the design in the DWG files to ensure a proper fit.
Item Manufacturer / part #
Audio loudspeaker Pyle PLMRW10
6 cm Petri plate Tritech T3315 or similar
10 cm Petri plate (pedestal) Tritech T3361
10 cm Petri plate (wormotel holder) Corning 430293
1/8 inch clear acrylic McMaster
Laser cutter Universal VLS3.50 or similar

118
In addition to these materials you will need sandpaper, a file, epoxy adhesive, acrylic
adhesive (Scigrip 10799 or similar), flat black spraypaint or tape, four 3/4 inch 8-32 machine
screws, four 1/4 inch 4-40 machine screws, and taps to cut 8-32 and 4-40 threads.
INSTRUCTIONS FOR ASSEMBLY
Pedestal
The pedestal consists of Petri dishes glued directly to the middle of the speaker cone,
providing a stand for the rest of the adapter. To build the pedestal, use sandpaper or a file to
flatten the base of a 6 cm plate (Tritech T3315). Use epoxy to glue it, bottom to bottom, to the
center of a 10 cm Petri dish (Tritech T3361). The bottom of the 10 cm dish can be spray-painted
or covered with black tape for darkfield imaging. The pedestal is then glued directly to the center
of the speaker cone using epoxy. Bonding can be improved by roughing up the surfaces to be
glued with coarse (approx. 60 grit) sandpaper.
Petri dish holder
The Petri dish holder consists of custom acrylic pieces and screws which secure the
WorMotel holder to the pedestal. Cut acrylic pieces from 1/8 inch clear acrylic sheet stock
according to the plans in petriHolder.dwg (Fig. A1.2) using a laser cutter. To create the base of
the Petri dish holder, align and bond layers 1-3 with acrylic cement, and then cut 8-32 threads in
the holes indicated in the DWG. The base should fit snugly in the pedestal. Glue it in place with
Epoxy. The dimensions of layer 1 might need to be modified if the pedestal was made with a
different model of 10 cm plate or your laser cutter has a different kerf (radius of material removed
while cutting). Once in place, layers 1-3 provide a base for a second 10 cm Petri dish containing
the WorMotel. This dish is held in place with the fourth acrylic piece and four 3/4 inch 8-32
screws.
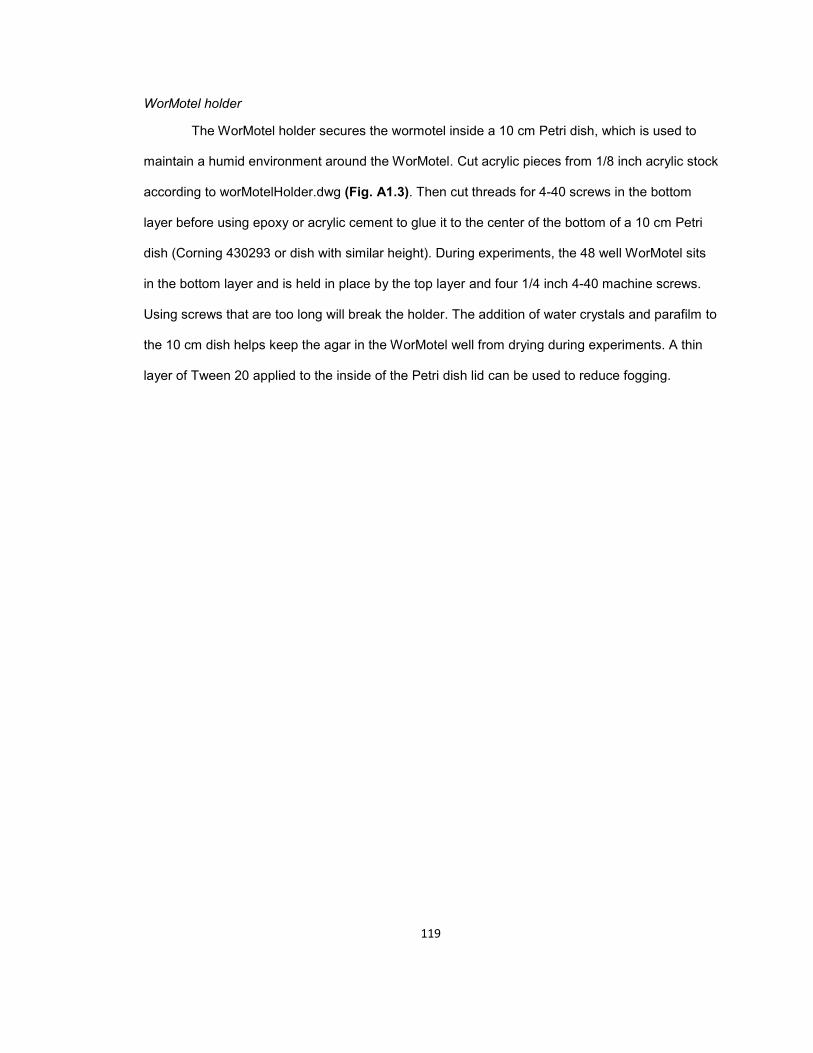
119
WorMotel holder
The WorMotel holder secures the wormotel inside a 10 cm Petri dish, which is used to
maintain a humid environment around the WorMotel. Cut acrylic pieces from 1/8 inch acrylic stock
according to worMotelHolder.dwg (Fig. A1.3). Then cut threads for 4-40 screws in the bottom
layer before using epoxy or acrylic cement to glue it to the center of the bottom of a 10 cm Petri
dish (Corning 430293 or dish with similar height). During experiments, the 48 well WorMotel sits
in the bottom layer and is held in place by the top layer and four 1/4 inch 4-40 machine screws.
Using screws that are too long will break the holder. The addition of water crystals and parafilm to
the 10 cm dish helps keep the agar in the WorMotel well from drying during experiments. A thin
layer of Tween 20 applied to the inside of the Petri dish lid can be used to reduce fogging.
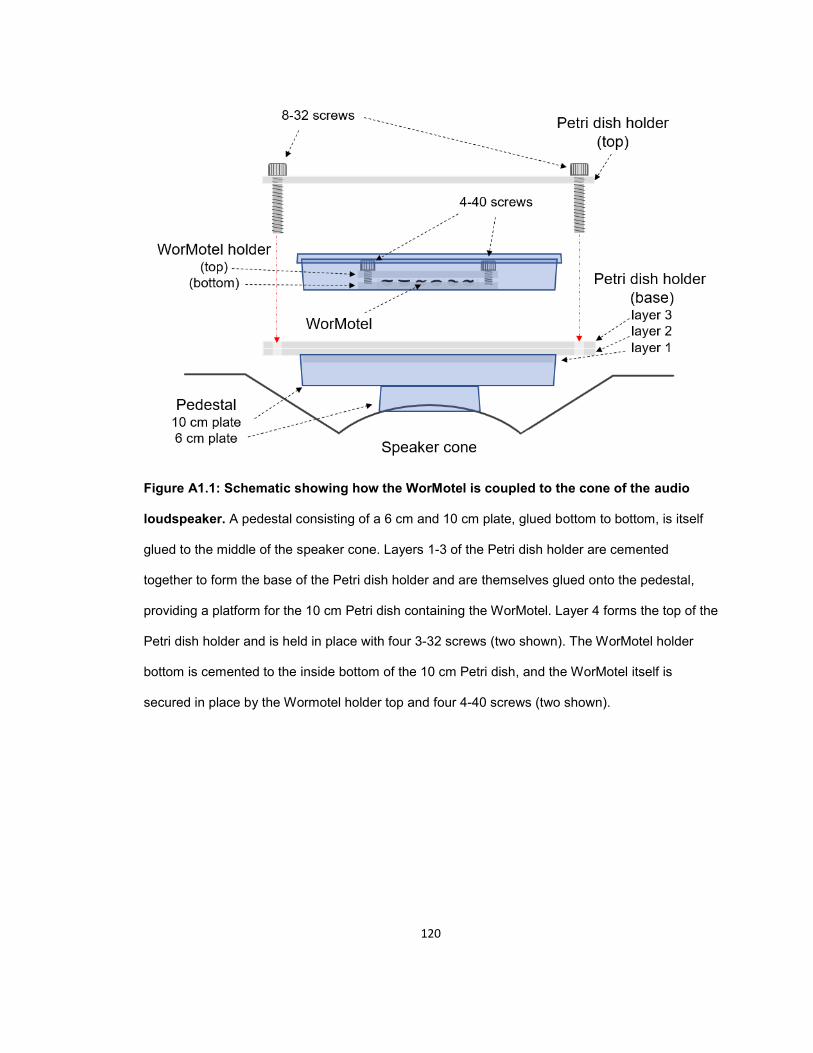
120
Figure A1.1: Schematic showing how the WorMotel is coupled to the cone of the audio
loudspeaker. A pedestal consisting of a 6 cm and 10 cm plate, glued bottom to bottom, is itself
glued to the middle of the speaker cone. Layers 1-3 of the Petri dish holder are cemented
together to form the base of the Petri dish holder and are themselves glued onto the pedestal,
providing a platform for the 10 cm Petri dish containing the WorMotel. Layer 4 forms the top of the
Petri dish holder and is held in place with four 3-32 screws (two shown). The WorMotel holder
bottom is cemented to the inside bottom of the 10 cm Petri dish, and the WorMotel itself is
secured in place by the Wormotel holder top and four 4-40 screws (two shown).
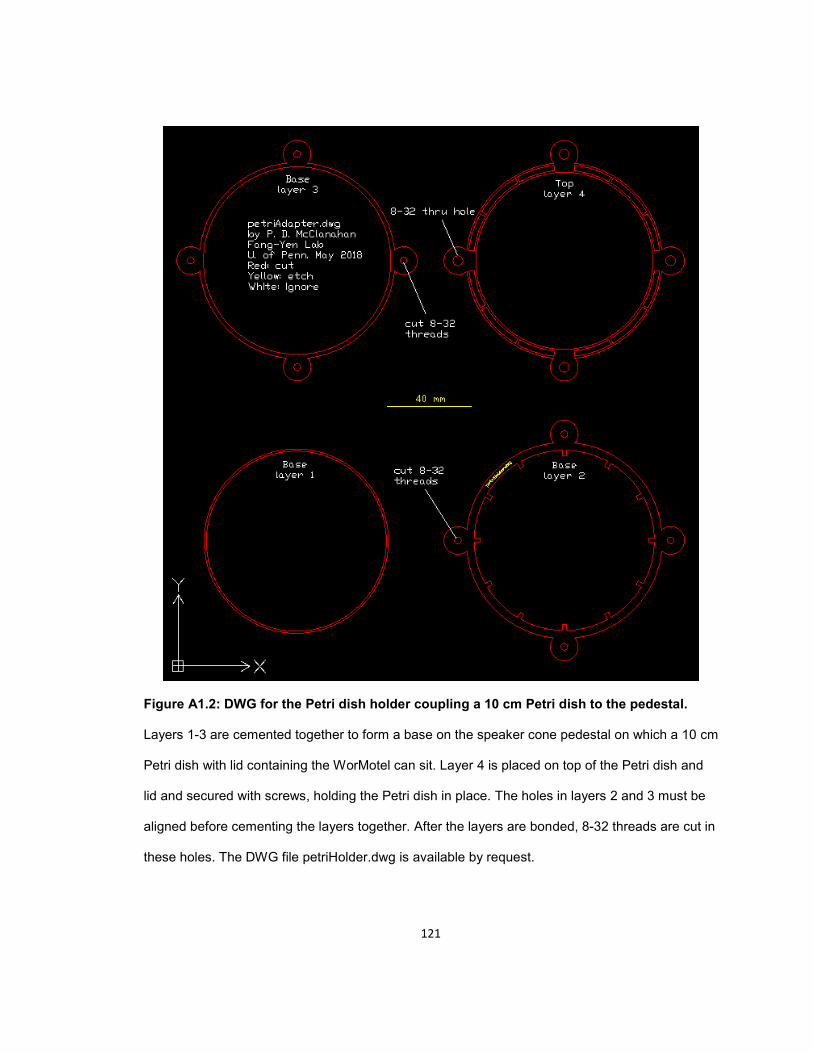
121
Figure A1.2: DWG for the Petri dish holder coupling a 10 cm Petri dish to the pedestal.
Layers 1-3 are cemented together to form a base on the speaker cone pedestal on which a 10 cm
Petri dish with lid containing the WorMotel can sit. Layer 4 is placed on top of the Petri dish and
lid and secured with screws, holding the Petri dish in place. The holes in layers 2 and 3 must be
aligned before cementing the layers together. After the layers are bonded, 8-32 threads are cut in
these holes. The DWG file petriHolder.dwg is available by request.

122
Figure A1.3: DWG for the WorMotel holder securing a 48 well wormotel in the Petri dish.
The bottom is glued to the bottom inside of a 10 cm Petri dish. With the WorMotel nested inside,
the top can be secured with screws, holding the WorMotel in place during mechanosensory
assays. 4-40 threads should be cut where indicated before gluing. The DWG file
worMotelHolder.dwg is available by request.

123
APPENDIX II: MATLAB code for data acquisition and processing
OVERVIEW
The following MATLAB code was used for data acquisition, administration of
mechanosensory stimuli, and difference image processing for most of the studies described in
Chapter 3. Briefly, the MATLAB GUI for Image Acquisition acquires and saves a sequence of
bitmap images, the MATLAB GUI for Mechanosensory Stimulation sends audio signals to a
speaker coupled to a WorMotel containing C. elegans, and the MATLAB code for difference
image activity and quiescence detection processes the behavioral data acquired using the GUIs,
generating basic plots and saving the processed data for further analysis. This version of the
MATLAB GUI for Mechanosensory Stimulation relies on the PC’s audio jack to output the audio
signal. Another version utilizing a PCI-based NIDAQ (PCI-6281, National Instruments, Austin, TX)
is available upon request. All code was written and tested in MATLAB R2017a running on a PC
with Windows 7 Professional and may need to be modified if used with future releases. Additional
instructions, hardware, and software dependencies are listed for each section. If necessary, the
code can be modified to work with different hardware, but this may require additional or different
drivers and expertise in MATLAB.
MATLAB GUI FOR IMAGE ACQUISITION
Required hardware
10 megapixel CMOS camera (DMK 24UJ003, The Imaging Source, Charlotte, NC)
12.5 mm lens (HF12.5SA-1, Fujifilm Corp., Tokyo, Japan)
5 mm threaded C-mount spacer ring plus 1.5 mm of non-threaded spacer rings – these are
placed between the camera and lens to allow close up focusing.
Red LED strips (Oznium, Inc.)
Windows PC running Windows 7 Professional or similar

124
Required software
IC Capture software (available online from The Imaging Source)
Device Driver for USB Cameras (available online from The Imaging Source)
MATLAB R2017a (MathWorks, Inc., Natick, MA)
Instructions
1. Open IC Capture and set the camera to full sensor resolution and 0.3 s exposure.
2. Adjust the field of view and focus as desired, then close IC Capture.
3. Open MATLAB R2017a and ensure that cameraGUI.fig and cameraGUI.m are on the path.
4. Run cameraGUI.m. The GUI window should pop up.
5. Click “Set image dir” to select the directory for saving images, then click “Set image info dir.” to
select the directory for saving image information (typically a level above the image directory).
Then enter the frame rate in frames per second (fps, typically 1 for the experiments in chapter 3),
the time limit (video duration) in hours, the name of the imaging rig, and the name of the video,
which will be used as a prefix for the individual frames. Inputs are confirmed by output to the
MATLAB command line.
6. Click “Connect to Cam.” to connect MATLAB to the camera and wait for command line
confirmation.
7. Click “Test Image”. An image should appear in the GUI window along with the date, time, and
median pixel intensity. Verify that the field of view and median intensity are correct. If you need to
adjust the field of view or focus, you can click “Release Camera” and make adjustments using live
view in IC Capture without closing the GUI, then close IC Capture and click “Connect to Cam.”
again.

125
8. When you are ready to start, click “Begin Imaging”. Numbered images will be saved to the
image directory, and a .mat file containing frame times will be saved to the image information
directory.
9. During imaging, progress will be updated to the command line. At the end of the video, the
camera is released automatically, and plots of the frame to frame time intervals are displayed.
Occasionally frame rate can slow down due to interference from background processes or other
causes, and these plots are useful for detecting and correcting these problems. To that end, it is
recommended that all applications besides MATLAB be closed during imaging, and that the
computer be disconnected from the internet.
Code
The following script runs the camera. It should be copied into a .m file named cameraGUI.m. The
file is also available on request.
function varargout = cameraGUI(varargin) % CAMERA GUI (REQUIRES GUI FIG FILE) % BY P. D. MCCLANAHAN % FANG-YEN LAB % UNIVERSITY OF PENNSYLVANIA % [email protected] % LAST UPDATED JULY 2019 % This GUI acquires images using an Imaging Source DMK24UJ003 camera, but % by installing the necessary drivers and making a few mods it could be % used with a range of cameras. % This GUI was make in MATLAB's GUIDE. I have left some of the auto- % generated comments along with my own. % Begin initialization code - DO NOT EDIT gui_Singleton = 1; gui_State = struct('gui_Name', mfilename, ... 'gui_Singleton', gui_Singleton, ... 'gui_OpeningFcn', @cameraGUI_OpeningFcn, ... 'gui_OutputFcn', @cameraGUI_OutputFcn, ... 'gui_LayoutFcn', [] , ... 'gui_Callback', []); if nargin && ischar(varargin{1}) gui_State.gui_Callback = str2func(varargin{1});

126
end if nargout [varargout{1:nargout}] = gui_mainfcn(gui_State, varargin{:}); else gui_mainfcn(gui_State, varargin{:}); end % End initialization code - DO NOT EDIT % --- Executes just before cameraGUI is made visible. function cameraGUI_OpeningFcn(hObject, eventdata, handles, varargin) handles.output = hObject; guidata(hObject, handles); % --- Outputs from this function are returned to the command line. function varargout = cameraGUI_OutputFcn(hObject, eventdata, handles) % Get default command line output from handles structure set(handles.axes1,'xtick',[]); set(handles.axes1,'ytick',[]); varargout{1} = handles.output; % --- Executes on button press in set_im_dir. function set_im_dir_Callback(hObject, eventdata, handles) global image_folder image_folder = uigetdir('','Pick a directory for saving the image files...'); set(handles.im_dir,'String',image_folder); % --- Executes on button press in set_im_inf_dir. function set_im_inf_dir_Callback(hObject, eventdata, handles) global image_info_folder image_info_folder = uigetdir('','Pick a directory for saving the image *information*...'); set(handles.im_inf_dir,'String',image_info_folder); % --- Executes on button press in camera_connect. function camera_connect_Callback(hObject, eventdata, handles) global cam1 exposure = 0.3; ROI = [1 1 3872 2764]; format = 'Y800 (3872x2764)'; disp(['Exposure time hard-coded to ',num2str(exposure),' sec.']);

127
% SETUP IMAGING SOURCE CAMERA WITH ADAPTER TISImaq_R2013_64 % NB: Editable device properties change and camera speed increases after % the USB cam driver usbcam_2.9.4_tis for IC Capture is installed, even % though this driver is not actually needed for MATLAB to use the camera. % Run to see list of installed adapters % adapters = imaqhwinfo; devices = imaqhwinfo('tisimaq_r2013_64'); for d = 1:length(devices.DeviceInfo) if strcmp(devices.DeviceInfo(d).DeviceName, 'DMK 24UJ003') device_ID = d; break; elseif strcmp(devices.DeviceInfo(d).DeviceName, 'TIS UVC Device') device_ID = d; break; end end clear d devices % Works in r2017a; in r2017b, this can see both the USB and GIGE cameras, % but crashes when an attempt is made to connect to either one. % Other possible adapters: % devices = imaqhwinfo('tisimaq_r2013'); % this is the old adapter for USB % cameras % devices = imaqhwinfo('gige'); % this crashes MATLAB % devices = imaqhwinfo('gentl'); % for Basler cameras % Set camera properties: cam1 = imaq.VideoDevice('tisimaq_r2013_64',device_ID); cam1.DeviceProperties.Brightness = 168; cam1.DeviceProperties.Contrast = 0; cam1.DeviceProperties.Denoise = 0; cam1.DeviceProperties.Exposure = exposure; % non default cam1.DeviceProperties.ExposureAuto = 'Off'; cam1.DeviceProperties.ExposureAutoMaxValue = 0.34411; cam1.DeviceProperties.ExposureAutoReference = 128; cam1.DeviceProperties.FrameRate = 1; % non default cam1.DeviceProperties.GPIOGPIN = 0; cam1.DeviceProperties.GPIOGPOut = 0; cam1.DeviceProperties.GPIORead = 'Ready'; cam1.DeviceProperties.GPIOWrite = 'Ready'; cam1.DeviceProperties.Gain = 0; cam1.DeviceProperties.GainAuto = 'Off'; cam1.DeviceProperties.Gamma = 100; cam1.DeviceProperties.Highlightreduction = 'Disable'; % cam1.DeviceProperties.SerialNo = 42510681; % not user settable cam1.DeviceProperties.Sharpness = 0; cam1.DeviceProperties.Strobe = 'Disable'; cam1.DeviceProperties.StrobeDuration = 3.2; cam1.DeviceProperties.StrobePolarity = 'Low';

128
% cam1.DeviceProperties.ToneMapping = 'Disable'; % cam1.DeviceProperties.ToneMappingContrast = 0; % cam1.DeviceProperties.ToneMappingIntensity = 0; cam1.VideoFormat = format; % non default cam1.ROI = ROI; % non default disp('Camera setup successful'); function frame_rate_Callback(hObject, eventdata, handles) global fps fps = str2double(get(hObject,'String')); disp(['Frame rate set to ',num2str(fps)]); % --- Executes during object creation, after setting all properties. function frame_rate_CreateFcn(hObject, eventdata, handles) if ispc && isequal(get(hObject,'BackgroundColor'), get(0,'defaultUicontrolBackgroundColor')) set(hObject,'BackgroundColor','white'); end % Get video time limit from user function limit_Callback(hObject, eventdata, handles) global limit limit = str2double(get(hObject,'String')); disp(['Video limit set to ',num2str(limit),' hours, or ',num2str(round(limit*3600)),' seconds.']); limit = round(limit*3600); % --- Executes during object creation, after setting all properties. function limit_CreateFcn(hObject, eventdata, handles) if ispc && isequal(get(hObject,'BackgroundColor'), get(0,'defaultUicontrolBackgroundColor')) set(hObject,'BackgroundColor','white'); end % --- Executes on button press in release_cam. % Releases the camera so other applications can access it function release_cam_Callback(hObject, eventdata, handles) global cam1

129
release(cam1); disp('Camera released, you can now use it in IC Capture.'); % --- Executes on button press in test_image. % Takes a test image and displays a preview and the median pixel intensity function test_image_Callback(hObject, eventdata, handles) global cam1 I = step(cam1); cla(handles.axes1); disp(['Median pixel intensity in image is ',num2str(median(I(:)))]); imshow(I,'Parent',handles.axes1); text(10,30,['Test image taken at ',datestr(datetime)],'Parent',handles.axes1,'Color',[1 0 0]) text(10,110,['Median pixel intensity in image is ',num2str(median(I(:)))],'Parent',handles.axes1,'Color',[1 0 0]) clear I; % --- Executes on button press in imaing ('Begin Imaging') % This function runs the camera during an imaging session, saving frames % and timestamps. At the end it plots frame times so the user can easily % see if the imaging system became stuck or otherwise delayed during the % recording. function imaging_Callback(hObject, eventdata, handles) global rig vid_name image_folder image_info_folder cam1 limit fps start_time = datestr(clock); disp(['Started at ',start_time]); time_stamps = NaN(limit,1); frame_time = 1/fps; tic; vid_start_time = datetime; f = 1; save([image_info_folder,'\',vid_name,'_timestamps.mat'],'time_stamps','vid_start_time','rig','fps','limit','vid_name'); while toc < limit t1 = toc; I1 = step(cam1); time_stamps(f) = toc; imwrite(I1,[image_folder,'\',vid_name,'-',num2str(f,'%05d'),'.bmp']); clear I1 f = f+1; elapsed = toc-t1; disp(['Saved frame ',num2str(f,'%05d'),', time elapsed = ',num2str(toc),'.']); if mod(f,60) == 0
130
save([image_info_folder,'\',vid_name,'_timestamps.mat'],'time_stamps','-append'); end if elapsed < frame_time pause(frame_time - elapsed); else disp('Image rate slow'); end end vid_finish_time = datetime; disp(['Finished at ',datestr(vid_finish_time)]); save([image_info_folder,'\',vid_name,'_timestamps.mat'],'time_stamps','vid_start_time','vid_finish_time','rig'); h1 = figure; hold on; plot(time_stamps,[1:length(time_stamps)],'k.','MarkerSize',12); set(gca,'FontSize',12); title(['Time stamps from ',vid_name],'interpreter','none'); xlabel('time (s)'); ylabel('frame #'); savefig(h1,[image_info_folder,'\',vid_name,'_timestamps_plot.fig']); h2 = figure; hold on; frame_times = time_stamps(2:end)-time_stamps(1:end-1); plot(1:length(frame_times),frame_times,'k.','MarkerSize',12); set(gca,'FontSize',12); title(['Frame times from ',vid_name],'interpreter','none'); xlabel('frame #'); ylabel('time (s)'); savefig(h2,[image_info_folder,'\',vid_name,'_frametimes_plot.fig']); release(cam1); disp('Camera released.'); % --- Executes on button press in quit. % Closes the GUI function quit_Callback(hObject, eventdata, handles) close; disp('Bye!'); % Gets the name of the experiment rig used from user input function rig_name_Callback(hObject, eventdata, handles) global rig rig = get(hObject,'String'); disp(['Rig name set to ',rig]);
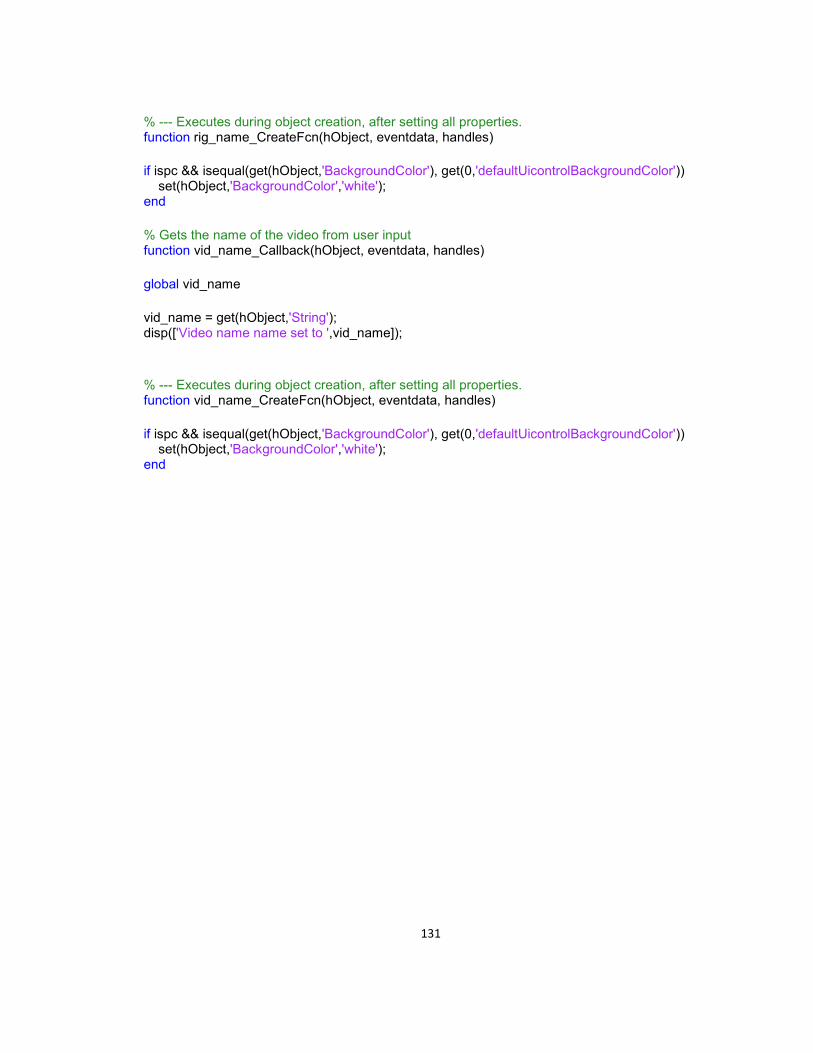
131
% --- Executes during object creation, after setting all properties. function rig_name_CreateFcn(hObject, eventdata, handles) if ispc && isequal(get(hObject,'BackgroundColor'), get(0,'defaultUicontrolBackgroundColor')) set(hObject,'BackgroundColor','white'); end % Gets the name of the video from user input function vid_name_Callback(hObject, eventdata, handles) global vid_name vid_name = get(hObject,'String'); disp(['Video name name set to ',vid_name]); % --- Executes during object creation, after setting all properties. function vid_name_CreateFcn(hObject, eventdata, handles) if ispc && isequal(get(hObject,'BackgroundColor'), get(0,'defaultUicontrolBackgroundColor')) set(hObject,'BackgroundColor','white'); end
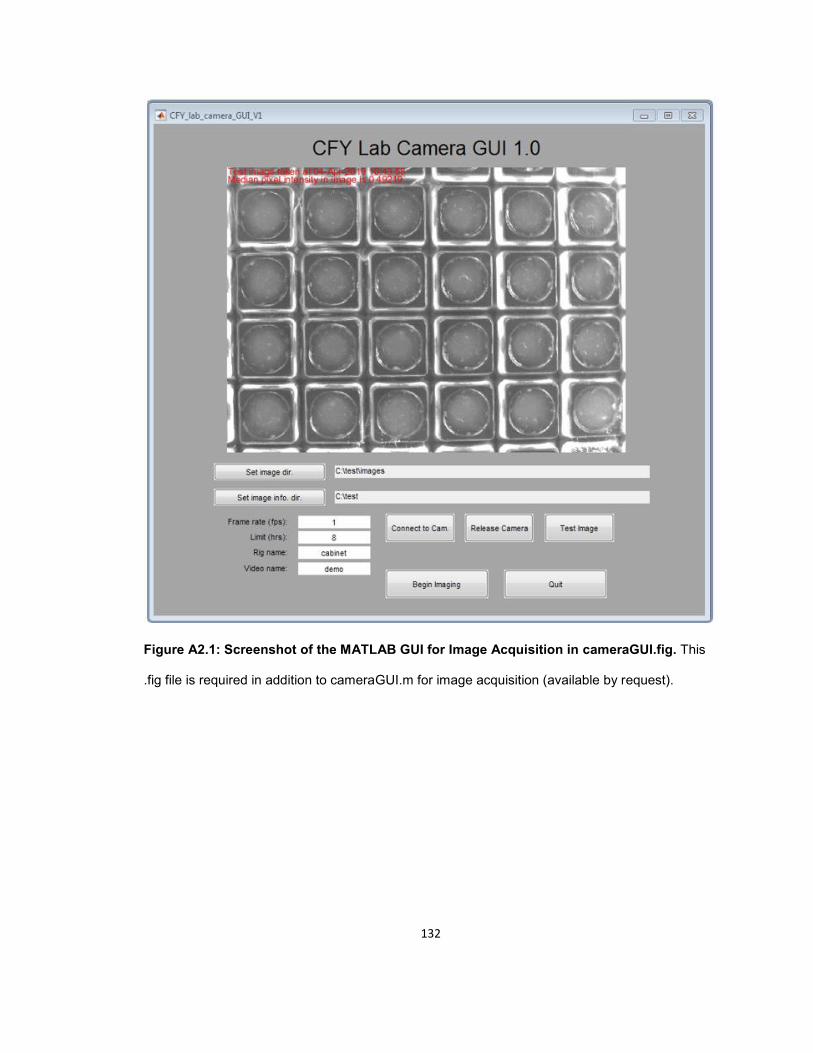
132
Figure A2.1: Screenshot of the MATLAB GUI for Image Acquisition in cameraGUI.fig. This
.fig file is required in addition to cameraGUI.m for image acquisition (available by request).

133
MATLAB GUI FOR MECHANOSENSORY STIMULATION
Required hardware
10-Inch marine subwoofer (speaker) with acrylic mounting plates and screws to hold the wormotel
(see Appendix I)
48 well WorMotel (available by request)
Amplifier (KAC-M1804 , Kenwood, Long Beach, CA)
Windows PC with an audio jack running Windows 7 Professional or similar
Required software
MATLAB R2017a (from MathWorks, Inc., Natick, MA)
Instructions
1. Ensure that the PC audio output is connected to the amplifier, the amplifier is powered, and the
amplifier is connected to the speaker. This may require soldering or specialized connectors. If set
up correctly, the PC audio should play from the experiment speaker. For experimental
consistency, always use the same PC audio settings. If using multiple PCs for experiments,
considering using an oscilloscope to measure and compare the audio signal amplitude.
2. If imaging, open a second instance of MATLAB R2017a and ensure that speakerGUI.m and
speakerGUI.fig are on the path.
4. Run speakerGUI.m. A GUI window should pop up.
5. Type the desired frequencies (Hz), amplitudes (0 to peak), stimulus durations (s), ISI (inter-
stimulus interval, s), initial wait time (time before first stimulus, s), # of stimuli, and experiment
name, and select a save path (directory where stimulus parameters and timing information will be
saved). The frequencies, amplitudes, durations, and ISIs can be specified for each stimulus by
separating the values with commas, or the same parameters can be applied to all the stimuli by
134
entering one parameter and setting “# of stimuli” to the desired number, or a subset of the
parameters can be specified for each stimulus.
6. Click “Test Buzz” to test the speaker. This will play a single stimulus according to the
parameters specified for the initial stimulus.
7. Click “Run” to run the stimulus sequence. Progress updates will be printed to the command
line. After the stimulus series is over, a .mat file containing the stimulus timing and parameters
will be saved on the save path.
Code:
The following code runs the GUI for mechanosensory stimulation. It should be copied into a .m
file called speakerGUI.m. The file is also available by request.
function varargout = speakerGUI(varargin) % SPEAKER STIMULUS GUI CODE - AUDIO PORT VERSION (REQUIRES GUI FIG FILE) % BY P. D. MCCLANAHAN % UNIVERSITY OF PENNSYLVANIA % [email protected] % LAST UPDATED JULY 2019 % This GUI was made in MATLAB's GUIDE, and much of the code is auto- % generated. I have left a subset of the auto- generated comments along % with my own. % The following functions are called by GUI button presses: % speakerTestFunction.m % speakerExpFunction.m % Begin initialization code - DO NOT EDIT gui_Singleton = 1; gui_State = struct('gui_Name', mfilename, ... 'gui_Singleton', gui_Singleton, ... 'gui_OpeningFcn', @speakerGUI_OpeningFcn, ... 'gui_OutputFcn', @speakerGUI_OutputFcn, ... 'gui_LayoutFcn', [] , ... 'gui_Callback', []); if nargin && ischar(varargin{1}) gui_State.gui_Callback = str2func(varargin{1}); end if nargout

135
[varargout{1:nargout}] = gui_mainfcn(gui_State, varargin{:}); else gui_mainfcn(gui_State, varargin{:}); end % End initialization code - DO NOT EDIT % --- Executes just before speakerGUI is made visible. function speakerGUI_OpeningFcn(hObject, eventdata, handles, varargin) handles.abort = 0; handles.output = hObject; guidata(hObject, handles); % --- Outputs from this function are returned to the command line. function varargout = speakerGUI_OutputFcn(hObject, eventdata, handles) varargout{1} = handles.output; % Gets user frequency input function frequencies_box_Callback(hObject, eventdata, handles) global fs fs_string = get(hObject,'String'); if iscell(fs_string) fs_string = fs_string{1}; end fs = []; f = []; c = 1; while c <= length(fs_string) fs_string_char = fs_string(c); if ismember(fs_string_char,'.01234567890') s = 1; f = [f,fs_string_char]; else %spaces, commas if s == 1 f = str2num(f); fs = [fs,f]; f = []; s = 0; end end c = c + 1; if c == length(fs_string) + 1 && s == 1 f = str2num(f); fs = [fs,f]; s = 0; end end disp(['Frequency(ies) set to ',num2str(fs),' Hz']); % --- Executes during object creation, after setting all properties. function frequencies_box_CreateFcn(hObject, eventdata, handles) if ispc && isequal(get(hObject,'BackgroundColor'), get(0,'defaultUicontrolBackgroundColor')) set(hObject,'BackgroundColor','white'); end
136
% Gets user amplitude input function amplitudes_Callback(hObject, eventdata, handles) global as as_string = get(hObject,'String'); pause(.1); if iscell(as_string) as_string = as_string{1}; end as = []; a = []; c = 1; while c <= length(as_string) as_string_char = as_string(c); if ismember(as_string_char,'.01234567890') s = 1; a = [a,as_string_char]; else %spaces, commas if s == 1 a = str2num(a); as = [as,a]; a = []; s = 0; end end c = c + 1; if c == length(as_string) + 1 && s == 1 a = str2num(a); as = [as,a]; s = 0; end end disp(['Amplitude(s) set to ',num2str(as),' V']); % --- Executes during object creation, after setting all properties. function amplitudes_CreateFcn(hObject, eventdata, handles) if ispc && isequal(get(hObject,'BackgroundColor'), get(0,'defaultUicontrolBackgroundColor')) set(hObject,'BackgroundColor','white'); end % Gets user duration input function durations_Callback(hObject, eventdata, handles) global ds ds_string = get(hObject,'String'); pause(.1); if iscell(ds_string) ds_string = ds_string{1}; end ds = []; d = []; c = 1; while c <= length(ds_string) ds_string_char = ds_string(c); if ismember(ds_string_char,'.01234567890') s = 1; d = [d,ds_string_char];

137
else %spaces, commas if s == 1 d = str2num(d); ds = [ds,d]; d = []; s = 0; end end c = c + 1; if c == length(ds_string) + 1 && s == 1 d = str2num(d); ds = [ds,d]; s = 0; end end disp(['Duration(s) set to ',num2str(ds),' seconds']); % --- Executes during object creation, after setting all properties. function durations_CreateFcn(hObject, eventdata, handles) if ispc && isequal(get(hObject,'BackgroundColor'), get(0,'defaultUicontrolBackgroundColor')) set(hObject,'BackgroundColor','white'); end % Gets user interstimulus interval (ISI) input function ISI_Callback(hObject, eventdata, handles) global ISI ISI_string = get(hObject,'String'); pause(.1); if iscell(ISI_string) ISI_string = ISI_string{1}; end ISI = str2num(ISI_string); disp(['ISI set to ',num2str(ISI),' seconds']); % --- Executes during object creation, after setting all properties. function ISI_CreateFcn(hObject, eventdata, handles) if ispc && isequal(get(hObject,'BackgroundColor'), get(0,'defaultUicontrolBackgroundColor')) set(hObject,'BackgroundColor','white'); end % Gets user inial wait (time before first stimulus) input function initial_wait_Callback(hObject, eventdata, handles) global init_wait init_wait_string = get(hObject,'String'); pause(.1); if iscell(init_wait_string) init_wait_string = init_wait_string{1};

138
end init_wait = str2num(init_wait_string); disp(['Initial wait time set to ',num2str(init_wait),' seconds']); % --- Executes during object creation, after setting all properties. function initial_wait_CreateFcn(hObject, eventdata, handles) if ispc && isequal(get(hObject,'BackgroundColor'), get(0,'defaultUicontrolBackgroundColor')) set(hObject,'BackgroundColor','white'); end % Gets # of stimuli to administer function num_stim_Callback(hObject, eventdata, handles) global num_stim num_stim_string = get(hObject,'String'); pause(.1); if iscell(num_stim_string) num_stim_string = num_stim_string{1}; end num_stim = str2num(num_stim_string); disp(['Number of stimuli set to ',num2str(num_stim)]); % --- Executes during object creation, after setting all properties. function num_stim_CreateFcn(hObject, eventdata, handles) if ispc && isequal(get(hObject,'BackgroundColor'), get(0,'defaultUicontrolBackgroundColor')) set(hObject,'BackgroundColor','white'); end % --- Executes on button press in run_experiment. % Calls the function 'speakerExpFunction', which runs the speaker % according to user inputs function run_experiment_Callback(hObject, eventdata, handles) global fs as ds ISI init_wait num_stim exp_name save_path speakerExpFunction(fs, as, ds, ISI, init_wait, num_stim,exp_name, save_path); % --- Executes on button press in abort. function abort_Callback(hObject, eventdata, handles) handles.abort = 1; guidata(hObject, handles); % --- Executes on button press in quit. % Closes the GUI function quit_Callback(hObject, eventdata, handles)

139
close; disp('Bye!'); % --- Executes on button press in test_buzz. function test_buzz_Callback(hObject, eventdata, handles) global fs as ds speakerTestFunction(fs, as, ds); % Gets experiment name from the user function exp_name_box_Callback(hObject, eventdata, handles) global exp_name exp_name = get(hObject,'String'); disp(['Experiment name set to ',exp_name]); % --- Executes during object creation, after setting all properties. function exp_name_box_CreateFcn(hObject, eventdata, handles) if ispc && isequal(get(hObject,'BackgroundColor'), get(0,'defaultUicontrolBackgroundColor')) set(hObject,'BackgroundColor','white'); end % --- Executes on button press in save_path. % Gets path for saving stimulus parameters from the user function save_path_Callback(hObject, eventdata, handles) global save_path save_path = uigetdir('*','Choose a directory to save the stimulus info...'); set(handles.save_path_box,'string',save_path) % --- Executes during object creation, after setting all properties. function save_path_box_CreateFcn(hObject, eventdata, handles) The following is a dependency of speakerGUI.m and should be copied into a .m file called
speakerExpFunction.m on the MATLAB path. The file is also available by request.
function speakerExpFunction(fs, as, ds, ISI, init_wait, num_stim,exp_name, save_path) % SPEAKER STIMULUS EXPERIMENT FUNCTION - AUDIO JACK VERSION (CALLED BY GUI) % BY P. D. MCCLANAHAN % FANG-YEN LAB % UNIVERSITY OF PENNSYLVANIA % [email protected]
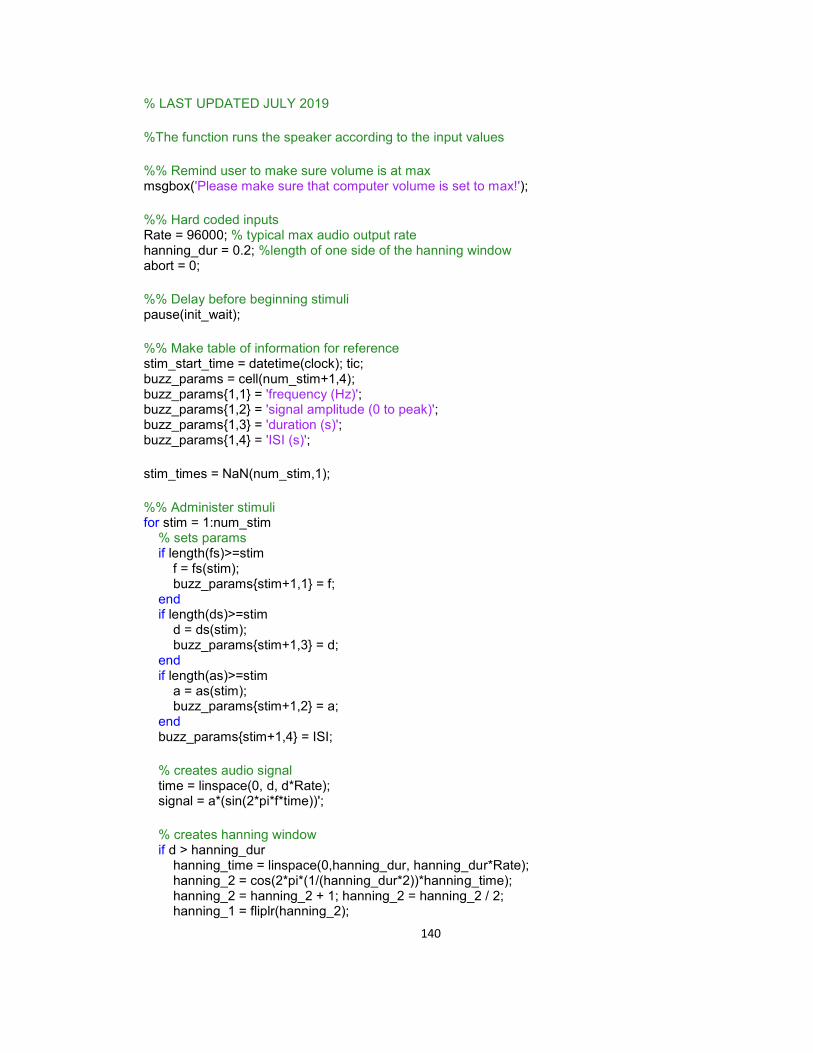
140
% LAST UPDATED JULY 2019 %The function runs the speaker according to the input values %% Remind user to make sure volume is at max msgbox('Please make sure that computer volume is set to max!'); %% Hard coded inputs Rate = 96000; % typical max audio output rate hanning_dur = 0.2; %length of one side of the hanning window abort = 0; %% Delay before beginning stimuli pause(init_wait); %% Make table of information for reference stim_start_time = datetime(clock); tic; buzz_params = cell(num_stim+1,4); buzz_params{1,1} = 'frequency (Hz)'; buzz_params{1,2} = 'signal amplitude (0 to peak)'; buzz_params{1,3} = 'duration (s)'; buzz_params{1,4} = 'ISI (s)'; stim_times = NaN(num_stim,1); %% Administer stimuli for stim = 1:num_stim % sets params if length(fs)>=stim f = fs(stim); buzz_params{stim+1,1} = f; end if length(ds)>=stim d = ds(stim); buzz_params{stim+1,3} = d; end if length(as)>=stim a = as(stim); buzz_params{stim+1,2} = a; end buzz_params{stim+1,4} = ISI; % creates audio signal time = linspace(0, d, d*Rate); signal = a*(sin(2*pi*f*time))'; % creates hanning window if d > hanning_dur hanning_time = linspace(0,hanning_dur, hanning_dur*Rate); hanning_2 = cos(2*pi*(1/(hanning_dur*2))*hanning_time); hanning_2 = hanning_2 + 1; hanning_2 = hanning_2 / 2; hanning_1 = fliplr(hanning_2);

141
hanning = ones(1,length(signal)); hanning(1:length(hanning_1)) = hanning_1; hanning(end-length(hanning_2)+1:end) = hanning_2; signal = signal.*hanning'; else disp('Signal too short for a hanning window.'); end %adds padding padding = zeros(100,1); signal = [padding;signal;padding]; % readies audio signal player = audioplayer(signal,Rate); play(player); stim_times(stim) = toc; pause(d); if ISI >= d pause(ISI-d); else disp('Warning: ISI set to less than length of stimulus, playing as fast as possible'); end if abort break; end end stim_end_time = datetime(clock); %% Save parameters if abort disp('Experiment aborted') end save_string = strcat(save_path,'\',num2str(year(datetime)),num2str(month(datetime),... '%02d'),num2str(day(datetime),'%02d'),num2str(hour(datetime),... '%02d'),num2str(minute(datetime),'%02d'),... num2str(round(second(datetime)),'%02d'),'_',exp_name,'_stim_time_info.mat'); save(save_string,'stim_start_time','stim_end_time','init_wait','buzz_params','stim_times'); end The following is a dependency of speakerGUI.m and should be copied into a .m file called
speakerTestFunction.m. The file is also available by request.

142
function speakerTestFunction(fs, as, ds) % SPEAKER STIMULUS TEST FUNCTION - AUDIO JACK VERSION (CALLED BY GUI) % BY P. D. MCCLANAHAN % FANG-YEN LAB % UNIVERSITY OF PENNSYLVANIA % [email protected] % LAST UPDATED JULY 2019 % Plays the speaker once with the inputs (or first input where array) given % The function runs the speaker according to the input values disp('Do testing with system volume set to max to ensure consistency!'); %% Hard coded inputs and NIDAQ setup for LED Rate = 96000; % typical max audio output rate hanning_dur = 0.2; % length of one side of the hanning window %% Administer stimulus stim = 1; % Creates audio signal time = linspace(0, ds(stim), ds(stim)*Rate); signal = as(stim)*(sin(2*pi*fs(stim)*time))'; % Creates hanning window if ds(stim) > hanning_dur hanning_time = linspace(0,hanning_dur, hanning_dur*Rate); hanning_2 = cos(2*pi*(1/(hanning_dur*2))*hanning_time); hanning_2 = hanning_2 + 1; hanning_2 = hanning_2 / 2; hanning_1 = fliplr(hanning_2); hanning = ones(1,length(signal)); hanning(1:length(hanning_1)) = hanning_1; hanning(end-length(hanning_2)+1:end) = hanning_2; signal = signal.*hanning'; else disp('Signal too short for a hanning window.'); end % Adds padding padding = zeros(100,1); signal = [padding;signal;padding]; % Plays audio signal player = audioplayer(signal,Rate); play(player); pause(ds(stim)); pause(.75);
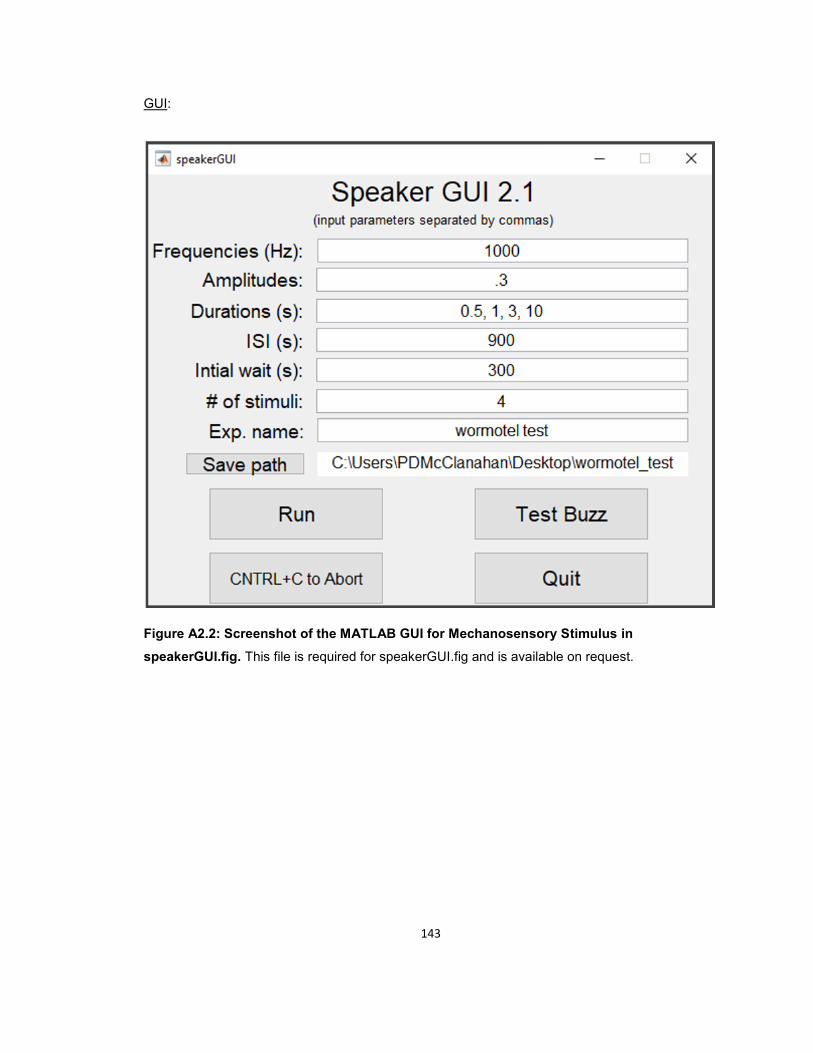
143
GUI:
Figure A2.2: Screenshot of the MATLAB GUI for Mechanosensory Stimulus in
speakerGUI.fig. This file is required for speakerGUI.fig and is available on request.
144
MATLAB CODE FOR DIFFERENCE IMAGE ACTIVITY AND QUIESCENCE DETECTION
Required hardware and software
Windows PC with MATLAB R2017a running Windows 7 Professional or similar
Instructions
1. Acquire image data and administer mechanosensory stimuli as described above. You will need
the image data as well as the .mat files created by the camera and speaker GUIs.
2. Once the .m and .fig (Fig. A2.3) files below are on your MATLAB path, you can run the entire
image processing pipeline by running each section of wormotelProcessingMain sequentially and
following the instructions for user input.
3. After successful processing, basic heatmaps of difference image activity and quiescence will
be saved in the processed data directory in a subfolder called “activityPlots”. In addition, a .mat
file containing a matrix of the difference image activity for each well (row) at each consecutive
frame pair (column) will be saved in the processed data directory for use in further analysis.
Code
The following script should be copied into a .m file named wormotelProcessingMain.m. The file
is also available by request.
% MAIN WORMOTEL DATA PROCESSING SCRIPT % BY P. D. MCCLANAHAN % FANG-YEN LAB % UNIVERSITY OF PENNSYLVANIA % [email protected] % LAST UPDATED JULY 2019 % This script organizes the image processing process so that batches of % videos can be processed together. Each section completes a particular % task. In the first two sections manual inputs are needed. This script % takes the manual inputs for all the videos at once, saving time. % The analysis scripts must be on your MATLAB path: addpath('<paste path to analysis scripts & run each section>'); % 'analysis scripts' includes the following:
145
% I_processingInput, which itself requires % drawWormotelROIs.m % wormInfoGUI.m % wormInfoGUI.fig % II_wormotelActivity, which itself requies nothing % % Some plotting scripts are needed to generate basic plots: % plotActogram.m % plotQuietogram.m % In addition to these scripts, you need the <vidname>_timestamps.mat file % created by the camera GUI and, if there were stimuli, the % <datestring_expname>_stim_time_info.mat file containing the stimulus % parameters and timing information. %% Specify .avi videos to process and save the processing queue % If you have completed this step previously for a batch of recordings, you % can open the .mat you created here and proceed to where you left off. bmp_folders = cell(0,0); bmp_paths = cell(0,0); % Creates a queue of videos to process, this can be a queue of one. go = 1; while go == 1 bmp_path = uigetdir('','Pick a folder containing separate .bmp video frames'); [bmp_path,bmp_folder] = fileparts(bmp_path); bmp_folders = [bmp_folders,[bmp_folder,'\']]; bmp_paths = [bmp_paths,[bmp_path,'\']]; disp('So far you have added the following folders to the processing list:'); disp(bmp_folders); disp('Located in these directories:'); disp(bmp_paths); go = input('Would you like to pick another video to analyze? (1 or 0):'); end [all_save_name,all_save_path] = uiputfile('*','Save the processng queue...'); clear go avi_path avi_name save([all_save_path,all_save_name,'.mat']); %% 1: User inputs for processing % Run this right after step 1, or load a processing queue .mat file first % (the one you saved in the previous section) % Gets user input needed to process videos, follow the instructions.

146
for vid = 1:length(bmp_folders) I_processingInput(bmp_paths{vid},bmp_folders{vid}); end %% 2: Process image data (this uses multithreading if processing >1 video) if length(bmp_folders) > 1 parpool; parfor vid = 1:length(bmp_folders) II_wormotelActivity(bmp_paths{vid},bmp_folders{vid}); end else II_wormotelActivity(bmp_paths{1},bmp_folders{1}); end %% 3: Plot results (generates basic plots of the data) for vid = 1:length(bmp_folders) plotActogram(bmp_paths{vid},bmp_folders{vid}); plotQuietogram(bmp_paths{vid},bmp_folders{vid}); end %% Fix first letter % (Run this section with the correct letter if the drive letters in % 'bmp_paths' in your processing queue are wrong) drive_letter = '<paste the drive letter here>'; for p = 1:length(bmp_paths) bmp_paths{p}(1) = drive_letter; end avi_path(1) = drive_letter; all_save_path(1) = drive_letter; save([all_save_path,all_save_name,'.mat'],'all_save_name','all_save_path',... 'bmp_paths','bmp_folders'); clear p drive_letter
The following function should be copied into a .m named file I_processingInput.m on the
MATLAB path. The file is also available by request.
function [ output_args ] = I_processingInput(bmp_path,bmp_folder) % FUNCTION TO GET USER INPUT FOR WORMOTEL DATA PROCESSING % BY P. D. MCCLANAHAN % FANG-YEN LAB % UNIVERSITY OF PENNSYLVANIA % [email protected] % LAST UPDATED MARCH 2019

147
% Requires the following functions on the MATLAB path: % drawWormotelROIs.m % wormInfoGUI.m % This version works on videos saved as .bmp files if ~exist([bmp_path,'processing_plots'],'dir') mkdir([bmp_path,'processing_plots'],'dir'); end % Parameters for wormotel well dimensions inner_outer_ratio = 0.9; well_width = 4.5; % Checks if analysis has already been done done_before = 0; if exist([bmp_path,bmp_folder(1:end-1),'.mat'],'file') disp(['Warning, analysis.mat file for ',bmp_path,bmp_folder,' already exists.']); go = input('Would you like to continue? (1 or 0)'); if go == 0 error('Aborted!'); end clear go end % Loads first video frame vid_info = dir([bmp_path,bmp_folder]); frame_1 = imread([bmp_path,bmp_folder,vid_info(3).name]); bmp_name = vid_info(3).name(1:end-10); % Gets the location of the timestamps from user [img_info_filename, img_info_path] = uigetfile(bmp_path,['Pick the ',... 'file that contains the timestamps for this video...']); load([img_info_path,img_info_filename],'frame_1','time_stamps','vid_start_time'); save([bmp_path,bmp_folder(1:end-1),'.mat'],'frame_1','time_stamps','vid_start_time'); % Loads data load([bmp_path,bmp_folder(1:end-1),'.mat']); if done_before bmp_path(1) = first_letter; clear first_letter end %% Gets the number of rows and cols and corner locations from the user go = 1; if done_before == 1 go = input('Would you like to draw the well ROIs? (1 or 0):'); end if go == 1 all_well_mask_size = NaN(1,2); all_well_mask_size(1) = input('How many rows total of wells are there?');
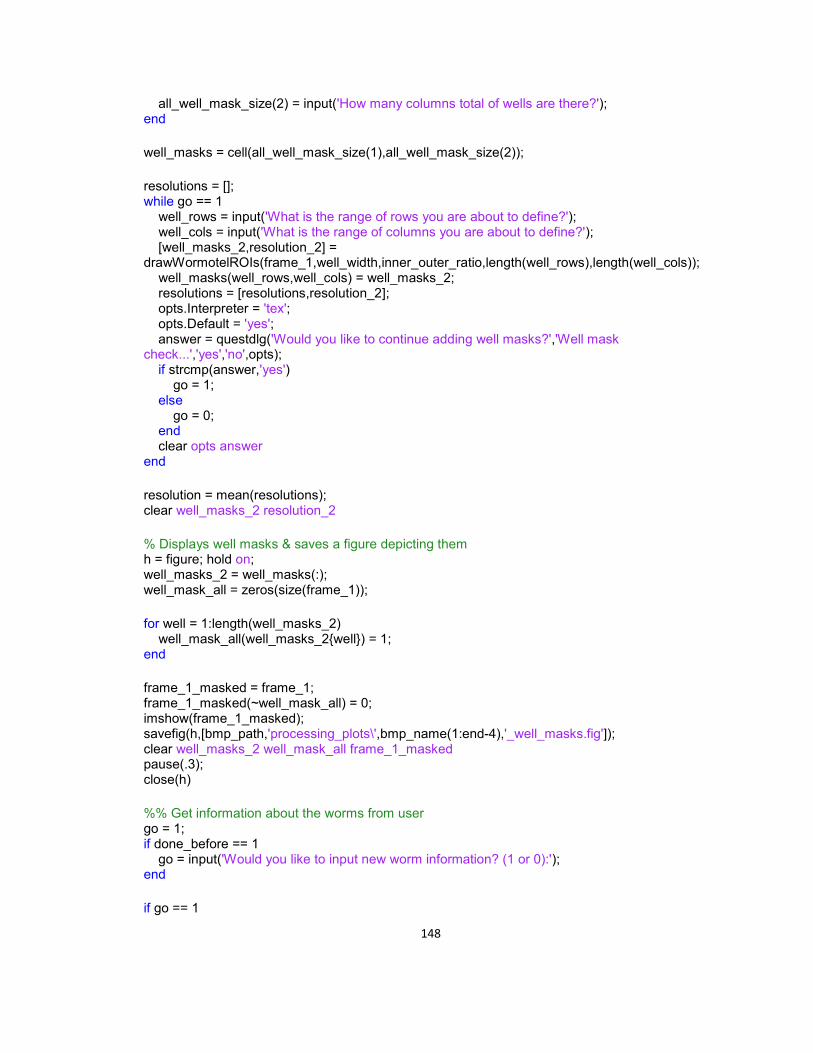
148
all_well_mask_size(2) = input('How many columns total of wells are there?'); end well_masks = cell(all_well_mask_size(1),all_well_mask_size(2)); resolutions = []; while go == 1 well_rows = input('What is the range of rows you are about to define?'); well_cols = input('What is the range of columns you are about to define?'); [well_masks_2,resolution_2] = drawWormotelROIs(frame_1,well_width,inner_outer_ratio,length(well_rows),length(well_cols)); well_masks(well_rows,well_cols) = well_masks_2; resolutions = [resolutions,resolution_2]; opts.Interpreter = 'tex'; opts.Default = 'yes'; answer = questdlg('Would you like to continue adding well masks?','Well mask check...','yes','no',opts); if strcmp(answer,'yes') go = 1; else go = 0; end clear opts answer end resolution = mean(resolutions); clear well_masks_2 resolution_2 % Displays well masks & saves a figure depicting them h = figure; hold on; well_masks_2 = well_masks(:); well_mask_all = zeros(size(frame_1)); for well = 1:length(well_masks_2) well_mask_all(well_masks_2{well}) = 1; end frame_1_masked = frame_1; frame_1_masked(~well_mask_all) = 0; imshow(frame_1_masked); savefig(h,[bmp_path,'processing_plots\',bmp_name(1:end-4),'_well_masks.fig']); clear well_masks_2 well_mask_all frame_1_masked pause(.3); close(h) %% Get information about the worms from user go = 1; if done_before == 1 go = input('Would you like to input new worm information? (1 or 0):'); end if go == 1

149
[worm_info,worm_types] = wormInfoGUI(frame_1, bmp_name,bmp_path); end worm_info = worm_info(1:size(well_masks,1),1:size(well_masks,2)); well_IDs = cell(size(well_masks)); alphabet = [{'A'},{'B'},{'C'},{'D'},{'E'},{'F'},{'G'},{'H'},{'I'},{'J'},... {'K'},{'L'},{'M'},{'N'},{'O'},{'P'},{'Q'},{'R'},{'S'},{'T'},{'U'},... {'V'},{'W'},{'X'},{'Y'},{'Z'}]; for row = 1:size(well_IDs,1) for col = 1:size(well_IDs,2) well_IDs{row,col} = [alphabet{col},num2str(row)]; end end clear alphabet row col well_radius middles done_before well_rows well_cols clear answer bounds c cc clind columns frame_masked go h mask maxcol_ROI clear maxrow_ROI middle mincol_ROI minrow_ROI num_bkgnds num_c num_r clear p poxX posY pt r ROI_invert rowind rows rr worm_info = worm_info(:); well_IDs = well_IDs(:); well_masks = well_masks(:); save([bmp_path,bmp_folder(1:end-1),'.mat'],'-append'); go = input('Does this video have computer-timed stimuli? (1 or 0):'); % Gets the stimulus info file from the user if go [stim_info_file,stim_info_path] = uigetfile(bmp_path,'Select a file containing stimulus timing information...'); load([stim_info_path,stim_info_file],'stim_times','stim_start_time'); time_diff = seconds(stim_start_time - vid_start_time); stim_times = stim_times(~isnan(stim_times))+time_diff; else stim_times = []; frame_info_path = []; frame_info_file = []; stim_info_file = []; stim_info_path = []; end % Finds the stimulus frames stim_frames = []; for stim = 1:length(stim_times) for f = 1:length(time_stamps) if stim_times(stim) > time_stamps(f) && stim_times(stim) < time_stamps(f+1) stim_frames = [stim_frames,f]; end end end

150
% Saves this information with the recording data <image folder>.mat file save([bmp_path,bmp_folder(1:end-1),'.mat'],'stim_frames','stim_info_path','stim_info_file','-append'); disp(['Saved user input in ',bmp_path,bmp_folder(1:end-1),'.mat']); clear end
The following function should be copied into a .m file named drawWormotelROIs.m on the
MATLAB path. The file is also available by request.
function [well_masks,resolution] = drawWormotelROIs(frame_1,well_width,inner_outer_ratio, num_r, num_c) % FUNCTION FOR DRAWING WORMOTEL WELL ROIS % BY P. D. MCCLANAHAN % FANG-YEN LAB % UNIVERSITY OF PENNSYLVANIA % [email protected] % LAST UPDATED 2018 % This function takes frame_1 and has the user pick the corners of the % well array and state how many rows and columns of well there are. Then it % creates square ROIs for each well, excluding bright pixels and setting % the width to inner_outer_ratio * actual width. Lastly, it calculates the % real-life resolution of the image based on the known period of the wells, % well_width. % Inputs are a video frame, the real-life width of the wells, the ratio of % the well + pedestal width to the total period (well_width) including the % moats, and the number of rows and columns to be segmented. % It returns an array of ROI masks and the real life resolution of the % image in pixels per mm. % While loop cycles until user indicates that they are satisfied with the % ROI locations go = 1; while go == 1 frame_1ud = flipud(frame_1); h = figure; hold on; set(gca,'visible','off'); imagesc(frame_1ud); colormap('gray'); set(gca,'units','pixels'); set(gca,'units','normalized','position',[0.05 0.05 .95 .95]); pbaspect([size(frame_1ud,2) size(frame_1ud,1) 1]); axis off;

151
axis tight; disp(['Pick the four corners of the wormotel wells clockwise starting',... 'from the upper left and proceeding clockwise...']); iptsetpref('ImshowBorder','tight'); pts = NaN(4,2); for p = 1:4 pt = ginput(1); plot(pt(1),pt(2),'g+','MarkerSize',15); pts(p,:) = pt; end % Flips points to make up for the fact that the image was displayed % upside down pts(:,2) = size(frame_1,1) - pts(:,2); pause(.3); close(h); clear dlg_title num_lines prompt h % Does some arithmetic to find well middles.... % Array of border intersection points int_pts = NaN(num_r+1,num_c+1,2); % Fills in corners int_pts(1,1,:) = pts(1,:); int_pts(1,num_c+1,:) = pts(2,:); int_pts(num_r+1,num_c+1,:) = pts(3,:); int_pts(num_r+1,1,:) = pts(4,:); % Fills in top and bottom rows for c = 1:num_c-1 int_pts(1,c+1,:) = int_pts(1,1,:) + (c/num_c)*(int_pts(1,num_c+1,:)-int_pts(1,1,:));% top row int_pts(num_r+1,c+1,:) = int_pts(num_r+1,1,:) + (c/num_c)*(int_pts(num_r+1,num_c+1,:)-int_pts(num_r+1,1,:));% bot row end % Fills in rows besides top and bottom rows for c = 1:num_c+1 for r = 1:num_r-1 int_pts(r+1,c,:) = int_pts(1,c,:) + (r/num_r)*(int_pts(num_r+1,c,:)-int_pts(1,c,:));% one row end end % Finds an array of middle points middles = NaN(num_r,num_c,2); for r = 1:num_r for c = 1:num_c middles(r,c,:) = mean([int_pts(r,c,:),int_pts(r+1,c,:),int_pts(r,c+1,:),int_pts(r+1,c+1,:)]);
152
end end for r = 1:num_r for c = 1:num_c plot(middles(r,c,1),middles(r,c,2),'r+','LineWidth',1.5); end end clear r c int_pts % Creates a series of masks for each well well_radius = 0.5*inner_outer_ratio*sqrt((pts(2,1)-pts(1,1))^2+(pts(2,2)-pts(1,2))^2)*(1/num_c); well_masks = cell(num_r,num_c); h = figure; frame_masked = frame_1; for r = 1:num_r for c = 1:num_c mask = zeros(size(frame_1)); middle = middles(r,c,:); for rr = 1:size(mask,1) for cc = 1:size(mask,2) % Creates a square ROI around the well middle if rr < middle(2) + well_radius && rr > middle(2) - well_radius if cc < middle(1) + well_radius && cc > middle(1) - well_radius mask(rr,cc) = 1; end end end end well_masks{r,c} = logical(mask); frame_masked(mask == 1) = 0; cla imshow(frame_masked); end end % Asks user if well masks are good opts.Interpreter = 'tex'; opts.Default = 'yes'; answer = questdlg('Accept these and continue?','Well check...','yes','no',opts); if strcmp(answer,'yes') go = 1; else go = 0; end clear opts answer go = ~go; if go == 1
153
close(h); else resolution = sqrt((pts(1,1)-pts(2,1))^2 + (pts(1,2)-pts(2,2))^2)/(well_width*num_c); disp(['Assuming a WM well is ',num2str(well_width),' mm wide, resolution is ',num2str(resolution),' pixels per mm.']); clear pts close(h); end end end
The following function should be copied into a .m file named wormInfoGUI.m on the MATLAB
path. This file and the associated .fig file are available by request.
% WORM INFO GUI (REQUIRES GUI FIG FILE) % BY P. D. MCCLANAHAN % FANG-YEN LAB % UNIVERSITY OF PENNSYLVANIA % [email protected] % LAST UPDATED AUGUST 2017 % Call should look like: % [worm_info,worm_types] = worm_info_GUI(frame_1,vid_name,vid_path); % 'frame_1' is an image, 'vid_path' and 'vid_name' are strings % 'worm_info' is a 2d array of the string entries in the table, and % 'worm_types' is a 1d array of each unique identifier entered in the table % Edited PDM 8-8-2017 function varargout = worm_info_GUI(varargin) % Begin initialization code - DO NOT EDIT gui_Singleton = 1; gui_State = struct('gui_Name', mfilename, ... 'gui_Singleton', gui_Singleton, ... 'gui_OpeningFcn', @worm_info_GUI_OpeningFcn, ... 'gui_OutputFcn', @worm_info_GUI_OutputFcn, ... 'gui_LayoutFcn', [] , ... 'gui_Callback', []); if nargin && ischar(varargin{1}) gui_State.gui_Callback = str2func(varargin{1}); end if nargout [varargout{1:nargout}] = gui_mainfcn(gui_State, varargin{:}); else

154
gui_mainfcn(gui_State, varargin{:}); end % End initialization code - DO NOT EDIT % --- Executes just before worm_info_GUI is made visible. function worm_info_GUI_OpeningFcn(hObject, eventdata, handles, varargin) handles.image = varargin{1}; handles.vid_name_txt = varargin{2}; handles.vid_path_txt = varargin{3}; % Sets text boxes set(handles.avi_path_txt, 'String', ['Directory: ',handles.vid_path_txt]); set(handles.avi_name_txt, 'String', ['Filename: ',handles.vid_name_txt]); % Choose default command line output for worm_info_GUI handles.output = hObject; % Update handles structure guidata(hObject, handles); %Set table size to be 6x8 %set(handles.uitable1,'Data',cell(6,8)); %set(handles.uitable1,'ColumnWidth',{40,40,40,40,40,40,40,40}); % UIWAIT makes worm_info_GUI wait for user response (see UIRESUME) % uiwait(handles.figure1); % --- Outputs from this function are returned to the command line. function varargout = worm_info_GUI_OutputFcn(hObject, eventdata, handles) global worm_info q image = handles.image; vid_name = handles.vid_name_txt; vid_path = handles.vid_path_txt; q = 0; % Shows an image from the WorMotel video h = imshow(image,'Parent',handles.axes1); while q == 0 handles.output = worm_info; pause(.5); end handles.output = worm_info;
155
worm_types = []; for w = 1:numel(worm_info) if ~isempty(worm_info{ind2sub(size(worm_info),w)}) if ~ismember(worm_info{ind2sub(size(worm_info),w)},worm_types) worm_types = [worm_types,worm_info(ind2sub(size(worm_info),w))]; end end end close; disp('Worm info GUI closed'); % Get default command line output from handles structure varargout{1} = handles.output; varargout{2} = worm_types; % --- Executes when entered data in editable cell(s) in uitable1. function uitable1_CellEditCallback(hObject, eventdata, handles) global worm_info % Gets the worm info inputted by the user worm_info = get(hObject,'data'); disp('from table callback'); disp(worm_info); % --- Executes when selected cell(s) is changed in uitable1. function uitable1_CellSelectionCallback(hObject, eventdata, handles) % --- Executes on button press in close. function close_Callback(hObject, eventdata, handles) global q q = 1; % --- Executes during object creation, after setting all properties. function uitable1_CreateFcn(hObject, eventdata, handles)

156
Figure A2.3: Screenshot of the MATLAB GUI for inputting worm information contained in
wormInfoGUI.fig. This GUI allows the user to enter worm strain and condition information during
data processing. The .fig file is available by request.

157
The following should be copied into a .m file named II_wormotelActivity.m on the MATLAB path.
The file is also available on request.
function II_wormotelActivity(bmp_path,bmp_folder,varargin) % FUNCTION TO CALCULATE ACTIVITY FROM DIFF IMGS % BY P. D. MCCLANAHAN % FANG-YEN LAB % UNIVERSITY OF PENNSYLVANIA % [email protected] % LAST UPDATED MARCH 2019 % This function calculates the difference image activity by loading % consecutive frames, smoothing them with a gaussian kernel of sigma = % w_sigma, subtracting them, and summing the number of pixels greater than % threshold = act_thresh. Depending on the resolution and noisiness of your % images, you may want to adjust these parameters such that the amount of % activity detected in an empty wells falls below an acceptable false % positive rate. % Does not require any additional custom functions % Hard inputs (these may need to be optimized for new imaging setups & % cameras) act_thresh = 5; % pixel difference cutoff for activity w_sigma = 1.5; % kernel size for smoothing % Testing (leave commented unless testing) % bmp_path = 'C:\Users\PDMcClanahan\Dropbox\Presentations\proposal etc\Defense\Code for dissertation\test_imaging\'; % bmp_folder = 'images\'; %% Load analysis file and corrects drive name drive_letter = bmp_path(1); load([bmp_path,bmp_folder(1:end-1),'.mat']); bmp_path(1) = drive_letter; clear drive_letter processing_date = datetime; %% Load video info if ~exist('bmp_info','var') bmp_info = dir([bmp_path,bmp_folder]); end vid_info = dir([bmp_path,bmp_folder]); num_frames = length(bmp_info)-3; num_frames = uint32(round(num_frames)); % Creates variables for activity and intensity if ~exist('frames_done','var') || ~exist('frame_last','var')

158
frames_done = 0; activity = NaN(numel(worm_info),num_frames-1); LED_intensity = NaN(1,num_frames); % Not used in any data I have published disp(['Started finding activity in ',bmp_name,' at ',datestr(now),'.']); else frame_last = imread([bmp_path,bmp_folder,vid_info(frames_done+2).name]); disp(['Resumed finding activity in ',bmp_name(1:end-4),' at ',datestr(now),'.']); end %% Difference image processing tic for f = frames_done:num_frames % Loads a video frame frame = imread([bmp_path,bmp_folder,vid_info(f+3).name]); % load frame % Removes third dimension if necessary if size(size(frame),2) == 3 frame = frame(:,:,1); frame = squeeze(frame); end % Gaussian filtering frame = imgaussfilt(frame,w_sigma); if frames_done > 0 % Finds difference image diff_img = uint8(abs(int16(frame)-int16(frame_last))); %signed int needed to see light to dark transitions % Thresholds the difference image diff_img(diff_img < act_thresh) = 0; diff_img(diff_img >= act_thresh) = 1; w = 1; for w = 1:length(well_masks) well_diff_img = diff_img.*uint8(well_masks{w}); activity(w,frames_done) = sum(well_diff_img(:)); end clear well_diff_img end clear w c r % Updates frames completed and close any figures frames_done = frames_done+1; frame_last = frame; close all; % Displays frames done after every frames if mod(frames_done,1)==0
159
disp(['Completed ',num2str(frames_done),' of ',num2str(num_frames),' frames at ',datestr(now),'.']); end % Saves progress every 1000 frames if mod(frames_done,1000)==0 save([bmp_path,bmp_folder(1:end-1),'.mat'],'activity','LED_intensity','frames_done','frame_last','-append'); disp(['Saved progress: ',bmp_name(1:end-10),' at ',datestr(now),'. ',num2str(frames_done),' frames saved']); end end toc %% Save useful variables clear debugging mkvid all_mask % MATLAB R2017a on a win. 10 laptop would crash during saving, if this % happens try a different computer. save([bmp_path,bmp_folder(1:end-1),'.mat'],'-append'); disp(['Finished saving activity in ',[bmp_path,bmp_folder(1:end-1),'.mat'],' at ',datestr(now),'.']); end
The following should be copied into a .m file plotActogram.m. The file is also available on
request.
function plot_actogram(bmp_path, bmp_folder) % FUNCTION TO PLOT AN ACTOGRAM OF RAW ACTIVITY % BY P. D. MCCLANAHAN % FANG-YEN LAB % UNIVERSITY OF PENNSYLVANIA % [email protected] % LAST UPDATED MAY 2019 % Makes and saves a heatmap of activity by worm, sorted by strain / % condition and total activity % %% testing % bmp_folder = 'bench_images\'; % bmp_path = 'F:\20170925_L4leth_Observation\'; %% Load activity load([bmp_path,bmp_folder(1:end-1),'.mat'],'activity','worm_info',... 'worm_types','stim_frames','time_stamps','bmp_name','well_masks',... 'well_IDs');
160
fps = time_stamps(end)/length(time_stamps); %% Sort by worm type / condition sorted_activity = cell(1,length(worm_types)); sorted_idx = sorted_activity; worm_info = worm_info(1:size(well_masks,1),1:size(well_masks,2)); % sorts the rows of 'activity' by the worm type for w = 1:numel(well_masks) % runs down rows of activity for t = 1:length(worm_types) % matches them with a worm type if strcmp(worm_info{w},worm_types{t}) sorted_activity{t} = [sorted_activity{t};activity(w,:)]; sorted_idx{t} = [sorted_idx{t};well_IDs(w)]; end end end clear t w a b % Sorts the activity of each worm type by total activity for wt = 1:length(sorted_activity) activity_type = sorted_activity{wt}; activity_total = sum(activity_type,2); [activity_tot_sorted,inds] = sortrows(activity_total); sorted_activity{wt} = activity_type(inds,:); sorted_idx{wt} = sorted_idx{wt}(inds); end %% Set up the figure h = figure; hold on; title(['Actogram of ',bmp_name,', sorted'],'interpreter','none'); xlabel(['frame (',num2str(fps),' fps)']); ylabel('worm strain & well ID'); set(gca,'FontSize',11); set(gca,'FontSize',12); version = ver; if str2num(version(20).Version) > 9 xtickangle(90) else set(gca, 'XTickLabelRotation',90); end clear version for r = 1:size(worm_info,1) for c = 1:size(worm_info,2) if isempty(worm_info{r,c}) worm_info{r,c} = ''; end end end

161
clear r c limits = [.5 size(activity,2)+.5 .5 .5+sum(ismember([worm_info(:)],worm_types))]; axis(limits); %% Plot the activities activity_image = []; activity_labels = []; for wt = 1:length(sorted_activity) activity_image = [activity_image;sorted_activity{wt}]; for w = 1:length(sorted_idx{wt}) sorted_idx{wt}{w} = [sorted_idx{wt}{w},', ',worm_types{wt}]; end activity_labels = [activity_labels;sorted_idx{wt}]; end upper_lim = prctile(activity_image(:),95); imagesc(activity_image,[0 upper_lim]); colormap(h,'bone'); set(gca,'TickLabelInterpreter','none') set(gca,'YTickLabels',activity_labels) set(gca,'YTick',[1:length(activity_labels)]) if exist('stim_frames','var') for s = 1:length(stim_frames) single_stim = stim_frames(s); plot([single_stim(1),single_stim(1)],[0 size(activity_image,1)+.5],'r--','LineWidth',1.5); end end %% Save the figure if ~exist([bmp_path,'\activityPlots'],'dir') mkdir([bmp_path,'\activityPlots']); end savefig(h,[bmp_path,'\activityPlots\',bmp_folder(1:end-1),'_actogram.fig']); saveas(h,[bmp_path,'\activityPlots\',bmp_folder(1:end-1),'_actogram.bmp']); close(h); end
The following should be copied into a .m file called plotQuietogram.m on the MATLAB path. The
file is also available on request.
function plot_quietogram(bmp_path, bmp_folder)

162
% FUNCTION TO PLOT A QUIETOGRAM FROM WORMOTEL DATA % BY P. D. MCCLANAHAN % FANG-YEN LAB % UNIVERSITY OF PENNSYLVANIA % [email protected] % LAST UPDATED MAY 2019 % Makes and saves a binary heatmap of the quiescence of each worm / well % throughout the video. %% Load activity load([bmp_path,bmp_folder(1:end-1),'.mat'],'activity','worm_info',... 'worm_types','stim_frames','time_stamps','bmp_name','well_masks',... 'well_IDs'); fps = time_stamps(end)/length(time_stamps); %% Sort by worm type / condition sorted_activity = cell(1,length(worm_types)); sorted_idx = sorted_activity; worm_info = worm_info(1:size(well_masks,1),1:size(well_masks,2)); for w = 1:numel(well_masks) % runs down rows of activity for t = 1:length(worm_types) % matches them with a worm type [a b] = ind2sub(size(worm_info),w); if strcmp(worm_info{a,b},worm_types{t}) sorted_activity{t} = [sorted_activity{t};activity(w,:)]; sorted_idx{t} = [sorted_idx{t};well_IDs(w)]; end end end clear t w a b % sorts the activity of each worm type by total activity for wt = 1:length(sorted_activity) activity_type = sorted_activity{wt}; activity_total = sum(activity_type,2); [activity_tot_sorted,inds] = sortrows(activity_total); sorted_activity{wt} = activity_type(inds,:); sorted_idx{wt} = sorted_idx{wt}(inds); end %% Plot quietogram % Calculates quiescence for wt = 1:length(sorted_activity) act = sorted_activity{wt}; mqb = 1; qq = zeros(size(act)); for w = 1:size(qq,1)
163
qw = qq(w,:); qw(act(w,:)==0) = 1; qw = bwareaopen(qw,mqb); qw = double(qw); qw(isnan(act(w,:))) = 0.5; qq(w,:) = qw; end q{wt} = qq; end % Sets up figure h = figure; hold on; title(['Quietogram of ',bmp_path,bmp_folder,', sorted'],'interpreter','none'); xlabel(['frame #']); ylabel('worm strain & well ID'); set(gca,'FontSize',11); set(gca,'FontSize',12); xtickangle(90) for r = 1:size(worm_info,1) for c = 1:size(worm_info,2) if isempty(worm_info{r,c}) worm_info{r,c} = ''; end end end clear r c limits = [.5 size(activity,2)+.5 .5 .5+sum(ismember([worm_info(:)],worm_types))]; axis(limits); % Plots quiescence q_image = []; activity_labels = []; for wt = 1:length(sorted_activity) q_image = [q_image;q{wt}]; for w = 1:length(sorted_idx{wt}) sorted_idx{wt}{w} = [sorted_idx{wt}{w},', ',worm_types{wt}]; end activity_labels = [activity_labels;sorted_idx{wt}]; end imagesc(q_image,[0 1]); set(gca,'TickLabelInterpreter','none') set(gca,'YTickLabels',activity_labels) set(gca,'YTick',[1:length(activity_labels)]) winsize = [680 315 573 663]; set(gcf,'Position',winsize); if exist('stim_frames','var') for s = 1:length(stim_frames) single_stim = stim_frames(s); plot([single_stim(1),single_stim(1)],[0 size(q_image,1)+.5],'r--','LineWidth',1.5); end end
164
%% Save the figure if ~exist([bmp_path,'\activityPlots'],'dir') mkdir([bmp_path,'\activityPlots']); end savefig(h,[bmp_path,'\activityPlots\',bmp_folder(1:end-1),'_quietogram.fig']); saveas(h,[bmp_path,'\activityPlots\',bmp_folder(1:end-1),'_quietogram.bmp']); close(h); end
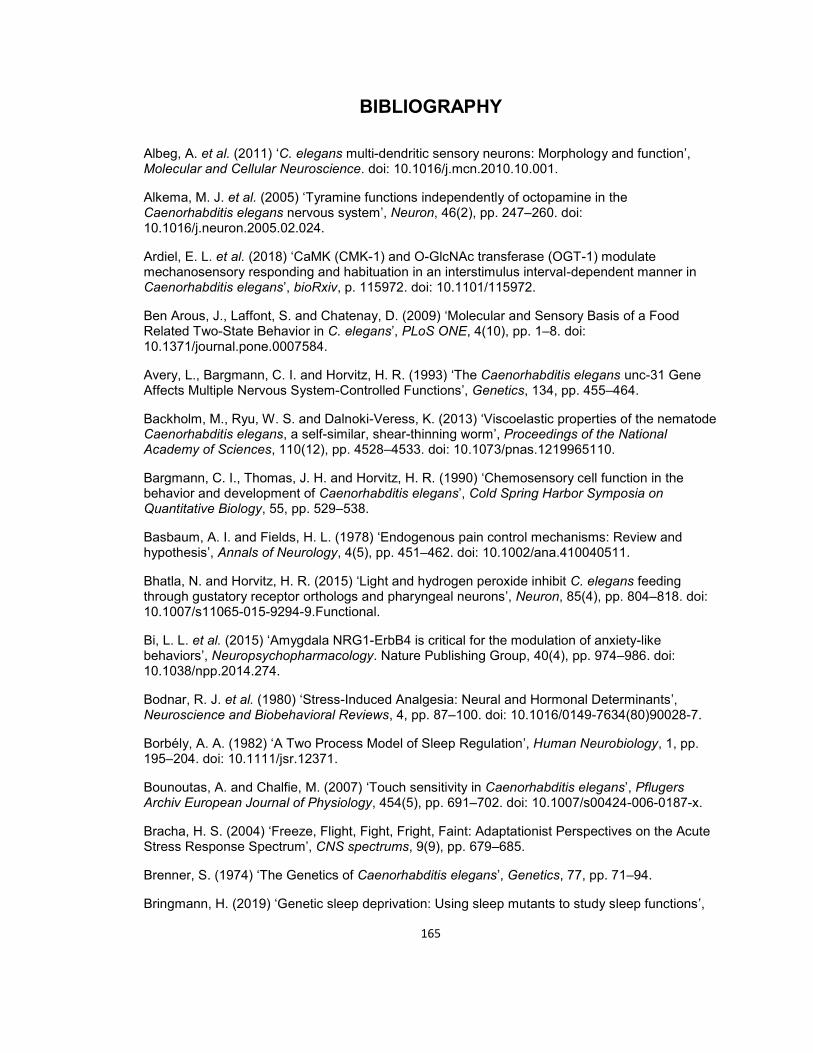
165
BIBLIOGRAPHY
Albeg, A. et al. (2011) ‘C. elegans multi-dendritic sensory neurons: Morphology and function’, Molecular and Cellular Neuroscience. doi: 10.1016/j.mcn.2010.10.001.
Alkema, M. J. et al. (2005) ‘Tyramine functions independently of octopamine in the Caenorhabditis elegans nervous system’, Neuron, 46(2), pp. 247–260. doi: 10.1016/j.neuron.2005.02.024.
Ardiel, E. L. et al. (2018) ‘CaMK (CMK-1) and O-GlcNAc transferase (OGT-1) modulate mechanosensory responding and habituation in an interstimulus interval-dependent manner in Caenorhabditis elegans’, bioRxiv, p. 115972. doi: 10.1101/115972.
Ben Arous, J., Laffont, S. and Chatenay, D. (2009) ‘Molecular and Sensory Basis of a Food Related Two-State Behavior in C. elegans’, PLoS ONE, 4(10), pp. 1–8. doi: 10.1371/journal.pone.0007584.
Avery, L., Bargmann, C. I. and Horvitz, H. R. (1993) ‘The Caenorhabditis elegans unc-31 Gene Affects Multiple Nervous System-Controlled Functions’, Genetics, 134, pp. 455–464.
Backholm, M., Ryu, W. S. and Dalnoki-Veress, K. (2013) ‘Viscoelastic properties of the nematode Caenorhabditis elegans, a self-similar, shear-thinning worm’, Proceedings of the National Academy of Sciences, 110(12), pp. 4528–4533. doi: 10.1073/pnas.1219965110.
Bargmann, C. I., Thomas, J. H. and Horvitz, H. R. (1990) ‘Chemosensory cell function in the behavior and development of Caenorhabditis elegans’, Cold Spring Harbor Symposia on Quantitative Biology, 55, pp. 529–538.
Basbaum, A. I. and Fields, H. L. (1978) ‘Endogenous pain control mechanisms: Review and hypothesis’, Annals of Neurology, 4(5), pp. 451–462. doi: 10.1002/ana.410040511.
Bhatla, N. and Horvitz, H. R. (2015) ‘Light and hydrogen peroxide inhibit C. elegans feeding through gustatory receptor orthologs and pharyngeal neurons’, Neuron, 85(4), pp. 804–818. doi: 10.1007/s11065-015-9294-9.Functional.
Bi, L. L. et al. (2015) ‘Amygdala NRG1-ErbB4 is critical for the modulation of anxiety-like behaviors’, Neuropsychopharmacology. Nature Publishing Group, 40(4), pp. 974–986. doi: 10.1038/npp.2014.274.
Bodnar, R. J. et al. (1980) ‘Stress-Induced Analgesia: Neural and Hormonal Determinants’, Neuroscience and Biobehavioral Reviews, 4, pp. 87–100. doi: 10.1016/0149-7634(80)90028-7.
Borbély, A. A. (1982) ‘A Two Process Model of Sleep Regulation’, Human Neurobiology, 1, pp. 195–204. doi: 10.1111/jsr.12371.
Bounoutas, A. and Chalfie, M. (2007) ‘Touch sensitivity in Caenorhabditis elegans’, Pflugers Archiv European Journal of Physiology, 454(5), pp. 691–702. doi: 10.1007/s00424-006-0187-x.
Bracha, H. S. (2004) ‘Freeze, Flight, Fight, Fright, Faint: Adaptationist Perspectives on the Acute Stress Response Spectrum’, CNS spectrums, 9(9), pp. 679–685.
Brenner, S. (1974) ‘The Genetics of Caenorhabditis elegans’, Genetics, 77, pp. 71–94.
Bringmann, H. (2019) ‘Genetic sleep deprivation: Using sleep mutants to study sleep functions’,
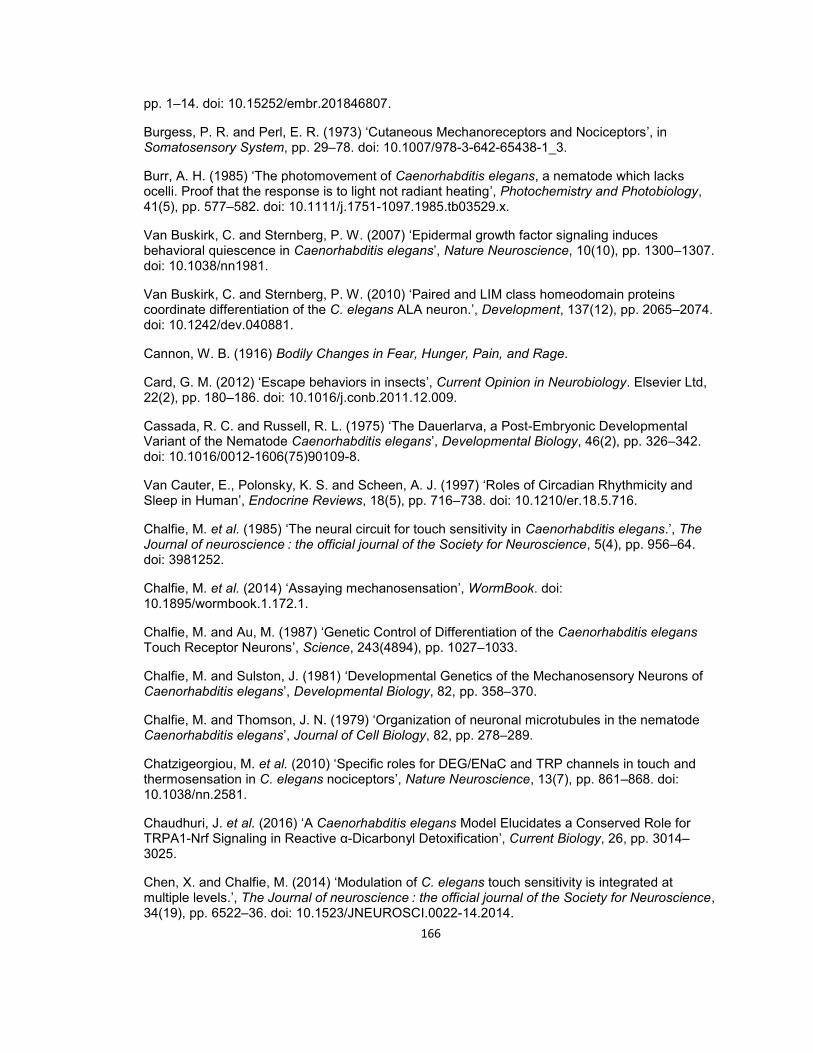
166
pp. 1–14. doi: 10.15252/embr.201846807.
Burgess, P. R. and Perl, E. R. (1973) ‘Cutaneous Mechanoreceptors and Nociceptors’, in Somatosensory System, pp. 29–78. doi: 10.1007/978-3-642-65438-1_3.
Burr, A. H. (1985) ‘The photomovement of Caenorhabditis elegans, a nematode which lacks ocelli. Proof that the response is to light not radiant heating’, Photochemistry and Photobiology, 41(5), pp. 577–582. doi: 10.1111/j.1751-1097.1985.tb03529.x.
Van Buskirk, C. and Sternberg, P. W. (2007) ‘Epidermal growth factor signaling induces behavioral quiescence in Caenorhabditis elegans’, Nature Neuroscience, 10(10), pp. 1300–1307. doi: 10.1038/nn1981.
Van Buskirk, C. and Sternberg, P. W. (2010) ‘Paired and LIM class homeodomain proteins coordinate differentiation of the C. elegans ALA neuron.’, Development, 137(12), pp. 2065–2074. doi: 10.1242/dev.040881.
Cannon, W. B. (1916) Bodily Changes in Fear, Hunger, Pain, and Rage.
Card, G. M. (2012) ‘Escape behaviors in insects’, Current Opinion in Neurobiology. Elsevier Ltd, 22(2), pp. 180–186. doi: 10.1016/j.conb.2011.12.009.
Cassada, R. C. and Russell, R. L. (1975) ‘The Dauerlarva, a Post-Embryonic Developmental Variant of the Nematode Caenorhabditis elegans’, Developmental Biology, 46(2), pp. 326–342. doi: 10.1016/0012-1606(75)90109-8.
Van Cauter, E., Polonsky, K. S. and Scheen, A. J. (1997) ‘Roles of Circadian Rhythmicity and Sleep in Human’, Endocrine Reviews, 18(5), pp. 716–738. doi: 10.1210/er.18.5.716.
Chalfie, M. et al. (1985) ‘The neural circuit for touch sensitivity in Caenorhabditis elegans.’, The Journal of neuroscience : the official journal of the Society for Neuroscience, 5(4), pp. 956–64. doi: 3981252.
Chalfie, M. et al. (2014) ‘Assaying mechanosensation’, WormBook. doi: 10.1895/wormbook.1.172.1.
Chalfie, M. and Au, M. (1987) ‘Genetic Control of Differentiation of the Caenorhabditis elegans Touch Receptor Neurons’, Science, 243(4894), pp. 1027–1033.
Chalfie, M. and Sulston, J. (1981) ‘Developmental Genetics of the Mechanosensory Neurons of Caenorhabditis elegans’, Developmental Biology, 82, pp. 358–370.
Chalfie, M. and Thomson, J. N. (1979) ‘Organization of neuronal microtubules in the nematode Caenorhabditis elegans’, Journal of Cell Biology, 82, pp. 278–289.
Chatzigeorgiou, M. et al. (2010) ‘Specific roles for DEG/ENaC and TRP channels in touch and thermosensation in C. elegans nociceptors’, Nature Neuroscience, 13(7), pp. 861–868. doi: 10.1038/nn.2581.
Chaudhuri, J. et al. (2016) ‘A Caenorhabditis elegans Model Elucidates a Conserved Role for TRPA1-Nrf Signaling in Reactive α-Dicarbonyl Detoxification’, Current Biology, 26, pp. 3014–3025.
Chen, X. and Chalfie, M. (2014) ‘Modulation of C. elegans touch sensitivity is integrated at multiple levels.’, The Journal of neuroscience : the official journal of the Society for Neuroscience, 34(19), pp. 6522–36. doi: 10.1523/JNEUROSCI.0022-14.2014.
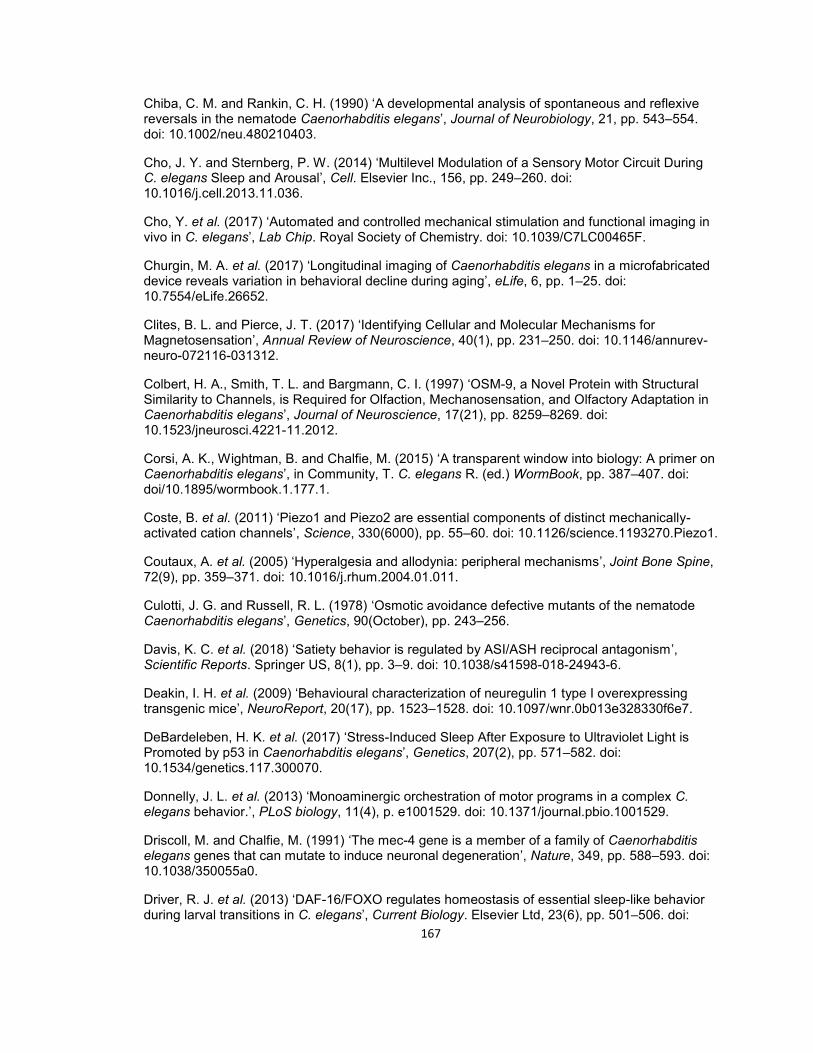
167
Chiba, C. M. and Rankin, C. H. (1990) ‘A developmental analysis of spontaneous and reflexive reversals in the nematode Caenorhabditis elegans’, Journal of Neurobiology, 21, pp. 543–554. doi: 10.1002/neu.480210403.
Cho, J. Y. and Sternberg, P. W. (2014) ‘Multilevel Modulation of a Sensory Motor Circuit During C. elegans Sleep and Arousal’, Cell. Elsevier Inc., 156, pp. 249–260. doi: 10.1016/j.cell.2013.11.036.
Cho, Y. et al. (2017) ‘Automated and controlled mechanical stimulation and functional imaging in vivo in C. elegans’, Lab Chip. Royal Society of Chemistry. doi: 10.1039/C7LC00465F.
Churgin, M. A. et al. (2017) ‘Longitudinal imaging of Caenorhabditis elegans in a microfabricated device reveals variation in behavioral decline during aging’, eLife, 6, pp. 1–25. doi: 10.7554/eLife.26652.
Clites, B. L. and Pierce, J. T. (2017) ‘Identifying Cellular and Molecular Mechanisms for Magnetosensation’, Annual Review of Neuroscience, 40(1), pp. 231–250. doi: 10.1146/annurev-neuro-072116-031312.
Colbert, H. A., Smith, T. L. and Bargmann, C. I. (1997) ‘OSM-9, a Novel Protein with Structural Similarity to Channels, is Required for Olfaction, Mechanosensation, and Olfactory Adaptation in Caenorhabditis elegans’, Journal of Neuroscience, 17(21), pp. 8259–8269. doi: 10.1523/jneurosci.4221-11.2012.
Corsi, A. K., Wightman, B. and Chalfie, M. (2015) ‘A transparent window into biology: A primer on Caenorhabditis elegans’, in Community, T. C. elegans R. (ed.) WormBook, pp. 387–407. doi: doi/10.1895/wormbook.1.177.1.
Coste, B. et al. (2011) ‘Piezo1 and Piezo2 are essential components of distinct mechanically-activated cation channels’, Science, 330(6000), pp. 55–60. doi: 10.1126/science.1193270.Piezo1.
Coutaux, A. et al. (2005) ‘Hyperalgesia and allodynia: peripheral mechanisms’, Joint Bone Spine, 72(9), pp. 359–371. doi: 10.1016/j.rhum.2004.01.011.
Culotti, J. G. and Russell, R. L. (1978) ‘Osmotic avoidance defective mutants of the nematode Caenorhabditis elegans’, Genetics, 90(October), pp. 243–256.
Davis, K. C. et al. (2018) ‘Satiety behavior is regulated by ASI/ASH reciprocal antagonism’, Scientific Reports. Springer US, 8(1), pp. 3–9. doi: 10.1038/s41598-018-24943-6.
Deakin, I. H. et al. (2009) ‘Behavioural characterization of neuregulin 1 type I overexpressing transgenic mice’, NeuroReport, 20(17), pp. 1523–1528. doi: 10.1097/wnr.0b013e328330f6e7.
DeBardeleben, H. K. et al. (2017) ‘Stress-Induced Sleep After Exposure to Ultraviolet Light is Promoted by p53 in Caenorhabditis elegans’, Genetics, 207(2), pp. 571–582. doi: 10.1534/genetics.117.300070.
Donnelly, J. L. et al. (2013) ‘Monoaminergic orchestration of motor programs in a complex C. elegans behavior.’, PLoS biology, 11(4), p. e1001529. doi: 10.1371/journal.pbio.1001529.
Driscoll, M. and Chalfie, M. (1991) ‘The mec-4 gene is a member of a family of Caenorhabditis elegans genes that can mutate to induce neuronal degeneration’, Nature, 349, pp. 588–593. doi: 10.1038/350055a0.
Driver, R. J. et al. (2013) ‘DAF-16/FOXO regulates homeostasis of essential sleep-like behavior during larval transitions in C. elegans’, Current Biology. Elsevier Ltd, 23(6), pp. 501–506. doi:
168
10.1016/j.cub.2013.02.009.
Dubin, A. E. and Patapoutian, A. (2010) ‘Review series Nociceptors: the sensors of the pain pathway’, Journal of Clinical Investigation, 120(11), pp. 3760–3772. doi: 10.1172/JCI42843.3760.
Eastwood, A. L. et al. (2016) ‘Tissue Mechanics Govern the Rapidly Adapting and Symmetrical Response to Touch.’, PNAS, 113(17), pp. E6955–E6963.
Eban-Rothschild, A. and de Lecea, L. (2017) ‘Neuronal substrates for initiation, maintenance, and structural organization of sleep/wake states’, F1000Research, 6(0), p. 212. doi: 10.12688/f1000research.9677.1.
Ebrahimi, C. M. and Rankin, C. H. (2007) ‘Early patterned stimulation leads to changes in adult behavior and gene expression in C. elegans’, Genes, Brain and Behavior, 6(6), pp. 517–528. doi: 10.1111/j.1601-183X.2006.00278.x.
Frézal, L. and Félix, M. A. (2015) ‘C. elegans outside the Petri dish’, eLife, 2015(4), pp. 1–14. doi: 10.7554/eLife.05849.001.
Fry, A. L. et al. (2016) ‘A conserved GEF for Rho-family GTPases acts in an EGF signaling pathway to promote sleep-like quiescence in Caenorhabditis elegans’, Genetics, 202(3), pp. 1153–1166. doi: 10.1534/genetics.115.183038.
Gabel, C. V. et al. (2007) ‘Neural Circuits Mediate Electrosensory Behavior in Caenorhabditis elegans’, Journal of Neuroscience, 27(28), pp. 7586–7596. doi: 10.1523/jneurosci.0775-07.2007.
Gadea, O. et al. (2015) ‘Magnetosensitive neurons mediate geomagnetic orientation in Caenorhabditis elegans’, eLife, 4, pp. 1–20. doi: 10.7554/elife.07493.
Gallagher, T. et al. (2013) ‘ASI Regulates Satiety Quiescence in C. elegans’, Journal of Neuroscience, 33(23), pp. 9716–9724. doi: 10.1523/JNEUROSCI.4493-12.2013.
Gilpin, W., Uppaluri, S. and Brangwynne, C. P. (2015) ‘Worms under pressure: Bulk mechanical properties of C. elegans are independent of the cuticle’, Biophysical Journal. Biophysical Society, 108(8), pp. 1887–1898. doi: 10.1016/j.bpj.2015.03.020.
Goff, W. R. et al. (1966) ‘Cerebral somatosensory responses evoked during sleep in man’, Electroencephalography and Clinical Neurophysiology, 21(5). doi: 10.1016/0013-4694(66)90194-5.
Gonzales, D. (2019) ‘Satiety, Thermosensation and Mechanosensation Regulate a Spontaneous C. elegans Sleep State’, pp. 1–38. doi: 10.1101/547075.
von Graffenried, B. et al. (1978) ‘The Influence of Anxiety and Pain Sensitivity on Experimental Pain in Man’, Pain, 4, pp. 253–263.
Grubbs, J. J. et al. (2019) ‘A salt-induced kinase ( SIK ) is required for the metabolic regulation of’.
Hart, A. (2006) ‘Behavior’, WormBook, pp. 1–67. doi: 10.1895/wormbook.1.87.1.
Hashimoto, S., Inoue, T. and Koyama, T. (1996) ‘Serotonin reuptake inhibitors reduce conditioned fear stress-induced freezing behavior in rats’, Psychopharmacology, 123(2), pp. 182–186. doi: 10.1007/BF02246175.
Haspel, G., O’Donovan, M. J. and Hart, A. C. (2010) ‘Motoneurons Dedicated to Either Forward

169
or Backward Locomotion in the Nematode Caenorhabditis elegans’, The Journal of Neuroscience, 30(33), pp. 11151–11156. doi: 10.1523/JNEUROSCI.2244-10.2010.
Hedgecock, E. M., Sulston, J. E. and Thomson, N. J. (1983) ‘Mutations Affecting Programmed Cell Deaths in the Nematode Caenorhabditis elegans’, Science, 220(4603), pp. 1277–1279.
Heller, H. C. (1979) ‘Hibernation: neural aspects’, Annual Review of Physiology, 41, pp. 305–321.
Hill, A. J. et al. (2014) ‘Cellular stress induces a protective sleep-like state in C. elegans’, Current Biology. Elsevier Ltd, 24(20), pp. 2399–2405. doi: 10.1016/j.cub.2014.08.040.
Hucho, T. and Levine, J. D. (2007) ‘Signaling Pathways in Sensitization: Toward a Nociceptor Cell Biology’, Neuron, 55(3), pp. 365–376. doi: 10.1016/j.neuron.2007.07.008.
Hulme, S. E. et al. (2007a) ‘A microfabricated array of clamps for immobilizing and imaging C. elegans’, Lab on a Chip, 7(11), p. 1515. doi: 10.1039/b707861g.
Hulme, S. E. et al. (2007b) ‘A microfabricated array of clamps for immobilizing and imaging C. elegans’, Lab on a Chip, 7(11), p. 1515. doi: 10.1039/b707861g.
Humphreys, R. K. and Ruxton, G. D. (2018) ‘A review of thanatosis (death feigning) as an anti-predator behaviour’, Behavioral Ecology and Sociobiology. Behavioral Ecology and Sociobiology, 72(22). doi: 10.1007/s00265-017-2436-8.
Hyun, M. et al. (2016) ‘Fat Metabolism Regulates Satiety Behavior in C. elegans’, Scientific Reports. Nature Publishing Group, 6(April), pp. 1–9. doi: 10.1038/srep24841.
Iannacone, M. J. et al. (2017) ‘The RFamide receptor DMSR-1 regulates stress-induced sleep in C . elegans’, pp. 1–20. doi: 10.7554/eLife.19837.
Iwanir, S. et al. (2013) ‘The Microarchitecture of C . elegans Behavior during Lethargus : Homeostatic Bout Dynamics , a Typical Body Posture , and Regulation by a Central Neuron’, Sleep, 36(3), pp. 385–395.
J. Nakai, M. Ohkura and K. Imoto (2001) ‘A high signal-to-noise Ca2+ probe composed of a single green fluorescent protein’, Nature Biotechnology, 3, pp. 137–141. doi: 10.1038/84397.
Jacob, T. C. and Kaplan, J. M. (2003) ‘The EGL-21 Carboxypeptidase E Facilitates Acetylcholine Release at Caenorhabditis elegans Neuromuscular Junctions’, The Journal of Neuroscience, 23(6), pp. 2122–2130.
Jensen, T. S. and Finnerup, N. B. (2014) ‘Allodynia and hyperalgesia in neuropathic pain: Clinical manifestations and mechanisms’, The Lancet Neurology. Elsevier Ltd, 13(9), pp. 924–935. doi: 10.1016/S1474-4422(14)70102-4.
Jeon, M. et al. (1999) ‘Similarity of the C. elegans Developmental Timing Protein LIN-42 to Circadian Rhythm Proteins’, Science, 286, pp. 1141–1147. Available at: http://www.wormbase.org/db/misc/paper?name=WBPaper00012681.
Jin, Y. et al. (1999) ‘The Caenorhabditis elegans Gene unc-25 Encodes Glutamic Acid Decarboxylase and Is Required for Synaptic Transmission But Not Synaptic Development’, The Journal of Neuroscience, 19(2), pp. 539–548. doi: 10.1523/jneurosci.19-02-00539.1999.
Johnson, K. O. (2001) ‘The roles and functions of cutaneous mechanoreceptors’, Current Opinion in Neurobiology, 11(4), pp. 455–461. doi: 10.1016/S0959-4388(00)00234-8.
170
Johnston, I. D. et al. (2014) ‘Mechanical characterization of bulk Sylgard 184 for microfluidics and microengineering’, Journal of Micromechanics and Microengineering, 24, p. 035017. doi: 10.1088/0960-1317/24/3/035017.
Julius, D. and Basbaum, A. I. (2001) ‘Molecular mechanisms of nociception’, Nature, 413(September), pp. 203–210. doi: 10.1038/35093019.
Kahn-Kirby, A. H. and Bargmann, C. I. (2006) ‘TRP Channels in C. elegans’, Annual Review of Physiology, 68, pp. 719–736. doi: 10.1146/annurev.physiol.68.040204.100715.
Kaplan, J. M. and Horvitz, H. R. (2016) ‘A Dual Mechanosensory and Chemosensory Neuron in Caenorhabditis elegans’, Proceedings of the National Academy of Sciences, 90(6), pp. 2227–2231.
Karl, T. et al. (2007) ‘Altered motor activity, exploration and anxiety in heterozygous neuregulin 1 mutant mice: Implications for understanding schizophrenia’, Genes, Brain and Behavior, 6(7), pp. 677–687. doi: 10.1111/j.1601-183X.2006.00298.x.
Keane, J. and Avery, L. (2003) ‘Mechanosensory inputs influence Caenorhabditis elegans pharyngeal activity via ivermectin sensitivity genes’, Genetics, 164(1), pp. 153–162. doi: 10.1098/rstb.1976.0085.
Khanafer, K. et al. (2009) ‘Effects of strain rate, mixing ratio, and stress-strain definition on the mechanical behavior of the polydimethylsiloxane (PDMS) material as related to its biological applications’, Biomedical Microdevices, 11(2), pp. 503–508. doi: 10.1007/s10544-008-9256-6.
Kindt, K. S. et al. (2007) ‘Caenorhabditis elegans TRPA-1 functions in mechanosensation’, Nature neuroscience, 10(5), pp. 568–77. doi: 10.1038/nn1886.
Klass, M. and Hirsch, D. (1976) ‘Non-aging developmental variant of Caenorhabditis elegans’, Nature, 260, pp. 523–525. doi: 10.1038/260170a0.
Kleitman, N. (1929) ‘Sleep’, Physiological Reviews, 9, pp. 624–665.
Knibestöl, M. and Vallbo, B. (1970) ‘Single Unit Analysis of Mechanoreceptor Activity from the Human Glabrous Skin’, Acta Physiologica Scandinavica, 80(2), pp. 178–195. doi: 10.1111/j.1748-1716.1970.tb04783.x.
Konietzka, J. et al. (2019) ‘Epidermal Growth Factor signaling acts directly and through a sedation neuron to depolarizes a sleep-active neuron following cellular stress’, bioRxiv.
Konturek, S. J. et al. (1991) ‘Role of salivary glands and epidermal growth factor (EGF) in gastric secretion and mucosal integrity in rats exposed to stress’, Regulatory Peptides, 32(2), pp. 203–215. doi: 10.1016/0167-0115(91)90047-K.
Koolhaas, J. M. et al. (1999) ‘Coping styles in animals: current status in behavior and stress-psychology’, Neuroscience and Biobehavioral Reviews, 23, pp. 925–935. doi: 10.1016/S0149-7634(99)00026-3.
Kramer, A. et al. (2001) ‘Regulation of daily locomotor activity and sleep by hypothalamic EGF receptor signating’, Science, 294(5551), pp. 2511–2515. doi: 10.1126/science.1067716.
Kuraishi, Y., Harada, Y. and Takagi, H. (1979) ‘Noradrenaline regulation of pain-transmission in the spinal cord mediated by α-adrenoceptors’, Brain Research, 174, pp. 333–336. doi: 10.1016/0006-8993(79)90857-6.
171
Kushikata, T. et al. (1998) ‘Epidermal growth factor enhances spontaneous sleep in rabbits’, The American Journal of Physiology, 275(2), pp. R509-14.
Laranjeiro, R. et al. (2017) ‘Single swim sessions in C. elegans induce key features of mammalian exercise’, BMC Biology. BMC Biology, 15(30). doi: 10.1186/s12915-017-0368-4.
Li, W. et al. (2011) ‘The neural circuits and sensory channels mediating harsh touch sensation in Caenorhabditis elegans’, Nature Communications. Nature Publishing Group, 2(1), pp. 315–319. doi: 10.1038/ncomms1308.
Lightfoot, J. W. et al. (2016) ‘Assaying Predatory Feeding Behaviors in <em>Pristionchus</em> and Other Nematodes’, Journal of Visualized Experiments, (115), pp. 1–8. doi: 10.3791/54404.
Liu, D. and Thomas, J. (1994) ‘Regulation of a periodic motor program in C. elegans’, The Journal of Neuroscience, 14(4), pp. 1953–1962. doi: 10.1523/jneurosci.14-04-01953.1994.
Liu, J. et al. (2010) ‘C. elegans phototransduction requires a G protein-dependent cGMP pathway and a taste receptor homolog’, Nature neuroscience, 13(6), pp. 715–722. doi: 10.1007/s10995-015-1800-4.Alcohol.
Liu, S., Schulze, E. and Baumeister, R. (2012) ‘Temperature- and Touch-Sensitive Neurons Couple CNG and TRPV Channel Activities to Control Heat Avoidance in Caenorhabditis elegans’, PLoS ONE, 7(3), p. e32360. doi: 10.1371/journal.pone.0032360.
Liu, Z. et al. (2018) ‘Predator-secreted sulfolipids induce defensive responses in C. elegans’, Nature Communications. Springer US, 9(1128). doi: 10.1038/s41467-018-03333-6.
Lockery, S. R. et al. (2008) ‘Artificial dirt: microfluidic substrates for nematode neurobiology and behavior.’, Journal of neurophysiology, 99(6), pp. 3136–43. doi: 10.1152/jn.91327.2007.
Maguire, S. M. et al. (2011) ‘The C. elegans touch response facilitates escape from predacious fungi.’, Current biology : CB. Elsevier Ltd, 21(15), pp. 1326–30. doi: 10.1016/j.cub.2011.06.063.
McClanahan, P. D., Xu, J. H. and Fang-Yen, C. (2017) ‘Comparing Caenorhabditis elegans gentle and harsh touch response behavior using a multiplexed hydraulic microfluidic device’, Integr. Biol. Royal Society of Chemistry, 9(10), pp. 800–809. doi: 10.1039/C7IB00120G.
McIntire, S. L. et al. (1993) ‘The GABAergic nervous system of C.elegans’, Nature, 364, pp. 337–341.
Montagu, A. (1984) ‘The Skin, Touch, and Human Development’, Clinics in Dermatology, 2(4), pp. 17–26. doi: 10.1016/0738-081X(84)90043-9.
Mori, I., Sasakura, H. and Kuhara, A. (2007) ‘Worm Thermotaxis: a Model System for Analyzing Thermosensation and Neural Plasticity’, Current Opinion in Neurobiology, 17(6), pp. 712–719. doi: 10.1016/j.conb.2007.11.010.
Nagy, S. et al. (2014) ‘Homeostasis in C. elegans sleep is characterized by two behaviorally and genetically distinct mechanisms’, eLife, 3, pp. 1–21. doi: 10.7554/eLife.04380.
Nagy, S., Raizen, D. M. and Biron, D. (2014) ‘Measurements of behavioral quiescence in Caenorhabditis elegans’, Methods. Elsevier Inc., 68(3), pp. 500–507. doi: 10.1016/j.ymeth.2014.03.009.
Nath, R. D. et al. (2016) ‘C. elegans Stress-Induced Sleep Emerges from the Collective Action of Multiple Neuropeptides’, Current Biology. Elsevier Ltd., 26(18), pp. 2446–2455. doi:

172
10.1016/j.cub.2016.07.048.
Nekimken, A. L. et al. (2017) ‘Pneumatic stimulation of C. elegans mechanoreceptor neurons in a microfluidic trap’, Lab on a Chip, 17, pp. 1116–1127. doi: 10.1039/C6LC01165A.
Nelson, M. D. et al. (2013) ‘The neuropeptide NLP-22 regulates a sleep-like state in Caenorhabditis elegans.’, Nature communications, 4, p. 2846. doi: 10.1038/ncomms3846.
Nelson, M. D. et al. (2014) ‘FMRFamide-like FLP-13 Neuropeptides Promote Quiescence following Heat Stress in Caenorhabditis elegans’, Current Biology. Elsevier Ltd, 24(20), pp. 1–5. doi: 10.1016/j.cub.2014.08.037.
Nichols, A. L. A. et al. (2017) ‘A global brain state underlies C. elegans sleep behavior’, Science, 356(1247), p. eaam6851:1-9. doi: 10.1126/science.aam6851.
O’Hagan, R., Chalfie, M. and Goodman, M. B. (2005) ‘The MEC-4 DEG/ENaC channel of Caenorhabditis elegans touch receptor neurons transduces mechanical signals.’, Nature neuroscience, 8(1), pp. 43–50. doi: 10.1038/nn1362.
Park, S.-J., Goodman, M. B. and Pruitt, B. L. (2007) ‘Analysis of nematode mechanics by piezoresistive displacement clamp.’, Proceedings of the National Academy of Sciences of the United States of America, 104(44), pp. 17376–17381. doi: 10.1073/pnas.0702138104.
Perusini, J. N. and Fanselow, M. S. (2015) ‘Neurobehavioral perspectives on the distinction between fear and anxiety’, Learning and Memory, 22(9), pp. 417–425. doi: 10.1101/lm.039180.115.
Petzold, B. C. et al. (2013) ‘MEMS-based Force-clamp Analysis of the Role of Body Stiffness in C. elegans Touch Sensation’, Integrative Biology, 5(6), pp. 853–864. doi: 10.1039/c3ib20293c.MEMS-based.
Pirri, J. K. and Alkema, M. J. (2012) ‘The neuroethology of C. elegans escape.’, Current opinion in neurobiology. Elsevier Ltd, 22(2), pp. 187–93. doi: 10.1016/j.conb.2011.12.007.
Ploghaus, A. et al. (2001) ‘Exacerbation of Pain by Anxiety is Associated with Activity in a Hippocampal Network’, The Journal of Neuroscience, 21(24), pp. 1–8. Available at: papers3://publication/uuid/8052C0B0-D9AC-4109-9357-1DC3EE225572.
Puttock, M. J. and Thwaite, E. G. (1969) ‘Elastic Compression of Spheres and Cylinders at Point and Line Contact’, National Standards Laboratory Technical Paper, (25), pp. 1–64. doi: 10.1.1.584.7900.
Raizen, D. M. et al. (2008) ‘Lethargus is a Caenorhabditis elegans sleep-like state.’, Nature, 451(January), pp. 569–72. doi: 10.1038/nature06535.
Ramana Reddy, S. V. and Yaksh, T. L. (1980) ‘Spinal Noradrenergic Terminal System Mediates Antinociception’, Brain Research, 189, pp. 391–401. doi: 10.1016/0006-8993(80)90099-2.
Ranade, S. S. et al. (2014) ‘Piezo2 is the major transducer of mechanical forces for touch sensation in mice’, Nature, 516(7529), pp. 121–125. doi: 10.1038/nature13980.Piezo2.
Rankin, C. H. (2000) ‘Context Conditioning in Habituation in the Nematode Caenorhabditis elegans’, Behavioral Neuroscience, 114(3), pp. 496–505. doi: 10.1037/0735-7044.114.3.496.
Rankin, C. H., Beck, C. D. and Chiba, C. M. (1990) ‘Caenorhabditis elegans: a new model system for the study of learning and memory.’, Behavioural Brain Research, 37(1), pp. 89–92. doi:

173
10.1016/0166-4328(90)90074-O.
Rankin, C. H. and Broster, B. S. (1992) ‘Factors Affecting Habituation and Recovery from Habituation in the Nematode Caenorhabditis elegans’, Behavioral neuroscience, 106(2), pp. 239–249. doi: 10.1037/0735-7044.106.2.239.
Rankin, C. H. and Wicks, S. R. (2000) ‘Mutations of the Caenorhabditis elegans brain-specific inorganic phosphate transporter eat-4 affect habituation of the tap-withdrawal response without affecting the response itself.’, The Journal of neuroscience : the official journal of the Society for Neuroscience, 20(11), pp. 4337–4344.
Ratner (1967) ‘Comparative Aspects of Animal Hypnosis’, in Handbook of clinical and experimental hypnosis.
Rau, V., DeCola, J. P. and Fanselow, M. S. (2005) ‘Stress-induced enhancement of fear learning: An animal model of posttraumatic stress disorder’, Neuroscience and Biobehavioral Reviews, 29(8), pp. 1207–1223. doi: 10.1016/j.neubiorev.2005.04.010.
Rechtschaffen, A. (2015) ‘Current Perspectives on the Function of Sleep’, Perspectives in Biology and Medicine, 41(3), pp. 359–390. doi: 10.1353/pbm.1998.0051.
Richard J McCloskey et al. (2017) ‘Food Responsiveness Regulates Episodic Behavioral States in Caenorhabditis elegans’, Journal of Neurophysiology, 19104. doi: 10.1152/jn.00555.2016.
Roberts, W. M. et al. (2016) ‘A stochastic neuronal model predicts random search behaviors at multiple spatial scales in C. elegans’, eLife, 5(9), pp. 1–30. doi: 10.7554/eLife.12572.
Roeder, T. et al. (2003) ‘Tyramine and octopamine: Antagonistic modulators of behavior and metabolism’, Archives of Insect Biochemistry and Physiology, 54(1), pp. 1–13. doi: 10.1002/arch.10102.
Roelofs, K. (2017) ‘Freeze for action: Neurobiological mechanisms in animal and human freezing’, Philosophical Transactions of the Royal Society B, 372(20160206). doi: 10.1098/rstb.2016.0206.
Rose, J. K. et al. (2003) ‘GLR-1, a non-NMDA glutamate receptor homolog, is critical for long-term memory in Caenorhabditis elegans.’, The Journal of neuroscience : the official journal of the Society for Neuroscience, 23(29), pp. 9595–9. Available at: http://www.ncbi.nlm.nih.gov/pubmed/14573539.
Sandkühler, J. (2009) ‘Models and Mechanisms of Hyperalgesia and Allodynia’, Physiological Reviews, 89(2), pp. 707–758. doi: 10.1152/physrev.00025.2008.
Sargeant, A. B. and Eberhardt, L. E. (1975) ‘Death Feigning by Ducks in Response to Predation by Red Foxes’, The American Midland Naturalist, 94(1), pp. 108–119.
Sawin, E. R., Ranganathan, R. and Horvitz, H. R. (2000) ‘C. elegans Locomotory Rate is Modulated by the Environment through a Dopaminergic Pathway and by Experience through a Serotonergic Pathway’, Neuron, 26(3), pp. 619–631. doi: 10.1016/S0896-6273(00)81199-X.
Schmidt, N. B. and Cook, J. H. (1999) ‘Effects of anxiety sensitivity on anxiety and pain during a cold pressor challenge in patients with panic disorder’, Behaviour Research and Therapy, 37, pp. 313–323. doi: 10.1016/S0005-7967(98)00139-9.
Schulenburg, H. and Félix, M.-A. (2017) ‘The Natural Biotic Environment of Caenorhabditis elegans’, Genetics, 206(May), pp. 55–86. doi: 10.1534/genetics.116.195511.

174
Schwarz, J., Lewandrowski, I. and Bringmann, H. (2011) ‘Reduced activity of a sensory neuron during a sleep-like state in Caenorhabditis elegans’, Current Biology. Elsevier, 21(24), pp. R983–R984. doi: 10.1016/j.cub.2011.10.046.
Schwarz, J., Spies, J.-P. and Bringmann, H. (2012) ‘Reduced muscle contraction and a relaxed posture during sleep-like Lethargus’, Worm, 1(1), pp. 12–14. doi: 10.4161/hv.19229.
Selye, H. (1936) ‘A syndrome produced by diverse nocuous agents’, Nature, 1936(1), p. 32.
Selye, H. (1951) ‘The General-Adaptation-Syndrome’, Annual Review of Medicine, 2, pp. 327–342. doi: 10.1146/annurev.me.02.020151.001551.
Sieburth, D. et al. (2005) ‘Systematic analysis of genes required for synapse structure and function’, Nature, 436(7050), pp. 510–516. doi: 10.1038/nature03809.
Siegel, J. M. (2005) ‘Clues to the functions of mammalian sleep’, Nature, 437(7063), pp. 1264–1271. doi: 10.1038/nature04285.
Skora, S., Mende, F. and Zimmer, M. (2018) ‘Energy Scarcity Promotes a Brain-wide Sleep State Modulated by Insulin Signaling in C. elegans’, Cell Reports. ElsevierCompany., 22(4), pp. 953–966. doi: 10.1016/j.celrep.2017.12.091.
Stajich, J. E. et al. (2003) ‘The Genome Sequence of Caenorhabditis briggsae: A Platform for Comparative Genomics’, PLoS Biology, 1(2), p. e45. doi: 10.1371/journal.pbio.0000045.
Sterken, M. G. et al. (2015) ‘The laboratory domestication of Caenorhabditis elegans’, Trends in Genetics. Elsevier Ltd, pp. 224–231. doi: 10.1016/j.tig.2015.02.009.
Stiernagle, T. (2006) ‘Maintenance of C. elegans.’, WormBook : the online review of C. elegans biology, (1999), pp. 1–11. doi: 10.1895/wormbook.1.101.1.
Sugi, T. et al. (2014) ‘High-throughput optical quantification of mechanosensory habituation reveals neurons encoding memory in Caenorhabditis elegans.’, PNAS, 111(48), pp. 17236–17241. doi: 10.1073/pnas.1414867111.
Sugi, T. et al. (2016) ‘Nanoscale Mechanical Stimulation Method for Quantifying C. elegans Mechanosensory Behavior and Memory’, Analytical Sciences, 32, pp. 1159–1164.
Sukul, N. C. and Croll, N. A. (1978) ‘Influence of Potential Difference and Current on the Electrotaxis of Caenorhabditis elegans’, Journal of Nematology, 10(4), pp. 314–317.
Sulston, J. E. et al. (1983) ‘The Embryonic Cell Lineage of the Nematode Caenorhabditis elegans’, Developmental Biology, 100(1), pp. 64–119. Available at: http://ukpmc.ac.uk/abstract/MED/6684600.
Sulston, J. E., Albertson, D. G. and Thomson, J. N. (1980) ‘The Caenorhabditis elegans Male: Postembryonic Development of Nongonadal Structures’, Developmental Biology, 78, pp. 542–576.
Sulston, J. E. and Horvitz, H. R. (1977) ‘Post-embryonic cell Lineages of the Nematode, Caenorhabditis elegans.’, Developmental Biology, 56, pp. 110–156. Available at: http://www.wormbase.org/db/misc/paper?name=WBPaper00000366.
Suzuki, H. et al. (2003) ‘In vivo imaging of C. elegans mechanosensory neurons demonstrates a specific role for the MEC-4 channel in the process of gentle touch sensation’, Neuron, 39(6), pp. 1005–1017. doi: 10.1016/j.neuron.2003.08.015.
175
Timbers, T. a. et al. (2013) ‘Intensity discrimination deficits cause habituation changes in middle-aged Caenorhabditis elegans’, Neurobiology of Aging. Elsevier Inc., 34(2), pp. 621–631. doi: 10.1016/j.neurobiolaging.2012.03.016.
Timbers, T. A. and Rankin, C. H. (2011) ‘Tap withdrawal circuit interneurons require CREB for long-term habituation in Caenorhabditis elegans’, Behavioral Neuroscience, 125(4), pp. 560–566. doi: 10.1037/a0024370.
Tobin, D. M. et al. (2002) ‘Combinatorial Expression of TRPV Channel Proteins Defines their Sensory Functions and Subcellular Localization in C. elegans Neurons’, Neuron, 35(2), pp. 307–318. doi: 10.1016/S0896-6273(02)00757-2.
Trojanowski, N. F. and Raizen, D. M. (2016) ‘Call it Worm Sleep’, Trends in Neurosciences. Elsevier Ltd, 39(2), pp. 54–62. doi: 10.1016/j.tins.2015.12.005.
Turek, M. et al. (2016) ‘Sleep-active neuron specification and sleep induction require FLP-11 neuropeptides to systemically induce sleep’, eLife, 5, pp. 1–18. doi: 10.7554/eLife.12499.
Turek, M., Lewandrowski, I. and Bringmann, H. (2013) ‘An AP2 transcription factor is required for a sleep-active neuron to induce sleep-like quiescence in C. elegans’, Current Biology. Elsevier Ltd, 23(22), pp. 2215–2223. doi: 10.1016/j.cub.2013.09.028.
Unger, M. A. et al. (2000) ‘Monolithic microfabricated valves and pumps by multilayer soft lithography.’, Science (New York, N.Y.), 288(5463), pp. 113–116. doi: 10.1126/science.288.5463.113.
Volchan, E. et al. (2011) ‘Is there tonic immobility in humans? Biological evidence from victims of traumatic stress’, Biological Psychology. Elsevier B.V., 88(1), pp. 13–19. doi: 10.1016/j.biopsycho.2011.06.002.
Wang, Z., Volinsky, A. A. and Gallant, N. D. (2014) ‘Crosslinking effect on polydimethylsiloxane elastic modulus measured by custom-built compression instrument’, Journal of Applied Polymer Science, 41050, pp. 1–4. doi: 10.1002/app.41050.
Ward, A. et al. (2008) ‘Light-sensitive neurons and channels mediate phototaxis in C. elegans’, Nature Neuroscience, 11(8), pp. 916–922. doi: 10.1080/10810730902873927.Testing.
Ward, S. (1973) ‘Chemotaxis by the Nematode Caenorhabditis elegans: Identification of Attractants and Analysis of the Response by Use of Mutants.’, Proceedings of the National Academy of Sciences, 70(3), pp. 817–821. doi: 10.1073/pnas.70.3.817.
Ward, S. et al. (1975) ‘Electron Microscopical Reconstruction of the Anterior Sensory Anatomy of the Nematode Caenorhabditis elegans’, Journal of Comparative Neurology, 160, pp. 313–337. doi: 10.1002/cne.901600305.
Ware, R. W. et al. (1975) ‘The Nerve Ring of the Nematode Caenorhabditis elegans: Sensory Input and Motor Output’, Journal of Comparative Neurology, 162, pp. 71–110. doi: 10.1002/cne.901620106.
Way, J.C., and Chalfie, M. (1989) ‘The mec-3 gene of Caenorhabditis elegans requires its own product for maintained expression and is expressed in three neuronal cell types.’, Genes Dev, 3, pp. 1823–1833.
Wei, J.-Z. et al. (2003) ‘Bacillus thuringiensis crystal proteins that target nematodes’, Proceedings of the National Academy of Sciences, 100(5), pp. 2760–2765. doi: 10.1093/ajh/5.7.480.

176
Wen, J. Y. M. et al. (1997) ‘Mutations that Prevent Associative Learning in C. elegans’, Behavioral Neuroscience, 111(2), pp. 354–368. doi: 10.1037/0735-7044.111.2.354.
White, J. G. et al. (1986) ‘The Structure of the Nervous System of the Nematode Caenorhabditis elegans’, Philosophical transactions of the Royal Society of London, 314, pp. 1–340.
Wicks, S. R. and Rankin, C. H. (1995) ‘Integration of mechanosensory stimuli in Caenorhabditis elegans’, The Journal of Neuroscience, 15(3 Pt 2), pp. 2434–2444.
Wicks, S. R. and Rankin, C. H. (1996) ‘The integration of antagonistic reflexes revealed by laser ablation of identified neurons determines habituation kinetics of the Caenorhabditis elegans tap withdrawal response’, Journal of Comparative Physiology A, 179(5), pp. 675–685. doi: 10.1007/BF00216131.
Wittenburg, N. and Baumeister, R. (1999) ‘Thermal avoidance in Caenorhabditis elegans: An approach to the study of nociception’, Proceedings of the National Academy of Sciences, 96, pp. 10477–10482. doi: 10.1073/pnas.96.18.10477.
Woo, S.-H. et al. (2014) ‘Piezo2 is required for Merkel-cell mechanotransduction’, Nature. Nature Publishing Group, 509(7502), pp. 622–626. doi: 10.1038/nature13251.
Wu, J., Lewis, A. H. and Grandl, J. (2017) ‘Touch, Tension, and Transduction – The Function and Regulation of Piezo Ion Channels’, Trends in Biochemical Sciences. Elsevier Ltd, 42(1), pp. 57–71. doi: 10.1016/j.tibs.2016.09.004.
Wu, Y. et al. (2018) ‘Sleep Counteracts Aging Phenotypes to Survive Starvation-Induced Developmental Arrest in C. elegans’, Current Biology. Elsevier Ltd., 28(22), pp. 1–14. doi: 10.1001/archinte.168.13.1371.
Xu, X. Z. S. et al. (2016) ‘The C. elegans Taste Receptor Homolog LITE-1 Is a Photoreceptor’, Cell. Elsevier, 167(5), pp. 1252-1263.e10. doi: 10.1016/j.cell.2016.10.053.
You, Y. jai et al. (2008) ‘Insulin, cGMP, and TGF-β Signals Regulate Food Intake and Quiescence in C. elegans: A Model for Satiety’, Cell Metabolism, 7, pp. 249–257. doi: 10.1016/j.cmet.2008.01.005.
Yuan, J. and Horvitz, H. R. (1992) ‘The Caenorhabditis elegans cell death gene ced-4 encodes a novel protein and is expressed during the period of extensive programmed cell death’, Development, 116, pp. 309–320. Available at: http://www.ncbi.nlm.nih.gov/pubmed/1286611.
Zhang, J.-M. and An, J. (2007) ‘Cytokines, Inflammation, Pain’, International Anesthesiology Clinics, 45(2), pp. 27–37. doi: 10.1097/AIA.0b013e318034194e.Cytokines.
Zhao, Y. et al. (2011) ‘An Expanded Palette of Genetically Encoded Ca2+ Indicators’, Science, 333, pp. 1888–1891. doi: 10.1126/science.1208592.
Zheng, C., Diaz-Cuadros, M. and Chalfie, M. (2015) ‘Hox Genes Promote Neuronal Subtype Diversification through Posterior Induction in Caenorhabditis elegans’, Neuron. Elsevier Inc., 88(3), pp. 514–527. doi: 10.1016/j.neuron.2015.09.049.


![[Lab Report] PSpice](https://static.fdokumen.com/doc/165x107/631a338ebb40f9952b01e638/lab-report-pspice.jpg)