
MB2: Decomposed Behavior Modeling for Self-Driving ...
14
MB2: Decomposed Behavior Modeling for Self-Driving Database Management Systems Lin Ma, William Zhang, Jie Jiao, Wuwen Wang, Matthew Butrovich Wan Shen Lim, Prashanth Menon, Andrew Pavlo Carnegie Mellon University {lin.ma,mbutrovi,wanshenl,pmenon,pavlo}@cs.cmu.edu,{wz2,jiejiao,wuwenw}@andrew.cmu.edu ABSTRACT Database management systems (DBMSs) are notoriously difficult to deploy and administer. The goal of a self-driving DBMS is to remove these impediments by managing itself automatically. However, a critical problem in achieving full autonomy is how to predict the DBMS’s runtime behavior and resource consumption. These pre- dictions guide a self-driving DBMS’s decision-making components to tune and optimize all aspects of the system. We present the ModelBot2 end-to-end framework for construct- ing and maintaining prediction models using machine learning (ML) in self-driving DBMSs. Our approach decomposes a DBMS’s architecture into fine-grained operating units that make it easier to estimate the system’s behavior for configurations that it has never seen before. ModelBot2 then provides an offline execution environment to exercise the system to produce the training data used to train its models. We integrated ModelBot2 in an in-memory DBMS and measured its ability to predict its performance for OLTP and OLAP workloads running in dynamic environments. We also compare ModelBot2 against state-of-the-art ML models and show that our models are up to 25× more accurate in multiple scenarios. ACM Reference Format: Lin Ma, William Zhang, Jie Jiao, Wuwen Wang, Matthew Butrovich and Wan Shen Lim, Prashanth Menon, Andrew Pavlo . 2021. MB2: Decomposed Behavior Modeling for Self-Driving Database Management Systems. In Proceedings of the 2021 International Conference on Management of Data (SIGMOD ’21), June 20–25, 2021, Virtual Event, China. ACM, New York, NY, USA, 14 pages. https://doi.org/10.1145/3448016.3457276 1 INTRODUCTION A self-driving DBMS can configure, tune, and optimize itself with- out human intervention, even as the application’s workload, dataset, and operating environment evolve [50]. Such automation seeks to remove the complications and costs involved with DBMS deploy- ments. The core component that underlies a self-driving DBMS’s decision-making is behavior models [51]. These models estimate and explain how the system’s performance changes due to a potential action (e.g., changing knobs, creating an index). This is similar to how self-driving vehicles use physical models to guide their au- tonomous planning [49]. But existing DBMSs do not contain the embedded low-level models for self-driving operations, nor do they support generating the training data needed to build such models. Techniques for constructing database behavior models fall under two categories: (1) “white-box” analytical methods and (2) ML meth- ods. Analytical models use a human-devised formula to describe a DBMS component’s behavior, such as the buffer pool or lock manager [42, 45, 74]. These models are customized per DBMS and version. They are difficult to migrate to a new DBMS and require redesign under system updates or reconfiguration. Recent works on using ML methods to construct models have shown that they are more adaptable and scalable than white-box approaches, but they have several limitations. These works mostly target isolated query execution [9, 17, 20, 34, 40]. The models that support con- current queries focus on real-time settings where the interleaving of queries is known [16, 68, 72], but a self-driving DBMS needs to plan for future workloads without such accurate information [37]. Many ML-based models also rely on dataset or workload-dependent information [16, 40, 58]; thus, a DBMS cannot deploy these models in new environments without expensive retraining. Given this, we present a framework, called ModelBot2 (MB2), that generates behavior models that estimate the performance of a self-driving DBMS’s components and their interference during concurrent execution. This enables the DBMS’s planning compo- nents to reason about the expected benefit and the impact of actions. For example, suppose the self-driving DBMS plans to create a new index. In that case, MB2’s models can answer how long the index creation is, how the index creation impacts the system performance, and how the new index accelerates the workload’s queries. The main idea of MB2 is to decompose a DBMS’s internal archi- tecture into small, independent operating units (OUs) (e.g., building a hash table, flushing log records). MB2 then uses ML methods to train an OU-model for each OU that predicts its runtime and resource consumption for the current DBMS state. Compared to a single monolithic model for the entire DBMS, these OU-models have smaller input dimensions, require less training time, and pro- vide performance insight to each DBMS component [22]. During inference, MB2 combines OU-models to predict the DBMS’s per- formance for the future workload (which we assume is provided by workload forecasting techniques [37]) and the system state. To support multi-core environments with concurrent threads, MB2 also estimates the interference between OUs by defining the OU- models’ outputs as a set of measurable performance metrics that summarizes each OU’s behavior. MB2 then builds interference mod- els for concurrent OUs based on these metrics. MB2 also provides a principled method for data generation and training for self-driving DBMSs: developers create offline runners that exercise the system’s This work is licensed under a Creative Commons Attribution International 4.0 License. SIGMOD ’21, June 20–25, 2021, Virtual Event, China. © 2021 Copyright held by the owner/author(s). ACM ISBN 978-1-4503-8343-1/21/06. https://doi.org/10.1145/3448016.3457276 Research Data Management Track Paper SIGMOD ’21, June 20–25, 2021, Virtual Event, China 1248
-
Upload
khangminh22 -
Category
Documents
-
view
0 -
download
0
Transcript of MB2: Decomposed Behavior Modeling for Self-Driving ...

MB2: Decomposed Behavior Modeling forSelf-Driving Database Management SystemsLin Ma, William Zhang, Jie Jiao, Wuwen Wang, Matthew Butrovich
Wan Shen Lim, Prashanth Menon, Andrew PavloCarnegie Mellon University
{lin.ma,mbutrovi,wanshenl,pmenon,pavlo}@cs.cmu.edu,{wz2,jiejiao,wuwenw}@andrew.cmu.edu
ABSTRACT
Database management systems (DBMSs) are notoriously difficult todeploy and administer. The goal of a self-driving DBMS is to removethese impediments by managing itself automatically. However, acritical problem in achieving full autonomy is how to predict theDBMS’s runtime behavior and resource consumption. These pre-dictions guide a self-driving DBMS’s decision-making componentsto tune and optimize all aspects of the system.
We present the ModelBot2 end-to-end framework for construct-ing and maintaining prediction models using machine learning(ML) in self-driving DBMSs. Our approach decomposes a DBMS’sarchitecture into fine-grained operating units that make it easierto estimate the system’s behavior for configurations that it hasnever seen before. ModelBot2 then provides an offline executionenvironment to exercise the system to produce the training dataused to train its models. We integrated ModelBot2 in an in-memoryDBMS and measured its ability to predict its performance for OLTPand OLAP workloads running in dynamic environments. We alsocompare ModelBot2 against state-of-the-art ML models and showthat our models are up to 25× more accurate in multiple scenarios.ACM Reference Format:
LinMa,William Zhang, Jie Jiao,WuwenWang, Matthew Butrovich andWanShen Lim, Prashanth Menon, Andrew Pavlo . 2021. MB2: DecomposedBehavior Modeling for Self-Driving Database Management Systems. InProceedings of the 2021 International Conference on Management of Data(SIGMOD ’21), June 20–25, 2021, Virtual Event, China. ACM, New York, NY,USA, 14 pages. https://doi.org/10.1145/3448016.3457276
1 INTRODUCTION
A self-driving DBMS can configure, tune, and optimize itself with-out human intervention, even as the application’s workload, dataset,and operating environment evolve [50]. Such automation seeks toremove the complications and costs involved with DBMS deploy-ments. The core component that underlies a self-driving DBMS’sdecision-making is behavior models [51]. These models estimate andexplain how the system’s performance changes due to a potentialaction (e.g., changing knobs, creating an index). This is similar tohow self-driving vehicles use physical models to guide their au-tonomous planning [49]. But existing DBMSs do not contain the
Permission to make digital or hard copies of part or all of this work for personal orclassroom use is granted without fee provided that copies are not made or distributedfor profit or commercial advantage and that copies bear this notice and the full citationon the first page. Copyrights for third-party components of this work must be honored.For all other uses, contact the owner/author(s).SIGMOD ’21, June 20–25, 2021, Virtual Event, China© 2021 Copyright held by the owner/author(s).ACM ISBN 978-1-4503-8343-1/21/06.https://doi.org/10.1145/3448016.3457276
embedded low-level models for self-driving operations, nor do theysupport generating the training data needed to build such models.
Techniques for constructing database behavior models fall undertwo categories: (1) “white-box” analytical methods and (2) MLmeth-ods. Analytical models use a human-devised formula to describea DBMS component’s behavior, such as the buffer pool or lockmanager [42, 45, 74]. These models are customized per DBMS andversion. They are difficult to migrate to a new DBMS and requireredesign under system updates or reconfiguration. Recent workson using ML methods to construct models have shown that theyare more adaptable and scalable than white-box approaches, butthey have several limitations. These works mostly target isolatedquery execution [9, 17, 20, 34, 40]. The models that support con-current queries focus on real-time settings where the interleavingof queries is known [16, 68, 72], but a self-driving DBMS needs toplan for future workloads without such accurate information [37].ManyML-based models also rely on dataset or workload-dependentinformation [16, 40, 58]; thus, a DBMS cannot deploy these modelsin new environments without expensive retraining.
Given this, we present a framework, calledModelBot2 (MB2),that generates behavior models that estimate the performance ofa self-driving DBMS’s components and their interference duringconcurrent execution. This enables the DBMS’s planning compo-nents to reason about the expected benefit and the impact of actions.For example, suppose the self-driving DBMS plans to create a newindex. In that case, MB2’s models can answer how long the indexcreation is, how the index creation impacts the system performance,and how the new index accelerates the workload’s queries.
The main idea of MB2 is to decompose a DBMS’s internal archi-tecture into small, independent operating units (OUs) (e.g., buildinga hash table, flushing log records). MB2 then uses ML methodsto train an OU-model for each OU that predicts its runtime andresource consumption for the current DBMS state. Compared toa single monolithic model for the entire DBMS, these OU-modelshave smaller input dimensions, require less training time, and pro-vide performance insight to each DBMS component [22]. Duringinference, MB2 combines OU-models to predict the DBMS’s per-formance for the future workload (which we assume is providedby workload forecasting techniques [37]) and the system state. Tosupport multi-core environments with concurrent threads, MB2also estimates the interference between OUs by defining the OU-models’ outputs as a set of measurable performance metrics thatsummarizes each OU’s behavior. MB2 then builds interference mod-els for concurrent OUs based on these metrics. MB2 also provides aprincipled method for data generation and training for self-drivingDBMSs: developers create offline runners that exercise the system’s
This work is licensed under a Creative Commons Attribution International 4.0 License.
SIGMOD ’21, June 20–25, 2021, Virtual Event, China. © 2021 Copyright held by the owner/author(s). ACM ISBN 978-1-4503-8343-1/21/06. https://doi.org/10.1145/3448016.3457276
Research Data Management Track Paper SIGMOD ’21, June 20–25, 2021, Virtual Event, China
1248

OUs under various conditions, and MB2 uses the runner-produceddata to train a set of workload and dataset independent OU-models.
To evaluate our approach, we implement our framework into theNoisePage DBMS [1] and measure its ability to model its runtimecomponents and predict its behavior using workload forecasts. Wealso compare against a state-of-the-art external modeling approachbased on deep learning [40]. Our results show that our modelssupport OLTP and OLAPworkloads with a minimal loss of accuracy.
2 BACKGROUND AND MOTIVATION
A self-driving DBMS’s architecture shares similar inspirations fromself-driving cars. The commonly adopted self-driving car archi-tecture (simplified for demonstration) consists of (1) a perceptionsystem, (2) mobility models, and (3) a decision-making system [49].The perception system observes the vehicle’s surrounding environ-ment and estimates the potential state, such as other vehicles’ move-ments. The mobility models approximate a vehicle’s behavior inresponse to control actions in relevant operating conditions. Lastly,the decision-making system uses the perception and the models’estimates to select actions to accomplish the driving objectives.
The above components have analogs in a self-driving DBMS: (1)forecasting, (2) behavior models, and (3) planning system [51]. Theforecasting system is how the DBMS observes and predicts the appli-cation’s future workload [37]. The DBMS then uses these forecastswith its behavior models to predict its runtime behavior relative tothe target objective function (e.g., latency, throughput). The DBMS’splanning system selects actions that improve this objective function.
Behavior models are the foundation for building a self-drivingDBMS since high-fidelity models form the basis of robust planningand control. We now provide an overview of the salient aspects ofmodeling for self-driving DBMSs. We then discuss the limitationsand unsolved challenges with existing approaches.
2.1 Behavior Modeling
Given an action, a self-driving DBMS’s behavior models estimate(1) how long the action takes, (2) how much resource the actionconsumes, (3) how applying the action impacts the system per-formance, and (4) how the action impacts the system once it isdeployed. Such models can also provide explanations about theself-driving DBMS’s decisions and debug potential issues.
Analytical models use a human-devised formula to describe aDBMS component’s behavior, such as the buffer pool or the lockmanager [42, 45, 74]. The unknown variables in the formula gener-ally come from a workload specification. The models (formulas) aredisparate for different DBMSs, components, and algorithms. Forexample, these works have devised drastically different I/O formu-las for MySQL and SQL Server [42, 45]. Thus, it is challenging andonerous to revise these models for new DBMSs or DBMS updates.
Recent works show promising results using ML to model queryexecution in analytical workloads [17, 34, 40]. These ML-basedmodels use query plan information (e.g., cardinality estimates) asinput features to estimate system performance metrics (e.g., querylatency). Although ML-based models’ are potentially easier to trans-fer to new environments, they still require feature adjustments, data
0 25 50 75 100 125 150 175 200Time (s)
0
500
1000
1500
Ave
rage
Que
ryLa
tenc
y(u
s) Start Index CreationStart Index Creation
Index Createdwith 8 Threads
Index Createdwith 4 Threads
4 Create Index Threads8 Create Index Threads
Figure 1: Index Build Example – TPC-C query latency running onNoisePage. The DBMS begins index building after 60s using 4 or 8 threads.
remaking, and retraining. Existing models also do not support trans-actional workloads, nor do they consider the effects of the DBMS’smaintenance operations (e.g., garbage collection).
Some methods also support concurrent queries when the arrivaltime of each query is known. They derive the concrete interleavingof queries as the input for their analytical or ML models [16, 68, 72].This is insufficient for a self-driving DBMS because it must accountfor unknown future workloads when planning expensive actions.
To illustrate the difficulties inherent in self-driving DBMS model-ing, consider the scenario of when a DBMS must decide whether tobuild an index. For this example, we use the TPC-C benchmark run-ning on NoisePage; we provide our experimental details in Sec. 8.The results in Fig. 1 show the query latency for the TPC-C work-load when we remove a secondary index on the CUSTOMER table.After 60s, the DBMS begins adding that index back to improve thelatency. However, before it can start, the DBMS’s planning compo-nent uses behavior models to identify what benefit (if any) addingthat index would provide. The planning component also must selecthow many threads to use to build the index; using more threadswill decrease the build time but degrade the system’s performance.For example, Fig. 1 shows that building with four threads onlydegrades performance by 25%, but it takes 80s to finish, whereasusing eight threads degrades performance by 32% but completesin 40s. A DBMS needs this information to determine which actiondeployment to choose based on the environment and constraints.
2.2 Challenges
Despite the advantages of using ML to build models, there areseveral challenges in using them in a self-driving DBMS.High Dimensionality: One approach for behavior modeling is tobuild a monolithic model that captures all aspects of the DBMS,including its workload, configuration, and actions. Although this isconceptually clean, it incurs the “curse of dimensionality” problemwhere an ML model’s predictive power decreases as the number ofdimensions or features increases [62]. Even if the model only targetsquery execution, a modern DBMS will still have hundreds of planoperator features [9, 40]. Naïvely concatenating these features intothe model will lead to sparse input and weak predictive efficacy.Partially because of this, modeling techniques target individualoperators instead of the entire query plan [34, 40]. A self-drivingDBMS must also consider its runtime state (e.g., database contents,knob configurations), interactions with other components (e.g.,garbage collection), and other autonomous actions (e.g., buildingindexes), which further increases dimensionality.
Research Data Management Track Paper SIGMOD ’21, June 20–25, 2021, Virtual Event, China
1249

Figure 2: System Architecture – MB2 trains OU-models for each OUwith the data generated by OU-runners and builds interference models forconcurrent OUs based on system resource utilization.
Concurrent Operations: Since queries and DBMS componentsthat run simultaneously will interfere with each other, a self-drivingDBMS needs to model such interference in dynamic environments.A simple approach is to duplicate the input features by the max-imum degree of concurrency (e.g., number of threads). This mul-tiplicatively increases feature dimensionality and exponentiallyincreases the possible input features for the models. For example, aworkload with 10 different queries running on a 20 core machinehas 1120 possible input feature combinations. Queries may alsoincur interference that is not easily identifiable solely on plan fea-tures, such as the resource contention between concurrent queries.Training, Generalizability, and Explainability: Collecting suf-ficient training data to build ML models for DBMSs is non-trivialwhen there are many features with large domains. Part of thisdifficulty is because some DBMS operations take a long time tocomplete. Thus, collecting this data is expensive, which is a keyproblem for many ML methods [52]. For example, building indexescan take hours [12], limiting the amount of training data that aDBMS can collect. Most of the previous work on using ML to pre-dict query execution times rely on synthetic benchmarks for train-ing [34, 38, 40, 63]. Although their models perform well for thesame workload used for training, they have high prediction errorson different workloads. The behavior models should also be explain-able and debuggable to facilitate their practical application [30].
3 OVERVIEW
MB2 is an embedded behavior modeling framework for self-drivingDBMSs. There are two key design considerations: (1) since collect-ing training data, building models, and diagnosing problems areexpensive and time-consuming, MB2 generates models offline in adataset and workload independent manner. The DBMS then usesthe same set of models to estimate the runtime actions’ impact onany workload or dataset. (2) MB2’s models are debuggable, explain-able, and adaptable. These qualities reduce development complexityand provide a view of why the DBMS chooses specific actions.
Fig. 2 provides an overview of MB2’s modeling architecture. Themain idea is to decompose the DBMS into independent operating
Figure 3: MB2 Inference Procedure – Given the forecasted workloadand a self-driving action, MB2 records the OUs for all input tasks, and usesthe OU-models and interference models to predict the DBMS’s behavior.
units (OUs). An OU represents a step that the DBMS performs tocomplete a specific task. These tasks include query execution steps(e.g., building join hash tables (JHTs)) and internal maintenancesteps (e.g., garbage collection). DBMS developers are responsible forcreating OUs and deciding their boundaries based on the system’simplementation. We decompose NoisePage naturally following thesystem’s source code organization. For example, NoisePage definesan OU for the function that builds a hash table.
MB2 pairs each OU with an OU-runner that exercises the OU’scorresponding DBMS component by sweeping the component’sinput parameter space. MB2 then provides a lightweight data col-lection layer to transform these OU-runners’ inputs to OU featuresand track the OU’s behavior metrics (e.g., runtime, CPU utilization).For each OU, MB2 automatically searches, trains, and validates anOU-model using the data collected from the related OU-runner.
To orchestrate data collection across all OUs and to simulateconcurrent environments, MB2 uses concurrent runners to executeend-to-end workloads (e.g., benchmarks, query traces) with mul-tiple threads. MB2 uses its training data collectors to build inter-ference models that estimate the impact of resource competition,cache locality, and internal contention among concurrent OUs.
With OU-models trained for the entire system, a self-drivingDBMS can use them as a simulator to approximate its runtimebehavior. Fig. 3 shows how aDBMS usesMB2’s models for inference.The inputs for MB2 are the forecasted workload and a potentialaction. Employing the same translator infrastructure for trainingdata collection, MB2 first extracts the OUs from the inputs andgenerates their model features. It then uses OU-models to predictthe behavior of each OU, and uses the interference models to adjustthe OU-model’s prediction to account for the impact of concurrentOUs. Finally, MB2 sums OU’s prediction to derive information thatguides the DBMS’s planning system, such as how long the actiontakes and its impacts on the forecasted workload’s performance.
Returning to our example from Sec. 2.1, before a self-drivingDBMS chooses the action to build the index, it can useMB2’s modelsto estimate the time and consumed resources (e.g., CPU, memory)
Research Data Management Track Paper SIGMOD ’21, June 20–25, 2021, Virtual Event, China
1250
for the action’s OUs. MB2 also estimates the effect of building theindex on the regular workload by converting its queries into OUsand predicting their performance. The DBMS’s planning systemthen decides whether to build this index and provides explanationsfor its decision based on these detailed predictions.Assumptions and Limitations: We now clarify MB2’s capabili-ties on what it can and cannot do. Foremost is that we assume theframework uses a forecasting system to generate estimations for fu-tureworkload arrival rates in fixed intervals (e.g., aminute/hour) [37].The workload forecasting system cannot predict ad-hoc queries ithas never seen before. Thus, we assume the DBMS executes querieswith a cached query plan except for the initial invocation.
We assume that the target system is an in-memory DBMS; MB2does not support disk-oriented DBMSs with buffer pools. This as-sumption simplifies MB2’s behavior models since it does not haveto consider what pages could be in memory for each query. Estimat-ing cache contents is difficult enough for a single query. It is morechallenging when evaluating a sequence of forecasted queries.
MB2 supports both OLTP and OLAP workloads, as well as mixedworkloads. Assuming an in-memory DBMSmakes it easier to modelOLAP workloads since each query’s performance is affected byaspects of the system that are observable by MB2: (1) database con-tents, (2) configuration, and (3) operating environment. ModelingOLTP queries poses additional challenges due to higher variancewith short query execution times. Supporting transactions alsomeans that MB2 must consider logical contention (e.g., transac-tions updating the same record) as well as physical contention forhardware resources. We assume that the DBMS uses MVCC [71]and MB2 supports capturing lock contention. MB2 does not, how-ever, model transaction aborts due to data conflicts because it ischallenging to get precise forecasts of overlapping queries.
MB2’s OU-models’ input features contain the cardinality esti-mation from the DBMS optimizer, which is known to be error-prone [32]. Our evaluation shows that MB2’s prediction is insensi-tive against cardinality estimation errors within a reasonable range(30%). There are recent works that use ML to improve an optimizer’scardinality estimations [18, 27, 66, 67, 73], which MB2 may leverage.
Lastly, while MB2 supports hardware context in its models (seeSec. 4.2), we defer the investigation on what features to includefor different hardware (e.g., CPU, disk) and environments (e.g.,bare-metal, container) as future work.
4 OU-MODELS
We now discuss how to create a DBMS’s OU-models with MB2. Thegoal of these models is to estimate the time and resources that theDBMS will consume to execute a query or action. A self-drivingDBMS can make proper planning decisions by combining theseestimates from multiple queries in a workload forecast interval. Inaddition to accuracy, these models need to have three propertiesthat are important for self-driving operations: (1) they provideexplanations of the DBMS’s behavior, (2) they support any datasetand workload, and (3) they adapt to DBMS software updates.
4.1 Principles
Developers use MB2 to decompose the DBMS into OUs to buildexplainable, adaptable, and workload independent behavior models.
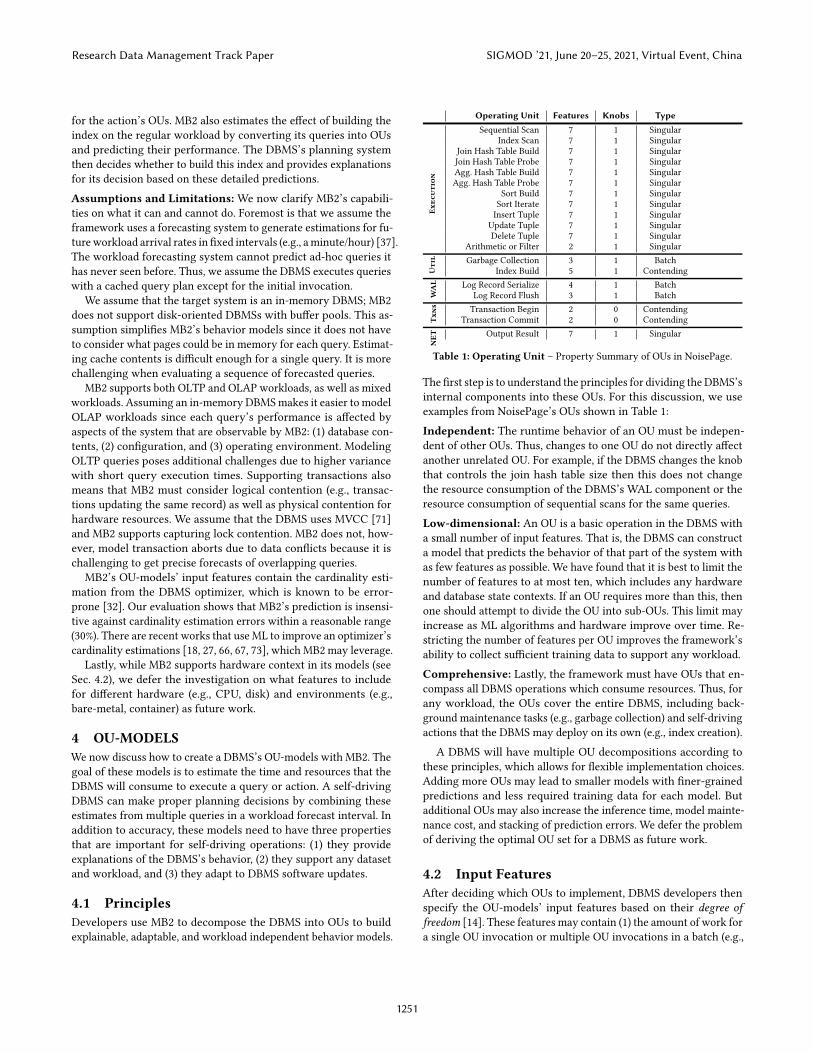
Operating Unit Features Knobs Type
Execution
Sequential Scan 7 1 SingularIndex Scan 7 1 Singular
Join Hash Table Build 7 1 SingularJoin Hash Table Probe 7 1 SingularAgg. Hash Table Build 7 1 SingularAgg. Hash Table Probe 7 1 Singular
Sort Build 7 1 SingularSort Iterate 7 1 SingularInsert Tuple 7 1 Singular
Update Tuple 7 1 SingularDelete Tuple 7 1 Singular
Arithmetic or Filter 2 1 Singular
Util Garbage Collection 3 1 Batch
Index Build 5 1 Contending
WAL Log Record Serialize 4 1 Batch
Log Record Flush 3 1 Batch
Txns Transaction Begin 2 0 Contending
Transaction Commit 2 0 Contending
NET Output Result 7 1 Singular
Table 1: Operating Unit – Property Summary of OUs in NoisePage.
The first step is to understand the principles for dividing the DBMS’sinternal components into these OUs. For this discussion, we useexamples from NoisePage’s OUs shown in Table 1:Independent: The runtime behavior of an OU must be indepen-dent of other OUs. Thus, changes to one OU do not directly affectanother unrelated OU. For example, if the DBMS changes the knobthat controls the join hash table size then this does not changethe resource consumption of the DBMS’s WAL component or theresource consumption of sequential scans for the same queries.Low-dimensional: An OU is a basic operation in the DBMS witha small number of input features. That is, the DBMS can constructa model that predicts the behavior of that part of the system withas few features as possible. We have found that it is best to limit thenumber of features to at most ten, which includes any hardwareand database state contexts. If an OU requires more than this, thenone should attempt to divide the OU into sub-OUs. This limit mayincrease as ML algorithms and hardware improve over time. Re-stricting the number of features per OU improves the framework’sability to collect sufficient training data to support any workload.Comprehensive: Lastly, the framework must have OUs that en-compass all DBMS operations which consume resources. Thus, forany workload, the OUs cover the entire DBMS, including back-ground maintenance tasks (e.g., garbage collection) and self-drivingactions that the DBMS may deploy on its own (e.g., index creation).
A DBMS will have multiple OU decompositions according tothese principles, which allows for flexible implementation choices.Adding more OUs may lead to smaller models with finer-grainedpredictions and less required training data for each model. Butadditional OUs may also increase the inference time, model mainte-nance cost, and stacking of prediction errors. We defer the problemof deriving the optimal OU set for a DBMS as future work.
4.2 Input Features
After deciding which OUs to implement, DBMS developers thenspecify the OU-models’ input features based on their degree offreedom [14]. These features may contain (1) the amount of work fora single OU invocation or multiple OU invocations in a batch (e.g.,
Research Data Management Track Paper SIGMOD ’21, June 20–25, 2021, Virtual Event, China
1251

Figure 4: OU and Interference Models – MB2 uses OU-specific inputfeatures to predict their resource consumption and elapsed time. The inter-ference model uses the summary predictions for concurrent OUs.
the number of tuples to process), (2) the parallel invocation status ofan OU (e.g., number of threads to create an index), and (3) the DBMSconfiguration knobs (e.g., the execution mode). Although humansselect the features for each OU-model, the features’ values aregenerated automatically by the DBMS based on the workload andactions. Some features are generic and will be the same across manyDBMSs, whereas others are specific to a DBMS’s implementation.We categorize OUs into three types based on their behavior pattern,which impacts what information the input features have.Singular OUs: The first type of OUs have input features that rep-resent the amount of work and resource consumption for a singleinvocation. These include NoisePage’s execution category OUs inTable 1. Almost all its execution OUs have the same seven inputfeatures. The first six features are related to the relational operatorthat the OU belongs to: (1) number of input tuples, (2) number ofcolumns of input tuples, (3) average input tuple size, (4) estimatedkey cardinality (e.g., sorting, joins), (5) payload size (e.g., hash tableentry size for hash joins), and (6) number of loops (only for indexnested loop joins). The first three features indicate the tuple volumethat the OU will process as an estimate of the amount of work itwill perform. Likewise, the fourth and fifth features approximatethe expected output, which helps determine the intermediate statethat the OU maintains during execution. The sixth feature indicateswhether the OUs is repeatedly executed in a loop, which helpscapture short OUs’ caching effect. Lastly, the seventh feature is anexecution mode flag that is specific to NoisePage; this indicateswhether the DBMS executes a query with its interpreter or as JIT-compiled [29, 41]. NoisePage’s networking OU also belongs to thistype since network communication is discrete amount of work.Batch OUs: The second type of OUs have input features that repre-sent a batch of work across multiple OU invocations. It is challeng-ing to derive features for these OUs since a single invocation mayspan multiple queries based on when those queries arrive and theinvocation interval. For example, the OU for log flushes will write
the log records generated from queries since the last invocation,the timing of which is unknown. To address this, we define the logflush OU’s input features to represent the total amount of recordsgenerated by the set of queries predicted to arrive in a workloadforecasting interval: (1) the total number of bytes, (2) the total num-ber of log buffers, and (3) the log flush interval. These features areindependent of what plans the DBMS chooses for each query.Contending OUs: The last type of OUs are for operations that mayincur contention in parallel invocations. For example, the DBMScan use multiple threads to build an index, but the threads have toacquire latches in the data structure. We include the contention in-formation into these OUs input features. For the index build OU, itsinput features include: (1) number of tuples, (2) number of keys, (3)size of keys, (4) estimated cardinality of the keys, and (5) the num-ber of parallel threads, which indicates the contention1. Similarly,the OUs related to starting and ending transactions also contain in-formation about transactions’ arrival rates in the workload forecastinterval. The internal contention is orthogonal to the concurrentimpact that MB2’s interference model captures based on resourceconsumption that we will discuss in Sec. 5.
A self-driving DBMS must also predict how changes to its con-figuration knobs impact its OUs. We categorize these tunable knobsinto behavior knobs and resource knobs. The former affects the inter-nal behavior of one or more OUs, such as the execution mode andlog flushing interval. As shown in these examples, MB2 appendsbehavior knobs to the impacted OUs’ features. Thus, the OU-modelscan predict the OU behavior when changing these knobs. MB2 canalso append the hardware context to the OU features to general-ize the OU-models across hardware. We demonstrate such abilityby extending the OU features with one hardware feature, i.e., theCPU frequency (Sec. 8.6). We leave a thorough investigation for theproper hardware context features as future work.
4.3 Output Labels
Every OU-model produces the same output labels. They are a vectorof commonly available hardware metrics (Sec. 6.1) that approxi-mate the OU’s behavior per invocation (i.e., for a single set of inputfeatures): (1) elapsed time, (2) CPU time, (3) CPU cycles, (4) CPUinstructions, (5) CPU cache references, (6) CPU cache misses, (7)disk block reads, (8) disk block writes (for logging), and (9) memoryconsumption. These metrics explain what work an OU does inde-pendent of which OU it is. Using the same labels enables MB2 tocombine them together to predict the interference among concur-rent OUs. They also help the self-driving DBMS estimate the impactof knobs for resource allocation. For example, the OU-models canpredict each query’s memory consumption by predicting the mem-ory consumption for all the OUs related to the query. A self-drivingDBMS evaluates what queries can execute under the knob thatlimits the working memory for each query, and then sets that knobaccording to its memory budget. Similarly, CPU usage predictionshelp a self-driving DBMS evaluate whether it has assigned enoughCPU resources for queries or its internal components.
1For parallel OUs, including the index build, MB2 uses the max (instead of the sum)predicted elapsed time among each single-threaded invocation as the elapsed time.
Research Data Management Track Paper SIGMOD ’21, June 20–25, 2021, Virtual Event, China
1252

Output Label Normalization: We now discuss how MB2 nor-malizes OU-models’ output labels by tuple counts to improve theiraccuracy and efficiency. DBMSs can execute queries that range fromaccessing a single tuple (i.e., OLTP workloads) to scanning billionsof tuples (i.e., OLAP workloads). The former is fast to replicate withOU-runners, but the latter is expensive and time-consuming. Toovercome this issue, MB2 employs a normalization method inspiredby a previous approach for scaling query execution modeling [34].We observe that many OUs have a known complexity based on thenumber of tuples processed, which we denote as 𝑛. For example, ifwe fix all the input features except for 𝑛, the time and resourcesrequired to build a hash table for a join are O(𝑛). Likewise, the timeand resources required to build buffers for sorting are O(𝑛 log𝑛).We have found in our evaluations with NoisePage that with typi-cally less than a million tuples, the output labels converge to theOU’s asymptotic complexity multiplied by a constant factor.
Given this, for OU-models that have the number of processedtuples/records as an input feature, MB2 normalizes the outputs.It divides the outputs by the related OU’s complexity based onthe number of tuples, while the inputs remain intact. A specialcase is the memory consumption label for building hash tables:NoisePage uses different hash table implementations for joins andaggregations. The hash table pre-allocates memory for joins basedon the number of tuples; for aggregations, the hash table growswith more inserted unique keys. Thus, to normalize this label, MB2divides it by the number of input tuples for the join hash table OUand by the cardinality feature for the aggregation hash table OU.
With such normalization, MB2 only needs to collect training datafor OU-models with the number of tuples up to the convergencepoint. Although previous work on analytical DBMS models alsoleverages similar database domain knowledge [42, 45], MB2’s nor-malization to OU-models is simple to implement regardless of theOU’s implementation and is easy to adapt when there are systemupdates (Sec. 7). We demonstrate in Sec. 8 that MB2 generalizes todatasets with orders of magnitude higher number of tuples thanwhat exists in the training data using this approach.
5 INTERFERENCE MODEL
The OU-models capture the internal contention on data structuresor latches within an OU (Sec. 4.2). But there can also be interferenceamong OUs due to resource competition, such as CPU, I/O, andmemory.2 MB2 builds a common interference model to capturesuch interference since it may impact any OU.
As shown in Fig. 4, MB2 first extracts all OUs from the forecastedworkload and the planned action before using OU-models to esti-mate their output labels. It then applies the interference model toeach OU separately to adjust the OU-model’s output labels basedon the workload forecast’s concurrency information and the OU-model predictions for other OUs. Building such an interferencemodel has two challenges: (1) there are an exponential number ofconcurrent OU combinations, and (2) self-driving DBMSs need toplan actions ahead of time [50], but predicting queries’ exact futurearrival times and concurrent interleavings is arguably impossible.
2We observe that in corner cases, there can also be resource sharing among OUs, suchas the cache locality across consecutively running OUs. MB2 does not model suchinterference since it has little impact on our evaluation.
To address these challenges, we formulate a model based onsummary statistics [14] of the unified behavior metrics estimated bythe OU-models. Given that all the OU-models have the same outputlabels, the interference model uses a fixed set of input features thatsummarize the OU-model predictions regardless of the underlyingOUs. Furthermore, the summary statistics aggregate the behaviorinformation of the OUs forecasted to run in an interval, which doesnot require the exact arrival time of each query. Fig. 4 illustratesthe formulation of the resource competition interference model.
5.1 Input Features
The interference model’s inputs are the OU-model’s output labelsfor the OU to predict and summary statistics of the OUs forecastedto run in the same interval (e.g., one minute). MB2 adds the OU-models’ output labels for the OUs assigned to run on each threadseparately and uses the sum and variance for each thread’s totallabels as the summary. Although MB2 can include other summaries,such as percentiles of concurrent OUs’ OU-model predictions, wefind the above summary effective in our evaluation. MB2 also nor-malizes the interference model’s inputs by dividing them by thetarget OU-model’s estimated elapsed time to help generalization.
5.2 Output Labels
The interference model generates the same set of outputs as theOU-models. Instead of estimating the absolute values of the outputmetrics, the model predicts the element-wise ratios between theactual metrics and the OU-model’s prediction. These ratios arealways greater than or equal to one since OUs run the fastest inisolation. We observe that under the same concurrent environment,OUs with similar per-time-unit OU-model estimation (part of theinterference model’s inputs) experience similar impacts and havesimilar output ratios regardless of the absolute elapsed time. Thus,the combination of normalizing the inputs by the elapsed time andusing the ratios as the outputs helps the model generalize to OUswith various elapsed times.
6 DATA GENERATION AND TRAINING
MB2 is an end-to-end solution that enables self-driving DBMSs togenerate training data from OUs and then build accurate modelsthat predict their behavior. We now describe how MB2 facilitatesthis data collection and model training. We begin with discussingMB2’s internal components that developers must integrate intotheir DBMS. We then present our OU- and concurrent-runner in-frastructure that exercises the system to produce training data.
We again emphasize that this training data collection processuses the DBMS in an offline manner. That is, developers run thesystem in non-production environments. We defer the problemof how to collect this training data for an online system withoutincurring observable performance degradation as future work.
6.1 Data Collection Infrastructure
MB2 provides a lightweight data collection framework that systemdevelopers integrate into their DBMS. We first describe how toset up the system to collect the behavior data of OUs (i.e., inputfeatures, output labels). We then describe the runtime mechanismsthat MB2 uses for tracking each OU’s resource consumption. Lastly,
Research Data Management Track Paper SIGMOD ’21, June 20–25, 2021, Virtual Event, China
1253
we discuss how the framework retrieves this data formodel training.OU Translator: This component extracts OUs from query andaction plans and then generates their corresponding input features.MB2 uses the same translator infrastructure for both offline trainingdata collection and runtime inference.Resource Tracker: Next, MB2’s tracker records the elapsed timeand resource consumption metrics (i.e., output labels) during OUsexecution. The framework also uses this method for the interfer-ence model data since it uses the same output labels to adjust theOU-models’ outputs. MB2 enables this resource tracking right be-fore the invocation of an OU, and then disables it after the OUcompletes. The tracker uses a combination of user- and kernel-levelprimitives for recording a OU’s actions during execution. For exam-ple, it uses C++11’s std::chrono high-resolution clock to recordthe elapsed time of the OU. To retrieve hardware counter infor-mation, MB2’s uses the Linux perf library and the rusage syscall.Although these tracking methods do not require the DBMS to runwith root privileges to collect the data, they do add some amountof runtime overhead to the system. Investigating more customizedand lightweight methods for resource tracking is future work [2, 6].Metrics Collector: The challenges with collecting training dataare that (1) multiple threads produce metrics and thus require co-ordination, and (2) resource tracker can incur a noticeable cost. Itis important for MB2 to support low-overhead metrics collectionto reduce the cost of accumulating training data and interferencewith the behavior of OUs, especially in concurrent environments.
MB2 uses a decentralized metrics collector to address the firstissue. When the DBMS executes in training mode, a worker threadrecords the features and metrics for each OU that it encounters inits thread-local memory. MB2 then uses a dedicated aggregator toperiodically gather this data from the threads and store it in theDBMS’s training data repository. To address the second challenge,MB2 supports resource tracking only for a subset of queries orDBMS components. For example, when MB2 collects training datafor the OUs in the execution engine, the DBMS can turn off thetracker and metrics collector for other components.
6.2 OU-Runners
An OU-runner is a specialized microbenchmark in MB2 that ex-ercises a single OU. The goal of each OU-runner is to reproducesituations that an OU could encounter when the DBMS executesa real application’s workload. The OU-runners sweep the inputfeature space (i.e., number of rows, columns, and column types)for each OU with fixed-length and exponential step sizes, whichis similar to the grid search optimization [11]. For example, withsingular OUs related to query execution, the OU-runner wouldevaluate different combinations of tuple sizes and column types.Although it not possible to exercise every possible variation forsome OU’s, MB2’s output label normalization technique (Sec. 4.3)reduces the OU-runners’ need to consider large data sets.
There are two ways to implement OU-runners: (1) low-levelexecution code that uses the DBMS’s internal API and (2) high-level SQL statements. We chose the latter for NoisePage because itrequires less upfront engineering effort to implement them, and haslittle to no maintenance costs if the DBMS’s internal API changes.
MB2 supports modeling OLTP and OLAP workloads. To the bestof our knowledge, we are the first to support both workload- anddata-independent modeling for OLTP query execution. Prior workeither focused on modeling OLAPworkloads [34, 40, 68] or assumesa fixed set of queries/stored procedures in the workload [42, 45].Modeling the query execution in OLTP workloads is challengingfor in-memory DBMSs: since OLTP queries access a small numberof tuples in a short amount of time, spikes in hardware performance(e.g., CPU scaling), background noise (e.g., OS kernel tasks), andthe precision of the resource trackers (e.g., hardware counters) caninflict large variance on query performance. Furthermore, DBMSstypically execute repeated OLTP queries as prepared statements.
To address the first challenge on variability, MB2 executes theOU-runners for the OUs in the execution engine with sufficientrepetitions (10×) and applies robust statistics [25] to derive a reliablemeasurement of the OU’s behavior. Robust statistics can handle ahigh proportion of outliers in the dataset before giving an incorrect(e.g., arbitrarily large) result, where such proportion is called thebreakdown point. MB2 uses the 20% trimmed mean statistics [57],which has a high breakdown point (i.e., 0.4), to derive the label fromthe repeated measurements. To address the second challenge, MB2executes each query for five warm-up iterations before taking mea-surements for the query’s OUs, with all executions of a given queryusing the same query template. MB2 starts a new transaction foreach execution to avoid the data residing in CPU caches. For queriesthat modify the DBMS state, MB2 reverts the query’s changes usingtransaction rollbacks. We find the labels insensitive to the trimmedmean percentage and the number of warm-up iterations.
6.3 Concurrent Runners
Since OU-runners invoke their SQL queries one at a time, MB2 alsoprovides concurrent runners that execute end-to-end benchmarks(e.g., TPC-C, TPC-H). These concurrent runners provide MB2 withthe necessary data to train its interference model (Sec. 5).
To generate training data with diverse concurrent execution pro-files, each concurrent runner executes their workload by varyingthree parameters: (1) the subsets of queries in the benchmark to exe-cute, (2) the number of concurrent threads that the DBMS uses, and(3) the workload submission rate. The concurrent runners executetheir workload with each parameter combination for a brief periodof time (e.g., 30s) in correspondence to the short-term predictionintervals used by the DBMS’s workload forecasting framework [37].As discussed in Sec. 5.2, MB2’s interference model is agnostic to theOU elapsed time, so the concurrent runners do not need to executethe workloads at different interval lengths.
6.4 Model Training
Lastly, we discuss how MB2 trains its behavior models using therunner-generated data. Since OUs have different input features andbehaviors, they may require using different ML algorithms that arebetter at handling their unique properties and assumptions abouttheir behavior. For example, Huber regression (a variant of linearregression) is simple enough to model the filter OUs with arithmeticoperations. In contrast, sorting and hash join OUs require morecomplex models, such as random forests, to support their behaviorsunder different key number, key size, and cardinality combinations.
Research Data Management Track Paper SIGMOD ’21, June 20–25, 2021, Virtual Event, China
1254

Model Type Runner Time Data Size Training Time Model SizeOUs 514 min 38 MB 18 min 338 MB
Interference 82 min 236 MB 21 min 66 KB
Table 2: MB2 Overhead – Behavior Model Computation and Storage Cost
MB2 trains multiple models per OU and then automatically se-lects the one with the best accuracy for each OU. MB2 currently sup-ports seven ML algorithms for its models: (1) linear regression [54],(2) Huber regression [25], (3) support vector machine [56], (4) ker-nel regression [43], (5) random forest [35], (6) gradient boostingmachine [19], and (7) deep neural network [53]. For each OU, MB2first trains an ML model using each algorithm under the common80/20% train/test data split and then uses cross-validation to deter-mine the best ML algorithm to use [28]. MB2 then trains a finalOU-model with all the available training data using the best MLalgorithm determined previously. Thus, MB2 utilizes all the datathat the runners collect to build the models. MB2 uses this sameprocedure to train its interference models.
7 HANDLING SOFTWARE UPDATES
DBMSs with an active install base likely have software updates tofix bugs, improve performance, and add new features. If its behaviormodels cannot keep upwith these changes, the DBMSwill be unableto adjust itself correctly . To handle software updates, MB2 onlyneeds to run the OU-runners for the affected OUs. This restrictedretraining is possible because the OUs are independent of eachother. The OU-runners issue SQL queries to the DBMS to exercisethe OUs, which means that developers do not need to update themunless there are changes to the DBMS’s SQL syntax. Furthermore,MB2 does not need to retrain its interference models in most casesbecause resource competition is not specific to any OU.
If a DBMS update contains changes that introduces new OUbehaviors (e.g., adding a new DBMS component), then MB2 re-runs the concurrent runners to generate the interference models.In NoisePage, we currently use a heuristic for MB2 to retrain theinterference models when a DBMS update affects at least five OUs.
8 EXPERIMENTAL EVALUATION
We now discuss our evaluation of MB2 using the NoisePage DBMS.We deployed the DBMS on a Ubuntu 18.04 LTS machine with two10-core Intel Xeon E5-2630v4 CPUs, 128GB of DRAM, and IntelOptane DC P4800X SSD.
We use the OLTP-Bench [13] testbed as an end-to-end workloadgenerator for the SmallBank [10], TATP [47], TPC-C [60], and TPC-H [61] benchmarks. SmallBank is an OLTPworkload that consists ofthree tables and five transactions that models customers interactingwith a bank branch. TATP is an OLTP workload with four tablesand seven transactions for a cellphone registration service. TPC-C is a more complex OLTP benchmark with nine tables and fivetransactions that models back-end warehouses fulfilling ordersfor a merchant. Lastly, TPC-H is an OLAP benchmark with eighttables and queries that model a business analytics workload. We usenumactl to fix the DBMS and OLTP-Bench processes on separateCPU sockets. We also set the Xeon CPUs’ power governor setting to“performance” mode to reduce the variance in our measurements.
We use two evaluation metrics. For OLAP workloads, we usethe average relative error ( |𝐴𝑐𝑡𝑢𝑎𝑙−𝑃𝑟𝑒𝑑𝑖𝑐𝑡 |
𝐴𝑐𝑡𝑢𝑎𝑙) used in similar prediction
tasks in previous work [34, 40]. Since OLTP queries have shortrun-times with high variance, their relative errors are too noisy tohave a meaningful interpretation. Thus, we use the average absoluteerror ( |𝐴𝑐𝑡𝑢𝑎𝑙 − 𝑃𝑟𝑒𝑑𝑖𝑐𝑡 |) per OLTP query template.
We implemented MB2’s models with scikit-learn [7]. We usethe default hyperparameters except for random forest with 50 esti-mators, neural network with 2 layers with 25 neurons, and gradientboosting machine with 20 depth and 1000 leaves. We also imple-mented MB2’s OU-runners using Google’s Benchmark library [3]with libpqxx [4] to connect to NoisePage.
8.1 Data Collection and Training
We first discuss MB2’s data collection and model training. Theresults in Table 2 show a breakdown between the time that MB2spends generating data versus the time that it spends training itsmodels. We generated ∼1M unique data points for NoisePage’s 19OUs. Exercising the OU-runners is the most costly step because (1)OU-runners enumerate a wide range of feature combinations, and(2) certain data points are expensive to collect (e.g., building a hashtable with 1m tuples). The model training step does not take toomuch time because we designed each OU-model to have a smallnumber of features. Table 2 also shows that the concurrent runnersproduce a larger data set than the OU-runners because they executemultiple OUs at the same time. The model is much smaller since,unlike OU-models with one model for each OU, MB2 generated asingle interference model that is not specific to any OU.
In our experiments, OU translator and OU-model inference for asingle query (may contain multiple OUs) on average take 10`s and0.5ms. Each resource tracker invocation on average takes 20`s.
8.2 OU-Model Accuracy
We next evaluate the accuracy of MB2’s OU-models, which arethe foundation of the self-driving DBMS behavior models. Recallfrom Sec. 6.4 that we split the data of each OU-runner into 80/20%train/test and build models with seven ML algorithms. From thetest result, MB2 selects the best algorithm for each OU and trainsthe final OU-model using all available OU-runner data. Due tospace limitations, we only demonstrate the results for a few more-representative and better-performing ML algorithms.
Fig. 5 shows the OU-model test relative error averaged acrossall output labels. More than 80% of the OU-models have an averageprediction error less than 20%, which demonstrates the effective-ness of the OU-models. The transaction OU models have higherrelative error because most cases have short elapsed times (< 10`s)unless the system is under heavy contention. Similarly, probing anaggregation hash table takes less than 10`s in most cases enumer-ated by the OU-runner. Thus, for these short-running tasks, smallperturbations in the predictions can lead to high relative error.
For most OUs, random forest and gradient boosting machine arethe best-performing ML algorithms with sufficient generalizability.Neural networks have higher errors in comparison because theyare prone to overfitting given the OU-models’ low dimensionality.For simple OUs (e.g., arithmetics), less complex models like Huberregression achieve competitive accuracy and are cheaper to train.
Research Data Management Track Paper SIGMOD ’21, June 20–25, 2021, Virtual Event, China
1255

LOG FLUSH OUTPUT SEQ SCAN IDX SCAN SORT BUILD HASHJOIN BUILD AGG BUILD SORT ITER HASHJOIN PROBE AGG PROBE INSERT UPDATE DELETE INDEX BUILD GC LOG SERIALIZE TXN BEGIN TXN COMMIT ARITHMETICS
Operating Unit
0.0
0.2
0.4
0.6
0.8
1.0
Rel
ativ
eE
rror
Random ForestNeural Network
Huber RegressionGradient Boosting Machine
Figure 5: OU-model Accuracy (OU) – Test relative error for each OU averaging across all OU-model output labels. OU-models are trained with four MLalgorithms: (1) random forest, (2) neural network, (3) Huber regression, and (4) gradient boosting machine.
CPU CYCLE INSTRUCTION CACHE REF CACHE MISS CPU TIME BLOCK READ BLOCK WRITE MEMORY B ELAPSED USTarget Metric
0.0
0.2
0.4
0.6
0.8
1.0
Rel
ativ
eE
rror
Random Forest without NormalizationNeural Network without NormalizationHuber Regression without NormalizationGradient Boosting Machine without Normalization
Random ForestNeural NetworkHuber RegressionGradient Boosting Machine
Figure 6: OU-model Accuracy (Output Labels) – Test relative error for each output label averaging across all OUs. OU-models are trained with four MLalgorithms with and without output label normalization: (1) random forest, (2) neural network, (3) Huber regression, and (4) gradient boosting machine.
TPC-H 0.1G TPC-H 1G TPC-H 100.0
1.5
3.0
4.5
6.0
Ave
rage
Rel
ativ
eE
rror
5.35
0.360.78
0.200.67
0.92
0.20 0.19 0.25
QPPNetMB2 w/o NormalizationMB2
(a) OLAP Query Runtime PredictionTPC-C TATP SmallBank
0
3
6
9
Ave
rage
Abs
olut
eE
rror
perQ
uery
Tem
plat
e(u
s)
1.11
5.08
10.10
4.86
2.87
1.01
4.09
2.83
0.91
QPPNetMB2 w/o NormalizationMB2
(b) OLTP Query Runtime Prediction
Figure 7: OU-Model Generalization – Query runtime estimations ondifferent datasets and workloads.
In Fig. 6, we show the predictive accuracy of the OU-models foreach output label, averaging across all OUs. Most labels have anaverage error of less than 20%, where the highest error is on thecache miss label. Accurately estimating the cache misses for OUs ischallenging because the metrics depend on the real-time contentsof the CPU cache. Despite the higher cache miss error, MB2’s in-terference model still captures the interference among concurrentOUs (see Sec. 8.4) because the interference model extracts informa-tion from all the output labels. The results in Fig. 6 also show theOU-model errors without output label normalization optimizationfrom Sec. 4.3. From this, we see that normalization has minimalimpact on OU-model accuracy while enabling generalizability.
8.3 OU-Model Generalization
We now evaluate the OU-models’ ability to predict query runtimeand generalize across workloads. Accurate query runtime predic-tion is crucial since many self-driving DBMSs’ optimization ob-jectives are focused on reducing query latency [51]. As discussedin Sec. 3, MB2 extracts all OUs from a query plan and sums thepredicted labels for all OUs as the final prediction.
For a state-of-the-art baseline, we compare against the QPP-
Net ML model for query performance prediction [26, 40]. QPPNetuses a tree-structured neural network to capture a query plan’s
structural information. It outperforms other recent models on pre-dicting query runtime [9, 34, 69], especially when generalizing thetrained model to different workloads (e.g., changing dataset sizes).Since NoisePage is an in-memory DBMS with a fused-operator JITquery engine [46], we remove any disk-oriented features from QPP-Net’s inputs and adapt its operator-level tree structure to supportpipelines. But such adaptation requires QPPNet’s training data tocontain all the operator combinations in the test data pipelines todo inference with the proper tree structure. Thus, we can only trainQPPNet on more complex workloads (e.g., TPC-C) and test on thesame or simpler workloads (e.g., SmallBank).
We evaluate MB2 and QPPNet on the (1) TPC-H OLAP workloadand (2) TPC-C, TATP, and SmallBank OLTP workloads. To evaluategeneralizability, we first train a QPPNet model with query metricsfrom a 1 GB TPC-H dataset and evaluate it on two other datasetsizes (i.e., 0.1 GB, 10 GB). We then train another QPPNet modelwith data collected from the TPC-C workload (one warehouse) andevaluate it on the OLTP workloads. For MB2, we use the sameOU-models only trained once (Sec. 8.2) for all the workloads.
The results in Fig. 7a show that QPPNet achieves competitiveprediction accuracy on the 1 GB TPC-H workload since it is thesame as its training dataset. But QPPNet has larger errors for TPC-Hon other scale factors. The authors of QPPNet also observed similargeneralization challenges for their models despite it outperform-ing the baselines [40]. In contrast, MB2 achieves up to 25× betteraccuracy than QPPNet and has more stable predictions across allthe workload sizes. We attribute this difference to how (1) MB2 de-composes the DBMS into fine-grained OUs and the correspondingOU-runner enumerates various input features that cover a range ofworkloads, and (2) MB2’s output label normalization technique fur-ther bolsters OU-models’ generalizability. Even though the 10 GBTPC-H workload has tables up to 60m tuples, which is 60× largerthan the largest table considered by MB2’s OU-runners, MB2 is stillable to generalize with minimal loss of accuracy. MB2 without theoutput normalization has much worse accuracy on large datasets.
Similarly, Fig. 7b shows that while MB2 has 4× higher predictionerror compared to QPPNet on TPC-C workload where QPPNet is
Research Data Management Track Paper SIGMOD ’21, June 20–25, 2021, Virtual Event, China
1256
2 8 16Number of Concurrent Threads
0.0
0.3
0.6
0.9
1.2
Ave
rage
Que
ryR
untim
eIn
crem
ent
0.06
0.21
0.86
0.16
0.38
0.71
ActualInterference Model Estimated
(a) Varying Concurrent Threads
TPC-H 0.1G TPC-H 10GDataset Sizes
0.0
0.2
0.4
0.6
0.8
Ave
rage
Que
ryR
untim
eIn
crem
ent
0.26 0.25
0.46
0.26
ActualInterference Model Estimated
(b) Varying Dataset Sizes
Figure 8: Interference Model Accuracy – Model trained with 1 GB TPC-H dataset and odd thread numbers generalizes to other scenarios.
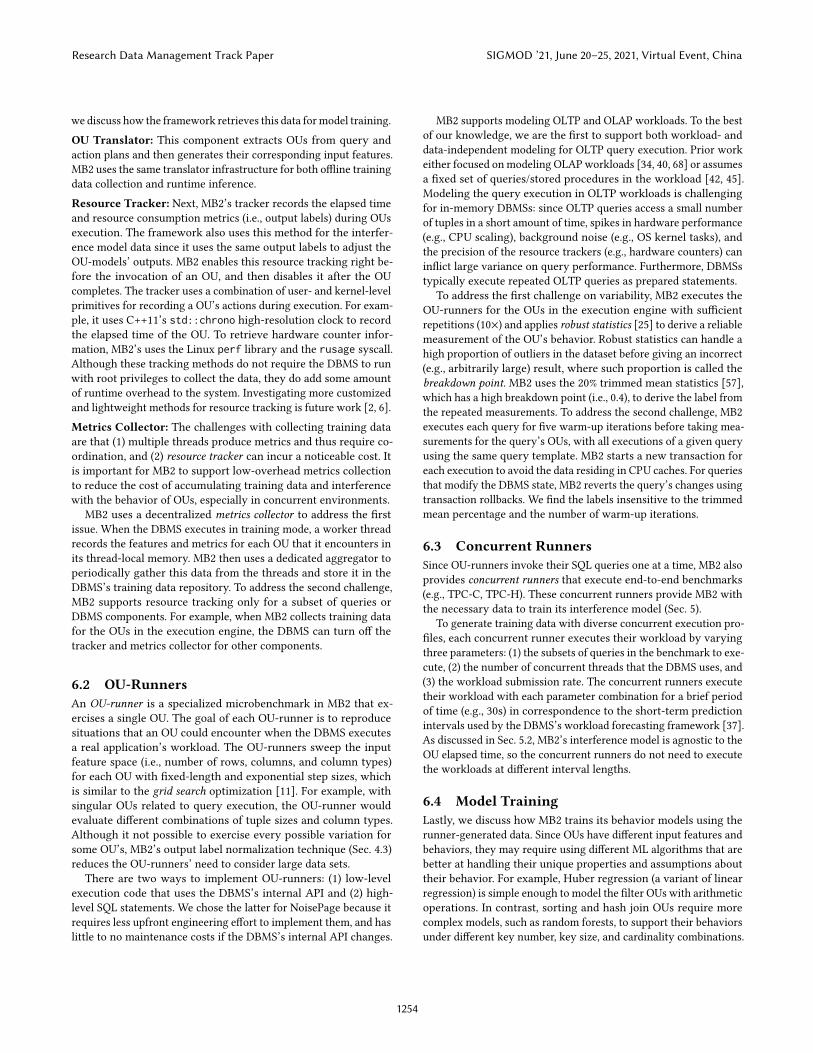
trained, MB2 achieves 1.8× and 10× better accuracy when gener-alizing to TATP and SmallBank workloads. Such generalizabilityis essential for the real-world deployment of MB2 for self-drivingDBMSs. Since these OLTP queries access a small number of tuples,output normalization has little impact on the model accuracy.
8.4 Interference Model Accuracy
We next measure the ability of MB2’s interference model to capturethe impact of resource competition on concurrent OUs. We run theconcurrent runner with the 1 GB TPC-H benchmark since it con-tains a diverse set of OUs. The concurrent runner enumerates threeparameters: (1) subsets of TPC-H queries, (2) number of concurrentthreads, and (3) query arrival rate. Since the interference modelis not specific to any OU or DBMS configuration, the concurrentrunner does not need to exercise all OU-model inputs or knobs. Forexample, with the knob that controls the number of threads, we onlygenerate training data for odd-numbered settings (i.e., 1, 3, 5, . . . 19)and then test on even-numbered settings. The concurrent runnerexecutes each query setup for 20s. To reduce the evaluation time,we assume the average query arrival rate per query template per10s is given to the model. In practice, this interval can be larger [37].Neural network performs the best for this model given its capacityto consume the summary statistics of OU-model output labels.
To evaluate the model’s generalizability, the concurrent runnerexecutes queries only in the DBMS’s interpretive mode (executionknob discussed in Sec. 4.2), but we test the model under JIT com-pilation mode. We also evaluate the model with thread numbersand workload sizes that are different from those used by MB2’sconcurrent runners. To isolate the interference model’s estimation,we execute the queries in both single-thread and concurrent envi-ronments and compare the true adjustment factors (the concurrentinterference impact) against the predicted adjustment factors.
Fig. 8 shows the actual and interference model-estimated averagequery run times under concurrent environments. The interferencemodel has less than 20% error in all cases. It generalizes to theseenvironments because (1) it leverages summary statistics of theOU-model output labels that are agnostic to specific OUs and (2)the elapsed time-based input normalization and ratio-based outputlabels help the model generalize across various scenarios. We alsoobserve that generalizing the interference model to small data sizesresult in the highest error (shown under TPC-H 0.1 GB in Fig. 8b)since the queries are shorter with potentially higher variance inthe interference, especially since the model only has the averagequery arrival information in an interval as an input feature.
1/100 Sleep 1/1000 Sleep No SleepJoin Hash Table Build Sleep Frequency
0.0
0.6
1.2
1.8
2.4
3.0
Ave
rage
Rel
ativ
eE
rror
0.09
1.73
2.68
N/A0.15 0.25
N/A N/A0.20
1/100 Sleep Model1/1000 Sleep ModelNo Sleep Model
(a) DBMS Updates (TPC-H 1 G)
TPC-H 0.1G TPC-H 1G TPC-H 10GDataset Sizes
0.00
0.08
0.16
0.24
0.32
0.40
Ave
rage
Rel
ativ
eE
rror
0.20 0.19
0.25
0.20 0.21
0.26
Accurate CardinalityNoisy Cardinality
(b) Noisy Cardinality Estimation
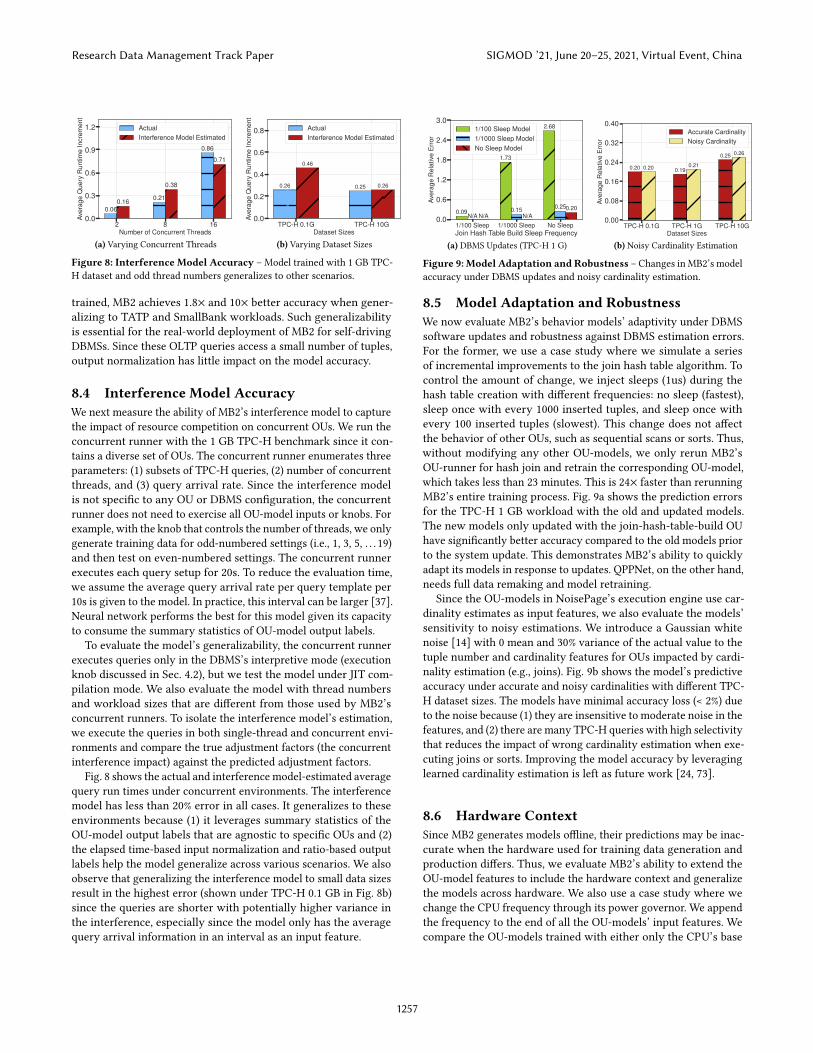
Figure 9: Model Adaptation and Robustness – Changes in MB2’s modelaccuracy under DBMS updates and noisy cardinality estimation.
8.5 Model Adaptation and Robustness
We now evaluate MB2’s behavior models’ adaptivity under DBMSsoftware updates and robustness against DBMS estimation errors.For the former, we use a case study where we simulate a seriesof incremental improvements to the join hash table algorithm. Tocontrol the amount of change, we inject sleeps (1us) during thehash table creation with different frequencies: no sleep (fastest),sleep once with every 1000 inserted tuples, and sleep once withevery 100 inserted tuples (slowest). This change does not affectthe behavior of other OUs, such as sequential scans or sorts. Thus,without modifying any other OU-models, we only rerun MB2’sOU-runner for hash join and retrain the corresponding OU-model,which takes less than 23 minutes. This is 24× faster than rerunningMB2’s entire training process. Fig. 9a shows the prediction errorsfor the TPC-H 1 GB workload with the old and updated models.The new models only updated with the join-hash-table-build OUhave significantly better accuracy compared to the old models priorto the system update. This demonstrates MB2’s ability to quicklyadapt its models in response to updates. QPPNet, on the other hand,needs full data remaking and model retraining.
Since the OU-models in NoisePage’s execution engine use car-dinality estimates as input features, we also evaluate the models’sensitivity to noisy estimations. We introduce a Gaussian whitenoise [14] with 0 mean and 30% variance of the actual value to thetuple number and cardinality features for OUs impacted by cardi-nality estimation (e.g., joins). Fig. 9b shows the model’s predictiveaccuracy under accurate and noisy cardinalities with different TPC-H dataset sizes. The models have minimal accuracy loss (< 2%) dueto the noise because (1) they are insensitive to moderate noise in thefeatures, and (2) there are many TPC-H queries with high selectivitythat reduces the impact of wrong cardinality estimation when exe-cuting joins or sorts. Improving the model accuracy by leveraginglearned cardinality estimation is left as future work [24, 73].
8.6 Hardware Context
Since MB2 generates models offline, their predictions may be inac-curate when the hardware used for training data generation andproduction differs. Thus, we evaluate MB2’s ability to extend theOU-model features to include the hardware context and generalizethe models across hardware. We also use a case study where wechange the CPU frequency through its power governor. We appendthe frequency to the end of all the OU-models’ input features. Wecompare the OU-models trained with either only the CPU’s base
Research Data Management Track Paper SIGMOD ’21, June 20–25, 2021, Virtual Event, China
1257

Train with 2.2 GHz Train with 1.2, 1.8, 2.2, 2.6, and 3.1 GHz
1.6 GHz 2.0 GHz 2.4 GHz 2.8 GHzCPU Frequency
0.0
0.1
0.2
0.3
0.4
0.5
Ave
rage
Rel
ativ
eE
rror
0.46
0.32
0.27
0.19
0.34
0.20
0.26 0.27
(a) TPC-H 1 G Query Runtime Prediction
1.6 GHz 2.0 GHz 2.4 GHz 2.8 GHzCPU Frequency
0
2
4
6
8
10
Nor
mal
ized
Ave
rage
Abs
olut
eE
rror
perQ
uery
Tem
plat
e
4.75 4.54
7.55 7.49
5.54
7.79
3.35 3.49
(b) TPC-C Query Runtime Prediction
Figure 10: Hardware Context – ExtendMB2’s OU-models’ input featuresto include the CPU frequency to generalize to different CPU frequencies.
frequency (2.2 GHz) or a range of frequencies (1.2–3.1 GHz), andtest the model generalization on a different set of frequencies.
Fig. 10 shows that extending the OU-model with hardware con-text improves the prediction inmost cases since the context capturesthe hardware performance differences. A special case where includ-ing the hardware context performs notably worse is for the TPC-Cworkload under 2.0 GHz CPU frequency (Fig. 10b). This is becausethe models generally over-predict the TPC-C query runtime for agiven frequency, and slightly slowing the CPU frequency (2.2 GHzto 2.0 GHz) falsely improves the prediction of the model trainedunder 2.2 GHz. The results show promise to extend MB2’s modelswith hardware context to generalize across hardware.
8.7 End-to-End Self-Driving Execution
Lastly, we demonstrate MB2’s behavior models’ application for aself-driving DBMS’s planning components and show how it enablesinterpretation of its decision-making process. We assume that theDBMS has (1) workload forecasting information of average queryarrival rate per query template in each 10s forecasting interval, simi-lar to Sec. 8.4, and (2) an “oracle” planner that makes decisions usingpredictions from behavior models. We assume a perfect workloadforecast to isolate MB2’s prediction error.
We simulate a daily transactional-analytical workload cycle by al-ternating the execution of TPC-C and TPC-H workloads on NoiseP-age. We use the TPC-C workload with 20 warehouses and adjustthe number of customers per district to 50,000 to make the choiceof indexes more important. For TPC-H, we use a dataset size of1 GB. We execute both workloads with 10 concurrent threads underthe maximum supported query arrival rate.
After the DBMS loads the dataset, we execute the workload inNoisePage using its interpretive mode, which is a sub-optimal knobconfiguration for long-running TPC-H queries. We also remove asecondary index on the CUSTOMER table for the (C_W_ID, C_D_ID,C_LAST) columns, which inhibits the performance of TPC-C. Wethen let the DBMS choose actions based on the forecasted workloadand the behavior model estimations from MB2.
Fig. 11a shows the actual and estimated average query runtimeper 3s interval across the entire evaluation session. We normalizedthe query runtime against the average runtime under the defaultconfiguration to keep metrics within the same scale. The workloadstarts as TPC-C and switches to TPC-H after 30s. During the first55s, the DBMS does not plan any actions. Then it plans to change theexecution mode from interpretive to compiled with MB2 estimating
0 20 40 60 80 100 120Time (s)
0.0
0.5
1.0
1.5
Nor
mal
ized
Avg
.Q
uery
Run
time
TPC-C StartTPC-H Start
Change ExecutionMode Knob
Build Indexwith 8 Threads
Index BuiltandTPC-C Start
Index Built(Estimated)Actual Query Runtime
Estimated Query Runtime
(a) Knob Changing and Index Creation (Eight Create Index Threads)
0 20 40 60 80 100 120Time (s)
0.0
0.2
0.4
0.6
0.8
CP
UU
tiliz
atio
n(R
elat
ive
toth
eD
BM
S)
Actual Query on CUSTOMER.c lastEstimated Query on CUSTOMER.c lastActual Index BuildEstimated Index Build
(b) CPU Utilization Prediction (Eight Create Index Threads)
0 20 40 60 80 100 120Time (s)
0.0
0.5
1.0
1.5N
orm
aliz
edA
vg.
Que
ryR
untim
e
TPC-C StartTPC-H Start Change Execution
Mode Knob
Build Indexwith 4 Threads
Index BuiltandTPC-C Start
Index Built(Estimated)Actual Query Runtime
Estimated Query Runtime
(c) Knob Changing and Index Creation (Four Create Index Threads)
Figure 11: End-to-End Self-Driving Execution – An example scenariowhere NoisePage uses MB2’s OU-models to predict the effects of two actionsin a changing workload. The first action is to change the DBMS’s executionmode. The DBMS then builds an index with either eight or four threads.
a 38% average query runtime reduction. The average query runtimedrops by 30% after updating this knob, which reflects the models’estimation. After 72s, the DBMS builds the above secondary indexon CUSTOMER with eight threads before the next time that the TPC-C workload starts. Both the estimated and the actual query runtimeincrease by more than 25% because of resource competition; and thecontention lasts for 27s during the index build with the estimatedbuild time being 26s. After 99s the workload switches back to TPC-C with 73% (60% estimated) faster average query runtime because ofthe secondary index built by the self-driving DBMS 3. This exampledemonstrates that MB2’s behavior models accurately estimate thecost, impact, and benefit of actions for self-driving DBMSs ahead oftime given the workload forecasting, which is a foundational steptowards building a self-driving DBMS [50].
We next show how MB2’s behavior models help explain the self-driving DBMS’s decision. Fig. 11b shows the actual and estimatedCPU utilization for the queries associated with the secondary indexon the CUSTOMER and the index build action. Both the actual andestimated CPU utilization for the queries on CUSTOMER drop signif-icantly as the TPC-C workload starts for the second time, which isthe main reason for the average query runtime reduction. Similarly,
3The DBMS does not change the execution mode for TPC-C to isolate the action effect.
Research Data Management Track Paper SIGMOD ’21, June 20–25, 2021, Virtual Event, China
1258

the high CPU utilization of index creation, which MB2 successfullypredicts, is also the main reason for the query runtime incrementbetween 72s to 99s. MB2’s decomposed modeling of each OU is thecrucial feature that enables such explainability.
Lastly, we demonstrate MB2’s estimations under an alternativeaction plan of the self-driving DBMS in Fig. 11c. The DBMS plansthe same actions under the same setup as in Fig. 11a except to buildthe index earlier (at 58s) with four threads to reduce the impact onthe running workload. MB2 accurately estimates the smaller queryruntime increment along with the workload being impacted forlonger. Such a trade-off between action time and workload impactis essential information for a self-driving DBMS to plan for targetobjectives (e.g., SLAs).We also observe that MB2 underestimates theindex build time under this scenario by 27% due to a combinationof OU- and interference-model errors.
9 RELATEDWORK
We broadly classify the previous work in DBMS modeling into thefollowing categories: (1) ML models and (2) analytical models. Re-lated to this are other methods for handling concurrent workloads.We also discuss other efforts on building automated DBMSs andreinforcement learning-based approaches.Machine Learning Models:Most ML-based behavior models usequery plan information as input features for estimating systemperformance. Techniques range from Ganapathi et al.’s subspaceprojections [20] to Gupta et al.’s PQR hierarchical classificationof queries into latency buckets [23]. Some methods mix plan- andoperator- level models to balance between accuracy and generality,compensating further for generalizability issues by adjusting pre-built offline models at runtime [9] or by building additional scalingfunctions [34]. QPPNet [40] predicts the latency of query executionplans by modeling the plan tree with deep neural networks.
ML-based models still require developers to adjust features, recol-lect data, and retrain them to generalize to new environments. Mostframeworks also train models on a small number of synthetic bench-marks and thus have high prediction errors on different workloads.Furthermore, these ML-based models do not support transactionalworkloads and ignore the effects of internal DBMS operations. Thisis in contrast to MB2 that builds a holistic model for the entiresystem that accounts for internal operations, and handles softwareupdates with limited retraining over SQL.Analytical Models: Researchers have also built analytical modelsfor DBMS components. DBSeer builds offline models that predictthe resource bottleneck and maximum throughput of concurrentOLTP workloads, given fixed transaction types and fixed DBMSconfiguration and physical design [42]. Wu et al. tunes the opti-mizer’s cost models for better query execution time predictionsthrough offline profiling and online refinement of cardinality esti-mates [69, 70]. Narasayya and Syamala provides DBAs with indexdefragmentation suggestions by modeling workload I/O costs [44].Concurrent Queries:Due to the difficulty of modeling concurrentoperations as described in Sec. 2.2, the aforementioned techniqueslargely focus on performance prediction for one query at a time.For concurrent OLAP workloads, researchers have built sampling-based statistical models that are fixed for a known set of queries.
The predictions have seen applications to scheduling [8], queryexecution time estimation [16], and overall analytical workloadthroughput prediction [17]. Wu et al. support dynamic query setsby modeling CPU, I/O interactions, and buffer pool hit rates withqueuing networks and Markov chains [68]. More recently, GPredic-tor predicts concurrent query performance by using a deep learningprediction network on a graph embedding of query features [72].But it requires the exact interleaving of queries to be known, whichis arguably impossible to forecast and thus does not apply to MB2’scontext. All of these methods also require updating their modelswhenever the DBMS’s software changes.
Autonomous DBMSs: There is a long history of research onautomating DBMS deployments [51]. Weikum et al. provided asummary of existing self-tuning DBMS techniques in the early2000s [65]. These typically involved queuing theory applied tomodels with different server types, such as applications, back-enddatabases, and middleware components [21]. Microsoft Azure SQLDatabase provides an auto-indexing [12] sub-system that automati-cally recommends, implements, and validates indexes. Oracle offersan autonomous DBaaS that runs their previous tuning tools in amanaged environment [5], which requires expensive testing of can-didate changes (e.g., indexes) on replicas without behavior models.
Another target area on using ML for automated DBMSs has beenon knob configuration tuning. iTuned [15] and OtterTune [64] useGaussian Process Regression to model how a DBMS will performwith different knob settings. CDBTune [76] and QTune [33] useactor-critic reinforcement learning to train knob recommendationpolicies. RelM tunesmemory allocation knobs for analytical systemsusing Guided Bayesian Optimization [31].
Reinforcement Learning (RL) for DBMSs: Recent work ex-plores using RL [55, 59] to enhance individual DBMS components [39,48, 75], which are independent of MB2’s goal to build behaviormodels for self-driving DBMSs that automate all the administrativetasks. We use a modularized design (Sec. 2) for self-driving DBMSs,which has a different methodology than RL-based approaches. Wethink this approach provides better data efficiency, debuggability,and explainability, which are essential for the system’s practicalapplication. All major organizations working on self-driving carsalso use a modularized approach instead of end-to-end RL [36].
10 CONCLUSION
Behavior modeling is the foundation for building a self-drivingDBMS. We propose a modeling framework ModelBot2 (MB2) thatdecomposes the DBMS into operating units (OUs) and builds modelsfor each OU with runners that exercise OUs’ behavior. Our evalua-tion shows that MB2’s behavior models provide the essential cost,impact, and benefit estimations for actions of self-driving DBMSsand generalize to various workloads and environments.
ACKNOWLEDGEMENTS
This work was supported (in part) by the National Science Founda-tion (IIS-1846158, SPX-1822933), Google Research Grants, and theAlfred P. Sloan Research Fellowship program. TKBM.
Research Data Management Track Paper SIGMOD ’21, June 20–25, 2021, Virtual Event, China
1259

REFERENCES
[1] [n.d.]. NoisePage. https://noise.page.[2] 2020. BPF Compiler Collection (BCC). https://github.com/iovisor/bcc/.[3] 2020. Google Benchmark Support Library. https://github.com/google/
benchmark.[4] 2020. libpqxx – Official C++ Client API for PostgreSQL. http://pqxx.org/
development/libpqxx/.[5] 2020. Oracle Self-Driving Database. https://www.oracle.com/database/
autonomous-database/index.html.[6] 2020. Processor Counter Monitor (PCM). https://github.com/opcm/pcm/.[7] 2020. scikit-learn: Machine Learning in Python. https://scikit-learn.org/stable/.[8] Mumtaz Ahmad, Songyun Duan, Ashraf Aboulnaga, and Shivnath Babu. 2011.
Predicting completion times of batch query workloads using interaction-awaremodels and simulation. In Proceedings of the 14th International Conference onExtending Database Technology. ACM, 449–460.
[9] Mert Akdere, Ugur Çetintemel, Matteo Riondato, Eli Upfal, and Stanley B Zdonik.2012. Learning-based query performance modeling and prediction. In DataEngineering (ICDE), 2012 IEEE 28th International Conference on. IEEE, 390–401.
[10] Mohammad Alomari, Michael Cahill, Alan Fekete, and Uwe Rohm. 2008. TheCost of Serializability on Platforms That Use Snapshot Isolation. In Proceedings ofthe 2008 IEEE 24th International Conference on Data Engineering (ICDE ’08). IEEEComputer Society, 576–585.
[11] James Bergstra and Yoshua Bengio. 2012. Random search for hyper-parameteroptimization. The Journal of Machine Learning Research 13, 1 (2012), 281–305.
[12] Sudipto Das, Miroslav Grbic, Igor Ilic, Isidora Jovandic, Andrija Jovanovic, VivekNarasayya, Miodrag Radulovic, Maja Stikic, Gaoxiang Xu, and Surajit Chaudhuri.2019. Automatically Indexing Millions of Databases in Microsoft Azure SQLDatabase. In Proceedings of the 2017 ACM International Conference on Managementof Data. ACM, 1–14.
[13] Djellel Eddine Difallah, Andrew Pavlo, Carlo Curino, and Philippe Cudre-Mauroux. 2013. OLTP-Bench: An Extensible Testbed for Benchmarking RelationalDatabases. Proceedings of the VLDB Endowment 7, 4 (2013), 277–288.
[14] Yadolah Dodge and Daniel Commenges. 2006. The Oxford dictionary of statisticalterms. Oxford University Press on Demand.
[15] Songyun Duan, Vamsidhar Thummala, and Shivnath Babu. 2009. Tuning databaseconfiguration parameters with iTuned. VLDB 2 (2009), 1246–1257. Issue 1.
[16] Jennie Duggan, Ugur Cetintemel, Olga Papaemmanouil, and Eli Upfal. 2011.Performance prediction for concurrent database workloads. In Proceedings ofthe 2011 ACM SIGMOD International Conference on Management of data. ACM,337–348.
[17] Jennie Duggan, Yun Chi, Hakan Hacigumus, Shenghuo Zhu, and Ugur Cetintemel.2013. Packing light: Portable workload performance prediction for the cloud. InData Engineering Workshops (ICDEW), 2013 IEEE 29th International Conference on.IEEE, 258–265.
[18] Anshuman Dutt, Chi Wang, Azade Nazi, Srikanth Kandula, Vivek Narasayya,and Surajit Chaudhuri. 2019. Selectivity estimation for range predicates usinglightweight models. Proceedings of the VLDB Endowment 12, 9 (2019), 1044–1057.
[19] Jerome H Friedman. 2001. Greedy function approximation: a gradient boostingmachine. Annals of statistics (2001), 1189–1232.
[20] Archana Ganapathi, Harumi Kuno, Umeshwar Dayal, Janet L Wiener, ArmandoFox, Michael Jordan, and David Patterson. 2009. Predicting multiple metrics forqueries: Better decisions enabled by machine learning. In Data Engineering, 2009.ICDE’09. IEEE 25th International Conference on. IEEE, 592–603.
[21] Michael Gillmann, Gerhard Weikum, and Wolfgang Wonner. 2002. Workflowmanagement with service quality guarantees. In Proceedings of the 2002 ACMSIGMOD international conference on Management of data. ACM, 228–239.
[22] Leilani H Gilpin, David Bau, Ben Z Yuan, Ayesha Bajwa, Michael Specter, andLalana Kagal. 2018. Explaining explanations: An overview of interpretability ofmachine learning. In 2018 IEEE 5th International Conference on data science andadvanced analytics (DSAA). IEEE, 80–89.
[23] Chetan Gupta, Abhay Mehta, and Umeshwar Dayal. 2008. PQR: Predictingquery execution times for autonomous workload management. In AutonomicComputing, 2008. ICAC’08. International Conference on. IEEE, 13–22.
[24] BenjaminHilprecht, Andreas Schmidt, Moritz Kulessa, AlejandroMolina, KristianKersting, and Carsten Binnig. 2020. DeepDB: learn from data, not from queries!Proceedings of the VLDB Endowment 13, 7 (2020), 992–1005.
[25] Peter J Huber. 2004. Robust statistics. Vol. 523. John Wiley & Sons.[26] Jie Jao. [n.d.]. QPPNet in PyTorch. https://github.com/rabbit721/QPPNet.[27] Andreas Kipf, Thomas Kipf, Bernhard Radke, Viktor Leis, Peter A. Boncz, and
Alfons Kemper. 2019. Learned Cardinalities: Estimating Correlated Joins withDeep Learning. In CIDR 2019, 9th Biennial Conference on Innovative Data SystemsResearch, Asilomar, CA, USA, January 13-16, 2019, Online Proceedings. http://cidrdb.org/cidr2019/papers/p101-kipf-cidr19.pdf
[28] Ron Kohavi et al. 1995. A study of cross-validation and bootstrap for accuracyestimation and model selection. In Ijcai, Vol. 14. Montreal, Canada, 1137–1145.
[29] André Kohn, Viktor Leis, and Thomas Neumann. 2018. Adaptive Execution ofCompiled Queries. In ICDE. 197–208.
[30] Max Kuhn, Kjell Johnson, et al. 2013. Applied predictive modeling. Vol. 26.Springer.
[31] Mayuresh Kunjir and Shivnath Babu. 2020. Black or White? How to Develop anAutoTuner for Memory-based Analytics. In Proceedings of the 2020 ACM SIGMODInternational Conference on Management of Data. 1667–1683.
[32] Viktor Leis, Andrey Gubichev, Atanas Mirchev, Peter Boncz, Alfons Kemper, andThomas Neumann. 2015. How good are query optimizers, really? Proceedings ofthe VLDB Endowment 9, 3 (2015), 204–215.
[33] Guoliang Li, Xuanhe Zhou, Shifu Li, and Bo Gao. 2019. Qtune: A query-awaredatabase tuning system with deep reinforcement learning. Proceedings of theVLDB Endowment 12, 12, 2118–2130.
[34] Jiexing Li, Arnd Christian König, Vivek Narasayya, and Surajit Chaudhuri. 2012.Robust estimation of resource consumption for sql queries using statistical tech-niques. Proceedings of the VLDB Endowment 5, 11 (2012), 1555–1566.
[35] Andy Liaw, Matthew Wiener, et al. 2002. Classification and regression by ran-domForest. R news 2, 3 (2002), 18–22.
[36] Shih-Chieh Lin, Yunqi Zhang, Chang-Hong Hsu, Matt Skach, Md EHaque, LingjiaTang, and JasonMars. 2018. The architectural implications of autonomous driving:Constraints and acceleration. In Proceedings of the Twenty-Third InternationalConference on Architectural Support for Programming Languages and OperatingSystems. 751–766.
[37] Lin Ma, Dana Van Aken, Ahmed Hefny, Gustavo Mezerhane, Andrew Pavlo, andGeoffrey J Gordon. 2018. Query-based Workload Forecasting for Self-DrivingDatabase Management Systems. In Proceedings of the 2018 ACM InternationalConference on Management of Data (SIGMOD ’18).
[38] Lin Ma, Bailu Ding, Sudipto Das, and Adith Swaminathan. 2020. Active Learningfor ML Enhanced Database Systems. In Proceedings of the 2020 ACM SIGMODInternational Conference on Management of Data. 175–191.
[39] Ryan Marcus, Parimarjan Negi, Hongzi Mao, Chi Zhang, Mohammad Alizadeh,Tim Kraska, Olga Papaemmanouil, and Nesime Tatbul. 2019. Neo: A LearnedQuery Optimizer. Proceedings of the VLDB Endowment 12, 11 (2019).
[40] Ryan Marcus and Olga Papaemmanouil. 2019. Plan-Structured Deep NeuralNetwork Models for Query Performance Prediction. Proceedings of the VLDBEndowment 12, 11 (2019), 1733–1746.
[41] Prashanth Menon and Andrew Pavlo Amadou Ngom, Todd C. Mowry. 2020.Permutable Compiled Queries: Dynamically Adapting Compiled Queries withoutRecompiling. Under Submission (2020).
[42] Barzan Mozafari, Carlo Curino, Alekh Jindal, and Samuel Madden. 2013. Perfor-mance and resource modeling in highly-concurrent OLTP workloads. In Proceed-ings of the 2013 International Conference on Management of data. ACM, 301–312.
[43] Kevin P Murphy. 2012. Machine learning: a probabilistic perspective. MIT press.[44] Vivek Narasayya and Manoj Syamala. 2010. Workload driven index defragmen-
tation. In Data Engineering (ICDE), 2010 IEEE 26th International Conference on.IEEE, 497–508.
[45] Dushyanth Narayanan, Eno Thereska, and Anastassia Ailamaki. 2005. Contin-uous resource monitoring for self-predicting DBMS. In 13th IEEE InternationalSymposium on Modeling, Analysis, and Simulation of Computer and Telecommuni-cation Systems. IEEE, 239–248.
[46] Thomas Neumann. 2011. Efficiently compiling efficient query plans for modernhardware. Proceedings of the VLDB Endowment 4, 9 (2011), 539–550.
[47] Simo Neuvonen, Antoni Wolski, Markku Manner, and Vilho Raatikka. 2011.Telecommunication Application Transaction Processing (TATP) Benchmark De-scription. http://tatpbenchmark.sourceforge.net/.
[48] Jennifer Ortiz, Magdalena Balazinska, Johannes Gehrke, and S Sathiya Keerthi.2018. Learning State Representations for Query Optimization with Deep Rein-forcement Learning. In Proceedings of the Second Workshop on Data Managementfor End-To-End Machine Learning. ACM, 4.
[49] Brian Paden, Michal Čáp, Sze Zheng Yong, Dmitry Yershov, and Emilio Frazzoli.2016. A survey of motion planning and control techniques for self-driving urbanvehicles. IEEE Transactions on intelligent vehicles 1, 1 (2016), 33–55.
[50] Andrew Pavlo, Gustavo Angulo, Joy Arulraj, Haibin Lin, Jiexi Lin, Lin Ma,Prashanth Menon, Todd Mowry, Matthew Perron, Ian Quah, Siddharth San-turkar, Anthony Tomasic, Skye Toor, Dana Van Aken, Ziqi Wang, Yingjun Wu,Ran Xian, and Tieying Zhang. 2017. Self-Driving Database Management Systems.In CIDR 2017, Conference on Innovative Data Systems Research.
[51] Andrew Pavlo, Matthew Butrovich, Ananya Joshi, Lin Ma, Prashanth Menon,Dana Van Aken, Lisa Lee, and Ruslan Salakhutdinov. 2019. External vs. Internal:An Essay on Machine Learning Agents for Autonomous Database ManagementSystems. Data Engineering (2019), 31.
[52] Alexander Ratner, Stephen H Bach, Henry Ehrenberg, Jason Fries, Sen Wu, andChristopher Ré. 2017. Snorkel: Rapid training data creationwithweak supervision.In Proceedings of the VLDB Endowment. International Conference on Very LargeData Bases, Vol. 11. NIH Public Access, 269.
[53] Frank Rosenblatt. 1958. The perceptron: a probabilistic model for informationstorage and organization in the brain. Psychological review 65, 6 (1958), 386.
[54] George AF Seber and Alan J Lee. 2012. Linear regression analysis. Vol. 329. JohnWiley & Sons.
[55] David Silver, Julian Schrittwieser, Karen Simonyan, Ioannis Antonoglou, AjaHuang, Arthur Guez, Thomas Hubert, Lucas Baker, Matthew Lai, Adrian Bolton,
Research Data Management Track Paper SIGMOD ’21, June 20–25, 2021, Virtual Event, China
1260

et al. 2017. Mastering the game of go without human knowledge. nature 550,7676 (2017), 354–359.
[56] Alex J Smola and Bernhard Schölkopf. 2004. A tutorial on support vector regres-sion. Statistics and computing 14, 3 (2004), 199–222.
[57] Stephen M Stigler. 1973. The asymptotic distribution of the trimmed mean. TheAnnals of Statistics (1973), 472–477.
[58] Ji Sun and Guoliang Li. 2019. An end-to-end learning-based cost estimator.Proceedings of the VLDB Endowment 13, 3 (2019), 307–319.
[59] Richard S Sutton and Andrew G Barto. 2018. Reinforcement learning: An intro-duction. MIT press.
[60] The Transaction Processing Council. 2010. TPC-C Benchmark (Revision 5.11.0).http://www.tpc.org/tpcc/.
[61] The Transaction Processing Council. 2013. TPC-H Benchmark (Revision 2.16.0).http://www.tpc.org/tpch/.
[62] Sergios Theodoridis and Konstantinos Koutroumbas. 2003. Pattern recognition.Elsevier.
[63] Dana Van Aken, Andrew Pavlo, Geoffrey J. Gordon, and Bohan Zhang. 2017.Automatic Database Management System Tuning Through Large-scale MachineLearning. In Proceedings of the 2017 ACM International Conference on Managementof Data (SIGMOD ’17). 1009–1024.
[64] Dana Van Aken, Andrew Pavlo, Geoffrey J. Gordon, and Bohan Zhang. 2017.Automatic Database Management System Tuning Through Large-scale MachineLearning. In Proceedings of the 2017 ACM International Conference on Managementof Data (SIGMOD ’17). 1009–1024.
[65] Gerhard Weikum, Axel Moenkeberg, Christof Hasse, and Peter Zabback. 2002.Self-tuning database technology and information services: from wishful thinkingto viable engineering. In VLDB’02: Proceedings of the 28th International Conferenceon Very Large Databases. Elsevier, 20–31.
[66] Lucas Woltmann, Claudio Hartmann, Maik Thiele, Dirk Habich, and WolfgangLehner. 2019. Cardinality estimation with local deep learning models. In Pro-ceedings of the Second International Workshop on Exploiting Artificial IntelligenceTechniques for Data Management. 1–8.
[67] Chenggang Wu, Alekh Jindal, Saeed Amizadeh, Hiren Patel, Wangchao Le, ShiQiao, and Sriram Rao. 2018. Towards a learning optimizer for shared clouds.Proceedings of the VLDB Endowment 12, 3 (2018), 210–222.
[68] Wentao Wu, Yun Chi, Hakan Hacígümüş, and Jeffrey F Naughton. 2013. Towardspredicting query execution time for concurrent and dynamic database workloads.Proceedings of the VLDB Endowment 6, 10 (2013), 925–936.
[69] Wentao Wu, Yun Chi, Shenghuo Zhu, Junichi Tatemura, Hakan Hacigümüs, andJeffrey F Naughton. 2013. Predicting query execution time: Are optimizer costmodels really unusable?. In Data Engineering (ICDE), 2013 IEEE 29th InternationalConference on. IEEE, 1081–1092.
[70] WentaoWu, XiWu, HakanHacigümüş, and Jeffrey F Naughton. 2014. Uncertaintyaware query execution time prediction. Proceedings of the VLDB Endowment 7,14 (2014), 1857–1868.
[71] Yingjun Wu, Joy Arulraj, Jiexi Lin, Ran Xian, and Andrew Pavlo. 2017. An em-pirical evaluation of in-memory multi-version concurrency control. Proceedingsof the VLDB Endowment 10, 7 (2017), 781–792.
[72] Guoliang Li Jianhua Feng Xuanhe Zhou, Ji Sun. 2020. Query Performance Pre-diction for Concurrent Queries using Graph Embedding. In VLDB 2020.
[73] Zongheng Yang, Eric Liang, Amog Kamsetty, ChenggangWu, Yan Duan, Xi Chen,Pieter Abbeel, Joseph M Hellerstein, Sanjay Krishnan, and Ion Stoica. 2019. Deepunsupervised cardinality estimation. Proceedings of the VLDB Endowment 13, 3(2019), 279–292.
[74] Dong Young Yoon, Ning Niu, and Barzan Mozafari. 2016. Dbsherlock: A per-formance diagnostic tool for transactional databases. In Proceedings of the 2016International Conference on Management of Data. ACM, 1599–1614.
[75] Xiang Yu, Guoliang Li, Chengliang Chai, and Nan Tang. 2020. Reinforcementlearning with tree-lstm for join order selection. In 2020 IEEE 36th InternationalConference on Data Engineering (ICDE). IEEE, 1297–1308.
[76] Ji Zhang, Yu Liu, Ke Zhou, Guoliang Li, Zhili Xiao, Bin Cheng, Jiashu Xing,Yangtao Wang, Tianheng Cheng, Li Liu, et al. 2019. An end-to-end automaticcloud database tuning system using deep reinforcement learning. In Proceedings ofthe 2019 International Conference on Management of Data (SIGMOD ’19). 415–432.
Research Data Management Track Paper SIGMOD ’21, June 20–25, 2021, Virtual Event, China
1261