Maxwell et al 2013 Nature Communications Supplementary Information
22
1 Supplementary Information 1 2 Cumulative human impacts on marine predators 3 S. M. Maxwell, et al. Nature Communications. 4 5 6 Supplementary Figure S1. Climate cumulative utilization and impact (CUI) for (a) all species combined, (b) marine mammals and (c) 7 seabirds. Solid outer line represents US EEZ, solid inner lines represent National Marine Sanctuaries and dashed lines represent 200 m 8 isobath. 9
-
Upload
independent -
Category
Documents
-
view
4 -
download
0
Transcript of Maxwell et al 2013 Nature Communications Supplementary Information

1
Supplementary Information 1
2
Cumulative human impacts on marine predators 3
S. M. Maxwell, et al. Nature Communications. 4
5
6 Supplementary Figure S1. Climate cumulative utilization and impact (CUI) for (a) all species combined, (b) marine mammals and (c) 7
seabirds. Solid outer line represents US EEZ, solid inner lines represent National Marine Sanctuaries and dashed lines represent 200 m 8
isobath. 9

2
7 Supplementary Figure S2. Fishing cumulative utilization and impact (CUI) for (a) all species combined, (b) marine mammals and (c) 8
seabirds. Solid outer line represents US EEZ, solid inner lines represent National Marine Sanctuaries and dashed lines represent 200 m 9
isobath. 10

3
11 Supplementary Figure S3. Pollution cumulative utilization and impact (CUI) for (a) all species combined, (b) marine mammals and (c) 12
seabirds. Solid outer line represents US EEZ, solid inner lines represent National Marine Sanctuaries and dashed lines represent 200 m 13
isobath. 14

4
15 Supplementary Figure S4. Shipping cumulative utilization and impact (CUI) for (a) all species combined, (b) marine mammals and (c) 16
seabirds. Solid outer line represents US EEZ, solid inner lines represent National Marine Sanctuaries and dashed lines represent 200 m 17
isobath. 18

5
19 Supplementary Figure S5. Direct cumulative utilization and impact (CUI) for (a) all species combined, (b) marine mammals and (c) 20
seabirds. Solid outer line represents US EEZ, solid inner lines represent National Marine Sanctuaries and dashed lines represent 200 m 21
isobath. 22

6
23 Supplementary Figure S6. Coastal cumulative utilization and impact (CUI) for (a) all species combined, (b) marine mammals and (c) 24
seabirds. Solid outer line represents US EEZ, solid inner lines represent National Marine Sanctuaries and dashed lines represent 200 m 25
isobath. 26

7
Supplementary Table S1. The influence of individual cumulative utilization and impact (CUI) layers on the overall CUI for each 27
species group. Spatial correlations (R2) indicate how well each layer predicts overall patterns, while the values for “per-pixel fraction 28
of the total” indicate the relative contribution of each layer to CUI on a per-pixel basis. For details on fishing gear classes, see ref. 59. 29 30
All Species Marine Mammals Seabirds Sea Turtles
Per pixel fraction of total Per pixel fraction of total Per pixel fraction of total Per pixel fraction of total
Layer Layer
category R2 Averag
e SD Max R2 Average SD Max R2 Average SD Max R2 Average SD Max
Ultraviolet
radiation
Climate
0.8926 0.1938 0.0359 0.2744 0.8908 0.2045 0.0422 0.3528 0.9521 0.1832 0.0391 0.2667 0.8849 0.2408 0.0370 0.3168
Ocean
acidification
Climate
0.8426 0.2861 0.0624 0.4886 0.9006 0.3068 0.0591 0.4905 0.9439 0.3092 0.0590 0.4882 0.8675 0.2325 0.0399 0.3323
Ocean
pollution
Pollution
0.7886 0.0881 0.0418 0.5639 0.7605 0.0790 0.0337 0.2651 0.8027 0.0961 0.0409 0.3079 0.8953 0.0818 0.0180 0.1624
Shipping Shipping 0.7358 0.0842 0.0449 0.2374 0.6684 0.0774 0.0391 0.2233 0.7253 0.0534 0.0292 0.1662 0.8780 0.1686 0.0286 0.2449
SST change Climate 0.7318 0.1364 0.0593 0.3442 0.6550 0.1288 0.0649 0.3446 0.8156 0.1281 0.0641 0.3434 0.8462 0.1555 0.0458 0.2424
Ocean
deposition
Pollution
0.4221 0.0949 0.0470 0.2470 0.5050 0.1006 0.0489 0.2421 0.7802 0.0994 0.0470 0.2470 0.0000 0.0000 0.0000 0.0000
Invasive
species
Shipping
0.4009 0.0023 0.0084 0.1408 0.1416 0.0004 0.0031 0.0594 0.0309 0.0004 0.0025 0.0346 0.3900 0.0036 0.0125 0.0670
Organic
pollution
Pollution
0.4000 0.0026 0.0100 0.1333 0.0379 0.0001 0.0007 0.0153 0.0036 0.0004 0.0061 0.1333 0.4281 0.0052 0.0180 0.1025
Nutrient
deposition
Pollution
0.3776 0.0022 0.0092 0.1621 0.1164 0.0001 0.0009 0.0303 0.0062 0.0006 0.0081 0.1621 0.3999 0.0024 0.0078 0.0504
Coastal
waste
Pollution
0.2717 0.0119 0.0491 0.6309 0.3116 0.0112 0.043 0.3655 0.0615 0.0104 0.0453 0.3818 0.3602 0.0068 0.0265 0.1817
Inorganic
pollution
Pollution
0.2577 0.0015 0.0077 0.1621 0.0979 0.0002 0.0008 0.0102 0.0040 0.0005 0.0070 0.1621 0.3579 0.0027 0.0109 0.0825
Fishing –
demersal,
non-
destructive
low bycatch
Fishing
0.1971 0.0257 0.0394 0.2332 0.2271 0.0153 0.0242 0.1531 0.4229 0.0468 0.0699 0.3374 0.0000 0.0000 0.0000 0.0000
Coastal
engineering
Coastal
0.1559 0.0021 0.0136 0.1931 0.7441 0.0052 0.0243 0.1931 0.0000 0.0000 0.0000 0.0000 0.0000 0.0000 0.0000 0.0000
Fishing –
pelagic, high
bycatch
Fishing
0.0995 0.0032 0.0130 0.1784 0.0856 0.0026 0.0119 0.1748 0.0515 0.0030 0.0145 0.2520 0.2950 0.0063 0.0207 0.2039
Fishing -
pelagic, low
bycatch
Fishing
0.0945 0.0147 0.0201 0.1812 0.1811 0.0108 0.0142 0.1024 0.3359 0.0307 0.0402 0.2172 0.0000 0.0000 0.0000 0.0000
Beach
access
Coastal
0.0822 0.0002 0.0032 0.0941 0.7842 0.0006 0.0050 0.0926 0.0000 0.0000 0.0000 0.0000 0.0000 0.0000 0.0000 0.0000

8
Fishing –
demersal,
non-
destructive
high bycatch
Fishing
0.0757 0.0369 0.0566 0.3063 0.1510 0.0317 0.0528 0.2917 0.2758 0.0367 0.0606 0.3607 0.3050 0.0577 0.0580 0.2646
Fishing –
demersal
destructive
Fishing
0.0615 0.0121 0.0246 0.1792 0.1693 0.0229 0.0339 0.1841 0.0000 0.0000 0.0000 0.0000 0.3467 0.0345 0.0310 0.1293
Ocean
engineering
Coastal
0.0254 0.0012 0.0126 0.2343 0.0157 0.0019 0.0168 0.2180 0.0111 0.0009 0.0132 0.2652 0.0018 0.0016 0.0140 0.1522
Fishing -
recreational
Fishing
0.0000 0.0000 0.0000 0.0000 0.0000 0.0000 0.0000 0.0000 0.0000 0.0000 0.0000 0.0000 0.0000 0.0000 0.0000 0.0000
Fish farming Coastal 0.0000 0.0000 0.0000 0.0000 0.0000 0.0000 0.0000 0.0000 0.0000 0.0002 0.0035 0.0998 0.0000 0.0000 0.0000 0.0000
Light
pollution
Coastal
0.0000 0.0000 0.0000 0.0000 0.0000 0.0000 0.0000 0.0000 0.0000 0.0000 0.0000 0.0000 0.0000 0.0000 0.0000 0.0000
Power plants Coastal 0.0000 0.0000 0.0000 0.0000 0.0000 0.0000 0.0000 0.0000 0.0000 0.0000 0.0000 0.0000 0.0000 0.0000 0.0000 0.0000
Sediment
runoff
Coastal
0.0000 0.0000 0.0000 0.0000 0.0000 0.0000 0.0000 0.0000 0.0000 0.0000 0.0000 0.0000 0.0000 0.0000 0.0000 0.0000
31

9
Supplementary Table S1. Individual species vulnerability weights across all 24 anthropogenic stressors; higher numbers indicate 32
greater impacts. Astericks (*) indicates a direct impact. See Halpern et al. 2009 for a detailed description of data layers. 33
34
Anthropogenic impacts Blue whales
Humpback
whales
California
sea lions
Northern
elephant
seals
Black-footed
albatrosses
Laysan
albatrosses
Sooty
shearwaters
Leatherback
sea turtles
Ocean acidification 12 12 12 12 12 12 12 11
Beach access 0 0 11 11 0 0 0 0
Coastal engineering 0 0 10 10 0 0 0 0
Fishing – demersal
destructive 0 0 9.5 9.5 0 0 0 8
Fishing – demersal, non-
destructive, high bycatch 0 10* 14* 14* 14* 14* 14* 15*
Fishing – demersal, non-
destructive, low bycatch 0 0 9 9 14* 13* 13* 0
Fishing – pelagic, high
bycatch 0 10* 13* 13* 13 13 13 15*
Fishing – pelagic, low
bycatch 0 10 10 10 13 13 13 0
Fishing – recreational 0 0 0 0 0 0 0 0
Fish farming 8 8 13 8 8 8 8 7
Inorganic pollution 13 13 14 14 15 15 15 13
Invasive species 8 8 8 8 8 8 8 7

10
Light pollution 0 0 0 0 0 0 0 0
Nutrient runoff 11* 11* 14* 0 14.5 14.5 14.5 6
Ocean deposition 13 13 15 13 16* 16* 16* 13
Ocean engineering 10 10 10 10 9* 9* 9* 0
Ocean-based pollution 15* 15* 15* 15* 17.5* 17.5* 17.5* 16*
Organic pollution 13 14 15 13 17* 17* 17* 13
Power plants 0 0 0 0 0 0 0 0
Sediment runoff 0 0 0 0 0 0 0 0
Shipping 15* 14* 14* 14* 10.5* 10.5* 10.5* 11.5*
Sea surface temperature
anomalies 12 16 15 15 15 15 15 10
Coastal waste 15* 16* 15* 15* 16.5* 16.5* 16.5* 12*
Ultraviolet radiation
anomalies 14* 14* 11 11 11 11 11 12*
35

11
Supplementary Table S3. Summary of electronic tagging data and IUCN status (IUCN 2012) by species. 36
37 Common name Scientific name IUCN status Tagging location N Tags Days Mean
length
(days)
Max
length
(days)
Start
date
End date
Blue whales Balaenoptera
musculus
Endangered Central and
southern
California
37 4188 113 505 7/29/04 8/5/07
Humpback whales Megaptera
novaeangliae
Least concern Northern and
central California
13 663 51 108 7/29/04 1/6/06
California sea lions Zalophus
californianus
Least concern Channel Islands
and Monterey Bay
California
110 6653 60 236 6/4/03 1/26/09
Northern elephant
seals
Mirounga
angustirostris
Least concern Año Nuevo State
Reserve,
California and
San Benitos,
Mexico
224 39581 140 302 6/9/03 5/13/08
Black-footed
albatrosses
Phoebastria
nigripes
Vulnerable Tern Island,
Hawaii
143 2162 15 28 12/19/02 12/5/06
Laysan albatrosses Phoebastria
immutabilis
Near
threatened
Isla Guadalupe,
Mexico
122 676 6 25 1/20/03 3/10/06
Sooty shearwaters Puffinus griseus Near
threatened
New Zealand 18 4654 259 301 1/28/05 12/1/05
Leatherback sea
turtles
Dermochelys
coriacea
Critically
endangered
Central California 18 1813 101 323 9/6/04 12/13/08
38
39
40

12
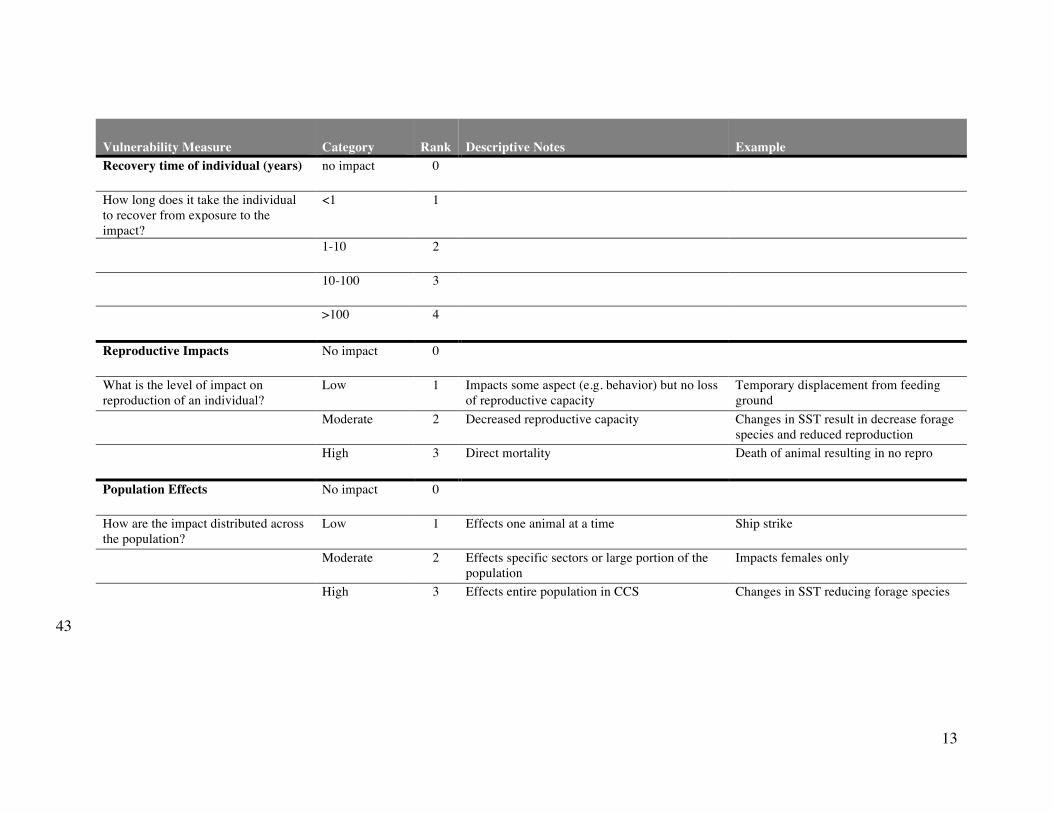
Supplementary Table S4. Summary of vulnerability measures used to determine the weightings for impact scores across species. 41
42
Vulnerability Measure Category Rank Descriptive Notes Example
Frequency Never 0
What is the frequency of the impact? Rare 1 Infrequent enough to affect long-term dynamics
or population
Large oil spill
Occasional 2 Frequent but irregular in nature Toxic algal blooms
Annual or
regular
3 Frequent and often seasonal or periodic in
nature
Runoff events due to seasonal rains
Persistent 4 More or less constant year-round lasting
through multiple years or decades
Persistent hypoxic zones
Direct/Indirect impact No impact 0
What’s the mechanism by which it is
affecting the individual?
Distant indirect
impact
1 Effects are more than one degree removed Trophic cascade, food source; ecosystem
degradation; impacts something that
impacts prey
Indirect impact 2 Known to cause impact as a result of an
indirect link such as via prey; metabolic or life
span effect
Impacts prey, impacts of heavy metals
that don’t result in direct death
Direct impact 3 Mortality Bycatch in fishing gear
Resistance (Likelihood of mortality) No impact 0
How likely is that impact to affect the
individual?
Low 1 Unlikely to result in mortality (0-33%) Anthropogenic noise
Medium 2 Moderate likelihood of mortality (33-66%) Domoic acid
Low 3 High likelihood of mortality (66-100%) Large reduction in forage base
13
Vulnerability Measure Category Rank Descriptive Notes Example
Recovery time of individual (years) no impact 0
How long does it take the individual
to recover from exposure to the
impact?
<1 1
1-10 2
10-100 3
>100 4
Reproductive Impacts No impact 0
What is the level of impact on
reproduction of an individual?
Low 1 Impacts some aspect (e.g. behavior) but no loss
of reproductive capacity
Temporary displacement from feeding
ground
Moderate 2 Decreased reproductive capacity Changes in SST result in decrease forage
species and reduced reproduction
High 3 Direct mortality Death of animal resulting in no repro
Population Effects No impact 0
How are the impact distributed across
the population?
Low 1 Effects one animal at a time Ship strike
Moderate 2 Effects specific sectors or large portion of the
population
Impacts females only
High 3 Effects entire population in CCS Changes in SST reducing forage species
43

14
Supplementary Note 1 44
45
Impact Summaries 46
47
Ocean acidification 48
Ocean acidification has been documented as widespread and persistent, and impacts are 49
known to occur in relation to the prey of a number of apex predators (i.e. krill, fish, 50
mollusks, gelatinous prey61-63. Additionally, changes in ocean chemistry will increase 51
sound absorption and anthropogenic ocean noise impacting the ability of blue whales to 52
communicate64-66. Despite impacts to the entire food chain67 direct impacts on apex 53
predators are uncertain though impacts are likely to influence the entire population62,68. 54
55
Sea surface temperature anomalies 56
Climate change affects sea surface temperatures, increases frequency and extremity of El 57
Niño events intensity and timing of upwelling, and changes the distribution and 58
abundance of the prey of pelagic predators69-78. This reduction in prey causes shifts in 59
predator distributions, sometimes up to several hundred kilometers79-82 and thus decreases 60
reproductive capacity and ultimately population levels, particularly for seabirds and sea 61
lions72,83-87. Strong El Niños and sea level rise also result in a reduction in available 62
breeding habitat, particularly for elephant seals80. While populations generally do recover 63
from El Niño events, recovery time varies depending on the intensity, duration and 64
frequency of El Niño events, and also varies by species with central place foragers being 65
more susceptible because their ranges are reduced76,88-90. 66
67
Organic and Inorganic Pollution 68
For both egg laying species (sea turtles and seabirds) and mammals, contaminant loads 69
are passed from females to chicks, pups or calves, and increased organic and inorganic 70
pollutant loads result in decreased hatchability and potential mortality in seabird chicks91-71 95. The impacts of heavy metals such as mercury, lead and cadmium on seabirds have 72
been well studied. They are known to cause decreased reproductive success, such as 73
decreased egg size, egg shell thinning, testicular damage, changes in feeding behavior 74
and delayed parental and sibling recognition, in addition to other impacts such as 75
impaired thermoregulation, depth perception and locomotion96-99. For mammals, organic 76
and inorganic pollutants have been shown to result in immunosuppression and impacts to 77
the reproductive and endocrine systems, particularly for females100-107. In pinnipeds, 78
heavy metal toxicity increases domoic acid poisoning, decreases reproductive capacity, 79
including premature death in pups; similar impacts are suspected for other marine 80
mammals103,108-110. 81
82
Ocean-Based Pollution 83
Ocean-based pollution in the form of discharge from ships or large-scale oil spills can 84
impact all predator species but has perhaps the greatest impacts on seabirds111-113. Oiled 85
birds can lose flight capability in addition to wasting fat and muscle tissues, abnormal 86
conditions in the lungs, kidneys and other organs from even small amounts of exposure to 87
oil slicks97,114,115. For leatherback sea turtles and some marine mammals, even moderate 88

15
exposure to oil may result in impacts to the skin, blood, digestive systems and salt glands, 89
or changes in behavior and thermoregulatory abilities116-118. 90
91
Coastal Waste 92
Coastal waste, in the form of plastics and other materials, originates primarily from land 93
rather than marine vessels. For all species, ingestion of plastic can result in death from 94
impaction or entanglement, and even smaller amounts of plastic in the gut can result in 95
decreased nutrient absorption, which may be particularly important for leatherbacks 96
because they consume a low nutrient diet119-127. While plastic ingestion may also exposes 97
some animals to increased organic pollutants due to the chemicals used to make plastics, 98
the ingestion risks are greatest for procellariform birds (albatrosses, shearwaters and 99
petrels) because they cannot regurgitate like other birds124. 100
101
Shipping 102
Impacts on marine mammals and sea turtles from shipping occur in the form of ship 103
strikes128,129. Though rare for most species, this impact is of particular concern to even the 104
largest whales that are killed as a result of ship strikes130-132. Studies in the North Atlantic 105
have shown that over 40% of right whale mortalities are attributable to ship strikes133. 106
Seabirds are attracted to ship lights at night and are killed or injured when they strike 107
parts of the ship134, though this has not been well studied in the California Current region. 108
109
Beach Access and Coastal Engineering 110
Pinnipeds are the only species that come to shore, and are impacted by humans accessing 111
beaches or coastal engineering, largely during the breeding and molting seasons. While 112
these impacts are unlikely to cause long-term impacts, disturbance by humans during the 113
breeding season may result stampedes endangering the young or changes in maternal 114
behavior that reduce provisioning of young80,90,135,136. 115
116
Invasive Species 117
Impacts of invasive species on pelagic predators in the California Current System are 118
largely unknown, although invasive species cause changes to overall ecosystem health 119
and structure that likely have indirect impacts on predators137. 120
121
Aquaculture 122
Aquaculture operations result in changes to overall ecosystem health and structure due to 123
increased nutrient inputs and pollution, causing indirect impacts on pelagic predators, 124
particularly by changes in California sea lion feeding habits, especially males138. In some 125
instances, sea lions are killed when they poach from aquaculture operations, though this 126
percentage is low. 127
128
Nutrient Run-Off 129
High levels of nutrient run-off, largely from domestic sewage, result in increased algal 130
blooms, including hazardous blooms such as those producing domoic acid that impacts 131
seabirds and marine mammals139,140. Domoic acid toxicity results in death for half of the 132
California sea lions treated after stranding, and a reduction in their ability to care for 133

16
young101,141. Similarly, domoic acid poisoning in seabirds results in reduced reproductive 134
capacity due to illness, death or neurological effects141. 135
136
Ocean Engineering 137
Noise from oil rigs can occasionally alter the behavior of some marine mammal species, 138
such as pinnipeds142,143. Seabirds may be attracted to rigs, particularly at night when bright 139
lights are disorienting and they are injured or killed by striking hard surfaces144. 140
141
UV Radiation 142
Exposure to UV radiation has both direct and indirect impacts on marine predators. UV 143
radiation can result in an increase in the severity of skin lesions, as well as impacts on 144
forage species145,146. Increased UV radiation exposure causes reduced productivity 145
through increased mutation rates in phytoplankton, macroalgae, eggs, and larval stages of 146
fish and other aquatic animals145. 147
148
Demersal Fishing 149
Demersal fishing has both direct and indirect impacts on marine predators. Destructive 150
fishing practices reduce habitat for forage species and reduce prey availability. Many 151
demersal fisheries compete with predators, particularly pinnipeds, for prey species such 152
as rockfish147-151. Demersal fisheries for halibut and angel shark use set nets and have 153
appreciable bycatchs of seabirds, pinnipeds and occasional whales and sea turtles152,153. 154
155
Pelagic Fishing 156
Resource competition occurs with pelagic fishing, particularly between salmon fisheries 157
and California sea lions and seabirds, especially during times of reduced environmental 158
productivity149,150,154. Bycatch of predators in most pelagic fisheries occurs but has been 159
significantly reduced by closures and the application of conservation technologies, except 160
the swordfish drift gillnet fishery where occasional bycatch of pinnipeds continues125,153. 161

17
162
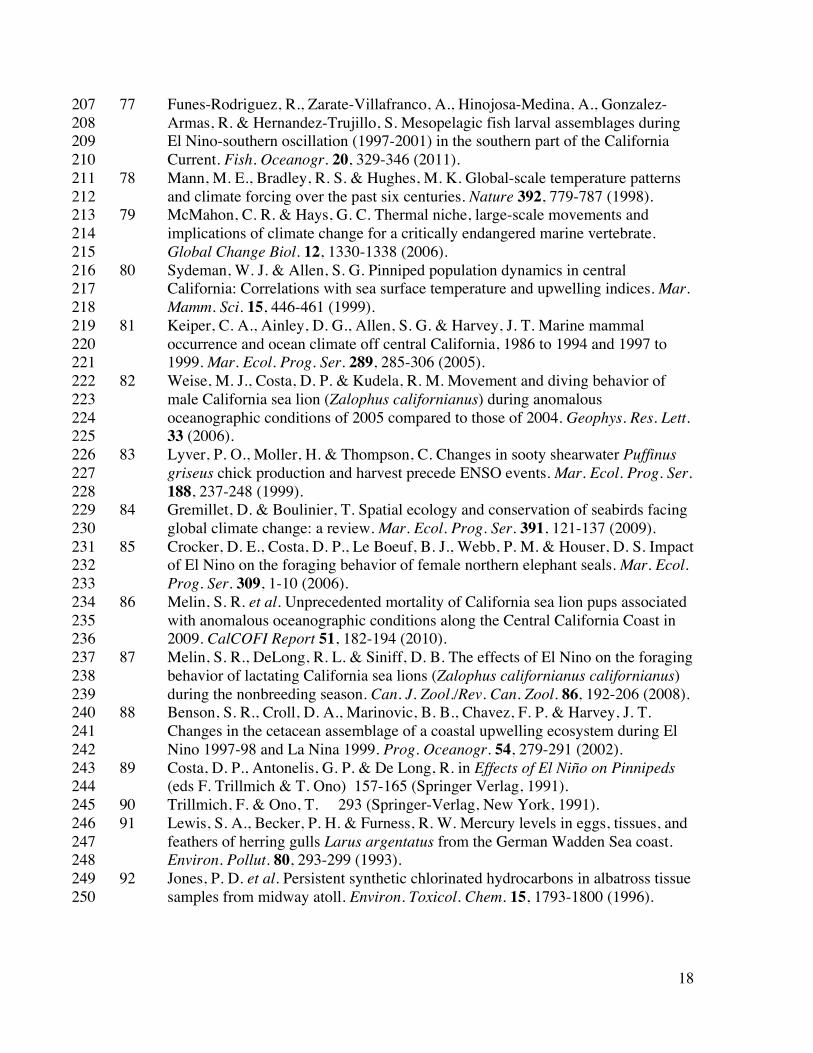
Supplementary References 163
164
61 Guinotte, J. M. & Fabry, V. J. in Year in Ecology and Conservation Biology 2008 165
Vol. 1134 Annals of the New York Academy of Sciences (ed R. S. Schlesinger W. 166
H. Ostfeld) 320-342 (2008). 167
62 Fabry, V. J., Seibel, B. A., Feely, R. A. & Orr, J. C. Impacts of ocean 168
acidification on marine fauna and ecosystem processes. ICES J. Mar. Sci. 65, 169
414-432 (2008). 170
63 Attrill, M. J., Wright, J. & Edwards, M. Climate-related increases in jellyfish 171
frequency suggest a more gelatinous future for the North Sea. Limnol. Oceanogr. 172
52, 480-485 (2007). 173
64 Sehgal, A., Tumar, I. & Schoumlnwaumllder, J. Effects of Climate Change and 174
Anthropogenic Ocean Acidification on Underwater Acoustic Communications. 175
OCEANS 2010 IEEE - Sydney (2010). 176
65 McDonald, M. A., Hildebrand, J. A. & Mesnick, S. Worldwide decline in tonal 177
frequencies of blue whale songs. Endanger. Species Res. 9, 13-21 (2009). 178
66 Hester, K. C., Peltzer, E. T., Kirkwood, W. J. & Brewer, P. G. Unanticipated 179
consequences of ocean acidification: A noisier ocean at lower pH. Geophys. Res. 180
Lett. 35 (2008). 181
67 National Research Council. Ocean Acidification: A National Strategy to Meet the 182
Challenges of a Changing Ocean. (The National Academies Press, 2010). 183
68 Feely, R. A., Sabine, C. L., Hernandez-Ayon, J. M., Ianson, D. & Hales, B. 184
Evidence for upwelling of corrosive "acidified" water onto the continental shelf. 185
Science 320, 1490-1492 (2008). 186
69 Hawkes, L. A., Broderick, A. C., Godfrey, M. H. & Godley, B. J. Climate change 187
and marine turtles. Endanger. Species Res. 7, 137-154 (2009). 188
70 Beaugrand, G., Reid, P. C., Ibanez, F., Lindley, J. A. & Edwards, M. 189
Reorganization of North Atlantic marine copepod biodiversity and climate. 190
Science 296, 1692-1694 (2002). 191
71 Edwards, M. & Richardson, A. J. Impact of climate change on marine pelagic 192
phenology and trophic mismatch. Nature 430, 881-884 (2004). 193
72 Veit, R. R., McGowan, J. A., Ainley, D. G., Wahls, T. R. & Pyle, P. Apex marine 194
predator declines ninety percent in association with changing oceanic climate. 195
Global Change Biol. 3, 23-28 (1997). 196
73 Mills, C. E. Jellyfish blooms: are populations increasing globally in response to 197
changing ocean conditions? Hydrobiologia 451, 55-68 (2001). 198
74 Zwolinski, J. P. & Demer, D. A. A cold oceanographic regime with high 199
exploitation rates in the Northeast Pacific forecasts a collapse of the sardine stock. 200
Proc. Natl. Acad. Sci. USA 109, 4175-4180 (2012). 201
75 Veit, R. R., Pyle, P. & McGowan, J. A. Ocean warming and long-term change in 202
pelagic bird abundance within the California current system. Mar. Ecol. Prog. 203
Ser. 139, 11-18 (1996). 204
76 Chavez, F. P. et al. Biological and chemical consequences of the 1997-1998 El 205
Nino in central California waters. Prog. Oceanogr. 54, 205-232 (2002). 206
18
77 Funes-Rodriguez, R., Zarate-Villafranco, A., Hinojosa-Medina, A., Gonzalez-207
Armas, R. & Hernandez-Trujillo, S. Mesopelagic fish larval assemblages during 208
El Nino-southern oscillation (1997-2001) in the southern part of the California 209
Current. Fish. Oceanogr. 20, 329-346 (2011). 210
78 Mann, M. E., Bradley, R. S. & Hughes, M. K. Global-scale temperature patterns 211
and climate forcing over the past six centuries. Nature 392, 779-787 (1998). 212
79 McMahon, C. R. & Hays, G. C. Thermal niche, large-scale movements and 213
implications of climate change for a critically endangered marine vertebrate. 214
Global Change Biol. 12, 1330-1338 (2006). 215
80 Sydeman, W. J. & Allen, S. G. Pinniped population dynamics in central 216
California: Correlations with sea surface temperature and upwelling indices. Mar. 217
Mamm. Sci. 15, 446-461 (1999). 218
81 Keiper, C. A., Ainley, D. G., Allen, S. G. & Harvey, J. T. Marine mammal 219
occurrence and ocean climate off central California, 1986 to 1994 and 1997 to 220
1999. Mar. Ecol. Prog. Ser. 289, 285-306 (2005). 221
82 Weise, M. J., Costa, D. P. & Kudela, R. M. Movement and diving behavior of 222
male California sea lion (Zalophus californianus) during anomalous 223
oceanographic conditions of 2005 compared to those of 2004. Geophys. Res. Lett. 224
33 (2006). 225
83 Lyver, P. O., Moller, H. & Thompson, C. Changes in sooty shearwater Puffinus 226
griseus chick production and harvest precede ENSO events. Mar. Ecol. Prog. Ser. 227
188, 237-248 (1999). 228
84 Gremillet, D. & Boulinier, T. Spatial ecology and conservation of seabirds facing 229
global climate change: a review. Mar. Ecol. Prog. Ser. 391, 121-137 (2009). 230
85 Crocker, D. E., Costa, D. P., Le Boeuf, B. J., Webb, P. M. & Houser, D. S. Impact 231
of El Nino on the foraging behavior of female northern elephant seals. Mar. Ecol. 232
Prog. Ser. 309, 1-10 (2006). 233
86 Melin, S. R. et al. Unprecedented mortality of California sea lion pups associated 234
with anomalous oceanographic conditions along the Central California Coast in 235
2009. CalCOFI Report 51, 182-194 (2010). 236
87 Melin, S. R., DeLong, R. L. & Siniff, D. B. The effects of El Nino on the foraging 237
behavior of lactating California sea lions (Zalophus californianus californianus) 238
during the nonbreeding season. Can. J. Zool./Rev. Can. Zool. 86, 192-206 (2008). 239
88 Benson, S. R., Croll, D. A., Marinovic, B. B., Chavez, F. P. & Harvey, J. T. 240
Changes in the cetacean assemblage of a coastal upwelling ecosystem during El 241
Nino 1997-98 and La Nina 1999. Prog. Oceanogr. 54, 279-291 (2002). 242
89 Costa, D. P., Antonelis, G. P. & De Long, R. in Effects of El Niño on Pinnipeds 243
(eds F. Trillmich & T. Ono) 157-165 (Springer Verlag, 1991). 244
90 Trillmich, F. & Ono, T. 293 (Springer-Verlag, New York, 1991). 245
91 Lewis, S. A., Becker, P. H. & Furness, R. W. Mercury levels in eggs, tissues, and 246
feathers of herring gulls Larus argentatus from the German Wadden Sea coast. 247
Environ. Pollut. 80, 293-299 (1993). 248
92 Jones, P. D. et al. Persistent synthetic chlorinated hydrocarbons in albatross tissue 249
samples from midway atoll. Environ. Toxicol. Chem. 15, 1793-1800 (1996). 250

19
93 Debier, C. et al. PCBs and DDT in the serum of juvenile California sea lions: 251
associations with vitamins A and E and thyroid hormones. Environ. Pollut. 134, 252
323-332 (2005). 253
94 Day, R. D., Segars, A. L., Arendt, M. D., Lee, A. M. & Peden-Adams, M. M. 254
Relationship of blood mercury levels to health parameters in the loggerhead sea 255
turtle (Caretta caretta). Environ. Health Perspect. 115, 1421-1428 (2007). 256
95 Harris, H. S. et al. Comparative health assessment of Western Pacific leatherback 257
turtles (Dermochelys coriacea) foraging off the coast of California, 2005-2007. J. 258
Wildl. Dis. 47, 321-337 (2011). 259
96 Eisler, R. Mercury hazards to fish, wildlife, and invertebrates: a synoptic review. 260
85 (US Fish and Wildlife Service. Biological report, 1987). 261
97 Furness, R. W. & Camphuysen, C. J. Seabirds as monitors of the marine 262
environment. ICES J. Mar. Sci. 54, 726-737 (1997). 263
98 Burger, J. & Gochfeld, M. Metal levels in feathers of 12 species of seabirds from 264
Midway Atoll in the northern Pacific Ocean. Sci. Total Environ. 257, 37-52 265
(2000). 266
99 Finkelstein, M. et al. Albatross species demonstrate regional differences in North 267
Pacific marine contamination. Ecol. Appl. 16, 678-686 (2006). 268
100 De Guise, S., Beckmen, K. B. & Holladay, S. D. in Toxicology of Marine 269
Mammals (eds J. G. Vos, G. D. Bossart, G. D. Fournier, & T. J. O'Shea) 38-54 270
(Taylor & Francis, 2003). 271
101 Reijnders, P. J. H. in Toxicology of Marine Mammals (eds J. G. Vos, G. D. 272
Bossart, G. D. Fournier, & T. J. O'Shea) 55-66 (Taylor & Francis, 2003). 273
102 Gregory, M. & Cyr, D. G. in Toxicology of Marine Mammals (eds J. G. Vos, G. 274
D. Bossart, G. D. Fournier, & T. J. O'Shea) 67-81 (Taylor & Francis, 2003). 275
103 Vos, J. G., Bossart, G. D., Fournier, G. D. & O'Shea, T. J. Toxicology of Marine 276
Mammals. (Taylor & Francis, 2003). 277
104 Colborn, T. & Smolden, M. J. in Toxicology of Marine Mammals (eds J. G. Vos, 278
G. D. Bossart, G. D. Fournier, & T. J. O'Shea) 291-332 (Taylor & Francis, 2003). 279
105 Goldstein, T. et al. The role of domoic acid in abortion and premature partrition 280
of California sea lions (Zalophus californianus) on San Miguel Island, California. 281
J. Wildl. Dis. 45, 91-108 (2009). 282
106 Goldstein, T. et al. Novel symptomatology and changing epidemiology of domoic 283
acid toxicosis in California sea lions (Zalophus californianus): an increasing risk 284
to marine mammal health. Proc. R. Soc. Lond., Ser. B: Biol. Sci. 275, 267-276 285
(2008). 286
107 Brodie, E. C. et al. Domoic acid causes reproductive failure in california sea lions 287
(Zalophus californianus). Mar. Mamm. Sci. 22, 700-707 (2006). 288
108 DeLong, R. L., Gilmarti.Wg & Simpson, J. G. Premature births in California sea 289
lions - association with high organochlorine pollutant reside levels. Science 181, 290
1168-1170 (1973). 291
109 O'Shea, T. J. & Brownell, R. L. California sea lion (Zalophus californianus) 292
populations and Sigma DDT contamination. Mar. Pollut. Bull. 36, 159-164 293
(1998). 294

20
110 Harper, E. R. et al. Tissue heavy metal concentrations of stranded California sea 295
lions (Zalophus californianus) in Southern California. Environ. Pollut. 147, 677-296
682 (2007). 297
111 Salazar, S. Impacts of the Jessica oil spill on sea lion (Zalophus wollebaeki) 298
populations. Mar. Pollut. Bull. 47, 313-318 (2003). 299
112 Mearns, A., Watabayashi, G. & Lankford, J. Dispersing oil near shore in the 300
California Current region. CalCOFI Report 42, 97-109 (2001). 301
113 Jenssen, B. M. An overview of exposure to, and effects of, petroleum oil and 302
organochlorine pollution in grey seals (Halichoerus grypus). Sci. Total Environ. 303
186, 109-118 (1996). 304
114 Clark, R. B. Impact of oil pollution on seabirds. Environmental Pollution Series 305
a-Ecological and Biological 33, 1-22 (1984). 306
115 Newton, K. M. et al. At-sea mortality of seabirds based on beachcast and offshore 307
surveys. Mar. Ecol. Prog. Ser. 392, 295-305 (2009). 308
116 Engelhardt, F. R. Petroleum effects on marine mammals. Aquat. Toxicol. 4, 199-309
217 (1983). 310
117 Milton, S., Lutz, P. & Shigenaka, G. in Oil Spills and Sea Turtles: Biology, 311
Planning and Response 35-48 (National Oceanic and Atmospheric 312
Administration, 2003). 313
118 Lutcavage, M. E., Lutz, P. L., Bossart, G. D. & Hudson, D. M. Physiological and 314
cliniopathological effects of crude-oil on loggerhead sea turtles. Arch. Environ. 315
Contam. Toxicol. 28, 417-422 (1995). 316
119 Connors, P. G. & Smith, K. G. Oceanic plastic particle pollution - suspected 317
effect on fat deposition in red phalaropes. Mar. Pollut. Bull. 13, 18-20 (1982). 318
120 Stewart, B. S. & Yochem, P. K. Entanglement of pinnipeds in synthetic debris 319
and fishing net and line fragments at San Nicholas and San Miguel Islands, 320
California, 1978-1986. Mar. Pollut. Bull. 18, 336-339 (1987). 321
121 Ryan, P. G. Effects of ingested plastic on seabird feeding - evidence from 322
chickens. Mar. Pollut. Bull. 19, 125-128 (1988). 323
122 Blight, L. K. & Burger, A. E. Occurrence of plastic particles in seabirds from the 324
eastern North Pacific. Mar. Pollut. Bull. 34, 323-325 (1997). 325
123 Baird, R. W. & Hooker, S. K. Ingestion of plastic and unusual prey by a juvenile 326
harbour porpoise. Mar. Pollut. Bull. 40, 719-720 (2000). 327
124 Derraik, J. G. B. The pollution of the marine environment by plastic debris: a 328
review. Mar. Pollut. Bull. 44, 842-852 (2002). 329
125 Moore, J. E. et al. A review of marine mammal, sea turtle and seabird bycatch in 330
USA fisheries and the role of policy in shaping management. Mar. Policy 33, 331
435-451 (2009). 332
126 Mrosovsky, N., Ryan, G. D. & James, M. C. Leatherback turtles: The menace of 333
plastic. Mar. Pollut. Bull. 58, 287-289 (2009). 334
127 Williams, R., Ashe, E. & O'Hara, P. D. Marine mammals and debris in coastal 335
waters of British Columbia, Canada. Mar. Pollut. Bull. 62, 1303-1316 (2011). 336
128 Carretta, J. V. et al. U.S. Pacific Marine Mammal Stock Assessments: 2007. 320 337
(US Department of Commerce, NOAA Technical Memorandum, NMFS-SWFSC-338
414, 2007). 339

21
129 Turtle Expert Working Group. An Assessment of the Leatherback Turtle 340
Population in the Atlantic Ocean. 116 (NOAA Technical Memorandum NMFS-341
SEFSC-555, 2007). 342
130 Carretta, J. V. et al. U.S. Pacific Marine Mammal Stock Assessments: 2011. 352 343
(NOAA Technical Memorandum NMFS-SWFSC-476, 2011). 344
131 Berman-Kowalewski, M. et al. Association between blue whale (Balaenoptera 345
musculus) mortality and ship strikes along the California Coast. Aquat. Mamm. 346
36, 59-66 (2010). 347
132 Douglas, A. B. et al. Incidence of ship strikes of large whales in Washington 348
State. J. Mar. Biol. Assoc. U.K. 88, 1121-1132 (2008). 349
133 Knowlton, A. R. & Kraus, S. D. Mortality and serious injury of northern right 350
whales (Eubalaena glacialis) in the western North Atlantic Ocean. Journal of 351
Cetacean Research and Management Special Issue, 193-208 (2001). 352
134 Black, A. Light induced seabird mortality on vessels operating in the Southern 353
Ocean: incidents and mitigation measures. Antarct. Sci. 17, 67-68 (2005). 354
135 French, S. S., Gonzalez-Suarez, M., Young, J. K., Durham, S. & Gerber, L. R. 355
Human Disturbance Influences Reproductive Success and Growth Rate in 356
California Sea Lions (Zalophus californianus). PLoS ONE 6 (2011). 357
136 Kovacs, K. M. et al. Global threats to pinnipeds. Mar. Mamm. Sci. 28, 414-436 358
(2012). 359
137 Stachowicz, J. J., Fried, H., Osman, R. W. & Whitlatch, R. B. Biodiversity, 360
invasion resistance, and marine ecosystem function: Reconciling pattern and 361
process. Ecology 83, 2575-2590 (2002). 362
138 Nash, C. E., Iwamoto, R. N. & Mahnken, C. V. W. Aquaculture risk management 363
and marine mammal interactions in the Pacific Northwest. Aquaculture 183, 307-364
323 (2000). 365
139 Lefebvre, K. A., Bargu, S., Kieckhefer, T. & Silver, M. W. From sanddabs to blue 366
whales: the pervasiveness of domoic acid. Toxicon 40, 971-977 (2002). 367
140 de la Riva, G. T. et al. Association of an unusual marine mammal mortality event 368
with Pseudo-nitzschia spp. blooms along the southern California coastline. J. 369
Wildl. Dis. 45, 109-121 (2009). 370
141 Bejarano, A. C., VanDola, F. M., Gulland, F. M., Rowles, T. K. & Schwacke, L. 371
H. Production and toxicity of the marine biotoxin domoic acid and its effects on 372
wildlife: A review. Hum. Ecol. Risk Assess. 14, 544-567 (2008). 373
142 Turl, C. W. Possible effects of noise from offshore oil and gas drilling activities 374
on marine mammals: a survey of the literature. 26 (Naval Ocean Systems Center, 375
Technical Report 776, 1982). 376
143 Kastak, D. & Schusterman, R. J. In-air and underwater hearing sensitivity of a 377
northern elephant seal (Mirounga angustirostris). Can. J. Zool./Rev. Can. Zool. 378
77, 1751-1758 (1999). 379
144 Wiese, F. K. et al. Seabirds at risk around offshore oil platforms in the North-west 380
Atlantic. Mar. Pollut. Bull. 42, 1285-1290 (2001). 381
145 Hader, D. P., Kumar, H. D., Smith, R. C. & Worrest, R. C. Effects of solar UV 382
radiation on aquatic ecosystems and interactions with climate change. 383
Photochemical & Photobiological Sciences 6, 267-285 (2007). 384

22
146 Wilson, B. et al. Epidermal diseases in bottlenose dolphins: impacts of natural 385
and anthropogenic factors. Proc. R. Soc. Lond., Ser. B: Biol. Sci. 266, 1077-1083 386
(1999). 387
147 Chuenpagdee, R., Morgan, L. E., Maxwell, S. M., Norse, E. A. & Pauly, D. 388
Shifting gears: assessing collateral impacts of fishing methods in US waters. 389
Front. Ecol. Environ. 1, 517-524 (2003). 390
148 Robinson, P. W. et al. At-sea behavior of female northern elephant seals. PLoS 391
ONE 7, e36728 (2012). 392
149 Weise, M. J. & Harvey, J. T. Temporal variability in ocean climate and California 393
sea lion diet and biomass consumption: implications for fisheries management. 394
Mar. Ecol. Prog. Ser. 373, 157-172 (2008). 395
150 Ainley, D. G. & Hyrenbach, K. D. Top-down and bottom-up factors affecting 396
seabird population trends in the California current system (1985-2006). Prog. 397
Oceanogr. 84, 242-254 (2010). 398
151 Weise, M. J., Harvey, J. T. & Costa, D. P. The role of body size in individual-399
based foraging strategies of a top marine predator. Ecology 91, 1004-1015 (2010). 400
152 Uhlmann, S. Fisheries bycatch mortalities of sooty shearwaters (Puffinus griseus) 401
and short-tailed shearwaters (P. tenuirostris). 52 (New Zealand Department of 402
Conservation, DOC Science Internal Series 92, Wellington, 2003). 403
153 Carretta, J. V., Price, T., Petersen, D. & Read, R. Estimates of marine mammal, 404
sea turtle, and seabird mortality in the California drift gillnet fishery for swordfish 405
and thresher shark, 1996–2002. Mar. Fish. Rev. 66, 21-30 (2004). 406
154 National Marine Fisheries Service. Final Recovery Plan for the Humpback Whale, 407
Megaptera novaeangliae. 105 (Prepared by the Humpback Whale Recovery Team 408
for the National Marine Fisheries Service, Silver Spring, MD, 1991). 409
410
411