Maximum production of methanol in a pilot-scale process
9
355 Korean J. Chem. Eng., 35(2), 355-363 (2018) DOI: 10.1007/s11814-017-0295-7 INVITED REVIEW PAPER pISSN: 0256-1115 eISSN: 1975-7220 INVITED REVIEW PAPER † To whom correspondence should be addressed. E-mail: [email protected] Copyright by The Korean Institute of Chemical Engineers. Maximum production of methanol in a pilot-scale process Minji Son * , Myung-June Park * , ** ,† , Geunjae Kwak *** , Hae-Gu Park *** , and Ki-Won Jun *** *Department of Energy Systems Research, Ajou University, Suwon 16499, Korea **Department of Chemical Engineering, Ajou University, Suwon 16499, Korea ***C1 Gas Conversion Research Group, Carbon Resources Institute, Korea Research Institute of Chemical Technology (KRICT), Daejeon 34114, Korea (Received 11 September 2017 • accepted 15 October 2017) Abstract-Mathematical models for both bench- and pilot-scale methanol synthesis reactors were developed by esti- mating the overall heat transfer coefficients due to different heat transfer characteristics, while the effectiveness factor was fixed because the same catalysts were used in both reactors. The overall heat transfer coefficient of a pilot-scale reactor was approximately twice that of a bench-scale reactor, while the estimate from the correlation reported for the heat transfer coefficient was 1.8-times higher, indicating that the values determined in the present study are effective. The model showed that the maximum methanol production rate of approximately 16 tons per day was achievable with peak temperature maintained below 250 o C in the open-loop case. Meanwhile, when the recycle was used to prevent the loss of unreacted gas, peak temperature and production rate decreased due to low CO and CO 2 fraction in the recycled stream at the same space velocity as the open-loop operation. Further analysis showed that, since the reaction was in the kinetic regime, the production rate could be maximized up to 18.7 tons per day by increasing the feed flow- rate and inlet temperature despite thermodynamically exothermic reaction. Keywords: Methanol, Reactor Modeling, Effectiveness Factor, Overall Heat Transfer Coefficient, Maximum Production INTRODUCTION Interest in methanol production and demand for methanol are expected to increase further in the next several decades due to the rapidly growing demand for alternative clean energy. Methanol is used extensively as a raw material for the production of chemicals such as formaldehyde, methyl tert-butyl ether (MTBE), and acetic acid. It can also be used to produce electricity by direct oxidiza- tion with air to water and carbon dioxide in a direct methanol fuel cell (DMFC) [1,2]. Methanol is also an excellent fuel in its own right and can be converted conveniently into ethylene or propyl- ene through the methanol-to-olefins (MTO) process [3-5]. Several catalysts, based on Cu, Zn, Cr, and Pd, have been re- ported to maximize both the yield and selectivity of methanol and to prevent the formation of hydrocarbons. Among these, Cu/ZnO catalysts are well-known for their high activity and selectivity, which can be increased further by using a support such as Al 2 O 3 [6-8]. To remove the heat released by the highly exothermic methanol synthesis reaction efficiently, many studies have focused on kinet- ics and reactor modeling when designing commercial processes for mass production [4]. Because the roles of CO and CO 2 have not been defined clearly, several kinetic models have been sug- gested based on different reaction pathways and conditions. Natta assumed that CO hydrogenation is the only mechanism for the production of methanol and suggested the corresponding revers- ible reaction rate [9,10]. Takagawa et al. [11] considered both CO and CO 2 hydrogenations on the basis of experimental results with varying CO and CO 2 ratios over a Cu/Zn catalyst and determined the kinetic parameters for the reaction rates of the CO and CO 2 hydrogenations and reverse water gas shift (WGS) reaction. Peter et al. developed a power-law model, a Langmuir-Hinshelwood-Hou- gen-Watson (LHHW) model, and a microkinetic model and con- ducted a sensitivity analysis to evaluate the effects of kinetic par- ameters on methanol formation rate [12]. In our previous works [6,13], four reactions were considered over a Cu/ZnO/Al 2 O 3 cata- lyst, CO and CO 2 hydrogenations, WGS reaction, and dimethyl ether (DME) formation, where the surface reaction of a methoxy species, the hydrogenation of a formate intermediate HCO 2 , and the formation of a formate intermediate were shown to be the rate determining steps for CO and CO 2 hydrogenations and WGS reac- tion, respectively. Recently, the Monte Carlo method has been applied in the methanol synthesis reaction over Cu(111) catalysts to evaluate the dependence of conversion and selectivity on the operating conditions [14]. Løvik et al. [15] did dynamic modeling and optimization for a typical methanol synthesis reactor, when catalyst deactivation existed, and suggested a strategy for the optimal temperature trajectory for maximum methanol productivity. Kordabadi and Jahanmiri [16] applied the genetic algorithm to maximize methanol production yield, and suggested a reactor with optimal two-stage cooling shells that resulted in an increase of yield of 2.9% during the operating period. They also applied the same strategy to a methanol synthe- sis reactor when catalyst deactivation existed and reduced the degree of deactivation by applying a multi-objective genetic algorithm [17]. Lim et al. [18] showed that the optimal CO 2 fraction for maximum
-
Upload
khangminh22 -
Category
Documents
-
view
0 -
download
0
Transcript of Maximum production of methanol in a pilot-scale process
355
Korean J. Chem. Eng., 35(2), 355-363 (2018)DOI: 10.1007/s11814-017-0295-7
INVITED REVIEW PAPER
pISSN: 0256-1115eISSN: 1975-7220
INVITED REVIEW PAPER
†To whom correspondence should be addressed.E-mail: [email protected] by The Korean Institute of Chemical Engineers.
Maximum production of methanol in a pilot-scale process
Minji Son*, Myung-June Park*,**
,†, Geunjae Kwak***, Hae-Gu Park***, and Ki-Won Jun***
*Department of Energy Systems Research, Ajou University, Suwon 16499, Korea**Department of Chemical Engineering, Ajou University, Suwon 16499, Korea
***C1 Gas Conversion Research Group, Carbon Resources Institute,Korea Research Institute of Chemical Technology (KRICT), Daejeon 34114, Korea
(Received 11 September 2017 • accepted 15 October 2017)
Abstract−Mathematical models for both bench- and pilot-scale methanol synthesis reactors were developed by esti-mating the overall heat transfer coefficients due to different heat transfer characteristics, while the effectiveness factorwas fixed because the same catalysts were used in both reactors. The overall heat transfer coefficient of a pilot-scalereactor was approximately twice that of a bench-scale reactor, while the estimate from the correlation reported for theheat transfer coefficient was 1.8-times higher, indicating that the values determined in the present study are effective.The model showed that the maximum methanol production rate of approximately 16 tons per day was achievable withpeak temperature maintained below 250 oC in the open-loop case. Meanwhile, when the recycle was used to preventthe loss of unreacted gas, peak temperature and production rate decreased due to low CO and CO2 fraction in therecycled stream at the same space velocity as the open-loop operation. Further analysis showed that, since the reactionwas in the kinetic regime, the production rate could be maximized up to 18.7 tons per day by increasing the feed flow-rate and inlet temperature despite thermodynamically exothermic reaction.Keywords: Methanol, Reactor Modeling, Effectiveness Factor, Overall Heat Transfer Coefficient, Maximum Production
INTRODUCTION
Interest in methanol production and demand for methanol areexpected to increase further in the next several decades due to therapidly growing demand for alternative clean energy. Methanol isused extensively as a raw material for the production of chemicalssuch as formaldehyde, methyl tert-butyl ether (MTBE), and aceticacid. It can also be used to produce electricity by direct oxidiza-tion with air to water and carbon dioxide in a direct methanol fuelcell (DMFC) [1,2]. Methanol is also an excellent fuel in its ownright and can be converted conveniently into ethylene or propyl-ene through the methanol-to-olefins (MTO) process [3-5].
Several catalysts, based on Cu, Zn, Cr, and Pd, have been re-ported to maximize both the yield and selectivity of methanol andto prevent the formation of hydrocarbons. Among these, Cu/ZnOcatalysts are well-known for their high activity and selectivity,which can be increased further by using a support such as Al2O3
[6-8].To remove the heat released by the highly exothermic methanol
synthesis reaction efficiently, many studies have focused on kinet-ics and reactor modeling when designing commercial processesfor mass production [4]. Because the roles of CO and CO2 havenot been defined clearly, several kinetic models have been sug-gested based on different reaction pathways and conditions. Nattaassumed that CO hydrogenation is the only mechanism for theproduction of methanol and suggested the corresponding revers-
ible reaction rate [9,10]. Takagawa et al. [11] considered both COand CO2 hydrogenations on the basis of experimental results withvarying CO and CO2 ratios over a Cu/Zn catalyst and determinedthe kinetic parameters for the reaction rates of the CO and CO2
hydrogenations and reverse water gas shift (WGS) reaction. Peter etal. developed a power-law model, a Langmuir-Hinshelwood-Hou-gen-Watson (LHHW) model, and a microkinetic model and con-ducted a sensitivity analysis to evaluate the effects of kinetic par-ameters on methanol formation rate [12]. In our previous works[6,13], four reactions were considered over a Cu/ZnO/Al2O3 cata-lyst, CO and CO2 hydrogenations, WGS reaction, and dimethylether (DME) formation, where the surface reaction of a methoxyspecies, the hydrogenation of a formate intermediate HCO2, andthe formation of a formate intermediate were shown to be the ratedetermining steps for CO and CO2 hydrogenations and WGS reac-tion, respectively. Recently, the Monte Carlo method has beenapplied in the methanol synthesis reaction over Cu(111) catalyststo evaluate the dependence of conversion and selectivity on theoperating conditions [14].
Løvik et al. [15] did dynamic modeling and optimization for atypical methanol synthesis reactor, when catalyst deactivation existed,and suggested a strategy for the optimal temperature trajectory formaximum methanol productivity. Kordabadi and Jahanmiri [16]applied the genetic algorithm to maximize methanol productionyield, and suggested a reactor with optimal two-stage cooling shellsthat resulted in an increase of yield of 2.9% during the operatingperiod. They also applied the same strategy to a methanol synthe-sis reactor when catalyst deactivation existed and reduced the degreeof deactivation by applying a multi-objective genetic algorithm [17].Lim et al. [18] showed that the optimal CO2 fraction for maximum
356 M. Son et al.
February, 2018
methanol production is a function of temperature and thus calcu-lated the optimal CO2 fractions for each catalytic bed for a three-stage methanol synthesis reactor over a Cu/ZnO/Al2O3/ZrO2 cata-lyst. Zhang et al. modeled a gas-to-methanol process using a pro-cess simulator (Aspen Plus), and analyzed the effects of CO2 feedingon the techno-economics of the entire process [19].
We considered mathematical modeling to evaluate the effects ofoperating conditions and suggest an optimal condition for maxi-mum methanol production in a pilot-scale (10 ton per day pro-duction of methanol) reactor. Since the conditions in the pilot-scaleoperation are limited while data under various operating condi-tions are required to estimate parameters in the model, an effec-tiveness factor and overall heat transfer coefficients were determinedusing experimental data from a bench-scale reactor with commer-cial pellet-type catalysts. The model with the same effectivenessfactor was used further in the modeling of a pilot-scale reactorwith the same type of catalysts, while the overall heat transfer coef-ficient was re-estimated due to different operating conditions (highlinear velocity of feed gas compared to a bench-scale operation).
EXPERIMENTAL
1. Catalyst PreparationA commercial CuO/ZnO/Al2O3 catalyst from Dalian Reak Sci-
ence & Technology was used in all methanol synthesis experiments.According to the vendor-supplied details for the catalyst, the cata-lyst has a molar ratio of Cu/Zn/Al=60/30/10, a cylindrical shape(5 mm diameter and 5 mm height), and a bulk density of 1.1-1.3kg/L. The catalyst was loaded into the reactors as received without anypre-treatment or crushing. Prior to the reaction, the loaded catalystwas reduced at 250 oC for 4 h in a flow of 5% H2 balanced withnitrogen. After reduction, the synthesis gas was fed into the reactor.2. Bench-scale Reactor
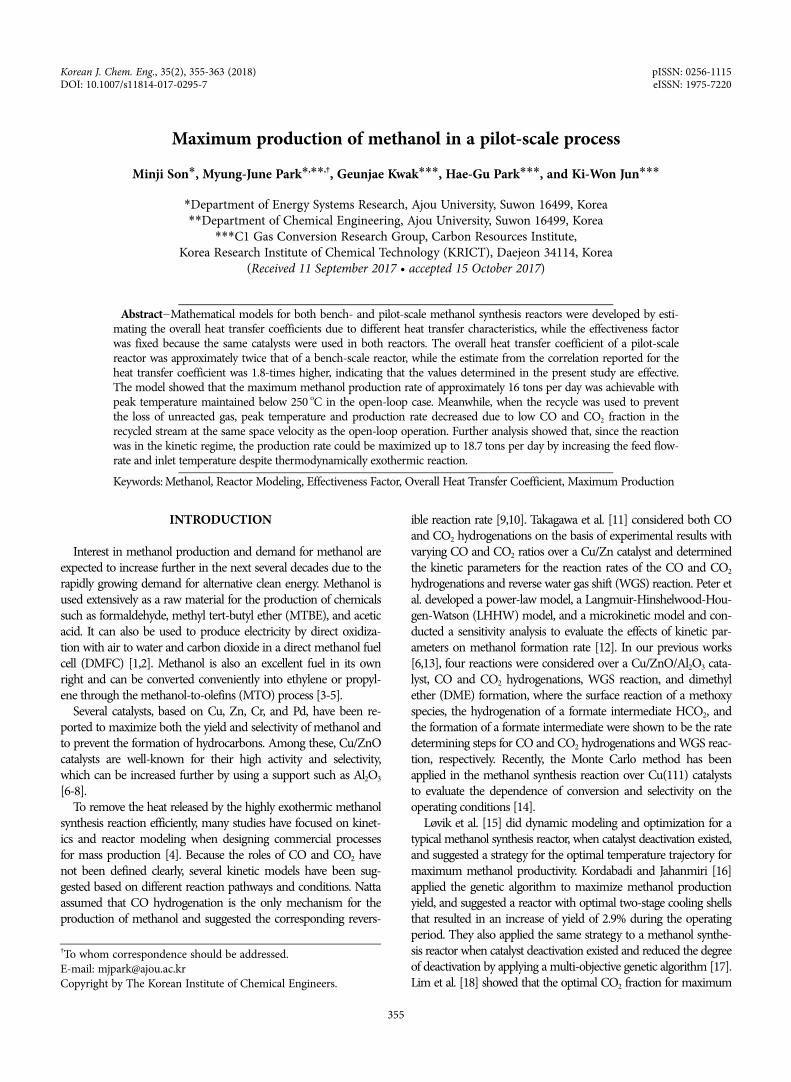
A schematic of the bench-scale reactor is provided in Fig. 1. Atube (diameter and length of 5.15 cm and 212 cm, respectively)was filled with inert material (upper part, 142 cm long) and cata-lyst material (60 cm long, 100 g catalyst and 2,200 g inert), and fivetemperature detectors were installed at the center of the catalytic
bed (detailed locations are shown in Fig. 1). Experiments wereconducted at 50 and 60 bar, while temperature (inlet and wall) andspace velocity were specified to be 225 oC and 8,000 mL/(gcat·h),respectively. The composition of the feed gas was 24%, 6%, 64%,and 6% CO, CO2, H2, and Ar, respectively.3. Pilot-scale Reactor
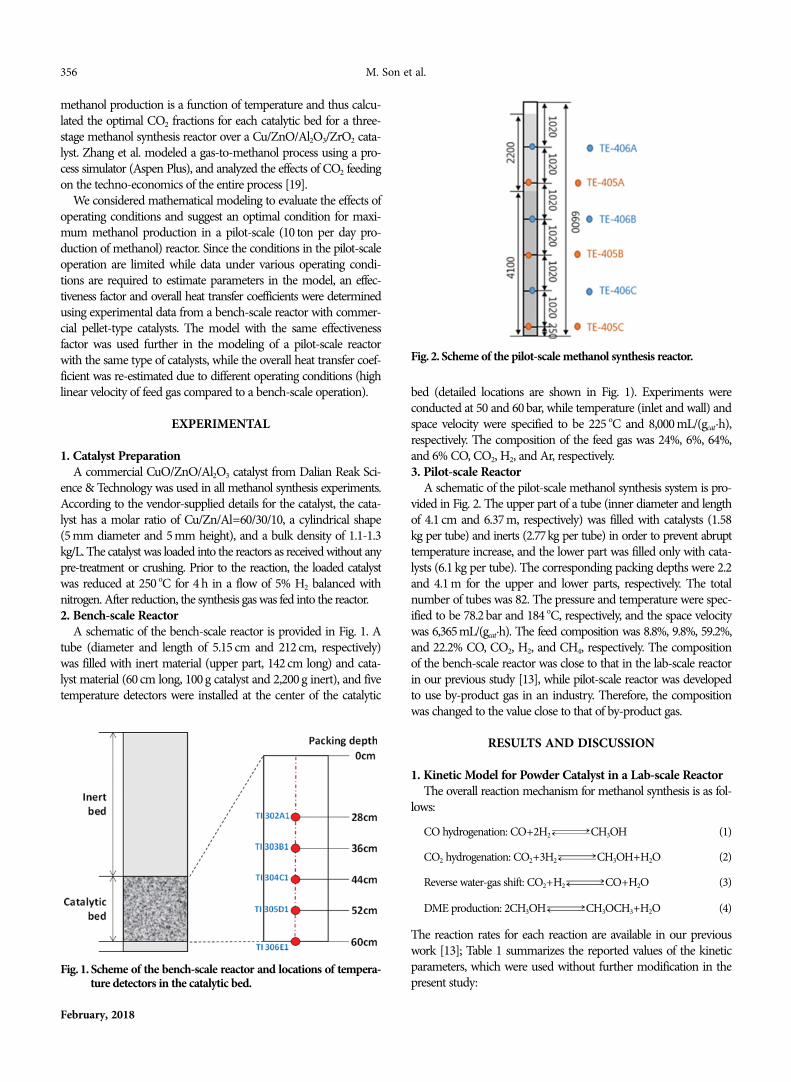
A schematic of the pilot-scale methanol synthesis system is pro-vided in Fig. 2. The upper part of a tube (inner diameter and lengthof 4.1 cm and 6.37 m, respectively) was filled with catalysts (1.58kg per tube) and inerts (2.77kg per tube) in order to prevent abrupttemperature increase, and the lower part was filled only with cata-lysts (6.1 kg per tube). The corresponding packing depths were 2.2and 4.1 m for the upper and lower parts, respectively. The totalnumber of tubes was 82. The pressure and temperature were spec-ified to be 78.2 bar and 184 oC, respectively, and the space velocitywas 6,365mL/(gcat·h). The feed composition was 8.8%, 9.8%, 59.2%,and 22.2% CO, CO2, H2, and CH4, respectively. The compositionof the bench-scale reactor was close to that in the lab-scale reactorin our previous study [13], while pilot-scale reactor was developedto use by-product gas in an industry. Therefore, the compositionwas changed to the value close to that of by-product gas.
RESULTS AND DISCUSSION
1. Kinetic Model for Powder Catalyst in a Lab-scale ReactorThe overall reaction mechanism for methanol synthesis is as fol-
lows:
CO hydrogenation: CO+2H2 CH3OH (1)
CO2 hydrogenation: CO2+3H2 CH3OH+H2O (2)
Reverse water-gas shift: CO2+H2 CO+H2O (3)
DME production: 2CH3OH CH3OCH3+H2O (4)
The reaction rates for each reaction are available in our previouswork [13]; Table 1 summarizes the reported values of the kineticparameters, which were used without further modification in thepresent study:
Fig. 1. Scheme of the bench-scale reactor and locations of tempera-ture detectors in the catalytic bed.
Fig. 2. Scheme of the pilot-scale methanol synthesis reactor.

Maximum production of methanol in a pilot-scale process 357
Korean J. Chem. Eng.(Vol. 35, No. 2)
(5)
(6)
(7)
(8)
Here, f denotes the fugacity, which was calculated using the gener-alized correlations for the fugacity coefficient in the literature [20],and Kp represents the reaction equilibrium constant (values inTable 1). In the case of the DME production rate, Ci was the con-centration of component i in mol/m3.
rCO = kAKCO fCOfH2
1.5 − fCH3OH/ KP, AfH2
0.5( )[ ]
1+ KCOfCO( ) 1+ KH2
0.5fH2
0.5 + KH2OfH2O( )
--------------------------------------------------------------------------------
rCO2 =
kCKCO2fCO2
fH2
1.5 − fH2OfCH3OH/ KP, CfH2
0.5( )[ ]
1+ KCO2fCO2
( ) 1+ KH2
0.5fH2
0.5 + KH2OfH2O( )
-----------------------------------------------------------------------------------------
rRWGS = − kBKCO2
fCO2fH2
− fCOfH2O/KP, B[ ]
1+ KCO2fCO2
( ) 1+ KH2
0.5fH2
0.5 + KH2OfH2O( )
-----------------------------------------------------------------------------------
rDME = kDMEKCH3OH
2 CCH3OH2
− CH2OCDME( )/KP, DME[ ]
1+ 2 KCH3OHCCH3OH + KH2O, DMECH2O( )4
------------------------------------------------------------------------------------------------------
Table 1. Kinetic parameters for a lab-scale methanol synthesis reactor available in the literatureParameter Unit Value Remark
kA mol/(kgcat·s·bar1.5)
[13]
kB mol/(kgcat·s·bar)
kC mol/(kgcat·s·bar1.5)
kDME mol/(kgcat·s)
KH2O bar−1
KCO bar−1
[23]
KH2 bar−1
KCO2 bar−1
KP, A bar−2
KP, B -
KP, C bar−2
KP, DME bar−2
[24]KCH3OH m3/kmol
KH2O, DME m3/kmol
1.88 108exp −113,711RT
----------------------
⎝ ⎠⎛ ⎞×
1.16 1010exp −126,573RT
----------------------
⎝ ⎠⎛ ⎞×
7.08 104exp − 68,252RT
-------------------
⎝ ⎠⎛ ⎞×
8.54 109exp −123,779RT
----------------------
⎝ ⎠⎛ ⎞×
3.80 10−10exp 80,876RT
---------------
⎝ ⎠⎛ ⎞×
8.00 10−7exp − 58,015RT
-------------------
⎝ ⎠⎛ ⎞×
27.08exp 6,291RT------------
⎝ ⎠⎛ ⎞
1.02 10−7exp − 67,439RT
-------------------
⎝ ⎠⎛ ⎞×
2.39 10−13exp − 98,379RT
-------------------
⎝ ⎠⎛ ⎞×
1.02 102exp 39,685RT
---------------
⎝ ⎠⎛ ⎞×
2.56 10−11exp − 58,695RT
-------------------
⎝ ⎠⎛ ⎞×
0.106exp 21,858RT
---------------
⎝ ⎠⎛ ⎞
7.90 10−4exp 70,500RT
---------------
⎝ ⎠⎛ ⎞×
8.40 10−2exp 41,100RT
---------------
⎝ ⎠⎛ ⎞×
Fig. 3. Effects of overall heat transfer coefficient (U) and effectiveness factor (η) on the mean of absolute relative residual (MARR) of (a) COconversion, (b) CO2 conversion, and (c) temperature profiles (averaged value of five measurement points) in a bench-scale reactor.
358 M. Son et al.
February, 2018
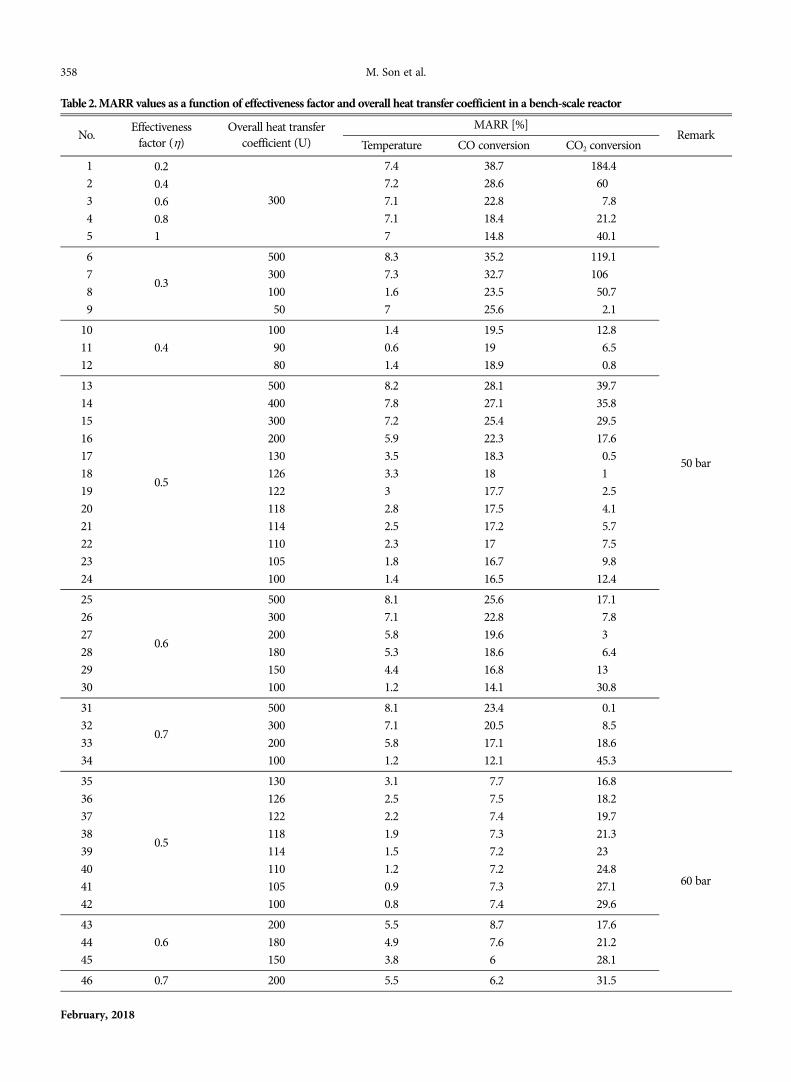
Table 2. MARR values as a function of effectiveness factor and overall heat transfer coefficient in a bench-scale reactor
No. Effectivenessfactor (η)
Overall heat transfercoefficient (U)
MARR [%]Remark
Temperature CO conversion CO2 conversion01 0.2
300
7.4 38.7 184.4
50 bar
02 0.4 7.2 28.6 60.03 0.6 7.1 22.8 007.804 0.8 7.1 18.4 021.205 1.0 7.0 14.8 040.106
0.3
500 8.3 35.2 119.107 300 7.3 32.7 106.008 100 1.6 23.5 050.709 050 7.0 25.6 002.110
0.4100 1.4 19.5 012.8
11 090 0.6 19.0 006.512 080 1.4 18.9 000.813
0.5
500 8.2 28.1 039.714 400 7.8 27.1 035.815 300 7.2 25.4 029.516 200 5.9 22.3 017.617 130 3.5 18.3 000.518 126 3.3 18.0 .119 122 3.0 17.7 002.520 118 2.8 17.5 004.121 114 2.5 17.2 005.722 110 2.3 17.0 007.523 105 1.8 16.7 009.824 100 1.4 16.5 012.425
0.6
500 8.1 25.6 017.126 300 7.1 22.8 007.827 200 5.8 19.6 .328 180 5.3 18.6 006.429 150 4.4 16.8 13.30 100 1.2 14.1 030.831
0.7
500 8.1 23.4 000.132 300 7.1 20.5 008.533 200 5.8 17.1 018.634 100 1.2 12.1 045.335
0.5
130 3.1 07.7 016.8
60 bar
36 126 2.5 07.5 018.237 122 2.2 07.4 019.738 118 1.9 07.3 021.339 114 1.5 07.2 23.40 110 1.2 07.2 024.841 105 0.9 07.3 027.142 100 0.8 07.4 029.643
0.6200 5.5 08.7 017.6
44 180 4.9 07.6 021.245 150 3.8 6. 028.146 0.7 200 5.5 06.2 031.5

Maximum production of methanol in a pilot-scale process 359
Korean J. Chem. Eng.(Vol. 35, No. 2)
The above rate equations were applied to a process simulator(UniSim Design Suite, Honeywell Inc.) to simulate a plug flowreactor (PFR). To obtain the axial profiles in the PFR, the reactorwas divided into several subvolumes where the reaction rates wereconsidered to be spatially uniform. A mole balance was done atsteady state in each subvolume j as follows:
Fj0−Fj+rjV=0 (9)
2. Bench-scale Reactor ModelingTo consider the mass transfer resistance resulting from the in-
crease of particle size (from powder to pellet type), an effectivenessfactor (η) was considered. In addition, because the different parti-cle size led to a change of porosity of the catalytic bed, the overallheat transfer coefficient (U) was also determined to explain thedifferent characteristics of heat transfer in a bench-scale reactor.
Fig. 3 shows the effects of η and U on the conversion and tem-perature profiles in the catalytic bed (detailed values are providedin Table 2). The mean absolute relative residual (MARR) of CO2
conversion was relatively large compared to those of CO conver-sion and temperature, probably due to the small values of experi-mental data in the denominators. For both pressure conditions, aneffectiveness factor of 0.5 and an overall heat transfer coefficient of122 kJ/(m2·oC·h) were determined to be the most adequate valuesfrom the perspective of balanced estimation; comparisons betweenexperimental data and simulated results are provided in Fig. 4, to-gether with the values of relative errors. Note that although the reac-tion rate for DME production was considered in our previous work,negligible amount of DME was measured in experimental data ofthe present study. Therefore, DME production was ignored in thedetermination of η and U.
There are two kinds of effectiveness factors: internal and over-all. To evaluate the contribution of internal and external mass trans-fer resistance, the dimensionless Mears parameters were calculatedunder all the experimental conditions and the values were less than3.75×10−8 (much lower than the threshold value of 0.15), confirm-ing negligible external mass diffusion [21]. Meanwhile, dimen-sionless Weisz-Prater parameters (CWP) were calculated to be 0.02(higher than the threshold value of 0.01), indicating the existenceof internal diffusion limitation. Therefore, the effectiveness factorin the present study represents internal one.
3. Pilot-scale Reactor ModelingSince the same catalyst pellets were used in both the bench- and
the pilot-scale reactors, the value of the effectiveness factor was
Fig. 5. Effects of wall temperature and overall heat transfer coefficient (U) on the mean of absolute relative residuals (MARR) of (a) CO con-version, (b) CO2 conversion, and (c) temperature profiles (averaged value of five measurement points) in a pilot-scale reactor.
Fig. 4. Comparisons of (a) conversions and (b) temperature pro-files between experimental data and simulation results in abench-scale reactor. Values with parentheses in diagram (a)represent relative errors, and means of absolute relative resid-uals of temperatures in diagram (b) are 3% and 2.2% for 50and 60 bar, respectively.
360 M. Son et al.
February, 2018
maintained as 0.5, while the different linear velocity in the pilot-scale reactor required re-estimation of the overall heat transfercoefficient. The effectiveness factor is influenced by operating con-ditions because different stream velocity affects the thickness ofmass transfer boundary layer. However, as discussed in the previ-ous section, the mass transfer was negligible in the present study,while internal diffusion limitation mostly affects the effectivenessfactor. In addition, operating temperatures were maintained withinlimited range. Therefore, constant effectiveness factor was assumedin the pilot-scale reactor.
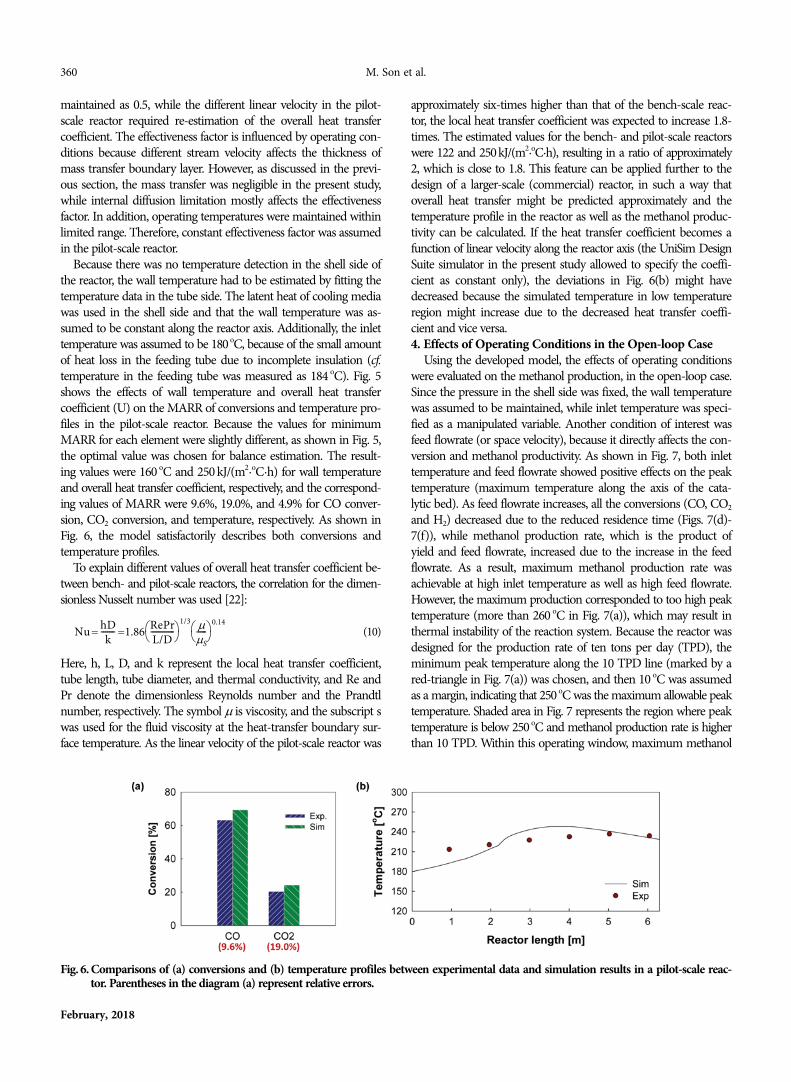
Because there was no temperature detection in the shell side ofthe reactor, the wall temperature had to be estimated by fitting thetemperature data in the tube side. The latent heat of cooling mediawas used in the shell side and that the wall temperature was as-sumed to be constant along the reactor axis. Additionally, the inlettemperature was assumed to be 180 oC, because of the small amountof heat loss in the feeding tube due to incomplete insulation (cf.temperature in the feeding tube was measured as 184 oC). Fig. 5shows the effects of wall temperature and overall heat transfercoefficient (U) on the MARR of conversions and temperature pro-files in the pilot-scale reactor. Because the values for minimumMARR for each element were slightly different, as shown in Fig. 5,the optimal value was chosen for balance estimation. The result-ing values were 160 oC and 250 kJ/(m2·oC·h) for wall temperatureand overall heat transfer coefficient, respectively, and the correspond-ing values of MARR were 9.6%, 19.0%, and 4.9% for CO conver-sion, CO2 conversion, and temperature, respectively. As shown inFig. 6, the model satisfactorily describes both conversions andtemperature profiles.
To explain different values of overall heat transfer coefficient be-tween bench- and pilot-scale reactors, the correlation for the dimen-sionless Nusselt number was used [22]:
(10)
Here, h, L, D, and k represent the local heat transfer coefficient,tube length, tube diameter, and thermal conductivity, and Re andPr denote the dimensionless Reynolds number and the Prandtlnumber, respectively. The symbol μ is viscosity, and the subscript swas used for the fluid viscosity at the heat-transfer boundary sur-face temperature. As the linear velocity of the pilot-scale reactor was
approximately six-times higher than that of the bench-scale reac-tor, the local heat transfer coefficient was expected to increase 1.8-times. The estimated values for the bench- and pilot-scale reactorswere 122 and 250kJ/(m2·oC·h), resulting in a ratio of approximately2, which is close to 1.8. This feature can be applied further to thedesign of a larger-scale (commercial) reactor, in such a way thatoverall heat transfer might be predicted approximately and thetemperature profile in the reactor as well as the methanol produc-tivity can be calculated. If the heat transfer coefficient becomes afunction of linear velocity along the reactor axis (the UniSim DesignSuite simulator in the present study allowed to specify the coeffi-cient as constant only), the deviations in Fig. 6(b) might havedecreased because the simulated temperature in low temperatureregion might increase due to the decreased heat transfer coeffi-cient and vice versa.4. Effects of Operating Conditions in the Open-loop Case
Using the developed model, the effects of operating conditionswere evaluated on the methanol production, in the open-loop case.Since the pressure in the shell side was fixed, the wall temperaturewas assumed to be maintained, while inlet temperature was speci-fied as a manipulated variable. Another condition of interest wasfeed flowrate (or space velocity), because it directly affects the con-version and methanol productivity. As shown in Fig. 7, both inlettemperature and feed flowrate showed positive effects on the peaktemperature (maximum temperature along the axis of the cata-lytic bed). As feed flowrate increases, all the conversions (CO, CO2
and H2) decreased due to the reduced residence time (Figs. 7(d)-7(f)), while methanol production rate, which is the product ofyield and feed flowrate, increased due to the increase in the feedflowrate. As a result, maximum methanol production rate wasachievable at high inlet temperature as well as high feed flowrate.However, the maximum production corresponded to too high peaktemperature (more than 260 oC in Fig. 7(a)), which may result inthermal instability of the reaction system. Because the reactor wasdesigned for the production rate of ten tons per day (TPD), theminimum peak temperature along the 10 TPD line (marked by ared-triangle in Fig. 7(a)) was chosen, and then 10 oC was assumedas a margin, indicating that 250 oC was the maximum allowable peaktemperature. Shaded area in Fig. 7 represents the region where peaktemperature is below 250 oC and methanol production rate is higherthan 10 TPD. Within this operating window, maximum methanol
Nu = hDk------- =1.86 RePr
L/D------------
⎝ ⎠⎛ ⎞
1/3µ
µS-----
⎝ ⎠⎛ ⎞0.14
Fig. 6. Comparisons of (a) conversions and (b) temperature profiles between experimental data and simulation results in a pilot-scale reac-tor. Parentheses in the diagram (a) represent relative errors.

Maximum production of methanol in a pilot-scale process 361
Korean J. Chem. Eng.(Vol. 35, No. 2)
production rate of 15.8 TPD was achieved at inlet temperature of166 oC and feed flowrate of twice of the reference value ((Feedref)open=178.9 kmol/h). Meanwhile, maximum yield required high tempera-ture (200 oC) and low feed flowrate (75% of (Feedref)open). Thus, ifoperation is conducted under the condition for the maximum meth-anol production rate, the corresponding yield decreases to approx-imately 0.32, resulting in large amount of unreacted feed gas andprobably highly expensive separation cost.5. Maximum Methanol Production in the Recycled Operation
To prevent the loss of unreacted gases, a recycle stream wasintroduced in the reactor (Fig. 8), and the simulation was conductedusing the same process simulator for reactor modeling (UniSimDesign Suite, Honeywell Inc.). The size of the reactor was main-tained to be the same in the open-loop case, while additional unitoperations were considered in the recycled case: The reactor efflu-ent was cooled to 42 oC by assuming the temperature of cooling
water was 32 oC and specifying the minimum approach tempera-ture to be 10 oC (COOLER), and the condensed methanol andwater were separated in the SEPARATOR while unreacted gaseswere recycled to the MIXER. The mixture of feed and recycled gaswas heated to the specified value of inlet temperature.
The flowrate for the maximum methanol production in theopen-loop was determined to 357.7 kmol/h (=2(Feedref)open in Fig.7(b)). Meanwhile, since the reactor inlet flowrate in the recycledcase was composed of two streams, feed and recycle, therefore, theflowrate of Feed was adjusted so that the reactor inlet (F+R) couldbe close to 357.7 kmol/h. As a result, the flowrate of feed was de-termined to be 93.0 kmol/h, which was used as a reference flow-rate in the recycled operation (denoted as (Feedref)recycle as in Table3). The corresponding reactor inlet flowrate was 359.3 kmol/h. Asshown in Table 3, despite almost the same space velocity, the metha-nol production of the reference case in the recycled operation
Fig. 7. Contour plots of (a) peak temperature, (b) methanol production rate [ton/day], (c) methanol yield, (d) CO conversion, (e) CO2 con-version, and (f) H2 conversion, with respect to inlet temperature and feed flowrate (Feed/(Feedref)open) where (Feedref)open=178.9 kmol/h,for the open-loop case. Shaded area corresponds to the region where peak temperature is below 250 oC and methanol production rateis higher than 10 tons per day.
Fig. 8. Scheme of a methanol production with recycled and purge streams.
362 M. Son et al.
February, 2018
decreased to 9.6. This feature is attributed to the fact that the recy-cled stream had low CO and CO2 fraction after separation andincluded small amount of methanol. Reduced fraction of CO andCO2 in the reactor inlet led to the decrease in the reaction rate,and the existence of methanol in the inlet increased reverse reac-tion rate, resulting in the decrease in the net reaction rate. In addi-tion, the reduced reaction rate lowered the peak temperature to209 oC.
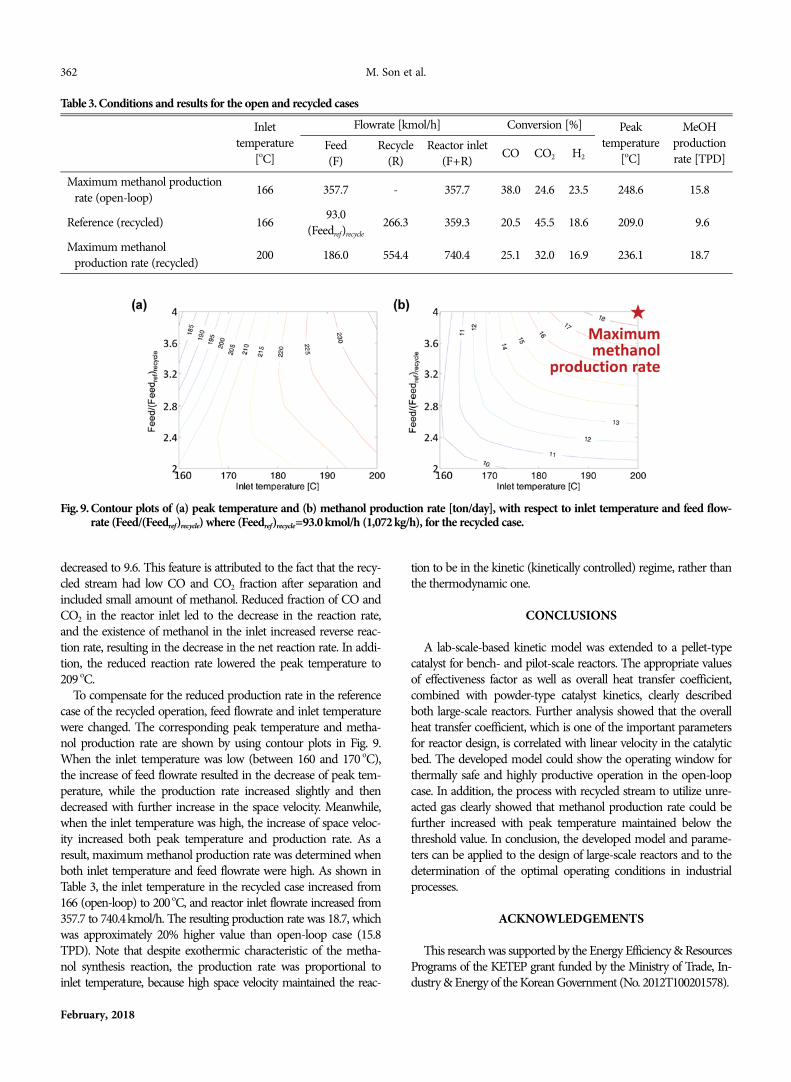
To compensate for the reduced production rate in the referencecase of the recycled operation, feed flowrate and inlet temperaturewere changed. The corresponding peak temperature and metha-nol production rate are shown by using contour plots in Fig. 9.When the inlet temperature was low (between 160 and 170 oC),the increase of feed flowrate resulted in the decrease of peak tem-perature, while the production rate increased slightly and thendecreased with further increase in the space velocity. Meanwhile,when the inlet temperature was high, the increase of space veloc-ity increased both peak temperature and production rate. As aresult, maximum methanol production rate was determined whenboth inlet temperature and feed flowrate were high. As shown inTable 3, the inlet temperature in the recycled case increased from166 (open-loop) to 200 oC, and reactor inlet flowrate increased from357.7 to 740.4kmol/h. The resulting production rate was 18.7, whichwas approximately 20% higher value than open-loop case (15.8TPD). Note that despite exothermic characteristic of the metha-nol synthesis reaction, the production rate was proportional toinlet temperature, because high space velocity maintained the reac-
tion to be in the kinetic (kinetically controlled) regime, rather thanthe thermodynamic one.
CONCLUSIONS
A lab-scale-based kinetic model was extended to a pellet-typecatalyst for bench- and pilot-scale reactors. The appropriate valuesof effectiveness factor as well as overall heat transfer coefficient,combined with powder-type catalyst kinetics, clearly describedboth large-scale reactors. Further analysis showed that the overallheat transfer coefficient, which is one of the important parametersfor reactor design, is correlated with linear velocity in the catalyticbed. The developed model could show the operating window forthermally safe and highly productive operation in the open-loopcase. In addition, the process with recycled stream to utilize unre-acted gas clearly showed that methanol production rate could befurther increased with peak temperature maintained below thethreshold value. In conclusion, the developed model and parame-ters can be applied to the design of large-scale reactors and to thedetermination of the optimal operating conditions in industrialprocesses.
ACKNOWLEDGEMENTS
This research was supported by the Energy Efficiency & ResourcesPrograms of the KETEP grant funded by the Ministry of Trade, In-dustry & Energy of the Korean Government (No. 2012T100201578).
Table 3. Conditions and results for the open and recycled cases
Inlettemperature
[oC]
Flowrate [kmol/h] Conversion [%] Peaktemperature
[oC]
MeOHproductionrate [TPD]
Feed(F)
Recycle(R)
Reactor inlet(F+R) CO CO2 H2
Maximum methanol productionrate (open-loop) 166 357.7 - 357.7 38.0 24.6 23.5 248.6 15.8
Reference (recycled) 166 93.0(Feedref)recycle
266.3 359.3 20.5 45.5 18.6 209.0 09.6
Maximum methanolproduction rate (recycled) 200 186.0 554.4 740.4 25.1 32.0 16.9 236.1 18.7
Fig. 9. Contour plots of (a) peak temperature and (b) methanol production rate [ton/day], with respect to inlet temperature and feed flow-rate (Feed/(Feedref)recycle) where (Feedref)recycle=93.0 kmol/h (1,072 kg/h), for the recycled case.

Maximum production of methanol in a pilot-scale process 363
Korean J. Chem. Eng.(Vol. 35, No. 2)
REFERENCES
1. G. A. Olah, Angew. Chem. Int. Ed., 44, 2636 (2005).2. G. A. Olah and G. K. S. Prakash, US Patent (US7608743 B2) (2009).3. B. Denise, R. P. A. Sneeden and C. Hamon, J. Mol. Catal., 17, 359
(1982).4. P. Mizsey, E. Newson, T. B. Truong and P. Hottinger, Appl. Catal.
A: Gen., 213, 233 (2001).5. M. Sedighi, M. Ghasemi and A. Jahangiri, Korean J. Chem. Eng.,
34, 997 (2017).6. H. W. Lim, M. J. Park, S. H. Kang, H. J. Chae, J. W. Bae and K. W.
Jun, Ind. Eng. Chem. Res., 48, 10448 (2009).7. J. Toyir, P. R. r. de la Piscina, J. L. G. Fierro and N. s. Homs, Appl.
Catal. B: Environ., 29, 207 (2001).8. J. Wu, S. Luo, J. Toyir, M. Saito, M. Takeuchi and T. Watanabe,
Catal. Today, 45, 215 (1998).9. K. Klier, Adv. Catal., 31, 243 (1982).
10. G. Natta, in Catalysis, P. H. Emmett Eds., Reinhold, New York(1955).
11. M. Takagawa and M. Ohsugi, J. Catal., 107, 161 (1987).12. M. Peter, M. B. Fichtl, H. Ruland, S. Kaluza, M. Muhler and O.
Hinrichsen, Chem. Eng. J., 203, 480 (2012).
13. N. Park, M. J. Park, Y. J. Lee, K. S. Ha and K. W. Jun, Fuel Process.Technol., 125, 139 (2014).
14. D. Kopač, M. Huš, M. Ogrizek and B. Likozar, J. Phys. Chem. C,121, 17941 (2017).
15. I. Løvik, M. Hillestad and T. Hertzberg, Comput. Chem. Eng., 22,S707 (1998).
16. H. Kordabadi and A. Jahanmiri, Chem. Eng. J., 108, 249 (2005).17. H. Kordabadi and A. Jahanmiri, Chem. Eng. Process., 46, 1299 (2007).18. H. W. Lim, H. J. Jun, M. J. Park, H. S. Kim, J. W. Bae, K. S. Ha, H. J.
Chae and K. W. Jun, Korean J. Chem. Eng., 27, 1760 (2010).19. C. Zhang, K.-W. Jun, R. Gao, G. Kwak and H.-G. Park, Fuel, 190,
303 (2017).20. J. M. Smith, H. C. Van Ness and M. M. Abbott, Introduction to
Chemical Engineering Thermodynamics, 7th Ed. McGraw-Hill, NewYork (2005).
21. H. S. Fogler, Elements of Chemical Reaction Engineering, Prentice-Hall, New Jersey (1999).
22. E. N. Sieder and G. E. Tate, Ind. Eng. Chem., 28, 1429 (1936).23. G. H. Graaf, P. J. J. M. Sijtsema, E. J. Stamhuis and G. E. H. Joosten,
Chem. Eng. Sci., 41, 2883 (1986).24. K. L. Ng, D. Chadwick and B. A. Toseland, Chem. Eng. Sci., 54,
3587 (1999).