Mathematical models for fatigue minimization during functional electrical stimulation
14
Journal of Electromyography and Kinesiology 13 (2003) 575–588 www.elsevier.com/locate/jelekin Mathematical models for fatigue minimization during functional electrical stimulation Jun Ding a,∗ , Anthony S. Wexler b , Stuart A. Binder-Macleod a,c a Interdisciplinary Graduate Program in Biomechanics & Movement Science, University of Delaware, Newark, DE 19716, USA b Departments of Mechanical and Aeronautical Engineering, Civil and Environmental Engineering, and Land, Air and Water Resources, University of California, Davis, CA 95616, USA c Department of Physical Therapy, University of Delaware, Newark, DE 19716, USA Received 27 January 2003; received in revised form 9 July 2003; accepted 14 July 2003 Abstract We previously reported the development of a force- and fatigue-model system that predicted accurately forces during repetitive fatiguing activation of human skeletal muscles using brief duration (six-pulse) stimulation trains. The model system was tested in the present study using force responses produced by longer duration stimulation trains, containing up to 50 pulses. Our results showed that our model successfully predicted the peak forces produced when the muscle was repetitively activated with stimulation trains of frequencies ranging from 20 to 40 Hz, train durations ranging from 0.5 to 1 s, and varied pulse patterns. The predicted peak forces throughout each protocol matched the experimental peak forces with r 2 values above 0.9 and predicted successfully the forces at the end of each protocol with 15% error for all protocols tested. The success of our model system further supports its potential use for the design of optimal stimulation patterns for individual users during functional electrical stimulation. 2003 Elsevier Ltd. All rights reserved. Keywords: Functional electrical stimulation; Doublets; Predictive model; Muscle fatigue 1. Introduction In patients with neurological disorders, artificial elec- trical stimulation is used to activate their paralyzed muscles to restore movement and function. This appli- cation of electrical stimulation is referred to as functional electrical stimulation (FES) [1]. Most current FES sys- tems employ a simple stimulation pattern (i.e. a constant- frequency train (CFT) with all the pulses within the train equally spaced) with frequencies ranging from 20 to 50 Hz [33] (Fig. 1A). However, muscles fatigue rapidly as a result of artificial activation. Clinicians often increase the stimulation frequency or intensity to maintain the needed forces as a muscle fatigues. Unfortunately, both high stimulation frequencies and intensities accelerate the rate and level of fatigue [4,8]. Thus, it is important ∗ Corresponding author. Present address: Department of Physical Therapy, 301 McKinly Laboratories, University of Delaware, Newark, DE 19716, USA. Tel.: +1-302-831-3011; fax: +1-302-831-4234. E-mail address: [email protected] (J. Ding). 1050-6411/$ - see front matter 2003 Elsevier Ltd. All rights reserved. doi:10.1016/S1050-6411(03)00102-0 to optimize the stimulation strategy to minimize energy expenditure and fatigue. Patterns of pulses within each stimulation train can markedly affect force production and fatigue [3,5,13]. Recent studies in our laboratory showed that stimulation trains that contained closely spaced pulses (doublets) at the beginning of a CFT (i.e. variable-frequency trains — VFTs, see Fig. 1 for an example) or throughout the train (i.e. doublet-frequency trains — DFTs) produced greater isometric forces from fatigued human skeletal muscles and greater power during dynamic contractions than tra- ditionally used CFTs [7,17,26]. However, VFTs and DFTs produced greater declines in forces than CFTs [10]. A new strategy to combat fatigue has therefore emerged. Instead of increasing stimulation frequency or intensity, the stimulation pulse pattern was varied (e.g. switching from CFT to DFT) during repetitive activation of the muscle to maintain forces [25]. However, because of the great variability in muscular contractile character- istics between individuals, numerous experimental tests would be needed to identify the optimal stimulation scheme (e.g. stimulation frequencies, patterns, and duty
-
Upload
independent -
Category
Documents
-
view
6 -
download
0
Transcript of Mathematical models for fatigue minimization during functional electrical stimulation

Journal of Electromyography and Kinesiology 13 (2003) 575–588www.elsevier.com/locate/jelekin
Mathematical models for fatigue minimization during functionalelectrical stimulation
Jun Dinga,∗, Anthony S. Wexlerb, Stuart A. Binder-Macleoda,c
a Interdisciplinary Graduate Program in Biomechanics & Movement Science, University of Delaware, Newark, DE 19716, USAb Departments of Mechanical and Aeronautical Engineering, Civil and Environmental Engineering, and Land, Air and Water Resources,
University of California, Davis, CA 95616, USAc Department of Physical Therapy, University of Delaware, Newark, DE 19716, USA
Received 27 January 2003; received in revised form 9 July 2003; accepted 14 July 2003
Abstract
We previously reported the development of a force- and fatigue-model system that predicted accurately forces during repetitivefatiguing activation of human skeletal muscles using brief duration (six-pulse) stimulation trains. The model system was tested inthe present study using force responses produced by longer duration stimulation trains, containing up to 50 pulses. Our resultsshowed that our model successfully predicted the peak forces produced when the muscle was repetitively activated with stimulationtrains of frequencies ranging from 20 to 40 Hz, train durations ranging from 0.5 to 1 s, and varied pulse patterns. The predictedpeak forces throughout each protocol matched the experimental peak forces withr2 values above 0.9 and predicted successfullythe forces at the end of each protocol with�15% error for all protocols tested. The success of our model system further supportsits potential use for the design of optimal stimulation patterns for individual users during functional electrical stimulation. 2003 Elsevier Ltd. All rights reserved.
Keywords: Functional electrical stimulation; Doublets; Predictive model; Muscle fatigue
1. Introduction
In patients with neurological disorders, artificial elec-trical stimulation is used to activate their paralyzedmuscles to restore movement and function. This appli-cation of electrical stimulation is referred to as functionalelectrical stimulation (FES)[1]. Most current FES sys-tems employ a simple stimulation pattern (i.e. a constant-frequency train (CFT) with all the pulses within the trainequally spaced) with frequencies ranging from 20 to 50Hz [33] (Fig. 1A). However, muscles fatigue rapidly asa result of artificial activation. Clinicians often increasethe stimulation frequency or intensity to maintain theneeded forces as a muscle fatigues. Unfortunately, bothhigh stimulation frequencies and intensities acceleratethe rate and level of fatigue[4,8]. Thus, it is important
∗ Corresponding author. Present address: Department of PhysicalTherapy, 301 McKinly Laboratories, University of Delaware, Newark,DE 19716, USA. Tel.:+1-302-831-3011; fax:+1-302-831-4234.
E-mail address: [email protected] (J. Ding).
1050-6411/$ - see front matter 2003 Elsevier Ltd. All rights reserved.doi:10.1016/S1050-6411(03)00102-0
to optimize the stimulation strategy to minimize energyexpenditure and fatigue.
Patterns of pulses within each stimulation train canmarkedly affect force production and fatigue[3,5,13].Recent studies in our laboratory showed that stimulationtrains that contained closely spaced pulses (doublets) atthe beginning of a CFT (i.e. variable-frequency trains —VFTs, seeFig. 1 for an example) or throughout the train(i.e. doublet-frequency trains — DFTs) produced greaterisometric forces from fatigued human skeletal musclesand greater power during dynamic contractions than tra-ditionally used CFTs[7,17,26]. However, VFTs andDFTs produced greater declines in forces than CFTs[10]. A new strategy to combat fatigue has thereforeemerged. Instead of increasing stimulation frequency orintensity, the stimulation pulse pattern was varied (e.g.switching from CFT to DFT) during repetitive activationof the muscle to maintain forces[25]. However, becauseof the great variability in muscular contractile character-istics between individuals, numerous experimental testswould be needed to identify the optimal stimulationscheme (e.g. stimulation frequencies, patterns, and duty

576 J. Ding et al. / Journal of Electromyography and Kinesiology 13 (2003) 575–588
Fig. 1. Schematic representations of the stimulation patterns (a) and testing procedures (b) used in this study. DFT, doublet-frequency trains with200-Hz doublets separated by equal intervals. VFT, variable-frequency trains with an initial 200-Hz doublet followed by pulses equally spaced.CFT, constant-frequency trains with all pulses separated by equal intervals.
cycles) for each task for each patient. If successfully,mathematical models that predict muscle forces andfatigue during repetitive activation can speed up this pro-cess and require far fewer tests.
Our effort to develop such a model started with a ser-ies of force models that successfully predicted forceresponses to a wide range of frequencies and patternsfor animal [38] and human skeletal muscles[15,17,18,20]. Then a fatigue model, coupled with ourforce model, was developed. Our force model consistsof two differential equations that were developed basedon the known mechanisms for muscle activation andforce development (see below for details). The fatiguemodel predicts changes in the force-model parametervalues by using instantaneous forces as a driving func-tion (see below for a more detailed description). Unfortu-nately, because many of the specific mechanisms respon-sible for fatigue are not well understood, our fatiguemodel was much more empirically derived and lacksspecific association between known cellular and molecu-lar mechanisms of fatigue and changes in muscle force.
The force–fatigue model system has successfully pre-dicted the short-term effects of stimulation frequency,pulse pattern, and resting times on muscle fatigue [18,20,21]. The model system has been tested with data pro-duced by repetitively activating human quadriceps fem-oris muscles with intermittent stimulation trains of fre-quencies ranging from 10 to 40 Hz, CFTs and DFTs,and resting times ranging from 500 to 1000 ms. Thesystem accounted for �90% of the variance in theexperimental data. However, only six-pulse trains wereused in these studies. Because some functional tasks mayrequire longer trains, the force model has been testedwith 1 s stimulation trains for both non-fatigued andfatigued muscles and showed success in predicting forceresponses to stimulation trains with mean frequencies(train duration divided by the number of pulses) from12.5 to 100 Hz, train durations from 485 to 1000 ms,and number of pulses from 14 to 50 [19]. The purpose ofthis study, therefore, was to test the force–fatigue modelsystem’s ability to predict short-term fatigue producedby longer duration stimulation trains.

577J. Ding et al. / Journal of Electromyography and Kinesiology 13 (2003) 575–588
2. Methods
Twelve healthy subjects participated in this study.Each subject signed a consent form that was approvedby the University of Delaware Human Subject Commit-tee. The experimental setup was similar to that describedpreviously [9]. Briefly, subjects were seated on a forcedynamometer with their hips flexed to about 75° andtheir knees flexed to about 90°. The force transducer waspositioned against the anterior aspect of the leg, proxi-mal to the lateral malleolus. Two stimulating electrodepads (Versa-stim, Conductive Adhesive, by CONMEDCorporation, 7.6 cm×12.7 cm) were placed over thequadriceps femoris muscle. One was placed over theproximal portion and the other was placed over the distalportion of the muscle. A Grass S8800 stimulator with aGrass Model SIU8T stimulus isolation unit was used todeliver 600 µs voltage-regulated pulses (Grass Stimu-lator S8800, Grass Instruments, West Warwick, RI). Iso-metric force data were collected at a rate of 200 Hz andstored onto a personal computer using customizedsoftware.
This study was conducted in two phases. The firstphase, termed the Development Phase, was conducted todevelop the force–fatigue model system and used datacollected from 6 subjects, each participating in sevenexperimental sessions. The second phase, termed theValidation Phase, was conducted to validate the force–fatigue model system and used data collected fromanother six subjects, each participating in five experi-mental sessions. At least 48 h separated each session.The experimental procedures were similar across ses-sions; each session started with obtaining the subjects’maximum voluntary isometric contractions (MVIC) fol-lowed by setting the stimulation intensity and continuedwith the testing protocol (Fig. 1B).
2.1. MVIC
In the first sessions of both phases, the subject’sMVIC was first determined using a burst superimpo-sition technique [34]. Briefly, subjects performed amaximum voluntary contraction, during which an 11-pulse 100-Hz train at high intensity (135 peak volts) wasdelivered to the muscle to determine whether subjectswere truly generating maximum force. Voluntary forcewas considered maximum if it did not increase by �10%when the stimulus train was added. If the forcesincreased with stimulation by �10%, subjects rested 5min before attempting to perform another MVIC. Amaximum of three attempts to achieve an MVIC waspermitted. Subjects unable to complete this task success-fully were not included in the study.
2.2. Setting stimulation intensity
The stimulation intensity for each session was thenset for each subject so that a six-pulse, 100-Hz train pro-duced 20% of the subject’s MVIC (N) (mean stimulatoroutput=60 V, range 42–105 V) obtained in the first test-ing session. Twenty percent was chosen because it waswell tolerated by subjects and produced powerful forces.A previous study showed this procedure activates ca40% of the quadriceps femoris muscle [16]. The stimu-lation intensity was kept constant for the remainder ofthe session.
3. Development phase
3.1. Force model
Our recently developed force model [19] has two dif-ferential equations
dCN
dt�
1tc�n
i � 1
Ri exp��t�ti
tc��
CN
tc(1)
with Ri = 1+(R0�1)exp[�(ti�ti�1) /tc] and
dFdt
� ACN
Km � CN
�F
t1 � t2CN
Km � CN
. (2)
Eq. (1) represents the activation of the muscle by mode-ling the dynamics of the rate-limiting step leading to theformation of Ca2+-troponin complex (CN, unitless), inwhich Ri (unitless) accounts for the nonlinear summationof the Ca2+ transient within the muscle fibers whenstimulated with two closely spaced pulses [22]. Eq. (2)represents the development of the mechanical force (F,Newton). The force is driven by force-producing cross-bridges (strongly bound cross-bridges) that are modeledby CN / (Km + CN). The force model is governed by sixparameters: tc, R0, A, Km, t1, and t2. The definitions ofsymbols used in the above equations are detailed inTable 1.
Because the simplest model is desired by designers ofthe FES systems [2], we have tried to limit the numberof free parameters for our force model. Among the sixforce-model parameters, we previously found that fixingtc at 20 ms was sufficient for human quadriceps femorismuscles under a variety of physiological conditions [17–21]. Additionally, further analysis of data collected pre-viously [19] showed that for both non-fatigued andfatigued muscle parameter R0 could be expressed as afunction of Km (R0 = Km + 1.04). Thus, for non-fatiguedmuscles only four free parameters, A, Km, t1, and t2 needto be identified for each subject.
The parametrization procedure is same for each sub-

578 J. Ding et al. / Journal of Electromyography and Kinesiology 13 (2003) 575–588
Table 1Definition of symbols
Symbol Unit Definition
Force modelA N/ms scaling factor for the force and the shortening velocity of the muscleCN — unitless representation of Ca2+-troponin complexF N instantaneous forceh integration stepKm — sensitivity of strongly bound cross-bridges to CN
n — total number of stimulus in the train before time tR0 — mathematical term characterizing the magnitude of enhancement in CN from the following stimulit1 ms time constant of force decline at the absence of strongly bound cross-bridgest2 ms time constant of force decline due to the extra friction between actin and myosin resulting from the presence of
cross-bridges.tc ms time constant controlling the rise and decay of CN
ti ms time of the ith stimulationtp ms time of the pth data pointGnf — Objective function for identifying force-model parameter values for non-fatigued musclesGfat — Objective function for identifying force-model parameter values for fatigued musclesFpred N Predicted forces using Eqs. (1) and (2)Fexp N Experimental forces
Fatigue modelaA ms–2 coefficient for force-model parameter A in the fatigue modelaKm
ms–1N–1 coefficient for K1m andK2
m in the fatigue modelat1 N–1 coefficient for force-model parameter tc in the fatigue modelK1
m,K2m — mathematical split of force-model parameter Km
tfat s time constant controlling the recovery of the three force-model parameters (A, R0, tc) during fatiguetKm
s time constant controlling the recovery of K1m during fatigue
tp ms time of the pth data pointtq ms time of the qth set of force model parameter valuesG — objective function for identifying fatigue-model parameter valuesj j = 1, 2, and 3 for A, Km, and t1Ppred
j jth force-model parameter values predicted by using Eqs. (5)–(9)Pcalc
j jth force-model parameter values calculated by using Eqs. (1)–(2)
ject. Parameter t1 can be calculated directly using theexperimental force decay at the end of the forceresponses, as described previously [38]. The remainingthree parameters can be identified by fitting the modelto the forces using the objective function Gnf for non-fatigued muscles as follows:
Gnf(A,Km,t2) � �p
(Fpred(tp;A,Km,t2)�Fexp(tp))2. (3)
Fpred, a function of parameters A, Km, and t2, representsthe force predicted by Eqs. (1) and (2) at time tp; Fexp
represents the experimental force at time tp; p is the num-ber of force data points. Objective function Gnf is minim-ized using a C code for Feasible Sequential QuadraticProgramming (CFSQP) [29], which identifies the opti-mum values for the free variables numerically.
For fatigued muscles, a previous study [20] showedthat parameter t2 could be fixed at its non-fatigued value.Thus, there are only three free parameters for fatiguedmuscles. Parameter t1 is identified as described above.Parameters A and Km are identified from fitting the modelto the forces using the objective function Gfat for fatiguedmuscles as follows:
Gfat(A,Km) � �p
(Fpred(tp;A,Km)�Fexp(tp))2. (4)
Objective function Gfat is also minimized usingCFSQP [29].
We previously used force responses to the combi-nation of a 50-Hz and a 12.5-Hz VFT to parametrize theforce model [19]. Because of the modifications made tothe model, the best parametrizing train or train combi-nation was re-identified using our previous data set. Wefound that the force model produced the best predictionsfor both non-fatigued and fatigued muscles when themodel was parameterized using force responses to thecombination of a 1 s, 50-Hz CFT (50CFT) and a 1 s,12.5-Hz VFT (12.5VFT). Thus, the parameterizing trainsfor our force model were changed slightly to the combi-nation of the 50CFT and 12.5VFT (versus the previouslyused 50-Hz and 12.5-Hz VFTs).
3.2. Data collection
Each of the six subjects recruited for this phase par-ticipated in seven testing sessions. The order of the test-

579J. Ding et al. / Journal of Electromyography and Kinesiology 13 (2003) 575–588
ing sessions was randomized for each subject. The test-ing portion of each session began by first potentiatingthe muscle with 35, 12-pulse, 14-Hz CFTs with one traindelivered every 5 s. We previously showed that this pro-cedure highly potentiated the muscle without causing ameasurable decline in forces [6]. Five seconds after thepotentiation trains, a 20-pulse 50-Hz CFT followed by5 s of rest and then a 14-pulse 12.5-Hz VFT were deliv-ered to the muscle. These two trains were used to estab-lish the initial, non-fatigue force-model parameter valuesfor the fatigue model. Five seconds after the 12.5-HzVFT, the fatigue protocol was begun. Each train in thefatigue protocol was separated from the next train by1000 ms. One fatigue protocol alternated between the50CFT and the 12.5VFT (50CFT-12.5VFT) to fatiguethe muscle (120 trains in total). We hypothesized thatthis protocol, which contained 60 pairs of the two trainsneeded to parametrize the force model, could best para-meterize the fatigue model because our previous studyusing six-pulse stimulation trains showed that the proto-col that contained the force-model parameterizing trainswas best to parameterize the fatigue model [18,20,21].Each of the other six fatigue protocols contained 10cycles of trains; each cycle contained 13 fatigue-produc-ing trains followed by the 50CFT and 12.5VFT pair, giv-ing a total of 150 trains. For these six fatigue protocols,the fatigue-producing trains were CFTs with either a 1s or a 0.5 s train duration and frequencies of 20-, 33-,or 40-Hz (1-s 20CFT, 33CFT, 40CFT, and 0.5-s 20CFT,33CFT, 40CFT, respectively). The pairs of 50CFT and12.5VFT included in these six fatigue protocols wereused to monitor changes in the force model parameterswith time. Each testing session used only one fatigueprotocol.
3.3. Fatigue model
Similar to our previous approach to modeling short-term fatigue [18,20,21], the fatigue model monitors thechanges in the force-model parameter values (A, Km andt1) using differential equations
dAdt
� �A�Arest
tfat
� aAF (5)
Km � K1m � K2
m (6)
with
dK1m
dt� �
K1m�K1
m,rest
tKm
�aKmF (7)
and
dK2m
dt� �
K2m�K2
m,rest
tfat
� aKmF (8)
dt1dt
� �t1�t1,rest
tfat
� at1F. (9)
In the fatigue model we assumed that the instantaneousforce (F) was the driving function for fatigue and onetime constant (tfat) controlled the recovery of A and t1.For force-model parameter Km, two differential equa-tions with two distinct time constants, tfat and tKm
, wereused to capture its more complicated fatigue dynamics.aA (ms–2), aKm
(ms–1N–1), at1 (N–1) are force-drivingcoefficients for force-model parameters A, Km and t1,respectively, while Arest, K1
m,rest, K2m,rest, and tc rest are the
values when muscles were not fatigued. In our previousapproach to modeling short-term fatigue, Eqs. (5)–(9)were fit to experimental forces produced by each subjectin response to 60 pairs of 50-Hz CFTs and 12.5 Hz VFTsto identify parameters aA, aKm
, at1. However, once thefatigue model was parameterized, forces predicted byEqs. (1) and (2) were used to drive the fatigue model.
To test our hypothesis that the fatigue protocol thatcontained 60 pairs of the 50-Hz CFT and 12.5-Hz VFTcould best parameterize the fatigue protocol, the fatiguemodel was parameterized separately using forces pro-duced by each of the seven fatigue protocols taken fromthe development phase of data collection. The para-meterization of the fatigue model started by calculatingthe sets of force-model parameter values using the forceresponses to the combination of 50-Hz CFT and 12.5-Hz VFT before and during the fatigue protocols. Theforce responses to the 50-Hz CFT and 12.5-Hz VFT pairprior to the delivery of the fatigue protocol were used tocalculate the initial, non-fatigued force model parametervalues as described above using Eqs. (1)–(3). To identifythe force model parameter values during fatigue, Eqs.(1), (2) and (4) were used by fitting the model to theforce responses to the 50-Hz CFT and 12.5-Hz VFTpairs during the fatigue protocol. Thus, there were 61sets of parameters (A, Km, t1) for the 50CFT–12.5VFTfatigue protocol, and 11 for each of the other sixfatigue protocols.
To parameterize the fatigue model, the objective func-tion
G � �3
j � 1
�q
�1�Ppred
j (tq;tfat,tKm,aj,F(tq)
Pcalcj (tq)
�2
(10)
was used to allow unbiased, concurrent evaluation of allthree force-model parameters. Symbol q designates thenumber of the set of force model parameter values,which ranges from 1 to 61 for the fatigue protocol thatcontained only the 50-Hz CFT and the 12.5-Hz VFT andfrom 1 to 11 for the other protocols; tq is 0 ms for thefirst set of force model parameter values and 1500 msafter the start of the pair of the 50-Hz CFT and 12.5-HzVFT, which is the midpoint between the start of the 50-Hz CFT and the end of the 12.5-Hz VFT; Ppred
j is thejth parameter value (j = 1, 2, and 3 for A, Km, and t1,respectively) predicted by Eqs. (5)–(9) at time tq, and isa function of tfat,tKm
, the corresponding aj, and F(tq) (the
580 J. Ding et al. / Journal of Electromyography and Kinesiology 13 (2003) 575–588
experimental forces at times tq). Pcalcj (tq) is the jth para-
meter value at time tq calculated as described aboveusing Eq. (4). This objective function was minimizedusing CFSQP [29].
For each subject, the fatigue model was parameterizedseparately using the forces from each of the sevenfatigue protocols, resulting in seven sets of fatigue-model parameter values. Next, for each set of fatigue-model parameter values, given the stimulation sequenceof the fatigue protocols and initial non-fatigued force-model parameter values, the forces produced in responseto each train in the 1-s 20CFT, 33CFT, and 40CFT, and0.5-s 20CFT, 33CFT, and 40CFT fatigue protocols werepredicted using the force and fatigue models to inte-grate forward.
3.4. Results of the development phase
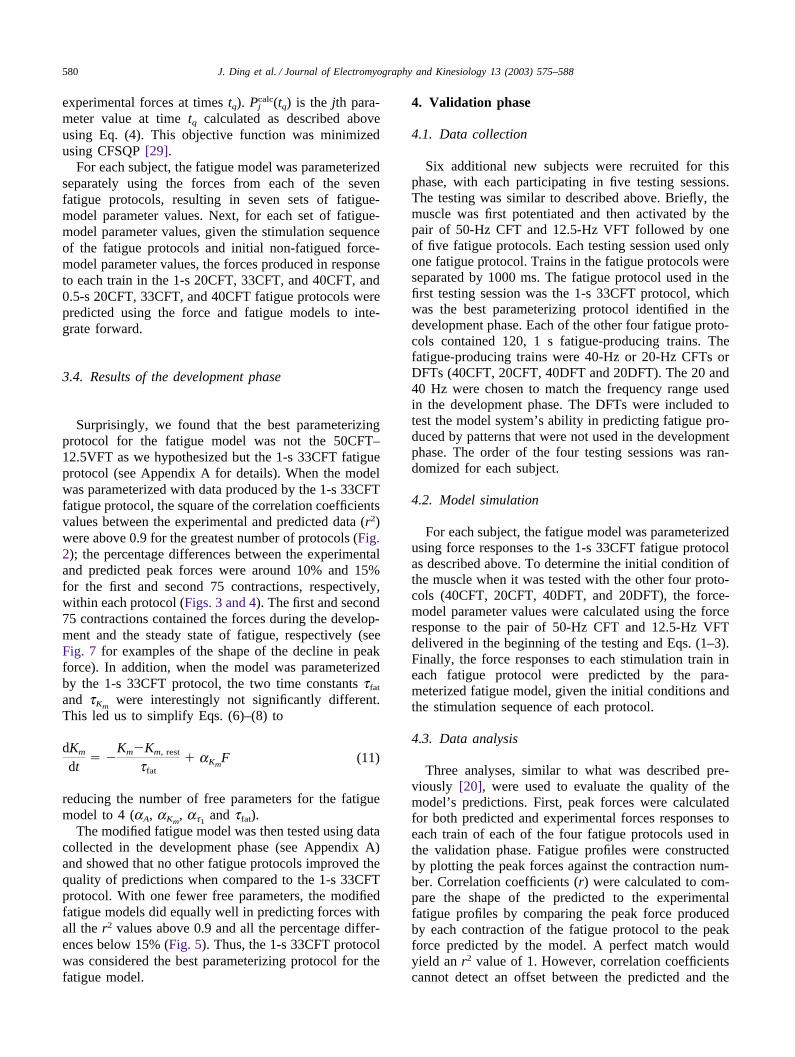
Surprisingly, we found that the best parameterizingprotocol for the fatigue model was not the 50CFT–12.5VFT as we hypothesized but the 1-s 33CFT fatigueprotocol (see Appendix A for details). When the modelwas parameterized with data produced by the 1-s 33CFTfatigue protocol, the square of the correlation coefficientsvalues between the experimental and predicted data (r2)were above 0.9 for the greatest number of protocols (Fig.2); the percentage differences between the experimentaland predicted peak forces were around 10% and 15%for the first and second 75 contractions, respectively,within each protocol (Figs. 3 and 4). The first and second75 contractions contained the forces during the develop-ment and the steady state of fatigue, respectively (seeFig. 7 for examples of the shape of the decline in peakforce). In addition, when the model was parameterizedby the 1-s 33CFT protocol, the two time constants tfat
and tKmwere interestingly not significantly different.
This led us to simplify Eqs. (6)–(8) to
dKm
dt� �
Km�Km, rest
tfat� aKm
F (11)
reducing the number of free parameters for the fatiguemodel to 4 (aA, aKm
, at1 and tfat).The modified fatigue model was then tested using data
collected in the development phase (see Appendix A)and showed that no other fatigue protocols improved thequality of predictions when compared to the 1-s 33CFTprotocol. With one fewer free parameters, the modifiedfatigue models did equally well in predicting forces withall the r2 values above 0.9 and all the percentage differ-ences below 15% (Fig. 5). Thus, the 1-s 33CFT protocolwas considered the best parameterizing protocol for thefatigue model.
4. Validation phase
4.1. Data collection
Six additional new subjects were recruited for thisphase, with each participating in five testing sessions.The testing was similar to described above. Briefly, themuscle was first potentiated and then activated by thepair of 50-Hz CFT and 12.5-Hz VFT followed by oneof five fatigue protocols. Each testing session used onlyone fatigue protocol. Trains in the fatigue protocols wereseparated by 1000 ms. The fatigue protocol used in thefirst testing session was the 1-s 33CFT protocol, whichwas the best parameterizing protocol identified in thedevelopment phase. Each of the other four fatigue proto-cols contained 120, 1 s fatigue-producing trains. Thefatigue-producing trains were 40-Hz or 20-Hz CFTs orDFTs (40CFT, 20CFT, 40DFT and 20DFT). The 20 and40 Hz were chosen to match the frequency range usedin the development phase. The DFTs were included totest the model system’s ability in predicting fatigue pro-duced by patterns that were not used in the developmentphase. The order of the four testing sessions was ran-domized for each subject.
4.2. Model simulation
For each subject, the fatigue model was parameterizedusing force responses to the 1-s 33CFT fatigue protocolas described above. To determine the initial condition ofthe muscle when it was tested with the other four proto-cols (40CFT, 20CFT, 40DFT, and 20DFT), the force-model parameter values were calculated using the forceresponse to the pair of 50-Hz CFT and 12.5-Hz VFTdelivered in the beginning of the testing and Eqs. (1–3).Finally, the force responses to each stimulation train ineach fatigue protocol were predicted by the para-meterized fatigue model, given the initial conditions andthe stimulation sequence of each protocol.
4.3. Data analysis
Three analyses, similar to what was described pre-viously [20], were used to evaluate the quality of themodel’s predictions. First, peak forces were calculatedfor both predicted and experimental forces responses toeach train of each of the four fatigue protocols used inthe validation phase. Fatigue profiles were constructedby plotting the peak forces against the contraction num-ber. Correlation coefficients (r) were calculated to com-pare the shape of the predicted to the experimentalfatigue profiles by comparing the peak force producedby each contraction of the fatigue protocol to the peakforce predicted by the model. A perfect match wouldyield an r2 value of 1. However, correlation coefficientscannot detect an offset between the predicted and the

581J. Ding et al. / Journal of Electromyography and Kinesiology 13 (2003) 575–588
Fig. 2. Group (n = 6) r2 values (means±SE) between experimental and predicted peak forces in response to each train for each testing protocolwhen the fatigue model was parameterized with force responses to 1-s 20CFT, 0.5-s 20CFT, 1-s 33CFT, 0.5-s 33CFT, 1-s 40CFT, 0.5-s 40CFT,and 50CFT–12.5VFT protocols (A–G, respectively). Arrows point to the model’s predictions for the fatigue protocol that was used to parameterizethe model. Symbols a–f represent the 1-s 20CFT, 0.5-s 20CFT, 1-s 33CFT, 0.5-s 33CFT, 1-s 40CFT, and 0.5-s 40CFT fatigue protocols, respectively.Data were taken from subjects in the development phase.
experimental fatigue profiles. Thus, percentage differ-ences between the experimental and predicted peakforces were calculated for the last contraction of eachfatigue protocol by normalizing the absolute differencebetween the experimental and predicted peak forces tothe experimental peak force. Finally, fatigue indiceswere calculated for each fatigue protocol for each subjectby subtracting the peak force of the last contraction fromthe peak force of the first contraction and then dividingthe difference by the peak force of the first contraction.The greater the fatigue index, the greater the decline inforce and the greater the muscle fatigue. A three-way,repeated measures ANOVA was used to compare thefrequency effect (20 Hz versus 40 Hz), train patterneffect (CFT versus DFT), and model effect(experimental versus predicted) on the fatigue index.Comparison was considered significant if p�0.05.
The best-fitted values of the three force-driving coef-ficients (aA, aKm
, and at1) of the fatigue model were eachcompared between subjects to explore the possibility offixing one or more at a constant value. First, the meanand standard deviation (SD) were calculated for each ofthe three force-driving coefficients. Next, regressionanalysis was used to examine the correlation among the
three coefficients. A strong correlation would have r2
values above 0.80.
5. Results
Predicted and experimental data from a typical subjectin the validation group are shown in Figs. 6 and 7. Thefatigue model was first parameterized by fitting the cal-culated force-model parameters (Fig. 6A–C). Then,given the initial force-model parameter values and thefatigue protocol, the model predicted well the forcesthroughout the whole testing (e.g. Fig. 6D–6F). The pre-dicted peak forces matched the experimental peak forceswell for each stimulation train in all four fatigue proto-cols tested (Fig. 7). The grouped r2 values suggested thatthe model accounted for �90% of the variance in theexperimental fatigue produced by each of the four testingprotocols (Fig. 8A). When muscles were fatigued by thetwo 20-Hz protocols the predicted peak forces were�10% different from the experimental peak forces bythe end of fatigue protocol (Fig. 8B). When muscleswere fatigued by 40-Hz trains, the predicted peak forceswere ca 15% different from the experimental peakforces.

582 J. Ding et al. / Journal of Electromyography and Kinesiology 13 (2003) 575–588
Fig. 3. Group (n = 6) percentage differences (means±SE) between experimental and predicted peak forces for the first 75 contractions in eachprotocol when the fatigue model was parameterized with force responses to 1-s 20CFT, 0.5-s 20CFT, 1-s 33CFT, 0.5-s 33CFT, 1-s 40CFT, 0.5-s 40CFT, and 50CFT–12.5VFT fatigue protocols (A–G, respectively). Arrows point to the percentage differences of the protocol that was used toparametrize the model. Symbols a–f represent the 1-s 20CFT, 0.5-s 20CFT, 1-s 33CFT, 0.5-s 33CFT, 1-s 40CFT, and 0.5-s 40CFT fatigue protocols,respectively. Data were taken from subjects in the development phase.
The three-way, repeated measure ANOVA for thefatigue indices (Fig. 8C) showed no interaction effectamong frequency (20 versus 40 Hz), pulse pattern (CFTversus DFT), and model effect (experimental versuspredicted). In addition, the ANOVA only showed a maineffect for frequency (p�0.01), suggesting that the mus-cle fatigued significantly more when activated by the 40Hz protocols than by the 20 Hz protocols. The lack ofa main effect for pulse pattern suggested that the pulsepattern did not affect the amount of decline in force if thestimulation frequency (20 or 40 Hz) and train duration (1s) were the same. Similarly the lack of main effect forthe model effect suggested that the predicted fatigueindices were not statistically different from the experi-mental fatigue indices.
For the three force-driving coefficients of the fatiguemodel, the means (±SD) were –3.9×10⁻⁷ ( ± 2.4 ×10⁻⁷) ms–2, 4.0×10⁻⁸ (±3.4×10⁻⁸) ms–1N–1, and 7.3×10⁻⁶
(±8.8×10⁻⁶) N–1 for aA, aKm, and at1, respectively.
Regression analysis yielded r2 values of 0.10, 0.37, and0.01 for correlations between aA and aKm
, between aA
and at1, and between aKmand at1, respectively, showing
weak correlation among the three parameters.
6. Discussion
A mathematical model system for predicting short-term muscle fatigue was presented. For human quadri-ceps femoris muscles, the nine subject-specific para-meters of the model system can be quickly identifiedusing a simple test (1-s 33CFT protocol). Our resultsshowed that the parameterized system accurately pre-dicted the fatigue produced by repetitively activating themuscles with stimulation trains of frequencies rangingfrom 20 to 40 Hz, train durations ranging from 0.5 to 1 s,and CFT and DFT pulse patterns. The system predictedsuccessfully the fatigued forces with less than 10% errorfor the 20-Hz protocols and �15% error for the 40-Hzprotocols (Fig. 8B). Finally, no significant differencewas observed between the predicted and the experi-mental fatigue indices for all the protocols (Fig. 8C).Because the data for each fatigue protocol were collectedat least 48 h apart, the data collection spread over asmuch as a 7-week period. Thus, the parameterized modelsystem was sufficiently robust to capture the muscle’contractile and short-term fatigue characteristics over anextended period of time and the characteristics appear

583J. Ding et al. / Journal of Electromyography and Kinesiology 13 (2003) 575–588
Fig. 4. Group (n = 6) percentage differences (means±SE) between experimental and predicted peak forces for the second 75 contractions in eachprotocol when the fatigue model was parameterized with force responses to 1-s 20CFT, 0.5-s 20CFT, 1-s 33CFT, 0.5-s 33CFT, 1-s 40CFT, 0.5-s 40CFT, and 50CFT–12.5VFT fatigue protocols (A–G, respectively). Arrows point to the percentage differences of the protocol that was used toparametrize the model. Symbols a–f represent the 1-s 20CFT, 0.5-s 20CFT, 1-s 33CFT, 0.5-s 33CFT, 1-s 40CFT, and 0.5-s 40CFT fatigue protocols,respectively. Data were taken from subjects in the development phase.
invariant. This contention is also supported by one ofour previous studies that showed good predictive abilityover a 6-month time period [20, 21].
Unlike the force model in our previously publishedmodel system [20,21], in the current force model weestablished a linear relationship between parameter R0
and Km (R0 = Km + 1.04). Because our force model isa simplified representation of the generation of muscleforce upon stimulation, each parameter may account formore than one specific physiological element duringforce generation. Parameter Km accounts for the calciumsensitivity of the sigmoid-shaped force–calcium relation-ship and is contributed to by the sensitivity of troponinor the cross-bridges to calcium. The smaller the Km
value, the more sensitive the force is to calcium. Para-meter R0 accounts for the experimental observation byDuchateau and Hainaut that calcium release from thesarcoplasmic reticulum increased when muscles werestimulated with doublets [22]. Increased calcium releasetogether with increased stiffness have been consideredtwo major mechanisms behind the more than linear sum-mation in force by doublets over twitches [9]. The largerthe R0 value, the greater the nonlinear summation indoublet force. The linear relationship between R0 and Km
was identified using data collected from human quadri-
ceps femoris muscles of healthy subjects when themuscles were non-fatigued or in the steady state offatigue. Thus, the generalizability of this relationshipneeds to be investigated before applying it to other mus-cle groups, different subject populations, or physiologi-cal conditions different than this study.
However, there seems to be physiological merit to theR0–Km relationship. It can be examined from threephysiological aspects: muscle fatigue, muscle length,and fiber type.
1. When muscles become fatigued, Westerblad andAllen showed reduced calcium sensitivity [37], whichsupports the greater Km value during fatigue that weobserved (Fig. 6B). Similarly, greater doublet-to-twitch ratio was observed for fatigued versus non-fatigued whole quadriceps femoris muscles [9], sug-gesting greater R0 value. Thus, parameters Km and R0
both increase with fatigue in a similar manner, sup-porting the linear relationship we identified.
2. Studies from our laboratory showed augmentation bydoublets from non-fatigued human quadriceps fem-oris muscles at 15o [30] but not at 90o knee flexionangle [9]. Additionally, greater calcium sensitivity hasbeen observed for muscles held at longer length [35].
584 J. Ding et al. / Journal of Electromyography and Kinesiology 13 (2003) 575–588
Fig. 5. Comparisons in group (n = 6) r2 values (A), percentage differ-ences between experimental and predicted peak forces for the first (B)and second (C) 75 contractions in each protocol when the fatiguemodel was parameterized by the 1-s 33CFT protocol between the pre-vious model (open bars) and the modified model (filled bars) system.Symbols a to f represent the 1-s 20CFT, 0.5-s 20CFT, 1-s 33CFT, 0.5-s 33CFT, 1-s 40CFT, and 0.5-s 40CFT protocols, respectively. Datawere taken from subjects in the development phase.
Thus, parameters Km and R0 both increased if muscleswere shortened.
3. Burke and colleagues observed much greater aug-mentation by doublet force in type S units than intype F units [13]. Bottinelli and colleagues showed arightward shift of the force–pCa curve for slow mus-cle fibers [12]. Thus, both parameter R0 and Km arelarger for slow muscle fibers than for fast muscle fib-ers. In conclusion, we believe that theoretically the
R0�Km relationship may apply to a wide range ofphysiological conditions. However, testings need tobe done before incorporating this relationship into themodel for muscle conditions other than the one testedin this study.
The values of the three force-driving coefficients inthe fatigue model, aA, aKm
, and at1, characterize theeffect of short-term fatigue on the force-model para-meters A, Km and t1, respectively and represent thefatigue characteristics for each person. The best-fittedaA, aKm
, and at1values were taken from the six subjectsin the validation group and means and standard devi-ations were calculated for each one. Large standard devi-ations were observed, ranging from 63% to 121% oftheir means, suggesting great variance among subjects’fatigue characteristics. In addition, regression analysisidentified no correlation between any two of the threecoefficients. The lack of correlation suggests that for thesame individual the fatigue impact on the muscle’s con-tractile property (characterized by A, Km and t1 duringfatigue) varies substantially. These results further sup-port the concept that fatigue is a complicated physiologi-cal phenomenon.
The model system presented in this paper consists ofa force model combined with a fatigue model. The forcemodel has only 6 free parameters and the fatigue modelhas only four free parameters. For human quadricepsmuscles, nine out of the ten free parameters of the modelsystem are subject specific (parameter tc can be fixed at20 ms) and can be identified using data collected froma simple testing protocol (1-s 33CFT fatigue protocol).The predictive ability and structural simplicity make ourmodel favorable for applications in FES. The ideal FEScontrol system requires both a feedforward model, whichdesigns the stimulation scheme for a given task, and afeedback control, which corrects for error by informingthe feedforward model to modify the stimulation scheme[11]. The feedforward model needs to be as simple aspossible to allow rapid parameter identification for eachpatient, fast optimization analysis of the system to ident-ify the optimal stimulation scheme, and accurate predic-tive ability of the system [2,11]. Two types of physi-ology-based mathematical models have been used as atool to help to explore the muscular-skeletal system sinceHill’s pioneering work [27]: structural models orphenomenological models. Structural models evolvedfrom Huxley’s early cross-bridge models [28] and arebased primarily on muscle biophysical and biochemicalmechanisms of muscle contraction at the molecular level[36,40]. This type of model can shed light on possiblemechanisms behind physiological processes [2], but aregenerally too complicated to be incorporated into FEScontrol systems [39]. Phenomenological models are alsocalled Hill-type models and use a motor, damper andspring to represent the contractile, viscous, and elastic

585J. Ding et al. / Journal of Electromyography and Kinesiology 13 (2003) 575–588
Fig. 6. Examples of predicted forces to the 1-s 30CFT fatigue protocol when the fatigue model was parameterized by the same 1-s 33CFT protocoldata for a typical subject in the validation phase. Force model parameter values were calculated (individual data points in A–C), and then fatiguemodel parameter values were identified (see values for aA, aKm and at1 in A–C). The tfat for this subject was 127 s. After the fatigue model wasparameterized, force model parameter values (solid lines in A–C) and forces (D)–(F) were predicted, given only the initial force model parametervalues (Arest = 3.009, Km , rest = 0.103, t1,rest = 50.957) and the fatigue protocol (1-s 33CFT).
Fig. 7. Experimental and predicted peak forces for a typical subject from the validation phase (same subject as in Fig. 6). The fatigue model wasparameterized using data collected when the muscle was fatigued by the 1-s 33CFT fatigue protocol (Fig. 1). The peak forces produced in responseto each train in the 20CFT (A), 20DFT (B) 40CFT (C), and 40DFT (D) fatigue protocols were plotted. Correlation coefficients (r2) were calculatedto compare the predictions to the experimental data.

586 J. Ding et al. / Journal of Electromyography and Kinesiology 13 (2003) 575–588
Fig. 8. Comparisons in group (n = 6) r2 values (means±SE) (A), per-centage differences (mean±SE) between experimental and predictedpeak forces produced at the end of the fatigue protocol (B), and fatigueindices (mean±standard error) (C) for each fatigue protocol. Data weretaken from subjects in the validation phase. ∗Significant difference wasobserved in fatigue indices produced by the 20-Hz and 40-Hz trains(p � 0.01).
elements of the muscle, respectively [23,38]. This typeof model relies more on the experimental observations ofinput–output relationship, such as force–frequency andforce–velocity relationships, and can be less sophisti-cated than the structural models by only taking into con-sideration the physiological processes that are relevantto the task [2]. Thus, phenomenological models, such asthe one presented in this study (Eqs. (1) and (2)), havegreat potential in designing stimulation patterns for FEScontrol systems. A valuable feature of our force modelis that it predicts force responses to a wide range ofstimulation patterns [17,19,38].
In addition, one of the obstacles for a good feedfor-ward model in FES is muscle fatigue. Previous modelsdeveloped in other laboratories used either myoelectric[14,31] or metabolic measurements [24,32] as fatigueindices added to muscle force models. These models arenot able to predict force responses to a variety of acti-vation frequencies during fatigue. Our fatigue model is
unique in that it uses the instantaneous force as the driv-ing function for fatigue to vary the force model para-meter values (Eqs. (5), (9) and (11)) [18,20–21] and pre-dicts forces during repetitive activation of the muscle.
Thus, the model system presented in this paper, withthe ability to predict force responses to a wide range ofstimulation patterns under various physiological con-ditions, can be integrated into a FES control system asa feedforward model to design stimulation schemes fortasks such as standing, maintaining posture, or holdinga cup. The simplicity of our model system also allowsquick adjustment in the stimulation schemes by usingthe information from the feedback control. We envisionthat the incorporation of this model system into a FESsystem would improve the performance of FES.
Acknowledgements
This work was supported by National Institute ofHealth Grant no. HD-36797. The authors would like tothank Mr Wayne Scott for reviewing a draft of thismanuscript.
Appendix A: Analysis and results of developmentphase
The quality of the predictions was compared acrossprotocols to evaluate which protocol could best identifythe fatigue-model parameter values. Peak forces werecalculated for each train in each of the fatigue protocolsfor both experimental data and predictions by the model.Two objective evaluations were used to compare the pre-dicted to the experimental peak forces throughout thefatigue testings. First, fatigue profiles were constructedby plotting the peak forces against the correspondingcontraction numbers. Correlation coefficients (r) werecalculated to compare the similarity in the shapesbetween experimental and predicted fatigue profiles. Anr2 of 1 suggests a perfect match. Regardless of what pro-tocol was used to parametrize the model, the predictedfatigue profiles could account for �70% of the variancein the experimental fatigue profiles for all the protocolstested (Fig. 2). However, only when the model was para-meterized with data produced by the 1-s 33CFT fatigueprotocol were the r2 values above 0.9 for the greatestnumber of protocols (Fig. 2C). Next, the peak forceswere calculated for each train in each protocol for bothexperimental and predicted data. Percentage differenceswere calculated by normalizing the absolute differencebetween the predicted and the experimental peak forceto the experimental peak force for each train. This evalu-ation was included because r2 is not sensitive to an offsetbetween the predicted and experimental fatigue profiles.Then, for each protocol, the percentage differences were

587J. Ding et al. / Journal of Electromyography and Kinesiology 13 (2003) 575–588
averaged for the first half of the protocol (75 contraction)to evaluate the accuracy of the model in predicting theforces during the development of fatigue (see Fig. 7 forexamples of the shape of the decline in peak force).Similarly, the percentage differences for the second halfof the protocol (75 contractions) to evaluate the accuracyof the model in predicting the forces at the steady stateof the fatigue. When forces were declining due to fatiguethe model was able to predict the force responses to thestimulation protocol that was used to parametrize themodel very well with percentage differences between theexperimental and predicted peak forces all below 10%(bars with arrows in Fig. 3). However, when the para-meterized model was used to predict forces produced byother protocols, greater errors were seen (Fig. 3A, B, Dand E). Only when the model was parameterized by the1-s 33CFT protocol was the model able to predict forcesto other protocols with around 10% errors (Fig. 3C).When muscles reached a steady state fatigue, the modelsparameterized by 1-s 33CFT, 0.5-s 40CFT and 50CFT–12.5VFT protocols predicted similarly well (Fig. 4C, Fand G). Thus, the 1-s 33CFT fatigue protocol was con-sidered the best parametrizing protocol for the fatiguemodel.
Interestingly, we noticed that time-constants tfat andtKm
were very similar in values. A paired t-test was usedto compare them and found no significant difference(p = 0.35). Thus we simplified Eqs. (6)–(8) to Eq. (11).
The modified fatigue model (i.e. Eqs. (5), (9) and (11))was re-tested using the data collected in the developmentphase. First, the best parametrizing train was re-exam-ined by comparing the quality of the predictions of themodel when it was parameterized by the 1-s 33CFT pro-tocol to those when the model was parameterized byother protocols. We found no improvement in the accu-racy of the predictions when the model was para-meterized by other protocols. Thus, the 1-s 33CFT wasstill the best parametrizing protocol. With one fewer freeparameter, the modified fatigue models did equally wellin predicting forces with all the r2 values above 0.9 andall the percentage differences below 15% (Fig. 5). We,therefore, consider the modification successful.
References
[1] B.J. Andrews, R.H. Baxendale, R. Barnett, G.F. Phillips, T. Tam-azaki, J.P. Paul, P.A. Freeman, Hybrid FES orthosis incorporatingclosed-loop control and sensory feedback, J Biomed Eng 10(1988) 189–195.
[2] J.J. Abbas, R. Riener, Using Mathematical models and advancedcontrol systems techniques to enhance neuroprosthesis function,Neuromodulation 4 (2001) 187–195.
[3] L. Bevan, Y. Laouris, R.M. Reinking, D.G. Stuart, The effect ofthe stimulation pattern on the fatigue of single motor units inadult cats, J Physiol 449 (1992) 85–108.
[4] B.D. Bigland-Ritchie, A. Jones, J.J. Woods, Excitation frequency
and muscle fatigue: Electrical responses during human voluntaryand stimulated contractions, Exp Neurol 64 (1979) 414–427.
[5] S.A. Binder-Macleod, C.B. Barker, Use of catchlike propery ofhuman skeletal muscle to reduce fatigue, Muscle Nerve 14 (1991)850–857.
[6] S.A. Binder-Macleod, C.J. Dean, J. Ding, Electrical stimulationfactors in potentiation of human quadriceps muscles, MuscleNerve 1 (2002) 1–20.
[7] S.A. Binder-Macleod, J. Ding, B.C. Mandigma, A.S. Wexler, Useof a mathematical model to identify optimal activation patternsfor skeletal muscle during cardiomyoplasty, Basic Appl Myol 9(3) (1999) 117–125.
[8] S.A. Binder-Macleod, E.E. Halden, K.A. Jungles, Effects ofstimulation intensity on the physiological responses of humanmotor units, Med Sci Sports Exerc 27 (4) (1995) 556–565.
[9] S.A. Binder-Macleod, S.C.K. Lee, D.W. Russ, L.J. Kucharski,New look at force–frequency relationship of human skeletal mus-cle: effects of fatigue, J Neurophysiol 79 (1998) 1858–1868.
[10] S.A. Binder-Macleod, W.B. Scott, Comparison of fatigue pro-duced by various electrical stimulation trains, Acta Physiol Scand172 (2001) 195–203.
[11] J.C. Bobet, Can muscle model improve FES-assisted walkingafter spinal cord injury?, J Electromyogr Kinesiol 9 (1998)125–132.
[12] R. Bottinelli, M.A. Pellegrina, M. Canepari, R. Rossi, C. Reggi-ani, Specific contributions of various muscle fibre types to humanmuscle performance: an in vitro study, J Electromyogr Kinesiol9 (1999) 87–95.
[13] R.E. Burke, P. Rudomin, F.E. Zajac, The effect of activation his-tory on tension production by individual muscle units, Brain Res109 (1976) 515–529.
[14] N.C. Chesler, W.K. Durfee, Surface EMG as a fatigue indicatorduring FES-induced isometric muscle contractions, J Electromy-ogr Kinesiol 7 (1) (1997) 27–37.
[15] J. Ding, S.A. Binder-Macleod, A.S. Wexler, Two-step, predictive,isometric force model tested on data from human and rat muscles,J Appl Physiol 85 (6) (1998) 2176–2189.
[16] J. Ding, J. Storaska, S.A. Binder-Macleod, Effect of potentiationon the catchlike property of human skeletal muscles, Muscle &Nerve 27 (3) (2003) 312–319.
[17] J. Ding, A.S. Wexler, S.A. Binder-Macleod, Development of amathematical model that predicts optimal muscle activation pat-terns by using brief trains, J Appl Physiol 88 (2000) 917–925.
[18] J. Ding, A.S. Wexler, S.A. Binder-Macleod, A predictive modelof fatigue in human skeletal muscles, J Appl Physiol 89 (2000)1322–1332.
[19] J. Ding, A.S. Wexler, S.A. Binder-Macleod, A mathematicalmodel that predicts the force–frequency relationship of humanskeletal muscle, Muscle & Nerve 1 (2002) 1–20.
[20] J. Ding, A.S. Wexler, S.A. Binder-Macleod, A predictive fatiguemodel. I: Predicting the effect of stimulation frequency and pat-tern on fatigue, IEEE Trans Rehab Eng 10 (1) (2002) 48–58.
[21] J. Ding, A.S. Wexler, S.A. Binder-Macleod, A predictive fatiguemodel. II: Predicting the effect of resting times on fatigue, IEEETrans Rehab Eng 10 (1) (2002) 59–67.
[22] J. Duchateau, K. Hainaut, Nonlinear summation of contractionsin striated muscle. II. Potentiation of intracellular Ca2+ move-ments in single barnacle muscle fibers, J Muscle Cell Motil 7(1986) 18–24.
[23] W.K. Durfee, K.I. Palmer, Estimation of force–activation, force–length, and force–velocity properties in isolated, electricallystimulated muscle, IEEE Trans Biomed Eng 41 (3) (1994)205–216.
[24] Y. Giat, J. Mizrahi, M. Levy, A model of fatigue and recoveryin paraplegic’s quadriceps muscle subjected to intermittent FES,J Biomech Eng 118 (1996) 357–366.
[25] Kebaetse MB, Binder-Macleod SA. Strategies for delaying mus-
588 J. Ding et al. / Journal of Electromyography and Kinesiology 13 (2003) 575–588
cle failure during repetitive dynamic performance of human skel-etal muscle. Proc 7th Ann Conf IFES Soc 2002; p. 100–102.
[26] M.B. Kebaetse, S.C.K. Lee, S.A. Binder-Macleod, A novel stimu-lation pattern improves performance during repetitive dynamiccontractions, Muscle Nerve 24 (2001) 744–752.
[27] A.V. Hill, Heat and shortening and the dynamic constants of mus-cle, Prog Biophys Chem 126 (1938) 136–195.
[28] A.F. Huxley, Muscle structure and theories of contraction, ProgBiophys Biophys Chem 7 (1957) 257–318.
[29] G. Lawrence, J.L. Zhou, A.L. Tits, CFSQP, University of Mary-land, College Park, MD, 1997.
[30] S.C.K. Lee, M.L. Gerdom, S.A. Binder-Macleod, Effects oflength on the catchlike property of human quadriceps femorismuscle, Phys Ther 79 (8) (1999) 738–748.
[31] J. Mizrahi, O. Levin, A. Aviram, E. Isakov, Z. Susak, Musclefatigue in interrupted stimulation: effect of partial recovery onforce and EMG dynamics, J Electromyogr Kinesiol 7 (1997)51–65.
[32] J. Mizrahi, D. Seelenfreund, E. Isakov, Z. Susak, Predicted andmeasured muscle forces after recoveries of differing durationsfollowing fatigue in functional electrical stimulation, Artif Org21 (3) (1997) 236–239.
[33] A.J. Robinson, Neuromuscular electrical stimulation for controlof posture and movement, in: A.J. Robinson, L. Snyder-Mackler(Eds.), Clinical Electrophysiology, 2nd ed, Williams & Wilkins,Baltimore, 1995, p. 179.
[34] L. Snyder-Mackler, S.A. Binder-Macleod, P.R. Williams, Fatig-ability of human quadriceps femoris muscle following anteriorcruciate ligament reconstruction, Med Sci Sports Exerc 25 (1993)783–789.
[35] D.G. Stephenson, D.A. Williams, Effects of sarcomeres lengthon the force–pCa relation in fast- and slow-twitch skinned musclefibres from the rat, J Physiol (Lond) 333 (1982) 637–653.
[36] R.B. Stein, J. Bobet, M.N. OGuztoreli, M. Fryer, The kineticsrelating calcium and force in skeletal muscle, Biophys J 54(1988) 705–716.
[37] H. Westerblad, D.G. Allen, Changes in myoplasmic calcium con-centration during fatigue in single mouse muscle fibers, J GenPhysiol 98 (1991) 615–635.
[38] A.S. Wexler, J. Ding, S.A. Binder-Macleod, A mathematicalmodel that predicts skeletal muscle force, IEEE Trans BiomedEng 44 (5) (1997) 337–348.
[39] G.I.M. Zahalak, Modeling muscle mechanics (and energetics), in:J.M. Winters, S.L.Y. Woo (Eds.), Multiple Muscle Systems:Biomechanics and Movement Organization, Springer, New York,1990, pp. 1–23.
[40] G.I. Zahalak, S.P. Ma, Muscle activation and contraction: consti-tutive relations based directly on cross-bridge kinetics, J BiomechEng 112 (1990) 52–62.
Jun Ding received a B.E. degree in BiomedicalEngineering from the Tsinghua University, Beij-ing, P. R. China in 1994, and a Ph.D. degree inBiomechanics & Movement Sciences from theUniversity of Delaware in 2001. She is currentlya research scientist in the Department of Physi-cal Therapy at the University of Delaware. Herresearch interests include FES and mathematicalmodeling of muscle activation and fatigue.
Anthony S. Wexler received a B.S. degree inEngineering Physics from the University of Cal-ifornia at Berkeley in 1976, a M.S. degree inMechanical Engineering from MassachusettsInstitute of Technology in 1978, and a Ph.D.degree in Mechanical Engineering from the Cal-ifornia Institute of Technology in 1990. From1991 to 2000, he was first Assistant, thenAssociate Professor, and finally Professor ofMechanical Engineering at the University ofDelaware. He is currently a Professor in theDepartment of Mechanical and Aeronautical
Engineering, Department of Civil and Environmental Engineering, andDepartment of Land, Air and Water Resources Departments at the Univer-sity of California at Davis. His research interests include air pollution,biomedical engineering, and single particle analysis.
Stuart A. Binder-Macleod received a B.S.degree in Physical Therapy from the State Uni-versity of New York at Buffalo in 1974, aM.M.Sc. degree in Physical Therapy fromEmory University in 1979, and a Ph.D. degreein Physiology from the Medical College of Vir-ginia in 1987. He has been with the Departmentof Physical Therapy at the University of Dela-ware since 1987. He is currently Professor andChair of the Department of Physical Therapy.His research interests include FES, the relation-ship between activation frequency and force out-
put of skeletal muscle, muscle fatigue, segmental motor control, and math-ematical modeling of muscle forces.