Treating Symptomatic Uterine Fibroids ... - X-Ray Consultants
Upload
independentCategory
view
2download
0
ORIGINAL ARTICLE
Mathematical modeling of electrical activity of uterinemuscle cells
Sandy Rihana Æ Jeremy Terrien Æ Guy Germain ÆCatherine Marque
Received: 29 March 2008 / Accepted: 16 December 2008 / Published online: 20 March 2009
� International Federation for Medical and Biological Engineering 2009
Abstract The uterine electrical activity is an efficient
parameter to study the uterine contractility. In order to
understand the ionic mechanisms responsible for its gen-
eration, we aimed at building a mathematical model of the
uterine cell electrical activity based upon the physiological
mechanisms. First, based on the voltage clamp experiments
found in the literature, we focus on the principal ionic
channels and their cognate currents involved in the gener-
ation of this electrical activity. Second, we provide the
methodology of formulations of uterine ionic currents
derived from a wide range of electrophysiological data. The
model is validated step by step by comparing simulated
voltage-clamp results with the experimental ones. The
model reproduces successfully the generation of single
spikes or trains of action potentials that fit with the
experimental data. It allows analyzing ionic channels
implications. Likewise, the calcium-dependent conductance
influences significantly the cellular oscillatory behavior.
Keywords Myometrial ionic currents �Uterine excitability � Voltage clamp � Action potential �Electrophysiological model
1 Introduction
The uterus is usually relatively quiescent during pregnancy
and conversely it exhibits rhythmic forceful contractions at
term. These contractions appear because of propagated
electrical activity generated at cellular levels. Different
studies have demonstrated that this electrical activity is
highly correlated to uterine contractions and has an impor-
tant clinical potential [4, 9, 18, 19]. This electrical activity is
initiated at the cellular level. Its shape and characteristics
vary during pregnancy from a single spike, an irregular train
of action potentials, to a regular train of action potentials
observed at the end of term. Understanding the uterine
electrical activity is not limited to cellular level. Indeed,
uterine gap junctions play an important role in the propa-
gation. In fact, during pregnancy, the propagation is limited
due to the lack of gap junctions and at the end of term, before
delivery, an abrupt increase in gap junctions is significantly
observed [10]. Our aim was to develop a physiological
model of the uterine electrical activity in order to correlate
these physiological mechanisms, in terms of genesis and
propagation of the uterine electrical activity to the recorded
uterine electromyogram EMG. This paper will focus on
describing the model developed first at the cellular level.
S. Rihana (&) � C. Marque
CNRS, UMR 6600 Biomecanique et Bio-ingenierie,
60200 Compiegne, France
e-mail: [email protected];
C. Marque
e-mail: [email protected]
J. Terrien
School of Science and Engineering, Reykjavik University,
Reykjavik, Iceland
e-mail: [email protected]
G. Germain
INRA, UMR 1198 Biologie du developpement et reproduction,
78350 Jouy en Josas, France
e-mail: [email protected]
G. Germain
ENVA, UMR 1198 Biologie du developpement et reproduction,
78350 Jouy en Josas, France
G. Germain
CNRS, FRE 2857, 78350 Jouy en Josas, France
123
Med Biol Eng Comput (2009) 47:665–675
DOI 10.1007/s11517-009-0433-4

The cellular electrical activity, difference of potential
across the cell membrane, is due primarily to the unequal
distribution of ions between the intra- and extra-cellular
spaces.
The understanding of impulse generation in uterine cell,
like in many types of excitable cells, lies on the concept of
changes in ionic permeability of the excitable membrane
[11]. The core framework of modeling excitable cell
functioning was raised 50 years ago as the Hodgkin–
Huxley model of the giant axon [11]. Over the past dec-
ades, the history of modeling was widely developed in
nerve and heart tissue. In 1962, Noble [23] proposed the
first model of cardiac tissue (Purkinje fibers) based on
Huxley and Hodgkin formulations. Cardiac tissue models
were continuously improved with the progress of the dif-
ferent experimental techniques and the study of the
biophysical properties of its cell membranes.
However, so far, few models concerning the myometrial
ionic channels and their activity control had been devel-
oped. Previous models of the myometrium have been
developed at the organ level [1, 34] based on automaton
discrete cell states. Ramon et al.[10] presented an elec-
trophysiological model of smooth muscle based on Huxley
and Hodgkin [6]. This model was limited to sodium and
potassium voltage-dependent currents and was not based
on the physiological ionic currents involved in the myo-
metrial excitation. Recently, Bursztyn et al. [5] published
an excitation-contraction model of uterine muscle cells.
This mathematical model reports the cellular mechanisms
of calcium control such as L-type voltage-dependent cur-
rent, Ca2? pumps and Na?/Ca2? exchangers. However, it
neglects the inactivation process of calcium current, the
time dependency of kinetic dynamics and all other ionic
mechanisms involvedsuch as potassium and sodium. In this
paper we present a model of the uterine excitability
involving the main ionic mechanisms responsible for the
genesis of the uterine excitability. The data in the model
are based on the electrophysiological properties of the
uterine cell. Therefore, the adaptation of voltage clamp
experiments is a major forward step. The most important
advantage of voltage-clamp is that it eliminates the
capacitive current and reduces all membrane currents to the
ionic ones. This technique allows, by blocking membrane
ionic channels, leaving a single channel active to identify
the principal kinetics that govern its corresponding ionic
current.
The major key for physiological modeling is a better
understanding of the main physiological processes
involved. Therefore, our methodology is described as
follows: first, we present a basic review of the main bio-
physical properties of the uterine cell and of its main ionic
channels. Then, we develop the modeling steps and show
how we have compiled all the ionic channels data obtained
from the uterine voltage clamp experiments to formulate
equations for the main myometrial ionic currents, based on
the fundamental electrophysiological principles developed
on the giant squid axon by Huxley and Hodgkin (HH) in
1952 [11]. These equations serve to develop a physiolog-
ical model of the uterine electrical activity of a single cell
that is presented in this paper.
2 Methods
During pregnancy, uterine cells are generally quiescent and
characterized by a resting membrane potential Vm varying
slightly under hormonal influences. It passes throughout
pregnancy from -60 mV at mid term, to -45 mV at term
[8, 27]. In some uterine cells, a spontaneous depolarization
occurs, the pacemaker potential, in addition to the resting
membrane potential. When the depolarization exceeds a
threshold, the cell shows a single spike, a plateau, regular
train of spikes or irregular one. The alternation between
resting state and repetitive single spikes is known as
bursting behavior. This is especially observed at the end of
gestation [27].
The frequency of the burst discharges and the number of
spikes in each burst vary considerably, and are largely
influenced by hormonal and gestational factors as well as
by pharmacological agents. Burst discharge frequency and
spike frequency within bursts have values in rat at term
(1.2 bursts/min and 1.5 spikes/s, respectively) [10, 20] that
are different to earlier stages of pregnancy (0.45 burst/min
and 4 spikes/s, respectively). The duration of bursts is
shorter at delivery (21.5 s), when compared to earlier
stages of pregnancy (32 s) [10, 20]. On a single cell level,
myometrial single action potential (AP) recorded after a
short depolarizing pulse has a duration of approximately
133 ms [13]. In response to longer depolarizing pulse, a
burst of action potential is observed and the AP duration is
increased to approx. 200–250 ms. The increase in the
action potential amplitude due to the longer depolarizing
pulse can be explained by the different time constants of
each individual myometrial cells and the charges concen-
trated in the capacitance membrane of the myometrial cell.
The spiking activities present peak amplitude of 54.6 mV
in depolarized cells [13]. The electrical activity is modu-
lated by the activity of the myometrial ion channels and by
the dynamics of the intracellular concentration. A brief
description of these processes will be given.
2.1 Myometrial ion channels
The main myometrial ionic channels, responsible for the
excitability of the cells, and their activity are briefly
described below.
666 Med Biol Eng Comput (2009) 47:665–675
123

2.1.1 Sodium voltage dependent channels
These channels have been described in rat and human
myometrial cells [33, 35]. Sperelakis et al. [30] postulated
that these channels contribute with gap junctions, to the
pacemaker potential generation and to a complete rhythmic
forceful propagation of the electrical activity at the time of
parturition.
2.1.2 Calcium voltage dependent channels
At least two types of calcium voltage-dependent currents
have been described in the smooth muscle [31].
• L type channels (Long lasting): They are predominant
in the rat uterine myocytes [21, 33]. L-type Ca2?
channels are associated with Ca2? entry in the intra-
cellular space and consequently with the contraction in
the myometrium.
• T type channels (Transient): These channels are
associated with transient currents. They are described
in human uterine cells [12, 36]. They are activated only
by depolarizing pulses from a holding potential of
-100 mV and completely inactivated at toward
-60 mV. Thus, for a resting potential of -50 mV, a
large fraction of the transient type calcium channel is
inactivated, raising the question of its physiologic role
in the generation of action potential [12, 36].
Otherwise, they are rarely observed in rat myometrial
pregnant cell. The presence of these channels is generally
linked to action potential generation and pacemaker
activity [12, 36].
2.1.3 Potassium channels
The role of potassium channels in the control of the uterine
excitability is not still completely understood [23, 25].
Nevertheless, it is obvious that these channels contribute
primarily to the repolarization of the cell after an action
potential [15, 28, 32]. The importance of K? channels, in
maintaining the resting membrane potential, and in the
repolarization, is related to the long period of some hun-
dreds of milliseconds of channel activation [32]. Two
primary types of potassium channels have been described
in the myometrium: potassium voltage-dependent channels
and potassium calcium dependent channels [14, 32].
2.1.4 Chloride channels
These channels have not been extensively evaluated
although they play an important role by controlling the
repolarization of the uterine activity [28]. The plateau
observed in some depolarization of uterine cells is almost
equal to the chloride equilibrium potential [7]. The
chloride current still activated like a background current.
Apart from its contribution in the repolarization of the
cell, it may play an important role in the depolarization of
the membrane [3]. This depolarization may contribute in
its turn to the opening of voltage-dependent calcium
channels.
2.2 Intracellular calcium concentration
Intracellular calcium plays an important role in the mod-
ulation of myometrial electrical activity. Ca2? may be seen
as the main transporter of charges in a uterine cell. Ca2?
plays a major role in the modulation of the electrical
uterine activity throughout pregnancy. Like in other
smooth muscles, the contractility of uterine muscle cells is
largely dependent on the intracellular free calcium con-
centration. The rise in [Ca2?]i occurs when efficient
stimulation is applied and when the major entry of Ca2?
ions into the uterine cell is done through the L-type Ca2?
channels [29]. The efflux or the decrease of the intracel-
lular calcium concentration needed for membrane
repolarization, is controlled by different mechanisms such
as calcium pumps, Na?/Ca2? exchangers and the calcium
sequestration by the intracellular compartments. Conse-
quently, intracellular calcium dynamics is an important
component to be taken into account for the electrophysio-
logical modeling of uterine cell activation.
2.3 Basic steps toward modeling
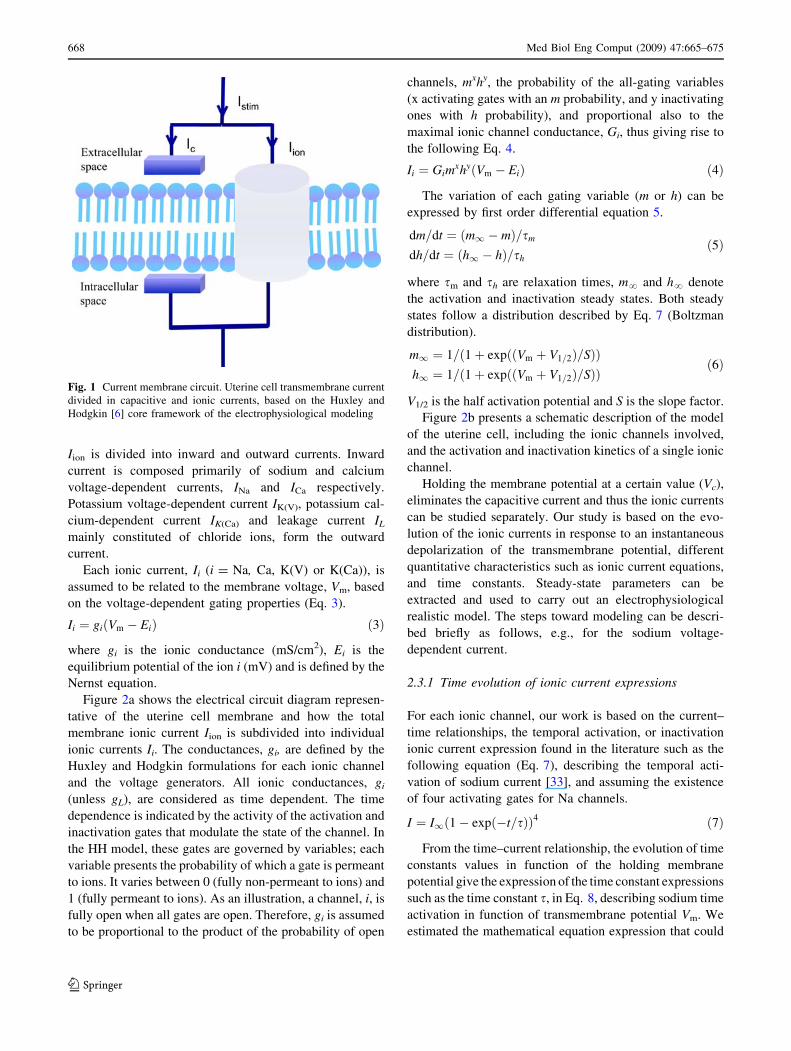
Based on the Huxley and Hodgkin model [11], the trans-
membrane current, Im, can be divided into two components
as shown in Fig. 1: the capacitive current, due to the bili-
pidic layer of the cell membrane, and the ionic current due
to the flux of ions between the intra and the extra cellular
space. Experimentally, Im is equal to the stimulation cur-
rent Istim applied to the uterine cell. Thus, the electrical
properties of the uterine cell can be described by the fol-
lowing differential equation 1.
Istim ¼ Cm
dVm
dtþX
Iion ð1Þ
where Istim is the membrane stimulation current (lA/cm2),
Cm is the membrane capacitance (lF/cm2), Iion is the sum
of the involved ionic currents (lA/cm2), and Vm is the
transmembrane potential, the difference between the
intracellular potential and the extracellular potential (mV).
For the myometrial cell, taking into consideration the
main ionic channels described above, the total ionic cur-
rent, Iion can be expressed as follows (Eq. 2):
Iion ¼ INa þ ICa þ IKðVÞ þ IKðCaÞ þ IL ð2Þ
Med Biol Eng Comput (2009) 47:665–675 667
123
Iion is divided into inward and outward currents. Inward
current is composed primarily of sodium and calcium
voltage-dependent currents, INa and ICa respectively.
Potassium voltage-dependent current IK(V), potassium cal-
cium-dependent current IK(Ca) and leakage current IL
mainly constituted of chloride ions, form the outward
current.
Each ionic current, Ii (i = Na, Ca, K(V) or K(Ca)), is
assumed to be related to the membrane voltage, Vm, based
on the voltage-dependent gating properties (Eq. 3).
Ii ¼ giðVm � EiÞ ð3Þ
where gi is the ionic conductance (mS/cm2), Ei is the
equilibrium potential of the ion i (mV) and is defined by the
Nernst equation.
Figure 2a shows the electrical circuit diagram represen-
tative of the uterine cell membrane and how the total
membrane ionic current Iion is subdivided into individual
ionic currents Ii. The conductances, gi, are defined by the
Huxley and Hodgkin formulations for each ionic channel
and the voltage generators. All ionic conductances, gi
(unless gL), are considered as time dependent. The time
dependence is indicated by the activity of the activation and
inactivation gates that modulate the state of the channel. In
the HH model, these gates are governed by variables; each
variable presents the probability of which a gate is permeant
to ions. It varies between 0 (fully non-permeant to ions) and
1 (fully permeant to ions). As an illustration, a channel, i, is
fully open when all gates are open. Therefore, gi is assumed
to be proportional to the product of the probability of open
channels, mxhy, the probability of the all-gating variables
(x activating gates with an m probability, and y inactivating
ones with h probability), and proportional also to the
maximal ionic channel conductance, Gi, thus giving rise to
the following Eq. 4.
Ii ¼ GimxhyðVm � EiÞ ð4Þ
The variation of each gating variable (m or h) can be
expressed by first order differential equation 5.
dm=dt ¼ ðm1 � mÞ=sm
dh=dt ¼ ðh1 � hÞ=sh
ð5Þ
where sm and sh are relaxation times, m? and h? denote
the activation and inactivation steady states. Both steady
states follow a distribution described by Eq. 7 (Boltzman
distribution).
m1 ¼ 1=ð1þ expððVm þ V1=2Þ=SÞÞh1 ¼ 1=ð1þ expððVm þ V1=2Þ=SÞÞ
ð6Þ
V1/2 is the half activation potential and S is the slope factor.
Figure 2b presents a schematic description of the model
of the uterine cell, including the ionic channels involved,
and the activation and inactivation kinetics of a single ionic
channel.
Holding the membrane potential at a certain value (Vc),
eliminates the capacitive current and thus the ionic currents
can be studied separately. Our study is based on the evo-
lution of the ionic currents in response to an instantaneous
depolarization of the transmembrane potential, different
quantitative characteristics such as ionic current equations,
and time constants. Steady-state parameters can be
extracted and used to carry out an electrophysiological
realistic model. The steps toward modeling can be descri-
bed briefly as follows, e.g., for the sodium voltage-
dependent current.
2.3.1 Time evolution of ionic current expressions
For each ionic channel, our work is based on the current–
time relationships, the temporal activation, or inactivation
ionic current expression found in the literature such as the
following equation (Eq. 7), describing the temporal acti-
vation of sodium current [33], and assuming the existence
of four activating gates for Na channels.
I ¼ I1ð1� expð�t=sÞÞ4 ð7Þ
From the time–current relationship, the evolution of time
constants values in function of the holding membrane
potential give the expression of the time constant expressions
such as the time constant s, in Eq. 8, describing sodium time
activation in function of transmembrane potential Vm. We
estimated the mathematical equation expression that could
Fig. 1 Current membrane circuit. Uterine cell transmembrane current
divided in capacitive and ionic currents, based on the Huxley and
Hodgkin [6] core framework of the electrophysiological modeling
668 Med Biol Eng Comput (2009) 47:665–675
123

fit with the experimental data described by Yoshino et al.
[33] The following equation expresses the sodium activation
time constant shown in Fig. 3 and its expression, described
by
smNa ¼ 0:25eð�0:02VmÞ ð8ÞFitting procedure in MATLAB� software (Matlab 7.0,
Mathworks) SSE (Sum Square error) = 0.000192 R2
(Coherence = 0.9936).
The same kind of expressions applies for other activating
and inactivating gates of other ions such as sodium-inacti-
vating gate, calcium-activating gates, and potassium-
inactivating gates.
We found one sodium-inactivating gate and the
expression of the time constant expressed as shNa ¼0:22eð�0:06VmÞ þ 0:366 (fitting procedure in MATLAB�
software (Matlab 7.0, Mathworks) SSE (Sum Square
error) = 0.000022 R2 (Coherence = 0.9946). Finally, the
Vm
gCa gK(Ca) gK(V )gLgNa
EL
Cm
Ek EkENaECa
Inactivation gate, h
K+
Na+Na+
Na+Na+
Na+
Na+
Na+
Ca++
Ca++
Ca++
Ca++
Ca++
Ca++
K+
K+
K+
K+
K+
K+
K+
K+
K+
Na+
Intracellularcompartments
Ca++
Na+
Ca++
Ionic channels of a myometrial cell
K(Ca) channels
K(V) channels
Na(V) channels
Ca(V) channels
Extracellular space
Intracellular space
Ca2+ Ca2+
Ca2+
Ca2+
Ca2+
Ca2+
Activation gate, m
Activation and inactivation kinetics of a single ionic channel
Bilipidic membrane
Ca++
A
B
Fig. 2 Single uterine cell
model. a Electrical circuit
diagram of the uterine
membrane cell based on the
literature and on the Huxley and
Hodgkin basics [11]. b Leftpanel a general schematic
picture of the ionic channels
involved in uterine excitability,
with emphasis on the
intracellular calcium
concentration dynamics due to
the influx of Ca2? through the
Ca2?-voltage-dependent
channels and the sequestration
of these ions by the intracellular
compartments. Right panelkinetics (activation and
inactivation gates) of each ionic
channel
-40 -30 -20 -10 0 10 20 300.1
0.15
0.2
0.25
0.3
0.35
0.4
0.45
0.5
0.55
0.6
Membrane potential, V (mV)
Sod
ium
act
ivat
ion
time
cons
tant
(m
sec)
Fig. 3 Sodium activation time constant. Sodium activation time
constant expression as function of the transmembrane potential.
Curve fitting to the data (stars) extracted from Yoshino et al. [33]
Med Biol Eng Comput (2009) 47:665–675 669
123

sodium voltage-dependent current expression is expressed
by the following equation:
INa ¼ GNam2NahNaðVm � ENaÞ ð9Þ
2.3.2 Current–transmembrane potential relationships
The current–potential relationship serves the physiologists
to determine the kinetics of the activation and inactivation
channels. From the experimental voltage clamp data found
in Yoshino et al. [33], we found the activation and inacti-
vation steady states of the sodium channels as described by
Eq. 10.
mNa1 ¼ 1 1þ expVm þ 21
�5
� �� ��ð10Þ
Moreover, the sodium steady-state voltage inactivation
relation follows a Boltzman distribution described as
follows:
hNa1 ¼1
ð1 þ exp ððVm þ 58:9Þ=8:7ÞÞ ð11Þ
2.3.3 Validation
In order to validate all the mathematical equations and the
assumptions made for each ionic current, we simulated
voltage-clamp experiments for ionic current using these
equations. By holding membrane potential at a constant
value, we compared the simulated curves (current–time and
current–transmembrane potential) with the experimental
ones found in the literature.
The same methodology was used for the other ionic
currents:
2.3.4 Calcium voltage-dependent current
Calcium currents in pregnant rat uterine myocytes are
mainly of L-type [21, 24, 33]. They are responsible for the
influx of calcium ions to the intracellular space and con-
sequently for the intracellular calcium concentration
increase. The activation of ICa has been described in [33]
by a square function (number of activations gates equal
to two). We fitted the voltage-dependent time constant swith an exponential equation smCa ¼ 0:64 expð�0:04VmÞþ1:188.
Calcium inactivation is more complex than sodium
inactivation. Young et al. [36], have found a great cell-to-
cell variability for the decay time course of the L-type
current. Most of cells were found expressing an inactiva-
tion time of the order of tens of milliseconds. These data of
the inactivation times of woman calcium currents ICa [36],
are in agreement with the results found by Yoshino et al.
[33], in pregnant rat uterine cells. In this case, inactivation
time s has been described by two exponential phases. The
first one, voltage-dependent, is the faster, sf, showing a
U-shaped relationship indicative of an effect of Ca2? in
calcium channel inactivation. In addition, the expression of
this time constant could be expressed by the sum of two
exponentials described by the following equation:
sf ðVÞ ¼ a exp � Vm � b
c
� �2 !
þ d exp � Vm � e
f
� �2 !
þ g
ð12Þ
with a = 35.05, b = 13.61, c = 12.34, d = 134.7,
e = 103.8, f = 52.14, g = 27.74.
The second one, ss, may have some voltage dependence.
However, the data recovered from the literature are too
scattered [33] to define its exact scalar value. Because it is
also the slower one, it can be considered as a constant mean
value, of about 160 ms. Because 38% of the calcium cur-
rent is quickly inactivated and 22% consists the slow
current inactivated, we assume the inactivation calcium
gate is expressed by the following Eq. 13:
hCa ¼ 0:38hCaf þ 0:22hCas þ 0:06 ð13Þ
In addition, the steady-state voltage inactivation relation
follows a Boltzman distribution described by Eq. 14.
hCa1 ¼ 1=ð1þ expððVm þ 34Þ=5:4ÞÞ ð14Þ
2.3.5 Potassium voltage-dependent current
Three populations of K? voltage-dependent current have
been described by Wang et al. [32] (IK1, IK2, IK3). Two
have inactivating components and the third one is nonin-
activating and represents the 10% left of the total IK. IK(V)
could be described by the sum of the three components.
The activation and inactivation kinetics of these currents
were fitted to the ones found in the literature [32]. Some
time-scale values are too long relatively to the uterine time
scale excitability such as first potassium component inac-
tivation time constant (shK1 [ 2.5 s) [32], which is ten
times larger than uterine action potential duration
(\300 ms). We therefore simplified the equations by
neglecting this inactivating gate. Other time constants are
too short and nearly instantaneous relative to uterine action
potential duration. It is the case of the third activation
potassium nK3, which is instantaneously activated. There-
fore, we set its value at its steady-state value due the fact
that it reaches quickly.
2.3.6 Potassium calcium-dependent current
and intracellular calcium concentration
These channels, both Ca2? and voltage-dependent, might
contribute to membrane repolarization after membrane
670 Med Biol Eng Comput (2009) 47:665–675
123

depolarization and to [Ca2?]i rise [2]. P0, the ratio between
the open duration time and the total time channel, fits the
Hill function (Eq. 15).
P0 ¼1
ð1þ ðK1=2=½Ca2þ�iÞNÞ
ð15Þ
where K1/2 is the concentration of half-activation and N is
the Hill coefficient. K1/2 is about 10 lM at -40 mV and
20 lM at -50 mV, N = 2, for both potentials [2].
Based on Eq. 3, we used the following IKCa expression
(Eq. 16).
IKðCaÞ ¼ gKðCaÞðVm � EkÞ ð16Þ
where gK(Ca), the total K(Ca) channel conductance, is
expressed as the product of the maximal K(Ca)
conductance GK(Ca) by the probability of the channel to
be open and is function of [Ca2?]i and can be expressed as
follows (Eq. 17).
gKðCaÞ ¼ GKðCaÞCa2þ� �
Ni
ðKNd þ Ca2þ� �
Ni
!ð17Þ
K(Ca) channels are membrane voltage and intracellular
calcium concentration dependent. A simple mathematical
model of the form presented in Eq. 18 describes the
dynamics of the intracellular calcium concentration. fc in
Eq. 18 is the probability of the influx of Ca2? participating
in the concentration dynamics, a is a factor of conversion
from influx Ca2? current I(Ca(V)) to ionic concentration per
time, and KCa represents the sequestration, extrusion, and
buffering processes of Ca2? by the intracellular
compartments [6].
d Ca2þ� �i
dt¼ fcðaICa � KCa Ca2þ� �
iÞ ð18Þ
2.3.7 Uterine cell model
Based on the ionic currents described previously, we can
state that the main ionic currents involved in myometrial
cell activity are
1. Sodium voltage-dependent current INa.
2. Calcium voltage-dependent current responsible for
most inward current during an action potential, mostly
a long lasting calcium current ICaL.
3. Voltage-dependent potassium current predominately
responsible for membrane repolarization, IK(V),
described by the sum of three components IK1(V),
IK2(V) and IK3(V).
4. Calcium-activated-K? current, IK(Ca).
Besides these currents, IL denotes leakage current
including the remaining ionic current. Istim represents the
stimulation current, the external current applied to the
membrane cell. By including the equations related to ionic
currents described below, we obtained a set of first
differential equations describing the activation and inacti-
vation kinetics’ temporal variations. The ten simple
differential equations presented in Eq. 19, describe the
temporal variation of the dynamics of the model.
dV=dt ¼ Istim � Iion V;mCa; h1Ca; h2Ca; nK; ½Ca2þ� i� �� �
=Cm
dmNa=dt ¼ ðmNa1ðVÞ � mNaÞ=smNaðVÞdhNa=dt ¼ ðhNa1ðVÞ � hNaÞ=shNaðVÞdmCa=dt ¼ ðmCa1ðVÞ � mCaÞ=smCaðVÞdh1Ca=dt ¼ ðhCa1ðVÞ � h1CaÞ=sh1CaðVÞdh2Ca=dt ¼ ðhCa1ðVÞ � h2CaÞ=sh2CaðVÞdnk1=dt ¼ ðnk11ðVÞ � nk1Þ=snk1ðVÞdnk2=dt ¼ ðnk21ðVÞ � nk2Þ=snk2ðVÞdhk1=dt ¼ ðhk11ðVÞ � hk1Þ=sk1ðVÞd Ca2þ� �
i=dt ¼ fc aICa V ;mCa; h1Ca; h2Ca; ½Ca2þ� i� ��
�KCa Ca2þ� �i
�ð19Þ
where mNa, hNa are sodium voltage-dependent activation
and inactivation kinetics, mCa calcium activation kinetic,
h1Ca, h2Ca represent the two slow and fast calcium inacti-
vation kinetics; nK1 and nK2 are the activation kinetics of
both potassium voltage-dependent components; hK1 is the
inactivation kinetic of the first potassium voltage-depen-
dent component; mNa?, hNa?, h1Ca?, h2Ca?, nK1?, hK1?
and nK2? represent the steady states of the variables; smNa,
shNa, smCa, sh1Ca, sh2Ca, snK1, shK1 and snK2 denote the time
constant; fc, a and KCa parameters govern the influx of
Ca2? ions to the cell as well as the sequestration, extrusion,
and buffering part of the cation, related to the intracellular
compartments.
2.3.8 Computational aspects
This type of model is a system of stiff, nonlinear ordinary
differential equations that must be solved numerically.
Techniques used for solving this kind of problems were
those described by Moore and Ramon [22], which include
fourth order Runge–Kutta method and methods with
adaptive time step like the Gear method. We used the Gear
method purely built-in MATLAB� routine, MATLAB’s
7.0 (The Mathworks) ode15 s method. The validity of our
single uterine cell model was studied step by step, by
verifying the current voltage relationships of a simulated
voltage-clamp experiment and comparing the relationship
curve simulated for each ionic current obtained with real
data (found in the literature).
For the simulated voltage clamp results, the membrane
potential was held at a constant value and then depolarized
by various voltage-clamp sets which represented a variation
Med Biol Eng Comput (2009) 47:665–675 671
123
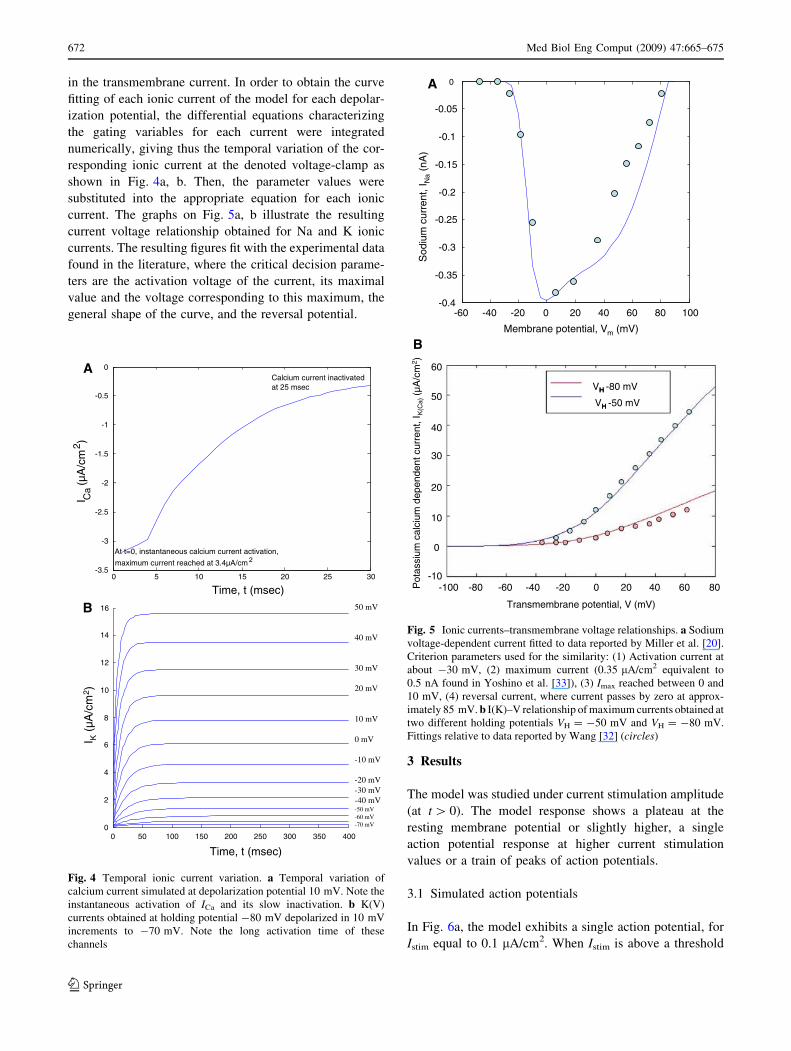
in the transmembrane current. In order to obtain the curve
fitting of each ionic current of the model for each depolar-
ization potential, the differential equations characterizing
the gating variables for each current were integrated
numerically, giving thus the temporal variation of the cor-
responding ionic current at the denoted voltage-clamp as
shown in Fig. 4a, b. Then, the parameter values were
substituted into the appropriate equation for each ionic
current. The graphs on Fig. 5a, b illustrate the resulting
current voltage relationship obtained for Na and K ionic
currents. The resulting figures fit with the experimental data
found in the literature, where the critical decision parame-
ters are the activation voltage of the current, its maximal
value and the voltage corresponding to this maximum, the
general shape of the curve, and the reversal potential.
3 Results
The model was studied under current stimulation amplitude
(at t [ 0). The model response shows a plateau at the
resting membrane potential or slightly higher, a single
action potential response at higher current stimulation
values or a train of peaks of action potentials.
3.1 Simulated action potentials
In Fig. 6a, the model exhibits a single action potential, for
Istim equal to 0.1 lA/cm2. When Istim is above a threshold
0 5 10 15 20 25 30-3.5
-3
-2.5
-2
-1.5
-1
-0.5
0
Time, t (msec)
I Ca (
µA/c
m2 )
At t=0, instantaneous calcium current activation,
maximum current reached at 3.4µA/cm 2
Calcium current inactivatedat 25 msec
0 50 100 150 200 250 300 350 4000
2
4
6
8
10
12
14
16 50 mV
40 mV
30 mV
20 mV
10 mV
0 mV
-10 mV
-20 mV-30 mV-40 mV-50 mV-60 mV-70 mV
Time, t (msec)
I K(µ
A/c
m2 )
A
B
Fig. 4 Temporal ionic current variation. a Temporal variation of
calcium current simulated at depolarization potential 10 mV. Note the
instantaneous activation of ICa and its slow inactivation. b K(V)
currents obtained at holding potential -80 mV depolarized in 10 mV
increments to -70 mV. Note the long activation time of these
channels
-60 -40 -20 0 20 40 60 80 100-0.4
-0.35
-0.3
-0.25
-0.2
-0.15
-0.1
-0.05
0
Sod
ium
cur
rent
, IN
a(n
A)
Membrane potential, Vm (mV)
VH -80 mV
VH -50 mV
Transmembrane potential, V (mV)
H
H
H
H
60
50
40
30
20
10
-10
0
-100 -80 -60 -40 -20 0 20 60 8040Pot
assi
um c
alci
um d
epen
dent
cur
rent
, IK
(Ca)
(µA
/cm
2 )
A
B
Fig. 5 Ionic currents–transmembrane voltage relationships. a Sodium
voltage-dependent current fitted to data reported by Miller et al. [20].
Criterion parameters used for the similarity: (1) Activation current at
about -30 mV, (2) maximum current (0.35 lA/cm2 equivalent to
0.5 nA found in Yoshino et al. [33]), (3) Imax reached between 0 and
10 mV, (4) reversal current, where current passes by zero at approx-
imately 85 mV. b I(K)–V relationship of maximum currents obtained at
two different holding potentials VH = -50 mV and VH = -80 mV.
Fittings relative to data reported by Wang [32] (circles)
672 Med Biol Eng Comput (2009) 47:665–675
123

value around of 0.12 lA/cm2, we obtain a regular spiking.
Figure 6b, shows a train of action potentials obtained for
0.2 lA/cm2 current stimulation similar to the activity
observed at term.
The difference of amplitude of the first peak with the
following ones is due to the time needed for the numerical
integration method to converge. It reflects the instanta-
neous transfer of the system, the uterine cell, from the
resting membrane potential around -50 mV to the oscil-
latory behavior, due to the external current applied. The
sustained spikes to a plateau around -35 to -40 mV are
consistent with the data described in the literature [13].
Therefore, except for the first peak, the action potential
peaks obtained by simulation are similar to the one
observed in the literature with an absolute peak amplitude
of about 40 mV and a peak duration of about 133–200 ms
[15, 25, 35]. Under sinusoidal current stimulation, the
model may exhibit a burst of action potential, Fig. 6C,
which in terms of peak-to-peak amplitude, spike interval
and burst duration, corresponds to the one observed at end
of term [15, 16, 24].3.2 Intracellular calcium concentration and ionic
currents
The essential core of the excitability process of a uterine
cell is the intracellular calcium concentration. The influx of
calcium into the myometrial cell occurs largely through the
calcium voltage-dependent channel. The repetitive action
potentials, as shown in Fig. 7a, are strongly associated with
the opening of voltage-sensitive Ca2? channels allowing
the increase and the accumulation of intracellular calcium
concentration. Resting intracellular calcium concentrations
are between 0.1 and 0.16 lM in myometrial cells and
increase in order to reach a certain threshold (between 1
and 3 mM) necessary to trigger the uterine cell contracture
process [17]. This intracellular calcium concentration is
illustrated in Fig. 7b.
4 Discussion
We have developed in this work an electrophysiological
model representative of the electrical activity of a single
uterine cell. This model is built on modified basic ionic
current expressions described by Huxley and Hodgkin [11]
and the data available in the literature on uterine physiol-
ogy. It permitted reproducing the uterine electrical activity
observed at term, and by varying the parameters such as the
Istim current, we produce different patterns of cell electrical
activities.
Questions can be raised concerning the assumptions and
simplifications that we have implemented during the
development of this model.
0 200 400 600 800 1000 1200 1400 1600 1800 2000-50
-40
-30
-20
-10
0
Time, t (msec)
Vm
(mV
)
0 1000 2000 3000 4000 5000 6000 7000 8000 9000 10000
-40
-20
0
20
Time, t (msec)
Mem
bran
e po
tent
ial,
Vm
(m
V)
A
B
C
Fig. 6 Different shapes of uterine electrical activity. a Single action
potential simulated for 0.1 lA/cm2 current stimulation amplitude.
b Repetitive action potentials simulated in response to a current
stimulation value 0.17 lA/cm2 higher than 0.12 lA/cm2. c Burst of
action potential generated by a sinusoidal stimulation current
0 2 4 6 8 10 12-60
-40
-20
0
20
40
Time, t ( sec)
Vm
(m
V)
0 2 4 6 8 10 120
0.2
0.4
0.6
0.8
1
Time, t (sec)
[Ca
2+] i (
µM
)
A
B
Fig. 7 Accumulation of the intracellular calcium concentration (b)
during the sustained train of action potentials (a)
Med Biol Eng Comput (2009) 47:665–675 673
123

They first concern the structure of the model itself. A
perfect model would have been based on complete uterine
myocyte electrophysiological data obtained from a same
species and at a given stage of pregnancy. As stated above,
these data are not always available. We made therefore
assumptions driven from values extracted from myocytes
in different species (rat, human) and from various experi-
mental conditions. Missing parameters were finally
estimated via ‘‘fine-tuning’’, by navigating their values in
different intervals in consistence with voltage-clamp data
simulating physiological conditions.
A second point of discussion is the triggering of the
electrical activity. In vivo, uterine excitability is thought to
be initiated spontaneously at pacemaker cells [10]. We
have used in our model a stimulating current, to trigger the
electrical activity of a single cell. This stimulating current
was associated with the pacemaker cell. By varying the
Istim value, when a threshold is reached, we were able to
reproduce different patterns of electrical response of the
uterine cell, from a single action potential, characteristic of
pregnancy, to a burst of action potentials, characteristic of
the end of gestation or of labor activity. However, the
duration of the burst is closely related to the duration for
which Istim is held, within certain limits, above the
threshold. Our model allows then reproducing the single
spike initiating small contractions during pregnancy and
the multiple spikes that maintain large contractions at the
end of gestation, but it is not yet able to reproduce the
phenomenon involved in the triggering of pacemaker
activity. Hence, by injecting the stimulation current, the
model exhibits the electrical activity of a uterine as pace-
maker cell. However, neglecting the current stimulation
parameter, the cell is considered as pacefollower, and does
not exhibit any electrical activity unless stimulation arises
from its neighbor cells. This case will be modeled in a
further work describing the propagation of electrical
activity.
Conversely, by keeping constant the stimulation current,
a reduction of the extra cellular calcium concentration
inhibits the repetitive action potential shape and shows a
single action potential, plateau-type. This confirms the
important role played by the influx of calcium ions in the
generation of the action potential. Therefore, a new ques-
tion can be raised: could the T-type transient calcium
currents be responsible for spike generation and the trig-
gering of uterine excitability, as it is the case in cardiac and
skeletal myocytes where they contribute to membrane cell
depolarization and to the pacemaker activity? The impor-
tance of the T-type Ca2? channels in uterine myocyte is
still elusive due to the fact that a large fraction of these
channels is inactivated at -60 mV [12]. It raises the
question of the physiological role of these channels at a
uterine resting potential of approximately -50 mV. It has
been demonstrated by Schmigol et al. [29] that the major
source of Ca2? ions entering the cell increasing the [Ca2?]i
is due to the influx of L-type Ca2? current. This hypothesis
may justify the limitation of modeling to the L-type Ca(V)
channels and neglecting the Ca2?-release from the intra-
cellular compartments.
All these questions on the model limitations still need to
be clarified. To solve the problems cited above, the only
way will be to go back to real voltage-clamp experiments
in order to validate the assumptions made and to bring to
the model the lacking data. Nevertheless, the model can be
used from now in different ways. It can help understanding
the contribution of myometrial ionic channels during the
pregnancy and parturition. Even at this early stage of
development, the model can be used to study the effect of
drug injections or the effect of the association of molecules
on the uterine cell behavior. We may explore, for example
by using this model, the response of the cell following
the administration of potassium-channel openers and of
calcium inhibitors. Thus, the model can serve as an
experimental platform to predict the effect of tocolytic
treatments. Future collaborations with physiological and
pharmacological laboratories will be held in order to
validate the tocolytics treatment.
5 Conclusion
Based on myometrial voltage-clamp experiments described
in the literature, we have selected the main uterine ionic
currents, and proposed their voltage channel dynamic
expressions to develop a mathematical model of the uterine
cell excitability. Our future efforts will focus on analyzing
the impacts of these parameters on the model response, in
order to reduce the model and to simplify its computation.
Since abdominal recording of the electrical activity of the
uterus allows monitoring the uterine contractility during
pregnancy [19], the final aim will be the modeling of a
surface uterine electromyogram in order to correlate the
characteristics of this signal to the involved physiological
mechanisms.
Acknowledgments This work was supported by a grant ‘‘Pole
GBM Perinatalite-Enfance’’ of the Picardy Region, France. It has
been communicated and poster presented in proceedings of the third
European Medical and Biological Engineering Conference, EMBC,
held in Prague in November 2005.
References
1. Andersen HF, Barclay ML (1995) A computer model of uterine
contractions based on discrete contractile elements. Obstet
Gynecol 86(1):108–111. doi:10.1016/0029-7844(95)00111-4
674 Med Biol Eng Comput (2009) 47:665–675
123

2. Anwer K et al (1993) Calcium-activated K?channels as modu-
lators of human myometrial contractile activity. Am J Physiol
265(4 Pt 1):C976–C985
3. Arnaudeau S, Lepretre N, Mironneau J (1994) Chloride and
monovalent ion-selective cation currents activated by oxytocin
in pregnant rat myometrial cells. Am J Obstet Gynecol 171(2):
491–501
4. Buhimschi C et al (1998) Uterine activity during pregnancy and
labor assessed by simultaneous recordings from the myometrium
and abdominal surface in the rat. Am J Obstet Gynecol 178:811–
822. doi:10.1016/S0002-9378(98)70498-3
5. Bursztyn L et al (2007) Mathematical model of excitation–con-
traction in a uterine smooth muscle cell. Am J Physiol Cell
Physiol 292(5):C1816–C1829. doi:10.1152/ajpcell.00478.2006
6. Chay TR, Keizer J (1983) Minimal model for membrane oscil-
lations in the pancreatic beta-cell. Biophys J 42(2):181–190
7. Coleman HA, Parkington HC (1987) Single channel Cl-and
K?currents from cells of uterus not treated with enzymes.
Pflugers Arch 410(4–5):560–562. doi:10.1007/BF00586540
8. Coleman HA, Parkington HC (1990) Hyperpolarization-activated
channels in myometrium: a patch clamp study. Prog Clin Biol
Res 327:665–672
9. Fele-Zorz G et al (2008) A comparison of various linear and non-
linear signal processing techniques to separate uterine EMG
records of term and pre-term delivery groups. Med Biol Eng
Comput 46:911–922
10. Garfield RE (1994) Role of cell-to-cell coupling in control of
myometrial contractility and labor. In: Garfield RE, Tabb TN
(eds) Control of uterine contractility. C.P.I. Llc., Florida
11. Hodgkin AL, Huxley AF (1952) A quantitative description of
membrane current and its application to conduction and excita-
tion in nerve. J Physiol 117(4):500–544
12. Inoue Y et al (1990) Some electrical properties of human preg-
nant myometrium. Am J Obstet Gynecol 162(4):1090–1098
13. Kao CY, McCullough JR (1975) Ionic currents in the uterine
smooth muscle. J Physiol 246(1):1–36
14. Khan RN et al (2001) Potassium channels in the human myo-
metrium. Exp Physiol 86(2):255–264. doi:10.1113/eph8602181
15. Knock G, Smirnov S, Aaronson P (1999) Voltage gated K?
currents in freshly isolated myocytes of the pregnant human
myometrium. J Physiol 518:769–781. doi:10.1111/j.1469-7793.
1999.0769p.x
16. Kuriyama H, Suzuki H (1976) Changes in electrical properties of
rat myometrium during gestation and following hormonal treat-
ments. J Physiol 260:315–333
17. Marshall J (1990) Relation between membrane potential and
spontaneous contraction of the uterus, in uterine contractility:
mechanisms of control. In: Garfield R, Norwell M (eds) Sereno
symposia, pp 3–7
18. Marque C, Duchene J (1989) Human abdominal EHG processing
for uterine contraction monitoring. Biotechnology 11:187–226
19. Marque C et al (1986) Uterine EHG processing for obstetrical
monitoring. IEEE Trans Biomed Eng 33(12):1182–1187. doi:
10.1109/TBME.1986.325698
20. Miller SM, Garfield RE, Daniel EE (1989) Improved propagation
in myometrium associated with gap junctions during parturition.
Am J Physiol 256(1 Pt 1):C130–C141
21. Miyoshi H, Urabe T, Fujiwara A (1991) Electrophysiological
properties of membrane currents in single myometrial cells
isolated from pregnant rats. Pflugers Arch 419(3–4):386–393.
doi:10.1007/BF00371121
22. Moore JW, Ramon F (1974) On numerical integration of the
Hodgkin and Huxley equations for a membrane action potential.
J Theor Biol 45(1):249–273. doi:10.1016/0022-5193(74)90054-X
23. Noble D (1962) A modification of the Hodgkin–Huxley equations
applicable to Purkinje fibre action and pace-maker potentials.
J Physiol 160:317–352
24. Ohya Y, Sperelakis N (1989) Fast Na?and slow Ca2?channels in
single uterine muscle cells from pregnant rats. Am J Physiol
257(2 Pt 1):C408–C412
25. Parkington HC, Coleman HA (1988) Ionic mechanisms under-
lying action potentials in myometrium. Clin Exp Pharmacol
Physiol 15(9):657–665. doi:10.1111/j.1440-1681.1988.tb01125.x
26. Ramon F et al (1976) A model of propagation of action potentials
in smooth muscle. J Theor Biol 59:381–408. doi:10.1016/0022-
5193(76)90178-8
27. Sanborn BM (1995) Ion channels and the control of myometrial
electrical activity. Semin Perinatol 19(1):31–40. doi:10.1016/
S0146-0005(95)80045-X
28. Sanborn BM (2000) Relationship of ion channel activity to
control of myometrial calcium. J Soc Gynecol Investig 7(1):4–11.
doi:10.1016/S1071-5576(99)00051-9
29. Shmigol A, Eisner D, Wray S (1998) Properties of voltage-acti-
vated [Ca2?]i transients in single smooth muscle cells isolated
from pregnant rat uterus. J Physiol 511(3):803–811. doi:10.1111/
j.1469-7793.1998.803bg.x
30. Sperelakis N, Inoue Y, Ohya Y (1992) Fast Na?channels and
slow Ca2? current in smooth muscle from pregnant rat uterus.
Mol Cell Biochem 114(1–2):79–89. doi:10.1007/BF00240301
31. Wang R, Karpinski E, Pang PK (1989) Two types of calcium
channels in isolated smooth muscle cells from rat tail artery. Am
J Physiol 256(5 Pt 2):H1361–H1368
32. Wang SY et al (1998) Potassium currents in freshly dissociated
uterine myocytes from nonpregnant and late-pregnant rats. J Gen
Physiol 112(6):737–756. doi:10.1085/jgp.112.6.737
33. Yoshino M, Wang SY, Kao CY (1997) Sodium and calcium
inward currents in freshly dissociated smooth myocytes of rat
uterus. J Gen Physiol 110(5):565–577. doi:10.1085/jgp.110.5.565
34. Young RC (1997) A computer model of uterine contractions
based on action potential propagation and intercellular calcium
waves. Obstet Gynecol 89(4):604–608. doi:10.1016/S0029-
7844(96)00502-9
35. Young RC, Herndon-Smith L (1991) Characterization of sodium
channels in cultured human uterine smooth muscle cells. Am J
Obstet Gynecol 164(1 Pt 1):175–181
36. Young RC, Smith LH, McLaren MD (1993) T-type and L-type
calcium currents in freshly dispersed human uterine smooth
muscle cells. Am J Obstet Gynecol 169(4):785–792
Med Biol Eng Comput (2009) 47:665–675 675
123
Copyright © 2022 FDOKUMEN