Is sex-biased maternal care limited by total maternal expenditure in polygynous ungulates
Upload
independentCategory
view
3download
0
Maternal Endocrine Adaptation throughout Pregnancyto Nutritional Manipulation: Consequences for MaternalPlasma Leptin and Cortisol and the Programming ofFetal Adipose Tissue Development
J. BISPHAM, G. S. GOPALAKRISHNAN, J. DANDREA, V. WILSON, H. BUDGE, D. H. KEISLER,F. BROUGHTON PIPKIN, T. STEPHENSON, AND M. E. SYMONDS
Academic Division of Child Health (J.B., G.S.G., J.D., V.W., H.B., T.S., M.E.S.) and Academic Division of Obstetrics andGynecology (F.B.P.), School of Human Development, University Hospital, Nottingham NG7 2UH, United Kingdom; andDepartment of Animal Sciences (D.H.K.), University of Missouri, Columbia, Missouri 65201
Maternal nutrient restriction at specific stages of gestationhas differential effects on fetal development such that theoffspring are programmed to be at increased risk of adultdisease. We investigated the effect of gestational age and ma-ternal nutrition on the maternal plasma concentration of lep-tin and cortisol together with effects on fetal adipose tissuedeposition plus leptin, IGF-I, IGF-II ligand, and receptormRNA abundance near to term. Singleton bearing ewes wereeither nutrient restricted (NR; consuming 3.2–3.8 MJ/d of me-tabolizable energy) or fed to appetite (consuming 8.7–9.9MJ/d) over the period of maximal placental growth, i.e. be-tween 28 and 80 d gestation. After 80 d gestation, ewes wereeither fed to calculated requirements, consuming 6.7–7.5
MJ/d, or were fed to appetite and consumed 8.0–10.9 MJ/d.Pregnancy resulted in a rise in plasma leptin concentration by28 d gestation, which continued up to 80 d gestation when fedto appetite but not with nutrient restriction. Plasma cortisolwas also lower in NR ewes up to 80 d gestation, a difference nolonger apparent when food intake was increased. At term,irrespective of maternal nutrition in late gestation, fetusessampled from ewes NR in early gestation possessed more ad-ipose tissue, whereas when ewes were fed to appetite through-out gestation, fetal adipose tissue deposition and leptin mRNAabundance were both reduced. These changes may result inthe offspring of NR mothers being at increased risk of obesityin later life. (Endocrinology 144: 3575–3585, 2003)
A WIDE RANGE of epidemiological evidence from dif-ferent populations worldwide indicates that the nu-
tritional and hormonal environment encountered by the fe-tus is a strong determinant of not only fetal growth but alsocardiovascular disease (CVD) risk in later life (1, 2). The mostprominent relationships between intrauterine life and in-creased prevalence of CVD risk factors relate to the effects oftransient periods of maternal nutrient restriction duringpregnancy on patterns of fetal growth and placental size,rather than low birth weight per se (3). For example, longi-tudinal studies have been performed on individuals bornduring the Dutch famine of 1944–1945. During the 5-monthperiod of the famine, mean energy intake was 3.2 MJ/d,compared with 6.3 MJ/d immediately afterward (4). Dietaryrestriction during early gestation had the greatest effect onthe ratio of placental size to birth weight and resulted in amuch greater risk of adult coronary heart disease and obesity(5, 6). The extent to which fetal adipose tissue can be repro-grammed as a consequence of a nutritional challenge in earlygestation has not been elucidated. It is also not establishedwhether there are major changes in maternal endocrine sta-tus either at the time of or after a prolonged period of ma-ternal nutrient restriction commencing early in gestation.
The precise molecular mechanisms underlying the pro-
gramming of adult disease by maternal nutrient restrictionremain a matter of debate. A severe period of nutrient re-striction in late gestation results in an appreciable decreasein maternal plasma IGF-I concentration and reduced placen-tal and fetal size (7). More modest changes in nutrient intakecan influence the plasma concentration of a range of counterregulatory metabolic hormones, including those secretedfrom the adrenal and thyroid glands, the pituitary, as well asleptin release from adipose tissue (8–11). The extent to whichthese may have an overriding effect on maternal metabolismso that the partition of nutrients to the fetus is altered has notbeen established. Recent experimental studies have sug-gested that fetal overexposure to maternal glucocorticoidstriggers programming events in utero that lead to hyperten-sion and persistent increases in glucocorticoid actionthroughout life (12, 13). However, in nonpregnant adultsheep, 4 d of food withdrawal has no effect on plasma cortisol(14), and in late gestation, a 50% reduction in maternal foodintake only causes a transient rise in maternal plasma cortisoland has no effect on cortisol in the fetus (8). Whether othermetabolic hormones, particularly leptin, may be consistentlyaffected by undernutrition during pregnancy also remainsunclear. In pregnant sheep, the effect of undernutrition onplasma leptin appears to be dependent on both the stage ofgestation (15) and animal age (16). For growing adolescentsheep made pregnant by embryo transfer and fed a pelleteddiet twice daily, either an increase or decrease in maternalnutrition up to 50 or 100 d gestation results in parallel
Abbreviations: CVD, Cardiovascular disease; 11�HSD, 11�-hydroxy-steroid dehydrogenase; ME, metabolizable energy; NEFA, nonesterifiedfatty acid; NR, nutrient-restricted.
0013-7227/03/$15.00/0 Endocrinology 144(8):3575–3585Printed in U.S.A. Copyright © 2003 by The Endocrine Society
doi: 10.1210/en.2003-0320
3575
changes in maternal leptin (16). In contrast, in ewes fed amixture of roughage and concentrate, nutrient restriction inlate gestation has no effect on maternal plasma leptin (17).
The aim of the present study was to examine whethernutrient restriction of pregnant ewes sufficient to meet 60%of their metabolizable energy (ME) requirements between 28and 80 d gestation alters maternal leptin or cortisol status.This period was chosen because it is after the time of embryodevelopment, coincides with the main period of placentalgrowth (18), and is coincident with the stage at which ma-ternal plasma leptin concentrations are near maximal (16).The effects of nutrition on other important metabolic hor-mones during pregnancy (IGF-I, prolactin, and T4) togetherwith glucose, nonesterified fatty acid (NEFA), and urea ni-trogen were also examined. At the same time, we determinedwhether fetal adipose tissue endocrine sensitivity, as evi-denced by mRNA abundance of leptin and IGF-I and IGF-IIand their receptors, may also be reprogrammed as a conse-quence of nutrient restriction.
Materials and MethodsAnimals and diet
Welsh Mountain ewes of similar age (median, 3 yr) and weight [36.1 �0.9 kg (mean � sem)] were entered into the study. Estrus activity wasdetermined using a vasectomized ram whose breast was painted to markewes. Those ewes exhibiting estrus were then bred with one of two Texelrams, and breeding dates were established from the last date of observedmating. Throughout the study, body condition score was assessed by thesame individual who had no knowledge of the nutritional group towhich each ewe belonged. Physical characteristics were examined in thelumbar region, on and around the backbone, and in the loin, immedi-ately behind the last rib, using a scale of 0–5, with 0 being very thin and5 being grossly fat, as described by Russel et al. (19) and was 2.7 � 0.2arbitrary units at the start of the study. Ewes were individually housedat 28 d gestation and were fed daily at approximately 0900 h. Before thiseach ewe was fed 100 g concentrate/d and allowed access to hay adlibitum. Thereafter, the ME requirement for each animal was calculatedaccording to its body weight, taking into account requirements for bothewe maintenance and growth of the conceptus on the basis of producinga 4.5-kg lamb at term (20). Ewes were allocated to one of two nutritionalgroups using a stratified randomization by body weight. They wereoffered either 60% (i.e. NR) or 225% (i.e. allowed to feed to appetite) oftheir calculated ME requirements as described by Clarke et al. (21). Feedintakes were measured daily, and NR ewes consumed all of the feedoffered, whereas ewes fed to appetite consumed 150% of ME require-ments because not all of the hay was eaten. Diets were adjusted fort-nightly, but feed was not reduced if maternal body weight decreased.Food consumption between 28 and 80 d of gestation was, therefore,either 3.2–3.8 MJ/d of ME in the NR group (�60% of ME requirements)or 8.7–9.9 MJ/d of ME in the group fed to appetite (�150% of MErequirements). The amount of feed given to each ewe was increased at43 and 61 d gestation to meet the higher energy requirements associatedwith growth of the conceptus (20). The diet comprised chopped hay thathad an estimated ME content of 7.91 MJ/kg dry matter and a crudeprotein content (nitrogen � 6.25) of 69 g/kg dry matter and a barley-based concentrate that had an estimated ME content of 11.6 MJ/kg drymatter and a crude protein content of 162 g/kg dry matter. The pro-portion of hay to concentrate fed was approximately 3:1 with respect todry weight. All diets contained adequate minerals and vitamins. Bodycondition score was measured every 2 wk.
After 80 d gestation, equal numbers of ewes from each group eitherwere fed to appetite and consumed between 8–10.9 MJ/d of ME (150%of ME requirements) up to 140 d gestation (term � 147 d) or were offeredsufficient feed to meet 100% of the ME requirements as calculated toproduce a 4.5-kg newborn lamb. These animals consumed between 6.5and 7.5 MJ/d of ME. For all of these animals, the amount of feedprovided was increased at 100 and 120 d gestation to meet the increased
ME requirements that accompany the increase in fetal weight withgestation.
Experimental design
Maternal blood sampling. Approximately 2 wk before mating and at in-dividual housing at 28 d gestation, blood samples were taken by ve-nepuncture from all ewes. At approximately 20-d intervals between 41and 139 d gestation, jugular venous catheters were inserted into sevenNR ewes and seven ewes fed to appetite, and blood samples takenhourly the following day from 0800 h until 1600 h, with feeding atapproximately 0900 h. This protocol was confined to those ewes thatwere fed to appetite after 80 d gestation. All samples were taken intoheparinized syringes, transferred into ice-cold tubes, and centrifuged at3000 rpm for 30 min. The plasma was removed and stored at �20 C untilanalyzed.
Tissue sampling. At 80 d gestation, six NR ewes and five well-fed eweswere euthanized by administration of 100 mg/kg pentobarbital sodium(euthatal). The entire uterus was removed, and the fetus was killed withbarbiturate. From each ewe, a number of randomly chosen A typeplacentomes [which represent the majority of placentomes (21, 22)] wereimmediately dissected. These were then separated into their maternaland fetal components, placed in liquid nitrogen, and stored at �80 Cuntil analyzed together with a sample of maternal omental adiposetissue from each ewe. In addition, whole placentomes were fixed in 10%(wt/vol) formalin and embedded in paraffin wax for histological anal-ysis. Total placental weights were recorded as previously published byDandrea et al. (23). At 140 d gestation, the same sampling procedure wasrepeated on 10 previously NR ewes and 10 ewes fed to appetite, of whichhalf of each group had been fed to requirements from 80 d gestation. Atthis stage, the fetus was also weighed and dissected to enable samplingand storage of perirenal adipose tissue (which constitutes �80% ofadipose tissue in a fetal sheep) and the hypothalamic region. All oper-ative procedures and experimental protocols had the required HomeOffice approval as designated by the Animals (Scientific Procedures) Act(1986).
RNA analysis
Total RNA was isolated from adipose and placental tissue usingTri-Reagent (Sigma, Poole, UK) as previously described by Bispham etal. (24). Each set of cDNA primers is described in Table 1, and mRNAabundance was determined using RT-PCR with the same protocol asoutlined by Bispham et al. (24). In the case of increasing the RT-PCRconditions to detect mRNA for the leptin receptor in adipose tissue andthe placenta, the number of cycles was increased to 40, and temperatureranges from 58.2–60.7 C were examined. Agarose gel electrophoresis(2.0%) and ethidium bromide staining confirmed the presence of both
TABLE 1. Primer sequences used for detection of IGF-I andIGF-II, leptin, and their receptors (R) using PCR
Primer set BPproduct Primer sequences
IGF-I 401 F 5�-CCC ATC TCC CTG GAT TTC TT-3�R 5�-ACA TCT CCA GCC TCC TCA GA-3�
IGF-I R 498 F 5�-GCC TCC AAC TTT GTC TTT GC-3�R 5�-GCT GAA ATA CTC CGG GTT CA-3�
IGF-II 248 F 5�-TCA CAG CAG GAA AGT CGA TG-3�R 5�-GGC ACA GTA AGT CTC CAG CA-3�
IGF-II R 401 F 5�-ACC GGC ACTTCA ACT ACA CC-3�R 5�-ACT CAG AAT GAC GGC TTC GT-3�
Leptin 192 F 5�-CAC CAA AAC CCT CAT CAA GAC G-3�R 5�-ACA TTT CTG GAA GGC AGA CTG G-3�
Leptin R,long form
303 F 5�-GTC ATG CAT GCC ACC AAA TA-3�
R 5�-TCC TCT TTC ATC CAG CAC TGT-3�Leptin R,
all forms577 F 5�-ATG TTC CGA ACC CCA AGA AT-3�
R 5�-GTT CAT CCA GGC CTT CTG AG-3�
BP, Base pair.
3576 Endocrinology, August 2003, 144(8):3575–3585 Bispham et al. • Nutritional Manipulation in Pregnancy
the amplicon under test and 18S products of the expected sizes. Eachassay was performed in triplicate on all samples from each group ofewes. In the case of placental analysis, a mean value of the maternal andfetal placental leptin mRNA abundance measured separately from eachewe was used in subsequent statistical analyses.
Immunocytochemical analysis
Serial sections were prepared from paraffin embedded placental sam-ples taken at mid and late gestation as well as brown adipose tissuesampled at birth, and immunocytochemistry for leptin was performedusing an antiovine leptin (25) antiserum at a range of dilutions from 1:100to 1:1000 using the techniques described by Dandrea et al. (23). Afterincubation with enzyme-conjugated second antibody and chromogensubstrate, sections were examined by light microscopy. The specificityof the procedure was confirmed by the absence of binding when adjacentsections were incubated with rabbit serum from an unimmunized rabbitin place of rabbit antiovine primary antibody.
Metabolite and hormone analysis
Plasma concentrations of glucose and NEFA were measured enzy-matically, and T4 was measured by RIA as described by Clarke et al. (21).The concentration of IGF-I was determined by ELISA as described byHeasman et al. (26). Plasma prolactin was also analyzed by RIA usingthe methods described by McMillen et al. (27). Plasma concentrations ofprolactin were assayed in duplicate after a 1:10 and a 1:50 dilution usinga rabbit antiovine prolactin primary antibody, iodinated ovine prolactin,and goat antirabbit secondary antibody. The intra- and interassay co-efficients of variation for the assay were 3 and 9% (n � 5), respectively.Leptin was determined using a validated double antibody RIA as de-scribed by Delavaud et al. (28). Plasma concentrations of leptin wereassayed in duplicate 200-�l samples using a rabbit antiovine leptinprimary antibody, iodinated ovine leptin, and sheep antirabbit second-ary antibody. The leptin intra- and interassay coefficients of variationwere 4 and 11% (n � 5), respectively. Total cortisol was measured bycoated-tube RIA (Coat-a-count, Diagnostic Products Corp. Ltd., Caer-narfon, UK) and urea nitrogen by UV ELISA [BUN (Endpoint), SigmaDiagnostics, Gillingham, UK].
Statistical analysis
Plasma metabolite and hormone profiles throughout gestation wereanalyzed for effect of diet, gestational age, and their interaction by ageneral linear model (SPSS version 9.0, SPSS Inc., Chicago, IL). Thiscombines ANOVA with regression, allowing analysis of a dependentvariable against one or more qualitative independent variables withoutany assumption about the nature of their relationship. We performed arepeated-measure general linear model that analyses the independentdifferences between groups of related data that have been measuredmore than twice, considering the effects both alone and as interactions.Significant differences in ewe body weights, body condition score, andplasma leptin concentration between preconception and 28 d gestationwere assessed by Mann-Whitney U test.
ResultsMaternal feed intake, body weight and composition, andmaternal plasma cortisol concentration
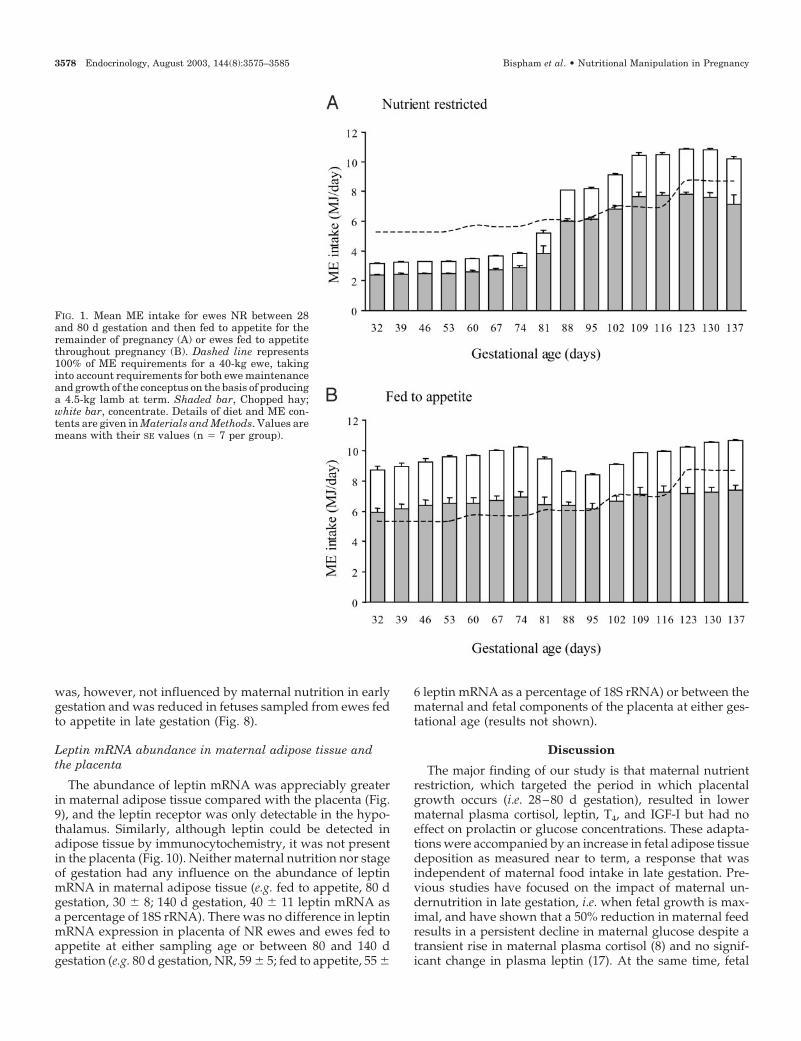
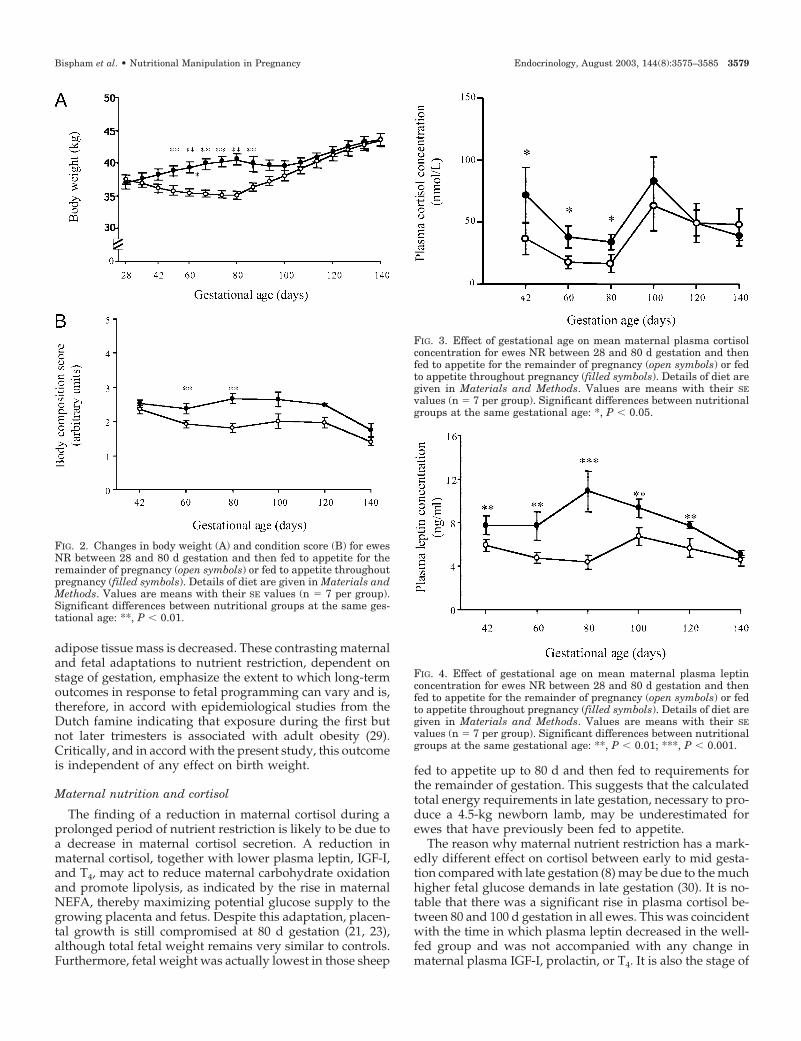
Between 28 and 80 d gestation, ewes fed to appetite con-sumed nearly three times more ME than the NR group (Fig.1). As a result, both body weight and condition score weresignificantly higher (P � 0.01) in the group fed to appetitefrom 42–100 d gestation (Fig. 2). After 80 d gestation, whenall of these ewes were offered the same amount of feed,intake gradually increased in previously NR ewes to plateauat around 109 d gestation. There was no difference in foodintake between groups when all ewes were fed to appetite.
When serial blood samples were taken at defined stages ofgestation, i.e. 42, 60, and 80 d gestation, from the same ewes
that were either NR or fed to appetite, maternal plasmacortisol was found to be consistently lower (P � 0.05) in NRewes compared with ewes fed to appetite (Fig. 3). This effectwas no longer apparent once the diet of the NR group wasrestored. Notably, there was an increase in plasma cortisolbetween 80 and 100 d gestation in both groups of ewes,irrespective of previous nutritional regime.
Plasma leptin concentration
In all ewes, plasma leptin increased by 28 d gestation(preconception 4.4 � 0.3; 28 d gestation 7.1 � 0.9 ng/ml (n �23) (P � 0.05)), an adaptation that was not accompanied byany significant changes in body weight (preconception35.8 � 0.7; 28 d gestation 37.1 � 0.6 kg) or condition score(preconception 2.7 � 0.2; 28 d gestation 2.3 � 0.1 arbitraryunits). During nutrient restriction, plasma leptin remainedunchanged up to 80 d gestation, compared with an increase(P � 0.002) in ewes fed to appetite, before declining (P � 0.05)up to term (Fig. 4). As a consequence, plasma leptin wassignificantly lower (P � 0.002) in NR ewes compared withwell-fed ewes at all sampling points with the exception of140 d gestation.
Plasma T4, prolactin, IGF-I, and metabolite concentrations
Plasma T4 and IGF-I concentrations were both lower in NRewes throughout the period of nutrient restriction (Table 2).Irrespective of feeding group, an increase in plasma T4 andIGF-I occurred in all ewes after 80 d gestation, to peak at 140 dgestation. Plasma prolactin was, however, similar betweengroups over the period of nutrient restriction and increasedin both groups up to 140 d gestation (Table 2).
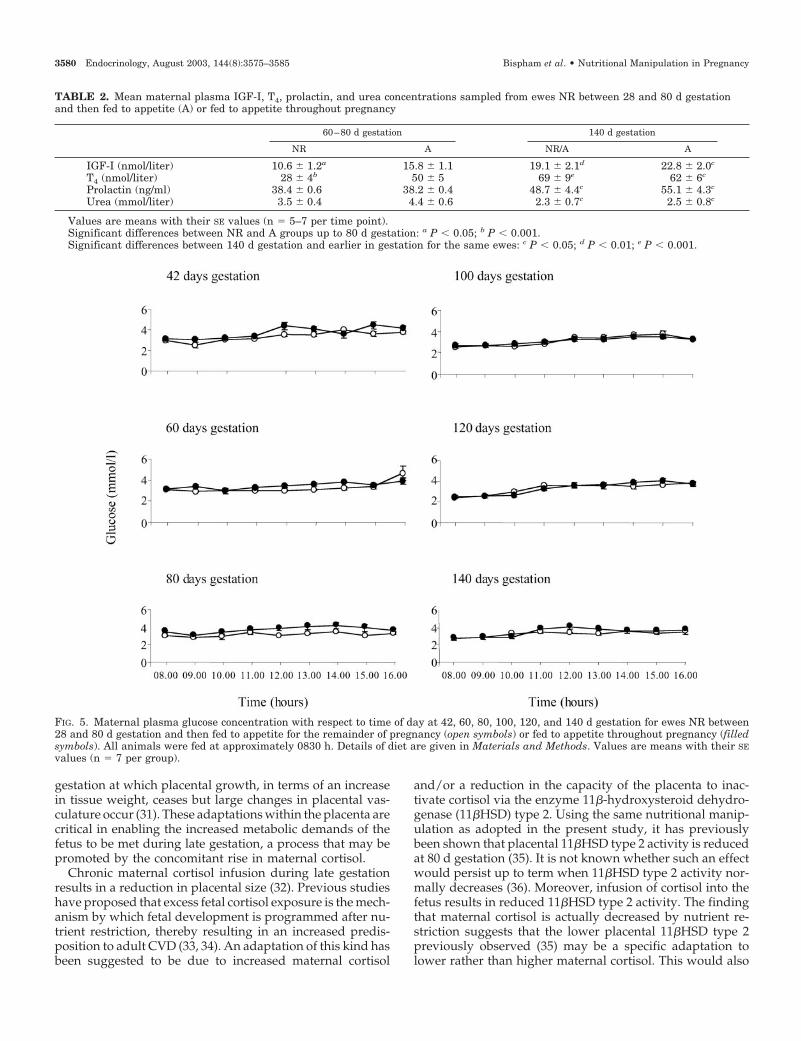
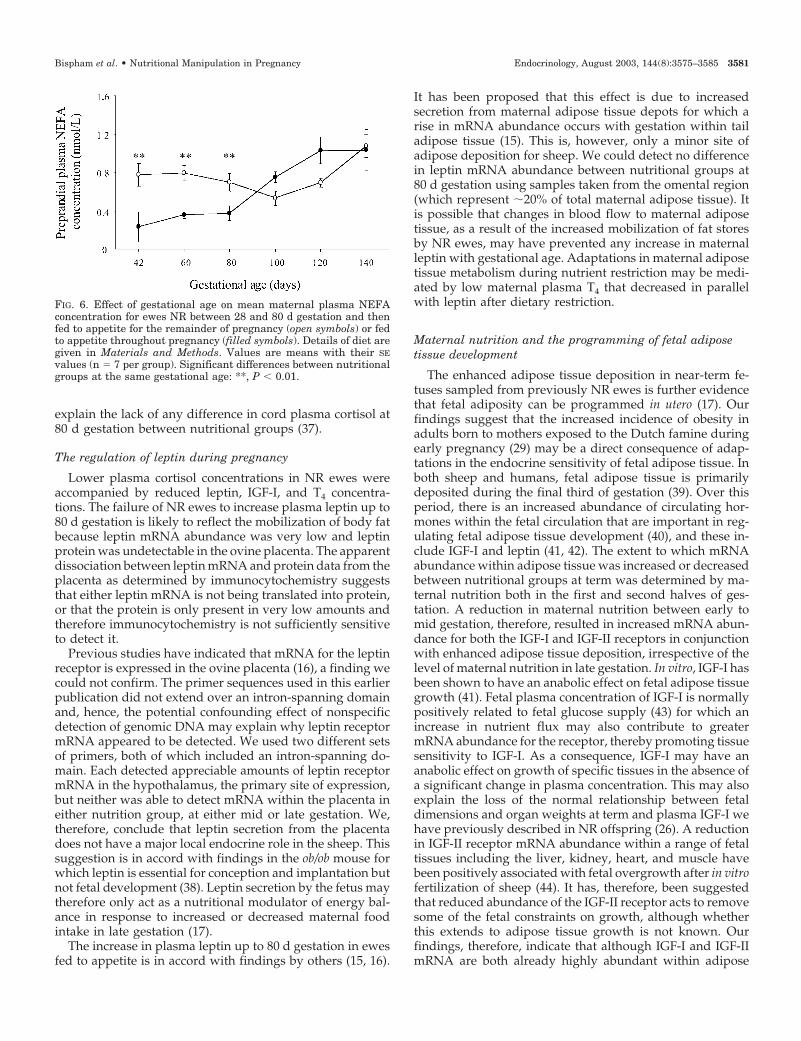
All ewes remained normoglycemic throughout the study,with comparable plasma glucose profiles being observed inboth groups throughout the study period (Fig. 5). PlasmaNEFA concentrations were significantly higher (P � 0.01) inNR ewes compared with those fed to appetite at 42, 60, and80 d gestation (Fig. 6). There was no difference betweengroups in plasma urea nitrogen concentration (Table 2),which remained unchanged throughout gestation before de-clining at 140 d gestation.
Fetal adipose tissue weight and composition
Fetal weight was significantly lower in ewes fed to appetiteup to 80 d gestation but then fed to 100% of ME requirementsup to term, compared with all other nutritional groups (Table3). Irrespective of weight at birth, fetuses sampled from ewesNR between 28 and 80 d gestation had significantly more(P � 0.05) adipose tissue than those sampled from ewes fedto appetite. This effect was irrespective of maternal nutritionin the second half of gestation, although fetuses of ewes fedto appetite in late gestation had less adipose tissue than thosefed only to 100% of ME requirements.
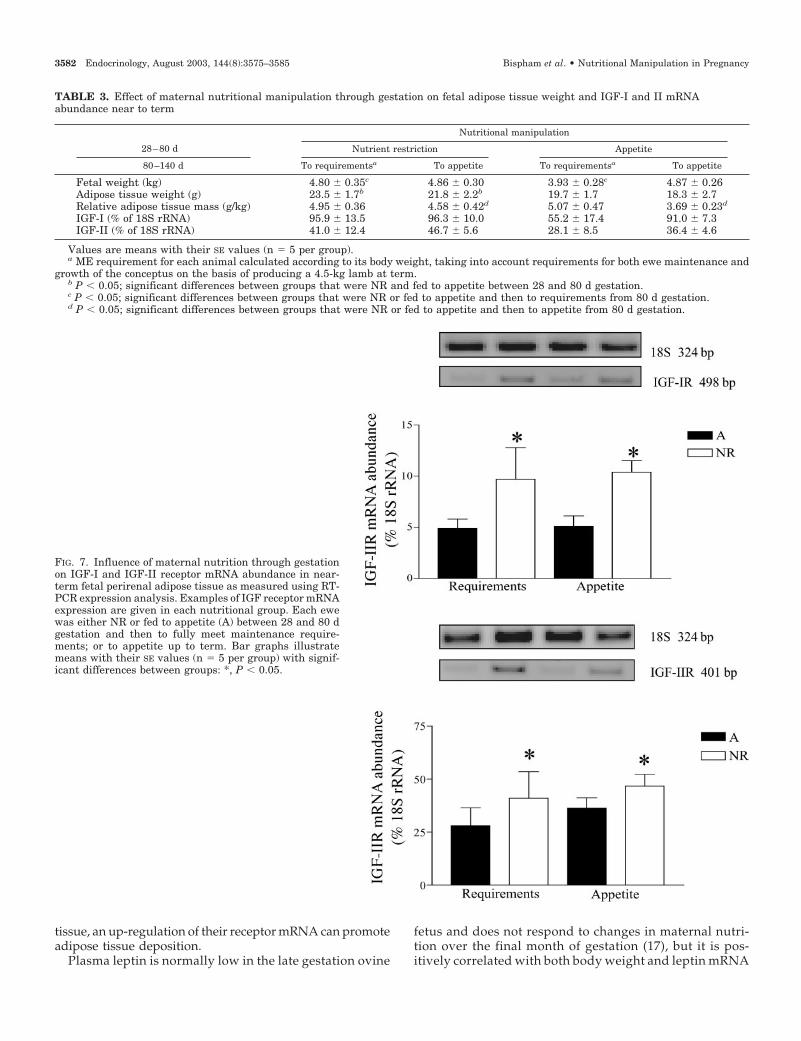
Adipose tissue of fetuses NR between 28 and 80 d gestationhad an increased mRNA abundance for IGF-I and IGF-IIreceptors compared with those fed to appetite in early ges-tation (Fig. 7). This response was unaffected by maternalnutrition in late gestation and was in the absence of any effecton IGF-I or IGF-II mRNA (Table 3). Leptin mRNA abundance
Bispham et al. • Nutritional Manipulation in Pregnancy Endocrinology, August 2003, 144(8):3575–3585 3577
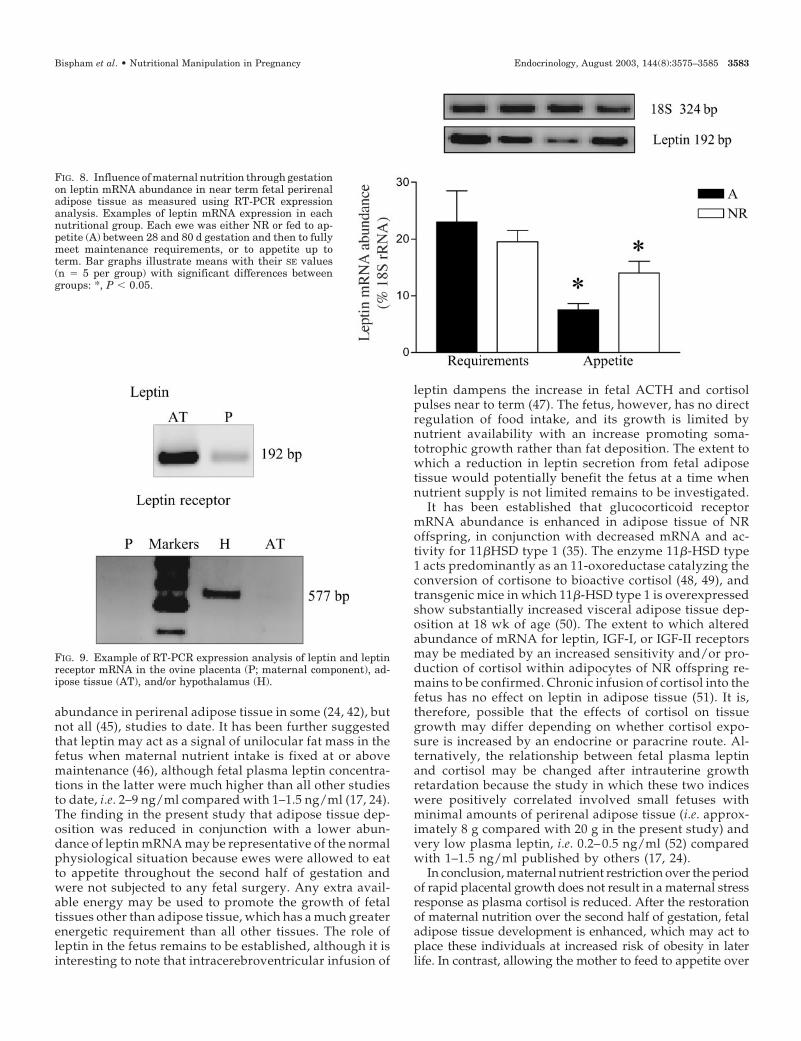
was, however, not influenced by maternal nutrition in earlygestation and was reduced in fetuses sampled from ewes fedto appetite in late gestation (Fig. 8).
Leptin mRNA abundance in maternal adipose tissue andthe placenta
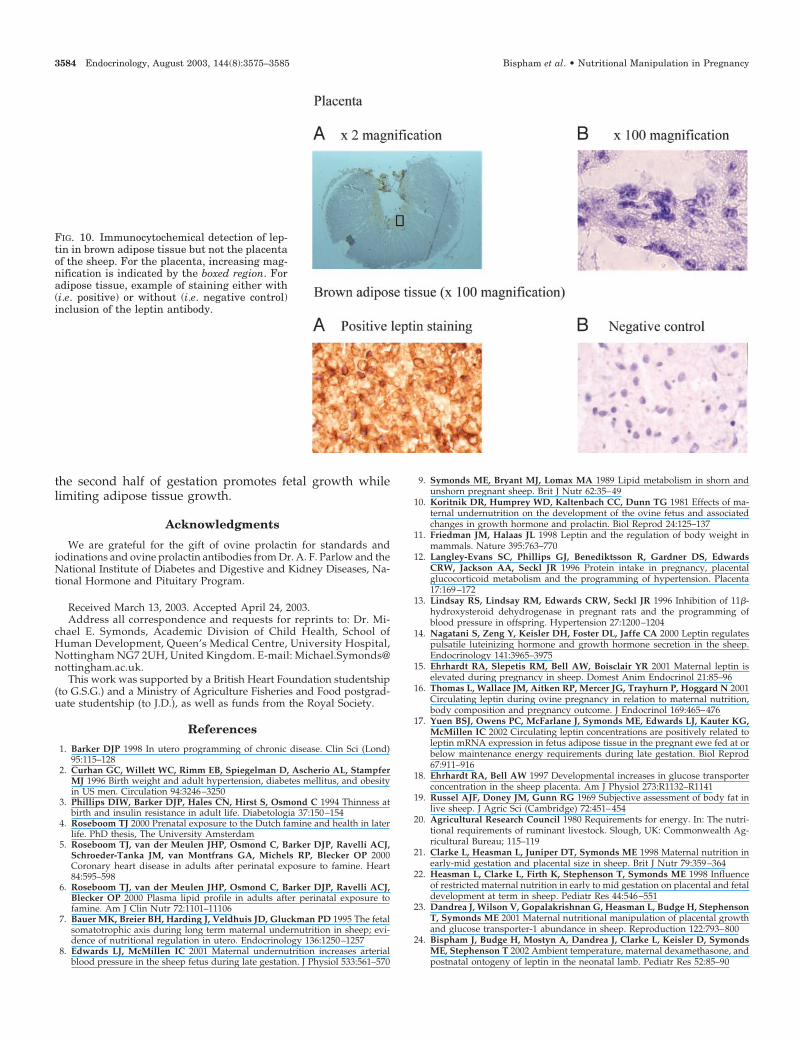
The abundance of leptin mRNA was appreciably greaterin maternal adipose tissue compared with the placenta (Fig.9), and the leptin receptor was only detectable in the hypo-thalamus. Similarly, although leptin could be detected inadipose tissue by immunocytochemistry, it was not presentin the placenta (Fig. 10). Neither maternal nutrition nor stageof gestation had any influence on the abundance of leptinmRNA in maternal adipose tissue (e.g. fed to appetite, 80 dgestation, 30 � 8; 140 d gestation, 40 � 11 leptin mRNA asa percentage of 18S rRNA). There was no difference in leptinmRNA expression in placenta of NR ewes and ewes fed toappetite at either sampling age or between 80 and 140 dgestation (e.g. 80 d gestation, NR, 59 � 5; fed to appetite, 55 �
6 leptin mRNA as a percentage of 18S rRNA) or between thematernal and fetal components of the placenta at either ges-tational age (results not shown).
Discussion
The major finding of our study is that maternal nutrientrestriction, which targeted the period in which placentalgrowth occurs (i.e. 28–80 d gestation), resulted in lowermaternal plasma cortisol, leptin, T4, and IGF-I but had noeffect on prolactin or glucose concentrations. These adapta-tions were accompanied by an increase in fetal adipose tissuedeposition as measured near to term, a response that wasindependent of maternal food intake in late gestation. Pre-vious studies have focused on the impact of maternal un-dernutrition in late gestation, i.e. when fetal growth is max-imal, and have shown that a 50% reduction in maternal feedresults in a persistent decline in maternal glucose despite atransient rise in maternal plasma cortisol (8) and no signif-icant change in plasma leptin (17). At the same time, fetal
FIG. 1. Mean ME intake for ewes NR between 28and 80 d gestation and then fed to appetite for theremainder of pregnancy (A) or ewes fed to appetitethroughout pregnancy (B). Dashed line represents100% of ME requirements for a 40-kg ewe, takinginto account requirements for both ewe maintenanceand growth of the conceptus on the basis of producinga 4.5-kg lamb at term. Shaded bar, Chopped hay;white bar, concentrate. Details of diet and ME con-tents are given in Materials and Methods. Values aremeans with their SE values (n � 7 per group).
3578 Endocrinology, August 2003, 144(8):3575–3585 Bispham et al. • Nutritional Manipulation in Pregnancy
adipose tissue mass is decreased. These contrasting maternaland fetal adaptations to nutrient restriction, dependent onstage of gestation, emphasize the extent to which long-termoutcomes in response to fetal programming can vary and is,therefore, in accord with epidemiological studies from theDutch famine indicating that exposure during the first butnot later trimesters is associated with adult obesity (29).Critically, and in accord with the present study, this outcomeis independent of any effect on birth weight.
Maternal nutrition and cortisol
The finding of a reduction in maternal cortisol during aprolonged period of nutrient restriction is likely to be due toa decrease in maternal cortisol secretion. A reduction inmaternal cortisol, together with lower plasma leptin, IGF-I,and T4, may act to reduce maternal carbohydrate oxidationand promote lipolysis, as indicated by the rise in maternalNEFA, thereby maximizing potential glucose supply to thegrowing placenta and fetus. Despite this adaptation, placen-tal growth is still compromised at 80 d gestation (21, 23),although total fetal weight remains very similar to controls.Furthermore, fetal weight was actually lowest in those sheep
fed to appetite up to 80 d and then fed to requirements forthe remainder of gestation. This suggests that the calculatedtotal energy requirements in late gestation, necessary to pro-duce a 4.5-kg newborn lamb, may be underestimated forewes that have previously been fed to appetite.
The reason why maternal nutrient restriction has a mark-edly different effect on cortisol between early to mid gesta-tion compared with late gestation (8) may be due to the muchhigher fetal glucose demands in late gestation (30). It is no-table that there was a significant rise in plasma cortisol be-tween 80 and 100 d gestation in all ewes. This was coincidentwith the time in which plasma leptin decreased in the well-fed group and was not accompanied with any change inmaternal plasma IGF-I, prolactin, or T4. It is also the stage of
FIG. 2. Changes in body weight (A) and condition score (B) for ewesNR between 28 and 80 d gestation and then fed to appetite for theremainder of pregnancy (open symbols) or fed to appetite throughoutpregnancy (filled symbols). Details of diet are given in Materials andMethods. Values are means with their SE values (n � 7 per group).Significant differences between nutritional groups at the same ges-tational age: **, P � 0.01.
FIG. 3. Effect of gestational age on mean maternal plasma cortisolconcentration for ewes NR between 28 and 80 d gestation and thenfed to appetite for the remainder of pregnancy (open symbols) or fedto appetite throughout pregnancy (filled symbols). Details of diet aregiven in Materials and Methods. Values are means with their SEvalues (n � 7 per group). Significant differences between nutritionalgroups at the same gestational age: *, P � 0.05.
FIG. 4. Effect of gestational age on mean maternal plasma leptinconcentration for ewes NR between 28 and 80 d gestation and thenfed to appetite for the remainder of pregnancy (open symbols) or fedto appetite throughout pregnancy (filled symbols). Details of diet aregiven in Materials and Methods. Values are means with their SEvalues (n � 7 per group). Significant differences between nutritionalgroups at the same gestational age: **, P � 0.01; ***, P � 0.001.
Bispham et al. • Nutritional Manipulation in Pregnancy Endocrinology, August 2003, 144(8):3575–3585 3579
gestation at which placental growth, in terms of an increasein tissue weight, ceases but large changes in placental vas-culature occur (31). These adaptations within the placenta arecritical in enabling the increased metabolic demands of thefetus to be met during late gestation, a process that may bepromoted by the concomitant rise in maternal cortisol.
Chronic maternal cortisol infusion during late gestationresults in a reduction in placental size (32). Previous studieshave proposed that excess fetal cortisol exposure is the mech-anism by which fetal development is programmed after nu-trient restriction, thereby resulting in an increased predis-position to adult CVD (33, 34). An adaptation of this kind hasbeen suggested to be due to increased maternal cortisol
and/or a reduction in the capacity of the placenta to inac-tivate cortisol via the enzyme 11�-hydroxysteroid dehydro-genase (11�HSD) type 2. Using the same nutritional manip-ulation as adopted in the present study, it has previouslybeen shown that placental 11�HSD type 2 activity is reducedat 80 d gestation (35). It is not known whether such an effectwould persist up to term when 11�HSD type 2 activity nor-mally decreases (36). Moreover, infusion of cortisol into thefetus results in reduced 11�HSD type 2 activity. The findingthat maternal cortisol is actually decreased by nutrient re-striction suggests that the lower placental 11�HSD type 2previously observed (35) may be a specific adaptation tolower rather than higher maternal cortisol. This would also
TABLE 2. Mean maternal plasma IGF-I, T4, prolactin, and urea concentrations sampled from ewes NR between 28 and 80 d gestationand then fed to appetite (A) or fed to appetite throughout pregnancy
60–80 d gestation 140 d gestation
NR A NR/A A
IGF-I (nmol/liter) 10.6 � 1.2a 15.8 � 1.1 19.1 � 2.1d 22.8 � 2.0c
T4 (nmol/liter) 28 � 4b 50 � 5 69 � 9e 62 � 6c
Prolactin (ng/ml) 38.4 � 0.6 38.2 � 0.4 48.7 � 4.4c 55.1 � 4.3c
Urea (mmol/liter) 3.5 � 0.4 4.4 � 0.6 2.3 � 0.7c 2.5 � 0.8c
Values are means with their SE values (n � 5–7 per time point).Significant differences between NR and A groups up to 80 d gestation: a P � 0.05; b P � 0.001.Significant differences between 140 d gestation and earlier in gestation for the same ewes: c P � 0.05; d P � 0.01; e P � 0.001.
FIG. 5. Maternal plasma glucose concentration with respect to time of day at 42, 60, 80, 100, 120, and 140 d gestation for ewes NR between28 and 80 d gestation and then fed to appetite for the remainder of pregnancy (open symbols) or fed to appetite throughout pregnancy (filledsymbols). All animals were fed at approximately 0830 h. Details of diet are given in Materials and Methods. Values are means with their SEvalues (n � 7 per group).
3580 Endocrinology, August 2003, 144(8):3575–3585 Bispham et al. • Nutritional Manipulation in Pregnancy
explain the lack of any difference in cord plasma cortisol at80 d gestation between nutritional groups (37).
The regulation of leptin during pregnancy
Lower plasma cortisol concentrations in NR ewes wereaccompanied by reduced leptin, IGF-I, and T4 concentra-tions. The failure of NR ewes to increase plasma leptin up to80 d gestation is likely to reflect the mobilization of body fatbecause leptin mRNA abundance was very low and leptinprotein was undetectable in the ovine placenta. The apparentdissociation between leptin mRNA and protein data from theplacenta as determined by immunocytochemistry suggeststhat either leptin mRNA is not being translated into protein,or that the protein is only present in very low amounts andtherefore immunocytochemistry is not sufficiently sensitiveto detect it.
Previous studies have indicated that mRNA for the leptinreceptor is expressed in the ovine placenta (16), a finding wecould not confirm. The primer sequences used in this earlierpublication did not extend over an intron-spanning domainand, hence, the potential confounding effect of nonspecificdetection of genomic DNA may explain why leptin receptormRNA appeared to be detected. We used two different setsof primers, both of which included an intron-spanning do-main. Each detected appreciable amounts of leptin receptormRNA in the hypothalamus, the primary site of expression,but neither was able to detect mRNA within the placenta ineither nutrition group, at either mid or late gestation. We,therefore, conclude that leptin secretion from the placentadoes not have a major local endocrine role in the sheep. Thissuggestion is in accord with findings in the ob/ob mouse forwhich leptin is essential for conception and implantation butnot fetal development (38). Leptin secretion by the fetus maytherefore only act as a nutritional modulator of energy bal-ance in response to increased or decreased maternal foodintake in late gestation (17).
The increase in plasma leptin up to 80 d gestation in ewesfed to appetite is in accord with findings by others (15, 16).
It has been proposed that this effect is due to increasedsecretion from maternal adipose tissue depots for which arise in mRNA abundance occurs with gestation within tailadipose tissue (15). This is, however, only a minor site ofadipose deposition for sheep. We could detect no differencein leptin mRNA abundance between nutritional groups at80 d gestation using samples taken from the omental region(which represent �20% of total maternal adipose tissue). Itis possible that changes in blood flow to maternal adiposetissue, as a result of the increased mobilization of fat storesby NR ewes, may have prevented any increase in maternalleptin with gestational age. Adaptations in maternal adiposetissue metabolism during nutrient restriction may be medi-ated by low maternal plasma T4 that decreased in parallelwith leptin after dietary restriction.
Maternal nutrition and the programming of fetal adiposetissue development
The enhanced adipose tissue deposition in near-term fe-tuses sampled from previously NR ewes is further evidencethat fetal adiposity can be programmed in utero (17). Ourfindings suggest that the increased incidence of obesity inadults born to mothers exposed to the Dutch famine duringearly pregnancy (29) may be a direct consequence of adap-tations in the endocrine sensitivity of fetal adipose tissue. Inboth sheep and humans, fetal adipose tissue is primarilydeposited during the final third of gestation (39). Over thisperiod, there is an increased abundance of circulating hor-mones within the fetal circulation that are important in reg-ulating fetal adipose tissue development (40), and these in-clude IGF-I and leptin (41, 42). The extent to which mRNAabundance within adipose tissue was increased or decreasedbetween nutritional groups at term was determined by ma-ternal nutrition both in the first and second halves of ges-tation. A reduction in maternal nutrition between early tomid gestation, therefore, resulted in increased mRNA abun-dance for both the IGF-I and IGF-II receptors in conjunctionwith enhanced adipose tissue deposition, irrespective of thelevel of maternal nutrition in late gestation. In vitro, IGF-I hasbeen shown to have an anabolic effect on fetal adipose tissuegrowth (41). Fetal plasma concentration of IGF-I is normallypositively related to fetal glucose supply (43) for which anincrease in nutrient flux may also contribute to greatermRNA abundance for the receptor, thereby promoting tissuesensitivity to IGF-I. As a consequence, IGF-I may have ananabolic effect on growth of specific tissues in the absence ofa significant change in plasma concentration. This may alsoexplain the loss of the normal relationship between fetaldimensions and organ weights at term and plasma IGF-I wehave previously described in NR offspring (26). A reductionin IGF-II receptor mRNA abundance within a range of fetaltissues including the liver, kidney, heart, and muscle havebeen positively associated with fetal overgrowth after in vitrofertilization of sheep (44). It has, therefore, been suggestedthat reduced abundance of the IGF-II receptor acts to removesome of the fetal constraints on growth, although whetherthis extends to adipose tissue growth is not known. Ourfindings, therefore, indicate that although IGF-I and IGF-IImRNA are both already highly abundant within adipose
FIG. 6. Effect of gestational age on mean maternal plasma NEFAconcentration for ewes NR between 28 and 80 d gestation and thenfed to appetite for the remainder of pregnancy (open symbols) or fedto appetite throughout pregnancy (filled symbols). Details of diet aregiven in Materials and Methods. Values are means with their SEvalues (n � 7 per group). Significant differences between nutritionalgroups at the same gestational age: **, P � 0.01.
Bispham et al. • Nutritional Manipulation in Pregnancy Endocrinology, August 2003, 144(8):3575–3585 3581
tissue, an up-regulation of their receptor mRNA can promoteadipose tissue deposition.
Plasma leptin is normally low in the late gestation ovine
fetus and does not respond to changes in maternal nutri-tion over the final month of gestation (17), but it is pos-itively correlated with both body weight and leptin mRNA
TABLE 3. Effect of maternal nutritional manipulation through gestation on fetal adipose tissue weight and IGF-I and II mRNAabundance near to term
28–80 d
Nutritional manipulation
Nutrient restriction Appetite
80–140 d To requirementsa To appetite To requirementsa To appetite
Fetal weight (kg) 4.80 � 0.35c 4.86 � 0.30 3.93 � 0.28c 4.87 � 0.26Adipose tissue weight (g) 23.5 � 1.7b 21.8 � 2.2b 19.7 � 1.7 18.3 � 2.7Relative adipose tissue mass (g/kg) 4.95 � 0.36 4.58 � 0.42d 5.07 � 0.47 3.69 � 0.23d
IGF-I (% of 18S rRNA) 95.9 � 13.5 96.3 � 10.0 55.2 � 17.4 91.0 � 7.3IGF-II (% of 18S rRNA) 41.0 � 12.4 46.7 � 5.6 28.1 � 8.5 36.4 � 4.6
Values are means with their SE values (n � 5 per group).a ME requirement for each animal calculated according to its body weight, taking into account requirements for both ewe maintenance and
growth of the conceptus on the basis of producing a 4.5-kg lamb at term.b P � 0.05; significant differences between groups that were NR and fed to appetite between 28 and 80 d gestation.c P � 0.05; significant differences between groups that were NR or fed to appetite and then to requirements from 80 d gestation.d P � 0.05; significant differences between groups that were NR or fed to appetite and then to appetite from 80 d gestation.
FIG. 7. Influence of maternal nutrition through gestationon IGF-I and IGF-II receptor mRNA abundance in near-term fetal perirenal adipose tissue as measured using RT-PCR expression analysis. Examples of IGF receptor mRNAexpression are given in each nutritional group. Each ewewas either NR or fed to appetite (A) between 28 and 80 dgestation and then to fully meet maintenance require-ments; or to appetite up to term. Bar graphs illustratemeans with their SE values (n � 5 per group) with signif-icant differences between groups: *, P � 0.05.
3582 Endocrinology, August 2003, 144(8):3575–3585 Bispham et al. • Nutritional Manipulation in Pregnancy
abundance in perirenal adipose tissue in some (24, 42), butnot all (45), studies to date. It has been further suggestedthat leptin may act as a signal of unilocular fat mass in thefetus when maternal nutrient intake is fixed at or abovemaintenance (46), although fetal plasma leptin concentra-tions in the latter were much higher than all other studiesto date, i.e. 2–9 ng/ml compared with 1–1.5 ng/ml (17, 24).The finding in the present study that adipose tissue dep-osition was reduced in conjunction with a lower abun-dance of leptin mRNA may be representative of the normalphysiological situation because ewes were allowed to eatto appetite throughout the second half of gestation andwere not subjected to any fetal surgery. Any extra avail-able energy may be used to promote the growth of fetaltissues other than adipose tissue, which has a much greaterenergetic requirement than all other tissues. The role ofleptin in the fetus remains to be established, although it isinteresting to note that intracerebroventricular infusion of
leptin dampens the increase in fetal ACTH and cortisolpulses near to term (47). The fetus, however, has no directregulation of food intake, and its growth is limited bynutrient availability with an increase promoting soma-totrophic growth rather than fat deposition. The extent towhich a reduction in leptin secretion from fetal adiposetissue would potentially benefit the fetus at a time whennutrient supply is not limited remains to be investigated.
It has been established that glucocorticoid receptormRNA abundance is enhanced in adipose tissue of NRoffspring, in conjunction with decreased mRNA and ac-tivity for 11�HSD type 1 (35). The enzyme 11�-HSD type1 acts predominantly as an 11-oxoreductase catalyzing theconversion of cortisone to bioactive cortisol (48, 49), andtransgenic mice in which 11�-HSD type 1 is overexpressedshow substantially increased visceral adipose tissue dep-osition at 18 wk of age (50). The extent to which alteredabundance of mRNA for leptin, IGF-I, or IGF-II receptorsmay be mediated by an increased sensitivity and/or pro-duction of cortisol within adipocytes of NR offspring re-mains to be confirmed. Chronic infusion of cortisol into thefetus has no effect on leptin in adipose tissue (51). It is,therefore, possible that the effects of cortisol on tissuegrowth may differ depending on whether cortisol expo-sure is increased by an endocrine or paracrine route. Al-ternatively, the relationship between fetal plasma leptinand cortisol may be changed after intrauterine growthretardation because the study in which these two indiceswere positively correlated involved small fetuses withminimal amounts of perirenal adipose tissue (i.e. approx-imately 8 g compared with 20 g in the present study) andvery low plasma leptin, i.e. 0.2– 0.5 ng/ml (52) comparedwith 1–1.5 ng/ml published by others (17, 24).
In conclusion, maternal nutrient restriction over the periodof rapid placental growth does not result in a maternal stressresponse as plasma cortisol is reduced. After the restorationof maternal nutrition over the second half of gestation, fetaladipose tissue development is enhanced, which may act toplace these individuals at increased risk of obesity in laterlife. In contrast, allowing the mother to feed to appetite over
FIG. 8. Influence of maternal nutrition through gestationon leptin mRNA abundance in near term fetal perirenaladipose tissue as measured using RT-PCR expressionanalysis. Examples of leptin mRNA expression in eachnutritional group. Each ewe was either NR or fed to ap-petite (A) between 28 and 80 d gestation and then to fullymeet maintenance requirements, or to appetite up toterm. Bar graphs illustrate means with their SE values(n � 5 per group) with significant differences betweengroups: *, P � 0.05.
FIG. 9. Example of RT-PCR expression analysis of leptin and leptinreceptor mRNA in the ovine placenta (P; maternal component), ad-ipose tissue (AT), and/or hypothalamus (H).
Bispham et al. • Nutritional Manipulation in Pregnancy Endocrinology, August 2003, 144(8):3575–3585 3583
the second half of gestation promotes fetal growth whilelimiting adipose tissue growth.
Acknowledgments
We are grateful for the gift of ovine prolactin for standards andiodinations and ovine prolactin antibodies from Dr. A. F. Parlow and theNational Institute of Diabetes and Digestive and Kidney Diseases, Na-tional Hormone and Pituitary Program.
Received March 13, 2003. Accepted April 24, 2003.Address all correspondence and requests for reprints to: Dr. Mi-
chael E. Symonds, Academic Division of Child Health, School ofHuman Development, Queen’s Medical Centre, University Hospital,Nottingham NG7 2UH, United Kingdom. E-mail: [email protected].
This work was supported by a British Heart Foundation studentship(to G.S.G.) and a Ministry of Agriculture Fisheries and Food postgrad-uate studentship (to J.D.), as well as funds from the Royal Society.
References
1. Barker DJP 1998 In utero programming of chronic disease. Clin Sci (Lond)95:115–128
2. Curhan GC, Willett WC, Rimm EB, Spiegelman D, Ascherio AL, StampferMJ 1996 Birth weight and adult hypertension, diabetes mellitus, and obesityin US men. Circulation 94:3246–3250
3. Phillips DIW, Barker DJP, Hales CN, Hirst S, Osmond C 1994 Thinness atbirth and insulin resistance in adult life. Diabetologia 37:150–154
4. Roseboom TJ 2000 Prenatal exposure to the Dutch famine and health in laterlife. PhD thesis, The University Amsterdam
5. Roseboom TJ, van der Meulen JHP, Osmond C, Barker DJP, Ravelli ACJ,Schroeder-Tanka JM, van Montfrans GA, Michels RP, Blecker OP 2000Coronary heart disease in adults after perinatal exposure to famine. Heart84:595–598
6. Roseboom TJ, van der Meulen JHP, Osmond C, Barker DJP, Ravelli ACJ,Blecker OP 2000 Plasma lipid profile in adults after perinatal exposure tofamine. Am J Clin Nutr 72:1101–11106
7. Bauer MK, Breier BH, Harding J, Veldhuis JD, Gluckman PD 1995 The fetalsomatotrophic axis during long term maternal undernutrition in sheep; evi-dence of nutritional regulation in utero. Endocrinology 136:1250–1257
8. Edwards LJ, McMillen IC 2001 Maternal undernutrition increases arterialblood pressure in the sheep fetus during late gestation. J Physiol 533:561–570
9. Symonds ME, Bryant MJ, Lomax MA 1989 Lipid metabolism in shorn andunshorn pregnant sheep. Brit J Nutr 62:35–49
10. Koritnik DR, Humprey WD, Kaltenbach CC, Dunn TG 1981 Effects of ma-ternal undernutrition on the development of the ovine fetus and associatedchanges in growth hormone and prolactin. Biol Reprod 24:125–137
11. Friedman JM, Halaas JL 1998 Leptin and the regulation of body weight inmammals. Nature 395:763–770
12. Langley-Evans SC, Phillips GJ, Benediktsson R, Gardner DS, EdwardsCRW, Jackson AA, Seckl JR 1996 Protein intake in pregnancy, placentalglucocorticoid metabolism and the programming of hypertension. Placenta17:169–172
13. Lindsay RS, Lindsay RM, Edwards CRW, Seckl JR 1996 Inhibition of 11�-hydroxysteroid dehydrogenase in pregnant rats and the programming ofblood pressure in offspring. Hypertension 27:1200–1204
14. Nagatani S, Zeng Y, Keisler DH, Foster DL, Jaffe CA 2000 Leptin regulatespulsatile luteinizing hormone and growth hormone secretion in the sheep.Endocrinology 141:3965–3975
15. Ehrhardt RA, Slepetis RM, Bell AW, Boisclair YR 2001 Maternal leptin iselevated during pregnancy in sheep. Domest Anim Endocrinol 21:85–96
16. Thomas L, Wallace JM, Aitken RP, Mercer JG, Trayhurn P, Hoggard N 2001Circulating leptin during ovine pregnancy in relation to maternal nutrition,body composition and pregnancy outcome. J Endocrinol 169:465–476
17. Yuen BSJ, Owens PC, McFarlane J, Symonds ME, Edwards LJ, Kauter KG,McMillen IC 2002 Circulating leptin concentrations are positively related toleptin mRNA expression in fetus adipose tissue in the pregnant ewe fed at orbelow maintenance energy requirements during late gestation. Biol Reprod67:911–916
18. Ehrhardt RA, Bell AW 1997 Developmental increases in glucose transporterconcentration in the sheep placenta. Am J Physiol 273:R1132–R1141
19. Russel AJF, Doney JM, Gunn RG 1969 Subjective assessment of body fat inlive sheep. J Agric Sci (Cambridge) 72:451–454
20. Agricultural Research Council 1980 Requirements for energy. In: The nutri-tional requirements of ruminant livestock. Slough, UK: Commonwealth Ag-ricultural Bureau; 115–119
21. Clarke L, Heasman L, Juniper DT, Symonds ME 1998 Maternal nutrition inearly-mid gestation and placental size in sheep. Brit J Nutr 79:359–364
22. Heasman L, Clarke L, Firth K, Stephenson T, Symonds ME 1998 Influenceof restricted maternal nutrition in early to mid gestation on placental and fetaldevelopment at term in sheep. Pediatr Res 44:546–551
23. Dandrea J, Wilson V, Gopalakrishnan G, Heasman L, Budge H, StephensonT, Symonds ME 2001 Maternal nutritional manipulation of placental growthand glucose transporter-1 abundance in sheep. Reproduction 122:793–800
24. Bispham J, Budge H, Mostyn A, Dandrea J, Clarke L, Keisler D, SymondsME, Stephenson T 2002 Ambient temperature, maternal dexamethasone, andpostnatal ontogeny of leptin in the neonatal lamb. Pediatr Res 52:85–90
FIG. 10. Immunocytochemical detection of lep-tin in brown adipose tissue but not the placentaof the sheep. For the placenta, increasing mag-nification is indicated by the boxed region. Foradipose tissue, example of staining either with(i.e. positive) or without (i.e. negative control)inclusion of the leptin antibody.
3584 Endocrinology, August 2003, 144(8):3575–3585 Bispham et al. • Nutritional Manipulation in Pregnancy
25. Gertler A, Simmons J, Keisler DH 1998 Large-scale preparation of biologicallyactive recombinant ovine obese protein (leptin). FEBS Lett 422:137–140
26. Heasman L, Brameld JM, Mostyn A, Budge H, Dawson J, Buttery PJ, Ste-phenson T, Symonds ME 2000 Maternal nutrient restriction during early tomid gestation alters the relationship between IGF-I and body weight at termin fetal sheep. Reprod Fertil Dev 12:345–350
27. McMillen IC, Thorburn GD, Walker DW 1987 Diurnal variations in plasmaconcentrations of cortisol, prolactin, growth hormone and glucose in the fetalsheep and pregnant ewe during late gestation. J Endocrinol 114:65–72
28. Delavaud C, Bocquier F, Chilliard Y, Keisler DH, Gertler A, Kann G 2000Effect of sheep nutritional status and body fatness on plasma leptin concen-tration assessed by a specific RIA. J Endocrinol 165:519–526
29. Roseboom TJ, van der Meulen JHP, Osmond C, Barker DJP, Ravelli ACJ,Blecker OP 2000 Plasma lipid profile in adults after perinatal exposure tofamine. Am J Clin Nutr 72:1101–1106
30. Molina RD, Meschia G, Battaglia FC, Hay WW 1991 Gestational maturationof placental transfer of glucose. Am J Physiol 261:R697–R704
31. Stegmann JHJ 1974 Placental development in sheep. Bijdragen tot deDierkunde 44:4–72
32. Jenson EC, Gallaher BW, Breier BH, Harding JE 2002 The effect of chronicmaternal cortisol infusion on the late-gestation fetal sheep. J Endocrinol 174:27–36
33. Dodic M, Hantzis V, Duncan J, Rees S, Koukoulas I, Johnson K, Wintour EM,Moritz K 2002 Programming effects of short prenatal exposure to cortisol.FASEB J 16:1017–1026
34. Bertram CE, Hanson MA 2002 Prenatal programming of postnatal endocrineresponses by glucocorticoids. Reproduction 124:459–467
35. Whorwood CB, Firth KM, Budge H, Symonds ME 2001 Maternal undernu-trition during early to midgestation programs tissue-specific alterations in theexpression of the glucocorticoid receptor, 11�-hydroxysteroid dehydrogenaseisoforms, and type 1 angiotensin II receptor in neonatal sheep. Endocrinology142:1778–1785
36. Clarke KA, Ward JW, Forhead AJ, Giussani DA, Fowden AL 2002 Regulationof 11�-hydroxysteroid dehydrogenase type 2 activity in ovine placenta by fetalcortisol. J Endocrinol 172:527–534
37. Brameld JM, Mostyn A, Dandrea J, Stephenson TJ, Dawson J, Buttery PJ,Symonds ME 2000 Maternal nutrition alters the expression of insulin-likegrowth factors in fetal sheep liver and skeletal muscle. J Endocrinol 167:429–437
38. Malik NM, Carter ND, Murray JF, Scaramuzzi RJ, Wilson CA, Stock MJ 2001Leptin requirement for conception, implantation, and gestation in the mouse.Endocrinology 142:5198–5202
39. Symonds ME, Lomax MA 1992 Maternal and environmental influences onthermoregulation in the neonate. Proc Nutr Soc 51:165–172
40. Symonds ME, Stephenson T 1999 Maternal nutrient restriction and endocrineprogramming of fetal adipose tissue development. Biochem Soc Trans 27:97–103
41. Lorenzo M, Valverde AM, Teurel T, Benito M 1993 IGF-I is a mitogeninvolved in differentiation-related gene expression in fetal brown adipocytes.J Cell Biol 123:1567–1575
42. Yuen BSJ, McMillen IC, Symonds ME, Owens PC 1999 Abundance of leptinmessenger ribonucleic acid in fetal adipose tissue is related to fetal bodyweight. J Endocrinol 163:R1–R4
43. Owens JA, Kind KL, Carbone F, Robinson JS, Owens PC 1994 Circulatinginsulin-like growth factors-I and -II and substrates in fetal sheep followingrestriction of placental growth. J Endocrinol 140:5–13
44. Young L, Fernandes K, McEvoy T, Butterwith S, Gutierrez C, Carolan C,Broadbent P, Robinson J, Wilmut I, Sinclair K 2001 Epigenetic change inIGF2R is associated with fetal overgrowth after embryo culture. Nat Genet27:153–154
45. Devasker SU, Anthony RV, Hay WW 2002 Ontogeny and insulin regulationof fetal ovine white adipose tissue leptin expression. Am J Physiol 282:R431–R438
46. Mulhlauser BS, Roberts CT, McFarlane J, Kauter KG, McMillen IC 2002 Fetalleptin is a signal of fat mass independent of maternal nutrition in ewes fed ator above maintenance energy requirements. Biol Reprod 67:493–499
47. Howe DC, Gertler A, Challis JRG 2002 The late gestation increase in circu-lating ACTH and cortisol in the fetal sheep is suppressed by intracerebro-ventricular infusion of recombinant ovine leptin. J Endocrinol 170:259–266
48. Bamberger CM, Schulte HM, Chrousos GP 1996 Molecular determinants ofglucocorticoid receptor function and tissue sensitivity to glucocorticoids. En-docr Rev 17:245–261
49. Stewart PM, Krozowski ZS 1999 11�-Hydroxysteroid dehydrogenase. VitamHorm 57:249–324
50. Masuzaki H, Paterson J, Shinyama H, Morton NM, Mullins JJ, Seckl JR, FlierJS 2001 A transgenic model of visceral obesity and the metabolic syndrome.Science 294:2166–2170
51. Mostyn A, Pearce S, Budge H, Elmes M, Forehead AJ, Fowden AL, SymondsME, Stephenson T 2003 Influence of cortisol on adipose tissue developmentin the fetal sheep during late gestation. J Endocrinol 176:23–30
52. Forhead AJ, Thomas L, Crabtree J, Hoggard N, Gardner DS, Giussani DA,Fowden AL 2002 Plasma leptin concentrations in fetal sheep during lategestation: ontogeny and effect of glucocorticoids. Endocrinology 275:1166–1173
Bispham et al. • Nutritional Manipulation in Pregnancy Endocrinology, August 2003, 144(8):3575–3585 3585
Copyright © 2022 FDOKUMEN