Materials Chemistry A - RSC Publishing
23
This is an Accepted Manuscript, which has been through the Royal Society of Chemistry peer review process and has been accepted for publication. Accepted Manuscripts are published online shortly after acceptance, before technical editing, formatting and proof reading. Using this free service, authors can make their results available to the community, in citable form, before we publish the edited article. We will replace this Accepted Manuscript with the edited and formatted Advance Article as soon as it is available. You can find more information about Accepted Manuscripts in the Information for Authors. Please note that technical editing may introduce minor changes to the text and/or graphics, which may alter content. The journal’s standard Terms & Conditions and the Ethical guidelines still apply. In no event shall the Royal Society of Chemistry be held responsible for any errors or omissions in this Accepted Manuscript or any consequences arising from the use of any information it contains. Accepted Manuscript Journal of Materials Chemistry A www.rsc.org/materialsA
-
Upload
khangminh22 -
Category
Documents
-
view
0 -
download
0
Transcript of Materials Chemistry A - RSC Publishing

This is an Accepted Manuscript, which has been through the Royal Society of Chemistry peer review process and has been accepted for publication.
Accepted Manuscripts are published online shortly after acceptance, before technical editing, formatting and proof reading. Using this free service, authors can make their results available to the community, in citable form, before we publish the edited article. We will replace this Accepted Manuscript with the edited and formatted Advance Article as soon as it is available.
You can find more information about Accepted Manuscripts in the Information for Authors.
Please note that technical editing may introduce minor changes to the text and/or graphics, which may alter content. The journal’s standard Terms & Conditions and the Ethical guidelines still apply. In no event shall the Royal Society of Chemistry be held responsible for any errors or omissions in this Accepted Manuscript or any consequences arising from the use of any information it contains.
Accepted Manuscript
Journal of Materials Chemistry A
www.rsc.org/materialsA
1
Crosslinked Polyaniline Nanorods with Improved
Electrochemical Performance as Electrode Material
for Supercapacitor
Xue Wang, Jinxing Deng, Xiaojuan Duan, Dong Liu, Jinshan Guo and Peng Liu*
State Key Laboratory of Applied Organic Chemistry and Resources Utilization of Gansu
Province, College of Chemistry and Chemical Engineering, Lanzhou University, Lanzhou
730000, China
AUTHOR INFORMATION
Corresponding Author
*E-mail: [email protected]. Tel./Fax: 86-931-8912582.
Page 1 of 22 Journal of Materials Chemistry A
Jour
nalo
fMat
eria
lsC
hem
istr
yA
Acc
epte
dM
anus
crip
t
2
Abstract
In order to improve the electrochemical performance of polyaniline (PANI), the crosslinked
polyaniline nanorods (CPANI) were prepared via chemical oxidative copolymerization of aniline
with p-phenylenediamine (PPDA) and triphenylamine (TPA). Their morphology and structure
were compared with polyaniline (PANI) via Transmission electron microscopy (TEM), Scanning
electron microscopy (SEM), Fourier transform infrared spectroscopy (FTIR), X-ray powder
diffraction (XRD) and Thermogravimetric analysis (TGA) techniques. The CPANI nanorods
exhibited an improved electrical conductivity (33.3 S cm-1
) in comparison with the PANI (4.26 S
cm-1
). Its electrochemical performance was studied by galvanostatic charge/discharge (GCD),
cyclic voltommetry (CV) and electrochemical impedance spectroscopy (EIS) tests. The CPANI
nanorods exhibited a maximum specific capacitance of 455.1 F g-1
at a scan rate of 1 mV s-1
in
1.0 mol L-1
H2SO4 electrolyte, also much higher than that of the PANI (286.7 F g-1
). Notably, the
cycling stability of the CPANI electrode had been improved significantly by the chemical
crosslinking, and could remain higher capacitance retention after 1300 cycles.
Keywords: Polyaniline; Crosslinked; Nanorods; In-situ copolymerization; Electrochemical
performance
Page 2 of 22Journal of Materials Chemistry A
Jour
nalo
fMat
eria
lsC
hem
istr
yA
Acc
epte
dM
anus
crip
t
3
1. INTRODUCTION
At present, the electrochemical supercapacitors, as energy storage devices between secondary
batteries and traditional capacitors, has been considerably focused due to their remarkable
properties including high capacitance, high power density, wide thermal operating range, and
environmental friendliness.1 Carbon materials, metal oxides and conducting polymers are
commonly taken for potential electrode materials for electrochemical supercapacitors. Actually,
the transition metal oxides display high specific capacitance. However, the high cost and toxicity
limit their application.2 Carbon materials exhibit long cycle life, but low specific capacitance.
3
These disadvantages hinder their practical applications for electrode materials of supercapacitors.
In contrast, the nanostructured conducting polymers, such as polyaniline (PANI), polypyrrole
(PPy) and polythiophene (PTh), have been regarded as promising electrode materials for
supercapacitors. Among these conducting polymers, PANI is famous for its morphology diversity
(nanofibers, nanotubes and nanowires etc), high electrical conductivity, large specific surface,
good redox reversibility, low cost, and simple synthesis.4 Regrettably, as an electrode material for
supercapacitors, PANI exhibits poor cycling stability due to the volume change during the long
charge/discharge process.5-7
So far, many researchers have focused on the synthesis of inorganic/PANI hybrid materials in
order to overcome its poor cycling stability, with the transition-metal oxides (such as MnO2 and
RuO2)8-10
or carbon materials (such as graphene11-18
and carbon nanotubes19-24
) as supporting
materials. However, in the approach above-mentioned, each component in the hybrid materials
still retains its own structure. And the improvement in cycling stability of PANI has been mainly
Page 3 of 22 Journal of Materials Chemistry A
Jour
nalo
fMat
eria
lsC
hem
istr
yA
Acc
epte
dM
anus
crip
t
4
attributed to the contributions of these supporting materials or the synergistic effects between
them in some cases.
Crosslinking might be a candidate to improve the electrical and electrochemical properties of
the conductive polymers. Yang et al prepared the crosslinked PANI samples via the in-situ
chemical oxidative polymerization of aniline in the presence of p-phenylenediamine (PPDA) and
triphenylamine (TPA) with HCl as dopant.25
The effect of the p-phenylenediamine and
triphenylamine contents on the electrical conductivity of the crosslinked PANI was mainly
discussed. By now, there is no report on the crosslinked PANI as electrode material for
supercapacitors.
In the present work, the chemical crosslinking method is tried to improve the electrochemical
properties of PANI by introducing the conjugated crosslinkers into the conjugated conducting
polymer for the first time. To avoid the influence of the exchanging of dopant during the
electrochemical process, H2SO4 was selected as the dopant in this work. The effects of the
crosslinking reaction on the morphology, structure, and electrical conductivity of the CPANI
were discussed in detail. And the electrochemical performance of the resulting copolymer was
investigated in 1.0 mol L-1
H2SO4 aqueous solution.
2. EXPERIMENTAL METHODS
2.1. Materials
Analytical reagent grade aniline (An) and ammonium peroxodisulfate (APS) were purchased
from Tianjin Guangfu Technology development Co. Ltd, Tianjin, China. Aniline was distilled
under reduced pressure before use.
Page 4 of 22Journal of Materials Chemistry A
Jour
nalo
fMat
eria
lsC
hem
istr
yA
Acc
epte
dM
anus
crip
t
5
P-phenylenediamine (PPDA) and triphenylamine (TPA) were obtained from Tianjin Guangfu
Fine Chemical Research Institute and Gracia Chemical Technology Co. Ltd, respectively.
Ammonium persulfate (APS), N, N-dimethylformamide (DMF) and sulfuric acid (H2SO4) were
used as received. Doubly deionized water was used through all the processes.
2.2. Synthesis of the crosslinked polyaniline and linear polyaniline
The crosslinked polyaniline (CPANI) was prepared as reported previously.25
Typically, 0.01 mol
of aniline was dissolved into a 100 mL 0.5 mol L-1
H2SO4 containing 0.0001 mol triphenylamine
(TPA) and 0.0002 mol p-phenylenediamine (PPDA). Then, APS (2.2820 g (0.01 mol) in 20 mL
0.5 mol L-1
H2SO4) was added drop by drop into the solution, and the crosslinking
polymerization was initiated and lasted for 10 h under stirring in an ice bath. For comparison, the
homopolymer of aniline (PANI) was also synthesized by the similar procedure without PPDA
and TPA.
2.3. Characterizations
The morphologies of the crosslinked and linear polymer samples (CPANI and PANI) were
investigated with a JEM-1230 transmission electron microscopy (TEM) (JEOL, Tokyo, Japan)
and a S-4800 scanning electron microscopy (SEM, Hitachi, Japan). For the TEM analysis, the
samples were dispersed in water in an ultrasonic bath for 30 min, and dropped onto the Cu grids
covered with a carbon film.
Fourier transform infrared (FT-IR) measurements (Impact 400, Nicolet, Waltham, MA) were
recorded with the KBr pellet method in the wavelength range of 400-4000 cm-1
.
The ultraviolet-visible spectra (UV-vis) were obtained using a UV-vis spectrometer (TU-1901,
Beijing Purkinje General Instrument, Co. Ltd, Beijing, China).
Page 5 of 22 Journal of Materials Chemistry A
Jour
nalo
fMat
eria
lsC
hem
istr
yA
Acc
epte
dM
anus
crip
t
6
Elementary composition of the PANI and CPANI samples was conducted on an Elementar
Vario EL instrument (Elementar Analysen systeme GmbH, Munich, Germany).
The crystal structures of samples were characterized using X-ray powder diffractometer (XRD,
Panalytical X’ Pert PRO X-ray Diffractometer). Nickel-filter Cu Kα radiation (λ = 0.15418 nm)
was used with a generator voltage of 40 kV and a current of 30 mA.
Thermogravimetric analysis (TGA) data were performed on a thermal analysis instrument
(Diamond TG thermogravimetric analyzer) with a heating rate of 10 °C min-1
in nitrogen
atmosphere.
The electrical conductivities of the samples were recorded using a RTS-2 four-point probe
conductivity tester ((Guangzhou four-point probe meter Electronic Technology Co., Ltd) at room
temperature. The pellets were obtained by subjecting the powder samples to a pressure of 20
MPa. Each value given is an average of three times measurements.
All electrochemical experiments were carried out in a three-electrode system with a working
electrode, a platinum counter electrode, and a standard calomel reference electrode (SCE). The
working electrodes were fabricated with the mixture containing the active materials (the results
copolymer), carbon black, and polyvinylidenefluoride (PVDF) with mass ratio of 80:15:5 to
make homogeneous mixture in DMF. Galvanostatic charge-discharge tests (GCD), cyclic
voltammetry (CV) and electrochemical impedance spectroscopy (EIS) of the samples were
performed on a CHI660B electrochemical workstation in 1.0 M H2SO4 aqueous solution. The
potential range for GCD and CV tests was -0.2 to 0.8 V. EIS tests were carried out ran at open
circuit potential of 0.4 V in the frequency range from 100 kHz to 0.01 Hz with an AC
perturbation of 5 mV.
3. RESULTS AND DISCUSSION
Page 6 of 22Journal of Materials Chemistry A
Jour
nalo
fMat
eria
lsC
hem
istr
yA
Acc
epte
dM
anus
crip
t
7
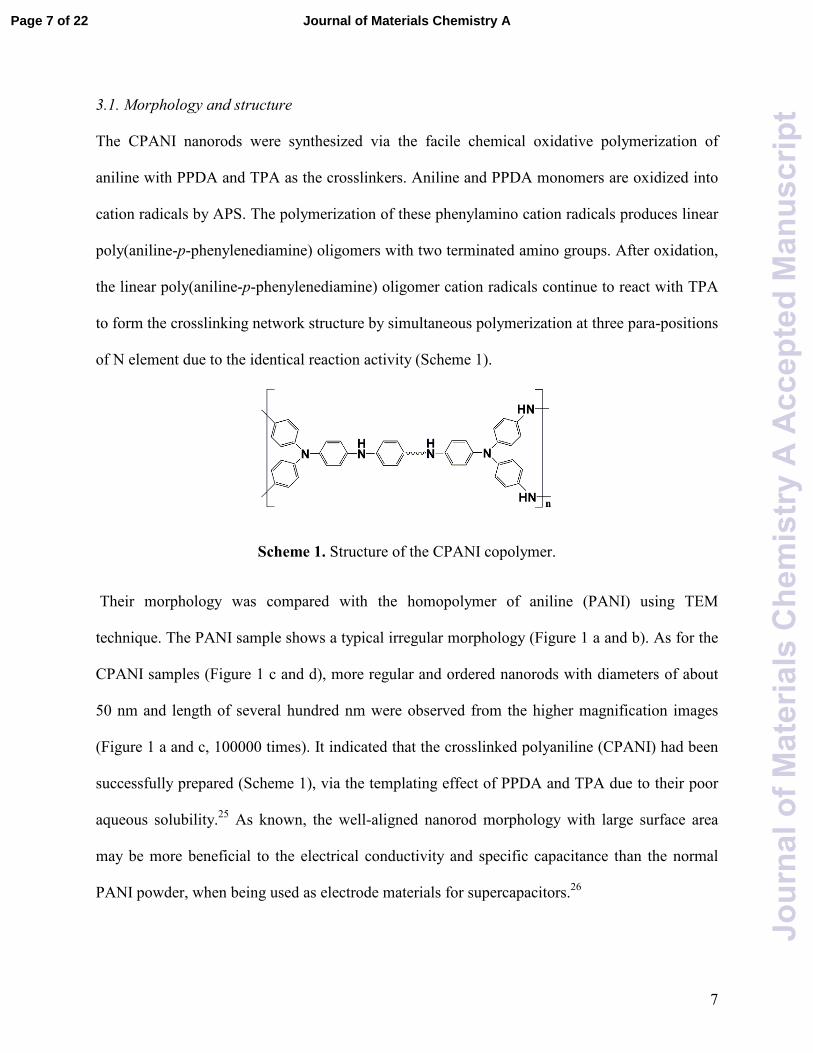
3.1. Morphology and structure
The CPANI nanorods were synthesized via the facile chemical oxidative polymerization of
aniline with PPDA and TPA as the crosslinkers. Aniline and PPDA monomers are oxidized into
cation radicals by APS. The polymerization of these phenylamino cation radicals produces linear
poly(aniline-p-phenylenediamine) oligomers with two terminated amino groups. After oxidation,
the linear poly(aniline-p-phenylenediamine) oligomer cation radicals continue to react with TPA
to form the crosslinking network structure by simultaneous polymerization at three para-positions
of N element due to the identical reaction activity (Scheme 1).
Scheme 1. Structure of the CPANI copolymer.
Their morphology was compared with the homopolymer of aniline (PANI) using TEM
technique. The PANI sample shows a typical irregular morphology (Figure 1 a and b). As for the
CPANI samples (Figure 1 c and d), more regular and ordered nanorods with diameters of about
50 nm and length of several hundred nm were observed from the higher magnification images
(Figure 1 a and c, 100000 times). It indicated that the crosslinked polyaniline (CPANI) had been
successfully prepared (Scheme 1), via the templating effect of PPDA and TPA due to their poor
aqueous solubility.25
As known, the well-aligned nanorod morphology with large surface area
may be more beneficial to the electrical conductivity and specific capacitance than the normal
PANI powder, when being used as electrode materials for supercapacitors.26
Page 7 of 22 Journal of Materials Chemistry A
Jour
nalo
fMat
eria
lsC
hem
istr
yA
Acc
epte
dM
anus
crip
t
8
(a) LPANI(a) LPANI (b) LPANI(b) LPANI(c) CPANI(c) CPANI (d) CPANI(d) CPANI
Figure 1. TEM images of the PANI (a, b) and CPANI (c, d) samples.
(a) PANI (b) CPANI
(c) PANI (d) CPANI
Figure 2. SEM images of the PANI and CPANI samples at high magnification (a and b) and low
magnification (c and d).
Page 8 of 22Journal of Materials Chemistry A
Jour
nalo
fMat
eria
lsC
hem
istr
yA
Acc
epte
dM
anus
crip
t
9
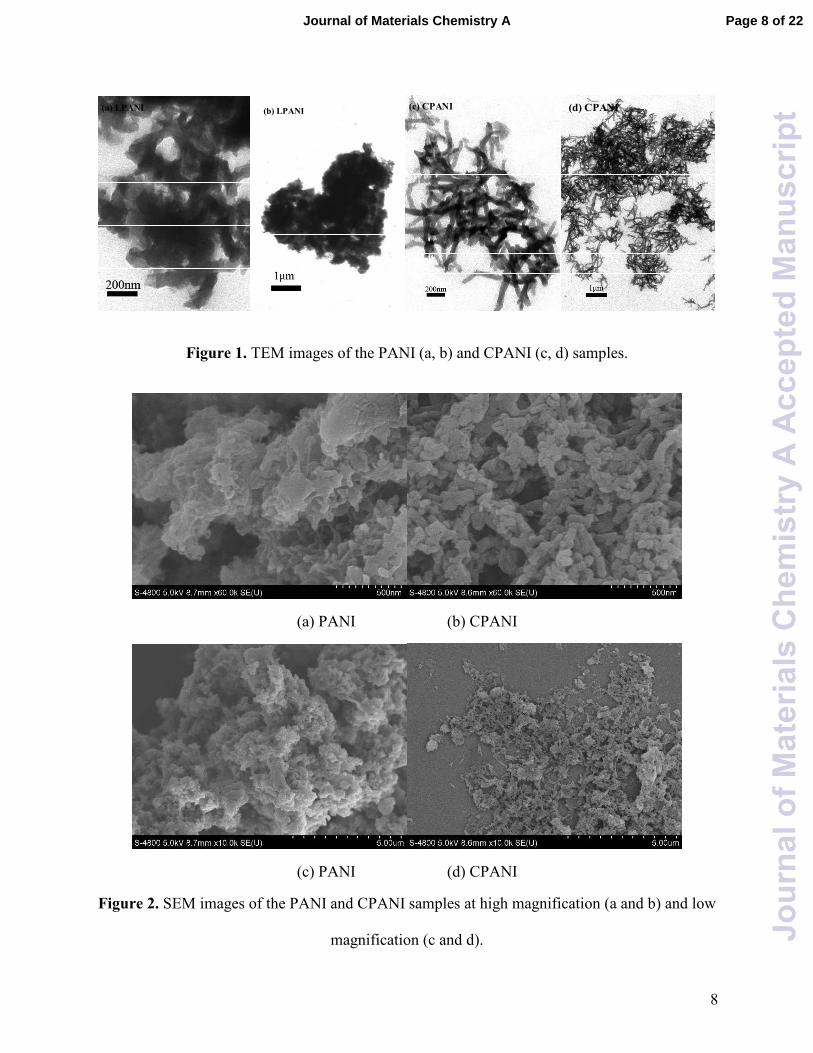
The CPANI and PANI samples showed the similar characteristic absorbance peaks in the FT-IR
spectra (Figure 3). The peaks at about 1580 and 1500 cm-1
are assigned to the C=C stretching
mode of the quinonoid rings and benzenoid units. Two peaks at 1306 and 1241 cm-1
are
attributed to the C-N stretching mode for the aromatic amine. The strongest peak at 1111 cm-1
is
assigned to the vibration mode of –NH+=, indicating the higher doping level.
27,28 The absorbance
peak at around 800 cm-1
corresponding to the C-H out-of-plane bending vibration of the 1, 4-
disubstituted rings can be seen in both the spectra.29
However, for the CPANI nanorods, the peak
intensity of the stretching vibration of the aromatic rings at 1645 cm-1
significantly increased,
indicating an increase in the benzenoid content as a direct consequence of the copolymerization
of PPDA and TPA.25
The absorbance peak at 3450 cm-1
of the N-H stretching mode in the
CPANI is much stronger than that of the PANI, attributing to the higher amine content in the
CPANI due to the introduction of PPDA.
4000 3500 3000 2500 2000 1500 1000 500
Tra
nsm
itta
nce
(%
)
CPANI
Wavenumbes (cm-1)
PANI
1645
Figure 3. FT-IR spectra of the PANI and CPANI samples.
Page 9 of 22 Journal of Materials Chemistry A
Jour
nalo
fMat
eria
lsC
hem
istr
yA
Acc
epte
dM
anus
crip
t
10
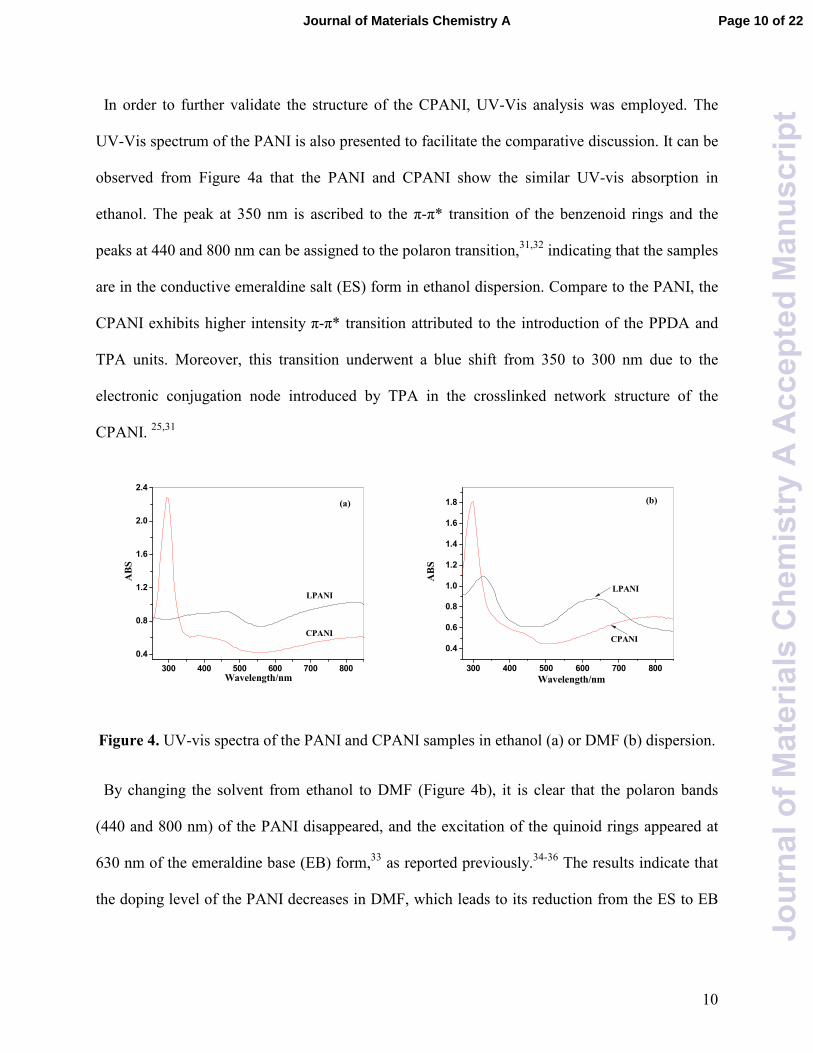
In order to further validate the structure of the CPANI, UV-Vis analysis was employed. The
UV-Vis spectrum of the PANI is also presented to facilitate the comparative discussion. It can be
observed from Figure 4a that the PANI and CPANI show the similar UV-vis absorption in
ethanol. The peak at 350 nm is ascribed to the π-π* transition of the benzenoid rings and the
peaks at 440 and 800 nm can be assigned to the polaron transition,31,32
indicating that the samples
are in the conductive emeraldine salt (ES) form in ethanol dispersion. Compare to the PANI, the
CPANI exhibits higher intensity π-π* transition attributed to the introduction of the PPDA and
TPA units. Moreover, this transition underwent a blue shift from 350 to 300 nm due to the
electronic conjugation node introduced by TPA in the crosslinked network structure of the
CPANI. 25,31
300 400 500 600 700 800
0.4
0.8
1.2
1.6
2.0
2.4
CPANI
LPANI
ABS
Wavelength/nm
(a)
300 400 500 600 700 800
0.4
0.6
0.8
1.0
1.2
1.4
1.6
1.8
AB
S
Wavelength/nm
LPANI
CPANI
(b)
Figure 4. UV-vis spectra of the PANI and CPANI samples in ethanol (a) or DMF (b) dispersion.
By changing the solvent from ethanol to DMF (Figure 4b), it is clear that the polaron bands
(440 and 800 nm) of the PANI disappeared, and the excitation of the quinoid rings appeared at
630 nm of the emeraldine base (EB) form,33
as reported previously.34-36
The results indicate that
the doping level of the PANI decreases in DMF, which leads to its reduction from the ES to EB
Page 10 of 22Journal of Materials Chemistry A
Jour
nalo
fMat
eria
lsC
hem
istr
yA
Acc
epte
dM
anus
crip
t
11
form. In contrast, the UV-vis spectra of the CPANI are similar in both dispersions, implying that
the CPANI can maintain more stable doped state than the PANI in aprotic solvent.
10 20 30 40 50 60 70
Inte
nsi
ty (a.u
.)
CPANI
2θθθθ /degree
PANI
Figure 5. XRD patterns of the PANI and CPANI samples.
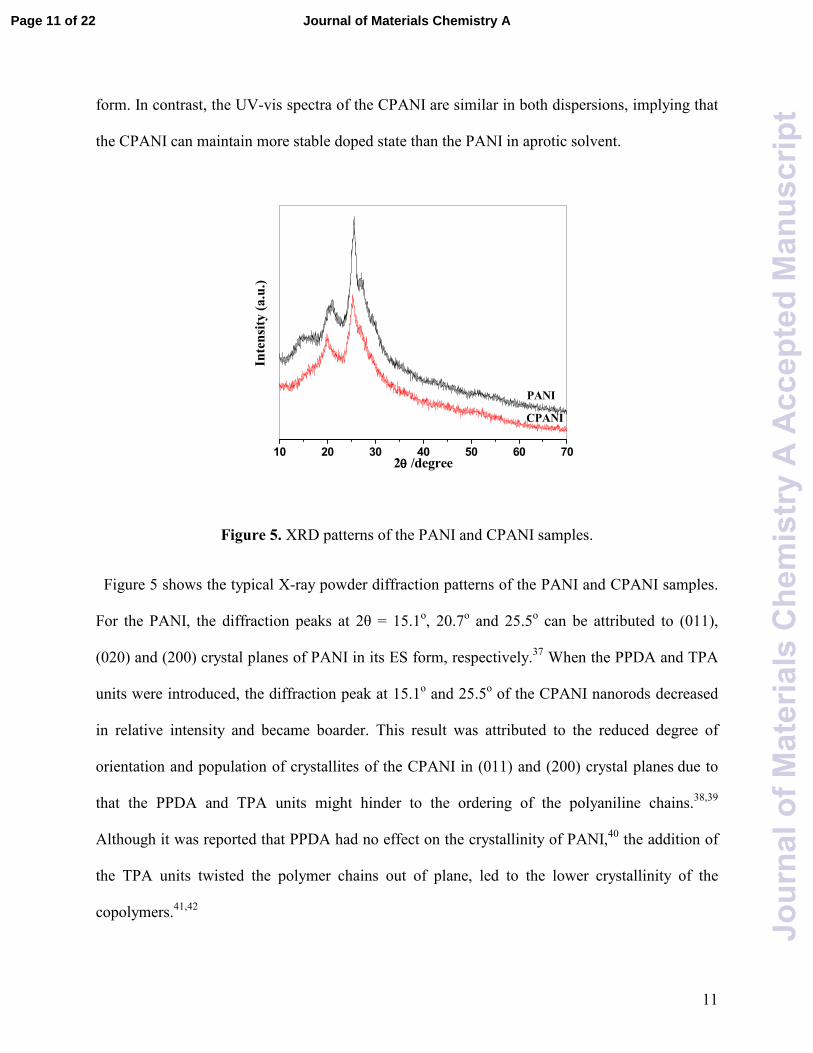
Figure 5 shows the typical X-ray powder diffraction patterns of the PANI and CPANI samples.
For the PANI, the diffraction peaks at 2θ = 15.1o, 20.7
o and 25.5
o can be attributed to (011),
(020) and (200) crystal planes of PANI in its ES form, respectively.37
When the PPDA and TPA
units were introduced, the diffraction peak at 15.1o and 25.5
o of the CPANI nanorods decreased
in relative intensity and became boarder. This result was attributed to the reduced degree of
orientation and population of crystallites of the CPANI in (011) and (200) crystal planes due to
that the PPDA and TPA units might hinder to the ordering of the polyaniline chains.38,39
Although it was reported that PPDA had no effect on the crystallinity of PANI,40
the addition of
the TPA units twisted the polymer chains out of plane, led to the lower crystallinity of the
copolymers.41,42
Page 11 of 22 Journal of Materials Chemistry A
Jour
nalo
fMat
eria
lsC
hem
istr
yA
Acc
epte
dM
anus
crip
t
12
200 400 600 800
40
50
60
70
80
90
100
CPANI
Weig
ht lo
ss (%
)
Temperature /oC
PANI
6.85%
2.39%
Figure 6. TGA curves of the PANI and CPANI samples.
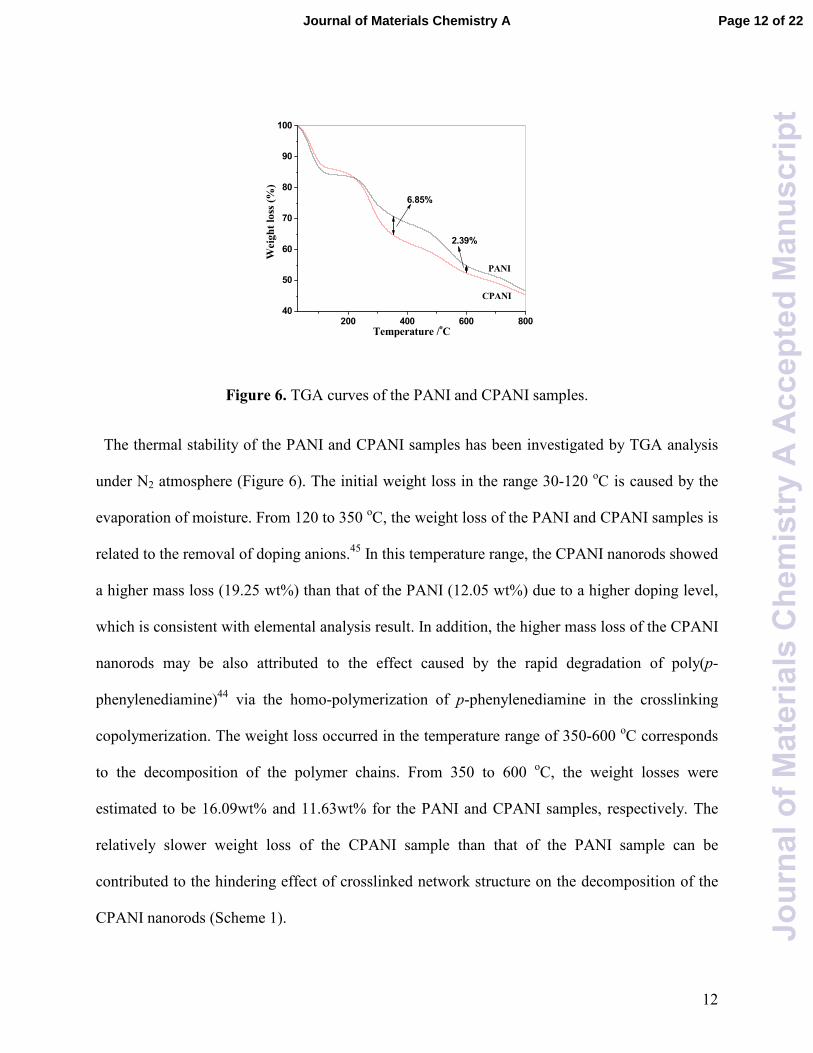
The thermal stability of the PANI and CPANI samples has been investigated by TGA analysis
under N2 atmosphere (Figure 6). The initial weight loss in the range 30-120 oC is caused by the
evaporation of moisture. From 120 to 350 oC, the weight loss of the PANI and CPANI samples is
related to the removal of doping anions.45
In this temperature range, the CPANI nanorods showed
a higher mass loss (19.25 wt%) than that of the PANI (12.05 wt%) due to a higher doping level,
which is consistent with elemental analysis result. In addition, the higher mass loss of the CPANI
nanorods may be also attributed to the effect caused by the rapid degradation of poly(p-
phenylenediamine)44
via the homo-polymerization of p-phenylenediamine in the crosslinking
copolymerization. The weight loss occurred in the temperature range of 350-600 oC corresponds
to the decomposition of the polymer chains. From 350 to 600 oC, the weight losses were
estimated to be 16.09wt% and 11.63wt% for the PANI and CPANI samples, respectively. The
relatively slower weight loss of the CPANI sample than that of the PANI sample can be
contributed to the hindering effect of crosslinked network structure on the decomposition of the
CPANI nanorods (Scheme 1).
Page 12 of 22Journal of Materials Chemistry A
Jour
nalo
fMat
eria
lsC
hem
istr
yA
Acc
epte
dM
anus
crip
t
13
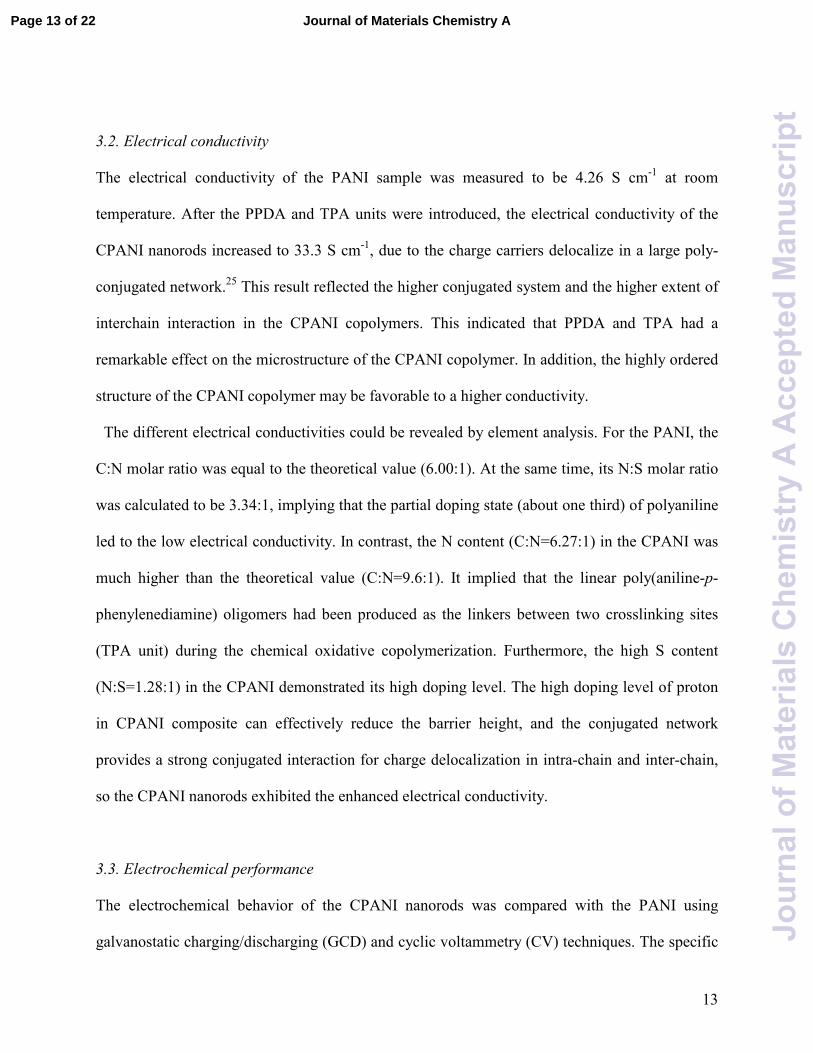
3.2. Electrical conductivity
The electrical conductivity of the PANI sample was measured to be 4.26 S cm-1
at room
temperature. After the PPDA and TPA units were introduced, the electrical conductivity of the
CPANI nanorods increased to 33.3 S cm-1
, due to the charge carriers delocalize in a large poly-
conjugated network.25
This result reflected the higher conjugated system and the higher extent of
interchain interaction in the CPANI copolymers. This indicated that PPDA and TPA had a
remarkable effect on the microstructure of the CPANI copolymer. In addition, the highly ordered
structure of the CPANI copolymer may be favorable to a higher conductivity.
The different electrical conductivities could be revealed by element analysis. For the PANI, the
C:N molar ratio was equal to the theoretical value (6.00:1). At the same time, its N:S molar ratio
was calculated to be 3.34:1, implying that the partial doping state (about one third) of polyaniline
led to the low electrical conductivity. In contrast, the N content (C:N=6.27:1) in the CPANI was
much higher than the theoretical value (C:N=9.6:1). It implied that the linear poly(aniline-p-
phenylenediamine) oligomers had been produced as the linkers between two crosslinking sites
(TPA unit) during the chemical oxidative copolymerization. Furthermore, the high S content
(N:S=1.28:1) in the CPANI demonstrated its high doping level. The high doping level of proton
in CPANI composite can effectively reduce the barrier height, and the conjugated network
provides a strong conjugated interaction for charge delocalization in intra-chain and inter-chain,
so the CPANI nanorods exhibited the enhanced electrical conductivity.
3.3. Electrochemical performance
The electrochemical behavior of the CPANI nanorods was compared with the PANI using
galvanostatic charging/discharging (GCD) and cyclic voltammetry (CV) techniques. The specific
Page 13 of 22 Journal of Materials Chemistry A
Jour
nalo
fMat
eria
lsC
hem
istr
yA
Acc
epte
dM
anus
crip
t
14
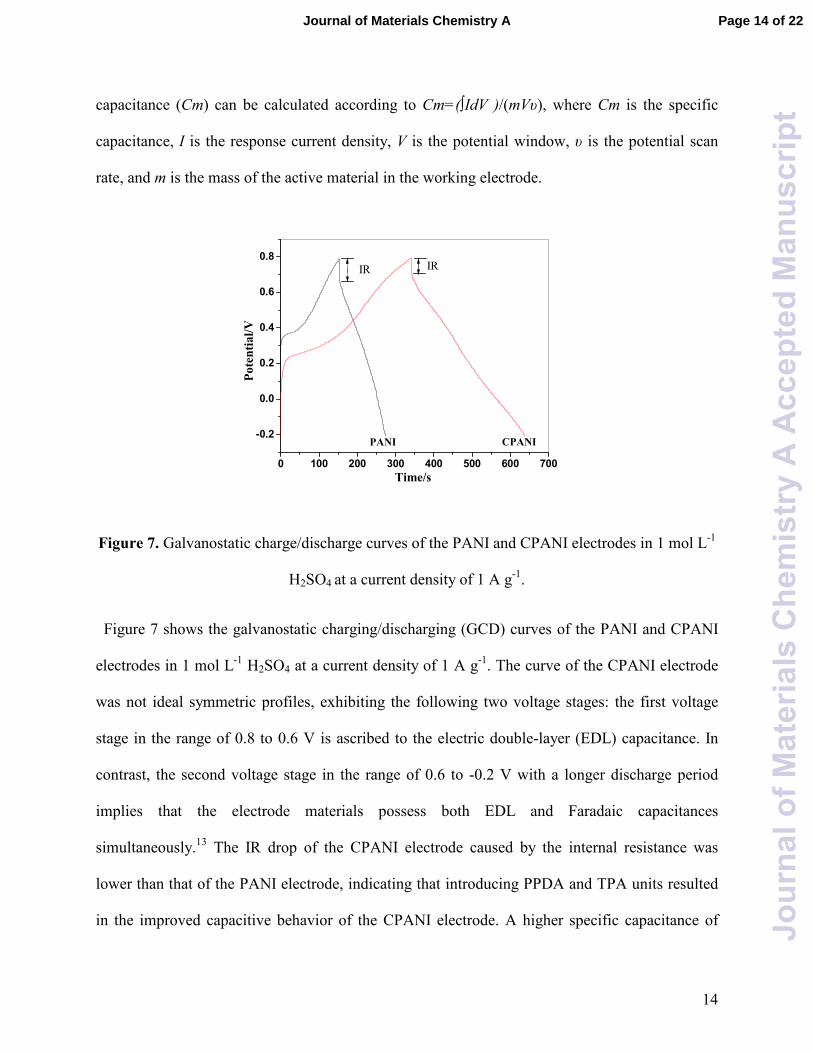
capacitance (Cm) can be calculated according to Cm=(∫IdV )/(mVυ), where Cm is the specific
capacitance, I is the response current density, V is the potential window, υ is the potential scan
rate, and m is the mass of the active material in the working electrode.
0 100 200 300 400 500 600 700
-0.2
0.0
0.2
0.4
0.6
0.8IR
CPANI
Pote
ntial/V
Time/s
PANI
IR
Figure 7. Galvanostatic charge/discharge curves of the PANI and CPANI electrodes in 1 mol L-1
H2SO4 at a current density of 1 A g-1
.
Figure 7 shows the galvanostatic charging/discharging (GCD) curves of the PANI and CPANI
electrodes in 1 mol L-1
H2SO4 at a current density of 1 A g-1
. The curve of the CPANI electrode
was not ideal symmetric profiles, exhibiting the following two voltage stages: the first voltage
stage in the range of 0.8 to 0.6 V is ascribed to the electric double-layer (EDL) capacitance. In
contrast, the second voltage stage in the range of 0.6 to -0.2 V with a longer discharge period
implies that the electrode materials possess both EDL and Faradaic capacitances
simultaneously.13
The IR drop of the CPANI electrode caused by the internal resistance was
lower than that of the PANI electrode, indicating that introducing PPDA and TPA units resulted
in the improved capacitive behavior of the CPANI electrode. A higher specific capacitance of
Page 14 of 22Journal of Materials Chemistry A
Jour
nalo
fMat
eria
lsC
hem
istr
yA
Acc
epte
dM
anus
crip
t
15
297 F g-1
was achieved for the CPANI electrode in comparison with that of the PANI electrode
(119 F g-1
) at a current density of 1 A g-1
. It means that the significant electrical double-layer
capacitance and Faradic pseudocapacitance has been achieved due to its regular nanorod
morphology with large surface area and the higher electrical conductivity.
-0.2 0.0 0.2 0.4 0.6 0.8
-1.0
-0.5
0.0
0.5
1.0
C2
C1
A2
CPANI
Curr
ent den
sity
(A
/g)
Potential/V
PANI
A1
(a)
-0.2 0.0 0.2 0.4 0.6 0.8
-6
-4
-2
0
2
4
6
Curr
ent density
(A
/g)
Potential/V
(b) CPANI
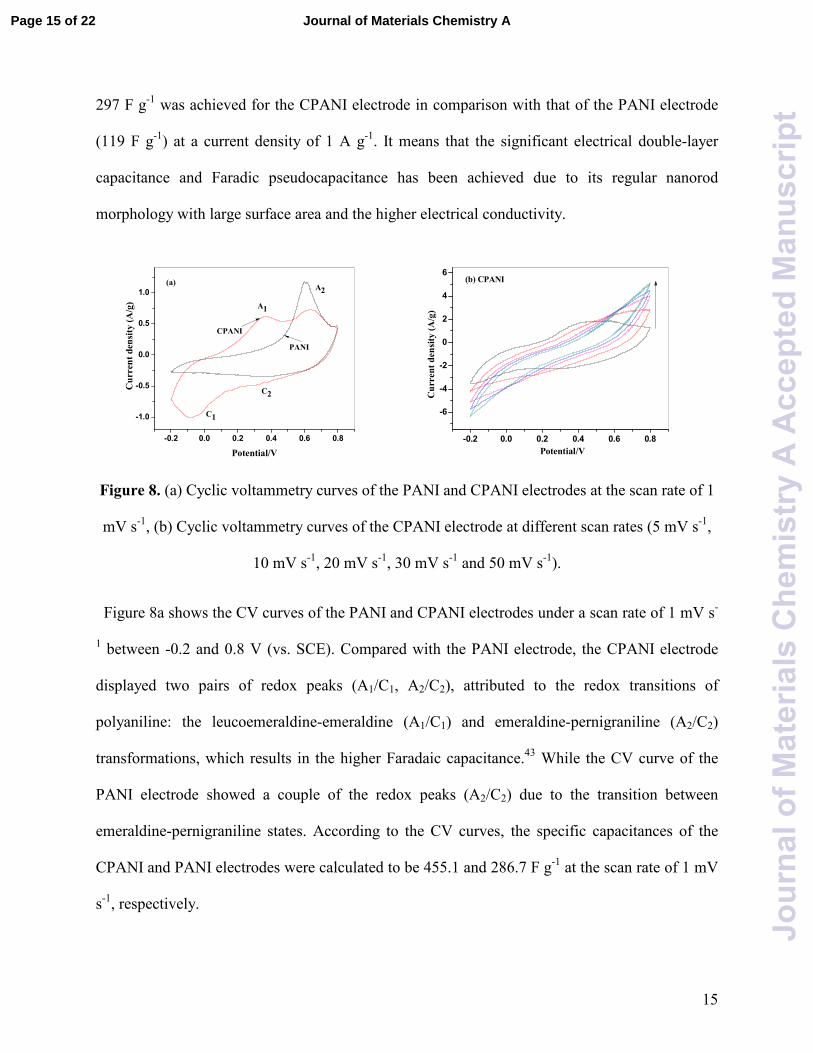
Figure 8. (a) Cyclic voltammetry curves of the PANI and CPANI electrodes at the scan rate of 1
mV s-1
, (b) Cyclic voltammetry curves of the CPANI electrode at different scan rates (5 mV s-1
,
10 mV s-1
, 20 mV s-1
, 30 mV s-1
and 50 mV s-1
).
Figure 8a shows the CV curves of the PANI and CPANI electrodes under a scan rate of 1 mV s-
1 between -0.2 and 0.8 V (vs. SCE). Compared with the PANI electrode, the CPANI electrode
displayed two pairs of redox peaks (A1/C1, A2/C2), attributed to the redox transitions of
polyaniline: the leucoemeraldine-emeraldine (A1/C1) and emeraldine-pernigraniline (A2/C2)
transformations, which results in the higher Faradaic capacitance.43
While the CV curve of the
PANI electrode showed a couple of the redox peaks (A2/C2) due to the transition between
emeraldine-pernigraniline states. According to the CV curves, the specific capacitances of the
CPANI and PANI electrodes were calculated to be 455.1 and 286.7 F g-1
at the scan rate of 1 mV
s-1
, respectively.
Page 15 of 22 Journal of Materials Chemistry A
Jour
nalo
fMat
eria
lsC
hem
istr
yA
Acc
epte
dM
anus
crip
t
16
The rate capability of the CPANI electrode was further evaluated by CV under various scan
rates (5, 10, 20, 30 and 50 mV s-1
) (Figure 8b). Increasing the scan rate from 5 to 50 mV s-1
, the
response current density gradually increased, demonstrating the good rate capability of the
CPANI electrode. Moreover, the redox peaks of the CPANI electrode became less obvious with
increasing the scan rate, mainly due to that the diffusion of the electrolyte ions is not so fast into
the interior electrode. This indicates that the CPANI electrode mainly possesses the electrical
double-layer capacitance at higher scan rate.
0 10 20 30 40 50 60 70 80
0
20
40
60
80
100
CPANI
-Z''/o
hm
Z'/ohm
PANI
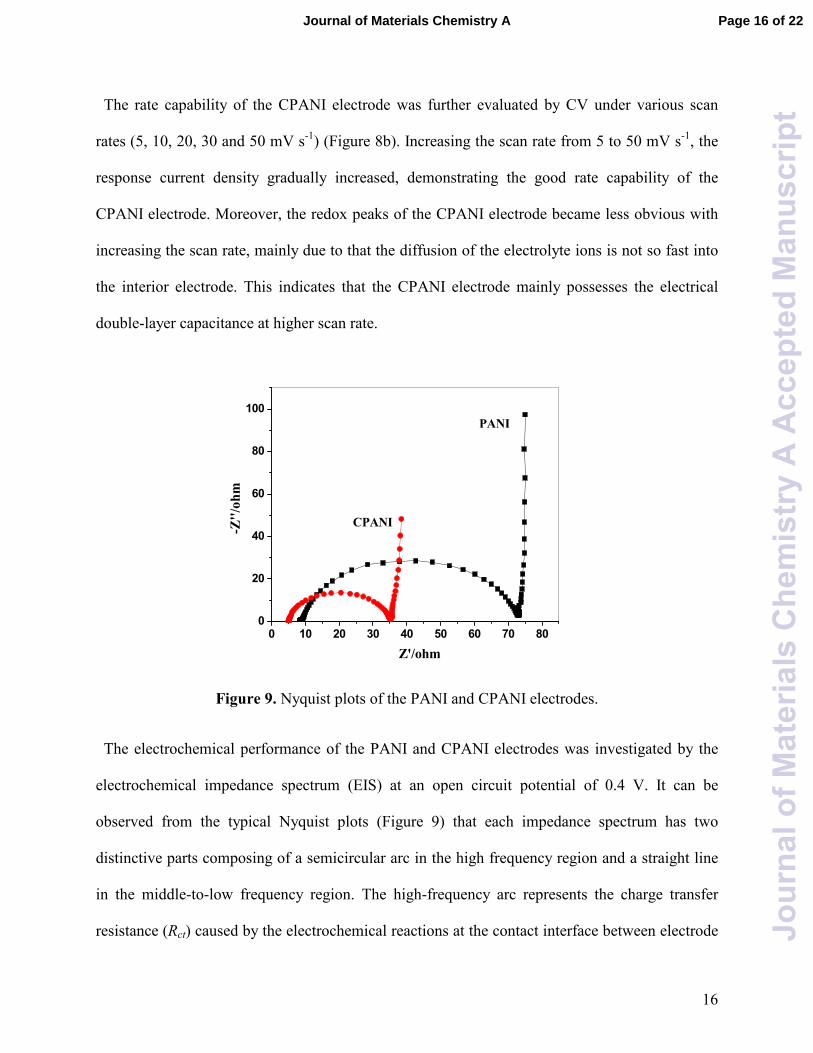
Figure 9. Nyquist plots of the PANI and CPANI electrodes.
The electrochemical performance of the PANI and CPANI electrodes was investigated by the
electrochemical impedance spectrum (EIS) at an open circuit potential of 0.4 V. It can be
observed from the typical Nyquist plots (Figure 9) that each impedance spectrum has two
distinctive parts composing of a semicircular arc in the high frequency region and a straight line
in the middle-to-low frequency region. The high-frequency arc represents the charge transfer
resistance (Rct) caused by the electrochemical reactions at the contact interface between electrode
Page 16 of 22Journal of Materials Chemistry A
Jour
nalo
fMat
eria
lsC
hem
istr
yA
Acc
epte
dM
anus
crip
t
17
and electrolyte solution.46
The Rct obtained from the semicircular arc diameter were 64.7 and
30.2 Ω for the PANI and CPANI electrodes, respectively. It is obvious that the Rct of the CPANI
electrode (30.2 Ω) is much lower than that of the PANI electrode (64.7 Ω). The straight line with
a slope from 45° to 90° ascribes to the Warburg diffusion behavior. It can be observed that the
CPANI electrode exhibits a short and vertical line, representative of fast ion diffusion/transport
in the electrode material.47
At the same time, the equivalent series resistance (Rs) can be observed
from the X-intercept of Figure 9, which included the ionic resistance of electrolyte, intrinsic
resistance of the active material, and contact resistance at the active material/current collector
interface.46,48
The PANI and CPANI electrodes delivered Rs of 8.32 and 4.96 Ω, respectively.
The result of the Nyquist plots indicates that the CPANI electrode has an improved
electrochemical capacitive behavior, which should be attributed to the higher conductivity and
charge transfer capability of the crosslinked copolymer.
0 200 400 600 800 1000 1200 1400
0
20
40
60
80
100
CPANI
Capaci
tance
rete
ntion (%
)
Cycling numbers
PANI
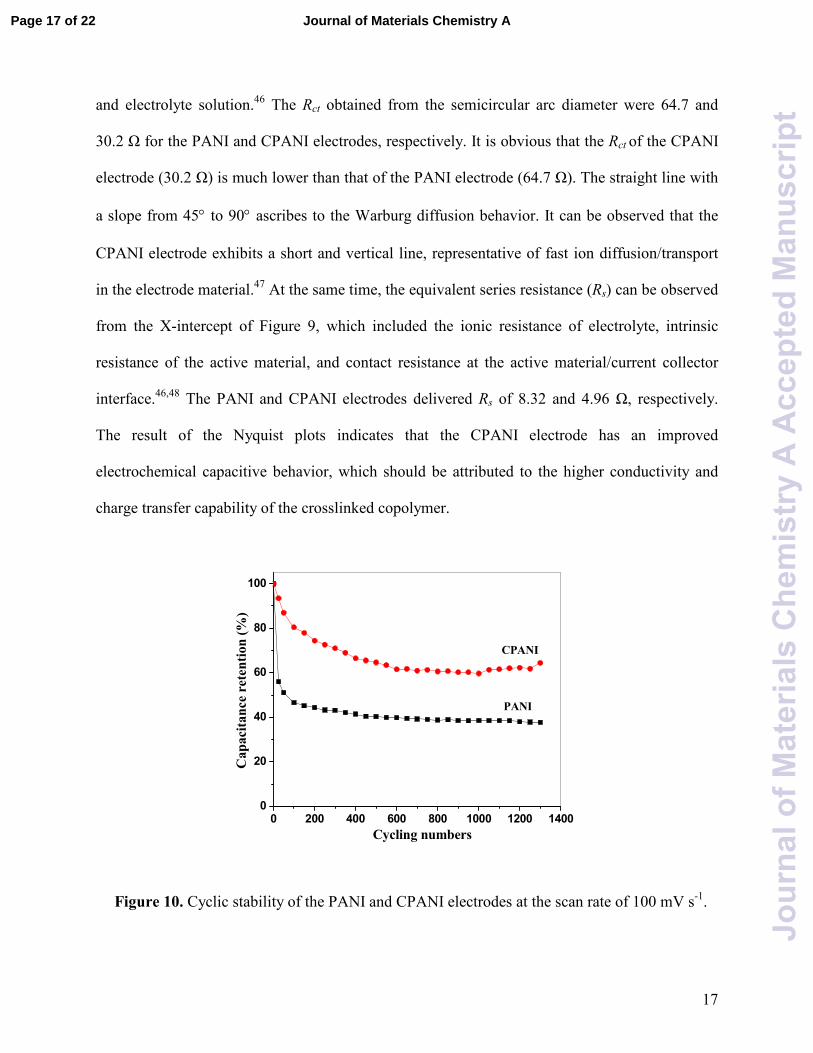
Figure 10. Cyclic stability of the PANI and CPANI electrodes at the scan rate of 100 mV s-1
.
Page 17 of 22 Journal of Materials Chemistry A
Jour
nalo
fMat
eria
lsC
hem
istr
yA
Acc
epte
dM
anus
crip
t
18
The electrochemical stabilities of the PANI and CPANI electrodes was compared by CV
cycling in 1.0 mol L-1
H2SO4 solution at 100 mV s-1
in the range of -0.2-0.8 V and the
capacitance retentions are shown in Figure 10. It is observed that the specific capacitance of the
PANI electrode decreased more rapidly (53% loss after 100 cycles) compared with the CPANI
electrode. The higher capacitance loss of the PANI electrode should be resulted from the
volumetric changes due to the insertion/release of ions, during the long-term charge/discharge
cycling.5-7
While the CPANI electrode had a high retention of 65 % of its initial capacitance after
1300 cycles, indicating a long-term electrochemical stability. In comparison with the PANI
electrode, the enhanced electrochemical stability of the CPANI electrode might be mainly caused
by the crosslinked structure, which significantly enhance the mechanical property and efficiently
hindered the deformation of the conductive polymer during the long charge/discharge process.
4. CONCLUSIONS
In summary, the crosslinked polyaniline nanorods (CPANI), synthesized by chemical oxidative
polymerization of aniline in present of p-phenylenediamine and triphenylamine as crosslinkers
with ammonium persulfate as oxidant, was investigated as the electrode material for
supercapacitor for the first time. The CPANI showed regular and order nano-fibrous morphology.
The electrical conductivity of the CPANI nanorods was almost 8 times higher than the PANI,
reached 33.3 S cm-1
. The specific capacitance of the CPANI electrode was 455.1 F g-1
at the scan
rate of 1 mV s-1
, much higher than 286.7 F g-1
of the PANI electrode. Moreover, the retention
ratio of specific capacitance of the CPANI is much higher than the PANI electrode. The results
Page 18 of 22Journal of Materials Chemistry A
Jour
nalo
fMat
eria
lsC
hem
istr
yA
Acc
epte
dM
anus
crip
t
19
demonstrated that the crosslinking polymerization could be used as a promising approach to
improve the electrochemical performance of the conducting polymer electrodes.
ACKNOWLEDGMENTS
This work was supported by the Natural Science Foundation of Gansu Province (Grant No.
1107RJZA213) and the Fundamental Research Funds for the Central Universities (Grant No.
lzujbky-2011-21 and lzujbky-2013-237).
REFERENCES
(1) B. E. Conway, Electrochemical Supercapacitors: Scientific Fundamentals and Technological
Applications, Plenum, New York, 1999.
(2) C. C. Hu, K. H. Chang, M. C. Lin and Y. T. Wu, Nano Lett., 2006, 6, 2690.
(3) G. Gryglewicz, J. Machnikowski, E. L. Grabowska, G. Lota and E. Frackowiak,
Electrochem. Acta, 2005, 50, 1197.
(4) G. Ciric-Marjanovic, Synth. Met., 2013, 177, 1.
(5) X. W. Li, H. Zhang, G. C. Wang and Z. H. Jiang, J. Mater. Chem., 2010, 20, 10598.
(6) J. H. Park, O. O. Park, K. H. Shin, C. S. Jin and J. H. Kim, Electrochem. Solid State Lett.,
2002, 5, H7.
(7) I. Kovalenko, D. G. Bucknall and G. Yushin, Adv. Funct. Mater., 2010, 20, 3979.
(8) J. G. Wang, Y. Yang, Z. H. Huang and F. Y. Kang, J. Power Sources, 2012, 204, 236.
(9) X. Li, W. P. Gan, F. Zheng, L. L. Li, N. N. Zhu and X. Q. Huang, Synth. Met., 2012, 162,
953.
(10) S. A. Iranagh, L. Eskandarian and R. Mohammadi, Synth. Met., 2013, 172, 49.
Page 19 of 22 Journal of Materials Chemistry A
Jour
nalo
fMat
eria
lsC
hem
istr
yA
Acc
epte
dM
anus
crip
t
20
(11) K. Zhang, L. L. Zhang, X. S. Zhao and J. S. Wu, Chem. Mater., 2010, 22, 1392.
(12) Y.-C. Lin, F.-H. Hsu and T.-M. Wu, Synth. Met., 2013, 184, 29.
(13) J. Yan, T. Wei, B. Shao, Z. J. Fan, W. Z. Qian, M. L. Zhang and F. Wei, Carbon, 2010,
48, 487.
(14) Q. Wu, Y. X. Xu, Z. Y. Yao, A. R. Liu and G. Q. Shi, ACS Nano, 2010, 4, 1963.
(15) H. L. Wang, Q. L. Hao, X. J. Yang, L. D. Lu and X. A. Wang, Nanoscale, 2010, 2, 2164.
(16) Y. H. Jin, S. Huang, M. Zhang and M. Q. Jia, Synth. Met., 2013, 168, 58.
(17) Z. H. Luo, L. H. Zhu, Y. F. Huang and H. Q. Tang, Synth. Met., 2013, 175, 88.
(18) L. Li, A. R. O. Raji, H. L. Fei, Y. Yang, E. L. G. Samuel and J. M. Tour, ACS Appl.
Mater. Interfaces, 2013, 5, 6622.
(19) J. Zhang, L. B. Kong, B. Wang, Y. C. Luo and L. Kang, Synth. Met., 2009, 159, 260.
(20) Y. Zhou, Z. Y. Qin, L. Li, Y. Zhang, Y. L. Wei, L. F. Wang and M. F. Zhu, Electrochim.
Acta, 2010, 55, 3904.
(21) S. B. Yoon, E. H. Yoon and K. B. Kim, J. Power Sources, 2011, 196, 10791.
(22) Z. Z. Zhu, G. C. Wang, M. Q. Sun, X. W. Li and C. Z. Li, Electrochim. Acta, 2011, 56,
1366.
(23) M. M. Yang, B. Cheng, H. H. Song and X. H. Chen, Electrochim. Acta, 2010, 55, 7021.
(24) C. Z. Meng, C. H. Liu, L. Z. Chen, C. H. Hu and S. S. Fan, Nano Lett., 2010, 10, 4025.
(25) Y. Y. Yang, S. Z. Chen and L. Xu, Macromol. Rapid Commun., 2011, 32, 593.
(26) J. G. Tu, J. G. Hou, W. Wang, S. Q. Jiao and H. M. Zhu, Synth. Met., 2011, 161, 1255.
(27) J. C. Chiang, and A. G. MacDiarmid, Synth. Met., 1986, 13, 193.
(28) Z. Ping, J. Chem. Soc. Faraday Trans., 1996, 92, 3063.
(29) Y. Furukawa, T. Hara, Y. Hyodo and I. Harada, Synth. Met., 1986, 16, 189.
Page 20 of 22Journal of Materials Chemistry A
Jour
nalo
fMat
eria
lsC
hem
istr
yA
Acc
epte
dM
anus
crip
t
21
(30) Y. Wang, H. D. Tran, L. Liao, X. F. Duan and R. B. Kaner, J. Am. Chem. Soc., 2010, 132,
10365.
(31) M. X. Wan, J. Polym. Sci.: Part A. Polym. Chem., 1992, 30, 543.
(32) J. Laska, M. Trznadel and A. Pron, Mater. Sci. Forum, 1993, 122, 177.
(33) Y. Xia, J. M. Wiesinger, A. G. MacDiarmid and A. J. Epstein, Chem. Mater., 1995, 7,
443.
(34) W. S. Yin and E. Ruckenstein, Macromolecules, 2000, 33, 1129.
(35) T. Lindfors, C. Kvarnstrom and A. Ivaska, J. Electroanal. Chem., 2002, 518, 131.
(36) P. Liu, Synth. Met., 2009, 159, 148.
(37) H. K. Chaudhari and D. S. Kelkar, Polym. Int., 1997, 42, 380.
(38) M. E. Jozefowicz, A. J. Epstein, J. P. Pouget, J. G. Masters, A. Ray and A. G.
MacDiarmid, Macromolecules, 1991, 24, 5863.
(39) S. Bhadra and D. Khastgir, Polym. Test., 2008, 27, 851.
(40) M. A. Shenashen, M. M. Ayad, N. Salahuddin and M. A. Youssif, React. Funct. Polym.,
2010, 70, 843.
(41) H. J. Niu, P. H. Luo, M. L. Zhang, L. Zhang, L. N. Hao, J. Luo, X. D. Bai and W. Wang,
Eur. Polym. J., 2009, 45, 3058.
(42) P. Liu, P. Zhang, D. L. Cao, L. H. Gan and Y. F. Li, J. Mol. Struct., 2013, 1050, 151.
(43) A. H. Gemeay, R. G. El-Sharkawy, I. A. Mansour and A. B. Zaki, J. Colloid Interface
Sci., 2007, 308, 385.
(44) A. Madhankumar and N. A. Rajendran, Synth. Met., 2012, 162, 176.
(45) Y. E. Miao, W. Fan, D. Chen and T. X. Liu, ACS Appl. Mater. Interfaces, 2013, 5, 4423.
(46) Z. Gao, W. L. Yang, J. Wang, B. Wang, Z. S. Li, Q. Liu, M. L. Zhang and L. H. Liu,
Energy Fuels, 2013, 27, 568.
Page 21 of 22 Journal of Materials Chemistry A
Jour
nalo
fMat
eria
lsC
hem
istr
yA
Acc
epte
dM
anus
crip
t
22
(47) Z. F. Li, H. Y. Zhang, Q. Liu, L. L. Sun, L. Stanciu and J. Xie, ACS Appl. Mater.
Interfaces, 2013, 5, 2685.
(48) H. X. Yang, T. Song, L. Liu, A. Devadoss, F. Xia, H. Han, H. Park, W. Sigmund, K.
Kwon and U. Paik, J. Phys. Chem. C, 2013, 117, 17376.
Page 22 of 22Journal of Materials Chemistry A
Jour
nalo
fMat
eria
lsC
hem
istr
yA
Acc
epte
dM
anus
crip
t