Matching spatial distributions of the sea star Echinaster sepositus and crustose coralline algae in...
11
Mar Biol DOI 10.1007/s00227-010-1489-2 123 ORIGINAL PAPER Matching spatial distributions of the sea star Echinaster sepositus and crustose coralline algae in shallow rocky Mediterranean communities Adriana Villamor · Mikel A. Becerro Received: 20 November 2009 / Accepted: 31 May 2010 © Springer-Verlag 2010 Abstract Understanding why a species is present in a particular location and the consequences of its presence is complex but necessary to identify the mechanisms that gen- erate and maintain ecological diversity. The common sea star Echinaster sepositus can be either very abundant or non-existing in nearby localities of the western Mediterra- nean. Yet, the factors that shape its distribution and the impact of the sea star on natural communities remain unin- vestigated. Here, we quantiWed multiple biotic and abiotic factors that may aVect the distribution of E. sepositus and tested whether this sea star can shape the organization of the community it inhabits. Our results showed that the dis- tribution of this sea star was highly contagious and posi- tively correlated with the abundance and distribution of crustose coralline algae from tens of meters to tens of kilo- meters. Despite signiWcant diVerences in community com- position between localities with high or low abundance of the sea star, experimental addition of E. sepositus to natural communities failed to shift the composition of the algal community in 4 months. Overall, our results suggest that within habitat variability in the abundance of crustose cor- alline algae may explain the abundance of E. sepositus at multiple geographic scales, emphasizing the need to inves- tigate small-scale processes at larger geographic scales. Introduction The study of the mechanisms that determine the presence and abundance of local species is basic to understand spe- cies diversity and the organization and functioning of nat- ural communities. The complexity of the multiple factors acting at varying temporal and spatial scales makes predicting whether a species is present in a particular location very challenging. On a local scale, species com- position may be determined by a few environmental vari- ables that Wlter a larger pool of species. According to this niche assembly view, physiological processes and biotic interactions play a major role in community composition (Tilman 1985; Keddy 1992; Grace 1999). Stochastic events at large temporal and spatial scales, local extinc- tion, and long distance dispersal are also known to explain species diversity (Tilman 1994; Eriksson 1996; Hubbell et al. 2001). Habitat variability correlates with species diversity and depends on the spatial scale investigated (Davidowitz and Rosenzweig 1998). Large-scale surveys comprise multiple variability sources including but not restricted to geo- graphic and habitat variability (e.g., Fabricius and De’ath 2001). At the opposite end, small-scale studies look for the most homogeneous habitats in order to discover the small- est variability (Benedetti-Cecchi and Cinelli 1995). These small-scale variability studies have received little attention, but they seem to play a major role in determining and main- taining diversity (Izsak and Price 2001; Hewitt et al. 2005). In fact, the importance of small-scale habitat variability could be underestimated because small-scale habitat vari- ability can result in large-scale variability patterns if the habitat itself changes across larger scales (Helmuth et al. 2006; Rilov and Schiel 2006; Chapman and Underwood 2008). Communicated by P. Kraufvelin. A. Villamor (&) · M. A. Becerro Center for Advanced Studies of Blanes (CEAB, CSIC), Acc Cala S Francesc 14, 17300 Blanes (Girona), Spain e-mail: [email protected]
Transcript of Matching spatial distributions of the sea star Echinaster sepositus and crustose coralline algae in...

Mar Biol
DOI 10.1007/s00227-010-1489-2ORIGINAL PAPER
Matching spatial distributions of the sea star Echinaster sepositus and crustose coralline algae in shallow rocky Mediterranean communities
Adriana Villamor · Mikel A. Becerro
Received: 20 November 2009 / Accepted: 31 May 2010© Springer-Verlag 2010
Abstract Understanding why a species is present in aparticular location and the consequences of its presence iscomplex but necessary to identify the mechanisms that gen-erate and maintain ecological diversity. The common seastar Echinaster sepositus can be either very abundant ornon-existing in nearby localities of the western Mediterra-nean. Yet, the factors that shape its distribution and theimpact of the sea star on natural communities remain unin-vestigated. Here, we quantiWed multiple biotic and abioticfactors that may aVect the distribution of E. sepositus andtested whether this sea star can shape the organization ofthe community it inhabits. Our results showed that the dis-tribution of this sea star was highly contagious and posi-tively correlated with the abundance and distribution ofcrustose coralline algae from tens of meters to tens of kilo-meters. Despite signiWcant diVerences in community com-position between localities with high or low abundance ofthe sea star, experimental addition of E. sepositus to naturalcommunities failed to shift the composition of the algalcommunity in 4 months. Overall, our results suggest thatwithin habitat variability in the abundance of crustose cor-alline algae may explain the abundance of E. sepositus atmultiple geographic scales, emphasizing the need to inves-tigate small-scale processes at larger geographic scales.
Introduction
The study of the mechanisms that determine the presenceand abundance of local species is basic to understand spe-cies diversity and the organization and functioning of nat-ural communities. The complexity of the multiple factorsacting at varying temporal and spatial scales makespredicting whether a species is present in a particularlocation very challenging. On a local scale, species com-position may be determined by a few environmental vari-ables that Wlter a larger pool of species. According to thisniche assembly view, physiological processes and bioticinteractions play a major role in community composition(Tilman 1985; Keddy 1992; Grace 1999). Stochasticevents at large temporal and spatial scales, local extinc-tion, and long distance dispersal are also known to explainspecies diversity (Tilman 1994; Eriksson 1996; Hubbellet al. 2001).
Habitat variability correlates with species diversity anddepends on the spatial scale investigated (Davidowitz andRosenzweig 1998). Large-scale surveys comprise multiplevariability sources including but not restricted to geo-graphic and habitat variability (e.g., Fabricius and De’ath2001). At the opposite end, small-scale studies look for themost homogeneous habitats in order to discover the small-est variability (Benedetti-Cecchi and Cinelli 1995). Thesesmall-scale variability studies have received little attention,but they seem to play a major role in determining and main-taining diversity (Izsak and Price 2001; Hewitt et al. 2005).In fact, the importance of small-scale habitat variabilitycould be underestimated because small-scale habitat vari-ability can result in large-scale variability patterns if thehabitat itself changes across larger scales (Helmuth et al.2006; Rilov and Schiel 2006; Chapman and Underwood2008).
Communicated by P. Kraufvelin.
A. Villamor (&) · M. A. BecerroCenter for Advanced Studies of Blanes (CEAB, CSIC), Acc Cala S Francesc 14, 17300 Blanes (Girona), Spaine-mail: [email protected]
123

Mar Biol
Sea stars are marine animals that inhabit virtually everyecosystem regardless of latitude and depth (Hyman 1955).Sea stars also are voracious feeders that can alter communi-ties by preferential predation (Menge 1982; Duggins 1983;Himmelman and Dutil 1991). Despite the abundance ofinformation on the role of sea stars as major drivers of com-munity organization and functioning, there is no availableinformation on the role of sea stars in benthic Mediterra-nean communities. Echinaster sepositus (Retzius 1783) isone of the most common and abundant sea stars in the Med-iterranean Sea, yet information on the biology of this seastar is fragmentary and contradictory. This is particularlyobtrusive for its feeding habits (Vasserot 1961; Ferguson1969), which are based on casual observations, and accu-rate information is lacking. Biological information on otherspecies of the genus Echinaster or the family Echinasteri-dae has been equally overlooked. Ecologically, the distribu-tion of E. sepositus varies as a function of cover of sand,algae, and depth (Entrambasaguas et al. 2008), although theexact nature of these relationships is complex and irreso-lute. The abundance of E. sepositus can also vary tremen-dously between nearby localities that have no conspicuousdiVerences in community composition, suggesting that theabundance of this species could be aVected by biotic or abi-otic factors acting at scales of hundred of meters or less(Underwood and Chapman 1996; Chapman and Under-wood 2008). In short, the causes and consequences behindthe variable abundance of E. sepositus in Mediterraneanshallow rocky communities remain open questions.
The goal of our study is twofold as we aimed at increas-ing our understanding of (1) the factors that can regulatethe spatial distribution of Echinaster sepositus and (2) theconsequences that the sea star may have in Mediterraneanshallow rocky communities. To do so, we quantiWed theabundance of E. sepositus and several biotic and abioticvariables within shallow algal-dominated communities.Shallow communities above 11 m of depth are character-ized by homogeneous spatial patterns when compared tocommunities below that depth (Garrabou et al. 2002).Rather than investigating a particular location extensively,we targeted the variability within this community type frommultiple locations spread over 150 km of coastline. Thus,our approach aimed at a level of variability usually associ-ated with small-scale studies but over a larger geographicscale. This particular approach allowed us (1) to quantita-tively characterize the community that E. sepositus inhab-its, (2) to establish the degree of variability in abioticfactors and community composition between locations withhigh and low sea star abundance, (3) to look for correlatesof sea star abundance, and (4) to describe patterns of spatialdistribution of the sea star and correlates from a scale oftens of meters to tens of kilometers. This Wrst observationalpart of our study was designed to look for potential causes
behind the variation in abundance of E. sepositus and togenerate testable hypotheses well supported by Weld data inour study area. Then, in the second part of our study, weexperimentally tested whether E. sepositus had the capacityto induce the diVerences we observed between locationswith low and high abundance of the sea star. This approachis particularly relevant to assess the causes and conse-quences of the large variation in the abundance of E. sepos-itus in these types of communities.
Materials and methods
Organism and area of study
Echinaster sepositus (Echinodermata, Class Asteroidea,Order Spinulosa, Family Echinasteridae) is distributedalong the eastern Atlantic and the Mediterranean Sea (Riedl1983; Ocaña Martín et al. 2000). This sea star is easily rec-ognized by a small disk with Wve slender cylindrical raysfrom bright orange to blood red, a reticulated skeleton withopen meshes, and single or few spines at the nodes. Its onlyknown predator is the gastropod Charonia lampas lampas(Linnaeus 1758), distributed along the western Mediterra-nean and eastern Atlantic but virtually extinguished in ourstudy area due to overWshing (Mas Cornet 2005). No infor-mation is available about predation at earlier stages ofdevelopment. As a consumer, E. sepositus is traditionallyconsidered a sponge feeder (Vasserot 1961; Sarà andVacelet 1973) even though it causes negligible damageand mortality to sponges (Ferguson 1969; Maldonado andUriz 1998). Also, E. sepositus has been found in feedingposition on a variety of substrates including multipleinvertebrates, algae, and sediment (Ferguson 1969).
Our study took place on shallow rocky bottoms oV theCosta Brava, Spain (northwestern Mediterranean Sea), at adepth between 5 and 10 m. Mediterranean shallow commu-nities are well characterized by the dominance of photo-philic algae. At the depth range of our study, thecommunity is formed by the characteristic algal and inver-tebrate species found on moderately calm conditions thatdemarcate a homogeneous facies (Pérès and Picard 1964;Ros et al. 1985; Garrabou et al. 1998). Above 5 m, there isa shift toward species more prone to strong water move-ment resulting in a distinct community where Echinastersepositus is incidental. Below ten meters, the incidence ofsciaphilous species becomes noticeable changing the over-all perception of the landscape. Although E. sepositus maybe abundant below 10 m, we restricted our sampling to the5–10 m depth range because of the large variation in seastar densities at those depths and the consistency of thelandscape in our study area. This restriction also avoidedthe complex relationship between this sea star and depth
123

Mar Biol
noticed by other authors (Entrambasaguas et al. 2008). Wehaphazardly selected 24 locations covering 150 km of coast(Fig. 1). Three gap areas in our design resulted from com-plex access (in the southernmost gap) and absence of rockybottoms (in the remaining two gaps). Our study sites includedtwo submarine mountains, 11 bays, seven sites subject tointense boat traYc in summer time, and four sites with lim-ited access for people and boats. Six of these sites are insidemarine protected areas (Cape Creus, Medes Islands, andSes Negres).
Sampling of biotic and abiotic variables
From June to August 2006, we SCUBA dove in all 24 loca-tions and quantiWed the abundance of Wsh, algae and sessileinvertebrates, echinoderms, and a number of abiotic vari-ables. These variables quantify the sessile community, themajor consumers in the system (Hereu 2006; Hereu et al.2008), and important environmental factors that shape theirdistribution (Ros et al. 1985; Garrabou et al. 1998; Virgilioet al. 2006).
In each location, we haphazardly placed a 50-m transectline between 5 and 10 m depth. We used underwater visualcensus (UVC) in a 2-m-wide strip at each side of the tran-sect line to quantify Wsh abundance. SpeciWcally, werecorded the number of Wsh specimens belonging to themost common and abundant demersal Wsh families in thestudy area (Labridae, Sparidae, and Serranidae). Sarpasalpa (Linnaeus 1758) was treated independently of thefamily Sparidae to which it belongs to account for func-tional diVerences in their feeding behavior. S. salpa is astrict herbivore with a strong aggregating behavior as
opposed to the remaining sparid species which are carni-vores or omnivores.
In the same transect line, we quantiWed the sessile com-position by recording every 50 cm the organism presentunderneath the line (point-intercept method, 100 pointstotal). Crustose coralline algae (also referred to as encrust-ing red algae, corallines or crusts, following Steneck et al.1991) such as Lithophyllum sp., Mesophyllum sp., andPeyssonnelia sp. were recorded when not overgrown byother algal species (Tuya and Haroun 2006). We combinedalgal species into functional groups because they representecologically distinct and relevant groups suitable to exam-ine overall changes in benthic community (Britton-Simmons 2006; Perner and Voigt 2007). We adapted forour study the algal functional groups described by Steneckand Watling (1982) (Table 1), which are widely used andstrongly correspond to speciWc ecological characteristics(Littler and Littler 1984). Species of sessile invertebrateswere also classiWed according to their zoological group assponges, bryozoans, ascidians, hydrozoans, anthozoans,and cirripeds. We also quantiWed the number of sea urchinsand number of the sea stars Echinaster sepositus andMarthasterias glacialis (Linnaeus 1758) along a 50-m²-wide strip, centered in the transect line. The most abundantsea urchin species in the area was Paracentrotus lividus(Lamarck 1816). A few specimens of the sea urchin Arbacialixula (Linnaeus 1758) were noticed in some transects,although numbers were low as this species inhabits prefer-entially artiWcial breakwaters (Palacin et al. 1998b). Tofacilitate underwater quantiWcation, we included bothspecies in our sea urchin category as main invertebrategrazers on these communities.
All abiotic variables were measured in the same transectline used to quantify biotic data. We used the chain-and-tape method to calculate substrate rugosity (Risk 1972).Every Wve meter along the transect line, we recorded depth(dive computer), slope (as the arcsin of the depth diVerencebetween the transect line and one meter down the slope),and orientation (compass). The ten individual measure-ments of depth, slope, and orientation for each transectwere averaged to a single value for each location. Satellitetemperature data for each of the 24 locations during thesampling months were extracted from http://oceancolor.gsfc.nasa.gov.
Rather than extensively sampling a single or a smallgroup of locations based on speciWc characteristics, wesampled 24 locations over 150 km of coastline to assess thevariability of the target algal-dominated community. Weconceived this observational part of our study as an explor-atory analysis to assess whether the abundance of Echinas-ter sepositus correlated with other biotic and abioticvariables in the community, which could provide testablehypotheses on the causes of sea star variation. We relied on
Fig. 1 Situation map of the study area in the northwestern Mediterra-nean. Numbers indicate the 24 localities surveyed. From north tosouth: Port Bou, Colera, Faro de S’Arnella, Port de la Selva, CalaCulip, Port lligat, Cala Montjoi, Cala Mateua, Montgri, Medas, SesNegres, Aiguafreda, Tamariu, Llafranc, La Fosca, Palamós, S’Agaro,Port Salvi, Salionç, Tossa, Muladera, Cala St Francesc, Niell St Franc-esc, and Pta. Sta Anna
Spain
-1-2
-3 -4
-5
-6-7
-8-9
-10
-11-12
-21-20-19-18
-17-16-15
-14-13
-22-23-24
25 kmBlanes
Palamós
L’Escala
Roses
123

Mar Biol
a regression style approach as opposed to an analysis ofvariance (ANOVA) approach, since all our variables werecontinuous and we lacked quantitative information on seastar variability as to deWne ecological relevant categories(Gotelli and Ellison 2004). Accordingly, each location inour study represented a replicate of the community, so therewas no need for additional replication within locations. Ourdata, however, were representative of the location andaccounted for the small-scale variability within each partic-ular location. Our 50-m-long UVCs provided ample repre-sentation of rocky Wsh assemblages in the Mediterranean,where 25-m-long UVCs are often used (Harmelin-Vivienet al. 2008). As to the benthic community, our 50-m-longtransect lines spanned the range of spatial variability pres-ent in each location due to diVerences in orientation, pres-ence of high densities of herbivores, species patchiness, orother small-scale sources of variation. As an example, 50and 80% of the species we found occurred within the Wrst10 and 25 m, respectively (data not shown). Thus, the spa-tial grain of our 50-m-long transects was above the usualsize of sample unit in these types of studies and comple-ments the regional spatial extent of our study.
Analyses of Weld data
We used linear regression to test for independence betweenabiotic variables. We then tested whether the abiotic vari-ables were aVecting biotic composition with the BIO-ENVprocedure of Primer 6 (Clarke and Warwick 2001). Thisprocedure calculates a Bray–Curtis similarity matrix (onsquare-root transformed abundance of the biotic variables)that is compared to multiple combinations of the abioticvariables at steadily increasing levels of complexity, untilthe best match of biotic and environmental patterns is found(or lack thereof). Since the BIO-ENV procedure evaluatesrelationships at a community level, we used multiple corre-lation analysis (Systat, SPSS 1999) to speciWcally test
whether the abundance of Echinaster sepositus was corre-lated with any abiotic variables.
We classiWed the 24 sampling sites as a function of theabundance of Echinaster sepositus. High and low densitylocations referred to sites with above and below average seastar density for the whole study area. We then used analysisof similarity (ANOSIM) to test whether community organi-zation varied between these two groups with contrastingsea star abundance. An exploratory similarity breakdownusing the SIMPER procedure available in the PRIMERsoftware assigned the relative contribution of the bioticvariables to the dissimilarities between locations with highand low abundance of E. sepositus (Clarke and Ainsworth1993). Based on these results, we then used multiple corre-lation analysis (Systat, SPSS 1999) to test for the relation-ship between the abundance of the sea star and everyvariable that contributed to the 50% dissimilarity betweenhigh and low abundance locations.
For those species whose abundances correlated withEchinaster sepositus, we used the �2 test of the varianceto mean ratio as an index of dispersion (IOD) to checkwhether they matched their spatial distributions (Elliot1977). We used abundance data from each location andpooled data from multiple groups of neighbor locationsto calculate the IOD at increasing geographic scales fromtens of meters to tens of kilometers. The smallest scalecorresponded with our 50-m transects in each of the 24locations. We then pooled abundance data from 2, 3, 4,6, 8, and 12 neighbor locations (12 was the maximumnumber of locations that we could pool and still had twoindependent groups as replicates). These groups ofneighbor locations corresponded with distances of 6, 13,18, 31, 42, and 68 km, respectively (average of the dis-tance between the most distant locations in each group).We then tested whether the spatial distributions ofE. sepositus and other selected species or groups werecorrelated.
Table 1 Functional groups used to classify algal species, main anatomic traits of the group, and examples found in our study area (ModiWed fromSteneck and Dethier 1994)
a Unicellular species. Included in the group “Calcareous articulated algae” because of its size and heavy calciWcation
Functional group Comparative anatomy Examples
Filamentous Uniseriate line of equal cells Cladophora sp., Falkenbergia rufolanosa
Foliose DiVerentiated cortex with one layer cells medulla Codium bursa, Dictyota dichotoma., Flabelia petiolata
Corticated DiVerentiated cortex with multilayered medulla Gelidium latifolium, Halopteris scoparia, Sphaerococcus coronopifolius
Calcareous articulated
Multilayered with calciWed cortex Amphiroa rigida, Corallina elongata, Halimeda tunaAcetabularia acetabuluma
Crustose coralline Cortex and medulla both calciWed Peyssonnelia squamaria, Mesophyllum lichenoides.Lithophyllum incrustans
123
Mar Biol
Experimental manipulation of sea star abundance
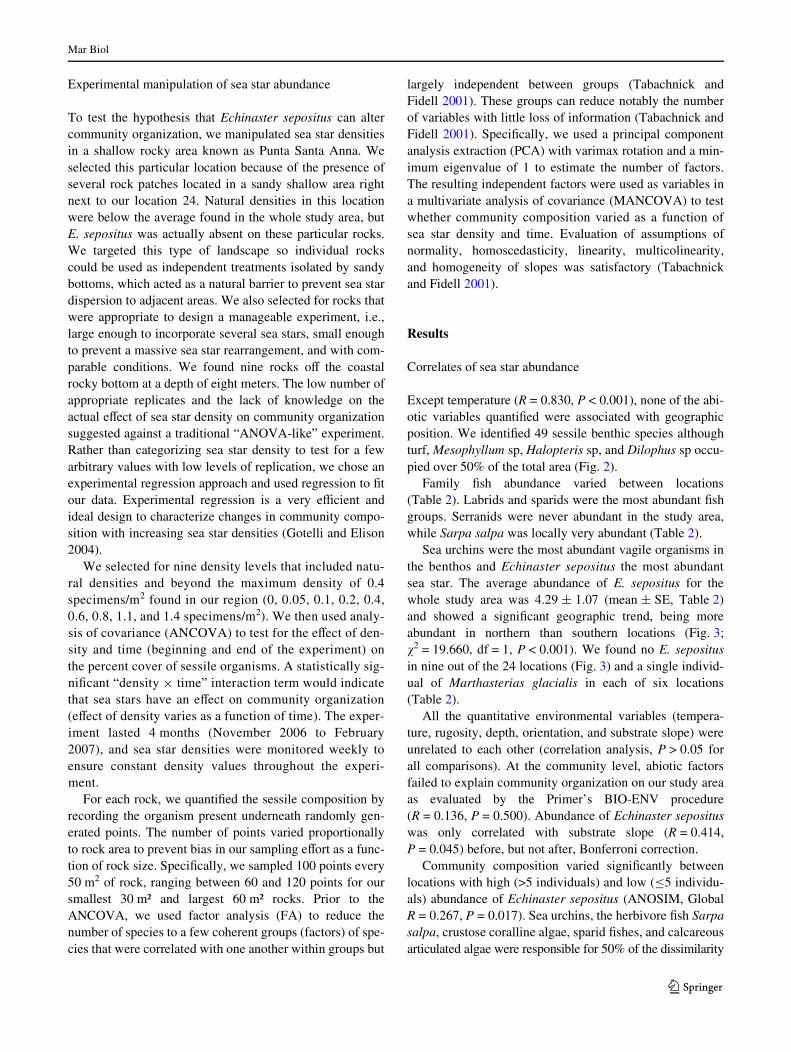
To test the hypothesis that Echinaster sepositus can altercommunity organization, we manipulated sea star densitiesin a shallow rocky area known as Punta Santa Anna. Weselected this particular location because of the presence ofseveral rock patches located in a sandy shallow area rightnext to our location 24. Natural densities in this locationwere below the average found in the whole study area, butE. sepositus was actually absent on these particular rocks.We targeted this type of landscape so individual rockscould be used as independent treatments isolated by sandybottoms, which acted as a natural barrier to prevent sea stardispersion to adjacent areas. We also selected for rocks thatwere appropriate to design a manageable experiment, i.e.,large enough to incorporate several sea stars, small enoughto prevent a massive sea star rearrangement, and with com-parable conditions. We found nine rocks oV the coastalrocky bottom at a depth of eight meters. The low number ofappropriate replicates and the lack of knowledge on theactual eVect of sea star density on community organizationsuggested against a traditional “ANOVA-like” experiment.Rather than categorizing sea star density to test for a fewarbitrary values with low levels of replication, we chose anexperimental regression approach and used regression to Wtour data. Experimental regression is a very eYcient andideal design to characterize changes in community compo-sition with increasing sea star densities (Gotelli and Elison2004).
We selected for nine density levels that included natu-ral densities and beyond the maximum density of 0.4specimens/m2 found in our region (0, 0.05, 0.1, 0.2, 0.4,0.6, 0.8, 1.1, and 1.4 specimens/m2). We then used analy-sis of covariance (ANCOVA) to test for the eVect of den-sity and time (beginning and end of the experiment) onthe percent cover of sessile organisms. A statistically sig-niWcant “density £ time” interaction term would indicatethat sea stars have an eVect on community organization(eVect of density varies as a function of time). The exper-iment lasted 4 months (November 2006 to February2007), and sea star densities were monitored weekly toensure constant density values throughout the experi-ment.
For each rock, we quantiWed the sessile composition byrecording the organism present underneath randomly gen-erated points. The number of points varied proportionallyto rock area to prevent bias in our sampling eVort as a func-tion of rock size. SpeciWcally, we sampled 100 points every50 m2 of rock, ranging between 60 and 120 points for oursmallest 30 m² and largest 60 m² rocks. Prior to theANCOVA, we used factor analysis (FA) to reduce thenumber of species to a few coherent groups (factors) of spe-cies that were correlated with one another within groups but
largely independent between groups (Tabachnick andFidell 2001). These groups can reduce notably the numberof variables with little loss of information (Tabachnick andFidell 2001). SpeciWcally, we used a principal componentanalysis extraction (PCA) with varimax rotation and a min-imum eigenvalue of 1 to estimate the number of factors.The resulting independent factors were used as variables ina multivariate analysis of covariance (MANCOVA) to testwhether community composition varied as a function ofsea star density and time. Evaluation of assumptions ofnormality, homoscedasticity, linearity, multicolinearity,and homogeneity of slopes was satisfactory (Tabachnickand Fidell 2001).
Results
Correlates of sea star abundance
Except temperature (R = 0.830, P < 0.001), none of the abi-otic variables quantiWed were associated with geographicposition. We identiWed 49 sessile benthic species althoughturf, Mesophyllum sp, Halopteris sp, and Dilophus sp occu-pied over 50% of the total area (Fig. 2).
Family Wsh abundance varied between locations(Table 2). Labrids and sparids were the most abundant Wshgroups. Serranids were never abundant in the study area,while Sarpa salpa was locally very abundant (Table 2).
Sea urchins were the most abundant vagile organisms inthe benthos and Echinaster sepositus the most abundantsea star. The average abundance of E. sepositus for thewhole study area was 4.29 § 1.07 (mean § SE, Table 2)and showed a signiWcant geographic trend, being moreabundant in northern than southern locations (Fig. 3;�2 = 19.660, df = 1, P < 0.001). We found no E. sepositusin nine out of the 24 locations (Fig. 3) and a single individ-ual of Marthasterias glacialis in each of six locations(Table 2).
All the quantitative environmental variables (tempera-ture, rugosity, depth, orientation, and substrate slope) wereunrelated to each other (correlation analysis, P > 0.05 forall comparisons). At the community level, abiotic factorsfailed to explain community organization on our study areaas evaluated by the Primer’s BIO-ENV procedure(R = 0.136, P = 0.500). Abundance of Echinaster seposituswas only correlated with substrate slope (R = 0.414,P = 0.045) before, but not after, Bonferroni correction.
Community composition varied signiWcantly betweenlocations with high (>5 individuals) and low (·5 individu-als) abundance of Echinaster sepositus (ANOSIM, GlobalR = 0.267, P = 0.017). Sea urchins, the herbivore Wsh Sarpasalpa, crustose coralline algae, sparid Wshes, and calcareousarticulated algae were responsible for 50% of the dissimilarity
123

Mar Biol
between sites with high and low abundance of the sea star(SIMPER analysis, Table 3). Sea urchins and calcareousarticulated algae were more abundant in locations with lowabundance of E. sepositus, while S. salpa, sparid Wshes, andcrustose coralline algae were more abundant in locationswith high abundance of the sea star (Table 3).
Sea star abundance was positively correlated with theabundance of crustose coralline algae, even after Bonfer-roni correction (R = 0.662, P < 0.001). As Echinastersepositus, this algal group was more abundant in northernthan southern locations (�2 = 22.688, df = 1, P < 0.001).The spatial distribution of E. sepositus and crustose coral-line algae were strongly correlated as shown by the �2 testof their index of dispersion (R = 0.982, P < 0.001, Fig. 4),which also showed a trend from contagious to random dis-tributions from local to regional scales (Fig. 4).
EVects of sea stars on community organization
We quantiWed a total of 37 sessile species on the experi-mental rocks. Algae dominated in number of species andpercent cover (algae: 22 species, 88.8% cover; sponges:9, 9.4%; cnidarians: 4, 0.9%, and ascidians: 2, 0.9%).Factor analysis of the 38 species (including bare rock)resulted in 11 independent factors that explained 90.08% ofthe total variance (Table 4). Multiple analysis of covariance(MANCOVA) on the 11 factors showed no signiWcant“density £ time” (Wilk’s � = 0.327, F = 0.750, P = 0.682),
Fig. 2 Cumulative abundance (%) of the algae and sessile invertebrates quantiWed in the 24 locations surveyed. Dotted line indicates 50% of cumulative abundance
Cum
ulat
ive
abun
danc
e %
20
40
60
80
100
Table 2 Minimum, maximum, and mean § standard error values ofWshes and echinoderms in the studied area
Fish data are number of individuals found in a 50 m £ 4 m strip. Echi-noderm data are number of individuals in a 50 m £ 1 m strip
Organism Min Max Mean § SE
Labridae 13 66 32 § 3.32
Sparidae 2 66 23.17 § 3.25
Serranidae 0 12 5.08 § 0.85
Sarpa salpa 0 55 8.66 § 3.24
Sea urchins 22 259 108.75 § 14.85
Echinaster sepositus 0 20 4.29 § 1.07
Marthasterias glacialis 0 1 0.25 § 0.09
Fig. 3 Bar diagram of the number of Echinaster sepositus in 50 m² foreach location. Locations ordered from north (top) to south (bottom).SigniWcant diVerences in sea star abundance between northern andsouthern locations (dotted line) tested by contingency table analysis(�2 = 19.660, df = 1, P < 0.001)
E. sepositus (indivs/50m²)
0 5 10 15 20 25
Loc
ality
123456789
101112131415161718192021222324
Northern locations
Southern locationsp<0.001
123

Mar Biol
no “density” eVect (Wilk’s � = 0.217, F = 1.641, P = 0.305),but a signiWcant “time” eVect (Wilk’s � = 0.002, F = 245.305,P < 0.001) that is exclusively driven by factor 1 (ANOVA,F = 33.328, P < 0.001). This factor comprises seasonalspecies of algae and invertebrates very common in this areaand whose abundances might dramatically change in suchtime period (Table 4).
A speciWc ANCOVA on the percent cover of crustosecoralline algae as a function of time and density showed
that none of the factors neither their interaction was signiWcant(density: F = 1.438, P = 0.249; time: F = 0.888, P = 0.361;density £ time: F = 0.016, P = 0.902).
Table 3 Functional groups and species average abundance, onsquare-root transformed data, and their contribution to dissimilarity (%)between localities with high and low density of Echinaster sepositus
Variables Aver. Abund. Low dens. sites
Aver. Abund. High dens. sites
% Dissim.
Sea urchins 10.32 8.64 15.69
Sarpa salpa 1.69 2.49 10.37
Crustose coralline algae
3.10 5.16 8.76
Sparids 4.42 4.76 7.98
Calcareous algae 1.88 1.35 7.00
Corticated algae 4.74 3.74 6.07
Filamentous algae 4.50 3.58 6.01
Serranids 2.18 1.41 5.66
Labrids 5.59 5.28 5.66
Sponges 2.44 1.74 5.64
Foliose algae 5.23 5.49 4.37
Posidonia oceanica 0.92 0.14 3.92
Free space 0.59 0.49 3.00
Others 7.13 8.99 9.87
Fig. 4 Index of dispersion as calculated by the �2 test of the varianceto mean ratio of Echinaster sepositus (open triangle) and crustose cor-alline algae (solid square) as a function of increasing population dis-tance. Both species showed a highly contagious spatial distribution(white area) at a scale of tens of meters that shifted toward randomness(gray area) with increasing distance (R = 0.982, P < 0.001)
Distance (Km)
Inde
x of
dis
pers
ion
random
contagious
Echinaster sepositus
Crustose coralline algae
150
120
90
60
30
00 10 20 30 40 50 60 70
Table 4 Factor analysis (FA) on the percent cover of the 38 sessilespecies (including bare rock) quantiWed in the community where den-sities of Echinaster sepositus were manipulated
To facilitate interpretation, only coeYcients with absolute value largerthan 0.5 are shown. Capital letters in the Wrst column indicate algae(A), cnidarians (C), sponges (S), and tunicates (T). The resulting inde-pendent factors after FA explained 90% of the total variance
Species Factor CoeYcient Variance explained (%)
Dyctiota sp A 1 ¡0.854 15.16
Cladophora sp A 1 0.799
Falkenbergia sp A 1 0.776
Dilophus sp A 1 0.746
Aglaophenia sp C 1 ¡0.684
Clavellina sp T 1 ¡0.645
Codium vermilara A 1 0.615
Plocamium sp A 1 ¡0.538
Halocynthia papillosa T 2 ¡0.965 9.61
Cereus pedunculatus C 2 ¡0.916
Jania Rubens A 2 ¡0.746
Corallina elongata A 2 ¡0.665
Ircinia sp S 3 ¡0.825 8.45
Codium bursa A 3 ¡0.774
Turf A 3 0.654
Chondrosia reniformis S 3 ¡0.616
Bare rock – 4 ¡0.986 8.41
Scopalina sp S 4 ¡0.986
Mesophyllum sp A 4 ¡0.639
Peyssonnelia sp A 4 ¡0.559
Balanophyllia sp C 5 ¡0.955 9.06
Amphiroa sp A 5 ¡0.955
Padina pavonica A 5 ¡0.591
Sphaerococcus sp A 5 0.567
Cladostephus hirsutus A 5 ¡0.544
Aglaozonia sp A 6 ¡0.929 8.67
Halopteris sp A 6 ¡0.717Phorbas Wctitius S 6 ¡0.653
Halimeda tuna A 6 ¡0.509
Petrosia sp S 7 ¡0.904 7.19
Rhodymenia sp A 7 ¡0.594
Phorbas tenacior S 7 ¡0.582
Dysidea avara S 8 ¡0.905 8.08
Flabelia petiolata A 8 ¡0.664
Crambe crambe S 8 ¡0.504
Gelidium latifolium A 9 ¡0.915 5.09
Corticium candelabrum S 10 ¡0.833 5.18
Eunicella singularis C 11 ¡0.944 5.18
123

Mar Biol
Discussion
It is widely accepted that habitat variability provides moreopportunities for species to Wnd and occupy their niche,regulating many ecological processes including the abun-dance and distribution of species (Zajac et al. 2003; Hewittet al. 2005). In our study, we targeted a speciWc, representa-tive, and well-established algal community in the westernMediterranean seeking for a reasonably homogeneous envi-ronment where to investigate the abundance of the sea starEchinaster sepositus over a larger regional scale of 150 km.In this sense, our study assessed whether small variationwithin homogeneous habitats can explain diVerences inspecies abundance at larger geographic scales, combininggoals associated with small- and larger-scale studies(Benedetti-Cecchi and Cinelli 1995; Ruitton et al. 2000;Fabricius and De’ath 2001). Our study showed signiWcantdiVerences between nearby communities with high and lowabundance of E. sepositus. Although several species con-tributed to such diVerences, we found that only percentcover of crustose coralline algae was correlated with abun-dance of sea stars. Moreover, the indexes of dispersion ofthese species from tens of meters to tens of kilometers werehighly correlated, supporting the matching spatial distribu-tions of these species in our study area. Multiple biologicaland statistical arguments could be behind the rationale ofthis relationship. Our results could either stem from a spuri-ous statistical relationship between crustose coralline algaeand sea star abundance, be the result of a direct relationshipbetween them, or be caused by a third unidentiWed variable.
Although a spurious correlation between the abundanceof Echinaster sepositus and crustose coralline algae cannotbe completely ruled out, statistical and biological evidencesuggests otherwise. Because we considered over 40 bioticand abiotic variables in our study, the possibility to obtainsome meaningless but statistically signiWcant correlationsbetween them looms large. However, we believe this isunlikely in our study because of statistical and biologicalreasons. Rather than “data snooping” with our whole dataset (Westfall and Young 1993), we searched for correlatesof sea star abundance in Wve abiotic and Wve biotic vari-ables that were selected based on the results from broaderanalysis at a community level. This rationale is similar tothe bioassay-guided fractionation used for example inchemical ecology to identify the speciWc compound(s)responsible for an ecological role (Becerro et al. 2001),although our study does test the same data multiple times.To decrease the probability to reject a true null hypothesis(Type I error), we used Bonferroni adjustment to correctour correlations. In our study, only the percent cover ofcrustose coralline algae was signiWcantly correlated withsea star abundance after Bonferroni correction. Statisti-cally, the probability to obtain by chance such a signiWcant
correlation in a series of 10 tests (as calculated by theBernoulli equation) is in fact below the traditional 0.05 sig-niWcant level (P = 0.010, Moran 2003). Beyond the rela-tionship between the species abundances, we also found ahighly signiWcant correlation between the patterns of distri-bution of both species, as indicated by their IOD. A numberof ecological mechanisms make more plausible argumentsfor this relationship.
Here, we set forth the hypothesis that the abundance ofEchinaster sepositus may be mediated by crustose corallinealgae. This hypothesis is based on the lack of relationshipbetween sea star abundance and abiotic factors, the highcorrelation between the abundance and spatial distributionof crustose coralline algae and E. sepositus, and the inca-pacity of the sea star to induce shifts in community organi-zation during the course of our experiment.
We found no relationship between abiotic variablesand community composition. This is likely a consequenceof the narrow range of environmental variability coveredin our study. Shallow Mediterranean rocky communitiesare dominated by algae, whose composition is known tovary as a function of depth (Boudouresque 1985; Gili andRos 1985). Orientation, rugosity, and slope are alsoknown to regulate the distribution of sessile organisms(Diez et al. 2003; Tuya and Haroun 2006; Roberts et al.2006). The 24 locations we investigated in our study tar-geted a speciWc algal community dominated by species ofmoderately calm conditions that demarcated a homoge-neous facies (Pérès and Picard 1964; Ros et al. 1985). Theabundance of Echinaster sepositus in particular was alsounrelated to the abiotic variables investigated in ourstudy, except for a weak correlation with slope that failedto pass Bonferroni correction. Sand, algal cover, anddepth correlate with the abundance of E. sepositus(Entrambasaguas et al. 2008), but all these variables hadminor variations in our study and failed to explain sea starabundance in our community. This lack of relationshipwith environmental variables seems to be common in otherechinoderms, whose distributions are better explained bybiotic factors (McClanahan 1998; Alves et al. 2001;Dumas et al. 2007).
Community composition varied between locations withhigh and low abundance of Echinaster sepositus. DiVer-ences were small as indicated by the low R value found inour ANOSIM analysis and driven primarily by sea urchins,Sarpa salpa, crustose coralline algae, sparid Wsh, and cal-careous articulated algae. Among them, abundance ofencrusting algae was positively correlated with the abun-dance of the sea star although the true nature of this associ-ation is unknown. Whatever the mechanisms, they seem tooperate from local to regional scales as suggested by thehigh match in the index of dispersion of both species at themultiple scales investigated in our study. Both species
123

Mar Biol
showed a highly contagious distribution up to about 40 km,when they came close to a random distribution.
A possible explanation for the positive relationshipbetween the abundance of Echinaster sepositus and crus-tose coralline algae is that high cover of crustose corallinealgae may lead to higher abundance of E. sepositus.Numerous benthic invertebrates are known to be positivelyassociated with high cover of crustose coralline algae. Itspresence is known to enhance larval settlement and inducemetamorphosis in many invertebrates (Daume et al. 1999;Heyward and Negri 1999; Morse et al. 1988) including seastars (Barker 1977; Johnson and Sutton 1994) and otherechinoderms (Huggett et al. 2006). Whether Echinastersepositus settles preferentially on this substrate remainsunknown but could be behind this positive association.Crustose coralline algae are also known to enhance growthand survival of new recruits (Rowley 1990; Harringtonet al. 2004). A trophic relationship between Echinastersepositus and crustose red algae or its associated faunacould also explain this association. Feeding preferences canresult in spatial patterns of predator abundance if the preda-tor mimics an irregular prey distribution or selects for envi-ronments that facilitate the access to its food resources(Yasuda and Ishikawa 1999; Torres et al. 2008; Hines et al.2009). The diet of E. sepositus includes algae and multiplemeiofaunal groups (Vaserot 1961) although further infor-mation is needed to clarify feeding habits and preferences.Crustose coralline algae can host a wide variety of associ-ated fauna (Martín 1987; Williamson and Creese 1996;Cebrian and Uriz 2006), so the possibility that E. seposituscould feed on these algae or their associated fauna cannotbe ruled out. The sea star Stichaster australis is known tofeed on the encrusting algae Mesophyllum insigne untiljuveniles reach over 2 cm in diameter (15–18 months old).Experimental testing of the sea star feeding preferences andstable isotopes analysis could provide useful data to supportor refute the hypothesis of a trophic link between E. sepos-itus and crustose coralline algae.
An opposite hypothesis would be a positive eVect ofEchinaster sepositus on percent cover of crustose corallinealgae. Our experimental data failed to support this hypothe-sis. The sea star was unable to induce any shift in the com-position of the benthic community in 4 months despite weused densities that exceeded over three times the maximumnatural density found in our study area. A larger percentcover of crustose coralline algae could result from a trueincrease in their abundance, a reduction in other algal orsessile species, or a combination of both factors. Althougha true increase in crustose coralline algae may need longerthan 4 months to be noticeable, we did notice changes incommunity composition over the course of the experiment.These changes were restricted to our factor 1 (whichincluded organisms with clear seasonal dynamics such as
Dictyota, Cladophora, Falkenbergia, Dilophus, or Agla-ophenia) and were unrelated to sea star abundance. Manysea stars are voracious feeders that might control their preyabundance and alter community organization and function-ing (Menge 1982; Duggins 1983; Rotjan and Lewis 2008).However, E. sepositus seems to lack the biological traitsthat make other echinoderms key players in communityorganization (Uthicke et al. 2009). Overall, our results sug-gest against the role of E. sepositus as a main contributor tocommunity organization. If any, changes in the sessilecommunity mediated by the sea star must be subtle andneed longer to become noticeable.
Alternatively, the positive correlation between crustosecoralline algae and Echinaster sepositus could reXect amutual relationship on a third unidentiWed biotic or abioticfactor. For example, herbivores have the capacity toremove erect Xeshy algae exposing crustose coralline algae(Palacin et al. 1998a), which facilitates the abundance ofother invertebrates (Cebrian and Uriz 2006). Our datashowed that sea urchins and Sarpa salpa were the maincontributors to the dissimilarities between locations withhigh and low abundance of E. sepositus. Whether herbi-vores could favor a correlation between sea star abundanceand crustose coralline algae by depleting Xeshy algaeremains an open question subject to hypothesis testing.Similarly, crustose coralline algae and E. sepositus couldtarget the same habitat because of speciWc but unknownabiotic characteristics. For example, temperature is knownto have signiWcant eVect on species distribution. Our north-ern locations have larger abundance of sea stars, crustosecoralline algae, and may be up to 2°C cooler than oursouthern locations. Also, northern and southern locationsdiVer in their orientation, predominant wind, and waveexposure, which could account for diVerences in commu-nity composition or species abundance. At this larger geo-graphic scale, we could expect a correlation between seastar abundance and temperature, orientation, or predomi-nant winds if measured. The abundance and patchy distri-bution of E. sepositus in southern Spain is similar to whatwe report in our study (Sanchez-Jerez et al. 2005, technicalreport) despite water temperature is about 5°C higher.Although the role of these factors in the abundance ofE. sepositus is unclear, geographic variation in temperature, orother factors are unlikely to contribute to the striking varia-tion in sea star abundance found between nearby locations.Factors acting at a scale of hundred meters or less are morelikely behind the local variation found for this species.
Multiple interacting factors aVect the distribution andabundance of species. Understanding their role is crucial tolearn how natural communities organize and function. Ourstudy took a comprehensive approach by looking at multi-ple factors at a within-community level over a regionalscale. Our data showed that the within-community spatial
123

Mar Biol
variability in the abundance of Echinaster sepositus andcrustose coralline algae was correlated. Experimental addi-tion of the sea star resulted in no changes in algal composi-tion. These results suggest that crustose coralline algaecould mediate the abundance of E. sepositus. Habitat heter-ogeneity has been suggested to play a major role in theorganization of echinoderm assemblages, which showedgreater variability at Wne than large spatial scales (Ent-rambasaguas et al. 2008). Our data were consistent withthis hypothesis and showed an increasingly larger departurefrom a random distribution of E. sepositus as we steppeddown from regional to local scales. Our detailed analysis ofshallow Mediterranean algal communities also opened anumber of questions that remain to be tested. More researchwill clarify the true nature of the relationship between crus-tose coralline algae and E. sepositus.
Acknowledgments The present study was funded by the SpanishMinistry of Science and Education (MPA-STAR, grant 200730I005and MARMOL, CMT2007-66635). Special thanks to N. Viladrich,O. Sacristán, A. Canyelles, and R. Bernardello for technical and Weldassistance. We are grateful to Patrik Kraufvelin and three anonymousreviewers whose useful comments greatly improved the manuscript.This article is part of Villamor’s PhD thesis.
References
Alves FMA, Chicharo LM, Serrao E, Abreu AD (2001) Algal coverand sea urchin spatial distribution at Madeira Island (NE Atlan-tic). Sci Ma 65:383–392
Barker MF (1977) Observations on settlement of brachiolaria larvae ofStichaster australis (Verrill) and Coscinasterias calamaria(Gray) (Echinodermata Asteroidea) in laboratory and on shore.J Exp Mar Biol Ecol 30:95–108
Becerro MA, Goetz G, Paul VJ, Scheuer PJ (2001) Chemical defensesof the sacoglossan mollusk Elysia rufescens and its host alga Bry-opsis sp. J Chem Ecol 27:2287–2299
Benedetti-Cecchi L, Cinelli F (1995) Habitat heterogeneity, sea urchingrazing and the distribution of algae in littoral rock pools on thewest-coast of Italy (Western Mediterranean). Mar Ecol Prog Ser126:203–212
Boudouresque CF (1985) Groupes ecologiques d’algues marines etphytocenoses benthiques en Mediterranée Nord-Occidentale: unerevue. Giorn Bot Ital 118:7–42
Britton-Simmons KH (2006) Functional group diversity, resource pre-emption and the genesis of invasion resistance in a community ofmarine algae. Oikos 113:395–401
Cebrian E, Uriz MJ (2006) Grazing on Xeshy seaweeds by sea urchinsfacilitates sponge Cliona viridis growth. Mar Ecol Prog Ser323:83–89
Chapman MG, Underwood AJ (2008) Scales of variation of gastropoddensities over multiple spatial scales: comparison of common andrare species. Mar Ecol Prog Ser 354:147–160
Clarke KR, Ainsworth M (1993) A method of linking multivariatecommunity structure to environmental variables. Mar Ecol ProgSer 92:205–219
Daume S, Brand-Gardner S, Woelkerling WJ (1999) Settlement ofabalone larvae (Haliotis laevigata Donovan) in response to non-geniculate coralline red algae (Corallinales, Rhodophyta). J ExpMar Biol Ecol 234:125–143
Davidowitz G, Rosenzweig ML (1998) The latitudinal gradient of spe-cies diversity among North American grasshoppers (Acrididae)within a single habitat: a test of the spatial heterogeneity hypoth-esis. J Biogeog 25:553–560
Diez I, Santolaria A, Gorostiaga JM (2003) The relationship of envi-ronmental factors to the structure and distribution of subtidal sea-weed vegetation of the western Basque coast (N Spain). EstuarCoast Shelf Sci 56:1041–1054
Duggins DO (1983) StarWsh predation and the creation of mosaic pat-ters in a kelp dominated community. Ecology 58:1218–1236
Dumas P, Kulbicki M, ChiZet S, Fichez R, Ferraris J (2007) Environ-mental factors inXuencing urchin spatial distributions on dis-turbed coral reefs (New Caledonia, South PaciWc). J Exp Mar BiolEcol 344:88–100
Elliot JM (1977) Some methods for the statistical analysis of samplesof benthic invertebrates. Freshwater Biological Association, UK
Entrambasaguas L, Perez-Ruzafa A, Garcia-Charton JA, Stobart B,Bacallado JJ (2008) Abundance, spatial distribution and habitatrelationships of echinoderms in the Cabo Verde Archipelago(eastern Atlantic). Mar Freshwater Res 59:477–488
Eriksson O (1996) Regional dynamics of plants: a review of evidencefor remnant, source-sink and metapopulations. Oikos 77:248–258
Fabricius K, De’ath G (2001) Environmental factors associated withthe spatial distribution of crustose coralline algae on the GreatBarrier Reef. Coral Reefs 19:303–309
Ferguson JC (1969) Feeding activity in Echinaster and its inductionwith dissolved nutrients. Biol Bull 136:374–384
Garrabou J, Riera J, Zabala M (1998) Landscape pattern indicesapplied to Mediterranean subtidal rocky benthic communities.Landscape Ecol 13:225–247
Garrabou J, Riera J, Zabala M (2002) Structure and dynamics of north-western Mediterranean rocky benthic communities along a depthgradient. Estuar Coast Shelf Sci 55:493–508
Gili JM, Ros J (1985) Study and cartography of the benthic communi-ties of Medes Islands (NE Spain). Mar Ecol PSZNI 6:219–238
Gotelli NJ, Ellison AM (2004) A primer of ecological statistics. Sina-uer, Massachusetts
Grace JB (1999) The factors controlling species density in herbaceousplant communities: an assessment. Perspect Plant Ecol Evol Syst2:1–28
Harmelin-Vivien M, Le Direach L, Bayle-Sempere J, Charbonnel E,Garcia-Charton JA, Ody D, Perez-Ruzafa A, Renones O, Sanchez-Jerez P, Valle C (2008) Gradients of abundance and biomassacross reserve boundaries in six Mediterranean marine protectedareas: evidence of Wsh spillover? Biol Conserv 141:1829–1839
Harrington L, Fabricius K, De’Ath G, Negri A (2004) Recognition andselection of settlement substrata determine post-settlement sur-vival in corals. Ecology 85:3428–3437
Helmuth B, Broitman BR, Blanchette CA, Gilman S, Halpin P, HarleyCDG, O’Donnell MJ, Hofmann GE, Menge B, Strickland D(2006) Mosaic patterns of thermal stress in the rocky intertidalzone: implications for climate change. Ecol Monogr 76:461–479
Hereu B (2006) Depletion of palatable algae by sea urchins and Wshesin a Mediterranean subtidal community. Mar Ecol Prog Ser313:95–103
Hereu B, Zabala M, Sala E (2008) Multiple controls of communitystructure and dynamics in a sublittoral marine environment. Ecol-ogy 89:3423–3435
Hewitt JE, Thrush SE, Halliday J, DuVy C (2005) The importance ofsmall-scale habitat structure for maintaining beta diversity. Ecol-ogy 86:1619–1626
Heyward AJ, Negri AP (1999) Natural inducers for coral larval meta-morphosis. Coral Reefs 18:273–279
Himmelman JH, Dutil C (1991) Distribution, population structure andfeeding of subtidal seastars in the northern Gulf of St. Lawrence.Mar Ecol Prog Ser 76:61–72
123

Mar Biol
Hines AH, Long WC, Terwin JR, Thrush SF (2009) Facilitation, inter-ference, and scale: the spatial distribution of prey patches aVectspredation rates in an estuarine benthic community. Mar Ecol ProgSer 385:127–135
Hubbell SP, Ahumada JA, Condit R, Foster RB (2001) Local neighbor-hood eVects on long-term survival of individual trees in a neotrop-ical forest. Ecol Res 16:859–875
Huggett MJ, Williamson JE, de Nys R, Kjelleberg S, Steinberg PD(2006) Larval settlement of the common Australian sea urchinHeliocidaris erythrogramma in response to bacteria from the sur-face of coralline algae. Oecologia 149:604–619
Hyman LH (1955) The invertebrates: echinodermata: the coelomateBilateria. International Books & Periodicals Supply Services,Delhi
Izsak C, Price ARG (2001) Measuring beta-diversity using a taxo-nomic similarity index, and its relation to spatial scale. Mar EcolProg Ser 215:69–77
Johnson CR, Sutton DC (1994) Bacteria on the surface of crustose cor-alline algae induce metamorphosis of the crown-of-thorns starWshAcanthaster Planci. Mar Biol 120:305–310
Keddy PA (1992) A pragmatic approach to functional ecology. FunctEcol 6:621–626
Littler MM, Littler DS (1984) Relationships between macroalgal func-tional form groups and substrata stability in a sub-tropical rocky-intertidal system. J Exp Mar Biol Ecol 74:13–34
Maldonado M, Uriz MJ (1998) Microrefuge exploitation by subtidalencrusting sponges: patterns of settlement and post-settlementsurvival. Mar Ecol Prog Ser 174:141–150
Martín D (1987) Anélidos poliquetos asociados a las concreciones dealgas calcáreas del litoral catalán. Miscel Zool 11:61–75
Mas Cornet G (2005) Proyecto de reintroducción del tritón marino enla Costa Brava. Manual de manejo en cautividad. Centro de Estu-dios del Mar de Begur-NEREO. http://www.nereo.org/images/corn/Manual%20de%20manejo%20en%20cautividad.pdf
McClanahan TR (1998) Predation and the distribution and abundanceof tropical sea urchin populations. J Exp Mar Biol Ecol 221:231–255
Menge BA (1982) EVects of feeding on the environment: Asteroidea.In: Jangoux M, Lawrence JM (eds) Echinoderm nutrition.Balkema, Rotterdam, pp 521–551
Moran MD (2003) Arguments for rejecting the sequential Bonferroniin ecological studies. Oikos 100:403–405
Morse DE, Hooker N, Morse ANC, Jensen RA (1988) Control of larvalmetamorphosis and recruitment in sympatric agariciid corals.J Exp Mar Biol Ecol 116:193–217
Ocaña Martín A, Sánchez Tocino L, López González S, VicianaMartín JF (2000) Guía submarina de invertebrados no artrópodos,2ª Edición. Editorial Comares, Granada
Palacin C, Giribet G, Carner S, Dantart L, Turon X (1998a) Low den-sities of sea urchins inXuence the structure of algal assemblagesin the western Mediterranean. J Sea Res 39:281–290
Palacin C, Turon X, Ballesteros M, Giribet G, López S (1998b) Stockevaluation of three littoral echinoid species on the Catalan coast(North-Western Mediterranean). Mar Ecol PSZNI 19:163–177
Pérès JM, Picard JN (1964) Nouveau manuel de bionomie benthiquede la Mer Mediterranee. Rec Trav St MarEndoume 31:1–137
Perner J, Voigt W (2007) Measuring the complexity of interactionwebs using vertical links between functional groups. Agr EcosystEnviron 120:192–200
Riedl R (1983) Fauna y Flora del Mar Mediterráneo. EdicionesOmega, Barcelona
Rilov G, Schiel DR (2006) Seascape-dependent subtidal-intertidal tro-phic linkages. Ecology 87:731–744
Risk MJ (1972) Fish diversity on a coral reef in the Virgin Islands.Atoll Res Bull pp 1–6
Roberts DE, Cummins SP, Davis AR, Chapman MG (2006) Structureand dynamics of sponge-dominated assemblages on exposed andsheltered temperate reefs. Mar Ecol Prog Ser 321:19–30
Ros JD, Romero J, Ballesteros E, Gili JM (1985) Diving in blue water.The benthos. In: Margalef R (ed) Western Mediterranean. Perg-amon Press, London, pp 233–295
Rotjan RD, Lewis SM (2008) Impact of coral predators on tropicalreefs. Mar Ecol Prog Ser 367:73–91
Rowley RJ (1990) Newly settled sea urchins in a kelp bed and urchinbarren ground - a comparison of growth and mortality. Mar EcolProg Ser 62:229–240
Ruitton S, Francour P, Boudouresque CF (2000) Relationshipsbetween algae, benthic herbivorous invertebrates and Wshes inrocky sublittoral communities of a temperate sea (Mediterra-nean). Estuar Coast Shelf Sci 50:217–230
Sarà M, Vacelet J (1973) Écologie des Démosponges. In: Grasse PP(ed) Traité de zoologie (anatomie, systematique, biologie).Masson & Cie, Paris, pp 462–576
SPSS (1999) Systat 9: statistics I. SPSS Inc, ChicagoSteneck RS, Watling L (1982) Feeding capabilities and limitation of
herbivorous molluscs: a functional group approach. Mar Biol68:299–319
Tabachnick BG, Fidell LS (2001) Using multivariate statistics. Allyn& Bacon, Needham Heights
Tilman D (1985) The resource-ratio hypothesis of plant succession.Am Nat 125:827–852
Tilman D (1994) Competition and biodiversity in spatially structuredhabitats. Ecology 75:2–16
Torres LG, Read AJ, Halpin P (2008) Fine-scale habitat modelling ofa top marine predator: do prey data improve predictive capacity?Ecol Appl 18:1702–1717
Tuya F, Haroun RJ (2006) Spatial patterns and response to wave expo-sure of shallow water algal assemblages across the Canarian Archi-pelago: a multi-scaled approach. Mar Ecol Prog Ser 311:15–28
Underwood AJ, Chapman MG (1996) Scales of spatial patterns of dis-tribution of intertidal invertebrates. Oecologia 107:212–224
Uthicke S, SchaVelke B, Byrne M (2009) A boom-bust phylum? Eco-logical and evolutionary consequences of density variations inechinoderms. Ecol Monogr 79:3–24
Vasserot J (1961) Caractère hautement spécialisé du régime alimen-taire chez les astérides Echinaster sepositus et Henricia sangui-nolenta, prédateurs de spongiaires. Bull Soc Zool Fr 86:796–809
Virgilio M, Airoldi L, Abbiati M (2006) Spatial and temporal varia-tions of assemblages in a Mediterranean coralligenous reef andrelationships with surface orientation. Coral Reefs 25:265–272
Westfall PH, Young SS (1993) On adjusting P-values for multiplicity.Biometrics 49:941–944
Williamson JE, Creese RG (1996) Small invertebrates inhabiting thecrustose alga Pseudolithoderma sp (Ralfsiaceae) in northern NewZealand. New Zeal J Mar Freshw 30:221–232
Yasuda H, Ishikawa H (1999) EVects of prey density and spatial distri-bution on prey consumption of the adult predatory ladybirdbeetle. J Appl Entomol 123:585–589
Zajac RN, Lewis RS, Poppe LJ, Twichell DC, Vozarik J, DiGiacomo-Cohen ML (2003) Responses of infaunal populations to bentho-scape structure and the potential importance of transition zones.Limnol Oceanogr 48(2):829–842
123